As filed with the Securities and Exchange Commission on February 25, 2016
Registration No. 333-208192
SECURITIES AND EXCHANGE COMMISSION
Washington, D.C. 20549
Washington, D.C. 20549
PRE-EFFECTIVE
AMENDMENT NO. 3
TO
FORM S-4
AMENDMENT NO. 3
TO
FORM S-4
REGISTRATION STATEMENT
UNDER
THE SECURITIES ACT OF 1933
UNDER
THE SECURITIES ACT OF 1933
NICOLET BANKSHARES, INC.
(Exact name of registrant as specified in its charter)
| |
Wisconsin
(State or other jurisdiction of incorporation or organization) |
| |
6021
(Primary Standard Industrial Classification Code Number) |
| |
47-0871001
(I.R.S. Employer Identification No.) |
|
111 North Washington Street
Green Bay, Wisconsin 54301
(920) 430-1400
Green Bay, Wisconsin 54301
(920) 430-1400
(Address, including zip code, and telephone number, including area code, of Registrant’s principal executive offices)
Robert B. Atwell
Chairman, President, and Chief Executive Officer
Nicolet Bankshares, Inc.
111 North Washington Street
Green Bay, Wisconsin 54301
(920) 430-1400
Chairman, President, and Chief Executive Officer
Nicolet Bankshares, Inc.
111 North Washington Street
Green Bay, Wisconsin 54301
(920) 430-1400
(Name, address, including zip code, and telephone number, including area code, of agent for service)
Copies to:
| |
Robert D. Klingler, Esq.
Bryan Cave LLP 1201 West Peachtree Street, NW Atlanta, Georgia 30309-3488 (404) 572-6600 |
| |
John T. Reichert, Esq.
James M. Bedore, Esq. Reinhart Boerner Van Deuren, s.c. 1000 North Water Street, Ste. 1700 Milwaukee, WI 53202 (414) 298-1000 |
|
Approximate Date of Commencement of Proposed Sale of the Securities to the Public: As soon as practicable after the effective date of this Registration Statement.
If the securities being registered on this Form are being offered in connection with the formation of a holding company and there is compliance with General Instruction G, please check the following box. ☐
If this Form is filed to register additional securities for an offering pursuant to Rule 462(b) under the Securities Act, check the following box and list the Securities Act registration statement number of the earlier effective registration statement for the same offering. ☐
If this Form is a post-effective amendment filed pursuant to Rule 462(d) under the Securities Act, check the following box and list the Securities Act registration statement number of the earlier effective registration statement for the same offering. ☐
Indicate by check mark whether the registrant is a large accelerated filer, an accelerated filer, a non-accelerated filer, or a smaller reporting company. See the definitions of “large accelerated filer,” “accelerated filer” and “smaller reporting company” in Rule 12b-2 of the Exchange Act.
| | Large accelerated filer | | | ☐ | | | Accelerated filer | | | ☒ | |
| | Non-accelerated filer | | | ☐ (Do not check if a smaller reporting company) | | | Smaller reporting company | | | ☐ | |
If applicable, place an X in the box to designate the appropriate rule provision relied upon in conducting this transaction:
Exchange Act Rule 13e-4(i) (Cross-Border Issuer Tender Offer) ☐Exchange Act Rule 14d-1(d) (Cross-Border Third-Party Tender Offer) ☐
The Registrant hereby amends this Registration Statement on such date or dates as may be necessary to delay its effective date until the Registrant shall file a further amendment that specifically states that this Registration Statement shall thereafter become effective in accordance with Section 8(a) of the Securities Act of 1933 or until this Registration Statement shall become effective on such date as the Commission, acting pursuant to said Section 8(a), may determine.
The information in this joint proxy statement-prospectus is not complete and may be changed. We may not sell these securities until the registration statement filed with the Securities and Exchange Commission is effective. This joint proxy statement-prospectus is not an offer to sell these securities and it is not soliciting an offer to buy these securities in any state where the offer or sale is not permitted.
Preliminary — Subject to Completion Dated February 25, 2016
| |
|
| |
|
|
| |
PROXY STATEMENT
OF BAYLAKE CORP. |
| |
PROXY STATEMENT AND
PROSPECTUS OF NICOLET BANKSHARES, INC. |
|
PROPOSED MERGER — YOUR VOTE IS VERY IMPORTANT
The boards of directors of Baylake Corp. (“Baylake”) and Nicolet Bankshares, Inc. (“Nicolet”) have each unanimously approved a transaction that will result in the merger of Baylake with and into Nicolet. Nicolet will be the surviving bank holding company in the merger. If the merger is completed, Baylake shareholders will receive 0.4517 shares of Nicolet common stock for each of their Baylake shares. As permitted by the terms of the merger agreement, the Baylake board of directors expects to declare and pay a one-time special cash dividend of up to $0.40 per share to Baylake shareholders immediately prior to the effective time of the merger, subject to the satisfaction of the closing conditions set forth in the merger agreement. After the merger is completed, we expect that current Nicolet shareholders will own approximately 50% of the voting shares of common stock of the combined company, and current Baylake shareholders will own approximately 50% of the voting shares of common stock of the combined company.
Nicolet’s common stock commenced trading on the Nasdaq Capital Market under the symbol “NCBS” on February 24, 2016. Prior to that time, Nicolet’s common stock was listed on the OTCBB, also under the symbol “NCBS.” The closing price of Nicolet common stock was $33.25 per share on September 8, 2015, the last trading day before public announcement of the merger. Baylake’s common stock currently trades on the Nasdaq Capital Market under the symbol “BYLK.” The closing price of Baylake common stock was $12.85 per share on September 8, 2015, the last trading day before public announcement of the merger. The shares of Nicolet common stock issued pursuant to the merger will be registered under the Securities Act of 1933, as amended, and will trade on the Nasdaq Capital Market.
We cannot complete the merger unless we obtain the necessary governmental approvals and unless the shareholders of both companies approve the merger agreement and the transactions contemplated thereby. Each of us is asking our shareholders to consider and vote on this merger proposal at our respective companies’ special meetings of shareholders. Whether or not you plan to attend your company’s meeting, please take the time to vote by following the voting instructions included in the enclosed proxy card. If you sign, date and mail your proxy card without indicating how you want to vote, your proxy will be counted as a vote FOR the merger agreement and the transactions contemplated thereby. If you do not vote your shares as instructed in the enclosed proxy card, or if you do not instruct your broker how to vote any shares held for you in “street name,” the effect will be a vote against the merger.
The places, dates and times of the shareholders’ meetings are as follows:
| | For shareholders of Baylake: | | | For shareholders of Nicolet: | |
| | April 12, 2016 6:00 p.m. Stone Harbor Resort & Conference Center 107 North First Avenue Sturgeon Bay, Wisconsin 54235 |
| | April 12, 2016 9:45 a.m. Nicolet National Bank 111 N. Washington St. Green Bay, Wisconsin 54301 |
|
This document contains a more complete description of the shareholders’ meetings and the terms of the merger. We urge you to review this entire document carefully. You may also obtain information about Nicolet and Baylake from documents that each has filed with the Securities and Exchange Commission.
Nicolet and the Baylake boards of directors recommend that the Nicolet and Baylake shareholders, respectively, vote FOR approval of the merger agreement and the transactions contemplated thereby, FOR the non-binding resolution approving certain merger-related compensation, and FOR the adjournment proposal.
| | /s/ Robert W. Agnew Robert W. Agnew Chairman of the Board Baylake Corp. |
| | /s/ Robert B. Atwell Robert B. Atwell Chairman, President and Chief Executive Officer Nicolet Bankshares, Inc. |
|
You should read this entire joint proxy statement-prospectus carefully because it contains important information about the merger. In particular, you should read carefully the information under the section entitled “Risk Factors,” beginning on page 16.
Neither the Securities and Exchange Commission nor any state securities regulators have approved or disapproved of the securities to be issued in the merger or determined if this document is truthful or complete. Any representation to the contrary is a criminal offense.
The shares of Nicolet common stock to be issued in the merger are not deposits or savings accounts or other obligations of any bank or savings association and are not insured by the Federal Deposit Insurance Corporation or any other governmental agency.
This joint proxy statement-prospectus is dated March 1, 2016, and is first being mailed to Baylake’s and Nicolet’s shareholders on or about March 10, 2016.
PLEASE NOTE
We have not authorized anyone to provide you with any information other than the information included in this joint proxy statement-prospectus and the documents to which we refer you herein. If someone provides you with other information, please do not rely on it as being authorized by us.
This joint proxy statement–prospectus has been prepared as of the date on the cover page. There may be changes since that date in the affairs of Baylake or Nicolet that are not reflected in this document.
As used in this joint proxy statement-prospectus, the terms “Baylake” and “Nicolet” refer to Baylake Corp. and Nicolet Bankshares, Inc., respectively. Where the context requires, “Baylake” may refer to Baylake Corp. and its subsidiary, Baylake Bank. Similarly, “Nicolet” may refer to Nicolet Bankshares, Inc. and its subsidiary, Nicolet National Bank.
Unless the context indicates otherwise, all references to the “merger agreement” refer to the Agreement and Plan of Merger dated September 8, 2015, between Nicolet and Baylake.
BAYLAKE CORP.
217 North Fourth Avenue
Sturgeon Bay, Wisconsin 54235-2405
217 North Fourth Avenue
Sturgeon Bay, Wisconsin 54235-2405
NOTICE OF SPECIAL MEETING OF SHAREHOLDERS
TO BE HELD ON APRIL 12, 2016
TO BE HELD ON APRIL 12, 2016
To the Shareholders of Baylake Corp.:
Baylake Corp. will hold a special meeting of shareholders at Stone Harbor Resort & Conference Center, 107 North First Avenue, Sturgeon Bay, WI 54235, on April 12, 2016, at 6:00 p.m., local time, for the following purposes:
1. Merger. To authorize, approve and adopt the Agreement and Plan of Merger by and between Baylake Corp. and Nicolet Bankshares, Inc., pursuant to which Baylake will merge with and into Nicolet, and the transactions contemplated by the merger agreement. A copy of the merger agreement is attached to the accompanying joint proxy statement-prospectus as Appendix A.
2. Non-Binding Vote on Compensation. To vote, on a non-binding advisory resolution, to approve compensation that may become payable to Robert J. Cera in connection with the merger.
3. Adjournment. To adjourn the special meeting to a later date or dates, if necessary or appropriate, including to solicit additional proxies to approve the merger agreement and the transactions contemplated by the merger agreement.
4. Other business. To transact such other business as may properly come before the special meeting or any adjournments or postponements of the special meeting.
Only shareholders of record at the close of business on February 29, 2016, the record date, are entitled to notice of and to vote at the special meeting or any adjournments or postponements of the special meeting. The approval of the Agreement and Plan of Merger requires the affirmative vote of at least a majority of the shares of Baylake common stock outstanding on the record date.
After careful consideration, your board of directors supports the merger and unanimously recommends that you vote FOR approval of the Agreement and Plan of Merger and the transactions contemplated thereby, FOR approval, in a non-binding resolution, of compensation that may become payable to Robert J. Cera in connection with the merger, and FOR the adjournment proposal.
YOUR VOTE IS VERY IMPORTANT. Whether or not you plan to attend the special meeting, please take the time to vote by following the instructions in the enclosed proxy card. You may revoke your proxy at any time before it is voted by giving written notice of revocation to Baylake’s Corporate Secretary or by filing a properly executed proxy card of a later date with Baylake’s Corporate Secretary at or before the meeting. You may also revoke your proxy by attending the meeting, giving oral notice of your revocation, and voting your shares in person at the meeting.
We do not know of any other matters to be presented at the special meeting, but if other matters are properly presented, the persons named as proxies will vote on such matters at their discretion.
By Order of the Board of Directors
/s/ Robert W. Agnew
Robert W. Agnew
Chairman of the Board
Robert W. Agnew
Chairman of the Board
Sturgeon Bay, Wisconsin
March 1, 2016
March 1, 2016
NICOLET BANKSHARES, INC.
111 North Washington Street
Green Bay, Wisconsin 54301
111 North Washington Street
Green Bay, Wisconsin 54301
NOTICE OF SPECIAL MEETING OF SHAREHOLDERS
TO BE HELD ON APRIL 12 , 2016
TO BE HELD ON APRIL 12 , 2016
To the Shareholders of Nicolet Bankshares, Inc.:
Nicolet Bankshares, Inc. will hold a special meeting of shareholders at Nicolet National Bank, 111 N. Washington St., Green Bay, Wisconsin 54301, on April 12, 2016, at 9:45 a.m., local time, for the following purposes:
1. Merger and Share Issuance. To authorize, approve and adopt the Agreement and Plan of Merger, by and between Nicolet Bankshares, Inc. and Baylake Corp., pursuant to which Baylake will merge with and into Nicolet, and the transactions contemplated by the merger agreement, including the issuance of up to 4,500,000 shares of Nicolet common stock in the merger. A copy of the merger agreement is attached to the accompanying joint proxy statement-prospectus as Appendix A.
2. Non-Binding Vote on Compensation. To vote, on a non-binding advisory resolution, to approve compensation that may become payable to Robert J. Cera in connection with the merger.
3. Adjournment. To adjourn the special meeting to a later date or dates, if necessary or appropriate, including to solicit additional proxies to approve the merger agreement and the transactions contemplated by the merger agreement.
4. Other business. To transact such other business as may properly come before the special meeting or any adjournments or postponements of the special meeting.
Only shareholders of record at the close of business on February 29, 2016, the record date, are entitled to notice of and to vote at the special meeting or any adjournments or postponements of the special meeting. The approval of the Agreement and Plan of Merger requires the affirmative vote of at least a majority of the shares of Nicolet common stock outstanding on the record date.
After careful consideration, your board of directors supports the merger and unanimously recommends that you vote FOR approval of the Agreement and Plan of Merger and the transactions contemplated thereby, including the share issuance, FOR approval, in a non-binding resolution, of compensation that may become payable to Robert J. Cera in connection with the merger, and FOR the adjournment proposal.
YOUR VOTE IS VERY IMPORTANT. Whether or not you plan to attend the special meeting, please take the time to vote by following the voting instructions included in the enclosed proxy card. You may revoke your proxy at any time before it is voted by giving written notice of revocation to Nicolet’s Corporate Secretary or by filing a properly executed proxy card of a later date with Nicolet’s Corporate Secretary at or before the meeting. You may also revoke your proxy by attending the meeting, giving oral notice of your revocation, and voting your shares in person at the meeting.
The anticipated usual Annual Meeting for Nicolet Bankshares, Inc. is currently planned to be held on June 21, 2016 at the Meyer Theatre, 117 S. Washington St., Green Bay, Wisconsin 54301. Post-meeting refreshments will be served at this meeting.
We do not know of any other matters to be presented at the special meeting, but if other matters are properly presented, the persons named as proxies will vote on such matters at their discretion.
By Order of the Board of Directors
/s/ Robert B. Atwell
Robert B. Atwell
Chairman, President and Chief Executive Officer
Robert B. Atwell
Chairman, President and Chief Executive Officer
Green Bay, Wisconsin
March 1, 2016
March 1, 2016
TABLE OF CONTENTS
| | | |
Page
|
| |||
| | | |
|
| | ||
| | | |
|
| | ||
| | | | | 1 | | | |
| | | | | 2 | | | |
| | | | | 2 | | | |
| | | | | 2 | | | |
| | | | | 2 | | | |
| | | | | 3 | | | |
| | | | | 3 | | | |
| | | | | 4 | | | |
| | | | | 4 | | | |
| | | | | 4 | | | |
| | | | | 4 | | | |
| | | | | 5 | | | |
| | | | | 5 | | | |
| | | | | 6 | | | |
| | | | | 6 | | | |
| | | | | 6 | | | |
| | | | | 7 | | | |
| | | | | 7 | | | |
| | | | | 7 | | | |
| | | | | 8 | | | |
| | | | | 8 | | | |
| | | | | 9 | | | |
| | | |
|
| | ||
| | | |
|
| | ||
| | | |
|
| | ||
| | | |
|
| | ||
| | | |
|
| | ||
| | | | | 21 | | | |
| | | | | 21 | | | |
| | | | | 22 | | | |
| | | | | 22 | | | |
| | | | | 23 | | | |
| | | | | 23 | | | |
| | | |
|
| | ||
| | | | | 24 | | | |
| | | | | 24 | | | |
| | | | | 24 | | | |
| | | |
|
| | ||
| | | |
Page
|
| |||
| | | | | 25 | | | |
| | | | | 25 | | | |
| | | | | 26 | | | |
| | | | | 26 | | | |
| | | | | 27 | | | |
| | | | | 27 | | | |
| | | | | 28 | | | |
| | | | | 28 | | | |
| | | | | 28 | | | |
| | | | | 28 | | | |
| | | | | 29 | | | |
| | | | | 29 | | | |
| | | | | 29 | | | |
| | | | | 33 | | | |
| | | | | 35 | | | |
| | | | | 45 | | | |
| | | | | 57 | | | |
| | | | | 59 | | | |
| | | | | 63 | | | |
| | | | | 63 | | | |
| | | | | 63 | | | |
| | | | | 64 | | | |
| | | | | 64 | | | |
| | | | | 66 | | | |
| | | | | 66 | | | |
| | | | | 67 | | | |
| | | | | 67 | | | |
| | | | | 67 | | | |
| | | | | 67 | | | |
| | | | | 68 | | | |
| | | | | 68 | | | |
| | | | | 68 | | | |
| | | | | 68 | | | |
| | | | | 69 | | | |
| | | | | 70 | | | |
| | | | | 70 | | | |
| | | | | 73 | | | |
| | | | | 75 | | | |
| | | | | 75 | | | |
| | | | | 76 | | | |
| | | | | 76 | | | |
| | | | | 76 | | | |
| | | | | 77 | | | |
| | | |
Page
|
| |||
| | | | | 77 | | | |
| | | | | 78 | | | |
| | | | | 78 | | | |
| | | | | 79 | | | |
| | | | | 79 | | | |
| | | | | 80 | | | |
| | | | | 81 | | | |
| | | | | 81 | | | |
| | | | | 81 | | | |
| | | |
|
| | ||
| | | | | 82 | | | |
| | | | | 82 | | | |
| | | | | 82 | | | |
| | | | | 83 | | | |
| | | | | 83 | | | |
| | | | | 83 | | | |
| | | | | 84 | | | |
| | | | | 84 | | | |
| | | | | 84 | | | |
| | | | | 85 | | | |
| | | | | 85 | | | |
| | | | | 86 | | | |
| | | | | 87 | | | |
| | | |
|
| | ||
| | | |
|
| | ||
| | | |
|
| | ||
| | | |
|
| | ||
| | | |
|
| | ||
| | | |
|
| | ||
| | | |
|
| | ||
| | | |
|
| | ||
APPENDIX A
AGREEMENT AND PLAN OF MERGER BY AND BETWEEN NICOLET BANKSHARES, INC. AND BAYLAKE CORP.
APPENDIX B
OPINION OF KEEFE, BRUYETTE & WOODS, INC.
APPENDIX C
OPINION OF SANDLER O’NEILL & PARTNERS, L.P.
QUESTIONS AND ANSWERS
Q:
On what am I being asked to vote?
A:
You are being asked to approve the Agreement and Plan of Merger by and between Nicolet and Baylake, which we may refer to as the merger agreement, and which provides for the merger of Baylake with and into Nicolet, and the transactions contemplated thereby. As part of their approval of the merger agreement and the merger, Nicolet shareholders are also being asked to approve the issuance of stock in the merger to Baylake shareholders. Shareholders of both Baylake and Nicolet are being asked to vote on non-binding advisory resolutions approving certain merger-related compensation, and to approve a proposal to adjourn their respective special meetings, if necessary or appropriate, including to solicit additional proxies to approve the merger agreement and the transactions contemplated by the merger agreement.
Q:
Why have Nicolet and Baylake decided to merge?
A:
Nicolet and Baylake agreed to merge for strategic reasons that benefit both parties. Their boards of directors believe that the merger will provide the combined institution with sufficient opportunities for enhanced revenue growth.
Q:
How does my board of directors recommend I vote on the merger agreement?
A:
The boards of directors of Baylake and Nicolet have unanimously approved and adopted the merger agreement and recommend that their respective shareholders vote “FOR” approval of the merger agreement and the transactions contemplated thereby, “FOR” approval, in a non-binding advisory resolution, of the merger-related compensation proposals and “FOR” approval of the respective adjournment proposals.
Q:
What will happen to Nicolet National Bank and Baylake Bank as a result of the merger?
A:
If the merger occurs, Baylake Bank, which is a wholly owned subsidiary of Baylake, will be merged with and into Nicolet National Bank, which is a wholly owned subsidiary of Nicolet. We may refer to this transaction as the “bank merger.” Nicolet National Bank will be the surviving entity in the bank merger.
Q:
What vote is required to approve the merger agreement and the transactions contemplated thereby?
A:
The merger cannot be completed unless a majority of the outstanding shares of each of Nicolet and Baylake vote to approve the merger agreement and the transactions contemplated thereby.
Q:
What will I receive in the merger?
A:
Baylake shareholders will receive 0.4517 shares of Nicolet common stock for each share of Baylake common stock they hold. In lieu of any fractional shares of Nicolet common stock, Baylake shareholders will receive an amount in cash (without interest and rounded to the nearest whole cent) as determined by multiplying the volume weighted average closing price of Nicolet common stock on Nasdaq Capital Market over the 20 trading day period ending on the third trading day prior to the closing date by the fractional share of Nicolet common stock to which such former holder would otherwise be entitled. After the merger is completed, we expect that current Nicolet shareholders will own approximately 50% of the voting shares of common stock of the combined company, and current Baylake shareholders will own approximately 50% of the voting shares of common stock of the combined company. See page 67 for further explanation.
In addition, the merger agreement allows Baylake to continue paying its regular quarterly dividends of $0.09 per share (the first such dividend having been declared on October 20, 2015 and payable on December 1, 2015 to shareholders of record as of November 12, 2015) and to pay a special cash dividend of up to $0.40 per share immediately prior to consummation of the merger. Though Baylake’s board of directors currently expects to pay both the regular quarterly dividend and the special dividend, the payment of such dividends is not guaranteed, nor is it a condition to the closing of the merger.
i
Q:
What are the federal income tax consequences of the merger to me?
A:
Bryan Cave LLP has issued an opinion, which it will confirm as of the effective date of the merger, that the merger will qualify as a reorganization under Section 368(a) of the Internal Revenue Code and that Baylake shareholders will not recognize gain for U.S. federal income tax purposes as a result of the surrender of Baylake common stock for receipt of Nicolet common stock. However, shareholders may recognize gain for U.S. federal income tax purposes to the extent of any cash received in lieu of fractional shares and for any dividends, including the special dividend. Your tax treatment will depend on your specific situation and many variables not within our control. You should consult your own tax advisor for a full understanding of the tax consequences of the merger to you.
Q:
When do you expect the merger to be completed?
A:
We are working to complete the merger in the second quarter of 2016, shortly after the special shareholders’ meetings, assuming Baylake and Nicolet shareholders approve the merger and other conditions to closing are met. We could experience delays in meeting these conditions or be unable to meet them at all. See “Risk Factors” beginning on page 16 for a discussion of these and other risks relating to the merger.
Q:
Will I be able to sell the Nicolet common stock I receive pursuant to the merger?
A:
Yes. The Nicolet common stock issued pursuant to the merger will be registered under the Securities Act of 1933, as amended, and Nicolet will cause the shares to be issued in the merger to be listed on the Nasdaq Capital Market. All shares of Nicolet common stock that you receive pursuant to the merger will be freely transferable unless you are deemed an affiliate of Nicolet. Affiliates of Nicolet will, be able to sell the shares they receive pursuant to the merger subject to applicable securities regulations. See “Resale of Nicolet Common Stock” on page 64.
Q:
What should I do now?
A:
After carefully reading and considering the information in this joint proxy statement-prospectus, follow the voting instructions included in the enclosed proxy card in order to vote your shares as soon as possible, so that your shares will be represented at your company’s special meeting.
NOTE: If you sign and send in your proxy card and do not indicate how you want to vote, your proxy will be voted “FOR” the proposal to approve the merger agreement and the transactions contemplated thereby, “FOR” the non-binding advisory resolution to approve certain merger-related compensation, and “FOR” the adjournment proposal.
Q:
What if I do not vote?
A:
If you do not vote, it will have the same effect as voting your shares against the merger.
Q:
If my shares are held in “street name” by my broker, will my broker automatically vote my shares for me?
A:
No. Your broker will vote your shares of stock on the merger agreement only if you provide instructions on how to vote. You should instruct your broker on how to vote your shares, following the directions your broker provides. If you do not provide instructions to your broker, and your broker submits an unvoted proxy, the resulting broker nonvote will not be counted toward a quorum and your shares will not be voted at your company’s special meeting, which will have the same effect as voting your shares against the merger.
Q:
Can I change my vote after I deliver my proxy?
A:
Yes. You can change your vote at any time before your proxy is voted at the special meeting. You can do this in three ways. First, you can revoke your proxy by giving written notice of revocation to your company’s Corporate Secretary. Second, you can submit a new properly executed proxy with a later date to your company’s Corporate Secretary at or before your company’s special meeting. The latest proxy actually received before the meeting will be counted, and any earlier proxies will be revoked. Third, you can attend your company’s special meeting, give oral notice of your revocation, and vote
ii
your shares in person. Any earlier proxy will be thereby revoked. However, simply attending the meeting without voting will not revoke your proxy. If you hold shares in “street name,” you must contact your broker prior to your company’s special meeting if you wish to revoke your proxy or change your vote.
Q:
Should I send in my stock certificates now?
A:
No. If you are a Baylake shareholder and the merger is completed, Nicolet’s exchange agent will send all Baylake shareholders written instructions for exchanging Baylake common stock certificates for the merger consideration they are entitled to receive. In any event, do not send your stock certificates with your proxy card.
If you are a Nicolet shareholder, your shares of Nicolet common stock will remain outstanding and unchanged in the merger. Consequently, you will not need to surrender your stock certificates or exchange them for new ones.
Q:
Who can help answer my questions?
A:
If you would like additional copies of this document, or if you would like to ask any questions about the merger and related matters, you should contact:
For Baylake shareholders: Robert J. Cera, Baylake Corp., 217 North Fourth Avenue, Sturgeon Bay, Wisconsin 54235-2405, telephone: (920) 746-5418.
For Nicolet shareholders: Robert B. Atwell, Nicolet Bankshares, Inc., 111 North Washington Street, Green Bay, Wisconsin 54301, telephone: (920) 430-1400.
iii
SUMMARY
We have prepared this summary of certain material information to assist you in your review of this joint proxy statement-prospectus. It is necessarily general and abbreviated, and it is not intended to be a complete explanation of all of the matters covered in this joint proxy statement-prospectus. To understand the merger and the issuance of cash and shares of Nicolet common stock in the merger, please see the more complete and detailed information in the sections that follow this summary, as well as the financial statements and appendices included in this joint proxy statement-prospectus by reference. For more information about Nicolet or Baylake, please see the section entitled “Where You Can Find Additional Information.” We urge you to read all of these documents in their entirety prior to returning your proxy or voting at the special meeting of your company’s shareholders.
Each item in this summary refers to the page of this document on which that subject is discussed in more detail.
The Companies
Nicolet Bankshares, Inc.
111 North Washington Street
Green Bay, Wisconsin 54301
(920) 430-1400
111 North Washington Street
Green Bay, Wisconsin 54301
(920) 430-1400
Nicolet is a Wisconsin corporation and was incorporated as Green Bay Financial Corporation, a Wisconsin corporation, on April 5, 2000, to serve as the holding company for and the sole shareholder of Nicolet National Bank. It amended and restated its articles of incorporation and changed its name to Nicolet Bankshares, Inc. on March 14, 2002. It subsequently became the holding company for Nicolet National Bank upon completion of Nicolet National Bank’s reorganization into a holding company structure on June 6, 2002.
Nicolet is a registered bank holding company under the Bank Holding Company Act of 1956, as amended. It conducts operations through its wholly owned subsidiary, Nicolet National Bank, which was organized in 2000 as a national bank under the laws of the United States and opened for business on November 1, 2000. Nicolet National Bank provides a full range of traditional banking services throughout northeastern Wisconsin and the upper peninsula of Michigan. Nicolet offers commercial, retail and wealth management services through 21 branch locations in Wisconsin and Menominee, Michigan.
As of September 30, 2015, Nicolet had consolidated total assets of approximately $1.17 billion, consolidated total gross loans of approximately $884 million, consolidated total deposits of approximately $1.01 billion, and consolidated shareholders’ equity of approximately $105 million.
Baylake Corp.
217 North Fourth Avenue
Sturgeon Bay, Wisconsin 54235-2405
(920) 743-5551
217 North Fourth Avenue
Sturgeon Bay, Wisconsin 54235-2405
(920) 743-5551
Baylake Corp. is a registered bank holding company headquartered in Sturgeon Bay, Wisconsin. Baylake Bank, Baylake’s wholly owned banking subsidiary, is a bank chartered under the laws of Wisconsin. Baylake Bank offers a full range of traditional banking services, including commercial, retail and wealth management services, through 20 retail banking locations throughout northeast Wisconsin.
On May 5, 2015, Baylake entered into an Agreement and Plan of Merger by and between Baylake and NEW Bancshares, Inc. (“NEWBI”), providing for the acquisition of NEWBI and its wholly owned bank subsidiary, Union State Bank, by Baylake. As of September 30, 2015, NEWBI had consolidated total assets of approximately $83 million, including consolidated total gross loans of approximately $49 million, as well as $73 million in deposits. The acquisition of NEWBI was completed on December 4, 2015.
As of September 30, 2015, Baylake had consolidated total assets of approximately $1.02 billion, consolidated total gross loans of approximately $692 million, consolidated total deposits of approximately $800 million and consolidated shareholders’ equity of approximately $111 million.
1
The Merger Agreement
(See page 67)
(See page 67)
Under the terms of the merger agreement, Baylake will merge with and into Nicolet, with Nicolet being the surviving corporation. Following the merger of Baylake with and into Nicolet, Baylake Bank will merge with and into Nicolet National Bank, with Nicolet National Bank being the surviving bank. Both Nicolet and Nicolet National Bank will continue their existence under Wisconsin law and the laws of the United States, respectively, while Baylake and Baylake Bank will cease to exist. The merger agreement is attached to this document as Appendix A and is incorporated into this joint proxy statement-prospectus by reference. We encourage you to read the entire merger agreement carefully, as it is the legal document that governs the proposed merger.
What You Will Receive in the Merger
(See page 67)
(See page 67)
If the merger is completed, Baylake shareholders will receive 0.4517 shares of Nicolet common stock for each of their shares except in the circumstances described below.
No fractional shares of Nicolet common stock will be issued in connection with the merger. Instead, Nicolet will make a cash payment without interest to each shareholder of Baylake who would otherwise receive a fractional share of Nicolet common stock. The amount of such cash payment will be determined by multiplying the fraction of a share of Nicolet common stock otherwise issuable to such shareholder by the volume weighted average closing price of Nicolet common stock on the Nasdaq Capital Market over the 20 trading day period ending on the third trading day prior to the closing date.
In addition, the merger agreement allows Baylake to continue paying its regular quarterly dividend of $0.09 per share and to pay a special cash dividend of up to $0.40 per share immediately prior to consummation of the merger. Though Baylake’s board of directors currently expects to pay both the regular quarterly dividend and the special dividend, the payment of such dividends is not guaranteed, nor is it a condition to the closing of the merger.
Effect of the Merger on Baylake Options, Restricted Stock Units and Other Equity Awards
(See page 68)
(See page 68)
As of September 30, 2015, there were 254,255 outstanding options to purchase Baylake common stock, with a weighted average exercise price of $9.39 per share, and 87,301 outstanding restricted stock units (RSUs). Pursuant to the merger agreement, each Baylake equity award, including options to purchase shares of Baylake common stock, RSUs and other equity awards, whether such award was granted under a Baylake stock plan or otherwise, and whether such award is vested or unvested, that is outstanding and unexercised immediately prior to the effective closing date shall be adjusted under the Baylake stock plan or converted into a substituted option under a Nicolet stock plan.
Your Expected Tax Treatment as a Result of the Merger
(See page 78)
(See page 78)
We expect that Baylake shareholders will not recognize any gain or loss for U.S. federal income tax purposes as a result of the merger, except to the extent of any cash received either as dividends, including the special dividend, or in lieu of fractional shares. The completion of the merger is conditioned on receipt of a tax opinion from Bryan Cave LLP that the merger qualifies as a tax-free reorganization under Section 368(a) of the Internal Revenue Code of 1986, as amended (the “Internal Revenue Code”) and that Baylake shareholders will not recognize gain or loss in connection with the exchange of their shares (except with respect to any cash received). The opinion will not bind the Internal Revenue Service, which could take a different view.
See “Material U.S. Federal Income Tax Consequences of the Merger” for a more detailed discussion of the tax consequences of the merger.
Determining the actual tax consequences of the merger to you as an individual taxpayer can be complicated. The tax treatment will depend on your specific situation and many variables not within our control. For these reasons, we recommend that you consult your tax advisor concerning the federal and any applicable state, local or other tax consequences of the merger to you.
2
Comparative Stock Prices
(See page 88)
(See page 88)
Nicolet. Nicolet common stock currently trades on the Nasdaq Capital Market under the ticker “NCBS.” The sale price for a share of Nicolet common stock was $32.49 on February 24, 2016.
Baylake. Baylake common stock currently trades on the Nasdaq Capital Market under the symbol “BYLK.” The sale price for a share of Baylake common stock was $14.35 on February 24, 2016.
Both Boards of Directors Recommend Shareholder Approval of the Merger
(See page 27 for Nicolet and page 23 for Baylake)
(See page 27 for Nicolet and page 23 for Baylake)
Nicolet. The board of directors of Nicolet has unanimously approved the merger agreement and believes that the merger is in the best interests of Nicolet’s shareholders. The board unanimously recommends that you vote FOR approval of the merger proposal, FOR the non-binding merger-related compensation proposal, and FOR the adjournment proposal.
In deciding to engage in the merger transaction with Baylake, Nicolet’s management and board of directors noted, among other things, the following:
•
the complementary strengths of Nicolet and Baylake, with Nicolet as a leader in commercial lending and Baylake having a superior retail and commercial banking presence in Door and Kewaunee Counties;
•
the expected strengthened competitive positioning of the combined company throughout Northeast Wisconsin, which Nicolet expects will meaningfully enhance its ability to serve its customers;
•
the board of director’s belief that the merger represents a superior opportunity for increasing shareholder value compared to the other strategic alternatives available to Nicolet; and
•
the expectation that Nicolet shareholders will experience opportunities for share price growth driven by a more liquid publicly traded stock.
Baylake. The board of directors of Baylake has unanimously approved the merger agreement and believes that the merger is in the best interests of Baylake’s shareholders. The board unanimously recommends that you vote FOR approval of the merger proposal, FOR the non-binding merger-related compensation proposal, and FOR the adjournment proposal.
In deciding to engage in the merger transaction with Nicolet, Baylake’s board of directors consulted with its management, as well as its legal counsel and financial advisor, and considered numerous factors, including the following:
•
information concerning business, operations, earnings, asset quality, and financial condition, prospects, and capital levels of Baylake and Nicolet, both individually and as a combined entity;
•
the expected strengthened competitive positioning of the combined company throughout Northeast Wisconsin, which Baylake expects will meaningfully enhance its ability to serve its customers;
•
the value of the consideration to be received by Baylake’s shareholders compared to shareholder value for Baylake as an independent entity;
•
the perceived risks and uncertainties attendant to Baylake’s operation as an independent banking organization, including risks and uncertainties related to the continuing low-interest rate environment and increased capital requirements;
•
the board of director’s belief that the merger represents a superior opportunity for increasing shareholder value compared to the other strategic alternatives available to Baylake;
•
the financial terms of recent business combinations in the financial services industry and a comparison of the multiples of selected combinations with the terms of the proposed merger;
3
•
the receipt of the stock consideration by Baylake’s shareholders on a tax-free basis;
•
the opinion of Sandler O’Neill that the consideration to be received by Baylake’s common shareholders in the merger is fair from a financial point of view; and
•
the likelihood of the merger being approved by applicable regulatory authorities without undue conditions or delay.
Opinion of Keefe, Bruyette & Woods, Inc.
(See page 35)
(See page 35)
In connection with the merger, Keefe, Bruyette & Woods, Inc. (“KBW”) delivered a written opinion, dated September 8, 2015, to Nicolet’s board of directors as to the fairness, from a financial point of view and as of the date of the opinion, to Nicolet of the exchange ratio in the merger. The full text of KBW’s opinion, which describes the procedures followed, assumptions made, matters considered, and qualifications and limitations on the review undertaken by KBW in preparing the opinion, is attached as Appendix B to this joint proxy statement-prospectus. The opinion was for the information of, and was directed to, the Nicolet board of directors (in its capacity as such) in connection with its consideration of the financial terms of the merger. The opinion did not address the underlying business decision of Nicolet to engage in the merger or enter into the merger agreement or constitute a recommendation to the Nicolet board of directors in connection with the merger, and it does not constitute a recommendation to any holder of Nicolet common stock or any shareholder of any other entity as to how to vote in connection with the merger or any other matter.
Opinion of Sandler O’Neill & Partners, L.P.
(See page 45)
(See page 45)
In deciding to approve the merger, the board of directors of Baylake considered the opinion of its financial advisor, Sandler O’Neill. Sandler O’Neill, an investment banking and financial advisory firm, has given a fairness opinion to the Baylake board of directors that, as of the date thereof, the merger consideration is fair, from a financial point of view, to the holders of Baylake common stock. The opinion is based on and subject to the procedures, matters and limitations described in the opinion and other matters that Sandler O’Neill considered relevant. The fairness opinion is attached to this joint proxy statement-prospectus as Appendix C. We urge all shareholders of Baylake to read the entire opinion, which describes the procedures followed, matters considered and limitations on the review undertaken by Sandler O’Neill in providing its opinion.
Information About the Shareholders’ Meetings
(See page 25 for Nicolet and page 21 for Baylake)
(See page 25 for Nicolet and page 21 for Baylake)
Nicolet. A special meeting of the shareholders of Nicolet will be held on April 12, 2016, at 9:45 a.m., local time. The meeting will be held at Nicolet National Bank, 111 N. Washington St., Green Bay, Wisconsin 54301. At the meeting, the shareholders of Nicolet will vote on the merger agreement described herein and in the notice for the meeting. If Nicolet’s shareholders approve the merger agreement and the other conditions to completing the merger are satisfied, we expect to complete the merger shortly after the special shareholders’ meeting.
Baylake. A special meeting of the shareholders of Baylake will be held on April 12, 2016, at 6:00 p.m., local time. The meeting will be held at Stone Harbor Resort & Conference Center, 107 North First Avenue, Sturgeon Bay, Wisconsin 54235. At the meeting, the shareholders of Baylake will vote on the merger agreement described herein and in the notice for the meeting. If Baylake’s shareholders approve the merger agreement and the other conditions to completing the merger are satisfied, we expect to complete the merger shortly after the special shareholders’ meeting.
Quorum and Vote Required at the Meetings
(See page 25 for Nicolet and page 21 for Baylake)
(See page 25 for Nicolet and page 21 for Baylake)
Nicolet. Shareholders who own Nicolet common stock at the close of business on February 29, 2016, the record date, will be entitled to vote at the meeting. A majority of the outstanding shares of Nicolet common stock, as of the record date for the meeting, must be present in person or by proxy at the meeting
4
in order for a quorum to be present. If a quorum is not present at the meeting, the meeting will be adjourned, and no vote will be taken until and unless a quorum is present.
Approval of the merger proposal requires the affirmative vote of a majority of the shares of Nicolet common stock outstanding on the record date. Abstentions, shares not voted, and broker nonvotes will have the same effect as a vote against the merger proposal. Approval of the non-binding merger-related compensation proposal and the adjournment proposal requires that the votes cast for the proposal exceed the votes cast against the proposal.
Baylake. Shareholders who own Baylake common stock at the close of business on February 29, 2016, the record date, will be entitled to vote at the meeting. A majority of the outstanding shares of Baylake common stock, as of the record date for the meeting, must be present in person or by proxy at the meeting in order for a quorum to be present. If a quorum is not present at the meeting, the meeting will be adjourned, and no vote will be taken until and unless a quorum is present.
Approval of the merger proposal requires the affirmative vote of a majority of the shares of Baylake common stock outstanding on the record date. Abstentions, shares not voted, and broker nonvotes will have the same effect as a vote against the merger proposal. Approval of the non-binding merger-related compensation proposal and the adjournment proposal requires that the votes cast for the proposal exceed the votes cast against the proposal.
Share Ownership of Management
(See page 90)
(See page 90)
Nicolet. As of December 31, 2015, directors and executive officers of Nicolet had or shared voting or dispositive power over approximately 25.3% of the outstanding shares of Nicolet common stock. It is anticipated that these individuals will vote their shares of Nicolet common stock in favor of the merger agreement. Certain of these individuals have entered into a written agreement with Baylake providing that they will vote the shares over which they have voting power, subject to their fiduciary duties, in favor of the merger agreement. A copy of the form of such agreement is included as an exhibit to the merger agreement.
As of December 31, 2015, directors and executive officers of Baylake had or shared no voting or dispositive power over any of the outstanding shares of Nicolet common stock.
Baylake. As of December 31, 2015, directors and executive officers of Baylake had or shared voting or dispositive power over approximately 11.49% of the outstanding shares of Baylake common stock. It is anticipated that these individuals will vote their shares of Baylake common stock in favor of the merger agreement. Certain of these individuals have entered into a written agreement with Nicolet providing that they will vote the shares over which they have voting power, subject to their fiduciary duties, in favor of the merger agreement. A copy of the form of such agreement is included as an exhibit to the merger agreement.
As of December 31, 2015, except for approximately 0.3% of the outstanding shares of Baylake common stock, Nicolet directors and executive officers had or shared no voting or dispositive power over any of the outstanding shares of Baylake common stock. Nicolet had voting and dispositive power over approximately 1.3% of the outstanding shares of Baylake common stock as of the record date.
Structure of the Merger
(See page 29)
(See page 29)
•
Baylake Corp. and Baylake Bank will cease to exist after the merger.
•
Subsequent to the bank merger, the business of Baylake Bank will be conducted through Nicolet National Bank.
•
Eight current Nicolet directors — Robert B. Atwell, Michael E. Daniels, John N. Dykema, Christopher J. Ghidorzi, Donald J. Long, Susan L. Merkatoris, Randy J. Rose, and Robert J. Weyers — will remain on Nicolet’s board of directors following consummation of the merger. They will also remain on the board of directors of Nicolet National Bank following the bank merger.
5
•
Eight current Baylake directors — Robert W. Agnew, Robert J. Cera, Terrence R. Fulwiler, Thomas L. Herlache, Louis J. Jeanquart, William D. Murphy, Dean J. Nolden, and Elyse Mollner Stackhouse — will be appointed to Nicolet’s board of directors upon consummation of the merger. They also will be appointed to Nicolet National Bank’s board of directors upon consummation of the bank merger.
•
Following consummation of the merger, Mr. Atwell and Mr. Cera will serve as Co-Chief Executive Officers and Co-Presidents of Nicolet, and Mr. Daniels will serve as Executive Vice President and Secretary.
We Have Obtained All Regulatory Approvals Required to Complete the Merger
(See page 64)
(See page 64)
Consummation of the merger requires the approval of the Board of Governors of the Federal Reserve System (the “Federal Reserve”), the Office of the Comptroller of the Currency (“OCC”) and the Wisconsin Department of Financial Institutions (the “WDFI”). As of the date of this joint proxy statement-prospectus, all required applications and notices have been filed and all required regulatory approvals have been received.
We Must Meet Several Conditions to Complete the Merger
(See page 69)
(See page 69)
In addition to the required regulatory approvals, the merger will be completed only if certain conditions are met or waived, including the following:
•
approval by both Baylake’s shareholders and Nicolet’s shareholders of the merger agreement by the required vote;
•
receipt by Baylake and Nicolet of an opinion from Bryan Cave LLP that the merger qualifies as a reorganization within the meaning of Section 368(a) of the Internal Revenue Code;
•
the non-objection of the Nasdaq Stock Market to the listing of the shares of Nicolet common stock to be delivered in the merger to the former Baylake shareholders on the Nasdaq Capital Market;
•
each party maintaining tangible common equity equal to at least 95% of such party’s tangible common equity as of June 30, 2015;
•
the offering by Nicolet of an employment agreement to Robert J. Cera in substantially the form attached as Exhibit D to the merger agreement; and
•
each party’s certification to the other as to the continued accuracy of the representations and warranties contained in the merger agreement, compliance with covenants and closing conditions, and the satisfaction of all other matters applicable to the transaction.
If all regulatory approvals are received and the other conditions to completion are satisfied, Nicolet and Baylake contemplate that they will complete the merger in the second quarter of 2016, shortly after their special shareholders’ meetings.
Termination and Termination Fee
(See page 75)
(See page 75)
The merger agreement may be terminated, either before or after shareholder approval, under certain circumstances described in detail later in this joint proxy statement-prospectus. If Nicolet terminates the merger agreement because Baylake’s board withdraws or changes its recommendation of the merger agreement, or if Baylake terminates the agreement to accept an Acquisition Proposal it deems a Superior Proposal, as each term is defined in the merger agreement, then Baylake (or its successor) must pay Nicolet a termination fee of $7,000,000. Similarly, if Baylake terminates the merger agreement because Nicolet’s
6
board withdraws or changes its recommendation of the merger agreement, or if Nicolet terminates the merger agreement to accept an Acquisition Proposal it deems a Superior Proposal, then Nicolet (or its successor) must pay Baylake a termination fee of $7,000,000.
Nicolet’s Directors and Executive Officers Have Interests in the Merger that Differ from its Shareholders’ Interests
(See page 59)
(See page 59)
The executive officers and directors of Nicolet have interests in the merger in addition to their interests as shareholders of Nicolet generally. The members of the Nicolet board of directors knew about these additional interests and considered them when they adopted the merger agreement. Such interests include, among others:
•
the potential continuation of employee benefits;
•
the potential acceleration of vesting of outstanding options and restricted stock;
•
the potential payment of certain change in control benefits; and
•
the continuation of service on Nicolet’s board of directors of Robert B. Atwell, Michael E. Daniels, John N. Dykema, Christopher J. Ghidorzi, Donald J. Long, Susan L. Merkatoris, Randy J. Rose, and Robert J. Weyers.
These interests are more fully described in this joint proxy statement-prospectus under the heading “The Merger — Interests of Certain Persons in the Merger” at page 59.
Baylake’s Directors and Executive Officers Have Interests in the Merger that Differ from its Shareholders’ Interests
(See page 59)
(See page 59)
The executive officers and directors of Baylake have interests in the merger in addition to their interests as shareholders of Baylake generally. The members of the Baylake board of directors knew about these additional interests and considered them when they adopted the merger agreement. Such interests include, among others:
•
the potential continuation of employee benefits;
•
the potential acceleration of vesting of outstanding options and restricted stock units;
•
the potential payment of certain change in control benefits;
•
the execution of a new employment agreement between Nicolet and Robert J. Cera in substantially the form attached as Exhibit D to the merger agreement;
•
provisions in the merger agreement relating to director and officer liability insurance and the indemnification of officers and directors of Baylake for certain liabilities; and
•
the appointment of Robert J. Cera, Robert W. Agnew, Thomas L. Herlache, Terrence R. Fulwiler, Louis J. (Rick) Jeanquart, Elyse Mollner Stackhouse, William D. Murphy and Dean Nolden to Nicolet’s board of directors.
These interests are more fully described in this joint proxy statement-prospectus under the heading “The Merger — Interests of Certain Persons in the Merger” at page 59.
Employee Benefits of Baylake Employees after the Merger
(See page 76)
(See page 76)
Nicolet has agreed to offer to all current employees of Baylake and Baylake Bank who become Nicolet employees as a result of the merger substantially similar employee benefits to those that Nicolet offers to its employees in similar positions.
7
Differences in Rights of Baylake’s Shareholders after the Merger
(See page 82)
(See page 82)
Because they will receive Nicolet common stock, Baylake shareholders will become Nicolet shareholders as a result of the merger. Their rights as shareholders after the merger will be governed by Nicolet’s articles of incorporation and bylaws. The rights of Nicolet shareholders are different in certain respects from the rights of Baylake’s shareholders. The material differences are described later in this joint proxy statement-prospectus.
Accounting Treatment
(See page 66)
(See page 66)
Nicolet is required to account for the merger as a purchase transaction for accounting and financial reporting purposes under accounting principles generally accepted in the United States of America (“GAAP”). Under purchase accounting, the assets (including any identifiable intangible assets) and liabilities (including executory contracts and other commitments) of Baylake at the effective time of the merger will be recorded at their respective fair values and added to those of Nicolet. Any excess of purchase price over the fair values is recorded as goodwill. Any excess of the fair values over the purchase price is recorded in earnings as a bargain purchase gain. Consolidated financial statements of Nicolet issued after the merger would reflect those fair values and would not be restated retroactively to reflect the historical consolidated financial position or results of operations of Baylake.
8
RECENT DEVELOPMENTS
On January 19, 2016, Nicolet issued a press release announcing its financial results for the three- and twelve-month periods ended December 31, 2015, as well as a consolidated financial summary for such periods. The press release and consolidated financial summary were included as an exhibit to the Current Report on Form 8-K filed by Nicolet on January 19, 2016. Nicolet reported net income of $11.4 million, and net income available to common shareholders of $11.2 million, or $2.57 per diluted common share, for the year ended December 31, 2015. Nicolet reported total assets at December 31, 2015 of $1.2 billion, total loans of $877 million and total deposits of $1.1 billion. Nonperforming assets were 0.32% of assets at December 31, 2015. Book value per common share was $23.42 at year-end 2015.
On January 28, 2016, Baylake issued a press release announcing its financial results for the three- and twelve-month periods ended December 31, 2015, as well as a consolidated financial summary for such periods. The press release and consolidated financial summary were included as an exhibit to the Current Report on Form 8-K filed by Baylake on February 1, 2016. Baylake reported net income of $8.0 million or $0.85 per diluted common share, for the year ended December 31, 2015. Baylake reported total assets at December 31, 2015 of $1.1 billion, total loans of $743 million and total deposits of $866 million. Nonperforming assets were 0.54% of assets at December 31, 2015. Book value per common share was $11.89 at year end 2015. Baylake also reported that its acquisition of NEW Bancshares, Inc. and its wholly-owned subsidiary, Union State Bank, was completed on December 4, 2015, and in the transaction Baylake acquired approximately $46.6 million in loans, $24.4 million in investment securities, and deposits of $68.5 million. Baylake paid a cash dividend of $0.09 per share during the fourth quarter of 2015.
9
UNAUDITED COMPARATIVE PER SHARE DATA
The following summary presents per share information for Nicolet and Baylake on a historical, pro forma combined and pro forma diluted equivalent basis for the periods and as of the dates indicated below. The pro forma information gives effect to the merger using the purchase method of accounting. This information should be read in conjunction with the companies’ historical financial statements and related notes as well as financial data included elsewhere in or incorporated by reference into this joint proxy statement-prospectus. The pro forma information should not be relied upon as being indicative of the historical results the companies would have had if the merger had occurred before such periods or the future results that the companies will experience after the merger.
The pro forma combined net income per diluted share has been computed based on the diluted average number of outstanding common shares of Nicolet adjusted for the additional shares to be issued in connection with the merger, after giving effect to the acquisition of NEWBI by Baylake. Baylake merger equivalent net income per diluted share is based on the number of shares of Nicolet common stock into which each share of Baylake common stock will be converted in the merger.
Baylake paid per share cash dividends of $0.25 and $0.30 on its common stock for the nine months ended September 30, 2015 and for the year ended December 31, 2014, respectively. Nicolet does not have a history of paying dividends on its common stock and does not intend to pay common stock dividends following the merger. Therefore, the pro forma dividend information has been omitted from the table below as it is not meaningful.
The pro forma combined net book value per share is based upon the pro forma combined equity of Nicolet divided by the pro forma number of outstanding shares of the combined companies. The Baylake merger equivalent net book value per share is based on the number of shares of Nicolet common stock into which each share of Baylake common stock will be converted in the merger.
The foregoing assumes that the shares of Nicolet common stock to be issued will have a value of $32.87 per share, which represents the volume-weighted average price based on the trading days of August 28, 2015 through September 25, 2015.
| | | |
Nine Months Ended
September 30, 2015 |
| |
Year Ended
December 31, 2014 |
| ||||||
| Net income per common share: | | | | | | | | | | | | | |
|
Income per diluted common share:
|
| | | | | | | | | | | | |
|
Nicolet
|
| | | $ | 1.93 | | | | | $ | 2.25 | | |
|
Baylake
|
| | | | 0.73 | | | | | | 0.97 | | |
|
Pro forma combined
|
| | | | 1.67 | | | | | | 1.96 | | |
|
Baylake merger equivalent(1)
|
| | | | 0.75 | | | | | | 0.89 | | |
| Balance Sheet Data: | | | | | | | | | | | | | |
|
Net book value per common share:
|
| | | | | | | | | | | | |
|
Nicolet
|
| | | $ | 23.41 | | | | | $ | 21.34 | | |
|
Baylake
|
| | | | 11.87 | | | | | | 11.65 | | |
|
Pro forma combined
|
| | | | 28.22 | | | | | | 27.05 | | |
|
Baylake merger equivalent(1)
|
| | | | 12.75 | | | | | | 12.22 | | |
(1)
Calculated by multiplying the pro forma combined information by the exchange ratio of 0.4517.
10
SELECTED UNAUDITED PRO FORMA CONDENSED FINANCIAL INFORMATION
The following unaudited pro forma condensed consolidated balance sheets and statements of income as of September 30, 2015, have been prepared to reflect the merger of Nicolet and Baylake after giving effect to the adjustments described in the notes to the pro forma condensed financial statements. In the merger, Baylake common shareholders will receive total consideration of approximately 4,310,000 shares of Nicolet common stock, subject to adjustments as set forth herein, having an estimated aggregate value of approximately $142 million (based on $32.87 per share, which represents the volume-weighted average price based on the trading days of August 28, 2015 through September 25, 2015).
The merger will be accounted for as a purchase transaction. Under the purchase method of accounting, Nicolet records the assets and liabilities of the acquired entities at their fair values on the closing date of the merger. The pro forma condensed consolidated balance sheet has been prepared assuming the transaction was consummated on September 30, 2015. The pro forma condensed consolidated statements of income have been prepared assuming the transaction was consummated on January 1, 2014.
The selected unaudited pro forma condensed consolidated financial information is presented for illustrative purposes only and does not indicate either the operating results that would have occurred had the merger been consummated before September 30, 2015, or at January 1, 2014, as the case may be, or future results of operations or financial condition. The selected unaudited pro forma condensed financial information is based upon assumptions and adjustments that Nicolet believes are reasonable. Only such adjustments as have been noted in the accompanying footnotes have been applied in order to give effect to the proposed transaction described in this joint proxy statement-prospectus. Such assumptions and adjustments are subject to change as future events materialize and fair value estimates are refined.
These selected unaudited pro forma condensed consolidated financial statements should be read in conjunction with Baylake’s Annual Report on Form 10-K for the year ended December 31, 2014, and its Form 10-Q for the nine months ended September 30, 2015, each of which are incorporated by reference herein, as well as the financial information for Nicolet’s Annual Report on Form 10-K for the year ended December 31, 2014, and its Form 10-Q for the nine months ended September 30, 2015, each of which are incorporated by reference herein.
11
NICOLET BANKSHARES, INC. AND SUBSIDIARIES
COMBINED WITH BAYLAKE CORP. AND SUBSIDIARIES
COMBINED WITH BAYLAKE CORP. AND SUBSIDIARIES
PRO FORMA CONDENSED CONSOLIDATED BALANCE SHEET (Unaudited)
AS OF SEPTEMBER 30, 2015
(In Thousands, Except Per Share Data)
AS OF SEPTEMBER 30, 2015
(In Thousands, Except Per Share Data)
| | | |
Baylake
(Historical) |
| |
NEWBI and
Pro Forma Adjustments* |
| |
Baylake
Pro Forma Combined |
| |
Nicolet
(Historical) |
| |
Pro forma
Adjustments |
| |
Pro Forma
Combined |
| ||||||||||||||||||
|
Cash and due from banks
|
| | | $ | 76,297 | | | | | $ | 775(4,5) | | | | | $ | 77,072 | | | | | $ | 38,794 | | | | | $ | (54)(18) | | | | | $ | 115,812 | | |
|
Investment securities
|
| | | | 183,640 | | | | | | 25,888 | | | | | | 209,528 | | | | | | 167,572 | | | | | | (641)(8,19) | | | | | | 376,459 | | |
|
Loans, net
|
| | | | 685,306 | | | | | | 47,870 | | | | | | 733,176 | | | | | | 877,498 | | | | | | (20,090)(9) | | | | | | 1,590,584 | | |
|
Premises and equipment, net
|
| | | | 21,732 | | | | | | 1,806 | | | | | | 23,538 | | | | | | 29,891 | | | | | | 6,000(10) | | | | | | 59,429 | | |
|
Other real estate owned, net
|
| | | | 3,977 | | | | | | 265 | | | | | | 4,242 | | | | | | 714 | | | | | | (1,500)(11) | | | | | | 3,456 | | |
|
Goodwill
|
| | | | 7,222 | | | | | | 223(3) | | | | | | 7,445 | | | | | | 762 | | | | | | 28,312(12,18) | | | | | | 36,519 | | |
|
Core Deposit Intangible
|
| | | | — | | | | | | — | | | | | | — | | | | | | 3,275 | | | | | | 15,000(13) | | | | | | 18,275 | | |
|
Other assets
|
| | | | 44,994 | | | | | | 2,468 | | | | | | 47,462 | | | | | | 48,346 | | | | | | 1,390(14,19) | | | | | | 97,198 | | |
|
Total Assets
|
| | | $ | 1,023,168 | | | | | $ | 79,295 | | | | | $ | 1,102,463 | | | | | $ | 1,166,852 | | | | | $ | 28,417 | | | | | $ | 2,297,732 | | |
|
Total deposits
|
| | | $ | 799,848 | | | | | $ | 72,543 | | | | | $ | 872,391 | | | | | $ | 1,012,181 | | | | | $ | 100(15) | | | | | $ | 1,884,672 | | |
|
Other borrowings and debt
|
| | | | 89,686 | | | | | | — | | | | | | 89,686 | | | | | | 15,480 | | | | | | 400(15) | | | | | | 105,566 | | |
|
Holding company debt
|
| | | | 16,100 | | | | | | 6,203(4) | | | | | | 22,303 | | | | | | 24,317 | | | | | | (7,200)(16) | | | | | | 39,420 | | |
|
Other liabilities
|
| | | | 6,933 | | | | | | 4,946(2,6) | | | | | | 11,879 | | | | | | 9,862 | | | | | | 675(18) | | | | | | 22,416 | | |
|
Total liabilities
|
| | | | 912,567 | | | | | | 83,692 | | | | | | 996,259 | | | | | | 1,061,840 | | | | | | (6,025) | | | | | | 2,052,074 | | |
|
Preferred equity
|
| | | | — | | | | | | — | | | | | | — | | | | | | 12,200 | | | | | | — | | | | | | 12,200 | | |
|
Common equity
|
| | | | 110,601 | | | | | | (4,397)(1,2,7) | | | | | | 106,204 | | | | | | 92,657 | | | | | | 34,442(17,18,19) | | | | | | 233,303 | | |
|
Total Equity
|
| | | | 110,601 | | | | | | (4,397) | | | | | | 106,204 | | | | | | 104,857 | | | | | | 34,442 | | | | | | 245,503 | | |
|
Noncontrolling interest
|
| | | | — | | | | | | — | | | | | | — | | | | | | 155 | | | | | | — | | | | | | 155 | | |
|
Total Liabilities, Equity & Noncontrolling Interest
|
| | | $ | 1,023,168 | | | | | $ | 79,295 | | | | | $ | 1,102,463 | | | | | $ | 1,166,852 | | | | | $ | 28,417 | | | | | $ | 2,297,732 | | |
|
Outstanding shares
|
| | | | 9,320 | | | | | | 222(1)(20) | | | | | | 9,542 | | | | | | 3,958 | | | | | | 4,310(20) | | | | | | 8,268 | | |
*
NEWBI and Pro Forma Adjustments includes NEWBI’s September 30, 2015 unaudited balance sheet as provided by NEWBI to Baylake’s management, with adjustments as detailed in footnotes 1 – 4 below, made to record the consummation of the transaction between Baylake and NEWBI (effective December 4, 2015), assuming NEWBI’s book value approximated its fair value. Also includes impacts of certain pre-merger costs and activities to be incurred by Baylake prior to and related to the merger of Nicolet and Baylake, as detailed in footnotes 5 – 7 below.
(1)
Adjustments to record the consummation of Baylake’s acquisition of NEWBI, for cash and common stock consideration per terms of that transaction. Equity adjustment consists of elimination of NEWBI’s book equity of $9,635 at book value and issuance of new equity of $4,044 (i.e. 286 shares of Baylake common stock for NEWBI common shares, issued at $14.15 per share, Baylake’s closing stock price on September 30, 2015).
(2)
Beginning NEWBI other liabilities of $347 are adjusted by recording an additional liability of $600 net of tax for Baylake’s estimated NEWBI acquisition expenses, which also negatively impacts equity.
(3)
Adjustments to record goodwill of $223 associated with the NEWBI transaction, the net result of paying $9,858 in consideration (common stock of $4,044 and cash of $5,814), for net assets purchased of $9,635.
(4)
Beginning NEWBI cash of $4,431 and NEWBI holding company debt of $203 are adjusted for net cash recorded from the new issuance of $6,000 in Baylake holding company debt and payment of $5,814 of cash consideration by Baylake to NEWBI shareholders.
(5)
Baylake special cash dividend paid to common shareholders of record as provided for in the merger agreement prior to the merger of Nicolet and Baylake, representing a reduction to Baylake equity and a cash outlay of $3,842 (i.e. $0.40 per share on 9,606 outstanding common shares).
12
(6)
Recording of additional liability of $3,999 net of taxes for estimated merger expenses incurred by Baylake for the merger, including investment banker fees, severance pay and change of control contracts, accelerated vesting on certain equity awards, legal costs, contract terminations, and other related expenses, which also negatively impacts equity.
(7)
Total equity impact of Baylake’s pre-merger expenses of $3,999 net of tax and special dividend of $3,842 resulting in net equity adjustment of $7,841.
(8)
Adjustment to mark Baylake’s HTM investments up to fair value, by $1,084.
(9)
Adjustment to eliminate Baylake’s allowance for loan loss of $6,510 and mark Baylake’s loans down to estimated fair value, by ($26,600), which includes a credit and an interest rate component.
(10)
Adjustment to mark Baylake’s fixed assets up to fair value, by $6,000.
(11)
Adjustment to mark Baylake’s other real estate owned down to fair value, by ($1,500).
(12)
Eliminate existing Baylake goodwill of ($7,445).
(13)
Record estimate of new core deposit intangible of $15,000 based on total non-maturing deposits at a 2% premium.
(14)
Adjustments to mark acquired assets up (or down) to estimated fair values at September 30, 2015 (a) investment in processing company by $4,000 (b) deferred tax adjustments related to all marks noted in footnotes 8 – 11, 14(a), 15 and 16 at a 40% tax rate, plus additional tax adjustment for life insurance redemption of ($1,800).
(15)
Adjustment to mark Baylake’s Federal Home Loan Advances to fair value by ($400) and to reflect current market rate of interest on deposits of ($100).
(16)
Adjustment to mark Baylake’s junior subordinated debentures (trust preferred securities) to estimated fair value by ($7,200).
(17)
Fair value adjustments for assets purchased of ($6,251) and liabilities assumed of ($6,700) resulting in a net equity impact of $449 at September 30, 2015.
(18)
Issuance of 4,310 shares of Nicolet common stock at a volume weighted average price of $32.87 based on the trading days of August 28 – September 25, 2015, inclusive, for total consideration of $141,681, cash paid for fractional shares estimated at $54, expenses related to the transaction of $675, for total consideration of $142,410 paid for net assets purchased of $106,653 resulting in goodwill of $35,757.
(19)
Nicolet to write off its investment holding of 122 shares of Baylake common stock (carried at the Baylake market price of $14.15 on September 30, 2015) for a reduction to investments of $1,725, an increase of $690 to the deferred tax liability and a $1,035 net equity reduction.
(20)
Issuance of 4,310 shares of Nicolet common stock based on exchange ratio of 0.4517 times 9,542 shares of Baylake common stock subject to exchange (i.e. 9,320 common shares outstanding, plus 286 shares for NEWBI, plus 58 common shares for Baylake restricted stock units immediately vesting, less 122 shares of Baylake common stock held by Nicolet pre-merger and not subject to conversion).
13
NICOLET BANKSHARES, INC. AND SUBSIDIARIES
COMBINED WITH BAYLAKE CORP. AND SUBSIDIARIES
COMBINED WITH BAYLAKE CORP. AND SUBSIDIARIES
PRO FORMA CONDENSED STATEMENTS OF INCOME (Unaudited)
(In Thousands, Except Per Share Data)
(In Thousands, Except Per Share Data)
| | | |
Nine months ended September 30, 2015
|
| |||||||||||||||||||||
| | | |
Historical
|
| |
Pro Forma
Adjustments |
| |
Pro Forma
Combined |
| |||||||||||||||
| | | |
Baylake*
|
| |
Nicolet
|
| ||||||||||||||||||
|
Interest income
|
| | | $ | 26,104 | | | | | $ | 36,134 | | | | | $ | 2,040(9) | | | | | $ | 64,278 | | |
|
Interest expense
|
| | | | 1,994 | | | | | | 5,401 | | | | | | (55)(2,4) | | | | | | 7,340 | | |
|
Net interest income
|
| | | | 24,110 | | | | | | 30,733 | | | | | | 2,095 | | | | | | 56,938 | | |
|
Provision for loan loss
|
| | | | 200 | | | | | | 1,350 | | | | | | —(5) | | | | | | 1,550 | | |
|
Net interest income after provision for loan losses
|
| | | | 23,910 | | | | | | 29,383 | | | | | | 2,095 | | | | | | 55,388 | | |
|
Other income
|
| | | | 7,231 | | | | | | 13,149 | | | | | | — | | | | | | 20,380 | | |
|
Other expense
|
| | | | 21,269 | | | | | | 29,375 | | | | | | 2,093(1,3) | | | | | | 52,737 | | |
|
Income before income taxes
|
| | | | 9,872 | | | | | | 13,157 | | | | | | 2 | | | | | | 23,031 | | |
|
Income taxes
|
| | | | 2,992 | | | | | | 4,452 | | | | | | | | | | | | 8,061 | | |
|
Income from continuing operations
|
| | | | 6,880 | | | | | | 8,705 | | | | | | | | | | | | 14,970(8) | | |
|
Less net income from noncontrolling interest
|
| | | | — | | | | | | 96 | | | | | | | | | | | | 96 | | |
|
Less preferred stock dividends
|
| | | | — | | | | | | 182 | | | | | | | | | | | | 182 | | |
|
Net income available to common shareholders
|
| | | $ | 6,880 | | | | | $ | 8,427 | | | | | | | | | | | $ | 14,692 | | |
|
Effective tax rate
|
| | | | 30.3% | | | | | | 33.8% | | | | | | | | | | | | 35.0% | | |
| Weighted average common shares outstanding – | | | | | | | | | | | | | | | | | | | | | | | | | |
|
basic
|
| | | | 9,267 | | | | | | 4,000 | | | | | | 4,310(6) | | | | | | 8,310 | | |
|
diluted
|
| | | | 9,413 | | | | | | 4,358 | | | | | | 4,437(6) | | | | | | 8,795 | | |
|
Net income per common share from continuing operations –
|
| | | | | | | | | | | | | | | | | | | | | | | | |
|
basic
|
| | | $ | 0.74 | | | | | $ | 2.11 | | | | | | | | | | | $ | 1.77 | | |
|
diluted
|
| | | $ | 0.73 | | | | | $ | 1.93 | | | | | | | | | | | $ | 1.67 | | |
*
NEWBI income statement was excluded from this pro forma income statement as it was insignificant to net income (less than 1% of pro forma combined net income).
14
| | | |
Year Ended December 31, 2014
|
| |||||||||||||||||||||
| | | |
Historical
|
| |
Pro Forma
Adjustments |
| |
Pro Forma
Combined |
| |||||||||||||||
| | | |
Baylake*
|
| |
Nicolet
|
| ||||||||||||||||||
|
Interest income
|
| | | $ | 34,743 | | | | | $ | 48,949 | | | | | $ | 2,720(9) | | | | | $ | 86,412 | | |
|
Interest expense
|
| | | | 3,313 | | | | | | 7,067 | | | | | | (73)(2,4) | | | | | | 10,307 | | |
|
Net interest income
|
| | | | 31,430 | | | | | | 41,882 | | | | | | 2,793 | | | | | | 76,105 | | |
|
Provision for loan loss
|
| | | | — | | | | | | 2,700 | | | | | | —(5) | | | | | | 2,700 | | |
|
Net interest income after provision for loan losses
|
| | | | 31,430 | | | | | | 39,182 | | | | | | 2,793 | | | | | | 73,405 | | |
|
Other income
|
| | | | 9,067 | | | | | | 14,185 | | | | | | | | | | | | 23,252 | | |
|
Other expense
|
| | | | 28,322 | | | | | | 38,709 | | | | | | 3,240(1,3) | | | | | | 70,271 | | |
|
Income before income taxes
|
| | | | 12,175 | | | | | | 14,658 | | | | | | (447) | | | | | | 26,386 | | |
|
Income taxes
|
| | | | 3,252 | | | | | | 4,607 | | | | | | | | | | | | 9,235 | | |
|
Income from continuing operations
|
| | | | 8,923 | | | | | | 10,051 | | | | | | | | | | | | 17,151(8) | | |
|
Less net income from noncontrolling interest
|
| | | | — | | | | | | 102 | | | | | | | | | | | | 102 | | |
|
Less preferred stock dividends
|
| | | | — | | | | | | 244 | | | | | | | | | | | | 244 | | |
|
Net income available to common shareholders
|
| | | $ | 8,923 | | | | | $ | 9,705 | | | | | | | | | | | $ | 16,805 | | |
|
Effective tax rate
|
| | | | 26.7% | | | | | | 31.4% | | | | | | | | | | | | 35.0% | | |
| Weighted average number of common shares outstanding – | | | | | | | | | | | | | | | | | | | | | | | | | |
|
basic
|
| | | | 8,354 | | | | | | 4,165 | | | | | | 4,310(6) | | | | | | 8,475 | | |
|
diluted
|
| | | | 9,600 | | | | | | 4,311 | | | | | | 4,337(6) | | | | | | 8,748 | | |
|
Net income per common share from continuing operations –
|
| | | | | | | | | | | | | | | | | | | | | | | | |
|
basic
|
| | | $ | 1.07 | | | | | $ | 2.33 | | | | | | | | | | | $ | 1.98 | | |
|
diluted
|
| | | $ | 0.97(7) | | | | | $ | 2.25 | | | | | | | | | | | $ | 1.96 | | |
*
NEWBI income statement was excluded from this pro forma income statement as it was insignificant to net income (less than 1% of pro forma combined net income).
(1)
Depreciation expense resulting from premises pro forma adjustment using straight-line over 25-year estimated useful life.
(2)
Fair value adjustment on FHLB advances and fair value adjustment for interest rate on deposits assuming straight-line over 3-year weighted average life.
(3)
Amortization of core deposit intangible resulting from the fair value pro forma adjustment amortized over 10 years using sum-of-years-digits.
(4)
Fair value adjustment on junior subordinated debenture (trust preferred securities) using straight line amortization over 30 years.
(5)
No adjustment for the provision for loan loss is reflected in the pro forma statement of income.
(6)
Baylake common stock will be exchanged in the merger at a ratio of 0.4517 shares of Nicolet common stock for each share of Baylake common stock. Basic shares represent those issued in the transaction as of January 1, 2014. Diluted shares give effect to the estimated Baylake equity awards outstanding at September 30, 2015 times the exchange ratio of 0.4517.
(7)
Baylake 2014 diluted earnings per share included $372 related to earnings from assumed conversion of convertible debentures which was added to net income to arrive at the net income used for diluted earnings per share. This amount was not included in the pro forma combined diluted earnings per share calculation.
(8)
The combined pro forma financial information does not reflect the realization of any expected cost savings or other synergies from the acquisition of Baylake as a result of restructuring activities and other cost savings initiatives. In addition, the pro forma financial information does not reflect anticipated restructuring charges associated with the transaction or these cost savings.
(9)
Accretion of the portion of the fair value adjustment accretable into earnings. For purposes of the pro forma impact, the net discount accretion was estimated using a period of 5 years.
15
RISK FACTORS
In addition to the other information included in this joint proxy statement-prospectus, you should carefully consider the matters described below in determining whether to adopt and approve the merger agreement.
Risk Relating to the Merger
The merger consideration is fixed despite any changes in Nicolet’s or Baylake’s stock prices.
Each share of Baylake common stock owned by Baylake shareholders will be converted into the right to receive 0.4517 shares of Nicolet common stock. The market price of the Nicolet common stock received, as well as the market price of the Baylake common stock currently owned, may vary between the date of this joint proxy statement-prospectus, the date of Baylake’s special meeting and the closing of the merger. Such variations in the prices of Nicolet and Baylake common stock may result from changes in the business, operations or prospects of Nicolet or Baylake, regulatory considerations, general market and economic conditions as well as other factors. Despite any such variations, the merger consideration Baylake’s shareholders are entitled to receive will not change.
Because Nicolet common stock is traded infrequently, it is difficult to determine how the fair value of Nicolet common stock compares with the merger consideration.
Trading of Nicolet common stock on the Nasdaq Capital Market commenced on February 24, 2016. Prior to that time, Nicolet common stock traded on the OTCBB market of the OTC Markets Group, Inc. The market for Nicolet common stock, even after its transfer to the Nasdaq Capital Market, has been illiquid and irregular. This lack of liquidity makes it difficult to determine the fair value of Nicolet common stock.
Combining our two companies may be more difficult, costly, or time-consuming than we expect.
Nicolet and Baylake have operated, and, until completion of the merger, will continue to operate, independently. It is possible that the integration process could result in the loss of key employees or disruption of each company’s ongoing business or inconsistencies in standards, procedures and policies, each of which would adversely affect our ability to maintain relationships with clients and employees or to achieve the anticipated benefits of the merger. If we have difficulties with the integration process, we might not achieve the economic benefits we expect to result from the merger. As with any merger of banking institutions, there also may be business disruptions that cause the combined entity to lose customers or cause customers to take their deposits out of our banks and move their business to other financial institutions.
Baylake and Nicolet will be subject to business uncertainties while the merger is pending, which could adversely affect their respective businesses.
Uncertainty about the effect of the merger on employees and customers may have an adverse effect on Baylake and Nicolet and consequently on the business and stock price of the combined company after the merger. Although the parties intend to take steps to reduce any adverse effects, these uncertainties may impair their ability to attract, retain, and motivate key personnel until the merger is consummated and for a period of time thereafter, and such uncertainties could cause customers and others that deal with Baylake or Nicolet to seek to change their existing business relationships. Employee retention could be particularly challenging during the merger, as employees may experience uncertainty about their roles in the combined company following the merger. If key employees depart because of issues relating to the perceived uncertainty and difficulty of integration or a desire not to remain with the combined company, the combined company’s business following the merger could be harmed and the market price of its common stock could decrease.
The market price of Nicolet common stock after the merger may be affected by factors different from those affecting the market price of Baylake common stock or the Nicolet common stock currently.
The businesses of Nicolet and Baylake differ in some respects and, accordingly, the results of operations of Nicolet and the market price of Nicolet’s shares of common stock after the merger may be affected by factors different from those currently affecting the independent results of operations of each of
16
Nicolet or Baylake. For a discussion of the businesses of Nicolet and Baylake and of certain factors to consider in connection with those businesses, see “Where You Can Find Additional Information” at page 99.
The merger agreement limits both parties’ ability to pursue alternatives to the merger.
The merger agreement contains provisions that limit either party’s ability to discuss competing third-party proposals to acquire all or a significant part of either party or any of its subsidiaries. In addition, each party has agreed to pay the other a fee of $7,000,000 if the other party terminates the agreement after such party’s board of directors withdraws or changes its recommendation of the merger agreement, or if the transaction is terminated to accept an Acquisition Proposal such party deems a Superior Proposal, as each term is defined in the merger agreement. These provisions might discourage a potential competing acquirer that might have an interest in acquiring all or a significant part of Nicolet or Baylake from considering or proposing that acquisition, even if it were prepared to pay consideration with a higher per share price than that proposed in the merger, or might result in a potential competing acquirer proposing to pay a lower per share price to acquire Nicolet or Baylake than it might otherwise have proposed to pay.
Certain directors and executive officers of Nicolet have interests in the merger other than their interests as shareholders.
Certain directors and executive officers of Nicolet have interests in the merger other than their interests as shareholders. The board of directors of Nicolet was aware of these interests at the time it approved the merger. These interests may cause Nicolet’s directors and executive officers to view the merger proposal differently than you may view it. See “The Merger — Interests of Certain Persons in the Merger” at page 59.
Certain directors and executive officers of Baylake have interests in the merger other than their interests as shareholders.
Certain directors and executive officers of Baylake have interests in the merger other than their interests as shareholders. The board of directors of Baylake was aware of these interests at the time it approved the merger. These interests may cause Baylake’s directors and executive officers to view the merger proposal differently than you may view it. See “The Merger — Interests of Certain Persons in the Merger” at page 59.
Failure to complete the merger could negatively impact the stock price and future business and financial results of Baylake and/or Nicolet.
If the merger is not completed for any reason, including as a result of shareholders failing to approve the merger agreement and the merger, the ongoing business of Baylake and/or Nicolet may be adversely affected and, without realizing any of the benefits of having completed the merger, Baylake and/or Nicolet could be subject to a number of possible consequences, including the following:
•
either Baylake or Nicolet may be required, under certain circumstances, to pay a termination fee to the other;
•
both Baylake and Nicolet are subject to certain restrictions on the conduct of business prior to completing the merger, which may adversely affect their abilities to execute certain business strategies;
•
Baylake and/or Nicolet may experience negative impacts on their stock prices or from customers, regulators and employees;
•
the parties have incurred and will continue to incur certain costs and fees associated with the merger; and
17
•
matters related to the merger (including integration planning) may require substantial commitments of time and resources by the management and employees of Baylake and Nicolet, which would otherwise have been devoted to day-to-day operations and other opportunities that may have been beneficial to Baylake and Nicolet as independent companies.
You will experience a substantial reduction in percentage ownership and voting power with respect to your shares as a result of the merger.
Shareholders will experience a substantial reduction in their respective percentage ownership interests and effective voting power through their stock ownership in Nicolet after the merger relative to their percentage ownership interest in Nicolet or Baylake prior to the merger. If the merger is consummated, current Baylake shareholders would own approximately 50% of Nicolet’s voting common stock, while current Nicolet shareholders would own the remaining 50%. Consequently, all existing groups of shareholders will have less voting power per share in Nicolet following the merger than they currently have in Baylake or Nicolet prior to the merger. See “The Merger Agreement — What Baylake’s Shareholders will Receive in the Merger” at page 67.
18
A WARNING ABOUT FORWARD-LOOKING STATEMENTS
This joint proxy statement-prospectus includes “forward-looking statements” within the meaning of Section 27A of the Securities Act and Section 21E of the Securities Exchange Act of 1934, as amended (the “Exchange Act”). Forward-looking statements discuss future expectations, describe future plans and strategies, contain projections of results of operations or of financial condition or state other forward-looking information. Forward-looking statements are generally identifiable by the use of forward-looking terminology such as “anticipate,” “believe,” “continue,” “could,” “endeavor,” “estimate,” “expect,” “forecast,” “goal,” “intend,” “may,” “objective,” “potential,” “predict,” “project,” “seek,” “should,” “will” and other similar words and expressions of future intent.
The ability of Nicolet and Baylake to predict results or the actual effect of future plans or strategies is inherently uncertain. Although Nicolet and Baylake believe that the expectations reflected in such forward-looking statements are based on reasonable assumptions, actual results and performance could differ materially from those set forth in the forward-looking statements. Factors that could cause actual results and performance to differ from those expressed in the forward-looking statements include, but are not limited to:
•
the businesses of Nicolet and Baylake may not integrate successfully or the integration may be more difficult, time-consuming or costly than expected;
•
the expected growth opportunities and cost savings from the transaction may not be fully realized or may take longer to realize than expected;
•
revenues following the transaction may be lower than expected as a result of losses of customers or other reasons, including issues arising in connection with integration of the two banks;
•
deposit attrition, operating costs, customer loss and business disruption following the transaction, including difficulties in maintaining relationships with employees, may be greater than expected;
•
governmental approvals of the transaction may not be obtained on the proposed terms or expected timeframe;
•
the terms of the proposed transaction may need to be modified to satisfy such approvals or conditions;
•
Nicolet’s shareholders or Baylake’s shareholders may fail to approve the transaction;
•
reputational risks and the reaction of the companies’ customers to the transaction;
•
diversion of management time on merger-related issues;
•
changes in asset quality and credit risk;
•
the cost and availability of capital;
•
customer acceptance of the combined company’s products and services;
•
customer borrowing, repayment, investment and deposit practices;
•
the introduction, withdrawal, success and timing of business initiatives;
•
the impact, extent, and timing of technological changes;
•
severe catastrophic events in our geographic area;
•
a weakening of the economies in which the combined company will conduct operations may adversely affect its operating results;
•
the U.S. legal and regulatory framework, including those associated with the Dodd Frank Wall Street Reform and Consumer Protection Act, could adversely affect the operating results of the combined company;
•
the interest rate environment may compress margins and adversely affect net interest income; and
•
competition from other financial services companies in the companies’ markets could adversely affect operations.
19
The cautionary statements in the “Risk Factors” section and elsewhere in this joint proxy statement-prospectus, and other risks detailed in the parties’ press releases, shareholder communications and other SEC filings, including the Form 10-Ks filed by Baylake and Nicolet for the year ended December 31, 2014, identify important factors and possible events that involve risk and uncertainties that could cause actual results to differ materially from those contained in the forward-looking statements. Nicolet and Baylake do not intend to, and undertake no obligation to, update or revise any forward-looking statements, whether as a result of differences in actual results, changes in assumptions or changes in other factors affecting such statements.
20
THE BAYLAKE SPECIAL SHAREHOLDERS’ MEETING
Purpose
Baylake shareholders are receiving this joint proxy statement-prospectus because on February 29, 2016, the record date for a special meeting of shareholders to be held on April 12, 2016, at Stone Harbor Resort & Conference Center, 107 North First Avenue, Sturgeon Bay, Wisconsin 54235 at 6:00 p.m., they owned shares of the common stock of Baylake Corp., and the board of directors of Baylake is soliciting proxies for the matters to be voted on at this special meeting, as described in more detail below. Each copy of this joint proxy statement-prospectus was mailed to holders of Baylake common stock on or about March 10, 2016, and is accompanied by a proxy card for use at the meeting and at any adjournment(s) of the meeting.
At the meeting, Baylake shareholders will consider and vote upon the merger agreement and the transactions contemplated thereby and any other matters that are properly brought before the meeting, or any adjournments(s) of the meeting.
When you sign the enclosed proxy card or otherwise vote pursuant to the instructions set forth on the proxy card, you appoint the proxy holder as your representative at the meeting. The proxy holder will vote your shares as you have instructed in the proxy card, thereby ensuring that your shares will be voted whether or not you attend the meeting. Even if you plan to attend the meeting, we ask that you instruct the proxies how to vote your shares in advance of the meeting just in case your plans change. In the event that other matters arise at the special meeting, the proxy holder will vote your shares according to his or her discretion.
If you have not already done so, please complete, date and sign the accompanying proxy card and return it promptly in the enclosed, postage paid envelope or otherwise vote pursuant to the instructions set forth on the proxy card. If you do not vote your shares as instructed on the proxy card, or if you do not attend and cast your vote at the special meeting, the effect will be a vote against the merger agreement.
Record Date; Quorum and Vote Required
The record date for the Baylake special meeting is February 29, 2016. Baylake’s shareholders of record as of the close of business on that day will receive notice of and will be entitled to vote at the special meeting. As of the record date, there were 9,620,348 shares of Baylake common stock outstanding and entitled to vote at the meeting. The outstanding shares are held by approximately 1,910 holders of record.
The presence, in person or by proxy, of a majority of the shares of Baylake common stock entitled to vote on the merger agreement is necessary to constitute a quorum at the meeting. Each share of Baylake common stock outstanding on the record date entitles its holder to one vote on the merger agreement and any other proposal that may properly come before the meeting.
To determine the presence of a quorum at the meeting, Baylake will also count as present at the meeting the shares of Baylake common stock present in person but not voting, and the shares of common stock for which Baylake has received proxies but with respect to which the holders of such shares have abstained or signed without providing instructions as described in “Solicitation and Revocation of Proxies” below. Based on the number of shares of Baylake common stock outstanding as of the record date, at least 4,810,175 shares need to be present at the special meeting, whether in person or by proxy, to constitute a quorum.
Approval of the merger proposal requires the affirmative vote of the holders of a majority of the outstanding shares of Baylake common stock as of the record date for the special meeting. Abstentions, shares not voted, and broker nonvotes will have the same effect as a vote against the merger proposal. Approval of the non-binding advisory resolution approving certain merger-related compensation and approval of the adjournment proposal each require that more votes be cast in favor of the proposal than against it; abstentions, shares not voted, and broker nonvotes will have no effect on these proposals.
As of December 31, 2015, Baylake’s directors and executive officers beneficially owned a total of 1,105,710 shares, or approximately 11.49% of the outstanding shares, of Baylake common stock. We anticipate that these individuals will vote their shares in favor of the merger agreement. Certain of these individuals have entered into a written agreement with Nicolet that they will vote their shares in favor of the merger agreement, except as may be limited by their fiduciary obligations.
21
Solicitation and Revocation of Proxies
If you have delivered a signed proxy card for the Baylake special meeting, you may revoke it at any time before it is voted by:
•
attending the meeting and voting in person;
•
giving written notice revoking your proxy to Baylake’s Corporate Secretary prior to the date of the meeting; or
•
submitting a signed proxy card that is dated later than your initial proxy card to Baylake’s Corporate Secretary.
The proxy holders will vote as directed on all valid proxies that are received at or prior to the meeting and that are not subsequently revoked. If you complete, date and sign your proxy card but do not provide instructions as to your vote, the proxy holders will vote your shares FOR approval of the merger proposal, FOR the merger-related compensation proposal, and FOR the adjournment proposal. If any other matters are properly presented at the meeting for consideration, the persons named in the proxy card will have discretionary authority to vote your shares on those matters. Baylake’s board of directors is not aware of any matter to be presented at the meeting other than the merger proposal, the merger-related compensation proposal, and the adjournment proposal.
If you hold shares in “street name” with a broker, bank, or other fiduciary, you will receive voting instructions from the holder of record of your shares. Under the rules of various national and regional securities exchanges, brokers, banks and other fiduciaries may generally vote your shares on routine matters, such as the ratification of an independent registered public accounting firm, even if you provide no instructions, but may not vote on non-routine matters, such as the matters being brought before the special meeting, unless you provide voting instructions. Shares for which a broker does not have the authority to vote are recorded as “broker nonvotes” and are not counted in the vote by shareholders, but will count for purposes of a quorum. As a result, any broker nonvotes will have the practical effect of a vote against the merger proposal but will not affect the merger-related compensation proposal or the adjournment proposal. We therefore encourage you to provide directions to your broker as to how you want your shares voted on all matters to be brought before the special meeting. You should do this by carefully following the instructions your broker gives you concerning its procedures. If you hold shares in “street name” and wish to change your vote at any time, you must contact your broker.
Baylake will bear the cost of soliciting proxies from its shareholders. Baylake will solicit shareholder votes by mail and may also solicit certain shareholders by other means of communication, including telephone or in person. If anyone solicits your vote in person, by telephone, or by other means of communication, they will receive no additional compensation for doing so. Baylake will reimburse brokerage firms and other persons representing beneficial owners of shares for their reasonable expenses in forwarding solicitation material to those beneficial owners.
How to Vote Your Shares
Shareholders of record (i.e., those who own shares in their own name) can vote by telephone, on the internet, or by mail as follows:
•
Voting by Telephone. Call the toll-free number listed on the proxy card and follow the instructions. You will need to have your proxy card with you when you call.
•
Voting on the Internet. Go to www.investorvote.com/BYLK and follow the instructions. You will need to have your proxy card with you when you link to the website.
•
Voting by Mail. Complete, sign, date, and return the enclosed proxy card in the envelope provided.
•
Voting at the Baylake Special Meeting. If you decide to attend the special meeting and vote in person, you may deposit your proxy card with a representative of Baylake at the special meeting
22
registration desk. You may also complete a ballot that will be distributed at the meeting. Whether or not you plan to attend the special meeting, please submit your proxy promptly in the enclosed envelope or vote telephonically or through the Internet by following the instructions on the proxy card.
“Street name” shareholders (i.e., those who own their shares in the name of a broker, bank, or other fiduciary) should refer to the information you receive from your broker to see which voting methods are available to you. Please note, if you are a street name shareholder and wish to vote in person at the special meeting, you must obtain a proxy executed in your favor from your broker to be able to vote at the special meeting.
You should not send any stock certificates with your proxy card. If the merger is approved, you will receive instructions for exchanging your stock certificates after the merger has been completed.
Dissenters’ Rights
Baylake’s shareholders do not have dissenters’ rights with respect to the merger under Wisconsin law.
Recommendation of the Board of Directors of Baylake
Baylake’s board of directors has unanimously approved the merger agreement and the transactions contemplated thereby, believes that the merger is in the best interests of Baylake and its shareholders, and recommends that you vote FOR approval of the merger agreement and the transactions contemplated thereby, FOR the merger-related compensation proposal and FOR the adjournment proposal.
For a discussion of the factors considered by the board of directors in reaching its conclusion, see “The Merger — Background of the Merger” at page 29 and “The Merger — Reasons for the Merger” at page 33.
Shareholders should note that Baylake’s directors have certain interests in, and may derive benefits as a result of, the merger that are in addition to their interests as shareholders of Baylake. See “The Merger — Interests of Certain Persons in the Merger” at page 59.
23
THE BAYLAKE PROPOSALS
Proposal 1 — Approval of the Merger Agreement and the Merger
At the Baylake special meeting, shareholders of Baylake will be asked to approve the Baylake merger proposal providing for the merger of Baylake with and into Nicolet. Shareholders of Baylake should read this joint proxy statement-prospectus carefully and in its entirety, including the appendices, for more detailed information concerning the merger agreement and the merger. A copy of the merger agreement is attached to this joint proxy statement-prospectus as Appendix A.
After careful consideration, the Baylake board of directors, by a unanimous vote of all directors, approved the merger agreement and the merger, to be advisable and in the best interests of Baylake and its shareholders. See “The Merger — Background of the Merger” and “The Merger — Reasons for the Merger” included elsewhere in this joint proxy statement-prospectus for a more detailed discussion of the Baylake board’s recommendation.
THE BAYLAKE BOARD UNANIMOUSLY RECOMMENDS THAT BAYLAKE
SHAREHOLDERS VOTE “FOR” THE BAYLAKE MERGER PROPOSAL.
SHAREHOLDERS VOTE “FOR” THE BAYLAKE MERGER PROPOSAL.
Proposal 2 — Merger-Related Compensation
As required by Section 14A of the Exchange Act, Baylake is providing its shareholders with the opportunity to approve, in a non-binding advisory vote, the compensation proposal, by voting on the following resolution:
“RESOLVED, that the compensation that may be paid to Robert J. Cera in connection with or as a result of the merger, as disclosed in the section entitled “The Merger — Interests of Certain Persons in the Merger” and the related tables and narrative, is hereby APPROVED.”
Approval of this proposal is not a condition to completion of the merger. The vote on this proposal is a vote separate and apart from the vote on the Baylake merger proposal. Because the compensation proposal is advisory in nature only, a vote for or against approval will not be binding on either Baylake or Nicolet.
The compensation that is subject to this proposal is a contractual obligation of Nicolet and Nicolet National Bank. If the merger is approved and completed, such compensation may be paid, subject only to the conditions applicable thereto, even if shareholders fail to approve this proposal. If the merger is not completed, the Baylake board of directors will consider the results of the vote in making future executive compensation decisions.
See “The Merger — Interests of Certain Persons in the Merger” elsewhere in this joint proxy statement-prospectus for additional information regarding the merger-related compensation to be paid as a result of this merger.
THE BAYLAKE BOARD UNANIMOUSLY RECOMMENDS THAT BAYLAKE
SHAREHOLDERS VOTE “FOR” THE MERGER-RELATED COMPENSATION PROPOSAL.
SHAREHOLDERS VOTE “FOR” THE MERGER-RELATED COMPENSATION PROPOSAL.
Proposal 3 — Adjournment of the Special Meeting
If Baylake does not receive a sufficient number of votes to constitute a quorum of the common stock or approve the merger agreement and the transactions contemplated thereby, it may propose to adjourn the special meeting for the purpose of soliciting additional proxies to establish such quorum or approve the merger proposal. Baylake does not currently intend to propose adjournment of the special meeting if there are sufficient votes to approve the merger agreement and the transactions contemplated thereby. If approval of the proposal to adjourn the special meeting for the purpose of soliciting additional proxies is submitted to the Baylake shareholders for approval, the approval requires the affirmative vote of the holders of a majority of the shares of common stock present, in person or by proxy, at the special meeting, whether or not a quorum is present.
THE BAYLAKE BOARD UNANIMOUSLY RECOMMENDS THAT BAYLAKE
SHAREHOLDERS VOTE “FOR” THE ADJOURNMENT PROPOSAL.
SHAREHOLDERS VOTE “FOR” THE ADJOURNMENT PROPOSAL.
24
THE NICOLET SPECIAL SHAREHOLDERS’ MEETING
Purpose
Nicolet shareholders have received this joint proxy statement-prospectus because on February 29, 2016, the record date for a special meeting of shareholders to be held on April 12, 2016, at Nicolet National Bank, 111 N. Washington St., Green Bay, Wisconsin 54301 at 9:45 a.m., they owned shares of the common stock of Nicolet Bankshares, Inc., and the board of directors of Nicolet is soliciting proxies for the matter to be voted on at this special meeting, as described in more detail below. Each copy of this joint proxy statement-prospectus was mailed to holders of Nicolet common stock on or about March 10, 2016, and is accompanied by a proxy card for use at the meeting and at any adjournment(s) of the meeting.
At the meeting, Nicolet shareholders will consider and vote upon the merger agreement and the transactions contemplated thereby, including the issuance of up to 4,500,000 shares of Nicolet common stock in the merger, and any other matters that are properly brought before the meeting or any adjournment(s) of the meeting.
When you sign the enclosed proxy card or otherwise vote pursuant to the instructions set forth on the proxy card, you appoint the proxy holder as your representative at the meeting. The proxy holder will vote your shares as you have instructed in the proxy card, thereby ensuring that your shares will be voted whether or not you attend the meeting. Even if you plan to attend the meeting, we ask that you instruct the proxies how to vote your shares in advance of the meeting just in case your plans change. In the event that other matters arise at the special meeting, the proxy holder will vote your shares according to his or her discretion.
If you have not already done so, please complete, date and sign the accompanying proxy card and return it promptly in the enclosed, postage paid envelope or otherwise vote pursuant to the instructions set forth on the proxy card. If you do not vote your shares as instructed on the proxy card, or if you do not attend and cast your vote at the special meeting, the effect will be a vote against the merger agreement.
Record Date; Quorum and Vote Required
The record date for the Nicolet special meeting is February 29, 2016. Nicolet’s shareholders of record as of the close of business on that day will receive notice of and will be entitled to vote at the special meeting. As of the record date, there were 4,253,203 shares of Nicolet common stock entitled to vote at the meeting. The outstanding shares were held by approximately 600 holders of record as of the record date.
The presence, in person or by proxy, of a majority of the shares of Nicolet common stock entitled to vote on the merger agreement is necessary to constitute a quorum at the meeting. Each share of Nicolet common stock outstanding on the record date, entitles its holder to one vote on the merger agreement and any other proposal that may properly come before the meeting.
To determine the presence of a quorum at the meeting, Nicolet will also count as present at the meeting the shares of Nicolet common stock present in person but not voting, and the shares of common stock for which Nicolet has received proxies but with respect to which the holders of such shares have abstained or signed without providing instructions as described in “Solicitation and Revocation of Proxies” below. Based on the number of shares of Nicolet common stock outstanding as of the record date, at least 2,126,602 shares need to be present at the special meeting, whether in person or by proxy, to constitute a quorum.
Approval of the merger proposal requires the affirmative vote of the holders of a majority of the outstanding shares of Nicolet common stock as of the record date for the special meeting. Abstentions, shares not voted, and broker nonvotes will have the same effect as a vote against the merger proposal. Approval of the non-binding resolution approving certain merger-related compensation and approval of the adjournment proposal each require that more votes be cast in favor of the proposal than against it; abstentions, shares not voted, and broker nonvotes will have no effect on these proposals.
As of December 31, 2015, Nicolet’s directors and executive officers beneficially owned a total of 1,105,753 shares, or approximately 25.3% of the outstanding shares, of Nicolet common stock. We anticipate that these individuals will vote their shares in favor of the merger agreement. Certain of these individuals have entered into a written agreement with Baylake that they will vote their shares in favor of the merger agreement, except as may be limited by their fiduciary obligations.
25
Solicitation and Revocation of Proxies
If you have delivered a signed proxy card for the Nicolet special meeting or otherwise voted pursuant to the instructions set forth on the proxy card, you may revoke it at any time before it is voted by:
•
attending the meeting and voting in person;
•
giving written notice revoking your proxy to Nicolet’s Corporate Secretary prior to the date of the meeting; or
•
submitting a signed proxy card that is dated later than your initial proxy card to Nicolet’s Corporate Secretary.
The proxy holders will vote as directed on all valid proxies that are received at or prior to the meeting and that are not subsequently revoked. If you complete, date and sign your proxy card but do not provide instructions as to your vote, the proxy holders will vote your shares FOR approval of the merger proposal, FOR the merger-related compensation proposal, and FOR the adjournment proposal. If any other matters are properly presented at the meeting for consideration, the persons named in the proxy card will have discretionary authority to vote your shares on those matters. Nicolet’s board of directors is not aware of any matter to be presented at the meeting other than the merger proposal and the adjournment proposal.
If you hold shares in “street name” with a broker, bank, or other fiduciary, you will receive voting instructions from the holder of record of your shares. Under the rules of various national and regional securities exchanges, brokers, banks and other fiduciaries may generally vote your shares on routine matters, such as the ratification of an independent registered public accounting firm, even if you provide no instructions, but may not vote on non-routine matters, such as the matters being brought before the special meeting, unless you provide voting instructions. Shares for which a broker does not have the authority to vote are recorded as “broker nonvotes” and are not counted in the vote by shareholders, but will count for purposes of a quorum. As a result, any broker nonvotes will have the practical effect of a vote against the merger proposal but will not affect the adjournment proposal. We therefore encourage you to provide directions to your broker as to how you want your shares voted on all matters to be brought before the special meeting. You should do this by carefully following the instructions your broker gives you concerning its procedures. If you hold shares in “street name” and wish to change your vote at any time, you must contact your broker.
Nicolet will bear the cost of soliciting proxies from its shareholders. Nicolet will solicit shareholder votes by mail and may also solicit certain shareholders by other means of communication, including telephone or in person. If anyone solicits your vote in person, by telephone, or by other means of communication, they will receive no additional compensation for doing so. Nicolet will reimburse brokerage firms and other persons representing beneficial owners of shares for their reasonable expenses in forwarding solicitation material to those beneficial owners.
How to Vote Your Shares
Shareholders of record (i.e., those who own shares in their own name) can vote by telephone, on the Internet, or by mail as follows:
•
Voting by Telephone. Call the toll-free number listed on the proxy card and follow the instructions. You will need to have your proxy card with you when you call.
•
Voting on the Internet. Go to www.investorvote.com/NCBS and follow the instructions. You will need to have your proxy card with you when you link to the website.
•
Voting by Mail. Complete, sign, date, and return the enclosed proxy card in the envelope provided.
•
Voting at the Nicolet Special Meeting. If you decide to attend the special meeting and vote in person, you may deposit your proxy card with a representative of Nicolet at the special meeting
26
registration desk. You may also complete a ballot that will be distributed at the meeting. Whether or not you plan to attend the special meeting, please submit your proxy promptly in the enclosed envelope or vote telephonically or through the internet by following the instructions on the proxy card.
“Street name” shareholders (i.e., those who own their shares in the name of a broker, bank, or other fiduciary) should refer to the information you receive from your broker to see which voting methods are available to you. Please note, if you are a street name shareholder, and wish to vote in person at the special meeting, you must obtain a proxy executed in your favor from your broker to be able to vote at the special meeting.
Dissenters’ Rights
Nicolet’s shareholders do not have dissenters’ rights with respect to the merger under Wisconsin law.
Recommendation of the Board of Directors of Nicolet
Nicolet’s board of directors has unanimously approved the merger agreement and the transactions contemplated thereby, including the issuance of up to 4,500,000 shares of Nicolet common stock in the merger, believes that the merger is in the best interests of Nicolet and its shareholders, and recommends that you vote FOR approval of the merger agreement and the transactions contemplated thereby, FOR the merger-related compensation proposal and FOR the adjournment proposal.
For a discussion of the factors considered by the board of directors in reaching its conclusion, see “The Merger — Background of the Merger” at page 29 and “The Merger — Reasons for the Merger” at page 33.
27
THE NICOLET PROPOSALS
Proposal 1 — Approval of the Merger Agreement, the Merger and the Stock Issuance
At the Nicolet special meeting, shareholders of Nicolet will be asked to approve the Nicolet merger proposal providing for the merger of Baylake with and into Nicolet and the issuance of up to 4,500,000 shares of Nicolet common stock to Baylake shareholders. Shareholders of Nicolet should read this joint proxy statement-prospectus carefully and in its entirety, including the appendices, for more detailed information concerning the merger agreement and the merger. A copy of the merger agreement is attached to this joint proxy statement-prospectus as Appendix A.
After careful consideration, the Nicolet board of directors, by a unanimous vote of all directors, approved the merger agreement and the merger, to be advisable and in the best interests of Nicolet and its shareholders. See “The Merger — Background of the Merger” and “The Merger — Reasons for the Merger” included elsewhere in this joint proxy statement-prospectus for a more detailed discussion of the Nicolet board’s recommendation.
THE NICOLET BOARD UNANIMOUSLY RECOMMENDS THAT NICOLET
SHAREHOLDERS VOTE “FOR” THE NICOLET MERGER PROPOSAL.
SHAREHOLDERS VOTE “FOR” THE NICOLET MERGER PROPOSAL.
Proposal 2 — Merger-Related Compensation
As required by Section 14A of the Exchange Act, Nicolet is providing its shareholders with the opportunity to approve, in a non-binding advisory vote, the compensation proposal, by voting on the following resolution:
“RESOLVED, that the compensation that may be paid to Robert J. Cera in connection with or as a result of the merger, as disclosed in the section entitled “The Merger — Interests of Certain Persons in the Merger” and the related tables and narrative, is hereby APPROVED.”
Approval of this proposal is not a condition to completion of the merger. The vote on this proposal is a vote separate and apart from the vote on the Nicolet merger proposal. Because the compensation proposal is advisory in nature only, a vote for or against approval will not be binding on Nicolet.
The compensation that is subject to this proposal is a contractual obligation of Nicolet and/or Nicolet National Bank. If the merger is approved and completed, such compensation may be paid, subject only to the conditions applicable thereto, even if shareholders fail to approve this proposal. The Nicolet board of directors will consider the results of the vote in making future executive compensation decisions.
See “The Merger — Interests of Certain Persons in the Merger” elsewhere in this joint proxy statement-prospectus for additional information regarding the merger-related compensation to be paid as a result of this merger.
THE NICOLET BOARD UNANIMOUSLY RECOMMENDS THAT NICOLET
SHAREHOLDERS VOTE “FOR” THE MERGER-RELATED COMPENSATION PROPOSAL.
SHAREHOLDERS VOTE “FOR” THE MERGER-RELATED COMPENSATION PROPOSAL.
Proposal 3 — Adjournment of the Special Meeting
If Nicolet does not receive a sufficient number of votes to constitute a quorum of the common stock or approve the merger agreement and the transactions contemplated thereby, it may propose to adjourn the special meeting for the purpose of soliciting additional proxies to establish such quorum or approve the merger proposal. Nicolet does not currently intend to propose adjournment of the special meeting if there are sufficient votes to approve the merger agreement and the transactions contemplated thereby. If approval of the proposal to adjourn the special meeting for the purpose of soliciting additional proxies is submitted to the Nicolet shareholders for approval, the approval requires the affirmative vote of the holders of a majority of the shares of common stock present, in person or by proxy, at the special meeting, whether or not a quorum is present.
THE NICOLET BOARD UNANIMOUSLY RECOMMENDS THAT NICOLET
SHAREHOLDERS VOTE “FOR” THE ADJOURNMENT PROPOSAL.
SHAREHOLDERS VOTE “FOR” THE ADJOURNMENT PROPOSAL.
28
THE MERGER
Structure of the Merger
The merger agreement provides for the merger of Baylake with and into Nicolet, with Nicolet being the surviving entity in the merger. After the merger, Baylake Bank will merge with and into Nicolet National Bank, with Nicolet National Bank being the surviving bank. Each share of Baylake common stock outstanding at the effective time of the merger will be converted into the right to receive either 0.4517 shares of Nicolet common stock. The merger agreement allows Baylake to continue paying its regular quarterly dividend of $0.09 per share and to pay a special dividend of up to $0.40 per share immediately prior to consummation of the merger. The payment of both the regular quarterly dividend and the special dividend is not guaranteed, nor is it a condition to the closing of the merger.
Pursuant to the merger agreement, the board of directors of the surviving entity will consist of sixteen members — eight current Nicolet directors (Robert B. Atwell, Michael E. Daniels, John N. Dykema, Christopher J. Ghidorzi, Donald J. Long, Susan L. Merkatoris, Randy J. Rose, and Robert J. Weyers) and eight current Baylake directors (Robert W. Agnew, Robert J. Cera, Terrence R. Fulwiler, Thomas L. Herlache, Louis J. Jeanquart, William D. Murphy, Dean J. Nolden, and Elyse Mollner Stackhouse). These sixteen directors will also be appointed to the board of directors of the surviving bank. The merger agreement provides for Mr. Atwell and Mr. Cera to serve as Co-Chairmen of the board of directors of the surviving entity. In addition, the merger agreement provides that, for two years following consummation of the merger, the nominating committee of the board of the surviving entity shall consist of two legacy Nicolet directors (Messrs. Rose and Dykema) and two legacy Baylake directors (Messrs. Agnew and Jeanquart).
The merger agreement provides for Mr. Atwell and Mr. Cera to serve as Co-Chief Executive Officers and Co-Presidents of the surviving entity and for Mr. Daniels to serve as Executive Vice President and Secretary of the surviving entity and as President and Chief Executive Officer of the surviving bank. Subsequently to execution of the merger agreement, the parties agreed that Ann K. Lawson would serve as Chief Financial Officer of the surviving entity and the surviving bank. Information about each of the above directors and officers of the surviving entity and bank is available in the parties’ respective public filings incorporated by reference into this joint proxy statement-prospectus. See “Where You Can Find More Information” on page 99.
See “The Merger Agreement” on page 67 for additional details regarding the structure of the merger.
Background of the Merger
Baylake’s board of directors and senior management regularly review and evaluate Baylake’s business, strategic direction, performance, prospects and strategic alternatives. Baylake’s board of directors and management team review and evaluate the possibility of pursuing various strategic alternatives and relationships as part of Baylake’s ongoing efforts to strengthen its businesses and improve its operations and financial performance in order to create value for its shareholders, taking into account economic, regulatory, competitive and other conditions. In the past, such reviews and evaluations have resulted in considering and pursuing strategic transactions with other companies (such as branch acquisitions and the acquisition of NEWBI described herein).
Nicolet’s board of directors and senior management regularly evaluates and assesses Nicolet’s strategy and opportunities to achieve profitable growth through various strategic initiatives and transactions, giving consideration to the context of developments in the industry, conditions in the geographic areas that Nicolet serves, competitive considerations and other factors. The board of directors of Nicolet has placed emphasis on achieving meaningful and profitable growth, either through organic or acquisitive means, especially following successful acquisition of community banks and branches in the five years prior. As such, the board has instructed senior management to continue to explore merger and acquisition opportunities that could expand and enhance the current Nicolet franchise and improve long term value for shareholders.
Nicolet and Baylake operate as competitors in the greater Green Bay market. Many of the principals of both companies have known each other through involvements in business, civic, and other community organizations. Over the course of the past five years, various members of Baylake’s board of directors have
29
had informal conversations with members of Nicolet’s board and senior management team regarding a potential combination of the two companies. However, in each instance, continued discussions were never pursued for a variety of reasons as both companies believed remaining as an independent community bank offered the greatest reward for their respective shareholders.
In January 2015, members of both Baylake’s and Nicolet’s senior management and board of directors attended an industry conference that focused on community bank mergers and acquisitions. During that conference, Baylake’s Chief Executive Officer, Robert J. Cera, and Robert Weyers, a director of Nicolet, had an informal conversation regarding a potential combination of the companies. During the following months, Baylake held meetings with two investment banking firms to assess a potential combination with Nicolet, as well as other potential viable alternatives. These alternatives included (1) remaining independent and continuing the pursuit of an organic growth strategy, (2) acquiring other community banks, and (3) merging with or being acquired by another depository institution. Like most similarly-situated bank holding companies, Baylake held periodic discussions with a limited number of candidates regarding the alternatives identified in (2) and (3) above. With the exception of its acquisition of NEWBI, which was evidenced by the execution of a revised non-binding letter of intent on January 30, 2015, and a merger agreement on May 5, 2015, all of the strategic discussions were exploratory in nature and none of them progressed beyond preliminary calls and meetings. After assessing these alternatives, the Executive Committee of Baylake’s board of directors determined that Mr. Cera should have future conversations with Nicolet to determine if a potential merger was feasible and strategically viable.
On May 6, 2015, Mr. Cera and Mr. Weyers had a meeting to continue discussions from their previous meeting several months prior. Following that discussion, over the next 45 days, Mr. Cera had additional follow up meetings with Robert B. Atwell, Chairman, President and Chief Executive Officer of Nicolet, and Michael E. Daniels, President and Chief Operating Officer of Nicolet National Bank. In addition, Baylake requested that principals from the investment banking firm of Sandler O’Neill & Partners L.P. (“Sandler O’Neill”) provide detailed analysis regarding a potential merger with Nicolet. Sandler O’Neill has acted as advisor to Baylake during the past eight years relating to both capital raise alternative strategies, as well as potential merger and acquisition opportunities, and as such, Sandler O’Neill was selected to represent Baylake based upon its deep knowledge of Baylake and its operations, as well as its strong reputation as a trusted advisor to financial services companies throughout the country. Sandler O’Neill provided initial information and analysis to Mr. Cera and certain members of Baylake’s directors on June 9, 2015, and followed up with additional analysis on June 15, 2015. During an executive session of the Baylake board of directors meeting on June 16, 2015, the board reviewed the information provided by Sandler O’Neill and determined that Mr. Cera should continue more in-depth conversations with Nicolet. A formal engagement letter with Sandler O’Neill was executed on August 11, 2015.
On June 17, 2015, the day after the Baylake board of directors meeting, Mr. Cera met with certain members of Nicolet’s senior management, including, among others, Mr. Atwell and Mr. Daniels. At the beginning of the meeting, both parties executed nondisclosure agreements with one another. At that time, Nicolet presented a summary draft term sheet that outlined certain terms and conditions that had been discussed between Baylake and Nicolet up to that point. The draft term sheet did not offer any financial terms and left certain items open ended as they had yet to be discussed by both parties. During that meeting, both parties discussed a number of topics related to the draft term sheet, including: organizational structure, name and branding, senior management roles, board composition, location of the corporate headquarters, and other operational and social issues. At the conclusion of the meeting, the principals of Nicolet shared and discussed the term sheet with certain members of Nicolet’s senior management team and board of directors, including Nicolet’s Executive Committee, while Mr. Cera discussed the term sheet with certain members of Baylake’s board of directors, including Robert W. Agnew and Louis (Rick) J. Jeanquart, Baylake’s Chairman and Vice-Chairman, respectively.
On June 18, 2015, Mr. Cera provided a modified version of the nonbinding term sheet that proposed the following: Nicolet Bankshares, Inc. as the name of the holding company and Baylake Bank as the name of the operating bank; Mr. Atwell as Executive Chairman of the company, Mr. Cera as Chief Executive Officer of the company and bank, and Mr. Daniels as President of the company and bank; and that Baylake be allowed to declare a special one-time cash dividend to its shareholders of $1.10 per share (or approximately $10 million in aggregate) concurrently with the closing of a transaction. Baylake did not provide any proposal for possible financial terms (i.e. exchange ratio) of a transaction.
30
On June 22, 2015, the Baylake board of directors voted to form a subcommittee of the board to continue potential negotiations regarding a combination. Baylake’s subcommittee included: Mr. Cera, Robert W. Agnew, Roger Ferris, Louis (Rick) J. Jeanquart, and Dean J. Nolden. Similarly, on June 19, 2015, the Executive Committee of Nicolet’s board of directors, which included Mr. Atwell, Mr. Daniels, John N. Dykema, Donald (DJ) J. Long, Randy J. Rose, and Robert J. Weyers, voted to form a subcommittee to consider a combination. The Nicolet subcommittee consisted of Messrs. Atwell, Daniel, Dykema and Rose. Both subcommittees met independently, Baylake’s on June 26 and Nicolet’s on June 19, to discuss the nonbinding term sheet. During this period, members of Nicolet senior management and the Nicolet subcommittee revised the term sheet to include potential financial terms of a transaction. The revised term sheet proposed by Nicolet included an exchange ratio whereby shareholders of Baylake would receive 0.41935 share of Nicolet stock for each share of Baylake stock owned. Nicolet also proposed that the surviving bank be nationally chartered, that each company elect a respective chairman to serve as co-chairman in the combined company, that Baylake not be allowed to make any special dividend, and that Mr. Atwell serve as Chief Executive Officer of the company, Mr. Cera serve as President of the company, and that Mr. Daniels serve as Chief Executive Officer and President of the bank.
On June 30, 2015, both subcommittees met jointly in Sturgeon Bay, Wisconsin to mutually review the revised term sheet and continue discussions regarding a potential merger of equals. At that meeting, members of Baylake’s subcommittee communicated that the proposed exchange ratio was not sufficient. Both subcommittees agreed that members of Nicolet’s senior management team, Mr. Cera, and Sandler O’Neill should independently assess additional exchange ratios and special dividends to determine if a different structure could be mutually agreeable by both parties. The subcommittees also agreed on the need to address the senior management issue and asked Messrs. Cera, Atwell, and Daniels to attempt to resolve the issue. The subcommittees scheduled a follow up meeting between the same parties for July 9, 2015.
After additional communication and exchange of information between Mr. Cera, Sandler O’Neill, and members of Nicolet’s senior management team on July 1, 2015, the Nicolet subcommittee met on July 2, 2015 to discuss the issue of senior management. During that meeting, the subcommittee discussed the possibility of Messrs. Atwell and Cera becoming Co-Chairmen, Co-Presidents, and Co-Chief Executive Officers of the company with Mr. Daniels serving as President and Chief Executive Officer of the bank. A lengthy discussion followed that addressed the roles and responsibilities of Co-Presidents and Co-Chief Executive Officers and general reporting dynamics of the combined organization with this shared role. After deliberations, it was determined that Nicolet would offer the new shared role structure to Baylake, which was then communicated to Mr. Cera through Sandler O’Neill.
Concurrently with the negotiation of the term sheet, the Baylake subcommittee, Mr. Cera and Nicolet management and the parties’ respective outside counsel negotiated the terms of Mr. Cera’s employment arrangement with Nicolet following the merger. The final terms of the employment agreement between Mr. Cera and Nicolet is summarized under “The Merger — Interests of Certain Persons in the Merger.”
Following independent analysis by all parties in the days after the June 30, 2015 meeting, Mr. Cera, members of Nicolet’s senior management team, including Messrs. Atwell and Daniels, and principals of Sandler O’Neill met on the afternoon of July 7, 2015 to discuss updated financial terms of a transaction. At that time, Nicolet proposed an increased exchange ratio of 0.4517, but with no special dividend to Baylake shareholders. Mr. Cera subsequently held discussions with members of the Baylake subcommittee regarding Nicolet’s updated proposal. At the July 9 joint meeting of the subcommittees, Baylake’s subcommittee agreed to accept the revised exchange ratio of 0.4517 proposed by Nicolet; however, they requested that a special dividend of $5 million in aggregate (or approximately $0.54 per share) be considered as part of a merger. On July 11, 2015, Nicolet made a counter proposal for a special dividend of $2.5 million in aggregate (or approximately $0.27 per share). In the following days, both parties continued negotiations and, on July 14, 2015, the parties agreed in principle that Baylake be allowed to make a special, one-time dividend of up to $0.40 per share (or approximately $3.8 million in aggregate) to its shareholders concurrently with the closing of the merger. The nonbinding term sheet was updated to reflect the new terms agreed upon by both subcommittees. Both Baylake and Nicolet agreed to present the revised term sheet to their respective board of directors on July 21, 2015—the date of each company’s regularly scheduled board meeting.
31
On July 21, 2015, Baylake’s board of directors discussed the revised term sheet. Sandler O’Neill made a presentation to the board that reviewed the financial terms of the transaction including an analysis of the pro forma company. Sandler O’Neill also provided an analysis of other strategic alternatives, including the prospects and likelihood of receiving a term sheet that offered superior terms and conditions as what Nicolet had provided. Other potential merger partners were discussed, but none were deemed as viable or presented a superior long-term benefit to Baylake’s shareholders. After a prolonged discussion among the directors regarding Baylake’s strategic alternatives, the board approved moving forward with a potential merger of equals with Nicolet under the terms and conditions outlined in the nonbinding term sheet. Nicolet’s board of directors also held a board meeting on the same day. During the meeting, Nicolet’s board held a lengthy discussion regarding the terms and conditions of the proposed merger with Baylake, assessed the consideration it was offering as part of the transaction against other strategic alternatives, reviewed other strategic opportunities it was currently considering and the likelihood of such opportunities closing, and considered its growth projections as a stand-alone company. After further conversation, Nicolet’s board believed it was in the best interest of its shareholders to continue to pursue a merger of equals with Baylake. After these meetings, both boards of directors decided to proceed with continued discussions, and Chairman Agnew from Baylake and Chairman Atwell from Nicolet each executed the term sheet.
During the next 30 days, members of both Baylake’s and Nicolet’s senior management team held a variety of meetings with each other to discuss the due diligence process, including which items would be reviewed and the conditions governing such review. On July 31, it was determined that, since the transaction was structured as a merger of equals, each party would provide the same due diligence information to the other. Both parties began to populate diligence information via a secure, third party virtual dataroom. Due to the physical nature of Baylake’s credit files, Nicolet had to review such information onsite, which it did at Baylake’s headquarters on August 6 – 9, 2015. Baylake performed a similar review of Nicolet’s credit files, but Baylake’s review was conducted virtually. Mutual review of all diligence information continued over the next several weeks. Messrs. Cera, Atwell, and Daniels met on August 17, 2015 to discuss initial diligence findings as well as request additional items needed as part of the review by both companies.
Also during the month of August 2015, both Baylake and Nicolet and their respective legal advisors began drafting a definitive agreement in connection with the merger. Baylake and its counsel, Reinhart Boerner van Deuren s.c. (“Reinhart”), were provided with an initial draft of a definitive agreement by Nicolet’s counsel, Bryan Cave LLP (“Bryan Cave”) on August 3, 2015. Baylake and Reinhart provided initial comments to Nicolet and Bryan Cave on August 10, 2015. Several follow up discussions were held between members of both company’s senior management teams, directors, and respective legal counsels over the weeks that followed.
Also in the month of August, members of Nicolet’s senior management team met with representatives of Keefe, Bruyette & Woods, Inc. (“KBW”) and a second investment banking firm to discuss the potential transaction and a potential engagement to render a fairness opinion to the Nicolet board of directors. Nicolet ultimately engaged KBW due to its historical relationship with the company, its strong reputation in the community bank M&A sector, and its knowledge of the history between Nicolet and Baylake.
On August 18, 2015, each of the boards of directors of Baylake and Nicolet independently held a regulatory scheduled meeting. At an executive session of the Baylake board, Reinhart discussed the fiduciary responsibilities and other issues as it related to the current draft of the definitive agreement. The senior management of Nicolet updated the board of directors of Nicolet on the status of the potential merger, including initial due diligence findings. Representatives of KBW also attended this meeting of the Nicolet board to discuss KBW’s engagement.
Over the next two weeks, both companies continued to share due diligence information. On September 1, 2015, the senior management team of Baylake presented their due diligence findings on Nicolet to the board of directors. After that meeting, it became apparent that a merger with Nicolet looked highly probable, and Mr. Cera met with Messrs. Atwell and Daniels to discuss a communication plan with employees, shareholders, and the media.
Baylake’s board of directors met on September 3, 2015 to discuss the final terms and conditions of a transaction with Nicolet, which had not materially changed since the term sheet that was initially approved on July 21, 2015. At that time, representatives of Reinhart and Sandler O’Neill discussed the course of
32
negotiations thus far and next steps. Representatives of Sandler O’Neill provided a financial analysis to the board regarding the proposed merger with Nicolet. Representatives of Reinhart reviewed in detail with the board the terms of the current draft of the merger agreement, including the scope of the representations and warranties, the nature of the operating covenants prior to closing, the proposed closing conditions, and the termination provisions. A discussion was held regarding the few remaining open items under the definitive agreement. At that time, Sandler O’Neill delivered to the board its oral opinion, which was subsequently confirmed in writing, that, as of such date, the merger consideration was fair, from a financial point of view, to the holders of Baylake common stock.
Nicolet’s board of directors had a special meeting on September 4, 2015, with representatives of Bryan Cave and KBW also in attendance, to discuss the final terms and conditions of a transaction with Baylake. At that time, representatives of Bryan Cave reviewed with the board the process leading to the proposed merger and the course of negotiations with Baylake. Representatives of Bryan Cave reviewed in detail with the board the terms of the current draft of the merger agreement, including the scope of the representations and warranties, the nature of the operating covenants prior to closing, the proposed closing conditions, and the termination provisions. Nicolet’s board of directors reviewed the results of Nicolet’s due diligence process regarding a review of the combined company’ loan portfolio and credit marks. A discussion was held regarding the few remaining open items under the definitive agreement.
On September 8, 2015, Baylake’s board of directors met again to discuss the final definitive agreement. At that time, Sandler O’Neill reiterated its oral opinion to the board, which was subsequently confirmed in writing, that as of such date, the merger consideration was fair, from a financial point of view, to the holders of Baylake common stock. The Baylake board engaged in a long discussion with Baylake’s advisors regarding the proposed draft of the merger agreement, including the final business terms of the transaction. After the conclusion of the presentations and discussions at the September 8 meeting, the Baylake board unanimously approved the merger agreement and resolved to recommend that Baylake shareholders approve the merger and authorized Mr. Cera to execute the merger agreement on behalf of Baylake in substantially the form reviewed by the board subject to such changes agreed to by Mr. Cera, and approved the Form of Voting and Support Agreement, a copy of which is attached hereto as Exhibit C to the merger agreement.
Likewise, on September 8, 2015, Nicolet held a special meeting of the board of directors to discuss the final version of the definitive agreement. At this meeting, KBW reviewed the financial aspects of the proposed merger and rendered an opinion to the Nicolet board of directors to the effect that, as of that date and subject to the procedures followed, assumptions made, matters considered, and qualifications and limitations on the review undertaken by KBW as set forth in such opinion, the exchange ratio in the proposed merger was fair, from a financial point of view, to Nicolet. The Nicolet board of directors then considered the information presented to them at the meeting, together with the information presented at prior meetings of the board, and after deliberations, voted unanimously to determine that the merger with Baylake is fair to and in the best interests of Nicolet and its shareholders, adopt the plan of merger, recommend that the shareholders approve the merger, and authorize Mr. Atwell to execute the merger agreement.
Nicolet and Baylake executed the merger agreement on September 8, 2015 and issued a joint press release announcing the execution of the merger agreement and the terms of the merger.
Reasons for the Merger
General
The financial and other terms of the merger agreement resulted from arm’s-length negotiations between Nicolet’s and Baylake’s representatives. The following discussion of the information and factors considered by the Nicolet and Baylake boards of directors is not intended to be exhaustive, but includes all of the material factors the respective boards considered in determining whether to enter into the merger agreement. In reaching their determinations to approve the merger and to recommend that their respective shareholders approve the merger, neither the Nicolet board of directors nor the Baylake board of directors assigned any relative or specific weight to the following factors, and individual directors may have assigned different weight to different factors.
33
Nicolet
In deciding to pursue a merger with Baylake, Nicolet’s management and board of directors considered, among other things, the following:
•
the complementary strengths of Nicolet and Baylake, with Nicolet as a leader in commercial lending and Baylake having a superior retail and commercial banking presence in Door and Kewaunee Counties;
•
the expected strengthened competitive positioning of the combined company throughout Northeast Wisconsin, which Nicolet expects will meaningfully enhance its ability to serve its customers;
•
the board of directors’ belief that the merger represents a superior opportunity for increasing shareholder value compared to the other strategic alternatives available to Nicolet;
•
the expectation that Nicolet shareholders will experience opportunities for share price growth driven by a more liquid publicly traded stock;
•
information concerning the business, operations, earnings, asset quality, capitalization, and financial condition of Baylake and Baylake Bank;
•
the financial terms of the merger, including the relationship of the value of the consideration issuable in the merger to the market value, tangible book value, and earnings per share of Baylake’s common stock;
•
the ability of Baylake’s operations to meaningfully contribute to Nicolet’s earnings after the merger;
•
the recent comparative earnings and financial performance of Baylake and Nicolet;
•
the financial terms of recent business combinations in the banking industry and a comparison of the multiples of selected combinations with the terms of the proposed merger;
•
the expectation that combined company will have an attractive and increasingly diversified loan portfolio;
•
the increased lending limit that the organizations will enjoy once Nicolet National Bank and Baylake Bank are combined;
•
the compatibility of Baylake’s management team, strategic objectives and geographic footprint with those of Nicolet;
•
the compatibility of the business cultures of the two organizations and their shared focus on small and middle-market customers throughout Northeast and North Central Wisconsin;
•
the opportunity to leverage the existing infrastructure of Nicolet;
•
the nonfinancial terms of the merger, including the treatment of the merger as a tax-free reorganization for U.S. federal income tax purposes;
•
the opinion, dated September 8, 2015, of KBW to the Nicolet board of directors as to the fairness, from a financial point of view and as of the date of the opinion, to Nicolet of the exchange ratio in the proposed merger, as more fully described below under “The Merger — Opinion of Keefe, Bruyette & Woods, Inc.”; and
•
the likelihood of the merger being approved by applicable regulatory authorities without undue conditions or delay.
34
Baylake
In deciding to pursue the merger transaction with Nicolet, Baylake’s board of directors consulted with its management, as well as its legal counsel and financial advisor, and considered numerous factors, including the following:
•
the complementary strengths of Nicolet and Baylake and the expected strengthened competitive positioning of the combined company throughout Northeast Wisconsin, which Baylake expects will meaningfully enhance its ability to serve its customers;
•
the board of directors’ belief that the merger represents a superior opportunity for increasing shareholder value compared to the other strategic alternatives available to Baylake;
•
the financial terms of the merger, including the relationship of the value of the consideration issuable in the merger to the market value, tangible book value, and earnings per share of Baylake’s common stock;
•
the recent comparative earnings and financial performance of Baylake and Nicolet;
•
the financial terms of recent business combinations in the banking industry and a comparison of the multiples of selected combinations with the terms of the proposed merger;
•
the expectation that combined company will have an attractive and increasingly diversified loan portfolio;
•
the increased lending limit that the organizations will enjoy once Nicolet National Bank and Baylake Bank are combined;
•
the compatibility of the business cultures of the two organizations and their shared focus on small and middle-market customers throughout Northeast and North Central Wisconsin;
•
the opportunity to leverage the existing infrastructure of Nicolet and Baylake;
•
the value of the consideration to be received by Baylake’s shareholders compared to shareholder value for Baylake as an independent entity;
•
information concerning business, operations, earnings, asset quality, and financial condition, prospects, and capital levels of Baylake and Nicolet, both individually and as a combined entity;
•
the perceived risks and uncertainties attendant to Baylake’s operation as an independent banking organization, the continuing low-interest rate environment, operating under enhanced regulatory scrutiny, and increased capital requirements;
•
the financial terms of recent business combinations in the financial services industry and a comparison of the multiples of selected combinations with the terms of the proposed merger;
•
the receipt of the stock consideration by Baylake’s shareholders on a tax-free basis;
•
the opinion of Sandler O’Neill that the consideration to be received by Baylake’s common shareholders in the merger is fair from a financial point of view, as more fully described below under “The Merger — Opinion of Sandler O’Neill & Partners, L.P.”; and
•
the likelihood of the merger being approved by applicable regulatory authorities without undue conditions or delay.
Opinion of Keefe, Bruyette & Woods, Inc.
Nicolet engaged Keefe, Bruyette & Woods, Inc. (“KBW”) to provide an opinion to the Nicolet board of directors as to the fairness, from a financial point of view, to Nicolet of the exchange ratio in the proposed merger. Nicolet selected KBW because KBW is a nationally recognized investment banking firm with substantial experience in transactions similar to the merger. As part of its investment banking business, KBW is continually engaged in the valuation of financial services businesses and their securities in connection with mergers and acquisitions.
35
As part of its engagement, representatives of KBW participated via teleconference in the Nicolet board meeting held on September 8, 2015 at which the Nicolet board evaluated the proposed merger. At this meeting, KBW reviewed the financial aspects of the proposed merger and rendered an opinion to the effect that, as of such date and subject to the procedures followed, assumptions made, matters considered, and qualifications and limitations on the review undertaken by KBW as set forth in such opinion, the exchange ratio in the proposed merger was fair, from a financial point of view, to Nicolet. The Nicolet board approved the merger agreement at this meeting.
The description of the opinion set forth herein is qualified in its entirety by reference to the full text of the opinion, which is attached as Appendix B to this document and is incorporated herein by reference, and describes the procedures followed, assumptions made, matters considered, and qualifications and limitations on the review undertaken by KBW in preparing the opinion.
KBW’s opinion speaks only as of the date of the opinion. The opinion was for the information of, and was directed to, the Nicolet board (in its capacity as such) in connection with its consideration of the financial terms of the merger. The opinion addressed only the fairness, from a financial point of view, of the exchange ratio in the merger to Nicolet. It did not address the underlying business decision of Nicolet to engage in the merger or enter into the merger agreement or constitute a recommendation to the Nicolet board in connection with the merger, and it does not constitute a recommendation to any holder of Nicolet common stock or any shareholder of any other entity as to how to vote in connection with the merger or any other matter, nor does it constitute a recommendation as to whether or not any such shareholder should enter into a voting, shareholders’, or affiliates’ agreement with respect to the merger or exercise any dissenters’ or appraisal rights that may be available to such shareholder.
KBW’s opinion was reviewed and approved by KBW’s Fairness Opinion Committee in conformity with its policies and procedures established under the requirements of Rule 5150 of the Financial Industry Regulatory Authority.
In connection with the opinion, KBW reviewed, analyzed and relied upon material bearing upon the merger and the financial and operating condition of Nicolet and Baylake, including, among other things:
•
a draft of the merger agreement, dated September 7, 2015 (the most recent draft then made available to KBW);
•
the audited financial statements and Annual Reports on Form 10-K of Nicolet for the three fiscal years ended December 31, 2014;
•
the unaudited quarterly financial statements and Quarterly Reports on Form 10-Q of Nicolet for the fiscal quarters ended March 31, 2015 and June 30, 2015;
•
the audited financial statements and Annual Reports on Form 10-K of Baylake for the three fiscal years ended December 31, 2014;
•
the unaudited quarterly financial statements and Quarterly Reports on Form 10-Q of Baylake for the fiscal quarters ended March 31, 2015 and June 30, 2015;
•
certain regulatory filings of Nicolet and Baylake, including the quarterly Call Reports on Form FRY-9C filed with respect to each quarter during the three year period ended June 30, 2015;
•
certain other interim reports and other communications of Nicolet and Baylake to their respective shareholders; and
•
other financial information concerning the businesses and operations of Nicolet and Baylake furnished to KBW by Nicolet and Baylake or which KBW was otherwise directed to use for purposes of its opinion and analyses.
KBW’s consideration of financial information and other factors that it deemed appropriate under the circumstances or relevant to its analyses included, among others, the following:
•
the historical and current financial position and results of operations of Nicolet and Baylake;
•
the assets and liabilities of Nicolet and Baylake;
36
•
the nature and terms of certain other merger transactions and business combinations in the banking industry;
•
a comparison of certain financial and stock market information of Nicolet and Baylake with similar information for certain other companies the securities of which are publicly traded;
•
financial and operating forecasts and projections of Nicolet that were prepared by Nicolet management, provided to and discussed with KBW by such management, and used and relied upon by KBW at the direction of such management with the consent of the Nicolet board;
•
the publicly available consensus “street estimates” of Baylake for 2015 and 2016 (which estimates reflect the pro forma impact of Baylake’s pending acquisition of NEW Bancshares, Inc. that was publicly announced on May 8, 2015 (the “NEWBI Acquisition”)) as well as assumed long term earnings and asset growth rates of Baylake that were provided to KBW by Nicolet management, all of which information was discussed with KBW by Nicolet management and used and relied upon by KBW at the direction of such management with the consent of the Nicolet board; and
•
estimates regarding certain pro forma financial effects of the merger on Nicolet (including but not limited to the cost savings and related expenses expected to result or be derived from the merger) that were prepared by Nicolet management, provided to and discussed with KBW by such management, and used and relied upon by KBW at the direction of such management with the consent of the Nicolet board.
KBW also performed such other studies and analyses as it considered appropriate and took into account its assessment of general economic, market and financial conditions and its experience in other transactions, as well as its experience in securities valuation and knowledge of the banking industry generally. KBW also held discussions with senior management of Nicolet and Baylake regarding the past and current business operations, regulatory relations, financial condition and future prospects of their respective companies (including, in the case of Baylake, matters pertaining to the NEWBI Acquisition) and such other matters as KBW deemed relevant to its inquiry.
In conducting its review and arriving at its opinion, KBW relied upon and assumed the accuracy and completeness of all of the financial and other information provided to it or publicly available and did not independently verify the accuracy or completeness of any such information or assume any responsibility or liability for such verification, accuracy or completeness. KBW relied upon the management of Nicolet as to the reasonableness and achievability of the financial and operating forecasts and projections of Nicolet and the estimates regarding certain pro forma financial effects of the merger on Nicolet (and the assumptions and bases for such forecasts, projections and estimates) which were prepared by, and provided to and discussed with KBW by, such management, and further relied on such management as to the reasonableness and achievability of the publicly available consensus “street estimates” of Baylake and long term growth rates referred to above that were discussed with KBW by Nicolet management and that KBW was directed by such management to use. KBW assumed, at the direction of Nicolet, that all of the foregoing forecasts, projections and estimates reflected, or in the case of the Baylake publicly available “street estimates” referred to above, were consistent with, the best currently available estimates and judgments of Nicolet management, and that such forecasts, projections and estimates would be realized in the amounts and in the time periods estimated. KBW expressed no view or opinion as to the NEWBI Acquisition (or any terms, aspects or implications thereof) and assumed, at the direction of Nicolet, that the NEWBI Acquisition would be consummated as described to KBW by Baylake management in the fourth quarter of 2015.
It is understood that the forecasts, projections and estimates of Nicolet and Baylake that were provided to and discussed with KBW were not prepared with the expectation of public disclosure, that all such forecasts, projections and estimates, together with the publicly available consensus “street estimates” of Baylake referred to above, were based on numerous variables and assumptions that are inherently uncertain, including, without limitation, factors related to general economic and competitive conditions and that, accordingly, actual results could vary significantly from those set forth in such information. KBW assumed, based on discussions with management of Nicolet and with the consent of the Nicolet board, that all such
37
information provided a reasonable basis upon which KBW could form its opinion and KBW expressed no view as to any such information or the assumptions or bases therefor. KBW relied on all such information without independent verification or analysis and did not in any respect assume any responsibility or liability for the accuracy or completeness thereof.
KBW assumed that there were no material changes in the assets, liabilities, financial condition, results of operations, business or prospects of either Nicolet or Baylake since the date of the last financial statements of each such entity that were made available to KBW. KBW is not an expert in the independent verification of the adequacy of allowances for loan and lease losses and KBW assumed, without independent verification and with Nicolet’s consent, that the aggregate allowances for loan and lease losses for Nicolet and Baylake were adequate to cover such losses. In rendering its opinion, KBW did not make or obtain any evaluations or appraisals or physical inspection of the property, assets or liabilities (contingent or otherwise) of Nicolet or Baylake, the collateral securing any of such assets or liabilities, or the collectability of any such assets, nor did KBW examine any individual loan or credit files, nor did KBW evaluate the solvency, financial capability or fair value of Nicolet or Baylake under any state or federal laws, including those relating to bankruptcy, insolvency or other matters. Estimates of values of companies and assets do not purport to be appraisals or necessarily reflect the prices at which companies or assets may actually be sold. Because such estimates are inherently subject to uncertainty, KBW assumed no responsibility or liability for their accuracy.
KBW assumed that, in all respects material to its analyses:
•
the merger would be completed substantially in accordance with the terms set forth in the merger agreement (the final terms of which KBW assumed would not differ in any respect material to its analyses from the latest draft version of the merger agreement that had been reviewed) with no adjustments to the exchange ratio and with no other consideration or payments in respect of the Baylake common stock;
•
that any related transactions (including the bank merger, the $0.40 special dividend that may be paid to Baylake shareholders (the “Baylake Special Dividend”) and the redemption of at least 50% of Nicolet’s Non-Cumulative Perpetual Preferred Stock, Series C (the “Nicolet Preferred Stock Redemption”)) would be completed as contemplated by the merger agreement and as described to KBW by representatives of Nicolet;
•
the representations and warranties of each party in the merger agreement and in all related documents and instruments referred to in the merger agreement were true and correct;
•
each party to the merger agreement and all related documents would perform all of the covenants and agreements required to be performed by such party under such documents;
•
there are no factors that would delay, or subject to any adverse conditions, any necessary regulatory or governmental approval for the merger and any related transactions and that all conditions to the completion of the merger and any related transactions would be satisfied without any waivers or modifications to the merger agreement; and
•
in the course of obtaining the necessary regulatory, contractual, or other consents or approvals for the merger and any related transactions, no restrictions, including any divestiture requirements, termination or other payments or amendments or modifications, would be imposed that would have a material adverse effect on the future results of operations or financial condition of Nicolet, Baylake or the pro forma entity or the contemplated benefits of the merger, including the cost savings and related expenses expected to result or be derived from the merger.
KBW assumed that the merger would be consummated in a manner that complied with the applicable provisions of the Securities Act of 1933, as amended, the Securities Exchange Act of 1934, as amended, and all other applicable federal and state statutes, rules and regulations. KBW was further advised by representatives of Nicolet that Nicolet relied upon advice from its advisors (other than KBW) or other appropriate sources as to all legal, financial reporting, tax, accounting and regulatory matters with respect to Nicolet, Baylake, the merger and any related transaction (including the bank merger, the Baylake Special Dividend and the Nicolet Preferred Stock Redemption), the NEWBI Acquisition, and the merger
38
agreement. KBW did not provide advice with respect to any such matters. In addition, for purposes of its analyses and at the direction of Nicolet management, KBW assumed, in all respects material to its analyses, the occurrence of the Baylake Special Dividend and the Nicolet Preferred Stock Redemption.
KBW’s opinion addressed only the fairness, from a financial point of view, as of the date of the opinion, of the exchange ratio in the merger to Nicolet. KBW expressed no view or opinion as to any other terms or aspects of the merger or any term or aspect of any related transaction (including the bank merger, the Baylake Special Dividend and the Nicolet Preferred Stock Redemption), including without limitation, the form or structure of the merger or any related transaction, any consequences of the merger to Nicolet, its shareholders, creditors or otherwise, or any terms, aspects or implications of any employment, voting, support, shareholder, or other agreements, arrangements or understandings contemplated or entered into in connection with the merger, any related transaction, or otherwise. KBW’s opinion was necessarily based upon conditions as they existed and could be evaluated on the date of the opinion and the information made available to KBW through such date. It is understood that subsequent developments may affect the conclusion reached in KBW’s opinion and that KBW does not have an obligation to update, revise or reaffirm its opinion. KBW’s opinion did not address, and KBW expressed no view or opinion with respect to:
•
the underlying business decision of Nicolet to engage in the merger or enter into the merger agreement;
•
the relative merits of the merger as compared to any strategic alternatives that are, have been or may be available to or contemplated by Nicolet or the Nicolet board;
•
the fairness of the amount or nature of any compensation to any of Nicolet’s officers, directors or employees, or any class of such persons, relative to any compensation to the holders of Nicolet common stock or Baylake common stock or relative to the exchange ratio;
•
the effect of the merger or any related transaction on, or the fairness of the consideration to be received by, holders of any class of securities of Nicolet or Baylake or any other party to any other transaction contemplated by the merger agreement;
•
the actual value of Nicolet common stock to be issued in the merger;
•
the prices, trading range or volume at which Nicolet common stock or Baylake common stock may trade following the public announcement of the merger or the prices, trading range or volume at which Nicolet common stock may trade following the consummation of the merger;
•
whether Nicolet has sufficient cash, available lines of credit or other sources of funds to enable it to complete the Nicolet Preferred Stock Redemption;
•
any advice or opinions provided by any other advisor to any of the parties to the merger or any other transaction contemplated by the merger agreement; or
•
any legal, regulatory, accounting, tax or similar matters relating to Nicolet, Baylake, any of their respective shareholders, or relating to or arising out of or as a consequence of the merger or any other related transaction (including the bank merger, the Baylake Special Dividend and the Nicolet Preferred Stock Redemption), or the NEWBI Acquisition, including whether or not the merger would qualify as a tax-free reorganization for United States federal income tax purposes.
In performing its analyses, KBW made numerous assumptions with respect to industry performance, general business, economic, market and financial conditions and other matters, which are beyond the control of KBW, Nicolet and Baylake. Any estimates contained in the analyses performed by KBW are not necessarily indicative of actual values or future results, which may be significantly more or less favorable than suggested by these analyses. Additionally, estimates of the value of businesses or securities do not purport to be appraisals or to reflect the prices at which such businesses or securities might actually be sold. Accordingly, these analyses and estimates are inherently subject to substantial uncertainty. In addition, the KBW opinion was among several factors taken into consideration by the Nicolet board in making its determination to approve the merger agreement and the merger. Consequently, the analyses described below
39
should not be viewed as determinative of the decision of the Nicolet board with respect to the fairness of the merger consideration. The type and amount of consideration payable in the merger were determined through negotiation between Nicolet and Baylake and the decision to enter into the merger agreement was solely that of the Nicolet board.
The following is a summary of the material financial analyses presented by KBW to the Nicolet board in connection with its opinion. The summary is not a complete description of the financial analyses underlying the opinion or the presentation made by KBW to the Nicolet board, but summarizes the material analyses performed and presented in connection with such opinion. The financial analyses summarized below include information presented in tabular format. The tables alone do not constitute a complete description of the financial analyses. The preparation of a fairness opinion is a complex analytic process involving various determinations as to appropriate and relevant methods of financial analysis and the application of those methods to the particular circumstances. Therefore, a fairness opinion is not readily susceptible to partial analysis or summary description. In arriving at its opinion, KBW did not attribute any particular weight to any analysis or factor that it considered, but rather made qualitative judgments as to the significance and relevance of each analysis and factor. Accordingly, KBW believes that its analyses and the summary of its analyses must be considered as a whole and that selecting portions of its analyses and factors or focusing on the information presented below in tabular format, without considering all analyses and factors or the full narrative description of the financial analyses, including the methodologies and assumptions underlying the analyses, could create a misleading or incomplete view of the process underlying its analyses and opinion.
For purposes of the financial analyses described below, KBW utilized an implied transaction value per share of Baylake common stock in the proposed merger of $15.02 based on the 0.4517x exchange ratio in the proposed merger and the closing price of Nicolet common stock on September 4, 2015. In addition to the financial analyses described below, KBW reviewed with the Nicolet board for informational purposes, among other things, the implied transaction multiples for the proposed merger of 14.7x Baylake’s estimated 2015 earnings per share (“EPS”) and 12.2x Baylake’s estimated 2016 EPS using publicly available consensus “street estimates” for Baylake (which estimates reflect the pro forma impact of the NEWBI Acquisition) and based on the implied transaction value per share of Baylake common stock in the proposed merger of $15.02.
Selected Companies Analysis. Using publicly available information, KBW compared the financial performance, financial condition and market performance of Nicolet and Baylake to 16 selected banks and thrifts that were listed on NASDAQ, the New York Stock Exchange or NYSE MKT and headquartered in the Midwest region (defined as Illinois, Indiana, Iowa, Kansas, Kentucky, Michigan, Minnesota, Missouri, Nebraska, North Dakota, Ohio, South Dakota and Wisconsin) and that had total assets between $750 million and $1.5 billion and a ratio of nonperforming assets to loans plus other real estate owned (“OREO”) of less than 7.0%. Merger targets were excluded from the selected companies.
The selected companies were:
| | MutualFirst Financial, Inc. | | | Hawthorne Bancshares, Inc. | |
| | BankFinancial Corporation | | | HF Financial Corp. | |
| | Cass Information Systems, Inc. | | | First Internet Bancorp | |
| | Ames National Corporation | | |
First Community Financial Partners, Inc.
|
|
| | Civista Bancshares, Inc. | | | Landmark Bancorp, Inc. | |
| |
Southern Missouri Bancorp, Inc.
|
| | HopFed Bancorp, Inc. | |
| | MBT Financial Corp. | | | Ohio Valley Banc Corp. | |
| | LCNB Corp. | | | County Bancorp, Inc. | |
To perform this analysis, KBW used profitability and other financial information as of, or for, the latest 12 months (“LTM”) or most recent completed fiscal quarter ended (June 30, 2015) and market price information as of September 4, 2015. KBW also used 2015 and 2016 EPS estimates taken from Nicolet management’s forecasts and projections for Nicolet and from publicly available consensus “street estimates”
40
for Baylake (which estimates reflect the pro forma impact of the NEWBI Acquisition) and publicly available consensus “street estimates” for the selected companies. Using publicly available information, applicable historical financial data for Nicolet and Baylake reflected pro forma adjustments for two branch divestitures completed in August 2015 in the case of Nicolet and the NEWBI Acquisition in the case of Baylake. Certain financial data prepared by KBW, and as referenced in the tables presented below, may not correspond to the data presented in Nicolet’s or Baylake’s historical financial statements, or the data prepared by Sandler O’Neill presented under the section “The Merger — Opinion of Sandler O’Neill & Partners, L.P.,” as a result of the different periods, assumptions and methods used by KBW to compute the financial data presented.
KBW’s analysis showed the following concerning the financial performance and financial condition of Nicolet, Baylake and the selected companies:
| | | | | | | | | | | | | | | |
Selected Companies
|
| |||||||||||||||||||||
| | | |
NCBS
|
| |
BYLK
|
| |
25th
Percentile |
| |
Average
|
| |
Median
|
| |
75th
Percentile |
| ||||||||||||||||||
|
LTM Core Return on Average Assets(1)(2)
|
| | | | 0.92% | | | | | | 0.86% | | | | | | 0.71% | | | | | | 0.87% | | | | | | 0.85% | | | | | | 1.05% | | |
|
LTM Core Return on Average Equity(1)(2)
|
| | | | 9.79% | | | | | | 8.10% | | | | | | 7.22% | | | | | | 8.38% | | | | | | 8.83% | | | | | | 9.42% | | |
|
LTM Net Interest Margin
|
| | | | 3.99% | | | | | | 3.69% | | | | | | 3.26% | | | | | | 3.48% | | | | | | 3.40% | | | | | | 3.72% | | |
|
LTM Fee Income/Revenue(3)
|
| | | | 26.0% | | | | | | 19.9% | | | | | | 17.7% | | | | | | 24.7% | | | | | | 22.2% | | | | | | 27.3% | | |
|
LTM Efficiency Ratio
|
| | | | 63.7% | | | | | | 66.3% | | | | | | 73.7% | | | | | | 67.7% | | | | | | 70.8% | | | | | | 63.8% | | |
|
Tangible Common Equity/Tangible Assets
|
| | | | 7.47% | | | | | | 9.75% | | | | | | 8.32% | | | | | | 9.62% | | | | | | 9.28% | | | | | | 11.05% | | |
|
Total Risk-Based Capital/Risk-Weighted Assets
|
| | | | 15.5% | | | | | | 15.0% | | | | | | 14.1% | | | | | | 16.1% | | | | | | 15.1% | | | | | | 18.1% | | |
|
Loans/Deposits
|
| | | | 88.3% | | | | | | 90.4% | | | | | | 76.0% | | | | | | 87.4% | | | | | | 91.1% | | | | | | 96.6% | | |
|
Loan Loss Reserve/Gross Loans
|
| | | | 1.10% | | | | | | 1.01% | | | | | | 1.11% | | | | | | 1.28% | | | | | | 1.24% | | | | | | 1.47% | | |
|
Nonperforming Assets/Loans + OREO
|
| | | | 1.00% | | | | | | 2.26% | | | | | | 2.56% | | | | | | 2.16% | | | | | | 1.72% | | | | | | 1.37% | | |
|
LTM Net Charge-Offs/Average Loans
|
| | | | 0.25% | | | | | | 0.10% | | | | | | 0.18% | | | | | | 0.09% | | | | | | 0.10% | | | | | | 0.01% | | |
(1)
Core income excludes extraordinary items, nonrecurring revenue/expenses and gain/loss on sale of securities.
(2)
BankFinancial Corporation Core Return on Average Assets and Core Return on Average Equity exclude a tax benefit related to the reversal of a valuation allowance on its deferred tax asset during the fourth quarter of 2014.
(3)
Excludes gain/loss on sale of securities.
41
KBW’s analysis showed the following concerning the market performance of Nicolet and Baylake and, to the extent publicly available, the selected companies (excluding the impact of certain selected company LTM and 2015 estimated EPS multiples considered to be not meaningful because they were greater than 30.0x and excluding the impact of price change and total return data for County Bancorp, Inc., which completed its IPO in January 2015):
| | | | | | | | | | | | | | | |
Selected Companies
|
| |||||||||||||||||||||
| | | |
NCBS
|
| |
BYLK
|
| |
25th
Percentile |
| |
Average
|
| |
Median
|
| |
75th
Percentile |
| ||||||||||||||||||
|
One-Year Stock Price Change
|
| | | | 40.6% | | | | | | 3.6% | | | | | | 3.2% | | | | | | 17.3% | | | | | | 12.5% | | | | | | 22.3% | | |
|
One-Year Total Return
|
| | | | 40.6% | | | | | | 6.4% | | | | | | 6.3% | | | | | | 19.6% | | | | | | 14.5% | | | | | | 24.1% | | |
|
YTD Stock Price Change
|
| | | | 33.0% | | | | | | 2.9% | | | | | | (4.2)% | | | | | | 9.8% | | | | | | 2.7% | | | | | | 19.7% | | |
|
Stock Price/Book Value per Share
|
| | | | 1.49x | | | | | | 1.11x | | | | | | 1.07x | | | | | | 1.23x | | | | | | 1.16x | | | | | | 1.31x | | |
|
Stock Price/Tangible Book Value per Share
|
| | | | 1.57x | | | | | | 1.20x | | | | | | 1.12x | | | | | | 1.34x | | | | | | 1.20x | | | | | | 1.41x | | |
|
Stock Price/LTM EPS(1)
|
| | | | 13.1x | | | | | | 13.0x | | | | | | 11.1x | | | | | | 14.6x | | | | | | 13.4x | | | | | | 16.5x | | |
|
Stock Price/2015 Estimated EPS(2)
|
| | | | 12.8x | | | | | | 12.6x | | | | | | 12.1x | | | | | | 12.8x | | | | | | 12.3x | | | | | | 15.2x | | |
|
Stock Price/2016 Estimated EPS(2)
|
| | | | 13.6x | | | | | | 10.4x | | | | | | 11.8x | | | | | | 13.6x | | | | | | 12.4x | | | | | | 14.8x | | |
|
Dividend Yield(3)
|
| | | | 0.00% | | | | | | 2.80% | | | | | | 1.20% | | | | | | 1.90% | | | | | | 1.80% | | | | | | 2.80% | | |
|
LTM Dividend Payout(3)
|
| | | | 0.0% | | | | | | 36.4% | | | | | | 15.1% | | | | | | 31.1% | | | | | | 28.3% | | | | | | 44.5% | | |
(1)
BankFinancial Corporation Price/LTM EPS excludes a tax benefit related to the reversal of a valuation allowance on its deferred tax asset during the fourth quarter of 2014.
(2)
Nicolet income projections per Nicolet management on a standalone basis.
(3)
Dividend yield reflects most recent quarterly dividend, annualized, as a percentage of stock price. LTM dividend payout reflects most recent quarterly dividend, annualized, as a percentage of LTM EPS.
No company used as a comparison in the above selected companies analysis is identical to Baylake or Nicolet. Accordingly, an analysis of these results is not mathematical. Rather, it involves complex considerations and judgments concerning differences in financial and operating characteristics of the companies involved.
Selected Transactions Analysis. KBW reviewed publicly available information related to 16 selected U.S. bank and thrift transactions announced after January 1, 2013 that had announced transaction values between $50 million and $300 million and in which the ratio of target assets to combined assets was greater than 35%. Terminated transactions, transactions where the acquired company was a mutual holding company and transactions where the acquiror was not a depository were excluded from the selected transactions. The selected transactions included in the group were:
|
Acquiror
|
| |
Acquired Company
|
|
| Green Bancorp, Inc. | | | Patriot Bancshares, Inc. | |
| Atlantic Capital Bancshares, Inc. | | | First Security Group, Inc. | |
| Plaza Bank | | | Manhattan Bancorp | |
| MidWestOne Financial Group, Inc. | | | Central Bancshares, Inc. | |
| CU Bancorp | | | 1st Enterprise Bank | |
| CB Financial Services, Inc. | | | FedFirst Financial Corporation | |
| Yadkin Financial Corporation | | | VantageSouth Bancshares, Inc. | |
| Center Bancorp, Inc | | | ConnectOne Bancorp, Inc. | |
| Hanmi Financial Corporation | | | Central Bancorp, Inc. | |
| Cascade Bancorp | | | Home Federal Bancorp, Inc. | |
| Heritage Financial Corporation | | | Washington Banking Company | |
42
|
Acquiror
|
| |
Acquired Company
|
|
| Mercantile Bank Corporation | | | Firstbank Corporation | |
| Bear State Financial, Inc. | | | First National Security Company | |
| Peoples Financial Services Corp. | | | Penseco Financial Services Corporation | |
| Home BancShares, Inc. | | | Liberty Bancshares, Inc. | |
| SCBT Financial Corporation | | | First Financial Holdings, Inc. | |
For each selected transaction, KBW derived the following implied transaction statistics (based on publicly reported values or, in the case of the selected transactions involving stock consideration, SNL Financial-calculated deal values) in each case based on the transaction consideration value paid for the acquired company and using financial data based on the acquired company’s then latest publicly available financial statements prior to the announcement of the acquisition:
•
Price per common share to tangible book value per share of the acquired company (in the case of selected transactions involving an acquired company that was privately held, this transaction statistic was calculated as total transaction consideration divided by total tangible common equity); and
•
Price per common share to LTM EPS of the acquired company (in the case of selected transactions involving an acquired company that was privately held, this transaction statistic was calculated as total transaction consideration divided by LTM net income).
KBW also reviewed the price per common share paid for the acquired company for each selected transaction in which the acquired company was publicly traded as a premium to the closing price of the acquired company one day prior to the announcement of the acquisition (expressed as a percentage and referred to as the one-day market premium). The above transaction statistics for the selected transactions were compared with the corresponding transaction statistics for the proposed merger based on the implied transaction value per share of Baylake common stock in the proposed merger of $15.02 and using historical financial information for Baylake as of or for the twelve month period ended June 30, 2015.
The results of the analysis are set forth in the following table (excluding the impact of LTM EPS multiples for certain selected transactions, which multiples were not considered to be meaningful because they were either negative or greater than 60.0x):
| | | | | | | | | |
Selected Transactions
|
| |||||||||||||||||||||
| | | |
NCBS/
BYLK(1) |
| |
25th
Percentile |
| |
Average
|
| |
Median
|
| |
75th
Percentile |
| |||||||||||||||
|
Price/Tangible Book Value
|
| | | | 1.40x | | | | | | 1.36x | | | | | | 1.44x | | | | | | 1.51x | | | | | | 1.65x | | |
|
Price/LTM EPS
|
| | | | 15.2x | | | | | | 14.2x | | | | | | 22.2x | | | | | | 15.6x | | | | | | 21.8x | | |
|
1-Day Market Premium
|
| | | | 16.9% | | | | | | 14.2% | | | | | | 19.5% | | | | | | 14.5% | | | | | | 25.9% | | |
(1)
Baylake tangible book value per share is pro forma for the pending NEWBI Acquisition announced May 8, 2015; implied transaction price to tangible book value multiple of Baylake as adjusted for the Baylake Special Dividend would be 1.45x.
No company or transaction used as a comparison in the above analysis is identical to Baylake or the proposed merger. Accordingly, an analysis of these results is not mathematical. Rather, it involves complex considerations and judgments concerning differences in financial and operating characteristics of the companies involved.
Relative Contribution Analysis. KBW analyzed the relative standalone contribution of Nicolet and Baylake to various pro forma balance sheet and income statement items and the pro forma market capitalization of the combined entity. This analysis did not include purchase accounting adjustments or cost savings. To perform this analysis, KBW used balance sheet data for Nicolet and Baylake as of June 30, 2015 (in each case pro forma for two branch divestitures completed in August 2015 in the case of Nicolet and the NEWBI Acquisition in the case of Baylake based on publicly available information), historical LTM ended
43
June 30, 2015 earnings data for Nicolet and Baylake, earnings estimates for 2015 and 2016 for Nicolet provided by Nicolet management, publicly available consensus “street estimates” of Baylake for 2015 and 2016 (which estimates reflect the pro forma impact of the NEWBI Acquisition) and market price data as of September 4, 2015. The results of KBW’s analysis are set forth in the following table, which also compares the results of KBW’s analysis with the implied pro forma ownership percentages of Nicolet and Baylake shareholders in the combined company based on the 0.4517x exchange ratio in the proposed merger and also on a fully diluted basis assuming all Nicolet options and Baylake options (as adjusted to reflect the 0.4517x exchange ratio in the proposed merger) are exercised for illustrative purposes:
| | | |
NCBS as a
Percentage of Total |
| |
BYLK as a
Percentage of Total |
| ||||||
| Ownership | | | | ||||||||||
|
100% stock
|
| | | | 48% | | | | | | 52% | | |
|
Fully Diluted Ownership at 100% Stock
|
| | | | 54% | | | | | | 46% | | |
| Market Capitalization | | | | ||||||||||
|
Pre-Deal Market Capitalization
|
| | | | 52% | | | | | | 48% | | |
| Balance Sheet | | | | ||||||||||
|
Assets
|
| | | | 52% | | | | | | 48% | | |
|
Gross Loans Held for Investment
|
| | | | 54% | | | | | | 46% | | |
|
Deposits
|
| | | | 54% | | | | | | 46% | | |
|
Tangible Common Equity
|
| | | | 45% | | | | | | 55% | | |
|
Tangible Common Equity as Adjusted(1)
|
| | | | 46% | | | | | | 54% | | |
| Net Income to Common | | | | ||||||||||
|
LTM Net Income to Common
|
| | | | 54% | | | | | | 46% | | |
|
2015 Estimated Net Income to Common
|
| | | | 53% | | | | | | 47% | | |
|
2016 Estimated Net Income to Common
|
| | | | 47% | | | | | | 53% | | |
(1)
Based on Baylake tangible common equity as adjusted for the Baylake Special Dividend.
Pro Forma Financial Impact Analysis. KBW performed a pro forma financial impact analysis that combined projected income statement and balance sheet information of Nicolet and Baylake. Using closing balance sheet estimates as of March 31, 2016 for Nicolet (giving effect to the Nicolet Preferred Stock Redemption) and Baylake (giving effect to the Baylake Special Dividend and the NEWBI Acquisition) extrapolated from the financial forecasts, projections and estimates utilized for Nicolet and Baylake, financial forecasts and projections relating to the earnings of Nicolet provided by Nicolet management, publicly available consensus “street estimates” of Baylake (which estimates reflect the pro forma impact of the NEWBI Acquisition) and pro forma assumptions (including, without limitation, the cost savings and related expenses expected to result from the merger as well as certain accounting adjustments assumed with respect thereto) provided by Nicolet management, KBW analyzed the estimated financial impact of the merger on certain projected financial results. This analysis indicated that the merger could be accretive to Nicolet’s 2016 and 2017 estimated EPS and dilutive to Nicolet’s estimated tangible book value per share as of March 31, 2016. Furthermore, the analysis indicated that, pro forma for the merger, Nicolet’s tangible common equity to tangible assets ratio could be higher and each of Nicolet’s leverage ratio, Tier 1 Risk-Based Capital Ratio and Total Risk Based Capital Ratio as of March 31, 2016 could be lower. For all of the above analysis, the actual results achieved by Nicolet following the merger may vary from the projected results, and the variations may be material.
Discounted Cash Flow Analyses. KBW performed separate discounted cash flow analyses to estimate a range for the implied equity value of Nicolet and a range for the implied equity value of Baylake. KBW used financial forecasts and projections relating to the earnings and assets of Nicolet that were prepared by Nicolet management and publicly available consensus “street estimates” of Baylake for 2015 and 2016 (which estimates reflect the pro forma impact the NEWBI Acquisition) as well as assumed long term
44
earnings and asset growth rates of Baylake that were provided to KBW by Nicolet management and assumed discount rates ranging from 11.0% to 15.0%. The ranges of values were derived by adding (i) the present value of the estimated free cash flows that Nicolet or Baylake, as the case may be, could generate over the five-year period from 2016 to 2021 and (ii) the present value of implied terminal values of Nicolet or Baylake, as the case may be, at the end of such period. KBW assumed that both Nicolet and Baylake would maintain a tangible common equity to tangible assets ratio of 8.00% and would retain sufficient earnings to maintain that level based on these assumptions. In calculating the terminal values of Nicolet and Baylake, KBW applied a range of 12.0x to 16.0x estimated 2021 net income. The discounted cash flow analysis of Nicolet resulted in a range of implied equity value of Nicolet of $25.37 per share to $35.04 per share. The discounted cash flow analysis of Baylake resulted in a range of implied equity value of Baylake of $14.31 per share to $19.94 per share. For illustrative purposes, KBW also calculated an implied exchange ratio of 0.5674x based on the midpoints of the above ranges of $29.84 for Nicolet and $16.93 for Baylake.
The discounted cash flow analysis is a widely used valuation methodology, but the results of such methodology are highly dependent on the assumptions that must be made, including asset and earnings growth rates, terminal values, dividend payout rates, and discount rates. The analysis did not purport to be indicative of the actual values or expected values of Nicolet or Baylake.
Miscellaneous. KBW was retained by Nicolet solely to render its opinion to the Nicolet board and did not act as a financial advisor to or as an agent of Nicolet in connection with the proposed merger, nor did KBW act as an advisor to or agent of any other person. As part of its investment banking business, KBW is continually engaged in the valuation of bank and bank holding company securities in connection with acquisitions, negotiated underwritings, secondary distributions of listed and unlisted securities, private placements and valuations for various other purposes. As specialists in the securities of banking companies, KBW has experience in, and knowledge of, the valuation of banking enterprises. In the ordinary course of KBW’s business as a broker dealer, KBW and its affiliates may from time to time purchase securities from, and sell securities to, Nicolet and Baylake, and as a market maker in securities, KBW may from time to time have a long or short position in, and buy or sell, debt or equity securities of Nicolet and Baylake for its own account and for the accounts of KBW’s customers.
Pursuant to the KBW engagement agreement, Nicolet agreed to pay KBW a non-refundable cash fee equal to $300,000, which became payable concurrently with the rendering of KBW’s opinion and has been paid. Nicolet also agreed to reimburse KBW for reasonable out-of-pocket expenses and disbursements incurred in connection with its engagement and to indemnify KBW against certain liabilities relating to or arising out of KBW’s engagement or KBW’s role in connection therewith. Other than in connection with this present engagement, in the two years preceding the date of its opinion, KBW did not provide investment banking and financial advisory services to Nicolet. In the two years preceding the date of its opinion, KBW did not provide investment banking and financial advisory services to Baylake. KBW may in the future provide investment banking and financial advisory services to Nicolet or Baylake and receive compensation for such services.
Opinion of Sandler O’Neill & Partners, L.P.
By letter dated August 11, 2015, Baylake retained Sandler O’Neill to act as financial advisor to Baylake’s Board of Directors in connection with Baylake’s consideration of a possible business combination. Sandler O’Neill is a nationally recognized investment banking firm whose principal business specialty is financial institutions. In the ordinary course of its investment banking business, Sandler O’Neill is regularly engaged in the valuation of financial institutions and their securities in connection with mergers and acquisitions and other corporate transactions.
Sandler O’Neill acted as financial advisor in connection with the proposed merger and participated in certain of the negotiations leading to the execution of the merger agreement. At the September 3, 2015 meeting at which Baylake’s Board of Directors considered and discussed the terms of the merger agreement and the merger, Sandler O’Neill delivered to the Baylake board its oral opinion, which was subsequently confirmed in writing, that, as of such date, the merger consideration was fair to the holders of Baylake common stock from a financial point of view. The full text of Sandler O’Neill’s opinion is attached as Appendix C to this joint proxy statement-prospectus. The opinion outlines the procedures followed, assumptions made, matters considered and qualifications and limitations on the review undertaken by Sandler
45
O’Neill in rendering its opinion. The description of the opinion set forth below is qualified in its entirety by reference to the full text of the opinion. Holders of Baylake common stock are urged to read the entire opinion carefully in connection with their consideration of the proposed merger.
Sandler O’Neill’s opinion speaks only as of the date of the opinion. The opinion was directed to Baylake’s board of directors in connection with its consideration of the merger and is directed only to the fairness, from a financial point of view, of the merger consideration to the holders of Baylake common stock. Sandler O’Neill’s opinion does not constitute a recommendation to any holder of Baylake common stock as to how such holder of Baylake common stock should vote with respect to the merger or any other matter. It does not address the underlying business decision of Baylake to engage in the merger, the relative merits of the merger as compared to any other alternative business strategies that might exist for Baylake or the effect of any other transaction in which Baylake might engage. Sandler O’Neill did not express any opinion as to the fairness of the amount or nature of the compensation to be received in the merger by Baylake’s officers, directors, or employees, or class of such persons, relative to the merger consideration to be received by Baylake’s common shareholders. Sandler O’Neill’s opinion was approved by Sandler O’Neill’s fairness opinion committee.
In connection with rendering its opinion, Sandler O’Neill reviewed and considered, among other things:
•
the merger agreement;
•
certain publicly available financial statements and other historical financial information of Baylake that Sandler O’Neill deemed relevant;
•
certain publicly available financial statements and other historical financial information of Nicolet that Sandler O’Neill deemed relevant;
•
publicly available mean and median analyst earnings per share estimates for Baylake for the years ending December 31, 2015 and December 31, 2016, and an estimated long-term annual growth rate for the years thereafter, as reviewed with and confirmed by the senior management of Baylake;
•
certain internal financial projections for Nicolet for the years ending December 31, 2015 through December 31, 2017, as reviewed with and confirmed by the senior management of Nicolet, and an estimated long-term annual growth rate for the years thereafter;
•
the relative contributions of assets, liabilities, equity and earnings of Baylake and Nicolet to the combined entity;
•
the pro forma financial impact of the merger on Nicolet based on certain assumptions relating to transaction expenses, the Baylake Special Dividend of $0.40 per share to be paid to the holders of Baylake common stock immediately prior to the closing of the merger, as well as certain cost savings, as provided by the senior management of Baylake, as well as certain assumptions relating to purchase accounting adjustments and the Nicolet Preferred Stock Redemption, as provided by the senior management of Nicolet;
•
a comparison of certain stock trading, financial and other information for Baylake and Nicolet with similar publicly available information for certain other banking institutions, the securities of which are publicly traded;
•
a comparison of certain pro forma financial information for the combined entity, as discussed with the senior management of Baylake and Nicolet, with similar publicly available information for certain bank and thrift institutions, the securities of which are publicly traded;
•
the publicly disclosed financial terms of certain other recent merger and acquisition transactions in the banking sector;
•
the current market environment generally and the banking environment in particular; and
•
such other information, financial studies, analyses and investigations and financial, economic and market criteria as Sandler O’Neill considered relevant.
46
Sandler O’Neill also discussed with certain members of senior management of Baylake the business, financial condition, results of operations and prospects of Baylake and held similar discussions with the senior management of Nicolet regarding the business, financial condition, results of operations and prospects of Nicolet.
In performing its review, Sandler O’Neill relied upon the accuracy and completeness of all of the financial and other information that was available to it from public sources, that was provided to it by Baylake and Nicolet or that was otherwise reviewed by it and Sandler O’Neill assumed such accuracy and completeness for purposes of preparing its opinion. Sandler O’Neill further relied on the assurances of the respective managements of Baylake and Nicolet that they were not aware of any facts or circumstances that would have made any of such information inaccurate or misleading in any material respect. Sandler O’Neill was not asked to undertake, and has not undertaken, an independent verification of any such information and does not assume any responsibility or liability for the accuracy and completeness thereof. Sandler O’Neill did not make an independent evaluation or appraisal of the specific assets, the collateral securing assets or the liabilities (contingent or otherwise) of Baylake or Nicolet, nor did Sandler O’Neill review any individual credit files of Baylake or Nicolet. Sandler O’Neill did not make an independent evaluation of the adequacy of the allowance for loan losses of Baylake or Nicolet and Sandler O’Neill assumed, with Baylake’s consent, that the respective allowances for loan losses for both Baylake and Nicolet were adequate to cover such losses and would be adequate on a pro forma basis for the combined entity.
In preparing its analyses, Sandler O’Neill used publicly available analyst earnings per share estimates for Baylake for the years ending December 31, 2015 and December 31, 2016, and an estimated long-term annual growth rate for the years thereafter as reviewed with and confirmed by the senior management of Baylake as well as certain internal financial projections for Nicolet for the years ending December 31, 2015 through December 31, 2017, as reviewed with and confirmed by the senior management of Nicolet, and an estimated long-term annual growth rate for the years thereafter. Sandler O’Neill also received and used in its analyses certain assumptions related to transaction expenses, purchase accounting adjustments, the Nicolet Preferred Stock Redemption, the Baylake Special Dividend and certain cost savings and other synergies as discussed with the senior management of Baylake and Nicolet. With respect to those projections and estimates, the senior managements of Baylake and Nicolet confirmed to Sandler O’Neill that they reflected the best currently available estimates of the managements of Baylake and Nicolet, respectively, and Sandler O’Neill assumed that such estimates would be achieved. Sandler O’Neill expressed no opinion as to such estimates or the assumptions on which they were based. Sandler O’Neill assumed that there was no material change in the respective assets, financial condition, results of operations, business or prospects of Baylake or Nicolet since the date of the most recent financial statements made available to Sandler O’Neill. Sandler O’Neill also assumed in all respects material to its analysis that Baylake and Nicolet would remain as going concerns for all periods relevant to its analyses. Sandler O’Neill expressed no opinion as to any of the legal, accounting and tax matters relating to the merger and any other transactions contemplated in connection therewith.
Sandler O’Neill also assumed, with Baylake’s consent, that (i) each of the parties to the merger agreement would comply in all material respects with all material terms of the merger agreement, that all of the representations and warranties contained in the merger agreement were true and correct in all material respects, that each of the parties to the merger agreement would perform in all material respects all of the covenants required to be performed by such party under the merger agreement and that the conditions precedent in the merger agreement were not waived, (ii) in the course of obtaining the necessary regulatory or third party approvals, consents and releases with respect to the merger, no material delay, limitation, restriction or condition would be imposed that would have an adverse effect on Baylake, Nicolet or the merger, and (iii) the merger and any related transaction would be consummated in accordance with the terms of the merger agreement without any waiver, modification or amendment of any material term, condition or agreement thereof and in compliance with all applicable laws and other requirements. Sandler O’Neill also assumed, with Baylake’s consent, that the pending NEWBI Acquisition would be consummated in accordance with the terms of the applicable merger agreement without any waiver, modification or amendment of any material term, condition or agreement thereof and in compliance with all applicable laws and other requirements.
47
Sandler O’Neill’s analyses and the views expressed therein were necessarily based on financial, economic, regulatory, market and other conditions as in effect on, and the information made available to Sandler O’Neill as of, the date of its opinion. Events occurring after the date of the opinion could materially affect Sandler O’Neill’s views. Sandler O’Neill has not undertaken to update, revise, reaffirm or withdraw its opinion or otherwise comment upon events occurring after the date thereof.
In rendering its opinion, Sandler O’Neill performed a variety of financial analyses. The summary below is not a complete description of all the analyses underlying Sandler O’Neill’s opinion or the presentation made by Sandler O’Neill to Baylake’s board of directors, but is a summary of the material analyses performed and presented by Sandler O’Neill. The summary includes information presented in tabular format. In order to fully understand the financial analyses, these tables must be read together with the accompanying text. The tables alone do not constitute a complete description of the financial analyses. The preparation of a fairness opinion is a complex process involving subjective judgments as to the most appropriate and relevant methods of financial analysis and the application of those methods to the particular circumstances. The process, therefore, is not necessarily susceptible to a partial analysis or summary description. Sandler O’Neill believes that its analyses must be considered as a whole and that selecting portions of the factors and analyses to be considered without considering all factors and analyses, or attempting to ascribe relative weights to some or all such factors and analyses, could create an incomplete view of the evaluation process underlying its opinion. Also, no company included in Sandler O’Neill’s comparative analyses described below is identical to Baylake or Nicolet and no transaction is identical to the merger. Accordingly, an analysis of comparable companies or transactions involves complex considerations and judgments concerning differences in financial and operating characteristics of the companies and other factors that could affect the public trading values or merger transaction values, as the case may be, of Baylake and Nicolet and the companies to which they are being compared. In arriving at its opinion, Sandler O’Neill did not attribute any particular weight to any analysis or factor that it considered. Rather, Sandler O’Neill made qualitative judgments as to the significance and relevance of each analysis and factor. Sandler O’Neill did not form an opinion as to whether any individual analysis or factor (positive or negative) considered in isolation supported or failed to support its opinion, rather, Sandler O’Neill made its determination as to the fairness of the merger consideration on the basis of its experience and professional judgment after considering the results of all its analyses taken as a whole.
In performing its analyses, Sandler O’Neill also made numerous assumptions with respect to industry performance, business and economic conditions and various other matters, many of which cannot be predicted and are beyond the control of Baylake, Nicolet and Sandler O’Neill. The analyses performed by Sandler O’Neill are not necessarily indicative of actual values or future results, both of which may be significantly more or less favorable than suggested by such analyses. Sandler O’Neill prepared its analyses solely for purposes of rendering its opinion and provided such analyses to Baylake’s board of directors at its September 3, 2015 meeting. Estimates of the values of companies do not purport to be appraisals or necessarily reflect the prices at which companies or their securities may actually be sold. Such estimates are inherently subject to uncertainty and actual values may be materially different. Accordingly, Sandler O’Neill’s analyses do not necessarily reflect the value of Baylake common stock or the prices at which Baylake or Nicolet common stock may be sold at any time. The analyses of Sandler O’Neill and its opinion were among a number of factors taken into consideration by Baylake’s board of directors in making its determination to approve the merger agreement and the analyses described below should not be viewed as determinative of the decision of Baylake’s board of directors or management with respect to the fairness of the merger.
Summary of Proposed Merger Consideration and Implied Transaction Metrics. Sandler O’Neill reviewed the financial terms of the proposed merger. As described in the merger agreement, each share of Baylake common stock outstanding immediately prior to the effective time of the merger¹, other than certain shares described in the merger agreement, will be converted into the right to receive 0.4517 shares of common stock of Nicolet, inclusive of the Baylake Special Dividend to be paid to the holders of Baylake common stock immediately prior to closing of the merger, Sandler O’Neill calculated an aggregate implied transaction value of approximately $149.9 million. Based upon financial information for Baylake as of or for the twelve months ended June 30, 2015 (unless otherwise indicated), Sandler O’Neill calculated the following implied transaction metrics(1)(2):
48
| |
Transaction Price/Book Value Per Share(3):
|
| | | | 136% | | |
| |
Transaction Price/Tangible Book Value Per Share(3):
|
| | | | 147% | | |
| |
Transaction Price/LTM Earnings Per Share:
|
| | | | 15.6x | | |
| |
Transaction Price/2015 Analyst Estimated Earnings Per Share:
|
| | | | 15.1x | | |
| |
Tangible Book Premium/Core Deposits(4):
|
| | | | 6.7% | | |
| |
One-Day Market Premium(5):
|
| | | | 20.5% | | |
(1)
Pro forma for pending NEWBI Acquisition.
(2)
Includes the $0.40 per share Baylake Special Dividend common shareholders.
(3)
Tangible book value and book value per share includes impact of the Baylake Special Dividend of $0.40 per share.
(4)
Tangible book premium to core deposits calculated as (deal value – tangible equity) / (core deposits); Core Deposits defined as deposits, less time deposit accounts with balances over $100,000, foreign deposits and unclassified deposits. Includes impact of the Baylake Special Dividend of $0.40 per share.
(5)
Based upon the closing price for Baylake common stock on September 2, 2015.
Stock Trading History. Sandler O’Neill reviewed the historical publicly reported trading prices of Baylake common stock and Nicolet common stock for the one-year period ended September 2, 2015. Sandler O’Neill then compared the relationship between the movements in the price of Baylake and Nicolet common stock, respectively, to movements in their respective Peer Group (as described below) as well as certain stock indices.
One-Year Stock Performance
| | | |
Beginning Value
September 2, 2014 |
| |
Ending Value
September 2, 2015 |
| ||||||
|
Baylake
|
| | | | 100% | | | | | | 102.6% | | |
|
Nicolet
|
| | | | 100% | | | | | | 140.3% | | |
|
SNL U.S. Bank & Thrift Index
|
| | | | 100% | | | | | | 100.9% | | |
|
Peer Group
|
| | | | 100% | | | | | | 113.0% | | |
Comparable Company Analysis. Sandler O’Neill used publicly available information to compare selected financial information for Baylake and Nicolet with a group of financial institutions selected by Sandler O’Neill. The peer group consisted of public banks headquartered in the Midwest with assets between $850 million and $1.3 billion, TCE/TA greater than 7.00%, non-performing assets/total assets less than 3.00% and last-twelve-months return on average assets greater than 0.70% (the “Peer Group”). The Peer Group excluded announced merger targets and internet-only banks. The Peer Group consisted of the following companies:
| | MBT Financial Corp. | | | Farmers & Merchants Bancorp, Inc. | |
| | Security National Corporation(1) | | | Foresight Financial Group, Inc. | |
| | LCNB Corp. | | | BNCCORP, Inc. | |
| | Bank First National Corporation | | | First Bankers Trustshares, Inc. | |
| | Independent Alliance Banks, Inc. | | | Kentucky Bancshares, Inc. | |
| | First Community Financial Partners, Inc. | | | ||
(1)
Financial data as of March 31, 2015.
The analysis compared publicly available financial information for Baylake and Nicolet with corresponding data for the Peer Group as of or for the twelve months ended June 30, 2015 (unless otherwise indicated), with pricing data as of September 2, 2015. The table below sets forth the data for Baylake and Nicolet, and the median, mean, high and low data for the Peer Group.
49
Comparable Company Analysis
| | | |
Baylake(1)
|
| |
Nicolet
|
| |
Peer
Group Median |
| |
Peer
Group Mean |
| |
Peer
Group High |
| |
Peer
Group Low |
| ||||||||||||||||||
|
Total assets (in millions)
|
| | | $ | 1,065 | | | | | $ | 1,185 | | | | | $ | 994 | | | | | $ | 1,042 | | | | | $ | 1,292 | | | | | $ | 853 | | |
|
Tangible common equity/Tangible assets
|
| | | | 9.90% | | | | | | 7.21% | | | | | | 9.67% | | | | | | 9.41% | | | | | | 11.91% | | | | | | 7.26% | | |
|
Leverage ratio
|
| | | | 11.13% | | | | | | 10.43% | | | | | | 9.92% | | | | | | 10.00% | | | | | | 11.90% | | | | | | 8.68% | | |
|
Total risk-based capital ratio
|
| | | | 15.22% | | | | | | 15.21% | | | | | | 15.26% | | | | | | 15.61% | | | | | | 21.84% | | | | | | 11.80% | | |
|
LTM Return on average assets
|
| | | | 0.94% | | | | | | 0.96% | | | | | | 0.97% | | | | | | 0.98% | | | | | | 1.18% | | | | | | 0.72% | | |
|
LTM Return on average equity
|
| | | | 9.6% | | | | | | 14.2% | | | | | | 10.8% | | | | | | 10.7% | | | | | | 13.0% | | | | | | 6.6% | | |
|
LTM Net interest margin
|
| | | | 3.69% | | | | | | 3.99% | | | | | | 3.35% | | | | | | 3.34% | | | | | | 3.79% | | | | | | 3.00% | | |
|
LTM Efficiency ratio
|
| | | | 66.3% | | | | | | 63.8% | | | | | | 65.4% | | | | | | 64.3% | | | | | | 74.4% | | | | | | 52.1% | | |
|
Loan loss reserves/Gross loans
|
| | | | 1.01% | | | | | | 1.10% | | | | | | 1.70% | | | | | | 1.55% | | | | | | 2.24% | | | | | | 0.38% | | |
|
Non-performing assets(2)/Total assets
|
| | | | 1.59% | | | | | | 0.75% | | | | | | 0.83% | | | | | | 1.12% | | | | | | 2.96% | | | | | | 0.27% | | |
|
Net charge-offs/Average loans
|
| | | | 0.03% | | | | | | 0.12% | | | | | | 0.14% | | | | | | 0.14% | | | | | | 0.35% | | | | | | (0.01)% | | |
|
Price/Tangible book value
|
| | | | 118% | | | | | | 157% | | | | | | 110% | | | | | | 116% | | | | | | 152% | | | | | | 85% | | |
|
Price/Book value
|
| | | | 109% | | | | | | 149% | | | | | | 107% | | | | | | 108% | | | | | | 133% | | | | | | 85% | | |
|
Price/LTM Earnings per share
|
| | | | 12.9x | | | | | | 13.1x | | | | | | 11.7x | | | | | | 11.8x | | | | | | 17.2x | | | | | | 7.1x | | |
|
Current Dividend Yield
|
| | | | 2.8% | | | | | | 0.0% | | | | | | 2.0% | | | | | | 1.8% | | | | | | 4.1% | | | | | | 0.0% | | |
|
LTM Dividend Ratio
|
| | | | 32.3% | | | | | | 0.0% | | | | | | 23.4% | | | | | | 25.3% | | | | | | 62.4% | | | | | | 0.0% | | |
|
Market value (in millions)
|
| | | $ | 119 | | | | | $ | 133 | | | | | $ | 117 | | | | | $ | 116 | | | | | $ | 171 | | | | | $ | 56 | | |
(1)
Baylake assets, capital ratios and pricing multiples pro forma for pending NEWBI Acquisition.
(2)
Nonperforming assets include nonaccrual loans and leases, renegotiated loans and leases and real estate owned.
Analysis of Selected Merger Transactions. Sandler O’Neill reviewed a group of recent merger and acquisition transactions consisting of nationwide bank and thrift transactions announced between January 1, 2013 and September 2, 2015, with deal values less than $1.0 billion and target pro forma ownership greater than 40% (the “Precedent Transactions”).
The Precedent Transactions group was composed of the following transactions:
|
Buyer
|
| |
Target
|
|
| Commerce Union Bancshares Inc. | | | Reliant Bank | |
| CB Financial Services Inc. | | | FedFirst Financial Corp. | |
| Yadkin Financial Corporation | | | VantageSouth Bancshares | |
| Center Bancorp Inc. | | | ConnectOne Bancorp Inc. | |
| Rockville Financial Inc. | | | United Financial Bancorp | |
| Heritage Financial Corp. | | | Washington Banking Co. | |
| Mercantile Bank Corp. | | | Firstbank Corp. | |
| Peoples Financial Services | | | Penseco Financial Services | |
| Union First Market Bkshs Corp. | | | StellarOne Corp. | |
| Provident New York Bancorp | | | Sterling Bancorp | |
Using then latest publicly available information prior to the announcement of the relevant transaction, Sandler O’Neill reviewed the following transaction metrics: transaction price to last-twelve-months earnings per share, transaction price to estimated earnings per share, transaction price to tangible book value per share, tangible book premium to core deposits, and one-day market premium. Sandler O’Neill compared
50
the indicated transaction metrics for the merger to the median, mean, high and low metrics of the Precedent Transactions group.
| | | |
Baylake /
Nicolet(1) |
| |
Median
Precedent Transactions |
| |
Mean
Precedent Transactions |
| |
High
Precedent Transactions |
| |
Low
Precedent Transactions |
| |||||||||||||||
|
Transaction price/LTM earnings per share
|
| | | | 15.6x | | | | | | 16.3x | | | | | | 17.9x | | | | | | 25.2x | | | | | | 13.9x | | |
|
Transaction price/Estimated earnings per share2:
|
| | | | 15.1x | | | | | | 17.0x | | | | | | 16.9x | | | | | | 19.6x | | | | | | 13.1x | | |
|
Transaction price/Tangible book value per share:
|
| | | | 147% | | | | | | 147% | | | | | | 147% | | | | | | 179% | | | | | | 107% | | |
|
Core deposit premium(3)
|
| | | | 6.7% | | | | | | 7.1% | | | | | | 7.0% | | | | | | 14.7% | | | | | | 2.4% | | |
|
One-Day market premium:
|
| | | | 20.5% | | | | | | 14.5% | | | | | | 15.4% | | | | | | 26.1% | | | | | | 5.2% | | |
(1)
Includes $0.40 per share special dividend to Baylake shareholders.
(2)
Based on median analyst earnings per share estimates as reported by FactSet. Estimated EPS data was not publicly available for the Commerce Union Bancshares Inc./Reliant Bank transaction, the CB Financial Services Inc./FedFirst Financial Corp. transaction, and the Peoples Financial Services/ Penseco Financial Services transaction.
(3)
Tangible book premium to core deposits calculated as (deal value – tangible equity)/(core deposits); core deposits defined as deposits, less time deposit accounts with balances over $100,000, foreign deposits and unclassified deposits.
Net Present Value Analyses. Sandler O’Neill performed an analysis that estimated the net present value per share of Baylake common stock, assuming Baylake performed in accordance with publicly available earnings per share estimates for Baylake for the years ending December 31, 2015 and December 31, 2016 and an estimated long-term annual balance sheet and earnings growth rate for the years thereafter as reviewed by the senior management of Baylake. To approximate the terminal value of Baylake common stock at December 31, 2019, Sandler O’Neill applied price to 2019 earnings multiples ranging from 9.0x to 14.0x and multiples of December 31, 2019 tangible book value ranging from 90% to 140%. The terminal values were then discounted to present values using different discount rates ranging from 10.0% to 16.0%, which were chosen to reflect different assumptions regarding required rates of return of holders or prospective buyers of Baylake common stock. As illustrated in the following tables, the analysis indicated an imputed range of values per share of Baylake common stock of $8.11 to $14.70 when applying multiples of earnings and $8.29 to $15.04 when applying multiples of tangible book value.
Baylake Earnings Per Share Multiples
|
Discount Rate
|
| |
9.0x
|
| |
10.0x
|
| |
11.0x
|
| |
12.0x
|
| |
13.0x
|
| |
14.0x
|
| ||||||||||||||||||
|
10.0%
|
| | | $ | 10.07 | | | | | $ | 11.00 | | | | | $ | 11.92 | | | | | $ | 12.85 | | | | | $ | 13.78 | | | | | $ | 14.70 | | |
|
11.0%
|
| | | $ | 9.70 | | | | | $ | 10.59 | | | | | $ | 11.48 | | | | | $ | 12.37 | | | | | $ | 13.26 | | | | | $ | 14.15 | | |
|
12.0%
|
| | | $ | 9.35 | | | | | $ | 10.21 | | | | | $ | 11.06 | | | | | $ | 11.92 | | | | | $ | 12.77 | | | | | $ | 13.63 | | |
|
13.0%
|
| | | $ | 9.02 | | | | | $ | 9.84 | | | | | $ | 10.66 | | | | | $ | 11.48 | | | | | $ | 12.30 | | | | | $ | 13.13 | | |
|
14.0%
|
| | | $ | 8.70 | | | | | $ | 9.49 | | | | | $ | 10.28 | | | | | $ | 11.07 | | | | | $ | 11.86 | | | | | $ | 12.65 | | |
|
15.0%
|
| | | $ | 8.40 | | | | | $ | 9.16 | | | | | $ | 9.92 | | | | | $ | 10.68 | | | | | $ | 11.43 | | | | | $ | 12.19 | | |
|
16.0%
|
| | | $ | 8.11 | | | | | $ | 8.84 | | | | | $ | 9.57 | | | | | $ | 10.30 | | | | | $ | 11.03 | | | | | $ | 11.76 | | |
51
Baylake Tangible Book Value Multiples
|
Discount Rate
|
| |
90%
|
| |
100%
|
| |
110%
|
| |
120%
|
| |
130%
|
| |
140%
|
| ||||||||||||||||||
|
10.0%
|
| | | $ | 10.29 | | | | | $ | 11.24 | | | | | $ | 12.19 | | | | | $ | 13.14 | | | | | $ | 14.09 | | | | | $ | 15.04 | | |
|
11.0%
|
| | | $ | 9.91 | | | | | $ | 10.83 | | | | | $ | 11.74 | | | | | $ | 12.65 | | | | | $ | 13.56 | | | | | $ | 14.48 | | |
|
12.0%
|
| | | $ | 9.56 | | | | | $ | 10.43 | | | | | $ | 11.31 | | | | | $ | 12.19 | | | | | $ | 13.06 | | | | | $ | 13.94 | | |
|
13.0%
|
| | | $ | 9.22 | | | | | $ | 10.06 | | | | | $ | 10.90 | | | | | $ | 11.74 | | | | | $ | 12.58 | | | | | $ | 13.43 | | |
|
14.0%
|
| | | $ | 8.89 | | | | | $ | 9.70 | | | | | $ | 10.51 | | | | | $ | 11.32 | | | | | $ | 12.13 | | | | | $ | 12.94 | | |
|
15.0%
|
| | | $ | 8.58 | | | | | $ | 9.36 | | | | | $ | 10.14 | | | | | $ | 10.92 | | | | | $ | 11.69 | | | | | $ | 12.47 | | |
|
16.0%
|
| | | $ | 8.29 | | | | | $ | 9.03 | | | | | $ | 9.78 | | | | | $ | 10.53 | | | | | $ | 11.28 | | | | | $ | 12.03 | | |
Sandler O’Neill also considered and discussed with the Baylake board of directors how this analysis would be affected by changes in the underlying assumptions, including variations with respect to net income. To illustrate this impact, Sandler O’Neill performed a similar analysis, assuming Baylake’s net income varied from 25% above estimates to 25% below estimates. This analysis resulted in the following range of per share values for Baylake common stock, applying the price to 2019 earnings multiples range of 9.0x to 14.0x referred to above and a discount rate of 13.00%.
Baylake Earnings Per Share Multiples
|
Annual Estimate Variance
|
| |
9.0x
|
| |
10.0x
|
| |
11.0x
|
| |
12.0x
|
| |
13.0x
|
| |
14.0x
|
| ||||||||||||||||||
|
(25.0)%
|
| | | $ | 7.17 | | | | | $ | 7.79 | | | | | $ | 8.40 | | | | | $ | 9.02 | | | | | $ | 9.64 | | | | | $ | 10.25 | | |
|
(20.0)%
|
| | | $ | 7.54 | | | | | $ | 8.20 | | | | | $ | 8.85 | | | | | $ | 9.51 | | | | | $ | 10.17 | | | | | $ | 10.83 | | |
|
(15.0)%
|
| | | $ | 7.91 | | | | | $ | 8.61 | | | | | $ | 9.31 | | | | | $ | 10.00 | | | | | $ | 10.70 | | | | | $ | 11.40 | | |
|
(10.0)%
|
| | | $ | 8.28 | | | | | $ | 9.02 | | | | | $ | 9.76 | | | | | $ | 10.50 | | | | | $ | 11.24 | | | | | $ | 11.98 | | |
|
(5.0)%
|
| | | $ | 8.65 | | | | | $ | 9.43 | | | | | $ | 10.21 | | | | | $ | 10.99 | | | | | $ | 11.77 | | | | | $ | 12.55 | | |
|
0.0%
|
| | | $ | 9.02 | | | | | $ | 9.84 | | | | | $ | 10.66 | | | | | $ | 11.48 | | | | | $ | 12.30 | | | | | $ | 13.13 | | |
|
5.0%
|
| | | $ | 9.39 | | | | | $ | 10.25 | | | | | $ | 11.11 | | | | | $ | 11.98 | | | | | $ | 12.84 | | | | | $ | 13.70 | | |
|
10.0%
|
| | | $ | 9.76 | | | | | $ | 10.66 | | | | | $ | 11.57 | | | | | $ | 12.47 | | | | | $ | 13.37 | | | | | $ | 14.28 | | |
|
15.0%
|
| | | $ | 10.13 | | | | | $ | 11.07 | | | | | $ | 12.02 | | | | | $ | 12.96 | | | | | $ | 13.91 | | | | | $ | 14.85 | | |
|
20.0%
|
| | | $ | 10.50 | | | | | $ | 11.48 | | | | | $ | 12.47 | | | | | $ | 13.45 | | | | | $ | 14.44 | | | | | $ | 15.43 | | |
|
25.0%
|
| | | $ | 10.87 | | | | | $ | 11.89 | | | | | $ | 12.92 | | | | | $ | 13.95 | | | | | $ | 14.97 | | | | | $ | 16.00 | | |
Sandler O’Neill also performed an analysis that estimated the net present value per share of Nicolet common stock, assuming that Nicolet performed in accordance with internal financial projections for Nicolet for the years ending December 31, 2015 through December 31, 2017, as reviewed with and confirmed by the senior management of Nicolet and an estimated long-term annual growth rate for the years thereafter, taking into account the Nicolet Preferred Stock Redemption. To approximate the terminal value of Nicolet common stock at December 31, 2019, Sandler O’Neill applied price to 2019 earnings multiples ranging from 9.0x to 14.0x and multiples of December 31, 2019 tangible book value ranging from 90% to 140%. The terminal values were then discounted to present values using different discount rates ranging from 10.0% to 16.0%, which were chosen to reflect different assumptions regarding required rates of return of holders or prospective buyers of Nicolet common stock. As illustrated in the following tables, the analysis indicated an imputed range of values per share of Nicolet common stock of $13.83 to $27.33 when applying earnings multiples and $16.49 to $32.57 when applying multiples of tangible book value.
Nicolet Earnings Per Share Multiples
|
Discount Rate
|
| |
9.0x
|
| |
10.0x
|
| |
11.0x
|
| |
12.0x
|
| |
13.0x
|
| |
14.0x
|
| ||||||||||||||||||
|
10.0%
|
| | | $ | 17.57 | | | | | $ | 19.52 | | | | | $ | 21.47 | | | | | $ | 23.43 | | | | | $ | 25.38 | | | | | $ | 27.33 | | |
|
11.0%
|
| | | $ | 16.87 | | | | | $ | 18.74 | | | | | $ | 20.62 | | | | | $ | 22.49 | | | | | $ | 24.37 | | | | | $ | 26.24 | | |
|
12.0%
|
| | | $ | 16.20 | | | | | $ | 18.00 | | | | | $ | 19.80 | | | | | $ | 21.60 | | | | | $ | 23.40 | | | | | $ | 25.20 | | |
|
13.0%
|
| | | $ | 15.57 | | | | | $ | 17.30 | | | | | $ | 19.02 | | | | | $ | 20.75 | | | | | $ | 22.48 | | | | | $ | 24.21 | | |
|
14.0%
|
| | | $ | 14.96 | | | | | $ | 16.62 | | | | | $ | 18.29 | | | | | $ | 19.95 | | | | | $ | 21.61 | | | | | $ | 23.27 | | |
|
15.0%
|
| | | $ | 14.38 | | | | | $ | 15.98 | | | | | $ | 17.58 | | | | | $ | 19.18 | | | | | $ | 20.78 | | | | | $ | 22.38 | | |
|
16.0%
|
| | | $ | 13.83 | | | | | $ | 15.37 | | | | | $ | 16.91 | | | | | $ | 18.45 | | | | | $ | 19.98 | | | | | $ | 21.52 | | |
52
Nicolet Tangible Book Value Multiples
|
Discount Rate
|
| |
90%
|
| |
100%
|
| |
110%
|
| |
120%
|
| |
130%
|
| |
140%
|
| ||||||||||||||||||
|
10.0%
|
| | | $ | 20.94 | | | | | $ | 23.27 | | | | | $ | 25.59 | | | | | $ | 27.92 | | | | | $ | 30.25 | | | | | $ | 32.57 | | |
|
11.0%
|
| | | $ | 20.10 | | | | | $ | 22.34 | | | | | $ | 24.57 | | | | | $ | 26.81 | | | | | $ | 29.04 | | | | | $ | 31.27 | | |
|
12.0%
|
| | | $ | 19.31 | | | | | $ | 21.45 | | | | | $ | 23.60 | | | | | $ | 25.75 | | | | | $ | 27.89 | | | | | $ | 30.04 | | |
|
13.0%
|
| | | $ | 18.55 | | | | | $ | 20.61 | | | | | $ | 22.68 | | | | | $ | 24.74 | | | | | $ | 26.80 | | | | | $ | 28.86 | | |
|
14.0%
|
| | | $ | 17.83 | | | | | $ | 19.81 | | | | | $ | 21.79 | | | | | $ | 23.77 | | | | | $ | 25.76 | | | | | $ | 27.74 | | |
|
15.0%
|
| | | $ | 17.14 | | | | | $ | 19.05 | | | | | $ | 20.95 | | | | | $ | 22.86 | | | | | $ | 24.76 | | | | | $ | 26.67 | | |
|
16.0%
|
| | | $ | 16.49 | | | | | $ | 18.32 | | | | | $ | 20.15 | | | | | $ | 21.99 | | | | | $ | 23.82 | | | | | $ | 25.65 | | |
Sandler O’Neill also considered and discussed with the Baylake board of directors how this analysis would be affected by changes in the underlying assumptions, including variations with respect to net income. To illustrate this impact, Sandler O’Neill performed a similar analysis assuming Nicolet’s net income varied from 25% above estimates to 25% below estimates. This analysis resulted in the following range of per share values for Nicolet common stock, applying the price to 2019 earnings multiples range of 9.0x to 14.0x referred to above and a discount rate of 13.00%.
Nicolet Earnings Per Share Multiples
|
Annual Estimate Variance
|
| |
9.0x
|
| |
10.0x
|
| |
11.0x
|
| |
12.0x
|
| |
13.0x
|
| |
14.0x
|
| ||||||||||||||||||
|
(25.0)%
|
| | | $ | 11.67 | | | | | $ | 12.97 | | | | | $ | 14.27 | | | | | $ | 15.57 | | | | | $ | 16.86 | | | | | $ | 18.16 | | |
|
(20.0)%
|
| | | $ | 12.45 | | | | | $ | 13.84 | | | | | $ | 15.22 | | | | | $ | 16.60 | | | | | $ | 17.99 | | | | | $ | 19.37 | | |
|
(15.0)%
|
| | | $ | 13.23 | | | | | $ | 14.70 | | | | | $ | 16.17 | | | | | $ | 17.64 | | | | | $ | 19.11 | | | | | $ | 20.58 | | |
|
(10.0)%
|
| | | $ | 14.01 | | | | | $ | 15.57 | | | | | $ | 17.12 | | | | | $ | 18.68 | | | | | $ | 20.24 | | | | | $ | 21.79 | | |
|
(5.0)%
|
| | | $ | 14.79 | | | | | $ | 16.43 | | | | | $ | 18.07 | | | | | $ | 19.72 | | | | | $ | 21.36 | | | | | $ | 23.00 | | |
|
0.0%
|
| | | $ | 15.57 | | | | | $ | 17.30 | | | | | $ | 19.02 | | | | | $ | 20.75 | | | | | $ | 22.48 | | | | | $ | 24.21 | | |
|
5.0%
|
| | | $ | 16.34 | | | | | $ | 18.16 | | | | | $ | 19.98 | | | | | $ | 21.79 | | | | | $ | 23.61 | | | | | $ | 25.42 | | |
|
10.0%
|
| | | $ | 17.12 | | | | | $ | 19.02 | | | | | $ | 20.93 | | | | | $ | 22.83 | | | | | $ | 24.73 | | | | | $ | 26.63 | | |
|
15.0%
|
| | | $ | 17.90 | | | | | $ | 19.89 | | | | | $ | 21.88 | | | | | $ | 23.87 | | | | | $ | 25.86 | | | | | $ | 27.85 | | |
|
20.0%
|
| | | $ | 18.68 | | | | | $ | 20.75 | | | | | $ | 22.83 | | | | | $ | 24.91 | | | | | $ | 26.98 | | | | | $ | 29.06 | | |
|
25.0%
|
| | | $ | 19.46 | | | | | $ | 21.62 | | | | | $ | 23.78 | | | | | $ | 25.94 | | | | | $ | 28.10 | | | | | $ | 30.27 | | |
In connection with its analyses, Sandler O’Neill considered and discussed with the Baylake board of directors how the present value analyses would be affected by changes in the underlying assumptions. Sandler O’Neill noted that the net present value analysis is a widely used valuation methodology, but the results of such methodology are highly dependent upon the numerous assumptions that must be made, and the results thereof are not necessarily indicative of actual values or future results.
Pro Forma Merger Analysis. Sandler O’Neill analyzed certain potential pro forma effects of the merger, based on the following assumptions: (i) the merger closes in the second calendar quarter of 2016; (ii) 100% of the outstanding shares of Baylake common stock are converted into the stock consideration at the exchange ratio of 0.4517; and (iii) all outstanding Baylake stock options will convert into Nicolet options in accordance with the merger agreement. Sandler O’Neill also utilized the following: (a) estimated earnings per share for Nicolet, for the years ending December 31, 2015 through December 31, 2017, as reviewed with and confirmed by the senior management of Nicolet and an estimated long-term annual growth rate for the years thereafter, taking into account the Nicolet Preferred Stock Redemption; (b) estimated earnings per share for Baylake, for the years ending December 31, 2015 and December 31, 2016 and an estimated long-term annual balance sheet and earnings growth rate for the years thereafter as reviewed and confirmed by the senior management of Baylake; (c) purchase accounting adjustments, including of a credit mark on loans, provided by Baylake management; (d) estimated cost savings provided by Baylake management; (e) pre-tax one-time transaction costs and expenses estimates provided by Baylake management; and (f) the terms of the Nicolet Preferred Stock Redemption as provided by the senior management of Nicolet. The analysis indicated that the merger would be accretive to Nicolet’s estimated earnings per share (excluding one-time transaction costs and expenses) in 2016 and dilutive to estimated tangible book value per share at close and at the year-end of 2016.
53
In connection with this analysis, Sandler O’Neill considered and discussed with the Baylake board of directors how the analysis would be affected by changes in the underlying assumptions, including the impact of final purchase accounting adjustments determined at the closing of the transaction, and noted that the actual results achieved by the combined company may vary from projected results and the variations may be material.
Pro Forma Comparable Company Analysis. Sandler O’Neill used publicly available information to compare selected financial information for a group of financial institutions selected by Sandler O’Neill as a peer group for the pro forma company following the closing of the merger. The pro forma peer group consisted of public banks and thrifts headquartered in the Midwest with assets between $2.0 billion and $3.5 billion, excluding announced merger targets, with non-performing assets/total assets less than 2.50% and last-twelve-months return on average assets greater than 0.75% (the “Pro Forma Peer Group”). The Pro Forma Peer Group consisted of the following companies:
| | Enterprise Financial Services Corp. | | | Stock Yards Bancorp, Inc. | |
| | MainSource Financial Group, Inc. | | | Meta Financial Group, Inc. | |
| | First Financial Corporation | | | German American Bancorp, Inc. | |
| | MidWestOne Financial Group, Inc. | | | Horizon Bancorp | |
| | Mercantile Bank Corporation | | | First Defiance Financial Corp. | |
The analysis compared publicly available financial information for the Pro Forma Peer Group as of or for the twelve months ended June 30, 2015 (unless otherwise indicated), with pricing data as of September 2, 2015. The table below sets forth the data for the median, mean, high and low data for the Pro Forma Peer Group.
Pro Forma Comparable Company Analysis
| | | |
Pro Forma
Peer Group Median |
| |
Pro Forma
Peer Group Mean |
| |
Pro Forma
Peer Group High |
| |
Pro Forma
Peer Group Low |
| ||||||||||||
|
Total assets (in millions)
|
| | | $ | 2,679 | | | | | $ | 2,685 | | | | | $ | 3,371 | | | | | $ | 2,197 | | |
|
Tangible common equity/Tangible assets
|
| | | | 9.31% | | | | | | 9.26% | | | | | | 12.15% | | | | | | 7.00% | | |
|
Leverage ratio
|
| | | | 10.47% | | | | | | 10.56% | | | | | | 12.62% | | | | | | 8.91% | | |
|
Total risk-based capital ratio
|
| | | | 13.99% | | | | | | 14.81% | | | | | | 20.68% | | | | | | 11.34% | | |
|
LTM Return on average assets
|
| | | | 1.02% | | | | | | 1.07% | | | | | | 1.49% | | | | | | 0.76% | | |
|
LTM Return on average equity
|
| | | | 11.8% | | | | | | 11.9% | | | | | | 14.9% | | | | | | 9.0% | | |
|
LTM Net interest margin
|
| | | | 3.78% | | | | | | 3.75% | | | | | | 4.09% | | | | | | 2.91% | | |
|
LTM Efficiency ratio
|
| | | | 61.7% | | | | | | 62.1% | | | | | | 73.4% | | | | | | 55.6% | | |
|
Loan loss reserves/Gross loans
|
| | | | 1.09% | | | | | | 1.12% | | | | | | 1.65% | | | | | | 0.76% | | |
|
Non-performing assets(1)/Total assets
|
| | | | 0.69% | | | | | | 0.81% | | | | | | 2.02% | | | | | | 0.32% | | |
|
Net charge-offs/Average loans
|
| | | | 0.11% | | | | | | 0.21% | | | | | | 0.72% | | | | | | (0.02)% | | |
|
Price/Tangible book value
|
| | | | 159% | | | | | | 154% | | | | | | 190% | | | | | | 116% | | |
|
Price/LTM Earnings per share
|
| | | | 13.6x | | | | | | 13.8x | | | | | | 16.7x | | | | | | 11.5x | | |
|
Current Dividend Yield
|
| | | | 2.4% | | | | | | 2.3% | | | | | | 3.0% | | | | | | 1.2% | | |
|
LTM Dividend Ratio
|
| | | | 29.1% | | | | | | 28.8% | | | | | | 39.8% | | | | | | 13.6% | | |
|
Market value (in millions)
|
| | | $ | 362 | | | | | $ | 382 | | | | | $ | 513 | | | | | $ | 272 | | |
(1)
Nonperforming assets include nonaccrual loans and leases, renegotiated loans and leases and real estate owned.
Pro Forma Net Present Value Analyses. Sandler O’Neill performed an analysis that estimated the net present value per share of the pro forma company following the closing of the merger, assuming the pro forma company performed in accordance with earnings per share estimates for both Baylake and Nicolet and pro forma merger adjustments, as noted above under the heading Pro Forma Merger Analysis. To approximate the terminal value of the pro forma company’s common stock at December 31, 2019, Sandler
54
O’Neill applied price to 2019 earnings multiples ranging from 12.0x to 17.0x and multiples of December 31, 2019 tangible book value ranging from 130% to 180%. The terminal values were then discounted to present values using different discount rates ranging from 10.0% to 16.0%, which were chosen to reflect different assumptions regarding required rates of return of holders or prospective buyers of the pro forma company’s common stock. As illustrated in the following tables, the analysis indicated an imputed range of values per share of the pro forma company’s common stock of $22.54 to $40.55 when applying multiples of earnings and $24.39 to $42.89 when applying multiples of tangible book value.
Baylake Earnings Per Share Multiples
|
Discount Rate
|
| |
12.0x
|
| |
13.0x
|
| |
14.0x
|
| |
15.0x
|
| |
16.0x
|
| |
17.0x
|
| ||||||||||||||||||
|
10.0%
|
| | | $ | 28.63 | | | | | $ | 31.01 | | | | | $ | 33.40 | | | | | $ | 35.78 | | | | | $ | 38.17 | | | | | $ | 40.55 | | |
|
11.0%
|
| | | $ | 27.48 | | | | | $ | 29.77 | | | | | $ | 32.06 | | | | | $ | 34.35 | | | | | $ | 36.64 | | | | | $ | 38.93 | | |
|
12.0%
|
| | | $ | 26.40 | | | | | $ | 28.60 | | | | | $ | 30.80 | | | | | $ | 32.99 | | | | | $ | 35.19 | | | | | $ | 37.39 | | |
|
13.0%
|
| | | $ | 25.36 | | | | | $ | 27.47 | | | | | $ | 29.59 | | | | | $ | 31.70 | | | | | $ | 33.81 | | | | | $ | 35.93 | | |
|
14.0%
|
| | | $ | 24.38 | | | | | $ | 26.41 | | | | | $ | 28.44 | | | | | $ | 30.47 | | | | | $ | 32.50 | | | | | $ | 34.53 | | |
|
15.0%
|
| | | $ | 23.44 | | | | | $ | 25.39 | | | | | $ | 27.34 | | | | | $ | 29.29 | | | | | $ | 31.25 | | | | | $ | 33.20 | | |
|
16.0%
|
| | | $ | 22.54 | | | | | $ | 24.42 | | | | | $ | 26.30 | | | | | $ | 28.18 | | | | | $ | 30.05 | | | | | $ | 31.93 | | |
Baylake Tangible Book Value Multiples
|
Discount Rate
|
| |
130%
|
| |
140%
|
| |
150%
|
| |
160%
|
| |
170%
|
| |
180%
|
| ||||||||||||||||||
|
10.0%
|
| | | $ | 30.98 | | | | | $ | 33.36 | | | | | $ | 35.74 | | | | | $ | 38.12 | | | | | $ | 40.51 | | | | | $ | 42.89 | | |
|
11.0%
|
| | | $ | 29.74 | | | | | $ | 32.03 | | | | | $ | 34.31 | | | | | $ | 36.60 | | | | | $ | 38.89 | | | | | $ | 41.18 | | |
|
12.0%
|
| | | $ | 28.56 | | | | | $ | 30.76 | | | | | $ | 32.96 | | | | | $ | 35.15 | | | | | $ | 37.35 | | | | | $ | 39.55 | | |
|
13.0%
|
| | | $ | 27.44 | | | | | $ | 29.55 | | | | | $ | 31.66 | | | | | $ | 33.78 | | | | | $ | 35.89 | | | | | $ | 38.00 | | |
|
14.0%
|
| | | $ | 26.38 | | | | | $ | 28.41 | | | | | $ | 30.43 | | | | | $ | 32.46 | | | | | $ | 34.49 | | | | | $ | 36.52 | | |
|
15.0%
|
| | | $ | 25.36 | | | | | $ | 27.31 | | | | | $ | 29.26 | | | | | $ | 31.21 | | | | | $ | 33.16 | | | | | $ | 35.11 | | |
|
16.0%
|
| | | $ | 24.39 | | | | | $ | 26.27 | | | | | $ | 28.14 | | | | | $ | 30.02 | | | | | $ | 31.90 | | | | | $ | 33.77 | | |
Sandler O’Neill also considered and discussed with the Baylake Board of Directors how this analysis would be affected by changes in the underlying assumptions, including variations with respect to net income. To illustrate this impact, Sandler O’Neill performed a similar analysis assuming the pro forma company’s net income varied from 25% above estimates to 25% below estimates. This analysis resulted in the following range of per share values for the pro forma company’s common stock, applying the price to 2019 earnings multiples range of 12.0x to 17.0x referred to above and a discount rate of 13.00%.
Baylake Earnings Per Share Multiples
|
Annual Estimate Variance
|
| |
12.0x
|
| |
13.0x
|
| |
14.0x
|
| |
15.0x
|
| |
16.0x
|
| |
17.0x
|
| ||||||||||||||||||
|
(25.0)%
|
| | | $ | 19.02 | | | | | $ | 20.61 | | | | | $ | 22.19 | | | | | $ | 23.78 | | | | | $ | 25.36 | | | | | $ | 26.95 | | |
|
(20.0)%
|
| | | $ | 20.29 | | | | | $ | 21.98 | | | | | $ | 23.67 | | | | | $ | 25.36 | | | | | $ | 27.05 | | | | | $ | 28.74 | | |
|
(15.0)%
|
| | | $ | 21.56 | | | | | $ | 23.35 | | | | | $ | 25.15 | | | | | $ | 26.95 | | | | | $ | 28.74 | | | | | $ | 30.54 | | |
|
(10.0)%
|
| | | $ | 22.82 | | | | | $ | 24.73 | | | | | $ | 26.63 | | | | | $ | 28.53 | | | | | $ | 30.43 | | | | | $ | 32.34 | | |
|
(5.0)%
|
| | | $ | 24.09 | | | | | $ | 26.10 | | | | | $ | 28.11 | | | | | $ | 30.12 | | | | | $ | 32.12 | | | | | $ | 34.13 | | |
|
0.0%
|
| | | $ | 25.36 | | | | | $ | 27.47 | | | | | $ | 29.59 | | | | | $ | 31.70 | | | | | $ | 33.81 | | | | | $ | 35.93 | | |
|
5.0%
|
| | | $ | 26.63 | | | | | $ | 28.85 | | | | | $ | 31.07 | | | | | $ | 33.29 | | | | | $ | 35.51 | | | | | $ | 37.72 | | |
|
10.0%
|
| | | $ | 27.90 | | | | | $ | 30.22 | | | | | $ | 32.55 | | | | | $ | 34.87 | | | | | $ | 37.20 | | | | | $ | 39.52 | | |
|
15.0%
|
| | | $ | 29.16 | | | | | $ | 31.60 | | | | | $ | 34.03 | | | | | $ | 36.46 | | | | | $ | 38.89 | | | | | $ | 41.32 | | |
|
20.0%
|
| | | $ | 30.43 | | | | | $ | 32.97 | | | | | $ | 35.51 | | | | | $ | 38.04 | | | | | $ | 40.58 | | | | | $ | 43.11 | | |
|
25.0%
|
| | | $ | 31.70 | | | | | $ | 34.34 | | | | | $ | 36.98 | | | | | $ | 39.63 | | | | | $ | 42.27 | | | | | $ | 44.91 | | |
Sandler O’Neill also performed an analysis that estimated the net present value per share of the shares issued to Baylake as a result of the merger with Nicolet, assuming the pro forma company performed in accordance with earnings per share estimates and pro forma merger adjustments, as noted above under the
55
heading Pro Forma Merger Analysis. The Baylake equivalent pro forma net present value per share was calculated by multiplying Nicolet’s pro forma net present value per share by the exchange ratio, plus the Baylake Special Dividend equal to $0.40 per share. To approximate the terminal value of Baylake equivalent pro forma common stock at December 31, 2019, Sandler O’Neill applied price to 2019 earnings multiples ranging from 12.0x to 17.0x and multiples of December 31, 2019 tangible book value ranging from 130% to 180%. The terminal values were then discounted to present values using different discount rates ranging from 10.0% to 16.0%, which were chosen to reflect different assumptions regarding required rates of return of holders or prospective buyers of Baylake equivalent pro forma common stock. As illustrated in the following tables, the analysis indicated an imputed range of values per share of Baylake equivalent pro forma common stock of $10.58 to $18.72 when applying earnings multiples and $11.42 to $19.77 when applying multiples of tangible book value.
Nicolet Earnings Per Share Multiples
|
Discount Rate
|
| |
12.0x
|
| |
13.0x
|
| |
14.0x
|
| |
15.0x
|
| |
16.0x
|
| |
17.0x
|
| ||||||||||||||||||
|
10.0%
|
| | | $ | 13.33 | | | | | $ | 14.41 | | | | | $ | 15.49 | | | | | $ | 16.56 | | | | | $ | 17.64 | | | | | $ | 18.72 | | |
|
11.0%
|
| | | $ | 12.81 | | | | | $ | 13.85 | | | | | $ | 14.88 | | | | | $ | 15.92 | | | | | $ | 16.95 | | | | | $ | 17.99 | | |
|
12.0%
|
| | | $ | 12.32 | | | | | $ | 13.32 | | | | | $ | 14.31 | | | | | $ | 15.30 | | | | | $ | 16.30 | | | | | $ | 17.29 | | |
|
13.0%
|
| | | $ | 11.86 | | | | | $ | 12.81 | | | | | $ | 13.76 | | | | | $ | 14.72 | | | | | $ | 15.67 | | | | | $ | 16.63 | | |
|
14.0%
|
| | | $ | 11.41 | | | | | $ | 12.33 | | | | | $ | 13.25 | | | | | $ | 14.16 | | | | | $ | 15.08 | | | | | $ | 16.00 | | |
|
15.0%
|
| | | $ | 10.99 | | | | | $ | 11.87 | | | | | $ | 12.75 | | | | | $ | 13.63 | | | | | $ | 14.51 | | | | | $ | 15.40 | | |
|
16.0%
|
| | | $ | 10.58 | | | | | $ | 11.43 | | | | | $ | 12.28 | | | | | $ | 13.13 | | | | | $ | 13.98 | | | | | $ | 14.82 | | |
Nicolet Tangible Book Value Multiples
|
Discount Rate
|
| |
130%
|
| |
140%
|
| |
150%
|
| |
160%
|
| |
170%
|
| |
180%
|
| ||||||||||||||||||
|
10.0%
|
| | | $ | 14.39 | | | | | $ | 15.47 | | | | | $ | 16.54 | | | | | $ | 17.62 | | | | | $ | 18.70 | | | | | $ | 19.77 | | |
|
11.0%
|
| | | $ | 13.83 | | | | | $ | 14.87 | | | | | $ | 15.90 | | | | | $ | 16.93 | | | | | $ | 17.97 | | | | | $ | 19.00 | | |
|
12.0%
|
| | | $ | 13.30 | | | | | $ | 14.29 | | | | | $ | 15.29 | | | | | $ | 16.28 | | | | | $ | 17.27 | | | | | $ | 18.26 | | |
|
13.0%
|
| | | $ | 12.80 | | | | | $ | 13.75 | | | | | $ | 14.70 | | | | | $ | 15.66 | | | | | $ | 16.61 | | | | | $ | 17.56 | | |
|
14.0%
|
| | | $ | 12.31 | | | | | $ | 13.23 | | | | | $ | 14.15 | | | | | $ | 15.06 | | | | | $ | 15.98 | | | | | $ | 16.90 | | |
|
15.0%
|
| | | $ | 11.85 | | | | | $ | 12.74 | | | | | $ | 13.62 | | | | | $ | 14.50 | | | | | $ | 15.38 | | | | | $ | 16.26 | | |
|
16.0%
|
| | | $ | 11.42 | | | | | $ | 12.26 | | | | | $ | 13.11 | | | | | $ | 13.96 | | | | | $ | 14.81 | | | | | $ | 15.65 | | |
Sandler O’Neill also considered and discussed with the Baylake board of directors how this analysis would be affected by changes in the underlying assumptions, including variations with respect to net income. To illustrate this impact, Sandler O’Neill performed a similar analysis assuming Baylake equivalent pro forma net income varied from 25% above estimates to 25% below estimates. This analysis resulted in the following range of per share values for Baylake equivalent pro forma common stock, applying the price to 2019 earnings multiples range of 12.0x to 17.0x referred to above and a discount rate of 13.00%.
Nicolet Earnings Per Share Multiples
|
Annual Estimate Variance
|
| |
12.0x
|
| |
13.0x
|
| |
14.0x
|
| |
15.0x
|
| |
16.0x
|
| |
17.0x
|
| ||||||||||||||||||
|
(25.0)%
|
| | | $ | 8.99 | | | | | $ | 9.71 | | | | | $ | 10.42 | | | | | $ | 11.14 | | | | | $ | 11.86 | | | | | $ | 12.57 | | |
|
(20.0)%
|
| | | $ | 9.56 | | | | | $ | 10.33 | | | | | $ | 11.09 | | | | | $ | 11.86 | | | | | $ | 12.62 | | | | | $ | 13.38 | | |
|
(15.0)%
|
| | | $ | 10.14 | | | | | $ | 10.95 | | | | | $ | 11.76 | | | | | $ | 12.57 | | | | | $ | 13.38 | | | | | $ | 14.19 | | |
|
(10.0)%
|
| | | $ | 10.71 | | | | | $ | 11.57 | | | | | $ | 12.43 | | | | | $ | 13.29 | | | | | $ | 14.15 | | | | | $ | 15.01 | | |
|
(5.0)%
|
| | | $ | 11.28 | | | | | $ | 12.19 | | | | | $ | 13.10 | | | | | $ | 14.00 | | | | | $ | 14.91 | | | | | $ | 15.82 | | |
|
0.0%
|
| | | $ | 11.86 | | | | | $ | 12.81 | | | | | $ | 13.76 | | | | | $ | 14.72 | | | | | $ | 15.67 | | | | | $ | 16.63 | | |
|
5.0%
|
| | | $ | 12.43 | | | | | $ | 13.43 | | | | | $ | 14.43 | | | | | $ | 15.44 | | | | | $ | 16.44 | | | | | $ | 17.44 | | |
|
10.0%
|
| | | $ | 13.00 | | | | | $ | 14.05 | | | | | $ | 15.10 | | | | | $ | 16.15 | | | | | $ | 17.20 | | | | | $ | 18.25 | | |
|
15.0%
|
| | | $ | 13.57 | | | | | $ | 14.67 | | | | | $ | 15.77 | | | | | $ | 16.87 | | | | | $ | 17.97 | | | | | $ | 19.06 | | |
|
20.0%
|
| | | $ | 14.15 | | | | | $ | 15.29 | | | | | $ | 16.44 | | | | | $ | 17.58 | | | | | $ | 18.73 | | | | | $ | 19.87 | | |
|
25.0%
|
| | | $ | 14.72 | | | | | $ | 15.91 | | | | | $ | 17.11 | | | | | $ | 18.30 | | | | | $ | 19.49 | | | | | $ | 20.69 | | |
56
In connection with its analyses, Sandler O’Neill considered and discussed with the Baylake Board of Directors how the present value analyses would be affected by changes in the underlying assumptions. Sandler O’Neill noted that the net present value analysis is a widely used valuation methodology, but the results of such methodology are highly dependent upon the numerous assumptions that must be made, and the results thereof are not necessarily indicative of actual values or future results.
Sandler O’Neill’s Relationship. Sandler O’Neill is acting as Baylake’s financial advisor in connection with the merger and a significant portion of Sandler O’Neill’s fee of $1,250,000 is contingent upon the closing of the merger. $150,000 of this total fee became payable upon Sandler O’Neill’s rendering of its opinion; the remaining portion of the fee will become payable on the day of closing of the merger. Baylake has also agreed to indemnify Sandler O’Neill against certain liabilities arising out of Sandler O’Neill’s engagement and to reimburse us for certain of our out-of-pocket expenses incurred in connection with our engagement.
Sandler O’Neill has historically provided certain investment banking services to Nicolet and received fees for such services. In the three years preceding the date of its opinion, Sandler O’Neill received a total of $480,000 in connection with Nicolet’s merger with Mid-Wisconsin Financial Services, Inc., including $325,000 as compensation for Sandler O’Neill acting as financial advisor to Nicolet, $150,000 for the preparation of Sandler O’Neill’s fairness opinion, and $5,000 as reimbursement of expenses. Sandler O’Neill may provide, and receive compensation for, investment banking services for Nicolet in the future, including during the pendency of the merger. In addition, in the ordinary course of Sandler O’Neill’s business as a broker-dealer, Sandler O’Neill may purchase securities from and sell securities to Baylake and Nicolet and their respective affiliates. Sandler O’Neill may also actively trade the equity and debt securities of Baylake, Nicolet or their affiliates for its own account and for the accounts of its customers and, accordingly, may at any time hold a long or short position in such securities.
Prospective Financial Information
Certain Unaudited Prospective Financial Information of Nicolet
Nicolet does not as a matter of course make public projections as to future sales, earnings, or other results. However, the management of Nicolet has prepared the prospective financial information set forth in this joint proxy statement-prospectus to present certain unaudited prospective financial information regarding Nicolet’s future operations for the years 2015 – 2017 (which we refer to in this joint proxy statement-prospectus as the “Nicolet projections”). The accompanying prospective financial information was not prepared with a view toward public disclosure or with a view toward complying with the guidelines established by the American Institute of Certified Public Accountants with respect to prospective financial information, but, in the view of the Nicolet’s management, was prepared on a reasonable basis, reflects the best currently available estimates and judgments, and presents, to the best of management’s knowledge and belief, the expected course of action and the expected future financial performance of Nicolet. However, this information is not fact and should not be relied upon as being necessarily indicative of actual future results, and readers of this joint proxy statement-prospectus are cautioned not to place undue reliance on the prospective financial information.
Neither Nicolet’s independent auditors, nor any other independent accountants, have compiled, examined, or performed any procedures with respect to the prospective financial information contained herein, nor have they expressed any opinion or any other form of assurance on such information or its achievability, and assume no responsibility for, and disclaim any association with, the prospective financial information.
The Nicolet projections, which were prepared by management of Nicolet, were prepared solely for internal use and are subjective in many respects. The Nicolet projections reflect numerous estimates and assumptions made with respect to business, economic, market, competition, regulatory and financial conditions and matters specific to the business of Nicolet, all of which are difficult to predict and many of which are beyond the control of Nicolet. The Nicolet projections reflect assumptions as to certain business decisions that are subject to change and, in many respects, subjective judgment, and thus are susceptible to multiple interpretations and periodic revisions based on actual experience and business developments. Nicolet can give no assurance that the Nicolet projections and the underlying estimates and assumptions
57
will be realized. In addition, because the Nicolet projections cover multiple years, the information by its nature becomes less predictive with each successive year. Actual results may differ materially from those set forth below, and important factors that may affect actual results and cause the Nicolet projections not to be realized include, but are not limited to, risks and uncertainties relating to the business of Nicolet, industry performance, general business and economic conditions, customer requirements, competition and adverse changes in applicable laws, regulations or policies. Other factors that could cause actual results to differ are further described in the sections of this joint proxy statement-prospectus entitled “Risk Factors,” “A Warning About Forward-Looking Statements” and “Where You Can Find Additional Information,” beginning on page 16, page 19 and page 99, respectively. Shareholders are urged to review Nicolet’s most recent SEC filings for a description of risk factors with respect to its business.
Furthermore, the Nicolet projections do not take into account any circumstances or events occurring after the date they were prepared. Nicolet can give no assurance that, had the Nicolet projections been prepared as of the date of this joint proxy statement-prospectus, similar estimates and assumptions would be used. Nicolet does not intend to, and disclaims any obligation to, make publicly available any update or other revision to the Nicolet projections to reflect circumstances existing since their preparation or to reflect the occurrence of unanticipated events, even in the event that any or all of the underlying assumptions are shown to be in error, or to reflect changes in general economic or industry conditions. The Nicolet projections do not take into account the possible financial and other effects on either Nicolet or Baylake, as applicable, of the merger and do not attempt to predict or suggest future results of the combined company. The Nicolet projections do not give effect to the impact of negotiating or executing the merger agreement, the expenses that may be incurred in connection with consummating the merger, the potential synergies that may be achieved by the combined company as a result of the merger, the effect of any business or strategic decision or action that has been or will be taken as a result of the merger agreement having been executed, or the effect on either Baylake or Nicolet, as applicable, of any business or strategic decisions or actions that would likely have been taken if the merger agreement had not been executed, but which were instead altered, accelerated, postponed or not taken in anticipation of the merger. Further, the Nicolet projections do not take into account the effect on either Baylake or Nicolet, as applicable, of any possible failure of the merger to occur. None of Baylake, Nicolet or their respective affiliates, officers, directors, advisors or other representatives has made, makes or is authorized in the future to make any representation to any shareholder of Baylake or Nicolet, or any other person, regarding Nicolet’s actual performance compared to the information contained in the Nicolet projections or that projected results will be achieved. The inclusion of the Nicolet projections should not be deemed an admission or representation by Baylake or Nicolet that it is viewed as material information of Nicolet, particularly in light of the inherent risks and uncertainties associated with such forecasts. The summary of the Nicolet projections included below is not being included to influence your decision whether to vote for the Baylake merger proposal or the Nicolet share issuance proposal, as applicable, nor should the Nicolet projections be construed as financial guidance, and they should not be relied on as such. The Nicolet projections are provided solely because they were made available to other parties in connection with the merger.
In light of the foregoing, and considering that the Nicolet and Baylake special meetings will be held several months after the Nicolet projections were prepared, as well as the uncertainties inherent in any forecasted information, shareholders of Nicolet and Baylake are cautioned not to place unwarranted reliance on such information in connection with their consideration of the merger and the Nicolet share issuance, as applicable.
The following table presents selected unaudited prospective financial data of Nicolet for the years ending December 31, 2015, 2016, and 2017.
| | | |
As of and for the years
ended December 31, |
| |||||||||||||||
| | | |
2015
|
| |
2016
|
| |
2017
|
| |||||||||
| | | |
(Dollars in thousands)
|
| |||||||||||||||
|
Total assets
|
| | | $ | 1,189,688 | | | | | $ | 1,226,538 | | | | | $ | 1,261,610 | | |
|
Net income before preferred dividends
|
| | | | 11,479 | | | | | | 11,573 | | | | | | 12,070 | | |
58
Certain Publicly Available Consensus “Street Estimates” for Baylake
Baylake is covered by stock research analysts. Consensus estimates based on the EPS estimates published by such analysts are compiled by a nationally recognized earnings estimate consolidator. The publicly available EPS consensus “street estimates” or “median analyst earnings per share estimates” for Baylake referred to on page 35 under the caption “The Merger — Opinion of Keefe, Bruyette & Woods, Inc.” and on page 45 under the caption “The Merger — Opinion of Sandler O’Neill & Partners, L.P.” are presented below:
Baylake Consensus Estimates
•
2015 – $1.02 per share
•
2016 – $1.23 per share
Interests of Certain Persons in the Merger
General
The directors and executive officers of Nicolet and Baylake have interests in the transaction in addition to their interests generally as shareholders of Nicolet and Baylake. These interests are described below. The board of directors of each of Nicolet and Baylake was aware of these interests and considered them, in addition to other matters, in approving the merger agreement.
Baylake
Appointment to the Boards of Directors of Nicolet and Nicolet National Bank. The merger agreement provides that eight current members of the Baylake board (Robert W. Agnew, Robert J. Cera, Terrence R. Fulwiler, Thomas L. Herlache, Louis J. Jeanquart, William D. Murphy, Dean J. Nolden, and Elyse Mollner Stackhouse) will be appointed to the board of Nicolet. For 2015, Nicolet directors receive fees of $1,200 per board meeting attended and $500 per committee meeting. The audit committee chairperson receives an additional $10,000 annual retainer.
Existing Employment Agreement. Baylake Bank has entered into an employment agreement with Mr. Cera (the “Cera Existing Employment Agreement”). The Cera Existing Employment Agreement provides for severance benefits equal to one year's base salary plus the annual bonus he would have received for the year of termination had his employment not been terminated and twelve months of monthly premiums for continued medical and dental coverage in the event Mr. Cera is terminated without “Cause” or terminates for “Good Reason.” The term “Cause” generally means (a) an act of fraud, embezzlement, or theft in connection with executive's duties; (b) willful and continual failure to perform substantially all of executive’s duties; (c) willfully engaging in illegal conduct or gross misconduct that is materially and demonstrably injurious; or (d) willfully and wrongfully disclosing any trade secret or other confidential information. The term “Good Reason” generally means a material reduction in authority, salary, location or a breach of the employment agreement by Baylake Bank. Mr. Cera has agreed not to compete and not to solicit employees or customers, in each case for twelve months following termination, regardless of cause. The Cera Existing Employment Agreement also includes standard non-disclosure of confidential information provisions.
New Employment Agreement for Mr. Cera. Concurrently with negotiating the terms of the merger agreement, the Baylake subcommittee, Mr. Cera and Nicolet management, along with the parties’ respective outside counsel, negotiated the terms of a new employment arrangement for Mr. Cera (the “Nicolet Cera Employment Agreement”) to take effect following the merger. The proposed Nicolet Cera Employment Agreement, a copy of which can be found as Exhibit D to the merger agreement, is intended to: (a) reflect the proposed management structure of Nicolet following the merger, (b) cover a two-year transitional period during which the integration can occur and the new Nicolet board of directors can review and consider the compensation of all executives, (c) replace benefits which Mr. Cera is entitled to and may be waiving under his current Cera Existing Employment Agreement, and (d) align the interests of all parties involved. The material terms of the Nicolet Cera Employment Agreement are as follows:
•
Mr. Cera will be employed as the Co-Chief Executive Officer of Nicolet;
59
•
The Nicolet Cera Employment Agreement shall be in effect for two years from the date it is executed and goes into effect (which will coincide with consummation of the merger);
•
Mr. Cera’s annual base salary will be $360,000, subject to annual review by Nicolet’s board for potential adjustments based on its evaluation of Mr. Cera’s performance;
•
Mr. Cera will be eligible to earn annual bonus compensation in such manner as may be determined by, and based on performance measures established by, Nicolet’s board of directors upon recommendation of the Compensation Committee consistent with Nicolet’s strategic planning process;
•
Mr. Cera will receive a signing bonus of $250,000;
•
Mr. Cera will receive a retention bonus of $250,000 if he remains employed with Nicolet at the first anniversary of the effective date, or if his employment has involuntarily terminated without “Cause” or he has resigned for “Good Reason,” as each term is defined in the Nicolet Cera Employment Agreement;
•
Nicolet will grant Mr. Cera a restricted stock award of Nicolet common stock worth $1 million; this restricted stock award will become vested and exercisable in one-fifth increments (or 20%) annually, commencing on the first anniversary of the effective date and continuing for the next four (4) successive anniversaries until fully vested; provided, however, the restricted stock award will become fully vested on an accelerated basis if Mr. Cera’s employment has involuntarily terminated without “Cause” or he resigns for “Good Reason” prior to the second anniversary of the effective date;
•
Nicolet will provide Mr. Cera with life insurance coverage in an amount equal to no less than $500,000;
•
In accordance with Nicolet’s reimbursement policies, Mr. Cera shall be reimbursed for reasonably and necessary business expenses, including reimbursement for the cost of annual dues for membership at one country club and the use of an automobile of a make and model determined by Nicolet;
•
Mr. Cera will be entitled to paid leave of no less than twenty-five (25) days per calendar year, exclusive of paid leave for holidays and sickness, all in accordance with Nicolet’s paid leave policy;
•
Mr. Cera shall be entitled to such other benefits as may be available from time to time for similarly-situated employees of Nicolet;
•
If, during the first two years of the Nicolet Cera Employment Agreement, Mr. Cera’s employment ends due to one of the following events: (a) involuntarily termination without “Cause,” (b) resignation for “Good Reason,” (c) death or disability, as set forth in the Nicolet Cera Employment Agreement, then Nicolet will pay Mr. Cera a severance in the amount of $2,000,000; and
•
During the term of the Nicolet Cera Employment Agreement and for a period of twenty-four (24) months thereafter, Mr. Cera will not compete with Nicolet within the defined “Area” nor will he solicit Nicolet’s employees or customers with whom he had “Material Contact.”
The proposed Nicolet Cera Employment Agreement is the subject of the non-binding, advisory vote of
both Baylake’s shareholders and Nicolet’s shareholders, as more particularly described in the sections
“The Baylake Proposals — Proposal 2 — Merger-Related Compensation” and “The Nicolet Proposal — Proposal 2 — Merger-Related Compensation,” respectively.
Change of Control Agreements. Baylake has entered into separate change of control agreements with each of Baylake’s Named Executive Officers (Messrs. Cera, LaLuzerne, Lammersfeld and Miller) (the “COC Agreements”). Each COC Agreement provides for severance benefits in the form of a lump-sum payment in cash equal to a multiple of base salary (two times for Mr. Cera and one times for Messrs. LaLuzerne, Lammersfeld and Miller) plus bonus, contributions to qualified retirement plans and twelve months of monthly premiums for continued medical and dental coverage in the event the officer is
60
terminated without “Cause” or terminates for “Good Reason,” as each term is defined in such COC Agreements, within twelve months following a change in control. The COC Agreements limit these payments to the extent necessary so that no portion of the payments constitutes an “excess parachute payment” within the meaning of Section 280G of the Internal Revenue Code. Each officer has also agreed not to compete and not to solicit employees or customers in each case for twelve months following termination, regardless of cause. The COC Agreements also include standard non-disclosure of confidential information provisions.
Vesting of Equity Rights. Baylake has granted each of its Named Executive Officers equity awards under the Baylake Corp. 2010 Equity Incentive Plan. The merger would constitute a “change in control” under the terms of the equity awards granted under this plan, which, absent any other action, would result in the acceleration of the vesting of options and restricted stock units granted. In accordance with the merger agreement, Mr. Cera has executed a waiver of equity vesting rights to waive the accelerated vesting that would have otherwise occurred as a result of the merger.
Payment of Nonqualified Deferred Compensation. Pursuant to the Baylake Bank Supplemental Executive Retirement Plan (“SERP”), the merger would trigger a “change in control,” which would result in payment of the SERP account balance within 30 days of the change in control. Mr. Miller is the only Named Executive Officer in the SERP and his account balance is 100% vested, regardless of the merger.
The information below is intended to comply with Item 402(t) of Regulation S-K, which requires the disclosure of information regarding compensation related to the merger payable to Baylake’s Named Executive Officers referred to as “golden parachute” compensation. Baylake’s Named Executive Officers for purposes of this disclosure are Robert J. Cera, Kevin L. LaLuzerne, Kenneth R. Lammersfeld and David J. Miller. Teresa Rosengarten was a named executive officer in Baylake's latest annual proxy statement; however, Ms. Rosengarten has ceased employment with Baylake Bank and has no interest in the merger or any rights to compensation that are based on or otherwise related to the merger, and is therefore not included in the disclosure that follows.
The estimated value of the payments and benefits that the Baylake Named Executive Officers may receive in connection with the merger is quantified in the table below, which amounts have been calculated based on the following estimates and assumptions, in addition to those described in the footnotes to the table:
•
each Named Executive Officer terminates his employment without cause immediately following consummation of the merger;
•
the effective time of the merger is assumed to be November 23, 2015, the latest practicable date before the date of this document;
•
pursuant to the waiver executed by Mr. Cera, no vesting of Mr. Cera’s equity awards will occur as a result of the merger.
The amounts below do not include compensation and benefits that are provided to Baylake’s general employees. The COC Agreements include a limitation so that no portion of the payments constitutes an “excess parachute payment” within the meaning of Section 280G of the Code. The amounts below do not reflect any potential adjustment triggered by these provisions. Additionally, the values provided in the table are estimates and would need to be verified and re-calculated upon the actual occurrence of a change in control and termination.
|
Name
|
| |
Cash(1)
|
| |
Equity(2)
|
| |
Pension/
NQDC(3) |
| |
Perquisites/
Benefits(4) |
| |
Tax
Reimbursements |
| |
Other
|
| |
Total
|
| |||||||||||||||||||||
|
Robert J. Cera
|
| | | $ | 982,000 | | | | | | — | | | | | | — | | | | | $ | 14,886 | | | | | | — | | | | | | — | | | | | $ | 996,886 | | |
|
Kevin L. LaLuzerne
|
| | | $ | 255,246 | | | | | $ | 248,760 | | | | | | — | | | | | $ | 14,886 | | | | | | — | | | | | | — | | | | | $ | 518,892 | | |
|
Kenneth R. Lammersfeld
|
| | | $ | 223,701 | | | | | $ | 149,034 | | | | | | — | | | | | $ | 15,411 | | | | | | — | | | | | | — | | | | | $ | 388,146 | | |
|
David J. Miller
|
| | | $ | 212,569 | | | | | $ | 219,742 | | | | | $ | 23,023 | | | | | $ | 8,671 | | | | | | — | | | | | | — | | | | | $ | 464,005 | | |
(1)
Represents the value of cash severance payments payable under the applicable named executive officer’s Change of Control Agreement, as described above in the section entitled “Change of Control
61
Agreements.” The severance amounts in this column are each “double trigger” in nature, which means that payment of these amounts is conditioned upon a change in control and a qualifying termination of employment. Amounts do not include any potential reduction resulting from the 280G cut-back provision of the COC Agreements.
(2)
Represents the aggregate dollar value of restricted stock unit awards for which vesting would be accelerated and in-the-money option awards for which vesting would be accelerated. The per share consideration of stock awards is the average closing market price of the securities over the first five business days following the first public announcement of the transaction. Treatment of all options and restricted stock unit awards in the merger is described in greater detail above in the section entitled “Vesting of Equity Awards.” Amounts included in this column are all single trigger in nature, which means that the payment is conditioned solely upon the consummation of the merger. Amounts included in this column do not include awards that could be made to the named executive officers in 2016, any such awards of which would be awarded pursuant to Baylake's standard practice.
(3)
Represents the lump sum payment that the named executive officers would receive upon a change in control under the SERP. These amounts represent employee contributions to the SERP and are already vested regardless of the merger.
(4)
Represents the estimated value of the continued participation in certain welfare benefit plans to which the named executive officers would be entitled upon a qualifying termination pursuant to their COC Agreements. See the section above entitled “Change of Control Agreements.” These benefits are double trigger, in that they would only be paid upon a change in control and a subsequent qualifying termination of employment.
As discussed above, concurrently with negotiating the terms of the merger agreement, the parties negotiated the terms of the Nicolet Cera Employment Agreement, which would take effect following the merger and replace benefits provided under Mr. Cera's agreements described above. The proposed Nicolet Cera Employment Agreement is the subject of the non-binding, advisory vote of both Baylake’s shareholders and Nicolet’s shareholders, as more particularly described in the sections “The Baylake Proposals — Proposal 2 — Merger-Related Compensation” and “The Nicolet Proposal — Proposal 2 — Merger-Related Compensation,” respectively. As required by Item 402(t) of Regulation S-K, the table below sets forth the new arrangements that are subject to such advisory vote:
|
Name
|
| |
Cash(1)
|
| |
Equity(2)
|
| |
Pension/
NQDC |
| |
Perquisites/
Benefits |
| |
Tax
Reimbursements |
| |
Other
|
| |
Total
|
| |||||||||||||||||||||
|
Robert J. Cera
|
| | | $ | 2,500,000 | | | | | $ | 1,000,000 | | | | | | — | | | | | | — | | | | | | — | | | | | | — | | | | | $ | 3,500,000 | | |
(1)
Represents the value of the signing bonus, retention bonus and cash severance payable under the Nicolet Cera Employment Agreement, as described above in the section entitled “New Employment Agreement for Mr. Cera.” The signing bonus is single trigger in nature, which means that payment is conditioned solely upon the consummation of the merger. The retention bonus is payable if Mr. Cera remains employed with Nicolet at the first anniversary of the effective date, or if his employment has involuntarily terminated without “Cause” or he has resigned for “Good Reason,” as each term is defined in the Nicolet Cera Employment Agreement. The severance amount is conditioned upon a qualifying termination of employment within two years of the effective date of the Nicolet Cera Employment Agreement.
(2)
Represents the aggregate dollar value of stock awards, which are awarded pursuant to the Nicolet Cera Employment Agreement and which are subject to vesting upon continued employment. Treatment of such stock awards is described in greater detail above in the section entitled “New Employment Agreement for Mr. Cera.”
Nicolet
Employment Agreements. Nicolet or Nicolet National Bank has entered into separate employment agreements with each of Nicolet’s Named Executive Officers (Messrs. Atwell and Daniels and Ms. Lawson) (the “Nicolet Employment Agreements”). Each Nicolet Employment Agreement provides for severance in
62
the amount of 1.5 times base salary plus bonus in the event the officer is terminated without cause or resigns for cause if the termination occurs within six months after a change in control. The Nicolet Employment Agreements limit these payments to the extent necessary so that no portion of the payments constitutes an “excess parachute payment” within the meaning of Section 280G of the Internal Revenue Code. Each officer has also agreed not to compete and not to solicit employees or customers for 12 months following termination, regardless of cause, as well as standard non-disclosure of confidential information and non-disparagement provisions. Each of Nicolet’s Named Executive Officers has executed, or will execute, prior to consummation of the merger, a waiver such that the consummation of the merger will not constitute a change in control under their respective Nicolet Employment Agreements.
New Employment Agreement for Mr. Cera. Concurrently with negotiating the terms of the merger agreement, the Baylake subcommittee, Mr. Cera and Nicolet management, along with the parties’ respective outside counsel, negotiated the terms of the Nicolet Cera Employment Agreement to take effect following the merger. The Nicolet Cera Employment Agreement is discussed more fully above under “The Merger — Interests of Certain Persons in the Merger — Baylake — New Employment Agreement for Mr. Cera” and a copy can be found as Exhibit D to the merger agreement. The proposed Nicolet Cera Employment Agreement is the subject of the non-binding, advisory vote of both Baylake’s shareholders and Nicolet’s shareholders, as more particularly described in the sections “The Baylake Proposals — Proposal 2 — Merger-Related Compensation” and “The Nicolet — Proposal — Proposal 2 — Merger-Related Compensation,” respectively.
Vesting of Equity Rights. Nicolet has granted each of its Named Executive Officers equity awards under the Nicolet Bankshares, Inc. 2002 Stock Incentive Plan and/or the Nicolet Bankshares, Inc. 2011 Long Term Incentive Plan. Under the terms of the equity awards granted under these plans, the merger would constitute a change in control under the plans, which, absent any other action, would result in the acceleration of the vesting of options and restricted stock granted. Each Nicolet Named Executive Officer has executed or will execute, prior to consummation of the merger, a waiver of equity vesting rights to waive the accelerated vesting that would have otherwise occurred as a result of the merger.
Trading Market for Nicolet Stock
The shares of Nicolet common stock issued pursuant to the merger will be registered under the Securities Act of 1933, as amended, and will be freely transferable under applicable securities laws, except to the extent of any limitations or restrictions applicable to any shares received by any shareholder who may be deemed an affiliate of Nicolet following completion of the merger. See “Resale of Nicolet Common Stock,” at page 64.
Nicolet’s common stock is currently traded on the Nasdaq Capital Market, and the merger agreement requires that the shares issued in the merger also be eligible for trading on the Nasdaq Capital Market. There is, however, no guarantee that a liquid market for shares of Nicolet common stock will develop.
Nicolet Dividends
The holders of Nicolet common stock receive dividends if and when declared by the Nicolet board of directors out of legally available funds. Nicolet’s board of directors has not declared a dividend since its inception in 2000. The board currently anticipates that all earnings, if any, will be used for working capital, to support Nicolet’s operations and to finance the growth and development of its business, including the merger and integration of Baylake. Any future determination relating to dividend policy will be made at the discretion of Nicolet’s board of directors following consummation of the merger and will depend on a number of factors, including the company’s future earnings, capital requirements, financial condition, future prospects, regulatory restrictions, stock repurchase strategy and other factors that the board of directors may deem relevant.
Surrender and Exchange of Baylake Stock Certificates
At the effective time of the merger, Baylake shareholders will automatically become entitled to all of the rights and privileges afforded to Nicolet shareholders as of that time. However, the actual physical exchange of Baylake common stock certificates for cash and certificates representing shares of Nicolet common stock will occur after the merger.
63
Computershare Trust Company, N.A. will serve as exchange agent for the merger. Within five business days after the effective date of the merger, Nicolet will send or cause to be sent to each of Baylake’s shareholders a letter of transmittal with instructions for exchanging their Baylake stock certificates for the merger consideration to which they are entitled. Each Baylake stock certificate outstanding immediately prior to the effective time of the merger will be deemed for all purposes to evidence the right to receive the merger consideration to which such holder is entitled, regardless of when they are actually exchanged.
Nicolet will delay paying former shareholders of Baylake who become holders of Nicolet common stock pursuant to the merger any dividends or other distributions that may become payable to holders of record of Nicolet common stock following the effective time of the merger until they have surrendered their certificates evidencing their Baylake common stock, at which time Nicolet will pay any such dividends or other distributions without interest.
You should not send in your Baylake stock certificate(s) until you have received a letter of transmittal and further written instructions after the effective date of the merger. Please do NOT send in your stock certificates with your proxy card.
After the exchange agent receives your Baylake certificate(s), together with a properly completed letter of transmittal, it will deliver to you the merger consideration to which you are entitled, consisting of Nicolet common stock certificates (together with any withheld dividends or other distributions, but without interest thereon) and any cash payments due for a fractional share, without interest.
Shareholders who cannot locate their stock certificates are urged to contact promptly:
Baylake Corp.
217 North Fourth Avenue
Sturgeon Bay, Wisconsin 54235-2405
Attention: Susan M. Lohrey, Vice President and Secretary
Telephone: (920) 746-5464
217 North Fourth Avenue
Sturgeon Bay, Wisconsin 54235-2405
Attention: Susan M. Lohrey, Vice President and Secretary
Telephone: (920) 746-5464
Baylake will issue a new stock certificate to replace the lost certificate(s) only if the shareholder of Baylake signs an affidavit certifying that his, her or its certificate(s) cannot be located and containing an agreement to indemnify Baylake and Nicolet against any claim that may be made against Baylake or Nicolet by the owner of the certificate(s) alleged to have been lost or destroyed. Baylake or Nicolet may also require the shareholder to post a bond in an amount sufficient to support the shareholder’s agreement to indemnify Baylake and Nicolet.
Resale of Nicolet Common Stock
The shares of Nicolet common stock to be issued in the merger will be registered under the Securities Act. Baylake shareholders who are not affiliates of Nicolet may generally freely trade their Nicolet common stock upon completion of the merger. The term “affiliate” generally means each person who is an executive officer, director or 10% shareholder of Nicolet after the merger.
Those shareholders who are deemed to be affiliates of Nicolet may only sell their Nicolet common stock as provided by Rule 144 under the Securities Act or as otherwise permitted under the Securities Act. Rule 144 requires the availability of current public information about the issuer, a holding period for shares issued without registration with the Securities and Exchange Commission (“SEC”), volume limitations and other restrictions on the manner of sale of the shares.
Regulatory and Other Required Approvals
Federal Reserve
The Federal Reserve approval was necessary before the merger can be completed. Nicolet and Baylake must then wait at least 30 days after the date of Federal Reserve approval before they may complete the merger. During this waiting period, the U.S. Department of Justice may object to the merger on antitrust grounds. Nicolet filed an application for approval of the merger with the Federal Reserve on December 2, 2015 and the Federal Reserve issued its approval on February 23, 2016. In reviewing that application, the Federal Reserve was required to consider the following:
64
•
competitive factors, such as whether the merger will result in a monopoly or whether the benefits of the merger to the public in meeting the needs and convenience of the community clearly outweigh the merger’s anticompetitive effects or restraints on trade; and
•
banking and community factors, which includes an evaluation of:
•
the financial and managerial resources of Nicolet, including its subsidiaries, and of Baylake, and the effect of the proposed transaction on these resources;
•
management expertise;
•
internal control and risk management systems;
•
the capital of Nicolet;
•
the convenience and needs of the communities to be served; and
•
the effectiveness of Nicolet and Baylake in combating money laundering activities.
The application process included publication and opportunity for comment by the public. The Federal Reserve was also required to ensure that the proposed transaction would not violate Wisconsin law regarding the number of years a bank must be in operation before it can be acquired, deposit concentration limits, Wisconsin community reinvestment laws and any Wisconsin antitrust statutes.
OCC
The merger of Baylake Bank with and into Nicolet National Bank required the approval of the OCC. Nicolet filed an Interagency Bank Merger Application for approval of the bank merger with the OCC on November 18, 2015, and the OCC issued its approval on February 16, 2016. In evaluating the bank merger, the OCC was required to consider, among other factors, the financial and managerial resources and future prospects of the institutions and the convenience and needs of the communities to be served. The relevant statutes prohibit the OCC from approving the bank merger if:
•
it would result in a monopoly or be in furtherance of any combination or conspiracy to monopolize or attempt to monopolize the business of banking in any part of the United States; or
•
its effect in any section of the country could be to substantially lessen competition or to tend to create a monopoly, or if it would result in a restraint of trade in any other manner.
The bank merger may not be consummated until the 30th day (which the OCC may reduce to 15 days) following the date of OCC approval, during which time the U.S. Department of Justice would be afforded the opportunity to challenge the transaction on antitrust grounds. The commencement of any antitrust action would stay the effectiveness of the approval of the agencies, unless a court of competent jurisdiction should specifically order otherwise.
WDFI
In addition to the required approvals of the Federal Reserve and OCC discussed above, the merger also required the approval of the WDFI. Nicolet filed an application with the WDFI on December 2, 2015 pursuant to Section 221.0901 of Wisconsin banking law, and the WDFI issued its approval on February 17, 2016. In evaluating the application, the WDFI was required to consider various aspects of the proposed transaction and the parties thereto, including, among others, the financial and managerial resources and future prospects of the institutions involved, the best interests of their shareholders and customers, safety and soundness considerations, and the CRA compliance status of each bank. The relevant statutes prohibit the WDFI from approving the transaction if, following consummation, the combined institution would control more than 30 percent of the deposits in the state.
In connection with or as a result of the merger, Nicolet or Baylake may be required, pursuant to other laws and regulations, either to notify or obtain the consent of other regulatory authorities and organizations to which such companies or subsidiaries of either or both of them may be subject. The Nicolet common stock to be issued in exchange for Baylake common stock in the merger has been registered with the SEC and will be issued pursuant to available exemptions from registration under state securities laws.
65
Status and Effect of Approvals
As of the date of this joint proxy statement-prospectus, all required applications and notices have been filed and all required regulatory approvals have been received. Nicolet and Baylake contemplate that they will complete the merger shortly after the Baylake and Nicolet special shareholders’ meetings.
While all required regulatory approvals for the merger have been obtained, we can give you no assurance regarding the absence of litigation challenging those approvals or otherwise. Similarly, we cannot assure you that any state attorney general or other regulatory authority will not attempt to challenge the merger on antitrust grounds or for other reasons, or, if such a challenge is made, project the result thereof. The merger is conditioned upon the receipt of all consents, approvals and actions of governmental authorities and the filing of all other notices with such authorities in respect of the merger.
We are not aware of any regulatory approvals that would be required for completion of the transactions contemplated by the merger agreement other than as described above. Should any other approvals be required, those approvals would be sought, but we cannot assure you that they will be obtained.
Accounting Treatment of the Merger
Nicolet is required to account for the merger as a purchase transaction for accounting and financial reporting purposes under GAAP. Under purchase accounting, the assets (including any identifiable intangible assets) and liabilities (including executory contracts and other commitments) of Baylake at the effective time of the merger will be recorded at their respective fair values and added to those of Nicolet. Any excess of purchase price over the fair values is recorded as goodwill. Any excess of the fair values over the purchase price is recorded in earnings as a bargain purchase gain. Consolidated financial statements of Nicolet issued after the merger would reflect those fair values and would not be restated retroactively to reflect the historical consolidated financial position or results of operations of Baylake.
66
THE MERGER AGREEMENT
This section of the proxy statement-prospectus describes certain terms of the merger agreement. It is not intended to include every term of the merger, but rather addresses only the significant aspects of the merger. This discussion is qualified in its entirety by reference to the merger agreement, which is attached as Appendix A to this joint proxy statement-prospectus and is incorporated herein by reference.
General; Business and Operations After the Merger
If the shareholders of Baylake and Nicolet approve the merger agreement and the other conditions to the consummation of the merger are satisfied, Baylake will merge with and into Nicolet. Nicolet will exchange 0.4517 shares of Nicolet common stock for each outstanding share of Baylake common stock, except for cash to be paid in lieu of fractional shares. Each share of Nicolet common stock outstanding immediately prior to the effective date of the merger will remain outstanding and unchanged as a result of the merger.
Following the consummation of the merger, Baylake Bank will merge with and into Nicolet National Bank with Nicolet National Bank surviving the merger. Baylake Corp. and Baylake Bank will cease to exist after the merger, and the business of Baylake Bank will be conducted through Nicolet National Bank.
What Baylake’s Shareholders Will Receive in the Merger
If the merger is completed, holders of Baylake common stock will receive 0.4517 shares of Nicolet common stock for each of their shares, except for cash paid in lieu of fractional shares. Also, as permitted by the terms of the merger agreement, the Baylake board of directors expects to declare and pay a one-time special cash dividend of up to $0.40 per share to Baylake shareholders immediately prior to the effective time of the merger, subject to the satisfaction of the closing conditions set forth in the merger agreement.
Although Nicolet common stock is currently traded on the Nasdaq Capital Market, it was, until February 23, 2016, traded on the OTCBB market of the OTC Markets Group, Inc., and historical transactions in its stock have been sporadic and irregular. The last sale of Nicolet common stock known to management prior to the date of this joint proxy statement-prospectus occurred on February 29, 2016, at $32.49 per share, and the last sale of Baylake common stock reported on the Nasdaq Capital Market occurred on February 29, 2016, at $14.35 per share. However, given the historical absence of a fully liquid market for Nicolet common stock, neither the price at which Nicolet common stock last sold nor the price of Nicolet common stock for the purposes of cashing out fractional shares in this transaction should be considered indicative of the value of Nicolet common stock following this transaction.
Any shares of Baylake common stock held in the treasury of Baylake immediately prior to the effective time of the merger will be canceled and extinguished. No payment will be made with respect to such shares. In addition, each option granted by Baylake to purchase shares of Baylake common stock under a Baylake stock plan or otherwise, whether vested or unvested, that is outstanding and unexercised immediately prior to the effective closing date of the merger shall be adjusted under the Baylake stock plan or converted into a substituted option under a Nicolet stock plan.
No fractional shares of Nicolet common stock will be issued in connection with the merger. Instead, Nicolet will make a cash payment without interest to each shareholder of Baylake who would otherwise receive a fractional share. The amount of such cash payment will be determined by multiplying the fraction of a share of Nicolet common stock otherwise issuable to such shareholder by the volume weighted average closing price of Nicolet common stock on the Nasdaq Capital Market over the 20 trading day period ending on the third trading day prior to the closing date.
Trust Preferred Securities
As of the effective time of the merger, Nicolet will assume and discharge Baylake’s covenants, agreements and obligations under and relating to Baylake’s trust preferred securities, including the due and punctual payment of interest on all of the Baylake’s obligations pursuant to the subordinated notes issued by Baylake to its subsidiary Baylake Capital Trust II (the “Baylake Trust”). Additionally, Nicolet will cause the Baylake Trust to discharge Baylake Trust’s obligations arising after the effective time of the merger with
67
respect to the trust preferred securities. Finally, Nicolet and Baylake shall execute and deliver a supplemental indenture, in a form satisfactory to the trustee of Baylake Trust, to effectuate Nicolet’s assumption of Baylake’s trust preferred securities, whereby Nicolet shall assume all of Baylake’s covenants, agreements and obligations under and relating to Baylake’s trust preferred securities.
Dissenters’ Rights
Neither Baylake nor Nicolet shareholders are entitled to dissenters’ rights in connection with the merger.
Effect of the Merger on Baylake Options, Restricted Stock Units and Other Equity Awards
As of September 30, 2015, there were 254,255 options to purchase Baylake common stock outstanding at a weighted average exercise price of $9.39 per share, and 87,301 outstanding restricted stock units (RSUs). Pursuant to the merger agreement, each Baylake equity award, including options to purchase shares of Baylake common stock, RSUs and other equity awards, whether such award was granted under a Baylake stock plan or otherwise, and whether such award is vested or unvested, that is outstanding and unexercised immediately prior to the effective closing date of the merger shall be adjusted under the Baylake stock plan or converted into a substituted equity award under a Nicolet stock plan. If Nicolet elects to adjust Baylake equity awards rather than provide substituted equity awards, Nicolet shall take any action necessary to assume sponsorship of the Baylake stock plan and the obligations thereunder.
Closing and Effective Time of the Merger
The merger will be completed only if all of the following occur:
•
the merger agreement is approved by a majority of each of Baylake’s and Nicolet’s shareholders; and
•
all other conditions to the merger discussed in this joint proxy statement-prospectus and the merger agreement are either satisfied or waived.
If all of these conditions are met, the closing of the merger will occur as soon as practicable thereafter on a date mutually agreeable to Nicolet and Baylake.
Representations and Warranties in the Merger Agreement
Baylake and Nicolet have made customary representations and warranties to each other as part of the merger agreement. Baylake’s representations and warranties are contained in Article 3 of the merger agreement and relate to, among other things:
•
its organization and authority to enter into the merger agreement;
•
its capitalization, subsidiaries, properties and financial statements;
•
pending and threatened litigation against Baylake and its subsidiaries;
•
Baylake Bank’s loan portfolio and allowance for loan losses;
•
its insurance, employee benefits, tax and environmental matters;
•
its legal and regulatory compliance;
•
its contractual obligations and contingent liabilities; and
•
its public reports filed with the SEC.
Nicolet’s representations and warranties are contained in Article 4 of the merger agreement and relate to, among other things:
•
its organization and authority to enter into the merger agreement;
•
its capitalization, subsidiaries and financial statements;
•
pending and threatened litigation against Nicolet and its subsidiaries;
68
•
Nicolet National Bank’s loan portfolio and allowance for loan losses;
•
its insurance, employee benefits, tax and environmental matters;
•
legal and regulatory compliance; and
•
the shares of Nicolet common stock to be issued in the merger.
Each party’s representations and warranties are for the benefit of the other; they are not for the benefit of and may not be relied upon by shareholders. The representations and warranties of the parties will not survive the closing of the merger.
Conditions to the Merger
The merger agreement contains a number of conditions that must be satisfied or waived (if they are waivable) to complete the merger. The conditions include, among other things:
•
the representations and warranties made by each party in the merger must be accurate as of the closing date of the merger;
•
each party must have performed or complied in all material respects with all covenants and obligations as established in the merger agreement;
•
approval by Baylake’s shareholders and Nicolet’s shareholders of the merger agreement by the required vote;
•
an absence of any commenced or pending legal proceeding that challenges any of the contemplated transactions or that may have the effect of preventing, delaying or making illegal or otherwise interfering with any of the contemplated transactions;
•
approval of the merger and the transactions contemplated thereby by the Federal Reserve, OCC and WDFI without imposing any restrictions that would have a “material adverse effect,” as defined in the merger agreement, on either Nicolet or Baylake (as of the date of this joint proxy statement-prospectus, all required regulatory approvals have been received);
•
the registration statement has become effective under the Securities Act;
•
the absence of a stop order suspending the effectiveness of Nicolet’s registration statement under the Securities Act with respect to the shares of Nicolet common stock to be issued to the Baylake shareholders;
•
both parties shall have received a certificate signed by an executive on behalf of the other party certifying that such party’s representations and warranties are accurate and that all covenants and obligations have been performed;
•
receipt by Baylake and Nicolet of a tax opinion from Bryan Cave LLP that the merger qualifies as a tax-free reorganization under the Internal Revenue Code;
•
Nicolet shall have filed with the Nasdaq Stock Market, LLC a notification form for the listing of all shares of Nicolet common stock to be delivered in the merger, and the Nasdaq Stock Market, LLC shall not have objected to the listing of such shares of Nicolet common stock (Nicolet commenced trading on the Nasdaq Capital Market on February 24, 2016);
•
as of the Closing Date, Baylake shall have Tangible Common Equity (as defined in the merger agreement) of no less than $96.0 million (Baylake’s tangible common equity was $103.5 million as of December 31, 2015);
•
as of the Closing Date, Nicolet shall have Tangible Common Equity (as defined in the merger agreement) of no less than $80.9 million (Nicolet’s tangible common equity was $93.5 million as of December 31, 2015);
69
•
Baylake and Nicolet shall deliver, or cause to be delivered, a supplemental indenture, in a form satisfactory to the trustee of Baylake Trust, to effectuate Nicolet’s assumption of Baylake’s trust preferred securities, whereby Nicolet shall assume all of Baylake’s covenants, agreements and obligations under and relating to Baylake’s trust preferred securities;
•
payment by Baylake of all accrued but unpaid interest on its trust preferred securities;
•
the absence of any material adverse change in the financial condition, results of operations, business or prospects of either Baylake or Nicolet;
•
each party shall have obtained the written consents, permissions and approvals as required under any agreements, contracts, appointments, indentures, plans, trusts or other arrangements with third parties;
•
Nicolet’s redemption of such number of shares of its Series C Preferred Stock such that no more than 12,200 shares of such Series C Preferred Stock are outstanding immediately prior to the closing date of the merger (as of the date of this joint proxy statement-prospectus, Nicolet has redeemed sufficient shares for the satisfaction of this condition);
•
Nicolet’s execution of an employment agreement with Robert J. Cera substantially in the form attached as Exhibit D to the merger agreement; and
•
the absence of an order, decree or injunction enjoining or prohibiting completion of the merger.
The conditions to the merger are set forth in Articles 8 and 9 of the merger agreement. The parties intend to complete the merger as soon as practicable after all conditions have been satisfied or waived; however, we cannot assure you that all conditions will be satisfied or waived.
Waiver and Amendment
Nearly all of the conditions to completing the merger may be waived at any time by the party for whose benefit they were created; however, the merger agreement provides that the parties may not waive any condition that would result in the violation of any law or regulation. Also, the parties may amend or supplement the merger agreement at any time by written agreement. Any material change in the terms of the merger agreement after the Baylake special shareholders’ meeting may require a re-solicitation of votes from Baylake’s shareholders with respect to the amended merger agreement.
Business of Baylake Pending the Merger
The merger agreement requires Baylake to continue to operate its business as usual and to preserve its business organization, rights and franchises pending the merger and to refrain from taking any action that would materially adversely affect the receipt of required regulatory or other consents or materially adversely affect either party’s ability to perform its covenants and agreements under the merger agreement. Among other things, and subject to certain specified exceptions, Baylake may not, without Nicolet’s consent, take or agree to take any of the following actions:
•
conduct its business in any manner other than in the ordinary course of business in all material respects;
•
take any action or make any decision in contravention of commercially reasonable efforts to maintain and preserve intact its business organization and advantageous business relationships;
•
take any action that is intended to or would reasonably be expected to adversely affect or materially delay the ability of Baylake or Nicolet to obtain any of the required regulatory approvals, to provide Baylake’s covenants and agreements under the merger agreement, or to consummate the contemplated merger;
•
other than pursuant to the terms of any contract to which Baylake is a party that is outstanding on the date of the merger agreement: (i) issue, sell or otherwise permit to become outstanding, or dispose of or encumber or pledge, or authorize or propose the creation of, any additional shares of Baylake capital stock or any security convertible into Baylake capital stock; (ii) permit any
70
additional shares of Baylake capital stock to become subject to new grants, except for issuances under existing Baylake benefit plans in the ordinary course of business after consultation with Nicolet; or (iii) grant any registration rights with respect to shares of Baylake capital stock;
•
make, declare, pay or set aside for payment any dividend on or in respect of, or declare or make any distribution on any shares of Baylake capital stock (other than dividends from its wholly owned subsidiary to it or another of its wholly owned subsidiaries); provided, however, that Baylake shall be permitted to (i) continue paying its regular quarterly dividend of $0.09 per share of Baylake common stock consistent with past practice and (ii) pay a special dividend of up to $0.40 per share of Baylake common stock immediately prior to the subject closing;
•
directly or indirectly adjust, split, combine, redeem, reclassify, purchase or otherwise acquire, any shares of Baylake capital stock (other than repurchases of shares of Baylake common stock in the ordinary course of business to satisfy obligations under Baylake benefit plans);
•
amend the terms of, waive any rights under, terminate, knowingly violate the terms of or enter into: (i) any contract that is material to Baylake’s operations; (ii) any material restriction on the ability of Baylake or its subsidiaries to conduct its business as it is presently being conducted; or (iii) any contract or other binding obligation relating to any class of Baylake capital stock or rights associated therewith or any outstanding instrument of indebtedness;
•
enter into loan transactions not in accordance with, or consistent with, past practices of Baylake Bank or that are on terms and conditions that, to the knowledge of Baylake, are materially more favorable than those available to the borrower from competitive sources in arm’s-length transactions;
•
enter into any new credit or new lending relationships greater than $1.0 million that would require an exception to Baylake Bank’s formal loan policy as in effect as of the date of the merger agreement or that are not in strict compliance with the provisions of such loan policy;
•
other than incident to a reasonable loan restructuring, extend additional credit to any individual or entity, or any director or officer of, or any owner of a material interest in, such entity if such person or entity is the obligor under any indebtedness to Baylake or any of its subsidiaries which constitutes a nonperforming loan or against any part of such indebtedness Baylake or any of its subsidiaries has established loss reserves or any part of which has been charged-off by Baylake or any of its subsidiaries;
•
maintain an allowance for loan and lease losses which is not adequate in all material respects under the requirements of GAAP to provide for possible losses, net of recoveries relating to Baylake loans previously charged off, on Baylake loans and leases outstanding (including accrued interest receivable);
•
fail to: (A) charge-off any Baylake loans or leases that would be deemed uncollectible in accordance with GAAP or any applicable legal requirement; or (B) place on non-accrual any Baylake loans or leases that are past due greater than ninety (90) days;
•
sell, transfer, mortgage, encumber, license, let lapse, cancel, abandon or otherwise dispose of or discontinue any of its assets, deposits, business or properties, except for sales, transfers, mortgages, encumbrances, licenses, lapses, cancellations, abandonments or other dispositions or discontinuances in the ordinary course of business and in a transaction that, together with other such transactions, is not material to Baylake and its subsidiaries, taken as a whole;
•
acquire (other than by way of foreclosures or acquisitions of control in a fiduciary or similar capacity or in satisfaction of debts previously contracted in good faith, in each case in the ordinary course of business) all or any portion of the assets, business, deposits or properties of any other entity except in the ordinary course of business and in a transaction that, together with other such transactions, is not material to Baylake and its subsidiaries, taken as a whole, and does not present a material risk that the closing date of the proposed merger will be materially delayed or that any approvals necessary to complete the merger or the other contemplated transactions will be more difficult to obtain;
71
•
purchase any equity security for its investment portfolio that is inconsistent with Baylake Bank’s formal investment policy as in effect as of the date of the merger agreement or that are not in strict compliance with the provisions of such investment policy;
•
amend its articles of incorporation or its bylaws, or similar governing documents of any of its subsidiaries;
•
implement or adopt any change in its accounting principles, practices or methods, other than as may be required by GAAP or applicable regulatory accounting requirements;
•
increase in any manner the compensation or benefits of any of the current or former directors, officers, employees, consultants, independent contractors or other service providers of Baylake or its subsidiaries, other than increases in the ordinary course of business;
•
become a party to, establish, amend, commence participation in, terminate or commit itself to the adoption of any stock option plan or other stock-based compensation plan, compensation, severance, pension, consulting, non-competition, change in control, retirement, profit-sharing, welfare benefit, or other employee benefit plan or agreement or employment agreement with or for the benefit of any Baylake employee (or newly hired employees), director or shareholder;
•
accelerate the vesting of or lapsing of restrictions with respect to any stock-based compensation or other long-term incentive compensation under any Baylake benefit plans;
•
cause the funding of any rabbi trust or similar arrangement or take any action to fund or in any other way secure the payment of compensation or benefits under any Baylake benefit plan;
•
materially change any actuarial assumptions used to calculate funding obligations with respect to any Baylake benefit plan that is required by applicable legal requirements to be funded or change the manner in which contributions to such plans are made or the basis on which such contributions are determined, except as may be required by GAAP or any applicable legal requirement;
•
incur or guarantee any indebtedness for borrowed money other than in the ordinary course of business;
•
enter into any new line of business or materially change its lending, investment, underwriting, risk and asset liability management and other banking and operating policies, except as required by applicable legal requirements or requested by any regulatory authority;
•
settle any action, suit, claim or proceeding against it or any of its subsidiaries, except for an action, suit, claim or proceeding that is settled in an amount and for consideration not in excess of $250,000 and that would not: (i) impose any material restriction on the business of Baylake or its subsidiaries; or (ii) create precedent for claims that is reasonably likely to be material to it or its subsidiaries;
•
make application for the opening, relocation or closing of any, or open, relocate or close any, branch office, loan production office or other significant office or operations facility;
•
make or change any material tax elections, change or consent to any change in it or its subsidiaries’ method of accounting for tax purposes (except as required by applicable tax law), take any material position on any material tax return filed on or after the date of the merger agreement, settle or compromise any material tax liability, claim or assessment, enter into any closing agreement, waive or extend any statute of limitations with respect to a material amount of taxes, surrender any right to claim a refund for a material amount of taxes, or file any material amended tax return; or
•
agree to take, make any commitment to take, or adopt any resolutions of the Baylake board of directors in support of, any of the prohibited actions listed immediately above.
The restrictions on Baylake’s business activities are set forth in Section 5.2 of the merger agreement.
72
Business of Nicolet Pending the Merger
The merger agreement requires Nicolet to continue to operate its business as usual and to preserve its business organization, rights and franchises pending the merger and to refrain from taking any action that would materially adversely affect the receipt of required regulatory or other consents or materially adversely affect either party’s ability to perform its covenants and agreements under the merger agreement. Among other things, and subject to certain specified exceptions, Nicolet may not, without Baylake’s consent, take or agree to take any of the following actions:
•
conduct its business in any manner other than in the ordinary course of business in all material respects;
•
take any action or make any decision in contravention of commercially reasonable efforts to maintain and preserve intact its business organization and advantageous business relationships;
•
take any action that is intended to or would reasonably be expected to adversely affect or materially delay the ability of Nicolet or Baylake to obtain any of the required regulatory approvals, to provide Nicolet’s covenants and agreements under the merger agreement, or to consummate the contemplated merger;
•
other than pursuant to the terms of any contract to which Nicolet is a party that is outstanding on the date of the merger agreement: (i) issue, sell or otherwise permit to become outstanding, or dispose of or encumber or pledge, or authorize or propose the creation of, any additional shares of Nicolet capital stock or any security convertible into Nicolet capital stock; (ii) permit any additional shares of Nicolet capital stock to become subject to new grants, except for issuances under existing Nicolet benefit plans in the ordinary course of business after consultation with Baylake; or (iii) grant any registration rights with respect to shares of Nicolet capital stock;
•
make, declare, pay or set aside for payment any dividend on or in respect of, or declare or make any distribution on any shares of Nicolet capital stock, other than (i) dividends from its wholly owned subsidiary to it or another of its wholly owned subsidiaries or (ii) required dividends on any Nicolet preferred stock or on the preferred stock of its subsidiaries;
•
directly or indirectly adjust, split, combine, redeem, reclassify, purchase or otherwise acquire, any shares of Nicolet capital stock, other than (i) repurchases of shares of Nicolet common stock in the ordinary course of business to satisfy obligations under Nicolet benefit plans, or (ii) the redemption or repurchase of Nicolet preferred stock;
•
amend the terms of, waive any rights under, terminate, knowingly violate the terms of or enter into: (i) any contract that is material to Nicolet’s operations; (ii) any material restriction on the ability of Nicolet or its subsidiaries to conduct its business as it is presently being conducted; or (iii) any contract or other binding obligation relating to any class of Nicolet capital stock or rights associated therewith or any outstanding instrument of indebtedness;
•
enter into loan transactions not in accordance with, or consistent with, past practices of Nicolet National Bank or that are on terms and conditions that, to the knowledge of Nicolet, are materially more favorable than those available to the borrower from competitive sources in arm’s-length transactions;
•
enter into any new credit or new lending relationships greater than $1.0 million that would require an exception to Nicolet National Bank’s formal loan policy as in effect as of the date of the merger agreement or that are not in strict compliance with the provisions of such loan policy;
•
other than incident to a reasonable loan restructuring, extend additional credit to any individual or entity, or any director or officer of, or any owner of a material interest in, such entity if such person or entity is the obligor under any indebtedness to Nicolet or any of its subsidiaries which constitutes a nonperforming loan or against any part of such indebtedness Nicolet or any of its subsidiaries has established loss reserves or any part of which has been charged-off by Nicolet or any of its subsidiaries;
73
•
maintain an allowance for loan and lease losses which is not adequate in all material respects under the requirements of GAAP to provide for possible losses, net of recoveries relating to Nicolet loans previously charged off, on Nicolet loans and leases outstanding (including accrued interest receivable);
•
fail to: (A) charge-off any Nicolet loans or leases that would be deemed uncollectible in accordance with GAAP or any applicable legal requirement; or (B) place on non-accrual any Nicolet loans or leases that are past due greater than ninety (90) days;
•
sell, transfer, mortgage, encumber, license, let lapse, cancel, abandon or otherwise dispose of or discontinue any of its assets, deposits, business or properties, except for sales, transfers, mortgages, encumbrances, licenses, lapses, cancellations, abandonments or other dispositions or discontinuances in the ordinary course of business and in a transaction that, together with other such transactions, is not material to Nicolet and its subsidiaries, taken as a whole;
•
acquire (other than by way of foreclosures or acquisitions of control in a fiduciary or similar capacity or in satisfaction of debts previously contracted in good faith, in each case in the ordinary course of business) all or any portion of the assets, business, deposits or properties of any other entity except in the ordinary course of business and in a transaction that, together with other such transactions, is not material to Nicolet and its subsidiaries, taken as a whole, and does not present a material risk that the closing date of the proposed merger will be materially delayed or that any approvals necessary to complete the merger or the other contemplated transactions will be more difficult to obtain;
•
purchase any equity security for its investment portfolio that is inconsistent with Nicolet National Bank’s formal investment policy as in effect as of the date of the merger agreement or that are not in strict compliance with the provisions of such investment policy;
•
amend its articles of incorporation or its bylaws, or similar governing documents of any of its subsidiaries;
•
implement or adopt any change in its accounting principles, practices or methods, other than as may be required by GAAP or applicable regulatory accounting requirements;
•
increase in any manner the compensation or benefits of any of the current or former directors, officers, employees, consultants, independent contractors or other service providers of Nicolet or its subsidiaries, other than increases in the ordinary course of business;
•
become a party to, establish, amend, commence participation in, terminate or commit itself to the adoption of any stock option plan or other stock-based compensation plan, compensation, severance, pension, consulting, non-competition, change in control, retirement, profit-sharing, welfare benefit, or other employee benefit plan or agreement or employment agreement with or for the benefit of any Nicolet employee (or newly hired employees), director or shareholder;
•
accelerate the vesting of or lapsing of restrictions with respect to any stock-based compensation or other long-term incentive compensation under any Nicolet benefit plans;
•
cause the funding of any rabbi trust or similar arrangement or take any action to fund or in any other way secure the payment of compensation or benefits under any Nicolet benefit plan;
•
materially change any actuarial assumptions used to calculate funding obligations with respect to any Nicolet benefit plan that is required by applicable legal requirements to be funded or change the manner in which contributions to such plans are made or the basis on which such contributions are determined, except as may be required by GAAP or any applicable legal requirement;
•
incur or guarantee any indebtedness for borrowed money other than in the ordinary course of business;
74
•
enter into any new line of business or materially change its lending, investment, underwriting, risk and asset liability management and other banking and operating policies, except as required by applicable legal requirements or requested by any regulatory authority;
•
settle any action, suit, claim or proceeding against it or any of its subsidiaries, except for an action, suit, claim or proceeding that is settled in an amount and for consideration not in excess of $250,000 and that would not: (i) impose any material restriction on the business of Nicolet or its subsidiaries; or (ii) create precedent for claims that is reasonably likely to be material to it or its subsidiaries;
•
make application for the opening, relocation or closing of any, or open, relocate or close any, branch office, loan production office or other significant office or operations facility;
•
make or change any material tax elections, change or consent to any change in it or its subsidiaries’ method of accounting for tax purposes (except as required by applicable tax law), take any material position on any material tax return filed on or after the date of the merger agreement, settle or compromise any material tax liability, claim or assessment, enter into any closing agreement, waive or extend any statute of limitations with respect to a material amount of taxes, surrender any right to claim a refund for a material amount of taxes, or file any material amended tax return; or
•
agree to take, make any commitment to take, or adopt any resolutions of the Nicolet board of directors in support of, any of the prohibited actions listed immediately above.
The restrictions on Nicolet’s business activities are set forth in Section 6.2 of the merger agreement.
No Solicitation of Alternative Transactions
Each of Baylake and Nicolet was required to immediately cease any negotiations with any person regarding any Acquisition Proposal, as defined in the merger agreement, existing at the time the merger agreement was executed. In addition, neither party may solicit, directly or indirectly, inquiries or proposals with respect to, or, except to the extent determined by its board of directors in good faith, after consultation with its legal counsel, to be required to discharge properly the directors’ fiduciary duties, furnish any information relating to, or participate in any negotiations or discussions concerning, any sale of all or substantially all of its assets, any purchase of a substantial equity interest in it or any merger or other combination with it. Subject to the same fiduciary duties, neither party’s board may withdraw its recommendation to its shareholders of the merger or recommend to its shareholders any such other transaction.
Each of Baylake and Nicolet was also required to instruct its respective officers, directors, agents, and affiliates to refrain from taking such action prohibited by the merger agreement and each party is required to notify the other party immediately if it receives any inquiries from third parties. However, no director or officer of Baylake or Nicolet is prohibited from taking any action that the board of directors of such party determines in good faith, after consultation with counsel, is required by law or is required to discharge such director’s or officer’s fiduciary duties.
Termination of the Merger Agreement; Termination Fee
The merger agreement specifies the circumstances under which the parties may terminate the agreement and abandon the merger. Those circumstances are:
•
by mutual consent of Baylake’s board of directors and Nicolet’s board of directors;
•
by either party if the other party materially breaches any representation, warranty or covenant, such breach cannot be, or is not, cured within 30 days after written notice, and the existence of such breach would result in a “material adverse effect,” as defined in the merger agreement, on the breaching party;
•
by either party if any regulatory authority that must grant a required approval has denied approval of any of the contemplated transactions and such denial has become final and nonappealable; provided, however, that the right to terminate the merger agreement shall not be
75
available to a party whose failure (or the failure of any of its affiliates) to fulfill any of its obligations (excluding warranties and representations) under the merger agreement has been the cause of or resulted in the occurrence of a regulatory authority denial;
•
by either party if any application, filing or notice for a required regulatory approval has been withdrawn at the request or recommendation of the applicable regulatory authority; provided, however, that the right to terminate the merger agreement shall not be available to a party whose failure (or the failure of any of its affiliates) to fulfill any of its obligations (excluding warranties and representations) under the merger agreement has been the cause of or resulted in the occurrence of a regulatory request for withdrawal;
•
by either party if either party’s shareholders fail to approve the proposed merger;
•
by either party if the merger is not consummated on or before September 8, 2016;
•
by either party if any court of competent jurisdiction or other regulatory authority shall have issued a judgment, order, injunction, rule or decree, or taken any other action restraining, enjoining or otherwise prohibiting any of the contemplated transactions and such judgment, order, injunction, rule, decree or other action shall have become final and nonappealable;
•
by either party, prior to its respective shareholders’ approval, to accept an Acquisition Proposal that such party’s board of directors deems a Superior Proposal, as each term is defined in the merger agreement; or
•
by either party if the other party’s board of directors makes an adverse recommendation, whereby such party withdraws, qualifies or adversely modifies its recommendation to its shareholders that they vote in favor of the adoption and approval of the merger agreement.
If Nicolet terminates the merger agreement because Baylake’s board withdraws or changes its recommendation of the merger agreement, or if Baylake terminates the merger agreement to accept an Acquisition Proposal it deems a Superior Proposal, as each term is defined in the merger agreement, then Baylake (or its successor) must pay Nicolet a termination fee of $7,000,000. Similarly, if Baylake terminates the merger agreement because Nicolet’s board withdraws or changes its recommendation of the merger agreement, or if Nicolet terminates the merger agreement to accept an Acquisition Proposal it deems a Superior Proposal, then Nicolet (or its successor) must pay Baylake a termination fee of $7,000,000.
Provisions of the merger agreement regarding confidentiality, payment of the termination fee and indemnification of Baylake and its controlling persons will survive any termination of the merger agreement.
Payment of Expenses Relating to the Merger
The parties will pay all of their own expenses related to negotiating and completing the merger, whether or not the merger is consummated, except that the expenses incurred in connection with the filing, printing and mailing of this joint proxy statement-prospectus, and all filing and other fees paid to the SEC, in each case in connection with the merger (other than attorneys’ fees, accountants’ fees and related expenses), shall be shared equally by Nicolet and Baylake.
Indemnification and Insurance
Nicolet has agreed to provide certain indemnification in favor of the directors, officers and employees of Baylake with respect to matters occurring prior to or at the effective time of the merger. Nicolet will cause the officers and directors of Baylake to be covered by a directors’ and officers’ liability insurance policy for six years following the effective time of the merger, subject to certain conditions provided in Section 6.7 of the merger agreement.
Employee Benefits of Baylake Employees after the Merger
Nicolet has agreed to offer to all current employees of Baylake and Baylake Bank who become Nicolet employees as a result of the merger substantially similar employee benefits to those that Nicolet offers to its employees in similar positions. Nicolet has agreed to credit Baylake employees for their years of service at Baylake to the same extent as if that service had been with Nicolet under the applicable Nicolet benefit plans.
76
Affiliate Agreements
Each director of Baylake has executed a Voting and Support Agreement, in which each such director agrees to vote all of his or her shares of Baylake common stock in favor of the merger agreement. Nicolet has also obtained a Voting and Support Agreements from each of its directors relating to their shares of Nicolet common stock.
Forms of the Voting and Support Agreements are attached as Exhibit C to the merger agreement, which is attached to this joint proxy statement-prospectus as Appendix A. These agreements may have the effect of discouraging third parties from making an Acquisition Proposal, as defined in the merger agreement. The following is a brief summary of the material provisions of the agreements:
•
The director agrees to vote, or cause to be voted, in person or by proxy, all of the Baylake or Nicolet common stock as to which he or she owns beneficially or of record in favor of the merger agreement unless Baylake or Nicolet, as applicable, is then in breach of the agreement.
•
The director agrees, except for certain specific transfers set forth in the agreement, not to directly or indirectly transfer any of his or her Baylake or Nicolet common stock until the closing date of the merger without prior written consent of Nicolet or Baylake, as applicable.
Preferred Stock and Debentures
Pursuant to the terms of the merger agreement:
•
As of the effective time of the merger, Nicolet will assume and discharge Baylake’s covenants, agreements and obligations under and relating to Baylake’s trust preferred securities, including the due and punctual payment of interest on all of the Baylake’s obligations pursuant to the subordinated notes issued by Baylake to the Baylake Trust. Additionally, Nicolet will cause the Baylake Trust to discharge Baylake Trust’s obligations arising after the effective time of the merger with respect to the trust preferred securities. Finally, Nicolet and Baylake shall execute and deliver a supplemental indenture, in a form satisfactory to the trustee of Baylake Trust, to effectuate Nicolet’s assumption of Baylake’s trust preferred securities, whereby Nicolet shall assume all of Baylake’s covenants, agreements and obligations under and relating to Baylake’s trust preferred securities.
•
As of the closing date of the merger, each of Baylake and Nicolet shall have paid, in full, all interest payments due and outstanding on its respective trust preferred securities.
•
Nicolet shall use its reasonable best efforts to redeem such number of shares of Nicolet Series C Preferred Stock such that not more than 12,200 shares of Nicolet Series C Preferred Stock are outstanding immediately prior to the closing date of the merger. On September 28, 2015, Nicolet redeemed 12,200 shares of its Series C Preferred Stock.
77
MATERIAL U.S. FEDERAL INCOME TAX CONSEQUENCES OF THE MERGER
The following is a summary description of the anticipated material U.S. federal income tax consequences of the merger generally applicable to U.S. Shareholders (as defined below) of Baylake who hold the common stock as capital assets within the meaning of Section 1221 of the Internal Revenue Code. This summary description deals only with the U.S. federal income tax consequences of the merger. No information is provided regarding the tax consequences of the merger under state, local, gift, estate, foreign or other tax laws. We do not intend it to be a complete description of the U.S. federal income tax consequences of the merger to all Baylake shareholders in light of their particular circumstances or to Baylake shareholders subject to special treatment under U.S. federal income tax laws, such as:
•
Non-U.S. Shareholders (as defined below) (except to the extent discussed under the subheading “Tax Implications to Non-U.S. Shareholders” below);
•
entities treated as partnerships for U.S. federal income tax purposes or Baylake shareholders who hold their shares through entities treated as partnerships for U.S. federal income tax purposes;
•
qualified insurance plans;
•
tax-exempt organizations;
•
qualified retirement plans and individual retirement accounts;
•
brokers or dealers in securities or currencies;
•
traders in securities that elect to use a mark-to-market method of accounting;
•
regulated investment companies;
•
real estate investment trusts;
•
persons whose functional currency is not the U.S. dollar;
•
shareholders who received their stock upon the exercise of employee stock options or otherwise acquired their stock as compensation;
•
persons who purchased or sell their shares of Baylake common stock as part of a wash sale; or
•
shareholders who hold the common stock as part of a “hedge,” “straddle” or other risk reduction, “constructive sale,” or “conversion transaction,” as these terms are used in the Internal Revenue Code.
This discussion is based upon, and subject to, the Internal Revenue Code, the Treasury regulations promulgated under the Internal Revenue Code, existing interpretations, administrative rulings and judicial decisions, all of which are in effect as of the date of this statement, and all of which are subject to change, possibly with retroactive effect. Any such change could affect the continuing validity of this discussion. Tax laws are complex, and your individual circumstances may affect the tax consequences to you. We urge you to consult a tax advisor regarding the tax consequences of the merger to you.
U.S. Shareholders
For purposes of this discussion, the term “U.S. Shareholder” means a beneficial owner of Baylake common stock that is:
•
a citizen or resident of the U.S.;
•
a corporation (including any entity treated as a corporation for U.S. federal income tax purposes) created or organized under the laws of the U.S. or any of its political subdivisions;
•
a trust that (i) is subject to both the primary supervision of a court within the U.S. and the control of one or more U.S. persons, or (ii) has a valid election in effect under applicable U.S. treasury regulations to be treated as a U.S. person; or
•
an estate that is subject to U.S. federal income tax on its income regardless of its source.
78
If a partnership (including any entity or arrangement, domestic or foreign, that is treated as a partnership for U.S. federal income tax purposes) holds Baylake common stock, the tax treatment of a partner will generally depend on the status of the partners and the activities of the partnership. Partnerships and partners in such a partnership should consult their tax advisors regarding the tax consequences of the merger to them.
Qualification of the Merger as a Reorganization
Nicolet and Baylake have structured the merger to qualify as a reorganization within the meaning of Section 368(a) of the Internal Revenue Code. The obligation of Nicolet and Baylake to complete the merger is conditioned upon receipt of a tax opinion from Bryan Cave LLP to the effect that:
•
the merger will constitute a “reorganization” within the meaning of Section 368(a) of the Internal Revenue Code; and
•
each of Baylake and Nicolet will be a party to such reorganization within the meaning of Section 368(b) of the Internal Revenue Code.
The tax opinion is filed as Exhibit 8.1 to the registration statement of which this joint proxy statement-prospectus is a part. The tax opinion is based upon law existing on the date of the opinion and upon certain facts, assumptions, limitations, representations and covenants including those contained in representation letters executed by officers of Baylake and Nicolet that, if incorrect in certain material respects, would jeopardize the conclusions reached by Bryan Cave LLP in its opinion. The tax opinion will not bind the Internal Revenue Service or prevent the Internal Revenue Service from successfully asserting a contrary opinion. No ruling will be requested from the Internal Revenue Service in connection with the merger.
Tax Implications to U.S. Shareholders
The following discussion summarizes the material U.S. federal income tax consequences of the merger to U.S. Shareholders, assuming the merger qualifies as a reorganization within the meaning of Section 368(a) of the Internal Revenue Code.
Tax Consequences to U.S. Shareholders. The U.S. federal income tax consequences of the merger to an owner of Baylake common stock that is a U.S. Shareholder generally will depend on whether the U.S. Shareholder exchanges Baylake common stock for cash, Nicolet common stock or a combination of cash and Nicolet common stock.
•
Exchange Solely for Nicolet Stock. No gain or loss will be recognized by U.S. Shareholders upon the exchange of shares of Baylake common stock solely for shares of Nicolet common stock pursuant to the merger, except in respect of cash received in lieu of the issuance of a fractional share of Nicolet common stock (as discussed below).
•
Exchange of Cash in Lieu of Fractional Share. A U.S. Shareholder who receives cash in lieu of the issuance of a fractional share of Nicolet common stock will generally be treated as having received such fractional share pursuant to the merger and then as having received cash in exchange for such fractional share. Gain or loss generally will be recognized in an amount equal to the difference between the amount of cash received instead of the fractional share and the portion of the U.S. Shareholder’s aggregate adjusted tax basis of the Baylake shares exchanged in the merger which is allocable to the fractional share of Nicolet common stock. Such gain or loss generally will be capital gain or loss, and will be long-term capital gain or loss if, as of the effective date of the merger, the holding period for such shares of Baylake common stock is more than one year.
•
Tax Basis of Nicolet Common Stock Received in the Merger. The aggregate tax basis of the Nicolet common stock (including a fractional share deemed received and sold for cash as described above) received in the merger will equal the aggregate tax basis of the Baylake common stock surrendered in the exchange.
79
•
Holding Period of Nicolet Common Stock Received in the Merger. The holding period for any Nicolet common stock received in the merger will include the holding period of the Baylake common stock surrendered in the exchange.
Baylake Special Dividend. As permitted by the terms of the merger agreement, the Baylake board of directors expects to declare and pay a one-time special cash dividend of up to $0.40 per share to Baylake shareholders immediately prior to the effective time of the merger, subject to the satisfaction of the closing conditions set forth in the merger agreement. Generally, Baylake shareholders will be taxed on the pre-merger special dividend at applicable U.S. Federal income tax rates.
Baylake Regular Quarterly Dividend. In addition, the merger agreement allows Baylake to continue paying its regular quarterly dividend of $0.09 per share to Baylake shareholders prior to consummation of the merger. Assuming this dividend will be paid to Baylake shareholders out of funds generated from ordinary operations, it will be taxed to the shareholders as qualified dividend income.
Tax Consequences to Nicolet and Baylake. Neither Nicolet nor Baylake will recognize taxable gain or loss as a result of the merger, except for, in the case of Baylake, gain, if any, that has been deferred in accordance with the consolidated return regulations.
Tax Implications to Non-U.S. Shareholders
For purposes of this discussion, the term “Non-U.S. Shareholder” means a beneficial owner of Baylake common stock (other than an entity treated as a partnership for U.S. federal income tax purposes) that is not a U.S. Shareholder. The rules governing the U.S. federal income taxation of Non-U.S. Shareholders are complex, and no attempt will be made herein to provide more than a limited summary of those rules.
Tax Consequences to Non-U.S. Shareholders. Any gain a Non-U.S. Shareholder recognizes from the exchange of Baylake common stock for Nicolet common stock and cash in the merger generally will not be subject to U.S. federal income taxation unless (a) the gain is effectively connected with a trade or business conducted by the Non-U.S. Shareholder in the United States, or (b) in the case of a Non- U.S. Shareholder who is an individual, such shareholder is present in the United States for 183 days or more in the taxable year of the sale and other conditions are met. Non-U.S. Shareholders described in (a) above will be subject to tax on gain recognized at applicable U.S. federal income tax rates and, in addition, Non-U.S. Shareholders that are corporations (or treated as corporations for U.S. federal income tax purposes) may be subject to a branch profits tax equal to 30% (or a lesser rate under an applicable income tax treaty) on their effectively connected earnings and profits for the taxable year, which would include such gain. Non-U.S. Shareholders described in (b) above will be subject to a flat 30% tax on any gain recognized, which may be offset by U.S. source capital losses.
Dividends Paid with Respect to Nicolet Common Stock. As a result of the merger, current shareholders of Baylake common stock will hold Nicolet common stock. Dividends paid to Non-U.S. Shareholders (to the extent paid out of Nicolet’s current or accumulated earnings and profits, as determined for U.S. federal income tax purposes) with respect to such shares of Nicolet common stock will be subject to withholding at a 30% rate or such lower rate as may be specified by an applicable income tax treaty unless the dividends are effectively connected with the conduct of a trade or business within the United States and, if certain tax treaties apply, are attributable to a U.S. permanent establishment, as discussed below. Even if a Non-U.S. Shareholder is eligible for a lower treaty rate, Nicolet will generally be required to withhold at a 30% rate (rather than the lower treaty rate) on dividend payments unless Nicolet has received a valid IRS Form W-8BEN or other documentary evidence establishing entitlement to a lower treaty rate with respect to such payments. If a Non-U.S. Shareholder holds the Nicolet common stock through a foreign financial institution or other foreign non-financial entity, a 30% withholding tax will be imposed on dividends paid after December 31, 2012, to such “foreign financial institution” or other foreign non-financial entity unless (i) the foreign financial institution undertakes certain diligence and reporting obligations or (ii) the foreign non-financial entity either certifies it does not have any substantial U.S. owners or furnishes identifying information regarding each substantial U.S. owner.
If a Non-U.S. Shareholder is subject to withholding at a rate in excess of a reduced rate for which it is eligible under a tax treaty or otherwise, it may be able to obtain a refund of or credit for any amounts
80
withheld in excess of the applicable rate. Investors are encouraged to consult with their own tax advisers regarding the possible implications of these withholding requirements.
Dividends that are effectively connected with the conduct of a trade or business within the United States and, if certain tax treaties apply, are attributable to a U.S. permanent establishment, are not subject to withholding tax, but instead are subject to U.S. federal income tax on a net income basis at applicable graduated rates. Special certification and disclosure requirements must be satisfied for effectively connected income to be exempt from withholding. Any such effectively connected dividend received by a Non-U.S. Shareholder that is a corporation for U.S. federal income tax purposes may be subject to an additional branch profits tax at a 30% rate or such lower rate as may be specified by an applicable income tax treaty.
Tax Consequences if the Merger Does Not Qualify as a Reorganization
If the merger fails to qualify as a reorganization within the meaning of Section 368(a) of the Internal Revenue Code, and if the parties to the merger waive this condition to closing and consummate the merger, the merger will be a fully taxable transaction to the shareholders of Baylake common stock. In such case, U.S. Shareholders will recognize gain or loss measured by the difference between the total consideration received in the merger and such shareholders’ tax basis in the shares of Baylake common stock surrendered in the merger. Each shareholder of Baylake common stock is urged to consult its tax advisor regarding the manner in which gain or loss should be calculated among different blocks of Baylake common stock surrendered in the merger. The aggregate tax basis in the shares of Nicolet common stock received pursuant to the merger will be equal to the fair market value of such Nicolet common stock as of the closing date of the merger. The holding period of such shares of Nicolet common stock will begin on the date immediately following the closing date of the merger.
Backup Withholding and Information Reporting
In general, information reporting requirements may apply to the cash payments made to shareholders of Baylake common stock in connection with the merger, unless an exemption applies. Backup withholding may be imposed on the above payments at a rate of 28% if a U.S. Shareholder or Non-U.S. Shareholder (i) fails to provide a taxpayer identification number or appropriate certificates, or (ii) otherwise fails to comply with all applicable requirements of the backup withholding rules.
Any amounts withheld from payments to shareholders of Baylake common stock under the backup withholding rules are not an additional tax and will be allowed as a refund or credit against your applicable U.S. federal income tax liability, provided the required information is furnished to the Internal Revenue Service. Both U.S. Shareholders and Non-U.S. Shareholders should consult their own tax advisors regarding the application of backup withholding based on their particular circumstances and the availability and procedure for obtaining an exemption from backup withholding.
Medicare Tax on Net Investment Income
U.S. Shareholders are subject to a 3.8% Medicare tax on certain net investment income earned by individuals, estates and trusts, including any gain recognized in connection with merger of Baylake and Nicolet. In the case of an individual, the tax will be imposed on the lesser of (i) the shareholder’s net investment income, or (ii) the amount by which the shareholder’s modified adjusted gross income exceeds a certain threshold (which is $250,000 in the case of married individuals filing jointly, $125,000 in the case of married individuals filing separately, and $200,000 in all other cases).
81
CERTAIN DIFFERENCES IN RIGHTS OF SHAREHOLDERS
If the merger is completed, Baylake’s shareholders will become Nicolet shareholders. Their rights as shareholders will then be governed by Nicolet’s articles of incorporation and bylaws rather than by Baylake’s articles of incorporation and bylaws.
Nicolet and Baylake are both corporations organized under the laws of the State of Wisconsin. The corporate affairs of Nicolet and Baylake are governed generally by the provisions of the Wisconsin Business Corporation Law (the “WBCL”). The following is a summary of differences between the rights of Baylake shareholders and Nicolet shareholders not described elsewhere in this joint proxy statement-prospectus. The summary is necessarily general, and it is not intended to be a complete statement of all differences affecting the rights of shareholders. It is qualified in its entirety by reference to the WBCL, as well as the articles of incorporation and bylaws of each corporation. Baylake shareholders should consult their own legal counsel with respect to specific differences and changes in their rights as shareholders that would result from the proposed merger.
Authorized Capital Stock
Nicolet. Nicolet’s articles of incorporation authorize it to issue 30,000,000 shares of common stock, $0.01 par value, and 10,000,000 shares of preferred stock, no par value, with such preferences, limitations and relative rights as determined by the board of directors. As of September 30, 2015, there were 4,010,835 shares (including 53,315 shares of restricted stock granted but not yet vested under Nicolet’s employee benefit plans) of common stock issued and 3,957,520 shares of common stock outstanding. Of the authorized preferred stock, (i) 14,964 shares of Fixed Rate Cumulative Perpetual Preferred Stock, Series A, and 748 shares of Fixed Rate Cumulative Perpetual Preferred Stock, Series B, were authorized but no shares of either series were issued or outstanding, and (ii) 24,400 shares of Non-Cumulative Perpetual Preferred Stock, Series C, were authorized and issued, with 12,200 shares outstanding as of September 30, 2015 following the redemption, on September 28, 2015, of 12,200 shares in satisfaction of the closing condition to the merger agreement. In addition, as of September 30, 2015, 1,096,059 shares of Nicolet common stock were subject to outstanding options.
Baylake. Baylake’s articles of incorporation authorize it to issue 50,000,000 shares of common stock, $5.00 par value. As of September 30, 2015, there were 10,158,768 shares of Baylake common stock issued, 9,320,255 shares of Baylake common stock outstanding, and 838,513 shares of Baylake common stock held as treasury shares. In addition, as of September 30, 2015, 341,556 shares of Baylake common stock were subject to outstanding options and RSUs. Upon consummation of the merger with NEWBI, Baylake issued 285,829 shares to former NEWBI shareholders.
Composition and Election of the Board of Directors
Nicolet. Nicolet’s articles of incorporation and bylaws provide that the board of directors shall consist of not fewer than two nor more than 25 directors, with the exact number of directors to be set by resolution of the board. Its articles of incorporation provide for the election of directors by cumulative voting, which means that the number of votes each common shareholder may cast is determined by multiplying the number of shares he, she or it owns by the number of directors to be elected. Those votes may be cumulated and cast for a single candidate or may be distributed among two or more candidates in the manner selected by the shareholder.
Baylake. Baylake’s bylaws provide that the number of directors constituting the board of directors shall be neither fewer than five nor more than 17. Its articles of incorporation do not provide for cumulative voting. Baylake’s articles of incorporation and bylaws provide that the board of directors is divided into three classes and each director serves for a term expiring at the third succeeding annual meeting or until his or her successor is elected and qualified.
Director Nominations
Nicolet. Under Nicolet’s bylaws, either directors or shareholders may nominate persons for election as Nicolet directors. Nominations that are not made by or on behalf of Nicolet’s management must be delivered in writing to Nicolet’s President no less than 14 and no more than 50 days before the meeting at
82
which directors will be elected. If less than 21 days’ notice of such meeting is given, then the delivery deadline for the shareholder’s written notice is the close of business on the seventh day after the date on which notice of the meeting was mailed. The shareholder’s nomination must specify (to the extent known to the shareholder) the nominee’s name, address and principal occupation; the number of shares of capital stock that will be voted in favor of the nominee; and the nominating shareholder’s name, address and beneficial ownership of Nicolet capital stock.
Baylake. Baylake’s bylaws prescribe that if the business at a meeting includes the nomination and election of any directors, such nominations shall be made by notice in writing, delivered or mailed by first class United States mail, postage prepaid, to the secretary of the corporation not less than 14 days nor more than 70 days preceding the meeting, provided, however, that if less than 21 days’ notice of the meeting is given to shareholders, such notice shall be delivered or mailed not less than seven business days following the mailing of such notice of meeting. Each notice of nomination of directors shall contain the name and address, the principal occupation or employment, and number of shares of the corporation beneficially owned by each nominee and the class for which nominated. The chairman of the meeting shall determine whether any nomination was not made in accordance herewith and if it is so determined, he shall so declare to the meeting and the defective nomination shall be disregarded.
Director Qualifications
Nicolet. Under Nicolet’s bylaws, no person shall be eligible to be elected a director at any meeting of shareholders held on or after the date he or she attains age 72. The board of directors, at its discretion, may waive the age limitation or establish a greater age from time to time. Nicolet’s bylaws do not impose any other specific qualification requirements on directors.
Baylake. Baylake’s bylaws prescribe that no director shall have any significant relationship with the ownership or management of any other financial institution, comprising either a 10% or more beneficial ownership or executive position as an officer or director in such institution or an affiliate thereof.
Board Committees
Nicolet. Under the WBCL, unless the articles of incorporation or bylaws provide otherwise, a board of directors may create one or more committees, appoint members of the board of directors to serve on the committees and designate other members of the board of directors to serve as alternates. The WBCL provides that a committee may exercise the authority of the full board of directors except that it cannot approve or recommend to shareholders matters that require shareholder approval under the WBCL and it cannot adopt, amend or repeal a corporate bylaw. In addition to these restrictions, Nicolet’s bylaws provide that no board committee may approve dividends, fill board or committee vacancies without express authorization by the full board, amend the articles of incorporation, approve a plan of merger not requiring shareholder approval, approve the reacquisition of outstanding Nicolet capital stock except pursuant to parameters established by the full board, or approve the issuance of capital stock except to the extent authorized by the full board.
Baylake. Subject to the provisions of the WBCL as described above, Baylake’s bylaws allow a committee of the board of directors to exercise any powers of the board of directors except actions in respect to dividends to shareholders, election of the principal officers or the filling of vacancies in the board of directors or committees.
Board Vacancies
Nicolet. The WBCL provides that unless the articles of incorporation provide otherwise, if a vacancy occurs on the board of directors it may filled by any of the following: (i) the shareholders; (ii) the board of directors; or (iii) if the directors remaining in office constitute fewer than a quorum of the board, the directors, by the affirmative vote of a majority of all directors remaining in office. If the vacant office was held by a director elected by a voting group of shareholders, only the holders of shares of that voting group may vote to fill the vacancy if it is filled by shareholders, and only the remaining directors elected by that voting group may vote to fill the vacancy if it is filled by the directors. A vacancy that will occur at a specific later date may be filled before the vacancy occurs, but the new directors may not take office until
83
the vacancy occurs. Nicolet’s bylaws provide that any vacancy on the board, including a vacancy resulting from an increase in the number of directors, shall be filled by a majority of the board of directors then in office, although less than a quorum, and any directors so chosen shall hold office for the remaining term of directors of the class to which he or she has been elected and until election of his or her duly qualified successor.
Baylake. Baylake’s bylaws provide that any vacancy on the board, including a vacancy resulting from removal of a director for cause, from resignation, or from an increase in the number of directors, shall be filled by a majority of the board of directors, acting by a majority of the directors then in office, although less than a quorum, and any directors so chosen shall hold office until election of their duly qualified successors.
Director Removal
Nicolet. Directors may be removed for cause by the affirmative vote of the holders of a majority of the outstanding shares of Nicolet common stock entitled to vote in the election of directors, except that a director may not be removed if a number of cumulative votes sufficient to elect him or her is cast against his or her removal. Removal must be voted upon at a special shareholders’ meeting called for that purpose, and any vacancy so created may be filled by majority vote of the remaining directors. “Cause” is defined as conviction of a felony, a demand for removal by regulatory authorities or a determination by two-thirds of the directors then in office (excluding the director whose removal is being sought) that the director’s conduct was inimical to the best interests of Nicolet.
Baylake. Baylake’s bylaws provide that, notwithstanding any other provision of the bylaws of the corporation, a director may be removed at any time, but only for cause and only by the affirmative vote of 67% or more of the outstanding shares of the corporation entitled to vote, cast at a meeting of the shareholders called for that purpose. This provision in Baylake’s bylaws may only be amended or repealed by the affirmative vote of more than 75% of the outstanding shares of Baylake common stock entitled to vote at a meeting called for the purpose of amending or repealing the provision.
Advance Notice of Shareholder Proposals
Nicolet. Nicolet’s bylaws provide that in addition to any other requirements generally applicable to matters to be brought before an annual meeting of shareholders under Nicolet’s articles of incorporation or bylaws or the WBCL, a Nicolet shareholder who wishes to present a matter for consideration at such meeting must notify Nicolet’s Corporate Secretary in writing no later than 60 days before the meeting. The shareholder’s notice must specify the nature and reason for the business proposed to be conducted; the shareholder’s name, address and beneficial ownership of Nicolet stock; and any material interest of the shareholder in the matter proposed for consideration. See “Director Nominations” above for special provisions relating to shareholder nominations of candidates for the board of directors.
Baylake. See “Director Nominations” above for special provisions relating to shareholder nominations of candidates for the board of directors. Baylake’s bylaws do not contain any advance notice requirements for items other than director nominations.
Meetings of Shareholders
Nicolet. Nicolet’s bylaws provide that annual meetings of shareholders will be held at such date as may be specified by the board of directors or Corporate Secretary. Subject to any contrary requirements of the WBCL, special meetings of shareholders may be called by either Nicolet’s Chief Executive Officer or President at the direction of the board of directors or by the holder(s) of at least 10% of Nicolet’s outstanding stock. Nicolet’s bylaws require at least ten and not more than sixty days’ notice of any meeting of shareholders.
Baylake. Baylake’s bylaws provide that the annual meeting of the shareholders shall be held at 7:00 p.m. on the first Monday of June, or at such other time and date within thirty days before or ninety days after said date as may be fixed by or under the authority of the board of directors for the purpose of electing directors and for the transaction of such other business as may come before the meeting. Special
84
meetings of the shareholders, for any purpose or purposes, unless prescribed in the WBCL, may be called by the president or the board of directors or the person designated in the written request of the holders of at least 10% of all the shares of the corporation entitled to vote at the meeting.
Shareholder Vote Requirements
Nicolet. Except as described under “Board of Directors” above and “Mergers, Consolidations and Sales of Assets” below, and unless a greater number of votes is required under Nicolet’s articles of incorporation or the WBCL, a matter voted upon by Nicolet shareholders will be approved if more votes are cast in favor of a matter than against it, assuming a quorum is present.
Baylake. Except as described under “Board of Directors” above and “Mergers, Consolidations and Sales of Assets” below, and unless a greater number of votes is required under Baylake’s articles of incorporation, the bylaws or the WBCL, a matter voted upon by Baylake shareholders will be approved if more votes are cast in favor of a matter than against it, assuming a quorum is present.
Mergers, Consolidations and Sales of Assets
Nicolet. Nicolet’s articles of incorporation provide that any merger or share exchange of Nicolet with or into any other corporation, or any sale, lease, exchange or other disposition of substantially all of its assets to any other person or entity will require the approval of either: (i) two-thirds of the directors then in office and a majority of the outstanding shares entitled to vote; or (ii) a majority of the directors then in office and two-thirds of the outstanding shares entitled to vote.
Nicolet’s articles of incorporation require that, in considering an offer of another party to make a tender or exchange offer for any equity security of Nicolet; to merge, effect a share exchange or otherwise combine Nicolet with any other corporation; or purchase or otherwise acquire all or substantially all of the assets of Nicolet, the Board, in determining what is in the best interests of Nicolet and its shareholders, give due consideration to all relevant factors, including, without limitation, (a) the short-term and long-term social and economic effects on the employees, customers, shareholders and other constituents of Nicolet and its subsidiaries, and on the communities within which Nicolet and its subsidiaries operate (it being understood that Nicolet National Bank is charged with providing support to and being involved in the communities it serves); and (b) the consideration being offered by the other party in relation to the then-current value of Nicolet in a freely negotiated transaction and in relation to the board’s then-estimate of the future value of Nicolet as an independent entity.
Baylake. Baylake’s bylaws provide that, in addition to any affirmative vote required by law or under any other section of the bylaws: (1) any merger or consolidation of Baylake or its subsidiary into any 30% shareholder or any other corporation which, after such merger or consolidation, would be an affiliate of a 30% shareholder, or (2) any sale, exchange, pledge or other disposition to or with any 30% shareholder or any assets of Baylake or its subsidiary, or (3) the issue or transfer by Baylake or its subsidiary of any securities of Baylake or its subsidiary to any 30% shareholder in exchange for cash, securities, or other property, or (4) any reclassification of securities, recapitalization, reorganization, merger or consolidation of Baylake or its subsidiary which has the effect of increasing the proportionate share of outstanding shares which is directly or indirectly owned by any 30% shareholder, shall require the affirmative vote of the holders of at least 90% or more of the outstanding shares of Baylake entitled to vote, cast at a meeting of the shareholders called for that purpose. Such affirmative vote shall be required notwithstanding the fact that no vote may be required or that some lesser percentage may be otherwise specified.
Approval of such transactions in the preceding paragraph shall require only such affirmative vote as is required by the WBCL or set forth in the bylaws if all of the following have been met: (i) when any of the above transactions are recommended by the board of directors, upon the affirmative vote of two-thirds or more of the directors then existing, cast at a meeting of the board called for that purpose, and (ii) when the aggregate amount of cash and fair market value of any other consideration to be received per share by holders of outstanding shares of Baylake is at least equal to either (a) the highest price per share paid by such 30% shareholder in acquiring any of its holdings in Baylake within 18 months previous to the date of such offer, or (b) the earnings per share received for the four consecutive quarters preceding the record date for solicitation of votes on the transaction multiplied by the then price/earnings multiple (if any) of such
85
30% shareholder as customarily computed and reported in the financial community, or (c) the then existing book value of outstanding shares of Baylake, and (iii) the minority shareholders existing after the transaction has been consummated shall have the right for a period of six months following consummation of the transaction to cause the 30% shareholder to redeem such shareholder’s shares at a redemption price at least equal to the price determined under (a) – (c) above.
Baylake’s bylaws require that, upon the receipt of any tender offer for consideration by the board for recommendation to Baylake shareholders, in addition to the factors which are required under the business judgment rule and fiduciary obligations of the board, such consideration shall include a review of the social and economic effects of any transaction and such factors shall be given such weight in its consideration as the board shall, in its discretion, declare to be valid and appropriate under the circumstances.
Indemnification
Nicolet. Nicolet’s bylaws provide for the mandatory indemnification of a director, officer, employee or agent of Nicolet (or a person concurrently serving in such a capacity with another entity at Nicolet’s request), to the extent such person has been successful on the merits or otherwise in the defense of any threatened, pending or completed civil, criminal, administrative or investigative action, suit, arbitration or other proceeding brought by or in the right of Nicolet or by any other person or entity to which such person is a party because he or she is a director, officer, employee or agent, for all reasonable fees, costs, charges, disbursements, attorneys’ fees and other expenses incurred in connection with proceeding. In all other cases, Nicolet shall indemnify a director or officer of Nicolet, and may indemnify an employee or agent of Nicolet, against all liability and reasonable fees, costs, charges, disbursements, attorneys’ fees and other expenses incurred by such person in any proceeding brought by or in the right of Nicolet or by any other person or entity to which such person is a party because he or she is a director, officer, employee or agent, unless it has been proven by final adjudication that such person breached or failed to perform a duty owed to Nicolet that constituted:
•
a willful failure to deal fairly with Nicolet or its shareholders in connection with a matter in which the director, officer, employee or agent has a material conflict of interest;
•
a violation of criminal law, unless the director, officer, employee or agent had reasonable cause to believe his or her conduct was lawful or no reasonable cause to believe his or her conduct was unlawful;
•
a transaction from which the director, officer, employee or agent derived an improper personal profit; or
•
willful misconduct.
Unless modified by written agreement, the determination as to whether indemnification is proper shall be made in accordance with the WBCL. The right to indemnification under Nicolet’s bylaws may only be amended by the vote of two-thirds of the outstanding shares of Nicolet capital stock entitled to vote on the matter. Nicolet is authorized to purchase and maintain insurance on behalf of its directors, officers, employees or agents in connection with the foregoing indemnification obligations.
Baylake. The WBCL requires a corporation to indemnify a director or officer, to the extent that he or she has been successful on the merits or otherwise in the defense of a proceeding, for all reasonable expenses incurred in the proceeding if the director or officer was a party because he or she is or was a director or officer of the corporation. Indemnification is also required in other instances, unless the director or officer is personally liable because the director or officer breached or failed to perform a duty that he or she owes to the corporation and the breach or failure to perform constitutes any of the following:
•
a willful failure to deal fairly with the corporation or its shareholders in connection with a matter in which the director or officer has a material conflict of interest;
•
a violation of the criminal law, unless the director or officer had reasonable cause to believe that his or her conduct was lawful or no reasonable cause to believe that his or her conduct was unlawful;
•
a transaction from which the director or officer derived an improper personal benefit; or
•
willful misconduct.
86
The WBCL provides that reasonable expenses incurred by a director or officer who is a party to a proceeding may be paid or reimbursed by a corporation at such time as the director of officer furnishes to the corporation: (i) a written affirmation of his or her good faith belief that he or she has not breached or failed to perform his or her duties to the corporation, and (ii) a written undertaking to repay any amounts advanced if it is determined that indemnification by the corporation is not required.
The indemnification provisions of the WBCL are not exclusive. A corporation may provide directors and officers additional rights to indemnification, except for conduct described above, in (i) the articles of incorporation or bylaws; (ii) by a written agreement between the director or officer and the corporation; (iii) by a resolution adopted by the board of directors; or (iv) by a resolution that is adopted, after notice, by a majority vote of all of the corporation’s voting shares then outstanding.
Baylake’s bylaws provide for indemnification of its directors and officers to the fullest extent permitted by the WBCL.
The merger agreement provides that Nicolet will assume Baylake’s indemnification obligations after the merger.
Amendments to Articles of Incorporation and Bylaws
Nicolet. Nicolet’s articles of incorporation may be amended as provided in the WBCL, which provides that unless the articles of incorporation, bylaws or WBCL require a higher vote, and subject to any rights of a class to vote separately on the amendment under the WBCL, an amendment to the articles of incorporation will be approved if the number of votes cast in favor of the amendment exceed the votes cast against it.
Nicolet’s bylaws may be amended by the shareholders or by majority vote of the board of directors, except as otherwise provided in the WBCL and except as specified under “Indemnification” above. The WBCL requires shareholder approval for an amendment to any shareholder-adopted bylaw that states that the board may not amend it. Additionally, a bylaw that fixes a greater or lower quorum requirement or a greater voting requirement for shareholders may not be adopted, amended or repealed by the board of directors. A bylaw that fixes a greater or lower quorum requirement or a greater voting requirement for the board of directors may be amended or repealed as follows: (i) if originally adopted by the shareholders, only by the shareholders, unless the bylaw also permits board approval of the amendment, or (ii) if originally adopted by the board of directors, either by the shareholders or by the board of directors.
Baylake. Baylake’s articles of incorporation and bylaws may be amended as provided in the WBCL, as summarized for Nicolet above. Baylake’s bylaws also state that, notwithstanding any other provisions in the bylaws, amending, altering, repealing or otherwise changing the bylaw requirements for the approval of a tender offer or merger require the affirmative vote of more than 75% of the outstanding shares of Baylake entitled to vote at a meeting called for such purpose.
87
MARKET PRICE AND DIVIDEND INFORMATION
Nicolet
Nicolet common stock is currently traded on the Nasdaq Capital Market under the symbol “NCBS.” As of the record date of February 29, 2016, Nicolet had approximately 600 shareholders of record. The following table sets forth, for the periods indicated, the high and low reported sale prices per share of Nicolet common stock. Prior to May 12, 2013, there was no established trading market for Nicolet common stock. Between May 12, 2013 and February 23, 2016, Nicolet common stock traded on the OTCBB. Nicolet common stock commenced trading on the Nasdaq Capital Market on February 24, 2016. The closing price of Nicolet common stock was $33.25 per share on September 8, 2015, the last trading day before public announcement of the merger.
| | | |
High
|
| |
Low
|
| ||||||
| 2016 | | | | ||||||||||
|
First Quarter (through February 24, 2016)
|
| | | $ | 32.50 | | | | | $ | 30.51 | | |
| 2015 | | | | | | | | | | | | | |
|
Fourth Quarter
|
| | | $ | 32.49 | | | | | $ | 30.60 | | |
|
Third Quarter
|
| | | | 34.75 | | | | | | 30.80 | | |
|
Second Quarter
|
| | | | 31.50 | | | | | | 27.00 | | |
|
First Quarter
|
| | | | 27.50 | | | | | | 25.00 | | |
| 2014 | | | | | | | | | | | | | |
|
Fourth Quarter
|
| | | $ | 25.00 | | | | | $ | 23.10 | | |
|
Third Quarter
|
| | | | 24.74 | | | | | | 22.35 | | |
|
Second Quarter
|
| | | | 27.25 | | | | | | 19.05 | | |
|
First Quarter
|
| | | | 19.44 | | | | | | 16.51 | | |
The payment of dividends by Nicolet and Nicolet National Bank are subject to certain regulations that may limit or prevent the payment of dividends except in certain circumstances. Moreover, the payment of dividends is further subject to the discretion of the boards of directors of Nicolet and Nicolet National Bank, and the payment of dividends on the common stock of Nicolet is subject to the rights of the holders of its senior securities. Nicolet has not paid any dividends on its common stock since its inception in 2000.
Nicolet anticipates that its earnings, if any, will be held for purposes of enhancing its capital. No assurances can be given that any dividends on Nicolet’s common stock will be declared in the future or, if declared, what the amount of such dividends will be or whether such dividends will continue for future periods.
Baylake
Baylake common stock is currently traded on the Nasdaq Capital Market under the symbol “BYLK.” As of the record date of February 29, 2016, Baylake had approximately 1,910 shareholders of record. The following table sets forth, for the periods indicated, the high and low reported sale prices per share of Baylake common stock, and cash dividends declared per share of Baylake common stock. The closing price of Baylake common stock was $12.85 per share on September 8, 2015, the last trading day before public announcement of the merger.
88
| | | |
High
|
| |
Low
|
| |
Dividends
|
| |||||||||
| 2016 | | | | | |||||||||||||||
|
First Quarter (through February 24, 2016)
|
| | | $ | 14.99 | | | | | $ | 14.15 | | | | | $ | 0.09 | | |
| 2015 | | | | | | | | | | | | | | | | | | | |
|
Fourth Quarter
|
| | | $ | 14.89 | | | | | $ | 13.81 | | | | | $ | 0.09 | | |
|
Third Quarter
|
| | | | 15.00 | | | | | | 12.13 | | | | | | 0.09 | | |
|
Second Quarter
|
| | | | 13.26 | | | | | | 12.03 | | | | | | 0.08 | | |
|
First Quarter
|
| | | | 12.75 | | | | | | 11.90 | | | | | | 0.08 | | |
| 2014 | | | | | |||||||||||||||
|
Fourth Quarter
|
| | | $ | 12.75 | | | | | $ | 11.41 | | | | | $ | 0.08 | | |
|
Third Quarter
|
| | | | 12.67 | | | | | | 10.92 | | | | | | 0.08 | | |
|
Second Quarter
|
| | | | 13.06 | | | | | | 11.54 | | | | | | 0.07 | | |
|
First Quarter
|
| | | | 14.00 | | | | | | 11.27 | | | | | | 0.07 | | |
The holders of Baylake common stock receive dividends if and when declared by the Baylake board of directors out of legally available funds. The principal source of Baylake cash flow, including cash flow to pay dividends to its shareholders, stems from dividends that Baylake Bank pays to Baylake as its sole shareholder. Statutory and regulatory limitations, as well as other factors that their board of directors deems relevant, apply to Baylake Bank’s payment of dividends to Baylake, as well as to Baylake’s payment of dividends to its shareholders. The merger agreement permits, but does not require, Baylake to continue paying its regular quarterly dividend of $0.09 per share and to pay a special dividend of up to $0.40 per share immediately prior to the subject closing. Baylake’s ability to pay such dividends will be subject to the usual statutory and regulatory limitations.
89
SECURITY OWNERSHIP OF CERTAIN BENEFICIAL OWNERS AND MANAGEMENT
Nicolet
The following table sets forth information with respect to the beneficial ownership, as of December 31, 2015, of shares of Nicolet common stock by (i) each person known by Nicolet to be the beneficial owner of more than 5% of Nicolet’s outstanding common stock; (ii) each of Nicolet’s current directors and executive officers; (iii) all current Nicolet directors and executive officers as a group; (iv) each new director to be appointed to the Nicolet board of directors upon the closing of the merger; and (v) all current and prospective Nicolet directors and executive officers as a group. Except as noted below, management believes that each person listed below has sole investment and voting power with respect to the shares included in the table.
Information relating to beneficial ownership of Nicolet common stock is based upon “beneficial owner” concepts set forth in rules under the Securities and Exchange Act of 1934, as amended. Under these rules, a person is deemed to be a “beneficial owner” of a security if that person has sole or shared “voting power” or “investment power” over the security. Voting power includes the power to vote or to direct the voting of the security, and investment power includes the power to dispose or to direct the disposition of the security. Under the rules, more than one person may be deemed to be a beneficial owner of the same securities.
|
Directors and Named Executive Officers
|
| |
Number of
Shares |
| |
Percentage of
Issued and Outstanding Shares(1) |
| ||||||
|
Robert B. Atwell
|
| | | | 155,743(2) | | | | | | 3.6% | | |
|
Michael E. Daniels
|
| | | | 162,135(3) | | | | | | 3.7 | | |
|
John N. Dykema
|
| | | | 82,217(4) | | | | | | 1.9 | | |
|
Gary L. Fairchild
|
| | | | 3,817(5) | | | | | | * | | |
|
Michael F. Felhofer
|
| | | | 72,000(6) | | | | | | 1.6 | | |
|
Christopher J. Ghidorzi
|
| | | | 3,238(7) | | | | | | * | | |
|
Kim A. Gowey
|
| | | | 30,018(8) | | | | | | * | | |
|
Andrew F. Hetzel, Jr.
|
| | | | 58,659(9) | | | | | | 1.3 | | |
|
Ann K. Lawson
|
| | | | 36,593(10) | | | | | | * | | |
|
Donald J. Long, Jr.
|
| | | | 101,528(11) | | | | | | 2.3 | | |
|
Susan L. Merkatoris
|
| | | | 105,000 | | | | | | 2.4 | | |
|
Therese Pandl
|
| | | | 2,240(12) | | | | | | * | | |
|
Randy J. Rose
|
| | | | 31,946(13) | | | | | | * | | |
|
Robert J. Weyers
|
| | | | 112,544(14) | | | | | | 2.6 | | |
|
All Current Directors and Executive Officers as a Group
(19 persons) |
| | | | 1,105,753(15) | | | | | | 25.3% | | |
*
Represents less than one percent.
(1)
For purposes of this table, percentages shown treat shares subject to exercisable options held by the indicated director or executive officer as if they were issued and outstanding. All unvested shares of restricted stock are entitled to vote and are therefore included with the issued and outstanding shares reflected in this table.
(2)
Includes exercisable options to purchase 39,300 shares of common stock, 12,565 shares Mr. Atwell owns in his Nicolet 401(k) plan, and 10,621 shares of unvested restricted stock.
(3)
Includes 9,803 shares held in his spouse’s IRA, exercisable options to purchase 52,200 shares of common stock, 6,252 shares Mr. Daniels owns in his Nicolet 401(k) plan, and 10,621 shares of unvested restricted stock.
90
(4)
Includes 5,063 shares Mr. Dykema purchased through the Deferred Compensation Plan for Non-Employee Directors.
(5)
Includes 3,567 shares Mr. Fairchild purchased through the Deferred Compensation Plan for Non-Employee Directors.
(6)
Includes 606 shares held in his spouse’s IRA.
(7)
Includes 783 shares Mr. Ghidorzi purchased through the Deferred Compensation Plan for Non-Employee Directors.
(8)
Includes 1,468 shares held in his spouse’s IRA.
(9)
Includes 3,509 shares Mr. Hetzel purchased through the Deferred Compensation Plan for Non-Employee Directors.
(10)
Includes exercisable options to purchase 22,685 shares of common stock, 800 shares Ms. Lawson owns in her Nicolet 401(k) plan, and 2,821 shares of unvested restricted stock. Ms. Lawson is a non-director named executive officer.
(11)
Includes 2,009 shares Mr. Long purchased through the Deferred Compensation Plan for Non-Employee Directors.
(12)
Includes 2,140 shares Ms. Pandl purchased through the Deferred Compensation Plan for Non-Employee Directors.
(13)
Includes 1,946 shares Mr. Rose purchased through the Deferred Compensation Plan for Non-Employee Directors.
(14)
Includes 5,544 shares Mr. Weyers purchased through the Deferred Compensation Plan for Non-Employee Directors, and 36,250 shares held in limited partnerships to which Mr. Weyers is general partner.
(15)
Includes outstanding common stock, exercisable options to purchase 175,985 shares of common stock and 36,690 shares of unvested restricted stock.
Baylake
The following table sets forth, as of December 31, 2015, the number of shares of common stock beneficially owned by (i) each director and Named Executive Officer of Baylake, (ii) all directors and executive officers of Baylake as a group, and (iii) each person known to or believed by Baylake to be the beneficial owner of more than 5% of the outstanding shares of Baylake common stock. Except as otherwise indicated and as set forth in footnote (1) below, persons listed have sole voting and investment power over shares beneficially owned. Indicated options are all exercisable within 60 days of December 31, 2015.
|
Name of Beneficial Owner(1)
|
| |
Common Stock
Beneficially Owned |
| |
Percent of Class(2)
|
| ||||||
| Directors: | | | | ||||||||||
|
Robert W. Agnew
|
| | | | 88,516 | | | | | | * | | |
|
Dee Geurts-Bengtson
|
| | | | 3,599 | | | | | | * | | |
|
Robert J. Cera
|
| | | | 124,373(3) | | | | | | 1.29% | | |
|
Roger G. Ferris
|
| | | | 80,780 | | | | | | * | | |
|
Terrence R. Fulwiler
|
| | | | 36,730 | | | | | | * | | |
|
Thomas L. Herlache
|
| | | | 73,493 | | | | | | * | | |
|
Louis J. “Rick” Jeanquart
|
| | | | 341,379 | | | | | | 3.55% | | |
|
Joseph J. Morgan
|
| | | | 24,308 | | | | | | * | | |
|
William D. Murphy
|
| | | | 0 | | | | | | * | | |
|
Dean J. Nolden
|
| | | | 805 | | | | | | * | | |
|
Elyse Mollner Stackhouse
|
| | | | 16,489 | | | | | | * | | |
|
Paul J. Sturm
|
| | | | 96,619(4) | | | | | | 1.03% | | |
91
|
Name of Beneficial Owner(1)
|
| |
Common Stock
Beneficially Owned |
| |
Percent of Class(2)
|
| ||||||
| Non-director Named Executive Officers: | | | | ||||||||||
|
Kevin L. LaLuzerne
|
| | | | 42,433(5) | | | | | | * | | |
|
Kenneth R. Lammersfeld
|
| | | | 15,349(6) | | | | | | * | | |
|
David J. Miller
|
| | | | 40,585(7) | | | | | | * | | |
|
All directors and executive officers as a group (22 persons)
|
| | | | 1,105,710(8) | | | | | | 11.49% | | |
| 5 Percent Beneficial Owner: | | | | ||||||||||
|
None
|
| | | | | | | | | | | | |
*
Less than one percent.
(1)
For all listed persons, the number includes shares held by, jointly with, or in trust for the benefit of, the person’s spouse and dependent children. Shares are reported in such cases on the presumption that the individual may share voting and/or investment power because of the family relationship.
(2)
Options to purchase shares of Baylake common stock held by directors and executive officers that would be exercisable within 60 days after December 31, 2015 (“currently exercisable”) are treated as outstanding for the purpose of computing the number and percentage of outstanding securities of the class owned by each such person and for all directors and executive officers as a group, but not for the purpose of computing the percentage of class owned by any other person.
(3)
Includes options to purchase 35,117 shares.
(4)
Includes 18,910 shares owned by adult children of Mr. Sturm for whom he serves as agent under a power of attorney.
(5)
Includes options to purchase 9,932 shares.
(6)
Includes options to purchase 7,592 shares.
(7)
Includes options to purchase 13,662 shares.
(8)
Includes options to purchase 81,375 shares.
92
SELECTED HISTORICAL CONSOLIDATED FINANCIAL DATA OF NICOLET
The following table presents Nicolet’s selected historical consolidated financial data as of and for the years ended December 31, 2010 through 2014 and for the nine months ended September 30, 2015 and 2014. The selected financial data as of and for the years ended December 31, 2014 and 2013 is derived from Nicolet’s audited consolidated financial statements and related notes included in Nicolet’s Annual Report on Form 10-K for the year ended December 31, 2014 (the “Nicolet Form 10-K”) incorporated by reference into this joint proxy statement-prospectus and should be read in conjunction with the consolidated financial statements and related notes, along with “Management’s Discussion and Analysis of Financial Condition and Results of Operations,” included in the Nicolet Form 10-K. The selected financial data as of and for the years ended December 31, 2012, 2011 and 2010 have been derived from Nicolet’s audited financial statements that are not included in the Nicolet Form 10-K. The selected financial data as of and for the nine months ended September 30, 2015 and 2014 is derived from Nicolet’s unaudited consolidated financial statements and related notes included in Nicolet’s Quarterly Report on Form 10-Q for the period ended September 30, 2015 (the “Nicolet Form 10-Q”) incorporated by reference into this joint proxy statement-prospectus and should be read in conjunction with the consolidated financial statements and related notes, along with “Management’s Discussion and Analysis of Financial Condition and Results of Operations,” included in the Nicolet Form 10-Q. See “Where You Can Find More Information” on page 99.
| | | |
As of and for the
Nine Months Ended September 30 |
| |
As of and for the Year Ended December 31
|
| ||||||||||||||||||||||||||||||||||||
| | | |
2015
|
| |
2014
|
| |
2014
|
| |
2013
|
| |
2012
|
| |
2011
|
| |
2010
|
| |||||||||||||||||||||
| | | |
(Unaudited)
|
| |
(dollars in thousands except per share data)
|
| | | ||||||||||||||||||||||||||||||||||
| INCOME STATEMENT: | | | | | | | | | |||||||||||||||||||||||||||||||||||
|
Interest and dividend income
|
| | | $ | 36,134 | | | | | $ | 36,685 | | | | | $ | 48,949 | | | | | $ | 43,196 | | | | | $ | 28,795 | | | | | $ | 29,830 | | | | | $ | 31,420 | | |
|
Interest expense
|
| | | | 5,401 | | | | | | 5,316 | | | | | | 7,067 | | | | | | 6,292 | | | | | | 6,530 | | | | | | 8,383 | | | | | | 11,291 | | |
|
Net interest income before provision for
loan losses |
| | | | 30,733 | | | | | | 31,369 | | | | | | 41,882 | | | | | | 36,904 | | | | | | 22,265 | | | | | | 21,447 | | | | | | 20,129 | | |
|
Provision for loan losses
|
| | | | 1,350 | | | | | | 2,025 | | | | | | 2,700 | | | | | | 6,200 | | | | | | 4,325 | | | | | | 6,600 | | | | | | 8,500 | | |
|
Net interest income after provision for loan losses
|
| | | | 29,383 | | | | | | 29,344 | | | | | | 39,182 | | | | | | 30,704 | | | | | | 17,940 | | | | | | 14,847 | | | | | | 11,629 | | |
|
Non-interest income
|
| | | | 13,149 | | | | | | 10,285 | | | | | | 14,185 | | | | | | 25,736 | | | | | | 10,744 | | | | | | 8,444 | | | | | | 8,968 | | |
|
Non-interest expense
|
| | | | 29,375 | | | | | | 28,595 | | | | | | 38,709 | | | | | | 36,431 | | | | | | 24,062 | | | | | | 21,443 | | | | | | 19,316 | | |
|
Income before provision for income taxes
|
| | | | 13,157 | | | | | | 11,034 | | | | | | 14,658 | | | | | | 20,009 | | | | | | 4,622 | | | | | | 1,848 | | | | | | 1,281 | | |
|
Income tax provision
|
| | | | 4,452 | | | | | | 3,425 | | | | | | 4,607 | | | | | | 3,837 | | | | | | 1,529 | | | | | | 318 | | | | | | 136 | | |
|
Net income
|
| | | $ | 8,705 | | | | | $ | 7,609 | | | | | $ | 10,051 | | | | | $ | 16,172 | | | | | $ | 3,093 | | | | | $ | 1,530 | | | | | $ | 1,145 | | |
|
Less: Net income attributable to non-controlling interest
|
| | | $ | 96 | | | | | $ | 76 | | | | | $ | 102 | | | | | $ | 31 | | | | | $ | 57 | | | | | $ | 40 | | | | | $ | 35 | | |
|
Net income attributable to Nicolet Bankshares, Inc.
|
| | | $ | 8,609 | | | | | $ | 7,533 | | | | | $ | 9,949 | | | | | $ | 16,141 | | | | | $ | 3,036 | | | | | $ | 1,490 | | | | | $ | 1,110 | | |
|
Less preferred stock dividends
|
| | | $ | 182 | | | | | $ | 183 | | | | | $ | 244 | | | | | $ | 976 | | | | | $ | 1,220 | | | | | $ | 1,461 | | | | | $ | 985 | | |
|
Net income available to common shareholders
|
| | | $ | 8,427 | | | | | $ | 7,350 | | | | | $ | 9,705 | | | | | $ | 15,165 | | | | | $ | 1,816 | | | | | $ | 29 | | | | | $ | 125 | | |
| Per Share Data: | | | | | | | | | |||||||||||||||||||||||||||||||||||
|
Net income per share (basic)
|
| | | $ | 2.11 | | | | | $ | 1.75 | | | | | $ | 2.33 | | | | | $ | 3.81 | | | | | $ | 0.53 | | | | | $ | 0.01 | | | | | $ | 0.04 | | |
|
Net income per share (diluted)
|
| | | $ | 1.93 | | | | | $ | 1.70 | | | | | $ | 2.25 | | | | | $ | 3.80 | | | | | $ | 0.53 | | | | | $ | 0.01 | | | | | $ | 0.04 | | |
|
Cash dividends per common share
|
| | | | — | | | | | | — | | | | | | — | | | | | | — | | | | | | — | | | | | | — | | | | | | — | | |
|
Book value per share at end of period
|
| | | $ | 23.41 | | | | | $ | 20.81 | | | | | $ | 21.34 | | | | | $ | 18.97 | | | | | $ | 15.45 | | | | | $ | 14.83 | | | | | $ | 14.57 | | |
|
Dividend payout ratio
|
| | | | —% | | | | | | —% | | | | | | —% | | | | | | —% | | | | | | —% | | | | | | —% | | | | | | —% | | |
|
Common shares outstanding
|
| | | | 3,957,520 | | | | | | 4,097,801 | | | | | | 4,058,208 | | | | | | 4,241,044 | | | | | | 3,425,413 | | | | | | 3,480,355 | | | | | | 3,460,437 | | |
| Performance Ratios | | | | | | | | | |||||||||||||||||||||||||||||||||||
|
Return on average assets
|
| | | | 0.97% | | | | | | 0.85% | | | | | | 0.84% | | | | | | 1.62% | | | | | | 0.45% | | | | | | 0.23% | | | | | | 0.17% | | |
|
Return on average total shareholders’ equity
|
| | | | 10.11% | | | | | | 9.35% | | | | | | 9.18% | | | | | | 16.97% | | | | | | 3.97% | | | | | | 2.15% | | | | | | 1.66% | | |
|
Return on average common equity
|
| | | | 12.57% | | | | | | 11.80% | | | | | | 11.55% | | | | | | 21.44% | | | | | | 3.48% | | | | | | 0.06% | | | | | | 0.24% | | |
|
Equity to assets
|
| | | | 8.99% | | | | | | 9.38% | | | | | | 9.13% | | | | | | 8.75% | | | | | | 10.38% | | | | | | 11.21% | | | | | | 9.73% | | |
|
Net interest margin
|
| | | | 3.85% | | | | | | 3.91% | | | | | | 3.89% | | | | | | 4.06% | | | | | | 3.67% | | | | | | 3.75% | | | | | | 3.39% | | |
|
Net interest spread
|
| | | | 3.67% | | | | | | 3.78% | | | | | | 3.75% | | | | | | 3.92% | | | | | | 3.46% | | | | | | 3.51% | | | | | | 3.11% | | |
|
Noninterest income to average assets
|
| | | | 1.11% | | | | | | 0.87% | | | | | | 1.19% | | | | | | 2.58% | | | | | | 1.59% | | | | | | 1.31% | | | | | | 1.37% | | |
|
Noninterest expense to average assets
|
| | | | 2.48% | | | | | | 2.42% | | | | | | 3.25% | | | | | | 3.65% | | | | | | 3.57% | | | | | | 3.34% | | | | | | 2.95% | | |
93
| | | |
As of and for the
Nine Months Ended September 30 |
| |
As of and for the Year Ended December 31
|
| ||||||||||||||||||||||||||||||||||||
| | | |
2015
|
| |
2014
|
| |
2014
|
| |
2013
|
| |
2012
|
| |
2011
|
| |
2010
|
| |||||||||||||||||||||
| | | |
(Unaudited)
|
| |
(dollars in thousands except per share data)
|
| | | ||||||||||||||||||||||||||||||||||
| ENDING BALANCE SHEET: | | | | | | | | | |||||||||||||||||||||||||||||||||||
|
Total assets
|
| | | $ | 1,166,852 | | | | | $ | 1,169,620 | | | | | $ | 1,215,285 | | | | | $ | 1,198,803 | | | | | $ | 745,255 | | | | | $ | 678,249 | | | | | $ | 674,754 | | |
|
Securities available for sale
|
| | | | 167,572 | | | | | | 150,649 | | | | | | 168,475 | | | | | | 127,515 | | | | | | 55,901 | | | | | | 56,759 | | | | | | 52,388 | | |
|
Gross loans
|
| | | | 884,448 | | | | | | 865,085 | | | | | | 883,341 | | | | | | 847,358 | | | | | | 552,601 | | | | | | 472,489 | | | | | | 513,761 | | |
|
Total deposits
|
| | | | 1,012,181 | | | | | | 1,011,509 | | | | | | 1,059,903 | | | | | | 1,034,834 | | | | | | 616,093 | | | | | | 551,536 | | | | | | 558,464 | | |
|
Short-term borrowings
|
| | | | — | | | | | | — | | | | | | — | | | | | | 7,116 | | | | | | 4,035 | | | | | | 4,132 | | | | | | 4,390 | | |
|
Other borrowings
|
| | | | 15,480 | | | | | | 22,238 | | | | | | 21,175 | | | | | | 32,422 | | | | | | 35,155 | | | | | | 35,374 | | | | | | 35,582 | | |
|
Junior subordinated debentures
|
| | | | 12,477 | | | | | | 12,278 | | | | | | 12,328 | | | | | | 12,128 | | | | | | 6,186 | | | | | | 6,186 | | | | | | 6,186 | | |
|
Subordinated notes
|
| | | | 11,840 | | | | | | — | | | | | | — | | | | | | — | | | | | | — | | | | | | — | | | | | | — | | |
|
Total shareholders’ equity
|
| | | | 104,857 | | | | | | 109,676 | | | | | | 111,008 | | | | | | 104,862 | | | | | | 77,333 | | | | | | 76,023 | | | | | | 65,620 | | |
| FINANCIAL CONDITION ANALYSIS: | | ||||||||||||||||||||||||||||||||||||||||||
|
Nonperforming loans to total loans
|
| | | | 0.49% | | | | | | 0.79% | | | | | | 0.61% | | | | | | 1.21% | | | | | | 1.27% | | | | | | 2.01% | | | | | | 2.10% | | |
|
Net loan charge-offs to average loans
|
| | | | 0.10% | | | | | | 0.19% | | | | | | 0.31% | | | | | | 0.54% | | | | | | 0.60% | | | | | | 1.85% | | | | | | 1.22% | | |
| Allowance for loan losses to: | | | | | | | | | |||||||||||||||||||||||||||||||||||
|
Gross loans
|
| | | | 1.13% | | | | | | 1.16% | | | | | | 1.05% | | | | | | 1.09% | | | | | | 1.29% | | | | | | 1.25% | | | | | | 1.68% | | |
|
Nonperforming loans
|
| | | | 232.7% | | | | | | 146.7% | | | | | | 172.3% | | | | | | 89.9% | | | | | | 101.3% | | | | | | 62.3% | | | | | | 79.9% | | |
|
Nonperforming assets to total assets
|
| | | | 0.43% | | | | | | 0.67% | | | | | | 0.61% | | | | | | 1.02% | | | | | | 0.97% | | | | | | 1.49% | | | | | | 1.81% | | |
94
SELECTED HISTORICAL CONSOLIDATED FINANCIAL DATA OF BAYLAKE
The following table presents Baylake’s selected historical consolidated financial data as of and for the years ended December 31, 2010 through 2014 and for the nine months ended September 30, 2015 and 2014. The selected financial data as of December 31, 2014 and 2013 and the selected financial data for the years ended December 31, 2014, 2013 and 2012 is derived from Baylake’s audited consolidated financial statements and related notes included in Baylake’s Annual Report on Form 10-K for the year ended December 31, 2014 (the “Baylake Form 10-K”) incorporated by reference into this joint proxy statement-prospectus and should be read in conjunction with the consolidated financial statements and related notes, along with “Management’s Discussion and Analysis of Financial Condition and Results of Operations,” included in the Baylake Form 10-K. The selected financial data as of and for the years ended December 31, 2011 and 2010 have been derived from Baylake’s audited financial statements that are not included in the Baylake Form 10-K. The selected financial data as of and for the nine months ended September 30, 2015 and 2014 is derived from Baylake’s unaudited consolidated financial statements and related notes included in Baylake’s Quarterly Report on Form 10-Q for the period ended September 30, 2015 (the “Baylake Form 10-Q”) incorporated by reference into this joint proxy statement-prospectus and should be read in conjunction with the consolidated financial statements and related notes, along with “Management’s Discussion and Analysis of Financial Condition and Results of Operations,” included in the Baylake Form 10-Q. See “Where You Can Find More Information” on page 99.
| | | |
As of and for the
Nine Months Ended September 30 |
| |
As of and for the Year Ended December 31
|
| ||||||||||||||||||||||||||||||||||||
| | | |
2015
|
| |
2014
|
| |
2014
|
| |
2013
|
| |
2012
|
| |
2011
|
| |
2010
|
| |||||||||||||||||||||
| | | |
(Unaudited)
|
| |
(dollars in thousands except per share data)
|
| | | ||||||||||||||||||||||||||||||||||
| INCOME STATEMENT: | | | | | | | | | |||||||||||||||||||||||||||||||||||
|
Interest and dividend income
|
| | | $ | 26,104 | | | | | $ | 25,848 | | | | | $ | 34,743 | | | | | $ | 34,740 | | | | | $ | 39,186 | | | | | $ | 42,122 | | | | | $ | 45,050 | | |
|
Interest expense
|
| | | | 1,994 | | | | | | 2,654 | | | | | | 3,313 | | | | | | 4,540 | | | | | | 6,755 | | | | | | 9,582 | | | | | | 12,825 | | |
|
Net interest income before loan losses
|
| | | | 24,110 | | | | | | 23,194 | | | | | | 31,430 | | | | | | 30,200 | | | | | | 32,431 | | | | | | 32,540 | | | | | | 32,225 | | |
|
Provision for loan losses
|
| | | | 200 | | | | | | — | | | | | | — | | | | | | 1,400 | | | | | | 5,425 | | | | | | 5,050 | | | | | | 7,350 | | |
|
Net interest income after provision for loan losses
|
| | | | 29,910 | | | | | | 23,194 | | | | | | 31,430 | | | | | | 28,800 | | | | | | 27,006 | | | | | | 27,490 | | | | | | 24,875 | | |
|
Non-interest income
|
| | | | 7,231 | | | | | | 6,511 | | | | | | 9,067 | | | | | | 9,830 | | | | | | 13,823 | | | | | | 10,020 | | | | | | 8,955 | | |
|
Non-interest expense
|
| | | | 21,269 | | | | | | 20,270 | | | | | | 28,322 | | | | | | 27,302 | | | | | | 31,704 | | | | | | 31,627 | | | | | | 33,609 | | |
|
Income before provision (benefit) for income taxes
|
| | | | 9,872 | | | | | | 9,435 | | | | | | 12,175 | | | | | | 11,328 | | | | | | 9,125 | | | | | | 5,883 | | | | | | 221 | | |
|
Income tax provision (benefit)
|
| | | | 2,992 | | | | | | 2,754 | | | | | | 3,252 | | | | | | 3,319 | | | | | | 1,483 | | | | | | 1,407 | | | | | | (916) | | |
|
Net income
|
| | | $ | 6,880 | | | | | $ | 6,681 | | | | | $ | 8,923 | | | | | $ | 8,009 | | | | | $ | 7,642 | | | | | $ | 4,476 | | | | | $ | 1,137 | | |
| Per Share Data: | | | | | | | | | |||||||||||||||||||||||||||||||||||
|
Net income per share (basic)
|
| | | $ | 0.74 | | | | | $ | 0.82 | | | | | $ | 1.07 | | | | | $ | 1.01 | | | | | $ | 0.96 | | | | | $ | 0.57 | | | | | $ | 0.14 | | |
|
Net income per share (diluted)
|
| | | $ | 0.73 | | | | | $ | 0.73 | | | | | $ | 0.97 | | | | | $ | 0.87 | | | | | $ | 0.84 | | | | | $ | 0.57 | | | | | $ | 0.14 | | |
|
Cash dividends per common share
|
| | | $ | 0.25 | | | | | $ | 0.22 | | | | | $ | 0.30 | | | | | $ | 0.22 | | | | | $ | 0.08 | | | | | | — | | | | | | — | | |
|
Book value per share at end of period
|
| | | $ | 11.87 | | | | | $ | 11.86 | | | | | $ | 11.65 | | | | | $ | 12.02 | | | | | $ | 11.73 | | | | | $ | 10.67 | | | | | $ | 9.74 | | |
|
Dividend payout ratio
|
| | | | 33.69% | | | | | | 26.78% | | | | | | 28.23% | | | | | | 21.78% | | | | | | 8.31% | | | | | | — | | | | | | — | | |
|
Shares outstanding
|
| | | | 9,320,255 | | | | | | 8,590,821 | | | | | | 9,054,821 | | | | | | 7,809,997 | | | | | | 7,937,347 | | | | | | 7,911,539 | | | | | | 7,911,539 | | |
| Performance Ratios | | | | | | | | | |||||||||||||||||||||||||||||||||||
|
Return on average assets
|
| | | | 0.93% | | | | | | 0.91% | | | | | | 0.91% | | | | | | 0.83% | | | | | | 0.74% | | | | | | 0.43% | | | | | | 0.11% | | |
|
Return on average total shareholders’ equity
|
| | | | 8.49% | | | | | | 9.18% | | | | | | 8.99% | | | | | | 8.55% | | | | | | 8.60% | | | | | | 5.53% | | | | | | 1.45% | | |
|
Equity to assets
|
| | | | 10.81% | | | | | | 10.37% | | | | | | 10.33% | | | | | | 9.42% | | | | | | 9.10% | | | | | | 7.77% | | | | | | 7.32% | | |
|
Net interest margin
|
| | | | 3.65% | | | | | | 3.59% | | | | | | 3.63% | | | | | | 3.58% | | | | | | 3.53% | | | | | | 3.55% | | | | | | 3.55% | | |
|
Net interest spread
|
| | | | 3.57% | | | | | | 3.51% | | | | | | 3.55% | | | | | | 3.48% | | | | | | 3.43% | | | | | | 3.44% | | | | | | 3.44% | | |
|
Noninterest income to average assets
|
| | | | 0.97% | | | | | | 0.89% | | | | | | 0.93% | | | | | | 1.02% | | | | | | 1.33% | | | | | | 0.96% | | | | | | 0.86% | | |
|
Noninterest expense to average assets
|
| | | | 2.86% | | | | | | 2.78% | | | | | | 2.89% | | | | | | 2.84% | | | | | | 3.05% | | | | | | 3.04% | | | | | | 3.23% | | |
|
Efficiency ratio
|
| | | | 67.86% | | | | | | 68.24% | | | | | | 67.30% | | | | | | 67.57% | | | | | | 72.52% | | | | | | 73.60% | | | | | | 82.11% | | |
95
| | | |
As of and for the
Nine Months Ended September 30 |
| |
As of and for the Year Ended December 31
|
| ||||||||||||||||||||||||||||||||||||
| | | |
2015
|
| |
2014
|
| |
2014
|
| |
2013
|
| |
2012
|
| |
2011
|
| |
2010
|
| |||||||||||||||||||||
| | | |
(Unaudited)
|
| |
(dollars in thousands except per share data)
|
| | | ||||||||||||||||||||||||||||||||||
| ENDING BALANCE SHEET: | | | | | | | | | |||||||||||||||||||||||||||||||||||
|
Total assets
|
| | | $ | 1,023,168 | | | | | $ | 982,485 | | | | | $ | 1,021,623 | | | | | $ | 996,776 | | | | | $ | 1,023,971 | | | | | $ | 1,086,929 | | | | | $ | 1,052,453 | | |
|
Securities
|
| | | | 183,640 | | | | | | 224,378 | | | | | | 208,524 | | | | | | 230,883 | | | | | | 242,019 | | | | | | 284,331 | | | | | | 266,760 | | |
|
Gross loans
|
| | | | 691,641 | | | | | | 631,523 | | | | | | 679,357 | | | | | | 617,960 | | | | | | 595,533 | | | | | | 631,015 | | | | | | 629,891 | | |
|
Total deposits
|
| | | | 799,848 | | | | | | 753,003 | | | | | | 765,542 | | | | | | 744,212 | | | | | | 806,015 | | | | | | 865,187 | | | | | | 852,566 | | |
|
Short-term borrowings
|
| | | | 48,076 | | | | | | 45,275 | | | | | | 64,869 | | | | | | 58,448 | | | | | | 51,568 | | | | | | 47,566 | | | | | | 19,236 | | |
|
Other borrowings
|
| | | | 41,610 | | | | | | 54,470 | | | | | | 60,455 | | | | | | 66,700 | | | | | | 40,000 | | | | | | 55,000 | | | | | | 70,000 | | |
|
Subordinated debentures
|
| | | | 16,100 | | | | | | 16,100 | | | | | | 16,100 | | | | | | 16,100 | | | | | | 16,100 | | | | | | 16,100 | | | | | | 16,100 | | |
|
Convertible promissory notes
|
| | | | — | | | | | | 4,375 | | | | | | 1,650 | | | | | | 9,400 | | | | | | 9,400 | | | | | | 9,450 | | | | | | 9,450 | | |
|
Total shareholders’ equity
|
| | | | 110,601 | | | | | | 101,913 | | | | | | 105,504 | | | | | | 93,881 | | | | | | 93,144 | | | | | | 84,401 | | | | | | 77,067 | | |
|
FINANCIAL CONDITION ANALYSIS:
|
| | | | | | | | |||||||||||||||||||||||||||||||||||
|
Nonperforming loans to total loans
|
| | | | 0.52% | | | | | | 0.93% | | | | | | 0.76% | | | | | | 1.08% | | | | | | 2.42% | | | | | | 3.10% | | | | | | 2.62% | | |
| Allowance for loan losses to: | | | | | | | | | |||||||||||||||||||||||||||||||||||
|
Gross loans
|
| | | | 0.94% | | | | | | 1.12% | | | | | | 1.04% | | | | | | 1.24% | | | | | | 1.54% | | | | | | 1.69% | | | | | | 1.83% | | |
|
Nonperforming loans
|
| | | | 179.69% | | | | | | 119.58% | | | | | | 136.78% | | | | | | 115.02% | | | | | | 63.44% | | | | | | 54.32% | | | | | | 69.71% | | |
|
Net charge-offs to average loans
|
| | | | 0.15% | | | | | | 0.13% | | | | | | 0.10% | | | | | | 0.48% | | | | | | 1.11% | | | | | | 0.94% | | | | | | 0.85% | | |
|
Nonperforming assets to total assets
|
| | | | 0.74% | | | | | | 1.11% | | | | | | 0.92% | | | | | | 1.30% | | | | | | 2.44% | | | | | | 2.92% | | | | | | 3.08% | | |
96
OTHER MATTERS
Neither Nicolet’s nor Baylake’s respective management teams are aware of any other matters to be brought before their respective special shareholders’ meeting. However, if any other matters are properly brought before the applicable meeting, the persons named in the enclosed proxy card will have discretionary authority to vote all proxies with respect to such matters in accordance with their judgment.
SHAREHOLDER PROPOSALS
Nicolet
To be considered for inclusion in Nicolet’s proxy statement and proxy form for an annual meeting, shareholder proposals must be submitted on a timely basis and the proposal and proponent thereof must meet the requirements established by the Securities and Exchange Commission for shareholder proposals and the requirements of Nicolet’s bylaws. Proposals intended for inclusion in the proxy statement for the 2016 annual meeting of Nicolet shareholders must be received, in writing, by the Secretary of Nicolet at 111 North Washington Street, Green Bay, Wisconsin 54301 no later than November 24, 2015, unless the 2016 annual meeting is held more than 30 days earlier or later than the 2015 annual meeting.
In addition, Nicolet’s Bylaws provide that a shareholder wishing to nominate a candidate for election to the board of directors or to have any other matter considered by the shareholders at the annual meeting must give Nicolet timely written notice of such proposal, together with specified accompanying information. Director nominations that are not made by or on behalf of Nicolet’s management must be delivered in writing to Nicolet’s President no less than 14 and no more than 50 days before the meeting at which directors will be elected. If less than 21 days’ notice of such meeting is given, then the delivery deadline for the shareholder’s written notice is the close of business on the seventh day after the date on which notice of the meeting was mailed. The shareholder’s nomination must specify (to the extent known to the shareholder) the nominee’s name, address and principal occupation; the number of shares of capital stock that will be voted in favor of the nominee; and the nominating shareholder’s name, address and beneficial ownership of Nicolet capital stock. A Nicolet shareholder who wishes to present a matter other than a director nomination for consideration at an annual meeting must notify Nicolet’s Corporate Secretary in writing no later than 60 days before the meeting. The shareholder’s notice must specify the nature and reason for the business proposed to be conducted; the shareholder’s name, address and beneficial ownership of Nicolet stock; and any material interest of the shareholder in the matter proposed for consideration.
With respect to shareholder proposals other than director nominations, pursuant to SEC Rule 14a-4(c)(1), if the proponent of a shareholder proposal fails to notify Nicolet at least 45 days prior to the anniversary of sending the prior year’s proxy statement, the proxies of Nicolet’s management would be permitted to use their discretionary authority at Nicolet’s next annual meeting of shareholders if the proposal were raised at the meeting without any discussion of the matter in the proxy statement. For purposes of the 2016 annual meeting, the deadline is February 8, 2016.
Baylake
Proposals intended for inclusion in the proxy statement for the 2016 annual meeting of Baylake shareholders must be in writing and must be received by the Secretary of Baylake at 217 North Fourth Avenue, Sturgeon Bay, Wisconsin 54235 no later than December 25, 2015, unless the 2016 annual meeting is held more than 30 days earlier or later than the 2015 annual meeting. To be considered for inclusion in Baylake’s proxy statement and proxy form for an annual meeting, the shareholder proposal must be submitted on a timely basis and the proposal and proponent thereof must meet the requirements established by the Securities and Exchange Commission for shareholder proposals.
In addition, Baylake’s Bylaws provide that a shareholder wishing to nominate a candidate for election to the board of directors must give Baylake written notice of such proposal, together with specified accompanying information, at least 14 days but not more than 70 days prior to the annual meeting in order to be considered at the meeting. However, such proposals will not be included in Baylake’s 2016 annual
97
meeting proxy statement unless they further comply with the requirements set forth in the paragraph above. The purpose of this provision of the Bylaws is to assure adequate notice of and information regarding any such matter as to which shareholder action may be sought.
With respect to shareholder proposals other than director nominations, pursuant to SEC Rule 14a-4(c)(1), if the proponent of a shareholder proposal fails to notify Baylake at least 45 days prior to the anniversary of sending the prior year’s proxy statement, the proxies of Baylake’s management would be permitted to use their discretionary authority at Baylake’s next annual meeting of shareholders if the proposal were raised at the meeting without any discussion of the matter in the proxy statement. For purposes of the 2016 annual meeting, the deadline is March 9, 2016.
EXPERTS
Nicolet
The consolidated financial statements and the effectiveness of internal control over financial reporting incorporated in this joint proxy statement-prospectus and Registration Statement by reference to the Annual Report on Form 10-K for the year ended December 31, 2014, have been audited by Porter Keadle Moore LLC, an independent registered public accounting firm, as stated in their report incorporated by reference herein, and has been so incorporated in reliance upon such report and upon the authority of such firm as experts in accounting and auditing.
Baylake
The consolidated financial statements and the effectiveness of internal control over financial reporting incorporated in this joint proxy statement-prospectus and Registration Statement by reference to the Annual Report on Form 10-K for the year ended December 31, 2014, have been audited by Baker Tilly Virchow Krause, LLP, an independent registered public accounting firm, as stated in their report incorporated by reference herein, and has been so incorporated in reliance upon such report and upon the authority of such firm as experts in accounting and auditing.
LEGAL MATTERS
The validity of the shares of common stock that Nicolet will issue in the merger will be passed upon for Nicolet by Godfrey & Kahn, S.C. Bryan Cave LLP will opine as to material federal income tax consequences of the merger for Nicolet and Baylake. Certain additional legal matters relating to the merger will be passed upon for Nicolet by Bryan Cave LLP and for Baylake by Reinhart Boerner Van Deuren, s.c.
98
WHERE YOU CAN FIND ADDITIONAL INFORMATION
Nicolet has filed a registration statement on Form S-4 with the SEC that registers the Nicolet common stock to be issued in the merger to Baylake shareholders. This joint proxy statement-prospectus is a part of that registration statement and constitutes a prospectus of Nicolet and a joint proxy statement of Baylake and Nicolet for their respective special meetings. As allowed by SEC rules and regulations, this joint proxy statement-prospectus does not contain all of the information in the registration statement.
Each of Nicolet and Baylake file reports, proxy statements, and other information with the SEC under the Exchange Act. The SEC maintains a web site that contains such reports, proxy statements and other information about public companies, including Baylake’s and Nicolet’s filings. The internet address of that site is http://www.sec.gov. You may also read and copy any materials filed with the SEC by Baylake and Nicolet at the SEC’s Public Reference Room at 100 F Street, N.E., Washington, D.C. 20549. You may obtain information on the operation of the Public Reference Room by calling the SEC at 1-800-SEC-0330. Nicolet’s internet address is www.nicoletbank.com. Baylake’s internet address is www.baylake.com. The information on Nicolet’s and Baylake’s websites is not part of this joint proxy statement-prospectus. You may obtain copies of the information that Nicolet files with the SEC, free of charge, by going to Nicolet’s website under the “Investor Relations” tab, or by written or oral request to Ann K. Lawson You may obtain copies of the information that Baylake files with the SEC, free of charge, by going to Baylake’s website under the “About Us” and “Investor Relations” tab, or by written or oral request to Susan Lohrey.
The SEC allows Nicolet and Baylake to “incorporate by reference” the information that each files with the SEC, which means that Nicolet and Baylake can disclose important information to you by referring to their respective filings with the SEC. The information incorporated by reference is considered a part of this joint proxy statement-prospectus, and certain information that Nicolet and Baylake file later with the SEC will automatically update and supersede the information in this joint proxy statement-prospectus.
Nicolet incorporates by reference the following documents Nicolet has filed with the SEC pursuant to Sections 13(a), 13(c), 14 or 15(d) of the Exchange Act, other than information in these documents that is not deemed to be filed with the SEC:
•
Nicolet’s Annual Report on Form 10-K for the year ended December 31, 2014, filed with the SEC on March 9, 2015;
•
Nicolet’s Quarterly Reports on Form 10-Q for the periods ended March 31, 2015, June 30, 2015 and September 30, 2015, filed with the SEC on May 7, 2015, August 7, 2015 and November 6, 2015, respectively;
•
The description of Nicolet’s common stock contained in Nicolet’s registration statement on Form S-3, dated October 8, 2014, and any amendment or report filed for the purpose of updating such description;
•
Nicolet’s Current Reports on Form 8-K* filed with the SEC on February 17, 2015, May 1, 2015, May 13, 2015, June 29, 2015, July 21, 2015, September 9, 2015, September 10, 2015, September 24, 2015, September 28, 2015, October 20, 2015, January 19, 2016 and February 24, 2016; and
•
Any document Nicolet may file* under Section 13(a), 13(c), 14 or 15(d) of the Exchange Act, after the date of this document.
Baylake incorporates by reference the following documents Baylake has filed with the SEC pursuant to Sections 13(a), 13(c), 14 or 15(d) of the Exchange Act, other than information in these documents that is not deemed to be filed with the SEC:
•
Baylake’s Annual Report on Form 10-K for the year ended December 31, 2014, filed with the SEC on February 27, 2015;
*
We are not incorporating and will not incorporate by reference into this joint proxy statement/prospectus past or future information on reports furnished or that will be furnished under Items 2.02 and/or 7.01 of, or otherwise with, Form 8-K.
99
•
Baylake’s Definitive Proxy Statement on Form 14A for the annual meeting held on June 1, 2015, filed with the SEC on April 24, 2015;
•
Baylake’s Quarterly Reports on Form 10-Q for the periods ended March 31, 2015, June 30, 2015 and September 30, 2015, filed with the SEC on May 1, 2015, July 31, 2015 and October 30, 2015, respectively;
•
Baylake’s Current Reports on Form 8-K* filed with the SEC on February 6, 2015, February 19, 2015, April 20, 2015, May 8, 2015, June 3, 2015, September 9, 2015, September 11, 2015, September 25, 2015, October 2, 2015, October 16, 2015, October 16, 2015, October 21, 2015, December 4, 2015, December 28, 2015, December 31, 2015, February 1, 2016; and
•
Any document Baylake may file* under Section 13(a), 13(c), 14 or 15(d) of the Exchange Act, after the date of this document.
If you would like to request documents, please do so by April 5, 2016 to receive them before the Nicolet special meeting, or by April 5, 2016 to receive them before the Baylake special meeting.
Nicolet has supplied all of the information contained in this joint proxy statement-prospectus relating to Nicolet and its subsidiary bank. Baylake has supplied all of the information relating to Baylake and its subsidiary bank.
You should rely only on the information contained or incorporated by reference in this joint proxy statement-prospectus to vote on the proposals to Nicolet and Baylake shareholders in connection with the merger. We have not authorized anyone to provide you with information that is different from what is contained in this joint proxy statement-prospectus. This joint proxy statement-prospectus is dated March 1, 2016. You should not assume that the information contained in this joint proxy statement-prospectus is accurate as of any other date other than such date, and neither the mailing of this joint proxy statement-prospectus nor the issuance of Nicolet common stock as contemplated by the merger agreement will create any implication to the contrary.
*
We are not incorporating and will not incorporate by reference into this joint proxy statement/prospectus past or future information on reports furnished or that will be furnished under Items 2.02 and/or 7.01 of, or otherwise with, Form 8-K.
100
APPENDIX B
![[MISSING IMAGE: lg-keefebruyettewoods_box.jpg]](lg-keefebruyettewoods_box.jpg)
September 8, 2015
The Board of Directors
Nicolet Bankshares, Inc.
111 North Washington Street
Green Bay, WI 54301
Nicolet Bankshares, Inc.
111 North Washington Street
Green Bay, WI 54301
Members of the Board:
You have requested the opinion of Keefe, Bruyette & Woods, Inc. (“KBW” or “we”) as investment bankers as to the fairness, from a financial point of view, to Nicolet Bankshares, Inc. (“NCBS”) of the Exchange Ratio (as defined below) in the proposed merger (the “Merger”) of Baylake Corp. (“BYLK”) with and into NCBS, pursuant to the Agreement and Plan of Merger to be entered into by and between NCBS and BYLK (the “Agreement”). Pursuant to the Agreement and subject to the terms, conditions and limitations set forth therein, at the Effective Time (as defined in the Agreement), by virtue of the Merger and without any action on the part of NCBS, BYLK, or the holders of any of the shares of common stock, par value $5.00 per share, of BYLK (the “BYLK Common Stock”), each share of BYLK Common Stock that is issued and outstanding immediately prior to the Effective Time will be converted into the right to receive 0.4517 of a share of common stock, par value $0.01 per share, of NCBS (the “NCBS Common Stock”). The ratio of 0.4517 of a share of NCBS Common Stock for one share of BYLK Common Stock is referred to herein as the “Exchange Ratio.” The terms and conditions of the Merger are more fully set forth in the Agreement.
The Agreement further provides that, following the Effective Time, Baylake Bank (“Baylake Bank”), a wholly-owned subsidiary of BYLK, will merge with and into Nicolet National Bank (“Nicolet Bank”), a wholly-owned subsidiary of NCBS (such transaction, the “Bank Merger”), pursuant to a separate plan of merger. In addition, representatives of NCBS have advised us that, immediately prior to the closing of the Merger, (i) BYLK expects to pay a one-time special cash dividend of $0.40 per share (representing approximately $3.8 million in the aggregate) on then issued and outstanding shares of BYLK Common Stock (the “BYLK Special Dividend”), as permitted under the Agreement and (ii) NCBS expects to redeem 50% of its outstanding shares of Non-Cumulative Perpetual Preferred Stock, Series C (such transaction, the “NCBS Preferred Stock Redemption”). For purposes of our analyses and at the direction of NCBS management, we have assumed, in all respects material to our analyses, the occurrence of the BYLK Special Dividend and the NCBS Preferred Stock Redemption.
KBW was retained by NCBS solely to render this opinion to the Board (as defined below) and we have not acted as a financial advisor to or as an agent of NCBS, nor have we acted as an advisor to or agent of any other person. As part of our investment banking business, we are continually engaged in the valuation of bank and bank holding company securities in connection with acquisitions, negotiated underwritings, secondary distributions of listed and unlisted securities, private placements and valuations for various other purposes. As specialists in the securities of banking companies, we have experience in, and knowledge of, the valuation of banking enterprises. In the ordinary course of our business as a broker-dealer, we and our affiliates may from time to time purchase securities from, and sell securities to, NCBS and BYLK, and as a market maker in securities, we may from time to time have a long or short position in, and buy or sell, debt or equity securities of NCBS and BYLK for our own account and for the accounts of our customers. We have acted exclusively for the board of directors of NCBS (the “Board”) in rendering this opinion and will receive a fee from NCBS upon the rendering of this opinion. In addition, NCBS has agreed to indemnify us for certain liabilities arising out of our engagement.
Keefe, Bruyette & Woods, a Stifel Company • 787 Seventh Avenue, 5th Floor, New York, NY 10019
(212) 887-7777 • www.kbw.com
(212) 887-7777 • www.kbw.com
B-1
Other than in connection with the present engagement, in the past two years, KBW has not provided investment banking and financial advisory services to NCBS. In the past two years, KBW has not provided investment banking and financial advisory services to BYLK. We may in the future provide investment banking and financial advisory services to NCBS or BYLK and receive compensation for such services.
In connection with this opinion, we have reviewed, analyzed and relied upon material bearing upon the Merger and the financial and operating condition of NCBS and BYLK, including among other things, the following: (i) a draft of the Agreement dated September 7, 2015 (the most recent draft made available to us); (ii) the audited financial statements and Annual Reports on Form 10-K for the three fiscal years ended December 31, 2014 of NCBS; (iii) the unaudited quarterly financial statements and Quarterly Reports on Form 10-Q for the fiscal quarters ended March 31, 2015 and June 30, 2015 for NCBS; (iv) the audited financial statements and Annual Reports on Form 10-K for the three fiscal years ended December 31, 2014 of BYLK; (v) the unaudited quarterly financial statements and Quarterly Reports on Form 10-Q for the fiscal quarters ended March 31, 2015 and June 30, 2015 for BYLK; (vi) certain regulatory filings of NCBS and BYLK, including the quarterly Call Reports on Form FRY-9C filed with respect to each quarter during the three year period ended June 30, 2015; (vii) certain other interim reports and other communications of NCBS and BYLK to their respective stockholders; and (viii) other financial information concerning the businesses and operations of NCBS and BYLK furnished to us by NCBS and BYLK or which we were otherwise directed to use for purposes of our opinion and our analyses. Our consideration of financial information and other factors that we deemed appropriate under the circumstances or relevant to our analyses included, among others, the following: (i) the historical and current financial position and results of operations of NCBS and BYLK; (ii) the assets and liabilities of NCBS and BYLK; (iii) the nature and terms of certain other merger transactions and business combinations in the banking industry; (iv) a comparison of certain financial and stock market information of NCBS and BYLK with similar information for certain other companies the securities of which are publicly traded; (v) financial and operating forecasts and projections of NCBS that were prepared by NCBS management, provided to and discussed with us by such management, and used and relied upon by us at the direction of such management with the consent of the Board; (vi) the publicly available consensus “street estimates” of BYLK for 2015 and 2016 (which estimates reflect the pro forma impact of BYLK’s pending acquisition of New Bancshares, Inc. that was publicly announced on May 8, 2015 (the “New Bancshares Acquisition”)) as well as assumed long term earnings and asset growth rates of BYLK that were provided to us by NCBS management, all of which information was discussed with us by NCBS management and used and relied upon by us at the direction of such management with the consent of the Board; and (vii) estimates regarding certain pro forma financial effects of the Merger on NCBS (including but not limited to the cost savings and related expenses expected to result or be derived from the Merger) that were prepared by NCBS management, provided to and discussed with us by such management, and used and relied upon by us at the direction of such management with the consent of the Board. We have also performed such other studies and analyses as we considered appropriate and have taken into account our assessment of general economic, market and financial conditions and our experience in other transactions, as well as our experience in securities valuation and knowledge of the banking industry generally. We have also held discussions with senior management of NCBS and BYLK regarding the past and current business operations, regulatory relations, financial condition and future prospects of their respective companies (including, in the case of BYLK, matters pertaining to the New Bancshares Acquisition) and such other matters as we have deemed relevant to our inquiry.
In conducting our review and arriving at our opinion, we have relied upon and assumed the accuracy and completeness of all of the financial and other information provided to us or publicly available and we have not independently verified the accuracy or completeness of any such information or assumed any responsibility or liability for such verification, accuracy or completeness. We have relied upon the management of NCBS as to the reasonableness and achievability of the financial and operating forecasts and projections of NCBS and the estimates regarding certain pro forma financial effects of the Merger on NCBS (and the assumptions and bases for such forecasts, projections and estimates) which were prepared by, and provided to and discussed with us by, such management, and have further relied on such management as to the reasonableness and achievability of the publicly available consensus “street
Keefe, Bruyette & Woods, a Stifel Company • 787 Seventh Avenue, 5th Floor, New York, NY 10019
(212) 887-7777 • www.kbw.com
(212) 887-7777 • www.kbw.com
B-2
estimates” of BYLK and long term growth rates referred to above that were discussed with us by NCBS management and that we were directed by such management to use. We have assumed, at the direction of NCBS, that all of the foregoing forecasts, projections and estimates reflect, or in the case of the BYLK publicly available “street estimates” referred to above are consistent with, the best currently available estimates and judgments of NCBS management, and that such forecasts, projections and estimates will be realized in the amounts and in the time periods currently estimated. We express no view or opinion as to the New Bancshares Acquisition (or any terms, aspects or implications thereof) and have assumed, at the direction of NCBS, that the New Bancshares Acquisition will be consummated as described to us by BYLK management in the fourth quarter of 2015.
It is understood that the forecasts, projections and estimates of NCBS and BYLK that were provided to and discussed with us were not prepared with the expectation of public disclosure, that all such information, together with the publicly available consensus “street estimates” of BYLK referred to above, are based on numerous variables and assumptions that are inherently uncertain, including, without limitation, factors related to general economic and competitive conditions and that, accordingly, actual results could vary significantly from those set forth in such forecasts, projections and estimates. We have assumed, based on discussions with management of NCBS and with the consent of the Board, that all such information provides a reasonable basis upon which we could form our opinion and we express no view as to any such information or the assumptions or bases therefor. We have relied on all such information without independent verification or analysis and do not in any respect assume any responsibility or liability for the accuracy or completeness thereof.
We also assumed that there were no material changes in the assets, liabilities, financial condition, results of operations, business or prospects of either NCBS or BYLK since the date of the last financial statements of each such entity that were made available to us. We are not experts in the independent verification of the adequacy of allowances for loan and lease losses and we have assumed, without independent verification and with your consent that the aggregate allowances for loan and lease losses for NCBS and BYLK are adequate to cover such losses. In rendering our opinion, we have not made or obtained any evaluations or appraisals or physical inspection of the property, assets or liabilities (contingent or otherwise) of NCBS or BYLK, the collateral securing any of such assets or liabilities, or the collectability of any such assets, nor have we examined any individual loan or credit files, nor did we evaluate the solvency, financial capability or fair value of NCBS or BYLK under any state or federal laws, including those relating to bankruptcy, insolvency or other matters. Estimates of values of companies and assets do not purport to be appraisals or necessarily reflect the prices at which companies or assets may actually be sold. Because such estimates are inherently subject to uncertainty, we assume no responsibility or liability for their accuracy.
We have assumed, in all respects material to our analyses, the following: (i) that the Merger will be completed substantially in accordance with the terms set forth in the Agreement (the final terms of which we have assumed will not differ in any respect material to our analyses from the draft version reviewed) with no adjustments to the Exchange Ratio and with no other consideration or payments in respect of the BYLK Common Stock; (ii) that any related transactions (including the Bank Merger, the BYLK Special Dividend and the NCBS Preferred Stock Redemption) will be completed as contemplated by the Agreement and as described to us by representatives of NCBS; (iii) that the representations and warranties of each party in the Agreement and in all related documents and instruments referred to in the Agreement are true and correct; (iv) that each party to the Agreement and all related documents will perform all of the covenants and agreements required to be performed by such party under such documents; (v) that there are no factors that would delay or subject to any adverse conditions, any necessary regulatory or governmental approval for the Merger and any related transactions and that all conditions to the completion of the Merger and any related transactions will be satisfied without any waivers or modifications to the Agreement; and (vi) that in the course of obtaining the necessary regulatory, contractual, or other consents or approvals for the Merger and any related transactions, no restrictions, including any divestiture requirements, termination or other payments or amendments or modifications, will be imposed that will have a material adverse effect on the future results of operations or financial condition of NCBS, BYLK or the pro forma entity or the contemplated benefits of the Merger, including the cost savings and related
Keefe, Bruyette & Woods, a Stifel Company • 787 Seventh Avenue, 5th Floor, New York, NY 10019
(212) 887-7777 • www.kbw.com
(212) 887-7777 • www.kbw.com
B-3
expenses expected to result or be derived from the Merger. We have assumed that the Merger will be consummated in a manner that complies with the applicable provisions of the Securities Act of 1933, as amended, the Securities Exchange Act of 1934, as amended, and all other applicable federal and state statutes, rules and regulations. We have further been advised by representatives of NCBS that NCBS has relied upon advice from its advisors (other than KBW) or other appropriate sources as to all legal, financial reporting, tax, accounting and regulatory matters with respect to NCBS, BYLK, the Merger and any related transaction (including the Bank Merger, the BYLK Special Dividend and the NCBS Preferred Stock Redemption), the New Bancshares Acquisition, and the Agreement. KBW has not provided advice with respect to any such matters.
This opinion addresses only the fairness, from a financial point of view, as of the date hereof, of the Exchange Ratio in the Merger to NCBS. We express no view or opinion as to any other terms or aspects of the Merger or any term or aspect of any related transaction (including the Bank Merger, the BYLK Special Dividend and the NCBS Preferred Stock Redemption), including without limitation, the form or structure of the Merger or any related transaction, any consequences of the Merger to NCBS, its stockholders, creditors or otherwise, or any terms, aspects or implications of any employment, voting, support, stockholder or other agreements, arrangements or understandings contemplated or entered into in connection with the Merger, any related transaction, or otherwise. Our opinion is necessarily based upon conditions as they exist and can be evaluated on the date hereof and the information made available to us through the date hereof. It is understood that subsequent developments may affect the conclusion reached in this opinion and that KBW does not have an obligation to update, revise or reaffirm this opinion. Our opinion does not address, and we express no view or opinion with respect to, (i) the underlying business decision of NCBS to engage in the Merger or enter into the Agreement, (ii) the relative merits of the Merger as compared to any strategic alternatives that are, have been or may be available to or contemplated by NCBS or the Board, (iii) the fairness of the amount or nature of any compensation to any of NCBS’s officers, directors or employees, or any class of such persons, relative to any compensation to the holders of NCBS Common Stock or BYLK Common Stock or relative to the Exchange Ratio, (iv) the effect of the Merger or any related transaction on, or the fairness of the consideration to be received by, holders of any class of securities of NCBS or BYLK or any other party to any other transaction contemplated by the Agreement, (v) the actual value of NCBS Common Stock to be issued in the Merger, (vi) the prices, trading range or volume at which NCBS Common Stock or BYLK Common Stock may trade following the public announcement of the Merger or the prices, trading range or volume at which NCBS Common Stock may trade following the consummation of the Merger, (vii) whether NCBS has sufficient cash, available lines of credit or other sources of funds to enable it to complete the NCBS Preferred Stock Redemption, (viii) any advice or opinions provided by any other advisor to any of the parties to the Merger or any other transaction contemplated by the Agreement, or (ix) any legal, regulatory, accounting, tax or similar matters relating to NCBS, BYLK, any of their respective shareholders, or relating to or arising out of or as a consequence of the Merger or any other related transaction (including the Bank Merger, the BYLK Special Dividend and the NCBS Preferred Stock Redemption), or the New Bancshares Acquisition, including whether or not the Merger would qualify as a tax-free reorganization for United States federal income tax purposes.
This opinion is for the information of, and is directed to, the Board (in its capacity as such) in connection with its consideration of the financial terms of the Merger. This opinion does not constitute a recommendation to the Board as to how it should vote on the Merger or to any holder of NCBS Common Stock or any shareholder of any other entity as to how to vote in connection with the Merger or any other matter, nor does it constitute a recommendation as to whether or not any such shareholder should enter into a voting, shareholders’, or affiliates’ agreement with respect to the Merger or exercise any dissenters’ or appraisal rights that may be available to such shareholder.
This opinion has been reviewed and approved by our Fairness Opinion Committee in conformity with our policies and procedures established under the requirements of Rule 5150 of the Financial Industry Regulatory Authority.
Keefe, Bruyette & Woods, a Stifel Company • 787 Seventh Avenue, 5th Floor, New York, NY 10019
(212) 887-7777 • www.kbw.com
(212) 887-7777 • www.kbw.com
B-4
Based upon and subject to the foregoing, it is our opinion that, as of the date hereof, the Exchange Ratio in the Merger is fair, from a financial point of view, to NCBS.
Very truly yours,
Keefe, Bruyette & Woods, Inc.
Keefe, Bruyette & Woods, a Stifel Company • 787 Seventh Avenue, 5th Floor, New York, NY 10019
(212) 887-7777 • www.kbw.com
(212) 887-7777 • www.kbw.com
B-5
APPENDIX C
[LETTERHEAD OF SANDLER O’NEILL & PARTNERS, L.P.]
September 8, 2015
Board of Directors
Baylake Corp.
217 North Fourth Avenue
Sturgeon Bay, WI 54235
Baylake Corp.
217 North Fourth Avenue
Sturgeon Bay, WI 54235
Ladies and Gentlemen:
Baylake Corp. (“Baylake”) and Nicolet Bankshares, Inc. (“Nicolet”) have entered into an Agreement and Plan of Merger, dated September 8, 2015 (the “Agreement”), pursuant to which Baylake will merge with and into Nicolet with Nicolet being the surviving entity (the “Merger”). Pursuant to the terms of the Agreement, upon the Effective Time of the Merger, all shares of Baylake common stock issued and outstanding immediately prior to the Effective Time (“Baylake Common Stock”), other than certain shares described in the Agreement, will be converted into the right to receive 0.4517 shares of Nicolet common stock (the “Stock Consideration”). The Stock Consideration and any cash in lieu of fractional shares paid pursuant to the Agreement are referred to herein as the “Merger Consideration.” The other terms and conditions of the Merger are more fully set forth in the Agreement, and capitalized terms used herein without definition shall have the meanings assigned to them in the Agreement. You have requested our opinion as to the fairness, from a financial point of view, of the Merger Consideration to the holders of Baylake Common Stock.
Sandler O’Neill & Partners, L.P., as part of its investment banking business, is regularly engaged in the valuation of financial institutions and their securities in connection with mergers and acquisitions and other corporate transactions. In connection with this opinion, we have reviewed, among other things: (i) the Agreement; (ii) certain publicly available financial statements and other historical financial information of Baylake that we deemed relevant; (iii) certain publicly available financial statements and other historical financial information of Nicolet that we deemed relevant; (iv) publicly available mean and median analyst earnings per share estimates for Baylake for the years ending December 31, 2015 and December 31, 2016, and an estimated long-term annual growth rate for the years thereafter as reviewed with and confirmed by the senior management of Baylake; (v) certain internal financial projections for Nicolet for the years ending December 31, 2015 through December 31, 2017, as reviewed with and confirmed by the senior management of Nicolet and an estimated long-term annual growth rate for the years thereafter; (vi) the relative contributions of assets, liabilities, equity and earnings of Baylake and Nicolet to the combined entity; (vii) the pro forma financial impact of the Merger on Nicolet based on assumptions related to transaction expenses, purchase accounting adjustments, the treatment of Nicolet’s outstanding Series C non-cumulative perpetual preferred stock issued through the Small Business Lending Fund (“Nicolet Preferred Stock”), a special dividend of $0.40 per share to paid to the holders of Baylake Common Stock immediately prior to the closing of the Merger (the “Special Dividend”), as well as certain cost savings and other synergies as discussed with the senior managements of Baylake and Nicolet; (viii) a comparison of certain stock trading, financial and other information for Baylake and Nicolet with similar publicly available information for certain other bank and thrift institutions, the securities of which are publicly traded; (ix) a comparison of certain pro forma financial information for the combined entity, as discussed with the senior management of Baylake and Nicolet, with similar publicly available information for certain bank and thrift institutions, the securities of which are publicly traded; (x) the financial terms of certain other recent merger and acquisition transactions in the banking sector; (xi) the current market environment generally and the banking environment in particular; and (xii) such other information, financial studies, analyses and investigations and financial, economic and market criteria as we considered relevant. We also discussed with certain members of the senior management of Baylake the business, financial condition, results of operations and prospects of Baylake and held similar discussions with the senior management of Nicolet regarding the business, financial condition, results of operations and prospects of Nicolet.
In performing our review, we have relied upon the accuracy and completeness of all of the financial and other information that was available to us from public sources, that was provided to us by Baylake and Nicolet, or that was otherwise reviewed by us and we have assumed such accuracy and completeness for
C-1
purposes of preparing this letter. We have further relied on the assurances of the senior management of Baylake and Nicolet that they are not aware of any facts or circumstances that would make any of such information inaccurate or misleading in any material respect. We have not been asked to undertake, and have not undertaken, an independent verification of any of such information and we do not assume any responsibility or liability for the accuracy or completeness thereof. We did not make an independent evaluation or appraisal of the specific assets, the collateral securing assets or the liabilities (contingent or otherwise) of Baylake or Nicolet, nor have we reviewed any individual credit files of Baylake or Nicolet. We did not make an independent evaluation of the adequacy of the allowance for loan losses of Baylake or Nicolet and we have assumed, with your consent, that the respective allowances for loan losses for both Baylake and Nicolet are adequate to cover such losses and will be adequate on a pro forma basis for the combined entity.
In preparing its analyses, Sandler O’Neill used publicly available mean and median analyst earnings per share estimates for Baylake for the years ending December 31, 2015 and December 31, 2016, and an estimated long-term annual growth rate for the years thereafter as reviewed with and confirmed by the senior management of Baylake, as well as certain internal financial projections for Nicolet for the years ending December 31, 2015 through December 31, 2017, as reviewed with and confirmed by the senior management of Nicolet, and an estimated long-term annual growth rate for the years thereafter. Sandler O’Neill also received and used in its analyses certain assumptions related to transaction expenses, purchase accounting adjustments, the treatment of Nicolet Preferred Stock, the Special Dividend, as well as certain cost savings and other synergies as discussed with the senior managements of Baylake and Nicolet. With respect to those projections and estimates, the senior management of Baylake and Nicolet confirmed to us that they reflected the best currently available projections and estimates of the senior management of Baylake and Nicolet, respectively, and we assumed that such projections and estimates would be achieved. We express no opinion as to any such projections or estimates or the assumptions on which they are based. We have also assumed that there has been no material change in the respective assets, financial condition, results of operations, business or prospects of Baylake or Nicolet since the date of the most recent financial statements made available to us. We have assumed in all respects material to our analysis that Baylake and Nicolet will remain as going concerns for all periods relevant to our analyses. We express no opinion as to any of the legal, accounting and tax matters relating to the Merger and any other transactions contemplated in connection therewith.
We have also assumed, with your consent, that (i) each of the parties to the Agreement will comply in all material respects with all material terms of the Agreement, that all of the representations and warranties contained in the Agreement are true and correct in all material respects, that each of the parties to the Agreement will perform in all material respects all of the covenants required to be performed by such party under the Agreement and that the conditions precedent in the Agreement are not waived, (ii) in the course of obtaining the necessary regulatory or third party approvals, consents and releases with respect to the Merger, no delay, limitation, restriction or condition will be imposed that would have an adverse effect on Baylake, Nicolet or the Merger, and (iii) the Merger and any related transactions will be consummated in accordance with the terms of the Agreement without any waiver, modification or amendment of any material term, condition or agreement thereof and in compliance with all applicable laws and other requirements. We have also assumed, with your consent, that the pending acquisition of New Bancshares, Inc. by Baylake will be consummated in accordance with the terms of the applicable merger agreement without any waiver, modification or amendment of any material term, condition or agreement thereof and in compliance with all applicable laws and other requirements.
Our analyses and the views expressed herein are necessarily based on financial, economic, regulatory, market and other conditions as in effect on, and the information made available to us as of, the date hereof. Events occurring after the date hereof could materially affect our views. We have not undertaken to update, revise, reaffirm or withdraw this letter or otherwise comment upon events occurring after the date hereof.
We have acted as financial advisor to the Board of Directors of Baylake in connection with the Merger and a portion of our fee is contingent upon the closing of the Merger. We will also receive a fee for rendering this opinion. The Buyer has also agreed to indemnify us against certain liabilities arising out of our engagement and to reimburse us for certain of our out-of-pocket expenses incurred in connection with our engagement. In the past, as we have previously advised you, we have provided certain investment
C-2
banking services to Nicolet and have received customary investment banking fees for such services and may provide, and receive compensation for, such services in the future. In addition, in the ordinary course of our business as a broker-dealer, we may purchase securities from or sell securities to Baylake, Nicolet or their respective affiliates. We may also actively trade the securities of Baylake or Nicolet for our own account and for the accounts of our customers and, accordingly, may at any time hold a long or short position in such securities.
This letter is directed to the Board of Directors of Baylake in connection with its consideration of the Merger and does not constitute a recommendation to any shareholder of Baylake as to how such shareholder should vote at any meeting of shareholders called to consider and vote upon the Merger. Our opinion is directed only to the fairness, from a financial point of view, of the Merger Consideration to the holders of Baylake Common Stock and does not address the underlying business decision of Baylake to engage in the Merger, the form or structure of the Merger, the relative merits of the Merger as compared to any other alternative business strategies that might exist for Baylake or the effect of any other transaction in which Baylake might engage. We also do not express any opinion as to the fairness of the amount or nature of the compensation to be received in the Merger by Baylake’s officers, directors, or employees, or class of such persons, relative to the compensation to be received in the Merger by any other shareholders of Baylake. This opinion has been approved by Sandler O’Neill’s fairness opinion committee. This opinion shall not be reproduced without Sandler O’Neill’s prior written consent, provided however Sandler O’Neill will provide its consent for the opinion to be included in required regulatory filings to be completed in connection with the Merger.
Based upon and subject to the foregoing, it is our opinion that, as of the date hereof, the Merger Consideration is fair, from a financial point of view, to the holders of Baylake Common Stock.
Very truly yours,
/s/ Sandler O’Neill & Partners, L.P.
C-3
PART II
INFORMATION NOT REQUIRED IN PROSPECTUS
Item 20. Indemnification of Directors and Officers
The Registrant’s bylaws provide for the mandatory indemnification of a director, officer, employee or agent of the Registrant (or a person concurrently serving in such a capacity with another entity at the Registrant’s request), to the extent such person has been successful on the merits or otherwise in the defense of any threatened, pending or completed civil, criminal, administrative or investigative action, suit, arbitration or other proceeding brought by or in the right of the Registrant or by any other person or entity to which such person is a party because he or she is a director, officer, employee or agent, for all reasonable fees, costs, charges, disbursements, attorneys’ fees and other expenses incurred in connection with proceeding. In all other cases, the Registrant shall indemnify a director or officer, and may indemnify an employee or agent, of the Registrant against all liability and reasonable fees, costs, charges, disbursements, attorneys’ fees and other expenses incurred by such person in any proceeding brought by or in the right of the Registrant or by any other person or entity to which such person is a party because he or she is a director, officer, employee or agent, unless it has been proven by final adjudication that such person breached or failed to perform a duty owed to Nicolet that constituted:
•
a willful failure to deal fairly with the Registrant or its shareholders in connection with a matter in which the director, officer, employee or agent has a material conflict of interest;
•
a violation of criminal law, unless the director, officer, employee or agent had reasonable cause to believe his or her conduct was lawful or no reasonable cause to believe his or her conduct was unlawful;
•
a transaction from which the director, officer, employee or agent derived an improper personal profit; or
•
willful misconduct.
Unless modified by written agreement, the determination as to whether indemnification is proper shall be made in accordance with the Wisconsin Business Corporation Law. The right to indemnification under the Registrant’s bylaws may only be amended by the vote of two-thirds of the outstanding shares of the Registrant’s capital stock entitled to vote on the matter. The Registrant is authorized to purchase and maintain insurance on behalf of its directors, officers, employees or agents in connection with the foregoing indemnification obligations.
Item 21. Exhibits and Financial Statement Schedules
(a) List of Exhibits
|
Exhibit
|
| |
Description of Exhibit
|
|
| 2.1 | | | Agreement and Plan of Merger by and between Nicolet Bankshares, Inc. and Baylake Corp., dated September 8, 2015 (attached as Appendix A to the proxy statement-prospectus, which is part of this registration statement and incorporated herein by reference).+ | |
| 5.1 | | | Opinion of Godfrey & Kahn, S.C. regarding legality of securities being registered (including its consent). | |
| 8.1 | | | Opinion of Bryan Cave LLP regarding certain tax matters (including its consent).** | |
| 23.1 | | | Consent of Godfrey & Kahn, S.C. (included as part of Exhibit 5.1). | |
| 23.2 | | | Consent of Bryan Cave LLP (included as part of Exhibit 8.1).** | |
| 23.3 | | | Consent of Porter Keadle Moore, LLC. | |
| 23.4 | | | Consent of Baker Tilly Virchow Krause, LLP. | |
| 24.1 | | | Power of Attorney (included in the signature pages to the Registration Statement on Form S-4).** | |
| 99.1 | | | Consent of Keefe, Bruyette & Woods, Inc.** | |
| 99.2 | | | Consent of Sandler O’Neill & Partners, L.P. | |
II-1
|
Exhibit
|
| |
Description of Exhibit
|
|
| 99.3 | | | Consent of Robert W. Agnew to be named as a director.** | |
| 99.4 | | | Consent of Robert J. Cera to be named as a director.** | |
| 99.5 | | | Consent of Terrence R. Fulwiler to be named as a director.** | |
| 99.6 | | | Consent of Thomas L. Herlache to be named as a director.** | |
| 99.7 | | | Consent of Louis J. Jeanquart to be named as a director.** | |
| 99.8 | | | Consent of William D. Murphy to be named as a director.** | |
| 99.9 | | | Consent of Dean J. Nolden to be named as a director.** | |
| 99.10 | | | Consent of Elyse Mollner Stackhouse to be named as a director.** | |
| 99.11 | | | Form of Proxy Card of Nicolet. | |
| 99.12 | | | Form of Proxy Card of Baylake. | |
+
Certain schedules and attachments to the merger agreement have been omitted from this filing pursuant to Item 601(b)(2) of Regulation S-K. Nicolet Bankshares, Inc. agrees to furnish a supplemental copy of any omitted schedule or attachment to the SEC upon request.
**
Previously filed.
(b) Financial Statement Schedules
None. All other schedules for which provision is made in Regulation S-X of the Securities and Exchange Commission are either not required under the related restrictions, are inapplicable or the required information has been incorporated by reference into the joint proxy statement-prospectus, and, therefore, have been omitted.
(c)
Opinions of Keefe, Bruyette & Woods, Inc. and Sandler O’Neill & Partners, L.P. have been furnished as Appendices B and C to the joint proxy statement-prospectus.
Item 22. Undertakings
The undersigned registrant hereby undertakes:
(a)(1)
To file, during any period in which offers or sales are being made, a post-effective amendment to this Registration Statement:
(i)
To include any prospectus required by section 10(a)(3) of the Securities Act of 1933;
(ii)
To reflect in the prospectus any facts or events arising after the effective date of the Registration Statement (or the most recent post-effective amendment thereof) which, individually or in the aggregate, represent a fundamental change in the information set forth in the registration statement. Notwithstanding the foregoing, any increase or decrease in volume of securities offered (if the total dollar value of securities offered would not exceed that which was registered) and any deviation from the low or high end of the estimated maximum offering range may be reflected in the form of prospectus filed with the Commission pursuant to Rule 424(b) if, in the aggregate, the changes in volume and price represent no more than a 20 percent change in the maximum aggregate offering price set forth in the “Calculation of Registration Fee” table in the effective Registration Statement; and
(iii)
To include any material information with respect to the plan of distribution not previously disclosed in the Registration Statement or any material change to such information in the Registration Statement.
(2)
That, for the purpose of determining any liability under the Securities Act of 1933, each such post-effective amendment shall be deemed to be a new registration statement relating to the securities offered therein, and the offering of such securities at that time shall be deemed to be the initial bona fide offering thereof.
II-2
(3)
To remove from registration by means of a post-effective amendment any of the securities being registered which remain unsold at the termination of the offering.
(b)
The undersigned registrant hereby undertakes that, for purposes of determining any liability under the Securities Act of 1933, each filing of the registrant’s annual report pursuant to section 13(a) or section 15(d) of the Securities Exchange Act of 1934 (and, where applicable, each filing of an employee benefit plan’s annual report pursuant to section 15(d) of the Securities Exchange Act of 1934) that is incorporated by reference in the registration statement shall be deemed to be a new registration statement relating to the securities offered therein, and the offering of such securities at that time shall be deemed to be the initial bona fide offering thereof.
(e)
The undersigned registrant hereby undertakes to deliver or cause to be delivered with the prospectus, to each person to whom the prospectus is sent or given, the latest annual report to security holders that is incorporated by reference in the prospectus and furnished pursuant to and meeting the requirements of Rule 14a-3 or Rule 14c-3 under the Securities Exchange Act of 1934; and, where interim financial information required to be presented by Article 3 of Regulation S-X are not set forth in the prospectus, to deliver, or cause to be delivered to each person to whom the prospectus is sent or given, the latest quarterly report that is specifically incorporated by reference in the prospectus to provide such interim financial information.
(g)(1)
The undersigned registrant hereby undertakes as follows: that prior to any public reoffering of the securities registered hereunder through use of a prospectus which is a part of this registration statement, by any person or party who is deemed to be an underwriter within the meaning of Rule 145(c), the issuer undertakes that such reoffering prospectus will contain the information called for by the applicable registration form with respect to reofferings by persons who may be deemed underwriters, in addition to the information called for by the other items of the applicable form.
(2)
The registrant undertakes that every prospectus (i) that is filed pursuant to paragraph (1) immediately preceding, or (ii) that purports to meet the requirements of section 10(a)(3) of the Act and is used in connection with an offering of securities subject to Rule 415, will be filed as a part of an amendment to the registration statement and will not be used until such amendment is effective, and that, for purposes of determining any liability under the Securities Act of 1933, each such post-effective amendment shall be deemed to be a new registration statement relating to the securities offered therein, and the offering of such securities at that time shall be deemed to be the initial bona fide offering thereof.
(h)
Insofar as indemnification for liabilities arising under the Securities Act of 1933 may be permitted to directors, officers and controlling persons of the registrant pursuant to the foregoing provisions, or otherwise, the registrant has been advised that in the opinion of the Securities and Exchange Commission, such indemnification is against public policy as expressed in the Act and is, therefore, unenforceable. In the event that a claim for indemnification against such liabilities (other than the payment by the registrant of expenses incurred or paid by a director, officer or controlling person of the registrant in the successful defense of any action, suit or proceeding) is asserted by such director, officer or controlling person in connection with the securities being registered, the registrant will, unless in the opinion of its counsel the matter has been settled by controlling precedent, submit to a court of appropriate jurisdiction the question whether such indemnification by it is against public policy as expressed in the Act and will be governed by the final adjudication of such issue.
The undersigned registrant hereby undertakes to respond to requests for information that is incorporated by reference into the prospectus pursuant to Items 4, 10(b), 11 or 13 of this Form, within one business day of receipt of such request, and to send the incorporated documents by first class mail or other equally prompt means. This includes information contained in documents filed subsequent to the effective date of the registration statement through the date of responding to the request.
The undersigned registrant hereby undertakes to supply by means of a post-effective amendment all information concerning a transaction, and the company being acquired involved therein, that was not the subject of and included in the registration statement when it became effective.
II-3
SIGNATURES
Pursuant to the requirements of the Securities Act of 1933, the registrant has filed this registration statement to be signed on its behalf by the undersigned, thereunto duly authorized, in the City of Green Bay, State of Wisconsin, on February 25, 2016.
| | | | | NICOLET BANKSHARES, INC. | | |||
| | | | | By: | | | /s/ Robert B. Atwell | |
| | | | | | | | Robert B. Atwell, Chairman, President and Chief Executive Officer |
|
POWER OF ATTORNEY
Pursuant to the requirements of the Securities Act of 1933, this Registration Statement has been signed by the following persons in the capacities stated and on the 25th day of February, 2016.
/s/ Robert B. Atwell
Robert B. Atwell
Chairman, President, Chief Executive Officer and Director
(Principal Executive Officer)
Chairman, President, Chief Executive Officer and Director
(Principal Executive Officer)
*
Ann K. Lawson
Chief Financial Officer
(Principal Financial and Accounting Officer)
Chief Financial Officer
(Principal Financial and Accounting Officer)
*
Michael E. Daniels
Director
Director
*
John N. Dykema
Director
Director
*
Gary L. Fairchild
Director
Director
*
Michael F. Felhofer
Director
Director
*
Christopher J. Ghidorzi
Director
Director
*
Kim A. Gowey
Director
Director
*
Andrew F. Hetzel, Jr.
Director
Director
*
Donald J. Long, Jr.
Director
Director
*
Susan L. Merkatoris
Director
Director
*
Therese B. Pandl
Director
Director
*
Randy J. Rose
Director
Director
*
Robert J. Weyers
Director
Director
| | *By: | | |
/s/ Robert B. Atwell
Robert B. Atwell
As Attorney-in-Fact |
|
EXHIBIT INDEX
|
Exhibit
|
| |
Description of Exhibit
|
|
| 2.1 | | | Agreement and Plan of Merger by and between Nicolet Bankshares, Inc. and Baylake Corp., dated September 8, 2015 (attached as Appendix A to the proxy statement-prospectus, which is part of this registration statement and incorporated herein by reference).+ | |
| 5.1 | | | Opinion of Godfrey & Kahn, S.C. regarding legality of securities being registered (including its consent). | |
| 8.1 | | | Opinion of Bryan Cave LLP regarding certain tax matters (including its consent).** | |
| 23.1 | | | Consent of Godfrey & Kahn, S.C. (included as part of Exhibit 5.1). | |
| 23.2 | | | Consent of Bryan Cave LLP (included as part of Exhibit 8.1).** | |
| 23.3 | | | Consent of Porter Keadle Moore, LLC. | |
| 23.4 | | | Consent of Baker Tilly Virchow Krause, LLP. | |
| 24.1 | | | Power of Attorney (included in the signature pages to the Registration Statement on Form S-4).** | |
| 99.1 | | | Consent of Keefe, Bruyette & Woods, Inc.** | |
| 99.2 | | | Consent of Sandler O’Neill & Partners, L.P. | |
| 99.3 | | | Consent of Robert W. Agnew to be named as a director.** | |
| 99.4 | | | Consent of Robert J. Cera to be named as a director.** | |
| 99.5 | | | Consent of Terrence R. Fulwiler to be named as a director.** | |
| 99.6 | | | Consent of Thomas L. Herlache to be named as a director.** | |
| 99.7 | | | Consent of Louis J. Jeanquart to be named as a director.** | |
| 99.8 | | | Consent of William D. Murphy to be named as a director.** | |
| 99.9 | | | Consent of Dean J. Nolden to be named as a director.** | |
| 99.10 | | | Consent of Elyse Mollner Stackhouse to be named as a director.** | |
| 99.11 | | | Form of Proxy Card of Nicolet. | |
| 99.12 | | | Form of Proxy Card of Baylake. | |
+
Certain schedules and attachments to the merger agreement have been omitted from this filing pursuant to Item 601(b)(2) of Regulation S-K. Nicolet Bankshares, Inc. agrees to furnish a supplemental copy of any omitted schedule or attachment to the SEC upon request.
**
Previously filed.


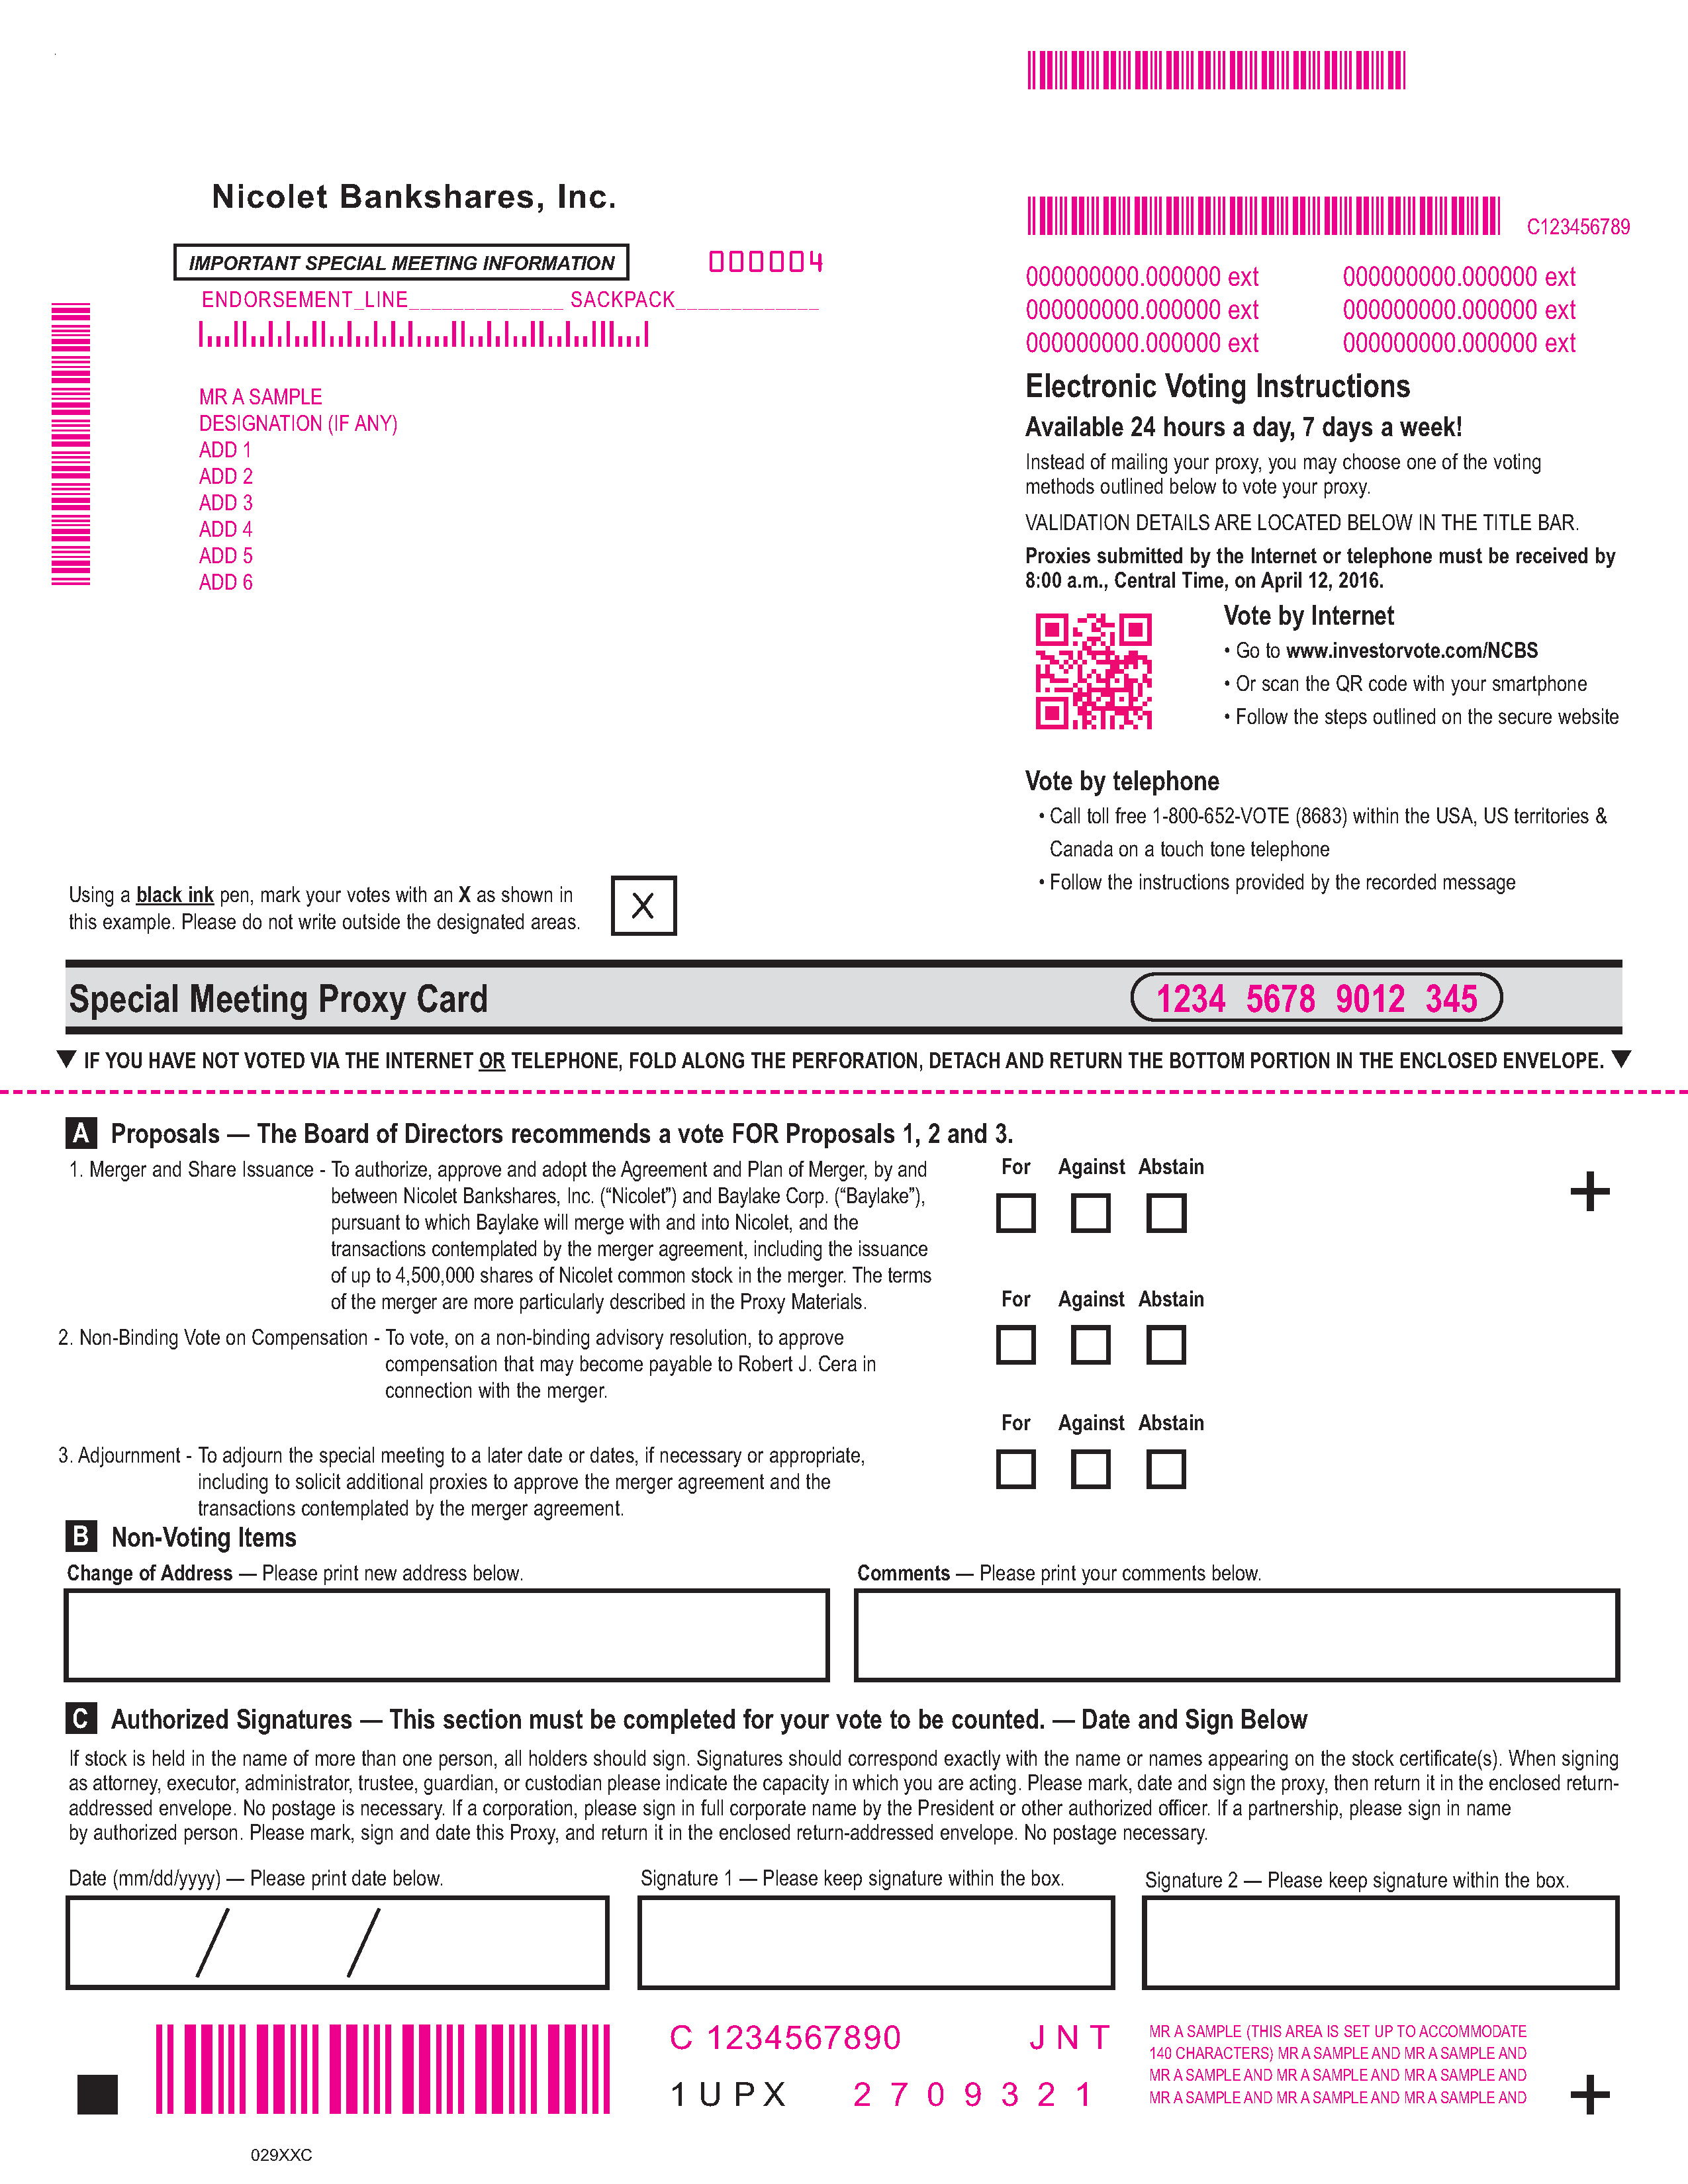 Using a black ink pen, mark your votes with an X as shown in this example. Please do not write outside the designated areas. X Nicolet Bankshares, Inc. 029XXC 1 U PX + Special Meeting Proxy Card . + A IMPORTANT SPECIAL MEETING INFORMATION 2. Non-Binding Vote on Compensation - To vote, on a non-binding advisory resolution, to approve compensation that may become payable to Robert J. Cera in connection with the merger. 1. Merger and Share Issuance - To authorize, approve and adopt the Agreement and Plan of Merger, by and between Nicolet Bankshares, Inc. ("Nicolet") and Baylake Corp. ("Baylake"), pursuant to which Baylake will merge with and into Nicolet, and the transactions contemplated by the merger agreement, including the issuance of up to 4,500,000 shares of Nicolet common stock in the merger. The terms of the merger are more particularly described in the Proxy Materials. 3. Adjournment - To adjourn the special meeting to a later date or dates, if necessary or appropriate, including to solicit additional proxies to approve the merger agreement and the transactions contemplated by the merger agreement. Proposals - The Board of Directors recommends a vote FOR Proposals 1, 2 and 3. C Authorized Signatures - This section must be completed for your vote to be counted. - Date and Sign Below If stock is held in the name of more than one person, all holders should sign. Signatures should correspond exactly with the name or names appearing on the stock certificate(s). When signing as attorney, executor, administrator, trustee, guardian, or custodian please indicate the capacity in which you are acting. Please mark, date and sign the proxy, then return it in the enclosed returnaddressed envelope. No postage is necessary. If a corporation, please sign in full corporate name by the President or other authorized officer. If a partnership, please sign in name by authorized person. Please mark, sign and date this Proxy, and return it in the enclosed return-addressed envelope. No postage necessary. Date (mm/dd/yyyy) - Please print date below. Signature 1 - Please keep signature within the box. Signature 2 - Please keep signature within the box. B Non-Voting Items Change of Address - Please print new address below. Comments - Please print your comments below. For Against Abstain For Against Abstain For Against Abstain MMMMMMMMMMMM MMMMMMMMMMMMMMM 000000000.000000 ext 000000000.000000 ext 000000000.000000 ext 000000000.000000 ext 000000000.000000 ext 000000000.000000 ext 000004 MR A SAMPLE DESIGNATION (IF ANY) ADD 1 ADD 2 ADD 3 ADD 4 ADD 5 ADD 6 ENDORSEMENT_LINE______________ SACKPACK_____________ 1234 5678 9012 345 MMMMMMM 2 7 0 9 3 2 1 MR A SAMPLE (THIS AREA IS SET UP TO ACCOMMODATE 140 CHARACTERS) MR A SAMPLE AND MR A SAMPLE AND MR A SAMPLE AND MR A SAMPLE AND MR A SAMPLE AND MR A SAMPLE AND MR A SAMPLE AND MR A SAMPLE AND MMMMMMMMM C 1234567890 J N T C123456789 qIF YOU HAVE NOT VOTED VIA THE INTERNET OR TELEPHONE, FOLD ALONG THE PERFORATION, DETACH AND RETURN THE BOTTOM PORTION IN THE ENCLOSED ENVELOPE.q Electronic Voting Instructions Available 24 hours a day, 7 days a week! Instead of mailing your proxy, you may choose one of the voting methods outlined below to vote your proxy. VALIDATION DETAILS ARE LOCATED BELOW IN THE TITLE BAR. Proxies submitted by the Internet or telephone must be received by 8:00 a.m., Central Time, on April 12, 2016. Vote by Internet o Go to www.investorvote.com/NCBS o Or scan the QR code with your smartphone o Follow the steps outlined on the secure website Vote by telephone o Call toll free 1-800-652-VOTE (8683) within the USA, US territories & Canada on a touch tone telephone o Follow the instructions provided by the recorded message
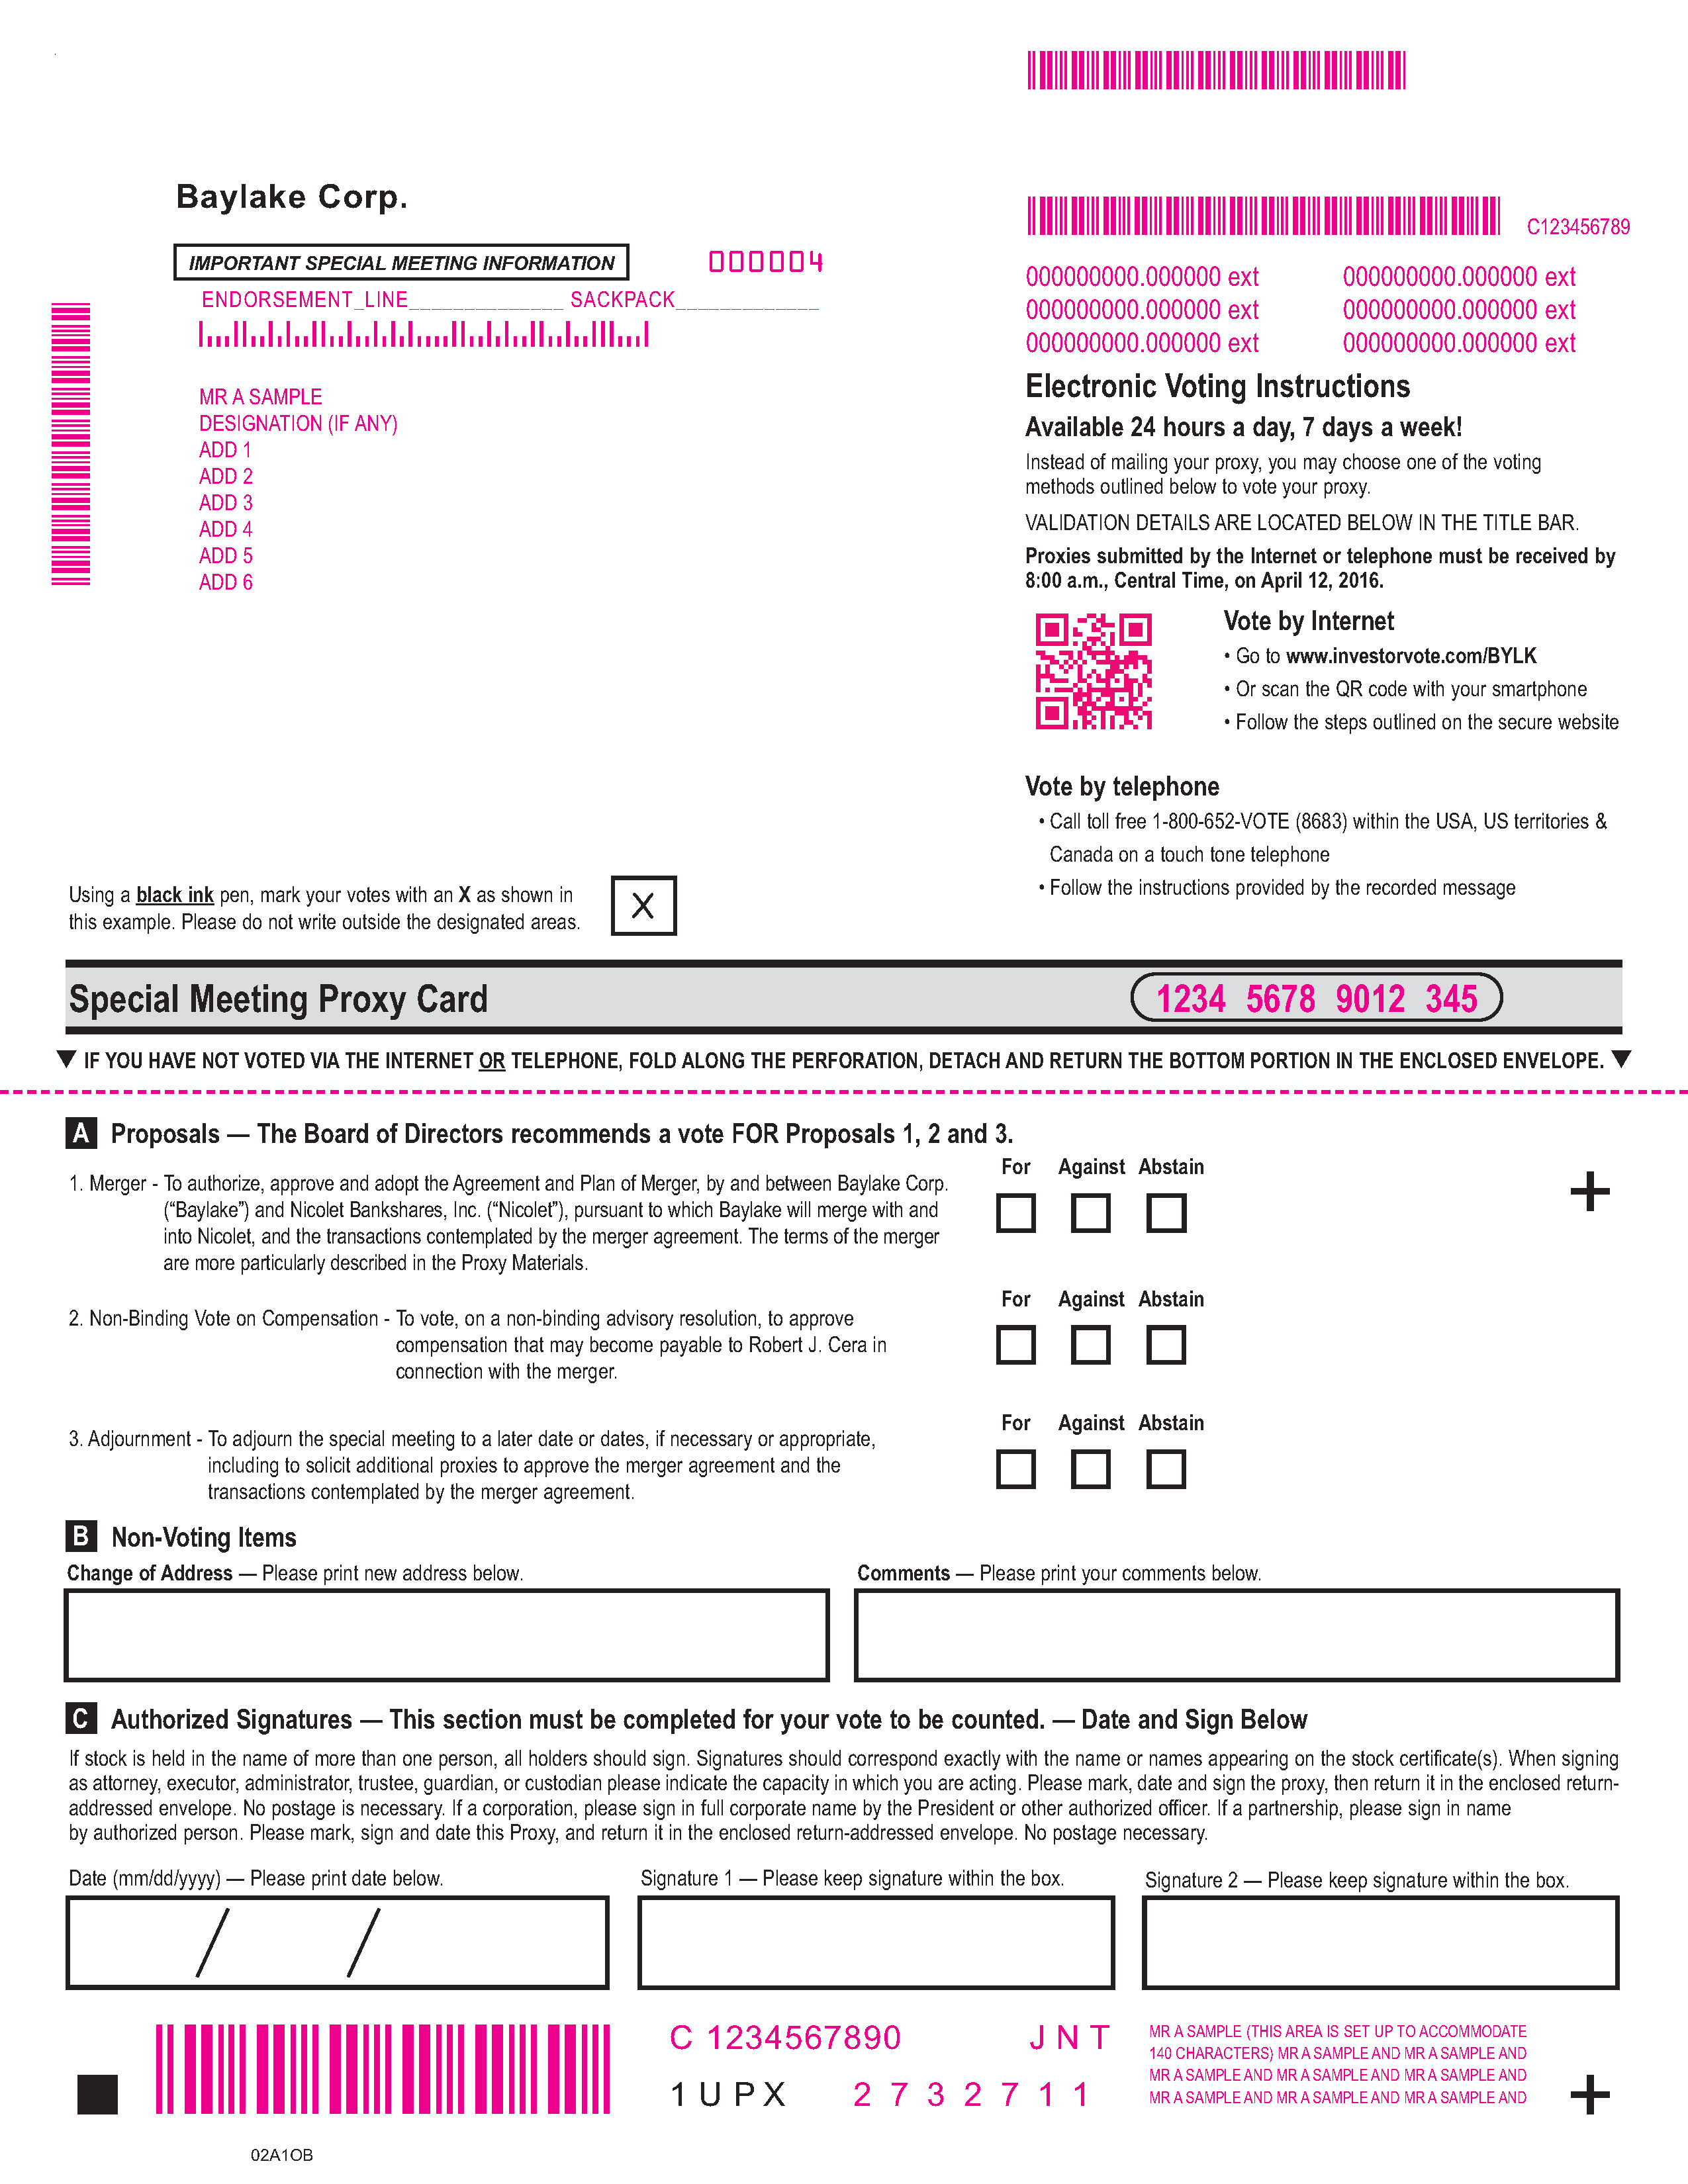 Using a black ink pen, mark your votes with an X as shown in this example. Please do not write outside the designated areas. X Baylake Corp. 02A1OB 1 U PX + Special Meeting Proxy Card . + A IMPORTANT SPECIAL MEETING INFORMATION 2. Non-Binding Vote on Compensation - To vote, on a non-binding advisory resolution, to approve compensation that may become payable to Robert J. Cera in connection with the merger. 1. Merger - To authorize, approve and adopt the Agreement and Plan of Merger, by and between Baylake Corp. ("Baylake") and Nicolet Bankshares, Inc. ("Nicolet"), pursuant to which Baylake will merge with and into Nicolet, and the transactions contemplated by the merger agreement. The terms of the merger are more particularly described in the Proxy Materials. 3. Adjournment - To adjourn the special meeting to a later date or dates, if necessary or appropriate, including to solicit additional proxies to approve the merger agreement and the transactions contemplated by the merger agreement. Proposals - The Board of Directors recommends a vote FOR Proposals 1, 2 and 3. C Authorized Signatures - This section must be completed for your vote to be counted. - Date and Sign Below If stock is held in the name of more than one person, all holders should sign. Signatures should correspond exactly with the name or names appearing on the stock certificate(s). When signing as attorney, executor, administrator, trustee, guardian, or custodian please indicate the capacity in which you are acting. Please mark, date and sign the proxy, then return it in the enclosed returnaddressed envelope. No postage is necessary. If a corporation, please sign in full corporate name by the President or other authorized officer. If a partnership, please sign in name by authorized person. Please mark, sign and date this Proxy, and return it in the enclosed return-addressed envelope. No postage necessary. Date (mm/dd/yyyy) - Please print date below. Signature 1 - Please keep signature within the box. Signature 2 - Please keep signature within the box. B Non-Voting Items Change of Address - Please print new address below. Comments - Please print your comments below. For Against Abstain For Against Abstain For Against Abstain MMMMMMMMMMMM MMMMMMMMMMMMMMM 000000000.000000 ext 000000000.000000 ext 000000000.000000 ext 000000000.000000 ext 000000000.000000 ext 000000000.000000 ext 000004 MR A SAMPLE DESIGNATION (IF ANY) ADD 1 ADD 2 ADD 3 ADD 4 ADD 5 ADD 6 ENDORSEMENT_LINE______________ SACKPACK_____________ 1234 5678 9012 345 MMMMMMM 2 7 3 2 7 1 1 MR A SAMPLE (THIS AREA IS SET UP TO ACCOMMODATE 140 CHARACTERS) MR A SAMPLE AND MR A SAMPLE AND MR A SAMPLE AND MR A SAMPLE AND MR A SAMPLE AND MR A SAMPLE AND MR A SAMPLE AND MR A SAMPLE AND MMMMMMMMM C 1234567890 J N T C123456789 qIF YOU HAVE NOT VOTED VIA THE INTERNET OR TELEPHONE, FOLD ALONG THE PERFORATION, DETACH AND RETURN THE BOTTOM PORTION IN THE ENCLOSED ENVELOPE.q Electronic Voting Instructions Available 24 hours a day, 7 days a week! Instead of mailing your proxy, you may choose one of the voting methods outlined below to vote your proxy. VALIDATION DETAILS ARE LOCATED BELOW IN THE TITLE BAR. Proxies submitted by the Internet or telephone must be received by 8:00 a.m., Central Time, on April 12, 2016. Vote by Internet o Go to www.investorvote.com/BYLK o Or scan the QR code with your smartphone o Follow the steps outlined on the secure website Vote by telephone o Call toll free 1-800-652-VOTE (8683) within the USA, US territories & Canada on a touch tone telephone o Follow the instructions provided by the recorded message