SECURITIES AND EXCHANGE COMMISSION
Washington, D.C. 20549
FORM 6-K
Report of Foreign Issuer
Pursuant to Rule 13a-16 or 15d-16 of the Securities Exchange Act of 1934
For the day of: January 31, 2013
Commission File Number 001-32500
TANZANIAN ROYALTY EXPLORATION CORPORATION
(Registrant's name)
404-1688 152nd Street
South Surrey, BC V4A 4N2
Canada
(Address of principal executive offices)
Indicate by check mark whether the registrant files or will file annual reports under cover Form 20-F or Form 40-F.
Form 20-F P Form 40-F ___
Indicate by check mark if the registrant is submitting the Form 6-K in paper as permitted by Regulation S-T Rule 101(b)(1):__
Indicate by check mark if the registrant is submitting the Form 6-K in paper as permitted by Regulation S-T Rule 101(b)(7):__
Indicate by check mark whether the registrant by furnishing the information contained in this Form is also thereby furnishing the information to the Commission pursuant to Rule 12g3-2(b) under the Securities Exchange Act of 1934.
Yes ___ No P
If "Yes" is marked, indicate below the file number assigned to the registrant in connection with Rule 12g3-2(b):
SIGNATURES
Pursuant to the requirements of the Securities Exchange Act of 1934, the registrant has duly caused this report to be signed on its behalf by the undersigned, thereunto duly authorized.
Tanzanian Royalty Exploration Corp.
(Registrant)
“James Sinclair”
Date: January 31, 2013
James E. Sinclair, Chief Executive Officer
Exhibit
Tanzanian Royalty Exploration Corporation 2012 Annual Report
|
The Chairman’s Report 2012
|
||||||||
|
|
||||||||
 |
Dear Friends,
|
in all metal industry companies has been dwarfed by investment funds, index funds, option strategies and hedge funds, many of whose managers are young enough never to have experienced the market’s potential to leverage a gold company’s shares to the price of gold rather than to earnings.
The cost factors of this industry have risen, but are far from changing that leverage characteristic. As the price of gold rises:
■ Lower grade material becomes economic.
■ Higher-grade material increases in value.
The industry is not without blame with regard to share price performance, as its leading entities seek always to reduce their tax obligation to minimum levels, not only in their countr(ies) of operation, but also domestically. This, of course, has an impact on their bottom line profit. It is our observation that major deposits among the leaders of the industry are developed with plant and equipment that pushes the envelope in science and, many times, in project management. The capital costs of these projects also enjoy
|
highly accelerated depreciation, which is a non-cash expense before earnings. That accelerated write-off of the cost of new plant, equipment and infra-structure is a highly sought-after benefit in a project’s accounting treatment, especially during its initial stages.
Hedge funds that speculate from the short side have focused interest on this industry because of its capital-intensive nature. The analysts from these funds may have over-stated increases in costs as a result of the accelerated deprecia-tion tax strategies employed by many of the majors. Furthermore, the capital budgets of the majors’ projects must take into account that they build facili-ties that rival a modern city. Accelerated depreciation on plant, equipment and infrastructure is a key aspect of the tax package that a major seeks in selecting its country of investment.
In our opinion and experience, the increasing costs of building and operating tend to understate earnings in the early years of any project. That does not have to be so, but is the predominant approach of management of the best known gold mining companies.
|
|||||
|
The most important final product in any public company lies in the reward to investors for their confidence in management and product. That means that values are translated efficiently into market recognition and therefore value.
|
||||||||
|
We believe we are fortunate to have as our President and CEO, Jim Sinclair with over 50 years’ experience in the mechanisms of finance plus success in efficient transmission of value to shareholders and investors in the metals industry. In particular, Mr. Sinclair’s many years of acting as a specialist and market maker is an asset to a company that seeks to reward its investors by accomplishment on the ground trans-mitted to share value.
Never before has this industry faced comparable challenges in the transmis-sion of value to market price. The explo-ration, development and production of properties is currently but one factor in valuation. Today, retail investment interest
|
||||||||
 |
||||||||
 |
|||||
|
The analysts for the investment and hedge funds that make up the new retail demand and short side speculative inter-ests in the market are not always, in our opinion, accurate in their assessment of capital risk.
As a company, via its third party consult-ants, produces 43-101 technical reports that speak to the cost elements of a project in very specific ways, the opportunity to obtain financing, assuming a positive feasibility study, expands beyond the equity markets to development lending entities, including governmental, quasi-governmental, and commercial lenders. Only 43-101 instruments can speak to capital and operating budgets specifically, but our indications in that regard are quite satisfactory. The mining of shorter life surface product and smaller pits as cash flow projects are generally on the lowest level of cost.
Your company has, before law required it, initiated meaningful partnerships with
|
the people of Tanzania and related parties. As an example, the Buckreef Gold Mine project is 45% owned by the State Mining Corporation of Tanzania, managed by us. We have so far negoti-ated our percentage based on the nature of the asset brought to the negotiating table and our technical plus financial management of the project.
We firmly believe in true partnership with our hosts. We believe that real shar-ing of the fruits of the labor will protect our asset better than available insurance policies. Historically no major mine has ever made any profit when it was not commercially managed. Our strategy, therefore, is to have a plan to functionally protect our assets from the beginning. We would prefer to have a 55% share of multiple major projects than 100 percent of something that fails to reward the hosts and maintains inherent downside risk and exposure.
|
It is our hypothesis that investment success today must be built on respect, fair sharing, forward-reaching technology, and knowledge of the function of the market for share valuation, good ecology and humanism.
Accounting and Administration
During 2012, the Company made mate-rial improvements to its accounting department in Tanzania. The successful introduction of Accpac modules for local accounting input has increased the efficiency of our accounting operations. The Company has also completed a staff rationalization program, resulting in a more motivated, professional and efficient work force.
Community Relations
The Company has maintained a cordial relationship with surrounding communi-ties at Buckreef where goodwill meetings are held between Company management and surrounding local and village
|
|||
| governments and authorities to discuss common problems and find solutions. This has succeeded in maintaining the harmonious living environment for both staff and the surrounding community.
PROJECT DEVELOPMENT
Buckreef Project
An NI 43-101 Technical Report was completed during the year that includes a positive Preliminary Economic Assessment (PEA) for the Buckreef Project. A major follow-up drill cam-paign has also been completed that will lead to a new Resource Model as the basis for initiating a Pre-Feasibility/ Feasibility Study of this project.
The PEA mine plan is based on an assumed minimum annual production of between 100,000 to 120,000 ounces of gold. Initial plant feed is assumed to be 1.8 million tons per year projected to produce about 110,000 ounces of gold annually, rising in year 6 to 3.6 million tons per year projected to produce over
|
120,000 ounces of gold annually. The mine plan is based on two open pits, one centered on Buckreef and a second open pit centered on Buziba. The largest open pit is 1.8 km long and 210 metres deep. Total ore projected to be mined over the 12-year life of mine is 33.5 million tons. Total production over the life of mine is projected to be approximately 1.35 million ounces of gold.
The weighted average operating cost over the life of mine is approximately $750 per ounce of gold produced. Initial capital cost is approximately $133.9 million and total capital cost is approximately $238.3 million. The net present value (NPV) at a discount rate of 5% and using a gold price of $1,600 per ounce is US $392 million, with an internal rate of return (IRR) of 54% on a pre-tax basis; and an NPV of US $288 million with an IRR of 48% on an after-tax basis. The PEA has also highlighted numerous areas for project optimization that can be addressed in a Pre-Feasibility /Feasibility Study.
|
Kigosi Project
The Company has successfully obtained a two-year permit from the Ministry of Natural Resources and Tourism to continue with feasibility and develop-ment work on the Kigosi Project. An Environmental Impact Assessment for the Kigosi Project has been approved by the National Environment Management Council (NEMC) and the project is currently awaiting the granting of an Environmental Certificate from the Office of the Vice President of Tanzania. The Company has also filed an applica-tion for a mining license with the Ministry of Energy and Minerals.
The Company has considered a number of potential production scenarios for the Kigosi Project as part of its conceptual five year management plan. One such scenario which has been studied by the Company is the potential for a modest low-capital start-up operation based on extracting gold from extensive surface rubble mineralization which has been the subject of a 43-101 Technical Report.
|
||
 |
 |
 |
|
Once all regulatory approvals have been granted for the Kigosi Project, management will be in a better position to finalize an appropriate development plan leading to production.
Itetemia Project
Earlier this year, the Company released a 43-101 Technical Report on the Itetemia Project. This report noted that the Golden Horseshoe Reef at Itetemia (GHR) has been considered for both underground and open pit mining, with a preliminary, high-level optimization document prepared by Auralia Pty Limited (Auralia) in August 2009, indicating that open pit mining is techni- cally feasible. No recent studies have been conducted on the underground potential, although varios methods could be applied to the steeply dipping mineralization. A Preliminary Economic Assessment by Saint Barbara LLP (Saint Barbara) done in September 2010 of potential open pit mining of the GHR is presented in the Technical Report.
Management is of the opinion that the GHR represents a modest, yet robust, medium-grade, near surface gold
 |
 deposit, that warrants further feasibility investigations. To this end management has initiated an internal review of various production scenarios for Itetemia as a potential open pit operation that could be “fast-tracked” to early production. Once this internal review has been completed, management will be in a better position to advance this project to the next stage in the development pipeline.
EXPLORATION PROGRAM FOR
BUCKREEF PROJECT
The Buckreef Project presents substantial opportunities for exploration. It is located on a secure district-scale land package with defined exploration targets. In 2012, the Company invested $6.1 million in exploration drilling and related costs. Of this amount, 86% was for resource development and 14% for green fields exploration. The Company will continue to pursue development exploration opportunities near Buckreef with a view to extending the limit of the known resources and testing new concepts.
|
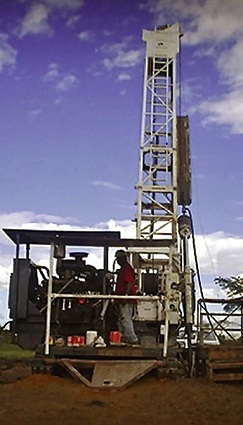
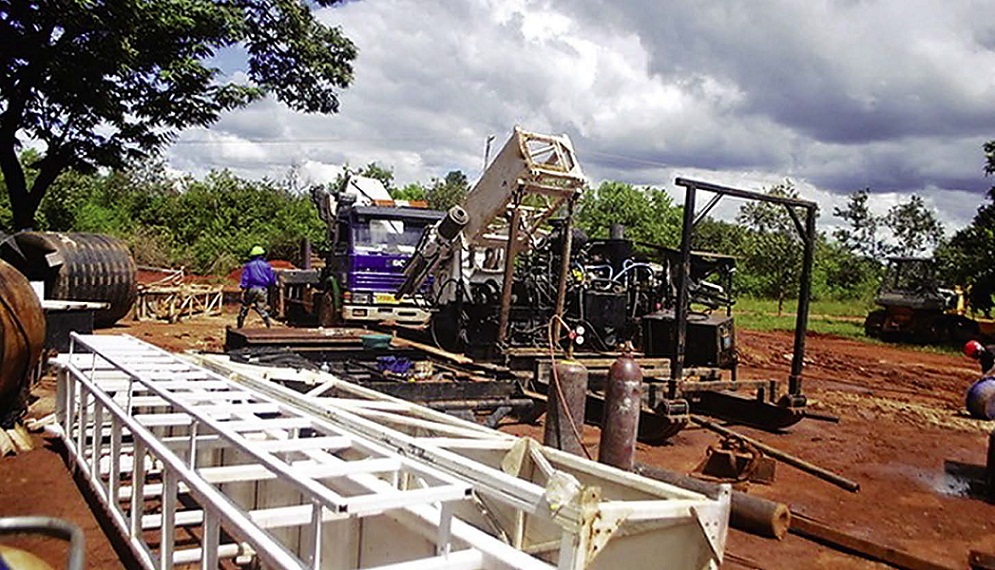
The Company is planning an aggressive 11,000-metre drill program for 2013 to follow up on additional targets in the vicinity of known mineralized occur- rences. For this initiative the Company is pleased to have retained Simba Drilling Co. Ltd. as the contractor for the on-going deep drilling program. Jim Graham, Director at Simba Drilling has quite a resume in the drilling industry. His extensive experience and knowledge has allowed him to gain access to – and effectively deploy - some of the most sophisticated high-tech drilling equipment on the market today. Simba Drilling has historically enjoyed positive drilling results both at Bulyanhulu and Kabanga Nickel in the early 1990s, its contribution having been pivotal to the hugely successful growth trajectories of both projects.
During 2012, the Company completed an aggressive resource definition drilling program in four areas at Buckreef: Buckreef Main zone, Buckreef Footwall zone, Eastern Porphyry prospect and Tembo prospect. A total of 165 holes for 32,569 metres were drilled during this period which include 51 reverse circulation
 |
|
holes (3073 metres), 6 PQ diamond holes (330 metres) for metallurgical test work for the Bingwa and Tembo prospects; and 108 NQ diamond holes (29,165 metres).
According to the August 23, 2012 43-101 Technical Report, prior to the recent drilling campaign, the Buckreef prospect had 8.882 million tons of Measured and Indicated resource at a grade of 1.97 grams per ton Au that contained approx- imately 563,000 ounces of gold; and the Tembo prospect had 0.725 million tons of Inferred resource at a grade of 2.18 grams per ton Au that contained 51,000 ounces of gold. The Report did not contain any estimate of a potential resource for the Eastern Porphyry prospect; however, sufficient drilling has now been done to warrant including the Eastern Porphyry prospect in the Buckreef project. The Company has initiated a comprehensive evaluation of the contribution of the recent drill campaign to the resource base of the BRMA area as defined in the PEA.
|
Buckreef Footwall zone:
The Footwall Zone is located 100 metres west in the footwall of the Main Zone of the historic Buckreef mine. A total of 30 reverse circulation holes for 1873 metres were completed to investigate the lateral and deep extension of the target.
The drilling returned interesting assay results which include 3 metres averaging 1.29 grams per ton gold; 6 metres averaging 2.67grams per ton gold; 5 metres averaging 2.62 grams per ton gold; 6 metres averaging 4.87 grams per ton gold, 6 metres averaging 1.63 grams per ton gold, including 2 metres at 3.75 grams per ton gold.
Eastern Porphyry prospect:
The Eastern Porphyry prospect is located 800 metres east of the Main Zone. The area is dominated by sequences of mafic rocks which include basaltic rock units alternating with dolerite and a series of narrow felsic porphyry units with pronounced shearing and pyrite-quartz- carbonate alteration of the mafic
|
packages at the contacts with the felsic por-phyry units. Mineralization is localized within the sheared, quartz-carbonate- pyrite altered zones.
At the Eastern Porphyry prospect, a total of 7 diamond holes for 1,211.42 metres were drilled to investigate the potential to define the resource. The diamond core drilling program on the Eastern Porphyry prospect returned some significant intercepts. Among them are 4.8 metres averaging 4.63 grams per ton gold (including 2 metres @ 10.93 grams per ton gold) and 2 metres averaging 7.47 grams per ton gold (including 1 metre @14.6 grams per ton gold); 10.5 metres averaging 2.27 grams per ton gold (including 1.1 metres @ 8.89 grams per ton gold and 1.5 metres @ 5.32 grams per ton gold); 4 metres at 3.01 grams per ton gold (including 1 metre @ 6.45 grams per ton gold); 5.24 metres at 2.06 grams per ton gold (including 3 metres @ 3.14 grams per ton gold); and 6 metres at 1.06 grams per ton gold (including 2 metres @ 1.98 grams per ton gold).
|
||
 |
||||
|
Buckreef Main zone:
A total of 101 holes for 27,954 metres have been completed on the Buckreef Main Zone and Buckreef North- east extension. Drilling consists of 3 diamond wedge holes (1,057. metres) and 98 diamond holes (26,896 metres). Approximately half of this drilling has been carried out on the Buckreef Main zone and half of it on the Buckreef Northeast zone. This drilling was done with a view to determining the potential for upgrading the current Inferred resource to the Indicated and Measured category at vertical depths of 150 metres and 200 metres, while testing the down- dip continuity of the shear zone-hosted gold mineralization associated with quartz-carbonate-pyrite veins emplaced in the mafic volcanic sequence below 300 metres. Surveys of inclination and azimuth were completed at nominal 30- metre intervals for all diamond drilling. The survey tool was usually a single shot Reflex camera and was operated by the drill contractor as part of normal drilling.
For diamond drilling, core recovery is generally very good. All diamond drilled holes commenced with a HQ to the base of sap rock, followed by NQ diameter which is reduced to NQ2 when fresh rock is reached or difficulties were encountered. Company standard
|
procedure is to mark a Top-of-Hole Reference line which may be solid/ dashed/dotted depending on confidence attached to the fitting.
The deeper drilling confirmed the down- dip continuity of the various near-surface mineralized zones; and some deeper holes seemed to indicate a thickening of mineralization with depth and occasional very high grade intercepts. One diamond drill hole returned 16 metres grading 2.23 grams per ton gold including a high grade section of 2.0 metres averaging 7.03 grams per ton gold with a second hole yielding 35.35 metres grading 2.75 grams per ton gold, including 6.35 metres averaging 5.75 grams per ton and 4.7 metres at 4.33 grams per ton. Another diamond drill hole targeted the down-dip potential in the Main Zone, returning 30 metres grading 2.66 grams per ton gold, including 2.0 metres @ 6.5 grams per ton gold along with 5.0 metres grading 4.06 grams per ton gold. The deepest segment of this hole returned 2.0 metres @ 1.77 grams per ton gold from 197 metres in sheared, altered dolerite intercalated with felsic porphyry and milky white late quartz veins; 7.0 metres grading 3.47 grams per ton gold; 4.0 metres grading 3.2 grams per ton gold; 3.0 metres aver- aging 4.06 grams per ton gold; 3.0 metres at 3.16 grams per ton gold; 13 metres
|
averaging 2.86 grams per ton gold; and 3.3 metres at 2.53 grams per ton gold.
Tembo Prospect:
A total of 23 holes for 1355.60 metres have been completed on the Tembo prospect. Drilling consists of 3 PQ diamond holes (157.60 metres) and 20 reverse circulation holes (1198 metres). The PQ holes were intended for metal- lurgical test work and the collected samples were analyzed by the MINTEK laboratory in South Africa.
Positive drill results were reported at Tembo, including: 3.0 metres grading 14.75 grams per ton gold; 6.0 metres averaging 3.38 grams per ton gold; 3.0 metres averaging 2.62 grams per ton gold; and 2.0 metres at 1.92 grams per ton gold. Similar to Buckreef Main, Tembo mineralization is structurally controlled and is hosted in a sub-vertical shear zone emplaced along a mafic basaltic sequence. The mineralization is confined along an East-West trending shear structure and a newly discovered northeast trending splay.
Biogeochemistry Project
As a means of bridging the gap between the existing aeromagnetic and radio- metric survey data and the need for follow-up drill testing and ground-based geo- physics
|
||
 |
||||
|
and geochemistry surveys, an innovative approach known as biogeo- chemistry is currently underway.
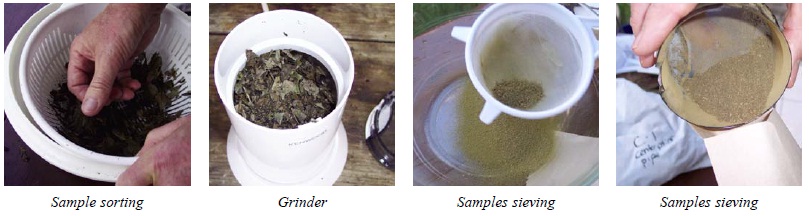
Biogeochemistry is a methodology whereby plant samples from specific plant species are obtained under rigorous procedures, noting the coordinates, soil conditions and seasonality when the samples are taken. The plants them- selves have the ability under certain conditions to metabolize precious metal and base metal elements, with the root systems of these plants acting as tiny natural drill bits that function on the principle of capillary action.
The Company has a proprietary biogeo- chemistry (also known as BGC) process utilizing plant species (indigenous to the regions of our prospecting licenses) with metabolic processes uniquely suit- ed for precious metal and base metal exploration. This process has been developed and refined over several years by some of the leading pioneering botanists and geochemists in the field who have also been associated with Tanzanian Royalty Exploration. This provides the Company with a unique exploration optimization potential. Furthermore, the Company’s Managing Consultant for Biogeochemistry has recently published a peer-reviewed academic paper on the subject of BGC analytics and predictive modeling, further demonstrating our leadership in this exciting exploration frontier.
|
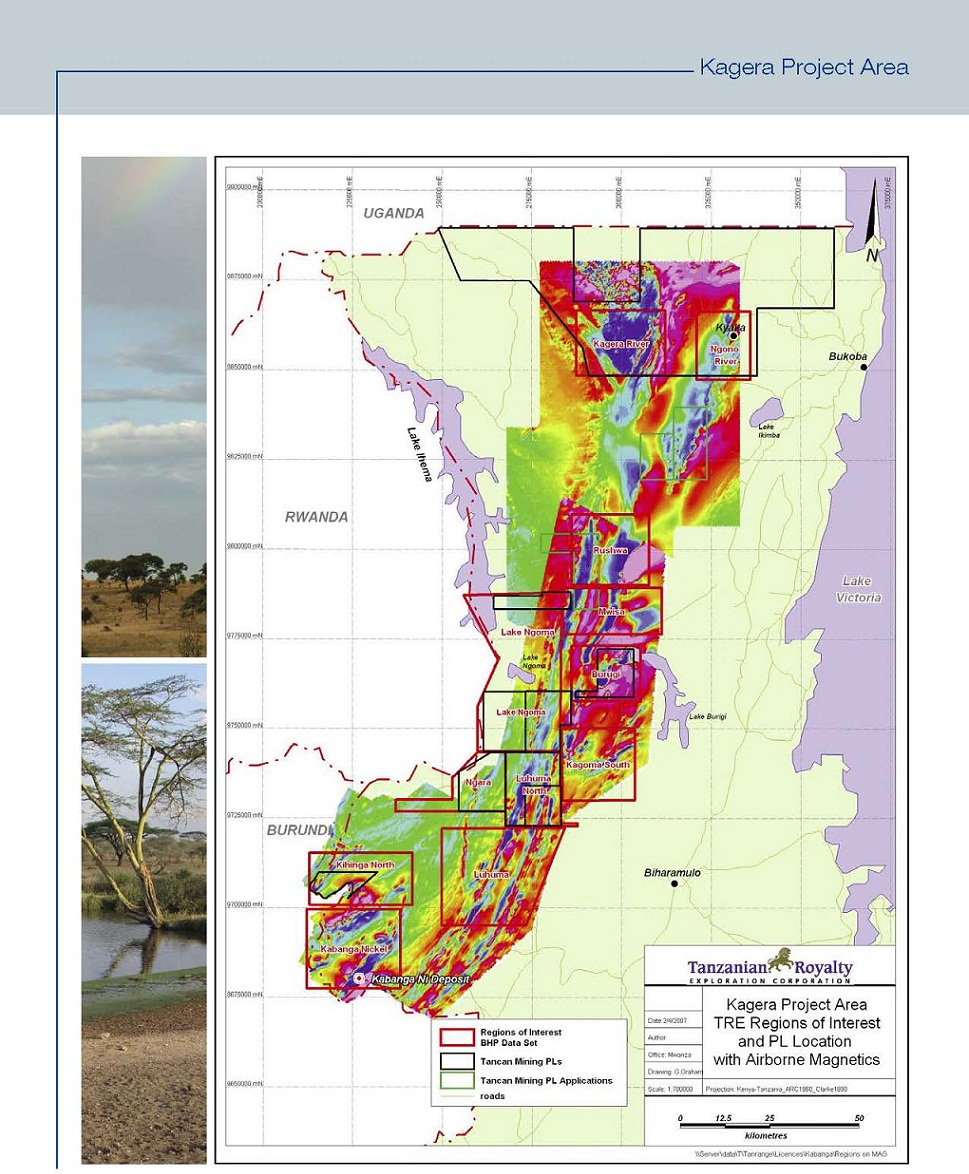
The BGC objective for the Company’s property licenses in the Kabanga Nickel Belt is to conduct an efficient, rapid exploration survey utilizing our propri- etary methods and expertise, targeting nickel, cobalt and the platinum group metals. This BGC reconnaissance sur- vey is aggressively targeting multiple prospecting licenses in both the Burigi and Biharamulo blocks initially, with multiple botany teams simultaneously launching into these areas starting in early January 2013. This BGC explo- ration effort is focusing on several prospecting licenses where previously conducted aeromagnetic and radio- metric surveys have indicated geophysical anomalies often associated with the presence of significant nickel, cobalt and platinum group metal ore bodies.
By exploring these anomalous regions in further detail using a relatively rapid and inexpensive process, we hope to confirm the presence of significant target miner- alization prior to the recommendation of the commencement of much more expensive and limited availability drill testing, thereby maximizing the efficient utilization of Company drill time. Further BGC surveys will then commence on additional prospecting licenses across multiple PL blocks to repeat the process of scouting the way for additional drilling exploration.
|
Closing Remarks
Success in mining is the outcome of multiple dynamics and interplay between stakeholders, institutions and chiefly, between the Board, staff and management of a corporation.
We further wish to thank our share- holders who are the backbone and support mechanism for our operations, as well as to our partners, STAMICO on behalf of the people of Tanzania, for their support as we head closer to production. Special mention and thanks go to Jim Sinclair, President and CEO, for his constant, selfless and steadfast guidance of management.
Sincerely,
 Joseph Kahama
Chairman, Chief Operating Officer
(Tanzania)
|
|
MANAGEMENT’S DISCUSSION AND ANALYSIS
|
|
The following Management’s Discussion and Analysis (“MD&A”) of the financial condition and results of
operations for Tanzanian Royalty Exploration Corporation (the “Company”) should be read on conjunction
with the audited consolidated financial statements for the years ended August 31, 2012, and 2011.
The MD&A was prepared as of November 23, 2012.
All amounts are in Canadian dollars, unless otherwise specified.
|
|
■
|
In early September 2011 the Company announced that Venmyn Independent Projects (Pty) Limited, a subsidiary of Venmyn Rand (Pty) Limited of South Africa, was awarded a contract to complete a Preliminary Economic Assessment (PEA) for the Buckreef Gold Project in Tanzania.
|
|
■
|
In October 2011 the Company signed the Definitive Joint Venture Agreement with State Mining Corporation (Stamico) for the development of the Buckreef Gold Project.
|
|
■
|
In November 2011 the Companys board of directors approved the adoption of a shareholder rights plan (the Rights Plan) designed to encourage the fair and equal treatment of shareholders in connection with any takeover bid for the outstanding common shares of the Company. The Companys board is not aware of any specific take-over bid for the Company that has been made or is contemplated. The Rights Plan was approved by the shareholders at the annual General and Special Meeting held on March 1, 2012.
|
|
■
|
On December 15, 2011 the Company announced that the Government of Tanzania approved the application for the expansion of the area covered by the Special Mining Licence for the Companys Buckreef Gold Project.
|
|
■
|
In December 21, 2011 the Company announced the Itetemia and Luhala properties previously optioned to Kibo Mining (formerly Sloane Developments Ltd.) were returned following termination of the Option Agreement.
|
|
■
|
In January 2012 the Company received NI 43-101 compliant resource reports for the Itetemia and Luhala Gold Projects.
|
|
■
|
In February 2012 the Company announced it had awarded a contract to complete a Preliminary Economic Assessment for a gravity recovery plant on its Kigosi Gold Project.
|
|
■
|
In March 2012 the Company announced Exploration Budget Expansion at Buckreef Main and Eastern Porphyry Targets.
|
|
■
|
In March 2012 the Company received US$1,000,000 from the exercise of 250,000 Compensation warrants.
|
|
■
|
On April 27, 2012 the Company announced it approved a $4.1 million budget for deep drilling program to test high grade gold potential at Buckreef Gold Project.
|
|
■
|
On May 31, 2012 the Company announced it had received a Permit for Continued Operations on the Kigosi Licences from the Tanzanian Ministry of Natural Resources.
|
|
■
|
On August 24, 2012 the revised Preliminary Economic Assessment (“PEA”) for the Buckreef Gold Project was filed on SEDAR.
|
|
■
|
Throughout the period, the Company announced positive results from expanded drilling programs carried out on the Buckreef Project.
|
|
MANAGEMENT’S DISCUSSION AND ANALYSIS
|
| Overall Performance | 233,318 shares under the convertible debt agreement (compared to issuing shares for gross proceeds of $13,831,976 through a private placement of 2,532,119 shares, $22,052,477 through the issuance of 5,263,158 through prospectus, and $995,128 on conversion of 247,173 shares under the convertible debt agreement during the year ended August 31, 2011) and proceeds of $1,000,000 on exercise of 250,000 warrants. The Company also issued 35,000 shares valued at $115,834 for services and issued shares pursuant to the RSU plan of 182,866 valued at $1,024,793. During the same period in 2011 136,408 shares valued at $681,339 were issued pursuant to RSU’s and 20,006 valued at $97,035 were issued for property. In the current quarter, capital is being utilized for the Buckreef Gold Project development, property acquisition, exploration, capital equipment purchases and general operating expenses as previously disclosed and as tabulated below. The remaining capital is invested in interest bearing investments, which are readily available. | |
|
For the year ended August 31, 2012 the Company had current assets of $20,483,824 compared to $32,922,378 on August 31, 2011. The decrease is mainly due to net expenditures on exploration of $9,593,993 (2011 - $7,640,353) and cash used in operations of $4,713,619 (2011 - $3,739,845). Deferred exploration costs were $41,562,996 as compared to $33,262,972 at August 31, 2011.
|
||
|
Net loss for the year ended August 31, 2012 was $8,897,843 com- pared to a net loss of $11,132,371 in the comparable year ended August 31, 2011. The decrease is primarily due to the decrease in the loss due to the write down in mineral properties and deferred exploration costs of $1,293,969 (2011 - $3,845,564) and a with- holding tax recovery of $250,019 (2011 - $856,191 withholding tax expense). Change in the valuation of the warrant liability of $2,321,921 (2011 - $315,159), partially offset the loss decrease.
|
||
|
The Company issued common shares during the year ended August 31, 2012 with a value of $950,213 on conversion of
|
|
C$ (000)
|
||
|
Funds available August 31, 2011
|
32,428
|
|
|
Equipment purchases
|
(142)
|
|
|
Mineral property expenditures including licences, environmental and exploration, net of recoveries
|
(9,580)
|
|
|
General corporate expenses
|
(2,647)
|
|
|
Funds available August 31, 2012
|
$20,059
|
| Management of the Company believes that the current level of funds is expected to be sufficient to achieve its business objectives and milestones over the next 12 months. Management continues to explore alternative financing sources in the form of equity, debt or a combination thereof; however thecurrent economic uncertainty and financial market volatility make it difficult to predict success.Risk factors potentially influencing the Company’s ability to raise equity or debt financing include:the outcome of the feasibility study at the Buckreef Project, mineral prices, the risk of operating in a foreign country, including, without limitation, risks relating to permitting, and the buoyancy of the credit and equity markets. For a more detailed list of risk factors, refer to the Company’s Annual Information Form for the year ended August 31, 2012, which is filed on SEDAR. |
Due to the current low interest rate environment, interest income is not expected to be a significant source of income or cash flow. Management intends to monitor spending and assess results on an ongoing basis and will make appropriate changes as required.
|
||
| Trends | |||
| ■ |
There are significant uncertainties regarding the prices of precious and base metals and other minerals and the availability of equity and debt financing for the purposes of mineral exploration and development. Although the prices of precious and base metals have risen substantially over the past several months, the Company remains cautious;
|
||
| ■ |
The Companys future performance is largely tied to the out come of future drilling results and the development of the Buckreef project; and
|
||
|
MANAGEMENT’S DISCUSSION AND ANALYSIS
|
| ■ |
Current financial markets are likely to be volatile in Canada for the remainder of the year, reflecting ongoing concerns about the stability of the global economy. As well, concern about global growth may lead to future drops in the commodity markets. Uncertainty in the credit markets has also led to increased difficulties in borrowing/raising funds. Companies worldwide have been negatively affected by these trends. As a
|
result, the Company may have difficulties raising equity and debt financing for the purposes of base and precious metals exploration and development.
These trends may limit the Company’s ability to discover and develop an economically viable mineral deposit.
|
|
|
As at and for the year ended
|
Aug 31, 2012
|
Aug 31, 2011
|
Aug 31, 2010 (1)
|
|
Total Revenues
|
$0
|
$0
|
$0
|
|
Net Loss for the period
|
($8,897,843)
|
($11,132,371)
|
($3,427,655)
|
|
Basic loss per share
|
($0.09)
|
($0.12)
|
($0.04)
|
|
Total assets
|
$63,256,530
|
$67,632,380
|
$32,295,717
|
|
Total long term financial liabilities
|
$10,187,286
|
$8,669,289
|
$1,841,226
|
|
Cash dividends declared per share
|
$0
|
$0
|
$0
|
|
Results of Operations
Net expenditures on mineral properties and deferred exploration costs for the year ended August 31, 2012 were $9,593,993 compared to $7,640,353 for the year ended August 31, 2011. The increase is a result of increases in Buckreef project expenditure, but partially offset by decreased exploration expenditures at the Kigosi project. Recoveries received during the year ended August 31, 2012 and August 31, 2011 from various option agreements were $50,114 and $285,198, respectively.
Net loss for the year ended August 31, 2012 was $8,897,843 compared to $11,132,371 for the comparable year ended August 31, 2011. For the three month period ended August 31, 2012 and August 31, 2011, the Company had net loss of $3,576,139 and a net loss of $7,401,871, respectively.
Salaries and benefits expense has decreased to $1,596,951 for the year ended August 31, 2012 from $1,601,832 for the year ended August 31, 2011. The expenses for the corresponding three month period ending August 31, 2012 and 2011 were $502,877 and $469,031 respectively. The decrease in salaries expense is a result of the Company closely managing payroll and hiring costs and outsourcing certain functions.
Professional fees increased by $236,760 for the year ended August 31, 2012 to $869,077 from $632,317 for the year ended
|
August 31, 2011. For the three month period ended August 31, 2012 professional fees were $464,054 and $217,400 respectively. The increase in total year and final quarter is due to increased costs during 2012 surrounding legal, audit and tax advisor professional fees.
For year ended August 31, 2012, the foreign exchange income was $24,082 compared to an exchange loss of $518,794 for the same period ended August 31, 2011. This decreased loss of $542,876 was due to the years’ average Tanzanian Shilling exchange rate having increased from 1,622 at August 31, 2011 to 1,572 at August 31, 2012.
Share based payments for the year ended August 31, 2012 were $777,630 compared to $368,161 in the comparable period ended August 31, 2011. Share based payments vary on the number of equity based compensation options issued and vesting. See note 9 of the financial statements for details. Director fee RSU expense was $289,448 and $441,000, respectively.
Shareholder information costs increased from $332,586 for the year ended August 31, 2011 to $581,526 for the year ended August 31, 2012. The increase of $248,940 was due to increased transfer agent and listing fees from the issue of shares for converted debt and exercise of warrants. Corporate investor promotion activity completed during the year also increased as an investor
|
|
MANAGEMENT’S DISCUSSION AND ANALYSIS
|
|
public relations firm was hired during the period. For the three month period ended August 31, 2012, shareholder information costs were $(21,143) compared to $99,019 for the three month period ended August 31, 2011. The negative amount in fiscal 2012 was due to account reclassifications in the period.
For the year ended August 31, 2012, travel and accommodation expense decreased by $30,211 from $199,631 in 2011 to $169,420. For the three months ended August 31, 2012, travel and accommodation expense decreased by $26,429 from $61,778 in 2011 to $35,349. Travel and accommodation expense decreased due to timing and increased control of travel requirements.
The interest accretion expense for the year ended August 31, 2012 was $102,785, compared to $181,076 for the year ended August 31, 2011. The interest relates to the issuance of convertible debt. Interest accretion is expected to decrease as debt is converted into shares.
For the year ended August 31, 2012, depreciation expense was $379,603 compared to $463,169 for the same period ended August 31, 2011. The decrease of $83,566 was due to the lower capital asset cost base as purchases in the period were minimal and depreciation lowered the capital asset balance. The capital expenditure for the year ended August 31, 2012 was $142,283 as compared to $817,429 in the year ended August 31, 2011.
During the year ended August 31, 2012, the Company abandoned and wrote-off expenses in various project areas in the amount of $1,293,969 (2011 - $3,845,564), as the
|
Company evaluated its mineral properties and deemed certain properties to warrant no further exploration.
Consulting fees for the year ended August 31, 2012 were $266,011 compared to $287,885 in the comparable period ended August 31, 2011. Consulting expenses remained consistent between the comparable periods. Consulting fees for the three months ended August 31, 2012 were $87,943 compared to $76,925 in the comparable period ended August 31, 2011. Consulting expenses remained consistent between the compa- rable periods. The decrease in total consulting expense is a result of the Company closely managing consulting costs in the current uncertain economic environment.
Directors’ fees for the year ended August 31, 2012 were $365,049 compared to $461,484 in the comparable period ended August 31, 2011. The decrease in director fees expense is a result of a decrease in number and valuation of RSU’s issued to board members.
Office and general expenses for the year ended August 31, 2012 were $437,380 compared to $443,774 in the comparable period ended August 31, 2011. The decrease is mainly due to the company closely managing its office and general costs including closure of the Mwanza office and consolidation of offices at the Buckreef camp. For the three month period ended August 31, 2012, office and general expenses were $151,581 compared to $120,004 in the comparable period ended August 31, 2011. The increase for the quarter is due timing differences as total expenses are in line with prior period.
|
|
2012
Q4
|
2012
Q3
|
2012
Q2
|
2012
Q1
|
2011
Q4
|
2011
Q3
|
2011
Q2
|
2011
Q1
|
|
|
Total Revenues
|
$0
|
$0
|
$0
|
$0
|
$0
|
$0
|
$0
|
$0
|
|
Net Income (Loss}
|
($3,576)
|
$385
|
($8,516)
|
$2,809
|
($7,402)
|
($1,493)
|
($1,081)
|
($1,156)
|
|
Basic and diluted
loss per share
|
($0.04)
|
($0.00)
|
($0.09)
|
($0.03)
|
($0.07)
|
($0.02)
|
($0.01)
|
($0.01)
|
|
MANAGEMENT’S DISCUSSION AND ANALYSIS
|
|
Liquidity and Capital Resources
The Company manages liquidity risk by maintaining adequate cash balances in order to meet short term business requirements. Because the Company does not currently derive any production revenue from operations, its ability to conduct exploration and development work on its properties is largely based upon its abili- ty to raise capital by equity funding. Previously, the Company has obtained funding via private placements, public offering and various sources, including the Company’s President and CEO.
As of August 31, 2012, the Company’s working capital position was $18,165,431, as compared to $30,451,179 as of August 31, 2011. As the Company’s mineral properties advance, additional
|
equity and debt financing will be required to fund exploration and mining activities.
The Company has prepared a cash flow forecast for fiscal 2013 and believes that it has sufficient funds to continue operations for at least the next twelve months.
Some of the Company’s mineral properties are being acquired over time by way of option payments. It is at the Company’s option as to whether to continue with the acquisition of the mineral properties and to incur these option payments. Current details of option payments required in the future if the Company is to maintain its interests are as follows:
|
|
Option Payments Due by Period (US$)
|
|||||
|
Option Agreement Obligations
|
Total
|
Less than 1 year
|
2-3 years
|
4-5 years
|
More than 5 years
|
|
$19,000
|
$19,000
|
$Nil
|
$Nil
|
$Nil
|
|
|
Convertible Debt
On September 23, 2011 the Company received notice from an arm’s length third party to convert its Promissory Note dated July 9, 2010 in the remaining principal amount of $1,000,000 bearing interest at 3% and convertible into 233,318 common shares at a price of $4.286 per share. $95,000 of the outstanding principal was converted into 22,166 common shares on closing, which shares were refundable to the Company if the remaining principal balance was not fully converted by December 9, 2011. 233,318 common shares were issued on September 23, 2011.
Off-Balance Sheet Arrangements
The Company has no off-balance sheet arrangements.
|
Transactions with Related Parties
Related parties include the Board of Directors and officers, close family members and enterprises that are controlled by these individuals as well as certain consultants performing similar functions.
Related party transactions conducted in the normal course of operations are measured at the exchange value (the amount established and agreed to by the related parties).
(a) Tanzanian Royalty Exploration Corporation entered into the following transactions with related parties:
|
|
Year ended August 31,
|
Notes
|
2012
|
2011
|
|
Legal services
|
(i)
|
$553,949
|
$797,863
|
|
Director compensation
|
(ii)
|
$365,049
|
$461,484
|
|
Chairman and COO
|
(iii)
|
USD$ 8,800
|
USD$ 9,600
|
|
Technical Committee
|
(iv)
|
$130,160
|
$156,119
|
|
(i) The Company engages a legal firm for professional services in which one of the Company’s directors is a partner. During the year ended August 31, 2012, the legal expense charged by the firm was $553,949 (2011 - $797,146), of which $140,245 remains payable at year end (2011 - $419,032).
|
(ii) During the year ended August 31, 2012, $365,049 (2011 - $461,484) was paid or payable by the Company to directors for serving on the Board and/or related Committees.
|
|
MANAGEMENT’S DISCUSSION AND ANALYSIS
|
|
(iii) During the year ended August 31, 2012, USD$8,800 (2011 - USD$9,600) was paid to a company associated with the Company’s Chairman and COO for office rental.
(iv) During the year ended August 31, 2012, $130,160 (2011 - $156,119) was paid or payable by the Company to directors as
|
incremental fees for serving on the Company’s Technical Committee.
(b) Remuneration of Directors and key management personnel (being the Company’s Chief Executive Officer, Chief Financial Officer and Chief Operating Officer), other than consulting fees, of the Company was as follows:
|
|
Year ended August 31,
|
2012
|
2011
|
||
|
Salaries and benefits (1)
|
Share based payments (3)
|
Salaries and benefits (1)
|
Share based payments (3)
|
|
|
Mangement
|
$ 377,230
|
$ 617,449
|
$ 217,394
|
$ 114,554
|
|
Directors
|
75,601
|
289,448
|
20,701
|
440,783
|
|
Total
|
$ 452,831
|
$ 906,897
|
$ 238,095
|
$ 555,337
|
|
(1)
|
Salaries and benefits include director fees. The board of directors do not have employment or service contracts with the Company. Directors are entitled to director fees and RSU’s for their services and officers are entitled to cash remuneration and RSU’s for their services.
|
|
(2)
|
Compensation shares may carry restrictive legends prohibiting selling within certain time frames up to a year.
|
|
(3)
|
All RSU share based compensation is based on the accounting expense recorded in the period.
|
|
On September 7, 2010 the Company completed an $800,000 private placement pursuant to a subscription agreement dated August 24, 2010 with the Company’s President and CEO for 144,430 common shares at a price of $5.539 per share.
On February 1, 2011 the Audit Committee approved a loan agree- ment (the Loan Agreement) with Joseph Kahama (Kahama), the Chairman and COO (Tanzania) of the Company, providing for a six month loan from the Company to Kahama in the principal amount of USD$100,000 on arm’s length commercial terms, bearing interest at the prime rate charged by the Company’s bankers, determined monthly (the Loan). Mr. Kahama repaid the loan principal plus interest on August 8, 2011. Upon further review, the Board has determined that the Kahama loan was inadvertently not in compliance with Sarbanes-Oxley. As a result, the Board has reviewed its corporate governance procedures with US counsel and has taken corrective action.
At August 31, 2012, the Company has a receivable of $22,977 (2011 - $7,214) from an organization associated with the Company’s President and CEO.
Restricted Stock Unit Plan
The Restricted Stock Unit Plan (“RSU Plan”) is intended to enhance the Company’s and its affiliates’ abilities to attract and retain highly qualified officers, directors, key employees and other persons, and to motivate such officers, directors, key employees and other persons to serve the Company and its affiliates and to expend maximum effort to improve the business
|
results and earnings of the Company, by providing to such persons an opportunity to acquire or increase a direct proprietary interest in the operations and future success of the Company. To this end, the RSU Plan provides for the grant of restricted stock units (“RSUs”). Each RSU represents an entitlement to one common share of the Company, upon vesting. As of November 24, 2010 the Board resolved to suspend 1,800,000 of the 2,500,000 common shares previously authorized for issuance under the RSU Plan, such that a maximum of 700,000 Shares shall be authorized for issuance under the RSU Plan, until such suspension may be lifted or further amended. Any of these awards of RSUs may, but need not, be made as performance incentives to reward attainment of annual or long-term performance goals in accordance with the terms of the RSU Plan. Any such performance goals are specified in the Award Agreement.
On April 26, 2011, the Corporation’s Restricted Stock Unit Plan was amended as the Plan expressly excluded the Chairman and Chief Executive Officer of the Corporation from participating in the Plan. As the joint office of Chairman and Chief Executive Officer of the Corporation no longer exists, and has been replaced by two new positions, being President and Chief Executive Officer and Chairman and Chief Operating Officer (Tanzania), the Board determined that it would be in keeping with the objective of the Plan and in the best interests of the Corporation that each of the offices of President and Chief Executive Officer and Chairman and Chief Operating Officer (Tanzania) be unambiguously included in the category of Service Providers eligible to receive awards of RSUs under the Plan, and
|
|
MANAGEMENT’S DISCUSSION AND ANALYSIS
|
|
that the wording of the Plan be amended as required to effect such result (as so amended, the “Amended RSU Plan”). The Amended RSU Plan was presented to and approved by the shareholders at the Corporation’s Annual General and Special Meeting held on March 1, 2012.
Of the 700,000 shares authorized for issuance under the Plan, 632,053 shares have been issued as of August 31, 2012.
Critical Accounting Estimates
Assessment of Recoverability of Mineral Property Costs
The deferred cost of mineral properties and their related develop- ment costs are deferred until the properties are placed into production, sold or abandoned. These costs will be amortized over the estimated useful life of the properties following the commencement of production. Cost includes both the cash consideration as well as the fair market value of any securities issued on the acquisition of mineral properties. Properties acquired under option agreements or joint ventures, whereby payments are made at the sole discretion of the Company, are recorded in the accounts at such time as the payments are made. The proceeds from property options granted reduce the cost of the related property and any excess over cost is applied to income The Company’s recorded value of its exploration properties is based on historical costs that expect to be recovered in the future. The Company’s recoverability evaluation is based on market conditions for minerals, underlying mineral resources associated with the properties and future costs that may be required for ultimate realization through mining operations or by sale.
Assessment of Recoverability of Deferred Income Tax Assets
TREC follows the liability method of accounting for income taxes. Under this method, deferred tax liabilities and assets are recognized for the estimated tax consequences attributable to differences between the financial statement carrying amounts of assets and liabilities and their respective tax bases. Deferred tax liabilities and assets are measured using substantively enacted tax rates. The effect on the deferred tax liabilities and assets of a change in tax rates is recognized in the period that the change occurs. Deferred income tax assets are recognized for all deductible temporary differences, carry forward of unused tax credits and unused tax losses, to the extent that is probable that taxable profit will be available against which the deductible temporary difference and the carry forward of unused credits and unused tax losses can be utilized. In preparing the consolidated financial statements, the Company is required to estimate its income tax obligations. This process involves estimating the actual tax exposure together with assessing temporary differences resulting from differing treatment of items for tax and accounting
|
purposes. The Company assesses, based on all available evidence, the likelihood that the deferred income tax assets will be recovered from future taxable income and, to the extent that recovery cannot be considered probable, the deferred tax asset is not recognized.
Estimate of Share Based Payments and Warrant Liability
and Associated Assumptions
The Company recorded share based payments based on an estimate of the fair value on the grant date of share based payments issued and reviews its foreign currency denominated warrants each period based on their fair value. The accounting required for the warrant liability requires estimates of interest rate, life of the warrant, stock price volatility and the application of the Black- Scholes option pricing model. See note 9 of the August 31, 2012, audited consolidated financial statements for a full disclosure.
Critical accounting policies
Mineral Properties
All direct costs related to the acquisition and exploration and development of specific properties are capitalized as incurred. If a property is brought into production, these costs will be amortized against the income generated from the property. If a property is abandoned, sold or impaired, an appropriate charge will be made. Discretionary option payments arising on the acquisition of mining properties are only recognized when paid. Amounts received from other parties to earn an interest in the Company's mining properties are applied as a reduction of the mining property and deferred exploration and development costs, except for administrative reimbursements which are credited to operations.
Consequential revenue from the sale of metals, extracted during the Company's test mining activities, is recognized on the date the mineral concentrate level is agreed upon by the Company and customer, as this coincides with the transfer of title, the risk of ownership, the determination of the amount due under the terms of settlement contracts the Company has with its customer, and collection is reasonably assured. Revenues from properties earned during the development stage (prior to commercial production) are deducted from capitalized costs.
The amounts shown for mining claims and related deferred costs represent costs incurred to date, less amounts expensed or written off, reimbursements and revenue, and do not necessarily reflect present or future values of the particular properties. The recoverability of these costs is dependent upon discovery of economically recoverable reserves and future production or proceeds from the disposition thereof.
|
|
MANAGEMENT’S DISCUSSION AND ANALYSIS
|
|
The Company reviews the carrying value of a mineral exploration property when events or changes in circumstances indicate that the carrying value may not be recoverable. If the carrying value of the property exceeds its fair value, the property will be written down to fair value with the provision charged against operations in the year. An impairment is also recorded when management determines that it will discontinue exploration or development on a property or when exploration rights or permits expire. The amount shown for deferred exploration expenses, represents costs incurred to date net of write downs, if any, and is not intended to reflect present or future values.
Ownership in mineral properties involves certain risks due to the difficulties in determining the validity of certain claims as well as the potential for problems arising from the frequently ambiguous conveyancing history characteristic of many mineral interests. The Company has investigated the ownership of its mineral properties and, to the best of its knowledge, ownership of its interests are in good standing.
Capitalized mineral property exploration costs are those directly attributable costs related to the search for, and evaluation of mineral resources, that are incurred after the Company has obtained legal rights to explore a mineral property and before the technical feasibility and commercial viability of a mineral reserve are demonstrable. Any cost incurred prior to obtaining the legal right to explore a mineral property are expensed as incurred.
Once an economically viable reserve has been determined for a property and a decision has been made to proceed with development has been approved, acquisition, exploration and development costs previously capitalized to the mineral property are first tested for impairment and then classified as property, plant and equipment under construction.
Impairment of Long-lived Assets
TREC reviews mineral properties and deferred costs for impairment on a periodic basis or whenever events or changes in circumstances indicate that the carrying amount may not be recoverable. Impairment losses on long-lived assets are recognized when events or changes in circumstances indicate that the undiscounted cash flows estimated to be generated by such assets are less than their carrying value and, accordingly, all or a portion of such carrying value may not be recoverable. Impairment losses then are measured by comparing the fair value of assets to their carrying amounts.
The Company’s most critical accounting estimate relates to the impairment of mineral properties and deferred exploration costs. During the year ended August 31, 2012 the Company wrote
|
off $1,293,969 of costs on abandoned mineral properties (2011 – $3,845,564). Management assesses impairment of its exploration prospects quarterly. If an impairment results, the capitalized costs associated with the related project or area of interest are charged to expense.
Asset Retirement Obligations
The Company recognizes liabilities for statutory, contractual, constructive or legal obligations, including those associated with the reclamation of mineral properties and PPE, when those obligations result from the acquisition, construction, development or normal operation of the assets. Initially, a liability for an asset retirement obligation is recognized at its fair value in the period in which it is incurred. Upon initial recognition of the liability, the corresponding asset retirement obligation is added to the carrying amount of the related asset and the cost is amortized as an expense over the economic life of the asset using either the unit-of- production method or the straight-line method, as appropriate. Following the initial recognition of the asset retirement obligation, the carrying amount of the liability is increased for the passage of time and adjusted for changes to the current market-based discount rate, amount or timing of the underlying cash flows needed to settle the obligation. As of August 31, 2012 no liability for restoration exists.
Financial Instruments
Fair Value of Financial Instruments
The Company designed its other financial assets and warrant liability as FVTPL, which are measured at fair value. Fair value of other financial assets is determined based on quoted market prices and is categorized as Level 1 measurement. The warrant liability is recorded at fair value based on observable market inputs. Trade and other receivables and cash and cash equivalents are classified as loans and receivables, which are measured at amortized cost. Trade and other payables and con- vertible debt are classified as other financial liabilities, which are measured at amortized cost. Fair value of Trade and other payables and convertible debt are determined from transaction values that are not based on observable market data.
The carrying value of the Company’s cash and cash equivalents, trade and other receivables, trade and other payables approxi- mate their fair value due to the relatively short term nature of these instruments.
The Company’s convertible debt fair value is based on market interest rate. As at August 31, 2012 the fair value of the convertible debt agreements did not differ materially from their carrying value.
|
|
MANAGEMENT’S DISCUSSION AND ANALYSIS
|
| Fair value estimates are made at a specific point in time, based on relevant market information and information about financial instruments. These estimates are subject to and involve uncertainties and matters of significant judgment, therefore cannot be determined with precision. Changes in assumptions could significantly affect the estimates.
A summary of the Company's risk exposures as they relate to financial instruments are reflected below:
Credit Risk
Credit risk is the risk of an unexpected loss if a third party to a financial instrument fails to meet its contractual obligations. The Company is subject to credit risk on the cash balances at the bank, its short-term bank investments and accounts and other receivables. The Company’s cash and cash equivalents and short- term bank investments are with Schedule 1 banks or equivalents. The accounts and other receivables consist of GST/HST receivable from the Custom Revenue Agency and amounts due from related parties.
Interest Rate Risk
Interest rate risk is the risk that the fair value or future cash flows of a financial instrument will fluctuate because of changes in market interest rate. The Company’s bank accounts earn inter- est income at variable rates. The Company’s future interest income is exposed to changes in short-term rates. As at August 31, 2012, a 1% increase/decrease in interest rates would decrease/increase net loss for the period by approximately $200,000 (2011 - $324,000.
Liquidity Risk
The Company’s approach to managing liquidity risk is to ensure that it will have sufficient liquidity to meet liabilities when due. As at August 31, 2012, the Company had current assets of $20,483,824 (August 31, 2011 - $32,922,378) and current liabilities of $2,318,393 (August 31, 2011 - $2,471,199). All of the Company’s financial liabilities and receivables have contractual maturities of less than 90 days and are subject to normal trade terms. Current working capital of the Company is $18,165,431 (August 31, 2011 - $30,451,179).
Foreign Currency Risk
The Company is exposed to the financial risk related to the fluctuation of foreign exchange rates. The Company has offices in Canada, USA, and Tanzania, but holds cash mainly in Canadian and United States currencies. A significant change in the currency exchange rates between the Canadian dollar relative to US dollar and Tanzanian shillings could have an effect on the
|
Company’s results of operations, financial position, or cash flows. At August 31, 2012, the Company had no hedging agreements in place with respect to foreign exchange rates. As a majority of the funds of the company are held in Canadian currencies, the change in the Canadian against United states dollar risk is not deemed material at August 31, 2012.
Disclosure of Outstanding Share Data
As at the date of this MD&A, there were 100,681,274 common shares outstanding. There were RSUs, convertible debt and warrants outstanding to purchase an aggregate 6,330,136 common shares.
Subsequent Event
Pursuant to the private placement completed on September 23, 2010, the Company received notice from an arm’s length third party to convert its Promissory Note in the principal amount of $1,000,000 bearing interest at 3% and convertible into 221,337 common shares at a price of $4.518 per share, and 221,337 shares were issued on October 17, 2012.
Litigation
There are no legal proceedings which may have or have had a significant effect on the Company’s financial position or profitability.
Outlook
The Company’s Board of Directors has confirmed the strategic objective of the Corporation is to explore and evaluate its various mineral properties and develop the Buckreef Gold Mine Re-development Project and the Kigosi project in northern Tanzania. In addition the Company seeks out and explores gold, nickel and other mineral deposits with the intention of developing certain ones for our own account and partnering with an exploration corporation to generate royalty interest in a deposit that results in production.
EXPLORATION SUMMARY
Kigosi Project
On May 31st, 2012 the Company was granted a two year permit from the Ministry of Wildlife and Nature Conservation to enter the Kigosi Game Reserve and continue with exploration activities. The Company is currently evaluating various alternatives for advancing the Kigosi Project by focusing on an area of near surface mineralization.
|
|
MANAGEMENT’S DISCUSSION AND ANALYSIS
|
| A quartz rubble area of mineralization has been identified which is of particular interest due to its tabular extent and unconsolidated nature. A 43-101 Technical Report dated Sept 1, 2011 has defined a surface area of 3.36km2 and an average thickness of 1.15m which contains an Indicated Mineral Resource of 3.89 million tons at an in-situ grade of 0.83g/t Au and an Inferred Mineral Resource of 6.30 million tons at a grade of 0.34g/t Au.
Itetemia Project
The Company is reviewing various alternatives for advancing its Itetemia project. Previous studies have indicated that the Golden Horseshoe Reef (GHR) represents a small, yet robust, medium-grade, near surface gold deposit that warrants further feasibility investigations. A 43-101 Technical Report dated January 31, 2012 shows that preliminary economic studies indicate the potential feasibility of a small opencast operation, at the current high gold prices. At lower gold prices, studies show the possibility of toll treating the GHR material at the neighbouring Bulyanhulu Mine.
The 43-101 Technical Report also includes a Resource Summary for the Golden Horseshoe Reef (GHR). Based on a 1.0g/t Au cut-off grade, Itetemia has an Indicated Mineral Resource of 2,80 million tons grading 2.96g/t Au containing 266,000 ounces of gold.
Buckreef Project
The Preliminary Economic Assessment (PEA) on the Buckreef Project that is contained in the August 23, 2012 43-101 Technical Report was commissioned by the Company for the purpose of defining and quantifying the preliminary technical and economic merits of the Project. The Buckreef Project comprises five gold deposits located within two geographically separated areas approximately 25km apart. For the purposes of the PEA, the two geographically separated areas have been termed the Buckreef Mining Area (“BRMA”) and the Buziba Mining Area (“BZMA”) and the individual gold deposits within these mining areas have been termed Prospects, as summarised below:-
■ BRMA: includes the Buckreef Prospect, the Bingwa Prospect and the Tembo Prospect; and
■ BZMA: includes the Buziba Prospect and the Busolwa Prospect.
At the time that the PEA was done the Company did not have sufficient information to warrant inclusion of the Eastern Porphyry prospect in the BRMA.
The Company has completed an aggressive resource definition drilling program in five areas of the BRMA (Buckreef Main zone,
|
Buckreef Footwall zone, Eastern Porphyry prospect, Bingwa prospect and Tembo prospect). A total of 165 holes for 32,569.28m were drilled during this period, which include 51 RC holes (3073m); 6 PQ Diamond holes (330.30m) for metallurgical test work for Bingwa and Tembo prospects; and 108 NQ Diamond holes (29,165.98m).
Buckreef Footwall zone:
The Footwall zone is located 100m west in the footwall of the Buckreef Main zone of the historic Buckreef mine. A total of 30 Reverse Circulation holes for 1873m were completed to investigate the lateral and deep extension of the target.
The drilling returned interesting assay results which include 3m averaging 1.29g/t gold; 6m averaging 2.67g/t gold; 5m averaging 2.62g/t gold; 6m averaging 4.87g/t gold and 6m averaging 1.63g/t gold, including 2m at 3.75g/t gold.
Eastern Porphyry prospect:
The Eastern Porphyry prospect is located 800m east of the Main Zone. The area is dominated by sequences of mafic rocks which include basaltic rock units alternating with dolerite and a series of narrow felsic porphyry units with pronounced shearing and pyrite-quartz-carbonate alteration of the mafic packages at the contacts with the felsic porphyry units. Mineralization is local-ized within the sheared, quartz-carbonate-pyrite altered zones in both mafic and felsic units.
At the Eastern Porphyry prospect, a total of 7 Diamond holes for 1,211.42m were completed to investigate and determine whether there is any potential to define the resource. The diamond core drilling program on the Eastern Porphyry prospect returned some significant intercepts. Among them are 4.8m averaging 4.63g/t gold (including 2m @ 10.93g/t gold) and 2m averaging 7.47g/t gold (including 1m @14.6g/t gold); 10.5m averaging 2.27g/t gold (including 1.1m @ 8.89g/t gold and 1.5m @ 5.32g/t gold).
Buckreef Main zone:
A total of 101 holes for 27,954.56m have been completed on the Buckreef Main zone and Buckreef Northeast extension. Drilling consists of: 3 diamond wedge holes (1,057.75m) and 98 Diamond holes (26,896.81m). Approximately half of this drilling has been carried out on the Buckreef Main zone and half of it on the Buckreef Northeast zone. This drilling was intended to explore the potential to define and upgrade the current inferred resource to the Indicated and Measured category at vertical depth of 150m and 200m, while testing the down dip continuity of the shear zone-hosted gold mineralization associated with quartz-carbonate-pyrite veins emplaced in the mafic volcanic sequence below 300m.
|
|
MANAGEMENT’S DISCUSSION AND ANALYSIS
|
| Surveys of inclination and azimuth were completed at nominal 30m intervals for all DD. The survey tool was usually a single shot Reflex camera and was operated by the drill contractor as part of normal drilling.
For diamond drilling, core recovery is generally very good. All DD holes commenced with an HQ size to the base of sap rock, followed by NQ size diameter which in turn is reduced to NQ2 size when fresh rock is reached or difficulties are encountered. TRE standard procedure is to mark a Top-of-Hole Reference (TOH) line which may be solid, dashed or dotted depending on the confidence attached to the core fitting.
The deeper drilling confirmed the down-dip continuity of the various near-surface mineralized zones, and some deeper holes seemed to indicate a thickening of mineralization with depth and occasional very high grade intercepts. One diamond drill hole returned 16m grading 2.23 g/t gold including a high grade section of 2.0 metres averaging 7.03 g/t, with a second hole yielding 35.35m grading 2.75 g/t gold including 6.35m averaging 5.75 g/t and 4.7m at 4.33 g/t. Another diamond drill hole targeted the down dip potential in the Main zone, returning 30m grading 2.66 g/t gold including 2.0m @ 6.5g/t, along with 5.0m grading 4.06g/t. The deepest segment of this hole returned 2.0m @ 1.77g/t from 197m in sheared, altered dolerite intercalated with felsic porphyry and milky white late quartz veins; 7.0m grading 3.47g/t gold; 4.0m grading 3.2 g/t gold; 3.0m is averaging 4.06 g/t; 3.0m at 3.16g/t gold; 13m averaging 2.86g/t gold; and 3.3m at 2.53 g/t gold.
Tembo Prospect:
A total of 23 holes for 1355.60m have been completed on the Tembo prospect. Drilling consists of 3 PQ Diamond holes (157.60m) and 20 RC holes (1198m). The PQ holes were intended for metallurgical testwork and the collected sample were analysed by MINTEK laboratory in South Africa.
Positive drill results were reported at Tembo including: 3.0m grading 14.75 g/t gold; 6.0m averaging 3.38 g/t gold; 3.0m averaging 2.62 g/t gold; and 2.0m at 1.92 g/t gold. Similar to Buckreef Main, Tembo mineralization is structurally controlled and is hosted in a sub-vertical shear zone emplaced along a mafic basaltic sequence. The mineralization is confined along an East-West trending shear structure and a newly discovered northeast trending splay.
Contribution of the recent Drill Campaign
at the Buckreef Project:
According to the August 23, 2012 43-101 Report, prior to the recent drilling campaign the BRMA, excluding the Eastern
|
Porphyry prospect, had a resource base made up of the following components: (a) the Buckreef prospect with 8.882 million tons of Measured and Indicated Mineral Resource at a grade of 1.97 g/t Au that contained approximately 563,000 ounces of gold and an Inferred Mineral Resource at 1.89 g/t Au that contained approxi-mately 435,000 ounces of gold ; (b) the Tembo prospect with 0.725 million tons of Inferred Mineral Resource at a grade of 2.18 g/t Au that contained approximately 51,000 ounces of gold; and (c) the Bingwa prospect with 1.120 million tons of Inferred Mineral Resource at a grade of 2.4 g/t Au that contained approxi-mately 86,000 ounces of gold. The Report did not contain any estimate of a potential resource for the Eastern Porphyry prospect; however, sufficient drilling has now been done to warrant including the Eastern Porphyry prospect into the Buckreef project. The Company has initiated a comprehensive evaluation of the contribution of the recent drill campaign to the resource base of the BRMA.
In October 2012 the Company announced it had retained Venmyn Rand Limited to prepare NI 43-101 compliant Mineral Resource block models and updated mineral resource statements for the Buckreef Project.
Risk Factors
The Company is subject to a number of extraneous risk factors over which it has no control. These factors are common to most exploration companies and include, among others: project ownership and exploration risk, depressed equity markets and related financing risk, commodity price risk, fluctuating exchange rates, environmental risk, insurance risk, sovereign risk. For further details on the risk factors affecting the Company, please see the Company’s Annual Information Form filed on SEDAR.
Status of TREC’s Transition to International
Financial Reporting Standards (“IFRS”)
Transition to IFRS from GAAP
In February 2008, the Canadian Accounting Standards Board confirmed that Canadian publicly accountable enterprises will be required to adopt International Financial Reporting Standards (“IFRS”) for financial periods beginning on and after January 1, 2011.
The Company has adopted IFRS with an adoption date of September 1, 2011 and a transition date of September 1, 2010.
IFRS Conversion
The Company’s IFRS conversion plan was comprehensive and addressed matters including changes in accounting policies, restatement of comparative periods, organizational and internal
|
|
MANAGEMENT’S DISCUSSION AND ANALYSIS
|
| controls and any required changes to business processes. To facilitate this process and ensure the full impact of the conversion was understood and managed reasonably, the Company hired an IFRS conversion project manager. The accounting staff attended several training courses on the adoption and implementation of IFRS. Through in depth training and the preparation of re-conciliations of historical Canadian GAAP financial statements to IFRS, the Company believes that its accounting personnel have obtained the necessary understanding of IFRS.
In conjunction with the adoption of IFRS the Company has implemented a new accounting system, which will satisfy all the information needs of the Company under IFRS. The Company has also reviewed its current internal and disclosure control processes and they did not need significant modification as a result of our conversion to IFRS.
Impact of IFRS
IFRS employs a conceptual framework that is similar to Canadian GAAP; however significant differences exist in certain matters of recognition, measurement and disclosure. While the adoption of IFRS did not change the actual cash flows of the Company, the adoption resulted in changes to the reported financial position and results of operations of the Company. In order to allow the users of the financial statements to better understand these changes, we have provided the reconciliations between Canadian GAAP and IFRS for the total assets, total liabilities, shareholders equity, cash flows and net loss in Note 3 to the interim consolidated financial statements. The adoption of IFRS has had no significant impact on the net cash flows of the Company. The changes made to the statements of financial position and comprehensive income have resulted in reclassifications of various amounts on the statements of cash flows that has been presented.
In preparing the reconciliations, the Company applied the principles and elections of IFRS 1, with a transition date of September 1, 2010. As the Company has adopted IFRS effective September 1, 2010, it has applied the provisions of IFRS 1 as described under the section entitled “Initial Adoption – IFRS 1”, with a September 1, 2010 transition date. The Company has also applied IFRS standards in effect at August 31, 2012 as required by IFRS 1.
Initial Adoption of International Accounting
Standards
IFRS 1 ‘‘First Time Adoption of International Accounting Standards’’ sets forth guidance for the initial adoption of IFRS. Under IFRS 1 the standards are applied retrospectively at the transitional date of the statement of financial position with all
|
adjustments to assets and liabilities as stated under GAAP taken to retained earnings unless certain exemptions are applied.
The optional exemptions elected and applied by the Company are as follows;
■ On the Transition Date, the Company has elected not to retrospectively apply IFRS 2, Share-based Payments (“IFRS 2”) to all share-based transactions at the date of transition. IFRS 2 will only be applied to equity instruments issued on or after, and that have not vested by, the transition Date.
■ Business combinations that occurred prior to the transition date have not been restated. There have been no business combinations that occurred during the year ended August 31, 2011 that required re-statement in compliance with IFRS.
■ IAS 23 ‘‘Borrowing Costs’’ has been applied prospectively from the transition date. The impact of the restatement of borrowing costs is described in the reconciliations between Canadian GAAP and IFRS in note 3 of the financial statements.
The Company has changed certain accounting policies to be consistent with IFRS at August 31, 2012, the Company’s first annual IFRS reporting date. As a result of the adoption of IFRS, the Company recorded certain adjustments to its comparative financial statements which are detailed in note 3 to the August 31, 2012 financial statements. The most significant adjustment was to reclassify from equity to liabilities the Company’s foreign currency denominated warrants and record the liability on a fair value basis.
Comparative Information
The Company has restated all periods from September 1, 2010 onwards in accordance with IFRS.
Disclosure Controls and Procedures (“DC&P”)
Requirements of NI 52-109 include conducting an evaluation of the effectiveness of DC&P. Management conducted an assess-ment of the effectiveness of the DC&P in place as of August 31, 2012 and concluded that such procedures are adequate and effec-tive to ensure accurate and complete disclosures in filings. Any system control over disclosure procedures, particularly for junior exploration companies, no matter how well designed and imple-mented, has inherent limitations and may not prevent or detect all inaccuracies. These limitations include limited personnel avail-able for such work, geographical logistics and human error among
|
|
MANAGEMENT’S DISCUSSION AND ANALYSIS
|
| others. The Board of Directors assess the integrity of the public financial disclosures through the oversight of the Audit Committee.
Internal Control Over Financial Reporting (“ICFR”)
Requirements of NI 52-109 include conducting an evaluation of the effectiveness of ICFR. Management conducted an assessment of the effectiveness of the ICFR in place as of August 31, 2012 and concluded that such procedures are adequate and effective to provide reasonable assurance regarding the reliability of the Company’s financial reporting and the preparation of financial statements in compliance with International Financial Reporting Standards. Any system of internal control over financial reporting, no matter how well designed and implemented, has inherent limitations and may not prevent or detect all misstatements. The Board of Directors assess the integrity of the public financial disclosure through the oversight of the Audit Committee.
Additional Information
Tanzanian Royalty Exploration Corporation is a Canadian public company listed on the TSX Exchange trading under the symbol “TNX” and also listed on the NYSE Amex Equities Exchange trading under the symbol “TRX”. Additional information about the company and its business activities is available on SEDAR at www.sedar.com and the Company’s website at www.tanzanianroyalty.com .
Approval
The Board of Directors of Tanzanian Royalty Exploration Corporation has approved the disclosure contained in the annual MD&A. A copy of this annual MD&A will be provided to anyone who requests it. It is also available on the SEDAR website at www.sedar.com
Cautionary Note Regarding
Forward-Looking Statements
Except for statements of historical fact relating to the Company, certain information contained in this MD&A constitutes “forward-looking information” under Canadian securities legislation. Forward-looking information includes, but is not limited to, statements with respect to the potential of the Company’s properties; the future prices of base and precious metals; success of exploration activities, cost and timing of future exploration and development; the estimation of mineral reserves
|
and mineralresources; conclusions of economic evaluations; requirements for additional capital; and other statements relating to the financial and business prospects of the Company. Generally, forward-looking information can be identified by the use of forward-looking terminology such as “plans”, “expects”, or “does not expect”, “is expected”, “budget”, “scheduled”, “estimates”, “forecasts”, “intends”, “anticipates” or “does not anticipate”, or “believes”, or “variations of such words and phrases or statements that certain actions, events or results “may” , “could”, “would”, “might” or “will be taken”, “occur” or “be achieved”. Forward-looking information is based on the reasonable assumptions, estimates, analysis and opinions of management made in light of its experience and its perception of trends, current conditions and expected developments at Buckreef or other mining or exploration projects, as well as other factors that management believes to be relevant and reasonable in the circumstances at the date that such statements are made, and is inherently subject to known and unknown risks, uncertainties and other factors that may cause the actual results, level of activity, performance or achievements of the Company to be materially different from those expressed or implied by such forward-looking information, including but not limited to risks related to: unexpected events and delays during permitting; the possibility that future exploration results will not be consistent with the Company’s expectations; timing and availability of external financing on accept-able terms in light of the current decline in global liquidity and credit availability; uncertainty of inferred mineral resources; future prices of base and precious metals; currency exchange rates; government regulation of mining operations; failure of equipment or processes to operate as anticipated; risks inherent in base and precious metal exploration and development including environ-mental hazards, industrial accidents, unusual or unexpected geological formations; and uncertain political and economic environments. Although management of the Company has attempted to identify important factors that could cause actual results to differ materially from those contained in forward-looking information, there may be other factors that cause results not to be as anticipated, estimated or intended. There can be no assurance that such statements will prove to be accurate, as actual results and future events could differ materially from those anticipated in such statements. Accordingly, readers should not place undue reliance on forward-looking information. The Company does not undertake to update any forward-looking information, except in accordance with applicable securities laws. |
| TANZANIAN ROYALTY EXPLORATION CORPORATION |
 |
 |
|
| James E. Sinclair | Steven Van Tongeren | |
| President and CEO | Chief Financial Officer |
|
TANZANIAN ROYALTY EXPLORATION CORPORATION
|

|
TANZANIAN ROYALTY EXPLORATION CORPORATION
|
|
As at
|
August 31,
2012
|
August 31,
2011
|
September 1,
2010
|
|||||||||
| (Note 3) | (Note 3) | |||||||||||
|
Assets
|
||||||||||||
|
Current Assets
|
||||||||||||
|
Cash and cash equivalents (Note 19)
|
$ | 20,058,678 | $ | 32,428,471 | $ | 1,325,708 | ||||||
|
Other financial assets (Note 8)
|
17,850 | 29,400 | 40,425 | |||||||||
|
Trade and other receivables (Note 16)
|
71,225 | 157,134 | 79,073 | |||||||||
|
Inventory (Note 18)
|
248,395 | 223,518 | 229,196 | |||||||||
|
Prepaid expenses (Note 15)
|
87,676 | 83,855 | 60,362 | |||||||||
| 20,483,824 | 32,922,378 | 1,734,764 | ||||||||||
|
Property, plant and equipment (Note 6)
|
1,209,710 | 1,447,030 | 1,092,770 | |||||||||
|
Mineral properties and deferred exploration (Note 5)
|
41,562,996 | 33,262,972 | 29,468,183 | |||||||||
| $ | 63,256,530 | $ | 67,632,380 | $ | 32,295,717 | |||||||
| Liabilities | ||||||||||||
| Current Liabilities | ||||||||||||
| Trade, other payables and accrued liabilities (Note 17) | $ | 2,318,393 | $ | 2,471,199 | $ | 620,795 | ||||||
| 2,318,393 | 2,471,199 | 620,795 | ||||||||||
|
Convertible debt (Note 7)
|
2,073,286 | 2,958,039 | 1,841,226 | |||||||||
|
Warrant liability (Note 9)
|
8,114,000 | 5,711,250 | - | |||||||||
| 12,505,679 | 11,140,488 | 2,462,021 | ||||||||||
|
Shareholders’ equity
|
||||||||||||
|
Share capital (Note 9)
|
113,476,858 | 109,935,253 | 72,855,310 | |||||||||
|
Share subscriptions received
|
- | - | 874,149 | |||||||||
|
Share based payment reserve (Note 11)
|
670,779 | 706,988 | 476,205 | |||||||||
|
Warrants reserve (Note 10)
|
870,037 | 1,353,990 | - | |||||||||
|
Accumulated deficit
|
(64,266,823 | ) | (55,504,339 | ) | (44,371,968 | ) | ||||||
|
Total shareholders’ equity
|
50,750,851 | 56,491,892 | 29,833,696 | |||||||||
| $ | 63,256,530 | $ | 67,632,380 | $ | 32,295,717 | |||||||
|
TANZANIAN ROYALTY EXPLORATION CORPORATION
|
| Year ended August 31, | 2012 | 2011 | ||||||
| (Note 3) | ||||||||
|
Administrative expenses
|
||||||||
|
Depreciation
|
$ | 379,603 | $ | 463,169 | ||||
|
Consulting
|
266,011 | 287,885 | ||||||
|
Directors’ fees
|
365,049 | 461,484 | ||||||
|
Office and general
|
437,380 | 443,774 | ||||||
|
Shareholder information
|
581,526 | 332,586 | ||||||
|
Professional fees
|
869,077 | 632,317 | ||||||
|
Salaries and benefits
|
1,596,951 | 1,601,832 | ||||||
|
Share based payments (Note 9)
|
777,630 | 368,161 | ||||||
|
Travel and accommodation
|
169,420 | 199,631 | ||||||
| (5,442,647 | ) | (4,790,839 | ) | |||||
|
Other income (expenses)
|
||||||||
|
Foreign exchange
|
24,082 | (518,794 | ) | |||||
|
Interest, net
|
274,913 | 25,042 | ||||||
|
Interest accretion
|
(102,785 | ) | (181,076 | ) | ||||
|
Loss on other financial assets (Note 8)
|
(18,017 | ) | (11,025 | ) | ||||
|
Issuance costs
|
- | (602,223 | ) | |||||
|
Change in value of warrant liability (Note 9)
|
(2,321,921 | ) | (315,159 | ) | ||||
|
Property investigation costs
|
(84,518 | ) | (36,542 | ) | ||||
|
Write-off of mineral properties and deferred exploration costs (Note 5)
|
(1,293,969 | ) | (3,845,564 | ) | ||||
|
Modification of warrants (Note 9)
|
(183,000 | ) | - | |||||
|
Withholding tax recoveries (costs)
|
250,019 | (856,191 | ) | |||||
|
Net loss and comprehensive loss
|
$ | (8,897,843 | ) | $ | (11,132,371 | ) | ||
| Loss per share – basic and diluted | $ | (0.09 | ) | $ | (0.12 | ) | ||
| Weighted average # of shares outstanding – basic and diluted | 100,151,347 | 93,839,466 | ||||||
|
TANZANIAN ROYALTY EXPLORATION CORPORATION
|
|
Share Capital
|
Reserves
|
|||||||||||||||||||||||||||
|
Number of
|
Share based
|
Share subscriptions
|
Accumulated
|
|||||||||||||||||||||||||
|
Shares
|
Amount
|
payments
|
Warrants
|
received
|
deficit
|
Total
|
||||||||||||||||||||||
|
Balance at September 1, 2010
|
91,415,459 | $ | 72,855,310 | $ | 476,205 | $ | - | $ | 874,149 | $ | (44,371,968 | ) | $ | 29,833,696 | ||||||||||||||
|
Private placement, net of issue costs
|
2,532,119 | 12,912,833 | - | 919,193 | (874,149 | ) | - | 12,957,877 | ||||||||||||||||||||
|
Issued for prospectus, net of issue costs
|
5,263,158 | 21,617,629 | - | 434,797 | - | - | 22,052,426 | |||||||||||||||||||||
|
Issued pursuant to share subscription
|
||||||||||||||||||||||||||||
|
agreements
|
144,430 | 800,000 | - | - | - | - | 800,000 | |||||||||||||||||||||
|
Issued pursuant to Restricted Share Unit
|
||||||||||||||||||||||||||||
|
Plan
|
136,408 | 681,339 | (681,339 | ) | - | - | - | - | ||||||||||||||||||||
|
RSU shares forfeited
|
- | (13,062 | ) | - | - | - | (13,062 | ) | ||||||||||||||||||||
|
Issued on conversion of convertible debt
|
||||||||||||||||||||||||||||
|
agreement
|
247,173 | 971,107 | (20,681 | ) | - | - | - | 950,426 | ||||||||||||||||||||
|
Equity conversion value for convertible debt
|
- | 70,404 | - | - | - | 70,404 | ||||||||||||||||||||||
|
Shares issued for property
|
20,006 | 97,035 | - | - | - | - | 97,035 | |||||||||||||||||||||
|
Share based compensation
|
- | 875,461 | - | - | - | 875,461 | ||||||||||||||||||||||
|
Total comprehensive loss for the year
|
- | - | - | - | (11,132,371 | ) | (11,132,371 | ) | ||||||||||||||||||||
|
Balance at August 31, 2011
|
99,758,753 | 109,935,253 | 706,988 | 1,353,990 | - | (55,504,339 | ) | 56,491,892 | ||||||||||||||||||||
|
Issued on conversion of convertible debt
|
||||||||||||||||||||||||||||
|
agreement
|
233,318 | 950,213 | (30,638 | ) | - | - | - | 919,575 | ||||||||||||||||||||
|
Shares issued for services
|
35,000 | 115,834 | - | - | - | - | 115,834 | |||||||||||||||||||||
|
Issued pursuant to Restricted Share Unit
|
182,866 | 1,024,793 | (1,024,793 | ) | - | - | - | - | ||||||||||||||||||||
|
(“RSU”) Plan
|
||||||||||||||||||||||||||||
|
RSU shares forfeited
|
- | (264,528 | ) | - | - | - | (264,528 | ) | ||||||||||||||||||||
|
Transfer of warrants to warrant liability
|
- | - | (216,188 | ) | - | 135,359 | (80,829 | ) | ||||||||||||||||||||
|
Compensation warrants exercised
|
250,000 | 1,000,000 | - | - | - | - | 1,000,000 | |||||||||||||||||||||
|
Reserve transferred on exercise of
|
- | |||||||||||||||||||||||||||
|
compensation warrants
|
450,765 | (450,765 | ) | - | - | - | ||||||||||||||||||||||
|
Modification of warrants
|
- | - | 183,000 | - | - | 183,000 | ||||||||||||||||||||||
|
Share based compensation
|
- | 1,283,750 | - | - | - | 1,283,750 | ||||||||||||||||||||||
|
Total comprehensive loss for the year
|
- | - | - | - | (8,897,843 | ) | (8,897,843 | ) | ||||||||||||||||||||
|
Balance at August 31, 2012
|
100,459,937 | $ | 113,476,858 | $ | 670,779 | $ | 870,037 | $ | - | $ | (64,266,823 | ) | $ | 50,750,851 | ||||||||||||||
|
TANZANIAN ROYALTY EXPLORATION CORPORATION
|
Consolidated Statements of Cash Flow (Expressed in Canadian dollars)
|
Year ended August 31,
|
2012
|
2011
|
||||||
|
(Note 3
|
) | |||||||
|
Operations
|
||||||||
|
Net loss
|
$ | (8,897,843 | ) | $ | (11,132,371 | ) | ||
|
Adjustments to reconcile net loss to cash flow from
|
||||||||
|
operating activities:
|
||||||||
| Depreciation | 379,603 | 463,169 | ||||||
| Change in value of warrant liability | 2,321,921 | 315,159 | ||||||
| Modification of warrants | 183,000 | - | ||||||
| Shares issued for services | 50,359 | - | ||||||
| Share based payments | 777,630 | 368,161 | ||||||
| Loss on other financial assets | 11,550 | 11,025 | ||||||
| Cash interest paid | (67,964 | ) | (60,000 | ) | ||||
| Cash interest received | 259,116 | 85,042 | ||||||
| Interest, net | (274,913 | ) | (25,042 | ) | ||||
| Interest accretion | 102,785 | 181,076 | ||||||
| Non cash directors’ fees | 289,448 | 453,845 | ||||||
| Write-off of mineral properties | 1,293,969 | 3,845,564 | ||||||
|
Net change in non-cash operating working capital items:
|
||||||||
|
Trade and other receivables
|
85,909 | (78,062 | ) | |||||
|
Inventory
|
(24,877 | ) | 5,678 | |||||
|
Prepaid expenses
|
(3,821 | ) | (23,493 | ) | ||||
|
Trade, other payables and accrued liabilities
|
(1,199,491 | ) | 1,850,404 | |||||
|
Cash used in operations
|
(4,713,619 | ) | (3,739,845 | ) | ||||
| Investing | ||||||||
| Mineral properties and exploration expenditures | (8,564,005 | ) | (7,769,107 | ) | ||||
|
Option payments received and recoveries
|
50,114 | 279,244 | ||||||
|
Equipment and leasehold improvements, net
|
(142,283 | ) | (817,429 | ) | ||||
|
Cash used in investing activities
|
(8,656,174 | ) | (8,307,292 | ) | ||||
| Financing | ||||||||
| Share capital issued – net of issue costs | 1,000,000 | 14,344,400 | ||||||
|
Issuance from prospectus
|
- | 26,846,345 | ||||||
|
Issuance of convertible debt
|
- | 2,033,304 | ||||||
|
Repayment of subscription received
|
- | (74,149 | ) | |||||
|
Cash provided from financing activities
|
1,000,000 | 43,149,900 | ||||||
|
Net (decrease) increase in cash and cash equivalents
|
(12,369,793 | ) | 31,102,763 | |||||
|
Cash and cash equivalents, beginning of year
|
32,428,471 | 1,325,708 | ||||||
| Cash and cash equivalents, end of year | $ | 20,058,678 | $ | 32,428,471 | ||||
|
TANZANIAN ROYALTY EXPLORATION CORPORATION
|
|
Supplementary information:
|
||||||||
|
Non-cash transactions:
|
||||||||
|
Share based payments capitalized to mineral properties
|
17,138 | 53,455 | ||||||
| Share issued pursuant to RSU plan | 1,024,793 | 681,338 | ||||||
|
Shares issued in current year for subscriptions received in prior year
|
- | 800,000 | ||||||
|
Warrants issued for prospectus
|
- | 4,492,217 | ||||||
|
Warrants issued for private placement
|
- | 919,193 | ||||||
|
Shares issued on conversion of convertible debt
|
950,213 | 971,107 | ||||||
|
Shares issued for services
|
115,834 | - | ||||||
|
TANZANIAN ROYALTY EXPLORATION CORPORATION
|
|
TANZANIAN ROYALTY EXPLORATION CORPORATION
|
|
•
|
IFRS 7 ‘Financial Instruments, Disclosures’ - effective for annual periods beginning on or after January 1, 2013, IFRS 7 has been amended to provide more extensive quantitative disclosures for financial instruments that are offset in the statement of financial position or that are subject to enforceable master netting similar arrangements.
|
|
•
|
IFRS 9 ‘Financial Instruments: Classification and Measurement’ – effective for annual periods beginning on or after January 1, 2015, with early adoption permitted, introduces new requirements for the classification and measurement of financial instruments.
|
|
•
|
IFRS 10 ‘Consolidated Financial Statements’ – effective for annual periods beginning on or after January 1, 2013, with early adoption permitted, establishes principles for the presentation and preparation of consolidated financial statements when an entity controls one or more other entities.
|
|
•
|
IFRS 11 ‘Joint Arrangements’ - effective for annual periods beginning on or after January 1, 2013, with early adoption permitted, provides for a more realistic reflection of joint arrangements by focusing on the rights and obligations of the arrangement, rather than its legal form.
|
|
•
|
IFRS 12 ‘Disclosure of Interests in Other Entities’ - effective for annual periods beginning on or after January 1, 2013, with early adoption permitted, requires the disclosure of information that enables users of financial statements to evaluate the nature of, and risks associated with its interests in other entities and the effects of those interests on its financial position, financial performance and cash flows.
|
|
•
|
IFRS 13 ‘Fair Value Measurement’ - effective for annual periods beginning on or after January 1, 2013, with early adoption permitted, provides the guidance on the measurement of fair value and related disclosures through a fair value hierarchy.
|
|
•
|
IAS 1 ‘Presentation of Financial Statements’ - the IASB amended IAS 1 with a new requirement for entities to group items presented in other comprehensive income on the basis of whether they are potentially reclassifiable to profit or loss.
|
|
•
|
IAS 12 ‘Income Taxes’ – In December 2010, effective for annual periods beginning on or after January 1, 2012, IAS 12 Income Taxes was amended to introduce an exception to the existing principle for the measurement of deferred tax assets or liabilities arising on investment property measured at fair value. As a result of the amendments, SIC 21, Income Taxes – recovery of revalued non-depreciable assets, will no longer apply to investment properties carried at fair value. The amendments also incorporate into IAS 12 the remaining guidance previously contained in SIC 21, which is withdrawn.
|
|
•
|
IAS 19 ‘Employee Benefits’ - effective for annual periods beginning on or after January 1, 2013, a number of amendments have been made to IAS 19, which included eliminating the use of the “corridor” approach in accounting for defined benefit plans and requiring defined benefit plan remeasurements to be presented in OCI. The standard also includes amendments related to termination benefits as well as enhanced disclosures.
|
|
TANZANIAN ROYALTY EXPLORATION CORPORATION
|
|
•
|
IAS 27 ‘Separate Financial Statements’ - effective for annual periods beginning on or after January 1, 2013, as a result of the issue of the new consolidation suite of standards, IAS 27 Separate Financial Statements has been reissued, as the consolidation guidance will now be included in IFRS 10. IAS 27 will now only prescribe the accounting and disclosure requirements for investments in subsidiaries, joint ventures and associates when an entity prepares separate financial statements.
|
|
•
|
IAS 28 ‘Investments in Associates and Joint Ventures’ - effective for annual periods beginning on or after January 1, 2013, as a consequence of the issue of IFRS 10, IFRS 11and IFRS 12, IAS 28 has been amended and will provide the accounting guidance for investments in associates and to set out the requirements for the application of the equity method when accounting for investments in associates and joint ventures. The amended IAS 28 will be applied by all entities that are investors with joint control of, or significant influence over, an investee.
|
|
•
|
IAS 32 ‘Financial instruments, Presentation’ – In December 2011, effective for annual periods beginning on or after January 1, 2013, IAS 32 was amended to clarify the requirements for offsetting financial assets and liabilities. The amendments clarify that the right of offset must be available on the current date and cannot be contingent on a future date.
|
|
•
|
On the Transition Date, the Company has elected not to retrospectively apply IFRS 2, Share-based Payments (“IFRS 2”) to all share-based transactions at the date of transition. IFRS 2 will only be applied to equity instruments issued on or after, and that have not vested by, the Transition Date.
|
|
•
|
Business combinations that occurred prior to the Transition Date have not been restated. There have been no business combinations that occurred during the year ended August 31, 2011 that required re-statement in compliance with IFRS.
|
|
•
|
IAS 23 ‘‘Borrowing Costs’’ has been applied prospectively from the Transition Date. The impact of borrowing costs is described in the explanatory notes following the reconciliations between Canadian GAAP and IFRS.
|
|
TANZANIAN ROYALTY EXPLORATION CORPORATION
|
|
TANZANIAN ROYALTY EXPLORATION CORPORATION
|
|
As at September 1, 2010
|
|||||||||||||
|
Effect of
|
|||||||||||||
|
transition to
|
|||||||||||||
|
GAAP
|
IFRS
|
IFRS
|
Notes
|
||||||||||
|
Assets
|
|||||||||||||
|
Current Assets
|
|||||||||||||
|
Cash and cash equivalents
|
$ | 1,325,708 | $ | - | $ | 1,325,708 | |||||||
|
Other financial assets
|
40,425 | - | 40,425 | ||||||||||
|
Trade and other receivables
|
79,073 | - | 79,073 | ||||||||||
|
Inventory
|
229,196 | - | 229,196 | ||||||||||
|
Prepaid expenses
|
60,362 | - | 60,362 | ||||||||||
| 1,734,764 | - | 1,734,764 | |||||||||||
|
Property, plant and equipment
|
1,092,770 | - | 1,092,770 | ||||||||||
|
Mineral properties and deferred exploration
|
29,956,026 | (487,843 | ) | 29,468,183 |
(c)
|
||||||||
| $ | 32,783,560 | $ | (487,843 | ) | $ | 32,295,717 | |||||||
|
Liabilities
|
|||||||||||||
|
Current Liabilities
|
|||||||||||||
|
Trade, other payables and accrued liabilities
|
$ | 620,795 | $ | - | $ | 620,795 | |||||||
| 620,795 | - | 620,795 | |||||||||||
|
Convertible debt
|
1,841,226 | - | 1,841,226 | ||||||||||
| 2,462,021 | - | 2,462,021 | |||||||||||
|
Shareholders’ equity
|
|||||||||||||
|
Share capital
|
72,855,310 | - | 72,855,310 | ||||||||||
|
Share subscriptions received
|
874,149 | - | 874,149 | ||||||||||
|
Share based payment reserve
|
476,205 | - | 476,205 | ||||||||||
|
Accumulated deficit
|
(43,884,125 | ) | (487,843 | ) | (44,371,968 | ) |
(c)
|
||||||
| 30,321,539 | (487,843 | ) | 29,833,696 | ||||||||||
| $ | 32,783,560 | $ | (487,843 | ) | $ | 32,295,717 | |||||||
|
TANZANIAN ROYALTY EXPLORATION CORPORATION
|
|
As at August 31, 2011
|
|||||||||||||
|
Effect of
|
|||||||||||||
|
transition to
|
|||||||||||||
|
GAAP
|
IFRS
|
IFRS
|
Notes
|
||||||||||
|
Assets
|
|||||||||||||
|
Current Assets
|
|||||||||||||
|
Cash and cash equivalents
|
$ | 32,428,471 | $ | - | $ | 32,428,471 | |||||||
|
Other financial assets
|
29,400 | - | 29,400 | ||||||||||
|
Trade and other receivables
|
157,134 | - | 157,134 | ||||||||||
|
Inventory
|
223,518 | - | 223,518 | ||||||||||
|
Prepaid expenses
|
83,855 | - | 83,855 | ||||||||||
| 32,922,378 | - | 32,922,378 | |||||||||||
|
Property, plant and equipment
|
1,447,030 | - | 1,447,030 | ||||||||||
|
Mineral properties and deferred exploration
|
33,744,578 | (481,606 | ) | 33,262,972 |
(b), (c)
|
||||||||
| $ | 68,113,986 | $ | (481,606 | ) | $ | 67,632,380 | |||||||
|
Liabilities
|
|||||||||||||
|
Current Liabilities
|
|||||||||||||
|
Trade, other payables and accrued liabilities
|
$ | 2,471,199 | $ | - | $ | 2,471,199 | |||||||
| 2,471,199 | - | 2,471,199 | |||||||||||
|
Convertible debt
|
2,958,039 | - | 2,958,039 | ||||||||||
|
Warrant liability
|
- | 5,711,250 | 5,711,250 |
(a)
|
|||||||||
| 5,429,238 | 5,711,250 | 11,140,488 | |||||||||||
|
Shareholders’ equity
|
|||||||||||||
|
Share capital
|
110,671,701 | (736,448 | ) | 109,935,253 |
(a)
|
||||||||
|
Share based payment reserve
|
706,988 | - | 706,988 | ||||||||||
|
Warrants reserve
|
5,411,410 | (4,057,420 | ) | 1,353,990 |
(a)
|
||||||||
|
Accumulated deficit
|
(54,105,351 | ) | (1,398,988 | ) | (55,504,339 | ) |
(a), (b), (c)
|
||||||
| 62,684,748 | (6,192,856 | ) | 56,491,892 | ||||||||||
| $ | 68,113,986 | $ | (481,606 | ) | $ | 67,632,380 | |||||||
|
TANZANIAN ROYALTY EXPLORATION CORPORATION
|
|
Year ended August 31, 2011
|
|||||||||||||
|
Effect of
|
|||||||||||||
|
transition to
|
|||||||||||||
|
GAAP
|
IFRS
|
IFRS
|
Notes
|
||||||||||
|
Administrative Expenses
|
|||||||||||||
|
Depreciation
|
$ | 463,169 | $ | - | $ | 463,169 | |||||||
|
Consulting
|
287,885 | - | 287,885 | ||||||||||
|
Directors’ fees
|
461,484 | - | 461,484 | ||||||||||
|
Office and general
|
443,774 | - | 443,774 | ||||||||||
|
Shareholder information
|
332,586 | - | 332,586 | ||||||||||
|
Professional fees
|
632,317 | - | 632,317 | ||||||||||
|
Salaries and benefits
|
1,601,832 | - | 1,601,832 | ||||||||||
|
Share based payments
|
368,161 | - | 368,161 | ||||||||||
|
Travel and accommodation
|
199,631 | - | 199,631 | ||||||||||
| (4,790,839 | ) | - | (4,790,839 | ) | |||||||||
|
Other income (expense)
|
|||||||||||||
|
Foreign exchange
|
(518,794 | ) | - | (518,794 | ) | ||||||||
|
Interest, net
|
18,805 | 6,237 | 25,042 |
(b)
|
|||||||||
|
Interest accretion
|
(181,076 | ) | - | (181,076 | ) | ||||||||
|
Loss on other financial assets
|
(11,025 | ) | - | (11,025 | ) | ||||||||
|
Issuance costs
|
- | (602,223 | ) | (602,223 | ) |
(a)
|
|||||||
|
Change in value of warrant liability
|
- | (315,159 | ) | (315,159 | ) |
(a)
|
|||||||
|
Property investigation costs
|
(36,542 | ) | - | (36,542 | ) | ||||||||
|
Withholding tax
|
(856,191 | ) | - | (856,191 | ) | ||||||||
| Write-off of mineral properties and deferred exploration | (3,845,564 | ) | - | (3,845,564 | ) | ||||||||
| Net loss and comprehensive loss | (10,221,226 | ) | $ | (911,145 | ) | $ | (11,132,371 | ) | |||||
|
TANZANIAN ROYALTY EXPLORATION CORPORATION
|
|
Year ended August 31, 2011
|
|||||||||||||
|
Effect of
|
|||||||||||||
|
transition
|
|||||||||||||
|
GAAP
|
to IFRS
|
IFRS
|
Notes
|
||||||||||
|
Operations
|
|||||||||||||
|
Net loss
|
$ | (10,221,226 | ) | $ | (911,145 | ) | $ | (11,132,371 | ) |
(a), (b)
|
|||
|
Adjustments to reconcile net loss to cash flow from operating activities:
|
|||||||||||||
|
Depreciation
|
463,169 | 463,169 | |||||||||||
|
Share based payments
|
368,161 | 368,161 | |||||||||||
|
Loss on other financial assets
|
11,025 | 11,025 | |||||||||||
|
Change in value of warrant liability
|
315,159 | 315,159 |
(a)
|
||||||||||
|
Cash interest paid
|
(60,000 | ) | (60,000 | ) |
(d)
|
||||||||
|
Cash interest received
|
85,042 | 85,042 |
(d)
|
||||||||||
|
Interest, net
|
(25,042 | ) | (25,042 | ) |
(d)
|
||||||||
|
Interest accretion
|
181,076 | 181,076 | |||||||||||
|
Non cash directors' fees
|
453,845 | 453,845 | |||||||||||
|
Write off of mineral properties
|
3,845,564 | 3,845,564 | |||||||||||
|
Net change in non-cash operating working capital items:
|
|||||||||||||
|
Trade and other receivables
|
(78,062 | ) | (78,062 | ) | |||||||||
|
Inventory
|
5,678 | 5,678 | |||||||||||
|
Prepaid expenses
|
(23,493 | ) | (23,493 | ) | |||||||||
|
Trade, other payables and accrued liabilities
|
1,850,404 | 1,850,404 | |||||||||||
| (3,143,859 | ) | (595,986 | ) | (3,739,845 | ) | ||||||||
|
Investing
|
|||||||||||||
|
Mineral properties and exploration expenditures
|
(7,762,870 | ) | (6,237 | ) | (7,769,107 | ) |
(b)
|
||||||
|
Option payments received and recoveries
|
279,244 | - | 279,244 | ||||||||||
|
Equipment and leasehold improvements
|
(817,429 | ) | - | (817,429 | ) | ||||||||
| (8,301,055 | ) | (6,237 | ) | (8,307,292 | ) | ||||||||
|
Financing
|
|||||||||||||
|
Share capital issued – net of issue costs
|
13,742,177 | 602,223 | 14,344,400 |
(a)
|
|||||||||
|
Issuance of convertible debt
|
2,033,304 | - | 2,033,304 | ||||||||||
|
Issuance from prospectus
|
26,846,345 | - | 26,846,345 | ||||||||||
|
Repayment of subscription received
|
(74,149 | ) | - | (74,149 | ) | ||||||||
| 42,547,677 | 602,223 | 43,149,900 | |||||||||||
|
Net increase in cash and cash equivalents
|
31,102,763 | - | 31,102,763 | ||||||||||
|
Cash and cash equivalents, beginning of year
|
1,325,708 | - | 1,325,708 | ||||||||||
|
Cash and cash equivalents, end of year
|
$ | 32,428,471 | $ | - | $ | 32,428,471 |
|
TANZANIAN ROYALTY EXPLORATION CORPORATION
|
|
TANZANIAN ROYALTY EXPLORATION CORPORATION
|
|
TANZANIAN ROYALTY EXPLORATION CORPORATION
|
|
Assets
|
Rate
|
|||
|
Machinery and equipment
|
20% to 30
|
% | ||
|
Automotive
|
30 | % | ||
|
Computer equipment
|
30 | % | ||
|
Drilling equipment and automotive equipment
|
6.67 | % | ||
|
Leasehold improvements
|
20 | % | ||
|
TANZANIAN ROYALTY EXPLORATION CORPORATION
|
|
TANZANIAN ROYALTY EXPLORATION CORPORATION
|
|
TANZANIAN ROYALTY EXPLORATION CORPORATION
|
|
TANZANIAN ROYALTY EXPLORATION CORPORATION
|
|
TANZANIAN ROYALTY EXPLORATION CORPORATION
|
|
TANZANIAN ROYALTY EXPLORATION CORPORATION
|
|
TANZANIAN ROYALTY EXPLORATION CORPORATION
|
|
Itetemia
|
Luhala
|
Kigosi
|
Lunguya
|
Kanagele
|
Tulawaka
|
Ushirombo
|
Mbogwe
|
Biharamulu
|
Buckreef
|
Other
|
||||||||||||||||||||||||||||||||||||||
|
(a)
|
(b)
|
(c)
|
(d)
|
(e)
|
(f)
|
(g)
|
(h)
|
(i)
|
(j)
|
(k)
|
Total
|
|||||||||||||||||||||||||||||||||||||
|
Balance, September 1, 2010
|
$ | 5,945,934 | $ | 3,842,114 | $ | 11,402,215 | $ | 2,725,692 | $ | 1,065,772 | $ | 620,209 | $ | 246,303 | $ | 80,753 | $ | 122,029 | $ | - | $ | 3,417,162 | $ | 29,468,183 | ||||||||||||||||||||||||
|
Exploration expenditures:
|
||||||||||||||||||||||||||||||||||||||||||||||||
|
Camp, field supplies and travel
|
- | - | 321,490 | 64,326 | - | - | - | - | - | - | 35,892 | 421,708 | ||||||||||||||||||||||||||||||||||||
|
Exploration and field overhead
|
13,957 | 7,408 | 1,255,558 | 152,294 | 2,833 | 971 | 18,052 | 3,821 | 2,300 | 598,722 | 183,972 | 2,239,888 | ||||||||||||||||||||||||||||||||||||
|
Geological consulting and field wages
|
- | - | 22,331 | - | - | - | - | - | - | - | - | 22,331 | ||||||||||||||||||||||||||||||||||||
|
Geophysical and geochemical
|
- | - | 191,604 | 66,550 | - | - | - | - | - | - | 42 | 258,196 | ||||||||||||||||||||||||||||||||||||
|
Property acquisition costs
|
25,870 | - | 234,910 | - | 55,882 | 15,595 | - | - | - | 3,822,521 | 259,706 | 4,414,484 | ||||||||||||||||||||||||||||||||||||
|
Trenching and drilling
|
- | - | 324,942 | 244,002 | - | - | - | - | - | - | - | 568,944 | ||||||||||||||||||||||||||||||||||||
|
Recoveries
|
(162,702 | ) | (121,896 | ) | - | - | - | (600 | ) | - | - | - | - | - | (285,198 | ) | ||||||||||||||||||||||||||||||||
| (122,875 | ) | (114,488 | ) | 2,350,835 | 527,172 | 58,715 | 15,966 | 18,052 | 3,821 | 2,300 | 4,421,243 | 479,612 | 7,640,353 | |||||||||||||||||||||||||||||||||||
| 5,823,059 | 3,727,626 | 13,753,050 | 3,252,864 | 1,124,487 | 636,175 | 264,355 | 84,574 | 124,329 | 4,421,243 | 3,896,774 | 37,108,536 | |||||||||||||||||||||||||||||||||||||
|
Write-offs
|
- | - | - | (68,189 | ) | - | - | - | (2,535 | ) | - | - | (3,774,840 | ) | (3,845,564 | ) | ||||||||||||||||||||||||||||||||
|
Balance, August 31, 2011
|
5,823,059 | 3,727,626 | 13,753,050 | 3,184,675 | 1,124,487 | 636,175 | 264,355 | 82,039 | 124,329 | 4,421,243 | 121,934 | 33,262,972 | ||||||||||||||||||||||||||||||||||||
|
Exploration expenditures:
|
||||||||||||||||||||||||||||||||||||||||||||||||
|
Camp, field supplies and travel
|
14,565 | - | 116,566 | 34,976 | - | - | - | - | - | 424,035 | - | 590,142 | ||||||||||||||||||||||||||||||||||||
|
Exploration and field overhead
|
1,420 | 1,340 | 47,581 | 71,737 | 2,755 | 3,573 | 6,285 | 12,463 | 7,211 | 1,124,484 | 88,114 | 1,366,963 | ||||||||||||||||||||||||||||||||||||
|
Geological consulting and field wages
|
- | - | - | - | - | - | - | - | - | 664,513 | - | 664,513 | ||||||||||||||||||||||||||||||||||||
|
Geophysical and geochemical
|
- | 30,381 | - | 90,050 | - | - | - | - | - | 569,283 | - | 689,714 | ||||||||||||||||||||||||||||||||||||
|
Property acquisition costs
|
37,070 | - | 3,892 | 13,326 | 17,693 | 17,092 | - | - | - | 108,804 | 13,070 | 210,947 | ||||||||||||||||||||||||||||||||||||
|
Trenching and drilling
|
- | - | 39,636 | 28,527 | - | - | - | - | - | 6,053,665 | - | 6,121,828 | ||||||||||||||||||||||||||||||||||||
|
Recoveries
|
(41,834 | ) | - | - | - | - | - | - | (176 | ) | (2,250 | ) | - | (5,854 | ) | (50,114 | ) | |||||||||||||||||||||||||||||||
| 11,221 | 31,721 | 207,675 | 238,616 | 20,448 | 20,665 | 6,285 | 12,287 | 4,961 | 8,944,784 | 95,330 | 9,593,993 | |||||||||||||||||||||||||||||||||||||
| 5,834,280 | 3,759,347 | 13,960,725 | 3,423,291 | 1,144,935 | 656,840 | 270,640 | 94,326 | 129,290 | 13,366,027 | 217,264 | 42,856,965 | |||||||||||||||||||||||||||||||||||||
|
Write-offs
|
(46,544 | ) | - | - | - | (297,588 | ) | (331,402 | ) | (266,379 | ) | (13,019 | ) | (129,290 | ) | - | (209,747 | ) | (1,293,969 | ) | ||||||||||||||||||||||||||||
|
Balance, August 31, 2012
|
$ | 5,787,736 | $ | 3,759,347 | $ | 13,960,725 | $ | 3,423,291 | $ | 847,347 | $ | 325,438 | $ | 4,261 | $ | 81,307 | $ | - | $ | 13,366,027 | $ | 7,517 | $ | 41,562,996 | ||||||||||||||||||||||||
|
TANZANIAN ROYALTY EXPLORATION CORPORATION
|
5. Mineral Properties (continued)
|
TANZANIAN ROYALTY EXPLORATION CORPORATION
|
|
TANZANIAN ROYALTY EXPLORATION CORPORATION
|
|
USD$
|
|
|
2013
|
19,000
|
|
TANZANIAN ROYALTY EXPLORATION CORPORATION
|
|
TANZANIAN ROYALTY EXPLORATION CORPORATION
|
|
Drilling
equipment
|
Automotive
|
Computer
Equipment
|
Machinery and
equipment
|
Leasehold
improvements
|
Total
|
|||||||||||||||||||
|
Cost
|
||||||||||||||||||||||||
|
As at September 1, 2010
|
$ | 464,487 | $ | 209,434 | $ | 120,597 | $ | 953,426 | $ | 5,596 | $ | 1,753,540 | ||||||||||||
|
Additions
|
- | 101,567 | 37,644 | 678,218 | - | 817,429 | ||||||||||||||||||
|
Disposals
|
- | (8,361 | ) | (349 | ) | (124,295 | ) | (1,127 | ) | (134,132 | ) | |||||||||||||
|
As at August 31, 2011
|
464,487 | 302,640 | 157,892 | 1,507,349 | 4,469 | 2,436,837 | ||||||||||||||||||
|
Additions
|
- | - | 12,372 | 40,582 | 89,329 | 142,283 | ||||||||||||||||||
|
Disposals
|
- | - | (78,619 | ) | (20,778 | ) | (4,469 | ) | (103,866 | ) | ||||||||||||||
|
As at August 31, 2012
|
$ | 464,487 | $ | 302,640 | $ | 91,645 | $ | 1,527,153 | $ | 89,329 | $ | 2,475,254 | ||||||||||||
|
Accumulated depreciation
|
||||||||||||||||||||||||
|
As at September 1, 2010
|
$ | 199,997 | $ | 95,996 | $ | 81,715 | $ | 277,840 | $ | 5,222 | $ | 660,770 | ||||||||||||
|
Depreciation expense
|
17,633 | 37,260 | 24,979 | 382,923 | 374 | 463,169 | ||||||||||||||||||
|
Removed on disposal of asset
|
- | (8,361 | ) | (349 | ) | (124,295 | ) | (1,127 | ) | (134,132 | ) | |||||||||||||
|
As at August 31, 2011
|
217,630 | 124,895 | 106,345 | 536,468 | 4,469 | 989,807 | ||||||||||||||||||
|
Depreciation expense
|
14,509 | 49,606 | 22,646 | 274,977 | 17,866 | 379,604 | ||||||||||||||||||
|
Disposals
|
- | - | (78,620 | ) | (20,778 | ) | (4,469 | ) | (103,867 | ) | ||||||||||||||
|
As at August 31, 2012
|
$ | 232,139 | $ | 174,501 | $ | 50,371 | $ | 790,667 | $ | 17,866 | $ | 1,265,544 | ||||||||||||
|
Net book value
|
||||||||||||||||||||||||
|
As at September 1, 2010
|
$ | 264,490 | $ | 113,438 | $ | 38,882 | $ | 675,586 | $ | 374 | $ | 1,092,770 | ||||||||||||
|
As at August 31, 2011
|
$ | 246,857 | $ | 177,745 | $ | 51,547 | $ | 970,881 | $ | - | $ | 1,447,030 | ||||||||||||
|
As at August 31, 2012
|
$ | 232,348 | $ | 128,139 | $ | 41,274 | $ | 736,486 | $ | 71,463 | $ | 1,209,710 | ||||||||||||
|
TANZANIAN ROYALTY EXPLORATION CORPORATION
|
|
August
|
September
|
October
|
|
|||||||||||||
|
2010
|
2010
|
2010
|
Total
|
|||||||||||||
|
Gross proceeds at inception
|
$ | 1,000,000 | $ | 1,000,000 | $ | 1,060,000 | $ | 3,060,000 | ||||||||
|
Fair value of liability portion
|
965,375 | 965,375 | 1,023,297 | 2,954,047 | ||||||||||||
|
Fair value of equity portion
|
34,625 | 34,625 | 36,703 | 105,953 | ||||||||||||
|
Liability portion of convertible debt:
|
||||||||||||||||
|
Initial fair value of debt component
|
$ | 965,375 | $ | 965,375 | $ | 1,023,297 | $ | 2,954,047 | ||||||||
|
Issuance costs
|
(111,160 | ) | (3,359 | ) | (22,383 | ) | (136,902 | ) | ||||||||
|
Accretion expense
|
101,523 | 82,065 | 90,091 | 273,679 | ||||||||||||
|
Interest paid
|
(36,164 | ) | (30,000 | ) | (31,800 | ) | (97,964 | ) | ||||||||
|
Conversion into common shares
|
(919,574 | ) | - | - | (919,574 | ) | ||||||||||
|
Closing balance of liability portion
|
$ | - | $ | 1,014,081 | $ | 1,059,205 | $ | 2,073,286 | ||||||||
|
Equity portion of convertible debt:
|
||||||||||||||||
|
Opening balance
|
$ | - | $ | - | $ | - | $ | - | ||||||||
|
Initial fair value of equity component
|
34,625 | 34,625 | 36,703 | 105,953 | ||||||||||||
|
Issuance costs
|
(3,987 | ) | (120 | ) | (804 | ) | (4,911 | ) | ||||||||
|
Conversion into common shares
|
(30,638 | ) | - | - | (30,638 | ) | ||||||||||
|
Closing balance of equity portion
|
$ | - | $ | 34,505 | $ | 35,899 | $ | 70,404 | ||||||||
|
May
|
August
|
September
|
October
|
|
||||||||||||||||
|
2010
|
2010
|
2010
|
2010
|
Total
|
||||||||||||||||
|
Gross proceeds at inception
|
$ | 1,000,000 | $ | 1,000,000 | $ | 1,000,000 | $ | 1,060,000 | $ | 4,060,000 | ||||||||||
|
Fair value of liability portion
|
978,997 | 965,375 | 965,375 | 1,023,297 | 3,933,044 | |||||||||||||||
|
Fair value of equity portion
|
21,003 | 34,625 | 34,625 | 36,703 | 126,956 | |||||||||||||||
|
Liability portion of convertible debt:
|
||||||||||||||||||||
|
Opening balance
|
- | - | - | - | - | |||||||||||||||
|
Initial fair value of equity component
|
978,997 | 965,375 | 965,375 | 1,023,297 | 3,933,044 | |||||||||||||||
|
Issuance costs
|
(14,996 | ) | (111,160 | ) | (3,359 | ) | (22,413 | ) | (151,928 | ) | ||||||||||
|
Accretion expense
|
33,137 | 85,534 | 39,369 | 46,022 | 204,062 | |||||||||||||||
|
Interest paid
|
(26,712 | ) | (30,000 | ) | - | - | (56,712 | ) | ||||||||||||
|
Conversion into common shares
|
(970,426 | ) | - | - | - | (970,426 | ) | |||||||||||||
|
Closing balance of liability portion
|
$ | - | $ | 909,749 | $ | 1,001,385 | $ | 1,046,906 | $ | 2,958,039 | ||||||||||
|
Equity portion of convertible debt:
|
||||||||||||||||||||
|
Opening balance
|
$ | - | $ | - | $ | - | $ | - | $ | - | ||||||||||
|
Initial fair value of equity component
|
21,003 | 34,625 | 34,625 | 36,703 | 126,956 | |||||||||||||||
|
Issuance costs
|
(322 | ) | (3,987 | ) | (120 | ) | (804 | ) | (5,233 | ) | ||||||||||
|
Conversion into common shares
|
(20,681 | ) | - | - | - | (20,681 | ) | |||||||||||||
|
Closing balance of equity portion
|
$ | - | $ | 30,638 | $ | 34,505 | $ | 35,899 | $ | 101,042 | ||||||||||
|
TANZANIAN ROYALTY EXPLORATION CORPORATION
|
|
May 2010
|
August 2010
|
Total
|
||||||||||
|
Gross proceeds at inception
|
$ | 1,000,000 | $ | 1,000,000 | $ | 2,000,000 | ||||||
|
Fair value of liability portion
|
978,997 | 965,375 | 1,944,372 | |||||||||
|
Fair value of equity portion
|
21,003 | 34,625 | 55,628 | |||||||||
|
Liability portion of convertible debt:
|
||||||||||||
|
Opening balance
|
- | - | - | |||||||||
|
Initial fair value of debt component
|
978,997 | 965,375 | 1,944,372 | |||||||||
|
Issuance costs
|
(14,996 | ) | (111,160 | ) | (126,156 | ) | ||||||
|
Accretion expense
|
12,540 | 10,470 | 23,010 | |||||||||
|
Interest paid
|
- | - | - | |||||||||
|
Conversion into common shares
|
- | - | - | |||||||||
|
Closing balance of liability portion
|
$ | 976,541 | $ | 864,685 | $ | 1,841,226 | ||||||
|
Equity portion of convertible debt:
|
||||||||||||
|
Opening balance
|
$ | - | $ | - | $ | - | ||||||
|
Initial fair value of equity component
|
21,003 | 34,625 | 55,628 | |||||||||
|
Issuance costs
|
(322 | ) | (3,987 | ) | (4,309 | ) | ||||||
|
Conversion into common shares
|
- | - | - | |||||||||
|
Closing balance of equity portion
|
$ | 20,681 | $ | 30,638 | $ | 51,319 | ||||||
|
TANZANIAN ROYALTY EXPLORATION CORPORATION
|
|
Number
|
Amount ($)
|
|||||||
|
Balance at September 1, 2010
|
91,415,459 | $ | 72,855,310 | |||||
|
Issued for cash:
|
||||||||
|
Issued for private placements, net of share issue costs
|
2,532,119 | 12,912,833 | ||||||
|
Issued for prospectus, net of share issue costs
|
5,263,158 | 21,617,629 | ||||||
|
Issued pursuant to share subscriptions agreement
|
144,430 | 800,000 | ||||||
|
Issued pursuant to Restricted Shares Unit Plan
|
136,408 | 681,339 | ||||||
|
Issued on conversion of convertible debt
|
247,173 | 971,107 | ||||||
|
Issued for non-cash consideration:
|
||||||||
|
Property acquisition
|
20,006 | 97,035 | ||||||
|
Balance at August 31, 2011
|
99,758,753 | 109,935,253 | ||||||
|
Issued on conversion of convertible debt
|
233,318 | 950,213 | ||||||
|
Issued for services
|
35,000 | 115,834 | ||||||
|
Issued pursuant to Restricted Share Unit Plan
|
182,866 | 1,024,793 | ||||||
|
Compensation warrants exercised
|
250,000 | 1,000,000 | ||||||
|
Reserve transferred on exercise of compensation warrants
|
450,765 | |||||||
|
Balance at August 31, 2012
|
100,459,937 | $ | 113,476,858 | |||||
|
TANZANIAN ROYALTY EXPLORATION CORPORATION
|
|
Nov. 5,
|
Nov. 23,
|
Jan. 31,
|
Aug. 12,
|
Aug. 12,
|
||||||||||||||||||||
|
2010
|
2010
|
2011
|
2011
|
2011
|
Total
|
|||||||||||||||||||
|
Compensation
|
||||||||||||||||||||||||
|
warrants
|
||||||||||||||||||||||||
|
Number of warrants
|
200,000 | 212,802 | 172,538 | 5,263,158 | 368,421 | 6,216,919 | ||||||||||||||||||
|
Exercise price ($)
|
7.309 | 7.05 | 6.903 |
USD 6.25
|
USD 5.91
|
|||||||||||||||||||
|
Expected volatility
|
62 | % | 59 | % | 52 | % | 35 | % | 35 | % | ||||||||||||||
|
Risk-free interest rate
|
1.45 | % | 1.64 | % | 1.64 | % | 1.12 | % | 1.12 | % | ||||||||||||||
|
Expected life (days)
|
715 | 715 | 690 | 711 | 711 | |||||||||||||||||||
|
Dividend yield
|
0 | 0 | 0 | 0 | 0 | |||||||||||||||||||
|
Fair value of warrants
|
||||||||||||||||||||||||
|
on grant date
|
$ | 345,900 | $ | 340,979 | $ | 232,314 | $ | 5,396,091 | $ | 434,798 | ||||||||||||||
|
TANZANIAN ROYALTY EXPLORATION CORPORATION
|
|
Year ended
|
August 31, 2012
|
August 31, 2011
|
||||||
|
Balance at beginning of year
|
$ | 5,711,250 | $ | - | ||||
|
Issuance of warrants
|
- | 5,396,091 | ||||||
|
Increase in value of warrant liability
|
2,321,921 | 315,159 | ||||||
|
Transfer of warrants on re-pricing to USD (ii)
|
80,829 | - | ||||||
|
Balance at end of year
|
$ | 8,114,000 | $ | 5,711,250 | ||||
|
TANZANIAN ROYALTY EXPLORATION CORPORATION
|
|
Number of
Warrants |
Exercise price
|
Expiry date
|
||||||||
|
Private placement
|
||||||||||
|
November 5, 2010
|
125,000 | * | $ | US4.00 |
October 20, 2013
|
|||||
|
Private placement
|
||||||||||
|
November 5, 2010
|
75,000 | $ | 7.309 |
October 20, 2012
|
||||||
|
Private placement
|
||||||||||
|
November 23, 2010
|
212,802 | $ | 7.05 |
November 9, 2012
|
||||||
|
Private placement
|
||||||||||
|
January 31, 2011
|
172,538 | $ | 6.903 |
December 22, 2012
|
||||||
|
Equity financing
|
||||||||||
|
August 12, 2011
|
5,263,158 | * |
USD$4.00
|
August 12, 2014
|
||||||
|
Equity financing
|
||||||||||
|
compensation options
|
||||||||||
|
August 12, 2011
|
118,421 |
USD$4.00
|
August 12, 2014
|
|||||||
|
Balance,
|
||||||||||
|
August 31, 2012
|
5,966,919 | - |
-
|
|||||||
|
* warrants classified under Warrant Liability
|
||||||||||
|
TANZANIAN ROYALTY EXPLORATION CORPORATION
|
|
Weighted average
|
||||||||
|
fair value at issue
|
||||||||
|
Number of RSU’s
|
date
|
|||||||
|
Balance, September 1, 2010
|
332,446 | $ | 4.62 | |||||
|
Granted
|
270,048 | $ | 6.34 | |||||
|
Redeemed for common shares
|
(136,408 | ) | $ | 4.99 | ||||
|
Forfeited - unvested
|
(25,154 | ) | $ | 4.69 | ||||
|
Balance, August 31, 2011
|
440,932 | $ | 5.55 | |||||
|
Granted
|
296,926 | $ | 4.83 | |||||
|
Redeemed for common shares
|
(182,866 | ) | $ | 5.60 | ||||
|
Forfeited - unvested
|
(108,745 | ) | $ | 5.39 | ||||
|
Balance, August 31, 2012
|
446,247 | $ | 5.09 | |||||
|
TANZANIAN ROYALTY EXPLORATION CORPORATION
|
|
August 31,
|
August 31,
|
|||||||
|
Year ended
|
2012
|
2011
|
||||||
|
Balance at beginning of year
|
$ | 1,353,990 | $ | - | ||||
|
Warrants issued
|
- | 1,353,990 | ||||||
|
Transfer of warrants to warrant liability
|
(216,188 | ) | - | |||||
|
Modification of warrants
|
183,000 | - | ||||||
|
Transfer on exercise of compensation warrants
|
(450,765 | ) | - | |||||
|
Balance at end of year
|
$ | 870,037 | $ | 1,353,990 | ||||
|
August 31,
|
August 31,
|
|||||||
|
Year ended
|
2012
|
2011
|
||||||
|
Balance at beginning of year
|
$ | 706,988 | $ | 476,205 | ||||
|
Shares issued pursuant to RSU plan
|
(1,024,793 | ) | (681,339 | ) | ||||
|
Issued on conversion of convertible debt
|
(30,638 | ) | (20,681 | ) | ||||
|
Equity conversion value for convertible debt
|
- | 70,404 | ||||||
|
RSU shares forfeited
|
(264,528 | ) | (13,062 | ) | ||||
|
Share based compensation
|
1,283,750 | 875,461 | ||||||
|
Balance at end of year
|
$ | 670,779 | $ | 706,988 | ||||
|
Year ended August 31,
|
Notes
|
2012
|
2011
|
|
Legal services
|
(i)
|
$553,949
|
$797,863
|
|
Director compensation
|
(ii)
|
$365,049
|
$461,484
|
|
Chairman and COO
|
(iii)
|
USD$ 8,800
|
USD$ 9,600
|
|
Technical Committee
|
(iv)
|
$130,160
|
$156,119
|
|
TANZANIAN ROYALTY EXPLORATION CORPORATION
|
|
Year ended August 31,
|
2012
|
2011
|
||||||||||||||
|
Salaries
|
Share
|
Salaries
|
Share
|
|||||||||||||
|
and
|
based
|
and
|
based
|
|||||||||||||
|
benefits (1)
|
payments (3)
|
benefits (1)
|
payments (3)
|
|||||||||||||
|
Management
|
$ | 377,230 | $ | 617,449 | $ | 217,394 | $ | 114,554 | ||||||||
|
Directors
|
75,601 | 289,448 | 20,701 | 440,783 | ||||||||||||
|
Total
|
$ | 452,831 | $ | 906,897 | $ | 238,095 | $ | 555,337 | ||||||||
|
TANZANIAN ROYALTY EXPLORATION CORPORATION
|
|
TANZANIAN ROYALTY EXPLORATION CORPORATION
|
|
TANZANIAN ROYALTY EXPLORATION CORPORATION
|
|
August 31, 2012
|
August 31, 2011
|
September 1, 2010
|
||||||||||
|
Insurance
|
$ | 41,525 | $ | 29,061 | $ | 13,144 | ||||||
|
Listing fees
|
23,806 | 41,921 | 32,749 | |||||||||
|
Other
|
22,345 | 12,873 | 14,469 | |||||||||
|
Total prepaid expenses
|
$ | 87,676 | $ | 83,855 | $ | 60,362 | ||||||
|
August 31, 2012
|
August 31, 2011
|
September 1, 2010
|
||||||||||
|
Receivable from related parties
|
$ | 23,315 | $ | 33,610 | $ | 43,507 | ||||||
|
HST and VAT Receivable
|
38,824 | 118,716 | 18,287 | |||||||||
|
Other
|
9,086 | 4,808 | 17,279 | |||||||||
|
Total Trade and Other Receivables
|
$ | 71,225 | $ | 157,134 | $ | 79,073 | ||||||
|
Below is an aged analysis of the Company’s trade and other receivables:
|
||||||||||||
|
August 31, 2012
|
August 31, 2011
|
September 1, 2010
|
||||||||||
|
Less than 1 month
|
$ | 4,034 | $ | 4,810 | $ | 17,279 | ||||||
|
1 to 3 months
|
64,016 | 126,986 | 61,794 | |||||||||
|
Over 3 months
|
3,175 | 25,338 | - | |||||||||
|
Total Trade and Other Receivables
|
$ | 71,225 | $ | 157,134 | $ | 79,073 | ||||||
|
TANZANIAN ROYALTY EXPLORATION CORPORATION
|
|
August 31, 2012
|
August 31, 2011
|
September 1, 2010
|
||||||||||
|
Less than 1 month
|
$ | 921,893 | $ | 1,235,600 | $ | 310,398 | ||||||
|
1 to 3 months
|
1,378,486 | 741,360 | 204,238 | |||||||||
|
Over 3 months
|
18,014 | 494,239 | 106,159 | |||||||||
|
Total Trade, Other Payables
|
||||||||||||
|
and Accrued Liabilities
|
$ | 2,318,393 | $ | 2,471,199 | $ | 620,795 | ||||||
|
August 31, 2012
|
August 31, 2011
|
September 1, 2010
|
||||||||||
|
Replacement parts for drill
|
$ | 186,296 | $ | 167,639 | $ | 171,897 | ||||||
|
Other
|
62,099 | 55,879 | 57,299 | |||||||||
|
Total Inventory
|
$ | 248,395 | $ | 223,518 | $ | 229,196 | ||||||
|
TANZANIAN ROYALTY EXPLORATION CORPORATION
|
|
2012
|
2011
|
|||||||
|
Combined basic Canadian federal and
|
||||||||
|
provincial statutory income tax rates
|
||||||||
|
including surtaxes
|
25.8 | % | 28.9 | % | ||||
|
Statutory income tax rates applied to
|
||||||||
|
accounting income
|
$ | (2,296,000 | ) | $ | (3,217,000 | ) | ||
|
Increase (decrease) in provision for income
|
||||||||
|
taxes:
|
||||||||
|
Foreign tax rates different from statutory rate
|
121,000 | 357,000 | ||||||
|
Permanent differences and other items
|
585,000 | 655,000 | ||||||
|
Benefit of tax losses not recognized
|
1,590,000 | 2,205,000 | ||||||
|
Provision for income taxes
|
$ | - | $ | - | ||||
|
2012
|
2011
|
|||||||
|
Current income taxes (recovery)
|
$ | - | $ | - | ||||
|
Deferred income taxes (recovery)
|
- | - | ||||||
| $ | - | $ | - | |||||
|
August 31,
|
August 31,
|
September 1,
|
||||||||||
|
2012
|
2011
|
2010
|
||||||||||
|
Non capital losses carried forward
|
$ | 18,000 | $ | - | $ | 5,000 | ||||||
|
Deferred income tax assets
|
$ | 18,000 | $ | - | $ | 5,000 | ||||||
|
Share issuance costs
|
(18,000 | ) | - | (5,000 | ) | |||||||
|
Net deferred income tax assets (liabilities)
|
$ | - | $ | - | $ | - | ||||||
|
TANZANIAN ROYALTY EXPLORATION CORPORATION
|
|
August 31,
|
August 31,
|
September 1,
|
||||||||||
|
2012
|
2011
|
2010
|
||||||||||
|
Non capital losses carried forward
|
$ | 34,526,000 | $ | 29,141,000 | $ | 21,884,000 | ||||||
|
Tangible capital assets
|
271,000 | 260,000 | 252,000 | |||||||||
|
Capital losses carried forward
|
127,000 | 127,000 | 127,000 | |||||||||
|
Share issuance costs
|
- | 78,000 | - | |||||||||
| $ | 34,924,000 | $ | 29,606,000 | $ | 22,263,000 | |||||||
|
2014
|
$ | 914,000 | ||
|
2015
|
997,000 | |||
|
2026
|
1,711,000 | |||
|
2027
|
1,388,000 | |||
|
2028
|
1,333,000 | |||
|
2029
|
1,587,000 | |||
|
2030
|
1,427,000 | |||
|
2031
|
2,378,000 | |||
|
2032
|
2,376,000 | |||
| $ | 14,111,000 |
|
TANZANIAN ROYALTY EXPLORATION CORPORATION
|
|
•
|
that engages in business activities from which it may earn revenues and incur expenses;
|
|
•
|
whose operating results are reviewed regularly by the entity’s chief operating decision maker; and
|
|
•
|
for which discrete financial information is available.
|
|
August 31,
|
August 31,
|
|||||||
|
2012
|
2011
|
|||||||
|
Consolidated net loss
|
||||||||
|
Canada
|
$ | (6,088,262 | ) | $ | (4,162,588 | ) | ||
|
Tanzania
|
(2,809,581 | ) | (6,969,783 | ) | ||||
| $ | (8,897,843 | ) | $ | (11,132,371 | ) | |||
|
Identifiable assets
|
||||||||
|
Canada
|
$ | 20,137,766 | $ | 39,500,639 | ||||
|
Tanzania
|
43,118,764 | 28,131,741 | ||||||
| $ | 63,256,530 | $ | 67,632,380 | |||||