
| Rufus Decker Accounting Branch Chief Office of Beverages, Apparel and Mining United States Securities and Exchange Commission Division of Corporation Finance 100 F Street, N.E. Washington D.C. 20549 - 7010
|
Gold Fields Limited Reg. 1968/004880/06 150 Helen Road, Sandown, Sandton, 2196
Postnet Suite 252 Private Bag X30500 Houghton, 2041 South Africa
Tel +27 11 562-9796 Fax +27 11 562-9825 www.goldfields.com |
September 5, 2017
By Facsimile and EDGAR
Dear Mr. Decker,
| Re: | Gold Fields Limited Form 20-F for the year ended December 31, 2016 Filed on April 5, 2017 File No. 001-31318 |
We refer to your comment letter (the “Comment Letter”) dated August 8, 2017 setting forth the comments of the (“Staff”) of the Division of Corporation Finance of the Securities and Exchange Commission (the “Commission”) on the above referenced Form 20-F (the “2016 Form 20-F”) of Gold Fields Limited (the “Company”). For your convenience, we have set forth below the text of the Staff’s comments, followed in each case by our response.
Form 20-F for Fiscal Year Ended December 31, 2016
Item 5. Operating and Financial Review and Prospects
Management’s Discussion and Analysis of the Financial Statements
All-in Sustaining and All-in Costs, page 161
| 1. | Please discuss how you determine the amounts of corporate general and administrative costs and exploration and study costs (sustaining and non-sustaining) included in all-in sustaining costs and all-in costs. Please also reconcile these amounts with your disclosures in Note 41 of your financial statements. |
Directors: C A Carolus (Chair), N J Holland†** (Chief Executive Officer), P A Schmidt** (Chief Financial Officer), A Andani#, P J Bacchus†, T P Goodlace, C E Letton^, R P Menell, D M J Ncube, S P Reid^, Y G H Suleman
^Australian, †British, #Ghanaian, **Executive Director
Company Secretary: MML Mokoka
Response
The Company acknowledges the Staff’s comment.
Corporate general and administrative costs are not disclosed as a separate caption in Note 41 to the Consolidated Financial Statements or in the in all-in sustaining costs and all-in costs calculations, but are included in ‘operating costs’ for each segment as disclosed in Note 41. As a result, management has not reconciled this amount. These costs are allocated to each mine or segment by means of a management fee charge. The allocation is determined based on time sheets completed by all Corporate office staff.
The exploration expense disclosed in the Consolidated Income Statements includes a cash portion (exploration activities at Greenfields exploration projects) and a non-cash portion relating to the write-off of exploration assets previously capitalised at the Australian operations in terms of the requirements of IFRS 6 – Exploration for and Evaluation of Mineral Resources. As the all-in sustaining costs and all-in costs calculations follow the cash expenditure, the exploration and study costs (sustaining and non-sustaining) included in all-in sustaining costs and all-in costs exclude the Australian exploration non-cash write-offs. The Australian exploration expenditure is capitalised to property, plant and equipment as incurred and included in the all-in sustaining and all-in costs as part of capital expenditure. As disclosed in Note 13, the write-off of exploration assets is due to specific exploration programmes not yielding results to warrant further exploration at the Group’s Australian operations and is included in the “Exploration expense” in the Consolidated Income Statements. Outlined below is a reconciliation of the amount included as Exploration expense in the all-in sustaining costs and all-in costs calculation:
| Reconciliation |
Amount |
Rational | ||||
| Exploration expense |
92.2 | Total expense per the Consolidated Income Statements. | ||||
| Less: Australian exploration costs previously capitalised written-off |
(47.4 | ) | Included in the all-in sustaining costs and all-in costs calculations when incurred as part of capital expenditure. Refer Note 13 of the Consolidated Financial Statements. | |||
| Add: Equity accounted earnings |
2.3 | Relates to entities (Far South East Project) in which the expenditure incurred relates to exploration. | ||||
|
|
|
|||||
| Total exploration, feasibility and evaluation costs |
47.1 | AISC and AIC table on page 162 of Form 20-F | ||||
|
|
|
|||||
Generally, exploration costs are only included as part of the all-in cost calculation as they relate to growth projects which are not currently in the operational phase. The exception to this is the Australian exploration costs, these are included as part of the all-in sustaining costs and all-in costs calculations as these exploration costs are part of a continuous programme to replace the Reserve depletion at the Australian operations to sustain the life of the operations at current levels.
In order to provide better clarity to the exploration expenditure included in the all-in sustaining costs and all-in costs calculations, the Company proposes to amend future disclosure in footnote 4 on page 162 of Form 20F to: “Includes exploration, feasibility and evaluation costs, excluding Australian exploration costs of USD 47.4 million (as these are included as part of sustaining capital expenditure) and share of equity accounted losses relating to exploration expenses incurred by Far Southeast Gold Resources Incorporated.”
*****
Item 18. Financial Statements
Consolidated Income Statements, page F-23
Note 41. Segment Report, page F-82
| 2. | You present two similarly-titled measures in your financial statements: operating profit and net operating profit. Please revise the titles used for these measures to distinguish between the two measures and better reflect what they represent. |
| 3. | Net operating profit excludes items such as share-based payments, long-term incentive plan, exploration expense, restructuring costs, asset impairments, social contributions/ sponsorships, rehabilitation income/(charges) and royalties. Operating profit excludes amortization and depreciation in addition to the items excluded from net operating profit. Please tell us how you determined the amounts disclosed for operating profit, net operating profit and operating costs are representative of all activities that would normally be regarded as operating. Refer to paragraph BC56 of IAS 1. |
Response
The Company acknowledges the Staff’s comment.
The Company will revise future filings by removing the titles used in the Consolidated Income Statements and related notes in order to follow the ‘nature of expense’ method outlined in paragraph 102 of International Accounting Standard 1 – Presentation of Financial Statements (‘IAS 1’). In the Consolidated Income Statements, the ‘net operating profit’ title will be removed. In the notes to the Consolidated Financial Statements (primarily Notes 3 and 41), the ‘operating costs’ title will be revised to ‘costs of sales before gold inventory change and amortisation and depreciation’ and the ‘operating costs including gold inventory change’ title will be revised to ‘costs of sales before amortisation and depreciation’. Refer to Addendum I for an example of the revised future disclosure.
All disclosures made elsewhere in the Form 20-F will be updated to make reference to the revised titles in Note 41 of the Consolidated Financial Statements.
The Company believes that the proposed changes to the future filings discussed under staff comment number 2 above, will address the matters raised in staff comment number 3. Therefore, the Company respectfully did not provide a separate response to comment number 3.
*****
Note 4.6 Amortisation and Depreciation of Mining Assets, page F-13
| 4. | Please disclose the type(s) of Resources (measured, indicated and/or inferred) included in your amortisation and depreciation base. In addition, disclose the nature of the judgments and estimates made by management in determining the useful lives and amortisation and depreciation of your mining assets providing details sufficient to understand the underlying assumptions used and other uncertainties related to the application and determination of your accounting policy. Please also disclose your history of converting Resources into Reserves. |
Response
The Company acknowledges the Staff’s comment. The Company refers to the correspondence filed on EDGAR on 5 September 2017.
As disclosed in Accounting policy 4.6, Amortisation and depreciation of mining assets, to the financial statements, “mining assets, including mine development and infrastructure costs, mine plant facilities and evaluation costs, are amortised over the life of the mine using the units-of-production method, based on estimated proved and probable ore reserves”.
Only “where it is anticipated that the mine life will significantly exceed the proved and probable reserves, the mine life is estimated using a methodology that takes account of current exploration information to assess the likely recoverable gold from a particular area. Such estimates are adjusted for the level of confidence in the assessment and the probability of conversion to reserves. The probability of conversion is based on historical experience of similar mining and geological conditions.”
The above policy is in line with IAS 16 – Property, Plant and Equipment, paragraph 57, which states that the useful life of an asset is defined in terms of the asset’s expected utility to the entity. The estimation of the useful life of the asset is a matter of judgement based on the technical knowledge and track record of the entity and experience gained from similar assets.
The net book value of property, plant and equipment of the Group at 31 December 2016, disclosed in Note 13 to the Consolidated Financial Statements, on page F-44 of Form 20-F, comprise the following:
All amounts in USD’million
| Australian operations |
Other | Group | ||||||||||
| Total property, plant and equipment |
768.6 | 3 779.2 | 4 547.8 | |||||||||
|
|
|
|
|
|
|
|||||||
Only USD179.8 million of assets out of a total carrying value of property, plant and equipment of USD4 547.8 million for the Group and USD768.8 million for the Australian operations, respectively, are amortised over a mine life that exceeds proved and probable reserves. For these assets, management has determined that proved and probable reserves alone may not provide a realistic indication of the useful life of the related assets.
Gold Fields’ Australian mines are deemed highly prospective due to the orogenic style of gold mineralisation that characterises these properties. Orogenic orebodies tend to occur in clusters at varying scales and their geological characteristics, size, grade and geometry typically support ongoing discovery and conversion to Reserves over multi-decade periods. Orogenic orebodies can have significant vertical and horizontal dimensions and “grow volumetrically” with time as extensional exploration and development advance. The importance of exploration momentum and ongoing funding in the more prospective areas of the mine properties is essential to realise annual discovery that supplies the pipeline of projects to replenish production depletion and grow the Reserve base.
Orogenic style orebodies, by their nature, characteristically support operations that report relatively short Proved and Probable Reserve (life of mine) profiles at any selected point in time, generally showing three to seven years. Importantly, depending on the life cycle stage, orogenic assets generally have a track record of replenishing Reserves through cyclical discovery (exploration converting pre-resource or endowment to Resource) and Resource to Reserve conversion, thereby extending life in response to the assets ‘geological endowment’. Gold Fields’ multi-year phased investment in exploration is aimed at realising each mine’s geological endowment potential plus finding and defining high quality orebodies that will support the new generation of pits and underground mines.
Outlined below is the recent exploration expenditure at the Australian operations:
All amounts in USD’million
| Operation |
2017 Plan |
2016 Actual |
2015 Actual |
2014 Actual |
||||||||||||
| St Ives |
25.7 | 30.5 | 31.9 | 22.4 | ||||||||||||
| Agnew |
17.4 | 21.2 | 15.6 | 13.6 | ||||||||||||
| Granny Smith |
18.8 | 16.5 | 13.5 | 11.7 | ||||||||||||
| Darlot |
3.0 | 8.2 | 7.2 | 6.8 | ||||||||||||
|
|
|
|
|
|
|
|
|
|||||||||
| Total |
64.9 | 76.4 | 68.2 | 54.5 | ||||||||||||
|
|
|
|
|
|
|
|
|
|||||||||
Equivalent spend in Australian dollars on exploration is as follows:
All amounts in AUD’million
| 2017 Plan |
2016 Actual |
2015 Actual |
2014 Actual |
|||||||||||||
| Total Australian operations |
88.9 | 102.5 | 90.7 | 60.3 | ||||||||||||
|
|
|
|
|
|
|
|
|
|||||||||
Dedicated exploration teams utilise a fully integrated and multi-method approach to target generation, prospectivity mapping and exploration stage gating, with the objective of maintaining a healthy pipeline of projects capable of delivering new Resources and Reserves to sustain the mines.
It would be technically extremely challenging and financially very onerous to attempt to define the full extent of all orebodies present on the lease area within a short space of time. Rather than drilling out a full orebody upfront, which can happen with other orebody styles, sufficient drilling is undertaken to establish an initial economic target to support a preliminary mine plan. An ongoing drilling programme is then commissioned, utilising optimal drill site locations from advancing development in the underground or the stages within an open-pit, to extend the Reserve footprint concurrently with mining. This process of incremental Resource extension and conversion campaign drilling can continue for significant periods, with new Reserves being defined and reported annually to replace production depletion and sustain the life of mine (LoM).
The Australian operating mines also cover very large areas of highly prospective ground. For example, St Ives covers a lease area of over 120,000 hectares. Concurrently with the continued drill out of known deposits, exploration continues across the remainder of the lease area. This exploration continues to identify new ore bodies which over time will become the new mines.
In the table below is a roll forward of the mineral rights of USD179.8 million at 31 December 2016 at the Australian operations, as accounted for in the IFRS financial statements filed as part of the 2016 Form 20F:
Depreciation and amortisation table using Proved and Probable Reserves and a portion of ounces beyond Proved and Probable Reserves (Inferred resources and endowment):
All amounts in USD’million
| St Ives | Agnew | Granny Smith |
Total1 | |||||||||||||
| Opening balance – 01/01/2014 |
228.3 | 56.3 | 5.0 | 289.6 | ||||||||||||
| Depreciation – FY 14 |
(12.4 | ) | (7.4 | ) | (0.8 | ) | (20.6 | ) | ||||||||
| Translation – FY14 |
(19.3 | ) | (4.3 | ) | (0.4 | ) | (24.0 | ) | ||||||||
|
|
|
|
|
|
|
|
|
|||||||||
| Closing balance – 31/12/2014 |
196.6 | 44.6 | 3.8 | 245.0 | ||||||||||||
| Depreciation – FY 15 |
(11.9 | ) | (5.9 | ) | (0.5 | ) | (18.3 | ) | ||||||||
| Translation – FY 15 |
(20.6 | ) | (4.5 | ) | (0.4 | ) | (25.5 | ) | ||||||||
|
|
|
|
|
|
|
|
|
|||||||||
| Closing balance – 31/12/2015 |
164.1 | 34.2 | 2.9 | 201.2 | ||||||||||||
| Depreciation – FY 16 |
(15.1 | ) | (5.4 | ) | (0.4 | ) | (20.9 | ) | ||||||||
| Translation – FY 16 |
(0.5 | ) | — | — | (0.5 | ) | ||||||||||
|
|
|
|
|
|
|
|
|
|||||||||
| Closing balance – 31/12/2016 |
148.5 | 28.8 | 2.5 | 179.8 | ||||||||||||
|
|
|
|
|
|
|
|
|
|||||||||
The mineral rights were capitalised at cost on acquisition based on the purchase price allocation performed at the time of acquisition, plus any subsequent acquisitions. At the time the investment decision was made, significant value was attributed to ounces beyond Proved and Probable Reserves, albeit at incrementally lower confidence levels, due to the nature of the Western Australian ore bodies and this value was capitalised as part of the above assets. The company would not have invested in the assets on a valuation that included Proved and Probable Reserves only, as this inherently undervalues the assets.
In addition, the use of only Proved and Probable Reserves to depreciate the assets would also result in a significant acceleration of depreciation expense.
If reserves only were used in the depreciation and amortisation calculation of mineral rights at the Australian operations, for illustrative purposes, the mineral rights balances would have been as follows:
Depreciation and amortisation table using Proved and Probable Reserves only:
All amounts in USD’million
| St Ives | Agnew | Granny Smith |
Total1 | |||||||||||||
| Opening balance – 01/01/2014 |
146.8 | 44.6 | 4.7 | 196.1 | ||||||||||||
| Depreciation – FY 14 |
(30.4 | ) | (13.1 | ) | (2.0 | ) | (45.5 | ) | ||||||||
| Translation – FY 14 |
(10.1 | ) | (2.7 | ) | (0.2 | ) | (13.0 | ) | ||||||||
|
|
|
|
|
|
|
|
|
|||||||||
| Closing balance – 31/12/2014 |
106.3 | 28.8 | 2.5 | 137.6 | ||||||||||||
| Depreciation – FY 15 |
(20.2 | ) | (7.7 | ) | (0.8 | ) | (28.7 | ) | ||||||||
| Translation – FY 15 |
(10.6 | ) | (2.8 | ) | (0.2 | ) | (13.6 | ) | ||||||||
|
|
|
|
|
|
|
|
|
|||||||||
| Closing balance – 31/12/2015 |
75.5 | 18.3 | 1.5 | 95.3 | ||||||||||||
| Depreciation – FY 16 |
(21.4 | ) | (6.9 | ) | (0.4 | ) | (28.7 | ) | ||||||||
| Translation – FY 16 |
0.2 | — | — | 0.2 | ||||||||||||
|
|
|
|
|
|
|
|
|
|||||||||
| Closing balance – 31/12/2016 |
54.3 | 11.4 | 1.1 | 66.8 | ||||||||||||
|
|
|
|
|
|
|
|
|
|||||||||
From the above tables, it is clear that the difference in useful lives, between using a denominator of reserves only and a denominator including ounces beyond reserves (endowment), to depreciate the mineral rights at the Australian operations is not significant to the depreciation charge for the Group of USD679.2 million in the 2016 financial year (2015: USD609.9 million and 2014: USD656.7 million). The differences are outlined in the table below:
Amortisation and depreciation:
All amounts in USD’million
| Financial year |
Current policy2 |
Reserves only | Difference | Total Group | Percentage Difference |
|||||||||||||||
| 2016 |
20.9 | 28.7 | 7.8 | 679.2 | 1.1 | % | ||||||||||||||
| 2015 |
18.3 | 28.7 | 10.4 | 609.9 | 1.7 | % | ||||||||||||||
| 2014 |
20.6 | 45.5 | 24.9 | 656.7 | 3.8 | % | ||||||||||||||
Property, plant and equipment, net book value:
All amounts in USD’million
| Financial year |
Current policy2 |
Reserves only | Difference | Total Group | Percentage Difference |
|||||||||||||||
| 2016 |
179.8 | 66.8 | 113.0 | 4 547.8 | 2.5 | % | ||||||||||||||
| 2015 |
201.2 | 95.3 | 105.9 | 4 312.4 | 2.5 | % | ||||||||||||||
In this orogenic geological context and with supporting history, it is commonly known that at Western Australian gold mines, reportable Reserves traditionally and significantly understate the gold that can potentially be recovered from the properties either through conversion of Resources to Reserves or from the discovery of new ore-bodies on the existing lease area. As a result of the above, the following ounces were taken into consideration in order to determine a value for the asset when the investment decision was made:
| • | Proved and Probable Reserves3 |
| • | Inferred Resources |
| • | Pre-Resource ounces (endowment), defined as ‘order of magnitude’ ounces that were profiled as representative of potential future discovery and value |
| 1 | No value was attributed to mineral rights at Darlot when performing the purchase price allocation at acquisition, as it was determined that there was no value beyond Proved and Probable reserves at Darlot. |
| 2 | Includes Reserves and a portion of Inferred Resources and endowment. |
| 3 | Measured and indicated resources not part of Proved and Probable Reserves are excluded due to price adjustments and other modifying factors. |
Where it is anticipated that the mine life will significantly exceed the Proved and Probable Reserves, the extended mine life (‘useful life’) is estimated annually using a methodology that takes account of historical and current exploration information, ongoing exploration funding and activity and the geological potential for discovery in prospective areas, in order to assess the likely future recoverable gold from a particular ore body or property. Such estimates are adjusted to reflect the level of confidence in the assessment and the probability of conversion to Reserves. The probability of conversion is based on historical experience and trends demonstrated from similar geological and mining conditions.
For the 2016 financial year, the depreciation and amortisation calculation of the mineral rights of USD179.8 million at the Australian operations is calculated as follows:
All amounts in USD’million unless otherwise stated
| LoM ounces (000’s) |
Ounces mined (000’s) |
Depreciation rate |
Carrying value opening balance (USDm)4 |
Depreciation charge (USDm) |
||||||||||||||||
| St Ives |
4 502 | 404 | 9.0 | % | 164.1 | 15.1 | ||||||||||||||
| Agnew |
1 587 | 245 | 15.4 | % | 34.2 | 5.4 | ||||||||||||||
| Granny Smith |
2 134 | 323 | 15.1 | % | 2.9 | 0.4 | ||||||||||||||
|
|
|
|
|
|||||||||||||||||
| Total |
201.2 | 20.9 | ||||||||||||||||||
|
|
|
|
|
|||||||||||||||||
The amounts included in the depreciation and amortisation calculation at 31 December 2016 (the 2016 financial year depreciation charge is based on the LoM ounces at 31 December 2015 (as the latest available information at the time of calculation) are determined as follows:
St Ives:
| All ounces in 000’s |
Total Inventory | Factor | LoM Ounces | |||||||||
| Reserves |
1 542 | 100 | % | 1 542 | ||||||||
| Less ore stocks5 |
(81 | ) | 100 | % | (81 | ) | ||||||
| Inferred Resources and endowment |
144 320 | 2.1 | % | 3 041 | ||||||||
|
|
|
|||||||||||
| Total LoM ounces used for depreciation and amortisation calculation |
|
4 502 | ||||||||||
|
|
|
|||||||||||
Agnew:
| All ounces in 000’s |
Total Inventory | Factor | LoM Ounces | |||||||||
| Reserves |
670 | 100 | % | 670 | ||||||||
| Less ore stocks5 |
(5 | ) | 100 | % | (5 | ) | ||||||
| Inferred Resources and endowment |
84 841 | 1.1 | % | 922 | ||||||||
|
|
|
|||||||||||
| Total LoM ounces used for depreciation and amortisation calculation |
|
1 587 | ||||||||||
|
|
|
|||||||||||
Granny Smith:
| All ounces in 000’s |
Total Inventory | Factor | LoM Ounces | |||||||||
| Reserves |
1 310 | 100 | % | 1 310 | ||||||||
| Less ore stocks5 |
(4 | ) | 100 | % | (4 | ) | ||||||
| Inferred Resources and endowment |
8 103 | 10.2 | % | 828 | ||||||||
|
|
|
|||||||||||
| Total LoM ounces used for depreciation and amortisation calculation |
|
2 134 | ||||||||||
|
|
|
|||||||||||
| 4 | The Group does not include any future costs in its depreciation and amortisation calculation. |
| 5 | Ore stocks are excluded from the depreciation denominator as they have already been mined but not yet processed and the numerator used in the depreciation calculation is ounces mined. |
When estimating the useful life of an asset, a key element of the judgements made by management is the track record of the company in relation to the accuracy of historic estimates. As a result, management has performed an assessment of the historic conversion of the total ounces used in the depreciation and amortisation calculation from acquisition at the Australian operations. Outlined in the tables below is the total conversion of Inferred resources and endowment into reserves. The Inferred resources and endowment ounces, included in the tables below, have been factorised by applying the different milestone definitions and their applicable conversion percentages (Refer to page 9 of this letter for detail around the milestones). For an example of how the factorisation is performed, refer to the above tables outlining the ounces included in the depreciation and amortisation calculations for 2016.
St Ives:
All amounts in’000 ounces
| OB - 2002 | Conversion to/(from) |
Discovery | Depletion6 | CB - 2016 | ||||||||||||||||
| Reserves excl stock piles |
1 938 | 7 193 | — | (7 498 | ) | 1 633 | ||||||||||||||
| Inferred resources and endowment |
3 932 | (7 193 | ) | 5 728 | — | 2 467 | ||||||||||||||
|
|
|
|
|
|
|
|
|
|
|
|||||||||||
| Total |
5 870 | — | 5 728 | (7 498 | ) | 4 100 | ||||||||||||||
|
|
|
|
|
|
|
|
|
|
|
|||||||||||
The above table demonstrates a strong historic trend of successful conversion of Inferred resources and endowment ounces into reserves. The tables below demonstrate a number of conversion factors:
| Opening reserves conversion |
‘000 ounces | |||
| Ounces mined over and above opening reserves |
5 560 (7 498 – 1 938 | ) | ||
| Opening Inferred resources and endowment |
3 932 | |||
| Percentage |
141 | % | ||
| Total reserves conversion |
‘000 ounces | |||
| Ounces mined over and above opening reserves plus additions to reserves |
7 193 (5 560 + 1 633 | ) | ||
| Opening Inferred resources and endowment |
3 932 | |||
| Percentage |
183 | % | ||
The above tables clearly indicate that the Company has been successful in replacing the reserves at the St Ives operation through exploration and conversion performed over the lease area.
Agnew:
All amounts in’000 ounces
| OB - 2002 | Lawlers addition7 |
Conversion | Discovery | Depletion6 | CB - 2016 | |||||||||||||||||||
| Reserves excl stock piles |
551 | 311 | 2 837 | — | (3193 | ) | 506 | |||||||||||||||||
| Inferred resources and Endowment |
718 | 567 | (2 837 | ) | 2 617 | — | 1 065 | |||||||||||||||||
|
|
|
|
|
|
|
|
|
|
|
|
|
|||||||||||||
| Total |
1 269 | 878 | — | 2 617 | (3 193 | ) | 1 571 | |||||||||||||||||
|
|
|
|
|
|
|
|
|
|
|
|
|
|||||||||||||
| 6 | Depletion of reserves relates to ounces mined not processed for the purposes of the depreciation and amortisation calculation. |
| 7 | The Lawlers mine was acquired in 2013 and has been included as part of the Agnew operations since. |
The above table demonstrates a strong historic trend of successful conversion of Inferred resources and endowment ounces into reserves. The tables below demonstrate a number of conversion factors:
| Opening reserves conversion |
‘000 ounces | |||
| Ounces mined over and above opening reserves |
2 331 (3 193 – 551 – 311 | ) | ||
| Opening Inferred resources and endowment |
1 285 (718 + 567 | ) | ||
| Percentage |
181 | % | ||
| Total reserves conversion |
‘000 ounces | |||
| Ounces mined over and above opening reserves plus additions to reserves |
2 837 (2 331 + 506 | ) | ||
| Opening Inferred resources and endowment |
1 285 (718 + 567 | ) | ||
| Percentage |
221 | % | ||
The above tables clearly indicate that the Company has been successful in replacing the reserves at the Agnew operation through exploration and conversion performed over the lease area.
Granny Smith:
All amounts in’000 ounces
| OB - 20138 | Conversion | Discovery | Depletion6 | CB - 2016 | ||||||||||||||||
| Reserves excl stock piles |
902 | 1 826 | — | (1 054 | ) | 1 674 | ||||||||||||||
| Inferred resources and Endowment |
1 280 | (1 826 | ) | 1 887 | — | 1 341 | ||||||||||||||
|
|
|
|
|
|
|
|
|
|
|
|||||||||||
| Total |
2 182 | — | 1 887 | (1 054 | ) | 3 015 | ||||||||||||||
|
|
|
|
|
|
|
|
|
|
|
|||||||||||
The above table demonstrates a strong historic trend of successful conversion of Inferred resources and endowment ounces into reserves. The tables below demonstrate a number of conversion factors:
| Opening reserves conversion |
‘000 ounces | |||
| Ounces mined over and above opening reserves |
152 (1 054 – 902 | ) | ||
| Opening Inferred resources and endowment |
1 280 | |||
| Percentage |
12 | % | ||
| Total reserves conversion |
‘000 ounces | |||
| Ounces mined over and above opening reserves plus additions to reserves |
1 826 (152 + 1 674 | ) | ||
| Opening Inferred resources and endowment |
1 280 | |||
| Percentage |
143 | % | ||
The above tables clearly indicate that the Company has been successful in replacing the reserves at the Granny Smith operation through exploration and conversion performed over the lease area.
Reserves
Reserves are determined in accordance with the South African Code for the reporting of Exploration Results, Mineral Resources and Mineral Reserves (“SAMREC”) code, 2016 edition. Detail on Reserves is disclosed in Item 4, Reserves of Gold Fields as at December 31, 2016, on page 46 of the Form 20-F and is compliant with SEC Industry Guide 7.
Resources
Resources are determined in accordance with the South African Code for the reporting of Exploration Results, Mineral Resources and Mineral Reserves (“SAMREC”), 2016 edition. As regulated, Resources are not disclosed in the 20-F so a brief description of how they are determined is warranted to provide context for their inclusion in the amortisation model.
| 8 | Granny Smith mine was acquired in 2013. |
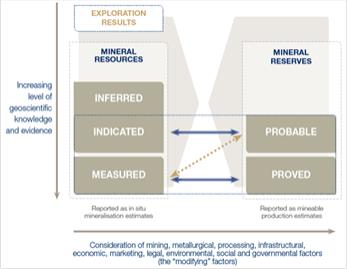
As per the SAMREC definition, a Resource is a concentration of solid material of economic interest in the Earth’s crust in such form that the grade or quality and quantity show reasonable prospects for eventual economic extraction. The location, quantity, grade, continuity and other geological characteristics of the Resource are known, estimated or interpreted from specific geological evidence and knowledge, including sampling. Importantly, Resources are subdivided in order of increasing confidence in respect of geoscientific evidence, into Inferred, Indicated or Measured categories.
| Measured Resources may convert to either Proved Reserves or Probable Reserves depending on the modifying factors and Indicated Resources may convert to Probable Reserves.
Inferred Resources cannot convert to Reserves, without further drilling being performed, due to their lower level of geoscientific knowledge and confidence. This relationship is shown in the schematic inset above and the Exploration results component reflects the information incorporated in the profiling of the pre-Resource ounces. |
|
Pre-Resource ounces (endowment)
The determination of the pre-Resource ‘endowment’ ounces incorporated in the amortisation and depreciation of the assets in Australia is an important component to profiling the ‘useful life’ of the assets and is based on the following methodology:
| 1. | The exploration database per asset is routinely updated to reflect the ounces categorised per exploration milestone |
| 2. | Six milestones are used to define the exploration stage gates as listed below: |
| • | Milestone 1: tenement acquired and prospectivity confirmed |
| • | Milestone 2: anomaly defined and potential confirmed |
| • | Milestone 3: anomaly tested and mineralised system indicated9 |
| • | Milestone 4: Inferred Resource defined |
| • | Milestone 5: Indicated Resource delineated (can be converted to Probable Reserve) |
| • | Milestone 6: Measured Resource delineated (can be converted to Proved Reserve) |
| 3. | The principle is to generally only include the contributing ounces beyond the Proved and Probable Reserve and Inferred Resource categories that meet Milestone 3 or better. Milestone 3 endowment ounces are supported by a physically tested anomaly and therefore supported by tangible early stage exploration data. |
| 4. | Further to the milestone threshold, the following are also considered in determining the pre-resource ounces to be included in the amortisation and depreciation models; project ranking, risk rating and potential economic viability |
| 5. | Using appropriate metal prices and consideration of the mining and processing capacities, mining and processing costs, together with capital requirements and rehabilitation costs, ounces are profiled that are considered to be potentially viable and economically recoverable |
| 9 | Based on a drill hole result and assayed sample. |
| 6. | A key enabler to realising the pre-resource ounces is the commitment to future multi-year exploration funding and activity, which is considered a core component of the Gold Fields Australia business model and exploration funding in the order of A$80-90m per annum is currently allocated to the Region’s exploration budget |
| 7. | Pre-resource ounces are subject to risk and uncertainties and it is reasonable that changes could occur which may affect the figures over time. These uncertainties are taken into consideration when estimating the endowment used in the depreciation and amortisation calculation |
Relevant characteristics of the Australian assets that mine ‘orogenic’ style orebodies include:
| • | Orogenic ore bodies are characteristically structurally controlled and usually take the form of veins or ‘shoots’ of mineralisation that ‘pinch and swell’ within predictable mineralisation corridors. Typically, these ore bodies require relatively intense drilling to define and profile at confidence levels suitable for mine planning and Mineral Reserve reporting. As a consequence, their full extent cannot be defined ‘upfront’ and scheduled exploration and Resource definition drilling programmes will normally grow and upgrade the Resource and Reserve base over the full life of the operation. |
| • | Typical ~3-7 year LoM plans that have the inherent capability to replace Reserve depletion and extend longevity well beyond this timeframe through ongoing discovery and conversion. |
| • | Companies tend to only drill-out enough Reserves to provide ~3-7 years of future production, typically in line with infrastructure, geotechnical and budgetary constraints. |
| • | Having a well-stocked project pipeline with projects spanning the various milestone stage gates and supported with multi-year exploration funding. |
| • | Although known Reserves characteristically do not extend beyond several years on any particular deposit, the nature of orogenic systems characteristically provide long lived, sustainable gold operations. |
| • | The long term business plans and strategic plans in Australia reflect extended lives beyond the Proved and Probable Reserves constraint based on reasonable assumptions around prospectivity, discovery, Resource definition, conversion to Reserves and production trends. |
In summary, if the Australian operations, which are characterised by orogenic style orebodies, were restricted to their ‘useful lives’ or ‘full site potential’ being assessed on Proved and Probable Reserves only, for the purposes of depreciation and amortisation, the model would provide a misleading perspective regarding life of asset sustainability and longevity. Notwithstanding that certain elements have to be in place, such as multi year exploration funding, discovery success, a substantive project pipeline, commodity prices and effective resource to reserve conversion, the Gold Fields Australian assets have historically demonstrated their capacity to replenish depleted ounces and maintain resources and reserves at commercially viable levels over periods exceeding 15 years.
Given the elevated exploration funding in Australia, the life cycle stage of the assets and the ongoing exploration potential offered by the tenements, the discovery and realisation of further pre-resource ‘endowment’ ounces can be reasonably anticipated to extend the life of mines materially beyond current Proved and Probable reserves. The lower confidence levels associated with the ounces assigned to Inferred resources and pre-resources are recognised and this uncertainty is appropriately factored into a risk adjusted model. This approach uses assumptions based on relevant knowledge and expertise to provide a practical and useful indication of the full and useful life of the assets and presents a meaningful approach to calculating depreciation on these type of operations.
Conclusion
Management believes, based on its technical knowledge and the track record of the Australian operations, it is appropriate to use a depreciation and amortisation useful life for mining rights at the Australian operations that exceeds Proved and Probable Reserves due to the following reasons:
| • | Gold Fields has a track record of proving additional reserves from resources every year; |
| • | There is evidence to indicate that it is probable that additional resources will be proved from endowment in the future; |
| • | Management has demonstrated an intention to continue exploration at the Australian operations in order to prove additional reserves in the future; and |
| • | Management has demonstrated an intention to continue mining activity at the Australian operations beyond the current Proved and Probable Reserves. |
Based on history and the above, management has concluded that its best estimate of the useful life of the mineral rights at the Australian operations is Proved and Probable reserves and a realistic portion of resource and endowment ounces.
As the mineral rights depreciated using ounces beyond Proved and Probable reserves are not material, the Company does not consider it necessary to disclose the judgements made as a significant judgement in the Consolidated Financial Statements.
*****
Supplemental Information
Pursuant to a request from the Staff, Gold Fields hereby acknowledges (i) it is responsible for the adequacy and accuracy of the disclosure in the filing, (ii) Staff comments or changes to disclosure in response to Staff comments do not foreclose the Commission from taking any action with respect to the filing and (iii) it may not assert Staff comments as a defence in any proceeding initiated by the Commission or any person under the federal securities laws of the United States.
*****
Should you or the Staff have any questions or require any additional information, please contact the undersigned at +27 11 562 9796 or via e-mail at pauls@goldfields.com.
| Sincerely |
| /s/ Paul Schmidt |
| Paul Schmidt |
| Chief Financial Officer |
| Gold Fields Limited |
| cc: | Blaise Rhodes, Securities and Exchange Commission |
Nicholas Holland, Gold Fields Limited
Taryn Harmse, Gold Fields Limited
Thomas B. Shropshire, Jr., Linklaters LLP
Addendum I
Consolidated income statement
for the year ended 31 December
Figures in millions unless otherwise stated
| UNITED STATES DOLLAR | ||||||||||||||||
| Notes | 2016 | 2015 | 2014 | |||||||||||||
| Revenue |
1 | 2,749.5 | 2,545.4 | 2,868.8 | ||||||||||||
| Cost of sales |
2 | (2,066.7 | ) | (2,066.1 | ) | (2,334.4 | ) | |||||||||
| Investment income |
3 | 8.3 | 6.3 | 4.2 | ||||||||||||
| Finance expense |
4 | (78.3 | ) | (82.9 | ) | (99.2 | ) | |||||||||
| Gain/(loss) on financial instruments |
14.4 | (4.7 | ) | (11.5 | ) | |||||||||||
| Foreign exchange (loss)/gain |
(6.4 | ) | 9.5 | 8.4 | ||||||||||||
| Other costs, net |
(16.8 | ) | (21.2 | ) | (62.5 | ) | ||||||||||
| Share-based payments |
5 | (14.4 | ) | (10.9 | ) | (26.0 | ) | |||||||||
| Long-term incentive plan |
26 | (11.0 | ) | (5.3 | ) | (8.7 | ) | |||||||||
| Exploration expense |
(92.2 | ) | (53.5 | ) | (47.2 | ) | ||||||||||
| Share of results of equity accounted investees after taxation |
15 | (2.3 | ) | (5.7 | ) | (2.4 | ) | |||||||||
| Restructuring costs |
(11.7 | ) | (9.3 | ) | (42.0 | ) | ||||||||||
| Impairment of investments and assets |
6 | (76.5 | ) | (221.1 | ) | (26.7 | ) | |||||||||
| Profit on disposal of investments |
2.3 | 0.1 | 0.5 | |||||||||||||
| Profit on disposal of Chucapaca |
32 | — | — | 4.6 | ||||||||||||
| Profit/(loss) on disposal of assets |
15.1 | (b) | 48.0 | (0.1 | ) | (1.3 | ) | |||||||||
|
|
|
|
|
|
|
|||||||||||
| Profit before royalties and taxation |
7 | 446.2 | 80.5 | 224.6 | ||||||||||||
| Royalties |
8 | (80.4 | ) | (76.0 | ) | (86.1 | ) | |||||||||
|
|
|
|
|
|
|
|||||||||||
| Profit before taxation |
365.8 | 4.5 | 138.5 | |||||||||||||
| Mining and income taxation |
9 | (192.1 | ) | (247.1 | ) | (118.1 | ) | |||||||||
|
|
|
|
|
|
|
|||||||||||
| Profit/(loss) for the year |
173.7 | (242.6 | ) | 20.4 | ||||||||||||
|
|
|
|
|
|
|
|||||||||||
| Profit/(loss) attributable to: |
||||||||||||||||
| – Owners of the parent |
162.8 | (242.1 | ) | 12.8 | ||||||||||||
| – Non-controlling interest holders |
10.9 | (0.5 | ) | 7.6 | ||||||||||||
|
|
|
|
|
|
|
|||||||||||
| 173.7 | (242.6 | ) | 20.4 | |||||||||||||
|
|
|
|
|
|
|
|||||||||||
| Earnings/(loss) per share attributable to owners of the parent: |
||||||||||||||||
| Basic earnings/(loss) per share – cents |
10.1 | 20 | (31 | ) | 2 | |||||||||||
| Diluted basic earnings/(loss) per share – cents |
10.2 | 20 | (31 | ) | 2 | |||||||||||
|
|
|
|
|
|
|
|||||||||||
The accompanying notes form an integral part of these financial statements.
Notes to the consolidated financial statements
for the year ended 31 December
Figures in millions unless otherwise stated
| 2. | COST OF SALES |
| UNITED STATES DOLLAR | ||||||||||||
| 2016 | 2015 | 2014 | ||||||||||
| Salaries and wages |
(409.5 | ) | (389.6 | ) | (448.1 | ) | ||||||
| Consumable stores |
(353.9 | ) | (389.2 | ) | (441.2 | ) | ||||||
| Utilities |
(175.1 | ) | (167.9 | ) | (199.2 | ) | ||||||
| Mine contractors |
(318.2 | ) | (294.9 | ) | (351.0 | ) | ||||||
| Other |
(176.3 | ) | (189.7 | ) | (245.4 | ) | ||||||
|
|
|
|
|
|
|
|||||||
| Cost of sales before gold inventory change and amortisation and depreciation |
(1,433.0 | ) | (1,431.3 | ) | (1,684.9 | ) | ||||||
| Gold inventory change |
45.5 | (24.9 | ) | 7.2 | ||||||||
|
|
|
|
|
|
|
|||||||
| Cost of sales before amortisation and depreciation |
(1,387.5 | ) | (1,456.2 | ) | (1,677.7 | ) | ||||||
| Amortisation and depreciation |
(679.2 | ) | (609.9 | ) | (656.7 | ) | ||||||
|
|
|
|
|
|
|
|||||||
| Total cost of sales |
(2,066.7 | ) | (2,066.1 | ) | (2,334.4 | ) | ||||||
|
|
|
|
|
|
|
|||||||
| 41. | SEGMENT REPORT |
| UNITED STATES DOLLAR | ||||||||||||||||||||||||||||||||||||||||||||||||||||
| South Africa |
Ghana | Peru | Australia | |||||||||||||||||||||||||||||||||||||||||||||||||
| South Deep1 |
Tarkwa | Damang | Total Ghana |
Cerro Corona |
St Ives | Agnew/ Lawlers |
Darlot | Granny Smith |
Gruyere | Total Australia |
Corporate and other2 |
Group | ||||||||||||||||||||||||||||||||||||||||
| INCOME STATEMENT |
||||||||||||||||||||||||||||||||||||||||||||||||||||
| for the year ended 31 December 2016 |
||||||||||||||||||||||||||||||||||||||||||||||||||||
| Revenue |
358.2 | 708.9 | 183.4 | 892.3 | 322.3 | 452.3 | 285.4 | 83.1 | 355.8 | — | 1,176.7 | — | 2,749.5 | |||||||||||||||||||||||||||||||||||||||
| Cost of sales before gold inventory change and amortisation and depreciation |
(272.3 | ) | (344.7 | ) | (136.4 | ) | (481.2 | ) | (143.7 | ) | (192.8 | ) | (145.7 | ) | (57.3 | ) | (141.1 | ) | — | (536.9 | ) | 1.1 | (1,433.0 | ) | ||||||||||||||||||||||||||||
| Gold inventory change |
0.7 | 17.5 | 0.4 | 17.8 | 3.8 | 11.0 | 5.1 | (0.4 | ) | 7.4 | — | 23.1 | — | 45.5 | ||||||||||||||||||||||||||||||||||||||
| Amortisation and depreciation |
(71.5 | ) | (184.4 | ) | (17.8 | ) | (202.2 | ) | (115.6 | ) | (144.7 | ) | (77.1 | ) | (14.4 | ) | (45.1 | ) | — | (281.3 | ) | (8.6 | ) | (679.2 | ) | |||||||||||||||||||||||||||
| Other income/(costs) |
13.5 | (7.8 | ) | (0.6 | ) | (8.4 | ) | (13.1 | ) | 13.6 | 6.3 | — | 2.3 | — | 22.2 | 25.0 | 3 | 39.2 | ||||||||||||||||||||||||||||||||||
| Share-based payments |
(2.3 | ) | (2.5 | ) | (0.3 | ) | (2.8 | ) | (2.0 | ) | (1.2 | ) | (0.8 | ) | (0.4 | ) | (0.9 | ) | — | (3.3 | ) | (4.0 | ) | (14.4 | ) | |||||||||||||||||||||||||||
| Long-term incentive plan |
(1.0 | ) | (2.3 | ) | (0.5 | ) | (2.8 | ) | (1.8 | ) | (0.8 | ) | (0.7 | ) | (0.5 | ) | (0.8 | ) | — | (2.8 | ) | (2.6 | ) | (11.0 | ) | |||||||||||||||||||||||||||
| Exploration expense |
— | — | — | — | — | (21.1 | ) | (9.6 | ) | (6.1 | ) | (10.6 | ) | — | (47.4 | ) | (44.8 | ) | (92.2 | ) | ||||||||||||||||||||||||||||||||
| Restructuring costs |
— | (0.2 | ) | (9.9 | ) | (10.1 | ) | — | — | — | — | (1.2 | ) | — | (1.2 | ) | (0.4 | ) | (11.7 | ) | ||||||||||||||||||||||||||||||||
| Impairment of investments and assets |
— | — | (10.0 | ) | (10.0 | ) | (66.4 | ) | — | — | — | — | — | — | (0.1 | ) | (76.5 | ) | ||||||||||||||||||||||||||||||||||
| Investment income |
1.1 | 1.8 | — | 1.8 | — | — | — | — | — | — | — | 5.4 | 8.3 | |||||||||||||||||||||||||||||||||||||||
| Finance expense |
(5.5 | ) | (3.9 | ) | (3.5 | ) | (7.4 | ) | (4.7 | ) | (2.7 | ) | (1.0 | ) | (0.2 | ) | (1.0 | ) | — | (4.9 | ) | (55.8 | ) | (78.3 | ) | |||||||||||||||||||||||||||
| Royalties |
(1.8 | ) | (35.4 | ) | (9.2 | ) | (44.6 | ) | (4.6 | ) | — | 4 | — | 4 | — | 4 | — | 4 | — | 4 | (29.3 | ) | — | (80.4 | ) | |||||||||||||||||||||||||||
| Current taxation |
— | (52.4 | ) | — | (52.4 | ) | (45.9 | ) | — | 4 | — | 4 | — | 4 | — | 4 | — | 4 | (95.7 | ) | (10.7 | ) | (204.7 | ) | ||||||||||||||||||||||||||||
| Deferred taxation |
(6.0 | ) | 22.6 | — | 22.6 | (1.5 | ) | — | 4 | — | 4 | — | 4 | — | 4 | — | 4 | 0.3 | (2.8 | ) | 12.6 | |||||||||||||||||||||||||||||||
| Profit/(loss) for the year |
13.0 | 116.9 | (4.5 | ) | 112.5 | (73.1 | ) | — | 4 | — | 4 | — | 4 | — | 4 | — | 4 | 219.5 | (98.3 | ) | 173.7 | |||||||||||||||||||||||||||||||
|
|
|
|
|
|
|
|
|
|
|
|
|
|
|
|
|
|
|
|
|
|
|
|
|
|
|
|||||||||||||||||||||||||||
| Profit/(loss) attributable to: |
||||||||||||||||||||||||||||||||||||||||||||||||||||
| – Owners of the parent |
13.0 | 105.2 | (4.0 | ) | 101.3 | (72.8 | ) | — | 4 | — | 4 | — | 4 | — | 4 | — | 4 | 219.5 | (98.3 | ) | 162.8 | |||||||||||||||||||||||||||||||
| – Non-controlling interest holders |
— | 11.7 | (0.5 | ) | 11.2 | (0.3 | ) | — | 4 | — | 4 | — | 4 | — | 4 | — | 4 | — | — | 10.9 | ||||||||||||||||||||||||||||||||
|
|
|
|
|
|
|
|
|
|
|
|
|
|
|
|
|
|
|
|
|
|
|
|
|
|
|
|||||||||||||||||||||||||||
| STATEMENT OF FINANCIAL POSITION |
||||||||||||||||||||||||||||||||||||||||||||||||||||
| at 31 December 2016 |
||||||||||||||||||||||||||||||||||||||||||||||||||||
| Total assets (excluding deferred taxation) |
1,075.0 | 1,667.0 | 132.6 | 1,799.6 | 822.5 | 622.3 | 426.4 | 10.1 | 292.7 | 272.5 | 1,624.0 | 964.9 | 6,286.0 | |||||||||||||||||||||||||||||||||||||||
| Total liabilities (excluding deferred taxation) |
1,162.0 | 219.0 | 96.3 | 315.3 | 195.4 | 136.3 | 66.3 | 22.5 | 63.1 | 272.4 | 560.6 | 446.3 | 2,679.6 | |||||||||||||||||||||||||||||||||||||||
| Net deferred taxation (assets)/liabilities |
(32.4 | ) | 282.4 | — | 282.4 | 95.6 | — | 4 | — | 4 | — | 4 | — | 4 | — | 4 | 87.0 | (15.7 | ) | 416.8 | ||||||||||||||||||||||||||||||||
|
|
|
|
|
|
|
|
|
|
|
|
|
|
|
|
|
|
|
|
|
|
|
|
|
|
|
|||||||||||||||||||||||||||
| Capital expenditure5 |
77.9 | 168.4 | 37.9 | 206.3 | 42.8 | 140.0 | 70.0 | 21.4 | 90.3 | — | 321.7 | 1.3 | 649.9 | |||||||||||||||||||||||||||||||||||||||
|
|
|
|
|
|
|
|
|
|
|
|
|
|
|
|
|
|
|
|
|
|
|
|
|
|
|
|||||||||||||||||||||||||||
The above is a geographical analysis presented by location of assets.
The Group is primarily involved in gold mining, exploration and related activities. Activities are conducted and investments held both inside and outside South Africa. The segment results have been prepared and presented based on management’s reporting format. Gold mining operations are managed and internally reported based on the following geographical areas: in South Africa, South Deep mine, in Ghana, Tarkwa and Damang mines, in Australia, St Ives, Agnew/Lawlers, Granny Smith, Darlot mines and Gruyere Gold Project and in Peru, the Cerro Corona mine. Whilst the Gruyere Gold Project does not meet the quantitative criteria for disclosure as a separate segment, it is expected to become a significant contributor to the Group’s performance in future years as the project is being developed. The Group also has exploration interests which are included in the “Corporate and other” segment. Refer to accounting policies on segment reporting on page ☐☐.
US Dollar figures may not add as they are rounded independently.
| 1 | The income statement and statement of financial position of South Deep is that of the operating mine and does not include any of the adjustments made in respect of the purchase price allocation relating to the acquisition of South Deep (refer note 14). South Deep Gold mine, being an unincorporated joint venture, is not liable for taxation. Taxation included in South Deep is indicative, as tax is provided in the holding companies at a rate of 30%. |
| 2 | “Corporate and other” represents the items to reconcile segment data to consolidated financial statement totals, including the elimination of intercompany transactions and balances as well as the Group’s exploration interests. This does not represent a separate segment as it does not generate revenue. Included in “Corporate and other” is the adjustment made in respect of the purchase price allocation, including goodwill relating to the acquisition of South Deep. |
| 3 | Other income “Corporate and other” comprise share of loss of associates after taxation of US$2.3 million, profit on disposal of investments of US$2.3 million, profit on disposal of assets of US$48.0 million and the balance of US$23.0 million consists mainly of corporate related costs. |
| 4 | The Australian operations are entitled to transfer and off-set profits and losses from one company to another, therefore it is not meaningful to split the royalties, income or deferred taxation. |
| 5 | Capital expenditure for the year ended 31 December 2016. |