Table of Contents
UNITED STATES
SECURITIES AND EXCHANGE COMMISSION
Washington, D.C. 20549
FORM N-CSR
CERTIFIED SHAREHOLDER REPORT OF REGISTERED
MANAGEMENT INVESTMENT COMPANIES
Investment Company Act file number: 811-21145
SPDR® INDEX SHARES FUNDS
(Exact name of registrant as specified in charter)
One Lincoln Street, Boston, Massachusetts 02111
(Address of principal executive offices) (zip code)
Joshua A. Weinberg, Esq.
Managing Director and Managing Counsel
SSGA Funds Management, Inc.
One Lincoln Street
Boston, Massachusetts 02111
(Name and address of agent for service)
Copy to:
W. John McGuire, Esq.
Morgan, Lewis & Bockius LLP
1111 Pennsylvania Avenue, N.W.
Washington, DC 20004
Registrant’s telephone number, including area code: (617) 664-7037
Date of fiscal year end: September 30
Date of reporting period: September 30, 2017
Table of Contents
Item 1. Report to Shareholders.
Table of Contents
Annual Report
September 30, 2017
SPDR® Index Shares Funds
The information contained in this report is intended for the general information of shareholders of the Trust. This report is not authorized for distribution to prospective investors unless preceded or accompanied by a current Trust prospectus which contains important information concerning the Trust. You may obtain a current prospectus and SAI from the Distributor by calling 1-866-787-2257 or visiting www.spdrs.com. Please read the prospectus carefully before you invest.

Table of Contents
| 1 | ||||
| Management’s Discussion of Fund Performance, Performance Summary & Portfolio Statistics (Unaudited) |
||||
| 2 | ||||
| 4 | ||||
| 6 | ||||
| 8 | ||||
| 10 | ||||
| 12 | ||||
| 14 | ||||
| 16 | ||||
| 18 | ||||
| 20 | ||||
| 22 | ||||
| 24 | ||||
| SPDR MSCI Emerging Markets Fossil Fuel Reserves Free ETF (EEMX) |
26 | |||
| 28 | ||||
| 30 | ||||
| 32 | ||||
| 34 | ||||
| 36 | ||||
| 38 | ||||
| 40 | ||||
| 42 | ||||
| 44 | ||||
| 46 | ||||
| 48 | ||||
| 50 | ||||
| 59 | ||||
| 67 | ||||
| 77 | ||||
| 80 | ||||
| 104 | ||||
| 107 | ||||
| 110 | ||||
| 120 | ||||
| 136 | ||||
| SPDR MSCI Emerging Markets Fossil Fuel Reserves Free ETF (EEMX) |
146 | |||
| 151 | ||||
| 158 | ||||
| 170 |
Table of Contents
| 182 | ||||
| 185 | ||||
| 188 | ||||
| 194 | ||||
| 198 | ||||
| 201 | ||||
| 214 | ||||
| 235 | ||||
| 257 | ||||
| 272 | ||||
| 273 |
The information contained in this report is intended for the general information of shareholders of the Trust. This report is not authorized for distribution to prospective investors unless preceded or accompanied by a current Trust prospectus which contains important information concerning the Trust. You may obtain a current prospectus and SAI from the Distributor by calling 1-866-787-2257 or visiting www.spdrs.com. Please read the prospectus carefully before you invest.
Table of Contents

NOTE TO PERFORMANCE SUMMARY (UNAUDITED)
The performance chart of a Fund’s total return at net asset value (“NAV”), the total return based on market price and its benchmark index is provided for comparative purposes only and represents the periods noted. A Fund’s per share NAV is the value of one share of a Fund and is calculated by dividing the value of total assets less total liabilities by the number of shares outstanding. The NAV return is based on the NAV of a Fund and the market return is based on the market price per share of a Fund. The market price used to calculate the market return is determined by using the midpoint between the highest bid and the lowest offer on the exchange on which the shares of a Fund are listed for trading, as of the time that a Fund’s NAV is calculated. NAV and market returns assume that dividends and capital gain distributions have been reinvested in a Fund at NAV. Market returns do not include brokerage commissions that may be payable on secondary market transactions. If brokerage commissions were included market returns would be lower.
An index is a statistical measure of a specified financial market or sector. An index does not actually hold a portfolio of securities and therefore does not reflect deductions for fees or expenses. In comparison, a Fund’s performance is negatively impacted by these deductions. Index returns reflect all items of income, gain and loss and the reinvestment of dividends and other income.
1
Table of Contents
MANAGEMENT’S DISCUSSION OF FUND PERFORMANCE (UNAUDITED)
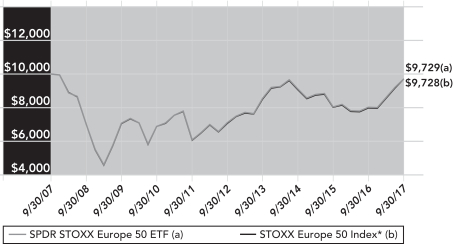
The SPDR STOXX Europe 50 ETF (the “Fund”) seeks to provide investment results that, before fees and expenses, correspond generally to the total return performance of the STOXX® Europe 50 Index. The Fund’s benchmark is the STOXX® Europe 50 Index (the “Index”).
For the 12-month period ended September 30, 2017 (the “Reporting Period”), the total return for the Fund was 20.83%, and the Index was 21.28%. The Fund and Index returns reflect the reinvestment of dividends and other income. The Fund’s performance reflects the expenses of managing the Fund, including brokerage and advisory expenses. The Index is unmanaged and Index returns do not reflect fees and expenses of any kind, which would have a negative impact on returns. Fees and expenses, cash drag and tax withholdings contributed to the difference between the Fund’s performance and that of the Index.
While Brexit created some uncertainty in the first half of 2016, the rollout of additional monetary policies by major central banks globally provided the much needed fodder to create an aggressive rally and end 2016 on an optimistic note. In the first half of 2017, U.S. stockholders who were invested in European equities benefitted from a better than 8% gain of the Euro against the U.S. dollar. In addition to an improving economic backdrop, European shares benefitted from an easing of political uncertainty with the defeat of populist candidates in the Netherlands in February and in presidential polls in France that spanned April and May. Positive returns continued to be realized for the Fund from strong economic and earnings growth in the Eurozone in the second half of 2017. As Eurozone industrial production trended higher, the Fund witnessed another double-digit positive performance in the third quarter of 2017.
The Fund did not invest in derivatives during the Reporting Period.
On an individual security level, the top positive contributors to the Fund’s performance were HSBC Holdings plc, Banco Santander S.A., and Allianz SE. The top negative contributors to the Fund’s performance were Imperial Brands PLC, BT Group plc, and Anheuser-Busch InBev SA/NV.
The views expressed above reflect those of the Fund’s portfolio manager only through the Reporting Period, and do not necessarily represent the views of the Adviser as a whole. Any such views are subject to change at any time based upon market or other conditions and the Adviser disclaims any responsibility to update such views. These views may not be relied on as investment advice and, because investment decisions for a fund are based on numerous factors, may not be relied on as an indication of trading intent on behalf of any fund.
2
Table of Contents
SPDR STOXX EUROPE 50 ETF —
PERFORMANCE SUMMARY AND PORTFOLIO STATISTICS (UNAUDITED)
Performance as of September 30, 2017
| Cumulative Total Return |
Average Annual Total Return |
|||||||||||||||||||||||||||||
| Net |
Market |
STOXX Europe |
Net |
Market |
STOXX Europe |
|||||||||||||||||||||||||
| ONE YEAR |
20.83% | 21.27% | 21.28% | 20.83% | 21.27% | 21.28% | ||||||||||||||||||||||||
| FIVE YEARS |
36.02% | 35.82% | 36.48% | 6.35% | 6.31% | 6.42% | ||||||||||||||||||||||||
| TEN YEARS |
–2.71% | –2.59% | –2.72% | –0.27% | –0.26% | –0.28% | ||||||||||||||||||||||||
Comparison of Change in Value of a $10,000 Investment (Based on Net Asset Value)
Line graph is based on cumulative total return.
| * | The STOXX Europe 50 Index (the “Index”) is a market capitalization weighted index designed to represent the performance of some of the largest companies across all components of the 19 STOXX Europe 600 Supersector Indexes. The STOXX Europe 600 Supersector Indexes are subsets of the STOXX Europe 600 Index, which contains 600 of the largest stocks traded on the major exchanges in Europe. The STOXX Europe 600 Index is derived from the STOXX Europe Total Market Index (TMI) and is a subset of the STOXX Global 1800 Index. The Index covers 50 stocks from European countries generally regardless of a country’s adopted currency. The Index captures approximately 50% of the free-float market capitalization of the TMI, which in turn covers approximately 95% of the free-float market capitalization of the represented countries. |
Top Ten Holdings as of September 30, 2017
| Description |
% of Net Assets |
|||||||
| Nestle SA |
5.9 | % | ||||||
| Novartis AG |
4.8 | |||||||
| HSBC Holdings PLC |
4.6 | |||||||
| Roche Holding AG |
4.1 | |||||||
| British American Tobacco PLC |
3.3 | |||||||
| Royal Dutch Shell PLC Class A |
3.1 | |||||||
| TOTAL SA |
3.0 | |||||||
| BP PLC |
2.9 | |||||||
| Siemens AG |
2.7 | |||||||
| Sanofi |
2.6 | |||||||
| TOTAL |
37.0 | % | ||||||
(The ten largest holdings are subject to change, and there are no guarantees the Fund will continue to remain invested in any particular company.)
Sector Breakdown as of September 30, 2017
| % of Net Assets |
||||||||
| Financials |
23.4 | % | ||||||
| Consumer Staples |
20.3 | |||||||
| Health Care |
20.0 | |||||||
| Energy |
9.9 | |||||||
| Industrials |
7.5 | |||||||
| Materials |
5.9 | |||||||
| Telecommunication Services |
4.2 | |||||||
| Information Technology |
4.0 | |||||||
| Consumer Discretionary |
3.5 | |||||||
| Utilities |
1.0 | |||||||
| Short-Term Investment |
0.1 | |||||||
| Other Assets in Excess of Liabilities |
0.2 | |||||||
| TOTAL |
100.0 | % | ||||||
(The Fund’s sector breakdown is expressed as a percentage of net assets and may change over time.)
The total expense ratio for SPDR STOXX Europe 50 ETF as stated in the Fees and Expenses table of the prospectus dated January 31, 2017 (as supplemented October 16, 2017) is 0.29%.
Performance quoted represents past performance, which is no guarantee of future results. Investment return and principal value will fluctuate, so you may have a gain or loss when shares are sold. Current performance may be higher or lower than that quoted. Visit www.spdrs.com for most recent month-end performance. The returns do not reflect the deduction of taxes that a shareholder would pay on Fund distributions or on the redemption or sale of Fund shares. See “Note to Performance Summary” on page 1 for more information.
3
Table of Contents
SPDR EURO STOXX SMALL CAP ETF —
MANAGEMENT’S DISCUSSION OF FUND PERFORMANCE (UNAUDITED)
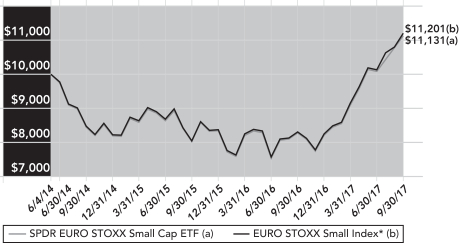
The SPDR EURO STOXX Small Cap ETF (the “Fund”) seeks to provide investment results that, before fees and expenses, correspond generally to the total return performance of an index that tracks the performance of small capitalization Eurozone equity securities. The Fund’s benchmark is the EURO STOXX Small Index (the “Index”).
For the 12-month period ended September 30, 2017 (the “Reporting Period”), the total return for the Fund was 34.30%, and the Index was 34.72%. The Fund and Index returns reflect the reinvestment of dividends and other income. The Fund’s performance reflects the expenses of managing the Fund, including brokerage and advisory expenses. The Index is unmanaged and Index returns do not reflect fees and expenses of any kind, which would have a negative impact on returns. Fees and expenses, cash drag and tax withholdings contributed to the difference between the Fund’s performance and that of the Index.
While Brexit created some uncertainty in the first half of 2016, the rollout of additional monetary policies by major central banks globally provided the much needed fodder to create an aggressive rally and end 2016 on an optimistic note. In the first half of 2017, U.S. stockholders who were invested in European equities benefitted from a better than 8% gain of the Euro against the U.S. dollar. In addition to an improving economic backdrop, European shares benefitted from an easing of political uncertainty with the defeat of populist candidates in the Netherlands in February and in presidential polls in France that spanned April and May. Positive returns continued for the Fund from strong economic and earnings growth in the Eurozone in the second half of 2017. As Eurozone industrial production trended higher, the Fund witnessed another double-digit positive performance in the third quarter of 2017.
The Fund did not invest in derivatives during the Reporting Period.
On an individual security level, the top positive contributors to the Fund’s performance were Deutsche Lufthansa AG, Unione di Banche Italiane SpA, and Uniper SE. The top negative contributors to the Fund’s performance were Jeronimo Martins, SGPS S.A., Amer Sports Oyj Class A, and Technicolor SA.
The views expressed above reflect those of the Fund’s portfolio manager only through the Reporting Period, and do not necessarily represent the views of the Adviser as a whole. Any such views are subject to change at any time based upon market or other conditions and the Adviser disclaims any responsibility to update such views. These views may not be relied on as investment advice and, because investment decisions for a fund are based on numerous factors, may not be relied on as an indication of trading intent on behalf of any fund.
4
Table of Contents
SPDR EURO STOXX SMALL CAP ETF —
PERFORMANCE SUMMARY AND PORTFOLIO STATISTICS (UNAUDITED)
Performance as of September 30, 2017
| Cumulative Total Return | Average Annual Total Return | |||||||||||||||||||||||||||||
| Net Asset Value |
Market Value |
EURO STOXX Small Index* |
Net Asset Value |
Market Value |
EURO STOXX Small Index* |
|||||||||||||||||||||||||
| ONE YEAR | 34.30% | 34.61% | 34.72% | 34.30% | 34.61% | 34.72% | ||||||||||||||||||||||||
| SINCE INCEPTION (1) | 11.31% | 11.54% | 12.01% | 3.27% | 3.34% | 3.47% | ||||||||||||||||||||||||
| (1) | For the period June 4, 2014 to September 30, 2017. Since shares of the Fund did not trade in the secondary market until the day after the Fund’s inception, for the period from inception to the first day of secondary market trading in shares of the Fund (6/4/14, 6/5/14, respectively), the NAV of the Fund is used as a proxy for the secondary market trading price to calculate market returns. |
Comparison of Change in Value of a $10,000 Investment (Based on Net Asset Value)
Line graph is based on cumulative total return.
| * | The EURO STOXX Small Index (the “Index”) is designed to provide a representation of small companies across the Eurozone. The Eurozone consists of European Union countries that have adopted the Euro as their currency. The Index consists of the Eurozone stocks included in the STOXX Europe Small 200 Index. |
Top Ten Holdings as of September 30, 2017
| Description | % of Net Assets |
|||||||
| Uniper SE |
1.7 | % | ||||||
| Unione di Banche Italiane SpA |
1.7 | |||||||
| Orpea |
1.6 | |||||||
| Faurecia |
1.6 | |||||||
| Rheinmetall AG |
1.6 | |||||||
| Ubisoft Entertainment SA |
1.5 | |||||||
| Ipsen SA |
1.5 | |||||||
| Allied Irish Banks PLC |
1.5 | |||||||
| Moncler SpA |
1.5 | |||||||
| ASR Nederland NV |
1.5 | |||||||
| TOTAL |
15.7 | % | ||||||
(The ten largest holdings are subject to change, and there are no guarantees the Fund will continue to remain invested in any particular company.)
Sector Breakdown as of September 30, 2017
| % of Net Assets |
||||||||
| Financials |
19.0 | % | ||||||
| Industrials |
17.9 | |||||||
| Consumer Discretionary |
16.3 | |||||||
| Health Care |
9.7 | |||||||
| Consumer Staples |
8.0 | |||||||
| Information Technology |
6.6 | |||||||
| Real Estate |
5.9 | |||||||
| Telecommunication Services |
5.3 | |||||||
| Materials |
5.1 | |||||||
| Utilities |
3.4 | |||||||
| Energy |
2.7 | |||||||
| Short-Term Investment |
0.0 | ** | ||||||
| Other Assets in Excess of Liabilities |
0.1 | |||||||
| TOTAL |
100.0 | % | ||||||
| ** | Amount shown represents less than 0.05% of net assets. |
(The Fund’s sector breakdown is expressed as a percentage of net assets and may change over time.)
The total expense ratio for SPDR EURO STOXX Small Cap ETF as stated in the Fees and Expenses table of the prospectus dated January 31, 2017 (as supplemented October 16, 2017) is 0.45%.
Performance quoted represents past performance, which is no guarantee of future results. Investment return and principal value will fluctuate, so you may have a gain or loss when shares are sold. Current performance may be higher or lower than that quoted. Visit www.spdrs.com for most recent month-end performance. The returns do not reflect the deduction of taxes that a shareholder would pay on Fund distributions or on the redemption or sale of Fund shares. See “Note to Performance Summary” on page 1 for more information.
5
Table of Contents
SPDR S&P EMERGING ASIA PACIFIC ETF —
MANAGEMENT’S DISCUSSION OF FUND PERFORMANCE (UNAUDITED)
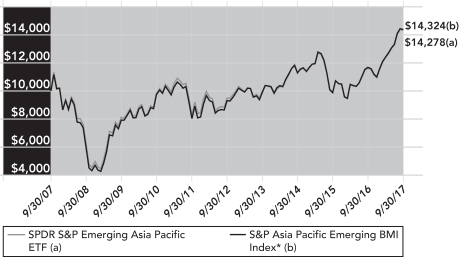
The SPDR S&P Emerging Asia Pacific ETF (the “Fund”) seeks to provide investment results that, before fees and expenses, correspond generally to the total return performance of an index based upon the emerging markets of the Asia Pacific region. The Fund’s benchmark is the S&P Asia Pacific Emerging BMI Index (the “Index”).
For the 12-month period ended September 30, 2017 (the “Reporting Period”), the total return for the Fund was 23.02%, and the Index was 22.88%. The Fund and Index returns reflect the reinvestment of dividends and other income. The Fund’s performance reflects the expenses of managing the Fund, including brokerage and advisory expenses. The Index is unmanaged and Index returns do not reflect fees and expenses of any kind, which would have a negative impact on returns. Fund expenses, transaction costs, cash and receivables drag, compounding, and security misweights contributed to the difference between the Fund’s performance and that of the Index.
The S&P Emerging Asia Pacific Index lost 5.72% during the final quarter of 2016. As the final quarter of 2016 commenced, October provided investors few places to avoid negative returns as both safe haven investments and riskier growth assets came under pressure during the month. Emerging market weakness in the fourth quarter corresponded with expectations for a faster pace of Fed tightening through 2017, with market forecasts of the December 2017 Federal Funds rate roughly 0.75% higher on December 31st than at the beginning of October. Any relaxing of Fed tightening expectations, a scenario that unfolded in early 2016 to the benefit of emerging markets, should be beneficial for the space in 2017 as well, while a faster pace of tightening will provide headwinds as global liquidity conditions become more constrained.
The Index gained 12.87% during the first quarter of 2017 as global markets ushered in 2017 on a cautiously positive note in January with new all-time highs established in U.S. equity markets, even as a number of other reflationary market trends paused or reversed. Beyond the better than 6% increase in U.S. equities as measured by the S&P 500 index, the first quarter of 2017 also set an optimistic tone across global regional indices from a U.S. investor perspective, led by gains in emerging markets that saw advances from China, one of its largest constituents. The strong advance for emerging equities occurred despite a faster than anticipated first 2017 hike by the Fed in March that might otherwise have dragged down emerging shares, suggesting that a sustainable global growth narrative was more compelling
The second and third quarter of 2017 continued to deliver gains for the Index by adding 7.04% and 7.88%, respectively. The uncertainty of the French presidential elections in April caused a significant uptick in global market volatility especially when compared to the historically low levels of volatility observed in the previous quarter of 2017. However, global markets reverted back to lower volatility and the equity markets rallied after the results favored the establishment friendly candidate. China continued to be one of the largest gainers in emerging markets due to improving economic backdrop and was one the major contributor to the Index in the second quarter of 2017. The third quarter of 2017 was a continuation of the themes that prevailed in the first half of the year. That strong advance led by China coincides with stabilization in the Chinese currency against the US dollar this year, as well as a rate of economic growth in 2017 now estimated at 6.8% by J.P. Morgan (against earlier consensus estimates and an official target of 6.5%).
The Fund did not invest in derivatives during the Reporting Period.
On an individual security level, the top positive contributors to the Fund’s performance were Tencent Holdings Ltd., Alibaba Group Holding Ltd. Sponsored ADR, and Taiwan Semiconductor Manufacturing Co., Ltd. The top negative contributors to the Fund’s performance were Tata Motors Limited, Sun Pharmaceutical Industries Limited, and China Mobile Limited.
The views expressed above reflect those of the Fund’s portfolio manager only through the Reporting Period, and do not necessarily represent the views of the Adviser as a whole. Any such views are subject to change at any time based upon market or other conditions and the Adviser disclaims any responsibility to update such views. These views may not be relied on as investment advice and, because investment decisions for a fund are based on numerous factors, may not be relied on as an indication of trading intent on behalf of any fund.
6
Table of Contents
SPDR S&P EMERGING ASIA PACIFIC ETF —
PERFORMANCE SUMMARY AND PORTFOLIO STATISTICS (UNAUDITED)
Performance as of September 30, 2017
| Cumulative Total Return | Average Annual Total Return | |||||||||||||||||||||||||||||
| Net Asset Value |
Market Value |
S&P Asia Pacific Emerging BMI Index* |
Net Asset Value |
Market Value |
S&P Asia Pacific Emerging BMI Index* |
|||||||||||||||||||||||||
| ONE YEAR | 23.02% | 22.99% | 22.88% | 23.02% | 22.99% | 22.88% | ||||||||||||||||||||||||
| FIVE YEARS | 50.18% | 52.80% | 53.87% | 8.47% | 8.85% | 9.00% | ||||||||||||||||||||||||
| TEN YEARS | 42.78% | 43.82% | 43.24% | 3.63% | 3.70% | 3.66% | ||||||||||||||||||||||||
Comparison of Change in Value of a $10,000 Investment (Based on Net Asset Value)
Line graph is based on cumulative total return.
| * | The S&P Asia Pacific Emerging BMI Index (the “Index”) is a market capitalization weighted index designed to define and measure the investable universe of publicly traded companies domiciled in emerging Asian Pacific markets. The Index is “float adjusted”, meaning that only those shares publicly available to investors are included in the Index calculation. |
Top Ten Holdings as of September 30, 2017
| Description | % of Net Assets |
|||||||
| Tencent Holdings, Ltd. |
6.8 | % | ||||||
| Alibaba Group Holding, Ltd. ADR |
5.5 | |||||||
| Taiwan Semiconductor Manufacturing Co., Ltd. ADR |
3.8 | |||||||
| China Construction Bank Corp. Class H |
2.2 | |||||||
| Baidu, Inc. ADR |
2.0 | |||||||
| China Mobile, Ltd. |
1.7 | |||||||
| Industrial & Commercial Bank of China, Ltd. Class H |
1.7 | |||||||
| Hon Hai Precision Industry Co., Ltd. |
1.5 | |||||||
| Housing Development Finance Corp., Ltd. |
1.3 | |||||||
| Reliance Industries, Ltd. GDR |
1.2 | |||||||
| TOTAL |
27.7 | % | ||||||
(The ten largest holdings are subject to change, and there are no guarantees the Fund will continue to remain invested in any particular company.)
Sector Breakdown as of September 30, 2017
| % of Net Assets |
||||||||
| Information Technology |
31.6 | % | ||||||
| Financials |
22.4 | |||||||
| Consumer Discretionary |
8.9 | |||||||
| Industrials |
6.0 | |||||||
| Materials |
5.6 | |||||||
| Energy |
5.6 | |||||||
| Consumer Staples |
5.1 | |||||||
| Telecommunication Services |
4.8 | |||||||
| Real Estate |
4.1 | |||||||
| Health Care |
2.8 | |||||||
| Utilities |
2.3 | |||||||
| Short-Term Investments |
1.9 | |||||||
| Liabilities in Excess of Other Assets |
(1.1 | ) | ||||||
| TOTAL |
100.0 | % | ||||||
(The Fund’s sector breakdown is expressed as a percentage of net assets and may change over time)
The total expense ratio for SPDR S&P Emerging Asia Pacific ETF as stated in the Fees and Expenses table of the prospectus dated January 31, 2017 (as supplemented October 16, 2017) is 0.49%.
Performance quoted represents past performance, which is no guarantee of future results. Investment return and principal value will fluctuate, so you may have a gain or loss when shares are sold. Current performance may be higher or lower than that quoted. Visit www.spdrs.com for most recent month-end performance. The returns do not reflect the deduction of taxes that a shareholder would pay on Fund distributions or on the redemption or sale of Fund shares. See “Note to Performance Summary” on page 1 for more information.
7
Table of Contents
MANAGEMENT’S DISCUSSION OF FUND PERFORMANCE (UNAUDITED)
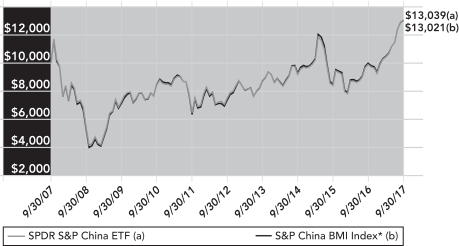
The SPDR S&P China ETF (the “Fund”) seeks to provide investment results that, before fees and expenses, correspond generally to the total return performance of an index based upon the Chinese equity market. The Fund’s benchmark is the S&P China BMI Index (the “Index”).
For the 12-month period ended September 30, 2017 (the “Reporting Period”), the total return for the Fund was 31.50%, and the Index was 30.16%. The Fund and Index returns reflect the reinvestment of dividends and other income. The Fund’s performance reflects the expenses of managing the Fund, including brokerage and advisory expenses. The Index is unmanaged and Index returns do not reflect fees and expenses of any kind, which would have a negative impact on returns. The difference in return of the fund and index was largely due to sampling. (The Fund holds a subset of the Index.)
China, after causing considerable market anxiety to open 2016 on a sharp fall in its currency and fears of a rapid economic growth slowdown, faded from being a top concern for global investors in 2016, turning in impressive results in 2017. Chinese equity markets started the fiscal year underperforming with the S&P China BMI Index declining 6.26% in the first quarter. The last three quarters of the fiscal year saw positive results with the S&P China BMI retuning 11.92% in the second quarter, 8.90% in the third quarter, and returning 13.91% in the last quarter . The final quarter of the fiscal year saw Chinese equities rally strongly. Growth in the world’s second largest economy, China, has been better than expected with a 2017 second quarter annualized growth rate of 6.9% topping what many considered an ambitious government target of 6.5%. The strong results by China coincides with stabilization in the Chinese currency against the U.S. dollar this year, as well as a rate of economic growth in 2017 now estimated at 6.8% by J.P. Morgan (against earlier consensus estimates and an official target of 6.5%). The S&P China BMI rose over 13% during the last quarter of the fiscal period, resulting in a full fiscal year return of 30.16%.
The Fund did not invest in derivatives during the Reporting Period.
On an individual security level, the top positive contributors to the Fund’s performance were Tencent Holdings Ltd., Alibaba Group Holding Ltd. Sponsored ADR, and JD.com, Inc. Sponsored ADR Class A. The top negative contributors to the Fund’s performance were China Huishan Dairy Holdings Co. Ltd., Vipshop Holdings Ltd Sponsored ADR, and China Mobile Limited.
The views expressed above reflect those of the Fund’s portfolio manager only through the Reporting Period, and do not necessarily represent the views of the Adviser as a whole. Any such views are subject to change at any time based upon market or other conditions and the Adviser disclaims any responsibility to update such views. These views may not be relied on as investment advice and, because investment decisions for a fund are based on numerous factors, may not be relied on as an indication of trading intent on behalf of any fund.
8
Table of Contents
SPDR S&P CHINA ETF —
PERFORMANCE SUMMARY AND PORTFOLIO STATISTICS (UNAUDITED)
Performance as of September 30, 2017
| Cumulative Total Return | Average Annual Total Return | |||||||||||||||||||||||||||||
| Net Asset Value |
Market Value |
S&P China BMI Index* |
Net Asset Value |
Market Value |
S&P China BMI Index* |
|||||||||||||||||||||||||
| ONE YEAR | 31.50% | 30.59% | 30.16% | 31.50% | 30.59% | 30.16% | ||||||||||||||||||||||||
| FIVE YEARS | 72.60% | 74.44% | 75.65% | 11.53% | 11.77% | 11.93% | ||||||||||||||||||||||||
| TEN YEARS | 30.39% | 31.83% | 30.21% | 2.69% | 2.80% | 2.67% | ||||||||||||||||||||||||
Comparison of Change in Value of a $10,000 Investment (Based on Net Asset Value)
Line graph is based on cumulative total return.
| * | The S&P China BMI Index (the “Index”) is a market capitalization weighted index designed to define and measure the investable universe of publicly traded companies domiciled in China available to foreign investors. The Index is “float adjusted”, meaning that only those shares publicly available to investors are included in the Index calculation. |
Top Ten Holdings as of September 30, 2017
| Description | % of Net Assets |
|||||||
| Tencent Holdings, Ltd. |
13.4 | % | ||||||
| Alibaba Group Holding, Ltd. ADR |
11.3 | |||||||
| China Construction Bank Corp. Class H |
4.9 | |||||||
| Baidu, Inc. ADR |
3.9 | |||||||
| Industrial & Commercial Bank of China, Ltd. Class H |
3.3 | |||||||
| China Mobile, Ltd. |
3.3 | |||||||
| Ping An Insurance Group Co. of China, Ltd. Class H |
2.3 | |||||||
| Bank of China, Ltd. Class H |
2.2 | |||||||
| JD.com, Inc. ADR |
1.8 | |||||||
| China Life Insurance Co., Ltd. Class H |
1.3 | |||||||
| TOTAL |
47.7 | % | ||||||
(The ten largest holdings are subject to change, and there are no guarantees the Fund will continue to remain invested in any particular company.)
Sector Breakdown as of September 30, 2017
| % of Net Assets |
||||||||
| Information Technology |
35.5 | % | ||||||
| Financials |
21.5 | |||||||
| Consumer Discretionary |
10.9 | |||||||
| Real Estate |
6.4 | |||||||
| Industrials |
6.0 | |||||||
| Energy |
4.4 | |||||||
| Telecommunication Services |
4.4 | |||||||
| Consumer Staples |
2.8 | |||||||
| Health Care |
2.6 | |||||||
| Materials |
2.6 | |||||||
| Utilities |
2.3 | |||||||
| Short-Term Investments |
2.4 | |||||||
| Liabilities in Excess of Other Assets |
(1.8 | ) | ||||||
| TOTAL |
100.0 | % | ||||||
(The Fund’s sector breakdown is expressed as a percentage of net assets and may change over time.)
The total expense ratio for SPDR S&P China ETF as stated in the Fees and Expenses table of the prospectus dated January 31, 2017 (as supplemented October 16, 2017) is 0.59%.
Performance quoted represents past performance, which is no guarantee of future results. Investment return and principal value will fluctuate, so you may have a gain or loss when shares are sold. Current performance may be higher or lower than that quoted. Visit www.spdrs.com for most recent month-end performance. The returns do not reflect the deduction of taxes that a shareholder would pay on Fund distributions or on the redemption or sale of Fund shares. See “Note to Performance Summary” on page 1 for more information.
9
Table of Contents
SPDR MSCI CHINA A SHARES IMI ETF —
MANAGEMENT’S DISCUSSION OF FUND PERFORMANCE (UNAUDITED)
The SPDR MSCI China A Shares IMI ETF (the “Fund”) seeks to provide investment results that, before fees and expenses, correspond generally to the total return performance of an index based upon the investible stocks of Chinese companies that issue A Shares. The Fund’s benchmark is the MSCI China A International IMI Index (the “Index”).
For the 12-month period ended September 30, 2017 (the “Reporting Period”), the total return for the Fund was 10.82%, and the Index was 9.95%. The Fund and Index returns reflect the reinvestment of dividends and other income. The Fund’s performance reflects the expenses of managing the Fund, including brokerage and advisory expenses. The Index is unmanaged and Index returns do not reflect fees and expenses of any kind, which would have a negative impact on returns. The difference in return of the fund and index was largely due to sampling. (The Fund holds a subset of the Index.)
China, after causing considerable market anxiety to open 2016 on a sharp fall in its currency and fears of a rapid economic growth slowdown, faded from being a top concern for global investors in 2016, turning in impressive results in 2017. Chinese equity markets started the fiscal year underperforming with the S&P China BMI Index declining 6.26% in the first quarter. The last three quarters of the fiscal year saw positive results with the S&P China BMI retuning 11.92% in the second quarter, 8.90% in the third quarter, and returning 13.91% in the last quarter . The final quarter of the fiscal year saw Chinese equities rally strongly. Growth in the world’s second largest economy, China, has been better than expected with a 2017 second quarter annualized growth rate of 6.9% topping what many considered an ambitious government target of 6.5%. The strong results by China coincides with stabilization in the Chinese currency against the US dollar this year, as well as a rate of economic growth in 2017 now estimated at 6.8% by J.P. Morgan (against earlier consensus estimates and an official target of 6.5%). The S&P China BMI rose over 13% during the last quarter of the fiscal period, resulting in a full fiscal year return of 30.16%.
The Fund did not invest in derivatives during the Reporting Period.
On an individual security level, the top positive contributors to the Fund’s performance were Kweichow Moutai Co., Ltd. Class A, Beijing Xinwei Technology Group Co., Ltd. Class A, and AnYang lron And Steel Co.Ltd. Class A. The top negative contributors to the Fund’s performance were But’one Information Corp., Xi’an Class A, Anhui Deli Household Glass Co., Ltd. Class A, and Wuliangye Yibin Co., Ltd. Class A.
The views expressed above reflect those of the Fund’s portfolio manager only through the Reporting Period, and do not necessarily represent the views of the Adviser as a whole. Any such views are subject to change at any time based upon market or other conditions and the Adviser disclaims any responsibility to update such views. These views may not be relied on as investment advice and, because investment decisions for a fund are based on numerous factors, may not be relied on as an indication of trading intent on behalf of any fund.
10
Table of Contents
SPDR MSCI CHINA A SHARES IMI ETF —
PERFORMANCE SUMMARY AND PORTFOLIO STATISTICS (UNAUDITED)
Performance as of September 30, 2017
| Cumulative Total Return |
Average Annual Total Return |
|||||||||||||||||||||||||||||
| Net |
Market |
MSCI China A |
Net |
Market |
MSCI China A |
|||||||||||||||||||||||||
| ONE YEAR |
10.82% | 9.76% | 9.95% | 10.82% | 9.76% | 9.95% | ||||||||||||||||||||||||
| SINCE INCEPTION (1) |
–3.50% | –3.68% | –1.71% | –1.83% | –1.92% | –0.89% | ||||||||||||||||||||||||
| (1) | For the period October 28, 2015 to September 30, 2017. Since shares of the Fund did not trade in the secondary market until the day after the Fund’s inception, for the period from inception to the first day of secondary market trading in shares of the Fund (10/28/15, 10/29/15, respectively), the NAV of the Fund is used as a proxy for the secondary market trading price to calculate market returns. |
Comparison of Change in Value of a $10,000 Investment (Based on Net Asset Value)
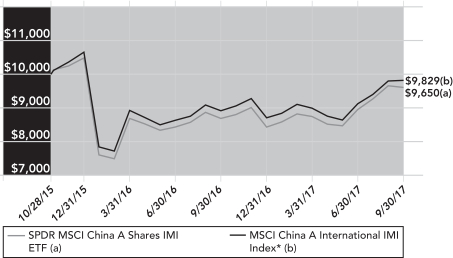
Line graph is based on cumulative total return.
| * | The MSCI China A International IMI Index (the “Index”) is a free-float adjusted, market capitalization weighted index (giving greater weight to larger companies, based on the value of securities available in the market) designed to capture large, mid and small cap representation across Chinese securities with A share listings on the Shanghai or Shenzhen Stock Exchanges. The Index is comprised solely of A Shares and aims to capture approximately 99% of the investible Chinese domestic A Shares equity universe. |
Top Ten Holdings as of September 30, 2017
| Description | % of Net Assets |
|||||||
| Kweichow Moutai Co., Ltd. Class A |
3.3 | % | ||||||
| Ping An Insurance Group Co. of China, Ltd. Class A |
1.8 | |||||||
| China Merchants Bank Co., Ltd. Class A |
1.7 | |||||||
| Industrial Bank Co., Ltd. Class A |
1.6 | |||||||
| Shanghai Pudong Development Bank Co., Ltd. Class A |
1.3 | |||||||
| Midea Group Co., Ltd. Class A |
1.0 | |||||||
| Hangzhou Hikvision Digital Technology Co., Ltd. Class A |
1.0 | |||||||
| Bank of China, Ltd. Class A |
1.0 | |||||||
| China Vanke Co., Ltd. Class A |
0.9 | |||||||
| Agricultural Bank of China, Ltd. Class A |
0.9 | |||||||
| TOTAL |
14.5 | % | ||||||
(The ten largest holdings are subject to change, and there are no guarantees the Fund will continue to remain invested in any particular company.)
Sector Breakdown as of September 30, 2017
| % of Net Assets |
||||||||
| Financials |
19.3 | % | ||||||
| Industrials |
19.1 | |||||||
| Materials |
12.9 | |||||||
| Consumer Discretionary |
10.8 | |||||||
| Information Technology |
10.2 | |||||||
| Consumer Staples |
8.4 | |||||||
| Health Care |
6.0 | |||||||
| Real Estate |
5.6 | |||||||
| Energy |
3.3 | |||||||
| Utilities |
3.1 | |||||||
| Telecommunication Services |
0.9 | |||||||
| Short-Term Investment |
0.0 | ** | ||||||
| Other Assets in Excess of Liabilities |
0.4 | |||||||
| TOTAL |
100.0 | % | ||||||
| ** | Amount shown represents less than 0.05% of net assets. |
(The Fund’s sector breakdown is expressed as a percentage of net assets and may change over time.)
The total expense ratio for SPDR MSCI China A Shares IMI ETF as stated in the Fees and Expenses table of the prospectus dated January 31, 2017 (as supplemented October 16, 2017) is 0.65%.
Performance quoted represents past performance, which is no guarantee of future results. Investment return and principal value will fluctuate, so you may have a gain or loss when shares are sold. Current performance may be higher or lower than that quoted. Visit www.spdrs.com for most recent month-end performance. The returns do not reflect the deduction of taxes that a shareholder would pay on Fund distributions or on the redemption or sale of Fund shares. See “Note to Performance Summary” on page 1 for more information.
11
Table of Contents
SPDR S&P EMERGING MARKETS DIVIDEND ETF —
MANAGEMENT’S DISCUSSION OF FUND PERFORMANCE (UNAUDITED)
The SPDR S&P Emerging Markets Dividend ETF (the “Fund”) seeks to provide investment results that before fees and expenses, correspond generally to the total return performance of an index that tracks dividend paying securities of publicly-traded companies in emerging markets. The Fund’s benchmark is the S&P Emerging Markets Dividend Opportunities Index (the “Index”).
For the 12-month period ended September 30, 2017 (the “Reporting Period”), the total return for the Fund was 14.47%, and the Index was 16.54%. The Fund and Index returns reflect the reinvestment of dividends and other income. The Fund’s performance reflects the expenses of managing the Fund, including brokerage and advisory expenses. The Index is unmanaged and Index returns do not reflect fees and expenses of any kind, which would have a negative impact on returns. Fees and expenses, cash drag and rebalance trades contributed to the difference between the Fund’s performance and that of the Index.
The last quarter of 2016 witnessed marginally negative returns for the Fund as growth assets came under pressure from the paring back of future global central banks policy support. Emerging markets ushered in 2017 on a cautiously positive note with the post-election rallies that took place in U.S. as well as the reflation rally that manifested itself powerfully. Emerging markets advanced forward strongly though towards the first half of 2017 as there was a rebound in commodity prices and economic growth improved notably in countries such as China and Korea. The last quarter of 2017 also saw the positive momentum continue in the Fund on account of increasing M&A activity, the emergence of Russia and Brazil from two years in recession, a weaker U.S. dollar and an acceleration in global trade.
The Fund did not invest in derivatives during the Reporting Period.
On an individual security level, the top positive contributors to the Fund’s performance were Mobile TeleSystems PJSC, SK Telecom Co., Ltd., and Phison Electronics Corp. The top negative contributors to the Fund’s performance were MediaTek Inc, Infosys Limited, and Life Healthcare Group Holdings Limited.
The views expressed above reflect those of the Fund’s portfolio manager only through the Reporting Period, and do not necessarily represent the views of the Adviser as a whole. Any such views are subject to change at any time based upon market or other conditions and the Adviser disclaims any responsibility to update such views. These views may not be relied on as investment advice and, because investment decisions for a fund are based on numerous factors, may not be relied on as an indication of trading intent on behalf of any fund.
12
Table of Contents
SPDR S&P EMERGING MARKETS DIVIDEND ETF —
PERFORMANCE SUMMARY AND PORTFOLIO STATISTICS (UNAUDITED)
Performance as of September 30, 2017
| Cumulative Total Return | Average Annual Total Return | |||||||||||||||||||||||||||||
| Net Asset Value |
Market Value |
S&P Emerging Markets Dividend Opportunities Index* |
Net Asset Value |
Market Value |
S&P Emerging Markets Dividend Opportunities Index* |
|||||||||||||||||||||||||
| ONE YEAR | 14.47% | 13.93% | 16.54% | 14.47% | 13.93% | 16.54% | ||||||||||||||||||||||||
| FIVE YEARS | –13.54% | –12.89% | –8.44% | –2.87% | –2.72% | –1.75% | ||||||||||||||||||||||||
| SINCE INCEPTION (1) | –16.71% | –16.29% | –8.03% | –2.73% | –2.66% | –1.26% | ||||||||||||||||||||||||
| (1) | For the period February 23, 2011 to September 30, 2017. Since shares of the Fund did not trade in the secondary market until the day after the Fund’s inception, for the period from inception to the first day of secondary market trading in shares of the Fund (2/23/11, 2/24/11, respectively), the NAV of the Fund is used as a proxy for the secondary market trading price to calculate market returns. |
Comparison of Change in Value of a $10,000 Investment (Based on Net Asset Value)

Line graph is based on cumulative total return.
| * | The S&P Emerging Markets Dividend Opportunities Index (the “Index”) is comprised of 100 of the highest yielding emerging markets stocks that meet certain investability requirements. The Index includes publicly traded companies with market capitalizations of at least U.S. $1 billion, float-adjusted market cap of U.S. $300 million and three-month average daily value traded above the liquidity threshold of U.S. $1 million as of the rebalancing reference date. Stocks must have a positive, cumulative three-year earnings growth and stocks must be profitable, as measured by positive earnings per share before extraordinary items, over the latest 12-month period as of the rebalancing reference date. |
Top Ten Holdings as of September 30, 2017
| Description |
% of Net Assets |
|||||||||
| PTT PCL NVDR |
3.2 | % | ||||||||
| Gazprom PJSC ADR |
3.1 | |||||||||
| LUKOIL PJSC |
2.6 | |||||||||
| China Overseas Land & Investment, Ltd. |
2.5 | |||||||||
| Siam Cement PCL NVDR |
2.5 | |||||||||
| PTT Global Chemical PCL NVDR |
2.5 | |||||||||
| China Telecom Corp., Ltd. Class H |
2.3 | |||||||||
| China Resources Land, Ltd. |
2.3 | |||||||||
| Telekomunikasi Indonesia Persero Tbk PT |
2.3 | |||||||||
| Taiwan Semiconductor Manufacturing Co., Ltd. ADR |
2.3 | |||||||||
| TOTAL |
25.6 | % | ||||||||
(The ten largest holdings are subject to change, and there are no guarantees the Fund will continue to remain invested in any particular company.)
Sector Breakdown as of September 30, 2017
| % of Net Assets |
||||||||
| Financials |
22.7 | % | ||||||
| Information Technology |
15.6 | |||||||
| Energy |
10.9 | |||||||
| Consumer Staples |
8.1 | |||||||
| Telecommunication Services |
7.9 | |||||||
| Consumer Discretionary |
7.6 | |||||||
| Real Estate |
7.0 | |||||||
| Materials |
6.7 | |||||||
| Utilities |
5.4 | |||||||
| Industrials |
4.6 | |||||||
| Health Care |
3.2 | |||||||
| Short-Term Investments |
3.9 | |||||||
| Liabilities in Excess of Other Assets |
(3.6 | ) | ||||||
| TOTAL |
100.0 | % | ||||||
(The Fund’s sector breakdown is expressed as a percentage of net assets and may change over time.)
The total expense ratio for SPDR S&P Emerging Markets Dividend ETF as stated in the Fees and Expenses table of the prospectus dated January 31, 2017 (as supplemented October 16, 2017) is 0.49%.
Performance quoted represents past performance, which is no guarantee of future results. Investment return and principal value will fluctuate, so you may have a gain or loss when shares are sold. Current performance may be higher or lower than that quoted. Visit www.spdrs.com for most recent month-end performance. The returns do not reflect the deduction of taxes that a shareholder would pay on Fund distributions or on the redemption or sale of Fund shares. See “Note to Performance Summary” on page 1 for more information.
13
Table of Contents
SPDR S&P INTERNATIONAL SMALL CAP ETF —
MANAGEMENT’S DISCUSSION OF FUND PERFORMANCE (UNAUDITED)
The SPDR S&P International Small Cap ETF (the “Fund”) seeks to provide investment results that, before fees and expenses, correspond generally to the total return performance of an index based upon the developed world (ex-US) small cap equity markets. The Fund’s benchmark is the S&P Developed Ex-U.S. under USD2 Billion Index (the “Index”).
For the 12-month period ended September 30, 2017 (the “Reporting Period”), the total return for the Fund was 16.30%, and the Index was 16.95%. The Fund and Index returns reflect the reinvestment of dividends and other income. The Fund’s performance reflects the expenses of managing the Fund, including brokerage and advisory expenses. The Index is unmanaged and Index returns do not reflect fees and expenses of any kind, which would have a negative impact on returns. Fund expenses, transaction costs, cash and receivables drag, compounding, and security misweights contributed to the difference between the Fund’s performance and that of the Index.
The Index lost 2.80% in the final quarter of 2016. As the final quarter of 2016 commenced, October provided investors few places to avoid negative returns as both safe haven investments and riskier growth assets came under pressure during the month. While much of 2016 had been notable for the outperformance of high yielding asset classes that benefitted from further suppression of yields by global central banks, October could be viewed as a cautionary preview of what can happen if the narrative suddenly shifts to one in which monetary policy support begins to be unwound. South Korea was the largest contributor to the Index decline during this period.
The Index gained 7.2% in the first quarter of 2017 as global markets ushered in 2017 on a cautiously positive note in January with new all-time highs established in U.S. equity markets, even as a number of other reflationary market trends paused or reversed. Beyond the better than 6% increase in U.S. equities as measured by the S&P 500 index, the first quarter of 2017 also set an optimistic tone across global regional indices from a U.S. investor perspective, led by gains in South Korea, one of the Index’s largest constituents. The developed Pacific region performed the best aided by a 5% gain in the Japanese Yen that applies to more than half of the Pacific index constituents.
The second and third quarter of 2017 continued to deliver gains for the Index by adding 6.29% and 5.59%, respectively. The uncertainty of the French presidential elections in April caused a significant uptick in global market volatility especially when compared to the historically low levels of volatility observed in the previous quarter of 2017. However, global markets reverted back to lower volatility and the equity markets rallied after the results favored the establishment friendly candidate. Japan continued to be one of the largest gainers in the Pacific due to improving economic backdrop and was one the major contributor to the Index in the second quarter of 2017. The third quarter of 2017 was a continuation of the themes that prevailed in the first half of the year. Global equity markets have had an impressive run heading into the final months of 2017; Notable, in addition to the persistence of this year’s advance, has been the balanced participation across the major developed market global indices. Among developed markets, local returns year-to-date for U.S., Europe and Pacific equities are in a narrow range. For unhedged investors in global equities though, currency has had a material impact on investment outcomes, with the most favorable outcomes to U.S. investors attributable to a 9% decline in the U.S. dollar year-to-date.
The Fund did not invest in derivatives during the Reporting Period.
On an individual security level, the top positive contributors to the Fund’s performance were Interpump Group S.p.A., JENOPTIK AG, and Air Canada. The top negative contributors to the Fund’s performance were Sirtex Medical Limited, Fukuoka Reit Corporation, and Premier Investment Corporation.
The views expressed above reflect those of the Fund’s portfolio manager only through the Reporting Period, and do not necessarily represent the views of the Adviser as a whole. Any such views are subject to change at any time based upon market or other conditions and the Adviser disclaims any responsibility to update such views. These views may not be relied on as investment advice and, because investment decisions for a fund are based on numerous factors, may not be relied on as an indication of trading intent on behalf of any fund.
14
Table of Contents
SPDR S&P INTERNATIONAL SMALL CAP ETF —
PERFORMANCE SUMMARY AND PORTFOLIO STATISTICS (UNAUDITED)
Performance as of September 30, 2017
| Cumulative Total Return | Average Annual Total Return | |||||||||||||||||||||||||||||
| Net Asset Value |
Market Value |
S&P Developed Ex-U.S. Under USD2 Billion Index* |
Net Asset Value |
Market Value |
S&P Developed Ex-U.S. Under USD2 Billion Index* |
|||||||||||||||||||||||||
| ONE YEAR | 16.30% | 16.21% | 16.95% | 16.30% | 16.21% | 16.95% | ||||||||||||||||||||||||
| FIVE YEARS | 61.54% | 63.02% | 61.38% | 10.07% | 10.27% | 10.05% | ||||||||||||||||||||||||
| TEN YEARS | 37.53% | 37.30% | 30.78% | 3.24% | 3.22% | 2.72% | ||||||||||||||||||||||||
Comparison of Change in Value of a $10,000 Investment (Based on Net Asset Value)

Line graph is based on cumulative total return.
| * | The S&P Developed Ex-U.S. Under USD2 Billion Index (the “Index”) is a market capitalization weighted index that defines and measures the investable universe of publicly traded small-cap companies, as defined by the Index, domiciled in developed countries outside the United States. The Index is “float adjusted”, meaning that only those shares publicly available to investors are included in the Index calculation. |
Top Ten Holdings as of September 30, 2017
| Description | % of Net Assets |
|||||||
| Nikkon Holdings Co., Ltd. |
0.4 | % | ||||||
| Wihlborgs Fastigheter AB |
0.4 | |||||||
| Shochiku Co., Ltd. |
0.3 | |||||||
| Toagosei Co., Ltd. |
0.3 | |||||||
| Jenoptik AG |
0.3 | |||||||
| InvoCare, Ltd. |
0.3 | |||||||
| J D Wetherspoon PLC |
0.3 | |||||||
| Valora Holding AG |
0.3 | |||||||
| Indus Holding AG |
0.2 | |||||||
| Road King Infrastructure, Ltd. |
0.2 | |||||||
| TOTAL |
3.0 | % | ||||||
(The ten largest holdings are subject to change, and there are no guarantees the Fund will continue to remain invested in any particular company.)
Sector Breakdown as of September 30, 2017
| % of Net Assets |
||||||||
| Industrials |
20.9 | % | ||||||
| Consumer Discretionary |
18.0 | |||||||
| Information Technology |
11.8 | |||||||
| Materials |
11.0 | |||||||
| Real Estate |
9.7 | |||||||
| Financials |
8.7 | |||||||
| Health Care |
7.4 | |||||||
| Consumer Staples |
5.9 | |||||||
| Energy |
4.2 | |||||||
| Utilities |
1.3 | |||||||
| Telecommunication Services |
0.7 | |||||||
| Short-Term Investments |
7.5 | |||||||
| Liabilities in Excess of Other Assets |
(7.1 | ) | ||||||
| TOTAL |
100.0 | % | ||||||
(The Fund’s sector breakdown is expressed as a percentage of net assets and may change over time.)
The total expense ratio for SPDR S&P International Small Cap ETF as stated in the Fees and Expenses table of the prospectus dated January 31, 2017 (as supplemented October 16, 2017) is 0.40%.
Performance quoted represents past performance, which is no guarantee of future results. Investment return and principal value will fluctuate, so you may have a gain or loss when shares are sold. Current performance may be higher or lower than that quoted. Visit www.spdrs.com for most recent month-end performance. The returns do not reflect the deduction of taxes that a shareholder would pay on Fund distributions or on the redemption or sale of Fund shares. See “Note to Performance Summary” on page 1 for more information.
15
Table of Contents
SPDR S&P GLOBAL INFRASTRUCTURE ETF —
MANAGEMENT’S DISCUSSION OF FUND PERFORMANCE (UNAUDITED)
The SPDR S&P Global Infrastructure ETF (the “Fund”) seeks to provide investment results that, before fees and expenses, correspond generally to the total return performance of an index based upon the global infrastructure industry market. The Fund’s benchmark is S&P Global Infrastructure Index (the “Index”).
For the 12-month period ended September 30, 2017 (the “Reporting Period”), the total return for the Fund’s was 12.35%, and the Index was 12.16%. The Fund and Index returns reflect the reinvestment of dividends and other income. The Fund’s performance reflects the expenses of managing the Fund, including brokerage and advisory expenses. The Index is unmanaged and Index returns do not reflect fees and expenses of any kind, which would have a negative impact on returns. Fund expenses, cash drag, small security misweights, securities lending, compounding and dividend tax withholding differences contributed to the difference between the Fund’s performance and that of the Index.
It is said that the return performance of an Infrastructure index tends to track the broader economic environment. While the Infrastructure index trended in the same direction as the broader global economic indices, it modestly lagged those benchmarks during the reporting period. All three sectors within the index; Energy, Industrials and Utilities posted a positive contribution during the 12 month Reporting Period. While positive over the Reporting Period, the Energy sector contributed the least of the three major components within the Infrastructure index. The Primary cause for this lackluster performance has been the oversupplied nature of the world oil markets along with production exceeding demand. Improving on the Energy component, the Utilities portion of this Index was the second best contributor during the period. Utility stocks are sensitive to interest rate shifts given their high yields relative to the market place. While mergers and acquisitions in this space along with deregulation helped propel the performance of its constituents, three increases in the Federal Funds rate and the expectations of more rate increases in the near term have kept the rising performance in check. Finally, the Industrial sector was the best performing component of this Index over the Reporting Period. In particular, the Transportation Infrastructure portion of this Index had the largest contribution to outperformance. Airline stocks had a solid performance over the last year as energy prices have stabilized a bit and growing airline travel demand worldwide continued to increase. Road and railroad traffic increased as well which helped Rail and Logistics companies perform strongly.
The Fund did not invest in derivatives during the Reporting Period.
On an individual security level, the top positive contributors to the Fund’s performance were Atlantia S.p.A, Abertis Infraestructuras SA, and Aena SME SA. The top negative contributors to the Fund’s performance were Auckland International Airport Limited, National Grid plc, and Kinder Morgan Inc Class P.
The views expressed above reflect those of the Fund’s portfolio manager only through the Reporting Period, and do not necessarily represent the views of the Adviser as a whole. Any such views are subject to change at any time based upon market or other conditions and the Adviser disclaims any responsibility to update such views. These views may not be relied on as investment advice and, because investment decisions for a fund are based on numerous factors, may not be relied on as an indication of trading intent on behalf of any fund.
16
Table of Contents
SPDR S&P GLOBAL INFRASTRUCTURE ETF —
PERFORMANCE SUMMARY AND PORTFOLIO STATISTICS (UNAUDITED)
Performance as of September 30, 2017
| Cumulative Total Return | Average Annual Total Return | |||||||||||||||||||||||||||||
| Net Asset Value |
Market Value |
S&P Global Infrastructure Index* |
Net Asset Value |
Market Value |
S&P Global Infrastructure Index* |
|||||||||||||||||||||||||
| ONE YEAR | 12.35% | 12.06% | 12.16% | 12.35% | 12.06% | 12.16% | ||||||||||||||||||||||||
| FIVE YEARS (1) | 51.53% | 51.77% | 49.93% | 8.67% | 8.70% | 8.44% | ||||||||||||||||||||||||
| TEN YEARS (1) | 29.62% | 29.69% | 30.70% | 2.63% | 2.63% | 2.71% | ||||||||||||||||||||||||
Comparison of Change in Value of a $10,000 Investment (Based on Net Asset Value)
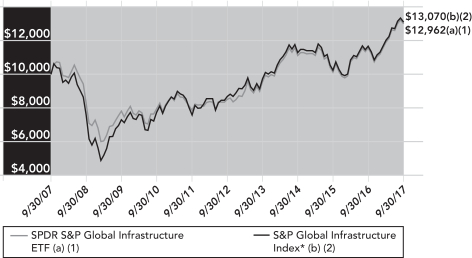
Line graph is based on cumulative total return.
| (1) | Effective May 1, 2013, the Fund changed its benchmark index from the Macquarie Global Infrastructure 100 Index to the S&P Global Infrastructure Index. The Fund’s performance in the table above is based on the Fund’s prior investment strategy to track a different benchmark index for periods prior to May 1, 2013. |
| (2) | Index returns represent the Fund’s prior investment strategy from September 30, 2007 through April 30, 2013 and the S&P Global Infrastructure Index from May 1, 2013 through September 30, 2017. |
| * | The S&P Global Infrastructure Index (the “Index”) is comprised of 75 of the largest publicly listed infrastructure companies that meet specific investability requirements. The Index is designed to provide liquid exposure to the leading publicly listed companies in the global infrastructure industry, from both developed markets and emerging markets. |
Top Ten Holdings as of September 30, 2017
| Description | % of Net Assets |
|||||||
| Enbridge, Inc. |
5.0 | % | ||||||
| Transurban Group Stapled Security |
4.9 | |||||||
| Abertis Infraestructuras SA |
4.5 | |||||||
| Atlantia SpA |
4.4 | |||||||
| Aena SME SA |
4.0 | |||||||
| NextEra Energy, Inc. |
3.3 | |||||||
| TransCanada Corp. |
3.1 | |||||||
| Duke Energy Corp. |
2.9 | |||||||
| Kinder Morgan, Inc. |
2.7 | |||||||
| Dominion Energy, Inc. |
2.4 | |||||||
| TOTAL |
37.2 | % | ||||||
(The ten largest holdings are subject to change, and there are no guarantees the Fund will continue to remain invested in any particular company.)
Industry Breakdown as of September 30, 2017
| Industry | % of Net Assets |
|||||||
| Transportation Infrastructure |
39.5 | % | ||||||
| Electric Utilities |
25.9 | |||||||
| Oil, Gas & Consumable Fuels |
18.8 | |||||||
| Multi-Utilities |
12.8 | |||||||
| Gas Utilities |
2.3 | |||||||
| Water Utilities |
0.4 | |||||||
| Short-Term Investments |
4.1 | |||||||
| Liabilities in Excess of Other Assets |
(3.8 | ) | ||||||
| TOTAL |
100.0 | % | ||||||
(The Fund’s industry breakdown is expressed as a percentage of net assets and may change over time.)
The total expense ratio for SPDR S&P Global Infrastructure ETF as stated in the Fees and Expenses table of the prospectus dated January 31, 2017 (as supplemented October 16, 2017) is 0.40%.
Performance quoted represents past performance, which is no guarantee of future results. Investment return and principal value will fluctuate, so you may have a gain or loss when shares are sold. Current performance may be higher or lower than that quoted. Visit www.spdrs.com for most recent month-end performance. The returns do not reflect the deduction of taxes that a shareholder would pay on Fund distributions or on the redemption or sale of Fund shares. See “Note to Performance Summary” on page 1 for more information.
17
Table of Contents
SPDR S&P GLOBAL NATURAL RESOURCES ETF —
MANAGEMENT’S DISCUSSION OF FUND PERFORMANCE (UNAUDITED)
The SPDR S&P Global Natural Resources ETF (the “Fund”) seeks to provide investment results that, before fees and expenses, correspond generally to the total return performance of an index that tracks publicly traded companies in natural resources and/or commodities businesses. The Fund’s benchmark is the S&P Global Natural Resources Index (the “Index”).
For the 12-month period ended September 30, 2017 (the “Reporting Period”), the total return for the Fund was 19.95%, and the Index was 19.85%. The Fund and Index returns reflect the reinvestment of dividends and other income. The Fund’s performance reflects the expenses of managing the Fund, including brokerage and advisory expenses. The Index is unmanaged and Index returns do not reflect fees and expenses of any kind, which would have a negative impact on returns. Cumulative security misweights and fund expenses contributed to the difference between the Fund’s performance and that of the Index.
Global economic strength, demand for raw materials and stabilized oil prices were primary drivers of Fund performance relative to the year. The Fund had positive performance for three of the four quarters this year. In the first half of the Reporting Period, performance was helped by an agreement between OPEC and Russia to cut oil production and strong macroeconomic data despite some geopolitical concerns and the surprise election results in the United States. A healthy global economy also led to increased and ongoing demand for raw materials like cobalt, copper and nickel which are key ingredients for electric cars and many other battery-powered devices. Performance in the third quarter of the reporting period was negative due to geopolitical tensions in Syria and North Korea and falling oil prices. The Fund’s performance in the fourth quarter of the Reporting Period was positive due to oil prices rebounding from the prior quarter, continued strong demand for raw materials, healthy economic data and despite continuing geopolitical risks (North Korean missile tests, U.S.-Russian tensions and personnel turnover in the White House.) Fund performance was also helped by companies’ ongoing efforts to align expenses and capital expenditures with commodity prices.
The Fund did not invest in derivatives during the Reporting Period.
On an individual security level, the top positive contributors to the Fund’s performance were Glencore plc, BHP Billiton Limited, Royal Dutch Shell Plc Class B. The top negative contributors to the Fund’s performance were Barrick Gold Corporation, Goldcorp Inc., and Silver Wheaton Corp.
The views expressed above reflect those of the Fund’s portfolio manager only through the Reporting Period, and do not necessarily represent the views of the Adviser as a whole. Any such views are subject to change at any time based upon market or other conditions and the Adviser disclaims any responsibility to update such views. These views may not be relied on as investment advice and, because investment decisions for a fund are based on numerous factors, may not be relied on as an indication of trading intent on behalf of any fund.
18
Table of Contents
SPDR S&P GLOBAL NATURAL RESOURCES ETF —
PERFORMANCE SUMMARY AND PORTFOLIO STATISTICS (UNAUDITED)
Performance as of September 30, 2017
| Cumulative Total Return | Average Annual Total Return | |||||||||||||||||||||||||||||
| Net Asset Value |
Market Value |
S&P Global Natural Resources Index* |
Net Asset Value |
Market Value |
S&P Global Natural Resources Index* |
|||||||||||||||||||||||||
| ONE YEAR | 19.95% | 20.02% | 19.85% | 19.95% | 20.02% | 19.85% | ||||||||||||||||||||||||
| FIVE YEARS | 2.82% | 3.27% | 2.55% | 0.56% | 0.65% | 0.50% | ||||||||||||||||||||||||
| SINCE INCEPTION (1) | 7.92% | 8.19% | 7.97% | 1.09% | 1.12% | 1.09% | ||||||||||||||||||||||||
| (1) | For the period September 13, 2010 to September 30, 2017. Since shares of the Fund did not trade in the secondary market until the day after the Fund’s inception, for the period from inception to the first day of secondary market trading in shares of the Fund (9/13/10, 9/14/10, respectively), the NAV of the Fund is used as a proxy for the secondary market trading price to calculate market returns. |
Comparison of Change in Value of a $10,000 Investment (Based on Net Asset Value)
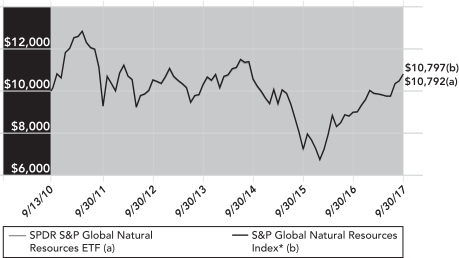
Line graph is based on cumulative total return.
| * | The S&P Global Natural Resources Index (the “Index”) is comprised of 90 of the largest U.S. and foreign publicly traded companies, based on market capitalization, in natural resources and commodities businesses (as defined below) that meet certain investability requirements. The Index component securities represent a combination of the component securities included in each of the following three sub-indices: the S&P Global Natural Resources-Agriculture Index, the S&P Global Natural Resources-Energy Index and the S&P Global Natural Resources-Metals and Mining Index. The maximum weight of each sub-index is capped at one-third of the total weight of the Index. |
Top Ten Holdings as of September 30, 2017
| Description | % of Net Assets |
|||||||||
| Exxon Mobil Corp. |
4.7 | % | ||||||||
| BHP Billiton, Ltd. |
4.2 | |||||||||
| Royal Dutch Shell PLC Class A |
4.0 | |||||||||
| TOTAL SA |
4.0 | |||||||||
| BP PLC |
3.6 | |||||||||
| Glencore PLC |
3.6 | |||||||||
| Monsanto Co. |
3.2 | |||||||||
| Chevron Corp. |
3.0 | |||||||||
| Potash Corp. of Saskatchewan, Inc. |
2.5 | |||||||||
| Agrium, Inc. |
2.3 | |||||||||
| TOTAL |
35.1 | % | ||||||||
(The ten largest holdings are subject to change, and there are no guarantees the Fund will continue to remain invested in any particular company.)
Industry Breakdown as of September 30, 2017
| Industry | % of Net Assets |
|||||||
| Oil, Gas & Consumable Fuels |
32.7 | % | ||||||
| Metals & Mining |
31.6 | |||||||
| Chemicals |
11.9 | |||||||
| Containers & Packaging |
8.3 | |||||||
| Paper & Forest Products |
6.9 | |||||||
| Food Products |
4.2 | |||||||
| Energy Equipment & Services |
2.1 | |||||||
| Real Estate Investment Trusts (REITs) |
1.8 | |||||||
| Short-Term Investments |
2.3 | |||||||
| Liabilities in Excess of Other Assets |
(1.8 | ) | ||||||
| TOTAL |
100.0 | % | ||||||
(The Fund’s industry breakdown is expressed as a percentage of net assets and may change over time.)
The total expense ratio for SPDR S&P Global Natural Resources ETF as stated in the Fees and Expenses table of the prospectus dated January 31, 2017 (as supplemented October 16, 2017) is 0.40%.
Performance quoted represents past performance, which is no guarantee of future results. Investment return and principal value will fluctuate, so you may have a gain or loss when shares are sold. Current performance may be higher or lower than that quoted. Visit www.spdrs.com for most recent month-end performance. The returns do not reflect the deduction of taxes that a shareholder would pay on Fund distributions or on the redemption or sale of Fund shares. See “Note to Performance Summary” on page 1 for more information.
19
Table of Contents
MANAGEMENT’S DISCUSSION OF FUND PERFORMANCE (UNAUDITED)
The SPDR MSCI ACWI IMI ETF (the “Fund”) seeks to provide investment results that, before fees and expenses, correspond generally to the total return performance of an index that tracks securities of publicly traded companies in developed and emerging markets. The Fund’s benchmark is the MSCI ACWI IMI Index (the “Index”).
For the 12-month period ended September 30, 2017 (the “Reporting Period”), the total return for the Fund was 18.58%, and the Index was 18.73%. The Fund and Index returns reflect the reinvestment of dividends and other income. The Fund’s performance reflects the expenses of managing the Fund, including brokerage and advisory expenses. The Index is unmanaged and Index returns do not reflect fees and expenses of any kind, which would have a negative impact on returns. Dividend tax withholding differences, fund expenses, a slight cash drag, and optimization contributed to the difference between the Fund’s performance and that of the Index.
The Fund started the Reporting Period with lackluster performance as one of the most identifiable causes for the angst across asset classes was a sharp rise in global sovereign bond yields coincided with a paring back of expectations for future global central bank policy support. Despite geopolitical concerns worldwide, in 2017 the MSCI ACWI ex-US IMI index went on to post double digit gains for the Reporting Period. The first quarter of 2017 witnessed an optimistic tone in all regional indices globally, largely on the back of growth expectations. In addition to an improving economic backdrop, European shares in the Fund benefitted from an easing of political uncertainty with the defeat of populist candidates in the Netherlands in February and in presidential polls in France that spanned April and May. The third quarter of 2017 also saw a positive performance for the Fund as markets continued to rally on back of strong retail sales and improved macroeconomic and manufacturing data.
For the reporting period the emerging markets had outperformed developed markets by over 3% mainly due to strong earnings in the emerging Asian countries and weakening of the U.S. Dollar. Main positive contributors to the fund’s performance were United States, Japan and France.
The Fund did not invest in derivatives during the Reporting Period.
On an individual security level, the top positive contributors to the Fund’s performance were Apple Inc., Baozun Inc Sponsored ADR Class A, and Microsoft Corporation. The top negative contributors to the Fund’s performance were QUALCOMM Incorporated, Mattel, Inc., and General Electric Company.
The views expressed above reflect those of the Fund’s portfolio manager only through the Reporting Period, and do not necessarily represent the views of the Adviser as a whole. Any such views are subject to change at any time based upon market or other conditions and the Adviser disclaims any responsibility to update such views. These views may not be relied on as investment advice and, because investment decisions for a fund are based on numerous factors, may not be relied on as an indication of trading intent on behalf of any fund.
20
Table of Contents
SPDR MSCI ACWI IMI ETF —
PERFORMANCE SUMMARY AND PORTFOLIO STATISTICS (UNAUDITED)
Performance as of September 30, 2017
| Cumulative Total Return | Average Annual Total Return | |||||||||||||||||||||||||||||
| Net Asset Value |
Market Value |
MSCI ACWI IMI Index* |
Net Asset Value |
Market Value |
MSCI ACWI IMI Index* |
|||||||||||||||||||||||||
| ONE YEAR | 18.58% | 17.79% | 18.73% | 18.58% | 17.79% | 18.73% | ||||||||||||||||||||||||
| FIVE YEARS | 68.74% | 69.39% | 64.19% | 11.03% | 11.12% | 10.43% | ||||||||||||||||||||||||
| SINCE INCEPTION (1) | 70.89% | 70.97% | 66.95% | 10.05% | 10.06% | 9.60% | ||||||||||||||||||||||||
| (1) | For the period February 27, 2012 to September 30, 2017. Since shares of the Fund did not trade in the secondary market until the day after the Fund’s inception, for the period from inception to the first day of secondary market trading in shares of the Fund (2/27/12, 2/28/12, respectively), the NAV of the Fund is used as a proxy for the secondary market trading price to calculate market returns. |
Comparison of Change in Value of a $10,000 Investment (Based on Net Asset Value)

Line graph is based on cumulative total return.
| * | The MSCI ACWI IMI Index (the “Index”) is a free float-adjusted market capitalization-weighted index that is designed to measure the combined equity market performance of developed and emerging markets. The Index covers approximately 99% of the global equity investment opportunity set. |
Top Ten Holdings as of September 30, 2017
| Description | % of Net Assets |
|||||||
| Apple, Inc. |
1.5 | % | ||||||
| Microsoft Corp. |
1.1 | |||||||
| Amazon.com, Inc. |
0.9 | |||||||
| JPMorgan Chase & Co. |
0.8 | |||||||
| Alphabet, Inc. Class A |
0.7 | |||||||
| Alphabet, Inc. Class C |
0.6 | |||||||
| Facebook, Inc. Class A |
0.6 | |||||||
| Wells Fargo & Co. |
0.6 | |||||||
| Exxon Mobil Corp. |
0.6 | |||||||
| Bank of America Corp. |
0.6 | |||||||
| TOTAL |
8.0 | % | ||||||
(The ten largest holdings are subject to change, and there are no guarantees the Fund will continue to remain invested in any particular company.)
Sector Breakdown as of September 30, 2017
| % of Net Assets |
||||||||
| Financials |
17.6 | % | ||||||
| Information Technology |
17.5 | |||||||
| Industrials |
13.8 | |||||||
| Health Care |
11.2 | |||||||
| Consumer Discretionary |
11.0 | |||||||
| Consumer Staples |
7.8 | |||||||
| Energy |
6.5 | |||||||
| Materials |
5.3 | |||||||
| Real Estate |
3.9 | |||||||
| Telecommunication Services |
2.9 | |||||||
| Utilities |
2.2 | |||||||
| Short-Term Investments |
1.2 | |||||||
| Liabilities in Excess of Other Assets |
(0.9 | ) | ||||||
| TOTAL |
100.0 | % | ||||||
(The Fund’s sector breakdown is expressed as a percentage of net assets and may change over time.)
The total expense ratio for SPDR MSCI ACWI IMI ETF as stated in the Fees and Expenses table of the prospectus dated January 31, 2017 (as supplemented October 16, 2017) is 0.25%.
Performance quoted represents past performance, which is no guarantee of future results. Investment return and principal value will fluctuate, so you may have a gain or loss when shares are sold. Current performance may be higher or lower than that quoted. Visit www.spdrs.com for most recent month-end performance. The returns do not reflect the deduction of taxes that a shareholder would pay on Fund distributions or on the redemption or sale of Fund shares. See “Note to Performance Summary” on page 1 for more information.
21
Table of Contents
SPDR MSCI ACWI LOW CARBON TARGET ETF —
MANAGEMENT’S DISCUSSION OF FUND PERFORMANCE (UNAUDITED)
The SPDR MSCI ACWI Low Carbon Target ETF (the “Fund”) seeks to provide investment results that, before fees and expenses, correspond generally to the total return performance of an index that tracks securities of publicly traded companies in developed and emerging markets while seeking to minimize carbon exposure. The Fund’s benchmark is the MSCI ACWI Low Carbon Target Index (the “Index”).
For the 12-month period ended September 30, 2017 (the “Reporting Period”), the total return for the Fund was 18.16%, and the Index was 17.95%. The Fund and Index returns reflect the reinvestment of dividends and other income. The Fund’s performance reflects the expenses of managing the Fund, including brokerage and advisory expenses. The Index is unmanaged and Index returns do not reflect fees and expenses of any kind, which would have a negative impact on returns. Fees and expenses, cash drag and cumulative effect of security misweights contributed to the difference between the Fund’s performance and that of the Index.
The last quarter of 2016 ended on a cautious note for the Fund as global markets staggered after the echoes of Brexit and there were unexpected challenges to the established political order in U.S. Global markets ushered in the first quarter of 2017 on a positive note as the reflation theme played forward and global industrial production growth witnessed a notable acceleration. The second quarter of 2017 provided favorable payoffs to investors positioned in the Fund as positive returns were realized from a range of continuing global economic and earnings growth. The last quarter of 2017 witnessed a continuation of the rally for the Fund, largely on the account of strong Chinese, UK and US manufacturing data.
The Fund did not invest in derivatives during the Reporting Period.
On an individual security level, the top positive contributors to the Fund’s performance were Apple Inc., Microsoft Corporation, and JPMorgan Chase & Co. The top negative contributors to the Fund’s performance were QUALCOMM Incorporated, Teva Pharmaceutical Industries Limited, and General Electric Company.
The views expressed above reflect those of the Fund’s portfolio manager only through the Reporting Period, and do not necessarily represent the views of the Adviser as a whole. Any such views are subject to change at any time based upon market or other conditions and the Adviser disclaims any responsibility to update such views. These views may not be relied on as investment advice and, because investment decisions for a fund are based on numerous factors, may not be relied on as an indication of trading intent on behalf of any fund.
22
Table of Contents
SPDR MSCI ACWI LOW CARBON TARGET ETF —
PERFORMANCE SUMMARY AND PORTFOLIO STATISTICS (UNAUDITED)
Performance as of September 30, 2017
| Cumulative Total Return | Average Annual Total Return | |||||||||||||||||||||||||||||
| Net Asset Value |
Market Value |
MSCI ACWI Low Carbon Target Index* |
Net Asset Value |
Market Value |
MSCI ACWI Low Carbon Target Index* |
|||||||||||||||||||||||||
| ONE YEAR | 18.16% | 18.02% | 17.95% | 18.16% | 18.02% | 17.95% | ||||||||||||||||||||||||
| SINCE INCEPTION (1) | 21.66% | 22.02% | 20.78% | 7.12% | 7.23% | 6.86% | ||||||||||||||||||||||||
| (1) | For the period November 25, 2014 to September 30, 2017. Since shares of the Fund did not trade in the secondary market until the day after the Fund’s inception, for the period from inception to the first day of secondary market trading in shares of the Fund (11/25/14, 11/26/14, respectively), the NAV of the Fund is used as a proxy for the secondary market trading price to calculate market returns. |
Comparison of Change in Value of a $10,000 Investment (Based on Net Asset Value)

Line graph is based on cumulative total return.
| * | The MSCI ACWI Low Carbon Target Index (the “Index”) is designed to address two dimensions of carbon exposure — carbon emissions and fossil fuel reserves. By overweighting companies with low carbon emissions relative to sales and per dollar of market capitalization, the Index aims to reflect a lower carbon exposure than that of the broad market. The Index is designed to achieve a target level of tracking relative to a broad market index (such as the Parent Index) while minimizing the carbon exposure. The Index is a subset of the MSCI ACWI Index (the Parent Index), which measures the combined equity market performance of developed and emerging market countries. |
Top Ten Holdings as of September 30, 2017
| Description | % of Net Assets |
|||||||
| Apple, Inc. |
1.9 | % | ||||||
| Microsoft Corp. |
1.3 | |||||||
| Facebook, Inc. Class A |
0.9 | |||||||
| Amazon.com, Inc. |
0.9 | |||||||
| JPMorgan Chase & Co. |
0.9 | |||||||
| Johnson & Johnson |
0.8 | |||||||
| Alphabet, Inc. Class C |
0.8 | |||||||
| Wells Fargo & Co. |
0.6 | |||||||
| Bank of America Corp. |
0.6 | |||||||
| Alphabet, Inc. Class A |
0.6 | |||||||
| TOTAL |
9.3 | % | ||||||
(The ten largest holdings are subject to change, and there are no guarantees the Fund will continue to remain invested in any particular company.)
Sector Breakdown as of September 30, 2017
| % of Net Assets |
||||||||
| Financials |
20.0 | % | ||||||
| Information Technology |
17.5 | |||||||
| Industrials |
12.3 | |||||||
| Consumer Discretionary |
11.9 | |||||||
| Health Care |
11.2 | |||||||
| Consumer Staples |
9.0 | |||||||
| Energy |
5.2 | |||||||
| Materials |
3.8 | |||||||
| Real Estate |
3.2 | |||||||
| Telecommunication Services |
3.0 | |||||||
| Utilities |
2.4 | |||||||
| Short-Term Investments |
0.4 | |||||||
| Other Assets in Excess of Liabilities |
0.1 | |||||||
| TOTAL |
100.0 | % | ||||||
(The Fund’s sector breakdown is expressed as a percentage of net assets and may change over time.)
The total expense ratio for SPDR MSCI ACWI Low Carbon Target ETF as stated in the Fees and Expenses table of the prospectus dated January 31, 2017 (as supplemented October 16, 2017) is 0.30% (0.20% after fee waiver). SSGA Funds Management, Inc. has contractually agreed to waive its management fee and reimburse certain expenses, until January 31, 2018, so that the net annual Fund operating expenses of the Fund will be limited to 0.20%.
Performance quoted represents past performance, which is no guarantee of future results. Investment return and principal value will fluctuate, so you may have a gain or loss when shares are sold. Current performance may be higher or lower than that quoted. Visit www.spdrs.com for most recent month-end performance. The returns do not reflect the deduction of taxes that a shareholder would pay on Fund distributions or on the redemption or sale of Fund shares. See “Note to Performance Summary” on page 1 for more information.
23
Table of Contents
SPDR MSCI EAFE FOSSIL FUEL RESERVES FREE ETF —
MANAGEMENT’S DISCUSSION OF FUND PERFORMANCE (UNAUDITED)
The SPDR MSCI EAFE Fossil Fuel Reserves Free ETF (the “Fund”) seeks to provide investment results that, before fees and expenses, correspond generally to the total return performance of the MSCI EAFE ex Fossil Fuels Index. The Fund’s benchmark is the MSCI EAFE ex Fossil Fuels Index (the “Index”).
For the period from October 24, 2016 (inception) through September 30, 2017 (the “Reporting Period”), the total return for the Fund was 20.89%, and the Index was 20.71%. The Fund and Index returns reflect the reinvestment of dividends and other income. The Fund’s performance reflects the expenses of managing the Fund, including brokerage and advisory expenses. The Index is unmanaged and Index returns do not reflect fees and expenses of any kind, which would have a negative impact on returns. Tax withholdings and the cumulative effect of security misweights contributed to the difference between the Fund’s performance and that of the Index.
In November 2016, while U.S. markets reacted positively to the surprise election of President Trump, global developed markets held steady until they too began their slow and steady rise in the weeks that followed. The performance of the Fund continued fairly consistently throughout the Reporting Period, rising slowly and surely in the face of economic and political news which was generally positive although somewhat volatile. While the European Central Bank, the Bank of Japan and the Bank of England all kept rates steady throughout the Reporting Period, the U.S. Federal Reserve Bank increased rates by a quarter point in each of December 2016, March 2017, and June 2017. In general, global markets were unphased by each of these announcements, pausing only briefly before continuing their steady rise. The Fund’s return was also enhanced by the weakening of the U.S. dollar during the Reporting Period, which was in slight decline after the record strength of the past several years.
The Fund’s exclusion of fossil fuel-based companies had a slightly negative effect on performance compared to the MSCI EAFE Index. Although the price of oil did exhibit some volatility, it held generally steady during the Reporting Period, and the performance of fossil fuel-based companies did not dramatically diverge from the broader markets. However, the Fund did not benefit from the higher dividend yield of fossil fuel-based companies, which ultimately detracted from relative performance.
The Fund did not invest in derivatives during the Reporting Period.
On an individual security level, the top positive contributors to the Fund’s performance were HSBC Holdings plc, Banco Santander S.A., and Allianz SE. The top negative contributors to the Fund’s performance were Anheuser-Busch InBev SA/NV, Shire PLC, and Teva Pharmaceutical Industries Limited.
The views expressed above reflect those of the Fund’s portfolio manager only through the Reporting Period, and do not necessarily represent the views of the Adviser as a whole. Any such views are subject to change at any time based upon market or other conditions and the Adviser disclaims any responsibility to update such views. These views may not be relied on as investment advice and, because investment decisions for a fund are based on numerous factors, may not be relied on as an indication of trading intent on behalf of any fund.
24
Table of Contents
SPDR MSCI EAFE FOSSIL FUEL RESERVES FREE ETF —
PERFORMANCE SUMMARY AND PORTFOLIO STATISTICS (UNAUDITED)
Performance as of September 30, 2017
| Cumulative Total Return | Average Annual Total Return | |||||||||||||||||||||||||||||
| Net Asset Value |
Market Value |
MSCI EAFE ex Fossil Fuels Index* |
Net Asset Value |
Market Value |
MSCI EAFE ex Fossil Fuels Index* |
|||||||||||||||||||||||||
| SINCE INCEPTION (1) | 20.89% | N/A | 20.71% | N/A | N/A | N/A | ||||||||||||||||||||||||
| (1) | For the period October 24, 2016 to September 30, 2017. Since shares of the Fund did not trade in the secondary market until the day after the Fund’s inception, for the period from inception to the first day of secondary market trading in shares of the Fund (10/24/16, 10/25/16, respectively), the NAV of the Fund is used as a proxy for the secondary market trading price to calculate market returns. |
Comparison of Change in Value of a $10,000 Investment (Based on Net Asset Value)
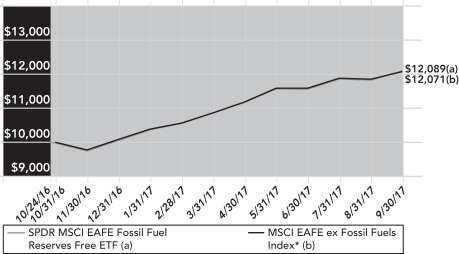
Line graph is based on cumulative total return.
| * | The MSCI EAFE ex Fossil Fuels Index (the “Index”) is designed to measure the performance of companies in the MSCI EAFE Index that are “fossil fuel reserves free,” which are defined as companies that do not own fossil fuel reserves. For purposes of the composition of the Index, fossil fuel reserves are defined as proved and probable coal, oil or natural gas reserves used for energy purposes, but do not include metallurgical or coking coal, which is primarily used in connection with steel production. The Index is a subset of the MSCI EAFE Index (the “Parent Index”), which serves as the initial universe of eligible securities for the Index. The Parent Index captures large and mid-capitalization representation across developed market Europe, Australasia, and Far East countries, excluding the United States and Canada. |
Top Ten Holdings as of September 30, 2017
| Description | % of Net Assets |
|||||||
| Nestle SA |
2.0 | % | ||||||
| HSBC Holdings PLC |
1.5 | |||||||
| Novartis AG |
1.4 | |||||||
| Roche Holding AG |
1.3 | |||||||
| Toyota Motor Corp. |
1.2 | |||||||
| British American Tobacco PLC |
1.1 | |||||||
| Bayer AG |
0.8 | |||||||
| Sanofi |
0.8 | |||||||
| Banco Santander SA |
0.8 | |||||||
| SAP SE |
0.8 | |||||||
| TOTAL |
11.7 | % | ||||||
(The ten largest holdings are subject to change, and there are no guarantees the Fund will continue to remain invested in any particular company.)
Sector Breakdown as of September 30, 2017
| % of Net Assets |
||||||||
| Financials |
23.2 | % | ||||||
| Industrials |
15.6 | |||||||
| Consumer Discretionary |
13.3 | |||||||
| Consumer Staples |
12.0 | |||||||
| Health Care |
11.5 | |||||||
| Information Technology |
6.6 | |||||||
| Materials |
6.4 | |||||||
| Telecommunication Services |
4.4 | |||||||
| Real Estate |
3.8 | |||||||
| Utilities |
2.3 | |||||||
| Energy |
0.3 | |||||||
| Short-Term Investments |
0.7 | |||||||
| Liabilities in Excess of Other Assets |
(0.1 | ) | ||||||
| TOTAL |
100.0 | % | ||||||
(The Fund’s sector breakdown is expressed as a percentage of net assets and may change over time.)
The total expense ratio for SPDR MSCI EAFE Fossil Fuel Reserves Free ETF as stated in the Fees and Expenses table of the prospectus dated January 31, 2017 (as supplemented October 16, 2017) is 0.30% (0.20% after fee waiver). SSGA Funds Management, Inc. has contractually agreed to waive its management fee and reimburse certain expenses, until January 31, 2018, so that the net annual Fund operating expenses of the Fund will be limited to 0.20%.
Performance quoted represents past performance, which is no guarantee of future results. Investment return and principal value will fluctuate, so you may have a gain or loss when shares are sold. Current performance may be higher or lower than that quoted. Visit www.spdrs.com for most recent month-end performance. The returns do not reflect the deduction of taxes that a shareholder would pay on Fund distributions or on the redemption or sale of Fund shares. See “Note to Performance Summary” on page 1 for more information.
25
Table of Contents
SPDR MSCI EMERGING MARKETS FOSSIL FUEL RESERVES FREE ETF —
MANAGEMENT’S DISCUSSION OF FUND PERFORMANCE (UNAUDITED)
The SPDR MSCI Emerging Markets Fossil Fuel Reserves Free ETF (the “Fund”) seeks to provide investment results that, before fees and expenses, correspond generally to the total return performance of the MSCI Emerging Markets ex Fossil Fuels Index. The Fund’s benchmark is the MSCI Emerging Markets ex Fossil Fuels Index (the “Index”).
For the period from October 24, 2016 (inception) through September 30, 2017 (the “Reporting Period”), the total return for the Fund was 21.02%, and the Index was 21.02%. The Fund and Index returns reflect the reinvestment of dividends and other income. The Fund’s performance reflects the expenses of managing the Fund, including brokerage and advisory expenses. The Index is unmanaged and Index returns do not reflect fees and expenses of any kind, which would have a negative impact on returns.
The Fund enjoyed positive performance during each quarter of the period thanks to very strong performance in both China and Korea, the top weighted countries in the Fund. Despite increased threats from North Korea advancing nuclear weapon production, overall geopolitical tension continued to ease. In addition, favorable GDP growth for the Chinese economy has boosted continued success for the country, as well as many other emerging markets. Additionally, these markets have been helped by a slow moving Federal Reserve, especially those that have borrowed heavily in U.S. dollars. Finally, many of the emerging market countries have been positively impacted by stabilizing commodity prices.
The Fund’s exclusion of fossil fuel-based companies had a slightly negative effect on performance compared to the MSCI Emerging Markets Index. Although the price of oil did exhibit some volatility, it held generally steady during the Fiscal Year, and the performance of fossil fuel-based companies did not dramatically diverge from the broader markets. However, the Fund did not benefit from the higher dividend yield of fossil fuel-based companies, which ultimately detracted from relative performance.
On an individual security level, the top positive contributors to the Fund’s performance were Samsung Electronics Co., Ltd., Tencent Holdings Ltd., and Alibaba Group Holding Ltd. Sponsored ADR. The top negative contributors to the Fund’s performance were NAVER Corp., Amorepacific Corp., and China Mobile Limited.
The views expressed above reflect those of the Fund’s portfolio manager only through the Reporting Period, and do not necessarily represent the views of the Adviser as a whole. Any such views are subject to change at any time based upon market or other conditions and the Adviser disclaims any responsibility to update such views. These views may not be relied on as investment advice and, because investment decisions for a fund are based on numerous factors, may not be relied on as an indication of trading intent on behalf of any fund.
26
Table of Contents
SPDR MSCI EMERGING MARKETS FOSSIL FUEL RESERVES FREE ETF —
PERFORMANCE SUMMARY AND PORTFOLIO STATISTICS (UNAUDITED)
Performance as of September 30, 2017
| Cumulative Total Return | Average Annual Total Return | |||||||||||||||||||||||||||||
| Net Asset Value |
Market Value |
MSCI Emerging Markets ex Fossil Fuels Index* |
Net Asset Value |
Market Value |
MSCI Emerging Markets ex Fossil Fuels Index* |
|||||||||||||||||||||||||
| SINCE INCEPTION (1) | 21.02% | N/A | 21.02% | N/A | N/A | N/A | ||||||||||||||||||||||||
| (1) | For the period October 24, 2016 to September 30, 2017. Since shares of the Fund did not trade in the secondary market until the day after the Fund’s inception, for the period from inception to the first day of secondary market trading in shares of the Fund (10/24/16, 10/25/16, respectively), the NAV of the Fund is used as a proxy for the secondary market trading price to calculate market returns. |
Comparison of Change in Value of a $10,000 Investment (Based on Net Asset Value)
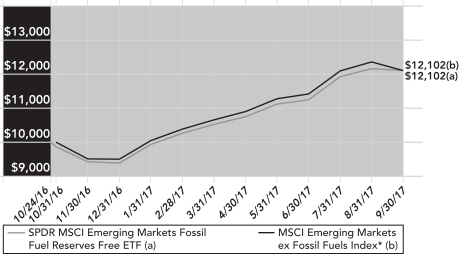
Line graph is based on cumulative total return.
| * | The MSCI Emerging Markets ex Fossil Fuels Index (the “Index”) is designed to measure the performance of companies in the MSCI Emerging Markets Index that are “fossil fuel reserves free,” which are defined as companies that do not own fossil fuel reserves. For purposes of the composition of the Index, fossil fuel reserves are defined as proved and probable coal, oil or natural gas reserves used for energy purposes, but do not include metallurgical or coking coal, which is primarily used in connection with steel production. The Index is a subset of the MSCI Emerging Markets Index (the “Parent Index”), which serves as the initial universe of eligible securities for the Index. The Parent Index captures large and mid-capitalization representation across 23 emerging market countries. |
Top Ten Holdings as of September 30, 2017
| Description | % of Net Assets |
|||||||||
| Tencent Holdings, Ltd. |
5.3 | % | ||||||||
| Samsung Electronics Co., Ltd. |
4.7 | |||||||||
| Alibaba Group Holding, Ltd. ADR |
4.1 | |||||||||
| Taiwan Semiconductor Manufacturing Co., Ltd. |
3.9 | |||||||||
| Naspers, Ltd. Class N |
2.0 | |||||||||
| Baidu, Inc. ADR |
1.5 | |||||||||
| China Construction Bank Corp. Class H |
1.4 | |||||||||
| China Mobile, Ltd. |
1.4 | |||||||||
| Hon Hai Precision Industry Co., Ltd. |
1.2 | |||||||||
| Industrial & Commercial Bank of China, Ltd. Class H |
1.1 | |||||||||
| TOTAL |
26.6 | % | ||||||||
(The ten largest holdings are subject to change, and there are no guarantees the Fund will continue to remain invested in any particular company.)
Sector Breakdown as of September 30, 2017
| % of Net Assets |
||||||||
| Information Technology |
27.6 | % | ||||||
| Financials |
24.3 | |||||||
| Consumer Discretionary |
9.7 | |||||||
| Consumer Staples |
6.6 | |||||||
| Materials |
6.1 | |||||||
| Industrials |
5.3 | |||||||
| Telecommunication Services |
5.2 | |||||||
| Real Estate |
2.7 | |||||||
| Utilities |
2.1 | |||||||
| Health Care |
1.8 | |||||||
| Energy |
0.9 | |||||||
| Short-Term Investments |
6.3 | |||||||
| Other Assets in Excess of Liabilities |
1.4 | |||||||
| TOTAL |
100.0 | % | ||||||
(The Fund’s sector breakdown is expressed as a percentage of net assets and may change over time.)
The total expense ratio for SPDR MSCI Emerging Markets Fossil Fuel Reserves Free ETF as stated in the Fees and Expenses table of the prospectus dated January 31, 2017 (as supplemented October 16, 2017) is 0.30%.
Performance quoted represents past performance, which is no guarantee of future results. Investment return and principal value will fluctuate, so you may have a gain or loss when shares are sold. Current performance may be higher or lower than that quoted. Visit www.spdrs.com for most recent month-end performance. The returns do not reflect the deduction of taxes that a shareholder would pay on Fund distributions or on the redemption or sale of Fund shares. See “Note to Performance Summary” on page 1 for more information.
27
Table of Contents
SPDR MSCI EAFE STRATEGICFACTORSSM ETF —
MANAGEMENT’S DISCUSSION OF FUND PERFORMANCE (UNAUDITED)
The SPDR MSCI EAFE StrategicFactors ETF (the “Fund”) seeks to provide investment results that, before fees and expenses, correspond generally to the total return performance of an index based upon the European, Australasian, and Far Eastern developed equity markets. The Fund’s benchmark is the MSCI EAFE Factor Mix A-Series Index (the “Index”).
For the 12-month period ended September 30, 2017 (the “Reporting Period”), the total return for the Fund was 15.92%, and the Index was 16.18%. The Fund and Index returns reflect the reinvestment of dividends and other income. The Fund’s performance reflects the expenses of managing the Fund, including brokerage and advisory expenses. The Index is unmanaged and Index returns do not reflect fees and expenses of any kind, which would have a negative impact on returns. Cumulative security misweights and Fund expenses contributed to the difference between the Fund’s performance and that of the Index.
Optimism about the global economy, accommodative monetary policy, and increased M&A activity were primary drivers of Fund performance relative to the year. The Fund had positive performance in three of the four quarters in the Reporting Period. Performance in the first quarter of the reporting period was negative. The performance was driven by the European Central Bank’s decision to reduce the pace of asset purchases and diplomatic tensions between the United States and other major powers and in spite of strong macro data and the markets embracing the surprise results of the U.S. presidential election of Donald Trump. The Fund’s performance turned positive for the remaining three quarters of the Reporting Period despite negative factors such as geopolitical factors (North Korean missile launches, Iran, calls for Catalonian independence in Spain, and German and French elections) and natural disasters. The positive performance was mostly driven by optimism regarding the global economy as risks became less pronounced, macroeconomic data was mostly positive and many companies reported strong earnings. Dovish monetary policy also contributed to the Fund’s performance as central banks left rates unchanged or signaled less than expected hawkish sentiments. Other factors like potential tax reform in the United States and the commencement of the Brexit process in the United Kingdom also contributed to the Fund’s positive performance.
The Fund did not invest in derivatives during the Reporting Period.
On an individual security level, the top positive contributors to the Fund’s performance were HSBC Holdings plc, Bayer AG, and LVMH Moet Hennessy Louis Vuitton SE. The top negative contributors to the Fund’s performance were Astellas Pharma Inc., Telstra Corporation Limited, Anheuser-Busch InBev SA/NV.
The views expressed above reflect those of the Fund’s portfolio manager only through the Reporting Period, and do not necessarily represent the views of the Adviser as a whole. Any such views are subject to change at any time based upon market or other conditions and the Adviser disclaims any responsibility to update such views. These views may not be relied on as investment advice and, because investment decisions for a fund are based on numerous factors, may not be relied on as an indication of trading intent on behalf of any fund.
28
Table of Contents
SPDR MSCI EAFE STRATEGICFACTORSSM ETF —
PERFORMANCE SUMMARY AND PORTFOLIO STATISTICS (UNAUDITED)
Performance as of September 30, 2017
| Cumulative Total Return | Average Annual Total Return | |||||||||||||||||||||||||||||
| Net Asset Value |
Market Value |
MSCI EAFE Factor Mix A-Series Index* |
Net Asset Value |
Market Value |
MSCI EAFE Factor Mix A-Series Index* |
|||||||||||||||||||||||||
| ONE YEAR | 15.92% | 16.57% | 16.18% | 15.92% | 16.57% | 16.18% | ||||||||||||||||||||||||
| SINCE INCEPTION (1) | 13.41% | 14.05% | 14.01% | 3.86% | 4.03% | 4.02% | ||||||||||||||||||||||||
| (1) | For the period June 4, 2014 to September 30, 2017. Since shares of the Fund did not trade in the secondary market until the day after the Fund’s inception, for the period from inception to the first day of secondary market trading in shares of the Fund (6/4/14, 6/5/14, respectively), the NAV of the Fund is used as a proxy for the secondary market trading price to calculate market returns. |
Comparison of Change in Value of a $10,000 Investment (Based on Net Asset Value)

Line graph is based on cumulative total return.
| * | The MSCI EAFE (Europe, Australasia, Far East) Factor Mix A-Series Index (the “Index”) captures large- and mid-cap representation across 21 developed market Europe, Australasia, and Far East countries and aims to represent the performance of value, low volatility, and quality factor strategies. The Index is an equal weighted combination of the following three MSCI Factor Indices in a single composite index: the MSCI EAFE Value Weighted Index, the MSCI EAFE Minimum Volatility Index, and the MSCI EAFE Quality Index. |
Top Ten Holdings as of September 30, 2017
| Description | % of Net Assets |
|||||||
| Nestle SA |
2.5 | % | ||||||
| Roche Holding AG |
2.1 | |||||||
| AstraZeneca PLC |
1.2 | |||||||
| British American Tobacco PLC |
1.2 | |||||||
| Novo Nordisk A/S Class B |
1.1 | |||||||
| Reckitt Benckiser Group PLC |
1.1 | |||||||
| Diageo PLC |
1.0 | |||||||
| Unilever NV |
1.0 | |||||||
| HSBC Holdings PLC |
1.0 | |||||||
| Bayer AG |
1.0 | |||||||
| TOTAL |
13.2 | % | ||||||
(The ten largest holdings are subject to change, and there are no guarantees the Fund will continue to remain invested in any particular company.)
Sector Breakdown as of September 30, 2017
| % of Net Assets |
||||||||
| Financials |
17.9 | % | ||||||
| Consumer Staples |
15.4 | |||||||
| Industrials |
14.6 | |||||||
| Health Care |
13.7 | |||||||
| Consumer Discretionary |
12.1 | |||||||
| Telecommunication Services |
5.7 | |||||||
| Information Technology |
5.3 | |||||||
| Materials |
5.3 | |||||||
| Utilities |
4.2 | |||||||
| Real Estate |
2.7 | |||||||
| Energy |
2.4 | |||||||
| Short-Term Investments |
0.4 | |||||||
| Other Assets in Excess of Liabilities |
0.3 | |||||||
| TOTAL |
100.0 | % | ||||||
(The Fund’s sector breakdown is expressed as a percentage of net assets and may change over time.)
The total expense ratio for SPDR MSCI EAFE StrategicFactors ETF as stated in the Fees and Expenses table of the prospectus dated January 31, 2017 (as supplemented June 30, 2017) is 0.30%.
Performance quoted represents past performance, which is no guarantee of future results. Investment return and principal value will fluctuate, so you may have a gain or loss when shares are sold. Current performance may be higher or lower than that quoted. Visit www.spdrs.com for most recent month-end performance. The returns do not reflect the deduction of taxes that a shareholder would pay on Fund distributions or on the redemption or sale of Fund shares. See “Note to Performance Summary” on page 1 for more information.
29
Table of Contents
SPDR MSCI EMERGING MARKETS STRATEGICFACTORSSM ETF —
MANAGEMENT’S DISCUSSION OF FUND PERFORMANCE (UNAUDITED)
The SPDR MSCI Emerging Markets Strategic Factors ETF (the “Fund”) seeks to provide investment results that, before fees and expenses, correspond generally to the total return performance of an index based upon the emerging equity markets of the world. The Fund’s benchmark is the MSCI Emerging Markets (EM) Factor Mix A-Series Index (the “Index”).
For the 12-month period ended September 30, 2017 (the “Reporting Period”), the total return for the Fund was 15.39%, and the Index was 15.68%. The Fund and Index returns reflect the reinvestment of dividends and other income. The Fund’s performance reflects the expenses of managing the Fund, including brokerage and advisory expenses. The Index is unmanaged and Index returns do not reflect fees and expenses of any kind, which would have a negative impact on returns. Fees and expenses, cash drag, and cumulative effect of security misweights contributed to the difference between the Fund’s performance and that of the Index.
While the last quarter of 2016 saw unexpected challenges to the established political order in U.S., the trading days following the U.S. election saw a surprising but persistent rise in growth assets in emerging markets. China and Korea, in spite of the ongoing geopolitical risks, notably witnessed a strong advance in the first quarter of 2017. The second quarter of 2017 saw a continuation of the positive sentiment for the Fund on back of strong macro and earnings data, and a rebound in commodity production. The success of emerging markets in the Fund in 2017 can be chalked up to a number of supporting factors, including the emergence of Brazil and Russia from two years in recession, a weaker U.S. dollar that keeps hard currency financing costs down and an acceleration in global trade.
The Fund did not invest in derivatives during the Reporting Period.
On an individual security level, the top positive contributors to the Fund’s performance were Tencent Holdings Ltd., Hon Hai Precision Industry Co., Ltd., and Samsung Electronics Co., Ltd. The top negative contributors to the Fund’s performance were NAVER Corp., China Huishan Dairy Holdings Co. Ltd., and China Mobile Limited.
The views expressed above reflect those of the Fund’s portfolio manager only through the Reporting Period, and do not necessarily represent the views of the Adviser as a whole. Any such views are subject to change at any time based upon market or other conditions and the Adviser disclaims any responsibility to update such views. These views may not be relied on as investment advice and, because investment decisions for a fund are based on numerous factors, may not be relied on as an indication of trading intent on behalf of any fund.
30
Table of Contents
SPDR MSCI EMERGING MARKETS STRATEGICFACTORSSM ETF —
PERFORMANCE SUMMARY AND PORTFOLIO STATISTICS (UNAUDITED)
Performance as of September 30, 2017
| Cumulative Total Return | Average Annual Total Return | |||||||||||||||||||||||||||||
| Net Asset Value |
Market Value |
MSCI Emerging Markets Factor Mix A-Series Index* |
Net Asset Value |
Market Value |
MSCI Emerging Markets Factor Mix A-Series Index* |
|||||||||||||||||||||||||
| ONE YEAR | 15.39% | 14.78% | 15.68% | 15.39% | 14.78% | 15.68% | ||||||||||||||||||||||||
| SINCE INCEPTION (1) | 7.74% | 8.38% | 10.40% | 2.27% | 2.45% | 3.02% | ||||||||||||||||||||||||
| (1) | For the period June 4, 2014 to September 30, 2017. Since shares of the Fund did not trade in the secondary market until the day after the Fund’s inception, for the period from inception to the first day of secondary market trading in shares of the Fund (6/4/14, 6/5/14, respectively), the NAV of the Fund is used as a proxy for the secondary market trading price to calculate market returns. |
Comparison of Change in Value of a $10,000 Investment (Based on Net Asset Value)
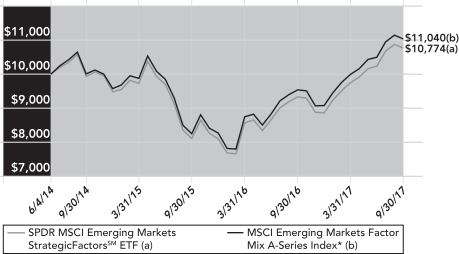
Line graph is based on cumulative total return.
| * | The MSCI Emerging Markets Factor Mix A-Series Index (the “Index”) captures large- and mid-cap representation across 23 emerging markets countries and aims to represent the performance of value, low volatility, and quality factor strategies. The Index is an equal weighted combination of the following three MSCI Factor Indices in a single composite index: the MSCI EM Value Weighted Index, the MSCI EM Minimum Volatility Index, and the MSCI EM Quality Index. |
Top Ten Holdings as of September 30, 2017
| Description | % of Net Assets |
|||||||
| Taiwan Semiconductor Manufacturing Co., Ltd. |
2.9 | % | ||||||
| Tencent Holdings, Ltd. |
2.8 | |||||||
| China Mobile, Ltd. |
2.2 | |||||||
| Hon Hai Precision Industry Co., Ltd. |
2.2 | |||||||
| China Construction Bank Corp. Class H |
1.4 | |||||||
| Samsung Electronics Co., Ltd. GDR |
1.3 | |||||||
| Ambev SA ADR |
1.1 | |||||||
| Industrial & Commercial Bank of China, Ltd. Class H |
1.1 | |||||||
| Yum China Holdings, Inc. |
1.1 | |||||||
| NetEase, Inc. ADR |
1.0 | |||||||
| TOTAL |
17.1 | % | ||||||
(The ten largest holdings are subject to change, and there are no guarantees the Fund will continue to remain invested in any particular company.)
Sector Breakdown as of September 30, 2017
| % of Net Assets |
||||||||
| Information Technology |
23.7 | % | ||||||
| Financials |
21.4 | |||||||
| Consumer Staples |
11.0 | |||||||
| Consumer Discretionary |
10.2 | |||||||
| Telecommunication Services |
8.2 | |||||||
| Energy |
5.6 | |||||||
| Industrials |
5.3 | |||||||
| Materials |
4.2 | |||||||
| Utilities |
4.2 | |||||||
| Health Care |
4.1 | |||||||
| Real Estate |
1.5 | |||||||
| Short-Term Investments |
1.8 | |||||||
| Liabilities in Excess of Other Assets |
(1.2 | ) | ||||||
| TOTAL |
100.0 | % | ||||||
(The Fund’s sector breakdown is expressed as a percentage of net assets and may change over time.)
The total expense ratio for SPDR MSCI Emerging Markets StrategicFactors ETF as stated in the Fees and Expenses table of the prospectus dated January 31, 2017 (as supplemented June 30, 2017) is 0.30%.
Performance quoted represents past performance, which is no guarantee of future results. Investment return and principal value will fluctuate, so you may have a gain or loss when shares are sold. Current performance may be higher or lower than that quoted. Visit www.spdrs.com for most recent month-end performance. The returns do not reflect the deduction of taxes that a shareholder would pay on Fund distributions or on the redemption or sale of Fund shares. See “Note to Performance Summary” on page 1 for more information.
31
Table of Contents
SPDR MSCI WORLD STRATEGICFACTORSSM ETF —
MANAGEMENT’S DISCUSSION OF FUND PERFORMANCE (UNAUDITED)
The SPDR MSCI World StrategicFactors ETF (the “Fund”) seeks to provide investment results that, before fees and expenses, correspond generally to the total return performance of an index based upon the developed equity markets of the world. The Fund’s benchmark is the MSCI World Factor Mix A-Series Index (the “Index”).
For the 12-month period ended September 30, 2017 (the “Reporting Period”), the total return for the Fund was 15.53%, and the Index was 15.61%. The Fund and Index returns reflect the reinvestment of dividends and other income. The Fund’s performance reflects the expenses of managing the Fund, including brokerage and advisory expenses. The Index is unmanaged and Index returns do not reflect fees and expenses of any kind, which would have a negative impact on returns. Fees and expenses, cash drag, cumulative effect of security misweights and tax withholdings contributed to the difference between the Fund’s performance and that of the Index.
While the last quarter of 2016 saw unexpected challenges to the established political order in U.S., the trading days following the U.S. election saw a surprising but persistent rise in growth assets. The shift in favor of developed markets and the Fund in the final quarter of 2016 is primarily attributable to U.S. equities and the U.S. dollar posting strong gains against a pullback in emerging markets in both local and currency-adjusted returns. The first quarter of 2017 witnessed an optimistic tone in all regional indices globally, largely on the back of growth expectations. In addition to an improving economic backdrop, European shares in the Fund benefitted from an easing of political uncertainty with the defeat of populist candidates in the Netherlands in February and in presidential polls in France that spanned April and May. The third quarter of 2017 also saw a positive performance for the Fund as markets continued to rally on back of strong retail sales and improved macroeconomic and manufacturing data.
The Fund did not invest in derivatives during the Reporting Period.
On an individual security level, the top positive contributors to the Fund’s performance were Apple Inc., Microsoft Corporation, and Visa Inc. Class A. The top negative contributors to the Fund’s performance were General Mills, Inc., Altria Group, Inc., and QUALCOMM Incorporated.
The views expressed above reflect those of the Fund’s portfolio manager only through the Reporting Period, and do not necessarily represent the views of the Adviser as a whole. Any such views are subject to change at any time based upon market or other conditions and the Adviser disclaims any responsibility to update such views. These views may not be relied on as investment advice and, because investment decisions for a fund are based on numerous factors, may not be relied on as an indication of trading intent on behalf of any fund.
32
Table of Contents
SPDR MSCI WORLD STRATEGICFACTORSSM ETF —
PERFORMANCE SUMMARY AND PORTFOLIO STATISTICS (UNAUDITED)
Performance as of September 30, 2017
| Cumulative Total Return | Average Annual Total Return | |||||||||||||||||||||||||||||
| Net Asset Value |
Market Value |
MSCI World Index* |
Net Asset Value |
Market Value |
MSCI World Index* |
|||||||||||||||||||||||||
| ONE YEAR | 15.53% | 16.14% | 15.61% | 15.53% | 16.14% | 15.61% | ||||||||||||||||||||||||
| SINCE INCEPTION (1) | 29.77% | 29.51% | 28.99% | 8.15% | 8.09% | 7.96% | ||||||||||||||||||||||||
| (1) | For the period June 4, 2014 to September 30, 2017. Since shares of the Fund did not trade in the secondary market until the day after the Fund’s inception, for the period from inception to the first day of secondary market trading in shares of the Fund (6/4/14, 6/5/14, respectively), the NAV of the Fund is used as a proxy for the secondary market trading price to calculate market returns. |
Comparison of Change in Value of a $10,000 Investment (Based on Net Asset Value)
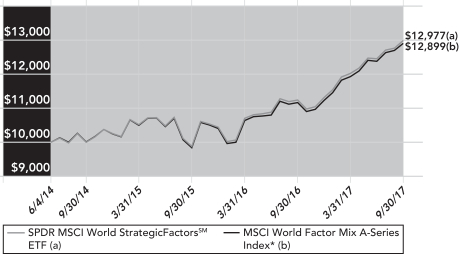
Line graph is based on cumulative total return.
| * | The MSCI World Factor Mix A-Series Index (the “Index”) captures large- and mid-cap representation across 23 developed countries and aims to represent the performance of value, low volatility, and quality factor strategies. The Index is an equal weighted combination of the following three MSCI Factor Indices in a single composite index: the MSCI World Value Weighted Index, the MSCI World Minimum Volatility Index, and the MSCI World Quality Index. |
Top Ten Holdings as of September 30, 2017
| Description | % of Net Assets |
|||||||
| Apple, Inc. |
2.1 | % | ||||||
| Microsoft Corp. |
2.0 | |||||||
| Johnson & Johnson |
1.9 | |||||||
| Procter & Gamble Co. |
1.2 | |||||||
| Roche Holding AG |
1.1 | |||||||
| Alphabet, Inc. Class C |
1.0 | |||||||
| Visa, Inc. Class A |
1.0 | |||||||
| Alphabet, Inc. Class A |
1.0 | |||||||
| Altria Group, Inc. |
0.8 | |||||||
| Intel Corp. |
0.8 | |||||||
| TOTAL |
12.9 | % | ||||||
(The ten largest holdings are subject to change, and there are no guarantees the Fund will continue to remain invested in any particular company.)
Sector Breakdown as of September 30, 2017
| % of Net Assets |
||||||||
| Information Technology |
17.4 | % | ||||||
| Financials |
15.2 | |||||||
| Health Care |
14.3 | |||||||
| Industrials |
11.8 | |||||||
| Consumer Staples |
11.6 | |||||||
| Consumer Discretionary |
11.3 | |||||||
| Materials |
4.2 | |||||||
| Utilities |
4.1 | |||||||
| Telecommunication Services |
4.0 | |||||||
| Energy |
3.5 | |||||||
| Real Estate |
2.3 | |||||||
| Short-Term Investments |
20.5 | |||||||
| Liabilities in Excess of Other Assets |
(20.2 | ) | ||||||
| TOTAL |
100.0 | % | ||||||
(The Fund’s sector breakdown is expressed as a percentage of net assets and may change over time.)
The total expense ratio for SPDR MSCI World StrategicFactors ETF as stated in the Fees and Expenses table of the prospectus dated January 31, 2017 (as supplemented June 30, 2017) is 0.30%.
Performance quoted represents past performance, which is no guarantee of future results. Investment return and principal value will fluctuate, so you may have a gain or loss when shares are sold. Current performance may be higher or lower than that quoted. Visit www.spdrs.com for most recent month-end performance. The returns do not reflect the deduction of taxes that a shareholder would pay on Fund distributions or on the redemption or sale of Fund shares. See “Note to Performance Summary” on page 1 for more information.
33
Table of Contents
SPDR MSCI CANADA STRATEGICFACTORSSM ETF —
MANAGEMENT’S DISCUSSION OF FUND PERFORMANCE (UNAUDITED)
The SPDR MSCI Canada StrategicFactors ETF (the “Fund”) seeks to provide investment results that, before fees and expenses, correspond generally to the total return performance of an index based upon the equity market of Canada. The Fund’s benchmark is the MSCI Canada Factor Mix A-Series Capped Index (the “Index”).
For the 12-month period ended September 30, 2017 (the “Reporting Period”), the total return for the Fund was 15.52%, and the Index was 15.61%. The Fund and Index returns reflect the reinvestment of dividends and other income. The Fund’s performance reflects the expenses of managing the Fund, including brokerage and advisory expenses. The Index is unmanaged and Index returns do not reflect fees and expenses of any kind, which would have a negative impact on returns. Fees and expenses, cash drag and tax withholdings contributed to the difference between the Fund’s performance and that of the Index.
Global markets ushered in 2017 on a cautiously positive note as the six quarter year over year (YoY) global earnings recession that finally gave way to growth in the second half of 2016 gained momentum in the first half of 2017. Earnings advanced 23% (YoY) for the MSCI World Index of developed market companies reported in the early weeks of the second quarter. The fund’s performance was mainly driven by the strong returns in Consumer Discretionary, Financials and Industrial sectors. Health Care and Real Estate were the weakest performing sectors in Canada.
The Fund did not invest in derivatives during the Reporting Period.
On an individual security level, the top positive contributors to the Fund’s performance were Toronto-Dominion Bank, Royal Bank of Canada, and Canadian National Railway Company. The top negative contributors to the Fund’s performance were Alimentation Couche-Tard Inc. Class B, Fairfax Financial Holdings Limited, and Cenovus Energy Inc.
The views expressed above reflect those of the Fund’s portfolio manager only through the Reporting Period, and do not necessarily represent the views of the Adviser as a whole. Any such views are subject to change at any time based upon market or other conditions and the Adviser disclaims any responsibility to update such views. These views may not be relied on as investment advice and, because investment decisions for a fund are based on numerous factors, may not be relied on as an indication of trading intent on behalf of any fund.
34
Table of Contents
SPDR MSCI CANADA STRATEGICFACTORSSM ETF —
PERFORMANCE SUMMARY AND PORTFOLIO STATISTICS (UNAUDITED)
Performance as of September 30, 2017
| Cumulative Total Return | Average Annual Total Return | |||||||||||||||||||||||||||||
| Net Asset Value |
Market Value |
MSCI Canada Capped |
Net Asset Value |
Market Value |
MSCI Canada Capped |
|||||||||||||||||||||||||
| ONE YEAR | 15.52% | 15.40% | 15.61% | 15.52% | 15.40% | 15.61% | ||||||||||||||||||||||||
| SINCE INCEPTION (1) | 6.78% | 7.02% | 7.01% | 2.00% | 2.07% | 2.07% | ||||||||||||||||||||||||
| (1) | For the period June 11, 2014 to September 30, 2017. Since shares of the Fund did not trade in the secondary market until the day after the Fund’s inception, for the period from inception to the first day of secondary market trading in shares of the Fund (6/11/14, 6/12/14, respectively), the NAV of the Fund is used as a proxy for the secondary market trading price to calculate market returns. |
Comparison of Change in Value of a $10,000 Investment (Based on Net Asset Value)
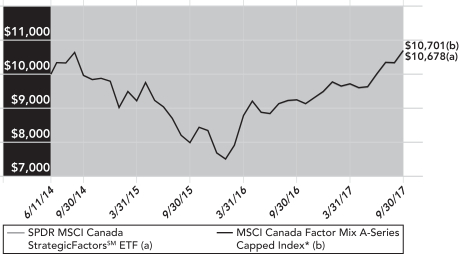
Line graph is based on cumulative total return.
| * | The MSCI Canada Factor Mix A-Series Capped Index (the “Index”) is designed to measure the equity market performance of large and mid-cap companies across the Canadian equity market. It aims to represent the performance of a combination of three factors - value, quality, and low volatility. The Index is an equal weighted combination of the following three MSCI Factor Indices in a single composite index: the MSCI Canada Value Weighted Index, the MSCI Canada Quality Index, and the MSCI Canada Minimum Volatility Index. |
Top Ten Holdings as of September 30, 2017
| Description | % of Net Assets |
|||||||
| Toronto-Dominion Bank |
4.4 | % | ||||||
| Royal Bank of Canada |
4.3 | |||||||
| Canadian Imperial Bank of Commerce |
3.9 | |||||||
| Bank of Nova Scotia |
3.6 | |||||||
| Sun Life Financial, Inc. |
3.3 | |||||||
| Canadian National Railway Co. |
3.2 | |||||||
| Intact Financial Corp. |
3.1 | |||||||
| Magna International, Inc. |
2.7 | |||||||
| Bank of Montreal |
2.6 | |||||||
| Great-West Lifeco, Inc. |
2.5 | |||||||
| TOTAL |
33.6 | % | ||||||
(The ten largest holdings are subject to change, and there are no guarantees the Fund will continue to remain invested in any particular company.)
Sector Breakdown as of September 30, 2017
| % of Net Assets |
||||||||
| Financials |
40.1 | % | ||||||
| Energy |
12.2 | |||||||
| Consumer Staples |
9.0 | |||||||
| Consumer Discretionary |
8.7 | |||||||
| Materials |
7.8 | |||||||
| Industrials |
7.7 | |||||||
| Information Technology |
5.3 | |||||||
| Telecommunication Services |
4.2 | |||||||
| Utilities |
2.9 | |||||||
| Real Estate |
1.4 | |||||||
| Health Care |
0.3 | |||||||
| Short-Term Investment |
0.0 | ** | ||||||
| Other Assets in Excess of Liabilities |
0.4 | |||||||
| TOTAL |
100.0 | % | ||||||
| ** | Amount shown represents less than 0.05% of net assets. |
(The Fund’s sector breakdown is expressed as a percentage of net assets and may change over time.)
The total expense ratio for SPDR MSCI Canada StrategicFactors ETF as stated in the Fees and Expenses table of the prospectus dated January 31, 2017 (as supplemented June 30, 2017) is 0.30%.
Performance quoted represents past performance, which is no guarantee of future results. Investment return and principal value will fluctuate, so you may have a gain or loss when shares are sold. Current performance may be higher or lower than that quoted. Visit www.spdrs.com for most recent month-end performance. The returns do not reflect the deduction of taxes that a shareholder would pay on Fund distributions or on the redemption or sale of Fund shares. See “Note to Performance Summary” on page 1 for more information.
35
Table of Contents
SPDR MSCI GERMANY STRATEGICFACTORSSM ETF —
MANAGEMENT’S DISCUSSION OF FUND PERFORMANCE (UNAUDITED)
The SPDR MSCI Germany Strategic Factors ETF (the “Fund”) seeks to provide investment results that, before fees and expenses, correspond generally to the total return performance of an index based upon the equity market of Germany. The Fund’s benchmark is the MSCI Germany Factor Mix A-Series Capped Index (the “Index”).
For the 12-month period ended September 30, 2017 (the “Reporting Period”), the total return for the Fund was 23.78%, and the Index was 24.03%. The Fund and Index returns reflect the reinvestment of dividends and other income. The Fund’s performance reflects the expenses of managing the Fund, including brokerage and advisory expenses. The Index is unmanaged and Index returns do not reflect fees and expenses of any kind, which would have a negative impact on returns. Expenses, dividend tax withholdings, and cash drag contributed to the difference between the Fund’s performance and that of the Index.
After a flat first fiscal quarter, the Index produced three straight fruitful quarters gaining at least 6% during each period and finishing the fiscal year ahead of the MSCI EAFE by almost 5%. Germany has been able to avoid much of the backlash from last year’s historic Brexit vote by remaining a trade partner of the U.K. This support led to an uptick in consumer confidence and demand within the region. As the largest country in the Eurozone, Germany sits at the center of the region’s ongoing sovereign debt crisis. Though it has stabilized and Germany specifically is not in crisis, the situation is far from resolved. Germany has successfully been able to balance supporting the Eurozone and not negatively affecting that aforementioned consumer confidence. As the fiscal year came to a close, Germany held its election campaign and Chancellor Angela Merkel won re-election to a fourth term. The tighter-than-expected election results were significant, however, due to the extraordinary rise of an extreme right party called Alternative für Deutschland (AfD) and the speculation that this could be the Chancellor’s last term and, thus, lead to a weaker government going forward.
The Fund did not invest in derivatives during the Reporting Period.
On an individual security level, the top positive contributors to the Fund’s performance were Allianz SE, Deutsche Post AG, and Bayer AG. The top negative contributors to the Fund’s performance were United Internet AG, ProSiebenSat.1 Media SE, and GEA Group Aktiengesellschaft.
The views expressed above reflect those of the Fund’s portfolio manager only through the Reporting Period, and do not necessarily represent the views of the Adviser as a whole. Any such views are subject to change at any time based upon market or other conditions and the Adviser disclaims any responsibility to update such views. These views may not be relied on as investment advice and, because investment decisions for a fund are based on numerous factors, may not be relied on as an indication of trading intent on behalf of any fund.
36
Table of Contents
SPDR MSCI GERMANY STRATEGICFACTORSSM ETF —
PERFORMANCE SUMMARY AND PORTFOLIO STATISTICS (UNAUDITED)
Performance as of September 30, 2017
| Cumulative Total Return |
Average Annual Total Return | |||||||||||||||||||||||||||||
| Net Asset Value |
Market Value |
MSCI Germany Capped |
Net Asset Value |
Market Value |
MSCI Germany Capped |
|||||||||||||||||||||||||
| ONE YEAR | 23.78% | 23.91% | 24.03% | 23.78% | 23.91% | 24.03% | ||||||||||||||||||||||||
| SINCE INCEPTION (1) | 12.29% | 12.54% | 12.60% | 3.57% | 3.64% | 3.66% | ||||||||||||||||||||||||
| (1) | For the period June 11, 2014 to September 30, 2017. Since shares of the Fund did not trade in the secondary market until the day after the Fund’s inception, for the period from inception to the first day of secondary market trading in shares of the Fund (6/11/14, 6/12/14, respectively), the NAV of the Fund is used as a proxy for the secondary market trading price to calculate market returns. |
Comparison of Change in Value of a $10,000 Investment (Based on Net Asset Value)

Line graph is based on cumulative total return.
| * | The MSCI Germany Factor Mix A-Series Capped Index (the “Index”) is designed to measure the equity market performance of large and mid-cap companies across the Germany equity market. It aims to represent the performance of a combination of three factors - value, quality, and low volatility. The Index is an equal weighted combination of the following three MSCI Factor Indices in a single composite index: the MSCI Germany Value Weighted Index, the MSCI Germany Quality Index, and the MSCI Germany Minimum Volatility Index. |
Top Ten Holdings as of September 30, 2017
| Description | % of Net Assets |
|||||||
| Allianz SE |
5.2 | % | ||||||
| Muenchener Rueckversicherungs-Gesellschaft AG in Muenchen |
5.1 | |||||||
| BASF SE |
5.0 | |||||||
| Siemens AG |
4.6 | |||||||
| Bayer AG |
4.3 | |||||||
| SAP SE |
4.2 | |||||||
| Deutsche Post AG |
4.2 | |||||||
| Daimler AG |
4.1 | |||||||
| Beiersdorf AG |
2.9 | |||||||
| adidas AG |
2.9 | |||||||
| TOTAL |
42.5 | % | ||||||
(The ten largest holdings are subject to change, and there are no guarantees the Fund will continue to remain invested in any particular company.)
Sector Breakdown as of September 30, 2017
| % of Net Assets |
||||||||
| Consumer Discretionary |
20.5 | % | ||||||
| Industrials |
16.3 | |||||||
| Financials |
15.4 | |||||||
| Materials |
14.8 | |||||||
| Health Care |
9.3 | |||||||
| Information Technology |
7.0 | |||||||
| Consumer Staples |
6.7 | |||||||
| Utilities |
4.6 | |||||||
| Telecommunication Services |
3.2 | |||||||
| Real Estate |
1.7 | |||||||
| Short-Term Investment |
0.0 | ** | ||||||
| Other Assets in Excess of Liabilities |
0.5 | |||||||
| TOTAL |
100.0 | % | ||||||
| ** | Amount shown represents less than 0.05% of net assets |
(The Fund’s sector breakdown is expressed as a percentage of net assets and may change over time.)
The total expense ratio for SPDR MSCI Germany StrategicFactors ETF as stated in the Fees and Expenses table of the prospectus dated January 31, 2017 (as supplemented June 30, 2017) is 0.30%.
Performance quoted represents past performance, which is no guarantee of future results. Investment return and principal value will fluctuate, so you may have a gain or loss when shares are sold. Current performance may be higher or lower than that quoted. Visit www.spdrs.com for most recent month-end performance. The returns do not reflect the deduction of taxes that a shareholder would pay on Fund distributions or on the redemption or sale of Fund shares. See “Note to Performance Summary” on page 1 for more information.
37
Table of Contents
SPDR MSCI JAPAN STRATEGICFACTORSSM ETF —
MANAGEMENT’S DISCUSSION OF FUND PERFORMANCE (UNAUDITED)
The SPDR MSCI Japan StrategicFactors ETF (the “Fund”) seeks to provide investment results that, before fees and expenses, correspond generally to the total return performance of an index based upon the equity market of Japan. The Fund’s benchmark is the MSCI Japan Factor Mix A-Series Capped Index (the “Index”).
For the 12-month period ended September 30, 2017 (the “Reporting Period”), the total return for the Fund was 12.21%, and the Index was 12.69%. The Fund and Index returns reflect the reinvestment of dividends and other income. The Fund’s performance reflects the expenses of managing the Fund, including brokerage and advisory expenses. The Index is unmanaged and Index returns do not reflect fees and expenses of any kind, which would have a negative impact on returns. Expenses, tax withholdings and cash drag contributed to the difference between the Fund’s performance and that of the Index.
As the final quarter of 2016 commenced, October provided investors few places to avoid negative returns as both safe haven investments and riskier growth assets came under pressure during the month. One of the most identifiable causes of angst across asset classes was a sharp rise in global sovereign bond yields coincident with a paring back of expectations for future global central bank policy support. The backup in global rates from the lows of July also coincided with a steady rise in longer-dated benchmarks in other developed markets on a paring back of expectations for expansion or extension of bond buying programs by the ECB and BOJ. This was validated in part by the BOJ decision in September to target a zero Japanese Government Bond interest rate rather than initiate explicit new asset purchase targets. The relative hawkishness of global central banks aided in the weaker Q4 2016 performance of the SPDR MSCI Japan StrategicFactorsSM ETF which finished -1.66% for Q4 2016.
Global markets ushered in 2017 on a cautiously positive note in January even as a number of reflationary market trends paused or reversed. February saw a continuation of the positive sentiment evident in global equity markets during the first month of the year, and by some measures, an acceleration of it. Beyond a pause in some capital markets and a somewhat murkier outlook for near term U.S. fiscal policy initiatives, measures of realized global real activity and inflation were decidedly in line with the global reflation theme in the early months of 2017. Evidence of global inflation finally converging toward or even exceeding central bank target levels continued to build in Q1 2017 after years of being below target and prompting considerable monetary stimulus that still continues apace for many economies. Given these conditions, the fund ended Q1 2017 up +4.46%.
April 2017 saw a measure of investor fear return to global risk markets following a four and a half month period of relative complacency. May provided favorable payoffs to investors positioning for a range of economic developments. Positive returns were realized for those embracing a narrative of continuing global economic and earnings growth that would continue to buoy equities. The not so hot, not so cold economic backdrop awakened a chorus of references to a new ‘Goldilocks’ economy in the financial press. Such a backdrop would further elongate the current cycle as a moderate rate of positive growth and inflation would be just enough to continue to boost earnings without eliciting a more aggressive response from central banks to normalize financial conditions with higher interest rates. Against this positive backdrop, the fund finished Q2 2017 +5.38%.
The second half of 2017 commenced with a continuation of many of the themes that prevailed in the first half of 2017, the global growth story that has provided firm foundation for broad advances in global equities year-to-date continued to show strength in August economic releases. Japan’s Q2 GDP was reported on August 14th to have advanced a lofty annual rate of 4% and on August 16th and Euro area growth for the second quarter was revised higher to an above trend 2.5% annual rate. As in the US, Japanese 10-year yields declined in the third quarter although both were on an upward trajectory to close the quarter with advances in September. In light of these developments the fund returned +3.66% for the quarter ended September 30, 2017.
The Fund did not invest in derivatives during the Reporting Period.
On an individual security level, the top positive contributors to the Fund’s performance were Keyence Corporation, Mitsubishi UFJ Financial Group, Inc., and Bridgestone Corporation. The top negative contributors to the Fund’s performance were KDDI Corporation, Japan Tobacco Inc., and Astellas Pharma Inc.
The views expressed above reflect those of the Fund’s portfolio manager only through the Reporting Period, and do not necessarily represent the views of the Adviser as a whole. Any such views are subject to change at any time based upon market or other conditions and the Adviser disclaims any responsibility to update such views. These views may not be relied on as investment advice and, because investment decisions for a fund are based on numerous factors, may not be relied on as an indication of trading intent on behalf of any fund.
38
Table of Contents
SPDR MSCI JAPAN STRATEGICFACTORSSM ETF —
PERFORMANCE SUMMARY AND PORTFOLIO STATISTICS (UNAUDITED)
Performance as of September 30, 2017
| Cumulative Total Return |
Average Annual Total Return | |||||||||||||||||||||||||||||
| Net Asset Value |
Market Value |
MSCI Japan Factor Mix A-Series Capped Index* |
Net Asset Value |
Market Value |
MSCI Japan Factor Mix A-Series Capped Index* |
|||||||||||||||||||||||||
| ONE YEAR | 12.21% | 11.49% | 12.69% | 12.21% | 11.49% | 12.69% | ||||||||||||||||||||||||
| SINCE INCEPTION (1) | 29.78% | 29.96% | 31.11% | 8.20% | 8.25% | 8.54% | ||||||||||||||||||||||||
| (1) | For the period June 11, 2014 to September 30, 2017. Since shares of the Fund did not trade in the secondary market until the day after the Fund’s inception, for the period from inception to the first day of secondary market trading in shares of the Fund (6/11/14, 6/12/14, respectively), the NAV of the Fund is used as a proxy for the secondary market trading price to calculate market returns. |
Comparison of Change in Value of a $10,000 Investment (Based on Net Asset Value)
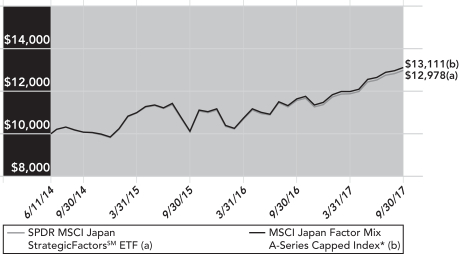
Line graph is based on cumulative total return.
| * | The MSCI Japan Factor Mix A-Series Capped Index (the “Index”) is designed to measure the equity market performance of large and mid-cap companies across the Japanese equity market. It aims to represent the performance of a combination of three factors - value, quality, and low volatility. The Index is an equal weighted combination of the following three MSCI Factor Indices in a single composite index: the MSCI Japan Value Weighted Index, the MSCI Japan Quality Index, and the MSCI Japan Minimum Volatility Index. |
Top Ten Holdings as of September 30, 2017
| Description | % of Net Assets |
|||||||
| Toyota Motor Corp. |
2.8 | % | ||||||
| Keyence Corp. |
2.5 | |||||||
| KDDI Corp. |
2.3 | |||||||
| Bridgestone Corp. |
2.2 | |||||||
| NTT DOCOMO, Inc. |
2.1 | |||||||
| Astellas Pharma, Inc. |
2.1 | |||||||
| Kao Corp. |
1.9 | |||||||
| Japan Tobacco, Inc. |
1.8 | |||||||
| Subaru Corp. |
1.8 | |||||||
| Hoya Corp. |
1.7 | |||||||
| TOTAL |
21.2 | % | ||||||
(The ten largest holdings are subject to change, and there are no guarantees the Fund will continue to remain invested in any particular company.)
Sector Breakdown as of September 30, 2017
| % of Net Assets |
||||||||
| Consumer Discretionary |
21.1 | % | ||||||
| Industrials |
18.2 | |||||||
| Information Technology |
11.8 | |||||||
| Financials |
10.5 | |||||||
| Health Care |
10.5 | |||||||
| Consumer Staples |
9.5 | |||||||
| Telecommunication Services |
5.9 | |||||||
| Real Estate |
4.3 | |||||||
| Materials |
4.2 | |||||||
| Utilities |
2.3 | |||||||
| Energy |
0.7 | |||||||
| Short-Term Investment |
0.0 | ** | ||||||
| Other Assets in Excess of Liabilities |
1.0 | |||||||
| TOTAL |
100.0 | % | ||||||
(The Fund’s sector breakdown is expressed as a percentage of net assets and may change over time.)
The total expense ratio for SPDR MSCI Japan StrategicFactors ETF as stated in the Fees and Expenses table of the prospectus dated January 31, 2017 (as supplemented June 30, 2017) is 0.30%.
Performance quoted represents past performance, which is no guarantee of future results. Investment return and principal value will fluctuate, so you may have a gain or loss when shares are sold. Current performance may be higher or lower than that quoted. Visit www.spdrs.com for most recent month-end performance. The returns do not reflect the deduction of taxes that a shareholder would pay on Fund distributions or on the redemption or sale of Fund shares. See “Note to Performance Summary” on page 1 for more information.
39
Table of Contents
SPDR MSCI UNITED KINGDOM STRATEGICFACTORSSM ETF —
MANAGEMENT’S DISCUSSION OF FUND PERFORMANCE (UNAUDITED)
The SPDR MSCI United Kingdom StrategicFactors ETF (the “Fund”) seeks to provide investment results that, before fees and expenses, correspond generally to the total return performance of an index based upon the equity market of the United Kingdom. The Fund’s benchmark is the MSCI UK Factor Mix A-Series Capped Index (the “Index”).
For the 12-month period ended September 30, 2017 (the “Reporting Period”), the total return for the Fund was 14.13%, and the Index was 14.67%. The Fund and Index returns reflect the reinvestment of dividends and other income. The Fund’s performance reflects the expenses of managing the Fund, including brokerage and advisory expenses. The Index is unmanaged and Index returns do not reflect fees and expenses of any kind, which would have a negative impact on returns. Fund expenses, cash, and slight security misweights contributed to the difference between the Fund’s performance and that of the Index.
After breaching record low levels in July following the surprise vote by the U.K. to exit the European Union (a.k.a. ‘Brexit’) in the last quarter of 2016 rate sensitive growth assets gave ground with global stocks overall declining by 1.9% as measured by the MSCI World Index. Global markets ushered in 2017 on a cautiously positive note as the six quarter year over year (YoY) global earnings recession that finally gave way to growth in the second half of 2016 gained momentum in the first half of 2017. Earnings advanced 23% (YoY) for the MSCI World Index of developed market companies reported in the early weeks of the second quarter. For the Reporting Period MSCI World was up over 18% compared to 14.6% U.K. country performance. The fund’s performance was mainly driven by the strong returns in materials, financials and energy sectors. Telecommunications services and utilities were the weakest performing sectors in the in U.K. Over 3% of the fund’s return came from the U.S. Dollar depreciation and U.K. Pound appreciation.
The Fund did not invest in derivatives during the Reporting Period.
On an individual security level, the top positive contributors to the Fund’s performance were HSBC Holdings plc, Royal Dutch Shell Plc Class B, and Glencore plc. The top negative contributors to the Fund’s performance were Imperial Brands PLC, National Grid plc, and BT Group plc.
The views expressed above reflect those of the Fund’s portfolio manager only through the Reporting Period, and do not necessarily represent the views of the Adviser as a whole. Any such views are subject to change at any time based upon market or other conditions and the Adviser disclaims any responsibility to update such views. These views may not be relied on as investment advice and, because investment decisions for a fund are based on numerous factors, may not be relied on as an indication of trading intent on behalf of any fund.
40
Table of Contents
SPDR MSCI UNITED KINGDOM STRATEGICFACTORSSM ETF —
PERFORMANCE SUMMARY AND PORTFOLIO STATISTICS (UNAUDITED)
Performance as of September 30, 2017
| Cumulative Total Return |
Average Annual Total Return | |||||||||||||||||||||||||||||
| Net Asset Value |
Market Value |
MSCI UK Factor Mix A-Series Capped Index* |
Net Asset Value |
Market Value |
MSCI UK Factor Mix A-Series Capped Index* |
|||||||||||||||||||||||||
| ONE YEAR | 14.13% | 14.06% | 14.67% | 14.13% | 14.06% | 14.67% | ||||||||||||||||||||||||
| SINCE INCEPTION (1) | –0.85% | –0.67% | 0.51% | –0.26% | –0.20% | 0.15% | ||||||||||||||||||||||||
| (1) | For the period June 11, 2014 to September 30, 2017. Since shares of the Fund did not trade in the secondary market until the day after the Fund’s inception, for the period from inception to the first day of secondary market trading in shares of the Fund (6/11/14, 6/12/14, respectively), the NAV of the Fund is used as a proxy for the secondary market trading price to calculate market returns. |
Comparison of Change in Value of a $10,000 Investment (Based on Net Asset Value)

Line graph is based on cumulative total return.
| * | The MSCI UK Factor Mix A-Series Capped Index (the “Index”) is designed to measure the equity market performance large and mid-cap companies across the British equity Market. It aims to represent the performance of a combination of three factors - value, quality, and low volatility. The Index is an equal weighted combination of the following three MSCI Factor Indices in a single composite index: the MSCI UK Value Weighted Index, the MSCI UK Quality Index, and the MSCI UK Minimum Volatility Index. |
Top Ten Holdings as of September 30, 2017
| Description | % of Net Assets |
|||||||
| HSBC Holdings PLC |
5.1 | % | ||||||
| Royal Dutch Shell PLC Class A |
4.0 | |||||||
| British American Tobacco PLC |
3.5 | |||||||
| BP PLC |
3.4 | |||||||
| GlaxoSmithKline PLC |
3.4 | |||||||
| AstraZeneca PLC |
3.3 | |||||||
| Reckitt Benckiser Group PLC |
3.1 | |||||||
| Unilever PLC |
2.8 | |||||||
| RELX PLC |
2.8 | |||||||
| Compass Group PLC |
2.7 | |||||||
| TOTAL |
34.1 | % | ||||||
(The ten largest holdings are subject to change, and there are no guarantees the Fund will continue to remain invested in any particular company.)
Sector Breakdown as of September 30, 2017
| % of Net Assets |
||||||||
| Financials |
18.8 | % | ||||||
| Consumer Staples |
16.2 | |||||||
| Consumer Discretionary |
13.9 | |||||||
| Industrials |
12.4 | |||||||
| Health Care |
9.8 | |||||||
| Energy |
9.7 | |||||||
| Materials |
6.5 | |||||||
| Telecommunication Services |
5.0 | |||||||
| Utilities |
4.0 | |||||||
| Information Technology |
1.6 | |||||||
| Real Estate |
1.2 | |||||||
| Short-Term Investment |
0.0 | ** | ||||||
| Other Assets in Excess of Liabilities |
0.9 | |||||||
| TOTAL |
100.0 | % | ||||||
| ** | Amount shown represents less than 0.05% of net assets. |
(The Fund’s sector breakdown is expressed as a percentage of net assets and may change over time.)
The total expense ratio for SPDR MSCI United Kingdom StrategicFactors ETF as stated in the Fees and Expenses table of the prospectus dated January 31, 2017 (as supplemented June 30, 2017) is 0.30%.
Performance quoted represents past performance, which is no guarantee of future results. Investment return and principal value will fluctuate, so you may have a gain or loss when shares are sold. Current performance may be higher or lower than that quoted. Visit www.spdrs.com for most recent month-end performance. The returns do not reflect the deduction of taxes that a shareholder would pay on Fund distributions or on the redemption or sale of Fund shares. See “Note to Performance Summary” on page 1 for more information.
41
Table of Contents
SPDR S&P GLOBAL DIVIDEND ETF —
MANAGEMENT’S DISCUSSION OF FUND PERFORMANCE (UNAUDITED)
The SPDR S&P Global Dividend ETF (the “Fund”) seeks to provide investment results that, before fees and expenses, correspond generally to the total return of an index that tracks stocks of global companies that offer high dividend yields. The Fund’s benchmark is the S&P Global Dividend Aristocrats Index (the “Index”).
For the 12-month period ended September 30, 2017 (the “Reporting Period”), the total return for the Fund was 10.83%, and the Index was 10.87%. The Fund and Index returns reflect the reinvestment of dividends and other income. The Fund’s performance reflects the expenses of managing the Fund, including brokerage and advisory expenses. The Index is unmanaged and Index returns do not reflect fees and expenses of any kind, which would have a negative impact on returns. Fees, dividend tax withholding differences, cash and small security mis-weights contributed to the difference between the Fund’s performance and that of the Index.
The fund posted a solid overall return over the Reporting Period, with three of the four quarters having positive returns. The only negative quarter was the first quarter of the fiscal year. The performance for this final quarter of 2016 was driven by the European Central Bank’s decision to reduce the pace of asset purchases and diplomatic tensions between the United States and other major powers. All this was in spite of strong macro data and the markets embracing the surprise results of the U.S. presidential election of Donald Trump. The positive performance the remaining three quarters was mostly driven by optimism regarding the global economy as risks became less pronounced, macroeconomic data was mostly positive and many companies reported strong earnings. Other factors like potential tax reform in the United States and the commencement of the Brexit process in the United Kingdom also contributed to the fund’s positive performance. In addition, the Financial Sector drove much of the return over the Reporting Period. The sector weight was over 20% and the return for the year 12-month period was 27.38%. Almost half of the return came from this sector alone.
The Fund did not invest in derivatives during the Reporting Period.
On an individual security level, the top positive contributors to the Fund’s performance were Fortum Oyj, Essentra plc and Abertis Infraestructuras SA. The top negative contributors to the Fund’s performance were Williams Companies, Inc., Mattel, Inc. and Carillion plc.
The views expressed above reflect those of the Fund’s portfolio manager only through the Reporting Period, and do not necessarily represent the views of the Adviser as a whole. Any such views are subject to change at any time based upon market or other conditions and the Adviser disclaims any responsibility to update such views. These views may not be relied on as investment advice and, because investment decisions for a fund are based on numerous factors, may not be relied on as an indication of trading intent on behalf of any fund.
42
Table of Contents
SPDR S&P GLOBAL DIVIDEND ETF —
PERFORMANCE SUMMARY AND PORTFOLIO STATISTICS (UNAUDITED)
Performance as of September 30, 2017
| Cumulative Total Return | Average Annual Total Return | |||||||||||||||||||||||||||||
| Net Asset Value |
Market Value |
S&P Global Dividend Aristocrats Index* |
Net Asset Value |
Market Value |
S&P Global Dividend Aristocrats Index* |
|||||||||||||||||||||||||
| ONE YEAR | 10.83% | 10.81% | 10.87% | 10.83% | 10.81% | 10.87% | ||||||||||||||||||||||||
| SINCE INCEPTION (1) | 35.48% | 36.01% | 34.62% | 7.24% | 7.34% | 7.09% | ||||||||||||||||||||||||
| (1) | For the period May 29, 2013 to September 30, 2017. Since shares of the Fund did not trade in the secondary market until the day after the Fund’s inception, for the period from inception to the first day of secondary market trading in shares of the Fund (5/29/13, 5/30/13, respectively), the NAV of the Fund is used as a proxy for the secondary market trading price to calculate market returns. |
Comparison of Change in Value of a $10,000 Investment (Based on Net Asset Value)
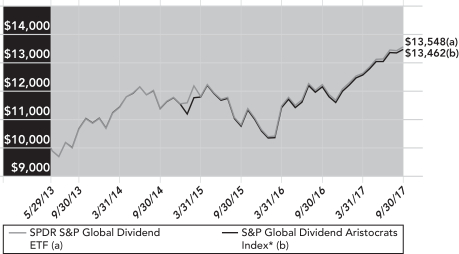
Line graph is based on cumulative total return.
| * | The S&P Global Dividend Aristocrats Index is designed to measure the performance of high dividend-yield companies included in the S&P Global BMI (Broad Market Index) that have followed a managed-dividends policy of increasing or stable dividends for at least ten consecutive years. |
Top Ten Holdings as of September 30, 2017
| Description | % of Net Assets |
|||||||
| Fortum Oyj |
2.1 | % | ||||||
| Waddell & Reed Financial, Inc. Class A |
1.9 | |||||||
| EDP — Energias de Portugal SA |
1.9 | |||||||
| Abertis Infraestructuras SA |
1.7 | |||||||
| IG Group Holdings PLC |
1.5 | |||||||
| Enagas SA |
1.4 | |||||||
| StarHub, Ltd. |
1.4 | |||||||
| Essentra PLC |
1.4 | |||||||
| Atlantia SpA |
1.3 | |||||||
| Tupperware Brands Corp. |
1.2 | |||||||
| TOTAL |
15.8 | % | ||||||
(The ten largest holdings are subject to change, and there are no guarantees the Fund will continue to remain invested in any particular company.)
Sector Breakdown as of September 30, 2017
| % of Net Assets |
||||||||
| Financials |
24.1 | % | ||||||
| Utilities |
16.5 | |||||||
| Real Estate |
14.8 | |||||||
| Consumer Discretionary |
13.2 | |||||||
| Telecommunication Services |
7.6 | |||||||
| Industrials |
6.9 | |||||||
| Consumer Staples |
6.0 | |||||||
| Health Care |
4.0 | |||||||
| Energy |
3.8 | |||||||
| Materials |
1.4 | |||||||
| Information Technology |
1.2 | |||||||
| Short-Term Investments |
3.6 | |||||||
| Liabilities in Excess of Other Assets |
(3.1 | ) | ||||||
| TOTAL |
100.0 | % | ||||||
(The Fund’s sector breakdown is expressed as a percentage of net assets and may change over time.)
The total expense ratio for SPDR S&P Global Dividend ETF as stated in the Fees and Expenses table of the prospectus dated January 31, 2017 (as supplemented October 16, 2017) is 0.40%.
Performance quoted represents past performance, which is no guarantee of future results. Investment return and principal value will fluctuate, so you may have a gain or loss when shares are sold. Current performance may be higher or lower than that quoted. Visit www.spdrs.com for most recent month-end performance. The returns do not reflect the deduction of taxes that a shareholder would pay on Fund distributions or on the redemption or sale of Fund shares. See “Note to Performance Summary” on page 1 for more information.
43
Table of Contents
SPDR S&P EMERGING MARKETS SMALL CAP ETF —
MANAGEMENT’S DISCUSSION OF FUND PERFORMANCE (UNAUDITED)
The SPDR S&P Emerging Markets Small Cap ETF (the “Fund”) seeks to provide investment results that before fees and expenses, correspond generally to the total return performance of an index that tracks the small capitalization segment of global emerging market countries. The Fund’s benchmark is the S&P Emerging Markets Under USD2 Billion Index (the “Index”).
For the 12-month period ended September 30, 2017 (the “Reporting Period”), the total return for the Fund was 18.46%, and the Index was 18.58%. The Fund and Index returns reflect the reinvestment of dividends and other income. The Fund’s performance reflects the expenses of managing the Fund, including brokerage and advisory expenses. The Index is unmanaged and Index returns do not reflect fees and expenses of any kind, which would have a negative impact on returns. Fees and expenses, cash drag, cumulative effect of security misweights contributed to the difference between the Fund’s performance and that of the Index.
The Fund declined approximately 4% over the first quarter of the fiscal year as emerging market weakness corresponded with expectations for a faster pace of Fed tightening through 2017 and market forecasts of the December 2017 Federal Funds rate roughly 0.75% higher on December 31st than at the beginning of October. In 2017, the Fund gained over 21%, helped by outperformance in Brazil as the country emerged from two years in recession. A weaker U.S. dollar that keeps hard financing costs down and the acceleration in global trade also supported the gain in emerging markets stocks across the size spectrum. Increased economic growth in China and the stabilization in the Chinese currency against the U.S. dollar helped the country have a strong advance in 2017. A smaller weight of China in the small cap Fund and the strong outperformance of the country was the main driver for the Fund’s underperformance relative to emerging market large and mid-cap stocks.
The Fund did not invest in derivatives during the Reporting Period.
On an individual security level, the top positive contributors to the Fund’s performance were Macronix International Co., Ltd., Yageo Corporation, and Autohome, Inc. Sponsored ADR Class A. The top negative contributors to the Fund’s performance were CT Environmental Group Ltd., Cemex Holdings Philippines, Inc., and Pruksa Real Estate Public Co., Ltd.
The views expressed above reflect those of the Fund’s portfolio manager only through the Reporting Period, and do not necessarily represent the views of the Adviser as a whole. Any such views are subject to change at any time based upon market or other conditions and the Adviser disclaims any responsibility to update such views. These views may not be relied on as investment advice and, because investment decisions for a fund are based on numerous factors, may not be relied on as an indication of trading intent on behalf of any fund.
44
Table of Contents
SPDR S&P EMERGING MARKETS SMALL CAP ETF —
PERFORMANCE SUMMARY AND PORTFOLIO STATISTICS (UNAUDITED)
Performance as of September 30, 2017
| Cumulative Total Return | Average Annual Total Return | |||||||||||||||||||||||||||||
| Net Asset Value |
Market Value |
S&P Emerging Markets Under USD2 Billion Index* |
Net Asset Value |
Market Value |
S&P Emerging Markets Under USD2 Billion Index* |
|||||||||||||||||||||||||
| ONE YEAR | 18.46% | 17.77% | 18.58% | 18.46% | 17.77% | 18.58% | ||||||||||||||||||||||||
| FIVE YEARS | 25.59% | 26.06% | 28.93% | 4.66% | 4.74% | 5.21% | ||||||||||||||||||||||||
| SINCE INCEPTION (1) | 20.23% | 20.61% | 37.07% | 1.98% | 2.02% | 3.42% | ||||||||||||||||||||||||
| (1) | For the period May 12, 2008 to September 30, 2017. Since shares of the Fund did not trade in the secondary market until the day after the Fund’s inception, for the period from inception to the first day of secondary market trading in shares of the Fund (5/12/08, 5/13/08, respectively), the NAV of the Fund is used as a proxy for the secondary market trading price to calculate market returns. |
Comparison of Change in Value of a $10,000 Investment (Based on Net Asset Value)

Line graph is based on cumulative total return.
| * | The S&P® Emerging Markets Under USD2 Billion Index (the “Index”) is a float adjusted market cap weighted index that represents the small capitalization segment of emerging countries included in the S&P Global BMI Index. A country will be eligible for inclusion in the Global Equity Index if it is classified as either a developed or emerging market by the S&P Global Equity Index Committee. All publicly listed companies with float-adjusted market capitalization of a minimum of $100 million and at least $50 million annual trading volume are included for each country. |
Top Ten Holdings as of September 30, 2017
| Description | % of Net Assets |
|||||||
| WNS Holdings, Ltd. ADR |
0.4 | % | ||||||
| Li Ning Co., Ltd. |
0.4 | |||||||
| Moneta Money Bank A/S |
0.3 | |||||||
| Tripod Technology Corp. |
0.3 | |||||||
| Accton Technology Corp. |
0.3 | |||||||
| Sohu.com, Inc. |
0.3 | |||||||
| Teco Electric and Machinery Co., Ltd. |
0.3 | |||||||
| Indiabulls Real Estate, Ltd. |
0.3 | |||||||
| Bharat Financial Inclusion, Ltd. |
0.3 | |||||||
| Realtek Semiconductor Corp. |
0.3 | |||||||
| TOTAL |
3.2 | % | ||||||
(The ten largest holdings are subject to change, and there are no guarantees the Fund will continue to remain invested in any particular company.)
Sector Breakdown as of September 30, 2017
| % of Net Assets |
||||||||
| Information Technology |
21.8 | % | ||||||
| Consumer Discretionary |
16.2 | |||||||
| Industrials |
14.4 | |||||||
| Materials |
10.8 | |||||||
| Real Estate |
9.3 | |||||||
| Financials |
8.2 | |||||||
| Consumer Staples |
6.3 | |||||||
| Health Care |
5.6 | |||||||
| Utilities |
3.4 | |||||||
| Energy |
2.2 | |||||||
| Telecommunication Services |
1.5 | |||||||
| Short-Term Investments |
3.5 | |||||||
| Liabilities in Excess of Other Assets |
(3.2 | ) | ||||||
| TOTAL |
100.0 | % | ||||||
(The Fund’s sector breakdown is expressed as a percentage of net assets and may change over time.)
The total expense ratio for SPDR S&P Emerging Markets Small Cap ETF as stated in the Fees and Expenses table of the prospectus dated January 31, 2017 (as supplemented October 16, 2017) is 0.65%.
Performance quoted represents past performance, which is no guarantee of future results. Investment return and principal value will fluctuate, so you may have a gain or loss when shares are sold. Current performance may be higher or lower than that quoted. Visit www.spdrs.com for most recent month-end performance. The returns do not reflect the deduction of taxes that a shareholder would pay on Fund distributions or on the redemption or sale of Fund shares. See “Note to Performance Summary” on page 1 for more information.
45
Table of Contents
September 30, 2017
| Security Description |
Shares |
Value |
||||||
| COMMON STOCKS — 99.7% |
| |||||||
| BELGIUM — 2.0% |
| |||||||
| Anheuser-Busch InBev SA |
53,309 | $ | 6,384,115 | |||||
|
|
|
|||||||
| DENMARK — 1.9% |
||||||||
| Novo Nordisk A/S Class B |
129,205 | 6,178,227 | ||||||
|
|
|
|||||||
| FRANCE — 16.8% |
||||||||
| Air Liquide SA |
27,875 | 3,718,837 | ||||||
| Airbus SE |
43,315 | 4,117,552 | ||||||
| AXA SA |
149,383 | 4,519,207 | ||||||
| BNP Paribas SA |
82,791 | 6,680,001 | ||||||
| L’Oreal SA |
17,530 | 3,728,240 | ||||||
| LVMH Moet Hennessy Louis Vuitton SE |
19,494 | 5,380,041 | ||||||
| Sanofi |
82,610 | 8,204,542 | ||||||
| Schneider Electric SE (a) |
40,192 | 3,498,526 | ||||||
| TOTAL SA (b) |
179,738 | 9,656,433 | ||||||
| Vinci SA |
40,143 | 3,815,545 | ||||||
|
|
|
|||||||
| 53,318,924 | ||||||||
|
|
|
|||||||
| GERMANY — 15.4% |
||||||||
| Allianz SE |
32,311 | 7,255,719 | ||||||
| BASF SE |
66,019 | 7,027,408 | ||||||
| Bayer AG |
59,438 | 8,101,850 | ||||||
| Daimler AG |
71,641 | 5,714,301 | ||||||
| Deutsche Telekom AG |
234,462 | 4,375,299 | ||||||
| SAP SE |
71,727 | 7,859,706 | ||||||
| Siemens AG |
61,095 | 8,609,395 | ||||||
|
|
|
|||||||
| 48,943,678 | ||||||||
|
|
|
|||||||
| ITALY — 2.1% |
||||||||
| Eni SpA |
182,437 | 3,019,477 | ||||||
| Intesa Sanpaolo SpA |
1,034,232 | 3,658,224 | ||||||
|
|
|
|||||||
| 6,677,701 | ||||||||
|
|
|
|||||||
| NETHERLANDS — 6.2% |
||||||||
| ASML Holding NV |
27,927 | 4,755,852 | ||||||
| ING Groep NV |
279,295 | 5,150,845 | ||||||
| Royal Dutch Shell PLC Class A |
324,199 | 9,800,159 | ||||||
|
|
|
|||||||
| 19,706,856 | ||||||||
|
|
|
|||||||
| SPAIN — 5.0% |
||||||||
| Banco Bilbao Vizcaya Argentaria SA |
478,771 | 4,279,547 | ||||||
| Banco Santander SA |
1,152,951 | 8,051,347 | ||||||
| Telefonica SA |
320,275 | 3,480,357 | ||||||
|
|
|
|||||||
| 15,811,251 | ||||||||
|
|
|
|||||||
| SWITZERLAND — 19.7% |
||||||||
| ABB, Ltd. |
147,717 | 3,654,759 | ||||||
| Glencore PLC (a) |
870,242 | 3,993,055 | ||||||
| Nestle SA |
223,672 | 18,747,209 | ||||||
| Novartis AG |
178,635 | 15,304,714 | ||||||
| Roche Holding AG |
50,495 | 12,900,335 | ||||||
| UBS Group AG (a) |
276,908 | 4,736,283 | ||||||
| Zurich Insurance Group AG |
10,867 | 3,317,602 | ||||||
|
|
|
|||||||
| 62,653,957 | ||||||||
|
|
|
|||||||
| UNITED KINGDOM — 30.6% |
||||||||
| AstraZeneca PLC |
90,986 | 6,048,635 | ||||||
| Barclays PLC |
1,149,693 | 2,982,395 | ||||||
| BP PLC |
1,419,736 | 9,091,555 | ||||||
| British American Tobacco PLC |
164,847 | 10,332,919 | ||||||
| Diageo PLC |
181,006 | 5,957,029 | ||||||
| GlaxoSmithKline PLC |
353,520 | 7,059,956 | ||||||
| HSBC Holdings PLC |
1,470,768 | 14,544,867 | ||||||
| Imperial Brands PLC |
68,854 | 2,941,314 | ||||||
| Lloyds Banking Group PLC |
5,169,477 | 4,697,501 | ||||||
| National Grid PLC |
245,986 | 3,051,430 | ||||||
| Prudential PLC |
185,669 | 4,450,221 | ||||||
| Reckitt Benckiser Group PLC |
48,218 | 4,407,443 | ||||||
| Rio Tinto PLC |
86,270 | 4,019,794 | ||||||
| Unilever NV |
113,072 | 6,689,029 | ||||||
| Unilever PLC |
94,177 | 5,457,167 | ||||||
| Vodafone Group PLC |
1,916,951 | 5,370,079 | ||||||
|
|
|
|||||||
| 97,101,334 | ||||||||
|
|
|
|||||||
| TOTAL COMMON STOCKS |
316,776,043 | |||||||
|
|
|
|||||||
| SHORT-TERM INVESTMENTS — 0.1% |
| |||||||
| State Street Institutional U.S. Government Money Market Fund, Class G Shares 0.96% (c)
(d) |
76,612 | 76,612 | ||||||
| State Street Navigator Securities Lending Government Money Market
Portfolio (c) (e) |
128,419 | 128,419 | ||||||
|
|
|
|||||||
| TOTAL SHORT-TERM INVESTMENTS |
205,031 | |||||||
|
|
|
|||||||
| TOTAL INVESTMENTS — 99.8% |
316,981,074 | |||||||
| OTHER ASSETS IN EXCESS OF LIABILITIES — 0.2% |
683,523 | |||||||
|
|
|
|||||||
| NET ASSETS — 100.0% |
$ | 317,664,597 | ||||||
|
|
|
|||||||
| (a) | Non-income producing security. |
| (b) | All or a portion of the shares of the security are on loan at September 30, 2017. |
| (c) | The Fund invested in certain money market funds managed by SSGA Funds Management, Inc. Amounts related to these transactions during the period ended September 30, 2017 are shown in the Affiliate Table below. |
| (d) | The rate shown is the annualized seven-day yield at September 30, 2017. |
| (e) | Investment of cash collateral for securities loaned. |
See accompanying notes to financial statements.
46
Table of Contents
SPDR STOXX Europe 50 ETF
SCHEDULE OF INVESTMENTS (continued)
September 30, 2017
The following table summarizes the value of the Fund’s investments according to the fair value hierarchy as of September 30, 2017.
| Description |
Level 1 — Quoted Prices |
Level 2 — Other Significant Observable Inputs |
Level 3 — Significant Unobservable Inputs |
Total | ||||||||||||
| ASSETS: |
||||||||||||||||
| INVESTMENTS: |
||||||||||||||||
| Common Stocks |
||||||||||||||||
| Belgium |
$ | 6,384,115 | $ | — | $ | — | $ | 6,384,115 | ||||||||
| Denmark |
6,178,227 | — | — | 6,178,227 | ||||||||||||
| France |
53,318,924 | — | — | 53,318,924 | ||||||||||||
| Germany |
48,943,678 | — | — | 48,943,678 | ||||||||||||
| Italy |
6,677,701 | — | — | 6,677,701 | ||||||||||||
| Netherlands |
19,706,856 | — | — | 19,706,856 | ||||||||||||
| Spain |
15,811,251 | — | — | 15,811,251 | ||||||||||||
| Switzerland |
62,653,957 | — | — | 62,653,957 | ||||||||||||
| United Kingdom |
97,101,334 | — | — | 97,101,334 | ||||||||||||
| Short-Term Investments |
205,031 | — | — | 205,031 | ||||||||||||
|
|
|
|
|
|
|
|
|
|||||||||
| TOTAL INVESTMENTS |
$ | 316,981,074 | $ | — | $ | — | $ | 316,981,074 | ||||||||
|
|
|
|
|
|
|
|
|
|||||||||
Affiliate Table
| Number of Shares Held at 9/30/16 |
Value at 9/30/16 |
Cost of Purchases |
Proceeds from Shares Sold |
Realized Gain (Loss) |
Change in Unrealized Appreciation/ Depreciation |
Number of Shares Held at 9/30/17 |
Value at 9/30/17 |
Dividend Income |
||||||||||||||||||||||||||||
| State Street Institutional Liquid Reserves Fund, Premier Class |
11,285 | $ | 11,285 | $ | 74 | $ | 11,359 | $ | — | $ | — | — | $ | — | $ | — | ||||||||||||||||||||
| State Street Institutional U.S. Government Money Market Fund, Class G Shares |
— | — | 7,456,167 | 7,379,555 | — | — | 76,612 | 76,612 | 1,729 | |||||||||||||||||||||||||||
| State Street Institutional U.S. Government Money Market Fund, Premier Class |
— | — | 1,875,095 | 1,875,095 | — | — | — | — | 250 | |||||||||||||||||||||||||||
| State Street Navigator Securities Lending Government Money Market Portfolio* |
1,459,114 | 1,459,114 | 59,137,739 | 60,468,434 | — | — | 128,419 | 128,419 | 65,514 | |||||||||||||||||||||||||||
|
|
|
|
|
|
|
|
|
|
|
|
|
|
|
|||||||||||||||||||||||
| TOTAL |
$ | 1,470,399 | $ | 68,469,075 | $ | 69,734,443 | $ | — | $ | — | $ | 205,031 | $ | 67,493 | ||||||||||||||||||||||
|
|
|
|
|
|
|
|
|
|
|
|
|
|
|
|||||||||||||||||||||||
| * | Effective October 5, 2016, the name of State Street Navigator Securities Lending Prime Portfolio was changed to State Street Navigator Securities Lending Government Money Market Portfolio. |
See accompanying notes to financial statements.
47
Table of Contents
SCHEDULE OF INVESTMENTS
September 30, 2017
| Security Description |
Shares |
Value |
||||||
| COMMON STOCKS — 99.9% |
| |||||||
| AUSTRIA — 3.4% |
| |||||||
| BUWOG AG (a) |
6,713 | $ | 201,260 | |||||
| Raiffeisen Bank International AG (a) |
8,105 | 271,690 | ||||||
| Wienerberger AG |
7,029 | 171,927 | ||||||
|
|
|
|||||||
| 644,877 | ||||||||
|
|
|
|||||||
| BELGIUM — 7.2% |
||||||||
| Ackermans & van Haaren NV |
1,324 | 232,202 | ||||||
| bpost SA |
5,856 | 174,113 | ||||||
| Cofinimmo SA REIT |
1,236 | 158,759 | ||||||
| Colruyt SA |
3,586 | 183,713 | ||||||
| Galapagos NV (a) |
2,638 | 268,796 | ||||||
| Ontex Group NV |
4,186 | 142,596 | ||||||
| Telenet Group Holding NV (a) |
3,047 | 201,649 | ||||||
|
|
|
|||||||
| 1,361,828 | ||||||||
|
|
|
|||||||
| FINLAND — 4.5% |
||||||||
| Amer Sports Oyj (a) |
7,088 | 188,034 | ||||||
| Kesko Oyj Class B |
4,084 | 219,051 | ||||||
| Metso Oyj |
6,410 | 235,218 | ||||||
| Outokumpu Oyj |
18,973 | 197,159 | ||||||
|
|
|
|||||||
| 839,462 | ||||||||
|
|
|
|||||||
| FRANCE — 30.2% |
||||||||
| Air France-KLM (a) |
14,799 | 233,388 | ||||||
| Amundi SA (b) |
2,949 | 245,157 | ||||||
| BioMerieux |
2,556 | 208,105 | ||||||
| Bollore SA |
53,123 | 265,590 | ||||||
| Casino Guichard Perrachon SA |
3,309 | 196,299 | ||||||
| Christian Dior SE |
624 | 199,878 | ||||||
| Cie Plastic Omnium SA |
4,003 | 171,287 | ||||||
| CNP Assurances |
8,936 | 209,487 | ||||||
| Dassault Aviation SA |
139 | 224,872 | ||||||
| Elior Group SA (b) |
6,488 | 171,810 | ||||||
| Eurazeo SA |
2,564 | 229,247 | ||||||
| Eutelsat Communications SA |
8,647 | 256,175 | ||||||
| Faurecia |
4,407 | 305,980 | ||||||
| Fonciere Des Regions |
1,939 | 201,469 | ||||||
| ICADE REIT |
1,884 | 168,092 | ||||||
| Imerys SA |
1,948 | 176,059 | ||||||
| Ipsen SA |
2,167 | 288,077 | ||||||
| JCDecaux SA |
4,575 | 171,343 | ||||||
| Lagardere SCA |
6,197 | 207,511 | ||||||
| Orpea |
2,611 | 309,290 | ||||||
| SEB SA |
1,472 | 270,079 | ||||||
| SFR Group SA (a) |
2,520 | 102,780 | ||||||
| Societe BIC SA |
1,614 | 193,478 | ||||||
| Sopra Steria Group |
986 | 183,065 | ||||||
| SPIE SA |
6,780 | 186,596 | ||||||
| Ubisoft Entertainment SA (a) |
4,204 | 289,053 | ||||||
|
|
|
|||||||
| 5,664,167 | ||||||||
|
|
|
|||||||
| GERMANY — 21.0% |
||||||||
| Aareal Bank AG |
3,580 | 151,621 | ||||||
| Aurubis AG |
2,017 | 163,433 | ||||||
| Axel Springer SE |
2,955 | 189,936 | ||||||
| Deutsche EuroShop AG |
2,884 | 108,182 | ||||||
| Drillisch AG |
2,865 | 200,985 | ||||||
| Duerr AG |
1,473 | 197,037 | ||||||
| Fraport AG Frankfurt Airport Services Worldwide |
2,227 | 211,516 | ||||||
| Freenet AG |
7,659 | 256,151 | ||||||
| Fuchs Petrolub SE Preference Shares |
4,157 | 246,162 | ||||||
| Gerresheimer AG |
1,887 | 146,096 | ||||||
| HOCHTIEF AG |
1,088 | 183,610 | ||||||
| METRO AG (a) |
10,069 | 212,895 | ||||||
| Rheinmetall AG |
2,612 | 294,463 | ||||||
| Sartorius AG Preference Shares |
2,044 | 195,440 | ||||||
| Schaeffler AG Preference Shares |
9,928 | 160,208 | ||||||
| Scout24 AG (b) |
4,956 | 202,721 | ||||||
| Software AG |
3,090 | 150,887 | ||||||
| STADA Arzneimittel AG |
1,347 | 131,120 | ||||||
| Telefonica Deutschland Holding AG |
37,929 | 212,899 | ||||||
| Uniper SE |
11,683 | 320,430 | ||||||
|
|
|
|||||||
| 3,935,792 | ||||||||
|
|
|
|||||||
| IRELAND — 2.7% |
||||||||
| Allied Irish Banks PLC |
47,009 | 282,594 | ||||||
| Glanbia PLC |
11,774 | 222,011 | ||||||
|
|
|
|||||||
| 504,605 | ||||||||
|
|
|
|||||||
| ITALY — 12.6% |
||||||||
| A2A SpA |
93,686 | 161,149 | ||||||
| Azimut Holding SpA |
6,661 | 144,106 | ||||||
| BPER Banca |
25,703 | 153,753 | ||||||
| Davide Campari-Milano SpA |
26,921 | 195,412 | ||||||
| FinecoBank Banca Fineco SpA |
23,469 | 208,088 | ||||||
| Italgas SpA |
29,274 | 164,387 | ||||||
| Moncler SpA |
9,777 | 282,255 | ||||||
| Poste Italiane SpA (b) |
27,575 | 203,093 | ||||||
| Recordati SpA |
6,095 | 281,015 | ||||||
| Saipem SpA (a) |
34,576 | 149,115 | ||||||
| Unione di Banche Italiane SpA |
60,825 | 315,385 | ||||||
| UnipolSai Assicurazioni SpA |
49,072 | 114,633 | ||||||
|
|
|
|||||||
| 2,372,391 | ||||||||
|
|
|
|||||||
| LUXEMBOURG — 0.9% |
||||||||
| RTL Group SA |
2,302 | 174,280 | ||||||
|
|
|
|||||||
| NETHERLANDS — 10.5% |
||||||||
| Aalberts Industries NV |
5,736 | 277,381 | ||||||
| ASM International NV |
3,129 | 197,865 | ||||||
| ASR Nederland NV |
7,025 | 281,081 | ||||||
| Boskalis Westminster |
5,058 | 176,845 | ||||||
| Euronext NV (b) |
2,790 | 169,831 | ||||||
| IMCD Group NV |
3,145 | 192,891 | ||||||
| Koninklijke Vopak NV |
3,964 | 173,883 | ||||||
| Philips Lighting NV (b) |
5,049 | 203,839 | ||||||
| PostNL NV |
25,706 | 110,740 | ||||||
| SBM Offshore NV |
10,454 | 189,644 | ||||||
|
|
|
|||||||
| 1,974,000 | ||||||||
|
|
|
|||||||
| SPAIN — 5.8% |
||||||||
| Bolsas y Mercados Espanoles SHMSF SA |
4,398 | 151,820 | ||||||
| Cellnex Telecom SA (b) |
9,145 | 209,305 | ||||||
| Mapfre SA |
59,435 | 193,507 | ||||||
| Mediaset Espana Comunicacion SA |
10,083 | 113,873 | ||||||
| Merlin Properties Socimi SA |
20,030 | 277,523 | ||||||
| Viscofan SA |
2,205 | 135,108 | ||||||
|
|
|
|||||||
| 1,081,136 | ||||||||
|
|
|
|||||||
See accompanying notes to financial statements.
48
Table of Contents
SPDR EURO STOXX Small Cap ETF
SCHEDULE OF INVESTMENTS (continued)
September 30, 2017
| Security Description |
Shares |
Value |
||||||
| UNITED KINGDOM — 1.1% |
| |||||||
| Dialog Semiconductor PLC (a) |
4,657 | $ | 205,713 | |||||
|
|
|
|||||||
| TOTAL COMMON STOCKS |
18,758,251 | |||||||
|
|
|
|||||||
| SHORT-TERM INVESTMENT — 0.0% (c) |
| |||||||
| State Street Institutional U.S. Government Money Market Fund, Class G Shares 0.96% (d)
(e) |
720 | 720 | ||||||
|
|
|
|||||||
| TOTAL INVESTMENTS — 99.9% |
18,758,971 | |||||||
| OTHER ASSETS IN EXCESS OF LIABILITIES — 0.1% |
9,624 | |||||||
|
|
|
|||||||
| NET ASSETS — 100.0% |
$ | 18,768,595 | ||||||
|
|
|
|||||||
| (a) | Non-income producing security. |
| (b) | Securities purchased pursuant to Rule 144A of the Securities Act of 1933, as amended. These securities, which represent 7.5% of net assets as of September 30, 2017, are considered liquid and may be resold in transactions exempt from registration, normally to qualified institutional buyers. |
| (c) | Amount is less than 0.05% of net assets. |
| (d) | The Fund invested in certain money market funds managed by SSGA Funds Management, Inc. Amounts related to these transactions during the period ended September 30, 2017 are shown in the Affiliate Table below. |
| (e) | The rate shown is the annualized seven-day yield at September 30, 2017. |
REIT = Real Estate Investment Trust
The following table summarizes the value of the Fund’s investments according to the fair value hierarchy as of September 30, 2017.
| Description |
Level 1 — Quoted Prices |
Level 2 — Other Significant Observable Inputs |
Level 3 — Significant Unobservable Inputs |
Total | ||||||||||||
| ASSETS: |
||||||||||||||||
| INVESTMENTS: |
||||||||||||||||
| Common Stocks |
||||||||||||||||
| Austria |
$ | 644,877 | $ | — | $ | — | $ | 644,877 | ||||||||
| Belgium |
1,361,828 | — | — | 1,361,828 | ||||||||||||
| Finland |
839,462 | — | — | 839,462 | ||||||||||||
| France |
5,561,387 | 102,780 | — | 5,664,167 | ||||||||||||
| Germany |
3,935,792 | — | — | 3,935,792 | ||||||||||||
| Ireland |
504,605 | — | — | 504,605 | ||||||||||||
| Italy |
2,372,391 | — | — | 2,372,391 | ||||||||||||
| Luxembourg |
174,280 | — | — | 174,280 | ||||||||||||
| Netherlands |
1,974,000 | — | — | 1,974,000 | ||||||||||||
| Spain |
1,081,136 | — | — | 1,081,136 | ||||||||||||
| United Kingdom |
205,713 | — | — | 205,713 | ||||||||||||
| Short-Term Investment |
720 | — | — | 720 | ||||||||||||
|
|
|
|
|
|
|
|
|
|||||||||
| TOTAL INVESTMENTS |
$ | 18,656,191 | $ | 102,780 | $ | — | $ | 18,758,971 | ||||||||
|
|
|
|
|
|
|
|
|
|||||||||
Affiliate Table
| Number of Shares Held at 9/30/16 |
Value at 9/30/16 |
Cost of Purchases |
Proceeds from Shares Sold |
Realized Gain (Loss) |
Change in Unrealized Appreciation/ Depreciation |
Number of Shares Held at 9/30/17 |
Value at 9/30/17 |
Dividend Income |
||||||||||||||||||||||||||||
| State Street Institutional Liquid Reserves Fund, Premier Class |
906 | $ | 906 | $ | — | $ | 906 | $ | — | $ | — | — | $ | — | $ | — | ||||||||||||||||||||
| State Street Institutional U.S. Government Money Market Fund, Class G Shares |
— | — | 212,414 | 211,694 | — | — | 720 | 720 | 15 | |||||||||||||||||||||||||||
| State Street Institutional U.S. Government Money Market Fund, Premier Class |
— | — | 48,623 | 48,623 | — | — | — | — | 7 | |||||||||||||||||||||||||||
|
|
|
|
|
|
|
|
|
|
|
|
|
|
|
|||||||||||||||||||||||
| TOTAL |
$ | 906 | $ | 261,037 | $ | 261,223 | $ | — | $ | — | $ | 720 | $ | 22 | ||||||||||||||||||||||
|
|
|
|
|
|
|
|
|
|
|
|
|
|
|
|||||||||||||||||||||||
See accompanying notes to financial statements.
49
Table of Contents
SPDR S&P Emerging Asia Pacific ETF
SCHEDULE OF INVESTMENTS
September 30, 2017
| Security Description |
Shares |
Value |
||||||
| COMMON STOCKS — 99.2% |
| |||||||
| CHINA — 45.2% |
| |||||||
| 21Vianet Group, Inc. ADR (a) (b) |
8,962 | $ | 50,994 | |||||
| 500.com, Ltd. Class A, ADR (a) (b) |
1,634 | 17,974 | ||||||
| 51job, Inc. ADR (b) |
2,670 | 161,829 | ||||||
| 58.com, Inc. ADR (b) |
4,082 | 257,737 | ||||||
| AAC Technologies Holdings, Inc. |
77,000 | 1,293,405 | ||||||
| Agile Group Holdings, Ltd. (a) |
531,598 | 775,887 | ||||||
| Agricultural Bank of China, Ltd. Class H |
2,673,000 | 1,197,780 | ||||||
| Air China, Ltd. Class H |
379,414 | 315,259 | ||||||
| Alibaba Group Holding, Ltd. ADR (a) (b) |
131,185 | 22,656,961 | ||||||
| Aluminum Corp. of China, Ltd. Class H (a) (b) |
688,304 | 617,744 | ||||||
| Angang Steel Co., Ltd. Class H (a) |
391,244 | 345,125 | ||||||
| Anhui Conch Cement Co., Ltd. Class H |
234,250 | 934,217 | ||||||
| Anhui Expressway Co., Ltd. Class H |
32,000 | 24,377 | ||||||
| ANTA Sports Products, Ltd. |
105,000 | 441,606 | ||||||
| Autohome, Inc. ADR (b) |
4,815 | 289,285 | ||||||
| AVIC International Holding HK, Ltd. (b) |
516,000 | 38,317 | ||||||
| AviChina Industry & Technology Co., Ltd. Class H |
436,000 | 263,474 | ||||||
| BAIC Motor Corp., Ltd. Class H (a) (c) |
197,000 | 186,894 | ||||||
| Baidu, Inc. ADR (b) |
32,624 | 8,080,639 | ||||||
| Bank of China, Ltd. Class H |
9,010,466 | 4,441,381 | ||||||
| Bank of Communications Co., Ltd. Class H |
2,461,630 | 1,796,419 | ||||||
| BBMG Corp. Class H |
239,000 | 121,172 | ||||||
| Beijing Capital International Airport Co., Ltd. Class H |
108,000 | 160,948 | ||||||
| Beijing Capital Land, Ltd. Class H |
120,000 | 66,985 | ||||||
| Beijing Enterprises Holdings, Ltd. |
74,000 | 397,916 | ||||||
| Beijing Enterprises Water Group, Ltd. (b) |
442,000 | 355,945 | ||||||
| Bitauto Holdings, Ltd. ADR (a) (b) |
2,503 | 111,834 | ||||||
| Boyaa Interactive International, Ltd. (a) (b) |
94,200 | 37,628 | ||||||
| Brilliance China Automotive Holdings, Ltd. |
376,000 | 1,001,293 | ||||||
| Byd Co., Ltd. Class H (a) |
91,800 | 851,513 | ||||||
| BYD Electronic International Co., Ltd. (a) |
109,500 | 323,844 | ||||||
| C.banner International Holdings, Ltd. (b) |
180,000 | 63,375 | ||||||
| CAR, Inc. (a) (b) |
177,043 | 161,840 | ||||||
| CGN Power Co., Ltd. Class H (c) |
1,262,000 | 348,998 | ||||||
| China Aerospace International Holdings, Ltd. |
300,000 | 39,561 | ||||||
| China Agri-Industries Holdings, Ltd. |
265,000 | 123,497 | ||||||
| China Animal Healthcare, Ltd. (a) (b) (d) |
305,700 | — | ||||||
| China Biologic Products Holdings, Inc. (b) |
1,877 | 173,191 | ||||||
| China Cinda Asset Management Co., Ltd. Class H |
1,074,600 | 396,232 | ||||||
| China CITIC Bank Corp., Ltd. Class H |
1,302,341 | 827,021 | ||||||
| China Coal Energy Co., Ltd. Class H (a) |
641,000 | 302,827 | ||||||
| China Communications Construction Co., Ltd. Class H |
578,000 | 721,510 | ||||||
| China Conch Venture Holdings, Ltd. |
144,600 | 281,399 | ||||||
| China Construction Bank Corp. Class H |
10,873,148 | 9,020,702 | ||||||
| China Dongxiang Group Co., Ltd. |
470,000 | 81,836 | ||||||
| China Eastern Airlines Corp., Ltd. Class H |
186,000 | 91,920 | ||||||
| China Everbright International, Ltd. |
275,000 | 345,039 | ||||||
| China Everbright, Ltd. |
118,000 | 271,330 | ||||||
| China Evergrande Group (a) (b) |
538,000 | 1,876,976 | ||||||
| China Fangda Group Co., Ltd. Class B |
116,550 | 80,578 | ||||||
| China Fire Safety Enterprise Group, Ltd. (b) |
404,227 | 24,583 | ||||||
| China Galaxy Securities Co., Ltd. Class H |
343,600 | 301,338 | ||||||
| China Harmony New Energy Auto Holding, Ltd. (a) (b) |
70,000 | 40,688 | ||||||
| China Hongqiao Group, Ltd. (a) (b) |
106,000 | 95,676 | ||||||
| China Huishan Dairy Holdings Co., Ltd. (a) (b) (d) |
549,000 | — | ||||||
| China Huiyuan Juice Group, Ltd. (b) |
136,000 | 41,963 | ||||||
| China International Marine Containers Group Co., Ltd. Class H |
82,000 | 154,957 | ||||||
| China Lesso Group Holdings, Ltd. |
135,000 | 92,124 | ||||||
| China Life Insurance Co., Ltd. Class H |
921,708 | 2,743,635 | ||||||
| China Lilang, Ltd. |
81,000 | 67,511 | ||||||
| China Lodging Group, Ltd. ADR (b) |
3,866 | 459,358 | ||||||
| China Longyuan Power Group Corp., Ltd. Class H |
471,000 | 350,957 | ||||||
| China Machinery Engineering Corp. Class H |
84,000 | 52,482 | ||||||
| China Medical System Holdings, Ltd. |
157,000 | 274,173 | ||||||
| China Mengniu Dairy Co., Ltd. (b) |
385,780 | 1,079,198 | ||||||
| China Merchants Bank Co., Ltd. Class H |
611,760 | 2,149,975 | ||||||
| China Merchants Port Holdings Co., Ltd. |
346,743 | 1,069,879 | ||||||
| China Minsheng Banking Corp., Ltd. Class H (a) |
852,600 | 781,571 | ||||||
| China Mobile, Ltd. |
687,136 | 6,963,117 | ||||||
| China Molybdenum Co., Ltd. Class H |
402,000 | 241,384 | ||||||
| China National Building Material Co., Ltd. Class H (a) |
408,000 | 282,597 | ||||||
| China Oilfield Services, Ltd. Class H |
280,557 | 256,825 | ||||||
| China Overseas Land & Investment, Ltd. |
677,084 | 2,201,843 | ||||||
| China Pacific Insurance Group Co., Ltd. Class H |
285,800 | 1,231,281 | ||||||
| China Petroleum & Chemical Corp. Class H |
3,109,726 | 2,329,099 | ||||||
| China Power International Development, Ltd. |
266,000 | 87,524 | ||||||
| China Railway Construction Corp., Ltd. Class H |
238,000 | 301,663 | ||||||
| China Railway Group, Ltd. Class H |
601,000 | 497,069 | ||||||
| China Resources Beer Holdings Co., Ltd. |
313,357 | 848,516 | ||||||
| China Resources Gas Group, Ltd. |
86,000 | 299,487 | ||||||
| China Resources Land, Ltd. |
418,767 | 1,281,387 | ||||||
| China Resources Phoenix Healthcare Holdings Co., Ltd. (a) |
71,000 | 88,538 | ||||||
See accompanying notes to financial statements.
50
Table of Contents
SPDR S&P Emerging Asia Pacific ETF
SCHEDULE OF INVESTMENTS (continued)
September 30, 2017
| Security Description |
Shares |
Value |
||||||
| China Resources Power Holdings Co., Ltd. |
304,437 | $ | 549,575 | |||||
| China Shengmu Organic Milk, Ltd. (a) (b) (c) |
333,000 | 59,261 | ||||||
| China Shenhua Energy Co., Ltd. Class H |
466,540 | 1,096,659 | ||||||
| China Silver Group, Ltd. (a) |
86,000 | 25,765 | ||||||
| China Singyes Solar Technologies Holdings, Ltd. (a) (b) |
69,600 | 23,257 | ||||||
| China South City Holdings, Ltd. |
380,000 | 108,492 | ||||||
| China Southern Airlines Co., Ltd. Class H |
220,000 | 151,536 | ||||||
| China State Construction International Holdings, Ltd. (a) |
214,000 | 311,793 | ||||||
| China Taiping Insurance Holdings Co., Ltd. |
117,741 | 315,053 | ||||||
| China Telecom Corp., Ltd. Class H |
2,149,320 | 1,100,705 | ||||||
| China Travel International Investment Hong Kong, Ltd. |
256,000 | 93,738 | ||||||
| China Unicom Hong Kong, Ltd. (b) |
738,172 | 1,026,355 | ||||||
| China Vanke Co., Ltd. Class H |
134,900 | 443,869 | ||||||
| China Yurun Food Group, Ltd. (b) |
190,659 | 22,701 | ||||||
| Chinasoft International, Ltd. (b) |
192,000 | 106,439 | ||||||
| Chong Sing Holdings FinTech Gr (a) (b) |
2,104,000 | 285,537 | ||||||
| Chongqing Changan Automobile Co., Ltd. Class B |
93,200 | 123,261 | ||||||
| Chongqing Rural Commercial Bank Co., Ltd. Class H |
192,000 | 121,679 | ||||||
| CITIC Resources Holdings, Ltd. |
338,000 | 38,947 | ||||||
| CITIC Securities Co., Ltd. Class H |
204,500 | 449,807 | ||||||
| CITIC Telecom International Holdings, Ltd. |
191,000 | 55,021 | ||||||
| CITIC, Ltd. |
581,000 | 858,404 | ||||||
| CNOOC, Ltd. |
1,885,249 | 2,432,984 | ||||||
| Cogobuy Group (c) |
66,000 | 40,560 | ||||||
| Colour Life Services Group Co., Ltd. (a) (b) |
85,000 | 55,174 | ||||||
| Consun Pharmaceutical Group, Ltd. |
170,400 | 143,551 | ||||||
| Coolpad Group, Ltd. (b) (d) |
437,400 | 20,160 | ||||||
| COSCO SHIPPING Development Co., Ltd. Class H (b) |
1,199,339 | 271,785 | ||||||
| COSCO SHIPPING Energy Transportation Co., Ltd. Class H |
565,215 | 313,337 | ||||||
| COSCO SHIPPING Holdings Co., Ltd. Class H (b) |
25,500 | 13,679 | ||||||
| COSCO SHIPPING Ports, Ltd. |
37,118 | 41,297 | ||||||
| Cosmo Lady China Holdings Co., Ltd. (a) (c) |
96,000 | 37,733 | ||||||
| Country Garden Holdings Co., Ltd. |
706,333 | 1,123,159 | ||||||
| CRRC Corp., Ltd. Class H |
485,000 | 430,934 | ||||||
| CSG Holding Co., Ltd. Class B |
124,000 | 76,679 | ||||||
| CSPC Pharmaceutical Group, Ltd. |
274,000 | 458,847 | ||||||
| CT Environmental Group, Ltd. (a) |
378,000 | 54,203 | ||||||
| Ctrip.com International, Ltd. ADR (b) |
36,060 | 1,901,804 | ||||||
| Datang International Power Generation Co., Ltd. Class H (b) |
362,000 | 115,867 | ||||||
| Dazhong Transportation Group Co., Ltd. Class B |
103,050 | 71,414 | ||||||
| Dongfang Electric Corp., Ltd. Class H (b) |
12,800 | 12,635 | ||||||
| Dongfeng Motor Group Co., Ltd. Class H |
460,468 | 608,400 | ||||||
| Fang Holdings, Ltd. ADR (a) (b) |
25,400 | 102,870 | ||||||
| Fanhua, Inc. ADR |
8,166 | 102,647 | ||||||
| Far East Horizon, Ltd. |
146,000 | 137,202 | ||||||
| FIH Mobile, Ltd. |
307,000 | 97,083 | ||||||
| First Tractor Co., Ltd. Class H (a) |
70,000 | 33,428 | ||||||
| Fufeng Group, Ltd. (b) |
107,000 | 73,290 | ||||||
| Future Land Holdings Co., Ltd. Class A |
139,621 | 375,598 | ||||||
| Geely Automobile Holdings, Ltd. |
565,000 | 1,591,407 | ||||||
| GF Securities Co., Ltd. Class H |
105,000 | 228,264 | ||||||
| Golden Eagle Retail Group, Ltd. (a) |
90,000 | 105,893 | ||||||
| GOME Retail Holdings, Ltd. (a) |
1,511,322 | 170,275 | ||||||
| Goodbaby International Holdings, Ltd. |
243,000 | 134,089 | ||||||
| Great Wall Motor Co., Ltd. Class H (a) |
344,500 | 423,419 | ||||||
| Greentown China Holdings, Ltd. (a) |
99,000 | 119,144 | ||||||
| Guangdong Investment, Ltd. |
340,000 | 484,925 | ||||||
| Guangshen Railway Co., Ltd. Class H |
68,500 | 40,167 | ||||||
| Guangzhou Automobile Group Co., Ltd. Class H |
442,032 | 1,023,204 | ||||||
| Guangzhou Baiyunshan Pharmaceutical Holdings Co., Ltd. Class H |
88,000 | 229,839 | ||||||
| Guangzhou R&F Properties Co., Ltd. Class H |
374,576 | 868,018 | ||||||
| Guotai Junan International Holdings, Ltd. (a) |
270,000 | 86,074 | ||||||
| Haitian International Holdings, Ltd. |
67,000 | 192,576 | ||||||
| Haitong Securities Co., Ltd. Class H |
323,600 | 522,851 | ||||||
| Health and Happiness H&H International Holdings, Ltd. (a) (b) |
24,000 | 117,224 | ||||||
| Hengan International Group Co., Ltd. |
84,500 | 782,177 | ||||||
| HNA Holding Group Co., Ltd. (a) (b) |
433,400 | 20,253 | ||||||
| Huadian Fuxin Energy Corp., Ltd. Class H |
218,000 | 50,239 | ||||||
| Huadian Power International Corp., Ltd. Class H |
218,000 | 88,197 | ||||||
| Huaneng Power International, Inc. Class H |
582,472 | 360,190 | ||||||
| Huaneng Renewables Corp., Ltd. Class H |
380,000 | 125,520 | ||||||
| Huatai Securities Co., Ltd. Class H (c) |
70,600 | 156,373 | ||||||
| Huishang Bank Corp., Ltd. Class H |
641,000 | 315,958 | ||||||
| Industrial & Commercial Bank of China, Ltd. Class H |
9,340,138 | 6,935,716 | ||||||
| Inner Mongolia Yitai Coal Co., Ltd. Class B |
195,181 | 292,967 | ||||||
| JD.com, Inc. ADR (b) |
96,424 | 3,683,397 | ||||||
| Jiangsu Expressway Co., Ltd. Class H |
356,299 | 545,577 | ||||||
| Jiangxi Copper Co., Ltd. Class H |
261,578 | 413,263 | ||||||
| JinkoSolar Holding Co., Ltd. ADR (a) (b) |
3,132 | 78,143 | ||||||
| Jumei International Holding, Ltd. ADR (a) (b) |
2,409 | 6,986 | ||||||
| Kama Co., Ltd. Class B (b) |
115,049 | 129,660 | ||||||
| Kangda International Environmental Co., Ltd. (b) (c) |
225,000 | 48,683 | ||||||
| Kingdee International Software Group Co., Ltd. (a) (b) |
228,000 | 100,416 | ||||||
| Kingsoft Corp., Ltd. |
101,000 | 235,344 | ||||||
See accompanying notes to financial statements.
51
Table of Contents
SPDR S&P Emerging Asia Pacific ETF
SCHEDULE OF INVESTMENTS (continued)
September 30, 2017
| Security Description |
Shares |
Value |
||||||
| Konka Group Co., Ltd. Class B (b) |
364,400 | $ | 152,558 | |||||
| Kunlun Energy Co., Ltd. (a) |
396,000 | 386,839 | ||||||
| KWG Property Holding, Ltd. |
166,951 | 178,478 | ||||||
| Lao Feng Xiang Co., Ltd. Class B |
57,179 | 220,940 | ||||||
| Launch Tech Co., Ltd. Class H |
25,000 | 29,607 | ||||||
| Lenovo Group, Ltd. |
987,703 | 545,022 | ||||||
| Leyou Technologies Holdings, Ltd. (b) |
225,800 | 54,060 | ||||||
| Li Ning Co., Ltd. (b) |
286,874 | 255,629 | ||||||
| Lifetech Scientific Corp. (a) (b) |
266,000 | 62,663 | ||||||
| Livzon Pharmaceutical Group, Inc. Class H |
23,627 | 136,728 | ||||||
| Luoyang Glass Co., Ltd. Class H (a) (b) |
58,153 | 33,355 | ||||||
| Luthai Textile Co., Ltd. Class B |
48,000 | 54,203 | ||||||
| Luye Pharma Group, Ltd. (a) |
198,000 | 115,595 | ||||||
| Maanshan Iron & Steel Co., Ltd. Class H (a) (b) |
696,971 | 340,869 | ||||||
| Metallurgical Corp. of China, Ltd. Class H |
424,000 | 139,511 | ||||||
| Minth Group, Ltd. |
86,000 | 450,331 | ||||||
| Nanjing Panda Electronics Co., Ltd. Class H |
29,000 | 18,453 | ||||||
| NetEase, Inc. ADR |
10,234 | 2,699,832 | ||||||
| New China Life Insurance Co., Ltd. Class H |
75,800 | 428,460 | ||||||
| New Oriental Education & Technology Group, Inc. ADR |
13,786 | 1,216,752 | ||||||
| Noah Holdings, Ltd. ADS (a) (b) |
2,445 | 78,509 | ||||||
| Ourgame International Holdings, Ltd. (b) |
43,000 | 11,451 | ||||||
| People’s Insurance Co. Group of China, Ltd. Class H |
536,000 | 239,497 | ||||||
| PetroChina Co., Ltd. Class H |
2,459,208 | 1,558,513 | ||||||
| PICC Property & Casualty Co., Ltd. Class H |
540,289 | 953,203 | ||||||
| Ping An Insurance Group Co. of China, Ltd. Class H |
586,228 | 4,499,516 | ||||||
| Poly Culture Group Corp., Ltd. Class H |
31,400 | 75,096 | ||||||
| Poly Property Group Co., Ltd. (b) |
272,000 | 139,644 | ||||||
| Renhe Commercial Holdings Co., Ltd. (a) (b) |
2,028,000 | 46,736 | ||||||
| Semiconductor Manufacturing International Corp. (a) (b) |
567,883 | 641,265 | ||||||
| Shandong Airlines Co., Ltd. Class B |
23,100 | 41,168 | ||||||
| Shandong Chenming Paper Holdings, Ltd. Class H |
49,900 | 94,552 | ||||||
| Shandong Weigao Group Medical Polymer Co., Ltd. Class H |
224,000 | 158,593 | ||||||
| Shang Gong Group Co., Ltd. Class B (b) |
156,600 | 162,864 | ||||||
| Shanghai Baosight Software Co., Ltd. Class B |
36,700 | 56,371 | ||||||
| Shanghai Dasheng Agricultural Finance Technology Co., Ltd. Class H (a) |
315,000 | 25,004 | ||||||
| Shanghai Electric Group Co., Ltd. Class H (a) (b) |
448,418 | 197,493 | ||||||
| Shanghai Fosun Pharmaceutical Group Co., Ltd. Class H |
36,000 | 149,334 | ||||||
| Shanghai Fudan-Zhangjiang Bio-Pharmaceutical Co., Ltd. Class H |
187,000 | 95,527 | ||||||
| Shanghai Haixin Group Co. Class B |
91,600 | 64,028 | ||||||
| Shanghai Highly Group Co., Ltd. Class B |
148,100 | 132,105 | ||||||
| Shanghai Industrial Holdings, Ltd. |
47,000 | 142,311 | ||||||
| Shanghai Jinjiang International Industrial Investment Co., Ltd. Class B |
13,500 | 18,671 | ||||||
| Shanghai Jinjiang International Travel Co., Ltd. Class B |
28,674 | 90,323 | ||||||
| Shanghai Jinqiao Export Processing Zone Development Co., Ltd. Class B |
40,400 | 58,418 | ||||||
| Shanghai Lujiazui Finance & Trade Zone Development Co., Ltd. Class B |
149,953 | 238,575 | ||||||
| Shanghai Mechanical and Electrical Industry Co., Ltd. Class B |
52,084 | 106,824 | ||||||
| Shanghai Pharmaceuticals Holding Co., Ltd. Class H |
67,400 | 164,645 | ||||||
| Shanghai Prime Machinery Co., Ltd. Class H |
594,000 | 125,482 | ||||||
| Shanghai Waigaoqiao Free Trade Zone Group Co., Ltd. Class B |
10,400 | 16,370 | ||||||
| Shanghai Zhenhua Heavy Industries Co., Ltd. Class B |
111,100 | 59,772 | ||||||
| Shengjing Bank Co., Ltd. Class H (c) |
18,000 | 14,196 | ||||||
| Shenzhen Expressway Co., Ltd. Class H |
29,000 | 28,143 | ||||||
| Shenzhen Investment, Ltd. |
318,888 | 144,528 | ||||||
| Shenzhou International Group Holdings, Ltd. |
53,000 | 415,276 | ||||||
| Shunfeng International Clean Energy, Ltd. (b) |
218,700 | 12,040 | ||||||
| SINA Corp. (b) |
9,804 | 1,124,029 | ||||||
| Sino-Ocean Group Holding, Ltd. |
819,211 | 546,441 | ||||||
| Sinopec Oilfield Service Corp. Class H (a) (b) |
190,000 | 33,083 | ||||||
| Sinopec Shanghai Petrochemical Co., Ltd. Class H |
592,878 | 352,962 | ||||||
| Sinopharm Group Co., Ltd. Class H |
116,000 | 510,889 | ||||||
| Sinotrans, Ltd. Class H |
232,000 | 117,920 | ||||||
| SITC International Holdings Co., Ltd. |
190,000 | 172,225 | ||||||
| Sohu.com, Inc. (b) |
3,924 | 213,662 | ||||||
| Sun King Power Electronics Group |
151,300 | 33,512 | ||||||
| Sunac China Holdings, Ltd. (a) |
274,000 | 1,254,113 | ||||||
| Sunny Optical Technology Group Co., Ltd. |
123,800 | 1,968,576 | ||||||
| TAL Education Group ADR |
36,645 | 1,235,303 | ||||||
| TCL Multimedia Technology Holdings, Ltd. (a) |
135,000 | 63,951 | ||||||
| Tencent Holdings, Ltd. |
657,770 | 28,312,734 | ||||||
| Tian Ge Interactive Holdings, Ltd. (a) (c) |
83,000 | 60,464 | ||||||
| Tianjin ZhongXin Pharmaceutical Group Corp., Ltd. |
33,545 | 36,229 | ||||||
| Tianneng Power International, Ltd. |
96,000 | 99,187 | ||||||
| Tingyi Cayman Islands Holding Corp. |
380,383 | 572,715 | ||||||
| Tong Ren Tang Technologies Co., Ltd. Class H |
137,000 | 175,225 | ||||||
| TravelSky Technology, Ltd. Class H |
98,000 | 255,329 | ||||||
| Tsingtao Brewery Co., Ltd. Class H |
86,000 | 329,215 | ||||||
| Uni-President China Holdings, Ltd. |
189,000 | 186,079 | ||||||
| Vipshop Holdings, Ltd. ADR (b) |
36,064 | 317,003 | ||||||
| Want Want China Holdings, Ltd. (a) |
1,061,000 | 745,758 | ||||||
See accompanying notes to financial statements.
52
Table of Contents
SPDR S&P Emerging Asia Pacific ETF
SCHEDULE OF INVESTMENTS (continued)
September 30, 2017
| Security Description |
Shares |
Value |
||||||
| Weibo Corp. ADR (a) (b) |
1,941 | $ | 192,043 | |||||
| Weichai Power Co., Ltd. Class H |
53,000 | 58,084 | ||||||
| West China Cement, Ltd. (b) |
386,000 | 62,763 | ||||||
| Wisdom Sports Group (a) (b) |
148,000 | 24,064 | ||||||
| Xiamen International Port Co., Ltd. Class H |
134,000 | 25,391 | ||||||
| Xinjiang Goldwind Science & Technology Co., Ltd. Class H (a) |
33,859 | 42,309 | ||||||
| Xinyi Solar Holdings, Ltd. |
265,200 | 94,391 | ||||||
| Yangzijiang Shipbuilding Holdings, Ltd. |
271,300 | 285,695 | ||||||
| Yantai Changyu Pioneer Wine Co., Ltd. Class B |
29,153 | 73,081 | ||||||
| Yanzhou Coal Mining Co., Ltd. Class H |
378,882 | 373,027 | ||||||
| Yestar Healthcare Holdings Co., Ltd. (a) |
375,000 | 165,638 | ||||||
| YY, Inc. ADR (b) |
3,458 | 300,085 | ||||||
| Zhejiang Expressway Co., Ltd. Class H |
218,000 | 271,010 | ||||||
| Zhengzhou Coal Mining Machinery Group Co., Ltd. Class H |
54,200 | 35,529 | ||||||
| Zhuzhou CRRC Times Electric Co., Ltd. Class H |
77,700 | 435,220 | ||||||
| Zijin Mining Group Co., Ltd. Class H |
982,685 | 337,178 | ||||||
| ZTE Corp. Class H (b) |
94,440 | 308,928 | ||||||
|
|
|
|||||||
| 187,112,182 | ||||||||
|
|
|
|||||||
| HONG KONG — 1.9% |
| |||||||
| Alibaba Pictures Group, Ltd. (a) (b) |
1,190,107 | 190,461 | ||||||
| Beijing Enterprises Clean Energy Group, Ltd. (a) (b) |
1,990,400 | 48,163 | ||||||
| Beijing Enterprises Medical & Health Group, Ltd. (a) (b) |
404,500 | 22,269 | ||||||
| BEP International Holdings, Ltd. (b) |
1,050,000 | 21,912 | ||||||
| Carnival Group International Holdings, Ltd. (a) (b) |
1,070,000 | 56,851 | ||||||
| CCT Land Holdings, Ltd. (b) |
10,493,000 | 13,434 | ||||||
| China All Access Holdings, Ltd. |
180,000 | 56,231 | ||||||
| China Beidahuang Industry Group Holdings, Ltd. Class A (b) |
429,600 | 21,176 | ||||||
| China Chengtong Development Group, Ltd. (b) |
346,074 | 25,698 | ||||||
| China Fiber Optic Network System Group, Ltd. (b) (d) |
686,800 | — | ||||||
| China Financial International Investments, Ltd. (b) |
540,000 | 16,316 | ||||||
| China Gas Holdings, Ltd. |
294,000 | 880,792 | ||||||
| China High Speed Transmission Equipment Group Co., Ltd. (a) |
8,000 | 10,263 | ||||||
| China Jicheng Holdings, Ltd. (a) (b) (c) |
2,311,500 | 2,959 | ||||||
| China Minsheng Drawin Technology Group, Ltd. (b) |
581,658 | 19,362 | ||||||
| China NT Pharma Group Co., Ltd. |
97,500 | 25,465 | ||||||
| China Nuclear Energy Technology Corp., Ltd. (b) |
102,000 | 21,025 | ||||||
| China Overseas Property Holdings, Ltd. (a) |
247,361 | 59,222 | ||||||
| China Soft Power Technology Holdings, Ltd. (a) (b) |
266,000 | 5,653 | ||||||
| Citychamp Watch & Jewellery Group, Ltd. (a) |
450,000 | 104,280 | ||||||
| Comba Telecom Systems Holdings, Ltd. |
345,847 | 65,975 | ||||||
| CP Pokphand Co., Ltd. |
830,000 | 66,947 | ||||||
| Dawnrays Pharmaceutical Holdings, Ltd. |
113,000 | 65,103 | ||||||
| Digital China Holdings, Ltd. (a) (b) |
142,000 | 79,993 | ||||||
| EVA Precision Industrial Holdings, Ltd. |
398,000 | 56,051 | ||||||
| Fullshare Holdings, Ltd. (a) (b) |
636,100 | 276,895 | ||||||
| GCL-Poly Energy Holdings, Ltd. (a) (b) |
892,000 | 122,196 | ||||||
| Haier Electronics Group Co., Ltd. (b) |
138,000 | 336,400 | ||||||
| Hanergy Thin Film Power Group, Ltd. (a) (b) (d) |
5,962,000 | — | ||||||
| Hi Sun Technology China, Ltd. (b) |
288,000 | 66,370 | ||||||
| Hua Han Health Industry Holdings, Ltd. (a) (b) (d) |
890,400 | 45,314 | ||||||
| Huabao International Holdings, Ltd. |
18,000 | 11,131 | ||||||
| Imperial Pacific International Holdings, Ltd. (a) (b) |
7,096,300 | 105,390 | ||||||
| Joy City Property, Ltd. |
444,000 | 81,857 | ||||||
| Kingboard Chemical Holdings, Ltd. |
118,200 | 625,753 | ||||||
| Lee & Man Paper Manufacturing, Ltd. |
220,000 | 281,665 | ||||||
| Munsun Capital Group, Ltd. (a) (b) |
478,200 | 5,510 | ||||||
| National Agricultural Holdings, Ltd. (a) (b) |
112,000 | 17,064 | ||||||
| NetDragon Websoft Holdings, Ltd. (a) |
53,500 | 178,774 | ||||||
| Newtree Group Holdings, Ltd. (b) |
306,000 | 17,238 | ||||||
| Nine Dragons Paper Holdings, Ltd. |
180,000 | 353,976 | ||||||
| North Mining Shares Co., Ltd. (b) |
2,470,000 | 51,230 | ||||||
| Qianhai Health Holdings, Ltd. (a) (b) |
786,374 | 11,578 | ||||||
| Shimao Property Holdings, Ltd. |
157,500 | 341,589 | ||||||
| Sino Biopharmaceutical, Ltd. |
621,000 | 656,722 | ||||||
| Skyworth Digital Holdings, Ltd. |
254,243 | 129,877 | ||||||
| SSY Group, Ltd. |
502,691 | 229,763 | ||||||
| Sun Art Retail Group, Ltd. |
226,000 | 209,776 | ||||||
| Tech Pro Technology Development, Ltd. (b) |
1,644,800 | 14,320 | ||||||
| Tibet Water Resources, Ltd. (a) (b) |
333,000 | 129,180 | ||||||
| United Laboratories International Holdings, Ltd. (a) (b) |
112,000 | 83,455 | ||||||
| Victory City International Holdings, Ltd. (b) |
849,915 | 21,872 | ||||||
| Vinda International Holdings, Ltd. |
42,000 | 78,938 | ||||||
| Vision Values Holdings, Ltd. (b) |
480,000 | 36,872 | ||||||
| Wasion Group Holdings, Ltd. (a) |
74,000 | 37,518 | ||||||
| WH Group, Ltd. (c) |
888,500 | 944,160 | ||||||
| Xinyi Glass Holdings, Ltd. (b) |
322,000 | 318,261 | ||||||
|
|
|
|||||||
| 7,756,245 | ||||||||
|
|
|
|||||||
| INDIA — 17.7% |
||||||||
| Adani Ports & Special Economic Zone, Ltd. |
110,030 | 634,626 | ||||||
| Adani Power, Ltd. (b) |
79,989 | 36,186 | ||||||
| AIA Engineering, Ltd. |
9,352 | 190,233 | ||||||
| Ajanta Pharma, Ltd. |
3,695 | 64,193 | ||||||
| Alembic Pharmaceuticals, Ltd. |
10,907 | 84,516 | ||||||
| Apollo Hospitals Enterprise, Ltd. |
30,514 | 469,482 | ||||||
| Apollo Tyres, Ltd. |
51,929 | 195,370 | ||||||
| Arvind, Ltd. |
30,700 | 174,039 | ||||||
| Asian Paints, Ltd. |
29,163 | 505,263 | ||||||
See accompanying notes to financial statements.
53
Table of Contents
SPDR S&P Emerging Asia Pacific ETF
SCHEDULE OF INVESTMENTS (continued)
September 30, 2017
| Security Description |
Shares |
Value |
||||||
| Aurobindo Pharma, Ltd. |
37,336 | $ | 395,337 | |||||
| Axis Bank, Ltd. |
168,866 | 1,316,260 | ||||||
| Bajaj Auto, Ltd. |
6,579 | 313,177 | ||||||
| Bajaj Finance, Ltd. |
15,992 | 450,001 | ||||||
| Bharat Electronics, Ltd. (e) |
107,793 | 268,659 | ||||||
| Bharat Financial Inclusion, Ltd. (b) |
29,962 | 434,729 | ||||||
| Bharat Forge, Ltd. |
14,818 | 133,593 | ||||||
| Bharat Forge, Ltd. Bonus Shares (e) |
14,818 | 133,593 | ||||||
| Bharat Heavy Electricals, Ltd. |
168,187 | 216,156 | ||||||
| Bharat Heavy Electricals, Ltd. Bonus Shares (e) |
84,094 | 108,078 | ||||||
| Bharat Petroleum Corp., Ltd. |
48,693 | 351,332 | ||||||
| Bharti Airtel, Ltd. |
212,430 | 1,266,547 | ||||||
| Bharti Infratel, Ltd. |
52,495 | 320,178 | ||||||
| Biocon, Ltd. |
74,880 | 380,762 | ||||||
| Bosch, Ltd. |
785 | 246,906 | ||||||
| Britannia Industries, Ltd. |
2,673 | 177,774 | ||||||
| Cadila Healthcare, Ltd. |
28,982 | 208,691 | ||||||
| Central Bank of India (b) |
74,645 | 85,307 | ||||||
| CG Power and Industrial Solutions, Ltd. (b) |
88,007 | 106,102 | ||||||
| Cipla, Ltd. |
97,000 | 870,357 | ||||||
| Coal India, Ltd. |
147,830 | 612,978 | ||||||
| Dabur India, Ltd. |
38,681 | 180,614 | ||||||
| DCB Bank, Ltd. |
79,604 | 221,312 | ||||||
| Divi’s Laboratories, Ltd. |
10,658 | 139,629 | ||||||
| DLF, Ltd. |
71,370 | 179,518 | ||||||
| Dr Reddy’s Laboratories, Ltd. |
11,255 | 401,257 | ||||||
| Eicher Motors, Ltd. |
1,085 | 518,470 | ||||||
| Emami, Ltd. |
5,902 | 98,862 | ||||||
| Escorts, Ltd. |
53,205 | 537,304 | ||||||
| Federal Bank, Ltd. |
86,228 | 148,708 | ||||||
| Fortis Healthcare, Ltd. (b) |
49,820 | 109,830 | ||||||
| GAIL India, Ltd. |
66,812 | 428,622 | ||||||
| Gillette India, Ltd. |
1,011 | 86,789 | ||||||
| Glenmark Pharmaceuticals, Ltd. |
21,378 | 195,812 | ||||||
| Godrej Consumer Products, Ltd. |
34,454 | 484,819 | ||||||
| Godrej Industries, Ltd. |
20,315 | 182,950 | ||||||
| Granules India, Ltd. |
66,833 | 115,976 | ||||||
| Grasim Industries, Ltd. |
15,682 | 272,238 | ||||||
| Gujarat Mineral Development Corp., Ltd. |
48,990 | 103,875 | ||||||
| Gujarat Pipavav Port, Ltd. |
41,001 | 83,860 | ||||||
| Havells India, Ltd. |
38,960 | 288,174 | ||||||
| HCL Technologies, Ltd. |
53,234 | 712,938 | ||||||
| HDFC Bank, Ltd. |
179,770 | 4,969,545 | ||||||
| Hero MotoCorp, Ltd. |
13,116 | 757,915 | ||||||
| Hindalco Industries, Ltd. |
122,743 | 452,112 | ||||||
| Hindustan Unilever, Ltd. |
120,893 | 2,172,632 | ||||||
| Hindustan Zinc, Ltd. |
163,965 | 742,762 | ||||||
| Housing Development & Infrastructure, Ltd. (b) |
71,611 | 61,942 | ||||||
| Housing Development Finance Corp., Ltd. |
201,725 | 5,380,208 | ||||||
| ICICI Bank, Ltd. |
581 | 2,460 | ||||||
| ICICI Bank, Ltd. ADR |
214,407 | 1,835,324 | ||||||
| Idea Cellular, Ltd. |
215,403 | 255,404 | ||||||
| IDFC, Ltd. |
158,827 | 143,460 | ||||||
| Indiabulls Housing Finance, Ltd. |
64,698 | 1,195,259 | ||||||
| Indian Hotels Co., Ltd. |
347,816 | 619,274 | ||||||
| Indian Oil Corp., Ltd. |
118,029 | 723,677 | ||||||
| IndusInd Bank, Ltd. |
27,485 | 707,827 | ||||||
| Infosys, Ltd. ADR |
253,731 | 3,701,935 | ||||||
| Ipca Laboratories, Ltd. |
16,466 | 122,928 | ||||||
| ITC, Ltd. GDR |
298,066 | 1,178,553 | ||||||
| Jain Irrigation Systems, Ltd. |
72,085 | 104,453 | ||||||
| Jaiprakash Associates, Ltd. (b) |
342,611 | 94,150 | ||||||
| Jindal Steel & Power, Ltd. (b) |
63,661 | 131,230 | ||||||
| JSW Steel, Ltd. |
161,791 | 615,385 | ||||||
| Jubilant Foodworks, Ltd. |
5,662 | 120,569 | ||||||
| Jubilant Life Sciences, Ltd. |
11,037 | 111,392 | ||||||
| Just Dial, Ltd. (b) |
5,965 | 33,971 | ||||||
| Karnataka Bank, Ltd. |
50,710 | 109,890 | ||||||
| Kotak Mahindra Bank, Ltd. |
77,596 | 1,190,609 | ||||||
| KPIT Technologies, Ltd. |
57,774 | 106,977 | ||||||
| Larsen & Toubro, Ltd. GDR |
50,947 | 899,215 | ||||||
| LIC Housing Finance, Ltd. |
41,106 | 394,793 | ||||||
| Lupin, Ltd. |
27,887 | 432,906 | ||||||
| Mahindra & Mahindra Financial Services, Ltd. |
40,907 | 258,236 | ||||||
| Mahindra & Mahindra, Ltd. |
62,272 | 1,195,723 | ||||||
| Manappuram Finance, Ltd. |
70,984 | 105,031 | ||||||
| Marico, Ltd. |
56,896 | 270,674 | ||||||
| Marksans Pharma, Ltd. |
185,485 | 120,685 | ||||||
| Maruti Suzuki India, Ltd. |
3,358 | 410,147 | ||||||
| Max Financial Services, Ltd. (b) |
16,797 | 151,950 | ||||||
| Mindtree, Ltd. |
14,502 | 103,204 | ||||||
| Motherson Sumi Systems, Ltd. |
66,397 | 341,947 | ||||||
| Natco Pharma, Ltd. |
10,405 | 125,371 | ||||||
| NCC, Ltd. |
84,366 | 107,137 | ||||||
| Nestle India, Ltd. |
2,342 | 258,742 | ||||||
| NTPC, Ltd. |
149,808 | 384,038 | ||||||
| Oil & Natural Gas Corp., Ltd. |
392,611 | 1,027,508 | ||||||
| Page Industries, Ltd. |
851 | 240,219 | ||||||
| PI Industries, Ltd. |
10,086 | 114,340 | ||||||
| Piramal Enterprises, Ltd. |
4,513 | 181,180 | ||||||
| Power Finance Corp., Ltd. |
89,942 | 167,850 | ||||||
| Power Grid Corp. of India, Ltd. |
95,791 | 309,429 | ||||||
| Rajesh Exports, Ltd. |
27,941 | 350,503 | ||||||
| Raymond, Ltd. |
8,524 | 105,982 | ||||||
| Reliance Capital, Ltd. |
37,107 | 332,895 | ||||||
| Reliance Communications, Ltd. (b) |
208,586 | 61,311 | ||||||
| Reliance Home Finance, Ltd. (b) |
37,107 | 56,439 | ||||||
| Reliance Industries, Ltd. GDR (c) |
208,160 | 4,985,432 | ||||||
| Reliance Infrastructure, Ltd. |
67,787 | 482,614 | ||||||
| Rural Electrification Corp., Ltd. |
84,142 | 196,958 | ||||||
| Shoppers Stop, Ltd. |
17,754 | 131,307 | ||||||
| Shriram City Union Finance, Ltd. |
8,244 | 260,067 | ||||||
| Shriram Transport Finance Co., Ltd. |
19,876 | 320,840 | ||||||
| Siemens, Ltd. |
30,401 | 553,310 | ||||||
| Sintex Industries, Ltd. |
126,094 | 51,638 | ||||||
| State Bank of India |
187,342 | 728,058 | ||||||
| Steel Authority of India, Ltd. (b) |
228,259 | 187,479 | ||||||
| Strides Shasun, Ltd. |
14,941 | 202,545 | ||||||
| Sun Pharma Advanced Research Co., Ltd. (b) |
26,369 | 153,483 | ||||||
| Sun Pharmaceutical Industries, Ltd. |
127,161 | 979,696 | ||||||
| Suzlon Energy, Ltd. (b) |
528,836 | 126,299 | ||||||
| Tata Consultancy Services, Ltd. |
66,537 | 2,481,335 | ||||||
| Tata Motors, Ltd. (b) |
206,680 | 1,270,392 | ||||||
See accompanying notes to financial statements.
54
Table of Contents
SPDR S&P Emerging Asia Pacific ETF
SCHEDULE OF INVESTMENTS (continued)
September 30, 2017
| Security Description |
Shares |
Value |
||||||
| Tata Steel, Ltd. |
38,084 | $ | 380,461 | |||||
| Tech Mahindra, Ltd. |
56,023 | 392,684 | ||||||
| Titan Co., Ltd. |
13,746 | 123,013 | ||||||
| Torrent Pharmaceuticals, Ltd. |
8,812 | 166,061 | ||||||
| UltraTech Cement, Ltd. |
6,836 | 403,357 | ||||||
| United Breweries, Ltd. |
8,297 | 104,341 | ||||||
| United Spirits, Ltd. (b) |
9,974 | 366,108 | ||||||
| UPL, Ltd. |
31,672 | 377,475 | ||||||
| Vakrangee, Ltd. |
96,548 | 730,170 | ||||||
| Vedanta, Ltd. |
135,403 | 651,414 | ||||||
| Wipro, Ltd. ADR |
182,428 | 1,036,191 | ||||||
| WNS Holdings, Ltd. ADR (b) |
9,418 | 343,757 | ||||||
| Wockhardt, Ltd. |
20,774 | 195,687 | ||||||
| Yes Bank, Ltd. |
170,755 | 914,946 | ||||||
| Zee Entertainment Enterprises, Ltd. |
166,166 | 1,323,070 | ||||||
|
|
|
|||||||
| 73,011,468 | ||||||||
|
|
|
|||||||
| INDONESIA — 3.6% |
||||||||
| Ace Hardware Indonesia Tbk PT |
2,147,300 | 193,702 | ||||||
| Adaro Energy Tbk PT |
2,602,300 | 352,602 | ||||||
| AKR Corporindo Tbk PT |
119,300 | 62,887 | ||||||
| Astra International Tbk PT |
2,769,000 | 1,624,107 | ||||||
| Bank Central Asia Tbk PT |
2,001,096 | 3,015,981 | ||||||
| Bank Mandiri Persero Tbk PT |
2,615,210 | 1,305,760 | ||||||
| Bank Negara Indonesia Persero Tbk PT |
501,100 | 275,309 | ||||||
| Bank Rakyat Indonesia Persero Tbk PT |
1,593,796 | 1,807,501 | ||||||
| Charoen Pokphand Indonesia Tbk PT |
337,500 | 68,658 | ||||||
| Ciputra Development Tbk PT |
828,796 | 73,533 | ||||||
| Garda Tujuh Buana Tbk PT (b) (d) |
127,500 | — | ||||||
| Garuda Indonesia Persero Tbk PT (b) |
3,152,200 | 78,167 | ||||||
| Gudang Garam Tbk PT |
89,800 | 438,699 | ||||||
| Indocement Tunggal Prakarsa Tbk PT |
255,625 | 358,699 | ||||||
| Intiland Development Tbk PT |
1,136,400 | 34,761 | ||||||
| Kalbe Farma Tbk PT |
910,700 | 112,578 | ||||||
| Kawasan Industri Jababeka Tbk PT |
5,978,898 | 135,834 | ||||||
| Lippo Cikarang Tbk PT (b) |
295,900 | 91,830 | ||||||
| Lippo Karawaci Tbk PT |
1,494,300 | 80,434 | ||||||
| Matahari Department Store Tbk PT |
85,100 | 58,601 | ||||||
| Matahari Putra Prima Tbk PT (b) |
410,600 | 19,968 | ||||||
| Media Nusantara Citra Tbk PT |
417,500 | 40,916 | ||||||
| Modernland Realty Tbk PT |
5,149,300 | 111,634 | ||||||
| Pakuwon Jati Tbk PT |
2,056,500 | 93,137 | ||||||
| Pembangunan Perumahan Persero Tbk PT |
701,876 | 120,375 | ||||||
| Perusahaan Gas Negara Persero Tbk |
1,622,740 | 189,755 | ||||||
| Semen Indonesia Persero Tbk PT |
499,900 | 375,788 | ||||||
| Summarecon Agung Tbk PT |
778,900 | 61,588 | ||||||
| Surya Semesta Internusa Tbk PT |
1,238,400 | 53,788 | ||||||
| Telekomunikasi Indonesia Persero Tbk PT |
7,803,070 | 2,711,290 | ||||||
| Tiga Pilar Sejahtera Food Tbk (b) |
823,000 | 56,826 | ||||||
| Tower Bersama Infrastructure Tbk PT |
295,200 | 144,104 | ||||||
| Unilever Indonesia Tbk PT |
60,000 | 218,168 | ||||||
| United Tractors Tbk PT |
254,645 | 604,992 | ||||||
| Wijaya Karya Persero Tbk PT |
663,557 | 88,185 | ||||||
|
|
|
|||||||
| 15,060,157 | ||||||||
|
|
|
|||||||
| MALAYSIA — 3.7% |
||||||||
| 7-Eleven Malaysia Holdings Bhd Class B |
242,200 | 89,481 | ||||||
| AEON Credit Service M Bhd |
61,350 | 186,556 | ||||||
| AirAsia Bhd |
221,600 | 181,059 | ||||||
| Alliance Bank Malaysia Bhd |
656,110 | 605,999 | ||||||
| Astro Malaysia Holdings Bhd |
225,200 | 150,400 | ||||||
| Axiata Group Bhd |
445,225 | 552,511 | ||||||
| Bermaz Auto Bhd |
260,080 | 129,963 | ||||||
| British American Tobacco Malaysia Bhd |
13,600 | 140,880 | ||||||
| Bursa Malaysia Bhd |
219,934 | 520,862 | ||||||
| Cahya Mata Sarawak Bhd |
219,300 | 208,264 | ||||||
| Carlsberg Brewery Malaysia Bhd Class B |
179,903 | 632,270 | ||||||
| CIMB Group Holdings Bhd |
379,699 | 566,514 | ||||||
| Coastal Contracts Bhd |
96,700 | 29,313 | ||||||
| Dialog Group Bhd |
575,200 | 272,445 | ||||||
| Eastern & Oriental Bhd |
530,441 | 198,483 | ||||||
| Eco World Development Group Bhd (b) |
301,900 | 110,822 | ||||||
| Genting Bhd |
449,700 | 1,017,083 | ||||||
| Genting Malaysia Bhd |
498,400 | 635,025 | ||||||
| IJM Corp. Bhd |
1,002,680 | 783,622 | ||||||
| Inari Amertron Bhd |
387,708 | 233,222 | ||||||
| IOI Corp. Bhd |
637,496 | 685,431 | ||||||
| IOI Properties Group Bhd |
541,616 | 259,103 | ||||||
| Karex Bhd |
379,225 | 135,614 | ||||||
| KNM Group Bhd (b) |
820,900 | 51,519 | ||||||
| Kuala Lumpur Kepong Bhd |
48,500 | 282,098 | ||||||
| Land & General Bhd |
1,009,000 | 52,571 | ||||||
| Landmarks Bhd (b) |
1,003,000 | 178,153 | ||||||
| Lingkaran Trans Kota Holdings Bhd |
53,300 | 73,212 | ||||||
| Malayan Banking Bhd |
472,756 | 1,066,990 | ||||||
| Maxis Bhd |
337,000 | 462,901 | ||||||
| Media Prima Bhd |
274,200 | 52,275 | ||||||
| MKH Bhd |
135,900 | 70,484 | ||||||
| Muhibbah Engineering M Bhd |
277,400 | 180,663 | ||||||
| Nam Cheong, Ltd. (a) (b) |
320,400 | 4,719 | ||||||
| Oldtown Bhd |
171,200 | 103,794 | ||||||
| OSK Holdings Bhd |
783,125 | 296,744 | ||||||
| Padini Holdings Bhd |
194,400 | 209,478 | ||||||
| PPB Group Bhd |
96,300 | 384,516 | ||||||
| Press Metal Aluminium Holdings Bhd |
445,240 | 397,526 | ||||||
| Prestariang Bhd |
179,800 | 76,221 | ||||||
| Public Bank Bhd |
172,820 | 836,576 | ||||||
| Sapura Energy Bhd |
195,100 | 70,231 | ||||||
| Silverlake Axis, Ltd. |
203,300 | 88,329 | ||||||
| Sime Darby Bhd |
341,188 | 728,837 | ||||||
| TA Enterprise Bhd |
616,100 | 92,652 | ||||||
| Telekom Malaysia Bhd |
130,509 | 200,902 | ||||||
| Tenaga Nasional Bhd |
301,050 | 1,020,968 | ||||||
| Yinson Holdings Bhd |
140,800 | 119,376 | ||||||
|
|
|
|||||||
| 15,426,657 | ||||||||
|
|
|
|||||||
| PAKISTAN — 0.3% |
||||||||
| Bank Alfalah, Ltd. (b) |
314,000 | 126,465 | ||||||
| Bank of Punjab (b) |
1,276,000 | 119,937 | ||||||
| Fauji Fertilizer Bin Qasim, Ltd. |
411,000 | 139,894 | ||||||
| Habib Bank, Ltd. |
75,000 | 128,716 | ||||||
| Maple Leaf Cement Factory, Ltd. |
147,100 | 117,275 | ||||||
| MCB Bank, Ltd. |
64,500 | 127,990 | ||||||
| Nishat Mills, Ltd. |
90,200 | 124,263 | ||||||
| Pioneer Cement, Ltd. |
137,500 | 117,415 | ||||||
See accompanying notes to financial statements.
55
Table of Contents
SPDR S&P Emerging Asia Pacific ETF
SCHEDULE OF INVESTMENTS (continued)
September 30, 2017
| Security Description |
Shares |
Value |
||||||
| Searle Co., Ltd. |
33,050 | $ | 126,746 | |||||
| TRG Pakistan (b) |
332,000 | 116,377 | ||||||
|
|
|
|||||||
| 1,245,078 | ||||||||
|
|
|
|||||||
| PHILIPPINES — 1.9% |
||||||||
| Alliance Global Group, Inc. |
715,100 | 225,794 | ||||||
| Ayala Land, Inc. |
1,454,388 | 1,245,403 | ||||||
| BDO Unibank, Inc. |
179,295 | 461,301 | ||||||
| Belle Corp. |
1,303,200 | 96,458 | ||||||
| Bloomberry Resorts Corp. (b) |
410,400 | 86,443 | ||||||
| Cebu Air, Inc. |
56,630 | 122,291 | ||||||
| Cosco Capital, Inc. |
1,640,000 | 273,766 | ||||||
| D&L Industries, Inc. |
1,451,100 | 288,509 | ||||||
| DoubleDragon Properties Corp. (b) |
469,370 | 369,586 | ||||||
| First Gen Corp. |
1,061,870 | 395,488 | ||||||
| First Philippine Holdings Corp. |
385,917 | 516,207 | ||||||
| Globe Telecom, Inc. |
2,145 | 86,561 | ||||||
| GT Capital Holdings, Inc. |
6,360 | 145,355 | ||||||
| JG Summit Holdings, Inc. |
308,860 | 455,999 | ||||||
| Jollibee Foods Corp. |
40,670 | 195,186 | ||||||
| LT Group, Inc. |
487,400 | 168,673 | ||||||
| Metro Pacific Investments Corp. |
1,163,100 | 153,402 | ||||||
| Nickel Asia Corp. |
635,184 | 82,525 | ||||||
| Philex Mining Corp. |
816,900 | 133,954 | ||||||
| PLDT, Inc. |
19,949 | 655,025 | ||||||
| Puregold Price Club, Inc. |
304,300 | 312,390 | ||||||
| Robinsons Retail Holdings, Inc. |
154,490 | 301,076 | ||||||
| SM Investments Corp. |
16,500 | 286,804 | ||||||
| SM Prime Holdings, Inc. |
943,400 | 639,773 | ||||||
| Universal Robina Corp. |
86,230 | 259,371 | ||||||
|
|
|
|||||||
| 7,957,340 | ||||||||
|
|
|
|||||||
| SINGAPORE — 0.0% (f) |
| |||||||
| SIIC Environment Holdings, Ltd. (a) |
142,699 | 56,220 | ||||||
|
|
|
|||||||
| TAIWAN — 20.4% |
||||||||
| Acer, Inc. (b) |
662,395 | 330,935 | ||||||
| Advanced Semiconductor Engineering, Inc. |
965,797 | 1,181,608 | ||||||
| Advantech Co., Ltd. |
45,898 | 326,935 | ||||||
| Airtac International Group |
12,431 | 171,355 | ||||||
| Asia Cement Corp. |
854,073 | 753,412 | ||||||
| Asustek Computer, Inc. |
126,138 | 1,037,839 | ||||||
| AU Optronics Corp. ADR (a) |
152,109 | 614,520 | ||||||
| Catcher Technology Co., Ltd. |
126,539 | 1,178,844 | ||||||
| Cathay Financial Holding Co., Ltd. |
1,229,604 | 1,954,456 | ||||||
| Center Laboratories, Inc. (b) |
52,896 | 81,723 | ||||||
| Chang Hwa Commercial Bank, Ltd. |
1,945,831 | 1,052,356 | ||||||
| China Development Financial Holding Corp. |
3,051,272 | 915,663 | ||||||
| China Life Insurance Co., Ltd. |
181,812 | 171,176 | ||||||
| China Steel Chemical Corp. |
18,877 | 72,834 | ||||||
| China Steel Corp. |
1,837,625 | 1,475,602 | ||||||
| Chlitina Holding, Ltd. |
44,000 | 150,904 | ||||||
| Chunghwa Telecom Co., Ltd. |
397,268 | 1,369,031 | ||||||
| Compal Electronics, Inc. |
950,431 | 675,432 | ||||||
| CTBC Financial Holding Co., Ltd. |
2,796,515 | 1,752,202 | ||||||
| Delta Electronics, Inc. |
302,787 | 1,557,670 | ||||||
| E.Sun Financial Holding Co., Ltd. |
446,475 | 266,495 | ||||||
| Eclat Textile Co., Ltd. |
43,365 | 526,975 | ||||||
| eMemory Technology, Inc. |
16,000 | 204,986 | ||||||
| Epistar Corp. (b) |
204,170 | 259,892 | ||||||
| Everlight Electronics Co., Ltd. |
153,996 | 243,253 | ||||||
| Far Eastern New Century Corp. |
1,094,170 | 865,983 | ||||||
| Far EasTone Telecommunications Co., Ltd. |
155,000 | 368,536 | ||||||
| Feng TAY Enterprise Co., Ltd. |
43,902 | 199,791 | ||||||
| Firich Enterprises Co., Ltd. (b) |
28,056 | 45,890 | ||||||
| First Financial Holding Co., Ltd. |
2,351,258 | 1,508,111 | ||||||
| Formosa Chemicals & Fibre Corp. |
641,691 | 1,951,059 | ||||||
| Formosa Petrochemical Corp. |
200,000 | 689,223 | ||||||
| Formosa Plastics Corp. |
839,137 | 2,540,324 | ||||||
| Foxconn Technology Co., Ltd. |
229,519 | 662,278 | ||||||
| Fubon Financial Holding Co., Ltd. |
1,030,998 | 1,608,172 | ||||||
| Giant Manufacturing Co., Ltd. |
43,000 | 202,068 | ||||||
| Himax Technologies, Inc. ADR (a) |
18,036 | 197,134 | ||||||
| Hiwin Technologies Corp. |
28,614 | 252,415 | ||||||
| Hon Hai Precision Industry Co., Ltd. |
1,830,950 | 6,339,855 | ||||||
| Hotai Motor Co., Ltd. |
39,000 | 449,495 | ||||||
| HTC Corp. (b) |
111,710 | 279,238 | ||||||
| Hua Nan Financial Holdings Co., Ltd. |
2,325,212 | 1,261,369 | ||||||
| Innolux Corp. |
910,753 | 424,982 | ||||||
| Inventec Corp. |
352,000 | 260,018 | ||||||
| King Yuan Electronics Co., Ltd. |
778,898 | 764,154 | ||||||
| Largan Precision Co., Ltd. |
12,710 | 2,234,016 | ||||||
| Lite-On Technology Corp. |
519,891 | 742,359 | ||||||
| Macronix International (b) |
621,990 | 949,681 | ||||||
| Makalot Industrial Co., Ltd. |
43,682 | 190,867 | ||||||
| MediaTek, Inc. |
209,219 | 1,962,894 | ||||||
| Medigen Biotechnology Corp. (b) |
14,000 | 20,568 | ||||||
| Mega Financial Holding Co., Ltd. |
1,745,148 | 1,363,936 | ||||||
| Merry Electronics Co., Ltd. |
44,000 | 277,140 | ||||||
| MIN AIK Technology Co., Ltd. |
32,000 | 28,598 | ||||||
| Motech Industries, Inc. (b) |
133,934 | 101,144 | ||||||
| Nan Ya Plastics Corp. |
870,759 | 2,145,024 | ||||||
| Novatek Microelectronics Corp. |
138,062 | 519,030 | ||||||
| PChome Online, Inc. |
22,957 | 117,722 | ||||||
| Pegatron Corp. |
328,630 | 852,895 | ||||||
| Pou Chen Corp. |
220,000 | 276,052 | ||||||
| Powertech Technology, Inc. |
217,518 | 626,932 | ||||||
| President Chain Store Corp. |
51,000 | 429,709 | ||||||
| ProMOS Technologies, Inc. (b) (d) |
1,135,850 | — | ||||||
| Quanta Computer, Inc. |
522,194 | 1,201,990 | ||||||
| Radiant Opto-Electronics Corp. |
44,000 | 103,021 | ||||||
| Realtek Semiconductor Corp. |
153,161 | 527,810 | ||||||
| Shin Kong Financial Holding Co., Ltd. |
2,379,980 | 712,644 | ||||||
| Silicon Motion Technology Corp. ADR |
3,428 | 164,647 | ||||||
| Siliconware Precision Industries Co., Ltd. |
401,763 | 642,577 | ||||||
| SinoPac Financial Holdings Co., Ltd. |
3,055,795 | 915,005 | ||||||
| Synnex Technology International Corp. |
210,000 | 252,078 | ||||||
| Tainan Enterprises Co., Ltd. |
508,830 | 405,232 | ||||||
| Taishin Financial Holding Co., Ltd. |
2,866,828 | 1,233,746 | ||||||
| Taiwan Cement Corp. |
725,216 | 808,347 | ||||||
| Taiwan FU Hsing Industrial Co., Ltd. |
198,000 | 254,976 | ||||||
| Taiwan Mobile Co., Ltd. |
271,200 | 965,888 | ||||||
| Taiwan Paiho, Ltd. |
28,000 | 128,809 | ||||||
| Taiwan Semiconductor Manufacturing Co., Ltd. ADR |
424,082 | 15,924,279 | ||||||
| Tatung Co., Ltd. (b) |
767,107 | 313,683 | ||||||
See accompanying notes to financial statements.
56
Table of Contents
SPDR S&P Emerging Asia Pacific ETF
SCHEDULE OF INVESTMENTS (continued)
September 30, 2017
| Security Description |
Shares |
Value |
||||||
| Teco Electric and Machinery Co., Ltd. |
162,000 | $ | 145,044 | |||||
| TPK Holding Co., Ltd. (b) |
23,000 | 74,179 | ||||||
| Tripod Technology Corp. |
371,361 | 1,285,876 | ||||||
| Uni-President Enterprises Corp. |
800,971 | 1,677,274 | ||||||
| United Integrated Services Co., Ltd. |
520,194 | 880,027 | ||||||
| United Microelectronics Corp. ADR (a) |
465,807 | 1,164,518 | ||||||
| Walsin Lihwa Corp. |
508,000 | 232,021 | ||||||
| Wistron Corp. |
769,873 | 615,665 | ||||||
| Yageo Corp. |
127,341 | 886,062 | ||||||
| Yuanta Financial Holding Co., Ltd. |
1,670,383 | 718,853 | ||||||
|
|
|
|||||||
| 84,269,011 | ||||||||
|
|
|
|||||||
| THAILAND — 4.2% |
||||||||
| Advanced Info Service PCL (e) |
173,102 | 991,379 | ||||||
| Airports of Thailand PCL (e) |
357,100 | 631,751 | ||||||
| Bangkok Expressway & Metro PCL (e) |
4,389,632 | 1,059,566 | ||||||
| Beauty Community PCL (e) |
280,000 | 134,333 | ||||||
| BEC World PCL (e) |
123,600 | 60,410 | ||||||
| Bumrungrad Hospital PCL (e) |
36,300 | 234,018 | ||||||
| Central Plaza Hotel PCL (e) |
50,300 | 67,494 | ||||||
| Charoen Pokphand Foods PCL (e) |
240,300 | 192,744 | ||||||
| Chularat Hospital PCL (e) |
1,997,200 | 147,320 | ||||||
| CP ALL PCL (e) |
764,000 | 1,506,237 | ||||||
| Electricity Generating PCL (e) |
183,099 | 1,290,203 | ||||||
| Energy Absolute PCL (e) |
235,200 | 269,757 | ||||||
| Gunkul Engineering PCL (e) |
1,356,903 | 163,561 | ||||||
| Hana Microelectronics PCL (e) |
106,800 | 152,114 | ||||||
| Ichitan Group PCL (e) |
138,600 | 33,247 | ||||||
| Indorama Ventures PCL (e) |
172,300 | 218,281 | ||||||
| IRPC PCL (e) |
3,088,939 | 583,518 | ||||||
| Jasmine International PCL (e) |
635,125 | 156,163 | ||||||
| Kasikornbank PCL |
58,254 | 373,804 | ||||||
| Kasikornbank PCL NVDR |
28,800 | 178,759 | ||||||
| KCE Electronics PCL (e) |
163,300 | 489,655 | ||||||
| MC Group PCL (e) |
308,100 | 141,347 | ||||||
| Mega Lifesciences PCL (e) |
235,100 | 266,118 | ||||||
| Minor International PCL (e) |
329,586 | 402,718 | ||||||
| Nok Airlines PCL (b) (e) |
783,900 | 85,089 | ||||||
| PTG Energy PCL (e) |
183,200 | 125,246 | ||||||
| PTT Exploration & Production PCL (e) |
318,832 | 855,636 | ||||||
| PTT Global Chemical PCL NVDR |
80,800 | 186,555 | ||||||
| PTT PCL (e) |
114,155 | 1,396,559 | ||||||
| Siam Cement PCL NVDR |
50,800 | 761,619 | ||||||
| Siam Commercial Bank PCL (e) |
244,797 | 1,123,057 | ||||||
| Somboon Advance Technology PCL (e) |
171,300 | 89,374 | ||||||
| Srisawad Corp. PCL (e) |
266,928 | 480,230 | ||||||
| Superblock PCL NVDR (b) |
1,050,000 | 40,930 | ||||||
| SVI PCL (e) |
998,700 | 151,227 | ||||||
| Thai Beverage PCL |
1,014,300 | 672,241 | ||||||
| Thai Oil PCL (e) |
398,664 | 1,105,740 | ||||||
| Thai Union Group PCL Class F (e) |
222,800 | 133,613 | ||||||
| TMB Bank PCL (e) |
2,052,300 | 155,076 | ||||||
| True Corp. PCL NVDR (b) |
1,478,883 | 270,500 | ||||||
|
|
|
|||||||
| 17,377,189 | ||||||||
|
|
|
|||||||
| UNITED STATES — 0.3% |
||||||||
| Yum China Holdings, Inc. (b) |
28,000 | 1,119,160 | ||||||
|
|
|
|||||||
| TOTAL COMMON STOCKS (Cost $343,033,377) |
410,390,707 | |||||||
|
|
|
|||||||
| WARRANTS — 0.0% (f) |
||||||||
| THAILAND — 0.0% (f) |
||||||||
| E for L Aim PCL (expiring 6/1/20) (b) |
272,340 | 163 | ||||||
| Superblock PCL (expiring 8/31/20) (b) |
194,700 | 2,394 | ||||||
|
|
|
|||||||
| 2,557 | ||||||||
|
|
|
|||||||
| TOTAL WARRANTS |
2,557 | |||||||
|
|
|
|||||||
| RIGHTS — 0.0% (f) |
||||||||
| CHINA — 0.0% (f) |
||||||||
| China State Construction International Holdings, Ltd. |
26,750 | 172 | ||||||
|
|
|
|||||||
| THAILAND — 0.0% (f) |
||||||||
| Nok Airlines PCL (expiring 10/20/17) (b) (e) |
783,900 | 49,831 | ||||||
|
|
|
|||||||
| TOTAL RIGHTS |
50,003 | |||||||
|
|
|
|||||||
| SHORT-TERM INVESTMENTS — 1.9% |
| |||||||
| State Street Institutional U.S. Government Money Market Fund, Class G Shares 0.96% (g) (h) |
2,046,576 | 2,046,576 | ||||||
| State Street Navigator Securities Lending Government Money Market Portfolio (g) (i) |
5,790,699 | 5,790,699 | ||||||
|
|
|
|||||||
| TOTAL SHORT-TERM INVESTMENTS |
7,837,275 | |||||||
|
|
|
|||||||
| TOTAL INVESTMENTS — 101.1% |
418,280,542 | |||||||
| LIABILITIES IN EXCESS OF OTHER ASSETS — (1.1)% |
(4,627,786 | ) | ||||||
|
|
|
|||||||
| NET ASSETS — 100.0% |
$ | 413,652,756 | ||||||
|
|
|
|||||||
| (a) | All or a portion of the shares of the security are on loan at September 30, 2017. |
| (b) | Non-income producing security. |
| (c) | Securities purchased pursuant to Rule 144A of the Securities Act of 1933, as amended. These securities, which represent 1.7% of net assets as of September 30, 2017, are considered liquid and may be resold in transactions exempt from registration, normally to qualified institutional buyers. |
| (d) | Fair valued as determined in good faith by the Trust’s Oversight Committee in accordance with policy and procedures approved by the Board of Trustees. Security value is determined based on Level 3 inputs. As of September 30, 2017, total aggregate fair value of the security is $65,474, representing less than 0.05% of the Fund’s net assets. |
| (e) | Fair valued as determined in good faith by the Trust’s Oversight Committee in accordance with policy and procedures approved by the Board of Trustees. As of September 30, 2017, total aggregate fair value of securities is $15,208,879 representing 3.7% of net assets. |
| (f) | Amount is less than 0.05% of net assets. |
| (g) | The Fund invested in certain money market funds managed by SSGA Funds Management, Inc. Amounts related to these |
See accompanying notes to financial statements.
57
Table of Contents
SPDR S&P Emerging Asia Pacific ETF
SCHEDULE OF INVESTMENTS (continued)
September 30, 2017
| transactions during the period ended September 30, 2017 are shown in the Affiliate Table below. |
| (h) | The rate shown is the annualized seven-day yield at September 30, 2017. |
| (i) | Investment of cash collateral for securities loaned. |
ADR = American Depositary Receipt
ADS = American Depositary Shares
GDR = Global Depositary Receipt
NVDR = Non Voting Depositary Receipt
The following table summarizes the value of the Fund’s investments according to the fair value hierarchy as of September 30, 2017.
| Description |
Level 1 — Quoted Prices |
Level 2 — Other Significant Observable Inputs |
Level 3 — Significant Unobservable Inputs |
Total | ||||||||||||
| ASSETS: |
||||||||||||||||
| INVESTMENTS: |
||||||||||||||||
| Common Stocks |
||||||||||||||||
| China |
$ | 186,996,346 | $ | 95,676 | $ | 20,160 | $ | 187,112,182 | ||||||||
| Hong Kong |
7,677,474 | 33,457 | 45,314 | 7,756,245 | ||||||||||||
| India |
72,745,373 | 266,095 | — | 73,011,468 | ||||||||||||
| Indonesia |
15,060,157 | — | 0 | (a) | 15,060,157 | |||||||||||
| Malaysia |
15,024,412 | 402,245 | — | 15,426,657 | ||||||||||||
| Pakistan |
1,245,078 | — | — | 1,245,078 | ||||||||||||
| Philippines |
7,957,340 | — | — | 7,957,340 | ||||||||||||
| Singapore |
56,220 | — | — | 56,220 | ||||||||||||
| Taiwan |
84,269,011 | — | 0 | (a) | 84,269,011 | |||||||||||
| Thailand |
2,484,408 | 14,892,781 | — | 17,377,189 | ||||||||||||
| United States |
1,119,160 | — | — | 1,119,160 | ||||||||||||
| Warrants |
||||||||||||||||
| Thailand |
2,557 | — | — | 2,557 | ||||||||||||
| Rights |
||||||||||||||||
| China |
— | 172 | — | 172 | ||||||||||||
| Thailand |
— | 49,831 | — | 49,831 | ||||||||||||
| Short-Term Investments |
7,837,275 | — | — | 7,837,275 | ||||||||||||
|
|
|
|
|
|
|
|
|
|||||||||
| TOTAL INVESTMENTS |
$ | 402,474,811 | $ | 15,740,257 | $ | 65,474 | $ | 418,280,542 | ||||||||
|
|
|
|
|
|
|
|
|
|||||||||
| (a) | Fund held Level 3 securities that were valued at $0 at September 30, 2017. |
Affiliate Table
| Number of Shares Held at 9/30/16 |
Value at 9/30/16 |
Cost of Purchases |
Proceeds from Shares Sold |
Realized Gain (Loss) |
Change in Unrealized Appreciation/ Depreciation |
Number of Shares Held at 9/30/17 |
Value at 9/30/17 |
Dividend Income |
||||||||||||||||||||||||||||
| State Street Institutional Liquid Reserves Fund, Premier Class |
931,229 | $ | 931,229 | $ | — | $ | 931,229 | $ | — | $ | — | — | $ | — | $ | 33 | ||||||||||||||||||||
| State Street Institutional U.S. Government Money Market Fund, Class G Shares |
— | — | 8,585,537 | 6,538,961 | — | — | 2,046,576 | 2,046,576 | 2,657 | |||||||||||||||||||||||||||
| State Street Institutional U.S. Government Money Market Fund, Premier Class |
— | — | 8,174,727 | 8,174,727 | — | — | — | — | 1,790 | |||||||||||||||||||||||||||
| State Street Navigator Securities Lending Government Money Market Portfolio* |
7,123,753 | 7,123,753 | 25,321,314 | 26,654,368 | — | — | 5,790,699 | 5,790,699 | 125,979 | |||||||||||||||||||||||||||
|
|
|
|
|
|
|
|
|
|
|
|
|
|
|
|||||||||||||||||||||||
| TOTAL |
$ | 8,054,982 | $ | 42,081,578 | $ | 42,299,285 | $ | — | $ | — | $ | 7,837,275 | $ | 130,459 | ||||||||||||||||||||||
|
|
|
|
|
|
|
|
|
|
|
|
|
|
|
|||||||||||||||||||||||
| * | Effective October 5, 2016, the name of State Street Navigator Securities Lending Prime Portfolio was changed to State Street Navigator Securities Lending Government Money Market Portfolio. |
See accompanying notes to financial statements.
58
Table of Contents
SCHEDULE OF INVESTMENTS
September 30, 2017
| Security Description |
Shares |
Value |
||||||
| COMMON STOCKS — 99.4% |
| |||||||
| AEROSPACE & DEFENSE — 0.1% |
| |||||||
| AviChina Industry & Technology Co., Ltd. Class H |
1,632,000 | $ | 986,216 | |||||
|
|
|
|||||||
| AIR FREIGHT & LOGISTICS — 0.2% |
| |||||||
| Sinotrans, Ltd. Class H |
816,000 | 414,754 | ||||||
| ZTO Express Cayman, Inc. ADR (a) |
116,900 | 1,641,276 | ||||||
|
|
|
|||||||
| 2,056,030 | ||||||||
|
|
|
|||||||
| AIRLINES — 0.3% |
| |||||||
| Air China, Ltd. Class H |
1,570,000 | 1,304,531 | ||||||
| China Eastern Airlines Corp., Ltd. Class H (b) |
1,432,000 | 707,686 | ||||||
| China Southern Airlines Co., Ltd. Class H |
1,138,000 | 783,853 | ||||||
| Shandong Airlines Co., Ltd. Class B |
106,000 | 188,910 | ||||||
|
|
|
|||||||
| 2,984,980 | ||||||||
|
|
|
|||||||
| AUTO COMPONENTS — 0.5% |
| |||||||
| China First Capital Group, Ltd. (a) |
518,000 | 207,579 | ||||||
| Fuyao Glass Industry Group Co., Ltd. Class H (c) |
176,400 | 640,268 | ||||||
| Minth Group, Ltd. |
608,000 | 3,183,735 | ||||||
| Xinyi Glass Holdings, Ltd. (a) |
984,000 | 972,574 | ||||||
|
|
|
|||||||
| 5,004,156 | ||||||||
|
|
|
|||||||
| AUTOMOBILES — 2.8% |
| |||||||
| BAIC Motor Corp., Ltd. Class H (b) (c) |
874,400 | 829,542 | ||||||
| Brilliance China Automotive Holdings, Ltd. |
1,592,000 | 4,239,518 | ||||||
| Byd Co., Ltd. Class H (b) |
405,000 | 3,756,673 | ||||||
| Chongqing Changan Automobile Co., Ltd. Class B |
727,300 | 961,887 | ||||||
| Dongfeng Motor Group Co., Ltd. Class H |
2,029,300 | 2,681,242 | ||||||
| Geely Automobile Holdings, Ltd. |
3,323,000 | 9,359,724 | ||||||
| Great Wall Motor Co., Ltd. Class H (b) |
2,231,000 | 2,742,085 | ||||||
| Guangzhou Automobile Group Co., Ltd. Class H |
1,622,637 | 3,756,037 | ||||||
| Qingling Motors Co., Ltd. Class H |
2,364,000 | 771,787 | ||||||
|
|
|
|||||||
| 29,098,495 | ||||||||
|
|
|
|||||||
| BANKS — 14.0% |
| |||||||
| Agricultural Bank of China, Ltd. Class H |
16,059,000 | 7,196,090 | ||||||
| Bank of China, Ltd. Class H |
44,996,700 | 22,179,484 | ||||||
| Bank of Chongqing Co., Ltd. Class H |
1,171,500 | 953,915 | ||||||
| Bank of Communications Co., Ltd. Class H |
13,829,824 | 10,092,565 | ||||||
| China CITIC Bank Corp., Ltd. Class H |
6,774,471 | 4,301,967 | ||||||
| China Construction Bank Corp. Class H |
60,539,623 | 50,225,557 | ||||||
| China Merchants Bank Co., Ltd. Class H |
2,464,735 | 8,662,089 | ||||||
| China Minsheng Banking Corp., Ltd. Class H (b) |
4,396,800 | 4,030,508 | ||||||
| Chongqing Rural Commercial Bank Co., Ltd. Class H |
1,762,000 | 1,116,660 | ||||||
| Huishang Bank Corp., Ltd. Class H |
1,641,000 | 808,871 | ||||||
| Industrial & Commercial Bank of China, Ltd. Class H |
45,692,789 | 33,930,144 | ||||||
| Postal Savings Bank of China Co., Ltd. Class H (c) |
834,000 | 479,427 | ||||||
| Shengjing Bank Co., Ltd. Class H (c) |
556,000 | 438,496 | ||||||
|
|
|
|||||||
| 144,415,773 | ||||||||
|
|
|
|||||||
| BEVERAGES — 0.1% |
| |||||||
| Tibet Water Resources, Ltd. (a) (b) |
1,405,000 | 545,041 | ||||||
| Tsingtao Brewery Co., Ltd. Class H |
201,000 | 769,444 | ||||||
|
|
|
|||||||
| 1,314,485 | ||||||||
|
|
|
|||||||
| BIOTECHNOLOGY — 0.4% |
| |||||||
| 3SBio, Inc. (a) (b) (c) |
515,000 | 825,509 | ||||||
| BeiGene, Ltd. ADR (a) |
25,774 | 2,666,578 | ||||||
| China Biologic Products Holdings, Inc. (a) |
10,386 | 958,316 | ||||||
| Shanghai Haohai Biological Technology Co., Ltd. Class H (c) |
15,700 | 70,352 | ||||||
|
|
|
|||||||
| 4,520,755 | ||||||||
|
|
|
|||||||
| BUILDING PRODUCTS — 0.0% (d) |
| |||||||
| China Lesso Group Holdings, Ltd. |
356,000 | 242,933 | ||||||
|
|
|
|||||||
| CAPITAL MARKETS — 1.9% |
| |||||||
| Central China Securities Co., Ltd. Class H (b) |
360,000 | 166,848 | ||||||
| China Cinda Asset Management Co., Ltd. Class H |
6,863,200 | 2,530,633 | ||||||
| China Everbright, Ltd. |
612,000 | 1,407,239 | ||||||
| China Financial International Investments, Ltd. (a) (b) |
4,010,000 | 121,162 | ||||||
| China Galaxy Securities Co., Ltd. Class H . |
1,980,000 | 1,736,464 | ||||||
| China Huarong Asset Management Co., Ltd. (c) |
4,992,000 | 2,230,540 | ||||||
| CITIC Securities Co., Ltd. Class H |
1,316,500 | 2,895,703 | ||||||
| GF Securities Co., Ltd. Class H |
1,014,200 | 2,204,811 | ||||||
| Guotai Junan International Holdings, Ltd. (b) |
1,725,000 | 549,919 | ||||||
| Haitong Securities Co., Ltd. Class H |
1,902,600 | 3,074,092 | ||||||
| Huatai Securities Co., Ltd. Class H (c) |
671,600 | 1,487,534 | ||||||
| Noah Holdings, Ltd. ADS (a) (b) |
14,630 | 469,769 | ||||||
| Shenwan Hongyuan HK, Ltd. (b) |
505,000 | 184,267 | ||||||
|
|
|
|||||||
| 19,058,981 | ||||||||
|
|
|
|||||||
| CHEMICALS — 0.3% |
| |||||||
| China BlueChemical, Ltd. Class H |
1,914,000 | 622,423 | ||||||
| China Lumena New Materials Corp. (a) (b) (e) |
3,564,548 | — | ||||||
| Fufeng Group, Ltd. (a) (b) |
559,000 | 382,891 | ||||||
| Sinopec Shanghai Petrochemical Co., Ltd. Class H |
2,645,999 | 1,575,262 | ||||||
|
|
|
|||||||
| 2,580,576 | ||||||||
|
|
|
|||||||
| COMMERCIAL SERVICES & SUPPLIES — 1.1% |
| |||||||
| China Everbright International, Ltd. |
1,825,000 | 2,289,808 | ||||||
| China Evergrande Group (a) (b) |
2,305,600 | 8,043,786 | ||||||
See accompanying notes to financial statements.
59
Table of Contents
SPDR S&P China ETF
SCHEDULE OF INVESTMENTS (continued)
September 30, 2017
| Security Description |
Shares |
Value |
||||||
| Dongjiang Environmental Co., Ltd. Class H (b) |
150,200 | $ | 223,453 | |||||
| Yestar Healthcare Holdings Co., Ltd. (b) |
687,500 | 303,670 | ||||||
|
|
|
|||||||
| 10,860,717 | ||||||||
|
|
|
|||||||
| COMMUNICATIONS EQUIPMENT — 0.5% |
| |||||||
| BYD Electronic International Co., Ltd. (b) |
487,000 | 1,440,293 | ||||||
| China All Access Holdings, Ltd. |
1,256,000 | 392,364 | ||||||
| China Fiber Optic Network System Group, Ltd. (a) (e) |
1,131,600 | — | ||||||
| Comba Telecom Systems Holdings, Ltd. |
1,384,310 | 264,077 | ||||||
| Shanghai Potevio Co., Ltd. Class B (a) |
264,700 | 220,495 | ||||||
| Yangtze Optical Fibre and Cable Joint Stock, Ltd. Co. Class H (b) (c) |
309,000 | 1,178,921 | ||||||
| ZTE Corp. Class H (a) |
641,797 | 2,099,417 | ||||||
|
|
|
|||||||
| 5,595,567 | ||||||||
|
|
|
|||||||
| CONSTRUCTION & ENGINEERING — 1.0% |
| |||||||
| China Communications Construction Co., Ltd. Class H |
2,834,394 | 3,538,139 | ||||||
| China Machinery Engineering Corp. Class H |
455,000 | 284,276 | ||||||
| China Railway Construction Corp., Ltd. Class H |
1,142,875 | 1,448,585 | ||||||
| China Railway Group, Ltd. Class H |
2,539,000 | 2,099,932 | ||||||
| China Singyes Solar Technologies Holdings, Ltd. (a) (b) |
368,000 | 122,970 | ||||||
| China State Construction International Holdings, Ltd. (b) |
992,000 | 1,445,320 | ||||||
| Concord New Energy Group, Ltd. |
3,530,000 | 162,700 | ||||||
| Metallurgical Corp. of China, Ltd. Class H |
1,618,000 | 532,380 | ||||||
| Sinopec Engineering Group Co., Ltd. Class H |
1,023,000 | 902,412 | ||||||
|
|
|
|||||||
| 10,536,714 | ||||||||
|
|
|
|||||||
| CONSTRUCTION MATERIALS — 0.6% |
| |||||||
| Anhui Conch Cement Co., Ltd. Class H |
841,000 | 3,354,008 | ||||||
| BBMG Corp. Class H (b) |
1,229,000 | 623,099 | ||||||
| China National Building Material Co., Ltd. Class H (b) |
2,584,000 | 1,789,781 | ||||||
| China Resources Cement Holdings, Ltd. |
769,163 | 472,683 | ||||||
| China Shanshui Cement Group, Ltd. (a) (b) (e) |
1,896,000 | 91,029 | ||||||
| CSG Holding Co., Ltd. Class B |
446,200 | 275,922 | ||||||
|
|
|
|||||||
| 6,606,522 | ||||||||
|
|
|
|||||||
| CONSUMER FINANCE — 0.2% |
| |||||||
| China Financial Services Holdings, Ltd. |
2,960,000 | 250,118 | ||||||
| Chong Sing Holdings FinTech Gr (a) (b) |
14,954,900 | 2,029,549 | ||||||
|
|
|
|||||||
| 2,279,667 | ||||||||
|
|
|
|||||||
| CONTAINERS & PACKAGING — 0.1% |
| |||||||
| Beijing Enterprises Clean Energy Group, Ltd. (a) (b) |
9,405,714 | 227,595 | ||||||
| Greatview Aseptic Packaging Co., Ltd. |
452,000 | 277,773 | ||||||
|
|
|
|||||||
| 505,368 | ||||||||
|
|
|
|||||||
| DISTRIBUTORS — 0.1% |
| |||||||
| Qianhai Health Holdings, Ltd. (a) (b) |
11,000,000 | 161,958 | ||||||
| Xinhua Winshare Publishing and Media Co., Ltd. Class H |
587,000 | 480,981 | ||||||
|
|
|
|||||||
| 642,939 | ||||||||
|
|
|
|||||||
| DIVERSIFIED CONSUMER SERVICES — 1.4% |
| |||||||
| China Maple Leaf Educational Systems, Ltd. (b) |
452,000 | 505,199 | ||||||
| Fu Shou Yuan International Group, Ltd. (b) |
681,000 | 448,147 | ||||||
| New Oriental Education & Technology Group, Inc. ADR |
82,130 | 7,248,794 | ||||||
| TAL Education Group ADR |
195,108 | 6,577,091 | ||||||
|
|
|
|||||||
| 14,779,231 | ||||||||
|
|
|
|||||||
| DIVERSIFIED FINANCIAL SERVICES — 0.1% |
| |||||||
| Far East Horizon, Ltd. |
1,095,000 | 1,029,012 | ||||||
|
|
|
|||||||
| DIVERSIFIED TELECOMMUNICATION SERVICES — 1.1% |
| |||||||
| China Communications Services Corp., Ltd. Class H |
2,059,600 | 1,060,032 | ||||||
| China Telecom Corp., Ltd. Class H |
8,896,951 | 4,556,289 | ||||||
| China Unicom Hong Kong, Ltd. (a) |
3,639,805 | 5,060,786 | ||||||
| CITIC Telecom International Holdings, Ltd. |
1,158,000 | 333,581 | ||||||
|
|
|
|||||||
| 11,010,688 | ||||||||
|
|
|
|||||||
| ELECTRICAL EQUIPMENT — 0.4% |
| |||||||
| Dongfang Electric Corp., Ltd. Class H (a) (b) |
245,400 | 242,236 | ||||||
| Shanghai Electric Group Co., Ltd. Class H (a) (b) |
2,002,000 | 881,724 | ||||||
| Tech Pro Technology Development, Ltd. (a) |
4,481,396 | 39,015 | ||||||
| Xinjiang Goldwind Science & Technology Co., Ltd. Class H (b) |
345,560 | 431,801 | ||||||
| Zhuzhou CRRC Times Electric Co., Ltd. Class H |
406,100 | 2,274,684 | ||||||
|
|
|
|||||||
| 3,869,460 | ||||||||
|
|
|
|||||||
| ELECTRONIC EQUIPMENT, INSTRUMENTS & COMPONENTS — 2.0% |
| |||||||
| AAC Technologies Holdings, Inc. |
454,745 | 7,638,565 | ||||||
| Anxin-China Holdings, Ltd. (a) (e) |
3,068,000 | — | ||||||
| AVIC International Holdings, Ltd. Class H |
628,030 | 353,788 | ||||||
| Digital China Holdings, Ltd. (a) (b) |
715,000 | 402,781 | ||||||
| Dongxu Optoelectronic Technology Co., Ltd. Class B |
1,410,700 | 1,157,718 | ||||||
| FIT Hon Teng, Ltd. (a) (c) |
775,000 | 499,091 | ||||||
| Ju Teng International Holdings, Ltd. |
1,042,000 | 410,893 | ||||||
| Kingboard Chemical Holdings, Ltd. |
520,999 | 2,758,179 | ||||||
| Kingboard Laminates Holdings, Ltd. |
326,000 | 526,728 | ||||||
See accompanying notes to financial statements.
60
Table of Contents
SPDR S&P China ETF
SCHEDULE OF INVESTMENTS (continued)
September 30, 2017
| Security Description |
Shares |
Value |
||||||
| Sunny Optical Technology Group Co., Ltd. |
405,000 | $ | 6,440,012 | |||||
| Wasion Group Holdings, Ltd. (b) |
354,000 | 179,477 | ||||||
|
|
|
|||||||
| 20,367,232 | ||||||||
|
|
|
|||||||
| ENERGY EQUIPMENT & SERVICES — 0.2% |
| |||||||
| Anton Oilfield Services Group (a) (b) |
918,000 | 90,499 | ||||||
| China Oilfield Services, Ltd. Class H |
1,185,900 | 1,085,586 | ||||||
| Hilong Holding, Ltd. |
665,000 | 101,316 | ||||||
| Sinopec Oilfield Service Corp. Class H (a) (b) |
1,288,000 | 224,267 | ||||||
|
|
|
|||||||
| 1,501,668 | ||||||||
|
|
|
|||||||
| FOOD & STAPLES RETAILING — 0.4% |
| |||||||
| China Resources Beer Holdings Co., Ltd. |
993,667 | 2,690,675 | ||||||
| Sun Art Retail Group, Ltd. |
1,358,000 | 1,260,515 | ||||||
|
|
|
|||||||
| 3,951,190 | ||||||||
|
|
|
|||||||
| FOOD PRODUCTS — 1.8% |
| |||||||
| China Agri-Industries Holdings, Ltd. |
1,551,600 | 723,088 | ||||||
| China Huishan Dairy Holdings Co., Ltd. (a) (b) (e) |
2,729,000 | — | ||||||
| China Huiyuan Juice Group, Ltd. (a) |
701,000 | 216,294 | ||||||
| China Mengniu Dairy Co., Ltd. (a) |
1,821,220 | 5,094,762 | ||||||
| China Yurun Food Group, Ltd. (a) |
1,128,000 | 134,308 | ||||||
| CP Pokphand Co., Ltd. |
3,172,000 | 255,849 | ||||||
| Health and Happiness H&H International Holdings, Ltd. (a) (b) |
154,000 | 752,186 | ||||||
| Imperial Pacific International Holdings, Ltd. (a) (b) |
29,050,300 | 431,438 | ||||||
| Tingyi Cayman Islands Holding Corp. |
1,421,844 | 2,140,767 | ||||||
| Uni-President China Holdings, Ltd. |
1,168,400 | 1,150,345 | ||||||
| Want Want China Holdings, Ltd. (b) |
4,455,933 | 3,131,995 | ||||||
| WH Group, Ltd. (c) |
4,551,606 | 4,836,741 | ||||||
| YuanShengTai Dairy Farm, Ltd. (a) |
2,286,000 | 114,143 | ||||||
|
|
|
|||||||
| 18,981,916 | ||||||||
|
|
|
|||||||
| GAS UTILITIES — 0.6% |
| |||||||
| China Gas Holdings, Ltd. |
1,420,000 | 4,254,164 | ||||||
| China Oil & Gas Group, Ltd. |
1,616,000 | 109,655 | ||||||
| China Resources Gas Group, Ltd. |
609,000 | 2,120,783 | ||||||
|
|
|
|||||||
| 6,484,602 | ||||||||
|
|
|
|||||||
| HEALTH CARE EQUIPMENT & SUPPLIES — 0.1% |
| |||||||
| Shandong Weigao Group Medical Polymer Co., Ltd. Class H |
1,596,000 | 1,129,973 | ||||||
|
|
|
|||||||
| HEALTH CARE PROVIDERS & SERVICES — 0.5% |
| |||||||
| China Resources Phoenix Healthcare Holdings Co., Ltd. (b) |
405,000 | 505,038 | ||||||
| Huayi Tencent Entertainment Co., Ltd. (a) (b) |
1,320,000 | 58,305 | ||||||
| Shanghai Pharmaceuticals Holding Co., Ltd. Class H |
670,000 | 1,636,678 | ||||||
| Sinopharm Group Co., Ltd. Class H |
728,400 | 3,208,030 | ||||||
|
|
|
|||||||
| 5,408,051 | ||||||||
|
|
|
|||||||
| HOTELS, RESTAURANTS & LEISURE — 1.3% |
| |||||||
| Ajisen China Holdings, Ltd. |
458,000 | 208,163 | ||||||
| China Lodging Group, Ltd. ADR (a) |
17,519 | 2,081,608 | ||||||
| China Travel International Investment Hong Kong, Ltd. (b) |
2,866,000 | 1,049,427 | ||||||
| Shanghai Jin Jiang International Hotels Group Co., Ltd. Class H |
1,168,187 | 436,722 | ||||||
| Yum China Holdings, Inc. (a) |
230,992 | 9,232,750 | ||||||
|
|
|
|||||||
| 13,008,670 | ||||||||
|
|
|
|||||||
| HOUSEHOLD DURABLES — 0.3% |
| |||||||
| Haier Electronics Group Co., Ltd. (a) |
887,000 | 2,162,224 | ||||||
| Hisense Kelon Electrical Holdings Co., Ltd. Class H |
295,000 | 322,922 | ||||||
| Skyworth Digital Holdings, Ltd. |
1,619,423 | 827,262 | ||||||
|
|
|
|||||||
| 3,312,408 | ||||||||
|
|
|
|||||||
| HOUSEHOLD PRODUCTS — 0.1% |
| |||||||
| Vinda International Holdings, Ltd. |
410,000 | 770,584 | ||||||
|
|
|
|||||||
| INDEPENDENT POWER PRODUCERS & ENERGY TRADERS — 1.0% |
| |||||||
| Beijing Jingneng Clean Energy Co., Ltd. Class H |
1,166,000 | 325,436 | ||||||
| CGN Power Co., Ltd. Class H (c) |
7,503,000 | 2,074,907 | ||||||
| China Datang Corp. Renewable Power Co., Ltd. Class H |
1,919,000 | 240,775 | ||||||
| China Longyuan Power Group Corp., Ltd. Class H |
2,233,000 | 1,663,879 | ||||||
| China Power International Development, Ltd. |
2,281,000 | 750,531 | ||||||
| China Resources Power Holdings Co., Ltd. |
1,190,092 | 2,148,373 | ||||||
| Datang International Power Generation Co., Ltd. Class H (a) |
2,868,287 | 918,063 | ||||||
| Huadian Fuxin Energy Corp., Ltd. Class H (b) |
1,832,000 | 422,190 | ||||||
| Huadian Power International Corp., Ltd. Class H |
974,000 | 394,054 | ||||||
| Huaneng Power International, Inc. Class H |
2,576,129 | 1,593,033 | ||||||
|
|
|
|||||||
| 10,531,241 | ||||||||
|
|
|
|||||||
| INDUSTRIAL CONGLOMERATES — 0.9% |
| |||||||
| Beijing Enterprises Holdings, Ltd. |
405,500 | 2,180,470 | ||||||
| CITIC, Ltd. |
4,042,000 | 5,971,895 | ||||||
| Shanghai Industrial Holdings, Ltd. |
302,000 | 914,425 | ||||||
|
|
|
|||||||
| 9,066,790 | ||||||||
|
|
|
|||||||
| INSURANCE — 5.3% |
| |||||||
| China Life Insurance Co., Ltd. Class H |
4,507,040 | 13,416,042 | ||||||
| China Pacific Insurance Group Co., Ltd. Class H |
1,495,400 | 6,442,471 | ||||||
| China Taiping Insurance Holdings Co., Ltd. |
752,491 | 2,013,528 | ||||||
| Fanhua, Inc. ADR |
25,756 | 323,753 | ||||||
| New China Life Insurance Co., Ltd. Class H |
396,100 | 2,238,956 | ||||||
| People’s Insurance Co. Group of China, Ltd. Class H |
4,669,000 | 2,086,216 | ||||||
| PICC Property & Casualty Co., Ltd. Class H |
2,830,858 | 4,994,331 | ||||||
See accompanying notes to financial statements.
61
Table of Contents
SPDR S&P China ETF
SCHEDULE OF INVESTMENTS (continued)
September 30, 2017
| Security Description |
Shares |
Value |
||||||
| Ping An Insurance Group Co. of China, Ltd. Class H |
3,059,100 | $ | 23,479,720 | |||||
|
|
|
|||||||
| 54,995,017 | ||||||||
|
|
|
|||||||
| INTERNET & CATALOG RETAIL — 3.1% |
| |||||||
| Ctrip.com International, Ltd. ADR (a) |
227,972 | 12,023,243 | ||||||
| JD.com, Inc. ADR (a) |
477,473 | 18,239,469 | ||||||
| Vipshop Holdings, Ltd. ADR (a) |
215,181 | 1,891,441 | ||||||
|
|
|
|||||||
| 32,154,153 | ||||||||
|
|
|
|||||||
| INTERNET SOFTWARE & SERVICES — 31.5% |
| |||||||
| 21Vianet Group, Inc. ADR (a) (b) |
39,006 | 221,944 | ||||||
| 58.com, Inc. ADR (a) |
47,575 | 3,003,885 | ||||||
| Alibaba Group Holding, Ltd. ADR (a) (b) |
672,910 | 116,218,286 | ||||||
| Autohome, Inc. ADR (a) |
25,658 | 1,541,533 | ||||||
| Baidu, Inc. ADR (a) |
160,440 | 39,739,384 | ||||||
| Baozun, Inc. ADR (a) (b) |
13,995 | 458,476 | ||||||
| Bitauto Holdings, Ltd. ADR (a) |
18,567 | 829,574 | ||||||
| Fang Holdings, Ltd. ADR (a) (b) |
114,086 | 462,048 | ||||||
| Momo, Inc. ADR (a) |
27,947 | 875,859 | ||||||
| NetEase, Inc. ADR |
44,799 | 11,818,424 | ||||||
| Phoenix New Media, Ltd. ADR (a) |
38,968 | 229,521 | ||||||
| SINA Corp. (a) |
40,778 | 4,675,198 | ||||||
| Sohu.com, Inc. (a) |
26,580 | 1,447,281 | ||||||
| Tencent Holdings, Ltd. |
3,205,415 | 137,972,336 | ||||||
| Tian Ge Interactive Holdings, Ltd. (b) (c) |
129,000 | 93,975 | ||||||
| Weibo Corp. ADR (a) (b) |
27,089 | 2,680,186 | ||||||
| YY, Inc. ADR (a) |
24,757 | 2,148,412 | ||||||
|
|
|
|||||||
| 324,416,322 | ||||||||
|
|
|
|||||||
| IT SERVICES — 0.3% |
| |||||||
| AGTech Holdings, Ltd. (a) (b) |
1,436,000 | 288,645 | ||||||
| Chinasoft International, Ltd. (a) (b) |
550,000 | 304,902 | ||||||
| Hi Sun Technology China, Ltd. (a) |
1,365,000 | 314,569 | ||||||
| TravelSky Technology, Ltd. Class H |
812,000 | 2,115,585 | ||||||
|
|
|
|||||||
| 3,023,701 | ||||||||
|
|
|
|||||||
| LIFE SCIENCES TOOLS & SERVICES — 0.1% |
| |||||||
| Genscript Biotech Corp. (b) |
418,000 | 399,232 | ||||||
| Wuxi Biologics Cayman, Inc. (a) (c) |
104,500 | 527,805 | ||||||
|
|
|
|||||||
| 927,037 | ||||||||
|
|
|
|||||||
| MACHINERY — 1.2% |
| |||||||
| China Conch Venture Holdings, Ltd. |
696,000 | 1,354,450 | ||||||
| China International Marine Containers Group Co., Ltd. Class H |
513,700 | 970,747 | ||||||
| CIMC Enric Holdings, Ltd. (a) (b) |
578,000 | 378,145 | ||||||
| CRRC Corp., Ltd. Class H |
2,634,950 | 2,341,218 | ||||||
| First Tractor Co., Ltd. Class H (b) |
352,000 | 168,098 | ||||||
| Haitian International Holdings, Ltd. |
599,000 | 1,721,683 | ||||||
| Lonking Holdings, Ltd. |
2,206,000 | 929,205 | ||||||
| Weichai Power Co., Ltd. Class H |
2,033,680 | 2,228,776 | ||||||
| Yangzijiang Shipbuilding Holdings, Ltd. |
1,776,500 | 1,870,757 | ||||||
| Zoomlion Heavy Industry Science and Technology Co., Ltd. Class H (b) |
855,400 | 376,736 | ||||||
|
|
|
|||||||
| 12,339,815 | ||||||||
|
|
|
|||||||
| MARINE — 0.2% |
| |||||||
| COSCO SHIPPING Development Co., Ltd. Class H (a) |
2,084,500 | 472,373 | ||||||
| COSCO SHIPPING Energy Transportation Co., Ltd. Class H |
815,800 | 452,253 | ||||||
| COSCO SHIPPING Holdings Co., Ltd. Class H (a) |
1,405,175 | 753,797 | ||||||
| SITC International Holdings Co., Ltd. |
668,000 | 605,508 | ||||||
|
|
|
|||||||
| 2,283,931 | ||||||||
|
|
|
|||||||
| MEDIA — 0.2% |
| |||||||
| Alibaba Pictures Group, Ltd. (a) (b) |
6,950,000 | 1,112,256 | ||||||
| Poly Culture Group Corp., Ltd. Class H |
91,800 | 219,548 | ||||||
| Wisdom Sports Group (a) (b) |
1,037,000 | 168,614 | ||||||
|
|
|
|||||||
| 1,500,418 | ||||||||
|
|
|
|||||||
| METALS & MINING — 1.2% |
| |||||||
| Aluminum Corp. of China, Ltd. Class H (a) (b) |
3,462,000 | 3,107,099 | ||||||
| Angang Steel Co., Ltd. Class H (b) |
1,015,720 | 895,990 | ||||||
| China Hongqiao Group, Ltd. (a) (b) |
433,000 | 390,829 | ||||||
| China Metal Recycling Holdings, Ltd. (a) (b) (e) |
268,085 | — | ||||||
| China Molybdenum Co., Ltd. Class H (b) |
3,615,000 | 2,170,657 | ||||||
| China Zhongwang Holdings, Ltd. (b) |
804,400 | 410,918 | ||||||
| Jiangxi Copper Co., Ltd. Class H |
927,000 | 1,464,552 | ||||||
| Maanshan Iron & Steel Co., Ltd. Class H (a) (b) |
1,732,000 | 847,074 | ||||||
| MMG, Ltd. (a) (b) |
1,160,000 | 516,830 | ||||||
| Munsun Capital Group, Ltd. (a) (b) |
4,092,000 | 47,151 | ||||||
| Shougang Fushan Resources Group, Ltd. |
2,592,000 | 587,379 | ||||||
| Zhaojin Mining Industry Co., Ltd. Class H (b) |
732,500 | 618,959 | ||||||
| Zijin Mining Group Co., Ltd. Class H |
4,880,750 | 1,674,678 | ||||||
|
|
|
|||||||
| 12,732,116 | ||||||||
|
|
|
|||||||
| MULTILINE RETAIL — 0.1% |
| |||||||
| Golden Eagle Retail Group, Ltd. (b) |
513,120 | 603,732 | ||||||
| Parkson Retail Group, Ltd. (b) |
1,596,500 | 269,807 | ||||||
|
|
|
|||||||
| 873,539 | ||||||||
|
|
|
|||||||
| OIL, GAS & CONSUMABLE FUELS — 4.2% |
| |||||||
| China Coal Energy Co., Ltd. Class H (b) |
1,766,013 | 834,316 | ||||||
| China Petroleum & Chemical Corp. Class H |
15,128,640 | 11,330,936 | ||||||
| China Shenhua Energy Co., Ltd. Class H |
2,224,700 | 5,229,428 | ||||||
| China Suntien Green Energy Corp., Ltd. Class H (b) |
941,000 | 233,723 | ||||||
| CNOOC, Ltd. |
9,877,174 | 12,746,862 | ||||||
| Kunlun Energy Co., Ltd. (b) |
2,435,400 | 2,379,057 | ||||||
| NewOcean Energy Holdings, Ltd. (a) (b) |
706,000 | 192,528 | ||||||
| PetroChina Co., Ltd. Class H |
12,686,930 | 8,040,291 | ||||||
| Sinopec Kantons Holdings, Ltd. |
1,012,000 | 681,517 | ||||||
See accompanying notes to financial statements.
62
Table of Contents
SPDR S&P China ETF
SCHEDULE OF INVESTMENTS (continued)
September 30, 2017
| Security Description |
Shares |
Value |
||||||
| Yanzhou Coal Mining Co., Ltd. Class H (b) |
1,227,900 | $ | 1,208,925 | |||||
|
|
|
|||||||
| 42,877,583 | ||||||||
|
|
|
|||||||
| PAPER & FOREST PRODUCTS — 0.4% |
| |||||||
| Lee & Man Paper Manufacturing, Ltd. |
1,559,000 | 1,995,980 | ||||||
| Nine Dragons Paper Holdings, Ltd. |
1,286,000 | 2,528,961 | ||||||
|
|
|
|||||||
| 4,524,941 | ||||||||
|
|
|
|||||||
| PERSONAL PRODUCTS — 0.5% |
| |||||||
| Hengan International Group Co., Ltd. |
505,500 | 4,679,177 | ||||||
|
|
|
|||||||
| PHARMACEUTICALS — 1.4% |
| |||||||
| China Animal Healthcare, Ltd. (a) (b) (e) |
763,600 | — | ||||||
| China Medical System Holdings, Ltd. |
795,300 | 1,388,850 | ||||||
| China Resources Pharmaceutical Group, Ltd. (c) |
638,000 | 758,017 | ||||||
| China Shineway Pharmaceutical Group, Ltd. |
294,000 | 261,603 | ||||||
| Consun Pharmaceutical Group, Ltd. |
579,000 | 487,769 | ||||||
| CSPC Pharmaceutical Group, Ltd. |
2,148,000 | 3,597,096 | ||||||
| Guangzhou Baiyunshan Pharmaceutical Holdings Co., Ltd. Class H |
192,000 | 501,466 | ||||||
| Hua Han Health Industry Holdings, Ltd. (a) (b) (e) |
3,728,400 | 189,745 | ||||||
| Luye Pharma Group, Ltd. (b) |
1,039,000 | 606,583 | ||||||
| Shanghai Fosun Pharmaceutical Group Co., Ltd. Class H |
204,000 | 846,224 | ||||||
| Shanghai Fudan-Zhangjiang Bio-Pharmaceutical Co., Ltd. Class H (b) |
515,000 | 263,081 | ||||||
| Sihuan Pharmaceutical Holdings Group, Ltd. (b) |
1,297,000 | 471,594 | ||||||
| Sino Biopharmaceutical, Ltd. |
3,245,000 | 3,431,664 | ||||||
| SSY Group, Ltd. |
1,826,332 | 834,753 | ||||||
| Tong Ren Tang Technologies Co., Ltd. Class H (b) |
403,000 | 515,443 | ||||||
|
|
|
|||||||
| 14,153,888 | ||||||||
|
|
|
|||||||
| REAL ESTATE MANAGEMENT & DEVELOPMENT — 5.6% |
| |||||||
| Agile Group Holdings, Ltd. (b) |
1,404,747 | 2,050,279 | ||||||
| Beijing Capital Land, Ltd. Class H |
820,000 | 457,731 | ||||||
| Carnival Group International Holdings, Ltd. (a) (b) |
6,856,800 | 364,317 | ||||||
| China Jinmao Holdings Group, Ltd. |
1,562,000 | 785,930 | ||||||
| China Overseas Land & Investment, Ltd. |
2,547,862 | 8,285,518 | ||||||
| China Overseas Property Holdings, Ltd. (b) |
942,620 | 225,677 | ||||||
| China Resources Land, Ltd. |
1,818,555 | 5,564,605 | ||||||
| China South City Holdings, Ltd. |
2,106,000 | 601,275 | ||||||
| China Vanke Co., Ltd. Class H |
841,864 | 2,770,034 | ||||||
| CIFI Holdings Group Co., Ltd. |
990,000 | 551,359 | ||||||
| Colour Life Services Group Co., Ltd. (a) (b) |
282,000 | 183,049 | ||||||
| Country Garden Holdings Co., Ltd. |
4,667,500 | 7,421,915 | ||||||
| Fullshare Holdings, Ltd. (a) (b) |
3,952,500 | 1,720,524 | ||||||
| Future Land Holdings Co., Ltd. Class A |
588,294 | 1,582,589 | ||||||
| Greentown China Holdings, Ltd. (b) |
370,500 | 445,888 | ||||||
| Guangzhou R&F Properties Co., Ltd. Class H |
936,224 | 2,169,544 | ||||||
| Hopson Development Holdings, Ltd. |
390,000 | 444,890 | ||||||
| Hydoo International Holding, Ltd. (a) |
1,290,000 | 130,475 | ||||||
| Kaisa Group Holdings, Ltd. (a) |
884,000 | 657,565 | ||||||
| KWG Property Holding, Ltd. |
789,806 | 844,339 | ||||||
| Longfor Properties Co., Ltd. |
865,000 | 2,181,687 | ||||||
| Poly Property Group Co., Ltd. (a) |
1,260,000 | 646,882 | ||||||
| Redco Properties Group, Ltd. (b) (c) |
398,200 | 187,611 | ||||||
| Renhe Commercial Holdings Co., Ltd. (a) (b) |
8,567,000 | 197,429 | ||||||
| Shanghai Jinqiao Export Processing Zone Development Co., Ltd. Class B |
297,650 | 430,402 | ||||||
| Shanghai Lujiazui Finance & Trade Zone Development Co., Ltd. Class B |
779,960 | 1,240,916 | ||||||
| Shenzhen Investment, Ltd. |
1,840,606 | 834,208 | ||||||
| Shimao Property Holdings, Ltd. |
1,118,441 | 2,425,697 | ||||||
| Shui On Land, Ltd. |
2,955,500 | 760,566 | ||||||
| Sino-Ocean Group Holding, Ltd. |
3,304,212 | 2,204,021 | ||||||
| SOHO China, Ltd. (a) |
907,500 | 519,355 | ||||||
| Sunac China Holdings, Ltd. (b) |
1,201,300 | 5,498,416 | ||||||
| Yanlord Land Group, Ltd. |
397,300 | 541,261 | ||||||
| Yuexiu Property Co., Ltd. |
6,148,000 | 1,251,529 | ||||||
| Yuzhou Properties Co., Ltd. |
2,456,840 | 1,327,392 | ||||||
| Zall Group, Ltd. (a) (b) |
624,000 | 434,604 | ||||||
|
|
|
|||||||
| 57,939,479 | ||||||||
|
|
|
|||||||
| ROAD & RAIL — 0.2% |
| |||||||
| CAR, Inc. (a) (b) |
773,300 | 706,897 | ||||||
| Dazhong Transportation Group Co., Ltd. Class B |
372,000 | 257,796 | ||||||
| Guangshen Railway Co., Ltd. Class H (b) |
1,410,000 | 826,789 | ||||||
|
|
|
|||||||
| 1,791,482 | ||||||||
|
|
|
|||||||
| SEMICONDUCTORS & SEMICONDUCTOR EQUIPMENT — 0.5% |
| |||||||
| China Soft Power Technology Holdings, Ltd. (a) (b) |
2,191,000 | 46,565 | ||||||
| GCL-Poly Energy Holdings, Ltd. (a) (b) |
6,901,000 | 945,379 | ||||||
| Hanergy Thin Film Power Group, Ltd. (a) (b) (e) |
17,589,376 | — | ||||||
| JinkoSolar Holding Co., Ltd. ADR (a) (b) |
13,380 | 333,831 | ||||||
| Semiconductor Manufacturing International Corp. (a) (b) |
2,135,600 | 2,411,563 | ||||||
| Shunfeng International Clean Energy, Ltd. (a) |
670,000 | 36,885 | ||||||
| Xinyi Solar Holdings, Ltd. (b) |
2,452,000 | 872,721 | ||||||
|
|
|
|||||||
| 4,646,944 | ||||||||
|
|
|
|||||||
See accompanying notes to financial statements.
63
Table of Contents
SPDR S&P China ETF
SCHEDULE OF INVESTMENTS (continued)
September 30, 2017
| Security Description |
Shares |
Value |
||||||
| SOFTWARE — 0.3% |
| |||||||
| Boyaa Interactive International, Ltd. (a) (b) |
299,000 | $ | 119,436 | |||||
| Cheetah Mobile, Inc. ADR (a) (b) |
15,260 | 128,337 | ||||||
| Kingdee International Software Group Co., Ltd. (a) (b) |
1,020,000 | 449,230 | ||||||
| Kingsoft Corp., Ltd. |
495,000 | 1,153,418 | ||||||
| NetDragon Websoft Holdings, Ltd. (b) |
202,000 | 674,997 | ||||||
| Shanghai Baosight Software Co., Ltd. Class B |
345,500 | 530,688 | ||||||
| V1 Group, Ltd. (a) |
2,066,000 | 71,417 | ||||||
|
|
|
|||||||
| 3,127,523 | ||||||||
|
|
|
|||||||
| SPECIALTY RETAIL — 0.3% |
| |||||||
| BEP International Holdings, Ltd. (a) (b) |
5,550,000 | 115,822 | ||||||
| China Harmony New Energy Auto Holding, Ltd. (a) (b) |
798,000 | 463,841 | ||||||
| China ZhengTong Auto Services Holdings, Ltd. (b) |
32,000 | 34,742 | ||||||
| GOME Retail Holdings, Ltd. (b) |
6,839,279 | 770,554 | ||||||
| Grand Baoxin Auto Group, Ltd. (a) |
857,574 | 492,978 | ||||||
| Hengdeli Holdings, Ltd. (b) |
2,576,895 | 140,215 | ||||||
| Zhongsheng Group Holdings, Ltd. |
516,500 | 1,118,873 | ||||||
|
|
|
|||||||
| 3,137,025 | ||||||||
|
|
|
|||||||
| TECHNOLOGY HARDWARE, STORAGE & PERIPHERALS — 0.5% |
| |||||||
| Coolpad Group, Ltd. (a) (e) |
2,629,400 | 121,190 | ||||||
| Huaneng Renewables Corp., Ltd. Class H |
2,410,000 | 796,062 | ||||||
| Lenovo Group, Ltd. |
4,454,000 | 2,457,749 | ||||||
| Meitu, Inc. (a) (b) (c) |
1,100,500 | 1,563,951 | ||||||
|
|
|
|||||||
| 4,938,952 | ||||||||
|
|
|
|||||||
| TEXTILES, APPAREL & LUXURY GOODS — 0.8% |
| |||||||
| ANTA Sports Products, Ltd. |
598,000 | 2,515,050 | ||||||
| Bosideng International Holdings, Ltd. |
3,198,000 | 294,796 | ||||||
| China Dongxiang Group Co., Ltd. |
3,001,000 | 522,534 | ||||||
| China Jicheng Holdings, Ltd. (a) (b) (c) |
9,215,000 | 11,798 | ||||||
| Cosmo Lady China Holdings Co., Ltd. (b) (c) |
301,000 | 118,308 | ||||||
| Lao Feng Xiang Co., Ltd. Class B |
172,911 | 668,128 | ||||||
| Li Ning Co., Ltd. (a) |
1,329,207 | 1,184,437 | ||||||
| Shenzhou International Group Holdings, Ltd. |
405,000 | 3,173,339 | ||||||
|
|
|
|||||||
| 8,488,390 | ||||||||
|
|
|
|||||||
| TRADING COMPANIES & DISTRIBUTORS — 0.0% (d) |
| |||||||
| CITIC Resources Holdings, Ltd. (b) |
1,806,000 | 208,099 | ||||||
|
|
|
|||||||
| TRANSPORTATION INFRASTRUCTURE — 1.2% |
| |||||||
| Anhui Expressway Co., Ltd. Class H |
612,000 | 466,207 | ||||||
| Beijing Capital International Airport Co., Ltd. Class H |
1,385,939 | 2,065,414 | ||||||
| China Merchants Port Holdings Co., Ltd. |
818,681 | 2,526,049 | ||||||
| COSCO SHIPPING International Hong Kong Co., Ltd. |
606,000 | 257,585 | ||||||
| COSCO SHIPPING Ports, Ltd. |
1,050,397 | 1,168,647 | ||||||
| Dalian Port PDA Co., Ltd. Class H |
1,170,200 | 202,257 | ||||||
| HNA Infrastructure Co., Ltd. |
387,000 | 366,651 | ||||||
| Jiangsu Expressway Co., Ltd. Class H |
782,795 | 1,198,641 | ||||||
| Qingdao Port International Co., Ltd. Class H (c) |
850,000 | 541,949 | ||||||
| Shenzhen Expressway Co., Ltd. Class H |
616,000 | 597,806 | ||||||
| Shenzhen International Holdings, Ltd. |
706,121 | 1,327,135 | ||||||
| Sichuan Expressway Co., Ltd. Class H |
804,000 | 323,218 | ||||||
| Xiamen International Port Co., Ltd. Class H |
975,000 | 184,747 | ||||||
| Yuexiu Transport Infrastructure, Ltd. |
376,000 | 282,576 | ||||||
| Zhejiang Expressway Co., Ltd. Class H |
818,000 | 1,016,910 | ||||||
|
|
|
|||||||
| 12,525,792 | ||||||||
|
|
|
|||||||
| WATER UTILITIES — 0.6% |
| |||||||
| Beijing Enterprises Water Group, Ltd. (a) |
3,244,000 | 2,612,411 | ||||||
| CT Environmental Group, Ltd. (b) |
1,736,400 | 248,988 | ||||||
| Guangdong Investment, Ltd. |
2,024,000 | 2,886,727 | ||||||
| Kangda International Environmental Co., Ltd. (a) (c) |
743,000 | 160,763 | ||||||
|
|
|
|||||||
| 5,908,889 | ||||||||
|
|
|
|||||||
| WIRELESS TELECOMMUNICATION SERVICES — 3.3% |
| |||||||
| China Mobile, Ltd. |
3,329,504 | 33,739,645 | ||||||
|
|
|
|||||||
| TOTAL COMMON STOCKS |
1,022,427,448 | |||||||
|
|
|
|||||||
| RIGHTS — 0.0% (d) |
| |||||||
| CONSTRUCTION & ENGINEERING — 0.0% (d) |
| |||||||
| China State Construction International Holdings, Ltd. |
124,000 | 794 | ||||||
|
|
|
|||||||
| SHORT-TERM INVESTMENTS — 2.4% |
| |||||||
| State Street Institutional U.S. Government Money Market Fund, Class G Shares 0.96% (g) (h) |
2,785,729 | 2,785,729 | ||||||
| State Street Navigator Securities Lending Government Money Market Portfolio (g) (i) |
22,187,451 | 22,187,451 | ||||||
|
|
|
|||||||
| TOTAL SHORT-TERM INVESTMENTS |
24,973,180 | |||||||
|
|
|
|||||||
| TOTAL INVESTMENTS — 101.8% |
1,047,401,422 | |||||||
| LIABILITIES IN EXCESS OF OTHER ASSETS — (1.8)% |
(18,162,310 | ) | ||||||
|
|
|
|||||||
| NET ASSETS — 100.0% |
$ | 1,029,239,112 | ||||||
|
|
|
|||||||
See accompanying notes to financial statements.
64
Table of Contents
SPDR S&P China ETF
SCHEDULE OF INVESTMENTS (continued)
September 30, 2017
| (a) | Non-income producing security. |
| (b) | All or a portion of the shares of the security are on loan at September 30, 2017. |
| (c) | Securities purchased pursuant to Rule 144A of the Securities Act of 1933, as amended. These securities, which represent 1.9% of net assets as of September 30, 2017, are considered liquid and may be resold in transactions exempt from registration, normally to qualified institutional buyers. |
| (d) | Amount shown represents less than 0.05% of net assets. |
| (e) | Fair valued as determined in good faith by the Trust’s Oversight Committee in accordance with policy and procedures approved by the Board of Trustees. Security value is determined based on Level 3 inputs. As of September 30, 2017, total aggregate fair value of the security is $401,964, representing less than 0.05% of the Fund’s net assets. |
| (f) | Fair valued as determined in good faith by the Trust’s Oversight Committee in accordance with policy and procedures approved by the Board of Trustees. As of September 30, 2017, total aggregate fair value of securities is $794 representing less than 0.05% of net assets. |
| (g) | The Fund invested in certain money market funds managed by SSGA Funds Management, Inc. Amounts related to these transactions during the period ended September 30, 2017 are shown in the Affiliate Table below. |
| (h) | The rate shown is the annualized seven-day yield at September 30, 2017. |
| (i) | Investment of cash collateral for securities loaned. |
ADR = American Depositary Receipt
ADS = American Depositary Shares
The following table summarizes the value of the Fund’s investments according to the fair value hierarchy as of September 30, 2017.
| Description |
Level 1 — Quoted Prices |
Level 2 — Other Significant Observable Inputs |
Level 3 — Significant Unobservable Inputs |
Total | ||||||||||||
| ASSETS: |
||||||||||||||||
| INVESTMENTS: |
||||||||||||||||
| Common Stocks |
||||||||||||||||
| Aerospace & Defense |
$ | 986,216 | $ | — | $ | — | $ | 986,216 | ||||||||
| Air Freight & Logistics |
2,056,030 | — | — | 2,056,030 | ||||||||||||
| Airlines |
2,984,980 | — | — | 2,984,980 | ||||||||||||
| Auto Components |
5,004,156 | — | — | 5,004,156 | ||||||||||||
| Automobiles |
29,098,495 | — | — | 29,098,495 | ||||||||||||
| Banks |
144,415,773 | — | — | 144,415,773 | ||||||||||||
| Beverages |
1,314,485 | — | — | 1,314,485 | ||||||||||||
| Biotechnology |
4,520,755 | — | — | 4,520,755 | ||||||||||||
| Building Products |
242,933 | — | — | 242,933 | ||||||||||||
| Capital Markets |
19,058,981 | — | — | 19,058,981 | ||||||||||||
| Chemicals |
2,580,576 | — | 0 | (a) | 2,580,576 | |||||||||||
| Commercial Services & Supplies |
10,860,717 | — | — | 10,860,717 | ||||||||||||
| Communications Equipment |
5,595,567 | — | 0 | (a) | 5,595,567 | |||||||||||
| Construction & Engineering |
10,536,714 | — | — | 10,536,714 | ||||||||||||
| Construction Materials |
6,515,493 | — | 91,029 | 6,606,522 | ||||||||||||
| Consumer Finance |
2,279,667 | — | — | 2,279,667 | ||||||||||||
| Containers & Packaging |
505,368 | — | — | 505,368 | ||||||||||||
| Distributors |
642,939 | — | — | 642,939 | ||||||||||||
| Diversified Consumer Services |
14,779,231 | — | — | 14,779,231 | ||||||||||||
| Diversified Financial Services |
1,029,012 | — | — | 1,029,012 | ||||||||||||
| Diversified Telecommunication Services |
11,010,688 | — | — | 11,010,688 | ||||||||||||
| Electrical Equipment |
3,869,460 | — | — | 3,869,460 | ||||||||||||
| Electronic Equipment, Instruments & Components |
20,367,232 | — | 0 | (a) | 20,367,232 | |||||||||||
| Energy Equipment & Services |
1,501,668 | — | — | 1,501,668 | ||||||||||||
| Food & Staples Retailing |
3,951,190 | — | — | 3,951,190 | ||||||||||||
| Food Products |
18,981,916 | — | 0 | (a) | 18,981,916 | |||||||||||
| Gas Utilities |
6,484,602 | — | — | 6,484,602 | ||||||||||||
| Health Care Equipment & Supplies |
1,129,973 | — | — | 1,129,973 | ||||||||||||
| Health Care Providers & Services |
5,408,051 | — | — | 5,408,051 | ||||||||||||
| Hotels, Restaurants & Leisure |
13,008,670 | — | — | 13,008,670 | ||||||||||||
| Household Durables |
3,312,408 | — | — | 3,312,408 | ||||||||||||
| Household Products |
770,584 | — | — | 770,584 | ||||||||||||
| Independent Power Producers & Energy Traders |
10,531,241 | — | — | 10,531,241 | ||||||||||||
| Industrial Conglomerates |
9,066,790 | — | — | 9,066,790 | ||||||||||||
See accompanying notes to financial statements.
65
Table of Contents
SPDR S&P China ETF
SCHEDULE OF INVESTMENTS (continued)
September 30, 2017
| Description |
Level 1 — Quoted Prices |
Level 2 — Other Significant Observable Inputs |
Level 3 — Significant Unobservable Inputs |
Total | ||||||||||||
| Insurance |
$ | 54,995,017 | $ | — | $ | — | $ | 54,995,017 | ||||||||
| Internet & Catalog Retail |
32,154,153 | — | — | 32,154,153 | ||||||||||||
| Internet Software & Services |
324,416,322 | — | — | 324,416,322 | ||||||||||||
| IT Services |
3,023,701 | — | — | 3,023,701 | ||||||||||||
| Life Sciences Tools & Services |
927,037 | — | — | 927,037 | ||||||||||||
| Machinery |
12,339,815 | — | — | 12,339,815 | ||||||||||||
| Marine |
2,283,931 | — | — | 2,283,931 | ||||||||||||
| Media |
1,500,418 | — | — | 1,500,418 | ||||||||||||
| Metals & Mining |
12,341,287 | 390,829 | 0 | (a) | 12,732,116 | |||||||||||
| Multiline Retail |
873,539 | — | — | 873,539 | ||||||||||||
| Oil, Gas & Consumable Fuels |
42,877,583 | — | — | 42,877,583 | ||||||||||||
| Paper & Forest Products |
4,524,941 | — | — | 4,524,941 | ||||||||||||
| Personal Products |
4,679,177 | — | — | 4,679,177 | ||||||||||||
| Pharmaceuticals |
13,964,143 | — | 189,745 | 14,153,888 | ||||||||||||
| Real Estate Management & Development |
57,939,479 | — | — | 57,939,479 | ||||||||||||
| Road & Rail |
1,791,482 | — | — | 1,791,482 | ||||||||||||
| Semiconductors & Semiconductor Equipment |
4,646,944 | — | 0 | (a) | 4,646,944 | |||||||||||
| Software |
3,127,523 | — | — | 3,127,523 | ||||||||||||
| Specialty Retail |
3,137,025 | — | — | 3,137,025 | ||||||||||||
| Technology Hardware, Storage & Peripherals |
4,817,762 | — | 121,190 | 4,938,952 | ||||||||||||
| Textiles, Apparel & Luxury Goods |
8,476,592 | 11,798 | — | 8,488,390 | ||||||||||||
| Trading Companies & Distributors |
208,099 | — | — | 208,099 | ||||||||||||
| Transportation Infrastructure |
12,525,792 | — | — | 12,525,792 | ||||||||||||
| Water Utilities |
5,908,889 | — | — | 5,908,889 | ||||||||||||
| Wireless Telecommunication Services |
33,739,645 | — | — | 33,739,645 | ||||||||||||
| Rights |
||||||||||||||||
| Construction & Engineering |
— | 794 | — | 794 | ||||||||||||
| Short-Term Investments |
24,973,180 | — | — | 24,973,180 | ||||||||||||
|
|
|
|
|
|
|
|
|
|||||||||
| TOTAL INVESTMENTS |
$ | 1,046,596,037 | $ | 403,421 | $ | 401,964 | $ | 1,047,401,422 | ||||||||
|
|
|
|
|
|
|
|
|
|||||||||
| (a) | Fund held Level 3 securities that were valued at $0 at September 30, 2017. |
Affiliate Table
| Number of Shares Held at 9/30/16 |
Value at 9/30/16 |
Cost of Purchases |
Proceeds from Shares Sold |
Realized Gain (Loss) |
Change in Unrealized Appreciation/ Depreciation |
Number of Shares Held at 9/30/17 |
Value at 9/30/17 |
Dividend Income |
||||||||||||||||||||||||||||
| State Street Institutional Liquid Reserves Fund, Premier Class |
1,571,854 | $ | 1,571,854 | $ | — | $ | 1,571,854 | $ | — | $ | — | — | $ | — | $ | 37 | ||||||||||||||||||||
| State Street Institutional U.S. Government Money Market Fund, Class G Shares |
— | — | 23,343,342 | 20,557,613 | — | — | 2,785,729 | 2,785,729 | 5,691 | |||||||||||||||||||||||||||
| State Street Institutional U.S. Government Money Market Fund, Premier Class |
— | — | 51,152,218 | 51,152,218 | — | — | — | — | 3,226 | |||||||||||||||||||||||||||
| State Street Navigator Securities Lending Government Money Market Portfolio* |
32,855,648 | 32,855,648 | 75,739,293 | 86,407,490 | — | — | 22,187,451 | 22,187,451 | 809,047 | |||||||||||||||||||||||||||
|
|
|
|
|
|
|
|
|
|
|
|
|
|
|
|||||||||||||||||||||||
| TOTAL |
$ | 34,427,502 | $ | 150,234,853 | $ | 159,689,175 | $ | — | $ | — | $ | 24,973,180 | $ | 818,001 | ||||||||||||||||||||||
|
|
|
|
|
|
|
|
|
|
|
|
|
|
|
|||||||||||||||||||||||
| * | Effective October 5, 2016, the name of State Street Navigator Securities Lending Prime Portfolio was changed to State Street Navigator Securities Lending Government Money Market Portfolio. |
See accompanying notes to financial statements.
66
Table of Contents
SPDR MSCI China A Shares IMI ETF
SCHEDULE OF INVESTMENTS
September 30, 2017
| Security Description |
Shares |
Value |
||||||
| COMMON STOCKS — 99.6% |
| |||||||
| AEROSPACE & DEFENSE — 0.9% |
| |||||||
| AECC Aero Science and Technology Co., Ltd. Class A (a) |
400 | $ | 1,706 | |||||
| AECC Aero-Engine Control Co., Ltd. Class A |
700 | 2,104 | ||||||
| AECC Aviation Power Co., Ltd. Class A |
800 | 3,766 | ||||||
| AVIC Aircraft Co., Ltd. Class A |
1,400 | 4,053 | ||||||
| AVIC Helicopter Co., Ltd. Class A |
400 | 2,632 | ||||||
| Changchun UP Optotech Co., Ltd. Class A |
600 | 1,754 | ||||||
| China Avionics Systems Co., Ltd. Class A |
800 | 1,957 | ||||||
| China Spacesat Co., Ltd. Class A |
700 | 2,967 | ||||||
|
|
|
|||||||
| 20,939 | ||||||||
|
|
|
|||||||
| AIR FREIGHT & LOGISTICS — 0.5% |
||||||||
| Citic Offshore Helicopter Co., Ltd. Class A (a) (b) |
1,300 | 2,612 | ||||||
| Jiangsu Aucksun Co., Ltd. Class A |
4,700 | 6,453 | ||||||
| Sinotrans Air Transportation Development Co., Ltd. Class A |
1,100 | 2,967 | ||||||
|
|
|
|||||||
| 12,032 | ||||||||
|
|
|
|||||||
| AIRLINES — 1.0% |
||||||||
| Air China, Ltd. Class A |
3,000 | 3,938 | ||||||
| China Eastern Airlines Corp., Ltd. Class A |
4,300 | 4,376 | ||||||
| China Southern Airlines Co., Ltd. Class A |
4,700 | 5,851 | ||||||
| Hainan Airlines Holding Co., Ltd. Class A |
11,900 | 5,822 | ||||||
| Spring Airlines Co., Ltd. Class A |
700 | 3,521 | ||||||
|
|
|
|||||||
| 23,508 | ||||||||
|
|
|
|||||||
| AUTO COMPONENTS — 2.0% |
||||||||
| Anhui Zhongding Sealing Parts Co., Ltd. Class A |
1,500 | 4,708 | ||||||
| China Shipbuilding Industry Group Power Co., Ltd. Class A |
1,000 | 3,769 | ||||||
| Fangda Special Steel Technology Co., Ltd. Class A |
2,400 | 4,668 | ||||||
| Fuyao Glass Industry Group Co., Ltd. Class A |
2,500 | 9,593 | ||||||
| Greatoo Intelligent Equipment, Inc. |
5,100 | 2,388 | ||||||
| Huayu Automotive Systems Co., Ltd. Class A |
1,700 | 5,771 | ||||||
| Sailun Jinyu Group Co., Ltd. Class A |
5,940 | 3,335 | ||||||
| Wanxiang Qianchao Co., Ltd. Class A |
1,560 | 2,841 | ||||||
| Weifu High-Technology Group Co., Ltd. Class A |
1,000 | 3,673 | ||||||
| Wuhu Shunrong Sanqi Interactive Entertainment Network Technology Co., Ltd. Class A |
800 | 2,686 | ||||||
| Zhejiang Wanfeng Auto Wheel Co., Ltd. Class A |
1,320 | 3,885 | ||||||
|
|
|
|||||||
| 47,317 | ||||||||
|
|
|
|||||||
| AUTOMOBILES — 1.1% |
||||||||
| Anhui Jianghuai Automobile Group Corp., Ltd Class A |
1,400 | 2,375 | ||||||
| Beiqi Foton Motor Co., Ltd. Class A |
10,600 | 4,947 | ||||||
| BYD Co., Ltd. Class A |
700 | 7,197 | ||||||
| Chongqing Changan Automobile Co., Ltd. Class A |
2,200 | 4,693 | ||||||
| FAW CAR Co., Ltd. Class A (a) |
1,500 | 3,107 | ||||||
| Haima Automobile Group Co., Ltd. Class A (a) |
4,100 | 3,315 | ||||||
|
|
|
|||||||
| 25,634 | ||||||||
|
|
|
|||||||
| BANKS — 10.9% |
||||||||
| Agricultural Bank of China, Ltd. Class A |
38,400 | 22,082 | ||||||
| Bank of Beijing Co., Ltd. Class A |
2,736 | 3,073 | ||||||
| Bank of China, Ltd. Class A |
37,100 | 23,010 | ||||||
| Bank of Communications Co., Ltd. Class A |
12,800 | 12,178 | ||||||
| Bank of Nanjing Co., Ltd. Class A |
5,544 | 6,602 | ||||||
| Bank of Ningbo Co., Ltd. Class A |
3,900 | 9,264 | ||||||
| China CITIC Bank Corp., Ltd. Class A |
3,200 | 3,035 | ||||||
| China Everbright Bank Co., Ltd. Class A |
20,300 | 12,376 | ||||||
| China Merchants Bank Co., Ltd. Class A |
10,300 | 39,617 | ||||||
| China Minsheng Banking Corp., Ltd. Class A |
14,500 | 17,506 | ||||||
| Huaxia Bank Co., Ltd. Class A |
7,320 | 10,215 | ||||||
| Industrial & Commercial Bank of China, Ltd. Class A |
15,600 | 14,090 | ||||||
| Industrial Bank Co., Ltd. Class A |
14,400 | 37,481 | ||||||
| Ping An Bank Co., Ltd. Class A |
8,520 | 14,250 | ||||||
| Shanghai Pudong Development Bank Co., Ltd. Class A |
16,302 | 31,584 | ||||||
|
|
|
|||||||
| 256,363 | ||||||||
|
|
|
|||||||
| BEVERAGES — 5.2% |
||||||||
| Beijing Yanjing Brewery Co., Ltd. Class A |
3,200 | 3,102 | ||||||
| Chongqing Brewery Co., Ltd. Class A |
2,200 | 7,309 | ||||||
| Hainan Yedao Co., Ltd. Class A (a) |
1,400 | 2,110 | ||||||
| Hebei Hengshui Laobaigan Liquor Co., Ltd. Class A (b) |
750 | 3,014 | ||||||
| Jiangsu Yanghe Brewery Joint-Stock Co., Ltd. Class A |
500 | 7,640 | ||||||
| Kweichow Moutai Co., Ltd. Class A |
1,000 | 77,925 | ||||||
| Luzhou Laojiao Co., Ltd. Class A |
1,400 | 11,823 | ||||||
| Qinghai Huzhu Barley Wine Co., Ltd. Class A |
1,100 | 3,014 | ||||||
| Tsingtao Brewery Co., Ltd. Class A |
700 | 3,247 | ||||||
| Zhejiang Guyuelongshan Shaoxing Wine Co., Ltd. Class A |
2,100 | 3,073 | ||||||
|
|
|
|||||||
| 122,257 | ||||||||
|
|
|
|||||||
| BIOTECHNOLOGY — 0.5% |
||||||||
| Beijing SL Pharmaceutical Co., Ltd. Class A |
600 | 2,453 | ||||||
| Da An Gene Co., Ltd. of Sun Yat-Sen University Class A |
660 | 1,993 | ||||||
| Hualan Biological Engineering, Inc. Class A |
800 | 3,277 | ||||||
| Shanghai RAAS Blood Products Co., Ltd. Class A |
1,620 | 5,075 | ||||||
|
|
|
|||||||
| 12,798 | ||||||||
|
|
|
|||||||
| BUILDING PRODUCTS — 0.2% |
||||||||
| Zhejiang Dun’An Artificial Environment Co., Ltd. Class A |
1,400 | 2,171 | ||||||
| Zhejiang Goldensea Environment Technology Co., Ltd. Class A |
1,000 | 2,718 | ||||||
|
|
|
|||||||
| 4,889 | ||||||||
|
|
|
|||||||
| CAPITAL MARKETS — 5.1% |
||||||||
| China Merchants Securities Co., Ltd. Class A |
3,700 | 11,914 | ||||||
| CITIC Securities Co., Ltd. Class A |
3,600 | 9,858 | ||||||
| Dongxing Securities Co., Ltd. Class A |
1,800 | 4,983 | ||||||
| Everbright Securities Co., Ltd. Class A |
2,100 | 4,909 | ||||||
| GF Securities Co., Ltd. Class A |
3,100 | 8,857 | ||||||
| Guosen Securities Co., Ltd. Class A |
2,300 | 4,740 | ||||||
| Haitong Securities Co., Ltd. Class A |
3,600 | 8,010 | ||||||
See accompanying notes to financial statements.
67
Table of Contents
SPDR MSCI China A Shares IMI ETF
SCHEDULE OF INVESTMENTS (continued)
September 30, 2017
| Security Description |
Shares |
Value |
||||||
| Huatai Securities Co., Ltd. Class A |
3,000 | $ | 10,215 | |||||
| Industrial Securities Co., Ltd. Class A |
5,590 | 7,128 | ||||||
| Northeast Securities Co., Ltd. Class A |
3,600 | 5,582 | ||||||
| Orient Securities Co., Ltd. Class A |
2,200 | 5,319 | ||||||
| Pacific Securities Co., Ltd. Class A |
11,505 | 7,222 | ||||||
| Sealand Securities Co., Ltd. Class A |
4,950 | 4,382 | ||||||
| Shanxi Securities Co., Ltd. Class A |
2,700 | 4,593 | ||||||
| Shenwan Hongyuan Group Co., Ltd. Class A |
8,910 | 7,820 | ||||||
| Sinolink Securities Co., Ltd. Class A |
2,600 | 4,591 | ||||||
| Southwest Securities Co., Ltd. Class A |
5,500 | 4,819 | ||||||
| Western Securities Co., Ltd. Class A |
2,268 | 5,323 | ||||||
|
|
|
|||||||
| 120,265 | ||||||||
|
|
|
|||||||
| CHEMICALS — 5.4% |
| |||||||
| Anhui Sierte Fertilizer Industry, Ltd. Co. Class A |
1,300 | 1,748 | ||||||
| Anhui Wanwei Updated High-Tech Material Industry Co., Ltd. Class A (a) |
4,100 | 2,759 | ||||||
| Befar Group Co., Ltd. Class A |
5,520 | 7,279 | ||||||
| China Hainan Rubber Industry Group Co., Ltd. Class A (a) |
3,200 | 3,097 | ||||||
| Do-Fluoride Chemicals Co., Ltd. Class A |
400 | 1,583 | ||||||
| Gpro Titanium Industry Co., Ltd. Class A |
2,800 | 2,580 | ||||||
| Hubei Biocause Pharmaceutical Co., Ltd. Class A |
2,700 | 3,597 | ||||||
| Hubei Kaile Science & Technology Co., Ltd. Class A (a) |
1,400 | 6,767 | ||||||
| Inner Mongolia Junzheng Energy & Chemical Industry Group Co., Ltd. Class A |
4,400 | 3,345 | ||||||
| Jiangsu Huifeng Bio Agriculture Co., Ltd. Class A |
3,040 | 2,467 | ||||||
| Jiangsu Protruly Vision Technology Group Co., Ltd. Class A (a) (b) |
1,500 | 2,436 | ||||||
| Jiangsu Yangnong Chemical Co., Ltd. Class A |
700 | 4,104 | ||||||
| Kangde Xin Composite Material Group Co., Ltd. Class A |
1,599 | 5,106 | ||||||
| Kingenta Ecological Engineering Group Co., Ltd. Class A |
2,200 | 2,666 | ||||||
| Kingfa Sci & Tech Co., Ltd. Class A |
3,000 | 2,777 | ||||||
| Luxi Chemical Group Co., Ltd. Class A (a) |
3,600 | 6,026 | ||||||
| Nanjing Redsun Co., Ltd. Class A |
1,500 | 4,941 | ||||||
| Qinghai Salt Lake Industry Co., Ltd. Class A |
1,650 | 4,700 | ||||||
| Shandong Hualu Hengsheng Chemical Co., Ltd. Class A |
3,042 | 5,848 | ||||||
| Shanghai Chlor-Alkali Chemical Co., Ltd. Class A (a) |
1,500 | 2,676 | ||||||
| Shanghai Pret Composites Co., Ltd. Class A |
900 | 3,719 | ||||||
| Shanghai Yahong Moulding Co., Ltd. Class A |
200 | 950 | ||||||
| Shanxi Yongdong Chemistry Industry Co., Ltd. Class A |
1,650 | 5,549 | ||||||
| Shenzhen Noposion Agrochemicals Co., Ltd. Class A (a) |
1,000 | 1,246 | ||||||
| Sinoma Science & Technology Co., Ltd. Class A |
900 | 3,211 | ||||||
| Sinopec Shanghai Petrochemical Co., Ltd. Class A |
3,500 | 3,325 | ||||||
| Tianqi Lithium Corp. Class A |
100 | 1,058 | ||||||
| Tongkun Group Co., Ltd. Class A |
1,500 | 3,875 | ||||||
| Wanhua Chemical Group Co., Ltd. Class A |
1,680 | 10,660 | ||||||
| Xinjiang Xuefeng Sci-Tech Group Co., Ltd. Class A (a) |
1,200 | 1,250 | ||||||
| Yueyang Xingchang Petrochemical Class A |
772 | 1,985 | ||||||
| Zhejiang Huafeng Spandex Co., Ltd. Class A (a) |
3,200 | 2,577 | ||||||
| Zhejiang Huge Leaf Co., Ltd. Class A (a) |
4,200 | 4,167 | ||||||
| Zhejiang Jiaao Enprotech Stock Co., Ltd. Class A |
400 | 2,481 | ||||||
| Zhejiang Longsheng Group Co., Ltd. Class A |
2,500 | 3,861 | ||||||
|
|
|
|||||||
| 126,416 | ||||||||
|
|
|
|||||||
| COMMERCIAL SERVICES & SUPPLIES — 0.8% |
|
|||||||
| Beijing GeoEnviron Engineering & Technology, Inc. Class A (b) |
800 | 1,824 | ||||||
| Eternal Asia Supply Chain Management, Ltd. Class A |
1,600 | 2,026 | ||||||
| Jiangsu Flowers King Horticulture Co., Ltd. Class A |
500 | 1,255 | ||||||
| Jihua Group Corp., Ltd. Class A |
2,300 | 2,895 | ||||||
| Shaanxi Jinye Science Technology & Education Group Co., Ltd. Class A |
2,000 | 2,595 | ||||||
| Shanghai Environment Group Co., Ltd. Class A (a) |
391 | 1,454 | ||||||
| Shanghai Jielong Industry Group Corp., Ltd. Class A (a) |
1,200 | 1,122 | ||||||
| Shenzhen Comix Group Co., Ltd. Class A |
1,400 | 3,808 | ||||||
| Shenzhen ESUN Display Co., Ltd. Class A |
200 | 1,214 | ||||||
| Tungkong, Inc. Class A |
600 | 1,952 | ||||||
|
|
|
|||||||
| 20,145 | ||||||||
|
|
|
|||||||
| COMMUNICATIONS EQUIPMENT — 1.2% |
| |||||||
| Addsino Co., Ltd. Class A |
1,000 | 1,802 | ||||||
| Bus Online Co., Ltd. (a) |
600 | 2,133 | ||||||
| Fiberhome Telecommunication Technologies Co., Ltd. Class A |
1,100 | 5,398 | ||||||
| Guangzhou Haige Communications Group, Inc. Co. Class A |
1,600 | 2,792 | ||||||
| Shenzhen Coship Electronics Co., Ltd. Class A (a) |
2,200 | 2,335 | ||||||
| Shenzhen Keybridge Communications Co., Ltd. Class A (a) |
1,200 | 2,502 | ||||||
| Tianjin Xinmao Science & Technology Co., Ltd. Class A (a) (b) |
3,000 | 3,222 | ||||||
| ZTE Corp. Class A (a) |
2,000 | 8,521 | ||||||
|
|
|
|||||||
| 28,705 | ||||||||
|
|
|
|||||||
| CONSTRUCTION & ENGINEERING — 3.6% |
| |||||||
| Changjiang & Jinggong Steel Building Group Co., Ltd. Class A |
2,500 | 2,168 | ||||||
| Changshu Fengfan Power Equipment Co., Ltd. Class A |
3,300 | 3,706 | ||||||
| China Gezhouba Group Co., Ltd. Class A |
4,400 | 6,875 | ||||||
| China National Chemical Engineering Co., Ltd. Class A |
4,200 | 4,293 | ||||||
| China Railway Construction Corp., Ltd. Class A |
1,500 | 2,678 | ||||||
| China Railway Group, Ltd. Class A |
4,900 | 6,381 | ||||||
| China State Construction Engineering Corp., Ltd. Class A |
13,600 | 18,999 | ||||||
See accompanying notes to financial statements.
68
Table of Contents
SPDR MSCI China A Shares IMI ETF
SCHEDULE OF INVESTMENTS (continued)
September 30, 2017
| Security Description |
Shares |
Value |
||||||
| East China Engineering Science and Technology Co., Ltd. Class A |
1,000 | $ | 1,912 | |||||
| Jiangsu Zhongtai Bridge Steel Structure Co., Ltd. Class A (a) |
1,300 | 2,830 | ||||||
| Metallurgical Corp. of China, Ltd. Class A |
11,600 | 8,941 | ||||||
| Northcom Group Co., Ltd. Class A (a) |
1,190 | 4,208 | ||||||
| Power Construction Corp. of China, Ltd. Class A |
5,300 | 6,407 | ||||||
| Shandong Longquan Pipeline Engineering Co., Ltd. Class A |
1,000 | 1,326 | ||||||
| Shanghai Construction Group Co., Ltd. Class A |
5,141 | 2,964 | ||||||
| Shanghai Tunnel Engineering Co., Ltd. Class A |
1,900 | 2,771 | ||||||
| Shenzhen Tagen Group Co., Ltd. Class A |
1,400 | 2,270 | ||||||
| Suzhou Gold Mantis Construction Decoration Co., Ltd. Class A |
1,950 | 3,241 | ||||||
| Xinjiang Beixin Road & Bridge Group Co., Ltd. Class A |
900 | 1,924 | ||||||
|
|
|
|||||||
| 83,894 | ||||||||
|
|
|
|||||||
| CONSTRUCTION MATERIALS — 0.8% |
| |||||||
| Anhui Conch Cement Co., Ltd. Class A |
1,700 | 6,390 | ||||||
| Anhui Xinli Finance Co., Ltd. Class A |
1,400 | 2,803 | ||||||
| Arcplus Group PLC Class A (a) |
700 | 2,097 | ||||||
| Shandong Jinjing Science & Technology Co., Ltd. Class A (a) |
4,700 | 3,630 | ||||||
| Xishui Strong Year Co., Ltd. Inner Mongolia Class A |
800 | 3,218 | ||||||
|
|
|
|||||||
| 18,138 | ||||||||
|
|
|
|||||||
| CONTAINERS & PACKAGING — 0.8% |
||||||||
| Jiangsu Shuangxing Color Plastic New Materials Co., Ltd. Class A |
2,340 | 2,801 | ||||||
| Kee Ever Bright Decorative Technology Co., Ltd. Class A (a) |
640 | 3,306 | ||||||
| Org Packaging Co., Ltd. Class A (a) |
2,880 | 2,814 | ||||||
| Shanghai Zi Jiang Enterprise Group Co., Ltd. Class A |
3,400 | 3,173 | ||||||
| Shenzhen Beauty Star Co., Ltd. Class A |
2,700 | 4,040 | ||||||
| Zhejiang Great Southeast Co., Ltd. Class A (a) (b) |
4,000 | 2,304 | ||||||
|
|
|
|||||||
| 18,438 | ||||||||
|
|
|
|||||||
| DISTRIBUTORS — 0.1% |
||||||||
| Shanghai Shenhua Holdings Co., Ltd. Class A (a) |
2,900 | 1,458 | ||||||
|
|
|
|||||||
| DIVERSIFIED CONSUMER SERVICES — 0.4% |
| |||||||
| But One Information Corp. Xi an Class A (a) |
1,300 | 7,392 | ||||||
| Zhejiang Yasha Decoration Co., Ltd. Class A |
1,200 | 1,676 | ||||||
|
|
|
|||||||
| 9,068 | ||||||||
|
|
|
|||||||
| DIVERSIFIED FINANCIAL SERVICES — 0.3% |
| |||||||
| Avic Capital Co., Ltd. Class A |
4,200 | 3,699 | ||||||
| Bohai Financial Investment Holding Co., Ltd. Class A |
2,900 | 2,890 | ||||||
|
|
|
|||||||
| 6,589 | ||||||||
|
|
|
|||||||
| DIVERSIFIED TELECOMMUNICATION SERVICES — 0.3% |
| |||||||
| 263 Network Communications Co., Ltd. Class A (a) |
1,700 | 2,513 | ||||||
| Dr Peng Telecom & Media Group Co., Ltd. Class A |
1,000 | 2,982 | ||||||
| GuangDong Super Telecom Co., Ltd. Class A |
300 | 2,558 | ||||||
|
|
|
|||||||
| 8,053 | ||||||||
|
|
|
|||||||
| ELECTRIC UTILITIES — 0.1% |
||||||||
| Xinjiang Tianfu Energy Co., Ltd. Class A |
3,200 | 3,651 | ||||||
|
|
|
|||||||
| ELECTRICAL EQUIPMENT — 3.8% |
||||||||
| Anhui Xinlong Electrical Co., Ltd. Class A |
1,100 | 1,835 | ||||||
| Beijing Sifang Automation Co., Ltd. Class A |
1,200 | 1,611 | ||||||
| China XD Electric Co., Ltd. Class A |
3,700 | 3,041 | ||||||
| Citychamp Dartong Co., Ltd. Class A |
2,100 | 2,339 | ||||||
| Dongfang Electric Corp., Ltd. Class A (a) |
1,400 | 2,198 | ||||||
| Dongfang Electronics Co., Ltd. Class A (a) |
5,600 | 4,493 | ||||||
| Fangda Carbon New Material Co., Ltd. Class A |
1,800 | 8,278 | ||||||
| Henan Tong-DA Cable Co., Ltd. Class A |
1,300 | 1,589 | ||||||
| Jiangsu SINOJIT Wind Energy Technology Co., Ltd. Class A (a) |
6,300 | 4,088 | ||||||
| Jiangsu Zongyi Co., Ltd. Class A (a) |
1,200 | 1,507 | ||||||
| Luxshare Precision Industry Co., Ltd. Class A |
1,800 | 5,598 | ||||||
| Nanjing Kangni Mechanical & Electrical Co., Ltd. Class A (b) |
1,750 | 3,937 | ||||||
| Nanyang Topsec Technologies Group, Inc. Class A |
1,800 | 4,937 | ||||||
| NARI Technology Co., Ltd. Class A |
1,600 | 3,979 | ||||||
| Shanghai Electric Group Co., Ltd. Class A (a) |
2,700 | 3,260 | ||||||
| Shanghai Welltech Automation Co., Ltd. Class A |
900 | 2,634 | ||||||
| Shenzhen Center Power Tech Co., Ltd. Class A |
600 | 1,832 | ||||||
| Shenzhen Hifuture Electric Co., Ltd. Class A (a) (b) |
2,500 | 7,567 | ||||||
| Shenzhen Invt Electric Co., Ltd. Class A |
1,700 | 2,321 | ||||||
| Shenzhen Moso Power Supply Technology Co., Ltd. Class A (a) |
1,600 | 2,712 | ||||||
| Shenzhen Woer Heat-Shrinkable Material Co., Ltd. Class A |
1,600 | 1,583 | ||||||
| Sieyuan Electric Co., Ltd. Class A |
2,520 | 6,411 | ||||||
| TBEA Co., Ltd. Class A |
2,313 | 3,433 | ||||||
| Tongling Jingda Special Magnet Wire Co., Ltd. Class A |
6,000 | 3,911 | ||||||
| Xinjiang Goldwind Science & Technology Co., Ltd. Class A |
2,210 | 4,345 | ||||||
|
|
|
|||||||
| 89,439 | ||||||||
|
|
|
|||||||
| ELECTRONIC EQUIPMENT, INSTRUMENTS & COMPONENTS — 3.9% |
| |||||||
| Accelink Technologies Co., Ltd. Class A |
1,200 | 4,592 | ||||||
| Beijing SDL Technology Co., Ltd. Class A |
700 | 1,594 | ||||||
| China Security & Fire Co., Ltd. Class A (a) |
1,000 | 1,046 | ||||||
| Dongxu Optoelectronic Technology Co., Ltd. Class A |
2,100 | 3,579 | ||||||
| Fujian Torch Electron Technology Co., Ltd. Class A |
1,500 | 6,300 | ||||||
| GoerTek, Inc. Class A |
2,000 | 6,094 | ||||||
| Hangzhou Hikvision Digital Technology Co., Ltd. Class A |
4,950 | 23,845 | ||||||
| Hengdian Group DMEGC Magnetics Co., Ltd. Class A |
4,400 | 7,207 | ||||||
See accompanying notes to financial statements.
69
Table of Contents
SPDR MSCI China A Shares IMI ETF
SCHEDULE OF INVESTMENTS (continued)
September 30, 2017
| Security Description |
Shares |
Value |
||||||
| IRICO Display Devices Co., Ltd. Class A (a) |
1,500 | $ | 1,967 | |||||
| Ningbo Yunsheng Group Co., Ltd. Class A |
900 | 2,837 | ||||||
| Shen Zhen Mindata Holding Co., Ltd. Class A (a) |
1,400 | 1,796 | ||||||
| Shenzhen Fastprint Circuit Tech Co., Ltd. Class A |
2,700 | 2,597 | ||||||
| Shenzhen Infinova, Ltd. Class A (a) |
2,210 | 2,013 | ||||||
| Shenzhen Mason Technologies Co., Ltd. |
2,400 | 3,248 | ||||||
| Shenzhen Sunlord Electronics Co., Ltd. Class A |
1,900 | 5,961 | ||||||
| Tatwah Smartech Co., Ltd. Class A (a) |
1,000 | 2,895 | ||||||
| TDG Holdings Co., Ltd. Class A (a) |
1,700 | 2,766 | ||||||
| Unigroup Guoxin Co., Ltd. Class A |
400 | 2,239 | ||||||
| WUS Printed Circuit Kunshan Co., Ltd. Class A |
3,400 | 2,528 | ||||||
| Zhejiang Dahua Technology Co., Ltd. Class A |
1,750 | 6,341 | ||||||
|
|
|
|||||||
| 91,445 | ||||||||
|
|
|
|||||||
| ENERGY EQUIPMENT & SERVICES — 0.7% |
| |||||||
| Beijing New Oriental Star Petrochemical Engineering Co., Ltd. Class A |
200 | 905 | ||||||
| Cangzhou Mingzhu Plastic Co., Ltd. Class A |
3,230 | 7,158 | ||||||
| Offshore Oil Engineering Co., Ltd. Class A |
3,100 | 2,875 | ||||||
| Yantai Jereh Oilfield Services Group Co., Ltd. Class A |
900 | 2,101 | ||||||
| Zhejiang Kingland Pipeline & Technologies Co., Ltd. Class A |
2,300 | 3,220 | ||||||
|
|
|
|||||||
| 16,259 | ||||||||
|
|
|
|||||||
| FOOD & STAPLES RETAILING — 0.4% |
| |||||||
| Shenzhen Agricultural Products Co., Ltd. Class A |
1,300 | 1,726 | ||||||
| Yonghui Superstores Co., Ltd. Class A |
5,600 | 6,736 | ||||||
|
|
|
|||||||
| 8,462 | ||||||||
|
|
|
|||||||
| FOOD PRODUCTS — 2.8% |
||||||||
| Baotou Huazi Industry Co., Ltd. Class A |
1,500 | 2,552 | ||||||
| Beijing Dabeinong Technology Group Co., Ltd. Class A |
3,450 | 3,199 | ||||||
| Bright Dairy & Food Co., Ltd. Class A |
1,100 | 2,201 | ||||||
| COFCO Tunhe Sugar Co., Ltd. Class A |
1,300 | 1,849 | ||||||
| Gansu Yasheng Industrial Group Co., Ltd. Class A |
2,800 | 1,998 | ||||||
| Henan Shuanghui Investment & Development Co., Ltd. Class A |
2,600 | 9,746 | ||||||
| Hunan Dakang International Food & Agriculture Co., Ltd. Class A (a) |
6,080 | 2,847 | ||||||
| Inner Mongolia Yili Industrial Group Co., Ltd. Class A |
3,800 | 15,731 | ||||||
| Jonjee Hi-Tech Industrial And Commercial Holding Co., Ltd. Class A |
1,400 | 4,980 | ||||||
| Lotus Health Group Co. Class A (a) |
3,000 | 1,825 | ||||||
| MeiHua Holdings Group Co., Ltd. Class A |
2,800 | 2,698 | ||||||
| Qiaqia Food Co., Ltd. Class A |
1,500 | 3,283 | ||||||
| Shandong Delisi Food Co., Ltd. Class A (a) |
2,800 | 3,591 | ||||||
| Shanghai Maling Aquarius Co., Ltd. Class A (a) |
1,400 | 2,025 | ||||||
| Xinjiang Guannong Fruit & Antler Group Co., Ltd. Class A |
1,800 | 2,520 | ||||||
| Yuan Longping High-tech Agriculture Co., Ltd. Class A |
1,400 | 5,480 | ||||||
|
|
|
|||||||
| 66,525 | ||||||||
|
|
|
|||||||
| HEALTH CARE EQUIPMENT & SUPPLIES — 0.1% |
| |||||||
| Jiangsu Yuyue Medical Equipment & Supply Co., Ltd. Class A |
600 | 1,853 | ||||||
|
|
|
|||||||
| HEALTH CARE PROVIDERS & SERVICES — 0.4% |
| |||||||
| Huadong Medicine Co., Ltd. Class A |
600 | 4,432 | ||||||
| Shanghai Pharmaceuticals Holding Co., Ltd. Class A |
1,200 | 4,289 | ||||||
|
|
|
|||||||
| 8,721 | ||||||||
|
|
|
|||||||
| HOTELS, RESTAURANTS & LEISURE — 0.5% |
| |||||||
| China International Travel Service Corp., Ltd. Class A |
1,200 | 6,230 | ||||||
| Shenzhen Overseas Chinese Town Co., Ltd. Class A |
4,200 | 5,166 | ||||||
|
|
|
|||||||
| 11,396 | ||||||||
|
|
|
|||||||
| HOUSEHOLD DURABLES — 1.9% |
||||||||
| Guangdong Homa Appliances Co., Ltd. Class A |
560 | 1,688 | ||||||
| Guangzhou Holike Creative Home Co., Ltd. Class A |
600 | 2,705 | ||||||
| Hisense Electric Co., Ltd. Class A |
1,600 | 3,784 | ||||||
| Leo Group Co., Ltd. Class A |
3,150 | 1,437 | ||||||
| Markor International Home Furnishings Co., Ltd. Class A |
2,530 | 2,460 | ||||||
| Midea Group Co., Ltd. Class A |
3,600 | 23,948 | ||||||
| NavInfo Co., Ltd. Class A |
900 | 3,471 | ||||||
| TCL Corp. Class A |
9,700 | 5,199 | ||||||
|
|
|
|||||||
| 44,692 | ||||||||
|
|
|
|||||||
| INDEPENDENT POWER PRODUCERS & ENERGY TRADERS — 2.5% |
| |||||||
| An Hui Wenergy Co., Ltd. Class A |
2,210 | 1,840 | ||||||
| China National Nuclear Power Co., Ltd. Class A |
7,000 | 7,861 | ||||||
| China Yangtze Power Co., Ltd. Class A |
3,900 | 8,847 | ||||||
| Datang Huayin Electric Power Co., Ltd. Class A (a) |
2,100 | 1,517 | ||||||
| GD Power Development Co., Ltd. Class A |
11,100 | 5,548 | ||||||
| Guangdong Baolihua New Energy Stock Co., Ltd. Class A |
1,800 | 2,157 | ||||||
| Huadian Power International Corp., Ltd. Class A |
4,300 | 2,848 | ||||||
| Huaneng Power International, Inc. Class A |
2,900 | 3,030 | ||||||
| Hubei Energy Group Co., Ltd. Class A |
3,200 | 2,399 | ||||||
| Inner Mongolia MengDian HuaNeng Thermal Power Corp., Ltd. Class A |
5,600 | 2,605 | ||||||
| SDIC Power Holdings Co., Ltd. Class A |
4,000 | 4,420 | ||||||
| Shanghai Electric Power Co., Ltd. Class A |
1,600 | 2,688 | ||||||
| Shanxi Zhangze Electric Power Co., Ltd. Class A (a) |
4,200 | 2,194 | ||||||
| Shenergy Co., Ltd. Class A |
3,900 | 3,499 | ||||||
| Shenzhen Energy Group Co., Ltd. Class A |
2,700 | 2,622 | ||||||
| Sichuan Chuantou Energy Co., Ltd. Class A |
3,800 | 5,389 | ||||||
|
|
|
|||||||
| 59,464 | ||||||||
|
|
|
|||||||
See accompanying notes to financial statements.
70
Table of Contents
SPDR MSCI China A Shares IMI ETF
SCHEDULE OF INVESTMENTS (continued)
September 30, 2017
| Security Description |
Shares |
Value |
||||||
| INDUSTRIAL CONGLOMERATES — 0.1% |
| |||||||
| China Baoan Group Co., Ltd. Class A |
2,025 | $ | 2,740 | |||||
|
|
|
|||||||
| INSURANCE — 2.9% |
||||||||
| China Life Insurance Co., Ltd. Class A |
600 | 2,505 | ||||||
| China Pacific Insurance Group Co., Ltd. Class A |
3,300 | 18,346 | ||||||
| New China Life Insurance Co., Ltd. Class A |
700 | 5,972 | ||||||
| Ping An Insurance Group Co. of China, Ltd. Class A |
5,200 | 42,397 | ||||||
|
|
|
|||||||
| 69,220 | ||||||||
|
|
|
|||||||
| INTERNET SOFTWARE & SERVICES — 0.3% |
| |||||||
| Dawning Information Industry Co., Ltd. Class A |
400 | 2,221 | ||||||
| Focus Technology Co., Ltd. Class A |
600 | 2,475 | ||||||
| People.cn Co., Ltd. Class A |
900 | 1,875 | ||||||
|
|
|
|||||||
| 6,571 | ||||||||
|
|
|
|||||||
| IT SERVICES — 0.9% |
| |||||||
| BOE Technology Group Co., Ltd. Class A |
18,800 | 12,453 | ||||||
| DHC Software Co., Ltd. Class A |
2,400 | 4,061 | ||||||
| Fujian Rongji Software Co., Ltd. Class A |
2,300 | 3,777 | ||||||
| Shanghai AtHub Co., Ltd. Class A |
300 | 2,163 | ||||||
|
|
|
|||||||
| 22,454 | ||||||||
|
|
|
|||||||
| LEISURE EQUIPMENT & PRODUCTS — 0.1% |
| |||||||
| Alpha Group Class A |
900 | 2,011 | ||||||
|
|
|
|||||||
| LIFE SCIENCES TOOLS & SERVICES — 0.1% |
| |||||||
| Shanghai Runda Medical Technology Co., Ltd. Class A |
1,080 | 2,286 | ||||||
|
|
|
|||||||
| MACHINERY — 4.8% |
| |||||||
| Anhui Ankai Automobile Co., Ltd. Class A |
2,500 | 3,959 | ||||||
| Anhui Heli Co., Ltd. Class A |
2,280 | 3,470 | ||||||
| China CSSC Holdings, Ltd. Class A (a) (b) |
800 | 2,986 | ||||||
| China Shipbuilding Industry Co., Ltd. Class A (a) (b) |
9,200 | 9,861 | ||||||
| CRRC Corp., Ltd. Class A |
11,800 | 17,284 | ||||||
| Eurocrane China Co., Ltd. Class A |
600 | 1,757 | ||||||
| Fujian Longma Environmental Sanitation Equipment Co., Ltd. Class A |
700 | 3,451 | ||||||
| Fujian Longxi Bearing Group Co., Ltd. Class A |
2,500 | 4,539 | ||||||
| Geron Co., Ltd. Class A |
100 | 547 | ||||||
| Han’s Laser Technology Industry Group Co., Ltd. Class A |
900 | 5,907 | ||||||
| Jiangsu Hengli Hydraulic Co., Ltd. Class A |
1,200 | 3,286 | ||||||
| Jiangsu Nonghua Intelligent Agriculture Technology Co., Ltd. Class A (a) |
1,900 | 1,999 | ||||||
| Linzhou Heavy Machinery Group Co., Ltd. Class A (a) |
2,210 | 1,860 | ||||||
| Mesnac Co., Ltd. Class A (a) |
1,300 | 1,840 | ||||||
| Nancal Energy-Saving Technology Co., Ltd. Class A |
600 | 2,830 | ||||||
| Nanxing Furniture Machinery & Equipment Co., Ltd. Class A (b) |
300 | 1,904 | ||||||
| North Navigation Control Technology Co., Ltd. Class A |
1,200 | 2,636 | ||||||
| Sanlux Co., Ltd. Class A |
2,000 | 3,646 | ||||||
| Sany Heavy Industry Co., Ltd. Class A |
3,900 | 4,491 | ||||||
| Shanghai Mechanical and Electrical Industry Co., Ltd. Class A |
800 | 2,371 | ||||||
| Shantui Construction Machinery Co., Ltd. Class A (a) |
3,200 | 2,731 | ||||||
| Sunward Intelligent Equipment Co., Ltd. Class A |
2,600 | 3,499 | ||||||
| Suzhou Thvow Technology Co., Ltd. Class A (a) |
2,600 | 3,832 | ||||||
| Taiyuan Heavy Industry Co., Ltd. Class A (a) |
4,600 | 2,701 | ||||||
| Tian Di Science & Technology Co., Ltd. Class A |
3,000 | 2,344 | ||||||
| Tianjin Benefo Tejing Electric Co., Ltd. Class A (b) |
1,100 | 1,914 | ||||||
| Weihai Guangtai Airport Equipment Co., Ltd. Class A |
700 | 1,836 | ||||||
| Wuxi Hongsheng Heat Exchanger Manufacturing Co., Ltd. Class A |
200 | 774 | ||||||
| XCMG Construction Machinery Co., Ltd. Class A |
4,400 | 2,437 | ||||||
| Zhejiang Jinggong Science & Technology Co., Ltd. Class A (b) |
1,700 | 2,396 | ||||||
| Zhengzhou Yutong Bus Co., Ltd. Class A |
1,500 | 5,555 | ||||||
| Zoomlion Heavy Industry Science and Technology Co., Ltd. Class A |
4,700 | 3,170 | ||||||
|
|
|
|||||||
| 113,813 | ||||||||
|
|
|
|||||||
| MEDIA — 1.8% |
||||||||
| Beijing Gehua CATV Network Co., Ltd. Class A |
1,000 | 2,222 | ||||||
| China Media Group Class A |
1,700 | 2,580 | ||||||
| China South Publishing & Media Group Co., Ltd. Class A |
1,300 | 2,988 | ||||||
| China Television Media, Ltd. Class A |
700 | 1,757 | ||||||
| Chinese Universe Publishing and Media Co., Ltd. Class A |
1,000 | 3,330 | ||||||
| CITIC Guoan Information Industry Co., Ltd. Class A |
4,000 | 6,744 | ||||||
| Contemporary Eastern Investment Co., Ltd. Class A (a) |
2,600 | 4,552 | ||||||
| Guangdong Advertising Group Co., Ltd. Class A |
1,859 | 1,945 | ||||||
| Jiangsu Broadcasting Cable Information Network Corp., Ltd. Class A (b) |
1,430 | 2,558 | ||||||
| Jiangsu Phoenix Publishing & Media Corp., Ltd. Class A |
1,500 | 2,089 | ||||||
| Jishi Media Co., Ltd. Class A |
3,500 | 1,781 | ||||||
| Shanghai Oriental Pearl Group Co., Ltd. Class A |
1,500 | 4,582 | ||||||
| Shenzhen Topway Video Communication Co., Ltd. Class A |
1,680 | 2,746 | ||||||
| Wanda Film Holding Co., Ltd. Class A (b) |
200 | 1,691 | ||||||
|
|
|
|||||||
| 41,565 | ||||||||
|
|
|
|||||||
| METALS & MINING — 5.5% |
||||||||
| Advanced Technology & Materials Co., Ltd. Class A (a) |
2,100 | 3,408 | ||||||
| Aluminum Corp. of China, Ltd. Class A (a) (b) |
7,100 | 8,476 | ||||||
| Anyang Iron & Steel, Inc. Class A (a) |
12,900 | 10,351 | ||||||
| Baoshan Iron & Steel Co., Ltd. Class A |
8,656 | 9,630 | ||||||
See accompanying notes to financial statements.
71
Table of Contents
SPDR MSCI China A Shares IMI ETF
SCHEDULE OF INVESTMENTS (continued)
September 30, 2017
| Security Description |
Shares |
Value |
||||||
| China Northern Rare Earth Group High-Tech Co., Ltd. Class A |
2,400 | $ | 5,828 | |||||
| Hunan Gold Corp., Ltd. Class A |
4,800 | 7,334 | ||||||
| Inner Mongolia BaoTou Steel Union Co., Ltd. Class A (a) |
37,800 | 15,364 | ||||||
| Jiangxi Ganfeng Lithium Co., Ltd. Class A |
400 | 5,257 | ||||||
| Kingswood Enterprise Co., Ltd. Class A (a) |
4,500 | 3,780 | ||||||
| Maanshan Iron & Steel Co., Ltd. Class A (a) |
7,400 | 5,124 | ||||||
| Ningxia Xinri Hengli Steel Wire Co., Ltd. Class A (a) |
1,100 | 2,411 | ||||||
| Shandong Gold Mining Co., Ltd. Class A |
1,600 | 7,570 | ||||||
| Shandong Humon Smelting Co., Ltd. Class A (a) |
3,100 | 5,357 | ||||||
| Shandong Iron and Steel Co., Ltd. Class A (a) |
9,360 | 3,480 | ||||||
| Shanghai Prosolar Resources Development Co., Ltd. Class A (a) |
2,300 | 2,645 | ||||||
| Shanxi Taigang Stainless Steel Co., Ltd. Class A |
4,600 | 3,497 | ||||||
| Shenzhen Zhongjin Lingnan Nonfemet Co., Ltd. Class A |
1,700 | 3,104 | ||||||
| Tongling Nonferrous Metals Group Co., Ltd. Class A (a) |
10,600 | 4,819 | ||||||
| Western Mining Co., Ltd. Class A |
5,700 | 7,912 | ||||||
| Zhongjin Gold Corp., Ltd. Class A |
4,130 | 6,665 | ||||||
| Zhongnan Red Culture Group Co., Ltd. Class A |
1,300 | 2,891 | ||||||
| Zijin Mining Group Co., Ltd. Class A |
10,400 | 6,059 | ||||||
|
|
|
|||||||
| 130,962 | ||||||||
|
|
|
|||||||
| MULTILINE RETAIL — 1.4% |
||||||||
| Beijing Capital Retailing Group Co., Ltd. Class A |
1,800 | 2,601 | ||||||
| Changchun Sinoenergy Corp. Class A (a) |
2,800 | 4,712 | ||||||
| Chengdu Hongqi Chain Co., Ltd. Class A |
2,800 | 2,525 | ||||||
| Dalian Friendship Group Class A |
4,200 | 5,766 | ||||||
| Hunan Friendship & Apollo Cmmericial Co., Ltd. Class A |
4,000 | 4,083 | ||||||
| Rainbow Department Store Co., Ltd. Class A |
1,700 | 4,067 | ||||||
| Shanghai Yimin Commerce Group Co., Ltd. Class A |
3,100 | 2,674 | ||||||
| Wuhan Department Store Group Co., Ltd. Class A |
2,080 | 5,714 | ||||||
|
|
|
|||||||
| 32,142 | ||||||||
|
|
|
|||||||
| OIL, GAS & CONSUMABLE FUELS — 2.4% |
| |||||||
| China Merchants Energy Shipping Co., Ltd. Class A |
4,000 | 2,981 | ||||||
| China Petroleum & Chemical Corp. Class A |
4,700 | 4,174 | ||||||
| China Shenhua Energy Co., Ltd. Class A |
1,900 | 5,989 | ||||||
| Guanghui Energy Co., Ltd. Class A |
4,600 | 2,915 | ||||||
| Jizhong Energy Resources Co., Ltd. Class A |
4,100 | 4,222 | ||||||
| Oriental Energy Co., Ltd. Class A |
1,400 | 2,352 | ||||||
| PetroChina Co., Ltd. Class A |
4,500 | 5,413 | ||||||
| Shanxi Lanhua Sci-Tech Venture Co., Ltd. Class A (a) |
6,800 | 9,827 | ||||||
| Shanxi Xishan Coal & Electricity Power Co., Ltd. Class A |
7,000 | 10,864 | ||||||
| Wintime Energy Co., Ltd. Class A |
6,200 | 3,360 | ||||||
| Yang Quan Coal Industry Group Co., Ltd. Class A (a) |
3,400 | 4,177 | ||||||
|
|
|
|||||||
| 56,274 | ||||||||
|
|
|
|||||||
| PAPER & FOREST PRODUCTS — 0.7% |
||||||||
| DeHua TB New Decoration Materials Co., Ltd. Class A |
1,950 | 3,637 | ||||||
| Fujian Jinsen Forestry Co., Ltd. Class A |
400 | 1,324 | ||||||
| Guangdong Weihua Corp. Class A (a) |
3,000 | 7,470 | ||||||
| Sichuan Guodong Construction Co., Ltd. Class A (a) |
5,200 | 3,734 | ||||||
|
|
|
|||||||
| 16,165 | ||||||||
|
|
|
|||||||
| PHARMACEUTICALS — 5.1% |
||||||||
| Beijing Tongrentang Co., Ltd. Class A |
1,000 | 4,879 | ||||||
| China Resources Sanjiu Medical & Pharmaceutical Co., Ltd. Class A |
1,000 | 4,205 | ||||||
| Dong-E-E-Jiao Co., Ltd. Class A |
700 | 6,842 | ||||||
| Guangdong Zhongsheng Pharmaceutical Co., Ltd. Class A |
1,900 | 3,312 | ||||||
| Guangzhou Baiyunshan Pharmaceutical Holdings Co., Ltd. Class A |
600 | 2,512 | ||||||
| Guizhou Bailing Group Pharmaceutical Co., Ltd. Class A |
800 | 2,093 | ||||||
| Harbin Gloria Pharmaceuticals Co., Ltd. Class A |
2,400 | 2,424 | ||||||
| Harbin Pharmaceutical Group Co., Ltd. Class A (b) |
2,210 | 1,946 | ||||||
| Huapont Life Sciences Co., Ltd. Class A |
1,500 | 1,734 | ||||||
| Humanwell Healthcare Group Co., Ltd. Class A |
1,000 | 2,726 | ||||||
| Jiangsu Hengrui Medicine Co., Ltd. Class A |
1,440 | 12,992 | ||||||
| Jilin Aodong Pharmaceutical Group Co., Ltd. Class A |
1,430 | 4,833 | ||||||
| Joincare Pharmaceutical Group Industry Co., Ltd. Class A |
1,400 | 2,059 | ||||||
| Kangmei Pharmaceutical Co., Ltd. Class A |
2,600 | 7,860 | ||||||
| Renhe Pharmacy Co., Ltd. Class A |
1,800 | 1,585 | ||||||
| Shanghai Fosun Pharmaceutical Group Co., Ltd. Class A |
1,100 | 5,662 | ||||||
| Shenzhen Hepalink Pharmaceutical Group Co., Ltd. Class A |
1,280 | 3,312 | ||||||
| Shenzhen Salubris Pharmaceuticals Co., Ltd. Class A |
800 | 3,723 | ||||||
| Shijiazhuang Yiling Pharmaceutical Co., Ltd. Class A |
900 | 2,204 | ||||||
| Sichuan Kelun Pharmaceutical Co., Ltd. Class A |
1,100 | 3,017 | ||||||
| Tasly Pharmaceutical Group Co., Ltd. Class A |
600 | 3,175 | ||||||
| Tianjin Lisheng Pharmaceutical Co., Ltd. Class A |
900 | 4,876 | ||||||
| Tonghua Dongbao Pharmaceutical Co., Ltd. Class A |
1,152 | 3,347 | ||||||
| Yabao Pharmaceutical Group Co., Ltd. Class A |
1,500 | 1,784 | ||||||
| Yifan Pharmaceutical Co., Ltd. Class A |
900 | 2,759 | ||||||
| Yunnan Baiyao Group Co., Ltd. Class A |
600 | 8,192 | ||||||
| Zhangzhou Pientzehuang Pharmaceutical Co., Ltd. Class A |
600 | 5,262 | ||||||
See accompanying notes to financial statements.
72
Table of Contents
SPDR MSCI China A Shares IMI ETF
SCHEDULE OF INVESTMENTS (continued)
September 30, 2017
| Security Description |
Shares |
Value |
||||||
| Zhejiang Yatai Pharmaceutical Co., Ltd. Class A |
3,600 | $ | 8,037 | |||||
| Zhongzhu Holding Co., Ltd. Class A |
2,800 | 2,984 | ||||||
|
|
|
|||||||
| 120,336 | ||||||||
|
|
|
|||||||
| REAL ESTATE MANAGEMENT & DEVELOPMENT — 5.6% |
| |||||||
| Beijing Capital Development Co., Ltd. Class A |
1,600 | 2,669 | ||||||
| Beijing Centergate Technologies Holding Co., Ltd. Class A (a) |
3,200 | 3,637 | ||||||
| Beijing Urban Construction Investment & Development Co., Ltd. Class A |
1,500 | 3,516 | ||||||
| China Fortune Land Development Co., Ltd. Class A |
1,400 | 6,550 | ||||||
| China Merchants Shekou Industrial Zone Holdings Co., Ltd. Class A |
2,721 | 7,488 | ||||||
| China Vanke Co., Ltd. Class A |
5,600 | 22,129 | ||||||
| Chongqing Dima Industry Co., Ltd. Class A |
3,600 | 3,089 | ||||||
| Gemdale Corp. Class A |
2,700 | 4,662 | ||||||
| Guangdong Shirongzhaoye Co., Ltd. Class A |
1,900 | 2,477 | ||||||
| Hainan Haide Industry Co., Ltd. Class A (a) |
1,000 | 4,716 | ||||||
| Hubei Fuxing Science And Technology Co., Ltd. Class A |
1,700 | 3,171 | ||||||
| Hunan Tianrun Digital Entertainment & Cultural Media Co., Ltd. Class A (a) |
5,200 | 11,155 | ||||||
| Jinke Properties Group Co., Ltd. Class A |
4,100 | 3,055 | ||||||
| Lushang Property Co., Ltd. Class A (a) |
3,200 | 2,211 | ||||||
| Myhome Real Estate Development Group Co., Ltd. Class A |
3,600 | 1,826 | ||||||
| Oceanwide Holdings Co., Ltd. Class A |
2,600 | 3,178 | ||||||
| Poly Real Estate Group Co., Ltd. Class A |
1,700 | 2,662 | ||||||
| RiseSun Real Estate Development Co., Ltd. Class A |
2,600 | 3,742 | ||||||
| Shanghai Lujiazui Finance & Trade Zone Development Co., Ltd. Class A |
1,440 | 4,847 | ||||||
| Shanghai SMI Holding Co., Ltd. Class A (a) |
1,409 | 2,083 | ||||||
| Shanghai Wanye Enterprises Co., Ltd. Class A |
2,200 | 4,435 | ||||||
| Shanghai Zhangjiang High-Tech Park Development Co., Ltd. Class A |
1,300 | 3,282 | ||||||
| Shenzhen World Union Properties Consultancy, Inc. Class A |
2,100 | 3,689 | ||||||
| Shenzhen Zhenye Group Co., Ltd. Class A (b) |
2,100 | 3,044 | ||||||
| Tahoe Group Co., Ltd. Class A |
800 | 2,123 | ||||||
| Xinhu Zhongbao Co., Ltd. Class A (a) |
15,100 | 9,752 | ||||||
| Zhejiang China Commodities City Group Co., Ltd. Class A |
4,100 | 4,339 | ||||||
| Zhongtian Financial Group Co., Ltd. Class A (b) |
3,000 | 3,443 | ||||||
|
|
|
|||||||
| 132,970 | ||||||||
|
|
|
|||||||
| ROAD & RAIL — 0.7% |
||||||||
| China High-Speed Railway Technology Co., Ltd. Class A |
3,300 | 4,486 | ||||||
| Daqin Railway Co., Ltd. Class A |
7,400 | 9,747 | ||||||
| Guangshen Railway Co., Ltd. Class A |
4,300 | 3,276 | ||||||
|
|
|
|||||||
| 17,509 | ||||||||
|
|
|
|||||||
| SEMICONDUCTORS & SEMICONDUCTOR EQUIPMENT — 1.3% |
| |||||||
| EGing Photovoltaic Technology Co., Ltd. Class A |
3,600 | 2,791 | ||||||
| Hangzhou Silan Microelectronics Co., Ltd. Class A |
4,200 | 6,588 | ||||||
| LONGi Green Energy Technology Co., Ltd. Class A |
1,800 | 7,986 | ||||||
| Sanan Optoelectronics Co., Ltd. Class A |
2,240 | 7,803 | ||||||
| Shanghai Belling Co., Ltd. Class A |
1,300 | 2,738 | ||||||
| Tianjin Zhonghuan Semiconductor Co., Ltd. Class A (b) |
1,800 | 2,739 | ||||||
|
|
|
|||||||
| 30,645 | ||||||||
|
|
|
|||||||
| SOFTWARE — 1.4% |
||||||||
| Beijing Shiji Information Technology Co., Ltd. Class A |
600 | 2,124 | ||||||
| Glodon Co., Ltd. Class A |
1,000 | 3,079 | ||||||
| Hangzhou Lianluo Interactive Information Technology Co., Ltd. Class A |
1,000 | 1,331 | ||||||
| Hundsun Technologies, Inc. Class A |
400 | 3,073 | ||||||
| Iflytek Co., Ltd. Class A |
900 | 7,269 | ||||||
| Inspur Software Co., Ltd. Class A |
500 | 1,523 | ||||||
| Neusoft Corp. Class A |
1,200 | 3,082 | ||||||
| Shanghai 2345 Network Holding Group Co., Ltd. Class A |
2,040 | 2,190 | ||||||
| Shanghai Golden Bridge InfoTech Co., Ltd. Class A |
600 | 2,013 | ||||||
| Sinodata Co., Ltd. Class A |
300 | 1,326 | ||||||
| Wisesoft Co., Ltd. Class A |
500 | 1,911 | ||||||
| Yonyou Network Technology Co., Ltd. Class A |
1,100 | 3,918 | ||||||
|
|
|
|||||||
| 32,839 | ||||||||
|
|
|
|||||||
| SPECIALTY RETAIL — 0.6% |
||||||||
| Pang Da Automobile Trade Co., Ltd. Class A (a) |
5,700 | 2,446 | ||||||
| Shanghai Yuyuan Tourist Mart Co., Ltd. Class A (b) |
1,500 | 3,139 | ||||||
| Suning Commerce Group Co., Ltd. Class A |
4,300 | 8,480 | ||||||
|
|
|
|||||||
| 14,065 | ||||||||
|
|
|
|||||||
| TECHNOLOGY HARDWARE, STORAGE & PERIPHERALS — 0.5% |
| |||||||
| GRG Banking Equipment Co., Ltd. Class A |
2,025 | 2,387 | ||||||
| Guangzhou KingTeller Technology Co., Ltd. Class A (a) |
2,700 | 2,418 | ||||||
| Inspur Electronic Information Industry Co., Ltd. Class A |
1,040 | 3,004 | ||||||
| Tsinghua Tongfang Co., Ltd. Class A |
2,100 | 3,857 | ||||||
|
|
|
|||||||
| 11,666 | ||||||||
|
|
|
|||||||
| TEXTILES, APPAREL & LUXURY GOODS — 1.5% |
| |||||||
| Anhui Huamao Textile Co. Class A |
4,300 | 3,405 | ||||||
| Bros Eastern Co., Ltd. Class A |
3,000 | 2,601 | ||||||
| Gansu Gangtai Holding Group Co., Ltd. Class A |
1,300 | 2,716 | ||||||
| Huafu Top Dyed Melange Yarn Co., Ltd. Class A |
2,500 | 4,162 | ||||||
| Huasi Holding Co., Ltd. Class A |
1,000 | 1,897 | ||||||
| Jiangsu Huaxicun Co., Ltd. Class A |
2,000 | 2,123 | ||||||
See accompanying notes to financial statements.
73
Table of Contents
SPDR MSCI China A Shares IMI ETF
SCHEDULE OF INVESTMENTS (continued)
September 30, 2017
| Security Description |
Shares |
Value |
||||||
| Jiangsu Sunshine Co., Ltd. Class A (a) |
3,300 | $ | 1,774 | |||||
| Luthai Textile Co., Ltd. Class A |
1,300 | 2,335 | ||||||
| Yantai Tayho Advanced Materials Co., Ltd. Class A |
1,200 | 2,343 | ||||||
| Youngor Group Co., Ltd. Class A |
2,660 | 3,924 | ||||||
| Zhejiang Hangmin Co., Ltd. Class A |
1,700 | 3,061 | ||||||
| Zhejiang Ming Jewelry Co., Ltd. Class A |
1,500 | 1,994 | ||||||
| Zhejiang Weixing Industrial Development Co., Ltd. Class A |
1,300 | 2,117 | ||||||
|
|
|
|||||||
| 34,452 | ||||||||
|
|
|
|||||||
| TRADING COMPANIES & DISTRIBUTORS — 0.7% |
| |||||||
| CMST Development Co., Ltd. Class A |
2,700 | 3,898 | ||||||
| Shandong Hiking International Co., Ltd. Class A (a) |
1,800 | 3,276 | ||||||
| Shanghai Lansheng Corp. Class A |
600 | 1,510 | ||||||
| Shanghai Waigaoqiao Free Trade Zone Group Co., Ltd. Class A |
700 | 1,866 | ||||||
| Sinochem International Corp. Class A |
2,100 | 3,243 | ||||||
| Tianjin Teda Co., Ltd. Class A |
4,500 | 3,462 | ||||||
|
|
|
|||||||
| 17,255 | ||||||||
|
|
|
|||||||
| TRANSPORTATION INFRASTRUCTURE — 1.9% |
| |||||||
| Dalian Port PDA Co., Ltd. Class A |
7,130 | 3,134 | ||||||
| Fujian Expressway Development Co., Ltd. Class A |
9,700 | 5,637 | ||||||
| Henan Zhongyuan Expressway Co., Ltd. Class A |
4,400 | 3,524 | ||||||
| Hubei Chutian Expressway Co., Ltd. Class A |
6,400 | 5,607 | ||||||
| Jiangxi Ganyue Expressway Co., Ltd. Class A |
4,000 | 3,203 | ||||||
| Shanghai International Port Group Co., Ltd. Class A |
3,700 | 3,726 | ||||||
| Shenzhen Chiwan Wharf Holdings, Ltd. Class A |
1,500 | 5,738 | ||||||
| TangShan Port Group Co., Ltd. Class A |
5,040 | 3,839 | ||||||
| Xiandai Investment Co., Ltd. Class A |
4,800 | 4,372 | ||||||
| Yingkou Port Liability Co., Ltd. Class A |
5,100 | 2,626 | ||||||
| Zhangjiagang Freetrade Science & Technology Group Co., Ltd. Class A |
3,600 | 2,536 | ||||||
|
|
|
|||||||
| 43,942 | ||||||||
|
|
|
|||||||
| WATER UTILITIES — 0.6% |
||||||||
| Beijing Capital Co., Ltd. Class A |
4,600 | 4,432 | ||||||
| Chengdu Xingrong Environment Co., Ltd. Class A |
3,600 | 3,100 | ||||||
| Guangdong Golden Dragon Development, Inc. Class A |
900 | 2,886 | ||||||
| Tus-Sound Environmental Resources Co., Ltd. Class A |
700 | 3,788 | ||||||
|
|
|
|||||||
| 14,206 | ||||||||
|
|
|
|||||||
| WIRELESS TELECOMMUNICATION SERVICES — 0.5% |
| |||||||
| China United Network Communications, Ltd. Class A (a) |
11,100 | 12,399 | ||||||
|
|
|
|||||||
| TOTAL COMMON STOCKS |
2,347,300 | |||||||
|
|
|
|||||||
| SHORT-TERM INVESTMENT — 0.0% (c) |
| |||||||
| State Street Institutional U.S. Government Money Market Fund, Class G Shares 0.96% (d)
(e) |
966 | 966 | ||||||
|
|
|
|||||||
| TOTAL INVESTMENTS — 99.6% |
2,348,266 | |||||||
| OTHER ASSETS IN EXCESS OF LIABILITIES — 0.4% |
9,067 | |||||||
|
|
|
|||||||
| NET ASSETS — 100.0% |
$ | 2,357,333 | ||||||
|
|
|
|||||||
| (a) | Non-income producing security. |
| (b) | Fair valued as determined in good faith by the Trust’s Oversight Committee in accordance with policy and procedures approved by the Board of Trustees. As of September 30, 2017, total aggregate fair value of securities is $73,013 representing 3.1% of net assets. |
| (c) | Amount shown represents less than 0.05% of net assets. |
| (d) | The Fund invested in certain money market funds managed by SSGA Funds Management, Inc. Amounts related to these transactions during the period ended September 30, 2017 are shown in the Affiliate Table below. |
| (e) | The rate shown is the annualized seven-day yield at September 30, 2017. |
The following table summarizes the value of the Fund’s investments according to the fair value hierarchy as of September 30, 2017.
| Description |
Level 1 — Quoted Prices |
Level 2 — Other Significant Observable Inputs |
Level 3 — Significant Unobservable Inputs |
Total | ||||||||||||
| ASSETS: |
||||||||||||||||
| INVESTMENTS: |
||||||||||||||||
| Common Stocks |
||||||||||||||||
| Aerospace & Defense |
$ | 20,939 | $ | — | $ | — | $ | 20,939 | ||||||||
| Air Freight & Logistics |
9,420 | 2,612 | — | 12,032 | ||||||||||||
| Airlines |
23,508 | — | — | 23,508 | ||||||||||||
| Auto Components |
47,317 | — | — | 47,317 | ||||||||||||
| Automobiles |
25,634 | — | — | 25,634 | ||||||||||||
| Banks |
256,363 | — | — | 256,363 | ||||||||||||
| Beverages |
119,243 | 3,014 | — | 122,257 | ||||||||||||
See accompanying notes to financial statements.
74
Table of Contents
SPDR MSCI China A Shares IMI ETF
SCHEDULE OF INVESTMENTS (continued)
September 30, 2017
| Description |
Level 1 — Quoted Prices |
Level 2 — Other Significant Observable Inputs |
Level 3 — Significant Unobservable Inputs |
Total | ||||||||||||
| Biotechnology |
$ | 12,798 | $ | — | $ | — | $ | 12,798 | ||||||||
| Building Products |
4,889 | — | — | 4,889 | ||||||||||||
| Capital Markets |
120,265 | — | — | 120,265 | ||||||||||||
| Chemicals |
123,980 | 2,436 | — | 126,416 | ||||||||||||
| Commercial Services & Supplies |
18,321 | 1,824 | — | 20,145 | ||||||||||||
| Communications Equipment |
25,483 | 3,222 | — | 28,705 | ||||||||||||
| Construction & Engineering |
83,894 | — | — | 83,894 | ||||||||||||
| Construction Materials |
18,138 | — | — | 18,138 | ||||||||||||
| Containers & Packaging |
16,134 | 2,304 | — | 18,438 | ||||||||||||
| Distributors |
1,458 | — | — | 1,458 | ||||||||||||
| Diversified Consumer Services |
9,068 | — | — | 9,068 | ||||||||||||
| Diversified Financial Services |
6,589 | — | — | 6,589 | ||||||||||||
| Diversified Telecommunication Services |
8,053 | — | — | 8,053 | ||||||||||||
| Electric Utilities |
3,651 | — | — | 3,651 | ||||||||||||
| Electrical Equipment |
77,935 | 11,504 | — | 89,439 | ||||||||||||
| Electronic Equipment, Instruments & Components |
91,445 | — | — | 91,445 | ||||||||||||
| Energy Equipment & Services |
16,259 | — | — | 16,259 | ||||||||||||
| Food & Staples Retailing |
8,462 | — | — | 8,462 | ||||||||||||
| Food Products |
66,525 | — | — | 66,525 | ||||||||||||
| Health Care Equipment & Supplies |
1,853 | — | — | 1,853 | ||||||||||||
| Health Care Providers & Services |
8,721 | — | — | 8,721 | ||||||||||||
| Hotels, Restaurants & Leisure |
11,396 | — | — | 11,396 | ||||||||||||
| Household Durables |
44,692 | — | — | 44,692 | ||||||||||||
| Independent Power Producers & Energy Traders |
59,464 | — | — | 59,464 | ||||||||||||
| Industrial Conglomerates |
2,740 | — | — | 2,740 | ||||||||||||
| Insurance |
69,220 | — | — | 69,220 | ||||||||||||
| Internet Software & Services |
6,571 | — | — | 6,571 | ||||||||||||
| IT Services |
22,454 | — | — | 22,454 | ||||||||||||
| Leisure Equipment & Products |
2,011 | — | — | 2,011 | ||||||||||||
| Life Sciences Tools & Services |
2,286 | — | — | 2,286 | ||||||||||||
| Machinery |
94,752 | 19,061 | — | 113,813 | ||||||||||||
| Media |
37,316 | 4,249 | — | 41,565 | ||||||||||||
| Metals & Mining |
122,486 | 8,476 | — | 130,962 | ||||||||||||
| Multiline Retail |
32,142 | — | — | 32,142 | ||||||||||||
| Oil, Gas & Consumable Fuels |
56,274 | — | — | 56,274 | ||||||||||||
| Paper & Forest Products |
16,165 | — | — | 16,165 | ||||||||||||
| Pharmaceuticals |
118,390 | 1,946 | — | 120,336 | ||||||||||||
| Real Estate Management & Development |
126,483 | 6,487 | — | 132,970 | ||||||||||||
| Road & Rail |
17,509 | — | — | 17,509 | ||||||||||||
| Semiconductors & Semiconductor Equipment |
27,906 | 2,739 | — | 30,645 | ||||||||||||
| Software |
32,839 | — | — | 32,839 | ||||||||||||
| Specialty Retail |
10,926 | 3,139 | — | 14,065 | ||||||||||||
| Technology Hardware, Storage & Peripherals |
11,666 | — | — | 11,666 | ||||||||||||
| Textiles, Apparel & Luxury Goods |
34,452 | — | — | 34,452 | ||||||||||||
| Trading Companies & Distributors |
17,255 | — | — | 17,255 | ||||||||||||
| Transportation Infrastructure |
43,942 | — | — | 43,942 | ||||||||||||
| Water Utilities |
14,206 | — | — | 14,206 | ||||||||||||
| Wireless Telecommunication Services |
12,399 | — | — | 12,399 | ||||||||||||
| Short-Term Investment |
966 | — | — | 966 | ||||||||||||
|
|
|
|
|
|
|
|
|
|||||||||
| TOTAL INVESTMENTS |
$ | 2,275,253 | $ | 73,013 | $ | — | $ | 2,348,266 | ||||||||
|
|
|
|
|
|
|
|
|
|||||||||
See accompanying notes to financial statements.
75
Table of Contents
SPDR MSCI China A Shares IMI ETF
SCHEDULE OF INVESTMENTS (continued)
September 30, 2017
Affiliate Table
| Number of Shares Held at 9/30/16 |
Value at 9/30/16 |
Cost of Purchases |
Proceeds from Shares Sold |
Realized Gain (Loss) |
Change in Unrealized Appreciation/ Depreciation |
Number of Shares Held at 9/30/17 |
Value at 9/30/17 |
Dividend Income |
||||||||||||||||||||||||||||
| State Street Institutional Liquid Reserves Fund, Premier Class |
338 | $ | 338 | $ | 1 | $ | 339 | $ | — | $ | — | — | $ | — | $ | — | ||||||||||||||||||||
| State Street Institutional U.S. Government Money Market Fund, Class G Shares |
— | — | 21,748 | 20,782 | — | — | 966 | 966 | 5 | |||||||||||||||||||||||||||
| State Street Institutional U.S. Government Money Market Fund, Premier Class |
— | — | 1,447 | 1,447 | — | — | — | — | 1 | |||||||||||||||||||||||||||
|
|
|
|
|
|
|
|
|
|
|
|
|
|
|
|||||||||||||||||||||||
| TOTAL |
$ | 338 | $ | 23,196 | $ | 22,568 | $ | — | $ | — | $ | 966 | $ | 6 | ||||||||||||||||||||||
|
|
|
|
|
|
|
|
|
|
|
|
|
|
|
|||||||||||||||||||||||
See accompanying notes to financial statements.
76
Table of Contents
SPDR S&P Emerging Markets Dividend ETF
SCHEDULE OF INVESTMENTS
September 30, 2017
| Security Description |
Shares |
Value |
||||||
| COMMON STOCKS — 99.7% |
| |||||||
| CHILE — 0.5% |
| |||||||
| Banco de Chile ADR |
357 | $ | 32,547 | |||||
| Banco de Credito e Inversiones |
20,072 | 1,271,251 | ||||||
| Embotelladora Andina SA Class B, Preference Shares |
154,991 | 725,448 | ||||||
|
|
|
|||||||
| 2,029,246 | ||||||||
|
|
|
|||||||
| CHINA — 11.9% |
| |||||||
| China Merchants Port Holdings Co., Ltd. |
1,932,393 | 5,962,420 | ||||||
| China Overseas Land & Investment, Ltd. |
3,260,000 | 10,601,354 | ||||||
| China Resources Land, Ltd. |
3,186,000 | 9,748,857 | ||||||
| China Telecom Corp., Ltd. Class H |
19,210,000 | 9,837,787 | ||||||
| China Zhongwang Holdings, Ltd. (a) |
2,034,000 | 1,039,044 | ||||||
| Far East Horizon, Ltd. |
1,367,000 | 1,284,620 | ||||||
| Guangdong Investment, Ltd. |
3,780,000 | 5,391,220 | ||||||
| Jiangsu Expressway Co., Ltd. Class H |
1,926,000 | 2,949,154 | ||||||
| Logan Property Holdings Co., Ltd. (a) |
40,100 | 41,380 | ||||||
| Shenzhen International Holdings, Ltd. |
1,819,719 | 3,420,113 | ||||||
| Shenzhen Investment, Ltd. |
164,436 | 74,526 | ||||||
|
|
|
|||||||
| 50,350,475 | ||||||||
|
|
|
|||||||
| COLOMBIA — 1.0% |
| |||||||
| Bancolombia SA Preference Shares |
277,255 | 3,189,145 | ||||||
| Grupo Aval Acciones y Valores SA Preference Shares |
2,163,388 | 979,764 | ||||||
|
|
|
|||||||
| 4,168,909 | ||||||||
|
|
|
|||||||
| HONG KONG — 1.8% |
| |||||||
| Lee & Man Paper Manufacturing, Ltd. |
3,538,000 | 4,529,684 | ||||||
| Skyworth Digital Holdings, Ltd. (a) |
5,948,000 | 3,038,462 | ||||||
|
|
|
|||||||
| 7,568,146 | ||||||||
|
|
|
|||||||
| INDIA — 1.9% |
| |||||||
| Infosys, Ltd. |
585,924 | 8,072,153 | ||||||
|
|
|
|||||||
| INDONESIA — 4.4% |
| |||||||
| Bank Rakyat Indonesia Persero Tbk PT |
7,864,200 | 8,918,677 | ||||||
| Telekomunikasi Indonesia Persero Tbk PT |
28,023,800 | 9,737,277 | ||||||
|
|
|
|||||||
| 18,655,954 | ||||||||
|
|
|
|||||||
| MALAYSIA — 5.9% |
| |||||||
| Astro Malaysia Holdings Bhd |
976,800 | 652,357 | ||||||
| Bursa Malaysia Bhd |
477,400 | 1,130,610 | ||||||
| Inari Amertron Bhd |
2,702,700 | 1,625,781 | ||||||
| IOI Properties Group Bhd |
1,372,100 | 656,398 | ||||||
| Petronas Gas Bhd |
383,200 | 1,624,459 | ||||||
| Public Bank Bhd |
1,850,800 | 8,959,231 | ||||||
| Tenaga Nasional Bhd |
2,691,300 | 9,127,156 | ||||||
| Westports Holdings Bhd |
1,377,200 | 1,242,660 | ||||||
|
|
|
|||||||
| 25,018,652 | ||||||||
|
|
|
|||||||
| MEXICO — 0.5% |
| |||||||
| Bolsa Mexicana de Valores SAB de CV |
468,094 | 784,915 | ||||||
| Macquarie Mexico Real Estate Management SA de CV REIT (b) |
1,164,707 | 1,546,379 | ||||||
|
|
|
|||||||
| 2,331,294 | ||||||||
|
|
|
|||||||
| PHILIPPINES — 0.9% |
| |||||||
| DMCI Holdings, Inc. |
6,319,400 | 1,940,622 | ||||||
| Semirara Mining & Power Corp. |
2,232,660 | 2,052,485 | ||||||
|
|
|
|||||||
| 3,993,107 | ||||||||
|
|
|
|||||||
| POLAND — 1.0% |
| |||||||
| Asseco Poland SA |
81,164 | 1,031,046 | ||||||
| Polskie Gornictwo Naftowe i Gazownictwo SA |
1,626,312 | 3,030,409 | ||||||
|
|
|
|||||||
| 4,061,455 | ||||||||
|
|
|
|||||||
| QATAR — 0.5% |
| |||||||
| Qatar Electricity & Water Co. QSC |
15,677 | 752,686 | ||||||
| Qatar International Islamic Bank QSC |
51,960 | 730,858 | ||||||
| Qatar Islamic Bank SAQ |
28,104 | 703,304 | ||||||
|
|
|
|||||||
| 2,186,848 | ||||||||
|
|
|
|||||||
| RUSSIA — 6.4% |
| |||||||
| Gazprom PJSC ADR |
3,121,939 | 13,080,924 | ||||||
| LUKOIL PJSC |
202,769 | 10,778,296 | ||||||
| LUKOIL PJSC ADR |
57,249 | 3,030,190 | ||||||
|
|
|
|||||||
| 26,889,410 | ||||||||
|
|
|
|||||||
| SOUTH AFRICA — 23.2% |
| |||||||
| AVI, Ltd. |
330,276 | 2,394,669 | ||||||
| Barclays Africa Group, Ltd. |
756,106 | 7,783,650 | ||||||
| FirstRand, Ltd. (a) |
1,521,042 | 5,861,123 | ||||||
| Foschini Group, Ltd. |
554,336 | 5,573,124 | ||||||
| Growthpoint Properties, Ltd. REIT (a) |
3,428,892 | 6,170,863 | ||||||
| JSE, Ltd. |
108,575 | 995,891 | ||||||
| Liberty Holdings, Ltd. |
262,599 | 2,046,726 | ||||||
| Life Healthcare Group Holdings, Ltd. |
3,488,530 | 6,123,174 | ||||||
| MMI Holdings, Ltd. (a) |
1,242,718 | 1,596,827 | ||||||
| Nedbank Group, Ltd. |
419,185 | 6,291,268 | ||||||
| Netcare, Ltd. |
2,393,319 | 4,218,552 | ||||||
| Pick n Pay Stores, Ltd. |
787,725 | 3,360,921 | ||||||
| Rand Merchant Investment Holdings, Ltd. |
753,979 | 2,315,683 | ||||||
| Reunert, Ltd. |
107,651 | 539,909 | ||||||
| RMB Holdings, Ltd. |
670,796 | 3,154,642 | ||||||
| Sanlam, Ltd. |
943,596 | 4,728,288 | ||||||
| SPAR Group, Ltd. |
412,108 | 5,099,426 | ||||||
| Standard Bank Group, Ltd. (a) |
534,733 | 6,249,673 | ||||||
| Tiger Brands, Ltd. |
122,544 | 3,424,698 | ||||||
| Truworths International, Ltd. (a) |
1,314,423 | 7,520,028 | ||||||
| Tsogo Sun Holdings, Ltd. |
717,074 | 1,075,943 | ||||||
| Vodacom Group, Ltd. |
476,071 | 5,681,472 | ||||||
| Woolworths Holdings, Ltd. |
1,307,006 | 5,797,192 | ||||||
|
|
|
|||||||
| 98,003,742 | ||||||||
|
|
|
|||||||
| TAIWAN — 22.0% |
| |||||||
| Advanced Semiconductor Engineering, Inc. |
5,632,361 | 6,890,931 | ||||||
| Cheng Shin Rubber Industry Co., Ltd. |
2,078,000 | 4,159,563 | ||||||
| Chin-Poon Industrial Co., Ltd. |
845,000 | 1,621,785 | ||||||
| FLEXium Interconnect, Inc. |
2,156,864 | 8,250,766 | ||||||
| Giant Manufacturing Co., Ltd. |
271,000 | 1,273,496 | ||||||
| Ginko International Co., Ltd. |
183,000 | 1,252,226 | ||||||
| Hua Nan Financial Holdings Co., Ltd. |
6,391,900 | 3,467,443 | ||||||
| Huaku Development Co., Ltd. |
448,000 | 978,024 | ||||||
| Kung Long Batteries Industrial Co., Ltd. |
111,000 | 539,919 | ||||||
See accompanying notes to financial statements.
77
Table of Contents
SPDR S&P Emerging Markets Dividend ETF
SCHEDULE OF INVESTMENTS (continued)
September 30, 2017
| Security Description |
Shares |
Value |
||||||
| Lite-On Technology Corp. |
2,574,000 | $ | 3,675,445 | |||||
| Mega Financial Holding Co., Ltd. |
6,894,000 | 5,388,069 | ||||||
| Namchow Holdings Co., Ltd. |
284,000 | 569,424 | ||||||
| Phison Electronics Corp. |
560,000 | 6,648,199 | ||||||
| Pou Chen Corp. |
1,751,000 | 2,197,123 | ||||||
| Sercomm Corp. |
504,000 | 1,357,895 | ||||||
| Simplo Technology Co., Ltd. |
343,800 | 1,825,346 | ||||||
| Sinbon Electronics Co., Ltd. |
336,000 | 888,643 | ||||||
| Sitronix Technology Corp. |
400,000 | 1,160,797 | ||||||
| Taiwan Mobile Co., Ltd. |
2,292,200 | 8,163,751 | ||||||
| Taiwan Semiconductor Manufacturing Co., Ltd. ADR |
256,360 | 9,626,318 | ||||||
| TTY Biopharm Co., Ltd. |
587,000 | 1,718,955 | ||||||
| TXC Corp. |
728,000 | 943,490 | ||||||
| Uni-President Enterprises Corp. |
4,468,000 | 9,356,220 | ||||||
| United Microelectronics Corp. |
10,310,000 | 5,150,920 | ||||||
| Wistron NeWeb Corp. |
882,035 | 2,530,571 | ||||||
| WPG Holdings, Ltd. |
2,528,000 | 3,363,831 | ||||||
|
|
|
|||||||
| 92,999,150 | ||||||||
|
|
|
|||||||
| THAILAND — 17.1% |
| |||||||
| Bangkok Bank PCL |
1,359,397 | 7,948,498 | ||||||
| Bangkok Bank PCL NVDR |
418,900 | 2,342,574 | ||||||
| Delta Electronics Thailand PCL (c) |
84,300 | 220,545 | ||||||
| Delta Electronics Thailand PCL NVDR |
478,100 | 1,250,801 | ||||||
| Electricity Generating PCL (c) |
28,100 | 198,006 | ||||||
| Electricity Generating PCL NVDR |
262,300 | 1,848,291 | ||||||
| Glow Energy PCL (c) |
114,600 | 306,688 | ||||||
| Glow Energy PCL NVDR |
868,500 | 2,324,247 | ||||||
| Major Cineplex Group PCL (c) |
27,000 | 24,693 | ||||||
| Major Cineplex Group PCL NVDR |
834,000 | 762,729 | ||||||
| Pruksa Holding PCL NVDR |
37,000 | 26,072 | ||||||
| PTT Global Chemical PCL (c) |
105,400 | 243,352 | ||||||
| PTT Global Chemical PCL NVDR |
4,551,100 | 10,507,787 | ||||||
| PTT PCL |
25,700 | 314,411 | ||||||
| PTT PCL NVDR |
1,116,100 | 13,654,237 | ||||||
| Ratchaburi Electricity Generating Holding PCL (c) |
745,000 | 1,200,712 | ||||||
| Siam Cement PCL |
108,400 | 1,631,688 | ||||||
| Siam Cement PCL NVDR |
702,200 | 10,527,736 | ||||||
| Thai Beverage PCL |
11,540,700 | 7,648,757 | ||||||
| Thai Vegetable Oil PCL (c) |
53,100 | 45,776 | ||||||
| Thai Vegetable Oil PCL NVDR |
1,641,300 | 1,414,914 | ||||||
| Thanachart Capital PCL (c) |
279,500 | 408,564 | ||||||
| Thanachart Capital PCL NVDR |
1,330,700 | 1,945,176 | ||||||
| Tisco Financial Group PCL (c) |
184,900 | 426,906 | ||||||
| Tisco Financial Group PCL NVDR |
2,159,400 | 4,985,721 | ||||||
|
|
|
|||||||
| 72,208,881 | ||||||||
|
|
|
|||||||
| TURKEY — 0.7% |
| |||||||
| Enka Insaat ve Sanayi A/S |
2,079,723 | 3,029,432 | ||||||
|
|
|
|||||||
| TOTAL COMMON STOCKS |
421,566,854 | |||||||
|
|
|
|||||||
| SHORT-TERM INVESTMENTS — 3.9% |
| |||||||
| State Street Institutional U.S. Government Money Market Fund, Class G Shares 0.96% (d) (e) |
26,195 | 26,195 | ||||||
| State Street Navigator Securities Lending Government Money Market Portfolio (d) (f) |
16,561,043 | 16,561,043 | ||||||
|
|
|
|||||||
| TOTAL SHORT-TERM INVESTMENTS |
16,587,238 | |||||||
|
|
|
|||||||
| TOTAL INVESTMENTS — 103.6% |
438,154,092 | |||||||
| LIABILITIES IN EXCESS OF OTHER ASSETS — (3.6)% |
(15,296,505 | ) | ||||||
|
|
|
|||||||
| NET ASSETS — 100.0% |
$ | 422,857,587 | ||||||
|
|
|
|||||||
| (a) | All or a portion of the shares of the security are on loan at September 30, 2017. |
| (b) | Non-income producing security. |
| (c) | Fair valued as determined in good faith by the Trust’s Oversight Committee in accordance with policy and procedures approved by the Board of Trustees. As of September 30, 2017, total aggregate fair value of securities is $3,075,242 representing 0.7% of net assets. |
| (d) | The Fund invested in certain money market funds managed by SSGA Funds Management, Inc. Amounts related to these transactions during the period ended September 30, 2017 are shown in the Affiliate Table below. |
| (e) | The rate shown is the annualized seven-day yield at September 30, 2017. |
| (f) | Investment of cash collateral for securities loaned. |
ADR = American Depositary Receipt
NVDR = Non Voting Depositary Receipt
REIT = Real Estate Investment Trust
The following table summarizes the value of the Fund’s investments according to the fair value hierarchy as of September 30, 2017.
| Description |
Level 1 — Quoted Prices |
Level 2 — Other Significant Observable Inputs |
Level 3 — Significant Unobservable Inputs |
Total | ||||||||||||
| ASSETS: |
||||||||||||||||
| INVESTMENTS: |
||||||||||||||||
| Common Stocks |
||||||||||||||||
| Chile |
$ | 2,029,246 | $ | — | $ | — | $ | 2,029,246 | ||||||||
| China |
50,350,475 | — | — | 50,350,475 | ||||||||||||
| Colombia |
4,168,909 | — | — | 4,168,909 | ||||||||||||
See accompanying notes to financial statements.
78
Table of Contents
SPDR S&P Emerging Markets Dividend ETF
SCHEDULE OF INVESTMENTS (continued)
September 30, 2017
| Description |
Level 1 — Quoted Prices |
Level 2 — Other Significant Observable Inputs |
Level 3 — Significant Unobservable Inputs |
Total | ||||||||||||
| Hong Kong |
$ | 7,568,146 | $ | — | $ | — | $ | 7,568,146 | ||||||||
| India |
8,072,153 | — | — | 8,072,153 | ||||||||||||
| Indonesia |
18,655,954 | — | — | 18,655,954 | ||||||||||||
| Malaysia |
25,018,652 | — | — | 25,018,652 | ||||||||||||
| Mexico |
2,331,294 | — | — | 2,331,294 | ||||||||||||
| Philippines |
3,993,107 | — | — | 3,993,107 | ||||||||||||
| Poland |
4,061,455 | — | — | 4,061,455 | ||||||||||||
| Qatar |
2,186,848 | — | — | 2,186,848 | ||||||||||||
| Russia |
26,889,410 | — | — | 26,889,410 | ||||||||||||
| South Africa |
98,003,742 | — | — | 98,003,742 | ||||||||||||
| Taiwan |
92,999,150 | — | — | 92,999,150 | ||||||||||||
| Thailand |
68,819,228 | 3,389,653 | — | 72,208,881 | ||||||||||||
| Turkey |
3,029,432 | — | — | 3,029,432 | ||||||||||||
| Short-Term Investments |
16,587,238 | — | — | 16,587,238 | ||||||||||||
|
|
|
|
|
|
|
|
|
|||||||||
| TOTAL INVESTMENTS |
$ | 434,764,439 | $ | 3,389,653 | $ | — | $ | 438,154,092 | ||||||||
|
|
|
|
|
|
|
|
|
|||||||||
Affiliate Table
| Number of Shares Held at 9/30/16 |
Value at 9/30/16 |
Cost of Purchases |
Proceeds from Shares Sold |
Realized Gain (Loss) |
Change in Unrealized Appreciation/ Depreciation |
Number of Shares Held at 9/30/17 |
Value at 9/30/17 |
Dividend Income |
||||||||||||||||||||||||||||
| State Street Institutional Liquid Reserves Fund, Premier Class |
294,049 | $ | 294,049 | $ | — | $ | 294,049 | $ | — | $ | — | — | $ | — | $ | 30 | ||||||||||||||||||||
| State Street Institutional U.S. Government Money Market Fund, Class G Shares |
— | — | 26,945,675 | 26,919,480 | — | — | 26,195 | 26,195 | 2,685 | |||||||||||||||||||||||||||
| State Street Institutional U.S. Government Money Market Fund, Premier Class |
— | — | 41,759,372 | 41,759,372 | — | — | — | — | 1,355 | |||||||||||||||||||||||||||
| State Street Navigator Securities Lending Government Money Market Portfolio* |
5,451,073 | 5,451,073 | 106,145,721 | 95,035,751 | — | — | 16,561,043 | 16,561,043 | 55,743 | |||||||||||||||||||||||||||
|
|
|
|
|
|
|
|
|
|
|
|
|
|
|
|||||||||||||||||||||||
| TOTAL |
$ | 5,745,122 | $ | 174,850,768 | $ | 164,008,652 | $ | — | $ | — | $ | 16,587,238 | $ | 59,813 | ||||||||||||||||||||||
|
|
|
|
|
|
|
|
|
|
|
|
|
|
|
|||||||||||||||||||||||
| * | Effective October 5, 2016, the name of State Street Navigator Securities Lending Prime Portfolio was changed to State Street Navigator Securities Lending Government Money Market Portfolio. |
See accompanying notes to financial statements.
79
Table of Contents
SPDR S&P International Small Cap ETF
SCHEDULE OF INVESTMENTS
September 30, 2017
| Security Description |
Shares |
Value |
||||||
| COMMON STOCKS — 99.6% |
| |||||||
| AUSTRALIA — 6.5% |
| |||||||
| Abacus Property Group |
159,620 | $ | 473,429 | |||||
| ACN 004 410 833, Ltd. (a) (b) |
1,727,582 | — | ||||||
| Aconex, Ltd. (a) (c) |
118,895 | 372,231 | ||||||
| AET&D Holdings NO. 1 Pty, Ltd. (b) (c) |
110,316 | — | ||||||
| Afterpay Touch Group, Ltd. (a) |
76,707 | 251,586 | ||||||
| Ainsworth Game Technology, Ltd. (c) |
67,801 | 135,660 | ||||||
| Altium, Ltd. |
62,143 | 527,101 | ||||||
| Amaysim Australia, Ltd. (c) |
148,510 | 228,978 | ||||||
| APN Outdoor Group, Ltd. (c) |
94,748 | 350,160 | ||||||
| Appen, Ltd. |
53,374 | 218,194 | ||||||
| ARB Corp., Ltd. (c) |
41,723 | 566,366 | ||||||
| Ardent Leisure Group (c) |
267,417 | 381,888 | ||||||
| Arena REIT |
166,171 | 299,888 | ||||||
| Asaleo Care, Ltd. |
196,048 | 237,666 | ||||||
| Astro Japan Property Group |
33,776 | 191,612 | ||||||
| Atlas Iron, Ltd. (a) |
57 | 1 | ||||||
| Ausdrill, Ltd. |
144,159 | 227,360 | ||||||
| Austal, Ltd. |
156,706 | 191,202 | ||||||
| Australian Agricultural Co., Ltd. (a) (c) |
189,905 | 229,474 | ||||||
| Australian Pharmaceutical Industries, Ltd. |
113,421 | 132,604 | ||||||
| Automotive Holdings Group, Ltd. (c) |
102,082 | 265,927 | ||||||
| Aveo Group |
188,423 | 353,352 | ||||||
| AWE, Ltd. (a) |
297,134 | 104,916 | ||||||
| BC Iron, Ltd. (a) |
3 | — | ||||||
| Beach Energy, Ltd. |
1,273,364 | 824,294 | ||||||
| Beadell Resources, Ltd. (a) (c) |
540,567 | 80,590 | ||||||
| Bega Cheese, Ltd. |
86,324 | 462,624 | ||||||
| Bellamy’s Australia, Ltd. (c) |
34,697 | 205,004 | ||||||
| Bingo Industries, Ltd. (a) |
141,428 | 244,137 | ||||||
| Blackmores, Ltd. (c) |
6,839 | 633,214 | ||||||
| Breville Group, Ltd. |
58,396 | 518,687 | ||||||
| Brickworks, Ltd. |
40,618 | 430,576 | ||||||
| Burson Group, Ltd. |
102,330 | 420,736 | ||||||
| Buru Energy, Ltd. (a) |
12 | 2 | ||||||
| BWP Trust |
167,408 | 387,502 | ||||||
| BWX, Ltd. |
58,319 | 268,611 | ||||||
| Cabcharge Australia, Ltd. |
61,109 | 87,028 | ||||||
| Cardno, Ltd. (a) |
103,222 | 113,390 | ||||||
| Cash Converters International, Ltd. |
33,142 | 10,272 | ||||||
| Central Petroleum, Ltd. (a) |
21 | 2 | ||||||
| Charter Hall Group REIT |
221,774 | 934,460 | ||||||
| Charter Hall Long Wale REIT |
72,423 | 239,809 | ||||||
| Charter Hall Retail REIT |
247,166 | 766,058 | ||||||
| Clean TeQ Holdings, Ltd. (a) (c) |
245,431 | 200,281 | ||||||
| Cleanaway Waste Management, Ltd. |
741,519 | 800,020 | ||||||
| Collins Foods, Ltd. |
51,126 | 234,679 | ||||||
| Cooper Energy, Ltd. (a) |
908,462 | 199,591 | ||||||
| Corporate Travel Management, Ltd. (c) |
50,144 | 860,092 | ||||||
| Costa Group Holdings, Ltd. |
135,380 | 592,740 | ||||||
| Credit Corp. Group, Ltd. |
27,506 | 414,817 | ||||||
| Cromwell Property Group |
479,465 | 359,283 | ||||||
| CSR, Ltd. |
334,877 | 1,242,860 | ||||||
| Dacian Gold, Ltd. (a) (c) |
127,502 | 200,089 | ||||||
| Data#3, Ltd. |
6 | 8 | ||||||
| DuluxGroup, Ltd. |
173,048 | 950,475 | ||||||
| Eclipx Group, Ltd. |
143,350 | 455,542 | ||||||
| Elders, Ltd. (a) |
62,452 | 237,664 | ||||||
| Emeco Holdings, Ltd. (a) |
30 | 5 | ||||||
| EML Payments, Ltd. (a) |
187,673 | 294,515 | ||||||
| Estia Health, Ltd. (c) |
99,556 | 247,630 | ||||||
| Evolution Mining, Ltd. |
45 | 78 | ||||||
| Fairfax Media, Ltd. |
1,054,043 | 781,567 | ||||||
| FAR, Ltd. (a) |
4,263,253 | 234,161 | ||||||
| Fleetwood Corp., Ltd. |
30 | 64 | ||||||
| FlexiGroup, Ltd. (c) |
139,960 | 170,769 | ||||||
| Folkestone Education Trust |
137,008 | 294,559 | ||||||
| G8 Education, Ltd. (c) |
175,338 | 559,946 | ||||||
| Galaxy Resources, Ltd. (a) (c) |
162,890 | 332,310 | ||||||
| Gateway Lifestyle (c) |
172,216 | 264,853 | ||||||
| GDI Property Group |
218,076 | 193,358 | ||||||
| Genworth Mortgage Insurance Australia, Ltd. |
88,869 | 194,550 | ||||||
| Gold Road Resources, Ltd. (a) (c) |
457,427 | 254,833 | ||||||
| GrainCorp, Ltd. Class A |
113,359 | 725,808 | ||||||
| Greencross, Ltd. |
58,653 | 243,457 | ||||||
| Greenland Minerals & Energy, Ltd. (a) |
84 | 6 | ||||||
| Growthpoint Properties Australia, Ltd. (c) |
77,605 | 193,030 | ||||||
| GUD Holdings, Ltd. |
45,720 | 391,029 | ||||||
| GWA Group, Ltd. |
133,960 | 274,342 | ||||||
| Hansen Technologies, Ltd. |
97,471 | 256,210 | ||||||
| Horizon Oil, Ltd. (a) |
54 | 2 | ||||||
| Hotel Property Investments |
83,854 | 207,915 | ||||||
| HT&E, Ltd. (c) |
90,002 | 145,477 | ||||||
| Icon Energy, Ltd. (a) |
24 | — | ||||||
| IDP Education, Ltd. |
48,376 | 214,464 | ||||||
| Imdex, Ltd. (a) |
9 | 6 | ||||||
| Independence Group NL (c) |
257,211 | 698,299 | ||||||
| Industria REIT |
99,447 | 195,858 | ||||||
| Infigen Energy (a) |
961,928 | 573,630 | ||||||
| Ingenia Communities Group |
61,180 | 126,733 | ||||||
| Inghams Group, Ltd. |
85,226 | 250,772 | ||||||
| InvoCare, Ltd. |
206,554 | 2,544,539 | ||||||
| IPH, Ltd. |
104,106 | 370,858 | ||||||
| IRESS, Ltd. (c) |
54,139 | 483,849 | ||||||
| iSelect, Ltd. |
164,242 | 206,196 | ||||||
| iSentia Group, Ltd. (c) |
121,045 | 169,061 | ||||||
| Jacana Minerals, Ltd. (b) |
12,051 | — | ||||||
| Japara Healthcare, Ltd. (c) |
130,487 | 183,272 | ||||||
| JB Hi-Fi, Ltd. (c) |
147 | 2,644 | ||||||
| Karoon Gas Australia, Ltd. (a) |
132,495 | 133,591 | ||||||
| Kingsgate Consolidated, Ltd. (a) |
1,374 | 302 | ||||||
| Liquefied Natural Gas, Ltd. (a) |
238,602 | 73,952 | ||||||
| Lynas Corp., Ltd. (a) (c) |
2,828,955 | 432,849 | ||||||
| MACA, Ltd. |
29,830 | 50,089 | ||||||
| Mantra Group, Ltd. |
145,866 | 365,107 | ||||||
| Mayne Pharma Group, Ltd. (a) (c) |
940,955 | 487,291 | ||||||
| McMillan Shakespeare, Ltd. |
41,901 | 483,301 | ||||||
| Melbourne IT, Ltd. |
6 | 13 | ||||||
| Mesoblast, Ltd. (a) (c) |
131,360 | 141,208 | ||||||
| Metals X, Ltd. |
195,979 | 122,251 | ||||||
| Mincor Resources NL (a) |
9 | 2 | ||||||
| Monadelphous Group, Ltd. (c) |
74,895 | 922,632 | ||||||
| Mount Gibson Iron, Ltd. |
528,793 | 157,669 | ||||||
See accompanying notes to financial statements.
80
Table of Contents
SPDR S&P International Small Cap ETF
SCHEDULE OF INVESTMENTS (continued)
September 30, 2017
| Security Description |
Shares |
Value |
||||||
| Myer Holdings, Ltd. (c) |
450,302 | $ | 273,830 | |||||
| MYOB Group, Ltd. (c) |
116,391 | 314,162 | ||||||
| Nanosonics, Ltd. (a) |
156,391 | 320,279 | ||||||
| Navitas, Ltd. (c) |
145,753 | 518,074 | ||||||
| New South Resources, Ltd. (a) (c) |
254,925 | 299,040 | ||||||
| NEXTDC, Ltd. (a) |
190,466 | 651,598 | ||||||
| Nick Scali, Ltd. |
41,952 | 212,977 | ||||||
| Nine Entertainment Co. Holdings, Ltd. |
239,747 | 259,602 | ||||||
| NRW Holdings, Ltd. (a) |
6 | 6 | ||||||
| Nufarm, Ltd. |
123,808 | 805,340 | ||||||
| OceanaGold Corp. |
332,500 | 1,002,299 | ||||||
| oOh!media, Ltd. |
91,053 | 314,357 | ||||||
| Orocobre, Ltd. (a) (c) |
92,674 | 325,043 | ||||||
| OZ Minerals, Ltd. |
157,840 | 918,960 | ||||||
| OzForex Group, Ltd. (c) |
127,420 | 173,965 | ||||||
| Pact Group Holdings, Ltd. |
66,416 | 273,074 | ||||||
| Paladin Energy, Ltd. (a) (c) |
772,885 | 28,503 | ||||||
| Perseus Mining, Ltd. (a) (c) |
312,648 | 82,182 | ||||||
| Pilbara Minerals, Ltd. (a) (c) |
506,545 | 252,387 | ||||||
| Premier Investments, Ltd. |
45,012 | 459,496 | ||||||
| Primary Health Care, Ltd. |
176,234 | 425,908 | ||||||
| Programmed Maintenance Services, Ltd. |
274,854 | 649,149 | ||||||
| Propertylink Group REIT |
370,079 | 270,056 | ||||||
| Quintis, Ltd. (c) |
148,677 | 34,415 | ||||||
| RCG Corp., Ltd. (c) |
267,769 | 160,730 | ||||||
| RCR Tomlinson, Ltd. |
50,447 | 170,208 | ||||||
| Regis Healthcare, Ltd. (c) |
101,173 | 276,261 | ||||||
| Regis Resources, Ltd. |
211,110 | 596,331 | ||||||
| Reject Shop, Ltd. (c) |
31,067 | 99,213 | ||||||
| Reliance Worldwide Corp., Ltd. (c) |
278,368 | 860,580 | ||||||
| Resapp Health, Ltd. (a) (c) |
376,776 | 19,808 | ||||||
| Resolute Mining, Ltd. |
364,626 | 294,687 | ||||||
| Retail Food Group, Ltd. (c) |
78,929 | 265,067 | ||||||
| Rural Funds Group REIT |
160,395 | 271,844 | ||||||
| Sandfire Resources NL |
57,212 | 258,574 | ||||||
| Saracen Mineral Holdings, Ltd. (a) (c) |
273,475 | 282,176 | ||||||
| Select Harvests, Ltd. (c) |
53,042 | 160,651 | ||||||
| Senex Energy, Ltd. (a) (c) |
603,735 | 156,328 | ||||||
| Service Stream, Ltd. |
222,889 | 255,339 | ||||||
| Seven West Media, Ltd. |
481,688 | 251,341 | ||||||
| SG Fleet Group, Ltd. |
74,523 | 230,974 | ||||||
| Shopping Centres Australasia Property Group |
311,310 | 559,377 | ||||||
| Sigma Healthcare, Ltd. |
1,026,856 | 664,721 | ||||||
| Silver Chef, Ltd. (c) |
10,535 | 59,517 | ||||||
| Silver Lake Resources, Ltd. (a) |
288,212 | 91,589 | ||||||
| Sirtex Medical, Ltd. |
33,537 | 351,566 | ||||||
| Slater & Gordon, Ltd. (a) (c) |
157,806 | 9,039 | ||||||
| SmartGroup Corp., Ltd. |
46,529 | 336,613 | ||||||
| Southern Cross Media Group, Ltd. |
502,189 | 464,970 | ||||||
| SpeedCast International, Ltd. (c) |
125,969 | 393,389 | ||||||
| St. Barbara, Ltd. |
282,812 | 583,619 | ||||||
| Steadfast Group, Ltd. |
384,728 | 842,236 | ||||||
| Strandline Resources, Ltd. (a) |
645 | 2 | ||||||
| Super Retail Group, Ltd. (c) |
58,126 | 368,061 | ||||||
| Superloop, Ltd. |
105,086 | 195,420 | ||||||
| Syrah Resources, Ltd. (a) (c) |
113,816 | 307,212 | ||||||
| Tap Oil, Ltd. (a) |
9 | — | ||||||
| Tassal Group, Ltd. |
45,048 | 136,086 | ||||||
| Technology One, Ltd. |
129,938 | 511,818 | ||||||
| Ten Network Holdings, Ltd. (a) (c) |
59,551 | 7,476 | ||||||
| Tiger Resources, Ltd. (a) |
2,464 | 95 | ||||||
| Tox Free Solutions, Ltd. |
77,489 | 152,004 | ||||||
| Village Roadshow, Ltd. |
23,395 | 68,838 | ||||||
| Virtus Health, Ltd. (c) |
17,006 | 74,458 | ||||||
| Vita Group, Ltd. (c) |
76,849 | 102,208 | ||||||
| Viva Energy REIT |
164,335 | 272,075 | ||||||
| Vocus Group, Ltd. |
332,862 | 624,220 | ||||||
| Webjet, Ltd. |
73,829 | 624,484 | ||||||
| Western Areas, Ltd. (c) |
116,476 | 237,621 | ||||||
| Westgold Resources, Ltd. (a) (c) |
96,688 | 148,698 | ||||||
| WiseTech Global, Ltd. |
55,107 | 376,185 | ||||||
| WPP AUNZ, Ltd. |
617,328 | 532,825 | ||||||
|
|
|
|||||||
| 57,336,880 | ||||||||
|
|
|
|||||||
| AUSTRIA — 0.4% |
| |||||||
| DO & Co. AG |
3,869 | 188,222 | ||||||
| Palfinger AG |
5,387 | 244,805 | ||||||
| POLYTEC Holding AG |
4,355 | 103,330 | ||||||
| Porr AG (c) |
8,038 | 253,955 | ||||||
| RHI AG |
13,221 | 552,516 | ||||||
| S IMMO AG |
31,022 | 549,196 | ||||||
| S&T AG |
21,306 | 468,999 | ||||||
| Schoeller-Bleckmann Oilfield Equipment AG (a) |
4,969 | 397,752 | ||||||
| Semperit AG Holding |
5,305 | 163,061 | ||||||
| Zumtobel Group AG |
23,289 | 404,724 | ||||||
|
|
|
|||||||
| 3,326,560 | ||||||||
|
|
|
|||||||
| BELGIUM — 1.3% |
| |||||||
| Ablynx NV (a) |
33,258 | 484,393 | ||||||
| Aedifica SA |
7,693 | 725,936 | ||||||
| AGFA-Gevaert NV (a) |
182,314 | 869,885 | ||||||
| Barco NV |
18,046 | 1,947,578 | ||||||
| Befimmo SA |
7,264 | 458,315 | ||||||
| Celyad SA (a) |
4,443 | 251,490 | ||||||
| Econocom Group SA |
49,955 | 381,448 | ||||||
| Euronav NV (c) |
63,172 | 519,413 | ||||||
| EVS Broadcast Equipment SA |
15,983 | 604,549 | ||||||
| Fagron (a) |
15,720 | 228,957 | ||||||
| Greenyard NV |
11,146 | 254,839 | ||||||
| Ion Beam Applications (c) |
11,591 | 393,821 | ||||||
| Kinepolis Group NV |
3,491 | 231,899 | ||||||
| MDxHealth (a) (c) |
52,365 | 292,815 | ||||||
| Nyrstar NV (a) (c) |
56,191 | 447,067 | ||||||
| Orange Belgium SA |
22,441 | 518,922 | ||||||
| Recticel SA |
30,351 | 272,336 | ||||||
| Retail Estates NV REIT |
4,493 | 390,988 | ||||||
| Rezidor Hotel Group AB |
69,593 | 278,803 | ||||||
| Tessenderlo Group SA (a) |
39,333 | 1,913,917 | ||||||
| X-Fab Silicon Foundries SE (a) (c) (d) |
45,558 | 398,015 | ||||||
|
|
|
|||||||
| 11,865,386 | ||||||||
|
|
|
|||||||
| CANADA — 9.0% |
| |||||||
| Advantage Oil & Gas, Ltd. (a) |
137,266 | 858,290 | ||||||
| Aecon Group, Inc. |
29,178 | 409,913 | ||||||
| AG Growth International, Inc. |
6,553 | 279,013 | ||||||
| AGF Management, Ltd. Class B |
11,754 | 76,032 | ||||||
See accompanying notes to financial statements.
81
Table of Contents
SPDR S&P International Small Cap ETF
SCHEDULE OF INVESTMENTS (continued)
September 30, 2017
| Security Description |
Shares |
Value |
||||||
| AGT Food & Ingredients, Inc. (c) |
11,130 | $ | 217,501 | |||||
| Aimia, Inc. |
62,081 | 122,608 | ||||||
| Alaris Royalty Corp. (c) |
16,137 | 265,412 | ||||||
| Alio Gold, Inc. (a) |
4,899 | 21,544 | ||||||
| Altius Minerals Corp. |
10,884 | 103,649 | ||||||
| Altus Group, Ltd. |
19,641 | 498,936 | ||||||
| Aphria, Inc. (a) |
72,500 | 412,745 | ||||||
| Arbutus Biopharma Corp. (a) (e) (f) |
11,276 | 69,911 | ||||||
| Arbutus Biopharma Corp. (a) (f) |
1,595 | 9,889 | ||||||
| Aritzia, Inc. (a) |
32,900 | 390,649 | ||||||
| Arizona Mining, Inc. (a) |
101,600 | 246,150 | ||||||
| Artis Real Estate Investment Trust |
17,534 | 185,343 | ||||||
| Asanko Gold, Inc. (a) (c) |
87,825 | 82,864 | ||||||
| Athabasca Oil Corp. (a) |
160,675 | 143,890 | ||||||
| Atrium Mortgage Investment Corp. (c) |
35,888 | 345,494 | ||||||
| ATS Automation Tooling Systems, Inc. (a) |
34,578 | 366,613 | ||||||
| Aurinia Pharmaceuticals, Inc. (a) |
49,000 | 306,385 | ||||||
| Aurora Cannabis, Inc. (a) (c) |
205,800 | 457,461 | ||||||
| AutoCanada, Inc. |
9,256 | 176,217 | ||||||
| Avigilon Corp. (a) (c) |
15,820 | 226,172 | ||||||
| Badger Daylighting, Ltd. (c) |
15,575 | 330,890 | ||||||
| Ballard Power Systems, Inc. (a) |
73,527 | 343,928 | ||||||
| Baytex Energy Corp. (a) (c) |
96,705 | 290,737 | ||||||
| Bellatrix Exploration, Ltd. (a) (c) |
19,791 | 56,335 | ||||||
| Birchcliff Energy, Ltd. |
103,064 | 498,570 | ||||||
| Bird Construction, Inc. (c) |
19,816 | 157,653 | ||||||
| Black Diamond Group, Ltd. |
12,586 | 23,347 | ||||||
| Boardwalk Real Estate Investment Trust |
12,833 | 390,023 | ||||||
| Bonavista Energy Corp. (c) |
96,478 | 229,884 | ||||||
| Bonterra Energy Corp. |
10,082 | 133,013 | ||||||
| Boralex, Inc. Class A |
25,700 | 441,605 | ||||||
| Boyd Group Income Fund |
5,181 | 379,798 | ||||||
| Calfrac Well Services, Ltd. (a) (c) |
42,399 | 171,881 | ||||||
| Callidus Capital Corp. (c) |
13,800 | 113,653 | ||||||
| Canaccord Genuity Group, Inc. |
49,603 | 170,149 | ||||||
| Canacol Energy, Ltd. (a) (c) |
52,674 | 174,787 | ||||||
| Canadian Solar, Inc. (a) (c) |
18,821 | 316,946 | ||||||
| Canadian Western Bank (c) |
45,289 | 1,220,719 | ||||||
| Canopy Growth Corp. (a) (c) |
93,800 | 804,011 | ||||||
| Capstone Mining Corp. (a) |
213,794 | 232,487 | ||||||
| Cara Operations, Ltd. |
9,312 | 181,601 | ||||||
| Cardinal Energy, Ltd. (c) |
46,932 | 177,123 | ||||||
| Cargojet, Inc. |
7,600 | 306,759 | ||||||
| Cascades, Inc. |
26,232 | 313,781 | ||||||
| Celestica, Inc. (a) |
112,730 | 1,391,717 | ||||||
| Centerra Gold, Inc. |
113,813 | 799,917 | ||||||
| CES Energy Solutions Corp. |
149,418 | 753,870 | ||||||
| Chemtrade Logistics Income Fund |
22,900 | 362,731 | ||||||
| Chorus Aviation, Inc. |
37,400 | 250,001 | ||||||
| Cineplex, Inc. (c) |
35,100 | 1,095,673 | ||||||
| Cogeco, Inc. |
4,500 | 294,615 | ||||||
| Colliers International Group, Inc. |
30,968 | 1,532,738 | ||||||
| Colossus Minerals, Inc. (a) (b) |
390 | — | ||||||
| Computer Modelling Group, Ltd. |
42,663 | 312,472 | ||||||
| Continental Gold, Inc. (a) (c) |
58,747 | 141,859 | ||||||
| Crew Energy, Inc. (a) |
71,282 | 253,062 | ||||||
| Crombie Real Estate Investment Trust |
19,200 | 209,248 | ||||||
| Dalradian Resources, Inc. (a) (c) |
112,804 | 120,863 | ||||||
| Delphi Energy Corp. (a) |
68,552 | 67,968 | ||||||
| Denison Mines Corp. (a) (c) |
285,953 | 132,613 | ||||||
| DIRTT Environmental Solutions (a) |
31,331 | 137,284 | ||||||
| Dominion Diamond Corp. |
47,304 | 669,098 | ||||||
| Dorel Industries, Inc. Class B |
15,238 | 363,816 | ||||||
| Dream Global Real Estate Investment Trust |
31,200 | 274,667 | ||||||
| Dream Office Real Estate Investment Trust |
16,600 | 279,133 | ||||||
| DREAM Unlimited Corp. Class A (a) |
85,049 | 490,988 | ||||||
| Dundee Precious Metals, Inc. (a) |
60,396 | 130,388 | ||||||
| ECN Capital Corp. |
227,700 | 720,979 | ||||||
| Eldorado Gold Corp. |
433,400 | 949,519 | ||||||
| Endeavour Mining Corp. (a) (c) |
36,762 | 733,682 | ||||||
| Endeavour Silver Corp. (a) (c) |
63,307 | 150,339 | ||||||
| EnerCare, Inc. |
49,454 | 808,647 | ||||||
| Enerflex, Ltd. |
42,866 | 630,660 | ||||||
| Enghouse Systems, Ltd. |
11,835 | 489,336 | ||||||
| Ensign Energy Services, Inc. |
57,612 | 324,763 | ||||||
| Entertainment One, Ltd. |
147,638 | 511,042 | ||||||
| Equitable Group, Inc. (c) |
6,694 | 299,735 | ||||||
| Exchange Income Corp. (c) |
13,133 | 366,798 | ||||||
| Extendicare, Inc. (c) |
47,112 | 351,461 | ||||||
| Fiera Capital Corp. |
31,500 | 363,699 | ||||||
| Firm Capital Mortgage Investment Corp. (c) |
31,958 | 315,581 | ||||||
| First Majestic Silver Corp. (a) |
97,100 | 661,490 | ||||||
| First Mining Finance Corp. (a) |
373,500 | 201,585 | ||||||
| Fortuna Silver Mines, Inc. (a) |
78,783 | 343,945 | ||||||
| Freehold Royalties, Ltd. (c) |
54,119 | 637,840 | ||||||
| GASFRAC Energy Services, Inc. (a) (b) |
21,904 | — | ||||||
| Gibson Energy, Inc. |
64,664 | 916,200 | ||||||
| Gluskin Sheff + Associates, Inc. |
13,196 | 198,365 | ||||||
| Gran Tierra Energy, Inc. (a) |
164,554 | 372,357 | ||||||
| Granite Oil Corp. (c) |
23,156 | 64,803 | ||||||
| Granite Real Estate Investment Trust |
25,396 | 1,016,733 | ||||||
| Great Canadian Gaming Corp. (a) |
29,961 | 768,999 | ||||||
| Guardian Capital Group, Ltd. Class A |
86,300 | 1,687,151 | ||||||
| Guyana Goldfields, Inc. (a) |
81,399 | 272,057 | ||||||
| High Liner Foods, Inc. |
5,790 | 64,861 | ||||||
| Home Capital Group, Inc. (c) |
25,833 | 286,907 | ||||||
| Horizon North Logistics, Inc. (c) |
76,561 | 85,092 | ||||||
| Hudson’s Bay Co. (c) |
63,400 | 644,316 | ||||||
| Innergex Renewable Energy, Inc. |
59,265 | 680,956 | ||||||
| Interfor Corp. (a) |
28,707 | 454,023 | ||||||
| InterRent Real Estate Investment Trust |
8,375 | 53,907 | ||||||
| Intertape Polymer Group, Inc. |
36,428 | 530,116 | ||||||
| Jamieson Wellness, Inc. |
16,900 | 268,908 | ||||||
| Just Energy Group, Inc. (c) |
81,738 | 472,527 | ||||||
| Kelt Exploration, Ltd. (a) |
60,810 | 346,680 | ||||||
| Killam Apartment Real Estate Investment Trust |
21,100 | 222,531 | ||||||
| Kinaxis, Inc. (a) |
12,279 | 723,594 | ||||||
| Kinder Morgan Canada, Ltd. (d) |
59,700 | 826,773 | ||||||
| Klondex Mines, Ltd. (a) |
66,711 | 242,702 | ||||||
| Knight Therapeutics, Inc. (a) |
32,256 | 223,096 | ||||||
| Labrador Iron Ore Royalty Corp. (c) |
26,224 | 415,172 | ||||||
See accompanying notes to financial statements.
82
Table of Contents
SPDR S&P International Small Cap ETF
SCHEDULE OF INVESTMENTS (continued)
September 30, 2017
| Security Description |
Shares |
Value |
||||||
| Laurentian Bank of Canada |
18,826 | $ | 907,845 | |||||
| Lightstream Resources, Ltd. (a) (b) |
64,736 | — | ||||||
| Liquor Stores N.A., Ltd. |
16,730 | 131,764 | ||||||
| Lithium Americas Corp. (a) |
151,700 | 201,353 | ||||||
| Lucara Diamond Corp. |
116,581 | 225,583 | ||||||
| MacDonald Dettwiler & Associates, Ltd. |
19,000 | 1,078,335 | ||||||
| MAG Silver Corp. (a) |
53,749 | 600,387 | ||||||
| Major Drilling Group International, Inc. (a) (c) |
103,329 | 578,342 | ||||||
| Martinrea International, Inc. |
70,073 | 635,372 | ||||||
| Medical Facilities Corp. |
16,906 | 210,742 | ||||||
| MEG Energy Corp. (a) (c) |
90,219 | 396,036 | ||||||
| Morneau Shepell, Inc. |
35,165 | 584,841 | ||||||
| Mountain Province Diamonds, Inc. (a) (c) |
43,693 | 141,841 | ||||||
| MTY Food Group, Inc. |
9,987 | 390,329 | ||||||
| Mullen Group, Ltd. (c) |
64,819 | 883,672 | ||||||
| Nemaska Lithium, Inc. (a) |
219,000 | 246,904 | ||||||
| Nevsun Resources, Ltd. (c) |
112,000 | 241,794 | ||||||
| NexGen Energy, Ltd. (a) (c) |
154,325 | 341,806 | ||||||
| North American Palladium, Ltd. (a) |
3 | 15 | ||||||
| North West Co., Inc. (c) |
29,657 | 709,264 | ||||||
| Northern Dynasty Minerals, Ltd. (a) (c) |
172,200 | 308,422 | ||||||
| Northview Apartment Real Estate Investment Trust |
15,600 | 279,906 | ||||||
| NorthWest Healthcare Properties Real Estate Investment Trust |
22,000 | 199,304 | ||||||
| Novagold Resources, Inc. (a) (c) |
119,966 | 489,207 | ||||||
| NuVista Energy, Ltd. (a) |
105,812 | 638,772 | ||||||
| Obsidian Energy, Ltd. (a) (c) |
194,960 | 205,771 | ||||||
| OneREIT |
9,495 | 32,494 | ||||||
| Osisko Mining, Inc. (a) |
91,400 | 320,830 | ||||||
| Painted Pony Energy, Ltd. (a) (c) |
50,326 | 134,401 | ||||||
| Paramount Resources, Ltd. Class A (a) |
43,229 | 853,761 | ||||||
| Parex Resources, Inc. (a) |
93,659 | 1,127,068 | ||||||
| Pason Systems, Inc. |
40,231 | 604,116 | ||||||
| Pengrowth Energy Corp. (a) (c) |
241,639 | 245,378 | ||||||
| Pizza Pizza Royalty Corp. |
23,038 | 305,049 | ||||||
| Poseidon Concepts Corp. (a) (b) |
43,064 | — | ||||||
| Precision Drilling Corp. (a) |
145,373 | 451,003 | ||||||
| Premier Gold Mines, Ltd. (a) |
98,874 | 282,237 | ||||||
| Pretium Resources, Inc. (a) |
63,066 | 582,427 | ||||||
| Primero Mining Corp. (a) (c) |
57,668 | 4,150 | ||||||
| ProMetic Life Sciences, Inc. (a) (c) (f) |
274,482 | 351,154 | ||||||
| ProMetic Life Sciences, Inc. (a) (f) |
3,753 | 4,774 | ||||||
| Pure Industrial Real Estate Trust |
60,100 | 305,630 | ||||||
| Quarterhill, Inc. |
1,107 | 1,452 | ||||||
| Raging River Exploration, Inc. (a) |
134,780 | 848,134 | ||||||
| Redknee Solutions, Inc. (a) |
810 | 505 | ||||||
| Richmont Mines, Inc. (a) |
27,584 | 256,508 | ||||||
| Rogers Sugar, Inc. (c) |
64,288 | 324,871 | ||||||
| Rubicon Minerals Corp. (a) |
15 | 19 | ||||||
| Russel Metals, Inc. |
33,840 | 746,258 | ||||||
| Sabina Gold & Silver Corp. (a) |
116,600 | 206,042 | ||||||
| Sandstorm Gold, Ltd. (a) (c) |
108,389 | 488,797 | ||||||
| Savaria Corp. |
23,900 | 266,012 | ||||||
| Seabridge Gold, Inc. (a) (c) |
24,518 | 298,964 | ||||||
| Secure Energy Services, Inc. (c) |
109,494 | 758,180 | ||||||
| SEMAFO, Inc. (a) |
143,391 | 378,355 | ||||||
| ShawCor, Ltd. |
33,292 | 734,971 | ||||||
| Sherritt International Corp. (a) (c) |
164,688 | 140,900 | ||||||
| Sienna Senior Living, Inc. (c) |
38,495 | 556,194 | ||||||
| Sierra Wireless, Inc. (a) |
17,431 | 373,108 | ||||||
| Silvercorp Metals, Inc. |
107,026 | 289,248 | ||||||
| SilverCrest Metals, Inc. (a) |
54 | 63 | ||||||
| Slate Office REIT |
36,600 | 235,289 | ||||||
| Sleep Country Canada Holdings, Inc. (d) |
17,075 | 492,597 | ||||||
| Southern Pacific Resource Corp. (a) (b) |
281,142 | — | ||||||
| Spartan Energy Corp. (a) |
522 | 2,851 | ||||||
| Sprott, Inc. (c) |
130,100 | 219,495 | ||||||
| SSR Mining, Inc. (a) |
67,897 | 717,705 | ||||||
| Stornoway Diamond Corp. (a) |
155,285 | 93,123 | ||||||
| Stuart Olson, Inc. |
69 | 286 | ||||||
| Student Transportation, Inc. (c) |
38,600 | 229,936 | ||||||
| Summit Industrial Income REIT |
40,300 | 239,741 | ||||||
| SunOpta, Inc. (a) |
34,410 | 299,367 | ||||||
| Sunshine Oilsands, Ltd. (a) |
1,799,500 | 64,509 | ||||||
| Superior Plus Corp. (c) |
61,518 | 621,747 | ||||||
| Surge Energy, Inc. (c) |
115,167 | 208,114 | ||||||
| Tamarack Valley Energy, Ltd. (a) |
171,700 | 388,527 | ||||||
| Teranga Gold Corp. (a) |
33,426 | 74,835 | ||||||
| Theratechnologies, Inc. (a) |
54,700 | 328,467 | ||||||
| Timbercreek Financial Corp. |
26,000 | 194,379 | ||||||
| TORC Oil & Gas, Ltd. (c) |
53,978 | 265,434 | ||||||
| Torex Gold Resources, Inc. (a) |
39,688 | 620,398 | ||||||
| Total Energy Services, Inc. |
41,911 | 475,526 | ||||||
| TransAlta Corp. |
145,707 | 850,487 | ||||||
| Transcontinental, Inc. Class A |
41,914 | 864,320 | ||||||
| Trevali Mining Corp. (a) |
372,479 | 419,938 | ||||||
| Trican Well Service, Ltd. (a) |
206,562 | 753,147 | ||||||
| Tricon Capital Group, Inc. |
67,311 | 545,205 | ||||||
| Trinidad Drilling, Ltd. (a) |
101,664 | 153,636 | ||||||
| Twin Butte Energy, Ltd. (a) (b) |
83,708 | — | ||||||
| Uni-Select, Inc. |
62,248 | 1,341,867 | ||||||
| Valener, Inc. (c) |
10,700 | 188,735 | ||||||
| Wajax Corp. |
5,684 | 92,624 | ||||||
| Western Forest Products, Inc. |
192,662 | 411,312 | ||||||
| Westshore Terminals Investment Corp. (c) |
29,550 | 566,829 | ||||||
| Yellow Pages, Ltd. (a) (c) |
12,355 | 85,255 | ||||||
| ZCL Composites, Inc. |
23,200 | 236,146 | ||||||
|
|
|
|||||||
| 79,679,496 | ||||||||
|
|
|
|||||||
| CHINA — 0.2% |
| |||||||
| APT Satellite Holdings, Ltd. (c) |
143,500 | 67,059 | ||||||
| Beijing Tong Ren Tang Chinese Medicine Co., Ltd. |
87,000 | 112,722 | ||||||
| Bloomage BioTechnology Corp., Ltd. (c) |
92,500 | 184,747 | ||||||
| BOE Varitronix, Ltd. |
106,000 | 54,963 | ||||||
| China Everbright Water, Ltd. (c) |
167,493 | 52,421 | ||||||
| China Gold International Resources Corp., Ltd. (a) |
129,009 | 202,181 | ||||||
| China Merchants Land, Ltd. |
212,000 | 42,342 | ||||||
| Chong Hing Bank, Ltd. |
57,000 | 116,325 | ||||||
See accompanying notes to financial statements.
83
Table of Contents
SPDR S&P International Small Cap ETF
SCHEDULE OF INVESTMENTS (continued)
September 30, 2017
| Security Description |
Shares |
Value |
||||||
| Gemdale Properties & Investment Corp., Ltd. |
2,752,000 | $ | 310,057 | |||||
| Greenland Hong Kong Holdings, Ltd. |
202,000 | 76,551 | ||||||
| HC International, Inc. (c) |
178,000 | 143,572 | ||||||
| HengTen Networks Group, Ltd. (a) (c) |
10,988,000 | 407,968 | ||||||
| Huarong International Financial Holdings, Ltd. (a) (c) |
363,000 | 134,312 | ||||||
| Nam Tai Property, Inc. |
13,814 | 149,882 | ||||||
| Sino Grandness Food Industry Group, Ltd. (a) (c) |
266,772 | 43,219 | ||||||
|
|
|
|||||||
| 2,098,321 | ||||||||
|
|
|
|||||||
| DENMARK — 0.6% |
| |||||||
| ALK-Abello A/S |
2,387 | 375,599 | ||||||
| Alm Brand A/S |
20,523 | 202,139 | ||||||
| Amagerbanken A/S (a) (b) |
308,573 | — | ||||||
| Ascendis Pharma A/S ADR (a) (c) |
12,700 | 460,375 | ||||||
| Bang & Olufsen A/S (a) |
35,061 | 757,498 | ||||||
| D/S Norden A/S (a) |
15,645 | 334,284 | ||||||
| Forward Pharma A/S ADR (a) |
6,240 | 36,754 | ||||||
| H+H International A/S Class B (a) |
31,327 | 567,338 | ||||||
| Matas A/S |
14,336 | 209,524 | ||||||
| NNIT A/S (d) |
7,972 | 240,624 | ||||||
| OW Bunker A/S (a) (b) |
9,828 | — | ||||||
| Per Aarsleff Holding A/S Class B |
11,889 | 349,410 | ||||||
| Ringkjoebing Landbobank A/S |
10,744 | 554,712 | ||||||
| Scandinavian Tobacco Group A/S Class A (d) |
30,619 | 543,328 | ||||||
| Solar A/S Class B |
1,509 | 91,933 | ||||||
| Spar Nord Bank A/S |
35,712 | 444,783 | ||||||
| Zealand Pharma A/S (a) |
22,768 | 439,460 | ||||||
|
|
|
|||||||
| 5,607,761 | ||||||||
|
|
|
|||||||
| FINLAND — 0.7% |
| |||||||
| Caverion Corp. (a) |
33,580 | 308,456 | ||||||
| Cramo Oyj |
16,154 | 424,150 | ||||||
| F-Secure Oyj |
65,461 | 330,447 | ||||||
| Ferratum Oyj |
7,361 | 232,783 | ||||||
| Finnair Oyj |
28,987 | 384,149 | ||||||
| Kemira Oyj |
48,671 | 639,832 | ||||||
| Lehto Group Oyj |
16,785 | 252,604 | ||||||
| Oriola-KD Oyj Class B |
35,960 | 144,540 | ||||||
| Outotec Oyj (a) (c) |
59,658 | 472,183 | ||||||
| Pihlajalinna Oyj |
11,718 | 221,371 | ||||||
| PKC Group Oyj (a) (e) |
177 | 4,928 | ||||||
| Raisio Oyj Class V |
46,615 | 202,247 | ||||||
| Ramirent Oyj |
35,051 | 362,162 | ||||||
| Revenio Group Oyj |
5,187 | 216,646 | ||||||
| Sanoma Oyj |
35,285 | 385,019 | ||||||
| Stockmann Oyj Abp Class B (a) |
19,389 | 137,530 | ||||||
| Talvivaara Mining Co. PLC (a) (b) |
572,382 | — | ||||||
| Technopolis Oyj |
52,066 | 241,901 | ||||||
| Tikkurila Oyj |
20,884 | 380,458 | ||||||
| Tokmanni Group Corp. |
22,499 | 190,178 | ||||||
| Uponor Oyj |
26,212 | 454,281 | ||||||
| YIT Oyj |
73,240 | 599,163 | ||||||
|
|
|
|||||||
| 6,585,028 | ||||||||
|
|
|
|||||||
| FRANCE — 2.2% |
| |||||||
| AB Science SA (a) (c) |
14,123 | 140,916 | ||||||
| Akka Technologies |
7,315 | 426,768 | ||||||
| Albioma SA |
12,026 | 271,263 | ||||||
| Assystem |
2,375 | 92,655 | ||||||
| Beneteau SA |
13,301 | 231,149 | ||||||
| Boiron SA |
3,361 | 299,990 | ||||||
| Bonduelle SCA |
5,033 | 226,695 | ||||||
| Bourbon Corp. (c) |
9,085 | 82,163 | ||||||
| Cellectis SA (a) (c) |
14,975 | 420,457 | ||||||
| CGG SA (a) (c) |
11,269 | 62,614 | ||||||
| Chargeurs SA |
8,711 | 264,662 | ||||||
| Cie des Alpes |
5,848 | 186,319 | ||||||
| Coface SA (a) |
43,308 | 465,396 | ||||||
| Derichebourg SA |
33,419 | 350,435 | ||||||
| Devoteam SA |
3,006 | 279,498 | ||||||
| Eramet (a) |
4,274 | 290,430 | ||||||
| Esker SA |
9,542 | 548,799 | ||||||
| Etablissements Maurel et Prom (a) |
2,040 | 9,068 | ||||||
| Gaztransport Et Technigaz SA (c) |
12,206 | 663,777 | ||||||
| Genfit (a) |
11,321 | 328,971 | ||||||
| GL Events |
30,493 | 1,011,169 | ||||||
| Guerbet |
3,079 | 286,831 | ||||||
| Haulotte Group SA |
3,302 | 62,458 | ||||||
| ID Logistics Group (a) |
1,276 | 227,782 | ||||||
| Innate Pharma SA (a) (c) |
27,000 | 328,131 | ||||||
| Interparfums SA |
2,288 | 91,344 | ||||||
| IPSOS |
15,170 | 525,196 | ||||||
| Jacquet Metal Service |
31,026 | 1,030,678 | ||||||
| Kaufman & Broad SA |
8,310 | 400,822 | ||||||
| Le Noble Age |
7,561 | 504,227 | ||||||
| Lectra |
15,216 | 477,771 | ||||||
| Maisons du Monde SA (d) |
20,032 | 880,845 | ||||||
| Manitou BF SA |
6,179 | 231,928 | ||||||
| Marie Brizard Wine & Spirits SA (a) |
14,617 | 245,033 | ||||||
| Mercialys SA |
19,592 | 391,432 | ||||||
| Mersen SA |
32,790 | 1,180,761 | ||||||
| Nanobiotix (a) |
13,923 | 280,474 | ||||||
| Naturex (a) |
3,597 | 407,377 | ||||||
| Neopost SA |
18,864 | 733,257 | ||||||
| Nicox (a) (c) |
18,098 | 204,861 | ||||||
| Parrot SA (a) (c) |
9,842 | 118,214 | ||||||
| Pierre & Vacances SA (a) |
1,082 | 58,201 | ||||||
| Rallye SA |
11,137 | 206,445 | ||||||
| SOITEC (a) |
10,611 | 696,084 | ||||||
| Solocal Group (a) |
257,833 | 309,687 | ||||||
| Solutions 30 SE (a) |
21,631 | 730,085 | ||||||
| SRP Groupe SA (a) (d) |
12,868 | 263,177 | ||||||
| Ste Industrielle d’Aviation Latecoere SA (a) |
55,164 | 380,203 | ||||||
| Talend SA ADR (a) |
9,400 | 384,836 | ||||||
| Technicolor SA |
223,181 | 770,426 | ||||||
| Valneva SE (a) (c) |
55,575 | 192,503 | ||||||
| Virbac SA (a) (c) |
1,926 | 283,362 | ||||||
|
|
|
|||||||
| 19,537,625 | ||||||||
|
|
|
|||||||
| GERMANY — 3.4% |
| |||||||
| ADVA Optical Networking SE (a) (c) |
12,499 | 84,476 | ||||||
| AIXTRON SE (a) (c) |
63,296 | 852,297 | ||||||
| Amadeus Fire AG |
3,255 | 302,919 | ||||||
| Aumann AG (a) (d) |
3,468 | 350,129 | ||||||
See accompanying notes to financial statements.
84
Table of Contents
SPDR S&P International Small Cap ETF
SCHEDULE OF INVESTMENTS (continued)
September 30, 2017
| Security Description |
Shares |
Value |
||||||
| AURELIUS SE & Co. KGaA (c) |
15,910 | $ | 1,046,521 | |||||
| Bauer AG |
5,619 | 181,979 | ||||||
| BayWa AG |
2,377 | 94,672 | ||||||
| Bertrandt AG (c) |
2,918 | 293,842 | ||||||
| bet-at-home.com AG |
1,830 | 256,474 | ||||||
| Bilfinger SE |
17,479 | 732,114 | ||||||
| Biotest AG Preference Shares |
11,881 | 318,908 | ||||||
| Borussia Dortmund GmbH & Co. KGaA |
40,908 | 396,564 | ||||||
| CANCOM SE (c) |
9,096 | 682,834 | ||||||
| Capital Stage AG (c) |
66,297 | 494,789 | ||||||
| Cewe Stiftung & Co. KGaA |
3,286 | 312,369 | ||||||
| Deutsche Beteiligungs AG |
6,525 | 351,057 | ||||||
| Deutsche Pfandbriefbank AG (d) |
37,324 | 558,615 | ||||||
| Deutz AG |
63,353 | 511,913 | ||||||
| DIC Asset AG |
83,840 | 926,632 | ||||||
| Draegerwerk AG & Co. KGaA |
2,348 | 197,637 | ||||||
| Draegerwerk AG & Co. KGaA Preference Shares |
1,544 | 171,196 | ||||||
| Elmos Semiconductor AG |
10,452 | 270,728 | ||||||
| ElringKlinger AG (c) |
8,643 | 161,134 | ||||||
| GFT Technologies SE |
12,231 | 229,472 | ||||||
| Grammer AG |
7,716 | 503,252 | ||||||
| Hamborner REIT AG |
46,814 | 506,393 | ||||||
| Heidelberger Druckmaschinen AG (a) (c) |
119,358 | 486,812 | ||||||
| HELMA Eigenheimbau AG |
2,642 | 149,812 | ||||||
| Hornbach Holding AG & Co. KGaA |
2,628 | 242,332 | ||||||
| Hypoport AG (a) |
2,003 | 352,469 | ||||||
| Indus Holding AG |
28,839 | 2,133,227 | ||||||
| Isra Vision AG |
826 | 155,995 | ||||||
| Jenoptik AG |
87,745 | 2,908,129 | ||||||
| Kloeckner & Co. SE |
57,570 | 738,442 | ||||||
| Koenig & Bauer AG |
8,964 | 738,945 | ||||||
| KSB AG Preference Shares |
265 | 144,408 | ||||||
| LPKF Laser & Electronics AG (a) |
13,451 | 121,283 | ||||||
| Medigene AG (a) (c) |
15,158 | 233,226 | ||||||
| MLP SE |
67,897 | 468,202 | ||||||
| Nordex SE (a) (c) |
40,225 | 459,276 | ||||||
| Norma Group SE |
16,113 | 1,059,874 | ||||||
| PATRIZIA Immobilien AG (a) (c) |
61,462 | 1,281,002 | ||||||
| Pfeiffer Vacuum Technology AG |
2,230 | 351,683 | ||||||
| QSC AG |
20,906 | 45,846 | ||||||
| RIB Software SE (c) |
17,188 | 364,738 | ||||||
| SAF-Holland SA |
16,376 | 332,987 | ||||||
| SGL Carbon SE (a) (c) |
24,251 | 410,117 | ||||||
| SHS ST Deutschland Holding (e) (f) |
17,810 | 395,202 | ||||||
| SHS ST Deutschland Holding (e) (f) |
12 | 44 | ||||||
| SLM Solutions Group AG (a) (c) |
5,956 | 250,666 | ||||||
| SMA Solar Technology AG (c) |
3,691 | 144,715 | ||||||
| STRATEC Biomedical AG (c) |
3,081 | 184,376 | ||||||
| SUESS MicroTec SE (a) (c) |
10,895 | 215,870 | ||||||
| Surteco SE |
8,585 | 262,356 | ||||||
| Takkt AG |
16,943 | 388,582 | ||||||
| Technotrans AG |
4,117 | 242,382 | ||||||
| Tele Columbus AG (a) (d) |
29,200 | 308,956 | ||||||
| TLG Immobilien AG |
22,607 | 521,424 | ||||||
| Trivago NV ADR (a) (c) |
20,500 | 222,425 | ||||||
| Vossloh AG (a) |
4,284 | 289,287 | ||||||
| VTG AG |
4,391 | 243,979 | ||||||
| Wacker Neuson SE |
10,031 | 332,872 | ||||||
| Washtec AG |
6,262 | 550,038 | ||||||
| XING SE |
1,724 | 540,100 | ||||||
| Zeal Network SE |
5,511 | 169,067 | ||||||
| zooplus AG (a) (c) |
2,744 | 462,264 | ||||||
|
|
|
|||||||
| 29,692,326 | ||||||||
|
|
|
|||||||
| GREECE — 0.0% (g) |
| |||||||
| TT Hellenic Postbank SA (a) (b) |
129,076 | — | ||||||
|
|
|
|||||||
| HONG KONG — 2.9% |
| |||||||
| Beijing Gas Blue Sky Holdings, Ltd. (a) |
3,704,000 | 246,595 | ||||||
| Cafe de Coral Holdings, Ltd. |
177,191 | 551,262 | ||||||
| Century Sunshine Group Holdings, Ltd. (a) |
882,698 | 27,688 | ||||||
| China Baoli Technologies Holdings, Ltd. (a) |
9,925,000 | 199,499 | ||||||
| China Cord Blood Corp. (a) (c) |
47,582 | 529,112 | ||||||
| China Goldjoy Group, Ltd. (c) |
4,240,000 | 314,850 | ||||||
| China Household Holdings, Ltd. (a) |
780,000 | 50,930 | ||||||
| China Innovationpay Group, Ltd. (a) (c) |
2,460,000 | 154,327 | ||||||
| China LNG Group, Ltd. (a) (c) |
846,999 | 130,129 | ||||||
| China LotSynergy Holdings, Ltd. (a) |
4,860,000 | 118,222 | ||||||
| China Ocean Resources Co., Ltd. (a) (c) |
26,593 | 1,463 | ||||||
| China Regenerative Medicine International, Ltd. (a) (c) |
6,208,056 | 160,552 | ||||||
| China Ruifeng Renewable Energy Holdings, Ltd. (a) |
427,200 | 38,286 | ||||||
| China Smarter Energy Group Holdings, Ltd. (a) (c) |
2,062,000 | 158,398 | ||||||
| China Strategic Holdings, Ltd. (a) |
9,306,667 | 132,260 | ||||||
| China Water Industry Group, Ltd. (a) (c) |
440,000 | 91,823 | ||||||
| Chow Sang Sang Holdings International, Ltd. |
260,939 | 598,001 | ||||||
| CK Life Sciences Int’l Holdings, Inc. |
2,764,000 | 215,863 | ||||||
| Common Splendor International Health Industry Group, Ltd. (a) |
2,360,000 | 217,548 | ||||||
| Digital Domain Holdings, Ltd. (a) (c) |
4,879,996 | 144,950 | ||||||
| Emperor Entertainment Hotel, Ltd. |
100,000 | 24,454 | ||||||
| Enerchina Holdings, Ltd. (c) |
3,496,500 | 79,235 | ||||||
| Esprit Holdings, Ltd. (a) (c) |
979,435 | 546,729 | ||||||
| Evergrande Health Industry Group, Ltd. (a) (c) |
1,290,000 | 566,492 | ||||||
| Fairwood Holdings, Ltd. (c) |
158,000 | 633,157 | ||||||
| FDG Electric Vehicles, Ltd. (a) (c) |
7,657,493 | 382,350 | ||||||
| Freeman FinTech Corp., Ltd. (a) |
5,000,000 | 294,468 | ||||||
| Future World Financial Holdings, Ltd. (a) |
34,303 | 830 | ||||||
| G-Resources Group, Ltd. (a) |
14,290,790 | 188,453 | ||||||
| GCL New Energy Holdings, Ltd. (a) (c) |
3,806,000 | 253,386 | ||||||
| Giordano International, Ltd. |
1,430,000 | 858,655 | ||||||
| Global Brands Group Holding, Ltd. (a) |
2,818,000 | 270,590 | ||||||
| HKBN, Ltd. |
554,413 | 579,207 | ||||||
| HKR International, Ltd. (c) |
2,777,259 | 1,767,188 | ||||||
See accompanying notes to financial statements.
85
Table of Contents
SPDR S&P International Small Cap ETF
SCHEDULE OF INVESTMENTS (continued)
September 30, 2017
| Security Description |
Shares |
Value |
||||||
| HMV Digital China Group, Ltd. (a) |
7,820,000 | $ | 250,298 | |||||
| Honbridge Holdings, Ltd. (a) (c) |
1,418,000 | 185,177 | ||||||
| Hopewell Highway Infrastructure, Ltd. |
603,500 | 373,194 | ||||||
| Hutchison Telecommunications Hong Kong Holdings, Ltd. |
800,000 | 291,907 | ||||||
| Hybrid Kinetic Group, Ltd. (a) (c) |
8,619,000 | 215,180 | ||||||
| K Wah International Holdings, Ltd. |
1,686,670 | 1,014,934 | ||||||
| Kong Sun Holdings, Ltd. (a) |
75,000 | 3,601 | ||||||
| L&A International Holdings, Ltd. (a) |
1,901,584 | 2,435 | ||||||
| Lai Sun Development Co., Ltd. |
142,800 | 257,054 | ||||||
| Landing International Development, Ltd. (a) |
33,126,000 | 665,854 | ||||||
| Lee’s Pharmaceutical Holdings, Ltd. |
227,000 | 179,607 | ||||||
| Noble Group, Ltd. (a) (c) |
442,919 | 128,836 | ||||||
| O Luxe Holdings, Ltd. (a) (c) |
900,000 | 192,428 | ||||||
| Pacific Basin Shipping, Ltd. (a) (c) |
3,264,000 | 735,483 | ||||||
| Pacific Textiles Holdings, Ltd. |
492,000 | 505,184 | ||||||
| Panda Green Energy Group, Ltd. (a) (c) |
2,260,000 | 298,027 | ||||||
| PAX Global Technology, Ltd. (c) |
403,000 | 214,639 | ||||||
| Peace Mark Holdings, Ltd. (a) (b) |
504,228 | — | ||||||
| Pico Far East Holdings, Ltd. (c) |
202,000 | 84,569 | ||||||
| Playmates Toys, Ltd. |
380,000 | 62,760 | ||||||
| Prosperity REIT |
602,000 | 254,343 | ||||||
| Road King Infrastructure, Ltd. |
1,238,482 | 1,994,713 | ||||||
| Sa Sa International Holdings, Ltd. (c) |
730,000 | 285,058 | ||||||
| Shun Tak Holdings, Ltd. |
1,342,749 | 598,252 | ||||||
| Singamas Container Holdings, Ltd. (a) |
924,000 | 204,658 | ||||||
| SmarTone Telecommunications Holdings, Ltd. (c) |
243,630 | 292,267 | ||||||
| SMI Holdings Group, Ltd. (c) |
628,081 | 330,497 | ||||||
| Spring Real Estate Investment Trust |
264,000 | 117,623 | ||||||
| Stella International Holdings, Ltd. |
214,500 | 375,135 | ||||||
| Summit Ascent Holdings, Ltd. (a) (c) |
586,000 | 81,778 | ||||||
| Sun Hung Kai & Co., Ltd. |
348,000 | 223,662 | ||||||
| SUNeVision Holdings, Ltd. |
292,000 | 197,391 | ||||||
| Sunlight Real Estate Investment Trust |
173,000 | 112,074 | ||||||
| Superb Summit International Group, Ltd. (a) (b) (c) |
1,685,500 | — | ||||||
| Television Broadcasts, Ltd. (c) |
173,816 | 577,480 | ||||||
| Texhong Textile Group, Ltd. (c) |
231,500 | 314,764 | ||||||
| Texwinca Holdings, Ltd. |
802,850 | 482,078 | ||||||
| Tongda Group Holdings, Ltd. (c) |
2,230,000 | 596,707 | ||||||
| Tou Rong Chang Fu Group, Ltd. (a) |
2,420,000 | 41,517 | ||||||
| Town Health International Medical Group, Ltd. (c) |
1,968,000 | 176,373 | ||||||
| Towngas China Co., Ltd. (a) |
473,000 | 331,858 | ||||||
| Truly International Holdings, Ltd. (c) |
802,000 | 269,021 | ||||||
| Value Partners Group, Ltd. (c) |
438,000 | 395,342 | ||||||
| Viva China Holdings, Ltd. (a) |
1,896,000 | 179,631 | ||||||
| Yuexiu Real Estate Investment Trust |
1,153,000 | 726,281 | ||||||
|
|
|
|||||||
| 25,346,622 | ||||||||
|
|
|
|||||||
| IRELAND — 0.8% |
| |||||||
| Amarin Corp. PLC ADR (a) (c) |
152,246 | 532,861 | ||||||
| C&C Group PLC |
163,123 | 588,174 | ||||||
| Cairn Homes PLC (a) |
387,906 | 787,615 | ||||||
| Dalata Hotel Group PLC (a) |
82,882 | 541,846 | ||||||
| Fly Leasing, Ltd. ADR (a) (c) |
24,854 | 348,453 | ||||||
| Green REIT PLC |
326,478 | 581,645 | ||||||
| Greencore Group PLC |
382,234 | 1,006,161 | ||||||
| Hibernia REIT PLC |
388,727 | 700,818 | ||||||
| Hostelworld Group PLC (d) |
53,534 | 258,027 | ||||||
| Irish Continental Group PLC |
79,015 | 528,242 | ||||||
| Irish Residential Properties REIT PLC |
364,454 | 635,515 | ||||||
| Origin Enterprises PLC |
61,357 | 483,091 | ||||||
| Trinity Biotech PLC ADR (a) |
32,259 | 180,973 | ||||||
|
|
|
|||||||
| 7,173,421 | ||||||||
|
|
|
|||||||
| ISRAEL — 1.8% |
| |||||||
| Africa Israel Properties, Ltd. (a) |
2,642 | 58,358 | ||||||
| Airport City, Ltd. (a) |
39,532 | 510,626 | ||||||
| Alony Hetz Properties & Investments, Ltd. |
34,571 | 366,985 | ||||||
| Amot Investments, Ltd. |
53,897 | 299,648 | ||||||
| Bayside Land Corp. |
710 | 326,400 | ||||||
| Caesarstone, Ltd. (a) |
12,601 | 375,510 | ||||||
| Cellcom Israel, Ltd. (a) |
34,100 | 317,486 | ||||||
| Ceragon Networks, Ltd. (a) (c) |
49,801 | 103,586 | ||||||
| Clal Insurance Enterprises Holdings, Ltd. (a) |
17,971 | 303,298 | ||||||
| CyberArk Software, Ltd. (a) |
14,934 | 612,294 | ||||||
| Delek Automotive Systems, Ltd. |
21,228 | 158,642 | ||||||
| Delta-Galil Industries, Ltd. |
5,761 | 181,835 | ||||||
| Electra, Ltd. |
2,242 | 501,318 | ||||||
| First International Bank Of Israel, Ltd. |
27,173 | 507,600 | ||||||
| Gazit-Globe, Ltd. |
50,540 | 486,572 | ||||||
| Harel Insurance Investments & Financial Services, Ltd. |
44,989 | 281,452 | ||||||
| IDI Insurance Co., Ltd. |
7,117 | 452,896 | ||||||
| Inrom Construction Industries, Ltd. |
75,968 | 329,454 | ||||||
| Israel Corp., Ltd. (a) |
1,591 | 317,290 | ||||||
| Israel Discount Bank, Ltd. Class A (a) |
1 | 2 | ||||||
| Ituran Location and Control, Ltd. |
14,120 | 509,026 | ||||||
| Jerusalem Economy, Ltd. (a) |
135,326 | 334,580 | ||||||
| Jerusalem Oil Exploration (a) |
5,727 | 306,404 | ||||||
| Kornit Digital, Ltd. (a) |
18,900 | 289,170 | ||||||
| Matrix IT, Ltd. |
15,717 | 165,330 | ||||||
| Mazor Robotics, Ltd. (a) |
18,014 | 429,876 | ||||||
| Migdal Insurance & Financial Holding, Ltd. |
259,432 | 270,551 | ||||||
| Neuroderm, Ltd. (a) |
11,800 | 459,020 | ||||||
| Norstar Holdings, Inc. |
7,117 | 129,140 | ||||||
| Nova Measuring Instruments, Ltd. (a) |
27,319 | 730,342 | ||||||
| Oil Refineries, Ltd. |
1,043,263 | 522,429 | ||||||
| Orbotech, Ltd. (a) |
26,057 | 1,099,866 | ||||||
| Partner Communications Co., Ltd. (a) |
57,480 | 308,992 | ||||||
| Paz Oil Co., Ltd. |
5,972 | 984,063 | ||||||
| Radware, Ltd. (a) |
27,804 | 468,776 | ||||||
| Rami Levy Chain Stores Hashikma Marketing 2006, Ltd. |
4,791 | 244,799 | ||||||
| Reit 1, Ltd. |
122,400 | 475,727 | ||||||
| Sapiens International Corp. NV (a) |
26,792 | 349,177 | ||||||
| Shikun & Binui, Ltd. |
84,325 | 206,480 | ||||||
| Shufersal, Ltd. |
61,199 | 359,648 | ||||||
| SodaStream International, Ltd. (a) |
11,694 | 777,066 | ||||||
|
|
|
|||||||
| 15,911,714 | ||||||||
|
|
|
|||||||
See accompanying notes to financial statements.
86
Table of Contents
SPDR S&P International Small Cap ETF
SCHEDULE OF INVESTMENTS (continued)
September 30, 2017
| Security Description |
Shares |
Value |
||||||
| ITALY — 1.3% |
| |||||||
| Ascopiave SpA |
39,302 | $ | 162,899 | |||||
| Astaldi SpA |
98,699 | 676,172 | ||||||
| Banca Carige SpA (a) (c) |
284,423 | 77,336 | ||||||
| Banca Farmafactoring SpA (a) (d) |
47,794 | 324,887 | ||||||
| Banca Monte dei Paschi di Siena SpA (a) (b) |
10,689 | 95,279 | ||||||
| Banca Popolare di Sondrio SCPA |
202,549 | 871,610 | ||||||
| BasicNet SpA (c) |
27,444 | 124,586 | ||||||
| Beni Stabili SpA SIIQ |
391,421 | 339,649 | ||||||
| Brunello Cucinelli SpA |
12,947 | 401,628 | ||||||
| Cairo Communication SpA |
36,970 | 187,061 | ||||||
| Cementir Holding SpA |
35,223 | 296,898 | ||||||
| CIR-Compagnie Industriali Riunite SpA |
90,049 | 139,244 | ||||||
| Credito Valtellinese SpA (a) (c) |
47,418 | 227,818 | ||||||
| Danieli & C Officine Meccaniche SpA |
18,031 | 333,386 | ||||||
| Datalogic SpA |
8,177 | 287,782 | ||||||
| doBank SpA (a) (d) |
22,647 | 293,971 | ||||||
| Ei Towers SpA |
18,361 | 1,086,403 | ||||||
| Esprinet SpA |
45,798 | 269,954 | ||||||
| Fila SpA |
11,160 | 248,826 | ||||||
| Fincantieri SpA (a) |
256,027 | 308,123 | ||||||
| GEDI Gruppo Editoriale SpA (a) |
28,066 | 24,885 | ||||||
| Immobiliare Grande Distribuzione SIIQ SpA |
162,518 | 169,554 | ||||||
| Italmobiliare SpA |
2,337 | 63,075 | ||||||
| Juventus Football Club SpA (a) |
206,045 | 192,677 | ||||||
| Maire Tecnimont SpA |
66,457 | 367,843 | ||||||
| MARR SpA (c) |
13,018 | 343,194 | ||||||
| Massimo Zanetti Beverage Group SpA (d) |
11,513 | 118,413 | ||||||
| OVS SpA (d) |
75,691 | 578,053 | ||||||
| Piaggio & C SpA |
88,642 | 277,700 | ||||||
| RAI Way SpA (d) |
50,908 | 275,038 | ||||||
| Safilo Group SpA (a) |
6,960 | 46,530 | ||||||
| Salini Impregilo SpA (c) |
93,705 | 369,555 | ||||||
| Societa Cattolica di Assicurazioni S.c.r.l |
77,614 | 674,401 | ||||||
| Sogefi SpA (a) |
36,118 | 219,685 | ||||||
| Tamburi Investment Partners SpA |
70,211 | 490,965 | ||||||
| Technogym SpA (d) |
38,580 | 341,841 | ||||||
| Vittoria Assicurazioni SpA |
7,988 | 108,599 | ||||||
|
|
|
|||||||
| 11,415,520 | ||||||||
|
|
|
|||||||
| JAPAN — 36.4% |
| |||||||
| 3-D Matrix, Ltd. (a) (c) |
12,200 | 73,916 | ||||||
| 77 Bank, Ltd. |
38,000 | 938,818 | ||||||
| A/S One Corp. |
3,800 | 202,212 | ||||||
| Access Co., Ltd. (a) (c) |
14,600 | 119,327 | ||||||
| Achilles Corp. |
3,100 | 62,212 | ||||||
| Adastria Co., Ltd. |
23,700 | 534,784 | ||||||
| ADEKA Corp. |
44,000 | 802,097 | ||||||
| Advanced Media, Inc. (a) |
15,700 | 117,856 | ||||||
| Adways, Inc. |
19,200 | 84,431 | ||||||
| Aeon Delight Co., Ltd. |
12,300 | 461,667 | ||||||
| AEON REIT Investment Corp. |
586 | 592,950 | ||||||
| Ahresty Corp. |
8,100 | 67,785 | ||||||
| Ai Holdings Corp. |
21,700 | 541,705 | ||||||
| Aichi Steel Corp. |
3,200 | 125,652 | ||||||
| Aida Engineering, Ltd. |
31,700 | 373,985 | ||||||
| Aiful Corp. (a) (c) |
127,876 | 426,007 | ||||||
| Akatsuki, Inc. (a) (c) |
2,300 | 179,807 | ||||||
| Akebono Brake Industry Co., Ltd. (a) |
74,600 | 255,150 | ||||||
| Alconix Corp. |
14,500 | 260,592 | ||||||
| Alpine Electronics, Inc. |
22,800 | 414,619 | ||||||
| Altech Corp. |
6,900 | 227,109 | ||||||
| Amano Corp. |
31,700 | 749,941 | ||||||
| Amiyaki Tei Co., Ltd. |
1,700 | 71,585 | ||||||
| AnGes, Inc. (a) (c) |
50,600 | 297,131 | ||||||
| Anicom Holdings, Inc. |
10,800 | 277,760 | ||||||
| Anritsu Corp. |
67,600 | 560,306 | ||||||
| AOKI Holdings, Inc. |
9,800 | 128,502 | ||||||
| Aomori Bank, Ltd. |
7,600 | 265,340 | ||||||
| Aoyama Trading Co., Ltd. |
22,500 | 804,535 | ||||||
| Arakawa Chemical Industries, Ltd. |
11,100 | 260,034 | ||||||
| Arata Corp. |
7,300 | 311,287 | ||||||
| Arcland Sakamoto Co., Ltd. |
13,900 | 209,306 | ||||||
| Arcs Co., Ltd. |
26,300 | 592,985 | ||||||
| Argo Graphics, Inc. |
8,200 | 256,421 | ||||||
| Arisawa Manufacturing Co., Ltd. |
14,200 | 126,780 | ||||||
| Artnature, Inc. |
16,200 | 101,893 | ||||||
| Asahi Diamond Industrial Co., Ltd. |
30,500 | 293,173 | ||||||
| Asahi Holdings, Inc. |
51,773 | 1,064,758 | ||||||
| Asatsu-DK, Inc. |
12,700 | 358,779 | ||||||
| Asia Pile Holdings Corp. |
6,600 | 36,352 | ||||||
| ASKA Pharmaceutical Co., Ltd. |
11,000 | 181,175 | ||||||
| ASKUL Corp. |
11,800 | 332,306 | ||||||
| Asukanet Co., Ltd. (c) |
5,200 | 87,864 | ||||||
| Ateam, Inc. |
6,400 | 167,896 | ||||||
| Atom Corp. (c) |
15,500 | 115,529 | ||||||
| Aucnet, Inc. |
20,900 | 264,766 | ||||||
| Autobacs Seven Co., Ltd. |
45,100 | 730,799 | ||||||
| Avex Group Holdings, Inc. |
20,800 | 282,162 | ||||||
| Awa Bank, Ltd. |
245,000 | 1,614,978 | ||||||
| Axial Retailing, Inc. |
6,900 | 265,113 | ||||||
| Bando Chemical Industries, Ltd. |
32,700 | 347,146 | ||||||
| Bank of Iwate, Ltd. |
1,800 | 72,678 | ||||||
| Bank of Nagoya, Ltd. (c) |
20,560 | 807,313 | ||||||
| Bank of Okinawa, Ltd. |
29,900 | 1,201,950 | ||||||
| Bank of the Ryukyus, Ltd. |
87,820 | 1,357,498 | ||||||
| Belc Co., Ltd. |
6,300 | 315,658 | ||||||
| Belluna Co., Ltd. |
26,400 | 278,154 | ||||||
| Benefit One, Inc. |
16,000 | 315,125 | ||||||
| BML, Inc. |
15,800 | 337,855 | ||||||
| Broadleaf Co., Ltd. |
29,100 | 249,986 | ||||||
| Broccoli Co., Ltd. (c) |
18,000 | 100,262 | ||||||
| Bunka Shutter Co., Ltd. |
43,200 | 323,141 | ||||||
| Can Do Co., Ltd. |
24,100 | 386,020 | ||||||
| Capcom Co., Ltd. |
25,500 | 626,598 | ||||||
| Central Glass Co., Ltd. |
59,269 | 1,291,055 | ||||||
| Chiome Bioscience, Inc. (a) (c) |
29,400 | 99,511 | ||||||
| Chiyoda Co., Ltd. |
20,400 | 510,521 | ||||||
| Chiyoda Corp. (c) |
107,500 | 628,392 | ||||||
| Chiyoda Integre Co., Ltd. |
5,600 | 131,238 | ||||||
| Chofu Seisakusho Co., Ltd. |
12,600 | 296,069 | ||||||
| Chubu Shiryo Co., Ltd. |
14,400 | 255,085 | ||||||
| Chudenko Corp. |
4,600 | 133,629 | ||||||
See accompanying notes to financial statements.
87
Table of Contents
SPDR S&P International Small Cap ETF
SCHEDULE OF INVESTMENTS (continued)
September 30, 2017
| Security Description |
Shares |
Value |
||||||
| Chugoku Marine Paints, Ltd. |
35,500 | $ | 296,766 | |||||
| Ci:z Holdings Co., Ltd. |
31,200 | 1,098,992 | ||||||
| CKD Corp. |
25,600 | 502,607 | ||||||
| Clarion Co., Ltd. |
59,000 | 232,719 | ||||||
| CMK Corp. |
36,000 | 362,031 | ||||||
| Cocokara fine, Inc. |
15,200 | 866,912 | ||||||
| COLOPL, Inc. |
42,100 | 485,460 | ||||||
| Colowide Co., Ltd. (c) |
30,100 | 554,055 | ||||||
| Comforia Residential REIT, Inc. (c) |
299 | 631,920 | ||||||
| COOKPAD, Inc. (c) |
22,066 | 152,707 | ||||||
| Cosmo Energy Holdings Co., Ltd. |
35,400 | 809,799 | ||||||
| Create Restaurants Holdings, Inc. |
16,100 | 166,914 | ||||||
| Create SD Holdings Co., Ltd. |
12,300 | 325,297 | ||||||
| CROOZ, Inc. (c) |
2,300 | 48,221 | ||||||
| CYBERDYNE, Inc. (a) (c) |
37,300 | 496,715 | ||||||
| D.A. Consortium Holdings, Inc. |
14,600 | 246,954 | ||||||
| D.Western Therapeutics Institute, Inc. (a) |
9,300 | 40,318 | ||||||
| Dai Nippon Toryo Co., Ltd. |
15,600 | 240,171 | ||||||
| Dai-Dan Co., Ltd. |
14,500 | 357,203 | ||||||
| Daibiru Corp. |
24,900 | 274,958 | ||||||
| Daido Metal Co., Ltd. |
28,400 | 253,308 | ||||||
| Daihen Corp. |
48,000 | 425,567 | ||||||
| Daiho Corp. |
82,000 | 387,545 | ||||||
| Daiken Corp. |
9,900 | 249,600 | ||||||
| Daikyo, Inc. |
10,700 | 210,074 | ||||||
| Daikyonishikawa Corp. |
19,700 | 317,118 | ||||||
| Dainichiseika Color & Chemicals Manufacturing Co., Ltd. |
8,800 | 401,048 | ||||||
| Daio Paper Corp. (c) |
50,600 | 596,960 | ||||||
| Daiseki Co., Ltd. |
14,300 | 360,025 | ||||||
| Daishi Bank, Ltd. |
19,200 | 904,011 | ||||||
| Daishinku Corp. |
1,800 | 30,191 | ||||||
| Daito Bank, Ltd. |
4,100 | 62,976 | ||||||
| Daito Pharmaceutical Co., Ltd. |
8,600 | 222,248 | ||||||
| Daiwabo Holdings Co., Ltd. |
10,600 | 446,826 | ||||||
| DCM Holdings Co., Ltd. |
78,793 | 711,177 | ||||||
| Denyo Co., Ltd. |
3,800 | 67,280 | ||||||
| Descente, Ltd. |
14,600 | 199,094 | ||||||
| Dexerials Corp. |
33,200 | 405,838 | ||||||
| Digital Arts, Inc. (c) |
8,300 | 357,616 | ||||||
| Digital Garage, Inc. |
18,400 | 390,836 | ||||||
| Dip Corp. |
16,700 | 381,430 | ||||||
| Doshisha Co., Ltd. |
12,900 | 289,252 | ||||||
| Doutor Nichires Holdings Co., Ltd. |
74,472 | 1,597,742 | ||||||
| DTS Corp. |
55,862 | 1,530,976 | ||||||
| Duskin Co., Ltd. |
23,200 | 653,347 | ||||||
| DyDo Group Holdings, Inc. |
4,100 | 195,229 | ||||||
| Dynam Japan Holdings Co., Ltd. |
110,400 | 168,200 | ||||||
| Eagle Industry Co., Ltd. |
14,800 | 271,505 | ||||||
| Earth Chemical Co., Ltd. |
10,600 | 478,372 | ||||||
| EDION Corp. (c) |
109,900 | 1,030,023 | ||||||
| Ehime Bank, Ltd. (c) |
97,540 | 1,252,124 | ||||||
| Eighteenth Bank, Ltd. |
314,730 | 768,896 | ||||||
| Eiken Chemical Co., Ltd. |
10,300 | 400,782 | ||||||
| Eizo Corp. |
11,500 | 454,626 | ||||||
| Elecom Co., Ltd. |
8,600 | 172,970 | ||||||
| en-japan, Inc. |
14,500 | 531,360 | ||||||
| Enplas Corp. |
5,300 | 245,307 | ||||||
| EPS Holdings, Inc. |
20,400 | 391,454 | ||||||
| eRex Co., Ltd. |
27,000 | 251,135 | ||||||
| ESPEC Corp. |
16,800 | 343,567 | ||||||
| euglena Co., Ltd. (a) (c) |
34,600 | 363,935 | ||||||
| Exedy Corp. |
18,000 | 547,684 | ||||||
| F@N Communications, Inc. |
15,600 | 174,619 | ||||||
| Fancl Corp. |
54,300 | 1,172,203 | ||||||
| FCC Co., Ltd. |
47,328 | 1,053,649 | ||||||
| Feed One Co., Ltd. |
51,600 | 120,560 | ||||||
| Ferrotec Holdings Corp. |
10,400 | 175,266 | ||||||
| Fields Corp. (c) |
3,500 | 34,824 | ||||||
| Financial Products Group Co., Ltd. (c) |
28,500 | 316,231 | ||||||
| Foster Electric Co., Ltd. |
15,300 | 308,678 | ||||||
| Fudo Tetra Corp. |
90,200 | 149,846 | ||||||
| Fuji Co., Ltd. |
11,900 | 306,156 | ||||||
| Fuji Kyuko Co., Ltd. (c) |
13,500 | 300,666 | ||||||
| Fuji Machine Manufacturing Co., Ltd. |
43,000 | 800,675 | ||||||
| Fuji Pharma Co., Ltd. |
3,500 | 119,398 | ||||||
| Fuji Seal International, Inc. |
19,700 | 595,034 | ||||||
| Fuji Soft, Inc. |
18,800 | 548,643 | ||||||
| Fujibo Holdings, Inc. |
7,200 | 248,177 | ||||||
| Fujicco Co., Ltd. |
10,000 | 236,397 | ||||||
| Fujimi, Inc. |
11,200 | 260,784 | ||||||
| Fujimori Kogyo Co., Ltd. |
7,500 | 253,187 | ||||||
| Fujita Kanko, Inc. (c) |
4,399 | 139,710 | ||||||
| Fujitec Co., Ltd. |
40,000 | 559,677 | ||||||
| Fujiya Co., Ltd. |
6,800 | 151,749 | ||||||
| Fukuda Corp. |
4,000 | 226,713 | ||||||
| Fukui Bank, Ltd. |
12,900 | 341,968 | ||||||
| Fukuoka Corp. REIT |
1,061 | 1,509,992 | ||||||
| Fukushima Industries Corp. |
8,400 | 310,061 | ||||||
| Fukuyama Transporting Co., Ltd. |
19,400 | 614,409 | ||||||
| FULLCAST Holdings Co., Ltd. |
14,100 | 256,159 | ||||||
| Funai Soken Holdings, Inc. |
14,800 | 455,577 | ||||||
| Furukawa Co., Ltd. |
17,839 | 303,637 | ||||||
| Fuso Chemical Co., Ltd. |
13,300 | 424,763 | ||||||
| Futaba Corp. |
14,000 | 264,167 | ||||||
| Futaba Industrial Co., Ltd. |
31,500 | 354,275 | ||||||
| Fuyo General Lease Co., Ltd. |
9,600 | 625,985 | ||||||
| G-Tekt Corp. |
16,000 | 330,334 | ||||||
| Genky Stores, Inc. (c) |
5,100 | 198,672 | ||||||
| Geo Holdings Corp. |
20,800 | 300,271 | ||||||
| Giken, Ltd. |
8,900 | 243,917 | ||||||
| Global One Real Estate Investment Corp. |
87 | 283,263 | ||||||
| GLOBERIDE, Inc. |
6,800 | 117,557 | ||||||
| GMO internet, Inc. (c) |
32,100 | 390,966 | ||||||
| GNI Group, Ltd. (a) (c) |
51,000 | 210,678 | ||||||
| Goldwin, Inc. |
4,000 | 285,346 | ||||||
| Gree, Inc. |
50,200 | 342,947 | ||||||
| GS Yuasa Corp. (c) |
224,000 | 1,176,067 | ||||||
| Gulliver International Co., Ltd. (c) |
33,500 | 206,836 | ||||||
| Gumi, Inc. (a) |
23,000 | 228,437 | ||||||
| Gunosy, Inc. (a) |
8,653 | 245,988 | ||||||
| Gunze, Ltd. |
9,200 | 420,095 | ||||||
| Gurunavi, Inc. |
14,100 | 204,175 | ||||||
| Hankyu REIT, Inc. |
225 | 267,645 | ||||||
| Hanwa Co., Ltd. |
17,600 | 630,889 | ||||||
| Happinet Corp. |
3,700 | 60,283 | ||||||
See accompanying notes to financial statements.
88
Table of Contents
SPDR S&P International Small Cap ETF
SCHEDULE OF INVESTMENTS (continued)
September 30, 2017
| Security Description |
Shares |
Value |
||||||
| Hazama Ando Corp. |
99,600 | $ | 696,355 | |||||
| Hearts United Group Co., Ltd. (c) |
6,200 | 84,877 | ||||||
| Heiwa Real Estate Co., Ltd. |
16,700 | 284,404 | ||||||
| Heiwa Real Estate REIT, Inc. |
408 | 329,836 | ||||||
| Heiwado Co., Ltd. |
20,400 | 446,366 | ||||||
| Hibiya Engineering, Ltd. |
7,500 | 155,577 | ||||||
| Hiday Hidaka Corp. |
9,700 | 269,720 | ||||||
| Hiramatsu, Inc. |
17,200 | 93,208 | ||||||
| Hirata Corp. (c) |
3,400 | 343,730 | ||||||
| Hitachi Maxell, Ltd. |
27,000 | 605,890 | ||||||
| Hitachi Zosen Corp. |
166,300 | 881,989 | ||||||
| Hito Communications, Inc. |
14,700 | 247,993 | ||||||
| Hodogaya Chemical Co., Ltd. (c) |
4,100 | 278,275 | ||||||
| Hogy Medical Co., Ltd. |
5,400 | 382,819 | ||||||
| Hokkaido Electric Power Co., Inc. (a) |
110,900 | 791,122 | ||||||
| Hokkaido Gas Co., Ltd. |
12,000 | 30,276 | ||||||
| Hokkoku Bank, Ltd. |
16,300 | 713,890 | ||||||
| Hokuetsu Bank, Ltd. |
39,500 | 897,273 | ||||||
| Hokuetsu Kishu Paper Co., Ltd. (c) |
51,700 | 322,881 | ||||||
| Hokuhoku Financial Group, Inc. |
47,000 | 755,741 | ||||||
| Hokuriku Electric Industry Co., Ltd. |
9,400 | 131,858 | ||||||
| Hokuto Corp. |
8,200 | 142,707 | ||||||
| Hoshino Resorts REIT, Inc. |
69 | 343,268 | ||||||
| Hosiden Corp. |
73,700 | 1,200,780 | ||||||
| Hosokawa Micron Corp. |
4,800 | 276,747 | ||||||
| Hulic Reit, Inc. REIT |
329 | 485,177 | ||||||
| Hyakugo Bank, Ltd. |
114,500 | 511,647 | ||||||
| Hyakujushi Bank, Ltd. |
169,000 | 585,528 | ||||||
| IBJ Leasing Co., Ltd. |
14,100 | 381,420 | ||||||
| Ichibanya Co., Ltd. |
5,700 | 236,983 | ||||||
| Ichigo Hotel Real Estate Investment Corp. |
241 | 231,441 | ||||||
| Ichigo Office REIT Investment |
578 | 390,246 | ||||||
| Ichigo, Inc. |
119,700 | 409,403 | ||||||
| Idec Corp. |
15,100 | 309,874 | ||||||
| Iino Kaiun Kaisha, Ltd. |
120,380 | 560,380 | ||||||
| Imasen Electric Industrial |
9,500 | 118,323 | ||||||
| Inaba Denki Sangyo Co., Ltd. |
3,000 | 124,461 | ||||||
| Inabata & Co., Ltd. |
3,400 | 45,307 | ||||||
| Industrial & Infrastructure Fund Investment Corp. REIT |
162 | 686,483 | ||||||
| Infomart Corp. |
46,800 | 335,934 | ||||||
| Intage Holdings, Inc. |
8,000 | 96,158 | ||||||
| Internet Initiative Japan, Inc. |
17,300 | 322,901 | ||||||
| Invesco Office J-REIT, Inc. |
308 | 293,320 | ||||||
| Invincible Investment Corp. REIT |
1,787 | 737,406 | ||||||
| Iriso Electronics Co., Ltd. |
10,300 | 538,951 | ||||||
| Iseki & Co., Ltd. |
5,600 | 125,069 | ||||||
| Ishihara Sangyo Kaisha, Ltd. (a) |
8,400 | 119,174 | ||||||
| Istyle, Inc. |
38,400 | 237,772 | ||||||
| Itfor, Inc. |
40,600 | 232,278 | ||||||
| Itochu Enex Co., Ltd. |
29,000 | 311,216 | ||||||
| Itoki Corp. |
29,700 | 249,600 | ||||||
| Iwasaki Electric Co., Ltd. |
2,700 | 46,221 | ||||||
| Iwatani Corp. |
53,000 | 1,612,624 | ||||||
| J Trust Co., Ltd. |
43,000 | 368,631 | ||||||
| Jaccs Co., Ltd. |
15,000 | 370,319 | ||||||
| Japan Asset Marketing Co., Ltd. (a) (c) |
57,900 | 63,782 | ||||||
| Japan Aviation Electronics Industry, Ltd. |
35,000 | 546,928 | ||||||
| Japan Cash Machine Co., Ltd. (c) |
3,200 | 32,152 | ||||||
| Japan Communications, Inc. (a) (c) |
61,200 | 76,116 | ||||||
| Japan Display, Inc. (a) (c) |
150,510 | 291,487 | ||||||
| Japan Excellent, Inc. |
726 | 862,312 | ||||||
| Japan Logistics Fund, Inc. |
940 | 1,749,478 | ||||||
| Japan Material Co., Ltd. |
15,400 | 405,778 | ||||||
| Japan Petroleum Exploration Co., Ltd. |
17,000 | 367,139 | ||||||
| Japan Pulp & Paper Co., Ltd. |
7,900 | 321,081 | ||||||
| Japan Rental Housing Investments, Inc. |
585 | 412,642 | ||||||
| Japan Securities Finance Co., Ltd. |
26,900 | 144,818 | ||||||
| Japan Steel Works, Ltd. |
31,500 | 724,781 | ||||||
| Japan Tissue Engineering Co., Ltd. (a) (c) |
7,600 | 81,087 | ||||||
| Japan Wool Textile Co., Ltd. |
23,000 | 207,596 | ||||||
| JCR Pharmaceuticals Co., Ltd. |
10,500 | 322,747 | ||||||
| JCU Corp. |
7,000 | 312,175 | ||||||
| Jeol, Ltd. |
41,000 | 208,342 | ||||||
| JIG-SAW, Inc. (a) (c) |
3,500 | 186,870 | ||||||
| JINS, Inc. |
6,600 | 412,189 | ||||||
| Joshin Denki Co., Ltd. |
13,500 | 458,135 | ||||||
| Joyful Honda Co., Ltd. |
23,500 | 623,173 | ||||||
| JSP Corp. |
8,100 | 248,257 | ||||||
| Juki Corp. |
34,000 | 485,693 | ||||||
| Juroku Bank, Ltd. |
19,400 | 637,676 | ||||||
| Justsystems Corp. |
16,900 | 357,172 | ||||||
| JVC Kenwood Corp. |
81,000 | 233,865 | ||||||
| Kadokawa Dwango (a) |
24,500 | 297,313 | ||||||
| Kaga Electronics Co., Ltd. |
6,400 | 189,331 | ||||||
| Kameda Seika Co., Ltd. |
8,400 | 370,879 | ||||||
| Kanamoto Co., Ltd. |
18,700 | 589,748 | ||||||
| Kanematsu Corp. |
118,300 | 1,508,106 | ||||||
| Kansai Super Market, Ltd. (c) |
14,600 | 183,140 | ||||||
| Kanto Denka Kogyo Co., Ltd. (c) |
24,000 | 255,852 | ||||||
| Kasai Kogyo Co., Ltd. |
8,000 | 121,246 | ||||||
| Katakura Industries Co., Ltd. |
80,374 | 968,215 | ||||||
| Kato Sangyo Co., Ltd. |
16,400 | 493,173 | ||||||
| KAWADA TECHNOLOGIES, Inc. (c) |
1,300 | 74,837 | ||||||
| Keihin Corp. |
14,600 | 249,808 | ||||||
| Keiyo Bank, Ltd. |
158,000 | 732,697 | ||||||
| Keiyo Co., Ltd. (c) |
32,400 | 221,056 | ||||||
| Kenedix Residential Investment Corp. |
131 | 336,679 | ||||||
| Kenedix Retail REIT Corp. |
261 | 542,103 | ||||||
| Kenedix, Inc. |
108,800 | 604,095 | ||||||
| Kenko Mayonnaise Co., Ltd. |
12,900 | 315,495 | ||||||
| Key Coffee, Inc. |
6,100 | 117,378 | ||||||
| KH Neochem Co., Ltd. |
17,800 | 436,283 | ||||||
| Kintetsu World Express, Inc. |
15,900 | 263,576 | ||||||
| Kisoji Co., Ltd. (c) |
10,300 | 251,083 | ||||||
| Kissei Pharmaceutical Co., Ltd. |
23,600 | 636,308 | ||||||
| Kito Corp. |
16,800 | 209,244 | ||||||
| Kitz Corp. |
191,900 | 1,563,295 | ||||||
| Kiyo Bank, Ltd. |
90,160 | 1,512,211 | ||||||
| KLab, Inc. (a) (c) |
17,300 | 248,669 | ||||||
| Koa Corp. |
19,300 | 358,001 | ||||||
| Kobe Bussan Co., Ltd. (c) |
5,700 | 255,719 | ||||||
| Kohnan Shoji Co., Ltd. |
14,900 | 279,694 | ||||||
See accompanying notes to financial statements.
89
Table of Contents
SPDR S&P International Small Cap ETF
SCHEDULE OF INVESTMENTS (continued)
September 30, 2017
| Security Description |
Shares |
Value |
||||||
| Kokuyo Co., Ltd. |
57,317 | $ | 970,007 | |||||
| KOMEDA Holdings Co., Ltd. |
22,400 | 373,516 | ||||||
| Komeri Co., Ltd. |
10,300 | 296,469 | ||||||
| Komori Corp. |
77,436 | 973,410 | ||||||
| Konishi Co., Ltd. |
15,200 | 268,851 | ||||||
| Konoike Transport Co., Ltd. |
14,700 | 223,833 | ||||||
| Kotobuki Spirits Co., Ltd. |
23,500 | 838,205 | ||||||
| Kourakuen Holdings Corp. |
8,000 | 121,885 | ||||||
| Kumagai Gumi Co., Ltd. |
18,200 | 548,918 | ||||||
| Kumiai Chemical Industry Co., Ltd. |
51,900 | 373,003 | ||||||
| Kura Corp. |
5,700 | 254,706 | ||||||
| Kurabo Industries, Ltd. |
544,600 | 1,494,971 | ||||||
| Kureha Corp. |
8,200 | 445,822 | ||||||
| Kuroda Electric Co., Ltd. |
6,500 | 113,295 | ||||||
| Kusuri no Aoki Holdings Co., Ltd. |
9,800 | 581,566 | ||||||
| KYB Corp. |
24,683 | 1,491,101 | ||||||
| Kyoei Steel, Ltd. |
4,000 | 62,328 | ||||||
| Kyokuto Kaihatsu Kogyo Co., Ltd. |
17,600 | 296,447 | ||||||
| Kyokuyo Co., Ltd. (c) |
2,200 | 65,278 | ||||||
| KYORIN Holdings, Inc. |
32,100 | 645,907 | ||||||
| Kyoritsu Maintenance Co., Ltd. (c) |
12,900 | 385,058 | ||||||
| Kyosan Electric Manufacturing Co., Ltd. |
12,000 | 62,790 | ||||||
| Kyoto Kimono Yuzen Co., Ltd. (c) |
19,800 | 160,771 | ||||||
| LAC Co., Ltd. |
6,900 | 85,082 | ||||||
| LaSalle Logiport REIT |
372 | 362,201 | ||||||
| Lasertec Corp. |
23,400 | 480,410 | ||||||
| LEC, Inc. |
8,200 | 213,077 | ||||||
| Leopalace21 Corp. |
135,300 | 942,346 | ||||||
| Life Corp. |
15,400 | 394,560 | ||||||
| LIFULL Co., Ltd. (c) |
32,700 | 284,108 | ||||||
| Lintec Corp. |
14,500 | 392,884 | ||||||
| LIXIL VIVA Corp. |
11,200 | 186,459 | ||||||
| M&A Capital Partners Co., Ltd. (a) (c) |
4,200 | 208,573 | ||||||
| Macnica Fuji Electronics Holdings, Inc. |
17,500 | 322,125 | ||||||
| Macromill, Inc. |
10,800 | 244,755 | ||||||
| Maeda Road Construction Co., Ltd. |
30,000 | 645,227 | ||||||
| Makino Milling Machine Co., Ltd. |
153,000 | 1,357,855 | ||||||
| Mandom Corp. |
17,600 | 483,916 | ||||||
| Mani, Inc. |
10,900 | 261,062 | ||||||
| Marudai Food Co., Ltd. |
374,656 | 1,774,012 | ||||||
| Maruha Nichiro Corp. |
36,320 | 1,067,998 | ||||||
| Marusan Securities Co., Ltd. (c) |
64,038 | 528,506 | ||||||
| Maruwa Co., Ltd. |
1,900 | 107,183 | ||||||
| Marvelous, Inc. (c) |
21,000 | 178,164 | ||||||
| Matsui Construction Co., Ltd. |
35,500 | 312,220 | ||||||
| Matsuya Co., Ltd. (c) |
29,700 | 263,848 | ||||||
| Max Co., Ltd. |
21,000 | 290,845 | ||||||
| MCJ Co., Ltd. |
20,900 | 226,147 | ||||||
| MCUBS MidCity Investment Corp. |
101 | 307,760 | ||||||
| Mebuki Financial Group, Inc. |
1,500 | 5,797 | ||||||
| Medinet Co., Ltd. (a) (c) |
99,400 | 113,030 | ||||||
| Megachips Corp. |
11,100 | 363,870 | ||||||
| Meidensha Corp. (c) |
144,000 | 550,082 | ||||||
| Meiko Electronics Co., Ltd. |
12,767 | 238,974 | ||||||
| Meitec Corp. |
14,300 | 716,493 | ||||||
| Melco Holdings, Inc. |
4,000 | 127,038 | ||||||
| Menicon Co., Ltd. |
8,800 | 347,888 | ||||||
| Michinoku Bank, Ltd. (c) |
53,920 | 927,846 | ||||||
| Micronics Japan Co., Ltd. (c) |
18,600 | 171,352 | ||||||
| Milbon Co., Ltd. |
7,300 | 442,935 | ||||||
| Mirai Corp. REIT |
153 | 236,911 | ||||||
| Mirait Holdings Corp. |
45,460 | 546,417 | ||||||
| Miroku Jyoho Service Co., Ltd. |
14,400 | 334,399 | ||||||
| Mitsuba Corp. |
19,900 | 308,493 | ||||||
| Mitsubishi Kakoki Kaisha, Ltd. |
1,600 | 36,303 | ||||||
| Mitsubishi Nichiyu Forklift Co., Ltd. (c) |
10,900 | 77,854 | ||||||
| Mitsubishi Pencil Co., Ltd. |
31,700 | 794,999 | ||||||
| Mitsubishi Shokuhin Co., Ltd. |
8,000 | 233,465 | ||||||
| Mitsuboshi Belting, Ltd. |
30,000 | 361,391 | ||||||
| Mitsui Engineering & Shipbuilding Co., Ltd. |
31,100 | 405,862 | ||||||
| Mitsui Fudosan Logistics Park, Inc. REIT |
65 | 189,113 | ||||||
| Mitsui High-Tec, Inc. |
15,500 | 321,112 | ||||||
| Mitsui Sugar Co., Ltd. |
44,600 | 1,499,676 | ||||||
| Mitsui-Soko Holdings Co., Ltd. |
253,000 | 746,200 | ||||||
| Miyaji Engineering Group, Inc. |
2,600 | 71,719 | ||||||
| Miyazaki Bank, Ltd. |
29,480 | 1,068,524 | ||||||
| Mizuno Corp. |
7,800 | 221,392 | ||||||
| Mochida Pharmaceutical Co., Ltd. |
9,100 | 668,565 | ||||||
| Modec, Inc. |
9,000 | 217,234 | ||||||
| Monex Group, Inc. (c) |
98,800 | 265,070 | ||||||
| Monogatari Corp. |
1,400 | 90,543 | ||||||
| Mori Trust Hotel Reit, Inc. REIT |
178 | 230,397 | ||||||
| Morinaga Milk Industry Co., Ltd. |
19,400 | 741,083 | ||||||
| Morita Holdings Corp. |
22,600 | 351,152 | ||||||
| MOS Food Services, Inc. |
11,800 | 367,423 | ||||||
| Musashi Seimitsu Industry Co., Ltd. |
14,600 | 455,257 | ||||||
| Musashino Bank, Ltd. |
34,680 | 1,030,557 | ||||||
| Nachi-Fujikoshi Corp. |
129,000 | 725,421 | ||||||
| Nagaileben Co., Ltd. |
14,900 | 374,469 | ||||||
| Nakanishi, Inc. |
27,280 | 1,233,556 | ||||||
| Namura Shipbuilding Co., Ltd. |
19,900 | 117,386 | ||||||
| NanoCarrier Co., Ltd. (a) (c) |
21,200 | 130,893 | ||||||
| Nanto Bank, Ltd. |
14,500 | 407,054 | ||||||
| NEC Networks & System Integration Corp. |
14,700 | 350,637 | ||||||
| NET One Systems Co., Ltd. |
126,200 | 1,334,145 | ||||||
| Neturen Co., Ltd. |
112,483 | 1,131,175 | ||||||
| Nichi-iko Pharmaceutical Co., Ltd. (c) |
27,400 | 425,733 | ||||||
| Nichias Corp. |
76,000 | 937,805 | ||||||
| Nichiban Co., Ltd. |
10,000 | 206,992 | ||||||
| Nichicon Corp. |
41,500 | 509,141 | ||||||
| Nichiha Corp. |
17,700 | 663,563 | ||||||
| NichiiGakkan Co., Ltd. |
73,700 | 758,835 | ||||||
| Nichireki Co., Ltd. |
11,000 | 140,328 | ||||||
| Nihon Dempa Kogyo Co., Ltd. (c) |
27,000 | 210,358 | ||||||
| Nihon Kagaku Sangyo Co., Ltd. (c) |
12,348 | 240,345 | ||||||
| Nihon Nohyaku Co., Ltd. |
14,000 | 78,355 | ||||||
| Nihon Parkerizing Co., Ltd. |
58,200 | 930,662 | ||||||
| Nihon Tokushu Toryo Co., Ltd. (c) |
14,400 | 246,386 | ||||||
| Nihon Trim Co., Ltd. (c) |
1,500 | 65,895 | ||||||
| Nihon Unisys, Ltd. |
32,400 | 517,813 | ||||||
| Nikkiso Co., Ltd. |
68,540 | 636,293 | ||||||
| Nikkon Holdings Co., Ltd. |
141,480 | 3,496,623 | ||||||
See accompanying notes to financial statements.
90
Table of Contents
SPDR S&P International Small Cap ETF
SCHEDULE OF INVESTMENTS (continued)
September 30, 2017
| Security Description |
Shares |
Value |
||||||
| Nippon Beet Sugar Manufacturing Co., Ltd. |
3,300 | $ | 71,180 | |||||
| Nippon Carbon Co., Ltd. (c) |
18,271 | 713,375 | ||||||
| Nippon Chemi-Con Corp. |
6,900 | 244,579 | ||||||
| Nippon Coke & Engineering Co., Ltd. |
91,400 | 95,001 | ||||||
| Nippon Concrete Industries Co., Ltd. (c) |
33,200 | 130,954 | ||||||
| Nippon Denko Co., Ltd. |
64,400 | 256,307 | ||||||
| Nippon Densetsu Kogyo Co., Ltd. |
25,000 | 525,696 | ||||||
| Nippon Flour Mills Co., Ltd. |
29,900 | 455,280 | ||||||
| Nippon Gas Co., Ltd. |
32,500 | 1,009,084 | ||||||
| Nippon Koei Co., Ltd. |
9,800 | 333,008 | ||||||
| Nippon Light Metal Holdings Co., Ltd. (c) |
252,500 | 717,807 | ||||||
| Nippon Parking Development Co., Ltd. |
45,700 | 67,394 | ||||||
| Nippon Pillar Packing Co., Ltd. |
15,600 | 235,320 | ||||||
| NIPPON REIT Investment Corp. |
693 | 1,991,609 | ||||||
| Nippon Road Co., Ltd. |
4,700 | 260,125 | ||||||
| Nippon Seiki Co., Ltd. |
53,200 | 1,087,489 | ||||||
| Nippon Sheet Glass Co., Ltd. (a) |
45,000 | 349,798 | ||||||
| Nippon Signal Co., Ltd. |
33,400 | 359,028 | ||||||
| Nippon Soda Co., Ltd. |
64,000 | 388,895 | ||||||
| Nippon Steel & Sumikin Bussan Corp. |
3,600 | 198,285 | ||||||
| Nippon Suisan Kaisha, Ltd. |
164,099 | 916,966 | ||||||
| Nippon Thompson Co., Ltd. |
149,600 | 827,973 | ||||||
| Nippon Valqua Industries, Ltd. |
10,476 | 255,653 | ||||||
| Nippon Yakin Kogyo Co., Ltd. (a) (c) |
81,800 | 170,046 | ||||||
| Nishi-Nippon Financial Holdings, Inc. |
53,200 | 581,790 | ||||||
| Nishi-Nippon Railroad Co., Ltd. |
33,400 | 803,214 | ||||||
| Nishimatsu Construction Co., Ltd. |
28,600 | 825,745 | ||||||
| Nishimatsuya Chain Co., Ltd. |
25,053 | 280,209 | ||||||
| Nishio Rent All Co., Ltd. |
7,000 | 232,888 | ||||||
| Nissan Shatai Co., Ltd. |
23,000 | 253,773 | ||||||
| Nissei ASB Machine Co., Ltd. |
4,700 | 188,935 | ||||||
| Nissei Build Kogyo Co., Ltd. |
28,500 | 308,129 | ||||||
| Nissha Printing Co., Ltd. |
25,200 | 683,925 | ||||||
| Nisshin Oillio Group, Ltd. |
13,600 | 445,822 | ||||||
| Nisshin Steel Co., Ltd. |
13,000 | 166,188 | ||||||
| Nisshinbo Holdings, Inc. |
75,900 | 897,463 | ||||||
| Nissin Corp. |
12,000 | 310,967 | ||||||
| Nissin Electric Co., Ltd. |
23,800 | 293,047 | ||||||
| Nissin Kogyo Co., Ltd. (c) |
14,700 | 262,880 | ||||||
| Nitta Corp. |
9,900 | 359,712 | ||||||
| Nittetsu Mining Co., Ltd. |
3,200 | 233,110 | ||||||
| Nitto Boseki Co., Ltd. |
30,631 | 938,796 | ||||||
| Nitto Kogyo Corp. |
8,500 | 150,193 | ||||||
| Nittoku Engineering Co., Ltd. |
9,400 | 397,495 | ||||||
| Nohmi Bosai, Ltd. |
18,200 | 286,990 | ||||||
| Nojima Corp. |
13,900 | 281,297 | ||||||
| Nomura Co., Ltd. |
22,400 | 496,097 | ||||||
| Noritake Co., Ltd. |
6,900 | 329,783 | ||||||
| Noritsu Koki Co., Ltd. |
9,800 | 123,278 | ||||||
| Noritz Corp. |
15,700 | 282,018 | ||||||
| North Pacific Bank, Ltd. |
157,000 | 496,531 | ||||||
| NS United Kaiun Kaisha, Ltd. |
1,900 | 41,573 | ||||||
| NSD Co., Ltd. |
20,900 | 387,494 | ||||||
| NuFlare Technology, Inc. (c) |
1,800 | 97,224 | ||||||
| Obara Group, Inc. |
3,500 | 198,063 | ||||||
| Oenon Holdings, Inc. |
98,200 | 271,312 | ||||||
| Ogaki Kyoritsu Bank, Ltd. |
9,500 | 265,846 | ||||||
| Ohsho Food Service Corp. |
6,800 | 273,051 | ||||||
| Oiles Corp. |
10,900 | 201,897 | ||||||
| Oita Bank, Ltd. |
26,580 | 1,102,728 | ||||||
| Okabe Co., Ltd. |
22,500 | 212,077 | ||||||
| Okamoto Industries, Inc. |
31,800 | 330,812 | ||||||
| Okamura Corp. |
60,300 | 688,362 | ||||||
| Okasan Securities Group, Inc. |
88,682 | 508,938 | ||||||
| Oki Electric Industry Co., Ltd. |
55,700 | 741,743 | ||||||
| Okinawa Electric Power Co., Inc. |
19,990 | 439,348 | ||||||
| OKUMA Corp. |
13,600 | 744,246 | ||||||
| Okumura Corp. |
16,800 | 641,763 | ||||||
| Okura Industrial Co., Ltd. |
33,950 | 245,505 | ||||||
| Okuwa Co., Ltd. |
18,000 | 185,813 | ||||||
| OncoTherapy Science, Inc. (a) (c) |
52,700 | 119,384 | ||||||
| One REIT, Inc. |
96 | 185,322 | ||||||
| Onward Holdings Co., Ltd. |
63,000 | 478,524 | ||||||
| Open House Co., Ltd. |
14,900 | 520,206 | ||||||
| Optex Co., Ltd. |
9,600 | 359,046 | ||||||
| Osaka Soda Co., Ltd. (c) |
12,400 | 319,460 | ||||||
| OSAKA Titanium Technologies Co., Ltd. (c) |
8,500 | 123,462 | ||||||
| Osaki Electric Co., Ltd. |
16,000 | 123,804 | ||||||
| OSG Corp. (c) |
50,040 | 1,138,030 | ||||||
| OSJB Holdings Corp. |
99,000 | 291,991 | ||||||
| Otsuka Kagu, Ltd. (c) |
7,200 | 58,206 | ||||||
| Outsourcing, Inc. |
30,000 | 417,092 | ||||||
| Pacific Industrial Co., Ltd. |
31,100 | 414,703 | ||||||
| Pacific Metals Co., Ltd. (a) (c) |
7,400 | 188,213 | ||||||
| Pack Corp. |
8,500 | 301,293 | ||||||
| Pal Co., Ltd. |
5,700 | 176,725 | ||||||
| Paramount Bed Holdings Co., Ltd. |
5,600 | 240,537 | ||||||
| Pasona Group, Inc. (c) |
14,400 | 158,117 | ||||||
| Penta-Ocean Construction Co., Ltd. |
124,600 | 785,910 | ||||||
| Pepper Food Service Co., Ltd. |
7,400 | 311,607 | ||||||
| Piolax, Inc. |
16,800 | 475,352 | ||||||
| Pioneer Corp. (a) |
178,400 | 331,236 | ||||||
| Plenus Co., Ltd. |
9,900 | 218,730 | ||||||
| Poletowin Pitcrew Holdings, Inc. |
10,000 | 139,475 | ||||||
| Premier Investment Corp. |
1,758 | 1,667,964 | ||||||
| Press Kogyo Co., Ltd. |
66,200 | 362,272 | ||||||
| Pressance Corp. |
18,000 | 243,539 | ||||||
| Prestige International, Inc. |
28,700 | 286,324 | ||||||
| Prima Meat Packers, Ltd. |
76,000 | 513,801 | ||||||
| Qol Co., Ltd. |
12,200 | 213,187 | ||||||
| Raito Kogyo Co., Ltd. |
16,300 | 161,892 | ||||||
| Relia, Inc. |
24,400 | 281,359 | ||||||
| Remixpoint Co., Ltd. (c) |
20,300 | 220,015 | ||||||
| Rengo Co., Ltd. |
227,500 | 1,352,085 | ||||||
| ReproCELL, Inc. (a) (c) |
42,200 | 131,963 | ||||||
| Riken Corp. |
7,000 | 360,059 | ||||||
| Riken Keiki Co., Ltd. |
12,300 | 246,732 | ||||||
| Riken Vitamin Co., Ltd. |
5,400 | 203,642 | ||||||
| Ringer Hut Co., Ltd. |
14,500 | 329,250 | ||||||
| Riso Kagaku Corp. |
9,200 | 167,302 | ||||||
| Rock Field Co., Ltd. |
10,600 | 187,959 | ||||||
| Rokko Butter Co., Ltd. |
10,600 | 226,191 | ||||||
| Roland DG Corp. |
4,400 | 112,614 | ||||||
| Round One Corp. |
23,900 | 321,243 | ||||||
See accompanying notes to financial statements.
91
Table of Contents
SPDR S&P International Small Cap ETF
SCHEDULE OF INVESTMENTS (continued)
September 30, 2017
| Security Description |
Shares |
Value |
||||||
| Royal Holdings Co., Ltd. |
13,400 | $ | 337,247 | |||||
| Ryobi, Ltd. |
16,400 | 441,452 | ||||||
| Ryosan Co., Ltd. |
10,000 | 396,660 | ||||||
| S Foods, Inc. |
5,700 | 221,539 | ||||||
| Sagami Chain Co., Ltd. |
23,000 | 282,379 | ||||||
| Saizeriya Co., Ltd. |
15,200 | 417,927 | ||||||
| Sakai Chemical Industry Co., Ltd. |
57,153 | 1,461,764 | ||||||
| Sakai Moving Service Co., Ltd. |
4,200 | 221,632 | ||||||
| Sakata INX Corp. |
23,800 | 439,147 | ||||||
| Sakata Seed Corp. |
16,600 | 471,905 | ||||||
| San-A Co., Ltd. |
10,200 | 453,978 | ||||||
| San-Ai Oil Co., Ltd. |
19,500 | 216,022 | ||||||
| San-In Godo Bank, Ltd. |
51,300 | 444,343 | ||||||
| Sanden Holdings Corp. (a) (c) |
11,200 | 222,378 | ||||||
| Sangetsu Co., Ltd. |
34,100 | 585,575 | ||||||
| Sanken Electric Co., Ltd. |
68,000 | 373,331 | ||||||
| Sanki Engineering Co., Ltd. |
25,700 | 288,130 | ||||||
| Sankyo Tateyama, Inc. (c) |
28,600 | 406,267 | ||||||
| Sanrio Co., Ltd. (c) |
30,100 | 570,901 | ||||||
| Sanyo Chemical Industries, Ltd. |
5,400 | 314,218 | ||||||
| Sanyo Denki Co., Ltd. |
5,600 | 315,906 | ||||||
| Sanyo Electric Railway Co., Ltd. (c) |
7,800 | 195,823 | ||||||
| Sanyo Shokai, Ltd. |
22,500 | 343,002 | ||||||
| Sanyo Special Steel Co., Ltd. |
38,387 | 983,173 | ||||||
| Sato Holdings Corp. |
39,940 | 944,523 | ||||||
| Seika Corp. |
4,400 | 119,415 | ||||||
| Seikagaku Corp. |
22,400 | 404,758 | ||||||
| Seiko Holdings Corp. (c) |
11,800 | 265,530 | ||||||
| Seiren Co., Ltd. |
71,880 | 1,323,744 | ||||||
| Sekisui House Reit, Inc. |
447 | 516,235 | ||||||
| Sekisui House Residential Investment Corp. |
571 | 559,003 | ||||||
| Sekisui Plastics Co., Ltd. |
23,000 | 288,918 | ||||||
| Senko Group Holdings Co., Ltd. |
47,000 | 334,864 | ||||||
| Senshu Ikeda Holdings, Inc. |
110,260 | 424,133 | ||||||
| Senshukai Co., Ltd. (c) |
18,900 | 115,685 | ||||||
| Septeni Holdings Co., Ltd. (c) |
40,300 | 110,627 | ||||||
| Shibuya Kogyo Co., Ltd. |
10,900 | 353,924 | ||||||
| Shiga Bank, Ltd. |
146,000 | 811,940 | ||||||
| Shikoku Bank, Ltd. |
24,000 | 362,884 | ||||||
| Shikoku Chemicals Corp. |
24,000 | 362,884 | ||||||
| Shima Seiki Manufacturing, Ltd. |
31,845 | 1,674,787 | ||||||
| Shimachu Co., Ltd. |
44,160 | 1,159,659 | ||||||
| Shin-Etsu Polymer Co., Ltd. |
22,600 | 204,989 | ||||||
| Shindengen Electric Manufacturing Co., Ltd. |
4,100 | 262,248 | ||||||
| Shinkawa, Ltd. (a) (c) |
9,200 | 65,957 | ||||||
| Shinko Electric Industries Co., Ltd. |
28,300 | 190,569 | ||||||
| Shinko Plantech Co., Ltd. |
31,100 | 272,693 | ||||||
| Shinmaywa Industries, Ltd. |
26,000 | 235,828 | ||||||
| Shinsho Corp. |
4,000 | 140,363 | ||||||
| Ship Healthcare Holdings, Inc. |
15,500 | 478,501 | ||||||
| Shizuoka Gas Co., Ltd. |
28,200 | 223,215 | ||||||
| SHO-BOND Holdings Co., Ltd. |
14,200 | 808,617 | ||||||
| Shochiku Co., Ltd. |
21,460 | 3,056,046 | ||||||
| Shoei Co., Ltd. |
5,600 | 172,629 | ||||||
| Shoei Foods Corp. (c) |
7,300 | 300,262 | ||||||
| Showa Corp. |
24,300 | 298,340 | ||||||
| Showa Sangyo Co., Ltd. |
7,600 | 196,271 | ||||||
| Siix Corp. |
11,200 | 492,515 | ||||||
| Sinanen Holdings Co., Ltd. |
7,600 | 156,571 | ||||||
| Sinfonia Technology Co., Ltd. |
348,400 | 1,491,838 | ||||||
| Sinko Industries, Ltd. |
14,500 | 242,944 | ||||||
| Sintokogio, Ltd. |
34,800 | 376,241 | ||||||
| SKY Perfect JSAT Holdings, Inc. |
62,000 | 277,049 | ||||||
| SMK Corp. |
143,343 | 662,181 | ||||||
| SMS Co., Ltd. |
22,400 | 713,401 | ||||||
| Sodick Co., Ltd. |
25,900 | 320,284 | ||||||
| Sogo Medical Co., Ltd. |
3,900 | 178,084 | ||||||
| Sosei Group Corp. (a) |
10,300 | 869,276 | ||||||
| St Marc Holdings Co., Ltd. |
3,000 | 88,216 | ||||||
| Star Asia Investment Corp. REIT |
215 | 195,012 | ||||||
| Star Micronics Co., Ltd. |
20,000 | 344,334 | ||||||
| Starts Corp., Inc. |
15,500 | 398,361 | ||||||
| Starts Proceed Investment Corp. |
154 | 210,961 | ||||||
| Starzen Co., Ltd. |
4,800 | 234,105 | ||||||
| Stella Chemifa Corp. (c) |
7,300 | 310,638 | ||||||
| Sumida Corp. |
18,900 | 368,043 | ||||||
| Sumitomo Bakelite Co., Ltd. |
87,000 | 640,723 | ||||||
| Sumitomo Mitsui Construction Co., Ltd. |
78,360 | 452,485 | ||||||
| Sumitomo Osaka Cement Co., Ltd. |
202,793 | 897,179 | ||||||
| Sumitomo Seika Chemicals Co., Ltd. |
2,400 | 114,707 | ||||||
| Sumitomo Warehouse Co., Ltd. (c) |
48,000 | 318,536 | ||||||
| Sun Corp. (c) |
10,000 | 67,339 | ||||||
| Sun Frontier Fudousan Co., Ltd. |
5,800 | 62,604 | ||||||
| Sushiro Global Holdings, Ltd. (a) (c) |
11,000 | 352,774 | ||||||
| SWCC Showa Holdings Co., Ltd. (a) |
4,500 | 41,296 | ||||||
| Systena Corp. |
11,200 | 279,192 | ||||||
| T Hasegawa Co., Ltd. |
13,000 | 248,994 | ||||||
| T RAD Co., Ltd. |
1,500 | 58,033 | ||||||
| T-Gaia Corp. |
10,300 | 200,116 | ||||||
| Tabuchi Electric Co., Ltd. (c) |
17,600 | 45,030 | ||||||
| Tachi-S Co., Ltd. |
20,300 | 375,829 | ||||||
| Tadano, Ltd. |
71,900 | 839,946 | ||||||
| Taihei Dengyo Kaisha, Ltd. |
12,500 | 328,810 | ||||||
| Taikisha, Ltd. |
14,900 | 410,341 | ||||||
| Taiko Pharmaceutical Co., Ltd. (c) |
12,800 | 266,541 | ||||||
| Taiyo Holdings Co., Ltd. |
4,600 | 214,134 | ||||||
| Taiyo Yuden Co., Ltd. |
64,500 | 954,049 | ||||||
| Takamatsu Construction Group Co., Ltd. |
7,900 | 218,616 | ||||||
| Takaoka Toko Co., Ltd. |
1,900 | 33,893 | ||||||
| Takara Bio, Inc. |
24,900 | 342,647 | ||||||
| Takara Leben Co., Ltd. |
40,700 | 198,863 | ||||||
| Takara Standard Co., Ltd. |
29,400 | 506,172 | ||||||
| Takasago International Corp. |
49,900 | 1,715,569 | ||||||
| Takasago Thermal Engineering Co., Ltd. |
34,100 | 562,855 | ||||||
| Takata Corp. (a) (e) |
300 | 48 | ||||||
| Takeuchi Manufacturing Co., Ltd. |
21,900 | 457,786 | ||||||
| Takuma Co., Ltd. |
37,500 | 455,737 | ||||||
| Tamron Co., Ltd. |
5,400 | 104,244 | ||||||
| Tamura Corp. |
49,000 | 297,313 | ||||||
| Tanseisha Co., Ltd. |
23,400 | 287,914 | ||||||
| TechnoPro Holdings, Inc. |
16,200 | 767,077 | ||||||
| Teikoku Electric Manufacturing Co., Ltd. |
3,600 | 37,450 | ||||||
See accompanying notes to financial statements.
92
Table of Contents
SPDR S&P International Small Cap ETF
SCHEDULE OF INVESTMENTS (continued)
September 30, 2017
| Security Description |
Shares |
Value |
||||||
| Teikoku Sen-I Co., Ltd. (c) |
15,000 | $ | 304,757 | |||||
| Tekken Corp. |
7,200 | 231,546 | ||||||
| TKC Corp. |
7,700 | 235,997 | ||||||
| Toa Corp. (c) (f) |
19,300 | 203,004 | ||||||
| Toa Corp. (a) (f) |
8,000 | 155,857 | ||||||
| Toagosei Co., Ltd. |
218,600 | 2,926,578 | ||||||
| Tobishima Corp. |
107,500 | 155,666 | ||||||
| TOC Co., Ltd. |
149,760 | 1,317,127 | ||||||
| Tocalo Co., Ltd. |
8,400 | 323,493 | ||||||
| Tochigi Bank, Ltd. |
147,900 | 630,676 | ||||||
| Toei Animation Co., Ltd. |
2,900 | 298,850 | ||||||
| Toei Co., Ltd. |
14,640 | 1,624,427 | ||||||
| Toho Bank, Ltd. |
90,000 | 338,205 | ||||||
| Toho Holdings Co., Ltd. (c) |
72,619 | 1,387,674 | ||||||
| Toho Zinc Co., Ltd. |
5,300 | 228,357 | ||||||
| Tokai Carbon Co., Ltd. |
134,500 | 1,264,167 | ||||||
| TOKAI Holdings Corp. |
60,900 | 470,688 | ||||||
| Tokai Rika Co., Ltd. |
19,300 | 381,662 | ||||||
| Tokai Tokyo Financial Holdings, Inc. |
78,200 | 463,371 | ||||||
| Token Corp. |
3,800 | 452,023 | ||||||
| Tokushu Tokai Paper Co., Ltd. |
5,100 | 199,125 | ||||||
| Tokuyama Corp. |
47,200 | 1,116,631 | ||||||
| Tokyo Base Co., Ltd. (a) |
4,000 | 192,600 | ||||||
| Tokyo Dome Corp. |
44,100 | 407,445 | ||||||
| Tokyo Ohka Kogyo Co., Ltd. |
18,700 | 664,505 | ||||||
| Tokyo Seimitsu Co., Ltd. |
23,000 | 814,241 | ||||||
| Tokyo Steel Manufacturing Co., Ltd. |
54,700 | 450,468 | ||||||
| Tokyo Tekko Co., Ltd. |
1,800 | 36,283 | ||||||
| Tokyo TY Financial Group, Inc. |
18,900 | 483,057 | ||||||
| Tokyotokeiba Co., Ltd. |
8,900 | 267,636 | ||||||
| Tokyu Construction Co., Ltd. |
40,200 | 329,628 | ||||||
| Tokyu REIT, Inc. |
346 | 421,415 | ||||||
| Tomoe Engineering Co., Ltd. |
2,800 | 53,804 | ||||||
| TOMONY Holdings, Inc. |
179,180 | 810,222 | ||||||
| Tomy Co., Ltd. |
56,000 | 773,597 | ||||||
| Topcon Corp. |
60,100 | 1,058,217 | ||||||
| Topre Corp. (c) |
24,800 | 761,196 | ||||||
| Topy Industries, Ltd. |
28,698 | 958,597 | ||||||
| Toridoll Holdings Corp. |
10,200 | 306,276 | ||||||
| Torii Pharmaceutical Co., Ltd. |
5,600 | 159,197 | ||||||
| Torishima Pump Manufacturing Co., Ltd. (c) |
5,600 | 59,251 | ||||||
| Tosei Reit Investment Corp. REIT |
208 | 202,521 | ||||||
| Toshiba Machine Co., Ltd. |
51,000 | 278,186 | ||||||
| Toshiba Plant Systems & Services Corp. |
24,000 | 403,394 | ||||||
| Toshiba TEC Corp. |
54,000 | 297,428 | ||||||
| Tosho Co., Ltd. |
9,000 | 221,312 | ||||||
| Totetsu Kogyo Co., Ltd. |
14,900 | 490,423 | ||||||
| Towa Corp. |
20,300 | 320,645 | ||||||
| Towa Pharmaceutical Co., Ltd. |
2,800 | 141,287 | ||||||
| Toyo Construction Co., Ltd. |
39,600 | 181,879 | ||||||
| Toyo Corp. |
147,168 | 1,333,553 | ||||||
| Toyo Engineering Corp. (c) |
11,600 | 141,490 | ||||||
| Toyo Ink SC Holdings Co., Ltd. |
60,000 | 337,405 | ||||||
| Toyo Kanetsu KK |
7,500 | 278,506 | ||||||
| Toyo Tanso Co., Ltd. |
8,300 | 197,979 | ||||||
| Toyobo Co., Ltd. |
42,779 | 814,418 | ||||||
| TPR Co., Ltd. |
16,900 | 566,761 | ||||||
| Transcosmos, Inc. |
14,600 | 336,579 | ||||||
| Trusco Nakayama Corp. |
22,300 | 543,211 | ||||||
| TSI Holdings Co., Ltd. |
70,500 | 559,916 | ||||||
| Tsubaki Nakashima Co., Ltd. (c) |
13,800 | 289,326 | ||||||
| Tsubakimoto Chain Co. |
62,000 | 495,163 | ||||||
| Tsugami Corp. |
39,000 | 328,797 | ||||||
| Tsukishima Kikai Co., Ltd. |
27,500 | 332,741 | ||||||
| Tsukui Corp. |
29,500 | 203,891 | ||||||
| Tsurumi Manufacturing Co., Ltd. |
10,900 | 193,569 | ||||||
| UACJ Corp. (c) |
14,500 | 412,850 | ||||||
| Uchida Yoko Co., Ltd. |
6,800 | 224,119 | ||||||
| Unipres Corp. |
18,000 | 500,511 | ||||||
| United Arrows, Ltd. |
14,300 | 519,584 | ||||||
| United Super Markets Holdings, Inc. |
33,700 | 322,435 | ||||||
| UNITED, Inc. (c) |
5,300 | 139,415 | ||||||
| Unitika, Ltd. (a) |
112,400 | 884,701 | ||||||
| Unizo Holdings Co., Ltd. |
6,900 | 159,926 | ||||||
| Ushio, Inc. |
61,700 | 822,740 | ||||||
| UT Group Co., Ltd. (a) |
14,000 | 273,620 | ||||||
| V Technology Co., Ltd. (c) |
1,936 | 323,856 | ||||||
| Valor Holdings Co., Ltd. |
33,200 | 709,037 | ||||||
| Vector, Inc. (c) |
18,000 | 256,172 | ||||||
| Vital KSK Holdings, Inc. |
28,300 | 234,566 | ||||||
| VT Holdings Co., Ltd. |
23,300 | 133,303 | ||||||
| W-Scope Corp. (c) |
9,400 | 190,814 | ||||||
| Wacoal Holdings Corp. |
36,000 | 1,026,607 | ||||||
| Wacom Co., Ltd. (c) |
77,000 | 358,442 | ||||||
| Wakachiku Construction Co., Ltd. |
3,800 | 65,289 | ||||||
| Wakita & Co., Ltd. |
10,900 | 131,596 | ||||||
| WATAMI Co., Ltd. (c) |
16,400 | 218,249 | ||||||
| WirelessGate, Inc. (c) |
8,000 | 92,320 | ||||||
| Xebio Holdings Co., Ltd. |
8,000 | 156,567 | ||||||
| Yahagi Construction Co., Ltd. |
26,800 | 230,228 | ||||||
| YAMABIKO Corp. |
22,600 | 310,395 | ||||||
| Yamagata Bank, Ltd. |
15,600 | 361,988 | ||||||
| Yamaichi Electronics Co., Ltd. |
16,400 | 301,003 | ||||||
| Yamanashi Chuo Bank, Ltd. |
112,000 | 470,626 | ||||||
| Yamato Kogyo Co., Ltd. |
12,500 | 338,138 | ||||||
| Yamazen Corp. |
49,700 | 537,333 | ||||||
| Yaoko Co., Ltd. |
9,000 | 416,559 | ||||||
| Yasunaga Corp. (c) |
6,900 | 230,174 | ||||||
| Yellow Hat, Ltd. |
10,300 | 291,894 | ||||||
| Yodogawa Steel Works, Ltd. |
43,500 | 1,190,246 | ||||||
| Yokogawa Bridge Holdings Corp. |
18,500 | 358,775 | ||||||
| Yokohama Reito Co., Ltd. |
26,900 | 253,311 | ||||||
| Yondoshi Holdings, Inc. |
14,800 | 420,735 | ||||||
| Yonex Co., Ltd. (c) |
26,100 | 194,536 | ||||||
| Yorozu Corp. |
14,800 | 316,208 | ||||||
| Yoshinoya Holdings Co., Ltd. (c) |
32,200 | 530,350 | ||||||
| Yuasa Trading Co., Ltd. |
10,300 | 363,723 | ||||||
| Yume No Machi Souzou Iinkai Co., Ltd. |
14,272 | 217,570 | ||||||
| Yumeshin Holdings Co., Ltd. (c) |
45,100 | 312,112 | ||||||
| Yushin Precision Equipment Co., Ltd. (c) |
8,200 | 230,196 | ||||||
| Zenrin Co., Ltd. |
53,477 | 1,624,762 | ||||||
| ZERIA Pharmaceutical Co., Ltd. |
22,500 | 401,968 | ||||||
| Zojirushi Corp. |
24,800 | 237,502 | ||||||
|
|
|
|||||||
| 322,210,791 | ||||||||
|
|
|
|||||||
See accompanying notes to financial statements.
93
Table of Contents
SPDR S&P International Small Cap ETF
SCHEDULE OF INVESTMENTS (continued)
September 30, 2017
| Security Description |
Shares |
Value |
||||||
| LIECHTENSTEIN — 0.0% (g) |
| |||||||
| VP Bank AG |
1,760 | $ | 236,461 | |||||
|
|
|
|||||||
| LUXEMBOURG — 0.1% |
| |||||||
| Orion Engineered Carbons SA |
19,200 | 431,040 | ||||||
|
|
|
|||||||
| MACAU — 0.1% |
| |||||||
| Macau Legend Development, Ltd. (a) (c) |
3,138,740 | 514,370 | ||||||
|
|
|
|||||||
| MALTA — 0.0% (g) |
| |||||||
| Catena Media PLC (a) |
27,211 | 253,363 | ||||||
|
|
|
|||||||
| NETHERLANDS — 1.3% |
| |||||||
| Accell Group |
12,738 | 393,789 | ||||||
| AMG Advanced Metallurgical Group NV |
12,273 | 529,366 | ||||||
| Amsterdam Commodities NV |
16,319 | 478,064 | ||||||
| Arcadis NV |
31,594 | 681,085 | ||||||
| Beter Bed Holding NV |
14,718 | 278,829 | ||||||
| BinckBank NV (c) |
43,338 | 224,098 | ||||||
| Brack Capital Properties NV (a) |
1,996 | 217,477 | ||||||
| Constellium NV Class A (a) |
51,673 | 529,648 | ||||||
| Corbion NV |
41,533 | 1,337,983 | ||||||
| Flow Traders (d) |
20,243 | 544,436 | ||||||
| ForFarmers NV |
10,295 | 133,878 | ||||||
| Fugro NV (a) |
30,904 | 437,138 | ||||||
| Heijmans NV (a) |
24,200 | 262,089 | ||||||
| Intertrust NV (d) |
41,383 | 672,201 | ||||||
| Kendrion NV |
12,207 | 533,807 | ||||||
| Koninklijke BAM Groep NV |
154,956 | 886,268 | ||||||
| NSI NV REIT |
11,450 | 451,161 | ||||||
| Pharming Group NV (a) (c) |
420,616 | 350,065 | ||||||
| PostNL NV |
172,142 | 741,576 | ||||||
| Refresco Gerber NV (d) |
27,866 | 561,352 | ||||||
| Takeaway.com NV (a) (d) |
15,481 | 680,912 | ||||||
| Vastned Retail NV |
6,287 | 280,205 | ||||||
| Wessanen |
31,511 | 592,311 | ||||||
|
|
|
|||||||
| 11,797,738 | ||||||||
|
|
|
|||||||
| NEW ZEALAND — 1.1% |
| |||||||
| Argosy Property, Ltd. |
374,633 | 281,655 | ||||||
| Arvida Group, Ltd. |
257,945 | 227,491 | ||||||
| Chorus, Ltd. (c) |
160,121 | 453,746 | ||||||
| EBOS Group, Ltd. |
32,435 | 401,652 | ||||||
| Freightways, Ltd. |
84,558 | 475,568 | ||||||
| Genesis Energy, Ltd. |
195,878 | 338,424 | ||||||
| Goodman Property Trust |
391,679 | 362,425 | ||||||
| Heartland New Zealand, Ltd. |
273,297 | 359,571 | ||||||
| Infratil, Ltd. |
324,471 | 731,828 | ||||||
| Investore Property, Ltd. (c) |
178,777 | 173,179 | ||||||
| Kiwi Property Group, Ltd. |
587,207 | 573,064 | ||||||
| Metlifecare, Ltd. |
69,945 | 293,267 | ||||||
| New Zealand Refining Co., Ltd. |
107,267 | 197,735 | ||||||
| Precinct Properties New Zealand, Ltd. |
498,768 | 459,713 | ||||||
| Restaurant Brands New Zealand, Ltd. |
151,667 | 747,745 | ||||||
| SKY Network Television, Ltd. |
147,590 | 288,071 | ||||||
| SKYCITY Entertainment Group, Ltd. |
351,836 | 953,784 | ||||||
| Stride Property Group |
275,202 | 326,267 | ||||||
| Summerset Group Holdings, Ltd. |
136,964 | 502,977 | ||||||
| Tourism Holdings, Ltd. |
61,530 | 220,621 | ||||||
| Trade Me Group, Ltd. |
215,142 | 710,755 | ||||||
| Vital Healthcare Property Trust |
239,170 | 384,694 | ||||||
| Warehouse Group, Ltd. |
67,229 | 105,948 | ||||||
|
|
|
|||||||
| 9,570,180 | ||||||||
|
|
|
|||||||
| NORWAY — 1.3% |
| |||||||
| Akastor ASA (a) |
98,083 | 214,394 | ||||||
| Aker Solutions ASA (a) |
60,665 | 321,147 | ||||||
| Asetek A/S |
14,202 | 217,661 | ||||||
| Atea ASA (a) |
42,574 | 561,571 | ||||||
| Avance Gas Holding, Ltd. (a) (d) |
27,344 | 79,693 | ||||||
| B2Holding ASA |
162,067 | 384,793 | ||||||
| Borregaard ASA |
57,161 | 640,883 | ||||||
| BW LPG, Ltd. (d) |
29,546 | 136,255 | ||||||
| BW Offshore, Ltd. (a) (c) |
53,501 | 187,515 | ||||||
| DNO ASA (a) (c) |
363,451 | 498,585 | ||||||
| Europris ASA (d) |
52,500 | 252,597 | ||||||
| Frontline, Ltd. (c) |
24,940 | 152,579 | ||||||
| Golden Ocean Group, Ltd. (a) (c) |
36,800 | 288,512 | ||||||
| Grieg Seafood ASA |
29,548 | 291,015 | ||||||
| Hoegh LNG Holdings, Ltd. |
21,368 | 197,298 | ||||||
| IDEX ASA (a) |
316,144 | 250,205 | ||||||
| Kongsberg Automotive ASA (a) |
276,961 | 326,356 | ||||||
| Kongsberg Gruppen ASA |
13,573 | 221,661 | ||||||
| Kvaerner ASA (a) |
114,344 | 183,863 | ||||||
| Nordic American Offshore, Ltd. |
1 | 1 | ||||||
| Nordic Nanovector ASA (a) |
30,679 | 308,320 | ||||||
| Nordic Semiconductor ASA (a) |
86,316 | 477,106 | ||||||
| Norway Royal Salmon ASA |
9,300 | 195,690 | ||||||
| Norwegian Air Shuttle ASA (a) (c) |
8,925 | 260,116 | ||||||
| Ocean Yield ASA |
22,419 | 201,369 | ||||||
| Petroleum Geo-Services ASA (a) (c) |
121,788 | 288,088 | ||||||
| Prosafe SE (a) |
15 | 45 | ||||||
| Protector Forsikring ASA |
59,315 | 583,068 | ||||||
| Scatec Solar ASA (d) |
97,600 | 512,503 | ||||||
| Skandiabanken ASA (d) |
38,947 | 430,554 | ||||||
| SpareBank 1 Nord Norge |
40,788 | 316,403 | ||||||
| SpareBank 1 SMN |
42,322 | 431,977 | ||||||
| Stolt-Nielsen, Ltd. |
14,611 | 220,258 | ||||||
| Thin Film Electronics ASA (a) (c) |
301,004 | 103,986 | ||||||
| Veidekke ASA |
112,701 | 1,412,249 | ||||||
| XXL ASA (d) |
56,512 | 615,858 | ||||||
|
|
|
|||||||
| 11,764,174 | ||||||||
|
|
|
|||||||
| PERU — 0.0% (g) |
| |||||||
| Hochschild Mining PLC |
88,426 | 272,271 | ||||||
|
|
|
|||||||
| PORTUGAL — 0.2% |
| |||||||
| Altri SGPS SA |
208,114 | 1,099,272 | ||||||
| Banco Comercial Portugues SA Class R (a) |
2,931 | 850 | ||||||
| CTT-Correios de Portugal SA |
63,633 | 383,507 | ||||||
| Mota-Engil SGPS SA |
48,869 | 183,256 | ||||||
| Pharol SGPS SA (a) (c) |
294,197 | 130,077 | ||||||
| REN - Redes Energeticas Nacionais SGPS SA |
87,398 | 284,548 | ||||||
|
|
|
|||||||
| 2,081,510 | ||||||||
|
|
|
|||||||
| SINGAPORE — 1.6% |
| |||||||
| Accordia Golf Trust |
418,400 | 224,921 | ||||||
| AIMS AMP Capital Industrial REIT |
258,058 | 267,949 | ||||||
| Ascendas Hospitality Trust |
536,300 | 329,770 | ||||||
See accompanying notes to financial statements.
94
Table of Contents
SPDR S&P International Small Cap ETF
SCHEDULE OF INVESTMENTS (continued)
September 30, 2017
| Security Description |
Shares |
Value |
||||||
| Ascott Residence Trust |
556,825 | $ | 481,807 | |||||
| Cache Logistics Trust |
611,948 | 376,285 | ||||||
| CapitaLand Retail China Trust |
360,273 | 425,817 | ||||||
| CDL Hospitality Trusts |
507,780 | 605,769 | ||||||
| China New Town Development Co., Ltd. (a) (e) |
428,500 | 21,670 | ||||||
| China Yuchai International, Ltd. (c) |
22,803 | 507,595 | ||||||
| COSCO Shipping International Singapore Co., Ltd. (a) (c) |
126,900 | 26,633 | ||||||
| Croesus Retail Trust |
276,718 | 237,399 | ||||||
| CWT, Ltd. |
198,000 | 341,191 | ||||||
| Delfi, Ltd. |
47,700 | 53,217 | ||||||
| ESR-REIT |
1,085,155 | 443,508 | ||||||
| Ezion Holdings, Ltd. (a) (c) |
648,440 | 94,070 | ||||||
| Ezra Holdings, Ltd. (a) (b) (c) |
1,444,295 | — | ||||||
| Far East Hospitality Trust |
445,447 | 219,779 | ||||||
| First Real Estate Investment Trust REIT |
602,600 | 592,416 | ||||||
| Frasers Centrepoint Trust |
276,000 | 428,852 | ||||||
| Frasers Commercial Trust |
338,637 | 344,136 | ||||||
| Frasers Logistics & Industrial Trust REIT |
583,300 | 459,613 | ||||||
| Hyflux, Ltd. (c) |
326,400 | 120,181 | ||||||
| International Healthway Corp., Ltd. (a) |
1,800 | 130 | ||||||
| Keppel DC REIT |
318,166 | 310,446 | ||||||
| Keppel Infrastructure Trust |
1,335,038 | 540,720 | ||||||
| Lian Beng Group, Ltd. |
130,100 | 60,837 | ||||||
| Lippo Malls Indonesia Retail Trust |
1,281,600 | 405,823 | ||||||
| M1, Ltd. (c) |
237,100 | 310,791 | ||||||
| Manulife US Real Estate Investment Trust REIT (c) |
325,700 | 298,016 | ||||||
| Metro Holdings, Ltd. |
350,000 | 337,641 | ||||||
| OUE Hospitality Trust |
362,033 | 210,616 | ||||||
| OUE, Ltd. |
94,000 | 134,983 | ||||||
| Parkway Life Real Estate Investment Trust REIT |
262,500 | 521,926 | ||||||
| Raffles Medical Group, Ltd. (c) |
494,049 | 409,297 | ||||||
| Religare Health Trust |
479,800 | 302,094 | ||||||
| Rowsley, Ltd. (a) (c) |
1,713,300 | 161,495 | ||||||
| Sabana Shari’ah Compliant Industrial Real Estate Investment Trust REIT |
582,449 | 199,447 | ||||||
| Saizen REIT |
367 | 9 | ||||||
| Sheng Siong Group, Ltd. (c) |
292,300 | 198,031 | ||||||
| Soilbuild Business Space REIT |
295,610 | 152,382 | ||||||
| Starhill Global REIT |
775,400 | 433,966 | ||||||
| Swiber Holdings, Ltd. (a) (b) (c) |
100,100 | — | ||||||
| Tat Hong Holdings, Ltd. (a) |
849 | 284 | ||||||
| Technics Oil & Gas, Ltd. (a) (b) |
1,254 | — | ||||||
| UMS Holdings, Ltd. (c) |
345,000 | 254,059 | ||||||
| United Engineers, Ltd. |
299,000 | 596,701 | ||||||
| Wing Tai Holdings, Ltd. (c) |
584,899 | 930,360 | ||||||
| Yoma Strategic Holdings, Ltd. (c) |
758,933 | 326,946 | ||||||
|
|
|
|||||||
| 13,699,578 | ||||||||
|
|
|
|||||||
| SOUTH AFRICA — 0.0% (g) |
| |||||||
| Great Basin Gold, Ltd. (a) (b) |
266,255 | — | ||||||
| Lonmin PLC (a) (c) |
106,793 | 101,011 | ||||||
| Petra Diamonds, Ltd. (a) |
182,554 | 205,736 | ||||||
|
|
|
|||||||
| 306,747 | ||||||||
|
|
|
|||||||
| SOUTH KOREA — 9.4% |
| |||||||
| Able C&C Co., Ltd. (c) |
10,107 | 140,308 | ||||||
| Advanced Process Systems Corp. (a) |
3,442 | 120,208 | ||||||
| AeroSpace Technology of Korea, Inc. (a) (c) |
6,018 | 87,484 | ||||||
| AfreecaTV Co., Ltd. |
7,693 | 136,685 | ||||||
| Ahnlab, Inc. (c) |
2,858 | 115,533 | ||||||
| AJ Rent A Car Co., Ltd. (a) |
3,044 | 34,683 | ||||||
| AK Holdings, Inc. |
2,007 | 113,724 | ||||||
| Amicogen, Inc. (a) |
6,711 | 186,327 | ||||||
| Aprogen Pharmaceuticals, Inc. (a) (c) |
42,025 | 144,933 | ||||||
| APS Holdings Corp. (a) |
3,156 | 27,004 | ||||||
| Asiana Airlines, Inc. (a) |
45,411 | 167,513 | ||||||
| Barun Electronics Co., Ltd. (a) |
167,847 | 193,441 | ||||||
| BH Co., Ltd. (a) |
17,101 | 330,717 | ||||||
| Binex Co., Ltd. (a) |
15,684 | 105,304 | ||||||
| Binggrae Co., Ltd. |
4,223 | 221,225 | ||||||
| Boryung Pharmaceutical Co., Ltd. |
3,762 | 131,548 | ||||||
| Bukwang Pharmaceutical Co., Ltd. |
12,310 | 239,676 | ||||||
| Byucksan Corp. |
30,082 | 79,844 | ||||||
| Cell Biotech Co., Ltd. |
3,486 | 119,766 | ||||||
| Celltrion Pharm, Inc. (a) |
9,667 | 157,832 | ||||||
| Chabiotech Co., Ltd. (a) (c) |
28,203 | 288,100 | ||||||
| Cheil Worldwide, Inc. |
45,881 | 729,065 | ||||||
| Choa Pharmaceutical Co. (a) (c) |
18,558 | 70,807 | ||||||
| Chong Kun Dang Pharmaceutical Corp. |
3,605 | 341,505 | ||||||
| Chongkundang Holdings Corp. |
2,053 | 125,293 | ||||||
| CJ CGV Co., Ltd. (c) |
7,133 | 401,070 | ||||||
| CJ Freshway Corp. |
1,771 | 56,129 | ||||||
| CJ O Shopping Co., Ltd. |
2,428 | 419,523 | ||||||
| CNK International Co., Ltd. (a) (b) |
16,071 | — | ||||||
| Com2uSCorp. |
7,421 | 809,905 | ||||||
| Cosmax BTI, Inc. |
6,732 | 169,865 | ||||||
| Cosmax, Inc. (c) |
5,387 | 597,327 | ||||||
| Crown Confectionery Co., Ltd. (a) |
2,361 | 35,765 | ||||||
| CROWNHAITAI Holdings Co., Ltd. |
1,930 | 28,983 | ||||||
| CrucialTec Co., Ltd. (a) |
13,227 | 31,354 | ||||||
| CrystalGenomics, Inc. (a) |
12,636 | 172,106 | ||||||
| CTC BIO, Inc. (a) |
6,698 | 41,872 | ||||||
| Dae Han Flour Mills Co., Ltd. |
503 | 75,317 | ||||||
| Dae Hwa Pharmaceutical Co., Ltd. (c) |
9,345 | 172,157 | ||||||
| Daeduck GDS Co., Ltd. |
6,402 | 107,040 | ||||||
| Daesang Corp. |
16,875 | 327,083 | ||||||
| Daesang Holdings Co., Ltd. |
5,117 | 41,415 | ||||||
| Daewon Pharmaceutical Co., Ltd. |
10,092 | 157,281 | ||||||
| Daewoo Shipbuilding & Marine Engineering Co., Ltd. (a) (b) |
50,853 | 99,455 | ||||||
| Daewoong Co., Ltd. |
24,685 | 310,354 | ||||||
| Daewoong Pharmaceutical Co., Ltd. |
1,796 | 166,216 | ||||||
| Daishin Securities Co., Ltd. Preference Shares |
62,998 | 510,980 | ||||||
| Daou Technology, Inc. |
19,119 | 294,626 | ||||||
| Dentium Co., Ltd. (a) |
5,966 | 288,051 | ||||||
| DGB Financial Group, Inc. |
103,169 | 945,802 | ||||||
| Digital Power Communications Co., Ltd. |
14,323 | 51,960 | ||||||
| DIO Corp. (a) (c) |
9,464 | 250,781 | ||||||
| Dong-A Socio Holdings Co., Ltd. (c) |
4,377 | 464,317 | ||||||
See accompanying notes to financial statements.
95
Table of Contents
SPDR S&P International Small Cap ETF
SCHEDULE OF INVESTMENTS (continued)
September 30, 2017
| Security Description |
Shares |
Value |
||||||
| Dong-A ST Co., Ltd. |
4,612 | $ | 329,788 | |||||
| Dongbu HiTek Co., Ltd. (a) |
26,513 | 354,170 | ||||||
| Dongjin Semichem Co., Ltd. |
20,811 | 341,596 | ||||||
| DongKook Pharmaceutical Co., Ltd. |
3,320 | 168,123 | ||||||
| Dongkuk Steel Mill Co., Ltd. |
54,062 | 505,054 | ||||||
| Dongsung Finetec Co., Ltd. |
11,308 | 49,217 | ||||||
| Dongwha Pharm Co., Ltd. |
32,559 | 243,336 | ||||||
| Dongwon F&B Co., Ltd. |
426 | 73,458 | ||||||
| Dongwon Industries Co., Ltd. |
1,174 | 285,466 | ||||||
| Doosan Heavy Industries & Construction Co., Ltd. (c) |
45,236 | 675,370 | ||||||
| Doosan Infracore Co., Ltd. (a) |
59,347 | 425,406 | ||||||
| DoubleUGames Co., Ltd. |
6,695 | 330,264 | ||||||
| Douzone Bizon Co., Ltd. |
17,716 | 482,594 | ||||||
| Ecopro Co., Ltd. (a) |
10,928 | 315,813 | ||||||
| Eo Technics Co., Ltd. |
5,265 | 380,619 | ||||||
| Eugene Investment & Securities Co., Ltd. (a) |
116,143 | 296,099 | ||||||
| Eugene Technology Co., Ltd. |
4,020 | 73,707 | ||||||
| Eusu Holdings Co., Ltd. |
6,796 | 42,306 | ||||||
| Fila Korea, Ltd. (c) |
7,189 | 429,953 | ||||||
| Finetex EnE, Inc. (a) (c) |
43,126 | 109,571 | ||||||
| Foosung Co., Ltd. (a) |
39,422 | 349,355 | ||||||
| G-treeBNT Co., Ltd. (a) |
14,333 | 353,523 | ||||||
| Gamevil, Inc. (a) (c) |
3,396 | 195,396 | ||||||
| GemVax & Kael Co., Ltd. (a) |
13,579 | 128,635 | ||||||
| Genexine Co., Ltd. (a) (c) |
8,128 | 341,697 | ||||||
| GNCO Co., Ltd. (a) (c) |
24,442 | 35,425 | ||||||
| GOLFZON Co., Ltd. |
2,295 | 94,176 | ||||||
| GOLFZONNEWDIN Co., Ltd. |
11,190 | 51,292 | ||||||
| Grand Korea Leisure Co., Ltd. |
14,790 | 306,040 | ||||||
| Green Cross Cell Corp. |
3,299 | 102,540 | ||||||
| Green Cross Corp. |
4,084 | 714,927 | ||||||
| Green Cross Holdings Corp. |
14,861 | 495,648 | ||||||
| GS Engineering & Construction Corp. (a) (c) |
26,374 | 613,670 | ||||||
| GS Home Shopping, Inc. |
2,574 | 488,124 | ||||||
| Halla Holdings Corp. |
2,725 | 149,651 | ||||||
| Hana Tour Service, Inc. |
4,784 | 359,630 | ||||||
| Hanall Biopharma Co., Ltd. (a) (c) |
16,588 | 162,209 | ||||||
| Hancom, Inc. |
6,462 | 98,170 | ||||||
| Handsome Co., Ltd. |
11,915 | 321,971 | ||||||
| Hanil Cement Co., Ltd. |
1,749 | 179,428 | ||||||
| Hanjin Heavy Industries & Construction Co., Ltd. (a) |
38,103 | 126,417 | ||||||
| Hanjin Kal Corp. (a) |
23,522 | 432,303 | ||||||
| Hanjin Shipping Co., Ltd. (a) (b) |
1,732 | — | ||||||
| Hanjin Transportation Co., Ltd. |
4,225 | 110,296 | ||||||
| Hankook Shell Oil Co., Ltd. |
303 | 103,174 | ||||||
| Hankook Tire Worldwide Co., Ltd. |
14,441 | 275,493 | ||||||
| Hanmi Pharm Co., Ltd. (a) (c) |
480 | 190,475 | ||||||
| Hanmi Semiconductor Co., Ltd. |
14,285 | 110,254 | ||||||
| Hansae Co., Ltd. (c) |
10,920 | 231,681 | ||||||
| Hansol Chemical Co., Ltd. |
8,615 | 546,829 | ||||||
| Hansol Holdings Co., Ltd. (a) |
49,278 | 256,856 | ||||||
| Hansol Paper Co., Ltd. |
30,771 | 447,319 | ||||||
| Hansol Technics Co., Ltd. (a) |
13,124 | 202,243 | ||||||
| Hanwha Investment & Securities Co., Ltd. (a) (c) |
257,880 | 631,557 | ||||||
| Hanwha Techwin Co., Ltd. (a) |
22,830 | 661,768 | ||||||
| Harim Co., Ltd. |
12,849 | 38,535 | ||||||
| Heung-A Shipping Co., Ltd. |
49,144 | 52,776 | ||||||
| Hite Jinro Co., Ltd. |
33,593 | 771,376 | ||||||
| HLB, Inc. (a) (c) |
17,257 | 302,847 | ||||||
| Homecast Co., Ltd. (a) (c) |
14,902 | 133,361 | ||||||
| HS Industries Co., Ltd. (c) |
36,876 | 309,728 | ||||||
| Huchems Fine Chemical Corp. |
21,732 | 454,430 | ||||||
| Humax Co., Ltd. |
33,510 | 271,802 | ||||||
| Humedix Co., Ltd. |
2,235 | 61,273 | ||||||
| Huons Co., Ltd. (a) |
2,381 | 138,451 | ||||||
| Huons Global Co., Ltd. |
2,155 | 81,188 | ||||||
| Hwa Shin Co., Ltd. |
3,454 | 14,656 | ||||||
| Hyundai BNG Steel Co., Ltd. |
2,627 | 26,377 | ||||||
| Hyundai Construction Equipment Co., Ltd. (a) (c) |
1,379 | 448,490 | ||||||
| Hyundai Corp. |
2,483 | 45,309 | ||||||
| Hyundai Electric & Energy System Co., Ltd. (a) (c) |
1,718 | 344,995 | ||||||
| Hyundai Elevator Co., Ltd. |
8,389 | 365,854 | ||||||
| Hyundai Engineering Plastics Co., Ltd. |
5,318 | 30,505 | ||||||
| Hyundai Greenfood Co., Ltd. |
35,628 | 482,153 | ||||||
| Hyundai Home Shopping Network Corp. |
4,104 | 433,565 | ||||||
| Hyundai Hy Communications & Network Co., Ltd. |
13,241 | 41,445 | ||||||
| Hyundai IBT Co., Ltd. (a) (c) |
47,107 | 219,217 | ||||||
| Hyundai Livart Furniture Co., Ltd. |
14,004 | 276,938 | ||||||
| Hyundai Merchant Marine Co., Ltd. (a) |
69,423 | 500,057 | ||||||
| Hyundai Mipo Dockyard Co., Ltd. (a) |
4,275 | 351,227 | ||||||
| Hyundai Rotem Co., Ltd. (a) |
25,318 | 391,259 | ||||||
| Hyundai Wia Corp. |
12,072 | 688,263 | ||||||
| i-SENS, Inc. |
2,693 | 51,845 | ||||||
| Il Dong Pharmaceutical Co., Ltd. |
7,561 | 127,408 | ||||||
| Iljin Materials Co., Ltd. (c) |
10,184 | 311,651 | ||||||
| Ilyang Pharmaceutical Co., Ltd. (c) |
8,672 | 251,373 | ||||||
| iMarketKorea, Inc. |
8,291 | 69,565 | ||||||
| InBody Co., Ltd. |
4,416 | 110,655 | ||||||
| Innocean Worldwide, Inc. |
6,023 | 351,804 | ||||||
| Innox Advanced Materials Co., Ltd. (a) |
2,571 | 177,109 | ||||||
| Inscobee, Inc. (a) |
56,828 | 78,890 | ||||||
| Interflex Co., Ltd. (a) |
6,585 | 315,064 | ||||||
| Interojo Co., Ltd. |
3,640 | 114,252 | ||||||
| Interpark Holdings Corp. |
33,626 | 125,068 | ||||||
| iNtRON Biotechnology, Inc. (a) (c) |
7,555 | 189,312 | ||||||
| IS Dongseo Co., Ltd. |
6,486 | 186,026 | ||||||
| Jayjun Cosmetic Co., Ltd. (a) (c) |
43,095 | 256,610 | ||||||
| JB Financial Group Co., Ltd. |
209,532 | 1,097,649 | ||||||
| Jeil Holdings Co., Ltd. (a) |
39,132 | 538,114 | ||||||
| Jeil Pharma Holdings, Inc. (c) |
1,491 | 42,178 | ||||||
| Jeil Pharmaceutical Co., Ltd. (a) (c) |
3,562 | 167,938 | ||||||
| Jeju Air Co., Ltd. |
5,274 | 165,769 | ||||||
| Jenax, Inc. (a) (c) |
7,408 | 183,041 | ||||||
| JoyCity Corp. (a) |
1,564 | 17,479 | ||||||
| Jusung Engineering Co., Ltd. (a) |
22,153 | 274,652 | ||||||
| JW Holdings Corp. |
27,313 | 188,390 | ||||||
| JW Pharmaceutical Corp. |
6,205 | 219,140 | ||||||
| JYP Entertainment Corp. (a) |
23,871 | 208,208 | ||||||
| KB Financial Group, Inc. |
138 | 6,759 | ||||||
See accompanying notes to financial statements.
96
Table of Contents
SPDR S&P International Small Cap ETF
SCHEDULE OF INVESTMENTS (continued)
September 30, 2017
| Security Description |
Shares |
Value |
||||||
| KC Tech Co., Ltd. |
15,332 | $ | 322,610 | |||||
| KEPCO Plant Service & Engineering Co., Ltd. |
15,634 | 565,791 | ||||||
| Kginicis Co., Ltd. |
17,361 | 171,283 | ||||||
| KGMobilians Co., Ltd. |
48,492 | 268,847 | ||||||
| KH Vatec Co., Ltd. |
6,225 | 46,469 | ||||||
| KIWOOM Securities Co., Ltd. |
7,210 | 455,759 | ||||||
| Koh Young Technology, Inc. |
4,945 | 289,270 | ||||||
| Kolao Holdings (c) |
15,984 | 70,057 | ||||||
| Kolon Corp. |
4,088 | 233,427 | ||||||
| Kolon Industries, Inc. |
9,454 | 584,401 | ||||||
| Kolon Life Science, Inc. |
2,068 | 241,584 | ||||||
| Komipharm International Co., Ltd. (a) |
14,613 | 444,635 | ||||||
| KONA I Co., Ltd. (a) |
6,302 | 53,922 | ||||||
| Korea Asset In Trust Co., Ltd. |
55,238 | 403,187 | ||||||
| Korea Electric Terminal Co., Ltd. |
2,659 | 173,653 | ||||||
| Korea Kolmar Co., Ltd. (c) |
9,311 | 616,208 | ||||||
| Korea Kolmar Holdings Co., Ltd. |
2,173 | 72,759 | ||||||
| Korea Line Corp. (a) (c) |
6,939 | 209,924 | ||||||
| Korea Petrochemical Ind Co., Ltd. |
2,689 | 582,243 | ||||||
| Korea Real Estate Investment & Trust Co., Ltd. |
54,633 | 157,886 | ||||||
| Korea United Pharm, Inc. |
7,238 | 140,292 | ||||||
| Korean Reinsurance Co. |
97,023 | 961,462 | ||||||
| Kortek Corp. |
8,255 | 97,660 | ||||||
| KT Skylife Co., Ltd. |
15,544 | 195,428 | ||||||
| Kumho Industrial Co., Ltd. |
17,655 | 147,054 | ||||||
| Kumho Tire Co., Inc. (a) (c) |
66,409 | 346,729 | ||||||
| Kwang Dong Pharmaceutical Co., Ltd. |
17,997 | 127,276 | ||||||
| KyungDong City Gas Co., Ltd. (a) |
561 | 26,107 | ||||||
| KyungDong Invest Co., Ltd. |
153 | 6,472 | ||||||
| Kyungdong Pharm Co., Ltd. |
7,176 | 119,981 | ||||||
| L&F Co., Ltd. (c) |
11,109 | 342,867 | ||||||
| Leaders Cosmetics Co., Ltd. (a) (c) |
7,660 | 77,580 | ||||||
| LEENO Industrial, Inc. |
7,117 | 304,477 | ||||||
| LF Corp. |
13,180 | 295,165 | ||||||
| LG Hausys, Ltd. |
4,048 | 315,259 | ||||||
| LG International Corp. |
39,725 | 946,866 | ||||||
| LIG Nex1 Co., Ltd. |
5,479 | 348,253 | ||||||
| Lock&Lock Co., Ltd. |
3,537 | 55,278 | ||||||
| Loen Entertainment, Inc. |
4,197 | 320,267 | ||||||
| Lotte Chilsung Beverage Co., Ltd. |
420 | 496,512 | ||||||
| LOTTE Fine Chemical Co., Ltd. |
15,320 | 553,090 | ||||||
| Lotte Food Co., Ltd. |
781 | 414,588 | ||||||
| LOTTE Himart Co., Ltd. |
4,398 | 252,280 | ||||||
| LS Industrial Systems Co., Ltd. |
11,773 | 556,091 | ||||||
| Lumens Co., Ltd. (a) |
28,851 | 82,496 | ||||||
| Lutronic Corp. |
6,385 | 61,043 | ||||||
| Macrogen, Inc. (a) |
4,413 | 91,893 | ||||||
| Maeil Dairies Co., Ltd. (a) |
943 | 56,151 | ||||||
| Maeil Holdings Co., Ltd. |
708 | 11,250 | ||||||
| Magnachip Semiconductor Corp. (a) (c) |
25,148 | 285,430 | ||||||
| Medipost Co., Ltd. (a) |
4,488 | 331,501 | ||||||
| Meritz Financial Group, Inc. |
34,192 | 491,080 | ||||||
| Minwise Co., Ltd. (c) |
40,456 | 812,405 | ||||||
| Mirae Corp. (a) |
236,744 | 47,128 | ||||||
| Modetour Network, Inc. |
7,459 | 157,926 | ||||||
| Muhak Co., Ltd. |
6,343 | 100,516 | ||||||
| Naturalendo Tech Co., Ltd. (a) (c) |
11,183 | 236,285 | ||||||
| Naturecell Co., Ltd. (a) (c) |
38,346 | 194,852 | ||||||
| Neowiz (a) (c) |
12,190 | 113,348 | ||||||
| NEPES Corp. (a) |
10,648 | 90,829 | ||||||
| Nexen Tire Corp. |
27,783 | 321,408 | ||||||
| NHN Entertainment Corp. (a) |
11,161 | 665,558 | ||||||
| NHN KCP Corp. (a) |
7,149 | 95,811 | ||||||
| NICE Holdings Co., Ltd. |
5,620 | 85,378 | ||||||
| NongShim Co., Ltd. |
2,941 | 880,746 | ||||||
| OCI Co., Ltd. (c) |
8,039 | 719,429 | ||||||
| Orion Holdings, Corp. |
12,778 | 253,251 | ||||||
| Osstem Implant Co., Ltd. (a) |
7,948 | 484,368 | ||||||
| Paradise Co., Ltd. (c) |
25,912 | 342,748 | ||||||
| Partron Co., Ltd. |
25,439 | 206,115 | ||||||
| Paru Co., Ltd. (a) (c) |
103,246 | 353,814 | ||||||
| Peptron, Inc. (a) |
7,216 | 291,387 | ||||||
| Pharmicell Co., Ltd. (a) |
63,211 | 216,066 | ||||||
| Poongsan Corp. |
19,508 | 873,759 | ||||||
| POSCO Chemtech Co., Ltd. |
13,087 | 338,787 | ||||||
| Posco ICT Co., Ltd. |
8,203 | 47,842 | ||||||
| Power Logics Co., Ltd. (a) |
16,051 | 84,084 | ||||||
| PSK, Inc. |
15,366 | 318,630 | ||||||
| Qurient Co., Ltd. (a) |
6,619 | 143,320 | ||||||
| Redrover Co., Ltd. (a) (c) |
23,075 | 61,850 | ||||||
| S&T Dynamics Co., Ltd. (a) |
7,654 | 54,196 | ||||||
| S&T Motiv Co., Ltd. |
10,375 | 434,802 | ||||||
| Sajo Industries Co., Ltd. |
1,270 | 74,292 | ||||||
| Sam Yung Trading Co., Ltd. |
5,845 | 88,031 | ||||||
| Samchully Co., Ltd. |
510 | 44,973 | ||||||
| Samjin Pharmaceutical Co., Ltd. |
10,535 | 300,317 | ||||||
| Samkwang Glass |
1,011 | 41,443 | ||||||
| Samsung Engineering Co., Ltd. (a) |
96,541 | 927,185 | ||||||
| Samsung Pharmaceutical Co., Ltd. (a) |
37,192 | 113,328 | ||||||
| Samyang Holdings Corp. |
4,123 | 318,580 | ||||||
| Seah Besteel Corp. |
11,764 | 323,026 | ||||||
| SeAH Steel Corp. |
690 | 56,749 | ||||||
| Sebang Co., Ltd. |
2,758 | 34,796 | ||||||
| Seegene, Inc. (a) |
14,379 | 345,242 | ||||||
| Seobu T&D (c) |
8,054 | 92,118 | ||||||
| Seohan Co., Ltd. |
155,071 | 284,323 | ||||||
| Seoul Semiconductor Co., Ltd. |
24,737 | 542,104 | ||||||
| SEOWONINTECH Co., Ltd. |
7,079 | 66,751 | ||||||
| Seoyon Co., Ltd. |
4,547 | 29,537 | ||||||
| Seoyon E-Hwa Co., Ltd. |
3,623 | 32,898 | ||||||
| SFA Engineering Corp. |
32,187 | 1,162,031 | ||||||
| Shinsegae Information & Communication Co., Ltd. |
7,452 | 489,925 | ||||||
| Shinsegae, Inc. |
3,408 | 580,224 | ||||||
| Silicon Works Co., Ltd. |
5,212 | 201,135 | ||||||
| SillaJen, Inc. (a) (c) |
32,977 | 1,287,006 | ||||||
| Sindoh Co., Ltd. |
1,322 | 73,640 | ||||||
| SK Bioland Co., Ltd. |
4,094 | 55,047 | ||||||
| SK Chemicals Co., Ltd. |
8,461 | 482,388 | ||||||
| SK Gas, Ltd. |
3,704 | 304,961 | ||||||
| SK Materials Co., Ltd. |
3,089 | 476,289 | ||||||
| SK Networks Co., Ltd. |
73,463 | 462,451 | ||||||
| SK Securities Co., Ltd. (a) |
248,610 | 251,790 | ||||||
| SKC Co., Ltd. |
14,719 | 530,108 | ||||||
| SKCKOLONPI, Inc. |
9,224 | 273,011 | ||||||
See accompanying notes to financial statements.
97
Table of Contents
SPDR S&P International Small Cap ETF
SCHEDULE OF INVESTMENTS (continued)
September 30, 2017
| Security Description |
Shares |
Value |
||||||
| SM Culture & Contents Co., Ltd. (a) |
106,570 | $ | 265,181 | |||||
| SM Entertainment Co. (a) (c) |
9,521 | 240,238 | ||||||
| Songwon Industrial Co., Ltd. |
15,780 | 252,816 | ||||||
| Soulbrain Co., Ltd. |
7,898 | 468,908 | ||||||
| SPC Samlip Co., Ltd. |
1,678 | 189,725 | ||||||
| Suheung Co., Ltd. |
1,571 | 45,607 | ||||||
| SundayToz Corp. (a) |
3,574 | 59,913 | ||||||
| Sungshin Cement Co., Ltd. (a) |
7,449 | 34,470 | ||||||
| Sungwoo Hitech Co., Ltd. |
29,426 | 155,949 | ||||||
| Suprema, Inc. (a) |
1,786 | 39,997 | ||||||
| Synopex, Inc. (a) |
31,168 | 82,046 | ||||||
| Taekwang Industrial Co., Ltd. |
548 | 536,350 | ||||||
| Taeyoung Engineering & Construction Co., Ltd. (a) |
46,229 | 340,254 | ||||||
| Taihan Electric Wire Co., Ltd. (a) |
147,366 | 160,187 | ||||||
| TBH Global Co., Ltd. (a) |
10,573 | 79,573 | ||||||
| Tera Semicon Co., Ltd. |
5,591 | 146,200 | ||||||
| TES Co., Ltd. |
17,351 | 482,498 | ||||||
| Tongyang Life Insurance Co., Ltd. |
8,109 | 54,161 | ||||||
| Tongyang, Inc. |
139,458 | 223,430 | ||||||
| Toptec Co., Ltd. (c) |
20,521 | 502,566 | ||||||
| Tovis Co., Ltd. |
7,797 | 54,256 | ||||||
| Value Added Technology Co., Ltd. |
3,788 | 90,289 | ||||||
| Viatron Technologies, Inc. (c) |
11,788 | 195,549 | ||||||
| Vieworks Co., Ltd. |
6,914 | 236,332 | ||||||
| ViroMed Co., Ltd. (a) (c) |
8,151 | 834,066 | ||||||
| Wave Electronics Co., Ltd. (a) |
6,818 | 151,200 | ||||||
| Webzen, Inc. (a) |
13,218 | 287,360 | ||||||
| WeMade Entertainment Co., Ltd. |
5,868 | 168,557 | ||||||
| Whanin Pharmaceutical Co., Ltd. |
9,055 | 169,186 | ||||||
| Wins Co., Ltd. |
7,047 | 75,678 | ||||||
| WiSoL Co., Ltd. |
6,196 | 77,359 | ||||||
| Wonik Holdings Co., Ltd. (a) |
109,333 | 721,664 | ||||||
| Wonik IPS Co., Ltd. (a) |
17,685 | 526,528 | ||||||
| Woojeon Co., Ltd. (a) |
7,674 | 268 | ||||||
| Woongjin Thinkbig Co., Ltd. (a) |
8,538 | 51,734 | ||||||
| YG Entertainment, Inc. |
7,147 | 169,728 | ||||||
| Youngone Corp. |
10,683 | 304,069 | ||||||
| Yuanta Securities Korea Co., Ltd. (a) (c) |
78,369 | 228,535 | ||||||
| Yungjin Pharmaceutical Co., Ltd. (a) (c) |
55,762 | 471,763 | ||||||
|
|
|
|||||||
| 83,685,687 | ||||||||
|
|
|
|||||||
| SPAIN — 1.2% |
| |||||||
| Abengoa SA Class B (a) |
12,838,165 | 182,127 | ||||||
| Almirall SA |
35,889 | 365,305 | ||||||
| Applus Services SA |
56,870 | 712,656 | ||||||
| Axiare Patrimonio SOCIMI SA |
33,216 | 678,943 | ||||||
| Codere SA (a) |
628,788 | 267,607 | ||||||
| Construcciones y Auxiliar de Ferrocarriles SA |
23,766 | 961,731 | ||||||
| Ence Energia y Celulosa SA |
54,742 | 284,750 | ||||||
| Ercros SA (c) |
71,762 | 232,453 | ||||||
| Euskaltel SA (d) |
33,260 | 299,382 | ||||||
| Faes Farma SA |
279,923 | 936,517 | ||||||
| Fluidra SA |
37,268 | 392,779 | ||||||
| Hispania Activos Inmobiliarios SOCIMI SA |
48,982 | 883,074 | ||||||
| Lar Espana Real Estate Socimi SA |
26,517 | 257,684 | ||||||
| Let’s GOWEX SA (a) (b) (c) |
9,561 | — | ||||||
| Liberbank SA (a) |
224,965 | 207,710 | ||||||
| Neinor Homes SA (a) (d) |
25,560 | 546,928 | ||||||
| Obrascon Huarte Lain SA (a) (c) |
51,015 | 184,307 | ||||||
| Papeles y Cartones de Europa SA |
27,690 | 260,244 | ||||||
| Parques Reunidos Servicios Centrales SAU (c) (d) |
16,215 | 245,368 | ||||||
| Pharma Mar SA (a) |
185,209 | 720,359 | ||||||
| Promotora de Informaciones SA Class A (a) (c) |
47,726 | 186,756 | ||||||
| Sacyr SA (a) (c) |
126,774 | 332,716 | ||||||
| Saeta Yield SA |
14,558 | 166,253 | ||||||
| Talgo SA (c) (d) |
39,614 | 220,483 | ||||||
| Tecnicas Reunidas SA (c) |
20,912 | 661,194 | ||||||
| Telepizza Group SA (a) (d) |
34,773 | 199,788 | ||||||
| Tubacex SA (a) (c) |
168,877 | 639,866 | ||||||
|
|
|
|||||||
| 11,026,980 | ||||||||
|
|
|
|||||||
| SWEDEN — 3.3% |
| |||||||
| AcadeMedia AB (a) (d) |
28,084 | 223,644 | ||||||
| Acando AB |
92,731 | 334,008 | ||||||
| AF AB Class B |
31,245 | 728,075 | ||||||
| Alimak Group AB (d) |
21,187 | 385,461 | ||||||
| Ambea AB (a) (d) |
19,209 | 201,801 | ||||||
| Attendo AB (d) |
51,386 | 590,202 | ||||||
| Avanza Bank Holding AB |
10,659 | 445,564 | ||||||
| Axactor AB (a) |
750,034 | 273,243 | ||||||
| Bergman & Beving AB |
14,083 | 188,496 | ||||||
| Betsson AB (a) |
53,457 | 486,279 | ||||||
| Bilia AB Class A |
27,747 | 305,945 | ||||||
| BioGaia AB Class B |
6,626 | 245,968 | ||||||
| Biotage AB |
38,395 | 285,763 | ||||||
| Bonava AB Class B |
40,062 | 646,894 | ||||||
| Boozt AB (a) (c) (d) |
21,063 | 191,603 | ||||||
| Bravida Holding AB (d) |
86,830 | 634,549 | ||||||
| Bufab AB |
24,373 | 318,758 | ||||||
| Bure Equity AB |
23,664 | 324,706 | ||||||
| Byggmax Group AB (c) |
36,524 | 306,516 | ||||||
| Capio AB (d) |
74,649 | 436,242 | ||||||
| Cellavision AB |
19,947 | 422,774 | ||||||
| Clas Ohlson AB Class B |
20,378 | 376,984 | ||||||
| Cloetta AB Class B |
115,740 | 397,033 | ||||||
| CLX Communications AB (a) (d) |
18,365 | 260,996 | ||||||
| Coor Service Management Holding AB (d) |
45,960 | 326,582 | ||||||
| D Carnegie & Co. AB (a) |
14,261 | 200,051 | ||||||
| Duni AB |
17,727 | 277,991 | ||||||
| Dustin Group AB (d) |
34,108 | 287,286 | ||||||
| Eltel AB (a) (c) (d) |
71,407 | 229,206 | ||||||
| Fingerprint Cards AB Class B (a) (c) |
176,028 | 491,917 | ||||||
| G5 Entertainment AB |
4,494 | 174,258 | ||||||
| Granges AB |
39,000 | 445,552 | ||||||
| Haldex AB (a) |
46,513 | 574,122 | ||||||
| Hansa Medical AB (a) |
14,819 | 390,339 | ||||||
| Hemfosa Fastigheter AB |
59,955 | 760,240 | ||||||
| HIQ International AB (a) |
33,833 | 252,845 | ||||||
| Hoist Finance AB (c) (d) |
27,317 | 281,123 | ||||||
| Infant Bacterial Theraoeutic AB (a) |
15 | 244 | ||||||
See accompanying notes to financial statements.
98
Table of Contents
SPDR S&P International Small Cap ETF
SCHEDULE OF INVESTMENTS (continued)
September 30, 2017
| Security Description |
Shares |
Value |
||||||
| Investment AB Oresund |
16,351 | $ | 272,438 | |||||
| INVISIO Communications AB |
29,279 | 299,521 | ||||||
| Inwido AB |
32,573 | 414,029 | ||||||
| KappAhl AB |
39,359 | 247,128 | ||||||
| Karo Pharma AB |
65,214 | 325,976 | ||||||
| Klovern AB Class B |
199,541 | 265,245 | ||||||
| KNOW IT AB |
24,682 | 394,617 | ||||||
| Kungsleden AB |
85,774 | 589,001 | ||||||
| LeoVegas AB (d) |
72,295 | 611,142 | ||||||
| Lindab International AB |
21,896 | 231,773 | ||||||
| Medicover AB (a) |
38,167 | 295,756 | ||||||
| Medivir AB Class B (a) |
9,095 | 79,670 | ||||||
| Mekonomen AB |
10,003 | 226,106 | ||||||
| Momentum Group AB Class B (a) |
20,865 | 222,394 | ||||||
| Mycronic AB (c) |
32,113 | 439,656 | ||||||
| New Wave Group AB Class B |
99,875 | 709,691 | ||||||
| Nobia AB |
55,516 | 552,280 | ||||||
| Nobina AB (d) |
51,347 | 299,438 | ||||||
| Nolato AB Class B |
12,715 | 612,201 | ||||||
| Nordax Group AB (d) |
74,136 | 435,969 | ||||||
| Opus Group AB (c) |
90,668 | 69,425 | ||||||
| Qliro Group AB (a) |
100,325 | 237,220 | ||||||
| Ratos AB Class B (c) |
58,317 | 284,785 | ||||||
| RaySearch Laboratories AB (a) (c) |
14,882 | 316,334 | ||||||
| Recipharm AB Class B (c) |
10,718 | 126,714 | ||||||
| Sagax AB Class D |
30 | 113 | ||||||
| SAS AB (a) (c) |
91,774 | 293,457 | ||||||
| Scandi Standard AB |
30,480 | 223,120 | ||||||
| Scandic Hotels Group AB (d) |
32,337 | 442,723 | ||||||
| SkiStar AB |
11,364 | 264,527 | ||||||
| Starbreeze AB (a) (c) |
118,826 | 165,231 | ||||||
| Tethys Oil AB |
32,763 | 249,866 | ||||||
| Thule Group AB (d) |
29,020 | 622,186 | ||||||
| Tobii AB (a) (c) |
41,605 | 249,762 | ||||||
| Troax Group AB |
6,618 | 236,752 | ||||||
| Vitrolife AB |
8,909 | 721,465 | ||||||
| Wihlborgs Fastigheter AB |
129,755 | 3,166,637 | ||||||
|
|
|
|||||||
| 28,897,608 | ||||||||
|
|
|
|||||||
| SWITZERLAND — 2.3% |
| |||||||
| APG SGA SA |
312 | 130,188 | ||||||
| Arbonia AG (a) (c) |
21,236 | 379,685 | ||||||
| Ascom Holding AG |
21,988 | 484,027 | ||||||
| Autoneum Holding AG |
1,486 | 415,807 | ||||||
| Bachem Holding AG Class B |
3,790 | 455,145 | ||||||
| Basilea Pharmaceutica, Ltd. (a) |
9,049 | 736,938 | ||||||
| Bell Food Group AG |
859 | 399,494 | ||||||
| Bobst Group SA |
2,892 | 318,012 | ||||||
| Bossard Holding AG Class A |
2,094 | 484,979 | ||||||
| Burckhardt Compression Holding AG |
1,445 | 452,122 | ||||||
| Burkhalter Holding AG |
2,839 | 362,357 | ||||||
| Comet Holding AG (a) |
3,553 | 526,561 | ||||||
| Evolva Holding SA (a) |
224,290 | 92,720 | ||||||
| Gurit Holding AG (a) |
246 | 282,458 | ||||||
| HBM Healthcare Investments AG Class A (a) |
3,180 | 380,575 | ||||||
| HOCHDORF Holding AG (a) (c) |
914 | 259,058 | ||||||
| Huber + Suhner AG (c) |
6,564 | 402,618 | ||||||
| Implenia AG |
8,622 | 570,731 | ||||||
| Inficon Holding AG (a) |
983 | 639,519 | ||||||
| Interroll Holding AG |
424 | 611,724 | ||||||
| Intershop Holding AG |
263 | 130,467 | ||||||
| Kardex AG (a) |
4,249 | 506,314 | ||||||
| Komax Holding AG |
2,304 | 663,745 | ||||||
| Kudelski SA (c) |
53,277 | 666,238 | ||||||
| LEM Holding SA |
283 | 362,378 | ||||||
| Leonteq AG (a) |
3,809 | 233,437 | ||||||
| Metall Zug AG |
63 | 255,880 | ||||||
| Meyer Burger Technology AG (a) (c) |
191,346 | 266,967 | ||||||
| Mobilezone Holding AG |
14,962 | 188,649 | ||||||
| Mobimo Holding AG (a) |
3,232 | 873,468 | ||||||
| Newron Pharmaceuticals SpA (a) (c) |
4,487 | 68,863 | ||||||
| Orior AG |
6,003 | 465,301 | ||||||
| Phoenix Mecano AG |
470 | 270,070 | ||||||
| Resurs Holding AB (d) |
53,070 | 374,504 | ||||||
| Rieter Holding AG (a) |
1,530 | 325,734 | ||||||
| Santhera Pharmaceutical Holding AG (a) (c) |
2,493 | 101,127 | ||||||
| Schmolz + Bickenbach AG (a) |
192,799 | 177,337 | ||||||
| Schweiter Technologies AG |
344 | 441,554 | ||||||
| Siegfried Holding AG (a) |
1,813 | 597,244 | ||||||
| Swissquote Group Holding SA |
5,758 | 216,312 | ||||||
| u-blox Holding AG (a) |
2,981 | 588,744 | ||||||
| Valiant Holding AG |
6,899 | 750,077 | ||||||
| Valora Holding AG |
6,329 | 2,217,374 | ||||||
| Vaudoise Assurances Holding SA |
466 | 252,120 | ||||||
| Vetropack Holding AG |
126 | 245,723 | ||||||
| Ypsomed Holding AG (a) |
1,931 | 298,950 | ||||||
| Zehnder Group AG (c) |
2,678 | 94,101 | ||||||
| Zur Rose Group AG (a) |
2,703 | 355,334 | ||||||
|
|
|
|||||||
| 20,372,730 | ||||||||
|
|
|
|||||||
| UNITED ARAB EMIRATES — 0.0% (g) |
| |||||||
| Lamprell PLC (a) |
121,346 | 145,709 | ||||||
|
|
|
|||||||
| UNITED KINGDOM — 9.2% |
| |||||||
| 888 Holdings PLC |
81,080 | 279,350 | ||||||
| A.G.Barr PLC |
48,075 | 398,609 | ||||||
| AA PLC |
357,080 | 812,034 | ||||||
| Acacia Mining PLC |
87,326 | 227,644 | ||||||
| Aldermore Group PLC (a) |
76,377 | 236,094 | ||||||
| Allied Minds PLC (a) |
110,221 | 199,635 | ||||||
| Anglo Pacific Group PLC |
129,122 | 232,570 | ||||||
| AO World PLC (a) (c) |
88,701 | 132,691 | ||||||
| Arrow Global Group PLC |
92,304 | 529,414 | ||||||
| Ascential PLC |
200,377 | 923,451 | ||||||
| Assura PLC |
930,380 | 782,649 | ||||||
| AVEVA Group PLC |
35,202 | 1,150,020 | ||||||
| Avon Rubber PLC |
17,705 | 222,693 | ||||||
| Biffa PLC (d) |
146,375 | 461,011 | ||||||
| Big Yellow Group PLC REIT |
60,556 | 615,024 | ||||||
| Bovis Homes Group PLC |
73,585 | 1,080,055 | ||||||
| Brewin Dolphin Holdings PLC |
114,066 | 534,251 | ||||||
| Cairn Energy PLC (a) |
260,813 | 670,096 | ||||||
| Capital & Regional PLC REIT |
347,933 | 264,911 | ||||||
| Card Factory PLC |
103,846 | 429,260 | ||||||
| Carillion PLC (c) |
159,093 | 109,392 | ||||||
| Chemring Group PLC |
287,849 | 695,147 | ||||||
| Cineworld Group PLC |
6 | 55 | ||||||
See accompanying notes to financial statements.
99
Table of Contents
SPDR S&P International Small Cap ETF
SCHEDULE OF INVESTMENTS (continued)
September 30, 2017
| Security Description |
Shares |
Value |
||||||
| Civitas Social Housing PLC REIT |
135,435 | $ | 202,603 | |||||
| Clarkson PLC |
12,624 | 484,567 | ||||||
| CMC Markets PLC (d) |
38,802 | 84,335 | ||||||
| Coats Group PLC |
597,528 | 626,909 | ||||||
| Computacenter PLC |
33,801 | 447,596 | ||||||
| Connect Group PLC |
73,432 | 99,505 | ||||||
| Costain Group PLC |
53,921 | 324,278 | ||||||
| Countrywide PLC (a) |
70,680 | 102,414 | ||||||
| Cranswick PLC |
22,517 | 891,797 | ||||||
| Crest Nicholson Holdings PLC |
140,723 | 1,044,069 | ||||||
| Dairy Crest Group PLC (c) |
66,629 | 549,319 | ||||||
| De La Rue PLC |
38,860 | 338,105 | ||||||
| Debenhams PLC |
480,289 | 318,968 | ||||||
| Devro PLC |
64,529 | 206,266 | ||||||
| DFS Furniture PLC |
79,674 | 235,168 | ||||||
| Dialight PLC (a) |
12,925 | 136,993 | ||||||
| Dignity PLC |
25,658 | 793,819 | ||||||
| Diploma PLC |
49,944 | 712,958 | ||||||
| Domino’s Pizza Group PLC |
276,538 | 1,150,895 | ||||||
| Drax Group PLC |
216,624 | 904,742 | ||||||
| Dunelm Group PLC |
60,209 | 571,514 | ||||||
| EI Group PLC (a) |
449,492 | 830,716 | ||||||
| Elementis PLC |
220,123 | 800,043 | ||||||
| Empiric Student Property PLC |
377,753 | 513,147 | ||||||
| EnQuest PLC (a) |
446,245 | 166,141 | ||||||
| Equiniti Group PLC (d) |
169,548 | 685,152 | ||||||
| Essentra PLC |
111,482 | 826,373 | ||||||
| esure Group PLC |
148,401 | 562,065 | ||||||
| F&C Commercial Property Trust, Ltd. |
292,796 | 585,709 | ||||||
| Fenner PLC |
171,993 | 778,219 | ||||||
| Fidessa Group PLC |
19,738 | 595,039 | ||||||
| Firstgroup PLC (a) |
542,492 | 851,566 | ||||||
| Forterra PLC (d) |
105,890 | 395,302 | ||||||
| Foxtons Group PLC (c) |
99,043 | 90,027 | ||||||
| Galliford Try PLC |
45,578 | 827,356 | ||||||
| Games Workshop Group PLC |
12,865 | 339,856 | ||||||
| Genel Energy PLC (a) |
83,267 | 148,023 | ||||||
| Genus PLC |
34,927 | 983,119 | ||||||
| Go-Ahead Group PLC |
18,236 | 416,662 | ||||||
| Gocompare.Com Group PLC |
173,543 | 243,311 | ||||||
| Grainger PLC |
177,498 | 638,692 | ||||||
| Greene King PLC |
6 | 44 | ||||||
| Greggs PLC |
53,180 | 889,721 | ||||||
| Gulf Keystone Petroleum, Ltd. (a) |
165,709 | 213,430 | ||||||
| Halfords Group PLC |
89,248 | 419,687 | ||||||
| Hansteen Holdings PLC |
310,936 | 575,691 | ||||||
| Helical Bar PLC |
42,653 | 171,962 | ||||||
| Hill & Smith Holdings PLC |
39,276 | 666,060 | ||||||
| Hunting PLC (a) |
67,299 | 427,892 | ||||||
| Huntsworth PLC |
1,810 | 1,785 | ||||||
| Ibstock PLC (d) |
214,885 | 656,460 | ||||||
| Imagination Technologies Group PLC (a) |
121,677 | 274,256 | ||||||
| Indivior PLC (a) |
24 | 109 | ||||||
| Intelligent Energy Holdings PLC (a) |
609 | 13 | ||||||
| International Personal Finance PLC |
113,015 | 318,416 | ||||||
| Interserve PLC |
97,764 | 155,103 | ||||||
| ITE Group PLC |
304,575 | 734,518 | ||||||
| J D Wetherspoon PLC (c) |
135,589 | 2,283,008 | ||||||
| Jackpotjoy PLC (a) (c) |
42,589 | 462,259 | ||||||
| JD Sports Fashion PLC |
9 | 45 | ||||||
| Jimmy Choo PLC (a) |
66,210 | 203,866 | ||||||
| John Laing Group PLC (d) |
190,317 | 728,226 | ||||||
| John Menzies PLC |
29,171 | 281,593 | ||||||
| Johnston Press PLC (a) |
360 | 65 | ||||||
| Just Group PLC |
364,484 | 718,356 | ||||||
| KCOM Group PLC |
235,300 | 312,533 | ||||||
| Keller Group PLC |
57,949 | 636,361 | ||||||
| Kier Group PLC |
54,879 | 856,298 | ||||||
| Laird PLC |
368,262 | 705,297 | ||||||
| Lancashire Holdings, Ltd. |
105,993 | 949,222 | ||||||
| LondonMetric Property PLC |
323,092 | 720,438 | ||||||
| Lookers PLC |
135,102 | 217,511 | ||||||
| Luxfer Holdings PLC ADR |
9,253 | 115,200 | ||||||
| Marshalls PLC |
107,070 | 626,316 | ||||||
| Marston’s PLC |
418,482 | 610,303 | ||||||
| McBride PLC (a) |
152,082 | 429,506 | ||||||
| McCarthy & Stone PLC (d) |
238,501 | 478,377 | ||||||
| Medica Group PLC |
94,216 | 250,282 | ||||||
| Mitchells & Butlers PLC |
116,001 | 392,194 | ||||||
| Mitie Group PLC |
266,366 | 914,510 | ||||||
| Moneysupermarket.com Group PLC |
27 | 115 | ||||||
| Morgan Advanced Materials PLC |
184,764 | 771,181 | ||||||
| Mothercare PLC (a) |
77,676 | 104,214 | ||||||
| N Brown Group PLC |
68,011 | 320,459 | ||||||
| NCC Group PLC |
132,778 | 385,677 | ||||||
| NewRiver REIT PLC |
146,064 | 663,739 | ||||||
| NMC Health PLC |
3 | 111 | ||||||
| Northgate PLC |
50,268 | 292,530 | ||||||
| Novae Group PLC |
51,245 | 490,895 | ||||||
| On the Beach Group PLC (d) |
37,086 | 196,538 | ||||||
| OneSavings Bank PLC |
62,159 | 336,168 | ||||||
| Ophir Energy PLC (a) |
279,887 | 272,245 | ||||||
| Oxford Biomedica PLC (a) |
1,741,533 | 218,699 | ||||||
| Oxford Instruments PLC |
24,371 | 317,001 | ||||||
| Pagegroup PLC |
166,589 | 1,112,827 | ||||||
| Paragon Banking Group PLC |
135,039 | 796,083 | ||||||
| Pendragon PLC |
540,815 | 232,187 | ||||||
| Petrofac, Ltd. |
146,607 | 885,129 | ||||||
| Petropavlovsk PLC (a) |
1,051,956 | 112,909 | ||||||
| Pets at Home Group PLC (c) |
158,058 | 453,169 | ||||||
| Photo-Me International PLC |
108,614 | 253,556 | ||||||
| Picton Property Income, Ltd. |
180,580 | 206,540 | ||||||
| Polypipe Group PLC |
117,517 | 664,723 | ||||||
| Premier Foods PLC (a) |
465,819 | 262,486 | ||||||
| Premier Oil PLC (a) (c) |
233,294 | 209,709 | ||||||
| Primary Health Properties PLC |
301,526 | 494,553 | ||||||
| Provident Financial PLC (c) |
82,298 | 916,997 | ||||||
| PZ Cussons PLC |
111,760 | 479,217 | ||||||
| QinetiQ Group PLC |
290,496 | 962,278 | ||||||
| Rank Group PLC |
77,032 | 229,437 | ||||||
| Rathbone Brothers PLC |
25,742 | 895,883 | ||||||
| Redefine International PLC |
591,170 | 301,394 | ||||||
| Regional REIT, Ltd. REIT (d) |
147,269 | 207,463 | ||||||
| Renewi PLC |
578,879 | 790,244 | ||||||
| Renishaw PLC |
3 | 192 | ||||||
| Restaurant Group PLC |
88,760 | 359,517 | ||||||
| RPC Group PLC |
12 | 159 | ||||||
See accompanying notes to financial statements.
100
Table of Contents
SPDR S&P International Small Cap ETF
SCHEDULE OF INVESTMENTS (continued)
September 30, 2017
| Security Description |
Shares |
Value |
||||||
| RPS Group PLC |
209,749 | $ | 811,867 | |||||
| Safestore Holdings PLC |
81,758 | 479,019 | ||||||
| Savills PLC |
57,909 | 723,716 | ||||||
| Schroder Real Estate Investment Trust, Ltd. |
252,013 | 207,940 | ||||||
| Senior PLC |
435,156 | 1,610,779 | ||||||
| Serco Group PLC (a) |
579,218 | 896,005 | ||||||
| SIG PLC |
324,948 | 775,584 | ||||||
| Sirius Minerals PLC (a) |
2,424,267 | 828,741 | ||||||
| Soco International PLC |
103,767 | 160,798 | ||||||
| Softcat PLC |
60,064 | 338,859 | ||||||
| Spire Healthcare Group PLC (d) |
164,043 | 494,978 | ||||||
| SSP Group PLC |
15 | 108 | ||||||
| ST Modwen Properties PLC |
73,907 | 370,650 | ||||||
| Stagecoach Group PLC |
150,976 | 345,765 | ||||||
| Stobart Group, Ltd. |
124,951 | 452,965 | ||||||
| Stock Spirits Group PLC |
92,973 | 299,369 | ||||||
| SuperGroup PLC |
24,839 | 566,196 | ||||||
| SVG Capital PLC (a) (e) |
16,733 | 15,715 | ||||||
| Ted Baker PLC |
11,100 | 394,646 | ||||||
| Telecom Plus PLC |
31,308 | 456,167 | ||||||
| Topps Tiles PLC |
109,835 | 111,257 | ||||||
| TORM PLC |
11,887 | 119,912 | ||||||
| Trinity Mirror PLC |
109,134 | 124,823 | ||||||
| Tyman PLC |
119,210 | 515,800 | ||||||
| UK Commercial Property Trust, Ltd. |
166,965 | 206,088 | ||||||
| Ultra Electronics Holdings PLC |
39,745 | 958,763 | ||||||
| Vectura Group PLC (a) |
292,678 | 417,802 | ||||||
| Virgin Money Holdings UK PLC |
165,529 | 636,265 | ||||||
| Wincanton PLC |
216,554 | 684,947 | ||||||
| Workspace Group PLC |
46,402 | 552,515 | ||||||
| ZPG PLC (d) |
146,207 | 709,506 | ||||||
|
|
|
|||||||
| 81,350,076 | ||||||||
|
|
|
|||||||
| UNITED STATES — 1.0% |
| |||||||
| Adaptimmune Therapeutics PLC ADR (a) |
36,400 | 298,116 | ||||||
| Alacer Gold Corp. (a) |
118,933 | 207,311 | ||||||
| Argonaut Gold, Inc. (a) |
69,313 | 135,783 | ||||||
| Avadel Pharmaceuticals PLC ADR (a) (c) |
21,565 | 226,432 | ||||||
| Boart Longyear, Ltd. (a) |
36 | 1 | ||||||
| Civeo Corp. (a) |
99,900 | 284,715 | ||||||
| DHT Holdings, Inc. |
63,221 | 251,619 | ||||||
| Eros International PLC (a) (c) |
16,484 | 235,721 | ||||||
| Ferroglobe Representation & Warranty Insurance Trust (a) (b) |
19,857 | — | ||||||
| Globant SA (a) |
12,439 | 498,431 | ||||||
| Golden Star Resources, Ltd. (a) |
264,300 | 203,009 | ||||||
| IMAX Corp. (a) |
36,800 | 833,520 | ||||||
| MDC Partners, Inc. Class A |
31,659 | 348,249 | ||||||
| Mimecast, Ltd. (a) |
19,200 | 545,664 | ||||||
| Mitel Networks Corp. (a) |
39,895 | 334,719 | ||||||
| Nordic American Tankers, Ltd. (c) |
49,616 | 264,949 | ||||||
| OM Asset Management PLC |
61,200 | 913,104 | ||||||
| Ormat Technologies, Inc. |
1 | 48 | ||||||
| Oxford Immunotec Global PLC (a) (c) |
19,044 | 319,939 | ||||||
| REC Silicon ASA (a) |
942,269 | 120,147 | ||||||
| Ship Finance International, Ltd. (c) |
35,320 | 512,140 | ||||||
| Stratasys, Ltd. (a) |
32,405 | 749,204 | ||||||
| Tahoe Resources, Inc. |
169,200 | 887,500 | ||||||
| Tucows, Inc. Class A (a) (c) |
7,900 | 462,545 | ||||||
| Vail Resorts, Inc. |
24 | 5,475 | ||||||
|
|
|
|||||||
| 8,638,341 | ||||||||
|
|
|
|||||||
| TOTAL COMMON STOCKS |
882,832,014 | |||||||
|
|
|
|||||||
| WARRANTS — 0.0% (g) |
||||||||
| AUSTRALIA — 0.0% (g) |
||||||||
| Westgold Resources, Ltd. (expiring 6/30/19) (a) (c) |
19,338 | 4,856 | ||||||
|
|
|
|||||||
| SINGAPORE — 0.0% (g) |
||||||||
| Ezion Holdings, Ltd. |
115,305 | 2,547 | ||||||
|
|
|
|||||||
| UNITED STATES — 0.0% (g) |
| |||||||
| Boart Longyear, Ltd. |
50 | — | ||||||
|
|
|
|||||||
| TOTAL WARRANTS |
7,403 | |||||||
|
|
|
|||||||
| RIGHTS — 0.0% (g) |
||||||||
| AUSTRALIA — 0.0% (g) |
||||||||
| Syrah Resources, Ltd. |
8,908 | — | ||||||
|
|
|
|||||||
| SINGAPORE — 0.0% (g) |
||||||||
| Manulife US Real Estate Investment Trust (expiring 10/16/17) (a) (e) |
133,537 | 29,378 | ||||||
|
|
|
|||||||
| SOUTH KOREA — 0.0% (g) |
||||||||
| Able C&C Co., Ltd. |
3,953 | 8,628 | ||||||
| Hyundai Construction Equipment Co., Ltd. (expiring 11/14/17) (a) (e) |
431 | 36,878 | ||||||
| Hyundai Electric & Energy System Co., Ltd. (expiring 11/11/17) (a) (e) |
533 | 20,476 | ||||||
| Seobu T&D (expiring 10/17/25) (a) |
808 | 1,658 | ||||||
|
|
|
|||||||
| 67,640 | ||||||||
|
|
|
|||||||
| UNITED KINGDOM — 0.0% (g) |
| |||||||
| Equiniti Group PLC |
36,332 | 56,056 | ||||||
|
|
|
|||||||
| TOTAL RIGHTS |
153,074 | |||||||
|
|
|
|||||||
| SHORT-TERM INVESTMENTS — 7.5% |
| |||||||
| State Street Institutional U.S. Government Money Market Fund, Class G Shares 0.96% (h) (i) |
73,500 | 73,500 | ||||||
| State Street Navigator Securities Lending Government Money Market Portfolio (h) (j) |
66,029,680 | 66,029,680 | ||||||
|
|
|
|||||||
| TOTAL SHORT-TERM INVESTMENTS |
66,103,180 | |||||||
|
|
|
|||||||
| TOTAL INVESTMENTS — 107.1% |
949,095,671 | |||||||
| LIABILITIES IN EXCESS OF OTHER ASSETS — (7.1)% |
(62,666,134 | ) | ||||||
|
|
|
|||||||
| NET ASSETS — 100.0% |
$ | 886,429,537 | ||||||
|
|
|
|||||||
See accompanying notes to financial statements.
101
Table of Contents
SPDR S&P International Small Cap ETF
SCHEDULE OF INVESTMENTS (continued)
September 30, 2017
| (a) | Non-income producing security. |
| (b) | Fair valued as determined in good faith by the Trust’s Oversight Committee in accordance with policy and procedures approved by the Board of Trustees. Security value is determined based on Level 3 inputs. As of September 30, 2017, total aggregate fair value of the security is $194,734, representing 0.0% of the Fund’s net assets. |
| (c) | All or a portion of the shares of the security are on loan at September 30, 2017. |
| (d) | Securities purchased pursuant to Rule 144A of the Securities Act of 1933, as amended. These securities, which represent 2.8% of net assets as of September 30, 2017, are considered liquid and may be resold in transactions exempt from registration, normally to qualified institutional buyers. |
| (e) | Fair valued as determined in good faith by the Trust’s Oversight Committee in accordance with policy and procedures approved by the Board of Trustees. As of September 30, 2017, total aggregate fair value of securities is $605,425 representing 0.1% of net assets. |
| (f) | Reflects separate holdings of the issuer’s common stock traded on different securities exchanges. |
| (g) | Amount is less than 0.05% of net assets. |
| (h) | The Fund invested in certain money market funds managed by SSGA Funds Management, Inc. Amounts related to these transactions during the period ended September 30, 2017 are shown in the Affiliate Table below. |
| (i) | The rate shown is the annualized seven-day yield at September 30, 2017. |
| (j) | Investment of cash collateral for securities loaned. |
ADR = American Depositary Receipt
REIT = Real Estate Investment Trust
The following table summarizes the value of the Fund’s investments according to the fair value hierarchy as of September 30, 2017.
| Description |
Level 1 — Quoted Prices |
Level 2 — Other Significant Observable Inputs |
Level 3 — Significant Unobservable Inputs |
Total | ||||||||||||
| ASSETS: |
||||||||||||||||
| INVESTMENTS: |
||||||||||||||||
| Common Stocks |
||||||||||||||||
| Australia |
$ | 57,074,779 | $ | 262,101 | $ | 0 | (b) | $ | 57,336,880 | |||||||
| Austria |
3,326,560 | — | — | 3,326,560 | ||||||||||||
| Belgium |
11,865,386 | — | — | 11,865,386 | ||||||||||||
| Canada |
79,609,585 | 69,911 | 0 | (b) | 79,679,496 | |||||||||||
| China |
2,098,321 | — | — | 2,098,321 | ||||||||||||
| Denmark |
5,607,761 | — | 0 | (b) | 5,607,761 | |||||||||||
| Finland |
6,580,100 | 4,928 | 0 | (b) | 6,585,028 | |||||||||||
| France |
19,537,625 | — | — | 19,537,625 | ||||||||||||
| Germany |
29,297,080 | 395,246 | — | 29,692,326 | ||||||||||||
| Greece |
— | — | 0 | (b) | — | |||||||||||
| Hong Kong |
24,920,651 | 425,971 | 0 | (b) | 25,346,622 | |||||||||||
| Ireland |
7,173,421 | — | — | 7,173,421 | ||||||||||||
| Israel |
15,911,714 | — | — | 15,911,714 | ||||||||||||
| Italy |
11,320,241 | — | 95,279 | 11,415,520 | ||||||||||||
| Japan |
322,210,743 | 48 | — | 322,210,791 | ||||||||||||
| Liechtenstein |
236,461 | — | — | 236,461 | ||||||||||||
| Luxembourg |
431,040 | — | — | 431,040 | ||||||||||||
| Macau |
514,370 | — | — | 514,370 | ||||||||||||
| Malta |
253,363 | — | — | 253,363 | ||||||||||||
| Netherlands |
11,797,738 | — | — | 11,797,738 | ||||||||||||
| New Zealand |
9,570,180 | — | — | 9,570,180 | ||||||||||||
| Norway |
11,764,174 | — | — | 11,764,174 | ||||||||||||
| Peru |
272,271 | — | — | 272,271 | ||||||||||||
| Portugal |
2,081,510 | — | — | 2,081,510 | ||||||||||||
| Singapore |
13,583,829 | 115,749 | 0 | (b) | 13,699,578 | |||||||||||
| South Africa |
306,747 | — | 0 | (b) | 306,747 | |||||||||||
| South Korea |
83,290,535 | 295,697 | 99,455 | 83,685,687 | ||||||||||||
| Spain |
11,026,980 | — | 0 | (b) | 11,026,980 | |||||||||||
| Sweden |
28,897,608 | — | — | 28,897,608 | ||||||||||||
| Switzerland |
20,372,730 | — | — | 20,372,730 | ||||||||||||
| United Arab Emirates |
145,709 | — | — | 145,709 | ||||||||||||
| United Kingdom |
81,334,361 | 15,715 | — | 81,350,076 | ||||||||||||
| United States |
8,638,341 | — | 0 | (b) | 8,638,341 | |||||||||||
See accompanying notes to financial statements.
102
Table of Contents
SPDR S&P International Small Cap ETF
SCHEDULE OF INVESTMENTS (continued)
September 30, 2017
| Description |
Level 1 — Quoted Prices |
Level 2 — Other Significant Observable Inputs |
Level 3 — Significant Unobservable Inputs |
Total | ||||||||||||
| Warrants |
||||||||||||||||
| Australia |
$ | 4,856 | $ | — | $ | — | $ | 4,856 | ||||||||
| Singapore |
— | 2,547 | — | 2,547 | ||||||||||||
| United States |
0 | (a) | — | — | — | |||||||||||
| Rights |
||||||||||||||||
| Australia |
— | — | 0 | (b) | — | |||||||||||
| Singapore |
— | 29,378 | — | 29,378 | ||||||||||||
| South Korea |
1,658 | 65,982 | — | 67,640 | ||||||||||||
| United Kingdom |
56,056 | — | — | 56,056 | ||||||||||||
| Short-Term Investments |
66,103,180 | — | — | 66,103,180 | ||||||||||||
|
|
|
|
|
|
|
|
|
|||||||||
| TOTAL INVESTMENTS |
$ | 947,217,664 | $ | 1,683,273 | $ | 194,734 | $ | 949,095,671 | ||||||||
|
|
|
|
|
|
|
|
|
|||||||||
| (a) | Fund held Level 1 security that was valued at $0 at September 30, 2017. |
| (b) | Fund held Level 3 securities that were valued at $0 at September 30, 2017. |
Affiliate Table
| Number of Shares Held at 9/30/16 |
Value at 9/30/16 |
Cost of Purchases |
Proceeds from Shares Sold |
Realized Gain (Loss) |
Change in Unrealized Appreciation/ Depreciation |
Number of Shares Held at 9/30/17 |
Value at 9/30/17 |
Dividend Income |
||||||||||||||||||||||||||||
| State Street Institutional Liquid Reserves Fund, Premier Class |
3,225,573 | $ | 3,225,573 | $ | 470,553 | $ | 3,696,126 | $ | — | $ | — | — | $ | — | $ | 141 | ||||||||||||||||||||
| State Street Institutional U.S. Government Money Market Fund, Class G Shares |
— | — | 23,893,952 | 23,820,452 | — | — | 73,500 | 73,500 | 7,149 | |||||||||||||||||||||||||||
| State Street Institutional U.S. Government Money Market Fund, Premier Class |
— | — | 37,421,048 | 37,421,048 | — | — | — | — | 5,521 | |||||||||||||||||||||||||||
| State Street Navigator Securities Lending Government Money Market Portfolio* |
77,010,646 | 77,010,646 | 121,957,900 | 132,938,866 | — | — | 66,029,680 | 66,029,680 | 1,748,900 | |||||||||||||||||||||||||||
|
|
|
|
|
|
|
|
|
|
|
|
|
|
|
|||||||||||||||||||||||
| TOTAL |
$ | 80,236,219 | $ | 183,743,453 | $ | 197,876,492 | $ | — | $ | — | $ | 66,103,180 | $ | 1,761,711 | ||||||||||||||||||||||
|
|
|
|
|
|
|
|
|
|
|
|
|
|
|
|||||||||||||||||||||||
| * | Effective October 5, 2016, the name of State Street Navigator Securities Lending Prime Portfolio was changed to State Street Navigator Securities Lending Government Money Market Portfolio. |
See accompanying notes to financial statements.
103
Table of Contents
SPDR S&P Global Infrastructure ETF
SCHEDULE OF INVESTMENTS
September 30, 2017
| Security Description |
Shares |
Value |
||||||
| COMMON STOCKS — 99.7% |
| |||||||
| AUSTRALIA — 8.3% |
| |||||||
| Macquarie Atlas Roads Group |
323,964 | $ | 1,380,297 | |||||
| Qube Holdings, Ltd. (a) |
735,790 | 1,426,023 | ||||||
| Sydney Airport |
595,543 | 3,322,451 | ||||||
| Transurban Group Stapled Security |
952,018 | 8,874,368 | ||||||
|
|
|
|||||||
| 15,003,139 | ||||||||
|
|
|
|||||||
| BRAZIL — 0.9% |
||||||||
| CPFL Energia SA ADR |
20,216 | 346,906 | ||||||
| Ultrapar Participacoes SA ADR |
57,545 | 1,370,722 | ||||||
|
|
|
|||||||
| 1,717,628 | ||||||||
|
|
|
|||||||
| CANADA — 11.4% |
||||||||
| AltaGas, Ltd. |
22,566 | 518,568 | ||||||
| Enbridge, Inc. (b) |
216,158 | 9,008,240 | ||||||
| Enbridge, Inc. (b) |
2,122 | 88,784 | ||||||
| Fortis, Inc. |
36,800 | 1,317,638 | ||||||
| Inter Pipeline, Ltd. |
49,686 | 1,026,972 | ||||||
| Pembina Pipeline Corp. (a) |
53,388 | 1,868,890 | ||||||
| TransCanada Corp. (a) |
115,487 | 5,694,705 | ||||||
| Veresen, Inc. |
41,598 | 622,648 | ||||||
| Westshore Terminals Investment Corp. (a) |
27,287 | 523,420 | ||||||
|
|
|
|||||||
| 20,669,865 | ||||||||
|
|
|
|||||||
| CHILE — 0.3% |
||||||||
| Enel Americas SA ADR |
49,589 | 506,800 | ||||||
|
|
|
|||||||
| CHINA — 4.0% |
||||||||
| Beijing Capital International Airport Co., Ltd. Class H |
772,000 | 1,150,483 | ||||||
| Beijing Enterprises Water Group, Ltd. (c) |
432,000 | 347,892 | ||||||
| China Merchants Port Holdings Co., Ltd. |
650,749 | 2,007,893 | ||||||
| COSCO SHIPPING Ports, Ltd. |
899,258 | 1,000,493 | ||||||
| Guangdong Investment, Ltd. |
254,000 | 362,267 | ||||||
| Jiangsu Expressway Co., Ltd. Class H |
660,000 | 1,010,614 | ||||||
| Kunlun Energy Co., Ltd. (a) |
450,000 | 439,589 | ||||||
| Zhejiang Expressway Co., Ltd. Class H |
774,000 | 962,211 | ||||||
|
|
|
|||||||
| 7,281,442 | ||||||||
|
|
|
|||||||
| FRANCE — 4.6% |
||||||||
| Aeroports de Paris |
17,629 | 2,851,048 | ||||||
| Engie SA |
142,316 | 2,417,693 | ||||||
| Groupe Eurotunnel SE |
252,367 | 3,043,151 | ||||||
|
|
|
|||||||
| 8,311,892 | ||||||||
|
|
|
|||||||
| GERMANY — 2.5% |
||||||||
| E.ON SE |
193,849 | 2,194,514 | ||||||
| Fraport AG Frankfurt Airport Services Worldwide |
19,940 | 1,893,859 | ||||||
| Hamburger Hafen und Logistik AG |
11,344 | 357,400 | ||||||
|
|
|
|||||||
| 4,445,773 | ||||||||
|
|
|
|||||||
| HONG KONG — 2.2% |
||||||||
| China Gas Holdings, Ltd. |
202,000 | 605,170 | ||||||
| CLP Holdings, Ltd. |
173,500 | 1,778,160 | ||||||
| Hong Kong & China Gas Co., Ltd. |
714,200 | 1,342,320 | ||||||
| Hopewell Highway Infrastructure, Ltd. |
549,000 | 339,492 | ||||||
|
|
|
|||||||
| 4,065,142 | ||||||||
|
|
|
|||||||
| ITALY — 8.4% |
||||||||
| ASTM SpA |
19,239 | 499,238 | ||||||
| Atlantia SpA |
253,874 | 8,016,464 | ||||||
| Enav SpA (d) |
137,449 | 629,819 | ||||||
| Enel SpA |
679,810 | 4,094,704 | ||||||
| Snam SpA |
297,082 | 1,431,533 | ||||||
| Societa Iniziative Autostradali e Servizi SpA |
36,843 | 588,438 | ||||||
|
|
|
|||||||
| 15,260,196 | ||||||||
|
|
|
|||||||
| MEXICO — 2.8% |
||||||||
| Grupo Aeroportuario del Centro Norte SAB de CV ADR |
22,608 | 1,003,569 | ||||||
| Grupo Aeroportuario del Pacifico SAB de CV ADR |
20,296 | 2,080,949 | ||||||
| Grupo Aeroportuario del Sureste SAB de CV ADR |
10,878 | 2,075,740 | ||||||
|
|
|
|||||||
| 5,160,258 | ||||||||
|
|
|
|||||||
| NEW ZEALAND — 1.3% |
||||||||
| Auckland International Airport, Ltd. |
502,419 | 2,339,000 | ||||||
|
|
|
|||||||
| SINGAPORE — 0.9% |
||||||||
| Hutchison Port Holdings Trust |
2,821,470 | 1,213,232 | ||||||
| SIA Engineering Co., Ltd. |
132,900 | 341,560 | ||||||
|
|
|
|||||||
| 1,554,792 | ||||||||
|
|
|
|||||||
| SPAIN — 11.2% |
||||||||
| Abertis Infraestructuras SA |
406,319 | 8,213,986 | ||||||
| Aena SME SA (d) |
39,677 | 7,164,911 | ||||||
| Enagas SA |
30,074 | 847,061 | ||||||
| Iberdrola SA |
522,994 | 4,063,357 | ||||||
|
|
|
|||||||
| 20,289,315 | ||||||||
|
|
|
|||||||
| SWITZERLAND — 1.3% |
||||||||
| Flughafen Zuerich AG |
10,275 | 2,325,574 | ||||||
|
|
|
|||||||
| UNITED KINGDOM — 4.2% |
||||||||
| BBA Aviation PLC |
485,311 | 1,942,934 | ||||||
| National Grid PLC |
318,034 | 3,945,178 | ||||||
| SSE PLC |
88,737 | 1,663,184 | ||||||
|
|
|
|||||||
| 7,551,296 | ||||||||
|
|
|
|||||||
| UNITED STATES — 35.4% |
||||||||
| American Electric Power Co., Inc. |
43,344 | 3,044,483 | ||||||
| Cheniere Energy, Inc. (c) |
26,839 | 1,208,829 | ||||||
| Consolidated Edison, Inc. |
27,288 | 2,201,596 | ||||||
| Dominion Energy, Inc. |
56,637 | 4,357,084 | ||||||
| DTE Energy Co. |
15,836 | 1,700,153 | ||||||
| Duke Energy Corp. |
61,627 | 5,171,738 | ||||||
| Edison International |
28,680 | 2,213,236 | ||||||
| Eversource Energy |
27,893 | 1,685,853 | ||||||
| Exelon Corp. |
84,593 | 3,186,618 | ||||||
| Kinder Morgan, Inc. |
254,538 | 4,882,039 | ||||||
| Macquarie Infrastructure Corp. |
41,951 | 3,028,023 | ||||||
| NextEra Energy, Inc. |
41,208 | 6,039,032 | ||||||
| ONEOK, Inc. |
50,346 | 2,789,672 | ||||||
| PG&E Corp. |
45,191 | 3,077,055 | ||||||
| PPL Corp. |
60,213 | 2,285,083 | ||||||
| Public Service Enterprise Group, Inc. |
44,516 | 2,058,865 | ||||||
| Sempra Energy |
22,142 | 2,527,066 | ||||||
| Southern Co. |
88,056 | 4,327,072 | ||||||
See accompanying notes to financial statements.
104
Table of Contents
SPDR S&P Global Infrastructure ETF
SCHEDULE OF INVESTMENTS (continued)
September 30, 2017
| Security Description |
Shares |
Value |
||||||
| Targa Resources Corp. |
28,588 | $ | 1,352,212 | |||||
| WEC Energy Group, Inc. |
27,784 | 1,744,280 | ||||||
| Williams Cos., Inc. |
109,579 | 3,288,466 | ||||||
| Xcel Energy, Inc. |
44,765 | 2,118,280 | ||||||
|
|
|
|||||||
| 64,286,735 | ||||||||
|
|
|
|||||||
| TOTAL COMMON STOCKS |
180,768,847 | |||||||
|
|
|
|||||||
| RIGHTS — 0.0% (e) |
||||||||
| AUSTRALIA — 0.0% (e) |
||||||||
| Macquarie Atlas Roads Group (expiring 10/4/17) (c) (f) |
45,894 | — | ||||||
|
|
|
|||||||
| SHORT-TERM INVESTMENTS — 4.1% |
| |||||||
| State Street Institutional U.S. Government Money Market Fund, Class G Shares 0.96% (g) (h) |
403,650 | 403,650 | ||||||
| State Street Navigator Securities Lending Government Money Market Portfolio (g) (i) |
7,104,926 | 7,104,926 | ||||||
|
|
|
|||||||
| TOTAL SHORT-TERM INVESTMENTS |
7,508,576 | |||||||
|
|
|
|||||||
| TOTAL INVESTMENTS — 103.8% |
188,277,423 | |||||||
| LIABILITIES IN EXCESS OF OTHER ASSETS — (3.8)% |
(6,900,473 | ) | ||||||
|
|
|
|||||||
| NET ASSETS — 100.0% |
$ | 181,376,950 | ||||||
|
|
|
|||||||
| (a) | All or a portion of the shares of the security are on loan at September 30, 2017. |
| (b) | Reflects separate holdings of the issuer’s common stock traded on different securities exchanges. |
| (c) | Non-income producing security. |
| (d) | Securities purchased pursuant to Rule 144A of the Securities Act of 1933, as amended. These securities, which represent 4.3% of net assets as of September 30, 2017, are considered liquid and may be resold in transactions exempt from registration, normally to qualified institutional buyers. |
| (e) | Amount is less than 0.05% of net assets. |
| (f) | Fair valued as determined in good faith by the Trust’s Oversight Committee in accordance with policy and procedures approved by the Board of Trustees. Security value is determined based on Level 3 inputs. As of September 30, 2017, total aggregate fair value of the security is $0, representing 0.0% of the Fund’s net assets. |
| (g) | The Fund invested in certain money market funds managed by SSGA Funds Management, Inc. Amounts related to these transactions during the period ended September 30, 2017 are shown in the Affiliate Table below. |
| (h) | The rate shown is the annualized seven-day yield at September 30, 2017. |
| (i) | Investment of cash collateral for securities loaned. |
ADR = American Depositary Receipt
The following table summarizes the value of the Fund’s investments according to the fair value hierarchy as of September 30, 2017.
| Description |
Level 1 — Quoted Prices |
Level 2 — Other Significant Observable Inputs |
Level 3 — Significant Unobservable Inputs |
Total | ||||||||||||
| ASSETS: |
||||||||||||||||
| INVESTMENTS: |
||||||||||||||||
| Common Stocks |
||||||||||||||||
| Australia |
$ | 15,003,139 | $ | — | $ | — | $ | 15,003,139 | ||||||||
| Brazil |
1,717,628 | — | — | 1,717,628 | ||||||||||||
| Canada |
20,669,865 | — | — | 20,669,865 | ||||||||||||
| Chile |
506,800 | — | — | 506,800 | ||||||||||||
| China |
7,281,442 | — | — | 7,281,442 | ||||||||||||
| France |
8,311,892 | — | — | 8,311,892 | ||||||||||||
| Germany |
4,445,773 | — | — | 4,445,773 | ||||||||||||
| Hong Kong |
4,065,142 | — | — | 4,065,142 | ||||||||||||
| Italy |
15,260,196 | — | — | 15,260,196 | ||||||||||||
| Mexico |
5,160,258 | — | — | 5,160,258 | ||||||||||||
| New Zealand |
2,339,000 | — | — | 2,339,000 | ||||||||||||
| Singapore |
1,554,792 | — | — | 1,554,792 | ||||||||||||
| Spain |
20,289,315 | — | — | 20,289,315 | ||||||||||||
| Switzerland |
2,325,574 | — | — | 2,325,574 | ||||||||||||
| United Kingdom |
7,551,296 | — | — | 7,551,296 | ||||||||||||
| United States |
64,286,735 | — | — | 64,286,735 | ||||||||||||
See accompanying notes to financial statements.
105
Table of Contents
SPDR S&P Global Infrastructure ETF
SCHEDULE OF INVESTMENTS (continued)
September 30, 2017
| Description |
Level 1 — Quoted Prices |
Level 2 — Other Significant Observable Inputs |
Level 3 — Significant Unobservable Inputs |
Total | ||||||||||||
| Rights |
||||||||||||||||
| Australia |
$ | — | $ | — | $ | 0 | (a) | $ | — | |||||||
| Short-Term Investments |
7,508,576 | — | — | 7,508,576 | ||||||||||||
|
|
|
|
|
|
|
|
|
|||||||||
| TOTAL INVESTMENTS |
$ | 188,277,423 | $ | — | $ | 0 | $ | 188,277,423 | ||||||||
|
|
|
|
|
|
|
|
|
|||||||||
| (a) | Fund held a Level 3 security that was valued at $0 at September 30, 2017. |
Affiliate Table
| Number of Shares Held at 9/30/16 |
Value at 9/30/16 |
Cost of Purchases |
Proceeds from Shares Sold |
Realized Gain (Loss) |
Change in Unrealized Appreciation/ Depreciation |
Number of Shares Held at 9/30/17 |
Value at 9/30/17 |
Dividend Income |
||||||||||||||||||||||||||||
| State Street Institutional Liquid Reserves Fund, Premier Class |
196,058 | $ | 196,058 | $ | 12,263 | $ | 208,321 | $ | — | $ | — | — | $ | — | $ | 5 | ||||||||||||||||||||
| State Street Institutional U.S. Government Money Market Fund, Class G Shares |
— | — | 3,658,203 | 3,254,553 | — | — | 403,650 | 403,650 | 1,304 | |||||||||||||||||||||||||||
| State Street Institutional U.S. Government Money Market Fund, Premier Class |
— | — | 4,084,200 | 4,084,200 | — | — | — | — | 478 | |||||||||||||||||||||||||||
| State Street Navigator Securities Lending Government Money Market Portfolio* |
4,958,497 | 4,958,497 | 63,727,212 | 61,580,783 | — | — | 7,104,926 | 7,104,926 | 36,128 | |||||||||||||||||||||||||||
|
|
|
|
|
|
|
|
|
|
|
|
|
|
|
|||||||||||||||||||||||
| TOTAL |
$ | 5,154,555 | $ | 71,481,878 | $ | 69,127,857 | $ | — | $ | — | $ | 7,508,576 | $ | 37,915 | ||||||||||||||||||||||
|
|
|
|
|
|
|
|
|
|
|
|
|
|
|
|||||||||||||||||||||||
| * | Effective October 5, 2016, the name of State Street Navigator Securities Lending Prime Portfolio was changed to State Street Navigator Securities Lending Government Money Market Portfolio. |
See accompanying notes to financial statements.
106
Table of Contents
SPDR S&P Global Natural Resources ETF
SCHEDULE OF INVESTMENTS
September 30, 2017
| Security Description |
Shares |
Value |
||||||
| COMMON STOCKS — 99.5% |
| |||||||
| AUSTRALIA — 9.0% |
| |||||||
| Amcor, Ltd. |
2,222,082 | $ | 26,519,487 | |||||
| BHP Billiton, Ltd. |
2,561,839 | 51,821,572 | ||||||
| Fortescue Metals Group, Ltd. |
1,362,006 | 5,493,106 | ||||||
| Newcrest Mining, Ltd. |
607,675 | 10,022,589 | ||||||
| South32, Ltd. |
4,192,422 | 10,756,936 | ||||||
| Woodside Petroleum, Ltd. |
263,837 | 6,024,271 | ||||||
|
|
|
|||||||
| 110,637,961 | ||||||||
|
|
|
|||||||
| AUSTRIA — 0.4% |
||||||||
| Voestalpine AG |
87,740 | 4,475,266 | ||||||
|
|
|
|||||||
| BRAZIL — 3.0% |
||||||||
| Fibria Celulose SA ADR (a) |
435,685 | 5,899,175 | ||||||
| Petroleo Brasileiro SA ADR (b) |
542,054 | 5,442,222 | ||||||
| Vale SA ADR (a) |
2,503,355 | 25,208,785 | ||||||
|
|
|
|||||||
| 36,550,182 | ||||||||
|
|
|
|||||||
| CANADA — 11.3% |
||||||||
| Agrium, Inc. |
265,138 | 28,348,661 | ||||||
| Barrick Gold Corp. |
931,639 | 14,990,071 | ||||||
| Canadian Natural Resources, Ltd. |
394,873 | 13,194,533 | ||||||
| Franco-Nevada Corp. |
142,225 | 10,992,259 | ||||||
| Goldcorp, Inc. (a) |
681,046 | 8,821,769 | ||||||
| Imperial Oil, Ltd. (a) |
92,624 | 2,952,059 | ||||||
| Potash Corp. of Saskatchewan, Inc. |
1,611,478 | 31,004,837 | ||||||
| Suncor Energy, Inc. |
609,300 | 21,304,673 | ||||||
| Wheaton Precious Metals Corp. (a) |
351,699 | 6,692,869 | ||||||
|
|
|
|||||||
| 138,301,731 | ||||||||
|
|
|
|||||||
| CHILE — 0.3% |
||||||||
| Antofagasta PLC |
306,070 | 3,896,962 | ||||||
|
|
|
|||||||
| CHINA — 0.6% |
||||||||
| CNOOC, Ltd. |
5,853,000 | 7,553,515 | ||||||
|
|
|
|||||||
| COLOMBIA — 0.1% |
||||||||
| Ecopetrol SA ADR (a) |
92,393 | 876,810 | ||||||
|
|
|
|||||||
| FINLAND — 3.5% |
||||||||
| Stora Enso Oyj Class R |
1,093,482 | 15,447,929 | ||||||
| UPM-Kymmene Oyj |
1,021,000 | 27,677,097 | ||||||
|
|
|
|||||||
| 43,125,026 | ||||||||
|
|
|
|||||||
| FRANCE — 4.0% |
||||||||
| TOTAL SA |
907,787 | 48,770,903 | ||||||
|
|
|
|||||||
| GERMANY — 1.7% |
||||||||
| KS AG (a) |
366,585 | 9,989,330 | ||||||
| ThyssenKrupp AG |
346,900 | 10,283,382 | ||||||
|
|
|
|||||||
| 20,272,712 | ||||||||
|
|
|
|||||||
| HONG KONG — 0.5% |
||||||||
| Nine Dragons Paper Holdings, Ltd. |
3,234,000 | 6,359,768 | ||||||
|
|
|
|||||||
| IRELAND — 1.2% |
||||||||
| Smurfit Kappa Group PLC |
452,183 | 14,166,117 | ||||||
|
|
|
|||||||
| ITALY — 1.3% |
||||||||
| Eni SpA |
982,003 | 16,252,927 | ||||||
|
|
|
|||||||
| JAPAN — 3.5% |
||||||||
| JFE Holdings, Inc. |
460,200 | 8,984,049 | ||||||
| Nippon Steel & Sumitomo Metal Corp. |
719,400 | 16,511,082 | ||||||
| Oji Holdings Corp. |
1,810,000 | 9,760,316 | ||||||
| Sumitomo Metal Mining Co., Ltd. |
221,000 | 7,095,403 | ||||||
|
|
|
|||||||
| 42,350,850 | ||||||||
|
|
|
|||||||
| LUXEMBOURG — 1.1% |
||||||||
| ArcelorMittal (b) |
503,468 | 12,990,230 | ||||||
|
|
|
|||||||
| MEXICO — 0.2% |
||||||||
| Fresnillo PLC |
146,658 | 2,764,530 | ||||||
|
|
|
|||||||
| NETHERLANDS — 4.3% |
||||||||
| OCI NV (b) |
120,647 | 2,825,477 | ||||||
| Royal Dutch Shell PLC Class A |
1,636,736 | 49,375,407 | ||||||
|
|
|
|||||||
| 52,200,884 | ||||||||
|
|
|
|||||||
| NORWAY — 2.5% |
||||||||
| Norsk Hydro ASA |
1,087,067 | 7,906,885 | ||||||
| Statoil ASA |
394,250 | 7,889,655 | ||||||
| Yara International ASA |
338,011 | 15,146,229 | ||||||
|
|
|
|||||||
| 30,942,769 | ||||||||
|
|
|
|||||||
| PERU — 0.4% |
||||||||
| Southern Copper Corp. (a) |
135,530 | 5,388,673 | ||||||
|
|
|
|||||||
| RUSSIA — 2.9% |
||||||||
| Gazprom PJSC ADR |
2,206,847 | 9,246,689 | ||||||
| LUKOIL PJSC ADR |
158,631 | 8,396,339 | ||||||
| MMC Norilsk Nickel PJSC ADR |
541,683 | 9,325,073 | ||||||
| Novatek PJSC GDR |
24,328 | 2,853,674 | ||||||
| Novolipetsk Steel PJSC GDR |
66,799 | 1,519,677 | ||||||
| Rosneft Oil Co. PJSC GDR |
424,529 | 2,358,259 | ||||||
| Severstal PJSC GDR |
140,040 | 2,093,598 | ||||||
|
|
|
|||||||
| 35,793,309 | ||||||||
|
|
|
|||||||
| SINGAPORE — 1.7% |
||||||||
| Golden Agri-Resources, Ltd. |
12,882,268 | 3,557,458 | ||||||
| Wilmar International, Ltd. |
7,144,219 | 16,730,083 | ||||||
|
|
|
|||||||
| 20,287,541 | ||||||||
|
|
|
|||||||
| SOUTH AFRICA — 1.5% |
||||||||
| Mondi PLC |
704,872 | 18,961,112 | ||||||
|
|
|
|||||||
| SOUTH KOREA — 1.8% |
||||||||
| Korea Zinc Co., Ltd. |
10,140 | 4,386,755 | ||||||
| POSCO |
4,195 | 1,161,055 | ||||||
| POSCO ADR |
239,579 | 16,626,783 | ||||||
|
|
|
|||||||
| 22,174,593 | ||||||||
|
|
|
|||||||
| SPAIN — 0.6% |
||||||||
| Repsol SA |
426,886 | 7,867,717 | ||||||
|
|
|
|||||||
| SWITZERLAND — 3.6% |
||||||||
| Glencore PLC (b) |
9,538,447 | 43,766,613 | ||||||
|
|
|
|||||||
| UNITED KINGDOM — 7.7% |
||||||||
| Anglo American PLC |
1,122,843 | 20,179,059 | ||||||
| BP PLC |
6,905,140 | 44,218,406 | ||||||
| DS Smith PLC |
1,941,324 | 12,837,960 | ||||||
| Rio Tinto, Ltd. (a) |
338,936 | 17,693,390 | ||||||
|
|
|
|||||||
| 94,928,815 | ||||||||
|
|
|
|||||||
| UNITED STATES — 30.8% |
| |||||||
| Anadarko Petroleum Corp. |
92,611 | 4,524,047 | ||||||
| Archer-Daniels-Midland Co. |
421,109 | 17,901,344 | ||||||
| Avery Dennison Corp. |
65,233 | 6,415,013 | ||||||
| Baker Hughes a GE Co. |
70,380 | 2,577,316 | ||||||
See accompanying notes to financial statements.
107
Table of Contents
SPDR S&P Global Natural Resources ETF
SCHEDULE OF INVESTMENTS (continued)
September 30, 2017
| Security Description |
Shares |
Value |
||||||
| Bunge, Ltd. |
103,376 | $ | 7,180,497 | |||||
| CF Industries Holdings, Inc. |
171,595 | 6,033,280 | ||||||
| Chevron Corp. |
314,711 | 36,978,543 | ||||||
| ConocoPhillips |
205,384 | 10,279,469 | ||||||
| Devon Energy Corp. |
86,918 | 3,190,760 | ||||||
| EOG Resources, Inc. |
95,726 | 9,260,533 | ||||||
| Exxon Mobil Corp. |
703,606 | 57,681,620 | ||||||
| FMC Corp. |
99,032 | 8,844,548 | ||||||
| Freeport-McMoRan, Inc. (b) |
1,063,833 | 14,936,215 | ||||||
| Halliburton Co. |
143,523 | 6,606,364 | ||||||
| Ingredion, Inc. |
53,032 | 6,397,781 | ||||||
| International Paper Co. |
304,679 | 17,311,861 | ||||||
| Monsanto Co. |
324,304 | 38,858,105 | ||||||
| Mosaic Co. |
258,416 | 5,579,201 | ||||||
| Newmont Mining Corp. |
426,097 | 15,982,898 | ||||||
| Nucor Corp. |
255,058 | 14,293,450 | ||||||
| Occidental Petroleum Corp. |
127,024 | 8,156,211 | ||||||
| Packaging Corp. of America |
69,355 | 7,953,631 | ||||||
| Phillips 66 |
72,586 | 6,649,603 | ||||||
| Pioneer Natural Resources Co. |
28,164 | 4,155,317 | ||||||
| Rayonier, Inc. REIT |
95,692 | 2,764,542 | ||||||
| Schlumberger, Ltd. |
230,438 | 16,075,355 | ||||||
| Sealed Air Corp. |
144,110 | 6,156,379 | ||||||
| Valero Energy Corp. |
74,312 | 5,716,822 | ||||||
| WestRock Co. |
185,904 | 10,546,334 | ||||||
| Weyerhaeuser Co. REIT |
554,318 | 18,863,442 | ||||||
|
|
|
|||||||
| 377,870,481 | ||||||||
|
|
|
|||||||
| TOTAL COMMON STOCKS |
1,219,527,997 | |||||||
|
|
|
|||||||
| SHORT-TERM INVESTMENTS — 2.3% |
| |||||||
| State Street Institutional U.S. Government Money Market Fund, Class G Shares 0.96% (c) (d) |
799,218 | 799,218 | ||||||
| State Street Navigator Securities Lending Government Money Market Portfolio (c) (e) |
27,454,617 | 27,454,617 | ||||||
|
|
|
|||||||
| TOTAL SHORT-TERM INVESTMENTS |
28,253,835 | |||||||
|
|
|
|||||||
| TOTAL INVESTMENTS — 101.8% |
1,247,781,832 | |||||||
| LIABILITIES IN EXCESS OF OTHER ASSETS — (1.8)% |
(21,628,291 | ) | ||||||
|
|
|
|||||||
| NET ASSETS — 100.0% |
$ | 1,226,153,541 | ||||||
|
|
|
|||||||
| (a) | All or a portion of the shares of the security are on loan at September 30, 2017. |
| (b) | Non-income producing security. |
| (c) | The Fund invested in certain money market funds managed by SSGA Funds Management, Inc. Amounts related to these transactions during the period ended September 30, 2017 are shown in the Affiliate Table below. |
| (d) | The rate shown is the annualized seven-day yield at September 30, 2017. |
| (e) | Investment of cash collateral for securities loaned. |
ADR = American Depositary Receipt
GDR = Global Depositary Receipt
REIT = Real Estate Investment Trust
The following table summarizes the value of the Fund’s investments according to the fair value hierarchy as of September 30, 2017.
| Description |
Level 1 — Quoted Prices |
Level 2 — Other Significant Observable Inputs |
Level 3 — Significant Unobservable Inputs |
Total | ||||||||||||
| ASSETS: |
||||||||||||||||
| INVESTMENTS: |
||||||||||||||||
| Common Stocks |
||||||||||||||||
| Australia |
$ | 110,637,961 | $ | — | $ | — | $ | 110,637,961 | ||||||||
| Austria |
4,475,266 | — | — | 4,475,266 | ||||||||||||
| Brazil |
36,550,182 | — | — | 36,550,182 | ||||||||||||
| Canada |
138,301,731 | — | — | 138,301,731 | ||||||||||||
| Chile |
3,896,962 | — | — | 3,896,962 | ||||||||||||
| China |
7,553,515 | — | — | 7,553,515 | ||||||||||||
| Colombia |
876,810 | — | — | 876,810 | ||||||||||||
| Finland |
43,125,026 | — | — | 43,125,026 | ||||||||||||
| France |
48,770,903 | — | — | 48,770,903 | ||||||||||||
| Germany |
20,272,712 | — | — | 20,272,712 | ||||||||||||
| Hong Kong |
6,359,768 | — | — | 6,359,768 | ||||||||||||
| Ireland |
14,166,117 | — | — | 14,166,117 | ||||||||||||
| Italy |
16,252,927 | — | — | 16,252,927 | ||||||||||||
| Japan |
42,350,850 | — | — | 42,350,850 | ||||||||||||
| Luxembourg |
12,990,230 | — | — | 12,990,230 | ||||||||||||
| Mexico |
2,764,530 | — | — | 2,764,530 | ||||||||||||
See accompanying notes to financial statements.
108
Table of Contents
SPDR S&P Global Natural Resources ETF
SCHEDULE OF INVESTMENTS (continued)
September 30, 2017
| Description |
Level 1 — Quoted Prices |
Level 2 — Other Significant Observable Inputs |
Level 3 — Significant Unobservable Inputs |
Total | ||||||||||||
| Netherlands |
$ | 52,200,884 | $ | — | $ | — | $ | 52,200,884 | ||||||||
| Norway |
30,942,769 | — | — | 30,942,769 | ||||||||||||
| Peru |
5,388,673 | — | — | 5,388,673 | ||||||||||||
| Russia |
35,793,309 | — | — | 35,793,309 | ||||||||||||
| Singapore |
20,287,541 | — | — | 20,287,541 | ||||||||||||
| South Africa |
18,961,112 | — | — | 18,961,112 | ||||||||||||
| South Korea |
22,174,593 | — | — | 22,174,593 | ||||||||||||
| Spain |
7,867,717 | — | — | 7,867,717 | ||||||||||||
| Switzerland |
43,766,613 | — | — | 43,766,613 | ||||||||||||
| United Kingdom |
94,928,815 | — | — | 94,928,815 | ||||||||||||
| United States |
377,870,481 | — | — | 377,870,481 | ||||||||||||
| Short-Term Investments |
28,253,835 | — | — | 28,253,835 | ||||||||||||
|
|
|
|
|
|
|
|
|
|||||||||
| TOTAL INVESTMENTS |
$ | 1,247,781,832 | $ | — | $ | — | $ | 1,247,781,832 | ||||||||
|
|
|
|
|
|
|
|
|
|||||||||
Affiliate Table
| Number of Shares Held at 9/30/16 |
Value at 9/30/16 |
Cost of Purchases |
Proceeds from Shares Sold |
Realized Gain (Loss) |
Change in Unrealized Appreciation/ Depreciation |
Number of Shares Held at 9/30/17 |
Value at 9/30/17 |
Dividend Income |
||||||||||||||||||||||||||||
| State Street Institutional Liquid Reserves Fund, Premier Class |
2,166,082 | $ | 2,166,082 | $ | 707 | $ | 2,166,789 | $ | — | $ | — | — | $ | — | $ | 65 | ||||||||||||||||||||
| State Street Institutional U.S. Government Money Market Fund, Class G Shares |
— | — | 110,544,078 | 109,744,860 | — | — | 799,218 | 799,218 | 15,323 | |||||||||||||||||||||||||||
| State Street Institutional U.S. Government Money Market Fund, Premier Class |
— | — | 25,983,417 | 25,983,417 | — | — | — | — | 5,156 | |||||||||||||||||||||||||||
| State Street Navigator Securities Lending Government Money Market Portfolio* |
19,577,508 | 19,577,508 | 532,619,733 | 524,742,624 | — | — | 27,454,617 | 27,454,617 | 250,973 | |||||||||||||||||||||||||||
|
|
|
|
|
|
|
|
|
|
|
|
|
|
|
|||||||||||||||||||||||
| TOTAL |
$ | 21,743,590 | $ | 669,147,935 | $ | 662,637,690 | $ | — | $ | — | $ | 28,253,835 | $ | 271,517 | ||||||||||||||||||||||
|
|
|
|
|
|
|
|
|
|
|
|
|
|
|
|||||||||||||||||||||||
| * | Effective October 5, 2016, the name of State Street Navigator Securities Lending Prime Portfolio was changed to State Street Navigator Securities Lending Government Money Market Portfolio. |
See accompanying notes to financial statements.
109
Table of Contents
SCHEDULE OF INVESTMENTS
September 30, 2017
| Security Description |
Shares |
Value |
||||||
| COMMON STOCKS — 99.7% |
||||||||
| AUSTRALIA — 2.4% |
||||||||
| Alumina, Ltd. (a) |
41,540 | $ | 71,708 | |||||
| Amcor, Ltd. |
3,583 | 42,761 | ||||||
| AMP, Ltd. |
12,597 | 47,741 | ||||||
| Australia & New Zealand Banking Group, Ltd. |
2,819 | 65,473 | ||||||
| BHP Billiton PLC |
822 | 14,497 | ||||||
| BHP Billiton, Ltd. |
3,499 | 70,779 | ||||||
| Boral, Ltd. |
16,530 | 87,809 | ||||||
| Brambles, Ltd. |
8,403 | 59,341 | ||||||
| Coca-Cola Amatil, Ltd. |
4,110 | 24,929 | ||||||
| Commonwealth Bank of Australia |
929 | 54,853 | ||||||
| CSL, Ltd. |
1,602 | 168,389 | ||||||
| Fortescue Metals Group, Ltd. |
6,250 | 25,207 | ||||||
| Iluka Resources, Ltd. |
1,663 | 12,396 | ||||||
| Insurance Australia Group, Ltd. |
19,207 | 96,001 | ||||||
| LendLease Group |
9,913 | 139,386 | ||||||
| Macquarie Group, Ltd. |
1,682 | 119,994 | ||||||
| National Australia Bank, Ltd. |
3,755 | 92,810 | ||||||
| Newcrest Mining, Ltd. |
1,972 | 32,525 | ||||||
| Origin Energy, Ltd. (b) |
6,248 | 36,671 | ||||||
| Orora, Ltd. |
1,507 | 3,666 | ||||||
| OZ Minerals, Ltd. |
6,043 | 35,183 | ||||||
| QBE Insurance Group, Ltd. |
2,939 | 23,084 | ||||||
| Santos, Ltd. (b) |
7,327 | 23,111 | ||||||
| Scentre Group REIT |
8,770 | 27,044 | ||||||
| Shopping Centres Australasia Property Group |
92,003 | 165,315 | ||||||
| Sonic Healthcare, Ltd. |
4,506 | 73,930 | ||||||
| South32, Ltd. (c) |
3,229 | 8,350 | ||||||
| South32, Ltd. (c) |
2,992 | 7,677 | ||||||
| Suncorp Group, Ltd. |
6,347 | 64,991 | ||||||
| Sydney Airport |
943 | 5,261 | ||||||
| Transurban Group Stapled Security |
6,201 | 57,803 | ||||||
| Vicinity Centres REIT |
32,610 | 68,063 | ||||||
| Wesfarmers, Ltd. |
3,839 | 124,497 | ||||||
| Westfield Corp. REIT |
7,039 | 43,301 | ||||||
| Westpac Banking Corp. |
4,243 | 106,270 | ||||||
| Woodside Petroleum, Ltd. |
1,624 | 37,081 | ||||||
| Woolworths, Ltd. |
1,426 | 28,208 | ||||||
|
|
|
|||||||
| 2,166,105 | ||||||||
|
|
|
|||||||
| AUSTRIA — 0.1% |
||||||||
| OMV AG |
1,687 | 98,303 | ||||||
|
|
|
|||||||
| BELGIUM — 0.3% |
||||||||
| Anheuser-Busch InBev SA |
981 | 117,482 | ||||||
| Solvay SA |
570 | 85,175 | ||||||
| UCB SA |
1,483 | 105,595 | ||||||
|
|
|
|||||||
| 308,252 | ||||||||
|
|
|
|||||||
| BRAZIL — 0.7% |
||||||||
| Ambev SA ADR |
12,779 | 84,214 | ||||||
| Banco Bradesco SA Preference Shares ADR |
10,314 | 114,176 | ||||||
| Cia Energetica de Minas Gerais ADR |
7,152 | 17,737 | ||||||
| Cia Siderurgica Nacional SA ADR (a) (b) |
6,276 | 18,577 | ||||||
| Gerdau SA ADR (a) |
5,672 | 19,455 | ||||||
| Itau Unibanco Holding SA Preference Shares ADR |
8,148 | 111,627 | ||||||
| Petroleo Brasileiro SA ADR (b) |
3,229 | 32,419 | ||||||
| Petroleo Brasileiro SA Preference Shares ADR (b) |
9,465 | 91,432 | ||||||
| Tim Participacoes SA ADR |
2,160 | 39,485 | ||||||
| Vale SA ADR |
10,404 | 104,768 | ||||||
|
|
|
|||||||
| 633,890 | ||||||||
|
|
|
|||||||
| CANADA — 3.2% |
||||||||
| Agrium, Inc. |
419 | 44,800 | ||||||
| Bank of Montreal |
921 | 69,540 | ||||||
| Bank of Nova Scotia (a) |
1,161 | 74,451 | ||||||
| Barrick Gold Corp. (a) |
1,797 | 28,852 | ||||||
| Brookfield Asset Management, Inc. Class A |
2,676 | 110,237 | ||||||
| Cameco Corp. (a) |
2,394 | 23,066 | ||||||
| Canadian Imperial Bank of Commerce (a) |
419 | 36,575 | ||||||
| Canadian National Railway Co. |
1,814 | 149,947 | ||||||
| Canadian Natural Resources, Ltd. |
1,814 | 60,614 | ||||||
| Canadian Pacific Railway, Ltd. |
383 | 64,182 | ||||||
| Canadian Tire Corp., Ltd. Class A |
443 | 55,024 | ||||||
| Cenovus Energy, Inc. (a) |
2,298 | 22,986 | ||||||
| Eldorado Gold Corp. |
2,470 | 5,411 | ||||||
| Enbridge, Inc. (c) |
2,052 | 85,516 | ||||||
| Enbridge, Inc. (c) |
2,632 | 110,123 | ||||||
| Encana Corp. |
3,366 | 39,537 | ||||||
| Enerplus Corp. |
2,646 | 26,044 | ||||||
| First Majestic Silver Corp. (a) (b) |
8,089 | 55,106 | ||||||
| First Quantum Minerals, Ltd. (a) |
1,280 | 14,339 | ||||||
| Goldcorp, Inc. (a) |
1,761 | 22,811 | ||||||
| IAMGOLD Corp. (b) |
2,658 | 16,216 | ||||||
| IGM Financial, Inc. |
707 | 23,709 | ||||||
| Imperial Oil, Ltd. (a) |
1,316 | 41,943 | ||||||
| Just Energy Group, Inc. |
16,099 | 93,068 | ||||||
| Kinross Gold Corp. (b) |
3,893 | 16,467 | ||||||
| Loblaw Cos., Ltd. |
1,475 | 80,316 | ||||||
| Manulife Financial Corp. |
4,721 | 95,541 | ||||||
| National Bank of Canada |
2,489 | 119,509 | ||||||
| Obsidian Energy, Ltd. (a) (b) |
1,743 | 1,840 | ||||||
| Onex Corp. |
1,566 | 120,569 | ||||||
| Paramount Resources, Ltd. Class A (b) |
2,907 | 57,412 | ||||||
| Potash Corp. of Saskatchewan, Inc. (a) |
1,339 | 25,717 | ||||||
| PrairieSky Royalty, Ltd. (a) |
24 | 613 | ||||||
| Rogers Communications, Inc. Class B (a) |
2,494 | 128,304 | ||||||
| Royal Bank of Canada |
2,184 | 168,587 | ||||||
| Shaw Communications, Inc. Class B (a) |
1,663 | 38,189 | ||||||
| SNC-Lavalin Group, Inc. (a) |
1,042 | 46,982 | ||||||
| Sun Life Financial, Inc. |
2,573 | 102,229 | ||||||
| Suncor Energy, Inc. |
3,666 | 128,185 | ||||||
| Teck Resources, Ltd. Class B |
1,304 | 27,391 | ||||||
| TELUS Corp. |
3,523 | 126,424 | ||||||
| TMX Group, Ltd. |
18 | 1,015 | ||||||
| Toronto-Dominion Bank |
3,489 | 195,980 | ||||||
| TransAlta Corp. |
4,083 | 23,832 | ||||||
| TransCanada Corp. (a) |
1,606 | 79,192 | ||||||
| Wheaton Precious Metals Corp. (a) |
1,173 | 22,322 | ||||||
| Yamana Gold, Inc. |
3,594 | 9,483 | ||||||
|
|
|
|||||||
| 2,890,196 | ||||||||
|
|
|
|||||||
| CHILE — 0.0% (d) |
||||||||
| Enel Americas SA ADR |
1,244 | 12,714 | ||||||
See accompanying notes to financial statements.
110
Table of Contents
SPDR MSCI ACWI IMI ETF
SCHEDULE OF INVESTMENTS (continued)
September 30, 2017
| Security Description |
Shares |
Value |
||||||
| Enel Chile SA ADR |
690 | $ | 4,140 | |||||
| Enel Generacion Chile SA ADR |
310 | 8,171 | ||||||
| Sociedad Quimica y Minera de Chile SA ADR |
153 | 8,516 | ||||||
|
|
|
|||||||
| 33,541 | ||||||||
|
|
|
|||||||
| CHINA — 3.1% |
||||||||
| Agricultural Bank of China, Ltd. Class H |
84,000 | 37,641 | ||||||
| Alibaba Group Holding, Ltd. ADR (b) |
1,636 | 282,553 | ||||||
| Bank of China, Ltd. Class H |
167,000 | 82,317 | ||||||
| Bank of Communications Co., Ltd. Class H |
60,000 | 43,786 | ||||||
| Baozun, Inc. ADR (a) (b) |
7,848 | 257,100 | ||||||
| China Construction Bank Corp. Class H |
131,000 | 108,682 | ||||||
| China Life Insurance Co., Ltd. Class H |
23,000 | 68,464 | ||||||
| China Merchants Bank Co., Ltd. Class H |
29,174 | 102,529 | ||||||
| China Mobile, Ltd. |
11,500 | 116,536 | ||||||
| China Overseas Land & Investment, Ltd. |
24,000 | 78,047 | ||||||
| China Petroleum & Chemical Corp. Class H |
71,200 | 53,327 | ||||||
| China Pioneer Pharma Holdings, Ltd. |
360,000 | 119,836 | ||||||
| China Shenhua Energy Co., Ltd. Class H |
11,500 | 27,032 | ||||||
| China Telecom Corp., Ltd. Class H |
72,000 | 36,872 | ||||||
| China Unicom Hong Kong, Ltd. (b) |
24,000 | 33,370 | ||||||
| CITIC, Ltd. |
24,000 | 35,459 | ||||||
| CNOOC, Ltd. |
36,000 | 46,459 | ||||||
| COSCO SHIPPING Ports, Ltd. |
23,041 | 25,635 | ||||||
| Health and Happiness H&H International Holdings, Ltd. (b) |
30,500 | 148,972 | ||||||
| Hengan International Group Co., Ltd. |
6,000 | 55,539 | ||||||
| Huaneng Power International, Inc. Class H |
48,000 | 29,682 | ||||||
| Industrial & Commercial Bank of China, Ltd. Class H |
132,000 | 98,019 | ||||||
| PetroChina Co., Ltd. Class H |
48,000 | 30,420 | ||||||
| PICC Property & Casualty Co., Ltd. Class H |
25,859 | 45,622 | ||||||
| Ping An Insurance Group Co. of China, Ltd. Class H |
12,000 | 92,104 | ||||||
| Shandong Xinhua Pharmaceutical Co., Ltd. Class H (b) |
210,000 | 203,260 | ||||||
| Tencent Holdings, Ltd. |
12,000 | 516,522 | ||||||
| Yanzhou Coal Mining Co., Ltd. Class H |
24,000 | 23,629 | ||||||
|
|
|
|||||||
| 2,799,414 | ||||||||
|
|
|
|||||||
| COLOMBIA — 0.0% (d) |
||||||||
| Bancolombia SA ADR |
260 | 11,905 | ||||||
|
|
|
|||||||
| DENMARK — 0.7% |
||||||||
| AP Moeller - Maersk A/S Class B |
60 | 113,999 | ||||||
| Danske Bank A/S |
2,040 | 81,602 | ||||||
| DSV A/S |
3,057 | 231,310 | ||||||
| Novo Nordisk A/S Class B |
4,542 | 217,186 | ||||||
|
|
|
|||||||
| 644,097 | ||||||||
|
|
|
|||||||
| FINLAND — 0.4% |
||||||||
| Fortum Oyj |
1,590 | 31,748 | ||||||
| Metso Oyj |
945 | 34,677 | ||||||
| Nokia Oyj |
9,862 | 59,227 | ||||||
| Sampo Oyj Class A |
1,113 | 58,842 | ||||||
| UPM-Kymmene Oyj |
3,630 | 98,402 | ||||||
| Valmet Oyj |
179 | 3,519 | ||||||
| Wartsila Oyj Abp |
1,077 | 76,266 | ||||||
|
|
|
|||||||
| 362,681 | ||||||||
|
|
|
|||||||
| FRANCE — 3.3% |
||||||||
| Accor SA |
1,990 | 98,891 | ||||||
| Airbus SE |
815 | 77,474 | ||||||
| Alstom SA |
1,471 | 62,492 | ||||||
| AXA SA |
3,834 | 115,988 | ||||||
| BNP Paribas SA |
2,035 | 164,194 | ||||||
| Bouygues SA |
1,167 | 55,392 | ||||||
| Capgemini SE |
1,435 | 168,221 | ||||||
| Carrefour SA |
2,427 | 49,049 | ||||||
| Credit Agricole SA |
4,166 | 75,747 | ||||||
| Danone SA |
1,153 | 90,467 | ||||||
| Engie SA |
1,956 | 33,229 | ||||||
| Essilor International SA |
740 | 91,638 | ||||||
| Fnac Darty SA (b) |
1,182 | 113,787 | ||||||
| Hermes International |
13 | 6,555 | ||||||
| Kering |
251 | 100,014 | ||||||
| LVMH Moet Hennessy Louis Vuitton SE |
395 | 109,014 | ||||||
| Orange SA |
5,584 | 91,495 | ||||||
| Pernod Ricard SA |
536 | 74,170 | ||||||
| Publicis Groupe SA |
970 | 67,760 | ||||||
| Renault SA |
1,351 | 132,739 | ||||||
| Sanofi |
1,785 | 177,280 | ||||||
| Schneider Electric SE (b) |
1,292 | 112,463 | ||||||
| Societe Generale SA |
1,627 | 95,278 | ||||||
| Sodexo SA |
1,137 | 141,809 | ||||||
| TOTAL SA |
3,133 | 168,321 | ||||||
| Unibail-Rodamco SE REIT |
431 | 104,835 | ||||||
| Vallourec SA (a) (b) |
1,266 | 7,528 | ||||||
| Veolia Environnement SA |
3,431 | 79,297 | ||||||
| Vinci SA |
1,651 | 156,926 | ||||||
| Vivendi SA |
4,208 | 106,558 | ||||||
|
|
|
|||||||
| 2,928,611 | ||||||||
|
|
|
|||||||
| GERMANY — 3.1% |
||||||||
| adidas AG |
981 | 221,974 | ||||||
| Allianz SE |
921 | 206,819 | ||||||
| BASF SE |
1,483 | 157,858 | ||||||
| Bayer AG |
1,749 | 238,402 | ||||||
| Commerzbank AG (b) |
1,651 | 22,465 | ||||||
| CompuGroup Medical SE |
3,019 | 171,029 | ||||||
| Daimler AG |
2,052 | 163,674 | ||||||
| Deutsche Bank AG |
3,905 | 67,539 | ||||||
| Deutsche Boerse AG |
707 | 76,653 | ||||||
| Deutsche Lufthansa AG |
4,242 | 117,900 | ||||||
| Deutsche Post AG |
3,523 | 156,870 | ||||||
| Deutsche Telekom AG |
5,815 | 108,514 | ||||||
| E.ON SE |
3,642 | 41,230 | ||||||
| Fresenius Medical Care AG & Co. KGaA |
395 | 38,651 | ||||||
| Linde AG |
251 | 52,358 | ||||||
| MAN SE |
335 | 37,817 | ||||||
| Merck KGaA |
1,244 | 138,418 | ||||||
| Muenchener Rueckversicherungs-Gesellschaft AG in Muenchen |
536 | 114,629 | ||||||
| OSRAM Licht AG |
14 | 1,117 | ||||||
| RWE AG (b) |
1,220 | 27,721 | ||||||
| Salzgitter AG (a) |
1,292 | 58,622 | ||||||
| SAP SE |
1,814 | 198,775 | ||||||
See accompanying notes to financial statements.
111
Table of Contents
SPDR MSCI ACWI IMI ETF
SCHEDULE OF INVESTMENTS (continued)
September 30, 2017
| Security Description |
Shares |
Value |
||||||
| Siemens AG |
1,443 | $ | 203,345 | |||||
| ThyssenKrupp AG |
2,274 | 67,410 | ||||||
| Uniper SE |
331 | 9,078 | ||||||
| Volkswagen AG |
431 | 72,990 | ||||||
| Volkswagen AG Preference Shares |
395 | 64,442 | ||||||
|
|
|
|||||||
| 2,836,300 | ||||||||
|
|
|
|||||||
| HONG KONG — 1.4% |
||||||||
| AIA Group, Ltd. |
16,800 | 123,892 | ||||||
| Bank of East Asia, Ltd. |
16,278 | 70,337 | ||||||
| CK Asset Holdings, Ltd. |
18,920 | 156,603 | ||||||
| CK Hutchison Holdings, Ltd. |
11,420 | 145,990 | ||||||
| Global Brands Group Holding, Ltd. (b) |
8,000 | 768 | ||||||
| Hang Lung Properties, Ltd. |
12,000 | 28,484 | ||||||
| Henderson Land Development Co., Ltd. |
15,406 | 102,073 | ||||||
| Hong Kong Exchanges & Clearing, Ltd. |
3,795 | 102,033 | ||||||
| Li & Fung, Ltd. |
24,000 | 12,045 | ||||||
| Link REIT |
12,058 | 97,721 | ||||||
| New World Development Co., Ltd. |
39,762 | 57,118 | ||||||
| Sands China, Ltd. |
9,600 | 49,962 | ||||||
| Shangri-La Asia, Ltd. |
24,000 | 44,493 | ||||||
| Sun Hung Kai Properties, Ltd. |
12,253 | 199,074 | ||||||
| Swire Pacific, Ltd. Class A |
6,000 | 58,228 | ||||||
|
|
|
|||||||
| 1,248,821 | ||||||||
|
|
|
|||||||
| HUNGARY — 0.1% |
||||||||
| MOL Hungarian Oil & Gas PLC |
2,200 | 25,116 | ||||||
| Richter Gedeon Nyrt |
2,238 | 55,784 | ||||||
|
|
|
|||||||
| 80,900 | ||||||||
|
|
|
|||||||
| INDIA — 0.9% |
||||||||
| Dr Reddy’s Laboratories, Ltd. ADR |
2,554 | 91,127 | ||||||
| ICICI Bank, Ltd. ADR |
8,764 | 75,020 | ||||||
| Infosys, Ltd. ADR (a) |
11,147 | 162,635 | ||||||
| Larsen & Toubro, Ltd. GDR |
3,746 | 66,117 | ||||||
| Mahindra & Mahindra, Ltd. GDR |
1,723 | 33,254 | ||||||
| Reliance Industries, Ltd. GDR (e) |
3,960 | 94,446 | ||||||
| State Bank of India GDR |
1,669 | 64,090 | ||||||
| Tata Motors, Ltd. ADR (b) |
2,380 | 74,422 | ||||||
| Vedanta, Ltd. ADR |
3,722 | 72,058 | ||||||
| Wipro, Ltd. ADR |
10,614 | 60,287 | ||||||
|
|
|
|||||||
| 793,456 | ||||||||
|
|
|
|||||||
| INDONESIA — 0.5% |
||||||||
| Astra International Tbk PT |
60,800 | 35,661 | ||||||
| Bank Central Asia Tbk PT |
54,800 | 82,592 | ||||||
| Bank Mandiri Persero Tbk PT |
109,600 | 54,723 | ||||||
| Bank Rakyat Indonesia Persero Tbk PT |
64,200 | 72,808 | ||||||
| Gudang Garam Tbk PT |
6,000 | 29,312 | ||||||
| Telekomunikasi Indonesia Persero Tbk PT |
402,400 | 139,820 | ||||||
|
|
|
|||||||
| 414,916 | ||||||||
|
|
|
|||||||
| IRELAND — 0.3% |
||||||||
| CRH PLC |
1,958 | 74,708 | ||||||
| Experian PLC |
4,616 | 92,834 | ||||||
| Prothena Corp. PLC (b) |
1,813 | 117,428 | ||||||
|
|
|
|||||||
| 284,970 | ||||||||
|
|
|
|||||||
| ISRAEL — 0.3% |
||||||||
| Bank Hapoalim BM |
8,316 | 58,216 | ||||||
| Bank Leumi Le-Israel BM |
37,874 | 201,024 | ||||||
| Teva Pharmaceutical Industries, Ltd. ADR |
1,423 | 25,045 | ||||||
|
|
|
|||||||
| 284,285 | ||||||||
|
|
|
|||||||
| ITALY — 0.7% |
||||||||
| Assicurazioni Generali SpA |
3,450 | 64,279 | ||||||
| Atlantia SpA |
923 | 29,145 | ||||||
| Banca Monte dei Paschi di Siena SpA (b) (f) |
90 | 802 | ||||||
| Enel SpA |
15,198 | 91,542 | ||||||
| Eni SpA |
5,232 | 86,594 | ||||||
| Ferrari NV |
277 | 30,618 | ||||||
| GEDI Gruppo Editoriale SpA (b) |
111 | 99 | ||||||
| Intesa Sanpaolo SpA |
27,419 | 96,985 | ||||||
| Italgas SpA |
1,720 | 9,659 | ||||||
| Luxottica Group SpA |
369 | 20,629 | ||||||
| Mediaset SpA (a) (b) |
13,484 | 46,675 | ||||||
| Saipem SpA (a) (b) |
1,573 | 6,784 | ||||||
| Snam SpA |
8,606 | 41,469 | ||||||
| Telecom Italia SpA/Milano (b) |
64,065 | 60,022 | ||||||
| UniCredit SpA (b) |
3,632 | 77,373 | ||||||
|
|
|
|||||||
| 662,675 | ||||||||
|
|
|
|||||||
| JAPAN — 8.0% |
||||||||
| Aisin Seiki Co., Ltd. |
1,200 | 63,217 | ||||||
| Asahi Group Holdings, Ltd. |
1,200 | 48,569 | ||||||
| Asahi Kasei Corp. |
12,000 | 147,648 | ||||||
| Astellas Pharma, Inc. |
6,000 | 76,303 | ||||||
| Bridgestone Corp. |
1,200 | 54,433 | ||||||
| Canon, Inc. |
1,200 | 40,990 | ||||||
| Credit Saison Co., Ltd. |
2,400 | 49,785 | ||||||
| Daiichi Sankyo Co., Ltd. |
3,600 | 81,169 | ||||||
| Daikin Industries, Ltd. |
1,200 | 121,476 | ||||||
| Daiwa Securities Group, Inc. |
12,000 | 67,939 | ||||||
| Denso Corp. |
2,400 | 121,380 | ||||||
| Eisai Co., Ltd. |
1,200 | 61,575 | ||||||
| FUJIFILM Holdings Corp. |
2,400 | 93,109 | ||||||
| Fujitsu, Ltd. |
11,000 | 81,685 | ||||||
| Hitachi, Ltd. |
12,000 | 84,527 | ||||||
| Hokuhoku Financial Group, Inc. |
2,400 | 38,591 | ||||||
| Honda Motor Co., Ltd. |
2,400 | 71,042 | ||||||
| Hoya Corp. |
2,400 | 129,525 | ||||||
| ITOCHU Corp. |
3,600 | 58,942 | ||||||
| Japan Tobacco, Inc. |
2,400 | 78,632 | ||||||
| JFE Holdings, Inc. |
2,400 | 46,853 | ||||||
| JSR Corp. |
2,400 | 45,584 | ||||||
| JXTG Holdings, Inc. |
6,000 | 30,857 | ||||||
| Kajima Corp. |
12,000 | 119,184 | ||||||
| Kamigumi Co., Ltd. |
6,000 | 138,853 | ||||||
| Kansai Electric Power Co., Inc. |
2,400 | 30,692 | ||||||
| KDDI Corp. |
7,200 | 189,778 | ||||||
| Kobe Steel, Ltd. |
3,600 | 41,128 | ||||||
| Komatsu, Ltd. |
2,400 | 68,249 | ||||||
| Konica Minolta, Inc. (a) |
6,000 | 49,252 | ||||||
| Kyocera Corp. |
2,400 | 148,863 | ||||||
| Makita Corp. |
2,400 | 96,691 | ||||||
| Marubeni Corp. |
12,000 | 81,926 | ||||||
| Marui Group Co., Ltd. (a) |
4,300 | 61,540 | ||||||
| Mebuki Financial Group, Inc. |
12,800 | 49,465 | ||||||
| Mitsubishi Chemical Holdings Corp. |
6,000 | 57,140 | ||||||
| Mitsubishi Corp. |
2,400 | 55,765 | ||||||
| Mitsubishi Electric Corp. |
12,000 | 187,412 | ||||||
See accompanying notes to financial statements.
112
Table of Contents
SPDR MSCI ACWI IMI ETF
SCHEDULE OF INVESTMENTS (continued)
September 30, 2017
| Security Description |
Shares |
Value |
||||||
| Mitsubishi Heavy Industries, Ltd. |
1,200 | $ | 47,429 | |||||
| Mitsubishi UFJ Financial Group, Inc. |
21,500 | 139,564 | ||||||
| Mitsui & Co., Ltd. |
2,400 | 35,457 | ||||||
| Mizuho Financial Group, Inc. (a) |
44,300 | 77,569 | ||||||
| MS&AD Insurance Group Holdings, Inc. |
2,400 | 77,246 | ||||||
| Murata Manufacturing Co., Ltd. |
1,200 | 176,325 | ||||||
| NEC Corp. |
200 | 5,419 | ||||||
| Nintendo Co., Ltd. |
400 | 147,684 | ||||||
| Nippon Steel & Sumitomo Metal Corp. |
3,500 | 80,329 | ||||||
| Nippon Yusen KK (b) |
2,400 | 49,870 | ||||||
| Nissan Motor Co., Ltd. |
4,800 | 47,525 | ||||||
| Nitto Denko Corp. |
1,200 | 100,017 | ||||||
| Nomura Holdings, Inc. |
11,900 | 66,601 | ||||||
| NTT Data Corp. |
6,000 | 64,176 | ||||||
| NTT DOCOMO, Inc. |
1,900 | 43,388 | ||||||
| Obayashi Corp. |
12,000 | 143,810 | ||||||
| ORIX Corp. |
4,800 | 77,374 | ||||||
| Osaka Gas Co., Ltd. |
2,400 | 44,604 | ||||||
| Panasonic Corp. |
7,200 | 104,292 | ||||||
| Resona Holdings, Inc. |
7,200 | 36,971 | ||||||
| Rohm Co., Ltd. |
1,200 | 102,767 | ||||||
| Secom Co., Ltd. |
1,200 | 87,437 | ||||||
| Seven & i Holdings Co., Ltd. |
1,200 | 46,320 | ||||||
| Shin-Etsu Chemical Co., Ltd. |
1,200 | 107,245 | ||||||
| SoftBank Group Corp. |
2,400 | 193,680 | ||||||
| Sompo Holdings, Inc. |
2,400 | 93,343 | ||||||
| Sony Corp. |
3,600 | 133,875 | ||||||
| Sumitomo Chemical Co., Ltd. |
12,000 | 74,943 | ||||||
| Sumitomo Corp. |
2,400 | 34,508 | ||||||
| Sumitomo Electric Industries, Ltd. |
3,600 | 58,782 | ||||||
| Sumitomo Mitsui Financial Group, Inc. |
2,400 | 92,107 | ||||||
| Sumitomo Mitsui Trust Holdings, Inc. |
1,200 | 43,292 | ||||||
| T&D Holdings, Inc. |
4,800 | 69,656 | ||||||
| Takeda Pharmaceutical Co., Ltd. |
1,200 | 66,244 | ||||||
| TDK Corp. |
1,200 | 81,446 | ||||||
| Teijin, Ltd. |
2,400 | 47,290 | ||||||
| Terumo Corp. |
2,400 | 94,345 | ||||||
| Tokio Marine Holdings, Inc. |
2,400 | 93,855 | ||||||
| Tokyo Electron, Ltd. |
1,200 | 184,214 | ||||||
| Tokyu Corp. |
5,500 | 77,835 | ||||||
| Toppan Printing Co., Ltd. |
12,000 | 118,971 | ||||||
| Toshiba Corp. (b) |
12,000 | 33,581 | ||||||
| Toyota Motor Corp. |
4,800 | 286,128 | ||||||
| Toyota Tsusho Corp. |
3,600 | 118,172 | ||||||
| West Japan Railway Co. |
1,200 | 83,386 | ||||||
| Yamada Denki Co., Ltd. (a) |
4,800 | 26,225 | ||||||
| Yamaha Corp. |
3,900 | 143,784 | ||||||
|
|
|
|||||||
| 7,228,850 | ||||||||
|
|
|
|||||||
| LUXEMBOURG — 0.0% (d) |
||||||||
| ArcelorMittal (b) |
1,371 | 35,374 | ||||||
|
|
|
|||||||
| MALAYSIA — 0.1% |
||||||||
| CIMB Group Holdings Bhd |
12,000 | 17,904 | ||||||
| Malayan Banking Bhd |
8,000 | 18,056 | ||||||
| Public Bank Bhd |
5,200 | 25,172 | ||||||
| Tenaga Nasional Bhd |
6,100 | 20,687 | ||||||
|
|
|
|||||||
| 81,819 | ||||||||
|
|
|
|||||||
| MEXICO — 0.4% |
||||||||
| America Movil SAB de CV Series L |
93,026 | 82,784 | ||||||
| Cemex SAB de CV Series CPO (b) |
47,666 | 43,442 | ||||||
| Fomento Economico Mexicano SAB de CV |
9,562 | 91,643 | ||||||
| Grupo Financiero Banorte SAB de CV Series O |
9,204 | 63,650 | ||||||
| Grupo Mexico SAB de CV Series B |
15,308 | 46,946 | ||||||
| Grupo Televisa SAB Series CPO |
8,133 | 40,197 | ||||||
| Industrias Penoles SAB de CV |
620 | 15,443 | ||||||
|
|
|
|||||||
| 384,105 | ||||||||
|
|
|
|||||||
| NETHERLANDS — 1.6% |
||||||||
| Akzo Nobel NV |
966 | 89,213 | ||||||
| ASML Holding NV |
875 | 149,009 | ||||||
| Heineken NV |
647 | 63,982 | ||||||
| ING Groep NV |
8,398 | 154,879 | ||||||
| Koninklijke Ahold Delhaize NV |
3,577 | 66,898 | ||||||
| Koninklijke DSM NV |
1,153 | 94,407 | ||||||
| Koninklijke KPN NV |
11,057 | 37,973 | ||||||
| Koninklijke Philips NV |
3,480 | 143,704 | ||||||
| Royal Dutch Shell PLC Class A |
2,082 | 62,808 | ||||||
| Royal Dutch Shell PLC Class B |
11,878 | 365,654 | ||||||
| Wolters Kluwer NV |
3,630 | 167,772 | ||||||
|
|
|
|||||||
| 1,396,299 | ||||||||
|
|
|
|||||||
| NORWAY — 0.3% |
||||||||
| DNB ASA |
4,506 | 90,852 | ||||||
| Norsk Hydro ASA |
13,852 | 100,754 | ||||||
| Telenor ASA |
3,690 | 78,062 | ||||||
| Yara International ASA |
768 | 34,414 | ||||||
|
|
|
|||||||
| 304,082 | ||||||||
|
|
|
|||||||
| PERU — 0.0% (d) |
| |||||||
| Cia de Minas Buenaventura SAA ADR |
324 | 4,144 | ||||||
|
|
|
|||||||
| PHILIPPINES — 0.0% (d) |
| |||||||
| PLDT, Inc. ADR |
897 | 28,632 | ||||||
|
|
|
|||||||
| POLAND — 0.0% (d) |
| |||||||
| Polski Koncern Naftowy ORLEN SA |
538 | 17,968 | ||||||
| Powszechna Kasa Oszczednosci Bank Polski SA (b) |
1,684 | 16,327 | ||||||
|
|
|
|||||||
| 34,295 | ||||||||
|
|
|
|||||||
| RUSSIA — 0.4% |
| |||||||
| Gazprom PJSC ADR |
9,573 | 40,111 | ||||||
| LUKOIL PJSC ADR |
1,185 | 62,841 | ||||||
| MMC Norilsk Nickel PJSC ADR |
1,447 | 24,888 | ||||||
| Mobile TeleSystems PJSC ADR |
2,262 | 23,615 | ||||||
| RusHydro PJSC ADR (c) |
579 | 831 | ||||||
| RusHydro PJSC ADR (c) |
1,077 | 1,540 | ||||||
| Sberbank of Russia PJSC ADR (c) |
4,626 | 65,851 | ||||||
| Sberbank of Russia PJSC ADR (c) |
427 | 6,093 | ||||||
| Surgutneftegas OJSC ADR |
10,445 | 54,001 | ||||||
| Tatneft PJSC ADR (c) |
1,097 | 46,842 | ||||||
| Tatneft PJSC ADR (c) |
96 | 4,151 | ||||||
|
|
|
|||||||
| 330,764 | ||||||||
|
|
|
|||||||
| SINGAPORE — 0.6% |
| |||||||
| Broadcom, Ltd. |
929 | 225,320 | ||||||
| CapitaLand, Ltd. |
36,000 | 94,908 | ||||||
| Singapore Exchange, Ltd. |
24,000 | 130,609 | ||||||
See accompanying notes to financial statements.
113
Table of Contents
SPDR MSCI ACWI IMI ETF
SCHEDULE OF INVESTMENTS (continued)
September 30, 2017
| Security Description |
Shares |
Value |
||||||
| Singapore Press Holdings, Ltd. (a) |
24,000 | $ | 48,072 | |||||
| Singapore Telecommunications, Ltd. |
12,000 | 32,519 | ||||||
|
|
|
|||||||
| 531,428 | ||||||||
|
|
|
|||||||
| SOUTH AFRICA — 0.7% |
| |||||||
| AngloGold Ashanti, Ltd. |
1,053 | 9,928 | ||||||
| Discovery, Ltd. (a) |
15,747 | 164,042 | ||||||
| FirstRand, Ltd. (a) |
13,266 | 51,119 | ||||||
| Gold Fields, Ltd. |
2,554 | 11,156 | ||||||
| Harmony Gold Mining Co., Ltd. |
2,422 | 4,326 | ||||||
| Impala Platinum Holdings, Ltd. (b) |
1,639 | 3,763 | ||||||
| Lonmin PLC (a) (b) |
13 | 12 | ||||||
| MTN Group, Ltd. |
4,899 | 45,128 | ||||||
| Naspers, Ltd. Class N |
780 | 168,680 | ||||||
| Novus Holdings, Ltd. |
270 | 130 | ||||||
| Sanlam, Ltd. |
12,283 | 61,549 | ||||||
| Sasol, Ltd. |
945 | 25,965 | ||||||
| Sibanye-Stillwater |
2,458 | 2,771 | ||||||
| Standard Bank Group, Ltd. |
3,174 | 37,096 | ||||||
|
|
|
|||||||
| 585,665 | ||||||||
|
|
|
|||||||
| SOUTH KOREA — 1.8% |
| |||||||
| Able C&C Co., Ltd. |
4,152 | 57,639 | ||||||
| DIO Corp. (b) |
1,932 | 51,195 | ||||||
| E-MART, Inc. |
27 | 4,915 | ||||||
| Hana Financial Group, Inc. |
410 | 16,950 | ||||||
| Hyundai Construction Equipment Co., Ltd. (b) |
2 | 650 | ||||||
| Hyundai Electric & Energy System Co., Ltd. (b) |
2 | 402 | ||||||
| Hyundai Heavy Industries Co., Ltd. (b) |
30 | 3,798 | ||||||
| Hyundai Mobis Co., Ltd. |
167 | 34,994 | ||||||
| Hyundai Motor Co. |
373 | 49,013 | ||||||
| Hyundai Robotics Co., Ltd. (b) |
6 | 2,232 | ||||||
| Hyundai Steel Co. |
163 | 7,514 | ||||||
| JW Holdings Corp. |
4,827 | 33,294 | ||||||
| JW Pharmaceutical Corp. |
1,028 | 36,306 | ||||||
| KB Financial Group, Inc. |
903 | 44,230 | ||||||
| Kia Motors Corp. |
300 | 8,290 | ||||||
| Korea Electric Power Corp. ADR (a) |
990 | 16,592 | ||||||
| KT&G Corp. |
336 | 30,949 | ||||||
| LG Chem, Ltd. Preference Shares |
507 | 112,214 | ||||||
| LG Electronics, Inc. |
129 | 9,281 | ||||||
| LG Household & Health Care, Ltd. |
53 | 43,312 | ||||||
| Lotte Chemical Corp. |
17 | 5,610 | ||||||
| NAVER Corp. |
95 | 61,793 | ||||||
| NHN Entertainment Corp. (b) |
33 | 1,968 | ||||||
| POSCO ADR |
1,356 | 94,106 | ||||||
| Samsung C&T Corp. |
158 | 18,623 | ||||||
| Samsung Electronics Co., Ltd. GDR |
458 | 518,456 | ||||||
| Samsung Engineering Co., Ltd. (b) |
355 | 3,409 | ||||||
| Samsung Fire & Marine Insurance Co., Ltd. |
89 | 21,758 | ||||||
| Samsung Heavy Industries Co., Ltd. (b) |
692 | 6,767 | ||||||
| Samsung Securities Co., Ltd. |
351 | 10,588 | ||||||
| SeAH Steel Corp. |
2,134 | 175,512 | ||||||
| Shinhan Financial Group Co., Ltd. |
903 | 39,657 | ||||||
| SK Holdings Co., Ltd. |
86 | 21,625 | ||||||
| SK Hynix, Inc. |
1,395 | 100,970 | ||||||
| SK Innovation Co., Ltd. |
68 | 11,815 | ||||||
|
|
|
|||||||
| 1,656,427 | ||||||||
|
|
|
|||||||
| SPAIN — 1.0% |
| |||||||
| Acciona SA |
1,582 | 127,270 | ||||||
| Acerinox SA |
3,629 | 52,340 | ||||||
| ACS Actividades de Construccion y Servicios SA |
2,800 | 103,790 | ||||||
| Amadeus IT Group SA |
1,206 | 78,401 | ||||||
| Banco Bilbao Vizcaya Argentaria SA |
10,804 | 96,573 | ||||||
| Banco Santander SA |
24,454 | 170,768 | ||||||
| Iberdrola SA |
9,567 | 74,330 | ||||||
| Industria de Diseno Textil SA |
2,405 | 90,655 | ||||||
| Repsol SA |
1,795 | 33,083 | ||||||
| Telefonica SA |
8,707 | 94,617 | ||||||
|
|
|
|||||||
| 921,827 | ||||||||
|
|
|
|||||||
| SWEDEN — 1.1% |
| |||||||
| Assa Abloy AB Class B |
4,095 | 93,315 | ||||||
| Atlas Copco AB Class B |
3,810 | 147,408 | ||||||
| Nordea Bank AB |
6,612 | 89,431 | ||||||
| Sandvik AB |
3,547 | 61,055 | ||||||
| Securitas AB Class B |
5,512 | 92,110 | ||||||
| Skandinaviska Enskilda Banken AB Class A |
8,340 | 109,636 | ||||||
| Skanska AB Class B |
3,618 | 83,642 | ||||||
| SKF AB Class B |
2,573 | 55,953 | ||||||
| Svenska Handelsbanken AB Class A |
3,383 | 50,938 | ||||||
| Tele2 AB Class B |
2,530 | 28,888 | ||||||
| Telefonaktiebolaget LM Ericsson Class B |
6,751 | 38,683 | ||||||
| Telia Co. AB |
5,815 | 27,328 | ||||||
| Volvo AB Class A |
5,565 | 106,700 | ||||||
|
|
|
|||||||
| 985,087 | ||||||||
|
|
|
|||||||
| SWITZERLAND — 2.9% |
| |||||||
| ABB, Ltd. |
5,027 | 124,376 | ||||||
| Adecco Group AG (b) |
969 | 75,509 | ||||||
| Cie Financiere Richemont SA |
1,363 | 124,665 | ||||||
| Credit Suisse Group AG (b) |
4,248 | 67,302 | ||||||
| Ferguson PLC |
1,053 | 69,169 | ||||||
| Geberit AG |
395 | 187,008 | ||||||
| Givaudan SA |
48 | 104,522 | ||||||
| Glencore PLC (b) |
6,604 | 30,302 | ||||||
| Kuehne + Nagel International AG |
466 | 86,352 | ||||||
| LafargeHolcim, Ltd. (b) |
930 | 54,401 | ||||||
| Nestle SA |
4,818 | 403,824 | ||||||
| Novartis AG |
3,281 | 281,103 | ||||||
| Roche Holding AG |
1,220 | 311,682 | ||||||
| Santhera Pharmaceutical Holding AG (a) (b) |
606 | 24,582 | ||||||
| SGS SA |
48 | 115,238 | ||||||
| Swatch Group AG (a) |
144 | 59,945 | ||||||
| Swiss Re AG |
1,173 | 106,317 | ||||||
| TE Connectivity, Ltd. |
2,482 | 206,155 | ||||||
| UBS Group AG (b) |
6,826 | 116,753 | ||||||
| Zurich Insurance Group AG |
239 | 72,965 | ||||||
|
|
|
|||||||
| 2,622,170 | ||||||||
|
|
|
|||||||
| TAIWAN — 1.4% |
| |||||||
| Advanced Semiconductor Engineering, Inc. ADR |
14,349 | 88,677 | ||||||
| AU Optronics Corp. ADR (a) |
24,401 | 98,580 | ||||||
| Chunghwa Telecom Co., Ltd. ADR |
3,269 | 111,506 | ||||||
See accompanying notes to financial statements.
114
Table of Contents
SPDR MSCI ACWI IMI ETF
SCHEDULE OF INVESTMENTS (continued)
September 30, 2017
| Security Description |
Shares |
Value |
||||||
| Hon Hai Precision Industry Co., Ltd. GDR |
25,771 | $ | 180,397 | |||||
| Siliconware Precision Industries Co., Ltd. ADR |
16,934 | 133,609 | ||||||
| Taiwan Semiconductor Manufacturing Co., Ltd. ADR |
13,628 | 511,731 | ||||||
| United Microelectronics Corp. ADR (a) |
56,217 | 140,543 | ||||||
|
|
|
|||||||
| 1,265,043 | ||||||||
|
|
|
|||||||
| THAILAND — 0.2% |
| |||||||
| Bangkok Bank PCL |
13,200 | 77,181 | ||||||
| CP ALL PCL NVDR |
8,900 | 17,813 | ||||||
| Kasikornbank PCL NVDR |
2,100 | 13,035 | ||||||
| PTT PCL (g) |
2,400 | 29,361 | ||||||
| Siam Commercial Bank PCL NVDR |
3,200 | 14,681 | ||||||
|
|
|
|||||||
| 152,071 | ||||||||
|
|
|
|||||||
| TURKEY — 0.2% |
| |||||||
| Akbank TAS |
9,083 | 24,009 | ||||||
| Emlak Konut Gayrimenkul Yatirim Ortakligi A/S REIT (b) |
49,741 | 37,487 | ||||||
| Turkiye Garanti Bankasi A/S |
10,507 | 28,601 | ||||||
| Turkiye Is Bankasi Class C |
24,114 | 45,975 | ||||||
|
|
|
|||||||
| 136,072 | ||||||||
|
|
|
|||||||
| UNITED KINGDOM — 6.0% |
| |||||||
| 3i Group PLC |
22,031 | 269,864 | ||||||
| Anglo American PLC |
2,770 | 49,781 | ||||||
| AstraZeneca PLC |
2,196 | 145,987 | ||||||
| BAE Systems PLC |
11,076 | 93,842 | ||||||
| Barclays PLC |
30,004 | 77,833 | ||||||
| BP PLC |
25,071 | 160,547 | ||||||
| British American Tobacco PLC |
2,054 | 128,749 | ||||||
| British Land Co. PLC REIT |
7,942 | 64,145 | ||||||
| BT Group PLC |
25,842 | 98,431 | ||||||
| Burberry Group PLC |
1,968 | 46,470 | ||||||
| Capita PLC |
6,676 | 50,606 | ||||||
| CNH Industrial NV |
1,712 | 20,563 | ||||||
| Cobham PLC. |
69,090 | 135,056 | ||||||
| Compass Group PLC |
5,391 | 114,496 | ||||||
| CYBG PLC (b) |
934 | 3,767 | ||||||
| Diageo PLC |
3,378 | 111,172 | ||||||
| Fiat Chrysler Automobiles NV (b) |
2,122 | 38,031 | ||||||
| G4S PLC |
7,743 | 28,911 | ||||||
| GlaxoSmithKline PLC |
7,767 | 155,111 | ||||||
| Hammerson PLC REIT |
12,777 | 92,054 | ||||||
| HSBC Holdings PLC |
31,620 | 312,700 | ||||||
| Imperial Brands PLC |
1,244 | 53,141 | ||||||
| Indivior PLC (b) |
946 | 4,311 | ||||||
| InterContinental Hotels Group PLC |
2,496 | 132,209 | ||||||
| J Sainsbury PLC. |
9,155 | 29,221 | ||||||
| Land Securities Group PLC REIT |
5,135 | 66,995 | ||||||
| Liberty Global PLC Class A (b) |
1,244 | 42,184 | ||||||
| Liberty Global PLC Series C (b) |
2,220 | 72,594 | ||||||
| Liberty Global PLC LiLAC Class C (b) |
309 | 7,200 | ||||||
| Lloyds Banking Group PLC |
107,617 | 97,792 | ||||||
| Marks & Spencer Group PLC (a) |
12,641 | 59,936 | ||||||
| Micro Focus International PLC ADR (b) |
683 | 21,788 | ||||||
| National Grid PLC |
2,315 | 28,717 | ||||||
| Next PLC |
897 | 63,302 | ||||||
| Old Mutual PLC. |
18,636 | 48,556 | ||||||
| Pearson PLC |
1,483 | 12,177 | ||||||
| Pentair PLC |
143 | 9,718 | ||||||
| Prudential PLC |
6,031 | 144,554 | ||||||
| Randgold Resources, Ltd. |
367 | 36,018 | ||||||
| Reckitt Benckiser Group PLC |
993 | 90,767 | ||||||
| RELX NV |
6,531 | 139,054 | ||||||
| RELX PLC |
3,869 | 84,974 | ||||||
| Rio Tinto PLC |
2,668 | 124,317 | ||||||
| Rio Tinto, Ltd. (a) |
1,257 | 65,619 | ||||||
| Rolls-Royce Holdings PLC (b) |
3,929 | 46,757 | ||||||
| RSA Insurance Group PLC |
8,770 | 73,304 | ||||||
| Sage Group PLC |
21,128 | 197,999 | ||||||
| Severn Trent PLC |
3,105 | 90,523 | ||||||
| Sky PLC |
2,494 | 30,617 | ||||||
| Smith & Nephew PLC |
5,632 | 101,857 | ||||||
| Smiths Group PLC |
4,337 | 91,761 | ||||||
| SSE PLC |
2,334 | 43,746 | ||||||
| Standard Chartered PLC (b) |
6,071 | 60,404 | ||||||
| Standard Life Aberdeen PLC |
20,882 | 121,451 | ||||||
| TechnipFMC PLC (b) (c) |
1,286 | 35,598 | ||||||
| TechnipFMC PLC (b) (c) |
2,482 | 69,297 | ||||||
| Tesco PLC (b) |
14,684 | 36,870 | ||||||
| Tullow Oil PLC (b) |
3,334 | 8,324 | ||||||
| Unilever NV |
2,492 | 147,420 | ||||||
| Unilever PLC |
1,901 | 110,155 | ||||||
| United Utilities Group PLC |
5,524 | 63,329 | ||||||
| Vodafone Group PLC |
45,308 | 126,924 | ||||||
| Whitbread PLC |
4,059 | 205,087 | ||||||
| WPP PLC |
4,276 | 79,456 | ||||||
|
|
|
|||||||
| 5,374,139 | ||||||||
|
|
|
|||||||
| UNITED STATES — 51.5% |
| |||||||
| 3M Co. |
1,244 | 261,116 | ||||||
| Abbott Laboratories |
4,642 | 247,697 | ||||||
| AbbVie, Inc. |
1,220 | 108,409 | ||||||
| Accenture PLC Class A |
1,244 | 168,027 | ||||||
| Adient PLC. |
13 | 1,092 | ||||||
| Adobe Systems, Inc. (b) |
2,722 | 406,068 | ||||||
| AdvanSix, Inc. (b) |
88 | 3,498 | ||||||
| Aetna, Inc. |
1,877 | 298,462 | ||||||
| Aflac, Inc. |
2,482 | 202,010 | ||||||
| Agilent Technologies, Inc. |
2,482 | 159,344 | ||||||
| AGNC Investment Corp. REIT |
1,244 | 26,970 | ||||||
| Alexion Pharmaceuticals, Inc. (b) |
944 | 132,434 | ||||||
| Allegion PLC |
406 | 35,107 | ||||||
| Allergan PLC |
463 | 94,892 | ||||||
| Allstate Corp. |
2,482 | 228,121 | ||||||
| Alphabet, Inc. Class A (b) |
608 | 592,022 | ||||||
| Alphabet, Inc. Class C (b) |
608 | 583,139 | ||||||
| Altria Group, Inc. |
2,482 | 157,408 | ||||||
| Amazon.com, Inc. (b) |
802 | 771,003 | ||||||
| American Electric Power Co., Inc. |
2,482 | 174,336 | ||||||
| American Express Co. |
2,482 | 224,522 | ||||||
| American Tower Corp. REIT |
1,244 | 170,030 | ||||||
| Amgen, Inc. |
2,124 | 396,020 | ||||||
| Anadarko Petroleum Corp. |
1,244 | 60,769 | ||||||
| Annaly Capital Management, Inc. REIT |
2,482 | 30,256 | ||||||
| Anthem, Inc. |
1,244 | 236,211 | ||||||
| Apache Corp. (a) |
1,244 | 56,975 | ||||||
See accompanying notes to financial statements.
115
Table of Contents
SPDR MSCI ACWI IMI ETF
SCHEDULE OF INVESTMENTS (continued)
September 30, 2017
| Security Description |
Shares |
Value |
||||||
| Apple, Inc. |
8,713 | $ | 1,342,848 | |||||
| Applied Materials, Inc. |
7,689 | 400,520 | ||||||
| Archer-Daniels-Midland Co. |
3,726 | 158,392 | ||||||
| AT&T, Inc. |
11,045 | 432,633 | ||||||
| Automatic Data Processing, Inc. |
1,244 | 135,994 | ||||||
| Baker Hughes a GE Co. |
1,884 | 68,992 | ||||||
| Bank of America Corp. |
21,134 | 535,536 | ||||||
| Bank of New York Mellon Corp. |
3,726 | 197,553 | ||||||
| Baxter International, Inc. |
2,429 | 152,420 | ||||||
| Becton Dickinson and Co. |
1,244 | 243,762 | ||||||
| Bed Bath & Beyond, Inc. (a) |
1,244 | 29,197 | ||||||
| Berkshire Hathaway, Inc. Class B (b) |
1,444 | 264,714 | ||||||
| Biogen, Inc. (b) |
763 | 238,911 | ||||||
| Bioverativ, Inc. (b) |
381 | 21,744 | ||||||
| Boeing Co. |
1,244 | 316,237 | ||||||
| Brighthouse Financial, Inc. (b) |
367 | 22,314 | ||||||
| Bristol-Myers Squibb Co. |
3,726 | 237,495 | ||||||
| C.H. Robinson Worldwide, Inc. |
1,244 | 94,668 | ||||||
| California Resources Corp. (a) (b) |
81 | 847 | ||||||
| Capital One Financial Corp. |
1,244 | 105,317 | ||||||
| Carnival Corp. |
1,244 | 80,325 | ||||||
| Caterpillar, Inc. |
1,244 | 155,139 | ||||||
| CBS Corp. Class B |
2,470 | 143,260 | ||||||
| CDK Global, Inc. |
409 | 25,804 | ||||||
| Celgene Corp. (b) |
2,489 | 362,946 | ||||||
| CenturyLink, Inc. (a) |
2,482 | 46,910 | ||||||
| Charles Schwab Corp. |
6,214 | 271,800 | ||||||
| Charter Communications, Inc. Class A (b) |
529 | 192,249 | ||||||
| Chemours Co. |
422 | 21,357 | ||||||
| Chesapeake Energy Corp. (a) (b) |
3,726 | 16,022 | ||||||
| Chevron Corp. |
3,122 | 366,835 | ||||||
| Chubb, Ltd. |
1,995 | 284,387 | ||||||
| Church & Dwight Co., Inc. |
3,755 | 181,930 | ||||||
| Cisco Systems, Inc. |
12,415 | 417,516 | ||||||
| Citigroup, Inc. |
6,214 | 452,006 | ||||||
| Citrix Systems, Inc. (b) |
1,244 | 95,564 | ||||||
| Clorox Co. |
1,244 | 164,096 | ||||||
| Coach, Inc. |
1,244 | 50,108 | ||||||
| Coca-Cola Co. |
4,977 | 224,015 | ||||||
| Cognizant Technology Solutions Corp. Class A |
2,489 | 180,552 | ||||||
| Colgate-Palmolive Co. |
2,482 | 180,814 | ||||||
| Comcast Corp. Class A |
6,410 | 246,657 | ||||||
| CommerceHub, Inc. Series A (b) |
46 | 1,038 | ||||||
| CommerceHub, Inc. Series C (b) |
105 | 2,242 | ||||||
| Conagra Brands, Inc. |
2,482 | 83,743 | ||||||
| ConocoPhillips |
2,482 | 124,224 | ||||||
| Corning, Inc. |
4,977 | 148,912 | ||||||
| Costco Wholesale Corp. |
1,244 | 204,377 | ||||||
| Coty, Inc. Class A |
659 | 10,893 | ||||||
| CSX Corp. |
4,977 | 270,052 | ||||||
| Cummins, Inc. |
1,244 | 209,029 | ||||||
| CVS Health Corp. |
2,482 | 201,836 | ||||||
| Danaher Corp. |
2,482 | 212,906 | ||||||
| Deere & Co. |
1,244 | 156,234 | ||||||
| Dell Technologies, Inc. Class V (b) |
555 | 42,852 | ||||||
| Devon Energy Corp. |
1,244 | 45,667 | ||||||
| Discover Financial Services |
2,482 | 160,039 | ||||||
| Dollar Tree, Inc. (b) |
1,675 | 145,423 | ||||||
| DowDuPont, Inc. |
6,907 | 478,172 | ||||||
| Duke Energy Corp. |
1,351 | 113,376 | ||||||
| DXC Technology Co. |
460 | 39,505 | ||||||
| Easterly Government Properties, Inc. REIT |
7,000 | 144,690 | ||||||
| Eaton Corp. PLC |
2,482 | 190,593 | ||||||
| eBay, Inc. (b) |
3,726 | 143,302 | ||||||
| Ecolab, Inc. |
1,244 | 159,991 | ||||||
| Edison International |
2,482 | 191,536 | ||||||
| Eli Lilly & Co. |
2,482 | 212,310 | ||||||
| Emerson Electric Co. |
2,482 | 155,969 | ||||||
| EOG Resources, Inc. |
2,489 | 240,786 | ||||||
| Equity Residential REIT |
1,244 | 82,017 | ||||||
| Estee Lauder Cos., Inc. Class A |
1,244 | 134,153 | ||||||
| Exelon Corp. |
2,482 | 93,497 | ||||||
| Express Scripts Holding Co. (b) |
1,736 | 109,924 | ||||||
| Exxon Mobil Corp. |
6,652 | 545,331 | ||||||
| Facebook, Inc. Class A (b) |
3,299 | 563,700 | ||||||
| Fastenal Co. (a) |
1,244 | 56,702 | ||||||
| FedEx Corp. |
1,244 | 280,621 | ||||||
| FirstEnergy Corp. |
2,482 | 76,520 | ||||||
| Ford Motor Co. |
9,934 | 118,910 | ||||||
| Fortive Corp. |
1,241 | 87,850 | ||||||
| Franklin Resources, Inc. |
3,726 | 165,844 | ||||||
| Freeport-McMoRan, Inc. (b) |
2,482 | 34,847 | ||||||
| General Dynamics Corp. |
1,244 | 255,742 | ||||||
| General Electric Co. |
17,316 | 418,701 | ||||||
| General Mills, Inc. |
1,244 | 64,389 | ||||||
| General Motors Co. |
2,482 | 100,223 | ||||||
| Gilead Sciences, Inc. |
3,293 | 266,799 | ||||||
| Gladstone Commercial Corp. REIT |
4,500 | 100,215 | ||||||
| Goldman Sachs Group, Inc. |
1,244 | 295,064 | ||||||
| Halliburton Co. |
2,482 | 114,246 | ||||||
| Halyard Health, Inc. (b) |
155 | 6,980 | ||||||
| HCP, Inc. REIT |
3,726 | 103,695 | ||||||
| Hershey Co. |
1,244 | 135,807 | ||||||
| Hess Corp. |
1,244 | 58,331 | ||||||
| Hewlett Packard Enterprise Co. |
4,977 | 73,212 | ||||||
| Home Depot, Inc. |
2,482 | 405,956 | ||||||
| Honeywell International, Inc. |
2,482 | 351,799 | ||||||
| HP, Inc. |
4,977 | 99,341 | ||||||
| Illinois Tool Works, Inc. |
1,877 | 277,721 | ||||||
| Ingersoll-Rand PLC |
2,482 | 221,320 | ||||||
| Intel Corp. |
9,934 | 378,287 | ||||||
| International Business Machines Corp. |
2,004 | 290,740 | ||||||
| Intuit, Inc. |
1,244 | 176,822 | ||||||
| Iron Mountain, Inc. |
29 | 1,122 | ||||||
| Iron Mountain, Inc. REIT |
91 | 3,540 | ||||||
| J.M. Smucker Co. |
1,244 | 130,533 | ||||||
| Johnson & Johnson |
3,726 | 484,417 | ||||||
| Johnson Controls International PLC |
3,290 | 132,554 | ||||||
| JPMorgan Chase & Co. |
7,457 | 712,218 | ||||||
| Juniper Networks, Inc. |
2,482 | 69,074 | ||||||
| Kellogg Co. |
1,244 | 77,588 | ||||||
| Keysight Technologies, Inc. (b) |
1,243 | 51,783 | ||||||
| Kimberly-Clark Corp. |
1,244 | 146,394 | ||||||
| Kinder Morgan, Inc. |
3,586 | 68,779 | ||||||
| Kohl’s Corp. |
1,244 | 56,789 | ||||||
| Kraft Heinz Co. |
203 | 15,743 | ||||||
| L Brands, Inc. (a) |
1,877 | 78,102 | ||||||
See accompanying notes to financial statements.
116
Table of Contents
SPDR MSCI ACWI IMI ETF
SCHEDULE OF INVESTMENTS (continued)
September 30, 2017
| Security Description |
Shares |
Value |
||||||
| Lamb Weston Holdings, Inc. |
826 | $ | 38,731 | |||||
| Las Vegas Sands Corp. |
1,244 | 79,815 | ||||||
| Leidos Holdings, Inc. |
313 | 18,536 | ||||||
| Liberty Expedia Holdings, Inc. Class A (b) |
210 | 11,153 | ||||||
| Liberty Interactive Corp. QVC Group Class A (b) |
2,482 | 58,501 | ||||||
| Liberty TripAdvisor Holdings, Inc. Class A (b) |
168 | 2,075 | ||||||
| Liberty Ventures Series A (b) |
314 | 18,071 | ||||||
| Lockheed Martin Corp. |
1,002 | 310,911 | ||||||
| LogMeIn, Inc. |
213 | 23,441 | ||||||
| Lowe’s Cos., Inc. |
3,726 | 297,856 | ||||||
| LyondellBasell Industries NV Class A |
1,244 | 123,218 | ||||||
| Macy’s, Inc. (a) |
2,482 | 54,157 | ||||||
| Mallinckrodt PLC (b) |
155 | 5,792 | ||||||
| Marathon Oil Corp. |
3,726 | 50,525 | ||||||
| Marathon Petroleum Corp. |
2,490 | 139,639 | ||||||
| Marsh & McLennan Cos., Inc. |
2,482 | 208,016 | ||||||
| Mastercard, Inc. Class A |
800 | 112,960 | ||||||
| Mattel, Inc. (a) |
4,977 | 77,044 | ||||||
| McCormick & Co., Inc. |
2,670 | 274,049 | ||||||
| McDonald’s Corp. |
1,244 | 194,910 | ||||||
| McKesson Corp. |
944 | 145,008 | ||||||
| Medtronic PLC |
5,150 | 400,515 | ||||||
| Merck & Co., Inc. |
4,977 | 318,677 | ||||||
| MetLife, Inc. |
3,726 | 193,566 | ||||||
| Microsoft Corp. |
13,664 | 1,017,831 | ||||||
| Mondelez International, Inc. Class A |
1,244 | 50,581 | ||||||
| Monsanto Co. |
1,244 | 149,056 | ||||||
| Morgan Stanley |
3,726 | 179,481 | ||||||
| Mosaic Co. |
1,244 | 26,858 | ||||||
| National Oilwell Varco, Inc. |
1,244 | 44,448 | ||||||
| NetApp, Inc. |
1,244 | 54,437 | ||||||
| Newmont Mining Corp. |
1,244 | 46,662 | ||||||
| News Corp. Class A |
756 | 10,025 | ||||||
| NexPoint Residential Trust, Inc. REIT |
5,000 | 118,650 | ||||||
| NextEra Energy, Inc. |
1,244 | 182,308 | ||||||
| NIKE, Inc. Class B |
4,158 | 215,592 | ||||||
| Noble Corp. PLC (a) (b) |
2,482 | 11,417 | ||||||
| Noble Energy, Inc. |
2,482 | 70,390 | ||||||
| Norfolk Southern Corp. |
1,244 | 164,507 | ||||||
| Northrop Grumman Corp. |
1,133 | 325,987 | ||||||
| NOW, Inc. (b) |
310 | 4,281 | ||||||
| NVIDIA Corp. |
800 | 143,016 | ||||||
| O’Reilly Automotive, Inc. (b) |
717 | 154,420 | ||||||
| Occidental Petroleum Corp. |
2,482 | 159,369 | ||||||
| Oracle Corp. |
8,689 | 420,113 | ||||||
| Outfront Media, Inc. REIT |
3 | 76 | ||||||
| Parker-Hannifin Corp. |
1,244 | 217,725 | ||||||
| PayPal Holdings, Inc. (b) |
3,726 | 238,576 | ||||||
| PepsiCo, Inc. |
2,482 | 276,569 | ||||||
| Perrigo Co. PLC (a) |
21 | 1,778 | ||||||
| Pfizer, Inc. |
12,269 | 438,003 | ||||||
| PG&E Corp. |
1,244 | 84,704 | ||||||
| Philip Morris International, Inc. |
2,482 | 275,527 | ||||||
| Phillips 66 |
608 | 55,699 | ||||||
| Pioneer Natural Resources Co. |
1,244 | 183,540 | ||||||
| PNC Financial Services Group, Inc. |
1,244 | 167,654 | ||||||
| PPL Corp. |
3,726 | 141,402 | ||||||
| Praxair, Inc. |
1,244 | 173,837 | ||||||
| Priceline Group, Inc. (b) |
92 | 168,435 | ||||||
| Procter & Gamble Co. |
2,714 | 246,920 | ||||||
| Prologis, Inc. REIT |
3,726 | 236,452 | ||||||
| Prudential Financial, Inc. |
2,482 | 263,886 | ||||||
| Public Service Enterprise Group, Inc. |
2,482 | 114,792 | ||||||
| Public Storage REIT |
1,042 | 222,978 | ||||||
| QUALCOMM, Inc. |
3,726 | 193,156 | ||||||
| Quality Care Properties, Inc. REIT (b) |
744 | 11,532 | ||||||
| Range Resources Corp. (a) |
1,244 | 24,345 | ||||||
| Raytheon Co. |
1,244 | 232,106 | ||||||
| Retail Opportunity Investments Corp. REIT |
10,219 | 194,263 | ||||||
| Ross Stores, Inc. |
2,490 | 160,779 | ||||||
| salesforce.com, Inc. (b) |
2,566 | 239,716 | ||||||
| Schlumberger, Ltd. |
3,654 | 254,903 | ||||||
| Seagate Technology PLC (a) |
1,244 | 41,263 | ||||||
| Shire PLC |
717 | 36,439 | ||||||
| Shire PLC ADR |
92 | 14,089 | ||||||
| Simon Property Group, Inc. REIT |
1,244 | 200,296 | ||||||
| Southern Co. |
1,244 | 61,130 | ||||||
| Southwestern Energy Co. (b) |
1,244 | 7,601 | ||||||
| Starbucks Corp. |
4,962 | 266,509 | ||||||
| State Street Corp. (h) |
1,244 | 118,852 | ||||||
| Synchrony Financial |
1,387 | 43,066 | ||||||
| Sysco Corp. |
2,482 | 133,904 | ||||||
| Target Corp. |
1,244 | 73,408 | ||||||
| Tesla, Inc. (b) |
100 | 34,110 | ||||||
| Texas Instruments, Inc. |
3,726 | 333,999 | ||||||
| Thermo Fisher Scientific, Inc. |
1,879 | 355,507 | ||||||
| Time Warner, Inc. |
2,004 | 205,310 | ||||||
| Time, Inc. |
310 | 4,185 | ||||||
| TJX Cos., Inc. |
2,482 | 182,998 | ||||||
| Transocean, Ltd. (b) |
885 | 9,494 | ||||||
| Travelers Cos., Inc. |
1,244 | 152,415 | ||||||
| Twenty-First Century Fox, Inc. Class A |
6,214 | 163,925 | ||||||
| Tyson Foods, Inc. Class A |
3,970 | 279,686 | ||||||
| UMH Properties, Inc. REIT |
7,100 | 110,405 | ||||||
| Union Pacific Corp. |
2,489 | 288,649 | ||||||
| United Financial Bancorp, Inc. |
10,408 | 190,362 | ||||||
| United Parcel Service, Inc. Class B |
1,244 | 149,392 | ||||||
| United Technologies Corp. |
1,244 | 144,404 | ||||||
| UnitedHealth Group, Inc. |
2,482 | 486,100 | ||||||
| US Bancorp |
3,726 | 199,676 | ||||||
| Valero Energy Corp. |
2,482 | 190,940 | ||||||
| Vector Group, Ltd. (a) |
8,194 | 167,735 | ||||||
| Verizon Communications, Inc. |
4,208 | 208,254 | ||||||
| Viacom, Inc. Class B |
1,244 | 34,633 | ||||||
| Visa, Inc. Class A (a) |
4,986 | 524,727 | ||||||
| Wal-Mart Stores, Inc. |
2,482 | 193,943 | ||||||
| Walgreens Boots Alliance, Inc. |
2,482 | 191,660 | ||||||
| Walt Disney Co. |
3,726 | 367,272 | ||||||
| Washington Prime Group, Inc. REIT (a) |
619 | 5,156 | ||||||
| Waste Management, Inc. |
2,482 | 194,266 | ||||||
| Weatherford International PLC (a) (b) |
6,214 | 28,460 | ||||||
| Wells Fargo & Co. |
9,934 | 547,860 | ||||||
| Western Digital Corp. |
1,541 | 133,142 | ||||||
| Williams Cos., Inc. |
3,726 | 111,817 | ||||||
| Yum China Holdings, Inc. (b) |
1,244 | 49,723 | ||||||
| Yum! Brands, Inc. |
1,244 | 91,571 | ||||||
See accompanying notes to financial statements.
117
Table of Contents
SPDR MSCI ACWI IMI ETF
SCHEDULE OF INVESTMENTS (continued)
September 30, 2017
| Security Description |
Shares |
Value |
||||||
| Zoetis, Inc. |
143 | $ | 9,118 | |||||
|
|
|
|||||||
| 46,513,362 | ||||||||
|
|
|
|||||||
| TOTAL COMMON STOCKS |
90,054,973 | |||||||
|
|
|
|||||||
| RIGHTS — 0.0% (d) |
| |||||||
| SOUTH KOREA — 0.0% (d) |
||||||||
| Able C&C Co., Ltd. |
1,624 | 3,545 | ||||||
|
|
|
|||||||
| SHORT-TERM INVESTMENTS — 1.2% |
| |||||||
| State Street Institutional U.S. Government Money Market Fund, Class G Shares 0.96% (i) (j) |
55,517 | 55,517 | ||||||
| State Street Navigator Securities Lending Government Money Market Portfolio (i) (k) |
985,141 | 985,141 | ||||||
|
|
|
|||||||
| TOTAL SHORT-TERM INVESTMENTS |
1,040,658 | |||||||
|
|
|
|||||||
| TOTAL INVESTMENTS — 100.9% |
91,099,176 | |||||||
| LIABILITIES IN EXCESS OF OTHER ASSETS — (0.9)% |
(777,842 | ) | ||||||
|
|
|
|||||||
| NET ASSETS — 100.0% |
$ | 90,321,334 | ||||||
|
|
|
|||||||
| (a) | All or a portion of the shares of the security are on loan at September 30, 2017. |
| (b) | Non-income producing security. |
| (c) | Reflects separate holdings of the issuer’s common stock traded on different securities exchanges. |
| (d) | Amount is less than 0.05% of net assets. |
| (e) | Security purchased pursuant to Rule 144A of the Securities Act of 1933, as amended. This security, which represents 0.1% of net assets as of September 30, 2017, is considered liquid and may be resold in transactions exempt from registration, normally to qualified institutional buyers. |
| (f) | Fair valued as determined in good faith by the Trust’s Oversight Committee in accordance with policy and procedures approved by the Board of Trustees. Security value is determined based on Level 3 inputs. As of September 30, 2017, total aggregate fair value of the security is $802, representing less than 0.05% of the Fund’s net assets. |
| (g) | Fair valued as determined in good faith by the Trust’s Oversight Committee in accordance with policy and procedures approved by the Board of Trustees. As of September 30, 2017, total aggregate fair value of securities is $32,906, representing less than 0.05% of the Fund’s net assets. |
| (h) | The Fund invested in an affiliated entity, State Street Corp. Amounts related to these transactions during the period ended September 30, 2017 are shown in the Affiliate Table below. |
| (i) | The Fund invested in certain money market funds managed by SSGA Funds Management, Inc. Amounts related to these transactions during the period ended September 30, 2017 are shown in the Affiliate Table below. |
| (j) | The rate shown is the annualized seven-day yield at September 30, 2017. |
| (k) | Investment of cash collateral for securities loaned. |
ADR = American Depositary Receipt
GDR = Global Depositary Receipt
NVDR = Non Voting Depositary Receipt
REIT = Real Estate Investment Trust
The following table summarizes the value of the Fund’s investments according to the fair value hierarchy as of September 30, 2017.
| Description |
Level 1 — Quoted Prices |
Level 2 — Other Significant Observable Inputs |
Level 3 — Significant Unobservable Inputs |
Total | ||||||||||||
| ASSETS: |
||||||||||||||||
| INVESTMENTS: |
||||||||||||||||
| Common Stocks |
||||||||||||||||
| Australia |
$ | 2,166,105 | $ | — | $ | — | $ | 2,166,105 | ||||||||
| Austria |
98,303 | — | — | 98,303 | ||||||||||||
| Belgium |
308,252 | — | — | 308,252 | ||||||||||||
| Brazil |
633,890 | — | — | 633,890 | ||||||||||||
| Canada |
2,890,196 | — | — | 2,890,196 | ||||||||||||
| Chile |
33,541 | — | — | 33,541 | ||||||||||||
| China |
2,799,414 | — | — | 2,799,414 | ||||||||||||
| Colombia |
11,905 | — | — | 11,905 | ||||||||||||
| Denmark |
644,097 | — | — | 644,097 | ||||||||||||
| Finland |
362,681 | — | — | 362,681 | ||||||||||||
| France |
2,928,611 | — | — | 2,928,611 | ||||||||||||
| Germany |
2,836,300 | — | — | 2,836,300 | ||||||||||||
| Hong Kong |
1,248,821 | — | — | 1,248,821 | ||||||||||||
| Hungary |
80,900 | — | — | 80,900 | ||||||||||||
| India |
793,456 | — | — | 793,456 | ||||||||||||
See accompanying notes to financial statements.
118
Table of Contents
SPDR MSCI ACWI IMI ETF
SCHEDULE OF INVESTMENTS (continued)
September 30, 2017
| Description |
Level 1 — Quoted Prices |
Level 2 — Other Significant Observable Inputs |
Level 3 — Significant Unobservable Inputs |
Total | ||||||||||||
| Indonesia |
$ | 414,916 | $ | — | $ | — | $ | 414,916 | ||||||||
| Ireland |
284,970 | — | — | 284,970 | ||||||||||||
| Israel |
284,285 | — | — | 284,285 | ||||||||||||
| Italy |
661,873 | — | 802 | 662,675 | ||||||||||||
| Japan |
7,228,850 | — | — | 7,228,850 | ||||||||||||
| Luxembourg |
35,374 | — | — | 35,374 | ||||||||||||
| Malaysia |
81,819 | — | — | 81,819 | ||||||||||||
| Mexico |
384,105 | — | — | 384,105 | ||||||||||||
| Netherlands |
1,396,299 | — | — | 1,396,299 | ||||||||||||
| Norway |
304,082 | — | — | 304,082 | ||||||||||||
| Peru |
4,144 | — | — | 4,144 | ||||||||||||
| Philippines |
28,632 | — | — | 28,632 | ||||||||||||
| Poland |
34,295 | — | — | 34,295 | ||||||||||||
| Russia |
330,764 | — | — | 330,764 | ||||||||||||
| Singapore |
531,428 | — | — | 531,428 | ||||||||||||
| South Africa |
585,665 | — | — | 585,665 | ||||||||||||
| South Korea |
1,656,427 | — | — | 1,656,427 | ||||||||||||
| Spain |
921,827 | — | — | 921,827 | ||||||||||||
| Sweden |
985,087 | — | — | 985,087 | ||||||||||||
| Switzerland |
2,622,170 | — | — | 2,622,170 | ||||||||||||
| Taiwan |
1,265,043 | — | — | 1,265,043 | ||||||||||||
| Thailand |
122,710 | 29,361 | — | 152,071 | ||||||||||||
| Turkey |
136,072 | — | — | 136,072 | ||||||||||||
| United Kingdom |
5,374,139 | — | — | 5,374,139 | ||||||||||||
| United States |
46,513,362 | — | — | 46,513,362 | ||||||||||||
| Rights |
||||||||||||||||
| South Korea |
— | 3,545 | — | 3,545 | ||||||||||||
| Short-Term Investments |
1,040,658 | — | — | 1,040,658 | ||||||||||||
|
|
|
|
|
|
|
|
|
|||||||||
| TOTAL INVESTMENTS |
$ | 91,065,468 | $ | 32,906 | $ | 802 | $ | 91,099,176 | ||||||||
|
|
|
|
|
|
|
|
|
|||||||||
Affiliate Table
| Number of Shares Held at 9/30/16 |
Value at 9/30/16 |
Cost of Purchases |
Proceeds from Shares Sold |
Realized Gain (Loss) |
Change in Unrealized Appreciation/ Depreciation |
Number of Shares Held at 9/30/17 |
Value at 9/30/17 |
Dividend Income |
||||||||||||||||||||||||||||
| State Street Corp |
1,037 | $ | 72,206 | $ | 32,003 | $ | 17,989 | $ | 5,382 | $ | 27,250 | 1,244 | $ | 118,852 | $ | 2,022 | ||||||||||||||||||||
| State Street Institutional Liquid Reserves Fund, Premier Class |
268,592 | 268,592 | 8,422 | 277,014 | — | — | — | — | 10 | |||||||||||||||||||||||||||
| State Street Institutional U.S. Government Money Market Fund, Class G Shares |
— | — | 1,625,217 | 1,569,700 | — | — | 55,517 | 55,517 | 1,120 | |||||||||||||||||||||||||||
| State Street Institutional U.S. Government Money Market Fund, Premier Class |
— | — | 4,701,273 | 4,701,273 | — | — | — | — | 1,041 | |||||||||||||||||||||||||||
| State Street Navigator Securities Lending Government Money Market Portfolio* |
2,141,243 | 2,141,243 | 10,953,410 | 12,109,512 | — | — | 985,141 | 985,141 | 16,678 | |||||||||||||||||||||||||||
|
|
|
|
|
|
|
|
|
|
|
|
|
|
|
|||||||||||||||||||||||
| TOTAL |
$ | 2,482,041 | $ | 17,320,325 | $ | 18,675,488 | $ | 5,382 | $ | 27,250 | $ | 1,159,510 | $ | 20,871 | ||||||||||||||||||||||
|
|
|
|
|
|
|
|
|
|
|
|
|
|
|
|||||||||||||||||||||||
| * | Effective October 5, 2016, the name of State Street Navigator Securities Lending Prime Portfolio was changed to State Street Navigator Securities Lending Government Money Market Portfolio. |
See accompanying notes to financial statements.
119
Table of Contents
SPDR MSCI ACWI Low Carbon Target ETF
SCHEDULE OF INVESTMENTS
September 30, 2017
| Security Description |
Shares |
Value |
||||||
| COMMON STOCKS — 99.5% |
||||||||
| ARGENTINA — 0.0% (a) |
||||||||
| MercadoLibre, Inc. |
132 | $ | 34,179 | |||||
|
|
|
|||||||
| AUSTRALIA — 2.2% |
| |||||||
| Amcor, Ltd. |
2,314 | 27,616 | ||||||
| AMP, Ltd. |
12,549 | 47,559 | ||||||
| APA Group |
22,822 | 149,526 | ||||||
| Aristocrat Leisure, Ltd. |
1,461 | 24,074 | ||||||
| Aurizon Holdings, Ltd. |
2,081 | 8,001 | ||||||
| Australia & New Zealand Banking Group, Ltd. |
10,407 | 241,709 | ||||||
| Brambles, Ltd. |
9,258 | 65,379 | ||||||
| Caltex Australia, Ltd. |
7,873 | 198,299 | ||||||
| Challenger, Ltd. |
1,826 | 17,838 | ||||||
| Coca-Cola Amatil, Ltd. |
2,727 | 16,540 | ||||||
| Cochlear, Ltd. |
136 | 16,990 | ||||||
| Commonwealth Bank of Australia |
5,989 | 353,620 | ||||||
| Computershare, Ltd. |
1,241 | 14,090 | ||||||
| Crown Resorts, Ltd. |
1,018 | 9,034 | ||||||
| CSL, Ltd. |
1,321 | 138,853 | ||||||
| Dexus REIT |
3,575 | 26,649 | ||||||
| Domino’s Pizza Enterprises, Ltd. (b) |
250 | 8,988 | ||||||
| Flight Centre Travel Group, Ltd. |
392 | 13,844 | ||||||
| Fortescue Metals Group, Ltd. |
25,419 | 102,517 | ||||||
| Goodman Group REIT |
8,221 | 53,153 | ||||||
| GPT Group REIT |
5,886 | 22,907 | ||||||
| Harvey Norman Holdings, Ltd. (b) |
2,601 | 7,919 | ||||||
| Insurance Australia Group, Ltd. |
5,092 | 25,451 | ||||||
| LendLease Group |
2,334 | 32,818 | ||||||
| Macquarie Group, Ltd. |
1,430 | 102,017 | ||||||
| Medibank Pvt, Ltd. |
328 | 752 | ||||||
| Mirvac Group REIT |
13,939 | 25,046 | ||||||
| National Australia Bank, Ltd. |
9,565 | 236,413 | ||||||
| Newcrest Mining, Ltd. |
2,536 | 41,827 | ||||||
| QBE Insurance Group, Ltd. |
5,010 | 39,350 | ||||||
| Ramsay Health Care, Ltd. |
452 | 22,088 | ||||||
| Scentre Group REIT |
25,230 | 77,801 | ||||||
| SEEK, Ltd. |
1,309 | 17,060 | ||||||
| Sonic Healthcare, Ltd. |
1,055 | 17,309 | ||||||
| Stockland REIT |
10,895 | 36,760 | ||||||
| Suncorp Group, Ltd. |
5,771 | 59,093 | ||||||
| Sydney Airport |
12,894 | 71,934 | ||||||
| Tabcorp Holdings, Ltd. |
5,993 | 20,079 | ||||||
| Tatts Group, Ltd. |
7,378 | 23,041 | ||||||
| Telstra Corp., Ltd. |
20,544 | 56,258 | ||||||
| TPG Telecom, Ltd. (b) |
5,636 | 21,537 | ||||||
| Transurban Group Stapled Security |
16,346 | 152,372 | ||||||
| Treasury Wine Estates, Ltd. |
3,569 | 38,338 | ||||||
| Vicinity Centres REIT |
16,945 | 35,367 | ||||||
| Wesfarmers, Ltd. |
3,601 | 116,779 | ||||||
| Westfield Corp. REIT |
8,119 | 49,945 | ||||||
| Westpac Banking Corp. |
12,098 | 303,007 | ||||||
| Woolworths, Ltd. |
1,810 | 35,804 | ||||||
|
|
|
|||||||
| 3,223,351 | ||||||||
|
|
|
|||||||
| AUSTRIA — 0.1% |
| |||||||
| ANDRITZ AG |
170 | 9,829 | ||||||
| Erste Group Bank AG (c) |
1,383 | 59,750 | ||||||
| Raiffeisen Bank International AG (c) |
1,020 | 34,192 | ||||||
|
|
|
|||||||
| 103,771 | ||||||||
|
|
|
|||||||
| BELGIUM — 0.4% |
| |||||||
| Ageas |
1,441 | 67,733 | ||||||
| Anheuser-Busch InBev SA |
2,876 | 344,421 | ||||||
| Colruyt SA |
272 | 13,935 | ||||||
| KBC Group NV |
734 | 62,217 | ||||||
| Proximus SADP |
442 | 15,234 | ||||||
| UCB SA |
340 | 24,209 | ||||||
| Umicore SA |
267 | 22,092 | ||||||
|
|
|
|||||||
| 549,841 | ||||||||
|
|
|
|||||||
| BERMUDA — 0.0% (a) |
| |||||||
| Marvell Technology Group, Ltd. |
1,918 | 34,332 | ||||||
|
|
|
|||||||
| BRAZIL — 0.9% |
| |||||||
| Ambev SA |
21,590 | 143,608 | ||||||
| B3 SA - Brasil Bolsa Balcao |
5,044 | 38,191 | ||||||
| Banco Bradesco SA |
1,210 | 12,777 | ||||||
| Banco Bradesco SA Preference Shares |
11,953 | 132,448 | ||||||
| Banco do Brasil SA |
3,363 | 37,105 | ||||||
| Banco Santander Brasil SA |
900 | 7,864 | ||||||
| BB Seguridade Participacoes SA |
1,287 | 11,649 | ||||||
| CCR SA |
7,852 | 43,962 | ||||||
| Cielo SA |
5,722 | 39,761 | ||||||
| Cosan SA Industria e Comercio |
10,971 | 125,555 | ||||||
| CPFL Energia SA |
3,800 | 32,700 | ||||||
| Embraer SA |
3,087 | 17,459 | ||||||
| Itau Unibanco Holding SA Preference Shares |
10,182 | 139,541 | ||||||
| Klabin SA |
1,313 | 7,617 | ||||||
| Kroton Educacional SA |
3,852 | 24,416 | ||||||
| Localiza Rent a Car SA |
1,900 | 34,665 | ||||||
| Raia Drogasil SA |
500 | 11,855 | ||||||
| Telefonica Brasil SA Preference Shares |
2,184 | 34,847 | ||||||
| Tim Participacoes SA |
1,607 | 5,868 | ||||||
| Ultrapar Participacoes SA |
10,960 | 260,942 | ||||||
| Vale SA |
12,672 | 127,676 | ||||||
|
|
|
|||||||
| 1,290,506 | ||||||||
|
|
|
|||||||
| CANADA — 3.6% |
| |||||||
| Agnico Eagle Mines, Ltd. |
1,815 | 81,836 | ||||||
| Alimentation Couche-Tard, Inc. Class B |
1,423 | 64,741 | ||||||
| AltaGas, Ltd. |
3,310 | 76,064 | ||||||
| Bank of Montreal |
1,287 | 97,175 | ||||||
| Bank of Nova Scotia |
3,671 | 235,409 | ||||||
| Barrick Gold Corp. |
2,168 | 34,809 | ||||||
| BCE, Inc. |
573 | 26,784 | ||||||
| BlackBerry, Ltd. (c) |
1,037 | 11,567 | ||||||
| Bombardier, Inc. Class B (c) |
3,362 | 6,075 | ||||||
| Brookfield Asset Management, Inc. Class A |
2,527 | 104,099 | ||||||
| CAE, Inc. |
784 | 13,685 | ||||||
| Cameco Corp. |
8,112 | 78,159 | ||||||
| Canadian Imperial Bank of Commerce |
533 | 46,526 | ||||||
| Canadian National Railway Co. |
1,916 | 158,378 | ||||||
| Canadian Pacific Railway, Ltd. |
127 | 21,282 | ||||||
| Canadian Tire Corp., Ltd. Class A |
60 | 7,452 | ||||||
| CCL Industries, Inc. Class B |
925 | 44,658 | ||||||
| CGI Group, Inc. Class A (c) |
524 | 27,108 | ||||||
See accompanying notes to financial statements.
120
Table of Contents
SPDR MSCI ACWI Low Carbon Target ETF
SCHEDULE OF INVESTMENTS (continued)
September 30, 2017
| Security Description |
Shares |
Value |
||||||
| Constellation Software, Inc. |
55 | $ | 29,937 | |||||
| Enbridge, Inc. (d) |
7,543 | 314,349 | ||||||
| Enbridge, Inc. (d) |
4,681 | 195,853 | ||||||
| Fairfax Financial Holdings, Ltd. |
32 | 16,614 | ||||||
| Finning International, Inc. |
916 | 20,896 | ||||||
| First Quantum Minerals, Ltd. |
6,698 | 75,032 | ||||||
| Franco-Nevada Corp. |
1,423 | 109,981 | ||||||
| George Weston, Ltd. |
500 | 43,437 | ||||||
| Goldcorp, Inc. |
4,110 | 53,238 | ||||||
| Great-West Lifeco, Inc. |
524 | 15,046 | ||||||
| Hydro One, Ltd. (e) |
11,567 | 210,132 | ||||||
| Inter Pipeline, Ltd. |
19,844 | 410,161 | ||||||
| Keyera Corp. |
4,494 | 137,050 | ||||||
| Loblaw Cos., Ltd. |
825 | 44,923 | ||||||
| Magna International, Inc. |
182 | 9,690 | ||||||
| Manulife Financial Corp. |
7,008 | 141,824 | ||||||
| Open Text Corp. |
520 | 16,739 | ||||||
| Pembina Pipeline Corp. (b) |
13,612 | 476,499 | ||||||
| Power Corp. of Canada |
1,048 | 26,572 | ||||||
| PrairieSky Royalty, Ltd. |
13,987 | 357,098 | ||||||
| Restaurant Brands International, Inc. |
760 | 48,445 | ||||||
| Rogers Communications, Inc. Class B (b) |
1,163 | 59,831 | ||||||
| Royal Bank of Canada |
4,572 | 352,921 | ||||||
| Shaw Communications, Inc. Class B |
108 | 2,480 | ||||||
| Shopify, Inc. Class A (c) |
200 | 23,207 | ||||||
| SNC-Lavalin Group, Inc. |
798 | 35,981 | ||||||
| Sun Life Financial, Inc. |
1,687 | 67,027 | ||||||
| Toronto-Dominion Bank |
5,617 | 315,511 | ||||||
| TransCanada Corp. |
4,542 | 223,968 | ||||||
| Veresen, Inc. |
11,578 | 173,302 | ||||||
| Wheaton Precious Metals Corp. |
5,812 | 110,603 | ||||||
| Yamana Gold, Inc. |
2,638 | 6,961 | ||||||
|
|
|
|||||||
| 5,261,115 | ||||||||
|
|
|
|||||||
| CHILE — 0.3% |
| |||||||
| Aguas Andinas SA Class A |
177,617 | 113,171 | ||||||
| Antofagasta PLC |
14,157 | 180,250 | ||||||
| Cencosud SA |
23,669 | 72,459 | ||||||
| SACI Falabella |
3,062 | 29,904 | ||||||
| Sociedad Quimica y Minera de Chile SA |
||||||||
| Class B, Preference Shares |
936 | 52,003 | ||||||
|
|
|
|||||||
| 447,787 | ||||||||
|
|
|
|||||||
| CHINA — 3.3% |
| |||||||
| 58.com, Inc. ADR (c) |
300 | 18,942 | ||||||
| AAC Technologies Holdings, Inc. |
2,500 | 41,994 | ||||||
| Agricultural Bank of China, Ltd. Class H |
150,000 | 67,215 | ||||||
| Alibaba Group Holding, Ltd. ADR (b) (c) |
3,785 | 653,707 | ||||||
| ANTA Sports Products, Ltd. |
3,000 | 12,617 | ||||||
| Baidu, Inc. ADR (c) |
913 | 226,141 | ||||||
| Bank of China, Ltd. Class H |
341,000 | 168,083 | ||||||
| Bank of Communications Co., Ltd. Class H |
77,000 | 56,192 | ||||||
| Beijing Capital International Airport Co., Ltd. Class H |
22,000 | 32,786 | ||||||
| Beijing Enterprises Water Group, Ltd. (c) |
100,000 | 80,531 | ||||||
| Brilliance China Automotive Holdings, Ltd. |
12,000 | 31,956 | ||||||
| CGN Power Co., Ltd. Class H (e) |
487,200 | 134,732 | ||||||
| China Cinda Asset Management Co., Ltd. Class H |
54,000 | 19,911 | ||||||
| China CITIC Bank Corp., Ltd. Class H |
68,000 | 43,182 | ||||||
| China Conch Venture Holdings, Ltd. |
7,500 | 14,595 | ||||||
| China Construction Bank Corp. Class H |
322,000 | 267,141 | ||||||
| China Everbright Bank Co., Ltd. Class H |
17,000 | 7,857 | ||||||
| China Evergrande Group (b) (c) |
12,700 | 44,308 | ||||||
| China Galaxy Securities Co., Ltd. Class H |
14,500 | 12,717 | ||||||
| China Life Insurance Co., Ltd. Class H |
34,000 | 101,207 | ||||||
| China Merchants Bank Co., Ltd. Class H |
15,000 | 52,716 | ||||||
| China Merchants Port Holdings Co., Ltd. |
24,953 | 76,993 | ||||||
| China Minsheng Banking Corp., Ltd. Class H (b) |
40,000 | 36,668 | ||||||
| China Mobile, Ltd. |
19,500 | 197,604 | ||||||
| China Oilfield Services, Ltd. Class H |
34,000 | 31,124 | ||||||
| China Overseas Land & Investment, Ltd. |
20,000 | 65,039 | ||||||
| China Pacific Insurance Group Co., Ltd. Class H |
6,800 | 29,296 | ||||||
| China Resources Gas Group, Ltd. |
4,000 | 13,930 | ||||||
| China Resources Land, Ltd. |
8,000 | 24,479 | ||||||
| China Taiping Insurance Holdings Co., Ltd. |
6,000 | 16,055 | ||||||
| China Telecom Corp., Ltd. Class H |
68,000 | 34,824 | ||||||
| China Unicom Hong Kong, Ltd. (c) |
22,000 | 30,589 | ||||||
| China Vanke Co., Ltd. Class H |
6,696 | 22,032 | ||||||
| Chongqing Changan Automobile Co., Ltd. Class B |
2,400 | 3,174 | ||||||
| CITIC Securities Co., Ltd. Class H |
8,500 | 18,696 | ||||||
| COSCO SHIPPING Ports, Ltd. |
12,800 | 14,241 | ||||||
| Country Garden Holdings Co., Ltd. |
17,000 | 27,032 | ||||||
| Ctrip.com International, Ltd. ADR (c) |
1,163 | 61,337 | ||||||
| Geely Automobile Holdings, Ltd. |
25,000 | 70,416 | ||||||
| GF Securities Co., Ltd. Class H |
6,000 | 13,044 | ||||||
| Great Wall Motor Co., Ltd. Class H (b) |
25,500 | 31,342 | ||||||
| Guangdong Investment, Ltd. |
58,000 | 82,722 | ||||||
| Guangzhou Automobile Group Co., Ltd. Class H |
12,000 | 27,777 | ||||||
| Haitian International Holdings, Ltd. |
4,000 | 11,497 | ||||||
| Haitong Securities Co., Ltd. Class H |
13,200 | 21,328 | ||||||
| Huaneng Renewables Corp., Ltd. Class H |
188,000 | 62,099 | ||||||
| Huatai Securities Co., Ltd. Class H (e) |
6,500 | 14,397 | ||||||
| Industrial & Commercial Bank of China, Ltd. Class H |
266,000 | 197,524 | ||||||
| JD.com, Inc. ADR (c) |
2,405 | 91,871 | ||||||
| Jiangsu Expressway Co., Ltd. Class H |
24,000 | 36,750 | ||||||
| Lenovo Group, Ltd. |
34,000 | 18,761 | ||||||
| NetEase, Inc. ADR |
271 | 71,492 | ||||||
| New Oriental Education & Technology Group, Inc. ADR |
405 | 35,745 | ||||||
| PICC Property & Casualty Co., Ltd. Class H |
12,000 | 21,171 | ||||||
| Ping An Insurance Group Co. of China, Ltd. Class H |
17,000 | 130,481 | ||||||
| Shanghai Electric Group Co., Ltd. Class H (b) (c) |
44,000 | 19,379 | ||||||
| Shanghai Industrial Holdings, Ltd. |
8,000 | 24,223 | ||||||
| SINA Corp. (c) |
164 | 18,803 | ||||||
| Sunny Optical Technology Group Co., Ltd. |
2,000 | 31,803 | ||||||
See accompanying notes to financial statements.
121
Table of Contents
SPDR MSCI ACWI Low Carbon Target ETF
SCHEDULE OF INVESTMENTS (continued)
September 30, 2017
| Security Description |
Shares |
Value |
||||||
| TAL Education Group ADR |
1,026 | $ | 34,586 | |||||
| Tencent Holdings, Ltd. |
19,484 | 838,660 | ||||||
| Vipshop Holdings, Ltd. ADR (c) |
1,407 | 12,368 | ||||||
| Want Want China Holdings, Ltd. |
17,000 | 11,949 | ||||||
| Weibo Corp. ADR (b) (c) |
16 | 1,583 | ||||||
| Yangzijiang Shipbuilding Holdings, Ltd. |
34,000 | 35,804 | ||||||
| Zhejiang Expressway Co., Ltd. Class H |
24,000 | 29,836 | ||||||
| Zhuzhou CRRC Times Electric Co., Ltd. Class H |
2,000 | 11,203 | ||||||
|
|
|
|||||||
| 4,800,257 | ||||||||
|
|
|
|||||||
| COLOMBIA — 0.2% |
| |||||||
| Bancolombia SA Preference Shares |
4,455 | 51,244 | ||||||
| Grupo Aval Acciones y Valores SA Preference Shares |
34,988 | 15,845 | ||||||
| Grupo de Inversiones Suramericana SA |
3,539 | 49,264 | ||||||
| Grupo de Inversiones Suramericana SA Preference Shares |
696 | 9,523 | ||||||
| Interconexion Electrica SA ESP |
26,273 | 122,386 | ||||||
|
|
|
|||||||
| 248,262 | ||||||||
|
|
|
|||||||
| CZECH REPUBLIC — 0.0% (a) |
| |||||||
| Komercni banka A/S |
477 | 20,828 | ||||||
|
|
|
|||||||
| DENMARK — 0.6% |
| |||||||
| Carlsberg A/S Class B |
9 | 985 | ||||||
| Chr Hansen Holding A/S |
1,094 | 93,849 | ||||||
| Coloplast A/S Class B |
374 | 30,360 | ||||||
| Danske Bank A/S |
2,349 | 93,963 | ||||||
| Genmab A/S (c) |
153 | 33,785 | ||||||
| ISS A/S |
513 | 20,635 | ||||||
| Novo Nordisk A/S Class B |
6,352 | 303,735 | ||||||
| Novozymes A/S Class B |
1,759 | 90,286 | ||||||
| Pandora A/S |
425 | 41,961 | ||||||
| TDC A/S |
3,362 | 19,703 | ||||||
| Vestas Wind Systems A/S |
1,102 | 98,912 | ||||||
|
|
|
|||||||
| 828,174 | ||||||||
|
|
|
|||||||
| FINLAND — 0.4% |
| |||||||
| Kone Oyj Class B |
2,253 | 119,325 | ||||||
| Metso Oyj |
561 | 20,586 | ||||||
| Neste Oyj |
1,751 | 76,488 | ||||||
| Nokia Oyj (d) |
21,883 | 131,420 | ||||||
| Nokia Oyj (d) |
2,449 | 14,655 | ||||||
| Nokian Renkaat Oyj |
493 | 21,932 | ||||||
| Sampo Oyj Class A |
1,689 | 89,294 | ||||||
| Wartsila Oyj Abp |
723 | 51,198 | ||||||
|
|
|
|||||||
| 524,898 | ||||||||
|
|
|
|||||||
| FRANCE — 3.6% |
| |||||||
| Aeroports de Paris |
579 | 93,639 | ||||||
| Airbus SE |
2,401 | 228,241 | ||||||
| Alstom SA |
642 | 27,274 | ||||||
| Atos SE |
332 | 51,514 | ||||||
| AXA SA |
9,199 | 278,293 | ||||||
| BNP Paribas SA |
4,343 | 350,415 | ||||||
| Bollore SA |
10,605 | 53,020 | ||||||
| Bureau Veritas SA |
867 | 22,380 | ||||||
| Capgemini SE |
527 | 61,779 | ||||||
| CNP Assurances |
2,890 | 67,750 | ||||||
| Credit Agricole SA |
7,939 | 144,349 | ||||||
| Danone SA |
2,465 | 193,410 | ||||||
| Dassault Aviation SA |
17 | 27,502 | ||||||
| Dassault Systemes SE |
292 | 29,546 | ||||||
| Edenred |
1,821 | 49,514 | ||||||
| Essilor International SA |
744 | 92,134 | ||||||
| Eutelsat Communications SA |
1,018 | 30,159 | ||||||
| Fonciere Des Regions |
419 | 43,536 | ||||||
| Gecina SA REIT |
194 | 31,466 | ||||||
| Groupe Eurotunnel SE |
3,096 | 37,333 | ||||||
| Hermes International |
125 | 63,033 | ||||||
| ICADE REIT |
196 | 17,487 | ||||||
| Iliad SA |
68 | 18,076 | ||||||
| Ingenico Group SA |
194 | 18,394 | ||||||
| Kering |
293 | 116,749 | ||||||
| Klepierre SA REIT |
1,431 | 56,182 | ||||||
| L’Oreal SA |
1,215 | 258,403 | ||||||
| Lagardere SCA |
340 | 11,385 | ||||||
| Legrand SA |
1,385 | 100,009 | ||||||
| LVMH Moet Hennessy Louis Vuitton SE |
1,080 | 298,063 | ||||||
| Natixis SA |
5,902 | 47,237 | ||||||
| Orange SA |
8,254 | 135,244 | ||||||
| Pernod Ricard SA |
970 | 134,225 | ||||||
| Peugeot SA |
2,778 | 66,176 | ||||||
| Publicis Groupe SA |
734 | 51,274 | ||||||
| Remy Cointreau SA |
157 | 18,598 | ||||||
| Renault SA |
1,182 | 116,135 | ||||||
| Rexel SA |
2,366 | 40,949 | ||||||
| Safran SA |
1,343 | 137,240 | ||||||
| Sanofi |
4,287 | 425,770 | ||||||
| Schneider Electric SE (c) |
3,190 | 277,675 | ||||||
| SCOR SE |
776 | 32,544 | ||||||
| Societe BIC SA |
102 | 12,227 | ||||||
| Societe Generale SA |
3,345 | 195,884 | ||||||
| Sodexo SA |
502 | 62,610 | ||||||
| Thales SA |
437 | 49,482 | ||||||
| Unibail-Rodamco SE REIT |
463 | 112,619 | ||||||
| Valeo SA |
673 | 49,949 | ||||||
| Vinci SA |
2,069 | 196,656 | ||||||
| Vivendi SA |
5,191 | 131,450 | ||||||
| Zodiac Aerospace |
1,112 | 32,162 | ||||||
|
|
|
|||||||
| 5,197,141 | ||||||||
|
|
|
|||||||
| GERMANY — 3.1% |
| |||||||
| adidas AG |
708 | 160,201 | ||||||
| Allianz SE |
1,965 | 441,258 | ||||||
| BASF SE |
1,131 | 120,390 | ||||||
| Bayer AG |
2,484 | 338,588 | ||||||
| Bayerische Motoren Werke AG |
1,636 | 166,002 | ||||||
| Bayerische Motoren Werke AG Preference Shares |
885 | 78,866 | ||||||
| Beiersdorf AG |
337 | 36,266 | ||||||
| Brenntag AG |
1,132 | 63,052 | ||||||
| Commerzbank AG (c) |
4,227 | 57,517 | ||||||
| Continental AG |
272 | 69,055 | ||||||
| Daimler AG |
4,601 | 366,990 | ||||||
| Deutsche Bank AG |
9,178 | 158,739 | ||||||
| Deutsche Boerse AG |
607 | 65,811 | ||||||
| Deutsche Post AG |
1,423 | 63,363 | ||||||
| Deutsche Telekom AG |
10,780 | 201,166 | ||||||
See accompanying notes to financial statements.
122
Table of Contents
SPDR MSCI ACWI Low Carbon Target ETF
SCHEDULE OF INVESTMENTS (continued)
September 30, 2017
| Security Description |
Shares |
Value |
||||||
| Deutsche Wohnen SE |
1,265 | $ | 53,718 | |||||
| Fraport AG Frankfurt Airport Services Worldwide |
476 | 45,209 | ||||||
| Fresenius Medical Care AG & Co. KGaA |
838 | 81,999 | ||||||
| Fresenius SE & Co. KGaA |
1,467 | 118,365 | ||||||
| Fuchs Petrolub SE Preference Shares |
747 | 44,235 | ||||||
| GEA Group AG |
595 | 27,074 | ||||||
| Hannover Rueck SE |
219 | 26,395 | ||||||
| Henkel AG & Co. KGaA |
474 | 57,689 | ||||||
| Henkel AG & Co. KGaA Preference Shares |
547 | 74,463 | ||||||
| HUGO BOSS AG |
279 | 24,602 | ||||||
| Infineon Technologies AG |
3,506 | 88,160 | ||||||
| Merck KGaA |
510 | 56,747 | ||||||
| Muenchener Rueckversicherungs-Gesellschaft AG in Muenchen |
886 | 189,480 | ||||||
| ProSiebenSat.1 Media SE |
645 | 21,987 | ||||||
| SAP SE |
3,694 | 404,781 | ||||||
| Siemens AG |
3,269 | 460,661 | ||||||
| Symrise AG |
1,418 | 107,740 | ||||||
| Telefonica Deutschland Holding AG |
5,054 | 28,368 | ||||||
| Volkswagen AG Preference Shares |
733 | 119,584 | ||||||
| Vonovia SE |
2,038 | 86,736 | ||||||
| Zalando SE (c) (e) |
319 | 15,990 | ||||||
|
|
|
|||||||
| 4,521,247 | ||||||||
|
|
|
|||||||
| GREECE — 0.0% (a) |
| |||||||
| Alpha Bank AE (c) |
2,943 | 5,810 | ||||||
| Eurobank Ergasias SA (c) |
259 | 229 | ||||||
| JUMBO SA |
536 | 8,865 | ||||||
| National Bank of Greece SA (c) |
238 | 81 | ||||||
| OPAP SA |
1,717 | 18,167 | ||||||
| Piraeus Bank SA (c) |
2 | 7 | ||||||
|
|
|
|||||||
| 33,159 | ||||||||
|
|
|
|||||||
| HONG KONG — 1.1% |
| |||||||
| AIA Group, Ltd. |
38,000 | 280,231 | ||||||
| BOC Hong Kong Holdings, Ltd. |
8,500 | 41,299 | ||||||
| CK Asset Holdings, Ltd. |
9,459 | 78,293 | ||||||
| CK Hutchison Holdings, Ltd. |
3,500 | 44,743 | ||||||
| Galaxy Entertainment Group, Ltd. |
5,000 | 35,208 | ||||||
| Hanergy Thin Film Power Group, Ltd. (c) (f) |
24,000 | — | ||||||
| Hang Lung Properties, Ltd. |
11,000 | 26,110 | ||||||
| Henderson Land Development Co., Ltd. |
3,630 | 24,051 | ||||||
| Hong Kong & China Gas Co., Ltd. |
163,020 | 306,392 | ||||||
| Hong Kong Exchanges & Clearing, Ltd. |
2,374 | 63,828 | ||||||
| Hongkong Land Holdings, Ltd. |
6,800 | 48,960 | ||||||
| I-CABLE Communications, Ltd. (c) |
4,190 | 137 | ||||||
| Jardine Matheson Holdings, Ltd. |
800 | 50,688 | ||||||
| Kerry Properties, Ltd. |
7,000 | 28,992 | ||||||
| Li & Fung, Ltd. |
34,000 | 17,064 | ||||||
| Link REIT |
7,000 | 56,730 | ||||||
| Melco Resorts & Entertainment, Ltd. ADR |
709 | 17,101 | ||||||
| MTR Corp., Ltd. |
7,880 | 46,005 | ||||||
| Power Assets Holdings, Ltd. |
24,500 | 212,199 | ||||||
| Sands China, Ltd. |
11,200 | 58,289 | ||||||
| Sino Land Co., Ltd. |
6,058 | 10,641 | ||||||
| Sun Hung Kai Properties, Ltd. |
6,000 | 97,482 | ||||||
| Swire Properties, Ltd. |
6,800 | 23,071 | ||||||
| Wharf Holdings, Ltd. |
5,000 | 44,554 | ||||||
| Wheelock & Co., Ltd. |
4,000 | 28,141 | ||||||
|
|
|
|||||||
| 1,640,209 | ||||||||
|
|
|
|||||||
| INDIA — 0.9% |
| |||||||
| Adani Ports & Special Economic Zone, Ltd. |
8,782 | 50,652 | ||||||
| Asian Paints, Ltd. |
5,797 | 100,436 | ||||||
| Axis Bank, Ltd. |
4,683 | 36,503 | ||||||
| Bajaj Auto, Ltd. |
578 | 27,514 | ||||||
| Bharat Petroleum Corp., Ltd. |
15,264 | 110,133 | ||||||
| Bharti Airtel, Ltd. |
4,501 | 26,836 | ||||||
| Bharti Infratel, Ltd. |
3,012 | 18,371 | ||||||
| Eicher Motors, Ltd. |
52 | 24,848 | ||||||
| HCL Technologies, Ltd. |
1,915 | 25,647 | ||||||
| Hindustan Petroleum Corp., Ltd. |
10,153 | 66,339 | ||||||
| Hindustan Unilever, Ltd. |
1,669 | 29,994 | ||||||
| Housing Development Finance Corp., Ltd. |
4,356 | 116,179 | ||||||
| ICICI Bank, Ltd. ADR |
4,895 | 41,901 | ||||||
| Indian Oil Corp., Ltd. |
12,966 | 79,499 | ||||||
| Infosys, Ltd. ADR (b) |
8,224 | 119,988 | ||||||
| ITC, Ltd. |
17,927 | 70,890 | ||||||
| Larsen & Toubro, Ltd. GDR |
1,998 | 35,265 | ||||||
| Lupin, Ltd. |
329 | 5,107 | ||||||
| Mahindra & Mahindra, Ltd. GDR |
1,119 | 21,597 | ||||||
| Maruti Suzuki India, Ltd. |
421 | 51,421 | ||||||
| Power Finance Corp., Ltd. |
4,887 | 9,120 | ||||||
| Reliance Industries, Ltd. |
3,246 | 38,806 | ||||||
| Rural Electrification Corp., Ltd. |
8,180 | 19,148 | ||||||
| State Bank of India GDR |
620 | 23,808 | ||||||
| Sun Pharmaceutical Industries, Ltd. |
2,792 | 21,511 | ||||||
| Tata Consultancy Services, Ltd. |
1,849 | 68,954 | ||||||
| Tata Motors, Ltd. (c) |
2,808 | 17,260 | ||||||
| Tata Motors, Ltd. Class A (c) |
10,536 | 35,857 | ||||||
| Wipro, Ltd. ADR (b) |
3,204 | 18,199 | ||||||
|
|
|
|||||||
| 1,311,783 | ||||||||
|
|
|
|||||||
| INDONESIA — 0.3% |
| |||||||
| Astra International Tbk PT |
91,800 | 53,844 | ||||||
| Bank Central Asia Tbk PT |
13,700 | 20,648 | ||||||
| Bank Mandiri Persero Tbk PT |
68,000 | 33,952 | ||||||
| Bank Rakyat Indonesia Persero Tbk PT |
34,000 | 38,559 | ||||||
| Charoen Pokphand Indonesia Tbk PT |
25,500 | 5,187 | ||||||
| Gudang Garam Tbk PT |
4,700 | 22,961 | ||||||
| Hanjaya Mandala Sampoerna Tbk PT |
81,700 | 23,414 | ||||||
| Indofood CBP Sukses Makmur Tbk PT |
15,600 | 10,105 | ||||||
| Jasa Marga Persero Tbk PT |
101,750 | 42,305 | ||||||
| Perusahaan Gas Negara Persero Tbk |
252,300 | 29,503 | ||||||
| Telekomunikasi Indonesia Persero Tbk PT |
248,900 | 86,484 | ||||||
| Unilever Indonesia Tbk PT |
8,500 | 30,907 | ||||||
|
|
|
|||||||
| 397,869 | ||||||||
|
|
|
|||||||
| IRELAND — 0.1% |
| |||||||
| Bank of Ireland Group PLC (c) |
2,426 | 19,875 | ||||||
| Experian PLC |
4,417 | 88,832 | ||||||
| Kerry Group PLC Class A |
169 | 16,241 | ||||||
| Paddy Power Betfair PLC |
286 | 28,543 | ||||||
| XL Group, Ltd. |
1,187 | 46,827 | ||||||
|
|
|
|||||||
| 200,318 | ||||||||
|
|
|
|||||||
See accompanying notes to financial statements.
123
Table of Contents
SPDR MSCI ACWI Low Carbon Target ETF
SCHEDULE OF INVESTMENTS (continued)
September 30, 2017
| Security Description |
Shares |
Value |
||||||
| ISRAEL — 0.1% |
| |||||||
| Bank Leumi Le-Israel BM |
2,181 | $ | 11,576 | |||||
| Bezeq The Israeli Telecommunication Corp., Ltd. |
5,345 | 7,642 | ||||||
| Check Point Software Technologies, Ltd. (c) |
528 | 60,203 | ||||||
| Elbit Systems, Ltd. |
88 | 12,936 | ||||||
| Frutarom Industries, Ltd. |
654 | 50,338 | ||||||
| Teva Pharmaceutical Industries, Ltd. |
3,531 | 61,732 | ||||||
|
|
|
|||||||
| 204,427 | ||||||||
|
|
|
|||||||
| ITALY — 0.7% |
| |||||||
| Assicurazioni Generali SpA |
4,887 | 91,052 | ||||||
| Atlantia SpA |
3,522 | 111,213 | ||||||
| Ferrari NV |
395 | 43,662 | ||||||
| Intesa Sanpaolo SpA |
53,695 | 189,927 | ||||||
| Leonardo SpA |
1,722 | 32,267 | ||||||
| Luxottica Group SpA |
428 | 23,928 | ||||||
| Mediobanca SpA |
2,469 | 26,503 | ||||||
| Snam SpA |
67,120 | 323,427 | ||||||
| Telecom Italia SpA/Milano Savings Shares |
88,045 | 66,199 | ||||||
| Terna Rete Elettrica Nazionale SpA |
2,605 | 15,219 | ||||||
| UniCredit SpA (c) |
7,276 | 155,002 | ||||||
| UnipolSai Assicurazioni SpA |
1,537 | 3,590 | ||||||
|
|
|
|||||||
| 1,081,989 | ||||||||
|
|
|
|||||||
| JAPAN — 7.7% |
| |||||||
| Aisin Seiki Co., Ltd. |
300 | 15,804 | ||||||
| Alfresa Holdings Corp. |
600 | 10,975 | ||||||
| Alps Electric Co., Ltd. |
500 | 13,188 | ||||||
| Amada Holdings Co., Ltd. |
1,700 | 18,651 | ||||||
| Asahi Group Holdings, Ltd. |
1,700 | 68,806 | ||||||
| Asics Corp. |
400 | 5,956 | ||||||
| Astellas Pharma, Inc. |
8,200 | 104,280 | ||||||
| Bandai Namco Holdings, Inc. |
400 | 13,717 | ||||||
| Bank of Kyoto, Ltd. |
200 | 10,163 | ||||||
| Bridgestone Corp. |
800 | 36,288 | ||||||
| Brother Industries, Ltd. |
500 | 11,629 | ||||||
| Canon, Inc. |
4,800 | 163,959 | ||||||
| Casio Computer Co., Ltd. |
1,100 | 15,479 | ||||||
| Central Japan Railway Co. |
900 | 157,749 | ||||||
| Chiba Bank, Ltd. (b) |
3,000 | 21,454 | ||||||
| Chugai Pharmaceutical Co., Ltd. |
600 | 24,892 | ||||||
| Concordia Financial Group, Ltd. |
5,600 | 27,665 | ||||||
| Credit Saison Co., Ltd. |
500 | 10,372 | ||||||
| Dai-ichi Life Holdings, Inc. |
4,900 | 87,888 | ||||||
| Daiichi Sankyo Co., Ltd. |
1,700 | 38,330 | ||||||
| Daikin Industries, Ltd. |
800 | 80,984 | ||||||
| Daito Trust Construction Co., Ltd. |
200 | 36,423 | ||||||
| Daiwa House Industry Co., Ltd. |
2,000 | 69,027 | ||||||
| Daiwa Securities Group, Inc. |
11,000 | 62,278 | ||||||
| DeNA Co., Ltd. |
200 | 4,481 | ||||||
| Denso Corp. |
2,000 | 101,150 | ||||||
| Dentsu, Inc. |
1,200 | 52,663 | ||||||
| East Japan Railway Co. |
1,500 | 138,387 | ||||||
| Eisai Co., Ltd. |
1,100 | 56,444 | ||||||
| FANUC Corp. |
800 | 161,969 | ||||||
| Fast Retailing Co., Ltd. |
200 | 58,970 | ||||||
| FUJIFILM Holdings Corp. |
600 | 23,277 | ||||||
| Fujitsu, Ltd. |
5,000 | 37,130 | ||||||
| Fukuoka Financial Group, Inc. |
3,000 | 13,859 | ||||||
| Hachijuni Bank, Ltd. |
3,100 | 19,360 | ||||||
| Hankyu Hanshin Holdings, Inc. |
1,000 | 37,934 | ||||||
| Hino Motors, Ltd. |
1,700 | 20,781 | ||||||
| Hirose Electric Co., Ltd. |
100 | 14,072 | ||||||
| Hiroshima Bank, Ltd. |
1,000 | 8,093 | ||||||
| Hitachi Chemical Co., Ltd. |
400 | 10,963 | ||||||
| Hitachi Construction Machinery Co., Ltd. |
400 | 11,851 | ||||||
| Hitachi, Ltd. |
10,000 | 70,439 | ||||||
| Honda Motor Co., Ltd. |
5,600 | 165,764 | ||||||
| Hoshizaki Corp. |
200 | 17,572 | ||||||
| Hoya Corp. |
1,400 | 75,556 | ||||||
| IHI Corp. |
500 | 17,368 | ||||||
| Iida Group Holdings Co., Ltd. |
1,600 | 28,513 | ||||||
| Isetan Mitsukoshi Holdings, Ltd. (b) |
1,900 | 19,833 | ||||||
| Isuzu Motors, Ltd. |
3,100 | 41,062 | ||||||
| ITOCHU Corp. |
9,800 | 160,453 | ||||||
| Japan Airport Terminal Co., Ltd. (b) |
300 | 10,687 | ||||||
| Japan Exchange Group, Inc. |
1,600 | 28,300 | ||||||
| Japan Post Bank Co., Ltd. (b) |
3,700 | 45,689 | ||||||
| Japan Post Holdings Co., Ltd. (b) |
4,532 | 53,507 | ||||||
| Japan Real Estate Investment Corp. REIT |
3 | 14,418 | ||||||
| Japan Retail Fund Investment Corp. REIT |
4 | 7,175 | ||||||
| Japan Tobacco, Inc. |
5,300 | 173,645 | ||||||
| Kajima Corp. |
4,000 | 39,728 | ||||||
| Kamigumi Co., Ltd. |
2,000 | 46,284 | ||||||
| Kansai Paint Co., Ltd. (b) |
2,800 | 70,445 | ||||||
| Kao Corp. |
1,700 | 99,978 | ||||||
| KDDI Corp. |
7,500 | 197,686 | ||||||
| Keikyu Corp. |
1,000 | 20,264 | ||||||
| Keio Corp. |
400 | 16,488 | ||||||
| Keisei Electric Railway Co., Ltd. |
1,000 | 27,673 | ||||||
| Keyence Corp. |
300 | 159,241 | ||||||
| Kikkoman Corp. |
1,000 | 30,738 | ||||||
| Kirin Holdings Co., Ltd. |
1,700 | 39,991 | ||||||
| Koito Manufacturing Co., Ltd. |
600 | 37,632 | ||||||
| Komatsu, Ltd. |
5,000 | 142,185 | ||||||
| Konami Holdings Corp. |
300 | 14,418 | ||||||
| Kubota Corp. |
4,500 | 81,773 | ||||||
| Kyocera Corp. |
1,300 | 80,634 | ||||||
| Lawson, Inc. (b) |
400 | 26,474 | ||||||
| Lion Corp. |
1,000 | 18,247 | ||||||
| M3, Inc. |
500 | 14,236 | ||||||
| Mabuchi Motor Co., Ltd. |
200 | 10,003 | ||||||
| Makita Corp. |
800 | 32,230 | ||||||
| Marubeni Corp. |
18,600 | 126,985 | ||||||
| Marui Group Co., Ltd. (b) |
500 | 7,156 | ||||||
| Maruichi Steel Tube, Ltd. |
3,100 | 90,192 | ||||||
| Mazda Motor Corp. |
1,700 | 26,052 | ||||||
| Mebuki Financial Group, Inc. |
6,200 | 23,959 | ||||||
| Medipal Holdings Corp. |
1,300 | 22,567 | ||||||
| MEIJI Holdings Co., Ltd. |
300 | 23,773 | ||||||
| MISUMI Group, Inc. |
1,200 | 31,587 | ||||||
| Mitsubishi Corp. |
3,600 | 83,648 | ||||||
| Mitsubishi Electric Corp. |
7,400 | 115,571 | ||||||
| Mitsubishi Estate Co., Ltd. |
5,000 | 86,905 | ||||||
| Mitsubishi Heavy Industries, Ltd. |
1,700 | 67,191 | ||||||
| Mitsubishi Motors Corp. |
1,700 | 13,441 | ||||||
See accompanying notes to financial statements.
124
Table of Contents
SPDR MSCI ACWI Low Carbon Target ETF
SCHEDULE OF INVESTMENTS (continued)
September 30, 2017
| Security Description |
Shares |
Value |
||||||
| Mitsubishi Tanabe Pharma Corp. |
500 | $ | 11,460 | |||||
| Mitsubishi UFJ Financial Group, Inc. |
49,400 | 320,673 | ||||||
| Mitsubishi UFJ Lease & Finance Co., Ltd. |
3,600 | 19,061 | ||||||
| Mitsui & Co., Ltd. |
8,800 | 130,008 | ||||||
| Mitsui Fudosan Co., Ltd. |
3,800 | 82,370 | ||||||
| Mizuho Financial Group, Inc. |
101,800 | 178,251 | ||||||
| MS&AD Insurance Group Holdings, Inc. |
2,800 | 90,120 | ||||||
| Murata Manufacturing Co., Ltd. |
700 | 102,856 | ||||||
| Nabtesco Corp. |
400 | 14,854 | ||||||
| Nagoya Railroad Co., Ltd. |
400 | 8,610 | ||||||
| NEC Corp. |
600 | 16,257 | ||||||
| Nexon Co., Ltd. (c) |
600 | 15,650 | ||||||
| NGK Spark Plug Co., Ltd. |
600 | 12,766 | ||||||
| Nidec Corp. |
1,100 | 135,051 | ||||||
| Nintendo Co., Ltd. |
400 | 147,684 | ||||||
| Nippon Building Fund, Inc. REIT |
3 | 14,951 | ||||||
| Nippon Paint Holdings Co., Ltd. |
1,600 | 54,369 | ||||||
| Nippon Telegraph & Telephone Corp. |
2,600 | 119,115 | ||||||
| Nissan Chemical Industries, Ltd. |
1,100 | 38,698 | ||||||
| Nissan Motor Co., Ltd. (b) |
10,200 | 100,990 | ||||||
| Nitori Holdings Co., Ltd. |
300 | 42,882 | ||||||
| Nitto Denko Corp. |
1,100 | 91,682 | ||||||
| Nomura Holdings, Inc. |
17,000 | 95,145 | ||||||
| Nomura Real Estate Holdings, Inc. |
1,200 | 25,564 | ||||||
| Nomura Real Estate Master Fund, Inc. |
13 | 16,896 | ||||||
| Nomura Research Institute, Ltd. |
300 | 11,700 | ||||||
| NTT Data Corp. |
1,500 | 16,044 | ||||||
| NTT DOCOMO, Inc. |
6,000 | 137,014 | ||||||
| Obayashi Corp. |
2,100 | 25,167 | ||||||
| Odakyu Electric Railway Co., Ltd. |
1,400 | 26,554 | ||||||
| Olympus Corp. |
1,200 | 40,617 | ||||||
| Omron Corp. |
500 | 25,452 | ||||||
| Ono Pharmaceutical Co., Ltd. |
1,400 | 31,709 | ||||||
| Oriental Land Co., Ltd. |
1,100 | 83,786 | ||||||
| ORIX Corp. |
4,800 | 77,374 | ||||||
| Otsuka Holdings Co., Ltd. |
1,400 | 55,607 | ||||||
| Panasonic Corp. |
6,800 | 98,498 | ||||||
| Rakuten, Inc. |
3,400 | 37,061 | ||||||
| Recruit Holdings Co., Ltd. |
4,500 | 97,424 | ||||||
| Resona Holdings, Inc. |
11,900 | 61,104 | ||||||
| Ryohin Keikaku Co., Ltd. |
100 | 29,450 | ||||||
| Santen Pharmaceutical Co., Ltd. |
1,200 | 18,901 | ||||||
| SBI Holdings, Inc. |
1,700 | 25,583 | ||||||
| Secom Co., Ltd. |
1,500 | 109,297 | ||||||
| Sekisui House, Ltd. |
3,400 | 57,283 | ||||||
| Seven & i Holdings Co., Ltd. |
2,800 | 108,080 | ||||||
| Sharp Corp. (b) (c) |
700 | 21,112 | ||||||
| Shimano, Inc. |
200 | 26,633 | ||||||
| Shimizu Corp. |
2,000 | 22,156 | ||||||
| Shin-Etsu Chemical Co., Ltd. |
1,700 | 151,930 | ||||||
| Shinsei Bank, Ltd. |
600 | 9,600 | ||||||
| Shionogi & Co., Ltd. |
1,200 | 65,573 | ||||||
| Shiseido Co., Ltd. |
1,700 | 67,991 | ||||||
| Shizuoka Bank, Ltd. |
2,000 | 17,981 | ||||||
| SMC Corp. |
300 | 105,779 | ||||||
| SoftBank Group Corp. |
3,100 | 250,170 | ||||||
| Sohgo Security Services Co., Ltd. |
200 | 9,168 | ||||||
| Sompo Holdings, Inc. |
1,700 | 66,118 | ||||||
| Sony Corp. |
4,700 | 174,781 | ||||||
| Sony Financial Holdings, Inc. |
1,200 | 19,679 | ||||||
| Start Today Co., Ltd. |
500 | 15,835 | ||||||
| Subaru Corp. |
3,200 | 115,418 | ||||||
| Sumitomo Corp. |
10,800 | 155,286 | ||||||
| Sumitomo Electric Industries, Ltd. |
400 | 6,531 | ||||||
| Sumitomo Heavy Industries, Ltd. |
800 | 32,053 | ||||||
| Sumitomo Metal Mining Co., Ltd. |
2,000 | 64,212 | ||||||
| Sumitomo Mitsui Financial Group, Inc. |
5,900 | 226,429 | ||||||
| Sumitomo Mitsui Trust Holdings, Inc. |
1,700 | 61,331 | ||||||
| Sumitomo Realty & Development Co., Ltd. |
1,000 | 30,249 | ||||||
| Suntory Beverage & Food, Ltd. |
700 | 31,155 | ||||||
| Suzuki Motor Corp. |
1,700 | 89,134 | ||||||
| Sysmex Corp. |
500 | 31,893 | ||||||
| T&D Holdings, Inc. |
3,400 | 49,339 | ||||||
| Taisei Corp. |
600 | 31,448 | ||||||
| Takeda Pharmaceutical Co., Ltd. |
3,000 | 165,611 | ||||||
| Terumo Corp. |
1,100 | 43,242 | ||||||
| Toho Gas Co., Ltd. |
3,200 | 93,670 | ||||||
| Tokio Marine Holdings, Inc. |
3,000 | 117,319 | ||||||
| Tokyo Electron, Ltd. |
700 | 107,458 | ||||||
| Tokyu Corp. |
4,700 | 66,514 | ||||||
| TOTO, Ltd. |
300 | 12,633 | ||||||
| Toyota Industries Corp. (b) |
1,200 | 68,973 | ||||||
| Toyota Motor Corp. |
10,200 | 608,022 | ||||||
| Toyota Tsusho Corp. |
2,500 | 82,064 | ||||||
| Trend Micro, Inc. |
200 | 9,843 | ||||||
| Tsuruha Holdings, Inc. |
100 | 11,949 | ||||||
| Unicharm Corp. |
1,700 | 38,904 | ||||||
| Yahoo! Japan Corp. (b) |
5,100 | 24,194 | ||||||
| Yakult Honsha Co., Ltd. |
300 | 21,614 | ||||||
| Yamaha Corp. |
300 | 11,060 | ||||||
| Yamaha Motor Co., Ltd. |
600 | 17,963 | ||||||
| Yamato Holdings Co., Ltd. |
1,100 | 22,197 | ||||||
| Yaskawa Electric Corp. |
500 | 15,835 | ||||||
|
|
|
|||||||
| 11,280,414 | ||||||||
|
|
|
|||||||
| JORDAN — 0.0% (a) |
| |||||||
| Hikma Pharmaceuticals PLC |
700 | 11,373 | ||||||
|
|
|
|||||||
| LUXEMBOURG — 0.1% |
| |||||||
| Millicom International Cellular SA SDR |
188 | 12,380 | ||||||
| RTL Group SA |
170 | 12,870 | ||||||
| SES SA |
1,540 | 33,699 | ||||||
| Tenaris SA |
1,148 | 16,286 | ||||||
|
|
|
|||||||
| 75,235 | ||||||||
|
|
|
|||||||
| MACAU — 0.0% (a) |
| |||||||
| MGM China Holdings, Ltd. (b) |
6,800 | 16,298 | ||||||
|
|
|
|||||||
| MALAYSIA — 0.3% |
| |||||||
| British American Tobacco Malaysia Bhd |
900 | 9,323 | ||||||
| CIMB Group Holdings Bhd |
21,324 | 31,816 | ||||||
| Gamuda Bhd |
23,100 | 28,885 | ||||||
| IOI Properties Group Bhd |
62,912 | 30,096 | ||||||
| Malayan Banking Bhd |
7,299 | 16,474 | ||||||
| Petronas Chemicals Group Bhd |
33,500 | 57,837 | ||||||
| Petronas Dagangan Bhd |
17,900 | 103,097 | ||||||
| PPB Group Bhd |
11,100 | 44,321 | ||||||
| Sapura Energy Bhd |
67,200 | 24,190 | ||||||
| Westports Holdings Bhd |
65,162 | 58,796 | ||||||
|
|
|
|||||||
| 404,835 | ||||||||
|
|
|
|||||||
See accompanying notes to financial statements.
125
Table of Contents
SPDR MSCI ACWI Low Carbon Target ETF
SCHEDULE OF INVESTMENTS (continued)
September 30, 2017
| Security Description |
Shares |
Value |
||||||
| MEXICO — 0.4% |
| |||||||
| America Movil SAB de CV Series L |
58,872 | $ | 52,391 | |||||
| Coca-Cola Femsa SAB de CV Series L |
1,687 | 13,072 | ||||||
| Fibra Uno Administracion SA de CV REIT |
7,096 | 12,004 | ||||||
| Fomento Economico Mexicano SAB de CV |
6,730 | 64,501 | ||||||
| Fresnillo PLC |
3,196 | 60,245 | ||||||
| Grupo Aeroportuario del Pacifico SAB de CV Class B |
1,687 | 17,317 | ||||||
| Grupo Aeroportuario del Sureste SAB de CV Class B |
1,704 | 32,523 | ||||||
| Grupo Financiero Banorte SAB de CV Series O |
3,062 | 21,175 | ||||||
| Grupo Mexico SAB de CV Series B |
41,043 | 125,869 | ||||||
| Grupo Televisa SAB Series CPO |
6,730 | 33,262 | ||||||
| Promotora y Operadora de Infraestructura SAB de CV |
4,364 | 46,321 | ||||||
| Wal-Mart de Mexico SAB de CV |
23,537 | 54,049 | ||||||
|
|
|
|||||||
| 532,729 | ||||||||
|
|
|
|||||||
| NETHERLANDS — 1.1% |
| |||||||
| ABN AMRO Group NV (e) |
833 | 24,954 | ||||||
| Aegon NV |
10,863 | 63,287 | ||||||
| AerCap Holdings NV (c) |
882 | 45,079 | ||||||
| Altice NV Class A (c) |
1,214 | 24,319 | ||||||
| Altice NV Class B (c) |
646 | 12,907 | ||||||
| ASML Holding NV |
1,309 | 222,917 | ||||||
| Gemalto NV |
238 | 10,634 | ||||||
| Heineken NV |
647 | 63,982 | ||||||
| ING Groep NV |
14,609 | 269,424 | ||||||
| Koninklijke Ahold Delhaize NV |
961 | 17,973 | ||||||
| Koninklijke DSM NV |
1,112 | 91,050 | ||||||
| Koninklijke KPN NV |
10,916 | 37,489 | ||||||
| Koninklijke Philips NV |
4,244 | 175,253 | ||||||
| Koninklijke Vopak NV |
4,770 | 209,238 | ||||||
| NN Group NV |
1,683 | 70,453 | ||||||
| NXP Semiconductors NV (c) |
1,038 | 117,387 | ||||||
| Randstad Holding NV |
782 | 48,387 | ||||||
| Royal Dutch Shell PLC Class A |
180 | 5,430 | ||||||
| Wolters Kluwer NV |
1,018 | 47,050 | ||||||
|
|
|
|||||||
| 1,557,213 | ||||||||
|
|
|
|||||||
| NEW ZEALAND — 0.1% |
| |||||||
| Auckland International Airport, Ltd. |
2,238 | 10,419 | ||||||
| Meridian Energy, Ltd. |
66,516 | 136,800 | ||||||
|
|
|
|||||||
| 147,219 | ||||||||
|
|
|
|||||||
| NORWAY — 0.2% |
| |||||||
| DNB ASA |
5,330 | 107,466 | ||||||
| Gjensidige Forsikring ASA |
680 | 11,840 | ||||||
| Marine Harvest ASA (c) |
3,034 | 60,030 | ||||||
| Orkla ASA |
8,052 | 82,641 | ||||||
| Schibsted ASA Class B |
877 | 20,712 | ||||||
| Telenor ASA |
3,914 | 82,801 | ||||||
|
|
|
|||||||
| 365,490 | ||||||||
|
|
|
|||||||
| PERU — 0.2% |
| |||||||
| Cia de Minas Buenaventura SAA ADR |
260 | 3,325 | ||||||
| Southern Copper Corp. |
5,684 | 225,996 | ||||||
|
|
|
|||||||
| 229,321 | ||||||||
|
|
|
|||||||
| PHILIPPINES — 0.1% |
| |||||||
| International Container Terminal Services, Inc. |
3,400 | 6,961 | ||||||
| PLDT, Inc. |
425 | 13,955 | ||||||
| SM Investments Corp. |
1,970 | 34,243 | ||||||
| SM Prime Holdings, Inc. |
32,300 | 21,904 | ||||||
| Universal Robina Corp. |
2,040 | 6,136 | ||||||
|
|
|
|||||||
| 83,199 | ||||||||
|
|
|
|||||||
| POLAND — 0.1% |
| |||||||
| Bank Pekao SA |
1,113 | 39,096 | ||||||
| Bank Zachodni WBK SA |
136 | 13,037 | ||||||
| CCC SA |
182 | 13,785 | ||||||
| Cyfrowy Polsat SA |
1,224 | 8,716 | ||||||
| LPP SA |
12 | 26,912 | ||||||
| mBank SA (c) |
68 | 7,819 | ||||||
| Powszechna Kasa Oszczednosci Bank Polski SA (c) |
4,444 | 43,087 | ||||||
| Powszechny Zaklad Ubezpieczen SA |
3,655 | 46,139 | ||||||
|
|
|
|||||||
| 198,591 | ||||||||
|
|
|
|||||||
| PORTUGAL — 0.0% (a) |
| |||||||
| Jeronimo Martins SGPS SA |
1,015 | 20,027 | ||||||
|
|
|
|||||||
| QATAR — 0.1% |
| |||||||
| Barwa Real Estate Co. |
2,624 | 23,107 | ||||||
| Ezdan Holding Group QSC |
6,804 | 19,623 | ||||||
| Qatar Gas Transport Co., Ltd. |
18,269 | 79,233 | ||||||
|
|
|
|||||||
| 121,963 | ||||||||
|
|
|
|||||||
| ROMANIA — 0.0% (a) |
| |||||||
| NEPI Rockcastle PLC |
1,419 | 19,326 | ||||||
|
|
|
|||||||
| RUSSIA — 0.3% |
| |||||||
| Magnit PJSC GDR |
1,985 | 81,286 | ||||||
| Mobile TeleSystems PJSC ADR |
5,044 | 52,659 | ||||||
| Moscow Exchange MICEX-RTS PJSC |
20,497 | 41,245 | ||||||
| PhosAgro PJSC GDR |
2,591 | 36,922 | ||||||
| Sberbank of Russia PJSC ADR |
15,807 | 225,013 | ||||||
| VTB Bank PJSC GDR |
20,690 | 44,483 | ||||||
|
|
|
|||||||
| 481,608 | ||||||||
|
|
|
|||||||
| SINGAPORE — 0.7% |
| |||||||
| Broadcom, Ltd. |
1,524 | 369,631 | ||||||
| City Developments, Ltd. |
1,832 | 15,285 | ||||||
| DBS Group Holdings, Ltd. |
6,549 | 100,409 | ||||||
| Genting Singapore PLC |
34,000 | 29,294 | ||||||
| Global Logistic Properties, Ltd. |
17,000 | 41,312 | ||||||
| Hutchison Port Holdings Trust |
78,000 | 33,540 | ||||||
| Jardine Cycle & Carriage, Ltd. |
784 | 22,713 | ||||||
| Oversea-Chinese Banking Corp., Ltd. |
9,708 | 79,783 | ||||||
| SATS, Ltd. |
6,200 | 21,048 | ||||||
| Singapore Technologies Engineering, Ltd. |
9,000 | 22,799 | ||||||
| Singapore Telecommunications, Ltd. |
55,129 | 149,398 | ||||||
| United Overseas Bank, Ltd. |
4,654 | 80,540 | ||||||
| UOL Group, Ltd. |
2,892 | 17,293 | ||||||
|
|
|
|||||||
| 983,045 | ||||||||
|
|
|
|||||||
| SOUTH AFRICA — 0.7% |
| |||||||
| Aspen Pharmacare Holdings, Ltd. |
1,579 | 35,502 | ||||||
| Barclays Africa Group, Ltd. |
3,455 | 35,567 | ||||||
| Bid Corp., Ltd. |
1,657 | 37,294 | ||||||
See accompanying notes to financial statements.
126
Table of Contents
SPDR MSCI ACWI Low Carbon Target ETF
SCHEDULE OF INVESTMENTS (continued)
September 30, 2017
| Security Description |
Shares |
Value |
||||||
| Brait SE (c) |
4,081 | $ | 16,170 | |||||
| Discovery, Ltd. |
1,173 | 12,220 | ||||||
| FirstRand, Ltd. (b) |
17,502 | 67,441 | ||||||
| Fortress Income Fund, Ltd. Class A |
22,317 | 28,511 | ||||||
| Growthpoint Properties, Ltd. REIT |
20,424 | 36,756 | ||||||
| Hyprop Investments, Ltd. |
2,053 | 16,074 | ||||||
| Investec PLC |
2,384 | 17,432 | ||||||
| Investec, Ltd. |
1,825 | 13,246 | ||||||
| Mediclinic International PLC |
1,509 | 13,160 | ||||||
| Mr. Price Group, Ltd. |
408 | 5,440 | ||||||
| MTN Group, Ltd. |
6,994 | 64,426 | ||||||
| Naspers, Ltd. Class N |
1,647 | 356,174 | ||||||
| Nedbank Group, Ltd. |
1,241 | 18,625 | ||||||
| Novus Holdings, Ltd. |
570 | 275 | ||||||
| Redefine Properties, Ltd. REIT |
50,505 | 39,985 | ||||||
| Resilient REIT, Ltd. REIT |
1,877 | 18,500 | ||||||
| RMB Holdings, Ltd. |
6,790 | 31,932 | ||||||
| Sanlam, Ltd. |
5,566 | 27,891 | ||||||
| SPAR Group, Ltd. |
1,590 | 19,675 | ||||||
| Standard Bank Group, Ltd. |
5,561 | 64,994 | ||||||
| Steinhoff International Holdings NV |
15,597 | 69,342 | ||||||
| Truworths International, Ltd. |
1,673 | 9,571 | ||||||
| Vodacom Group, Ltd. |
2,418 | 28,857 | ||||||
|
|
|
|||||||
| 1,085,060 | ||||||||
|
|
|
|||||||
| SOUTH KOREA — 1.6% |
| |||||||
| Amorepacific Corp. |
147 | 33,305 | ||||||
| Amorepacific Corp. Preference Shares |
52 | 7,083 | ||||||
| AMOREPACIFIC Group |
130 | 14,018 | ||||||
| Celltrion, Inc. (c) |
288 | 35,706 | ||||||
| Coway Co., Ltd. |
130 | 10,669 | ||||||
| Daelim Industrial Co., Ltd. |
234 | 16,365 | ||||||
| Daewoo Engineering & Construction Co., Ltd. (c) |
1,027 | 6,465 | ||||||
| Dongbu Insurance Co., Ltd. |
130 | 8,286 | ||||||
| Dongsuh Cos., Inc. |
900 | 21,059 | ||||||
| Hana Financial Group, Inc. |
1,343 | 55,521 | ||||||
| Hanssem Co., Ltd. |
40 | 5,291 | ||||||
| Hanwha Corp. |
371 | 14,252 | ||||||
| Hanwha Life Insurance Co., Ltd. |
897 | 5,365 | ||||||
| Hyundai Engineering & Construction Co., Ltd. |
910 | 30,470 | ||||||
| Hyundai Glovis Co., Ltd. |
352 | 45,485 | ||||||
| Hyundai Heavy Industries Co., Ltd. (c) |
86 | 10,887 | ||||||
| Hyundai Mobis Co., Ltd. |
385 | 80,674 | ||||||
| Hyundai Motor Co. |
109 | 14,323 | ||||||
| Hyundai Motor Co. Preference Shares (d) |
574 | 51,369 | ||||||
| Hyundai Motor Co. Preference Shares (d) |
802 | 65,541 | ||||||
| Industrial Bank of Korea |
897 | 11,278 | ||||||
| Kakao Corp. |
52 | 6,538 | ||||||
| Kangwon Land, Inc. |
840 | 25,669 | ||||||
| KB Financial Group, Inc. |
1,534 | 75,136 | ||||||
| KEPCO Plant Service & Engineering Co., Ltd. |
174 | 6,297 | ||||||
| Kia Motors Corp. |
827 | 22,853 | ||||||
| Korea Aerospace Industries, Ltd. |
570 | 21,748 | ||||||
| Korea Gas Corp. (c) |
1,437 | 52,820 | ||||||
| Korea Zinc Co., Ltd. |
277 | 119,835 | ||||||
| KT&G Corp. |
574 | 52,872 | ||||||
| LG Household & Health Care, Ltd. |
34 | 27,785 | ||||||
| LG Household & Health Care, Ltd. Preference Shares |
45 | 23,495 | ||||||
| Mirae Asset Daewoo Co., Ltd. |
2,070 | 17,766 | ||||||
| NAVER Corp. |
102 | 66,346 | ||||||
| NCSoft Corp. |
52 | 21,089 | ||||||
| Orion Corp. (c) |
85 | 7,199 | ||||||
| S-1 Corp. |
104 | 8,099 | ||||||
| Samsung C&T Corp. |
370 | 43,611 | ||||||
| Samsung Card Co., Ltd. |
156 | 5,019 | ||||||
| Samsung Electronics Co., Ltd. |
324 | 725,312 | ||||||
| Samsung Electronics Co., Ltd. Preference Shares |
69 | 124,222 | ||||||
| Samsung Fire & Marine Insurance Co., Ltd. |
119 | 29,091 | ||||||
| Samsung Life Insurance Co., Ltd. |
255 | 25,158 | ||||||
| Samsung SDS Co., Ltd. |
101 | 14,859 | ||||||
| Samsung Securities Co., Ltd. |
206 | 6,214 | ||||||
| Shinhan Financial Group Co., Ltd. |
1,687 | 74,087 | ||||||
| SK Holdings Co., Ltd. |
223 | 56,074 | ||||||
| SK Hynix, Inc. |
1,306 | 94,528 | ||||||
| SK Telecom Co., Ltd. |
65 | 14,472 | ||||||
| Woori Bank |
1,417 | 22,084 | ||||||
|
|
|
|||||||
| 2,333,690 | ||||||||
|
|
|
|||||||
| SPAIN — 1.2% |
| |||||||
| Abertis Infraestructuras SA |
4,419 | 89,333 | ||||||
| Aena SME SA (e) |
495 | 89,387 | ||||||
| Amadeus IT Group SA |
767 | 49,862 | ||||||
| Banco Bilbao Vizcaya Argentaria SA |
23,768 | 212,453 | ||||||
| Banco de Sabadell SA |
24,648 | 51,459 | ||||||
| Banco Santander SA |
51,957 | 362,829 | ||||||
| Bankia SA |
1,370 | 6,608 | ||||||
| CaixaBank SA |
11,905 | 59,674 | ||||||
| Enagas SA |
15,388 | 433,417 | ||||||
| Industria de Diseno Textil SA |
3,394 | 127,935 | ||||||
| Mapfre SA |
226 | 736 | ||||||
| Red Electrica Corp. SA |
7,162 | 150,542 | ||||||
| Telefonica SA |
17,344 | 188,473 | ||||||
|
|
|
|||||||
| 1,822,708 | ||||||||
|
|
|
|||||||
| SWEDEN — 1.1% |
| |||||||
| Alfa Laval AB |
1,343 | 32,726 | ||||||
| Assa Abloy AB Class B |
3,337 | 76,042 | ||||||
| Atlas Copco AB Class A |
1,202 | 50,791 | ||||||
| Atlas Copco AB Class B |
3,853 | 149,072 | ||||||
| Autoliv, Inc. (b) |
272 | 33,619 | ||||||
| Boliden AB |
8,696 | 293,725 | ||||||
| Hennes & Mauritz AB Class B |
3,769 | 97,430 | ||||||
| Hexagon AB Class B |
731 | 36,154 | ||||||
| Investor AB Class B |
2,320 | 114,347 | ||||||
| Kinnevik AB Class B |
782 | 25,446 | ||||||
| Nordea Bank AB |
11,172 | 151,107 | ||||||
| Sandvik AB |
4,521 | 77,821 | ||||||
| Skandinaviska Enskilda Banken AB Class A |
3,318 | 43,618 | ||||||
| Skanska AB Class B |
485 | 11,212 | ||||||
| SKF AB Class B |
527 | 11,460 | ||||||
| Svenska Handelsbanken AB Class A |
3,874 | 58,331 | ||||||
| Swedbank AB Class A |
1,788 | 49,331 | ||||||
See accompanying notes to financial statements.
127
Table of Contents
SPDR MSCI ACWI Low Carbon Target ETF
SCHEDULE OF INVESTMENTS (continued)
September 30, 2017
| Security Description |
Shares |
Value |
||||||
| Telefonaktiebolaget LM Ericsson Class B |
12,710 | $ | 72,828 | |||||
| Telia Co. AB |
11,749 | 55,216 | ||||||
| Volvo AB Class B |
6,926 | 133,219 | ||||||
|
|
|
|||||||
| 1,573,495 | ||||||||
|
|
|
|||||||
| SWITZERLAND — 2.8% |
| |||||||
| ABB, Ltd. |
6,780 | 167,748 | ||||||
| Adecco Group AG (c) |
782 | 60,937 | ||||||
| Chocoladefabriken Lindt & Spruengli AG |
3 | 17,130 | ||||||
| Cie Financiere Richemont SA |
1,873 | 171,311 | ||||||
| Credit Suisse Group AG (c) |
10,105 | 160,097 | ||||||
| EMS-Chemie Holding AG |
93 | 61,897 | ||||||
| Ferguson PLC |
1,488 | 97,743 | ||||||
| Geberit AG |
26 | 12,309 | ||||||
| Givaudan SA |
74 | 161,139 | ||||||
| Julius Baer Group, Ltd. (c) |
493 | 29,195 | ||||||
| Kuehne + Nagel International AG |
384 | 71,157 | ||||||
| Nestle SA |
10,690 | 895,989 | ||||||
| Novartis AG |
7,702 | 659,876 | ||||||
| Roche Holding AG |
2,349 | 600,117 | ||||||
| SGS SA |
3 | 7,202 | ||||||
| Sika AG |
20 | 148,925 | ||||||
| STMicroelectronics NV |
907 | 17,553 | ||||||
| Swatch Group AG |
706 | 56,292 | ||||||
| Swiss Life Holding AG (c) |
148 | 52,173 | ||||||
| Swiss Re AG |
1,561 | 141,484 | ||||||
| Swisscom AG |
87 | 44,615 | ||||||
| TE Connectivity, Ltd. |
1,406 | 116,782 | ||||||
| UBS Group AG (c) |
13,909 | 237,902 | ||||||
| Zurich Insurance Group AG |
561 | 171,268 | ||||||
|
|
|
|||||||
| 4,160,841 | ||||||||
|
|
|
|||||||
| TAIWAN — 1.3% |
| |||||||
| Acer, Inc. (c) |
35,000 | 17,486 | ||||||
| Advantech Co., Ltd. |
2,199 | 15,664 | ||||||
| Asustek Computer, Inc. |
6,000 | 49,367 | ||||||
| Catcher Technology Co., Ltd. |
3,000 | 27,948 | ||||||
| Cathay Financial Holding Co., Ltd. |
49,000 | 77,885 | ||||||
| Cheng Shin Rubber Industry Co., Ltd. |
12,000 | 24,021 | ||||||
| China Development Financial Holding Corp. |
52,000 | 15,605 | ||||||
| China Life Insurance Co., Ltd. |
19,620 | 18,472 | ||||||
| Chunghwa Telecom Co., Ltd. |
17,000 | 58,584 | ||||||
| CTBC Financial Holding Co., Ltd. |
80,359 | 50,350 | ||||||
| Delta Electronics, Inc. |
6,000 | 30,867 | ||||||
| Eclat Textile Co., Ltd. |
1,020 | 12,395 | ||||||
| Foxconn Technology Co., Ltd. |
11,070 | 31,942 | ||||||
| Fubon Financial Holding Co., Ltd. |
50,000 | 77,991 | ||||||
| Hiwin Technologies Corp. |
2,040 | 17,996 | ||||||
| Hon Hai Precision Industry Co., Ltd. |
62,820 | 217,521 | ||||||
| Hotai Motor Co., Ltd. |
1,000 | 11,526 | ||||||
| MediaTek, Inc. |
11,000 | 103,202 | ||||||
| Mega Financial Holding Co., Ltd. |
49,922 | 39,017 | ||||||
| Micro-Star International Co., Ltd. |
3,000 | 6,450 | ||||||
| Novatek Microelectronics Corp. |
4,000 | 15,038 | ||||||
| Pegatron Corp. |
5,000 | 12,977 | ||||||
| Pou Chen Corp. |
4,000 | 5,019 | ||||||
| President Chain Store Corp. |
5,000 | 42,128 | ||||||
| Quanta Computer, Inc. |
6,000 | 13,811 | ||||||
| Shin Kong Financial Holding Co., Ltd. |
40,469 | 12,118 | ||||||
| Synnex Technology International Corp. |
22,000 | 26,408 | ||||||
| Taiwan Mobile Co., Ltd. |
12,000 | 42,738 | ||||||
| Taiwan Semiconductor Manufacturing Co., Ltd. |
84,000 | 599,723 | ||||||
| Teco Electric and Machinery Co., Ltd. |
31,000 | 27,755 | ||||||
| Uni-President Enterprises Corp. |
40,000 | 83,762 | ||||||
| WPG Holdings, Ltd. |
18,000 | 23,951 | ||||||
| Yuanta Financial Holding Co., Ltd. |
143,573 | 61,787 | ||||||
|
|
|
|||||||
| 1,871,504 | ||||||||
|
|
|
|||||||
| THAILAND — 0.2% |
| |||||||
| Advanced Info Service PCL (g) |
3,400 | 19,472 | ||||||
| Airports of Thailand PCL (g) |
44,900 | 79,433 | ||||||
| Bangkok Bank PCL NVDR |
1,000 | 5,592 | ||||||
| Bangkok Expressway & Metro PCL NVDR |
85,000 | 20,517 | ||||||
| BTS Group Holdings PCL (g) |
106,500 | 27,304 | ||||||
| CP ALL PCL (g) |
13,600 | 26,813 | ||||||
| Energy Absolute PCL (g) |
76,500 | 87,740 | ||||||
| Kasikornbank PCL |
3,400 | 21,817 | ||||||
| Kasikornbank PCL NVDR |
400 | 2,483 | ||||||
| Siam Commercial Bank PCL (g) |
6,800 | 31,196 | ||||||
|
|
|
|||||||
| 322,367 | ||||||||
|
|
|
|||||||
| TURKEY — 0.1% |
| |||||||
| Akbank TAS |
9,781 | 25,854 | ||||||
| BIM Birlesik Magazalar A/S |
1,415 | 29,545 | ||||||
| Emlak Konut Gayrimenkul Yatirim Ortakligi A/S REIT (c) |
29,727 | 22,403 | ||||||
| TAV Havalimanlari Holding A/S |
1,020 | 5,063 | ||||||
| Turkcell Iletisim Hizmetleri A/S |
102 | 364 | ||||||
| Turkiye Garanti Bankasi A/S |
9,554 | 26,007 | ||||||
| Turkiye Halk Bankasi A/S |
2,030 | 6,919 | ||||||
| Turkiye Is Bankasi Class C |
16,543 | 31,541 | ||||||
| Yapi ve Kredi Bankasi A/S (c) |
20,108 | 24,427 | ||||||
|
|
|
|||||||
| 172,123 | ||||||||
|
|
|
|||||||
| UNITED ARAB EMIRATES — 0.1% |
| |||||||
| Aldar Properties PJSC |
6,484 | 4,114 | ||||||
| DP World, Ltd. |
644 | 14,464 | ||||||
| Emaar Properties PJSC |
15,328 | 35,433 | ||||||
| Emirates Telecommunications Group Co. PJSC |
6,597 | 31,075 | ||||||
| First Abu Dhabi Bank PJSC |
1,353 | 3,758 | ||||||
|
|
|
|||||||
| 88,844 | ||||||||
|
|
|
|||||||
| UNITED KINGDOM — 5.9% |
| |||||||
| 3i Group PLC |
6,766 | 82,879 | ||||||
| Ashtead Group PLC |
2,452 | 59,182 | ||||||
| Associated British Foods PLC |
1,020 | 43,696 | ||||||
| AstraZeneca PLC |
4,671 | 310,522 | ||||||
| Auto Trader Group PLC (e) |
3,126 | 16,461 | ||||||
| Aviva PLC |
22,999 | 158,757 | ||||||
| Babcock International Group PLC |
3,471 | 38,536 | ||||||
| BAE Systems PLC |
11,957 | 101,306 | ||||||
| Barclays PLC |
77,780 | 201,768 | ||||||
| Barratt Developments PLC |
5,176 | 42,673 | ||||||
| Berkeley Group Holdings PLC |
657 | 32,764 | ||||||
| British American Tobacco PLC |
7,282 | 456,449 | ||||||
| British American Tobacco PLC ADR |
1,841 | 114,970 | ||||||
| British Land Co. PLC REIT |
6,854 | 55,358 | ||||||
See accompanying notes to financial statements.
128
Table of Contents
SPDR MSCI ACWI Low Carbon Target ETF
SCHEDULE OF INVESTMENTS (continued)
September 30, 2017
| Security Description |
Shares |
Value |
||||||
| BT Group PLC |
36,952 | $ | 140,748 | |||||
| Bunzl PLC |
1,557 | 47,357 | ||||||
| Burberry Group PLC |
1,873 | 44,227 | ||||||
| Capita PLC |
3,097 | 23,476 | ||||||
| CNH Industrial NV |
3,424 | 41,126 | ||||||
| Cobham PLC |
9,045 | 17,681 | ||||||
| Coca-Cola European Partners PLC |
833 | 34,669 | ||||||
| Compass Group PLC |
6,705 | 142,403 | ||||||
| Croda International PLC |
1,611 | 81,982 | ||||||
| DCC PLC |
353 | 34,313 | ||||||
| Delphi Automotive PLC |
952 | 93,677 | ||||||
| Diageo PLC |
10,500 | 345,562 | ||||||
| Direct Line Insurance Group PLC |
4,516 | 22,030 | ||||||
| Dixons Carphone PLC |
5,397 | 14,004 | ||||||
| GlaxoSmithKline PLC |
16,944 | 338,379 | ||||||
| Hammerson PLC REIT |
6,021 | 43,379 | ||||||
| Hargreaves Lansdown PLC |
561 | 11,139 | ||||||
| HSBC Holdings PLC |
75,365 | 745,307 | ||||||
| IMI PLC |
2,014 | 33,587 | ||||||
| Imperial Brands PLC |
4,429 | 189,199 | ||||||
| Inmarsat PLC |
2,657 | 22,939 | ||||||
| Intertek Group PLC |
717 | 47,925 | ||||||
| Intu Properties PLC REIT (b) |
11,230 | 34,729 | ||||||
| ITV PLC |
21,268 | 49,849 | ||||||
| Johnson Matthey PLC |
2,286 | 104,892 | ||||||
| Kingfisher PLC |
8,193 | 32,812 | ||||||
| Land Securities Group PLC REIT |
4,554 | 59,423 | ||||||
| Legal & General Group PLC |
31,552 | 110,020 | ||||||
| Liberty Global PLC Class A (c) |
1,715 | 58,156 | ||||||
| Liberty Global PLC Series C (c) |
1,483 | 48,494 | ||||||
| Lloyds Banking Group PLC |
277,973 | 252,594 | ||||||
| London Stock Exchange Group PLC |
867 | 44,551 | ||||||
| Marks & Spencer Group PLC |
6,628 | 31,426 | ||||||
| Meggitt PLC |
5,804 | 40,570 | ||||||
| Merlin Entertainments PLC (e) |
3,755 | 22,444 | ||||||
| Micro Focus International PLC ADR (c) |
835 | 26,637 | ||||||
| National Grid PLC |
9,600 | 119,087 | ||||||
| Next PLC |
597 | 42,131 | ||||||
| Old Mutual PLC |
17,154 | 44,695 | ||||||
| Pearson PLC |
3,362 | 27,605 | ||||||
| Pentair PLC |
1,033 | 70,203 | ||||||
| Persimmon PLC |
1,477 | 51,165 | ||||||
| Provident Financial PLC (b) |
536 | 5,972 | ||||||
| Prudential PLC |
10,839 | 259,795 | ||||||
| Randgold Resources, Ltd. |
573 | 56,235 | ||||||
| Reckitt Benckiser Group PLC |
2,741 | 250,546 | ||||||
| RELX NV |
3,057 | 65,088 | ||||||
| RELX PLC |
5,448 | 119,653 | ||||||
| Rolls-Royce Holdings PLC (c) |
7,733 | 92,026 | ||||||
| Royal Bank of Scotland Group PLC (c) |
17,375 | 62,544 | ||||||
| Royal Mail PLC |
2,656 | 13,691 | ||||||
| RSA Insurance Group PLC |
2,894 | 24,189 | ||||||
| Sage Group PLC |
4,101 | 38,432 | ||||||
| Schroders PLC |
488 | 21,966 | ||||||
| Segro PLC REIT |
6,088 | 43,780 | ||||||
| Severn Trent PLC |
4,453 | 129,823 | ||||||
| Sky PLC |
5,410 | 66,414 | ||||||
| Smith & Nephew PLC |
3,575 | 64,655 | ||||||
| Smiths Group PLC |
2,622 | 55,476 | ||||||
| Standard Chartered PLC (c) |
12,814 | 127,495 | ||||||
| Standard Life Aberdeen PLC |
14,942 | 86,903 | ||||||
| Taylor Wimpey PLC |
13,813 | 36,231 | ||||||
| TechnipFMC PLC (c) (d) |
2,708 | 74,961 | ||||||
| TechnipFMC PLC (c) (d) |
3,149 | 87,920 | ||||||
| Tesco PLC (c) |
20,824 | 52,287 | ||||||
| Travis Perkins PLC |
1,602 | 31,122 | ||||||
| Unilever NV |
5,264 | 311,404 | ||||||
| Unilever PLC |
4,651 | 269,506 | ||||||
| United Utilities Group PLC |
15,282 | 175,199 | ||||||
| Vodafone Group PLC |
122,281 | 342,554 | ||||||
| Weir Group PLC |
1,337 | 35,248 | ||||||
| Whitbread PLC |
884 | 44,665 | ||||||
| Worldpay Group PLC (e) |
3,912 | 21,362 | ||||||
| WPP PLC |
5,536 | 102,869 | ||||||
|
|
|
|||||||
| 8,671,924 | ||||||||
|
|
|
|||||||
| UNITED STATES — 51.2% |
| |||||||
| 3M Co. |
2,051 | 430,505 | ||||||
| Abbott Laboratories |
6,350 | 338,836 | ||||||
| AbbVie, Inc. |
5,530 | 491,396 | ||||||
| Accenture PLC Class A |
2,303 | 311,066 | ||||||
| Activision Blizzard, Inc. |
2,339 | 150,889 | ||||||
| Acuity Brands, Inc. |
140 | 23,979 | ||||||
| Adobe Systems, Inc. (c) |
1,815 | 270,762 | ||||||
| Advance Auto Parts, Inc. |
221 | 21,923 | ||||||
| Advanced Micro Devices, Inc. (b) (c) |
2,800 | 35,700 | ||||||
| Aetna, Inc. |
1,423 | 226,271 | ||||||
| Affiliated Managers Group, Inc. |
187 | 35,498 | ||||||
| Aflac, Inc. |
1,647 | 134,049 | ||||||
| AGCO Corp. |
392 | 28,918 | ||||||
| Agilent Technologies, Inc. |
1,031 | 66,190 | ||||||
| AGNC Investment Corp. REIT |
2,590 | 56,151 | ||||||
| Akamai Technologies, Inc. (c) |
544 | 26,504 | ||||||
| Albemarle Corp. (b) |
456 | 62,157 | ||||||
| Alexandria Real Estate Equities, Inc. REIT |
260 | 30,932 | ||||||
| Alexion Pharmaceuticals, Inc. (c) |
777 | 109,005 | ||||||
| Align Technology, Inc. (c) |
260 | 48,430 | ||||||
| Alkermes PLC (c) |
437 | 22,217 | ||||||
| Alleghany Corp. (c) |
29 | 16,066 | ||||||
| Allergan PLC |
1,244 | 254,958 | ||||||
| Alliance Data Systems Corp. |
170 | 37,664 | ||||||
| Allstate Corp. |
1,163 | 106,891 | ||||||
| Ally Financial, Inc. |
3,671 | 89,058 | ||||||
| Alphabet, Inc. Class A (c) |
957 | 931,850 | ||||||
| Alphabet, Inc. Class C (c) |
1,184 | 1,135,586 | ||||||
| Altria Group, Inc. |
7,667 | 486,241 | ||||||
| Amazon.com, Inc. (c) |
1,375 | 1,321,856 | ||||||
| AMERCO |
100 | 37,490 | ||||||
| American Express Co. |
3,062 | 276,989 | ||||||
| American International Group, Inc. |
4,675 | 286,998 | ||||||
| American Tower Corp. REIT |
1,456 | 199,006 | ||||||
| American Water Works Co., Inc. |
3,896 | 315,225 | ||||||
| Ameriprise Financial, Inc. |
688 | 102,175 | ||||||
| AmerisourceBergen Corp. |
800 | 66,200 | ||||||
| AMETEK, Inc. |
1,377 | 90,937 | ||||||
| Amgen, Inc. |
2,541 | 473,769 | ||||||
| Amphenol Corp. Class A |
362 | 30,640 | ||||||
See accompanying notes to financial statements.
129
Table of Contents
SPDR MSCI ACWI Low Carbon Target ETF
SCHEDULE OF INVESTMENTS (continued)
September 30, 2017
| Security Description |
Shares |
Value |
||||||
| Analog Devices, Inc. |
1,652 | $ | 142,353 | |||||
| Annaly Capital Management, Inc. REIT |
5,942 | 72,433 | ||||||
| ANSYS, Inc. (c) |
132 | 16,200 | ||||||
| Anthem, Inc. |
1,103 | 209,438 | ||||||
| AO Smith Corp. |
392 | 23,297 | ||||||
| Aon PLC |
666 | 97,303 | ||||||
| Apple, Inc. |
17,825 | 2,747,189 | ||||||
| Applied Materials, Inc. |
4,128 | 215,028 | ||||||
| Arch Capital Group, Ltd. (c) |
260 | 25,610 | ||||||
| Arista Networks, Inc. (c) |
171 | 32,423 | ||||||
| Arrow Electronics, Inc. (c) |
800 | 64,328 | ||||||
| Assurant, Inc. |
104 | 9,934 | ||||||
| AT&T, Inc. |
22,300 | 873,491 | ||||||
| Atmos Energy Corp. |
1,392 | 116,705 | ||||||
| Autodesk, Inc. (c) |
671 | 75,326 | ||||||
| Automatic Data Processing, Inc. |
1,687 | 184,423 | ||||||
| AutoZone, Inc. (b) (c) |
119 | 70,818 | ||||||
| AvalonBay Communities, Inc. REIT |
493 | 87,961 | ||||||
| Avery Dennison Corp. |
765 | 75,230 | ||||||
| Avnet, Inc. |
1,467 | 57,653 | ||||||
| Axalta Coating Systems, Ltd. (c) |
3,046 | 88,090 | ||||||
| Axis Capital Holdings, Ltd. |
270 | 15,474 | ||||||
| Baker Hughes a GE Co. |
2,324 | 85,105 | ||||||
| Ball Corp. |
1,614 | 66,658 | ||||||
| Bank of America Corp. |
36,990 | 937,327 | ||||||
| Bank of New York Mellon Corp. |
4,388 | 232,652 | ||||||
| Baxter International, Inc. |
1,593 | 99,961 | ||||||
| BB&T Corp. |
3,142 | 147,486 | ||||||
| Becton Dickinson and Co. |
893 | 174,983 | ||||||
| Bed Bath & Beyond, Inc. |
392 | 9,200 | ||||||
| Berkshire Hathaway, Inc. Class B (c) |
1,612 | 295,512 | ||||||
| Best Buy Co., Inc. |
891 | 50,751 | ||||||
| Biogen, Inc. (c) |
743 | 232,648 | ||||||
| BioMarin Pharmaceutical, Inc. (c) |
590 | 54,911 | ||||||
| BlackRock, Inc. |
590 | 263,783 | ||||||
| Boeing Co. |
2,232 | 567,397 | ||||||
| BorgWarner, Inc. |
683 | 34,990 | ||||||
| Boston Properties, Inc. REIT |
391 | 48,046 | ||||||
| Boston Scientific Corp. (c) |
5,044 | 147,134 | ||||||
| Brighthouse Financial, Inc. (c) |
399 | 24,259 | ||||||
| Bristol-Myers Squibb Co. |
5,804 | 369,947 | ||||||
| Brixmor Property Group, Inc. REIT |
545 | 10,246 | ||||||
| Brown-Forman Corp. Class B |
948 | 51,476 | ||||||
| C.H. Robinson Worldwide, Inc. (b) |
524 | 39,876 | ||||||
| C.R. Bard, Inc. |
155 | 49,678 | ||||||
| CA, Inc. |
1,373 | 45,831 | ||||||
| Cadence Design Systems, Inc. (c) |
524 | 20,682 | ||||||
| Camden Property Trust REIT |
260 | 23,777 | ||||||
| Campbell Soup Co. |
710 | 33,242 | ||||||
| Capital One Financial Corp. |
2,881 | 243,905 | ||||||
| Cardinal Health, Inc. |
1,283 | 85,858 | ||||||
| CarMax, Inc. (b) (c) |
611 | 46,320 | ||||||
| Caterpillar, Inc. |
2,384 | 297,309 | ||||||
| CBRE Group, Inc. Class A (c) |
1,292 | 48,941 | ||||||
| CBS Corp. Class B |
1,287 | 74,646 | ||||||
| Celgene Corp. (c) |
2,626 | 382,923 | ||||||
| Centene Corp. (c) |
689 | 66,675 | ||||||
| CenturyLink, Inc. (b) |
899 | 16,991 | ||||||
| Cerner Corp. (c) |
1,054 | 75,171 | ||||||
| Charles Schwab Corp. |
4,794 | 209,690 | ||||||
| Charter Communications, Inc. Class A (c) |
863 | 313,631 | ||||||
| Cheniere Energy, Inc. (b) (c) |
3,474 | 156,469 | ||||||
| Chipotle Mexican Grill, Inc. (b) (c) |
102 | 31,399 | ||||||
| Chubb, Ltd. |
1,813 | 258,443 | ||||||
| Church & Dwight Co., Inc. |
524 | 25,388 | ||||||
| Cigna Corp. |
994 | 185,818 | ||||||
| Cincinnati Financial Corp. |
455 | 34,839 | ||||||
| Cintas Corp. |
417 | 60,165 | ||||||
| Cisco Systems, Inc. |
19,167 | 644,586 | ||||||
| CIT Group, Inc. |
700 | 34,335 | ||||||
| Citigroup, Inc. |
10,898 | 792,721 | ||||||
| Citizens Financial Group, Inc. |
2,693 | 101,984 | ||||||
| Citrix Systems, Inc. (c) |
544 | 41,790 | ||||||
| Clorox Co. |
285 | 37,594 | ||||||
| CME Group, Inc. |
1,305 | 177,062 | ||||||
| Coach, Inc. |
997 | 40,159 | ||||||
| Coca-Cola Co. |
16,555 | 745,141 | ||||||
| Cognizant Technology Solutions Corp. Class A |
2,217 | 160,821 | ||||||
| Colgate-Palmolive Co. |
3,098 | 225,689 | ||||||
| Colony NorthStar, Inc. Class A REIT |
2,608 | 32,757 | ||||||
| Comcast Corp. Class A |
17,468 | 672,169 | ||||||
| Comerica, Inc. |
717 | 54,678 | ||||||
| Concho Resources, Inc. (b) (c) |
100 | 13,172 | ||||||
| Consolidated Edison, Inc. |
1,346 | 108,595 | ||||||
| Constellation Brands, Inc. Class A |
756 | 150,784 | ||||||
| Cooper Cos., Inc. |
170 | 40,309 | ||||||
| Core Laboratories NV (b) |
938 | 92,581 | ||||||
| Corning, Inc. |
2,948 | 88,204 | ||||||
| CoStar Group, Inc. (c) |
65 | 17,436 | ||||||
| Costco Wholesale Corp. |
1,873 | 307,715 | ||||||
| Coty, Inc. Class A (b) |
2,126 | 35,143 | ||||||
| Crown Castle International Corp. REIT |
1,253 | 125,275 | ||||||
| CSX Corp. |
2,734 | 148,347 | ||||||
| Cummins, Inc. |
705 | 118,461 | ||||||
| CVS Health Corp. |
4,388 | 356,832 | ||||||
| D.R. Horton, Inc. |
1,687 | 67,362 | ||||||
| Danaher Corp. |
2,452 | 210,333 | ||||||
| DaVita, Inc. (c) |
557 | 33,080 | ||||||
| Deere & Co. |
912 | 114,538 | ||||||
| Dell Technologies, Inc. Class V (c) |
848 | 65,474 | ||||||
| DENTSPLY SIRONA, Inc. |
861 | 51,496 | ||||||
| DexCom, Inc. (c) |
260 | 12,721 | ||||||
| Diamondback Energy, Inc. (c) |
2,174 | 212,965 | ||||||
| Dick’s Sporting Goods, Inc. |
260 | 7,023 | ||||||
| Digital Realty Trust, Inc. REIT |
656 | 77,625 | ||||||
| Discover Financial Services |
1,423 | 91,755 | ||||||
| Discovery Communications, Inc. Class A (c) |
463 | 9,857 | ||||||
| Discovery Communications, Inc. Class C (c) |
470 | 9,522 | ||||||
| DISH Network Corp. Class A (c) |
964 | 52,278 | ||||||
| Dollar General Corp. |
935 | 75,782 | ||||||
| Dollar Tree, Inc. (c) |
800 | 69,456 | ||||||
| Domino’s Pizza, Inc. |
260 | 51,623 | ||||||
| Dover Corp. |
901 | 82,342 | ||||||
| Dr. Pepper Snapple Group, Inc. |
582 | 51,490 | ||||||
| Duke Realty Corp. REIT |
916 | 26,399 | ||||||
See accompanying notes to financial statements.
130
Table of Contents
SPDR MSCI ACWI Low Carbon Target ETF
SCHEDULE OF INVESTMENTS (continued)
September 30, 2017
| Security Description |
Shares |
Value |
||||||
| DXC Technology Co. |
1,114 | $ | 95,670 | |||||
| E*TRADE Financial Corp. (c) |
1,135 | 49,497 | ||||||
| East West Bancorp, Inc. |
500 | 29,890 | ||||||
| Eaton Corp. PLC |
2,234 | 171,549 | ||||||
| eBay, Inc. (c) |
3,624 | 139,379 | ||||||
| Ecolab, Inc. |
2,817 | 362,294 | ||||||
| Edison International |
2,096 | 161,748 | ||||||
| Edwards Lifesciences Corp. (c) |
778 | 85,043 | ||||||
| Electronic Arts, Inc. (c) |
952 | 112,393 | ||||||
| Eli Lilly & Co. |
3,362 | 287,586 | ||||||
| Emerson Electric Co. |
2,838 | 178,340 | ||||||
| Envision Healthcare Corp. (c) |
483 | 21,711 | ||||||
| Equifax, Inc. |
611 | 64,760 | ||||||
| Equinix, Inc. REIT |
192 | 85,690 | ||||||
| Equity Residential REIT |
1,241 | 81,819 | ||||||
| Essex Property Trust, Inc. REIT |
190 | 48,266 | ||||||
| Estee Lauder Cos., Inc. Class A |
1,054 | 113,663 | ||||||
| Everest Re Group, Ltd. |
131 | 29,919 | ||||||
| Eversource Energy |
3,919 | 236,864 | ||||||
| Expedia, Inc. |
469 | 67,508 | ||||||
| Expeditors International of Washington, Inc. |
1,923 | 115,111 | ||||||
| Express Scripts Holding Co. (c) |
2,543 | 161,023 | ||||||
| Extra Space Storage, Inc. REIT |
524 | 41,878 | ||||||
| F5 Networks, Inc. (c) |
221 | 26,644 | ||||||
| Facebook, Inc. Class A (c) |
8,065 | 1,378,067 | ||||||
| Fastenal Co. (b) |
1,423 | 64,860 | ||||||
| Federal Realty Investment Trust REIT |
132 | 16,396 | ||||||
| Fidelity National Information Services, Inc. |
1,151 | 107,492 | ||||||
| Fifth Third Bancorp |
3,362 | 94,069 | ||||||
| First Data Corp. Class A (c) |
1,221 | 22,027 | ||||||
| First Republic Bank |
231 | 24,130 | ||||||
| Fiserv, Inc. (c) |
505 | 65,125 | ||||||
| FleetCor Technologies, Inc. (c) |
334 | 51,693 | ||||||
| FLIR Systems, Inc. |
392 | 15,253 | ||||||
| Flowserve Corp. |
799 | 34,029 | ||||||
| Fluor Corp. |
1,031 | 43,405 | ||||||
| FMC Corp. |
800 | 71,448 | ||||||
| FNF Group |
425 | 20,171 | ||||||
| Foot Locker, Inc. |
459 | 16,166 | ||||||
| Ford Motor Co. |
11,210 | 134,184 | ||||||
| Fortinet, Inc. (c) |
524 | 18,780 | ||||||
| Fortive Corp. |
1,224 | 86,647 | ||||||
| Fortune Brands Home & Security, Inc. |
354 | 23,799 | ||||||
| Franklin Resources, Inc. |
1,687 | 75,088 | ||||||
| Freeport-McMoRan, Inc. (c) |
2,664 | 37,403 | ||||||
| Gap, Inc. |
867 | 25,603 | ||||||
| Garmin, Ltd. (b) |
459 | 24,772 | ||||||
| General Dynamics Corp. |
1,149 | 236,211 | ||||||
| General Electric Co. |
33,200 | 802,776 | ||||||
| General Mills, Inc. |
2,611 | 135,145 | ||||||
| General Motors Co. |
3,070 | 123,967 | ||||||
| Genuine Parts Co. |
392 | 37,495 | ||||||
| GGP, Inc. REIT (b) |
1,687 | 35,039 | ||||||
| Gilead Sciences, Inc. |
4,652 | 376,905 | ||||||
| Global Payments, Inc. |
524 | 49,796 | ||||||
| Goldman Sachs Group, Inc. |
1,555 | 368,830 | ||||||
| H&R Block, Inc. |
243 | 6,435 | ||||||
| Halliburton Co. |
4,772 | 219,655 | ||||||
| Hanesbrands, Inc. (b) |
1,224 | 30,159 | ||||||
| Harley-Davidson, Inc. (b) |
765 | 36,881 | ||||||
| Harris Corp. |
425 | 55,964 | ||||||
| Hartford Financial Services Group, Inc. |
1,876 | 103,987 | ||||||
| Hasbro, Inc. |
425 | 41,510 | ||||||
| HCA Healthcare, Inc. (c) |
499 | 39,715 | ||||||
| HCP, Inc. REIT |
1,687 | 46,949 | ||||||
| HD Supply Holdings, Inc. (c) |
776 | 27,990 | ||||||
| Helmerich & Payne, Inc. (b) |
1,438 | 74,934 | ||||||
| Henry Schein, Inc. (c) |
32 | 2,624 | ||||||
| Hershey Co. |
548 | 59,825 | ||||||
| Hewlett Packard Enterprise Co. |
6,086 | 89,525 | ||||||
| Hologic, Inc. (c) |
712 | 26,123 | ||||||
| Home Depot, Inc. |
4,346 | 710,832 | ||||||
| Honeywell International, Inc. |
2,553 | 361,862 | ||||||
| Hormel Foods Corp. (b) |
916 | 29,440 | ||||||
| Host Hotels & Resorts, Inc. REIT |
3,127 | 57,818 | ||||||
| HP, Inc. |
5,350 | 106,786 | ||||||
| Humana, Inc. |
596 | 145,204 | ||||||
| Huntington Bancshares, Inc. |
3,651 | 50,968 | ||||||
| Huntington Ingalls Industries, Inc. |
183 | 41,439 | ||||||
| IDEX Corp. |
500 | 60,735 | ||||||
| IDEXX Laboratories, Inc. (c) |
260 | 40,427 | ||||||
| IHS Markit, Ltd. (c) |
2,119 | 93,406 | ||||||
| Illinois Tool Works, Inc. |
1,609 | 238,068 | ||||||
| Illumina, Inc. (c) |
459 | 91,433 | ||||||
| Incyte Corp. (c) |
621 | 72,496 | ||||||
| Ingersoll-Rand PLC |
1,173 | 104,596 | ||||||
| Intel Corp. |
17,795 | 677,634 | ||||||
| Intercontinental Exchange, Inc. |
1,959 | 134,583 | ||||||
| International Business Machines Corp. |
3,230 | 468,608 | ||||||
| International Flavors & Fragrances, Inc. |
732 | 104,610 | ||||||
| Interpublic Group of Cos., Inc. |
1,031 | 21,435 | ||||||
| Intuit, Inc. |
867 | 123,235 | ||||||
| Intuitive Surgical, Inc. (c) |
140 | 146,423 | ||||||
| Invesco, Ltd. |
2,211 | 77,473 | ||||||
| Iron Mountain, Inc. REIT |
744 | 28,942 | ||||||
| J.M. Smucker Co. |
611 | 64,112 | ||||||
| Jacobs Engineering Group, Inc. |
1,399 | 81,520 | ||||||
| Jazz Pharmaceuticals PLC (c) |
204 | 29,835 | ||||||
| Johnson & Johnson |
9,560 | 1,242,896 | ||||||
| Johnson Controls International PLC |
4,362 | 175,745 | ||||||
| Jones Lang LaSalle, Inc. |
260 | 32,110 | ||||||
| JPMorgan Chase & Co. |
13,097 | 1,250,895 | ||||||
| Juniper Networks, Inc. |
1,687 | 46,949 | ||||||
| Kellogg Co. (b) |
433 | 27,006 | ||||||
| KeyCorp. |
4,146 | 78,028 | ||||||
| Kimberly-Clark Corp. |
203 | 23,889 | ||||||
| Kimco Realty Corp. REIT |
2,687 | 52,531 | ||||||
| Kinder Morgan, Inc. |
13,799 | 264,665 | ||||||
| KLA-Tencor Corp. |
560 | 59,360 | ||||||
| Kohl’s Corp. (b) |
561 | 25,610 | ||||||
| Kraft Heinz Co. |
2,755 | 213,650 | ||||||
| L Brands, Inc. (b) |
1,028 | 42,775 | ||||||
| L3 Technologies, Inc. |
293 | 55,210 | ||||||
| Laboratory Corp. of America Holdings (c) |
285 | 43,026 | ||||||
| Lam Research Corp. |
683 | 126,382 | ||||||
| Las Vegas Sands Corp. |
1,687 | 108,238 | ||||||
See accompanying notes to financial statements.
131
Table of Contents
SPDR MSCI ACWI Low Carbon Target ETF
SCHEDULE OF INVESTMENTS (continued)
September 30, 2017
| Security Description |
Shares |
Value |
||||||
| Leidos Holdings, Inc. |
525 | $ | 31,091 | |||||
| Lennar Corp. Class A |
981 | 51,797 | ||||||
| Level 3 Communications, Inc. (c) |
1,031 | 54,942 | ||||||
| Liberty Broadband Corp. Class C (c) |
631 | 60,134 | ||||||
| Liberty Interactive Corp. QVC Group Class A (c) |
1,687 | 39,763 | ||||||
| Liberty Media Corp.-Liberty SiriusXM Class A (c) |
793 | 33,227 | ||||||
| Liberty Media Corp.-Liberty SiriusXM Class C (c) |
875 | 36,636 | ||||||
| Lincoln National Corp. |
1,291 | 94,863 | ||||||
| LKQ Corp. (c) |
1,259 | 45,311 | ||||||
| Lockheed Martin Corp. |
1,046 | 324,563 | ||||||
| Lowe’s Cos., Inc. |
2,966 | 237,102 | ||||||
| lululemon athletica, Inc. (c) |
392 | 24,402 | ||||||
| M&T Bank Corp. |
438 | 70,536 | ||||||
| Macerich Co. REIT |
285 | 15,666 | ||||||
| Macquarie Infrastructure Corp. |
656 | 47,350 | ||||||
| Mallinckrodt PLC (c) |
391 | 14,612 | ||||||
| ManpowerGroup, Inc. |
505 | 59,499 | ||||||
| Markel Corp. (c) |
28 | 29,903 | ||||||
| Marriott International, Inc. Class A |
656 | 72,331 | ||||||
| Marsh & McLennan Cos., Inc. |
1,212 | 101,578 | ||||||
| Masco Corp. |
1,687 | 65,810 | ||||||
| Mastercard, Inc. Class A |
3,514 | 496,177 | ||||||
| Mattel, Inc. (b) |
1,291 | 19,985 | ||||||
| Maxim Integrated Products, Inc. |
250 | 11,928 | ||||||
| McCormick & Co., Inc. |
539 | 55,323 | ||||||
| McDonald’s Corp. |
3,097 | 485,238 | ||||||
| McKesson Corp. |
884 | 135,791 | ||||||
| MEDNAX, Inc. (c) |
260 | 11,211 | ||||||
| Medtronic PLC |
5,547 | 431,390 | ||||||
| Merck & Co., Inc. |
9,952 | 637,227 | ||||||
| MetLife, Inc. |
4,396 | 228,372 | ||||||
| MGM Resorts International |
1,560 | 50,840 | ||||||
| Michael Kors Holdings, Ltd. (c) |
734 | 35,122 | ||||||
| Microchip Technology, Inc. (b) |
524 | 47,045 | ||||||
| Micron Technology, Inc. (c) |
3,362 | 132,227 | ||||||
| Microsoft Corp. |
25,699 | 1,914,319 | ||||||
| Mid-America Apartment Communities, Inc. REIT |
360 | 38,477 | ||||||
| Middleby Corp. (c) |
260 | 33,324 | ||||||
| Molson Coors Brewing Co. Class B |
1,142 | 93,233 | ||||||
| Mondelez International, Inc. Class A |
6,063 | 246,522 | ||||||
| Monsanto Co. |
1,917 | 229,695 | ||||||
| Monster Beverage Corp. (c) |
1,524 | 84,201 | ||||||
| Moody’s Corp. |
608 | 84,640 | ||||||
| Morgan Stanley |
6,360 | 306,361 | ||||||
| Motorola Solutions, Inc. |
491 | 41,671 | ||||||
| Mylan NV (c) |
1,687 | 52,921 | ||||||
| Nasdaq, Inc. |
351 | 27,227 | ||||||
| National Oilwell Varco, Inc. |
3,308 | 118,195 | ||||||
| National Retail Properties, Inc. REIT |
656 | 27,329 | ||||||
| Navient Corp. |
1,544 | 23,191 | ||||||
| NetApp, Inc. |
1,031 | 45,117 | ||||||
| Netflix, Inc. (c) |
1,573 | 285,264 | ||||||
| New York Community Bancorp, Inc. |
1,440 | 18,562 | ||||||
| Newell Brands, Inc. |
1,704 | 72,710 | ||||||
| News Corp. Class A |
2,690 | 35,669 | ||||||
| Nielsen Holdings PLC |
2,272 | 94,174 | ||||||
| NIKE, Inc. Class B |
4,912 | 254,687 | ||||||
| Nordstrom, Inc. |
392 | 18,483 | ||||||
| Norfolk Southern Corp. |
500 | 66,120 | ||||||
| Northern Trust Corp. |
850 | 78,141 | ||||||
| Northrop Grumman Corp. |
694 | 199,678 | ||||||
| Nuance Communications, Inc. (c) |
899 | 14,132 | ||||||
| NVIDIA Corp. |
1,942 | 347,171 | ||||||
| NVR, Inc. (c) |
10 | 28,550 | ||||||
| O’Reilly Automotive, Inc. (c) |
357 | 76,887 | ||||||
| Omnicom Group, Inc. |
743 | 55,034 | ||||||
| ONEOK, Inc. |
2,883 | 159,747 | ||||||
| Oracle Corp. |
11,889 | 574,833 | ||||||
| PACCAR, Inc. |
1,687 | 122,038 | ||||||
| Palo Alto Networks, Inc. (c) |
337 | 48,562 | ||||||
| Parker-Hannifin Corp. |
555 | 97,136 | ||||||
| Parsley Energy, Inc. Class A (c) |
6,604 | 173,949 | ||||||
| Paychex, Inc. |
1,131 | 67,815 | ||||||
| PayPal Holdings, Inc. (c) |
4,127 | 264,252 | ||||||
| People’s United Financial, Inc. |
1,000 | 18,140 | ||||||
| PepsiCo, Inc. |
5,429 | 604,954 | ||||||
| Perrigo Co. PLC (b) |
493 | 41,732 | ||||||
| Pfizer, Inc. |
22,015 | 785,936 | ||||||
| PG&E Corp. |
1,856 | 126,375 | ||||||
| Philip Morris International, Inc. |
5,887 | 653,516 | ||||||
| Phillips 66 |
2,281 | 208,962 | ||||||
| Pioneer Natural Resources Co. |
1,333 | 196,671 | ||||||
| PNC Financial Services Group, Inc. |
1,873 | 252,424 | ||||||
| Polaris Industries, Inc. (b) |
187 | 19,566 | ||||||
| PPG Industries, Inc. |
1,606 | 174,508 | ||||||
| Priceline Group, Inc. (c) |
187 | 342,363 | ||||||
| Principal Financial Group, Inc. |
1,189 | 76,500 | ||||||
| Procter & Gamble Co. |
9,284 | 844,658 | ||||||
| Progressive Corp. |
1,087 | 52,633 | ||||||
| Prologis, Inc. REIT |
2,268 | 143,927 | ||||||
| Prudential Financial, Inc. |
2,282 | 242,622 | ||||||
| Public Storage REIT |
561 | 120,048 | ||||||
| PulteGroup, Inc. |
1,687 | 46,106 | ||||||
| PVH Corp. |
340 | 42,860 | ||||||
| Qorvo, Inc. (c) |
504 | 35,623 | ||||||
| QUALCOMM, Inc. |
5,529 | 286,623 | ||||||
| Quest Diagnostics, Inc. |
510 | 47,756 | ||||||
| Quintiles IMS Holdings, Inc. (c) |
434 | 41,260 | ||||||
| Ralph Lauren Corp. |
289 | 25,516 | ||||||
| Raymond James Financial, Inc. |
459 | 38,707 | ||||||
| Raytheon Co. |
1,270 | 236,957 | ||||||
| Realty Income Corp. REIT (b) |
1,037 | 59,306 | ||||||
| Red Hat, Inc. (c) |
476 | 52,769 | ||||||
| Regency Centers Corp. REIT |
200 | 12,408 | ||||||
| Regeneron Pharmaceuticals, Inc. (c) |
255 | 114,016 | ||||||
| Regions Financial Corp. |
5,810 | 88,486 | ||||||
| Reinsurance Group of America, Inc. |
260 | 36,278 | ||||||
| ResMed, Inc. |
425 | 32,708 | ||||||
| Robert Half International, Inc. |
961 | 48,377 | ||||||
| Rockwell Automation, Inc. |
705 | 125,638 | ||||||
| Rockwell Collins, Inc. |
858 | 112,149 | ||||||
| Rollins, Inc. |
600 | 27,684 | ||||||
| Roper Technologies, Inc. |
561 | 136,547 | ||||||
| Ross Stores, Inc. |
1,439 | 92,916 | ||||||
See accompanying notes to financial statements.
132
Table of Contents
SPDR MSCI ACWI Low Carbon Target ETF
SCHEDULE OF INVESTMENTS (continued)
September 30, 2017
| Security Description |
Shares |
Value |
||||||
| Royal Caribbean Cruises, Ltd. |
85 | $ | 10,076 | |||||
| S&P Global, Inc. |
833 | 130,206 | ||||||
| Sabre Corp. |
470 | 8,507 | ||||||
| salesforce.com, Inc. (c) |
2,386 | 222,900 | ||||||
| SBA Communications Corp. REIT (c) |
335 | 48,257 | ||||||
| Schlumberger, Ltd. |
7,423 | 517,829 | ||||||
| Scripps Networks Interactive, Inc. Class A |
392 | 33,669 | ||||||
| Seagate Technology PLC |
952 | 31,578 | ||||||
| Sealed Air Corp. |
1,118 | 47,761 | ||||||
| Seattle Genetics, Inc. (b) (c) |
260 | 14,147 | ||||||
| Sensata Technologies Holding NV (c) |
734 | 35,283 | ||||||
| ServiceNow, Inc. (c) |
612 | 71,928 | ||||||
| Sherwin-Williams Co. |
630 | 225,565 | ||||||
| Shire PLC |
3,229 | 164,103 | ||||||
| Signature Bank (c) |
132 | 16,901 | ||||||
| Signet Jewelers, Ltd. (b) |
255 | 16,970 | ||||||
| Simon Property Group, Inc. REIT |
1,220 | 196,432 | ||||||
| Sirius XM Holdings, Inc. (b) |
8,426 | 46,512 | ||||||
| Skyworks Solutions, Inc. |
645 | 65,726 | ||||||
| SL Green Realty Corp. REIT |
387 | 39,211 | ||||||
| Snap-on, Inc. (b) |
340 | 50,663 | ||||||
| Splunk, Inc. (c) |
471 | 31,289 | ||||||
| Sprint Corp. (b) (c) |
5,133 | 39,935 | ||||||
| SS&C Technologies Holdings, Inc. |
500 | 20,075 | ||||||
| Stanley Black & Decker, Inc. |
773 | 116,700 | ||||||
| Starbucks Corp. |
5,396 | 289,819 | ||||||
| State Street Corp. (h) |
1,555 | 148,565 | ||||||
| Stryker Corp. |
1,323 | 187,892 | ||||||
| SunTrust Banks, Inc. |
2,211 | 132,152 | ||||||
| SVB Financial Group (c) |
100 | 18,709 | ||||||
| Symantec Corp. |
2,182 | 71,591 | ||||||
| Synchrony Financial |
3,084 | 95,758 | ||||||
| Synopsys, Inc. (c) |
356 | 28,669 | ||||||
| Sysco Corp. |
2,169 | 117,018 | ||||||
| T Rowe Price Group, Inc. |
828 | 75,058 | ||||||
| T-Mobile US, Inc. (c) |
738 | 45,505 | ||||||
| Targa Resources Corp. |
1,955 | 92,472 | ||||||
| Target Corp. |
1,687 | 99,550 | ||||||
| TD Ameritrade Holding Corp. |
1,019 | 49,727 | ||||||
| Teleflex, Inc. |
132 | 31,940 | ||||||
| Tesla, Inc. (c) |
453 | 154,518 | ||||||
| Texas Instruments, Inc. |
3,362 | 301,370 | ||||||
| Textron, Inc. |
1,019 | 54,904 | ||||||
| Thermo Fisher Scientific, Inc. |
1,423 | 269,232 | ||||||
| Thomson Reuters Corp. |
90 | 4,120 | ||||||
| Tiffany & Co. |
544 | 49,928 | ||||||
| Time Warner, Inc. |
2,838 | 290,753 | ||||||
| TJX Cos., Inc. |
2,375 | 175,109 | ||||||
| Toll Brothers, Inc. |
1,010 | 41,885 | ||||||
| Total System Services, Inc. |
569 | 37,270 | ||||||
| Tractor Supply Co. |
425 | 26,898 | ||||||
| TransDigm Group, Inc. (b) |
219 | 55,987 | ||||||
| Travelers Cos., Inc. |
1,130 | 138,448 | ||||||
| Trimble, Inc. (c) |
899 | 35,286 | ||||||
| TripAdvisor, Inc. (b) (c) |
391 | 15,847 | ||||||
| Twenty-First Century Fox, Inc. Class A |
3,185 | 84,020 | ||||||
| Twenty-First Century Fox, Inc. Class B |
2,639 | 68,060 | ||||||
| Twitter, Inc. (c) |
2,397 | 40,437 | ||||||
| UDR, Inc. REIT |
348 | 13,234 | ||||||
| Ulta Salon Cosmetics & Fragrance, Inc. (c) |
172 | 38,882 | ||||||
| Under Armour, Inc. Class A (b) (c) |
902 | 14,865 | ||||||
| Under Armour, Inc. Class C (b) (c) |
512 | 7,690 | ||||||
| Union Pacific Corp. |
2,402 | 278,560 | ||||||
| United Parcel Service, Inc. Class B |
1,241 | 149,032 | ||||||
| United Rentals, Inc. (c) |
459 | 63,682 | ||||||
| United Technologies Corp. |
3,252 | 377,492 | ||||||
| United Therapeutics Corp. (c) |
132 | 15,469 | ||||||
| UnitedHealth Group, Inc. |
3,520 | 689,392 | ||||||
| Universal Health Services, Inc. Class B |
285 | 31,618 | ||||||
| Unum Group |
1,163 | 59,464 | ||||||
| US Bancorp. |
5,810 | 311,358 | ||||||
| Vail Resorts, Inc. |
100 | 22,812 | ||||||
| Valero Energy Corp. |
434 | 33,388 | ||||||
| Vantiv, Inc. Class A (c) |
470 | 33,121 | ||||||
| Varian Medical Systems, Inc. (c) |
225 | 22,514 | ||||||
| Veeva Systems, Inc. Class A (c) |
374 | 21,097 | ||||||
| Ventas, Inc. REIT |
1,314 | 85,581 | ||||||
| VEREIT, Inc. REIT |
7,431 | 61,603 | ||||||
| Verisk Analytics, Inc. (c) |
827 | 68,798 | ||||||
| Verizon Communications, Inc. |
14,549 | 720,030 | ||||||
| Vertex Pharmaceuticals, Inc. (c) |
866 | 131,667 | ||||||
| VF Corp. (b) |
1,541 | 97,961 | ||||||
| Viacom, Inc. Class B |
1,291 | 35,941 | ||||||
| Visa, Inc. Class A |
6,888 | 724,893 | ||||||
| VMware, Inc. Class A (b) (c) |
306 | 33,412 | ||||||
| Vornado Realty Trust REIT |
388 | 29,829 | ||||||
| Voya Financial, Inc. |
1,528 | 60,952 | ||||||
| Vulcan Materials Co. |
500 | 59,800 | ||||||
| W.W. Grainger, Inc. (b) |
323 | 58,059 | ||||||
| WABCO Holdings, Inc. (c) |
260 | 38,480 | ||||||
| Wabtec Corp. (b) |
429 | 32,497 | ||||||
| Wal-Mart Stores, Inc. |
5,345 | 417,658 | ||||||
| Walgreens Boots Alliance, Inc. |
3,552 | 274,285 | ||||||
| Walt Disney Co. |
5,671 | 558,991 | ||||||
| Waters Corp. (c) |
157 | 28,185 | ||||||
| Weatherford International PLC (b) (c) |
7,507 | 34,382 | ||||||
| Wells Fargo & Co. |
17,086 | 942,293 | ||||||
| Welltower, Inc. REIT |
1,545 | 108,583 | ||||||
| Western Digital Corp. |
1,097 | 94,781 | ||||||
| Western Union Co. |
1,687 | 32,390 | ||||||
| WestRock Co. |
638 | 36,194 | ||||||
| Weyerhaeuser Co. REIT |
640 | 21,779 | ||||||
| Whirlpool Corp. |
204 | 37,626 | ||||||
| Williams Cos., Inc. |
1,530 | 45,915 | ||||||
| Willis Towers Watson PLC |
418 | 64,468 | ||||||
| Workday, Inc. Class A (c) |
456 | 48,058 | ||||||
| Wyndham Worldwide Corp. |
208 | 21,925 | ||||||
| Wynn Resorts, Ltd. |
289 | 43,038 | ||||||
| Xerox Corp. |
1,261 | 41,979 | ||||||
| Xilinx, Inc. (b) |
1,031 | 73,026 | ||||||
| Xylem, Inc. |
918 | 57,494 | ||||||
| Yum China Holdings, Inc. (c) |
910 | 36,373 | ||||||
| Zayo Group Holdings, Inc. (c) |
600 | 20,652 | ||||||
| Zillow Group, Inc. Class C (b) (c) |
564 | 22,678 | ||||||
| Zimmer Biomet Holdings, Inc. |
782 | 91,564 | ||||||
| Zions Bancorp |
700 | 33,026 | ||||||
See accompanying notes to financial statements.
133
Table of Contents
SPDR MSCI ACWI Low Carbon Target ETF
SCHEDULE OF INVESTMENTS (continued)
September 30, 2017
| Security Description |
Shares |
Value |
||||||
| Zoetis, Inc |
1,398 | $ | 89,136 | |||||
|
|
|
|||||||
| 74,917,067 | ||||||||
|
|
|
|||||||
| TOTAL COMMON STOCKS |
145,502,952 | |||||||
|
|
|
|||||||
| SHORT-TERM INVESTMENTS — 0.4% |
| |||||||
| State Street Institutional U.S. Government Money Market Fund, Class G Shares 0.96% (i) (j) |
215,632 | 215,632 | ||||||
| State Street Navigator Securities Lending Government Money Market Portfolio (i) (k) |
378,038 | 378,038 | ||||||
|
|
|
|||||||
| TOTAL SHORT-TERM INVESTMENTS |
593,670 | |||||||
|
|
|
|||||||
| TOTAL INVESTMENTS — 99.9% |
146,096,622 | |||||||
| OTHER ASSETS IN EXCESS OF LIABILITIES — 0.1% |
136,898 | |||||||
|
|
|
|||||||
| NET ASSETS — 100.0% |
$ | 146,233,520 | ||||||
|
|
|
|||||||
| (a) | Amount is less than 0.05% of net assets. |
| (b) | All or a portion of the shares of the security are on loan at September 30, 2017. |
| (c) | Non-income producing security. |
| (d) | Reflects separate holdings of the issuer’s common stock traded on different securities exchanges. |
| (e) | Securities purchased pursuant to Rule 144A of the Securities Act of 1933, as amended. These securities, which represent 0.4% of net assets as of September 30, 2017, are considered liquid and may be resold in transactions exempt from registration, normally to qualified institutional buyers. |
| (f) | Fair valued as determined in good faith by the Trust’s Oversight Committee in accordance with policy and procedures approved by the Board of Trustees. Security value is determined based on Level 3 inputs. As of September 30, 2017, total aggregate fair value of the security is $0, representing 0.0% of the Fund’s net assets. |
| (g) | Fair valued as determined in good faith by the Trust’s Oversight Committee in accordance with policy and procedures approved by the Board of Trustees. As of September 30, 2017, total aggregate fair value of securities is $271,958 representing 0.2% of net assets. |
| (h) | The Fund invested in an affiliated entity, State Street Corp. Amounts related to these transactions during the period ended September 30, 2017 are shown in the Affiliate Table below. |
| (i) | The Fund invested in certain money market funds managed by SSGA Funds Management, Inc. Amounts related to these transactions during the period ended September 30, 2017 are shown in the Affiliate Table below. |
| (j) | The rate shown is the annualized seven-day yield at September 30, 2017. |
| (k) | Investment of cash collateral for securities loaned. |
ADR = American Depositary Receipt
GDR = Global Depositary Receipt
NVDR = Non Voting Depositary Receipt
REIT = Real Estate Investment Trust
SDR = Swedish Depositary Receipt
The following table summarizes the value of the Fund’s investments according to the fair value hierarchy as of September 30, 2017.
| Description |
Level 1 — Quoted Prices |
Level 2 — Other Significant Observable Inputs |
Level 3 — Significant Unobservable Inputs |
Total | ||||||||||||
| ASSETS: |
||||||||||||||||
| INVESTMENTS: |
||||||||||||||||
| Common Stocks |
||||||||||||||||
| Argentina |
$ | 34,179 | $ | — | $ | — | $ | 34,179 | ||||||||
| Australia |
3,223,351 | — | — | 3,223,351 | ||||||||||||
| Austria |
103,771 | — | — | 103,771 | ||||||||||||
| Belgium |
549,841 | — | — | 549,841 | ||||||||||||
| Bermuda |
34,332 | — | — | 34,332 | ||||||||||||
| Brazil |
1,290,506 | — | — | 1,290,506 | ||||||||||||
| Canada |
5,261,115 | — | — | 5,261,115 | ||||||||||||
| Chile |
447,787 | — | — | 447,787 | ||||||||||||
| China |
4,800,257 | — | — | 4,800,257 | ||||||||||||
| Colombia |
248,262 | — | — | 248,262 | ||||||||||||
| Czech Republic |
20,828 | — | — | 20,828 | ||||||||||||
| Denmark |
828,174 | — | — | 828,174 | ||||||||||||
| Finland |
524,898 | — | — | 524,898 | ||||||||||||
| France |
5,197,141 | — | — | 5,197,141 | ||||||||||||
| Germany |
4,521,247 | — | — | 4,521,247 | ||||||||||||
| Greece |
33,159 | — | — | 33,159 | ||||||||||||
| Hong Kong |
1,640,209 | — | 0 | (a) | 1,640,209 | |||||||||||
| India |
1,311,783 | — | — | 1,311,783 | ||||||||||||
| Indonesia |
397,869 | — | — | 397,869 | ||||||||||||
| Ireland |
200,318 | — | — | 200,318 | ||||||||||||
See accompanying notes to financial statements.
134
Table of Contents
SPDR MSCI ACWI Low Carbon Target ETF
SCHEDULE OF INVESTMENTS (continued)
September 30, 2017
| Description |
Level 1 — Quoted Prices |
Level 2 — Other Significant Observable Inputs |
Level 3 — Significant Unobservable Inputs |
Total | ||||||||||||
| Israel |
$ | 204,427 | $ | — | $ | — | $ | 204,427 | ||||||||
| Italy. |
1,081,989 | — | — | 1,081,989 | ||||||||||||
| Japan |
11,280,414 | — | — | 11,280,414 | ||||||||||||
| Jordan |
11,373 | — | — | 11,373 | ||||||||||||
| Luxembourg |
75,235 | — | — | 75,235 | ||||||||||||
| Macau |
16,298 | — | — | 16,298 | ||||||||||||
| Malaysia |
404,835 | — | — | 404,835 | ||||||||||||
| Mexico |
532,729 | — | — | 532,729 | ||||||||||||
| Netherlands |
1,557,213 | — | — | 1,557,213 | ||||||||||||
| New Zealand |
147,219 | — | — | 147,219 | ||||||||||||
| Norway |
365,490 | — | — | 365,490 | ||||||||||||
| Peru. |
229,321 | — | — | 229,321 | ||||||||||||
| Philippines |
83,199 | — | — | 83,199 | ||||||||||||
| Poland |
198,591 | — | — | 198,591 | ||||||||||||
| Portugal |
20,027 | — | — | 20,027 | ||||||||||||
| Qatar |
121,963 | — | — | 121,963 | ||||||||||||
| Romania |
19,326 | — | — | 19,326 | ||||||||||||
| Russia |
481,608 | — | — | 481,608 | ||||||||||||
| Singapore |
983,045 | — | — | 983,045 | ||||||||||||
| South Africa |
1,085,060 | — | — | 1,085,060 | ||||||||||||
| South Korea |
2,333,690 | — | — | 2,333,690 | ||||||||||||
| Spain |
1,822,708 | — | — | 1,822,708 | ||||||||||||
| Sweden |
1,573,495 | — | — | 1,573,495 | ||||||||||||
| Switzerland |
4,160,841 | — | — | 4,160,841 | ||||||||||||
| Taiwan |
1,871,504 | — | — | 1,871,504 | ||||||||||||
| Thailand |
50,409 | 271,958 | — | 322,367 | ||||||||||||
| Turkey |
172,123 | — | — | 172,123 | ||||||||||||
| United Arab Emirates |
88,844 | — | — | 88,844 | ||||||||||||
| United Kingdom |
8,671,924 | — | — | 8,671,924 | ||||||||||||
| United States |
74,917,067 | — | — | 74,917,067 | ||||||||||||
| Short-Term Investments |
593,670 | — | — | 593,670 | ||||||||||||
|
|
|
|
|
|
|
|
|
|||||||||
| TOTAL INVESTMENTS |
$ | 145,824,664 | $ | 271,958 | $ | 0 | $ | 146,096,622 | ||||||||
|
|
|
|
|
|
|
|
|
|||||||||
| (a) | Fund held a Level 3 security that was valued at $0 at September 30, 2017. |
Affiliate Table
| Number of Shares Held at 9/30/16 |
Value at 9/30/16 |
Cost of Purchases |
Proceeds from Shares Sold |
Realized Gain (Loss) |
Change in Unrealized Appreciation/ Depreciation |
Number of Shares Held at 9/30/17 |
Value at 9/30/17 |
Dividend Income |
||||||||||||||||||||||||||||
| State Street Corp. |
1,287 | $ | 89,614 | $ | 29,525 | $ | 7,880 | $ | (93 | ) | $ | 37,399 | 1,555 | $ | 148,565 | $ | 2,426 | |||||||||||||||||||
| State Street Institutional Liquid Reserves Fund, Premier Class |
241,790 | 241,790 | 45,145 | 286,935 | — | — | — | — | 10 | |||||||||||||||||||||||||||
| State Street Institutional U.S. Government Money Market Fund, Class G Shares |
— | — | 3,845,044 | 3,629,412 | — | — | 215,632 | 215,632 | 854 | |||||||||||||||||||||||||||
| State Street Institutional U.S. Government Money Market Fund, Premier Class |
— | — | 2,509,473 | 2,509,473 | — | — | — | — | 490 | |||||||||||||||||||||||||||
| State Street Navigator Securities Lending Government Money Market Portfolio* |
— | — | 5,103,876 | 4,725,838 | — | — | 378,038 | 378,038 | 3,078 | |||||||||||||||||||||||||||
|
|
|
|
|
|
|
|
|
|
|
|
|
|
|
|||||||||||||||||||||||
| TOTAL |
$ | 331,404 | $ | 11,533,063 | $ | 11,159,538 | $ | (93 | ) | $ | 37,399 | $ | 742,235 | $ | 6,858 | |||||||||||||||||||||
|
|
|
|
|
|
|
|
|
|
|
|
|
|
|
|||||||||||||||||||||||
| * | Effective October 5, 2016, the name of State Street Navigator Securities Lending Prime Portfolio was changed to State Street Navigator Securities Lending Government Money Market Portfolio. |
See accompanying notes to financial statements.
135
Table of Contents
SPDR MSCI EAFE Fossil Fuel Reserves Free ETF
SCHEDULE OF INVESTMENTS
September 30, 2017
| Security Description |
Shares |
Value |
||||||
| COMMON STOCKS — 99.4% |
||||||||
| AUSTRALIA — 6.2% |
||||||||
| Alumina, Ltd. (a) |
8,622 | $ | 14,884 | |||||
| Amcor, Ltd. |
4,074 | 48,621 | ||||||
| AMP, Ltd. |
10,427 | 39,517 | ||||||
| APA Group |
3,920 | 25,683 | ||||||
| Aristocrat Leisure, Ltd. |
1,900 | 31,308 | ||||||
| ASX, Ltd. |
676 | 27,810 | ||||||
| Aurizon Holdings, Ltd. |
7,225 | 27,779 | ||||||
| Australia & New Zealand Banking Group, Ltd. |
10,271 | 238,550 | ||||||
| Bank of Queensland, Ltd. |
1,384 | 14,096 | ||||||
| Bendigo & Adelaide Bank, Ltd. |
1,722 | 15,687 | ||||||
| BlueScope Steel, Ltd. |
2,193 | 18,876 | ||||||
| Boral, Ltd. |
3,813 | 20,255 | ||||||
| Brambles, Ltd. |
5,597 | 39,525 | ||||||
| Caltex Australia, Ltd. |
925 | 23,298 | ||||||
| Challenger, Ltd. |
2,004 | 19,577 | ||||||
| CIMIC Group, Ltd. |
351 | 12,176 | ||||||
| Coca-Cola Amatil, Ltd. |
2,004 | 12,155 | ||||||
| Cochlear, Ltd. |
208 | 25,984 | ||||||
| Commonwealth Bank of Australia |
5,850 | 345,413 | ||||||
| Computershare, Ltd. |
1,640 | 18,620 | ||||||
| Crown Resorts, Ltd. |
1,279 | 11,350 | ||||||
| CSL, Ltd. |
1,601 | 168,284 | ||||||
| Dexus REIT |
3,411 | 25,426 | ||||||
| Domino’s Pizza Enterprises, Ltd. (a) |
221 | 7,946 | ||||||
| Flight Centre Travel Group, Ltd. (a) |
275 | 9,712 | ||||||
| Fortescue Metals Group, Ltd. |
5,493 | 22,154 | ||||||
| Goodman Group REIT |
6,267 | 40,519 | ||||||
| GPT Group REIT |
6,345 | 24,694 | ||||||
| Healthscope, Ltd. |
6,111 | 8,008 | ||||||
| Incitec Pivot, Ltd. |
5,948 | 16,802 | ||||||
| Insurance Australia Group, Ltd. |
8,557 | 42,770 | ||||||
| LendLease Group |
1,939 | 27,264 | ||||||
| Macquarie Group, Ltd. |
1,094 | 78,046 | ||||||
| Medibank Pvt, Ltd. |
9,697 | 22,218 | ||||||
| Mirvac Group REIT |
13,056 | 23,460 | ||||||
| National Australia Bank, Ltd. |
9,322 | 230,407 | ||||||
| Newcrest Mining, Ltd. |
2,707 | 44,647 | ||||||
| Orica, Ltd. |
1,318 | 20,446 | ||||||
| QBE Insurance Group, Ltd. |
4,843 | 38,039 | ||||||
| Ramsay Health Care, Ltd. |
494 | 24,141 | ||||||
| REA Group, Ltd. |
182 | 9,568 | ||||||
| Scentre Group REIT |
18,764 | 57,862 | ||||||
| SEEK, Ltd. |
1,159 | 15,105 | ||||||
| Sonic Healthcare, Ltd. |
1,399 | 22,953 | ||||||
| Stockland REIT |
8,714 | 29,401 | ||||||
| Suncorp Group, Ltd. |
4,529 | 46,376 | ||||||
| Sydney Airport |
3,855 | 21,506 | ||||||
| Tabcorp Holdings, Ltd. |
2,930 | 9,817 | ||||||
| Tatts Group, Ltd. |
5,168 | 16,139 | ||||||
| Telstra Corp., Ltd. |
15,073 | 41,276 | ||||||
| Transurban Group Stapled Security |
7,173 | 66,864 | ||||||
| Treasury Wine Estates, Ltd. |
2,603 | 27,961 | ||||||
| Vicinity Centres REIT |
11,862 | 24,758 | ||||||
| Wesfarmers, Ltd. |
3,972 | 128,810 | ||||||
| Westfield Corp. REIT |
6,952 | 42,766 | ||||||
| Westpac Banking Corp. |
11,601 | 290,559 | ||||||
| Woolworths, Ltd. |
4,563 | 90,261 | ||||||
|
|
|
|||||||
| 2,848,129 | ||||||||
|
|
|
|||||||
| AUSTRIA — 0.2% |
||||||||
| ANDRITZ AG |
260 | 15,032 | ||||||
| Erste Group Bank AG (b) |
1,068 | 46,141 | ||||||
| Raiffeisen Bank International AG (b) |
416 | 13,945 | ||||||
| Voestalpine AG |
403 | 20,556 | ||||||
|
|
|
|||||||
| 95,674 | ||||||||
|
|
|
|||||||
| BELGIUM — 1.3% |
||||||||
| Ageas |
702 | 32,997 | ||||||
| Anheuser-Busch InBev SA |
2,635 | 315,559 | ||||||
| Colruyt SA (a) |
234 | 11,988 | ||||||
| Groupe Bruxelles Lambert SA |
286 | 30,092 | ||||||
| KBC Group NV |
897 | 76,033 | ||||||
| Proximus SADP |
533 | 18,371 | ||||||
| Solvay SA |
260 | 38,852 | ||||||
| Telenet Group Holding NV (b) |
182 | 12,044 | ||||||
| UCB SA |
442 | 31,472 | ||||||
| Umicore SA |
338 | 27,967 | ||||||
|
|
|
|||||||
| 595,375 | ||||||||
|
|
|
|||||||
| CHILE — 0.0% (c) |
||||||||
| Antofagasta PLC |
1,380 | 17,571 | ||||||
|
|
|
|||||||
| CHINA — 0.0% (c) |
||||||||
| Yangzijiang Shipbuilding Holdings, Ltd. |
9,100 | 9,583 | ||||||
|
|
|
|||||||
| DENMARK — 2.0% |
| |||||||
| AP Moeller - Maersk A/S Class A |
8 | 14,704 | ||||||
| AP Moeller - Maersk A/S Class B |
26 | 49,399 | ||||||
| Carlsberg A/S Class B |
377 | 41,265 | ||||||
| Chr Hansen Holding A/S |
351 | 30,111 | ||||||
| Coloplast A/S Class B |
416 | 33,770 | ||||||
| Danske Bank A/S |
2,434 | 97,363 | ||||||
| DONG Energy A/S (d) |
703 | 40,249 | ||||||
| DSV A/S |
663 | 50,166 | ||||||
| Genmab A/S (b) |
195 | 43,059 | ||||||
| H Lundbeck A/S |
194 | 11,197 | ||||||
| ISS A/S |
585 | 23,531 | ||||||
| Novo Nordisk A/S Class B |
6,478 | 309,760 | ||||||
| Novozymes A/S Class B |
819 | 42,038 | ||||||
| Pandora A/S (a) |
390 | 38,506 | ||||||
| TDC A/S |
2,616 | 15,331 | ||||||
| Vestas Wind Systems A/S |
793 | 71,177 | ||||||
| William Demant Holding A/S (b) |
416 | 10,983 | ||||||
|
|
|
|||||||
| 922,609 | ||||||||
|
|
|
|||||||
| FINLAND — 1.1% |
||||||||
| Elisa Oyj |
494 | 21,270 | ||||||
| Fortum Oyj |
1,562 | 31,189 | ||||||
| Kone Oyj Class B |
1,198 | 63,449 | ||||||
| Metso Oyj |
403 | 14,788 | ||||||
| Neste Oyj |
455 | 19,875 | ||||||
| Nokia Oyj |
20,567 | 123,517 | ||||||
| Nokian Renkaat Oyj |
403 | 17,928 | ||||||
| Orion Oyj Class B |
364 | 16,894 | ||||||
| Sampo Oyj Class A |
1,575 | 83,267 | ||||||
| Stora Enso Oyj Class R |
1,939 | 27,393 | ||||||
| UPM-Kymmene Oyj |
1,874 | 50,800 | ||||||
See accompanying notes to financial statements.
136
Table of Contents
SPDR MSCI EAFE Fossil Fuel Reserves Free ETF
SCHEDULE OF INVESTMENTS (continued)
September 30, 2017
| Security Description |
Shares |
Value |
||||||
| Wartsila Oyj Abp |
520 | $ | 36,823 | |||||
|
|
|
|||||||
| 507,193 | ||||||||
|
|
|
|||||||
| FRANCE — 10.1% |
||||||||
| Accor SA |
615 | 30,562 | ||||||
| Aeroports de Paris |
104 | 16,819 | ||||||
| Air Liquide SA |
1,367 | 182,373 | ||||||
| Airbus SE |
1,991 | 189,266 | ||||||
| Alstom SA |
533 | 22,643 | ||||||
| Arkema SA |
234 | 28,701 | ||||||
| Atos SE |
312 | 48,411 | ||||||
| AXA SA |
6,678 | 202,026 | ||||||
| BNP Paribas SA |
3,884 | 313,381 | ||||||
| Bollore SA |
3,091 | 15,453 | ||||||
| Bouygues SA |
741 | 35,172 | ||||||
| Bureau Veritas SA |
951 | 24,548 | ||||||
| Capgemini SE |
572 | 67,054 | ||||||
| Carrefour SA |
2,006 | 40,541 | ||||||
| Casino Guichard Perrachon SA |
195 | 11,568 | ||||||
| Cie de Saint-Gobain |
1,744 | 103,954 | ||||||
| Cie Generale des Etablissements Michelin |
559 | 81,615 | ||||||
| CNP Assurances |
598 | 14,019 | ||||||
| Credit Agricole SA |
3,727 | 67,765 | ||||||
| Danone SA |
2,001 | 157,004 | ||||||
| Dassault Aviation SA |
8 | 12,942 | ||||||
| Dassault Systemes SE |
457 | 46,241 | ||||||
| Edenred |
752 | 20,447 | ||||||
| Eiffage SA |
208 | 21,541 | ||||||
| Essilor International SA |
729 | 90,276 | ||||||
| Eurazeo SA |
151 | 13,501 | ||||||
| Eutelsat Communications SA |
611 | 18,101 | ||||||
| Fonciere Des Regions |
119 | 12,365 | ||||||
| Gecina SA REIT |
158 | 25,627 | ||||||
| Groupe Eurotunnel SE |
1,637 | 19,740 | ||||||
| Hermes International |
99 | 49,922 | ||||||
| ICADE REIT |
130 | 11,599 | ||||||
| Iliad SA |
91 | 24,189 | ||||||
| Imerys SA |
130 | 11,749 | ||||||
| Ingenico Group SA |
198 | 18,773 | ||||||
| Ipsen SA |
131 | 17,415 | ||||||
| JCDecaux SA |
260 | 9,738 | ||||||
| Kering |
260 | 103,600 | ||||||
| Klepierre SA REIT |
780 | 30,623 | ||||||
| L’Oreal SA |
892 | 189,708 | ||||||
| Lagardere SCA |
416 | 13,930 | ||||||
| Legrand SA |
951 | 68,670 | ||||||
| LVMH Moet Hennessy Louis Vuitton SE |
957 | 264,117 | ||||||
| Natixis SA |
3,307 | 26,468 | ||||||
| Orange SA |
7,004 | 114,763 | ||||||
| Pernod Ricard SA |
754 | 104,336 | ||||||
| Peugeot SA |
1,705 | 40,615 | ||||||
| Publicis Groupe SA |
684 | 47,782 | ||||||
| Remy Cointreau SA |
78 | 9,240 | ||||||
| Renault SA |
596 | 58,559 | ||||||
| Rexel SA |
1,081 | 18,709 | ||||||
| Safran SA |
1,107 | 113,124 | ||||||
| Sanofi |
3,880 | 385,348 | ||||||
| Schneider Electric SE (b) |
1,965 | 171,044 | ||||||
| SCOR SE |
572 | 23,989 | ||||||
| SEB SA |
75 | 13,761 | ||||||
| Societe BIC SA |
104 | 12,467 | ||||||
| Societe Generale SA |
2,620 | 153,428 | ||||||
| Sodexo SA |
338 | 42,156 | ||||||
| Suez Environment Co. |
1,255 | 22,915 | ||||||
| Thales SA |
377 | 42,688 | ||||||
| Unibail-Rodamco SE REIT |
351 | 85,376 | ||||||
| Valeo SA |
845 | 62,715 | ||||||
| Veolia Environnement SA |
1,588 | 36,702 | ||||||
| Vinci SA |
1,770 | 168,236 | ||||||
| Vivendi SA |
3,465 | 87,743 | ||||||
| Wendel SA |
104 | 16,850 | ||||||
| Zodiac Aerospace |
734 | 21,229 | ||||||
|
|
|
|||||||
| 4,627,932 | ||||||||
|
|
|
|||||||
| GERMANY — 10.4% |
||||||||
| adidas AG |
663 | 150,019 | ||||||
| Allianz SE |
1,601 | 359,519 | ||||||
| Axel Springer SE |
156 | 10,027 | ||||||
| BASF SE |
3,228 | 343,605 | ||||||
| Bayer AG |
2,832 | 386,023 | ||||||
| Bayerische Motoren Werke AG |
1,172 | 118,921 | ||||||
| Bayerische Motoren Werke AG Preference Shares |
195 | 17,377 | ||||||
| Beiersdorf AG |
351 | 37,773 | ||||||
| Brenntag AG |
546 | 30,412 | ||||||
| Commerzbank AG (b) |
3,753 | 51,068 | ||||||
| Continental AG |
390 | 99,012 | ||||||
| Covestro AG (d) |
384 | 33,026 | ||||||
| Daimler AG |
3,252 | 259,389 | ||||||
| Deutsche Bank AG |
6,862 | 118,682 | ||||||
| Deutsche Boerse AG |
676 | 73,292 | ||||||
| Deutsche Lufthansa AG |
832 | 23,124 | ||||||
| Deutsche Post AG |
3,424 | 152,462 | ||||||
| Deutsche Telekom AG |
11,357 | 211,933 | ||||||
| Deutsche Wohnen SE |
1,198 | 50,873 | ||||||
| Evonik Industries AG |
572 | 20,435 | ||||||
| Fraport AG Frankfurt Airport Services Worldwide |
143 | 13,582 | ||||||
| Fresenius Medical Care AG & Co. KGaA |
780 | 76,324 | ||||||
| Fresenius SE & Co. KGaA |
1,432 | 115,541 | ||||||
| Fuchs Petrolub SE Preference Shares |
247 | 14,626 | ||||||
| GEA Group AG |
637 | 28,985 | ||||||
| Hannover Rueck SE |
208 | 25,069 | ||||||
| HeidelbergCement AG |
494 | 50,791 | ||||||
| Henkel AG & Co. KGaA |
364 | 44,302 | ||||||
| Henkel AG & Co. KGaA Preference Shares |
624 | 84,945 | ||||||
| HOCHTIEF AG |
78 | 13,163 | ||||||
| HUGO BOSS AG |
234 | 20,634 | ||||||
| Infineon Technologies AG |
3,985 | 100,204 | ||||||
| Innogy SE (d) |
590 | 26,264 | ||||||
| KION Group AG |
158 | 15,124 | ||||||
| KS AG (a) |
676 | 18,421 | ||||||
| Lanxess AG |
325 | 25,650 | ||||||
| Linde AG |
650 | 135,589 | ||||||
| MAN SE |
130 | 14,676 | ||||||
| Merck KGaA |
455 | 50,627 | ||||||
| METRO AG (b) |
624 | 13,194 | ||||||
| Muenchener Rueckversicherungs-Gesellschaft AG in Muenchen |
495 | 105,861 | ||||||
See accompanying notes to financial statements.
137
Table of Contents
SPDR MSCI EAFE Fossil Fuel Reserves Free ETF
SCHEDULE OF INVESTMENTS (continued)
September 30, 2017
| Security Description |
Shares |
Value |
||||||
| OSRAM Licht AG |
312 | $ | 24,901 | |||||
| Porsche Automobil Holding SE Preference Shares |
533 | 34,089 | ||||||
| ProSiebenSat.1 Media SE |
780 | 26,589 | ||||||
| RWE AG (b) |
1,718 | 39,036 | ||||||
| SAP SE |
3,460 | 379,140 | ||||||
| Schaeffler AG Preference Shares |
585 | 9,440 | ||||||
| Siemens AG |
2,609 | 367,656 | ||||||
| Symrise AG |
429 | 32,595 | ||||||
| Telefonica Deutschland Holding AG |
2,629 | 14,757 | ||||||
| ThyssenKrupp AG |
1,292 | 38,300 | ||||||
| TUI AG |
1,457 | 24,748 | ||||||
| United Internet AG |
429 | 26,712 | ||||||
| Volkswagen AG |
75 | 12,701 | ||||||
| Volkswagen AG Preference Shares |
650 | 106,043 | ||||||
| Vonovia SE |
1,693 | 72,053 | ||||||
| Zalando SE (b) (d) |
299 | 14,988 | ||||||
|
|
|
|||||||
| 4,764,292 | ||||||||
|
|
|
|||||||
| HONG KONG — 3.5% |
||||||||
| AIA Group, Ltd. |
41,600 | 306,779 | ||||||
| ASM Pacific Technology, Ltd. |
900 | 12,963 | ||||||
| Bank of East Asia, Ltd. |
5,236 | 22,625 | ||||||
| BOC Hong Kong Holdings, Ltd. |
13,000 | 63,163 | ||||||
| CK Asset Holdings, Ltd. |
8,500 | 70,355 | ||||||
| CK Hutchison Holdings, Ltd. |
8,500 | 108,662 | ||||||
| CK Infrastructure Holdings, Ltd. |
2,000 | 17,207 | ||||||
| CLP Holdings, Ltd. |
6,500 | 66,617 | ||||||
| Galaxy Entertainment Group, Ltd. |
9,000 | 63,375 | ||||||
| Hang Lung Group, Ltd. |
3,000 | 10,774 | ||||||
| Hang Lung Properties, Ltd. |
9,000 | 21,363 | ||||||
| Hang Seng Bank, Ltd. |
2,600 | 63,380 | ||||||
| Henderson Land Development Co., Ltd. |
3,000 | 19,877 | ||||||
| HKT Trust & HKT, Ltd. |
13,000 | 15,795 | ||||||
| Hong Kong Exchanges & Clearing, Ltd. |
3,976 | 106,900 | ||||||
| Hongkong Land Holdings, Ltd. |
3,900 | 28,080 | ||||||
| Hysan Development Co., Ltd. |
2,000 | 9,410 | ||||||
| I-CABLE Communications, Ltd. (b) |
2,511 | 82 | ||||||
| Jardine Matheson Holdings, Ltd. |
800 | 50,688 | ||||||
| Jardine Strategic Holdings, Ltd. |
800 | 34,560 | ||||||
| Kerry Properties, Ltd. |
2,500 | 10,354 | ||||||
| Li & Fung, Ltd. |
26,000 | 13,049 | ||||||
| Link REIT |
6,500 | 52,678 | ||||||
| Melco Resorts & Entertainment, Ltd. ADR |
663 | 15,992 | ||||||
| MTR Corp., Ltd. |
6,500 | 37,948 | ||||||
| New World Development Co., Ltd. |
27,045 | 38,850 | ||||||
| NWS Holdings, Ltd. |
9,530 | 18,570 | ||||||
| Power Assets Holdings, Ltd. |
5,000 | 43,306 | ||||||
| Sands China, Ltd. |
8,000 | 41,635 | ||||||
| Shangri-La Asia, Ltd. |
2,000 | 3,708 | ||||||
| Sino Land Co., Ltd. |
14,196 | 24,936 | ||||||
| SJM Holdings, Ltd. |
13,000 | 11,900 | ||||||
| Sun Hung Kai Properties, Ltd. |
4,000 | 64,988 | ||||||
| Swire Pacific, Ltd. Class A |
1,000 | 9,705 | ||||||
| Swire Properties, Ltd. |
5,200 | 17,642 | ||||||
| Techtronic Industries Co., Ltd. |
4,500 | 24,025 | ||||||
| WH Group, Ltd. (d) |
30,000 | 31,879 | ||||||
| Wharf Holdings, Ltd. |
4,000 | 35,643 | ||||||
| Wheelock & Co., Ltd. |
2,000 | 14,070 | ||||||
| Yue Yuen Industrial Holdings, Ltd. |
4,500 | 17,111 | ||||||
|
|
|
|||||||
| 1,620,644 | ||||||||
|
|
|
|||||||
| IRELAND — 0.7% |
||||||||
| Bank of Ireland Group PLC (b) |
3,232 | 26,479 | ||||||
| CRH PLC |
2,930 | 111,796 | ||||||
| Experian PLC |
3,385 | 68,077 | ||||||
| James Hardie Industries PLC |
1,562 | 21,718 | ||||||
| Kerry Group PLC Class A |
559 | 53,720 | ||||||
| Paddy Power Betfair PLC |
286 | 28,543 | ||||||
| Ryanair Holdings PLC ADR (b) |
117 | 12,334 | ||||||
|
|
|
|||||||
| 322,667 | ||||||||
|
|
|
|||||||
| ISRAEL — 0.5% |
||||||||
| Azrieli Group, Ltd. |
156 | 8,664 | ||||||
| Bank Hapoalim BM |
3,753 | 26,273 | ||||||
| Bank Leumi Le-Israel BM |
5,103 | 27,085 | ||||||
| Bezeq The Israeli Telecommunication Corp., Ltd. |
7,303 | 10,442 | ||||||
| Check Point Software Technologies, Ltd. (b) |
455 | 51,879 | ||||||
| Elbit Systems, Ltd. |
80 | 11,760 | ||||||
| Frutarom Industries, Ltd. |
141 | 10,853 | ||||||
| Israel Chemicals, Ltd. |
1,796 | 7,972 | ||||||
| Mizrahi Tefahot Bank, Ltd. |
494 | 8,856 | ||||||
| Nice, Ltd. |
208 | 16,593 | ||||||
| Teva Pharmaceutical Industries, Ltd. |
3,216 | 56,225 | ||||||
|
|
|
|||||||
| 236,602 | ||||||||
|
|
|
|||||||
| ITALY — 1.6% |
||||||||
| Assicurazioni Generali SpA |
4,113 | 76,631 | ||||||
| Atlantia SpA |
1,445 | 45,628 | ||||||
| Ferrari NV |
429 | 47,420 | ||||||
| Intesa Sanpaolo SpA (e) |
43,269 | 153,048 | ||||||
| Intesa Sanpaolo SpA (e) |
3,281 | 10,861 | ||||||
| Leonardo SpA |
1,419 | 26,589 | ||||||
| Luxottica Group SpA |
598 | 33,432 | ||||||
| Mediobanca SpA |
1,991 | 21,372 | ||||||
| Poste Italiane SpA (a) (d) |
1,835 | 13,515 | ||||||
| Prysmian SpA |
702 | 23,719 | ||||||
| Recordati SpA |
365 | 16,829 | ||||||
| Snam SpA |
8,635 | 41,609 | ||||||
| Telecom Italia SpA/Milano (b) (e) |
35,675 | 33,424 | ||||||
| Telecom Italia SpA/Milano Savings Shares (e) |
21,236 | 15,967 | ||||||
| Terna Rete Elettrica Nazionale SpA |
5,311 | 31,029 | ||||||
| UniCredit SpA (b) |
6,824 | 145,373 | ||||||
| UnipolSai Assicurazioni SpA |
3,985 | 9,309 | ||||||
|
|
|
|||||||
| 745,755 | ||||||||
|
|
|
|||||||
| JAPAN — 24.6% |
||||||||
| Aeon Co., Ltd. (a) |
2,600 | 38,400 | ||||||
| AEON Financial Service Co., Ltd. |
500 | 10,443 | ||||||
| Air Water, Inc. |
800 | 14,754 | ||||||
| Aisin Seiki Co., Ltd. |
700 | 36,876 | ||||||
| Ajinomoto Co., Inc. |
2,100 | 40,968 | ||||||
| Alfresa Holdings Corp. |
800 | 14,633 | ||||||
| Alps Electric Co., Ltd. |
500 | 13,188 | ||||||
| Amada Holdings Co., Ltd. |
1,300 | 14,263 | ||||||
| ANA Holdings, Inc. |
300 | 11,351 | ||||||
| Aozora Bank, Ltd. |
300 | 11,407 | ||||||
See accompanying notes to financial statements.
138
Table of Contents
SPDR MSCI EAFE Fossil Fuel Reserves Free ETF
SCHEDULE OF INVESTMENTS (continued)
September 30, 2017
| Security Description |
Shares |
Value |
||||||
| Asahi Glass Co., Ltd. |
500 | $ | 18,545 | |||||
| Asahi Group Holdings, Ltd. |
1,300 | 52,617 | ||||||
| Asahi Kasei Corp. |
4,000 | 49,216 | ||||||
| Asics Corp. |
500 | 7,445 | ||||||
| Astellas Pharma, Inc. |
7,800 | 99,193 | ||||||
| Bandai Namco Holdings, Inc. |
800 | 27,433 | ||||||
| Bank of Kyoto, Ltd. |
200 | 10,163 | ||||||
| Benesse Holdings, Inc. |
300 | 10,820 | ||||||
| Bridgestone Corp. |
2,400 | 108,865 | ||||||
| Brother Industries, Ltd. |
900 | 20,932 | ||||||
| Calbee, Inc. (a) |
300 | 10,541 | ||||||
| Canon, Inc. |
3,900 | 133,216 | ||||||
| Casio Computer Co., Ltd. (a) |
500 | 7,036 | ||||||
| Central Japan Railway Co. |
400 | 70,111 | ||||||
| Chiba Bank, Ltd. |
2,000 | 14,303 | ||||||
| Chubu Electric Power Co., Inc. |
2,600 | 32,268 | ||||||
| Chugai Pharmaceutical Co., Ltd. |
800 | 33,190 | ||||||
| Chugoku Bank, Ltd. |
1,300 | 17,808 | ||||||
| Chugoku Electric Power Co., Inc. (a) |
1,300 | 13,801 | ||||||
| Coca-Cola Bottlers Japan, Inc. |
300 | 9,728 | ||||||
| Concordia Financial Group, Ltd. |
3,900 | 19,267 | ||||||
| Credit Saison Co., Ltd. |
800 | 16,595 | ||||||
| Dai Nippon Printing Co., Ltd. |
500 | 11,962 | ||||||
| Dai-ichi Life Holdings, Inc. |
3,900 | 69,952 | ||||||
| Daicel Corp. |
1,300 | 15,660 | ||||||
| Daiichi Sankyo Co., Ltd. |
2,100 | 47,349 | ||||||
| Daikin Industries, Ltd. |
900 | 91,107 | ||||||
| Daito Trust Construction Co., Ltd. |
200 | 36,423 | ||||||
| Daiwa House Industry Co., Ltd. |
2,100 | 72,478 | ||||||
| Daiwa House REIT Investment Corp. |
4 | 9,573 | ||||||
| Daiwa Securities Group, Inc. |
4,000 | 22,646 | ||||||
| DeNA Co., Ltd. |
500 | 11,202 | ||||||
| Denso Corp. |
1,600 | 80,920 | ||||||
| Dentsu, Inc. |
800 | 35,109 | ||||||
| Disco Corp. |
100 | 20,335 | ||||||
| Don Quijote Holdings Co., Ltd. |
300 | 11,207 | ||||||
| East Japan Railway Co. |
1,300 | 119,935 | ||||||
| Eisai Co., Ltd. |
1,000 | 51,313 | ||||||
| FamilyMart UNY Holdings Co., Ltd. |
200 | 10,536 | ||||||
| FANUC Corp. |
700 | 141,723 | ||||||
| Fast Retailing Co., Ltd. |
200 | 58,970 | ||||||
| Fuji Electric Co., Ltd. |
2,000 | 11,087 | ||||||
| FUJIFILM Holdings Corp. |
1,300 | 50,434 | ||||||
| Fujitsu, Ltd. |
8,000 | 59,407 | ||||||
| Fukuoka Financial Group, Inc. |
2,000 | 9,239 | ||||||
| Hakuhodo DY Holdings, Inc. |
1,300 | 17,069 | ||||||
| Hamamatsu Photonics KK |
300 | 9,061 | ||||||
| Hankyu Hanshin Holdings, Inc. |
1,000 | 37,934 | ||||||
| Hino Motors, Ltd. |
1,300 | 15,891 | ||||||
| Hirose Electric Co., Ltd. |
100 | 14,072 | ||||||
| Hisamitsu Pharmaceutical Co., Inc. |
200 | 9,594 | ||||||
| Hitachi Chemical Co., Ltd. |
400 | 10,963 | ||||||
| Hitachi Construction Machinery Co., Ltd. |
400 | 11,851 | ||||||
| Hitachi High-Technologies Corp. |
300 | 10,874 | ||||||
| Hitachi Metals, Ltd. |
1,300 | 18,086 | ||||||
| Hitachi, Ltd. |
16,000 | 112,703 | ||||||
| Honda Motor Co., Ltd. |
6,200 | 183,524 | ||||||
| Hoshizaki Corp. |
200 | 17,572 | ||||||
| Hoya Corp. |
1,300 | 70,159 | ||||||
| Hulic Co., Ltd. |
1,300 | 12,738 | ||||||
| IHI Corp. |
500 | 17,368 | ||||||
| Iida Group Holdings Co., Ltd. |
700 | 12,475 | ||||||
| Isetan Mitsukoshi Holdings, Ltd. (a) |
1,300 | 13,570 | ||||||
| Isuzu Motors, Ltd. |
1,700 | 22,518 | ||||||
| ITOCHU Corp. |
5,200 | 85,138 | ||||||
| J Front Retailing Co., Ltd. |
1,300 | 17,958 | ||||||
| Japan Airlines Co., Ltd. |
300 | 10,149 | ||||||
| Japan Exchange Group, Inc. |
2,000 | 35,375 | ||||||
| Japan Post Bank Co., Ltd. (a) |
1,300 | 16,053 | ||||||
| Japan Post Holdings Co., Ltd. (a) |
1,300 | 15,348 | ||||||
| Japan Prime Realty Investment Corp. REIT |
3 | 10,021 | ||||||
| Japan Real Estate Investment Corp. REIT |
3 | 14,418 | ||||||
| Japan Retail Fund Investment Corp. REIT |
13 | 23,317 | ||||||
| Japan Tobacco, Inc. |
3,900 | 127,777 | ||||||
| JFE Holdings, Inc. |
1,800 | 35,140 | ||||||
| JGC Corp. |
700 | 11,324 | ||||||
| JSR Corp. |
800 | 15,195 | ||||||
| JTEKT Corp. |
1,300 | 17,993 | ||||||
| Kajima Corp. |
3,000 | 29,796 | ||||||
| Kakaku.com, Inc. |
400 | 5,096 | ||||||
| Kamigumi Co., Ltd. |
500 | 11,571 | ||||||
| Kaneka Corp. |
1,000 | 7,764 | ||||||
| Kansai Electric Power Co., Inc. |
2,600 | 33,249 | ||||||
| Kansai Paint Co., Ltd. |
900 | 22,643 | ||||||
| Kao Corp. |
1,600 | 94,097 | ||||||
| Kawasaki Heavy Industries, Ltd. |
400 | 13,255 | ||||||
| KDDI Corp. |
6,500 | 171,328 | ||||||
| Keihan Holdings Co., Ltd. |
400 | 11,709 | ||||||
| Keikyu Corp. |
500 | 10,132 | ||||||
| Keio Corp. |
200 | 8,244 | ||||||
| Keisei Electric Railway Co., Ltd. |
400 | 11,069 | ||||||
| Keyence Corp. |
300 | 159,241 | ||||||
| Kikkoman Corp. |
300 | 9,221 | ||||||
| Kintetsu Group Holdings Co., Ltd. |
800 | 29,743 | ||||||
| Kirin Holdings Co., Ltd. |
3,000 | 70,573 | ||||||
| Kobe Steel, Ltd. |
1,300 | 14,852 | ||||||
| Koito Manufacturing Co., Ltd. |
300 | 18,816 | ||||||
| Komatsu, Ltd. |
3,100 | 88,154 | ||||||
| Konami Holdings Corp. |
300 | 14,418 | ||||||
| Konica Minolta, Inc. (a) |
1,300 | 10,671 | ||||||
| Kose Corp. |
100 | 11,451 | ||||||
| Kubota Corp. |
3,900 | 70,870 | ||||||
| Kuraray Co., Ltd. |
1,300 | 24,299 | ||||||
| Kyocera Corp. |
1,300 | 80,634 | ||||||
| Kyowa Hakko Kirin Co., Ltd. |
1,300 | 22,105 | ||||||
| Kyushu Electric Power Co., Inc. |
1,300 | 13,801 | ||||||
| Kyushu Financial Group, Inc. |
1,300 | 7,992 | ||||||
| Kyushu Railway Co. |
349 | 10,371 | ||||||
| Lawson, Inc. |
100 | 6,618 | ||||||
| Lion Corp. |
600 | 10,948 | ||||||
| LIXIL Group Corp. |
900 | 23,874 | ||||||
| M3, Inc. |
1,000 | 28,472 | ||||||
| Mabuchi Motor Co., Ltd. |
200 | 10,003 | ||||||
| Makita Corp. |
700 | 28,201 | ||||||
| Marubeni Corp. |
6,500 | 44,377 | ||||||
| Marui Group Co., Ltd. (a) |
500 | 7,156 | ||||||
| Mazda Motor Corp. |
2,600 | 39,844 | ||||||
| McDonald’s Holdings Co., Japan, Ltd. |
200 | 8,848 | ||||||
See accompanying notes to financial statements.
139
Table of Contents
SPDR MSCI EAFE Fossil Fuel Reserves Free ETF
SCHEDULE OF INVESTMENTS (continued)
September 30, 2017
| Security Description |
Shares |
Value |
||||||
| Mebuki Financial Group, Inc. |
3,100 | $ | 11,980 | |||||
| Medipal Holdings Corp. |
700 | 12,151 | ||||||
| MEIJI Holdings Co., Ltd. |
300 | 23,773 | ||||||
| MINEBEA MITSUMI, Inc. |
1,300 | 20,326 | ||||||
| Miraca Holdings, Inc. |
200 | 9,292 | ||||||
| MISUMI Group, Inc. |
900 | 23,690 | ||||||
| Mitsubishi Chemical Holdings Corp. |
5,200 | 49,522 | ||||||
| Mitsubishi Corp. |
5,200 | 120,824 | ||||||
| Mitsubishi Electric Corp. |
6,500 | 101,515 | ||||||
| Mitsubishi Estate Co., Ltd. |
4,000 | 69,524 | ||||||
| Mitsubishi Gas Chemical Co., Inc. |
700 | 16,399 | ||||||
| Mitsubishi Heavy Industries, Ltd. |
1,300 | 51,381 | ||||||
| Mitsubishi Materials Corp. |
300 | 10,367 | ||||||
| Mitsubishi Motors Corp. |
2,600 | 20,557 | ||||||
| Mitsubishi Tanabe Pharma Corp. |
900 | 20,628 | ||||||
| Mitsubishi UFJ Financial Group, Inc. |
42,400 | 275,234 | ||||||
| Mitsubishi UFJ Lease & Finance Co., Ltd. |
1,000 | 5,295 | ||||||
| Mitsui & Co., Ltd. |
6,500 | 96,029 | ||||||
| Mitsui Chemicals, Inc. |
400 | 12,153 | ||||||
| Mitsui Fudosan Co., Ltd. |
2,700 | 58,526 | ||||||
| Mitsui OSK Lines, Ltd. (a) |
300 | 9,088 | ||||||
| Mixi, Inc. |
200 | 9,648 | ||||||
| Mizuho Financial Group, Inc. (a) |
84,500 | 147,958 | ||||||
| MS&AD Insurance Group Holdings, Inc. |
1,300 | 41,842 | ||||||
| Murata Manufacturing Co., Ltd. |
700 | 102,856 | ||||||
| Nabtesco Corp. |
300 | 11,140 | ||||||
| Nagoya Railroad Co., Ltd. |
400 | 8,610 | ||||||
| NEC Corp. |
800 | 21,676 | ||||||
| Nexon Co., Ltd. (b) |
700 | 18,258 | ||||||
| NGK Insulators, Ltd. |
1,300 | 24,345 | ||||||
| NGK Spark Plug Co., Ltd. |
900 | 19,149 | ||||||
| Nidec Corp. |
900 | 110,496 | ||||||
| Nikon Corp. |
1,300 | 22,532 | ||||||
| Nintendo Co., Ltd. |
400 | 147,684 | ||||||
| Nippon Building Fund, Inc. REIT |
4 | 19,935 | ||||||
| Nippon Electric Glass Co., Ltd. |
300 | 11,607 | ||||||
| Nippon Express Co., Ltd. |
200 | 13,024 | ||||||
| Nippon Paint Holdings Co., Ltd. |
500 | 16,990 | ||||||
| Nippon Prologis REIT, Inc. |
12 | 25,276 | ||||||
| Nippon Steel & Sumitomo Metal Corp. |
2,600 | 59,673 | ||||||
| Nippon Telegraph & Telephone Corp. |
2,600 | 119,115 | ||||||
| Nippon Yusen KK (b) |
900 | 18,701 | ||||||
| Nissan Chemical Industries, Ltd. |
300 | 10,554 | ||||||
| Nissan Motor Co., Ltd. (a) |
8,000 | 79,208 | ||||||
| Nisshin Seifun Group, Inc. |
1,300 | 21,770 | ||||||
| Nissin Foods Holdings Co., Ltd. |
200 | 12,153 | ||||||
| Nitori Holdings Co., Ltd. |
300 | 42,882 | ||||||
| Nitto Denko Corp. |
500 | 41,674 | ||||||
| NOK Corp. |
200 | 4,477 | ||||||
| Nomura Holdings, Inc. |
13,000 | 72,758 | ||||||
| Nomura Real Estate Holdings, Inc. |
500 | 10,652 | ||||||
| Nomura Real Estate Master Fund, Inc. |
13 | 16,896 | ||||||
| Nomura Research Institute, Ltd. |
300 | 11,700 | ||||||
| NSK, Ltd. |
1,300 | 17,520 | ||||||
| NTT Data Corp. |
2,100 | 22,462 | ||||||
| NTT DOCOMO, Inc. |
4,800 | 109,611 | ||||||
| Obayashi Corp. |
2,600 | 31,159 | ||||||
| Obic Co., Ltd. |
200 | 12,579 | ||||||
| Odakyu Electric Railway Co., Ltd. |
1,300 | 24,657 | ||||||
| Oji Holdings Corp. |
2,000 | 10,785 | ||||||
| Olympus Corp. |
1,000 | 33,847 | ||||||
| Omron Corp. |
700 | 35,633 | ||||||
| Ono Pharmaceutical Co., Ltd. |
1,300 | 29,444 | ||||||
| Oracle Corp. Japan |
100 | 7,853 | ||||||
| Oriental Land Co., Ltd. (a) |
900 | 68,552 | ||||||
| ORIX Corp. |
5,200 | 83,822 | ||||||
| Osaka Gas Co., Ltd. |
1,600 | 29,736 | ||||||
| Otsuka Corp. |
200 | 12,810 | ||||||
| Otsuka Holdings Co., Ltd. |
1,300 | 51,635 | ||||||
| Panasonic Corp. |
7,800 | 112,983 | ||||||
| Park24 Co., Ltd. (a) |
400 | 9,737 | ||||||
| Pola Orbis Holdings, Inc. |
300 | 9,075 | ||||||
| Rakuten, Inc. |
3,900 | 42,511 | ||||||
| Recruit Holdings Co., Ltd. |
3,900 | 84,434 | ||||||
| Resona Holdings, Inc. |
7,800 | 40,052 | ||||||
| Ricoh Co., Ltd. (a) |
2,600 | 25,269 | ||||||
| Rohm Co., Ltd. |
300 | 25,692 | ||||||
| Ryohin Keikaku Co., Ltd. |
100 | 29,450 | ||||||
| Santen Pharmaceutical Co., Ltd. |
1,300 | 20,476 | ||||||
| SBI Holdings, Inc. |
1,300 | 19,564 | ||||||
| Secom Co., Ltd. |
900 | 65,578 | ||||||
| Sega Sammy Holdings, Inc. |
500 | 6,983 | ||||||
| Seibu Holdings, Inc. |
700 | 11,952 | ||||||
| Seiko Epson Corp. |
900 | 21,771 | ||||||
| Sekisui Chemical Co., Ltd. |
1,300 | 25,569 | ||||||
| Sekisui House, Ltd. |
2,600 | 43,805 | ||||||
| Seven & i Holdings Co., Ltd. |
2,600 | 100,360 | ||||||
| Seven Bank, Ltd. (a) |
2,600 | 9,378 | ||||||
| Sharp Corp. (a) (b) |
600 | 18,096 | ||||||
| Shimadzu Corp. |
700 | 13,780 | ||||||
| Shimamura Co., Ltd. |
100 | 11,993 | ||||||
| Shimano, Inc. |
200 | 26,633 | ||||||
| Shimizu Corp. |
1,300 | 14,401 | ||||||
| Shin-Etsu Chemical Co., Ltd. |
1,300 | 116,182 | ||||||
| Shinsei Bank, Ltd. |
700 | 11,200 | ||||||
| Shionogi & Co., Ltd. |
1,100 | 60,108 | ||||||
| Shiseido Co., Ltd. |
1,300 | 51,993 | ||||||
| Shizuoka Bank, Ltd. |
1,000 | 8,990 | ||||||
| Showa Shell Sekiyu KK |
1,300 | 14,956 | ||||||
| SMC Corp. (a) |
200 | 70,519 | ||||||
| SoftBank Group Corp. |
2,900 | 234,030 | ||||||
| Sohgo Security Services Co., Ltd. |
200 | 9,168 | ||||||
| Sompo Holdings, Inc. |
1,300 | 50,561 | ||||||
| Sony Corp. |
4,400 | 163,625 | ||||||
| Sony Financial Holdings, Inc. |
700 | 11,480 | ||||||
| Stanley Electric Co., Ltd. |
700 | 23,973 | ||||||
| Start Today Co., Ltd. |
700 | 22,169 | ||||||
| Subaru Corp. |
2,100 | 75,743 | ||||||
| Sumitomo Chemical Co., Ltd. |
5,000 | 31,226 | ||||||
| Sumitomo Corp. |
3,900 | 56,076 | ||||||
| Sumitomo Dainippon Pharma Co., Ltd. (a) |
500 | 6,503 | ||||||
| Sumitomo Electric Industries, Ltd. |
2,600 | 42,454 | ||||||
| Sumitomo Heavy Industries, Ltd. |
200 | 8,013 | ||||||
| Sumitomo Metal Mining Co., Ltd. |
1,000 | 32,106 | ||||||
| Sumitomo Mitsui Financial Group, Inc. |
4,800 | 184,214 | ||||||
| Sumitomo Mitsui Trust Holdings, Inc. |
1,300 | 46,900 | ||||||
| Sumitomo Realty & Development Co., Ltd. |
1,000 | 30,249 | ||||||
| Sumitomo Rubber Industries, Ltd. |
700 | 12,823 | ||||||
See accompanying notes to financial statements.
140
Table of Contents
SPDR MSCI EAFE Fossil Fuel Reserves Free ETF
SCHEDULE OF INVESTMENTS (continued)
September 30, 2017
| Security Description |
Shares |
Value |
||||||
| Sundrug Co., Ltd. |
200 | $ | 8,280 | |||||
| Suntory Beverage & Food, Ltd. |
300 | 13,352 | ||||||
| Suruga Bank, Ltd. |
800 | 17,242 | ||||||
| Suzuken Co., Ltd. |
300 | 10,661 | ||||||
| Suzuki Motor Corp. |
1,300 | 68,161 | ||||||
| Sysmex Corp. |
500 | 31,893 | ||||||
| T&D Holdings, Inc. |
1,800 | 26,121 | ||||||
| Taiheiyo Cement Corp. |
300 | 11,580 | ||||||
| Taisei Corp. |
600 | 31,448 | ||||||
| Takashimaya Co., Ltd. |
1,000 | 9,363 | ||||||
| Takeda Pharmaceutical Co., Ltd. |
2,600 | 143,530 | ||||||
| TDK Corp. |
400 | 27,149 | ||||||
| Teijin, Ltd. |
800 | 15,763 | ||||||
| Terumo Corp. |
1,300 | 51,104 | ||||||
| THK Co., Ltd. |
300 | 10,207 | ||||||
| Tobu Railway Co., Ltd. |
600 | 16,470 | ||||||
| Toho Co., Ltd. |
300 | 10,461 | ||||||
| Tohoku Electric Power Co., Inc. |
1,300 | 16,526 | ||||||
| Tokio Marine Holdings, Inc. |
2,600 | 101,676 | ||||||
| Tokyo Electric Power Co. Holdings, Inc. (b) |
5,200 | 20,973 | ||||||
| Tokyo Electron, Ltd. |
500 | 76,756 | ||||||
| Tokyo Gas Co., Ltd. |
1,600 | 39,202 | ||||||
| Tokyo Tatemono Co., Ltd. |
1,300 | 16,619 | ||||||
| Tokyu Corp. |
1,500 | 21,228 | ||||||
| Tokyu Fudosan Holdings Corp. |
1,800 | 10,858 | ||||||
| Toppan Printing Co., Ltd. |
1,000 | 9,914 | ||||||
| Toray Industries, Inc. |
3,900 | 37,817 | ||||||
| Toshiba Corp. (b) |
13,000 | 36,379 | ||||||
| Tosoh Corp. |
1,000 | 22,529 | ||||||
| TOTO, Ltd. |
400 | 16,844 | ||||||
| Toyo Seikan Group Holdings, Ltd. |
700 | 11,691 | ||||||
| Toyo Suisan Kaisha, Ltd. |
300 | 11,020 | ||||||
| Toyota Industries Corp. |
400 | 22,991 | ||||||
| Toyota Motor Corp. |
9,100 | 542,451 | ||||||
| Toyota Tsusho Corp. |
900 | 29,543 | ||||||
| Trend Micro, Inc. |
300 | 14,765 | ||||||
| Tsuruha Holdings, Inc. |
100 | 11,949 | ||||||
| Unicharm Corp. |
1,300 | 29,750 | ||||||
| United Urban Investment Corp. REIT |
13 | 19,033 | ||||||
| USS Co., Ltd. |
1,300 | 26,216 | ||||||
| West Japan Railway Co. |
400 | 27,795 | ||||||
| Yahoo! Japan Corp. (a) |
5,200 | 24,668 | ||||||
| Yakult Honsha Co., Ltd. |
300 | 21,614 | ||||||
| Yamada Denki Co., Ltd. |
2,600 | 14,205 | ||||||
| Yamaha Corp. |
500 | 18,434 | ||||||
| Yamaha Motor Co., Ltd. |
900 | 26,944 | ||||||
| Yamato Holdings Co., Ltd. |
1,300 | 26,233 | ||||||
| Yaskawa Electric Corp. |
900 | 28,504 | ||||||
| Yokogawa Electric Corp. |
700 | 11,915 | ||||||
|
|
|
|||||||
| 11,296,905 | ||||||||
|
|
|
|||||||
| JORDAN — 0.0% (c) |
||||||||
| Hikma Pharmaceuticals PLC |
507 | 8,237 | ||||||
|
|
|
|||||||
| LUXEMBOURG — 0.3% |
||||||||
| ArcelorMittal (b) |
2,160 | 55,731 | ||||||
| Eurofins Scientific SE |
38 | 24,016 | ||||||
| Millicom International Cellular SA SDR |
234 | 15,409 | ||||||
| RTL Group SA |
143 | 10,827 | ||||||
| SES SA |
1,279 | 27,988 | ||||||
| Tenaris SA |
1,653 | 23,450 | ||||||
|
|
|
|||||||
| 157,421 | ||||||||
|
|
|
|||||||
| MACAU — 0.1% |
||||||||
| MGM China Holdings, Ltd. (a) |
5,200 | 12,463 | ||||||
| Wynn Macau, Ltd. |
5,200 | 14,014 | ||||||
|
|
|
|||||||
| 26,477 | ||||||||
|
|
|
|||||||
| MEXICO — 0.0% (c) |
||||||||
| Fresnillo PLC |
793 | 14,948 | ||||||
|
|
|
|||||||
| NETHERLANDS — 3.1% |
||||||||
| ABN AMRO Group NV (d) |
1,282 | 38,405 | ||||||
| Aegon NV |
5,941 | 34,611 | ||||||
| AerCap Holdings NV (b) |
485 | 24,788 | ||||||
| Akzo Nobel NV |
897 | 82,841 | ||||||
| Altice NV Class A (b) |
1,305 | 26,142 | ||||||
| Altice NV Class B (b) |
390 | 7,792 | ||||||
| ASML Holding NV |
1,292 | 220,022 | ||||||
| Boskalis Westminster |
322 | 11,258 | ||||||
| EXOR NV |
390 | 24,736 | ||||||
| Gemalto NV |
286 | 12,779 | ||||||
| Heineken Holding NV |
351 | 32,989 | ||||||
| Heineken NV |
819 | 80,992 | ||||||
| ING Groep NV |
13,661 | 251,940 | ||||||
| Koninklijke Ahold Delhaize NV |
4,503 | 84,217 | ||||||
| Koninklijke DSM NV |
653 | 53,467 | ||||||
| Koninklijke KPN NV |
12,042 | 41,356 | ||||||
| Koninklijke Philips NV |
3,209 | 132,513 | ||||||
| Koninklijke Vopak NV |
247 | 10,835 | ||||||
| NN Group NV |
1,060 | 44,373 | ||||||
| NXP Semiconductors NV (b) |
1,100 | 124,399 | ||||||
| Randstad Holding NV |
416 | 25,741 | ||||||
| Wolters Kluwer NV |
1,068 | 49,361 | ||||||
|
|
|
|||||||
| 1,415,557 | ||||||||
|
|
|
|||||||
| NEW ZEALAND — 0.2% |
||||||||
| Auckland International Airport, Ltd. |
3,415 | 15,898 | ||||||
| Contact Energy, Ltd. |
2,525 | 10,039 | ||||||
| Fletcher Building, Ltd. |
2,447 | 14,134 | ||||||
| Meridian Energy, Ltd. |
4,516 | 9,288 | ||||||
| Spark New Zealand, Ltd. |
6,447 | 17,011 | ||||||
|
|
|
|||||||
| 66,370 | ||||||||
|
|
|
|||||||
| NORWAY — 0.6% |
||||||||
| DNB ASA |
3,463 | 69,823 | ||||||
| Gjensidige Forsikring ASA |
715 | 12,449 | ||||||
| Marine Harvest ASA (b) |
1,341 | 26,533 | ||||||
| Norsk Hydro ASA |
4,739 | 34,470 | ||||||
| Orkla ASA |
2,878 | 29,538 | ||||||
| Schibsted ASA Class A |
464 | 11,961 | ||||||
| Telenor ASA |
2,642 | 55,891 | ||||||
| Yara International ASA |
624 | 27,961 | ||||||
|
|
|
|||||||
| 268,626 | ||||||||
|
|
|
|||||||
| PORTUGAL — 0.1% |
||||||||
| EDP - Energias de Portugal SA |
8,161 | 30,729 | ||||||
| Jeronimo Martins SGPS SA |
897 | 17,698 | ||||||
|
|
|
|||||||
| 48,427 | ||||||||
|
|
|
|||||||
See accompanying notes to financial statements.
141
Table of Contents
SPDR MSCI EAFE Fossil Fuel Reserves Free ETF
SCHEDULE OF INVESTMENTS (continued)
September 30, 2017
| Security Description |
Shares |
Value |
||||||
| SINGAPORE — 1.3% |
||||||||
| Ascendas REIT |
7,800 | $ | 15,279 | |||||
| CapitaLand Commercial Trust |
7,800 | 9,506 | ||||||
| CapitaLand Mall Trust REIT |
9,100 | 13,403 | ||||||
| CapitaLand, Ltd. |
9,100 | 23,991 | ||||||
| City Developments, Ltd. |
1,300 | 10,846 | ||||||
| ComfortDelGro Corp., Ltd. |
7,800 | 11,947 | ||||||
| DBS Group Holdings, Ltd. |
6,573 | 100,777 | ||||||
| Genting Singapore PLC |
20,800 | 17,921 | ||||||
| Global Logistic Properties, Ltd. |
9,100 | 22,114 | ||||||
| Golden Agri-Resources, Ltd. |
17,700 | 4,888 | ||||||
| Hutchison Port Holdings Trust |
23,500 | 10,105 | ||||||
| Keppel Corp., Ltd. |
5,200 | 24,852 | ||||||
| Oversea-Chinese Banking Corp., Ltd. |
10,400 | 85,470 | ||||||
| Sembcorp Industries, Ltd. |
3,900 | 8,501 | ||||||
| Singapore Airlines, Ltd. |
1,300 | 9,612 | ||||||
| Singapore Exchange, Ltd. |
2,600 | 14,149 | ||||||
| Singapore Press Holdings, Ltd. (a) |
5,200 | 10,416 | ||||||
| Singapore Technologies Engineering, Ltd. |
5,200 | 13,173 | ||||||
| Singapore Telecommunications, Ltd. |
28,600 | 77,505 | ||||||
| Suntec Real Estate Investment Trust |
9,100 | 12,498 | ||||||
| United Overseas Bank, Ltd. |
5,271 | 91,217 | ||||||
| UOL Group, Ltd. |
1,823 | 10,901 | ||||||
| Wilmar International, Ltd. |
6,500 | 15,221 | ||||||
|
|
|
|||||||
| 614,292 | ||||||||
|
|
|
|||||||
| SOUTH AFRICA — 0.1% |
||||||||
| Investec PLC |
2,186 | 15,984 | ||||||
| Mediclinic International PLC |
1,292 | 11,267 | ||||||
| Mondi PLC |
1,292 | 34,755 | ||||||
|
|
|
|||||||
| 62,006 | ||||||||
|
|
|
|||||||
| SPAIN — 3.6% |
||||||||
| Abertis Infraestructuras SA |
2,277 | 46,031 | ||||||
| ACS Actividades de Construccion y Servicios SA |
697 | 25,836 | ||||||
| Aena SME SA (d) |
234 | 42,256 | ||||||
| Amadeus IT Group SA |
1,536 | 99,854 | ||||||
| Banco Bilbao Vizcaya Argentaria SA |
23,604 | 210,987 | ||||||
| Banco de Sabadell SA |
18,633 | 38,901 | ||||||
| Banco Santander SA |
55,098 | 384,763 | ||||||
| Bankia SA |
4,059 | 19,578 | ||||||
| Bankinter SA |
2,381 | 22,530 | ||||||
| CaixaBank SA |
11,604 | 58,165 | ||||||
| Distribuidora Internacional de Alimentacion SA (a) |
2,199 | 12,829 | ||||||
| Enagas SA |
806 | 22,702 | ||||||
| Endesa SA |
1,133 | 25,550 | ||||||
| Ferrovial SA |
1,770 | 38,973 | ||||||
| Gas Natural SDG SA |
1,242 | 27,501 | ||||||
| Grifols SA |
1,068 | 31,123 | ||||||
| Iberdrola SA |
19,867 | 154,355 | ||||||
| Industria de Diseno Textil SA |
3,680 | 138,715 | ||||||
| Mapfre SA |
3,805 | 12,388 | ||||||
| Red Electrica Corp. SA |
1,523 | 32,013 | ||||||
| Siemens Gamesa Renewable Energy SA |
973 | 12,705 | ||||||
| Telefonica SA |
15,793 | 171,619 | ||||||
|
|
|
|||||||
| 1,629,374 | ||||||||
|
|
|
|||||||
| SWEDEN — 3.1% |
||||||||
| Alfa Laval AB |
1,042 | 25,392 | ||||||
| Assa Abloy AB Class B |
3,541 | 80,691 | ||||||
| Atlas Copco AB Class A |
2,244 | 94,820 | ||||||
| Atlas Copco AB Class B |
1,367 | 52,889 | ||||||
| Boliden AB |
977 | 33,000 | ||||||
| Electrolux AB Series B (a) |
858 | 29,075 | ||||||
| Essity AB Class B (b) |
2,147 | 58,289 | ||||||
| Getinge AB Class B |
715 | 13,376 | ||||||
| Getinge AB, Subscription Shares (b) (f) |
94 | 1,759 | ||||||
| Hennes & Mauritz AB Class B (a) |
3,346 | 86,495 | ||||||
| Hexagon AB Class B |
925 | 45,749 | ||||||
| Husqvarna AB Class B |
1,458 | 14,969 | ||||||
| ICA Gruppen AB |
286 | 10,725 | ||||||
| Industrivarden AB Class C |
572 | 14,457 | ||||||
| Investor AB Class B |
1,601 | 78,909 | ||||||
| Kinnevik AB Class B |
845 | 27,496 | ||||||
| Nordea Bank AB |
10,332 | 139,746 | ||||||
| Sandvik AB |
3,753 | 64,601 | ||||||
| Securitas AB Class B |
1,120 | 18,716 | ||||||
| Skandinaviska Enskilda Banken AB Class A |
5,363 | 70,501 | ||||||
| Skanska AB Class B |
1,211 | 27,996 | ||||||
| SKF AB Class B |
1,393 | 30,293 | ||||||
| Svenska Handelsbanken AB Class A |
5,337 | 80,359 | ||||||
| Swedbank AB Class A |
3,190 | 88,012 | ||||||
| Swedish Match AB |
663 | 23,206 | ||||||
| Tele2 AB Class B |
1,259 | 14,376 | ||||||
| Telefonaktiebolaget LM Ericsson Class B |
10,817 | 61,981 | ||||||
| Telia Co. AB |
9,153 | 43,016 | ||||||
| Volvo AB Class B |
5,441 | 104,656 | ||||||
|
|
|
|||||||
| 1,435,550 | ||||||||
|
|
|
|||||||
| SWITZERLAND — 9.2% |
||||||||
| ABB, Ltd. |
6,926 | 171,361 | ||||||
| Adecco Group AG |
585 | 45,586 | ||||||
| Baloise Holding AG |
182 | 28,816 | ||||||
| Barry Callebaut AG (b) |
13 | 19,938 | ||||||
| Chocoladefabriken Lindt & Spruengli AG |
3 | 17,130 | ||||||
| Cie Financiere Richemont SA |
1,835 | 167,835 | ||||||
| Coca-Cola HBC AG (b) |
637 | 21,580 | ||||||
| Credit Suisse Group AG (b) |
8,151 | 129,139 | ||||||
| Dufry AG (b) |
156 | 24,796 | ||||||
| EMS-Chemie Holding AG |
26 | 17,305 | ||||||
| Ferguson PLC |
897 | 58,921 | ||||||
| Geberit AG |
130 | 61,547 | ||||||
| Givaudan SA |
31 | 67,504 | ||||||
| Julius Baer Group, Ltd. (b) |
793 | 46,960 | ||||||
| Kuehne + Nagel International AG |
195 | 36,134 | ||||||
| LafargeHolcim, Ltd. (b) |
1,601 | 93,651 | ||||||
| Lonza Group AG (b) |
234 | 61,426 | ||||||
| Nestle SA |
10,770 | 902,694 | ||||||
| Novartis AG |
7,675 | 657,563 | ||||||
| Pargesa Holding SA |
117 | 9,734 | ||||||
| Partners Group Holding AG |
65 | 44,135 | ||||||
| Roche Holding AG |
2,414 | 616,723 | ||||||
| Schindler Holding AG (e) |
156 | 34,486 | ||||||
| Schindler Holding AG (e) |
78 | 16,792 | ||||||
| SGS SA |
17 | 40,813 | ||||||
| Sika AG |
8 | 59,570 | ||||||
See accompanying notes to financial statements.
142
Table of Contents
SPDR MSCI EAFE Fossil Fuel Reserves Free ETF
SCHEDULE OF INVESTMENTS (continued)
September 30, 2017
| Security Description |
Shares |
Value |
||||||
| Sonova Holding AG |
182 | $ | 30,904 | |||||
| STMicroelectronics NV |
2,251 | 43,563 | ||||||
| Straumann Holding AG |
35 | 22,499 | ||||||
| Swatch Group AG (a) (e) |
104 | 43,294 | ||||||
| Swatch Group AG (e) |
169 | 13,475 | ||||||
| Swiss Life Holding AG (b) |
117 | 41,245 | ||||||
| Swiss Prime Site AG (b) |
247 | 22,221 | ||||||
| Swiss Re AG |
1,185 | 107,404 | ||||||
| Swisscom AG |
91 | 46,666 | ||||||
| UBS Group AG (b) |
12,887 | 220,422 | ||||||
| Vifor Pharma AG |
130 | 15,316 | ||||||
| Zurich Insurance Group AG |
533 | 162,720 | ||||||
|
|
|
|||||||
| 4,221,868 | ||||||||
|
|
|
|||||||
| UNITED KINGDOM — 15.1% |
||||||||
| 3i Group PLC |
3,424 | 41,941 | ||||||
| Admiral Group PLC |
754 | 18,381 | ||||||
| Ashtead Group PLC |
1,770 | 42,721 | ||||||
| Associated British Foods PLC |
1,255 | 53,763 | ||||||
| AstraZeneca PLC |
4,421 | 293,903 | ||||||
| Auto Trader Group PLC (d) |
3,541 | 18,647 | ||||||
| Aviva PLC |
14,295 | 98,675 | ||||||
| Babcock International Group PLC |
897 | 9,959 | ||||||
| BAE Systems PLC |
11,173 | 94,663 | ||||||
| Barclays PLC |
55,692 | 144,469 | ||||||
| Barratt Developments PLC |
3,541 | 29,194 | ||||||
| Berkeley Group Holdings PLC |
468 | 23,339 | ||||||
| British American Tobacco PLC |
7,830 | 490,799 | ||||||
| British Land Co. PLC REIT |
3,463 | 27,970 | ||||||
| BT Group PLC |
29,733 | 113,251 | ||||||
| Bunzl PLC |
1,185 | 36,042 | ||||||
| Burberry Group PLC |
1,562 | 36,884 | ||||||
| Capita PLC |
2,355 | 17,852 | ||||||
| Carnival PLC |
663 | 42,190 | ||||||
| CNH Industrial NV |
3,619 | 43,468 | ||||||
| Cobham PLC |
8,419 | 16,457 | ||||||
| Coca-Cola European Partners PLC |
780 | 32,712 | ||||||
| Compass Group PLC |
5,569 | 118,276 | ||||||
| ConvaTec Group PLC (d) |
4,084 | 15,008 | ||||||
| Croda International PLC |
455 | 23,154 | ||||||
| DCC PLC |
312 | 30,327 | ||||||
| Diageo PLC |
8,711 | 286,685 | ||||||
| Direct Line Insurance Group PLC |
4,856 | 23,689 | ||||||
| Dixons Carphone PLC |
3,463 | 8,986 | ||||||
| easyJet PLC |
559 | 9,127 | ||||||
| Fiat Chrysler Automobiles NV (b) |
3,643 | 65,290 | ||||||
| G4S PLC |
5,467 | 20,413 | ||||||
| GKN PLC |
6,039 | 28,034 | ||||||
| GlaxoSmithKline PLC |
17,035 | 340,197 | ||||||
| Hammerson PLC REIT |
2,800 | 20,173 | ||||||
| Hargreaves Lansdown PLC |
925 | 18,367 | ||||||
| HSBC Holdings PLC |
68,929 | 681,660 | ||||||
| IMI PLC |
964 | 16,076 | ||||||
| Imperial Brands PLC |
3,307 | 141,269 | ||||||
| Inmarsat PLC |
1,588 | 13,710 | ||||||
| InterContinental Hotels Group PLC |
635 | 33,635 | ||||||
| International Consolidated Airlines Group SA |
2,224 | 17,721 | ||||||
| Intertek Group PLC |
572 | 38,233 | ||||||
| Intu Properties PLC REIT |
3,320 | 10,267 | ||||||
| ITV PLC |
12,783 | 29,962 | ||||||
| J Sainsbury PLC |
5,779 | 18,445 | ||||||
| Johnson Matthey PLC |
676 | 31,018 | ||||||
| Kingfisher PLC |
8,018 | 32,111 | ||||||
| Land Securities Group PLC REIT |
2,613 | 34,091 | ||||||
| Legal & General Group PLC |
20,963 | 73,097 | ||||||
| Lloyds Banking Group PLC |
250,099 | 227,265 | ||||||
| London Stock Exchange Group PLC |
1,120 | 57,551 | ||||||
| Marks & Spencer Group PLC (a) |
5,727 | 27,154 | ||||||
| Meggitt PLC |
2,733 | 19,104 | ||||||
| Merlin Entertainments PLC (d) |
2,499 | 14,937 | ||||||
| National Grid PLC |
12,010 | 148,983 | ||||||
| Next PLC |
494 | 34,862 | ||||||
| Old Mutual PLC |
17,377 | 45,275 | ||||||
| Pearson PLC |
2,904 | 23,844 | ||||||
| Persimmon PLC |
1,094 | 37,898 | ||||||
| Provident Financial PLC (a) |
520 | 5,794 | ||||||
| Prudential PLC |
8,997 | 215,645 | ||||||
| Randgold Resources, Ltd. |
325 | 31,896 | ||||||
| Reckitt Benckiser Group PLC |
2,194 | 200,546 | ||||||
| RELX NV |
3,515 | 74,839 | ||||||
| RELX PLC |
3,855 | 84,667 | ||||||
| Rolls-Royce Holdings PLC (b) |
5,553 | 66,083 | ||||||
| Royal Bank of Scotland Group PLC (b) |
12,465 | 44,870 | ||||||
| Royal Mail PLC |
3,177 | 16,376 | ||||||
| RSA Insurance Group PLC |
3,606 | 30,141 | ||||||
| Sage Group PLC |
3,805 | 35,658 | ||||||
| Schroders PLC |
481 | 21,651 | ||||||
| Segro PLC REIT |
3,587 | 25,795 | ||||||
| Severn Trent PLC |
845 | 24,635 | ||||||
| Sky PLC |
3,645 | 44,746 | ||||||
| Smith & Nephew PLC |
3,151 | 56,987 | ||||||
| Smiths Group PLC |
1,393 | 29,473 | ||||||
| St James’s Place PLC |
1,848 | 28,414 | ||||||
| Standard Chartered PLC (b) |
10,326 | 102,740 | ||||||
| Standard Life Aberdeen PLC |
9,428 | 54,834 | ||||||
| Tate & Lyle PLC |
1,640 | 14,269 | ||||||
| Taylor Wimpey PLC |
11,496 | 30,153 | ||||||
| Tesco PLC (b) |
28,799 | 72,311 | ||||||
| Travis Perkins PLC |
581 | 11,287 | ||||||
| Unilever NV |
5,775 | 341,633 | ||||||
| Unilever PLC |
4,516 | 261,683 | ||||||
| United Utilities Group PLC |
2,407 | 27,595 | ||||||
| Vodafone Group PLC |
89,290 | 250,134 | ||||||
| Weir Group PLC |
767 | 20,221 | ||||||
| Whitbread PLC |
637 | 32,185 | ||||||
| Wm Morrison Supermarkets PLC |
7,823 | 24,570 | ||||||
| Worldpay Group PLC (d) |
6,345 | 34,647 | ||||||
| WPP PLC |
4,542 | 84,399 | ||||||
|
|
|
|||||||
| 6,944,051 | ||||||||
|
|
|
|||||||
| UNITED STATES — 0.4% |
||||||||
| QIAGEN NV (b) |
764 | 24,052 | ||||||
| Shire PLC |
3,141 | 159,631 | ||||||
|
|
|
|||||||
| 183,683 | ||||||||
|
|
|
|||||||
| TOTAL COMMON STOCKS |
45,707,818 | |||||||
|
|
|
|||||||
See accompanying notes to financial statements.
143
Table of Contents
SPDR MSCI EAFE Fossil Fuel Reserves Free ETF
SCHEDULE OF INVESTMENTS (continued)
September 30, 2017
| Security Description |
Shares |
Value |
||||||
| RIGHTS — 0.0% (c) |
||||||||
| SINGAPORE — 0.0% (c) |
||||||||
| CapitaLand Commercial Trust (expiring 10/17/19) (b) (f) |
1,295 | $ | 278 | |||||
|
|
|
|||||||
| SHORT-TERM INVESTMENTS — 0.7% |
| |||||||
| State Street Institutional U.S. Government Money Market Fund, Class G Shares 0.96% (g) (h) |
75,546 | 75,546 | ||||||
| State Street Navigator Securities Lending Government Money Market Portfolio (g) (i) |
242,956 | 242,956 | ||||||
|
|
|
|||||||
| TOTAL SHORT-TERM INVESTMENTS |
318,502 | |||||||
|
|
|
|||||||
| TOTAL INVESTMENTS — 100.1% |
46,026,598 | |||||||
| LIABILITIES IN EXCESS OF OTHER ASSETS — (0.1)% |
(46,697 | ) | ||||||
|
|
|
|||||||
| NET ASSETS — 100.0% |
$ | 45,979,901 | ||||||
|
|
|
|||||||
| (a) | All or a portion of the shares of the security are on loan at September 30, 2017. |
| (b) | Non-income producing security. |
| (c) | Amount is less than 0.05% of net assets. |
| (d) | Securities purchased pursuant to Rule 144A of the Securities Act of 1933, as amended. These securities, which represent 0.7% of net assets as of September 30, 2017, are considered liquid and may be resold in transactions exempt from registration, normally to qualified institutional buyers. |
| (e) | Reflects separate holdings of the issuer’s common stock traded on different securities exchanges. |
| (f) | Fair valued as determined in good faith by the Trust’s Oversight Committee in accordance with policy and procedures approved by the Board of Trustees. As of September 30, 2017, total aggregate fair value of securities is $2,037 representing less than 0.05% of net assets. |
| (g) | The Fund invested in certain money market funds managed by SSGA Funds Management, Inc. Amounts related to these transactions during the period ended September 30, 2017 are shown in the Affiliate Table below. |
| (h) | The rate shown is the annualized seven-day yield at September 30, 2017. |
| (i) | Investment of cash collateral for securities loaned. |
ADR = American Depositary Receipt
REIT = Real Estate Investment Trust
SDR = Swedish Depositary Receipt
The following table summarizes the value of the Fund’s investments according to the fair value hierarchy as of September 30, 2017.
| Description |
Level 1 — Quoted Prices |
Level 2 — Other Significant Observable Inputs |
Level 3 — Significant Unobservable Inputs |
Total | ||||||||||||
| ASSETS: |
||||||||||||||||
| INVESTMENTS: |
||||||||||||||||
| Common Stocks |
||||||||||||||||
| Australia |
$ | 2,848,129 | $ | — | $ | — | $ | 2,848,129 | ||||||||
| Austria |
95,674 | — | — | 95,674 | ||||||||||||
| Belgium. |
595,375 | — | — | 595,375 | ||||||||||||
| Chile |
17,571 | — | — | 17,571 | ||||||||||||
| China |
9,583 | — | — | 9,583 | ||||||||||||
| Denmark |
922,609 | — | — | 922,609 | ||||||||||||
| Finland |
507,193 | — | — | 507,193 | ||||||||||||
| France |
4,627,932 | — | — | 4,627,932 | ||||||||||||
| Germany |
4,764,292 | — | — | 4,764,292 | ||||||||||||
| Hong Kong |
1,620,644 | — | — | 1,620,644 | ||||||||||||
| Ireland |
322,667 | — | — | 322,667 | ||||||||||||
| Israel |
236,602 | — | — | 236,602 | ||||||||||||
| Italy |
745,755 | — | — | 745,755 | ||||||||||||
| Japan |
11,296,905 | — | — | 11,296,905 | ||||||||||||
| Jordan |
8,237 | — | — | 8,237 | ||||||||||||
| Luxembourg |
157,421 | — | — | 157,421 | ||||||||||||
| Macau |
26,477 | — | — | 26,477 | ||||||||||||
| Mexico |
14,948 | — | — | 14,948 | ||||||||||||
| Netherlands |
1,415,557 | — | — | 1,415,557 | ||||||||||||
| New Zealand |
66,370 | — | — | 66,370 | ||||||||||||
| Norway |
268,626 | — | — | 268,626 | ||||||||||||
| Portugal |
48,427 | — | — | 48,427 | ||||||||||||
| Singapore |
614,292 | — | — | 614,292 | ||||||||||||
See accompanying notes to financial statements.
144
Table of Contents
SPDR MSCI EAFE Fossil Fuel Reserves Free ETF
SCHEDULE OF INVESTMENTS (continued)
September 30, 2017
| Description |
Level 1 — Quoted Prices |
Level 2 — Other Significant Observable Inputs |
Level 3 — Significant Unobservable Inputs |
Total | ||||||||||||
| South Africa |
$ | 62,006 | $ | — | $ | — | $ | 62,006 | ||||||||
| Spain |
1,629,374 | — | — | 1,629,374 | ||||||||||||
| Sweden |
1,433,791 | 1,759 | — | 1,435,550 | ||||||||||||
| Switzerland |
4,221,868 | — | — | 4,221,868 | ||||||||||||
| United Kingdom |
6,944,051 | — | — | 6,944,051 | ||||||||||||
| United States |
183,683 | — | — | 183,683 | ||||||||||||
| Rights |
||||||||||||||||
| Singapore |
— | 278 | — | 278 | ||||||||||||
| Short-Term Investments |
318,502 | — | — | 318,502 | ||||||||||||
|
|
|
|
|
|
|
|
|
|||||||||
| TOTAL INVESTMENTS |
$ | 46,024,561 | $ | 2,037 | $ | — | $ | 46,026,598 | ||||||||
|
|
|
|
|
|
|
|
|
|||||||||
Affiliate Table
| Number of Shares Held at 9/30/16 |
Value at 9/30/16 |
Cost of Purchases |
Proceeds from Shares Sold |
Realized Gain (Loss) |
Change in Unrealized Appreciation/ Depreciation |
Number of Shares Held at 9/30/17 |
Value at 9/30/17 |
Dividend Income |
||||||||||||||||||||||||||||
| State Street Institutional U.S. Government Money Market Fund, Class G Shares |
— | $ | — | $ | 1,401,403 | $ | 1,325,857 | $ | — | $ | — | 75,546 | $ | 75,546 | $ | 228 | ||||||||||||||||||||
| State Street Institutional U.S. Government Money Market Fund, Premier Class |
— | — | 267,924 | 267,924 | — | — | — | — | 42 | |||||||||||||||||||||||||||
| State Street Navigator Securities Lending Government Money Market Portfolio* |
— | — | 2,147,548 | 1,904,592 | — | — | 242,956 | 242,956 | 1,224 | |||||||||||||||||||||||||||
|
|
|
|
|
|
|
|
|
|
|
|
|
|
|
|||||||||||||||||||||||
| TOTAL |
$ | — | $ | 3,816,875 | $ | 3,498,373 | $ | — | $ | — | $ | 318,502 | $ | 1,494 | ||||||||||||||||||||||
|
|
|
|
|
|
|
|
|
|
|
|
|
|
|
|||||||||||||||||||||||
| * | Effective October 5, 2016, the name of State Street Navigator Securities Lending Prime Portfolio was changed to State Street Navigator Securities Lending Government Money Market Portfolio. |
See accompanying notes to financial statements.
145
Table of Contents
SPDR MSCI Emerging Markets Fossil Fuel Reserves Free ETF
SCHEDULE OF INVESTMENTS
September 30, 2017
| Security Description |
Shares |
Value |
||||||
| COMMON STOCKS — 92.3% |
| |||||||
| BRAZIL — 7.2% |
| |||||||
| Ambev SA |
18,534 | $ | 123,281 | |||||
| B3 SA - Brasil Bolsa Balcao |
8,334 | 63,102 | ||||||
| Banco Bradesco SA Preference Shares |
14,673 | 162,588 | ||||||
| Banco do Brasil SA |
3,458 | 38,153 | ||||||
| BB Seguridade Participacoes SA |
2,965 | 26,837 | ||||||
| BRF SA (a) |
2,965 | 42,809 | ||||||
| CCR SA |
4,701 | 26,320 | ||||||
| Cia de Saneamento Basico do Estado de Sao Paulo |
2,470 | 25,987 | ||||||
| Cielo SA |
4,857 | 33,750 | ||||||
| Embraer SA |
4,939 | 27,934 | ||||||
| Equatorial Energia SA |
1,483 | 28,716 | ||||||
| Itau Unibanco Holding SA Preference Shares |
11,362 | 155,713 | ||||||
| Itausa - Investimentos Itau SA |
3 | 10 | ||||||
| Itausa - Investimentos Itau SA Preference Shares |
17,905 | 62,435 | ||||||
| Kroton Educacional SA |
5,927 | 37,569 | ||||||
| Lojas Americanas SA Preference Shares |
4,121 | 25,079 | ||||||
| Lojas Renner SA |
4,032 | 45,965 | ||||||
| Raia Drogasil SA |
988 | 23,426 | ||||||
| Telefonica Brasil SA Preference Shares |
2,470 | 39,410 | ||||||
| Ultrapar Participacoes SA |
1,483 | 35,308 | ||||||
| Vale SA |
12,552 | 126,466 | ||||||
| WEG SA |
4,446 | 30,079 | ||||||
|
|
|
|||||||
| 1,180,937 | ||||||||
|
|
|
|||||||
| CHILE — 1.1% |
| |||||||
| Banco Santander Chile |
576,644 | 42,937 | ||||||
| Cencosud SA |
8,087 | 24,757 | ||||||
| Empresas CMPC SA |
13,680 | 36,062 | ||||||
| Enel Americas SA |
148,006 | 30,348 | ||||||
| SACI Falabella |
4,866 | 47,522 | ||||||
|
|
|
|||||||
| 181,626 | ||||||||
|
|
|
|||||||
| CHINA — 29.3% |
| |||||||
| 58.com, Inc. ADR (a) |
550 | 34,727 | ||||||
| AAC Technologies Holdings, Inc. |
1,000 | 16,797 | ||||||
| Agricultural Bank of China, Ltd. Class H |
60,000 | 26,886 | ||||||
| Alibaba Group Holding, Ltd. ADR (a) (b) |
3,920 | 677,023 | ||||||
| Anhui Conch Cement Co., Ltd. Class H |
10,000 | 39,881 | ||||||
| Baidu, Inc. ADR (a) |
990 | 245,213 | ||||||
| Bank of China, Ltd. Class H |
260,000 | 128,158 | ||||||
| Bank of Communications Co., Ltd. Class H |
35,000 | 25,542 | ||||||
| Beijing Enterprises Holdings, Ltd. |
5,000 | 26,886 | ||||||
| Beijing Enterprises Water Group, Ltd. (a) |
40,000 | 32,212 | ||||||
| Brilliance China Automotive Holdings, Ltd. |
20,000 | 53,260 | ||||||
| Byd Co., Ltd. Class H (b) |
5,000 | 46,379 | ||||||
| CGN Power Co., Ltd. Class H (c) |
85,000 | 23,506 | ||||||
| China Cinda Asset Management Co., Ltd. Class H |
70,000 | 25,811 | ||||||
| China CITIC Bank Corp., Ltd. Class H |
40,000 | 25,401 | ||||||
| China Communications Construction Co., Ltd. Class H |
25,000 | 31,207 | ||||||
| China Conch Venture Holdings, Ltd. |
12,500 | 24,326 | ||||||
| China Construction Bank Corp. Class H |
285,000 | 236,445 | ||||||
| China Everbright International, Ltd. |
20,000 | 25,094 | ||||||
| China Evergrande Group (a) (b) |
13,000 | 45,354 | ||||||
| China Galaxy Securities Co., Ltd. Class H |
27,500 | 24,118 | ||||||
| China Life Insurance Co., Ltd. Class H |
25,000 | 74,417 | ||||||
| China Longyuan Power Group Corp., Ltd. Class H |
30,000 | 22,354 | ||||||
| China Mengniu Dairy Co., Ltd. (a) |
15,000 | 41,962 | ||||||
| China Merchants Bank Co., Ltd. Class H |
10,000 | 35,144 | ||||||
| China Merchants Port Holdings Co., Ltd. |
10,302 | 31,787 | ||||||
| China Minsheng Banking Corp., Ltd. Class H (b) |
22,500 | 20,626 | ||||||
| China Mobile, Ltd. |
22,500 | 228,005 | ||||||
| China Overseas Land & Investment, Ltd. |
10,000 | 32,520 | ||||||
| China Pacific Insurance Group Co., Ltd. Class H |
7,000 | 30,157 | ||||||
| China Railway Group, Ltd. Class H |
35,000 | 28,947 | ||||||
| China Resources Beer Holdings Co., Ltd. |
10,000 | 27,078 | ||||||
| China Resources Gas Group, Ltd. |
10,000 | 34,824 | ||||||
| China Resources Land, Ltd. |
10,000 | 30,599 | ||||||
| China Taiping Insurance Holdings Co., Ltd. |
12,000 | 32,110 | ||||||
| China Telecom Corp., Ltd. Class H |
50,000 | 25,606 | ||||||
| China Unicom Hong Kong, Ltd. (a) |
20,000 | 27,808 | ||||||
| China Vanke Co., Ltd. Class H |
10,000 | 32,904 | ||||||
| CITIC Securities Co., Ltd. Class H |
12,500 | 27,494 | ||||||
| CITIC, Ltd. |
15,000 | 22,162 | ||||||
| Country Garden Holdings Co., Ltd. |
45,000 | 71,556 | ||||||
| CRRC Corp., Ltd. Class H |
25,000 | 22,213 | ||||||
| CSPC Pharmaceutical Group, Ltd. |
20,000 | 33,493 | ||||||
| Ctrip.com International, Ltd. ADR (a) |
1,390 | 73,309 | ||||||
| Fosun International, Ltd. |
17,500 | 36,879 | ||||||
| Geely Automobile Holdings, Ltd. |
25,000 | 70,416 | ||||||
| Great Wall Motor Co., Ltd. Class H (b) |
22,500 | 27,654 | ||||||
| Guangdong Investment, Ltd. |
20,000 | 28,525 | ||||||
| Haitong Securities Co., Ltd. Class H |
14,000 | 22,620 | ||||||
| Hengan International Group Co., Ltd. |
2,500 | 23,141 | ||||||
| Huaneng Power International, Inc. Class H |
40,000 | 24,735 | ||||||
| Huatai Securities Co., Ltd. Class H (c) |
12,000 | 26,579 | ||||||
| Industrial & Commercial Bank of China, Ltd. Class H |
245,000 | 181,930 | ||||||
| JD.com, Inc. ADR (a) |
2,552 | 97,486 | ||||||
| Lenovo Group, Ltd. |
40,000 | 22,072 | ||||||
| NetEase, Inc. ADR |
280 | 73,867 | ||||||
| New China Life Insurance Co., Ltd. Class H |
5,500 | 31,089 | ||||||
| New Oriental Education & Technology Group, Inc. ADR |
530 | 46,778 | ||||||
| PICC Property & Casualty Co., Ltd. Class H |
20,000 | 35,285 | ||||||
| Ping An Insurance Group Co. of China, Ltd. Class H |
15,000 | 115,131 | ||||||
| Semiconductor Manufacturing International Corp. (a) (b) |
20,200 | 22,810 | ||||||
| Shenzhou International Group Holdings, Ltd. |
5,000 | 39,177 | ||||||
| Sinopharm Group Co., Ltd. Class H |
6,000 | 26,425 | ||||||
| TAL Education Group ADR |
2,070 | 69,780 | ||||||
| Tencent Holdings, Ltd. |
20,000 | 860,870 | ||||||
| Vipshop Holdings, Ltd. ADR (a) |
1,745 | 15,339 | ||||||
| Want Want China Holdings, Ltd. |
40,000 | 28,115 | ||||||
See accompanying notes to financial statements.
146
Table of Contents
SPDR MSCI Emerging Markets Fossil Fuel Reserves Free ETF
SCHEDULE OF INVESTMENTS (continued)
September 30, 2017
| Security Description |
Shares |
Value |
||||||
| Zhuzhou CRRC Times Electric Co., Ltd. Class H |
5,000 | $ | 28,006 | |||||
|
|
|
|||||||
| 4,776,010 | ||||||||
|
|
|
|||||||
| COLOMBIA — 0.6% |
| |||||||
| Bancolombia SA Preference Shares |
4,026 | 46,309 | ||||||
| Grupo Argos SA |
4,542 | 32,664 | ||||||
| Grupo de Inversiones Suramericana SA |
756 | 10,524 | ||||||
| Grupo de Inversiones Suramericana SA Preference Shares |
10 | 137 | ||||||
|
|
|
|||||||
| 89,634 | ||||||||
|
|
|
|||||||
| EGYPT — 0.2% |
| |||||||
| Commercial International Bank Egypt SAE |
5,221 | 24,144 | ||||||
|
|
|
|||||||
| GREECE — 0.2% |
| |||||||
| Piraeus Bank SA (a) |
8,434 | 28,915 | ||||||
|
|
|
|||||||
| HONG KONG — 0.3% |
| |||||||
| Sino Biopharmaceutical, Ltd. |
40,000 | 42,301 | ||||||
|
|
|
|||||||
| HUNGARY — 0.4% |
| |||||||
| OTP Bank PLC |
1,095 | 41,232 | ||||||
| Richter Gedeon Nyrt |
1,200 | 29,911 | ||||||
|
|
|
|||||||
| 71,143 | ||||||||
|
|
|
|||||||
| INDONESIA — 2.4% |
| |||||||
| Astra International Tbk PT |
79,000 | 46,336 | ||||||
| Bank Central Asia Tbk PT |
47,000 | 70,836 | ||||||
| Bank Mandiri Persero Tbk PT |
74,000 | 36,948 | ||||||
| Bank Negara Indonesia Persero Tbk PT |
59,500 | 32,690 | ||||||
| Bank Rakyat Indonesia Persero Tbk PT |
44,500 | 50,467 | ||||||
| Indofood Sukses Makmur Tbk PT |
37,000 | 23,144 | ||||||
| Kalbe Farma Tbk PT |
185,500 | 22,931 | ||||||
| Matahari Department Store Tbk PT |
17,500 | 12,051 | ||||||
| Telekomunikasi Indonesia Persero Tbk PT |
199,500 | 69,319 | ||||||
| Unilever Indonesia Tbk PT |
7,500 | 27,271 | ||||||
|
|
|
|||||||
| 391,993 | ||||||||
|
|
|
|||||||
| MALAYSIA — 2.5% |
| |||||||
| CIMB Group Holdings Bhd |
22,017 | 32,849 | ||||||
| DiGi.Com Bhd |
20,800 | 24,137 | ||||||
| Genting Bhd |
13,500 | 30,533 | ||||||
| Genting Malaysia Bhd |
22,200 | 28,286 | ||||||
| IHH Healthcare Bhd |
16,500 | 22,469 | ||||||
| IJM Corp. Bhd |
31,500 | 24,618 | ||||||
| IOI Corp. Bhd |
23,200 | 24,944 | ||||||
| Malayan Banking Bhd |
14,149 | 31,934 | ||||||
| Maxis Bhd |
17,500 | 24,038 | ||||||
| Petronas Chemicals Group Bhd |
15,500 | 26,760 | ||||||
| Petronas Gas Bhd |
5,000 | 21,196 | ||||||
| Public Bank Bhd |
8,500 | 41,146 | ||||||
| Sime Darby Bhd. |
14,155 | 30,238 | ||||||
| Tenaga Nasional Bhd |
12,500 | 42,392 | ||||||
|
|
|
|||||||
| 405,540 | ||||||||
|
|
|
|||||||
| MEXICO — 3.9% |
| |||||||
| Alfa SAB de CV Class A |
15,329 | 19,407 | ||||||
| America Movil SAB de CV Series L |
114,230 | 101,654 | ||||||
| Cemex SAB de CV Series CPO (a) |
52,973 | 48,279 | ||||||
| Coca-Cola Femsa SAB de CV Series L |
2,967 | 22,990 | ||||||
| Fibra Uno Administracion SA de CV REIT |
13,149 | 22,244 | ||||||
| Fomento Economico Mexicano SAB de CV |
6,427 | 61,597 | ||||||
| Grupo Aeroportuario del Pacifico SAB de CV Class B |
2,472 | 25,375 | ||||||
| Grupo Bimbo SAB de CV Series A |
8,902 | 21,555 | ||||||
| Grupo Financiero Banorte SAB de CV Series O |
7,912 | 54,715 | ||||||
| Grupo Financiero Inbursa SAB de CV Series O |
15,329 | 28,119 | ||||||
| Grupo Financiero Santander Mexico SAB de CV Class B |
13,845 | 28,187 | ||||||
| Grupo Mexico SAB de CV Series B |
15,329 | 47,010 | ||||||
| Grupo Televisa SAB Series CPO |
8,902 | 43,997 | ||||||
| Industrias Penoles SAB de CV |
1,065 | 26,527 | ||||||
| Kimberly-Clark de Mexico SAB de CV Class A |
10,879 | 22,196 | ||||||
| Promotora y Operadora de Infraestructura SAB de CV |
1,978 | 20,995 | ||||||
| Wal-Mart de Mexico SAB de CV |
15,439 | 35,453 | ||||||
|
|
|
|||||||
| 630,300 | ||||||||
|
|
|
|||||||
| PERU — 0.6% |
| |||||||
| Credicorp, Ltd. |
495 | 101,485 | ||||||
|
|
|
|||||||
| PHILIPPINES — 1.3% |
| |||||||
| Aboitiz Equity Ventures, Inc. |
15,870 | 22,899 | ||||||
| Ayala Corp. |
1,450 | 27,687 | ||||||
| Ayala Land, Inc. |
33,000 | 28,258 | ||||||
| BDO Unibank, Inc. |
12,045 | 30,990 | ||||||
| JG Summit Holdings, Inc. |
16,800 | 24,804 | ||||||
| SM Investments Corp. |
1,800 | 31,288 | ||||||
| SM Prime Holdings, Inc. |
46,000 | 31,195 | ||||||
| Universal Robina Corp. |
6,820 | 20,514 | ||||||
|
|
|
|||||||
| 217,635 | ||||||||
|
|
|
|||||||
| POLAND — 1.1% |
| |||||||
| Bank Pekao SA |
860 | 30,209 | ||||||
| KGHM Polska Miedz SA |
1,785 | 57,509 | ||||||
| Powszechna Kasa Oszczednosci Bank Polski SA (a) |
4,217 | 40,886 | ||||||
| Powszechny Zaklad Ubezpieczen SA |
3,822 | 48,248 | ||||||
|
|
|
|||||||
| 176,852 | ||||||||
|
|
|
|||||||
| QATAR — 0.6% |
| |||||||
| Ezdan Holding Group QSC |
4,232 | 12,205 | ||||||
| Industries Qatar QSC |
835 | 21,029 | ||||||
| Masraf Al Rayan QSC |
2,568 | 26,183 | ||||||
| Qatar Insurance Co. SAQ |
1,179 | 16,949 | ||||||
| Qatar National Bank QPSC |
799 | 26,774 | ||||||
|
|
|
|||||||
| 103,140 | ||||||||
|
|
|
|||||||
| RUSSIA — 1.5% |
| |||||||
| Magnit PJSC GDR |
1,070 | 43,817 | ||||||
| Mobile TeleSystems PJSC ADR |
3,462 | 36,143 | ||||||
| Sberbank of Russia PJSC ADR |
9,397 | 133,766 | ||||||
| VTB Bank PJSC GDR |
11,547 | 24,826 | ||||||
|
|
|
|||||||
| 238,552 | ||||||||
|
|
|
|||||||
| SOUTH AFRICA — 6.4% |
| |||||||
| AngloGold Ashanti, Ltd. |
1,680 | 15,839 | ||||||
| Aspen Pharmacare Holdings, Ltd. |
1,290 | 29,004 | ||||||
| Barclays Africa Group, Ltd. |
2,380 | 24,501 | ||||||
| Bid Corp., Ltd. |
1,410 | 31,735 | ||||||
| Bidvest Group, Ltd. |
2,140 | 27,365 | ||||||
See accompanying notes to financial statements.
147
Table of Contents
SPDR MSCI Emerging Markets Fossil Fuel Reserves Free ETF
SCHEDULE OF INVESTMENTS (continued)
September 30, 2017
| Security Description |
Shares |
Value |
||||||
| Discovery, Ltd. |
3,200 | $ | 33,335 | |||||
| FirstRand, Ltd. (b) |
11,290 | 43,504 | ||||||
| Fortress Income Fund, Ltd. |
11,127 | 31,933 | ||||||
| Gold Fields, Ltd. |
4,116 | 17,979 | ||||||
| Growthpoint Properties, Ltd. REIT |
14,719 | 26,489 | ||||||
| Life Healthcare Group Holdings, Ltd. |
11,037 | 19,372 | ||||||
| MTN Group, Ltd. |
6,047 | 55,703 | ||||||
| Naspers, Ltd. Class N |
1,513 | 327,196 | ||||||
| Nedbank Group, Ltd. |
1,640 | 24,614 | ||||||
| Novus Holdings, Ltd. |
523 | 253 | ||||||
| Redefine Properties, Ltd. REIT |
31,599 | 25,017 | ||||||
| Remgro, Ltd. |
1,810 | 27,526 | ||||||
| Sanlam, Ltd. |
5,562 | 27,871 | ||||||
| Sappi, Ltd. |
4,525 | 30,851 | ||||||
| Shoprite Holdings, Ltd. |
1,875 | 28,729 | ||||||
| SPAR Group, Ltd. |
1,815 | 22,459 | ||||||
| Standard Bank Group, Ltd. |
4,402 | 51,448 | ||||||
| Steinhoff International Holdings NV |
10,997 | 48,891 | ||||||
| Tiger Brands, Ltd. |
940 | 26,270 | ||||||
| Vodacom Group, Ltd. |
2,385 | 28,463 | ||||||
| Woolworths Holdings, Ltd. |
4,598 | 20,394 | ||||||
|
|
|
|||||||
| 1,046,741 | ||||||||
|
|
|
|||||||
| SOUTH KOREA — 16.3% |
| |||||||
| Amorepacific Corp. |
135 | 30,587 | ||||||
| AMOREPACIFIC Group |
180 | 19,409 | ||||||
| Celltrion, Inc. (a) |
325 | 40,293 | ||||||
| CJ CheilJedang Corp. |
80 | 24,761 | ||||||
| Coway Co., Ltd. |
295 | 24,211 | ||||||
| Dongbu Insurance Co., Ltd. |
395 | 25,176 | ||||||
| E-MART, Inc. |
170 | 30,947 | ||||||
| GS Holdings Corp. |
543 | 31,100 | ||||||
| Hana Financial Group, Inc. |
1,088 | 44,979 | ||||||
| Hankook Tire Co., Ltd. |
485 | 25,492 | ||||||
| Hyundai Engineering & Construction Co., Ltd. |
672 | 22,501 | ||||||
| Hyundai Glovis Co., Ltd. |
160 | 20,675 | ||||||
| Hyundai Heavy Industries Co., Ltd. (a) |
110 | 13,926 | ||||||
| Hyundai Mobis Co., Ltd. |
245 | 51,338 | ||||||
| Hyundai Motor Co. |
495 | 65,043 | ||||||
| Hyundai Motor Co. Preference Shares |
290 | 23,699 | ||||||
| Hyundai Robotics Co., Ltd. (a) |
12 | 4,463 | ||||||
| Hyundai Steel Co. |
568 | 26,185 | ||||||
| Industrial Bank of Korea |
2,273 | 28,578 | ||||||
| Kangwon Land, Inc. |
740 | 22,613 | ||||||
| KB Financial Group, Inc. |
1,433 | 70,189 | ||||||
| Kia Motors Corp. |
1,063 | 29,374 | ||||||
| Korea Aerospace Industries, Ltd. |
395 | 15,071 | ||||||
| Korea Electric Power Corp. |
938 | 31,940 | ||||||
| Korea Zinc Co., Ltd. |
65 | 28,120 | ||||||
| KT&G Corp. |
450 | 41,450 | ||||||
| LG Chem, Ltd. |
203 | 69,477 | ||||||
| LG Corp. |
450 | 31,667 | ||||||
| LG Display Co., Ltd. |
938 | 25,019 | ||||||
| LG Electronics, Inc. |
563 | 40,504 | ||||||
| LG Household & Health Care, Ltd. |
40 | 32,689 | ||||||
| Lotte Chemical Corp. |
90 | 29,703 | ||||||
| NAVER Corp. |
105 | 68,298 | ||||||
| NCSoft Corp. |
100 | 40,555 | ||||||
| POSCO |
280 | 77,496 | ||||||
| S-Oil Corp. |
345 | 38,405 | ||||||
| Samsung C&T Corp. |
275 | 32,414 | ||||||
| Samsung Electronics Co., Ltd. |
342 | 765,607 | ||||||
| Samsung Electronics Co., Ltd. Preference Shares |
84 | 151,227 | ||||||
| Samsung Fire & Marine Insurance Co., Ltd. |
115 | 28,114 | ||||||
| Samsung Life Insurance Co., Ltd. |
260 | 25,652 | ||||||
| Samsung SDI Co., Ltd. |
305 | 52,859 | ||||||
| Samsung SDS Co., Ltd. |
180 | 26,481 | ||||||
| Shinhan Financial Group Co., Ltd. |
1,533 | 67,324 | ||||||
| SK Holdings Co., Ltd. |
175 | 44,004 | ||||||
| SK Hynix, Inc. |
2,173 | 157,281 | ||||||
| SK Telecom Co., Ltd. |
125 | 27,830 | ||||||
| Woori Bank |
2,421 | 37,731 | ||||||
|
|
|
|||||||
| 2,662,457 | ||||||||
|
|
|
|||||||
| TAIWAN — 12.6% |
| |||||||
| Advanced Semiconductor Engineering, Inc. |
25,312 | 30,968 | ||||||
| Asustek Computer, Inc. |
5,000 | 41,139 | ||||||
| AU Optronics Corp. |
67,000 | 26,845 | ||||||
| Catcher Technology Co., Ltd. |
5,000 | 46,580 | ||||||
| Cathay Financial Holding Co., Ltd. |
24,000 | 38,148 | ||||||
| Chang Hwa Commercial Bank, Ltd. |
52,500 | 28,393 | ||||||
| Cheng Shin Rubber Industry Co., Ltd. |
10,000 | 20,017 | ||||||
| China Development Financial Holding Corp. |
100,000 | 30,009 | ||||||
| China Life Insurance Co., Ltd. |
23,980 | 22,577 | ||||||
| China Steel Corp. |
55,000 | 44,165 | ||||||
| Chunghwa Telecom Co., Ltd. |
9,000 | 31,015 | ||||||
| Compal Electronics, Inc. |
40,000 | 28,426 | ||||||
| CTBC Financial Holding Co., Ltd. |
55,000 | 34,461 | ||||||
| Delta Electronics, Inc. |
5,000 | 25,722 | ||||||
| E.Sun Financial Holding Co., Ltd. |
49,491 | 29,540 | ||||||
| Far EasTone Telecommunications Co., Ltd. |
10,000 | 23,777 | ||||||
| First Financial Holding Co., Ltd. |
51,000 | 32,712 | ||||||
| Formosa Chemicals & Fibre Corp. |
10,000 | 30,405 | ||||||
| Formosa Petrochemical Corp. |
10,000 | 34,461 | ||||||
| Formosa Plastics Corp. |
15,000 | 45,410 | ||||||
| Foxconn Technology Co., Ltd. |
10,000 | 28,855 | ||||||
| Fubon Financial Holding Co., Ltd. |
24,000 | 37,436 | ||||||
| Hon Hai Precision Industry Co., Ltd. |
55,000 | 190,443 | ||||||
| Hua Nan Financial Holdings Co., Ltd. |
52,500 | 28,480 | ||||||
| Lite-On Technology Corp. |
20,000 | 28,558 | ||||||
| MediaTek, Inc. |
4,000 | 37,528 | ||||||
| Mega Financial Holding Co., Ltd. |
35,000 | 27,355 | ||||||
| Nan Ya Plastics Corp. |
20,000 | 49,268 | ||||||
| Pegatron Corp. |
10,000 | 25,953 | ||||||
| President Chain Store Corp. |
5,000 | 42,128 | ||||||
| Quanta Computer, Inc. |
8,000 | 18,414 | ||||||
| Siliconware Precision Industries Co., Ltd. |
15,000 | 23,991 | ||||||
| SinoPac Financial Holdings Co., Ltd. |
87,975 | 26,343 | ||||||
| Taishin Financial Holding Co., Ltd. |
73,007 | 31,419 | ||||||
| Taiwan Cement Corp. |
20,000 | 22,293 | ||||||
| Taiwan Cooperative Financial Holding Co., Ltd. |
56,650 | 29,237 | ||||||
| Taiwan Mobile Co., Ltd. |
5,000 | 17,808 | ||||||
| Taiwan Semiconductor Manufacturing Co., Ltd. |
90,000 | 642,560 | ||||||
See accompanying notes to financial statements.
148
Table of Contents
SPDR MSCI Emerging Markets Fossil Fuel Reserves Free ETF
SCHEDULE OF INVESTMENTS (continued)
September 30, 2017
| Security Description |
Shares |
Value |
||||||
| Uni-President Enterprises Corp. |
20,000 | $ | 41,881 | |||||
| United Microelectronics Corp. |
70,000 | 34,972 | ||||||
| Yuanta Financial Holding Co., Ltd. |
70,000 | 30,125 | ||||||
|
|
|
|||||||
| 2,059,817 | ||||||||
|
|
|
|||||||
| THAILAND — 1.9% |
| |||||||
| Advanced Info Service PCL NVDR |
6,500 | 37,226 | ||||||
| Airports of Thailand PCL NVDR |
21,500 | 38,036 | ||||||
| Bangkok Dusit Medical Services PCL NVDR |
40,500 | 24,895 | ||||||
| CP ALL PCL NVDR |
20,500 | 41,031 | ||||||
| Kasikornbank PCL |
7,000 | 44,917 | ||||||
| Minor International PCL NVDR |
22,200 | 27,126 | ||||||
| PTT Global Chemical PCL NVDR |
15,000 | 34,633 | ||||||
| Siam Cement PCL |
2,000 | 30,105 | ||||||
| Siam Commercial Bank PCL NVDR |
7,500 | 34,408 | ||||||
|
|
|
|||||||
| 312,377 | ||||||||
|
|
|
|||||||
| TURKEY — 1.1% |
| |||||||
| Akbank TAS |
11,467 | 30,311 | ||||||
| BIM Birlesik Magazalar A/S |
1,543 | 32,217 | ||||||
| Haci Omer Sabanci Holding A/S |
8,155 | 22,979 | ||||||
| Turkcell Iletisim Hizmetleri A/S |
7,837 | 27,967 | ||||||
| Turkiye Garanti Bankasi A/S |
13,219 | 35,983 | ||||||
| Turkiye Is Bankasi Class C |
17,214 | 32,820 | ||||||
|
|
|
|||||||
| 182,277 | ||||||||
|
|
|
|||||||
| UNITED ARAB EMIRATES — 0.8% |
| |||||||
| Abu Dhabi Commercial Bank PJSC |
14,898 | 28,801 | ||||||
| Aldar Properties PJSC |
35,300 | 22,395 | ||||||
| DP World, Ltd. |
1,333 | 29,939 | ||||||
| Emaar Properties PJSC |
14,110 | 32,618 | ||||||
| Emirates Telecommunications Group Co. PJSC |
5,044 | 23,760 | ||||||
|
|
|
|||||||
| 137,513 | ||||||||
|
|
|
|||||||
| TOTAL COMMON STOCKS |
15,061,389 | |||||||
|
|
|
|||||||
| SHORT-TERM INVESTMENTS — 6.3% |
||||||||
| State Street Institutional U.S. Government Money Market Fund, Class G Shares 0.96% (d) (e) |
851,592 | 851,592 | ||||||
| State Street Navigator Securities Lending Government Money Market Portfolio (d) (f) |
172,291 | 172,291 | ||||||
|
|
|
|||||||
| TOTAL SHORT-TERM INVESTMENTS |
1,023,883 | |||||||
|
|
|
|||||||
| TOTAL INVESTMENTS — 98.6% |
16,085,272 | |||||||
| OTHER ASSETS IN EXCESS OF LIABILITIES — 1.4% |
232,841 | |||||||
|
|
|
|||||||
| NET ASSETS — 100.0% |
$ | 16,318,113 | ||||||
|
|
|
|||||||
| (a) | Non-income producing security. |
| (b) | All or a portion of the shares of the security are on loan at September 30, 2017. |
| (c) | Securities purchased pursuant to Rule 144A of the Securities Act of 1933, as amended. These securities, which represent 0.3% of net assets as of September 30, 2017, are considered liquid and may be resold in transactions exempt from registration, normally to qualified institutional buyers. |
| (d) | The Fund invested in certain money market funds managed by SSGA Funds Management, Inc. Amounts related to these transactions during the period ended September 30, 2017 are shown in the Affiliate Table below. |
| (e) | The rate shown is the annualized seven-day yield at September 30, 2017. |
| (f) | Investment of cash collateral for securities loaned. |
ADR = American Depositary Receipt
GDR = Global Depositary Receipt
NVDR = Non Voting Depositary Receipt
REIT = Real Estate Investment Trust
At September 30, 2017, open futures contracts purchased were as follows:
| Futures Contracts |
Expiration Date |
Number of Contracts |
Notional Amount |
Value | Unrealized Depreciation |
|||||||||||||||
| SGX Nifty 50 Index |
10/26/2017 | 64 | 1,271,077 | 1,254,784 | (16,138 | ) | ||||||||||||||
During the period ended September 30, 2017, average notional value related to futures contracts was $687,564 or 4% of net assets.
The following table summarizes the value of the Fund’s investments according to the fair value hierarchy as of September 30, 2017.
| Description |
Level 1 — Quoted Prices |
Level 2 — Other Significant Observable Inputs |
Level 3 — Significant Unobservable Inputs |
Total | ||||||||||||
| ASSETS: |
||||||||||||||||
| INVESTMENTS: |
||||||||||||||||
| Common Stocks |
||||||||||||||||
| Brazil |
$ | 1,180,937 | $ | — | $ | — | $ | 1,180,937 | ||||||||
| Chile |
181,626 | — | — | 181,626 | ||||||||||||
See accompanying notes to financial statements.
149
Table of Contents
SPDR MSCI Emerging Markets Fossil Fuel Reserves Free ETF
SCHEDULE OF INVESTMENTS (continued)
September 30, 2017
| Description |
Level 1 — Quoted Prices |
Level 2 — Other Significant Observable Inputs |
Level 3 — Significant Unobservable Inputs |
Total | ||||||||||||
| China |
$ | 4,776,010 | $ | — | $ | — | $ | 4,776,010 | ||||||||
| Colombia |
89,634 | — | — | 89,634 | ||||||||||||
| Egypt |
24,144 | — | — | 24,144 | ||||||||||||
| Greece |
28,915 | — | — | 28,915 | ||||||||||||
| Hong Kong |
42,301 | — | — | 42,301 | ||||||||||||
| Hungary |
71,143 | — | — | 71,143 | ||||||||||||
| Indonesia |
391,993 | — | — | 391,993 | ||||||||||||
| Malaysia |
405,540 | — | — | 405,540 | ||||||||||||
| Mexico |
630,300 | — | — | 630,300 | ||||||||||||
| Peru |
101,485 | — | — | 101,485 | ||||||||||||
| Philippines |
217,635 | — | — | 217,635 | ||||||||||||
| Poland |
176,852 | — | — | 176,852 | ||||||||||||
| Qatar |
103,140 | — | — | 103,140 | ||||||||||||
| Russia |
238,552 | — | — | 238,552 | ||||||||||||
| South Africa |
1,046,741 | — | — | 1,046,741 | ||||||||||||
| South Korea |
2,662,457 | — | — | 2,662,457 | ||||||||||||
| Taiwan |
2,059,817 | — | — | 2,059,817 | ||||||||||||
| Thailand |
312,377 | — | — | 312,377 | ||||||||||||
| Turkey |
182,277 | — | — | 182,277 | ||||||||||||
| United Arab Emirates |
137,513 | — | — | 137,513 | ||||||||||||
| Short-Term Investments |
1,023,883 | — | — | 1,023,883 | ||||||||||||
|
|
|
|
|
|
|
|
|
|||||||||
| TOTAL INVESTMENTS |
$ | 16,085,272 | $ | — | $ | — | $ | 16,085,272 | ||||||||
|
|
|
|
|
|
|
|
|
|||||||||
| LIABILITIES: |
||||||||||||||||
| OTHER FINANCIAL INSTRUMENTS: |
||||||||||||||||
| Futures Contracts (a) |
(16,138 | ) | — | — | (16,138 | ) | ||||||||||
|
|
|
|
|
|
|
|
|
|||||||||
| TOTAL OTHER FINANCIAL INSTRUMENTS |
$ | (16,138 | ) | $ | — | $ | — | $ | (16,138 | ) | ||||||
|
|
|
|
|
|
|
|
|
|||||||||
| (a) | Futures Contracts are valued at unrealized appreciation (depreciation). |
Affiliate Table
| Number of Shares Held at 9/30/16 |
Value at 9/30/16 |
Cost of Purchases |
Proceeds from Shares Sold |
Realized Gain (Loss) |
Change in Unrealized Appreciation/ Depreciation |
Number of Shares Held at 9/30/17 |
Value at 9/30/17 |
Dividend Income |
||||||||||||||||||||||||||||
| State Street Institutional U.S. Government Money Market Fund, Class G Shares |
— | $ | — | $ | 2,994,532 | $ | 2,142,940 | $ | — | $ | — | 851,592 | $ | 851,592 | $ | 3,268 | ||||||||||||||||||||
| State Street Institutional U.S. Government Money Market Fund, Premier Class |
— | — | 440,070 | 440,070 | — | — | — | — | 867 | |||||||||||||||||||||||||||
| State Street Navigator Securities Lending Government Money Market Portfolio* |
— | — | 653,762 | 481,471 | — | — | 172,291 | 172,291 | 687 | |||||||||||||||||||||||||||
|
|
|
|
|
|
|
|
|
|
|
|
|
|
|
|||||||||||||||||||||||
| TOTAL |
$ | — | $ | 4,088,364 | $ | 3,064,481 | $ | — | $ | — | $ | 1,023,883 | $ | 4,822 | ||||||||||||||||||||||
|
|
|
|
|
|
|
|
|
|
|
|
|
|
|
|||||||||||||||||||||||
| * | Effective October 5, 2016, the name of State Street Navigator Securities Lending Prime Portfolio was changed to State Street Navigator Securities Lending Government Money Market Portfolio. |
See accompanying notes to financial statements.
150
Table of Contents
SPDR MSCI EAFE StrategicFactors ETF
SCHEDULE OF INVESTMENTS
September 30, 2017
| Security Description |
Shares |
Value |
||||||
| COMMON STOCKS — 99.3% |
||||||||
| AUSTRALIA — 4.6% |
||||||||
| AGL Energy, Ltd. |
22,128 | $ | 405,767 | |||||
| Amcor, Ltd. |
8,986 | 107,244 | ||||||
| Aristocrat Leisure, Ltd. |
6,547 | 107,879 | ||||||
| ASX, Ltd. |
3,604 | 148,266 | ||||||
| Australia & New Zealand Banking Group, Ltd. |
17,310 | 402,036 | ||||||
| BHP Billiton PLC |
11,808 | 208,246 | ||||||
| BHP Billiton, Ltd. |
12,848 | 259,893 | ||||||
| Brambles, Ltd. |
25,273 | 178,474 | ||||||
| Cochlear, Ltd. |
1,352 | 168,897 | ||||||
| Commonwealth Bank of Australia |
11,256 | 664,609 | ||||||
| CSL, Ltd. |
10,476 | 1,101,150 | ||||||
| GPT Group REIT |
31,769 | 123,641 | ||||||
| Insurance Australia Group, Ltd. |
19,710 | 98,515 | ||||||
| LendLease Group |
8,438 | 118,646 | ||||||
| Macquarie Group, Ltd. |
1,462 | 104,300 | ||||||
| Medibank Pvt, Ltd. |
43,566 | 99,817 | ||||||
| National Australia Bank, Ltd. |
14,068 | 347,711 | ||||||
| Newcrest Mining, Ltd. |
5,983 | 98,680 | ||||||
| QBE Insurance Group, Ltd. |
9,975 | 78,347 | ||||||
| Ramsay Health Care, Ltd. |
1,647 | 80,486 | ||||||
| REA Group, Ltd. |
1,889 | 99,308 | ||||||
| Scentre Group REIT |
76,180 | 234,914 | ||||||
| SEEK, Ltd. |
7,403 | 96,483 | ||||||
| Sonic Healthcare, Ltd. |
18,066 | 296,409 | ||||||
| Stockland REIT |
37,689 | 127,162 | ||||||
| Suncorp Group, Ltd. |
9,537 | 97,656 | ||||||
| Telstra Corp., Ltd. |
212,138 | 580,925 | ||||||
| Transurban Group Stapled Security |
33,531 | 312,564 | ||||||
| Vicinity Centres REIT |
105,381 | 219,948 | ||||||
| Wesfarmers, Ltd. |
18,470 | 598,974 | ||||||
| Westfield Corp. REIT |
46,161 | 283,966 | ||||||
| Westpac Banking Corp. |
17,136 | 429,189 | ||||||
| Woodside Petroleum, Ltd. |
5,248 | 119,829 | ||||||
| Woolworths, Ltd. |
23,411 | 463,093 | ||||||
|
|
|
|||||||
| 8,863,024 | ||||||||
|
|
|
|||||||
| AUSTRIA — 0.1% |
||||||||
| OMV AG |
2,445 | 142,472 | ||||||
|
|
|
|||||||
| BELGIUM — 1.0% |
||||||||
| Ageas |
1,833 | 86,159 | ||||||
| Anheuser-Busch InBev SA |
3,053 | 365,618 | ||||||
| Colruyt SA |
7,273 | 372,600 | ||||||
| Groupe Bruxelles Lambert SA |
1,035 | 108,898 | ||||||
| KBC Group NV |
1,342 | 113,753 | ||||||
| Proximus SADP |
13,758 | 474,197 | ||||||
| Solvay SA |
852 | 127,314 | ||||||
| UCB SA |
2,931 | 208,699 | ||||||
|
|
|
|||||||
| 1,857,238 | ||||||||
|
|
|
|||||||
| DENMARK — 3.9% |
||||||||
| AP Moeller - Maersk A/S Class B |
62 | 117,799 | ||||||
| Carlsberg A/S Class B |
913 | 99,933 | ||||||
| Chr Hansen Holding A/S |
6,108 | 523,975 | ||||||
| Coloplast A/S Class B |
6,296 | 511,097 | ||||||
| Danske Bank A/S |
23,193 | 927,750 | ||||||
| DONG Energy A/S (a) |
8,595 | 492,095 | ||||||
| DSV A/S |
8,743 | 661,545 | ||||||
| Genmab A/S (b) |
694 | 153,247 | ||||||
| H Lundbeck A/S |
4,247 | 245,113 | ||||||
| ISS A/S |
7,524 | 302,643 | ||||||
| Novo Nordisk A/S Class B |
45,334 | 2,167,747 | ||||||
| Novozymes A/S Class B |
4,771 | 244,886 | ||||||
| Pandora A/S |
2,203 | 217,507 | ||||||
| TDC A/S |
25,455 | 149,176 | ||||||
| Tryg A/S |
11,440 | 264,246 | ||||||
| Vestas Wind Systems A/S |
418 | 37,518 | ||||||
| William Demant Holding A/S (b) |
13,885 | 366,602 | ||||||
|
|
|
|||||||
| 7,482,879 | ||||||||
|
|
|
|||||||
| FINLAND — 1.2% |
||||||||
| Elisa Oyj |
7,707 | 331,830 | ||||||
| Fortum Oyj |
5,562 | 111,058 | ||||||
| Kone Oyj Class B |
7,220 | 382,389 | ||||||
| Neste Oyj |
2,015 | 88,020 | ||||||
| Nokia Oyj |
11,770 | 70,686 | ||||||
| Nokian Renkaat Oyj |
2,196 | 97,692 | ||||||
| Orion Oyj Class B |
5,681 | 263,673 | ||||||
| Sampo Oyj Class A |
14,790 | 781,917 | ||||||
| UPM-Kymmene Oyj |
3,125 | 84,712 | ||||||
| Wartsila Oyj Abp |
2,810 | 198,987 | ||||||
|
|
|
|||||||
| 2,410,964 | ||||||||
|
|
|
|||||||
| FRANCE — 7.5% |
||||||||
| Aeroports de Paris |
2,569 | 415,471 | ||||||
| Air Liquide SA |
5,166 | 689,202 | ||||||
| Airbus SE |
3,866 | 367,504 | ||||||
| Atos SE |
793 | 123,045 | ||||||
| AXA SA |
15,165 | 458,779 | ||||||
| BNP Paribas SA |
10,095 | 814,516 | ||||||
| Bureau Veritas SA |
4,586 | 118,380 | ||||||
| Capgemini SE |
913 | 107,028 | ||||||
| Carrefour SA |
3,836 | 77,524 | ||||||
| Casino Guichard Perrachon SA |
1,582 | 93,849 | ||||||
| Cie de Saint-Gobain |
3,176 | 189,310 | ||||||
| Cie Generale des Etablissements Michelin |
3,054 | 445,889 | ||||||
| Credit Agricole SA |
17,552 | 319,134 | ||||||
| Danone SA |
4,654 | 365,165 | ||||||
| Dassault Systemes SE |
4,854 | 491,149 | ||||||
| Engie SA |
11,746 | 199,543 | ||||||
| Essilor International SA |
3,483 | 431,319 | ||||||
| Eutelsat Communications SA |
3,280 | 97,173 | ||||||
| Hermes International |
671 | 338,363 | ||||||
| Iliad SA |
488 | 129,719 | ||||||
| Kering |
428 | 170,541 | ||||||
| L’Oreal SA |
6,101 | 1,297,546 | ||||||
| Legrand SA |
4,034 | 291,290 | ||||||
| LVMH Moet Hennessy Louis Vuitton SE |
4,461 | 1,231,167 | ||||||
| Orange SA |
9,912 | 162,411 | ||||||
| Pernod Ricard SA |
669 | 92,574 | ||||||
| Peugeot SA |
2,000 | 47,643 | ||||||
| Publicis Groupe SA |
2,374 | 165,839 | ||||||
| Renault SA |
1,464 | 143,842 | ||||||
| Safran SA |
1,218 | 124,467 | ||||||
| Sanofi |
5,803 | 576,334 | ||||||
| Schneider Electric SE (b) |
2,325 | 202,380 | ||||||
| SCOR SE |
11,012 | 461,827 | ||||||
| SEB SA |
733 | 134,489 | ||||||
See accompanying notes to financial statements.
151
Table of Contents
SPDR MSCI EAFE StrategicFactors ETF
SCHEDULE OF INVESTMENTS (continued)
September 30, 2017
| Security Description |
Shares |
Value |
||||||
| Societe BIC SA |
550 | $ | 65,931 | |||||
| Societe Generale SA |
8,801 | 515,389 | ||||||
| Sodexo SA |
2,933 | 365,810 | ||||||
| Thales SA |
4,465 | 505,577 | ||||||
| TOTAL SA |
15,923 | 855,464 | ||||||
| Unibail-Rodamco SE REIT |
366 | 89,025 | ||||||
| Valeo SA |
4,158 | 308,600 | ||||||
| Vinci SA |
2,264 | 215,191 | ||||||
| Vivendi SA |
6,622 | 167,687 | ||||||
|
|
|
|||||||
| 14,463,086 | ||||||||
|
|
|
|||||||
| GERMANY — 8.8% |
||||||||
| adidas AG |
3,053 | 690,811 | ||||||
| Allianz SE |
2,447 | 549,495 | ||||||
| BASF SE |
15,165 | 1,614,242 | ||||||
| Bayer AG |
14,214 | 1,937,476 | ||||||
| Bayerische Motoren Werke AG |
2,142 | 217,345 | ||||||
| Beiersdorf AG |
4,972 | 535,065 | ||||||
| CECONOMY AG |
4,582 | 53,968 | ||||||
| Commerzbank AG (b) |
18,653 | 253,814 | ||||||
| Continental AG |
2,196 | 557,515 | ||||||
| Covestro AG (a) |
1,157 | 99,508 | ||||||
| Daimler AG |
8,315 | 663,229 | ||||||
| Deutsche Bank AG |
18,665 | 322,822 | ||||||
| Deutsche Boerse AG |
1,622 | 175,856 | ||||||
| Deutsche Lufthansa AG |
5,014 | 139,357 | ||||||
| Deutsche Post AG |
16,883 | 751,758 | ||||||
| Deutsche Telekom AG |
13,515 | 252,204 | ||||||
| E.ON SE |
20,042 | 226,890 | ||||||
| Fresenius Medical Care AG & Co. KGaA |
5,013 | 490,525 | ||||||
| Fresenius SE & Co. KGaA |
3,610 | 291,273 | ||||||
| Fuchs Petrolub SE Preference Shares |
1,647 | 97,529 | ||||||
| GEA Group AG |
2,506 | 114,030 | ||||||
| Hannover Rueck SE |
1,096 | 132,096 | ||||||
| HeidelbergCement AG |
915 | 94,077 | ||||||
| Henkel AG & Co. KGaA |
4,158 | 506,060 | ||||||
| Henkel AG & Co. KGaA Preference Shares |
2,671 | 363,604 | ||||||
| HUGO BOSS AG |
1,525 | 134,475 | ||||||
| Infineon Technologies AG |
6,296 | 158,315 | ||||||
| Innogy SE (a) |
3,400 | 151,353 | ||||||
| Linde AG |
736 | 153,529 | ||||||
| MAN SE |
3,175 | 358,420 | ||||||
| Merck KGaA |
1,955 | 217,530 | ||||||
| METRO AG (b) |
3,950 | 83,517 | ||||||
| Muenchener Rueckversicherungs-Gesellschaft AG in Muenchen |
2,748 | 587,687 | ||||||
| Porsche Automobil Holding SE Preference Shares |
3,730 | 238,560 | ||||||
| ProSiebenSat.1 Media SE |
3,298 | 112,425 | ||||||
| RWE AG (b) |
9,772 | 222,038 | ||||||
| SAP SE |
17,130 | 1,877,072 | ||||||
| Siemens AG |
3,175 | 447,415 | ||||||
| ThyssenKrupp AG |
4,828 | 143,120 | ||||||
| TUI AG |
19,655 | 333,846 | ||||||
| United Internet AG |
1,878 | 116,936 | ||||||
| Volkswagen AG Preference Shares |
3,419 | 557,788 | ||||||
|
|
|
|||||||
| 17,024,575 | ||||||||
|
|
|
|||||||
| HONG KONG — 5.0% |
||||||||
| AIA Group, Ltd. |
183,223 | 1,351,178 | ||||||
| Bank of East Asia, Ltd. |
24,405 | 105,454 | ||||||
| BOC Hong Kong Holdings, Ltd. |
30,536 | 148,366 | ||||||
| CK Asset Holdings, Ltd. |
28,620 | 236,891 | ||||||
| CK Hutchison Holdings, Ltd. |
28,500 | 364,337 | ||||||
| CK Infrastructure Holdings, Ltd. |
61,000 | 524,818 | ||||||
| CLP Holdings, Ltd. |
91,000 | 932,637 | ||||||
| Hang Seng Bank, Ltd. |
48,829 | 1,190,296 | ||||||
| HK Electric Investments & HK Electric Investments, Ltd. (a) (d) |
273,540 | 249,351 | ||||||
| HKT Trust & HKT, Ltd. |
305,540 | 371,231 | ||||||
| Hong Kong & China Gas Co., Ltd. |
227,066 | 426,764 | ||||||
| Hong Kong Exchanges & Clearing, Ltd. |
24,797 | 666,697 | ||||||
| Jardine Matheson Holdings, Ltd. |
1,800 | 114,048 | ||||||
| Li & Fung, Ltd. |
222,000 | 111,416 | ||||||
| Link REIT |
30,500 | 247,180 | ||||||
| MTR Corp., Ltd. |
122,167 | 713,229 | ||||||
| New World Development Co., Ltd. |
123,615 | 177,572 | ||||||
| PCCW, Ltd. |
305,000 | 165,177 | ||||||
| Power Assets Holdings, Ltd. |
61,000 | 528,333 | ||||||
| Sands China, Ltd. |
48,800 | 253,975 | ||||||
| Swire Pacific, Ltd. Class A |
28,500 | 276,582 | ||||||
| Techtronic Industries Co., Ltd. |
30,500 | 162,834 | ||||||
| WH Group, Ltd. (a) |
120,500 | 128,049 | ||||||
| Yue Yuen Industrial Holdings, Ltd. |
61,500 | 233,852 | ||||||
|
|
|
|||||||
| 9,680,267 | ||||||||
|
|
|
|||||||
| IRELAND — 0.9% |
||||||||
| Bank of Ireland Group PLC (b) |
3,496 | 28,641 | ||||||
| CRH PLC |
3,114 | 118,816 | ||||||
| Experian PLC |
15,354 | 308,789 | ||||||
| Kerry Group PLC Class A |
7,888 | 758,045 | ||||||
| Paddy Power Betfair PLC |
992 | 99,003 | ||||||
| Ryanair Holdings PLC ADR (b) |
3,759 | 396,274 | ||||||
|
|
|
|||||||
| 1,709,568 | ||||||||
|
|
|
|||||||
| ISRAEL — 1.1% |
||||||||
| Azrieli Group, Ltd. |
4,812 | 267,258 | ||||||
| Bank Hapoalim BM |
85,101 | 595,750 | ||||||
| Bank Leumi Le-Israel BM |
73,543 | 390,344 | ||||||
| Bezeq The Israeli Telecommunication Corp., Ltd. |
85,453 | 122,183 | ||||||
| Check Point Software Technologies, Ltd. (b) |
3,206 | 365,548 | ||||||
| Mizrahi Tefahot Bank, Ltd. |
14,861 | 266,418 | ||||||
| Teva Pharmaceutical Industries, Ltd. |
4,224 | 73,848 | ||||||
|
|
|
|||||||
| 2,081,349 | ||||||||
|
|
|
|||||||
| ITALY — 0.9% |
||||||||
| Assicurazioni Generali SpA |
12,539 | 233,620 | ||||||
| Enel SpA |
65,100 | 392,117 | ||||||
| Eni SpA |
12,330 | 204,071 | ||||||
| Ferrari NV |
889 | 98,266 | ||||||
| Intesa Sanpaolo SpA |
76,968 | 272,247 | ||||||
| Luxottica Group SpA |
2,257 | 126,180 | ||||||
| Snam SpA |
32,364 | 155,951 | ||||||
| Telecom Italia SpA/Milano Savings Shares |
133,197 | 100,148 | ||||||
See accompanying notes to financial statements.
152
Table of Contents
SPDR MSCI EAFE StrategicFactors ETF
SCHEDULE OF INVESTMENTS (continued)
September 30, 2017
| Security Description |
Shares |
Value |
||||||
| UniCredit SpA (b) |
10,809 | $ | 230,267 | |||||
|
|
|
|||||||
| 1,812,867 | ||||||||
|
|
|
|||||||
| JAPAN — 23.2% |
||||||||
| ABC-Mart, Inc. |
4,600 | 242,740 | ||||||
| Aeon Co., Ltd. (d) |
6,100 | 90,092 | ||||||
| Ajinomoto Co., Inc. |
6,200 | 120,954 | ||||||
| ANA Holdings, Inc. |
11,800 | 446,464 | ||||||
| Aozora Bank, Ltd. |
4,600 | 174,903 | ||||||
| Asahi Group Holdings, Ltd. |
6,100 | 246,894 | ||||||
| Astellas Pharma, Inc. |
67,000 | 852,045 | ||||||
| Benesse Holdings, Inc. |
6,100 | 220,015 | ||||||
| Bridgestone Corp. |
17,800 | 807,416 | ||||||
| Canon, Inc. |
30,500 | 1,041,820 | ||||||
| Chubu Electric Power Co., Inc. |
6,100 | 75,705 | ||||||
| Concordia Financial Group, Ltd. |
11,500 | 56,813 | ||||||
| Dai-ichi Life Holdings, Inc. |
11,608 | 208,205 | ||||||
| Daicel Corp. |
5,300 | 63,846 | ||||||
| Daiichi Sankyo Co., Ltd. |
12,106 | 272,954 | ||||||
| Daito Trust Construction Co., Ltd. |
1,400 | 254,964 | ||||||
| Denso Corp. |
5,100 | 257,934 | ||||||
| Disco Corp. |
500 | 101,675 | ||||||
| East Japan Railway Co. |
6,100 | 562,773 | ||||||
| Eisai Co., Ltd. |
5,100 | 261,694 | ||||||
| FamilyMart UNY Holdings Co., Ltd. |
5,700 | 300,280 | ||||||
| Fujitsu, Ltd. |
13,000 | 96,537 | ||||||
| Hitachi, Ltd. |
55,000 | 387,416 | ||||||
| Honda Motor Co., Ltd. |
13,500 | 399,609 | ||||||
| Hoshizaki Corp. |
400 | 35,144 | ||||||
| Hoya Corp. |
6,200 | 334,607 | ||||||
| Inpex Corp. |
5,900 | 62,661 | ||||||
| Isuzu Motors, Ltd. |
7,900 | 104,641 | ||||||
| ITOCHU Corp. |
16,814 | 275,292 | ||||||
| Japan Airlines Co., Ltd. |
12,200 | 412,718 | ||||||
| Japan Exchange Group, Inc. |
12,206 | 215,894 | ||||||
| Japan Post Bank Co., Ltd. |
11,900 | 146,946 | ||||||
| Japan Prime Realty Investment Corp. REIT |
61 | 203,758 | ||||||
| Japan Real Estate Investment Corp. REIT |
56 | 269,142 | ||||||
| Japan Retail Fund Investment Corp. REIT |
183 | 328,234 | ||||||
| Japan Tobacco, Inc. |
20,300 | 665,095 | ||||||
| JFE Holdings, Inc. |
7,600 | 148,368 | ||||||
| JXTG Holdings, Inc. |
41,582 | 213,848 | ||||||
| Kajima Corp. |
57,000 | 566,126 | ||||||
| Kakaku.com, Inc. |
6,100 | 77,710 | ||||||
| Kansai Electric Power Co., Inc. |
6,500 | 83,123 | ||||||
| Kao Corp. |
12,200 | 717,488 | ||||||
| KDDI Corp. |
42,518 | 1,120,694 | ||||||
| Keikyu Corp. |
23,500 | 476,200 | ||||||
| Keyence Corp. |
1,500 | 796,207 | ||||||
| Kirin Holdings Co., Ltd. |
19,200 | 451,664 | ||||||
| Kobe Steel, Ltd. |
3,700 | 42,271 | ||||||
| Koito Manufacturing Co., Ltd. |
1,200 | 75,263 | ||||||
| Komatsu, Ltd. |
6,100 | 173,465 | ||||||
| Konami Holdings Corp. |
2,500 | 120,153 | ||||||
| Kubota Corp. |
6,100 | 110,848 | ||||||
| Kyowa Hakko Kirin Co., Ltd. |
6,100 | 103,721 | ||||||
| Kyushu Financial Group, Inc. |
6,900 | 42,418 | ||||||
| Kyushu Railway Co. |
10,919 | 324,471 | ||||||
| Lawson, Inc. (d) |
4,400 | 291,210 | ||||||
| LINE Corp. (b) (d) |
900 | 32,501 | ||||||
| LIXIL Group Corp. |
1,500 | 39,790 | ||||||
| M3, Inc. |
5,700 | 162,293 | ||||||
| Marubeni Corp. |
42,500 | 290,155 | ||||||
| Mazda Motor Corp. |
6,100 | 93,479 | ||||||
| McDonald’s Holdings Co., Japan, Ltd. |
6,100 | 269,871 | ||||||
| MEIJI Holdings Co., Ltd. |
5,100 | 404,140 | ||||||
| Miraca Holdings, Inc. |
4,600 | 213,725 | ||||||
| MISUMI Group, Inc. |
4,400 | 115,819 | ||||||
| Mitsubishi Chemical Holdings Corp. |
18,300 | 174,278 | ||||||
| Mitsubishi Corp. |
12,700 | 295,090 | ||||||
| Mitsubishi Electric Corp. |
6,200 | 96,829 | ||||||
| Mitsubishi Heavy Industries, Ltd. |
4,300 | 169,952 | ||||||
| Mitsubishi Tanabe Pharma Corp. |
18,413 | 422,028 | ||||||
| Mitsubishi UFJ Financial Group, Inc. |
133,900 | 869,193 | ||||||
| Mitsui & Co., Ltd. |
18,600 | 274,791 | ||||||
| Mitsui OSK Lines, Ltd. |
1,300 | 39,382 | ||||||
| Mizuho Financial Group, Inc. |
458,700 | 803,178 | ||||||
| MS&AD Insurance Group Holdings, Inc. |
6,100 | 196,334 | ||||||
| Murata Manufacturing Co., Ltd. |
4,900 | 719,993 | ||||||
| Nabtesco Corp. |
1,500 | 55,701 | ||||||
| Nagoya Railroad Co., Ltd. |
11,600 | 249,694 | ||||||
| NH Foods, Ltd. |
7,000 | 192,467 | ||||||
| Nippon Building Fund, Inc. REIT |
11 | 54,822 | ||||||
| Nippon Paint Holdings Co., Ltd. |
900 | 30,582 | ||||||
| Nippon Prologis REIT, Inc. |
123 | 259,080 | ||||||
| Nippon Steel & Sumitomo Metal Corp. |
8,300 | 190,495 | ||||||
| Nippon Telegraph & Telephone Corp. |
24,400 | 1,117,850 | ||||||
| Nippon Yusen KK (b) |
3,600 | 74,805 | ||||||
| Nissan Motor Co., Ltd. |
18,316 | 181,346 | ||||||
| Nissin Foods Holdings Co., Ltd. |
6,100 | 370,666 | ||||||
| Nitori Holdings Co., Ltd. |
3,800 | 543,171 | ||||||
| Nitto Denko Corp. |
4,800 | 400,068 | ||||||
| Nomura Holdings, Inc. |
25,200 | 141,038 | ||||||
| Nomura Real Estate Master Fund, Inc. |
304 | 395,107 | ||||||
| Nomura Research Institute, Ltd. |
6,300 | 245,698 | ||||||
| NTT DOCOMO, Inc. |
49,122 | 1,121,735 | ||||||
| Obayashi Corp. |
13,100 | 156,993 | ||||||
| Oracle Corp. Japan |
5,900 | 463,341 | ||||||
| Oriental Land Co., Ltd. |
6,100 | 464,633 | ||||||
| ORIX Corp. |
10,800 | 174,091 | ||||||
| Osaka Gas Co., Ltd. |
11,800 | 219,301 | ||||||
| Otsuka Corp. |
5,400 | 345,880 | ||||||
| Otsuka Holdings Co., Ltd. |
18,100 | 718,919 | ||||||
| Panasonic Corp. |
13,100 | 189,753 | ||||||
| Park24 Co., Ltd. (d) |
6,100 | 148,483 | ||||||
| Recruit Holdings Co., Ltd. |
48,005 | 1,039,294 | ||||||
| Resona Holdings, Inc. |
31,000 | 159,179 | ||||||
| Ricoh Co., Ltd. |
6,800 | 66,088 | ||||||
| Ryohin Keikaku Co., Ltd. |
500 | 147,248 | ||||||
| Sankyo Co., Ltd. |
6,100 | 194,545 | ||||||
| Santen Pharmaceutical Co., Ltd. |
12,200 | 192,161 | ||||||
| Secom Co., Ltd. |
6,100 | 444,474 | ||||||
| Sekisui House, Ltd. |
6,100 | 102,773 | ||||||
| Seven & i Holdings Co., Ltd. |
6,000 | 231,600 | ||||||
| Shimamura Co., Ltd. |
600 | 71,958 | ||||||
| Shimano, Inc. |
600 | 79,900 | ||||||
| Shin-Etsu Chemical Co., Ltd. |
300 | 26,811 | ||||||
See accompanying notes to financial statements.
153
Table of Contents
SPDR MSCI EAFE StrategicFactors ETF
SCHEDULE OF INVESTMENTS (continued)
September 30, 2017
| Security Description |
Shares |
Value |
||||||
| Shionogi & Co., Ltd. |
5,500 | $ | 300,542 | |||||
| SMC Corp. |
600 | 211,558 | ||||||
| SoftBank Group Corp. |
5,700 | 459,990 | ||||||
| Sompo Holdings, Inc. |
1,900 | 73,897 | ||||||
| Sony Corp. |
6,100 | 226,843 | ||||||
| Start Today Co., Ltd. |
4,700 | 148,852 | ||||||
| Subaru Corp. |
12,300 | 443,637 | ||||||
| Sumitomo Corp. |
12,312 | 177,026 | ||||||
| Sumitomo Electric Industries, Ltd. |
6,200 | 101,236 | ||||||
| Sumitomo Mitsui Financial Group, Inc. |
17,200 | 660,099 | ||||||
| Sumitomo Mitsui Trust Holdings, Inc. |
4,800 | 173,169 | ||||||
| Suntory Beverage & Food, Ltd. |
11,987 | 533,513 | ||||||
| Suzuken Co., Ltd. |
1,100 | 39,089 | ||||||
| Suzuki Motor Corp. |
1,100 | 57,675 | ||||||
| Sysmex Corp. |
5,100 | 325,305 | ||||||
| T&D Holdings, Inc. |
5,000 | 72,558 | ||||||
| Taisei Corp. |
4,600 | 241,105 | ||||||
| Taisho Pharmaceutical Holdings Co., Ltd. |
5,300 | 402,097 | ||||||
| Takeda Pharmaceutical Co., Ltd. |
17,100 | 943,983 | ||||||
| Terumo Corp. |
6,000 | 235,864 | ||||||
| Tobu Railway Co., Ltd. |
11,000 | 301,959 | ||||||
| Tohoku Electric Power Co., Inc. |
6,100 | 77,547 | ||||||
| Tokio Marine Holdings, Inc. |
5,900 | 230,727 | ||||||
| Tokyo Electric Power Co. Holdings, Inc. (b) |
47,800 | 192,788 | ||||||
| Tokyo Gas Co., Ltd. |
9,209 | 225,624 | ||||||
| Toray Industries, Inc. |
54,000 | 523,617 | ||||||
| Toshiba Corp. (b) |
27,000 | 75,556 | ||||||
| Toyo Suisan Kaisha, Ltd. |
12,100 | 444,485 | ||||||
| Toyota Motor Corp. |
23,200 | 1,382,952 | ||||||
| Toyota Tsusho Corp. |
5,200 | 170,692 | ||||||
| Trend Micro, Inc. |
1,500 | 73,824 | ||||||
| Tsuruha Holdings, Inc. |
600 | 71,692 | ||||||
| Unicharm Corp. |
5,706 | 130,579 | ||||||
| United Urban Investment Corp. REIT |
244 | 357,226 | ||||||
| USS Co., Ltd. |
12,200 | 246,027 | ||||||
| West Japan Railway Co. |
5,200 | 361,341 | ||||||
| Yahoo! Japan Corp. (d) |
24,400 | 115,752 | ||||||
| Yamada Denki Co., Ltd. |
36,600 | 199,964 | ||||||
| Yamaguchi Financial Group, Inc. |
4,000 | 46,800 | ||||||
| Yamato Holdings Co., Ltd. |
9,400 | 189,687 | ||||||
|
|
|
|||||||
| 44,724,576 | ||||||||
|
|
|
|||||||
| LUXEMBOURG — 0.3% |
||||||||
| ArcelorMittal (b) |
5,441 | 140,386 | ||||||
| RTL Group SA |
3,608 | 273,154 | ||||||
| SES SA |
7,408 | 162,106 | ||||||
|
|
|
|||||||
| 575,646 | ||||||||
|
|
|
|||||||
| MEXICO — 0.0% (e) |
||||||||
| Fresnillo PLC |
1,598 | 30,123 | ||||||
|
|
|
|||||||
| NETHERLANDS — 2.6% |
||||||||
| Aegon NV |
22,955 | 133,733 | ||||||
| Akzo Nobel NV |
1,358 | 125,416 | ||||||
| ASML Holding NV |
7,314 | 1,245,544 | ||||||
| Boskalis Westminster |
2,314 | 80,906 | ||||||
| EXOR NV |
2,203 | 139,725 | ||||||
| Heineken NV |
974 | 96,320 | ||||||
| ING Groep NV |
21,355 | 393,836 | ||||||
| Koninklijke Ahold Delhaize NV |
10,740 | 200,864 | ||||||
| Koninklijke DSM NV |
1,684 | 137,884 | ||||||
| Koninklijke KPN NV |
22,704 | 77,972 | ||||||
| Koninklijke Philips NV |
4,366 | 180,291 | ||||||
| NN Group NV |
9,057 | 379,141 | ||||||
| Randstad Holding NV |
1,574 | 97,393 | ||||||
| Royal Dutch Shell PLC Class A |
26,545 | 800,783 | ||||||
| Royal Dutch Shell PLC Class B |
24,331 | 749,009 | ||||||
| Wolters Kluwer NV |
2,506 | 115,822 | ||||||
|
|
|
|||||||
| 4,954,639 | ||||||||
|
|
|
|||||||
| NEW ZEALAND — 0.2% |
||||||||
| Auckland International Airport, Ltd. |
26,330 | 122,579 | ||||||
| Contact Energy, Ltd. |
9,217 | 36,646 | ||||||
| Meridian Energy, Ltd. |
47,172 | 97,016 | ||||||
| Ryman Healthcare, Ltd. |
14,313 | 95,916 | ||||||
| Spark New Zealand, Ltd. |
33,105 | 87,350 | ||||||
|
|
|
|||||||
| 439,507 | ||||||||
|
|
|
|||||||
| NORWAY — 0.4% |
||||||||
| DNB ASA |
8,498 | 171,341 | ||||||
| Gjensidige Forsikring ASA |
4,156 | 72,362 | ||||||
| Statoil ASA |
10,892 | 217,969 | ||||||
| Telenor ASA |
7,401 | 156,568 | ||||||
| Yara International ASA |
1,887 | 84,556 | ||||||
|
|
|
|||||||
| 702,796 | ||||||||
|
|
|
|||||||
| PORTUGAL — 0.1% |
||||||||
| EDP - Energias de Portugal SA |
24,174 | 91,022 | ||||||
| Jeronimo Martins SGPS SA |
5,196 | 102,522 | ||||||
|
|
|
|||||||
| 193,544 | ||||||||
|
|
|
|||||||
| SINGAPORE — 2.1% |
||||||||
| ComfortDelGro Corp., Ltd. |
61,000 | 93,435 | ||||||
| DBS Group Holdings, Ltd. |
60,903 | 933,761 | ||||||
| Keppel Corp., Ltd. |
29,311 | 140,085 | ||||||
| Oversea-Chinese Banking Corp., Ltd. |
121,602 | 999,358 | ||||||
| Singapore Airlines, Ltd. |
61,000 | 451,003 | ||||||
| Singapore Press Holdings, Ltd. (d) |
61,000 | 122,184 | ||||||
| Singapore Technologies Engineering, Ltd. |
61,000 | 154,527 | ||||||
| Singapore Telecommunications, Ltd. |
311,500 | 844,155 | ||||||
| StarHub, Ltd. |
61,000 | 116,794 | ||||||
| United Overseas Bank, Ltd. |
11,175 | 193,389 | ||||||
|
|
|
|||||||
| 4,048,691 | ||||||||
|
|
|
|||||||
| SOUTH AFRICA — 0.1% |
||||||||
| Mondi PLC |
6,108 | 164,306 | ||||||
|
|
|
|||||||
| SPAIN — 2.2% |
||||||||
| ACS Actividades de Construccion y Servicios SA |
3,342 | 123,881 | ||||||
| Amadeus IT Group SA |
8,986 | 584,172 | ||||||
| Banco Bilbao Vizcaya Argentaria SA |
51,613 | 461,349 | ||||||
| Banco de Sabadell SA |
51,698 | 107,933 | ||||||
| Banco Santander SA |
134,796 | 941,314 | ||||||
| CaixaBank SA |
28,749 | 144,105 | ||||||
| Distribuidora Internacional de Alimentacion SA |
9,258 | 54,013 | ||||||
| Endesa SA |
7,827 | 176,502 | ||||||
| Iberdrola SA |
30,759 | 238,980 | ||||||
| Industria de Diseno Textil SA |
20,857 | 786,193 | ||||||
| Repsol SA |
15,711 | 289,561 | ||||||
See accompanying notes to financial statements.
154
Table of Contents
SPDR MSCI EAFE StrategicFactors ETF
SCHEDULE OF INVESTMENTS (continued)
September 30, 2017
| Security Description |
Shares |
Value |
||||||
| Telefonica SA |
25,233 | $ | 274,201 | |||||
|
|
|
|||||||
| 4,182,204 | ||||||||
|
|
|
|||||||
| SWEDEN — 2.4% |
||||||||
| Alfa Laval AB |
5,360 | 130,612 | ||||||
| Assa Abloy AB Class B |
15,641 | 356,420 | ||||||
| Atlas Copco AB Class A |
16,756 | 708,025 | ||||||
| Atlas Copco AB Class B |
3,665 | 141,798 | ||||||
| Essity AB Class B (b) |
2,688 | 72,977 | ||||||
| Hennes & Mauritz AB Class B |
26,905 | 695,505 | ||||||
| Hexagon AB Class B |
3,669 | 181,464 | ||||||
| ICA Gruppen AB |
3,237 | 121,392 | ||||||
| Investor AB Class B |
5,014 | 247,127 | ||||||
| Kinnevik AB Class B |
5,930 | 192,960 | ||||||
| L E Lundbergforetagen AB Class B |
2,081 | 165,973 | ||||||
| Nordea Bank AB |
18,172 | 245,786 | ||||||
| Sandvik AB |
8,499 | 146,295 | ||||||
| Securitas AB Class B |
2,669 | 44,601 | ||||||
| Skandinaviska Enskilda Banken AB Class A |
9,355 | 122,978 | ||||||
| Skanska AB Class B |
7,645 | 176,740 | ||||||
| Svenska Handelsbanken AB Class A |
7,098 | 106,874 | ||||||
| Swedbank AB Class A |
4,522 | 124,762 | ||||||
| Swedish Match AB |
2,748 | 96,186 | ||||||
| Telefonaktiebolaget LM Ericsson Class B |
16,883 | 96,739 | ||||||
| Telia Co. AB |
49,501 | 232,636 | ||||||
| Volvo AB Class B |
9,416 | 181,114 | ||||||
|
|
|
|||||||
| 4,588,964 | ||||||||
|
|
|
|||||||
| SWITZERLAND — 11.9% |
||||||||
| ABB, Ltd. |
37,386 | 924,991 | ||||||
| Adecco Group AG (b) |
3,054 | 237,982 | ||||||
| Baloise Holding AG |
1,525 | 241,453 | ||||||
| Barry Callebaut AG (b) |
122 | 187,110 | ||||||
| Chocoladefabriken Lindt & Spruengli AG |
122 | 696,621 | ||||||
| Cie Financiere Richemont SA |
1,279 | 116,982 | ||||||
| Credit Suisse Group AG (b) |
20,792 | 329,414 | ||||||
| EMS-Chemie Holding AG |
183 | 121,798 | ||||||
| Ferguson PLC |
4,586 | 301,241 | ||||||
| Geberit AG |
852 | 403,370 | ||||||
| Givaudan SA |
304 | 661,976 | ||||||
| Glencore PLC (b) |
118,346 | 543,024 | ||||||
| Julius Baer Group, Ltd. (b) |
4,136 | 244,928 | ||||||
| Kuehne + Nagel International AG |
5,318 | 985,446 | ||||||
| LafargeHolcim, Ltd. (b) (c) |
976 | 57,091 | ||||||
| LafargeHolcim, Ltd. (b) (c) |
1,159 | 67,680 | ||||||
| Nestle SA |
56,408 | 4,727,872 | ||||||
| Novartis AG |
19,404 | 1,662,455 | ||||||
| Partners Group Holding AG |
794 | 539,126 | ||||||
| Roche Holding AG |
15,530 | 3,967,565 | ||||||
| Schindler Holding AG (c) |
852 | 188,345 | ||||||
| Schindler Holding AG (c) |
730 | 157,151 | ||||||
| SGS SA |
122 | 292,896 | ||||||
| Sika AG |
59 | 439,329 | ||||||
| Sonova Holding AG |
4,708 | 799,426 | ||||||
| Swatch Group AG |
366 | 152,361 | ||||||
| Swiss Life Holding AG (b) |
671 | 236,542 | ||||||
| Swiss Prime Site AG (b) |
5,440 | 489,409 | ||||||
| Swiss Re AG |
11,191 | 1,014,315 | ||||||
| Swisscom AG |
1,767 | 906,144 | ||||||
| UBS Group AG (b) |
22,088 | 377,797 | ||||||
| Vifor Pharma AG |
610 | 71,869 | ||||||
| Zurich Insurance Group AG |
2,318 | 707,666 | ||||||
|
|
|
|||||||
| 22,851,375 | ||||||||
|
|
|
|||||||
| UNITED KINGDOM — 18.7% |
||||||||
| 3i Group PLC |
14,288 | 175,017 | ||||||
| Admiral Group PLC |
10,028 | 244,460 | ||||||
| Anglo American PLC |
12,178 | 218,856 | ||||||
| Ashtead Group PLC |
9,113 | 219,954 | ||||||
| Associated British Foods PLC |
7,037 | 301,457 | ||||||
| AstraZeneca PLC |
33,955 | 2,257,286 | ||||||
| Aviva PLC |
17,615 | 121,593 | ||||||
| Babcock International Group PLC |
8,499 | 94,357 | ||||||
| BAE Systems PLC |
63,660 | 539,361 | ||||||
| Barclays PLC |
145,708 | 377,978 | ||||||
| Barratt Developments PLC |
16,899 | 139,323 | ||||||
| Berkeley Group Holdings PLC |
3,114 | 155,292 | ||||||
| BP PLC |
117,368 | 751,589 | ||||||
| British American Tobacco PLC |
35,812 | 2,244,763 | ||||||
| BT Group PLC |
210,677 | 802,457 | ||||||
| Bunzl PLC |
10,462 | 318,204 | ||||||
| Burberry Group PLC |
8,681 | 204,985 | ||||||
| Centrica PLC |
87,639 | 219,876 | ||||||
| CNH Industrial NV |
8,380 | 100,653 | ||||||
| Compass Group PLC |
72,004 | 1,529,244 | ||||||
| ConvaTec Group PLC (a) |
65,508 | 240,727 | ||||||
| Croda International PLC |
2,627 | 133,685 | ||||||
| Diageo PLC |
59,832 | 1,969,111 | ||||||
| Direct Line Insurance Group PLC |
76,611 | 373,727 | ||||||
| easyJet PLC |
1,852 | 30,239 | ||||||
| Fiat Chrysler Automobiles NV (b) |
21,234 | 380,559 | ||||||
| GKN PLC |
41,297 | 191,705 | ||||||
| GlaxoSmithKline PLC |
44,844 | 895,555 | ||||||
| Hargreaves Lansdown PLC |
5,803 | 115,227 | ||||||
| HSBC Holdings PLC |
198,241 | 1,960,465 | ||||||
| IMI PLC |
7,031 | 117,254 | ||||||
| Imperial Brands PLC |
25,265 | 1,079,273 | ||||||
| Intertek Group PLC |
2,749 | 183,746 | ||||||
| ITV PLC |
83,022 | 194,592 | ||||||
| J Sainsbury PLC |
27,288 | 87,097 | ||||||
| Johnson Matthey PLC |
3,541 | 162,477 | ||||||
| Kingfisher PLC |
77,946 | 312,160 | ||||||
| Land Securities Group PLC REIT |
7,167 | 93,511 | ||||||
| Legal & General Group PLC |
104,317 | 363,748 | ||||||
| Lloyds Banking Group PLC |
312,588 | 284,049 | ||||||
| London Stock Exchange Group PLC |
1,963 | 100,869 | ||||||
| Marks & Spencer Group PLC |
43,741 | 207,393 | ||||||
| Meggitt PLC |
14,678 | 102,599 | ||||||
| Merlin Entertainments PLC (a) |
20,979 | 125,393 | ||||||
| National Grid PLC |
63,093 | 782,662 | ||||||
| Next PLC |
2,750 | 194,070 | ||||||
| Old Mutual PLC |
32,680 | 85,147 | ||||||
| Pearson PLC |
6,847 | 56,220 | ||||||
| Persimmon PLC |
7,220 | 250,111 | ||||||
| Prudential PLC |
12,539 | 300,542 | ||||||
| Randgold Resources, Ltd. |
1,842 | 180,777 | ||||||
| Reckitt Benckiser Group PLC |
22,784 | 2,082,608 | ||||||
| RELX NV |
21,040 | 447,971 | ||||||
See accompanying notes to financial statements.
155
Table of Contents
SPDR MSCI EAFE StrategicFactors ETF
SCHEDULE OF INVESTMENTS (continued)
September 30, 2017
| Security Description |
Shares |
Value |
||||||
| RELX PLC |
51,088 | $ | 1,122,036 | |||||
| Rio Tinto PLC |
7,280 | 339,215 | ||||||
| Rio Tinto, Ltd. |
6,410 | 334,620 | ||||||
| Rolls-Royce Holdings PLC (b) |
35,317 | 420,288 | ||||||
| Royal Bank of Scotland Group PLC (b) |
12,667 | 45,597 | ||||||
| Royal Mail PLC |
63,382 | 326,710 | ||||||
| Sage Group PLC |
21,231 | 198,965 | ||||||
| Schroders PLC |
2,142 | 96,416 | ||||||
| Severn Trent PLC |
2,566 | 74,809 | ||||||
| Sky PLC |
20,381 | 250,199 | ||||||
| Smith & Nephew PLC |
36,226 | 655,163 | ||||||
| Smiths Group PLC |
7,949 | 168,183 | ||||||
| SSE PLC |
35,704 | 669,195 | ||||||
| St James’s Place PLC |
8,620 | 132,535 | ||||||
| Standard Chartered PLC (b) |
30,278 | 301,256 | ||||||
| Standard Life Aberdeen PLC |
17,835 | 103,729 | ||||||
| Tate & Lyle PLC |
32,519 | 282,935 | ||||||
| Taylor Wimpey PLC |
54,946 | 144,119 | ||||||
| Tesco PLC (b) |
65,450 | 164,338 | ||||||
| Travis Perkins PLC |
2,507 | 48,704 | ||||||
| Unilever NV |
33,249 | 1,966,920 | ||||||
| Unilever PLC |
28,117 | 1,629,264 | ||||||
| United Utilities Group PLC |
5,379 | 61,667 | ||||||
| Vodafone Group PLC |
273,645 | 766,579 | ||||||
| Whitbread PLC |
3,671 | 185,483 | ||||||
| William Hill PLC |
28,447 | 96,331 | ||||||
| Wm Morrison Supermarkets PLC |
29,490 | 92,622 | ||||||
| WPP PLC |
19,588 | 363,981 | ||||||
|
|
|
|||||||
| 36,143,833 | ||||||||
|
|
|
|||||||
| UNITED STATES — 0.1% |
||||||||
| Shire PLC |
1,955 | 99,356 | ||||||
|
|
|
|||||||
| TOTAL COMMON STOCKS |
191,227,849 | |||||||
|
|
|
|||||||
| SHORT-TERM INVESTMENTS — 0.4% |
| |||||||
| State Street Institutional U.S. Government Money Market Fund, Class G Shares 0.96% (f) (g) |
152,020 | 152,020 | ||||||
| State Street Navigator Securities Lending Government Money Market Portfolio (f) (h) |
666,545 | 666,545 | ||||||
|
|
|
|||||||
| TOTAL SHORT-TERM INVESTMENTS (Cost $818,565) |
818,565 | |||||||
|
|
|
|||||||
| TOTAL INVESTMENTS — 99.7% |
192,046,414 | |||||||
| OTHER ASSETS IN EXCESS OF LIABILITIES — 0.3% |
597,639 | |||||||
|
|
|
|||||||
| NET ASSETS — 100.0% |
$ | 192,644,053 | ||||||
|
|
|
|||||||
| (a) | Securities purchased pursuant to Rule 144A of the Securities Act of 1933, as amended. These securities, which represent 0.8% of net assets as of September 30, 2017, are considered liquid and may be resold in transactions exempt from registration, normally to qualified institutional buyers. |
| (b) | Non-income producing security. |
| (c) | Reflects separate holdings of the issuer’s common stock traded on different securities exchanges. |
| (d) | All or a portion of the shares of the security are on loan at September 30, 2017. |
| (e) | Amount is less than 0.05% of net assets. |
| (f) | The Fund invested in certain money market funds managed by SSGA Funds Management, Inc. Amounts related to these transactions during the period ended September 30, 2017 are shown in the Affiliate Table below. |
| (g) | The rate shown is the annualized seven-day yield at September 30, 2017. |
| (h) | Investment of cash collateral for securities loaned. |
ADR = American Depositary Receipt
REIT = Real Estate Investment Trust
The following table summarizes the value of the Fund’s investments according to the fair value hierarchy as of September 30, 2017.
| Description |
Level 1 — Quoted Prices |
Level 2 — Other Significant Observable Inputs |
Level 3 — Significant Unobservable Inputs |
Total | ||||||||||||
| ASSETS: |
||||||||||||||||
| INVESTMENTS: |
||||||||||||||||
| Common Stocks |
||||||||||||||||
| Australia |
$ | 8,863,024 | $ | — | $ | — | $ | 8,863,024 | ||||||||
| Austria |
142,472 | — | — | 142,472 | ||||||||||||
| Belgium |
1,857,238 | — | — | 1,857,238 | ||||||||||||
| Denmark |
7,482,879 | — | — | 7,482,879 | ||||||||||||
| Finland |
2,410,964 | — | — | 2,410,964 | ||||||||||||
| France |
14,463,086 | — | — | 14,463,086 | ||||||||||||
| Germany |
17,024,575 | — | — | 17,024,575 | ||||||||||||
| Hong Kong |
9,680,267 | — | — | 9,680,267 | ||||||||||||
| Ireland |
1,709,568 | — | — | 1,709,568 | ||||||||||||
See accompanying notes to financial statements.
156
Table of Contents
SPDR MSCI EAFE StrategicFactors ETF
SCHEDULE OF INVESTMENTS (continued)
September 30, 2017
| Description |
Level 1 — Quoted Prices |
Level 2 — Other Significant Observable Inputs |
Level 3 — Significant Unobservable Inputs |
Total | ||||||||||||
| Israel |
$ | 2,081,349 | $ | — | $ | — | $ | 2,081,349 | ||||||||
| Italy |
1,812,867 | — | — | 1,812,867 | ||||||||||||
| Japan |
44,724,576 | — | — | 44,724,576 | ||||||||||||
| Luxembourg |
575,646 | — | — | 575,646 | ||||||||||||
| Mexico |
30,123 | — | — | 30,123 | ||||||||||||
| Netherlands |
4,954,639 | — | — | 4,954,639 | ||||||||||||
| New Zealand |
439,507 | — | — | 439,507 | ||||||||||||
| Norway |
702,796 | — | — | 702,796 | ||||||||||||
| Portugal |
193,544 | — | — | 193,544 | ||||||||||||
| Singapore |
4,048,691 | — | — | 4,048,691 | ||||||||||||
| South Africa |
164,306 | — | — | 164,306 | ||||||||||||
| Spain |
4,182,204 | — | — | 4,182,204 | ||||||||||||
| Sweden |
4,588,964 | — | — | 4,588,964 | ||||||||||||
| Switzerland |
22,851,375 | — | — | 22,851,375 | ||||||||||||
| United Kingdom |
36,143,833 | — | — | 36,143,833 | ||||||||||||
| United States |
99,356 | — | — | 99,356 | ||||||||||||
| Short-Term Investments |
818,565 | — | — | 818,565 | ||||||||||||
|
|
|
|
|
|
|
|
|
|||||||||
| TOTAL INVESTMENTS |
$ | 192,046,414 | $ | — | $ | — | $ | 192,046,414 | ||||||||
|
|
|
|
|
|
|
|
|
|||||||||
Affiliate Table
| Number of Shares Held at 9/30/16 |
Value at 9/30/16 |
Cost of Purchases |
Proceeds from Shares Sold |
Realized Gain (Loss) |
Change in Unrealized Appreciation/ Depreciation |
Number of Shares Held at 9/30/17 |
Value at 9/30/17 |
Dividend Income |
||||||||||||||||||||||||||||
| State Street Institutional Liquid Reserves Fund, Premier Class |
7,487 | $ | 7,487 | $ | 3 | $ | 7,490 | $ | — | $ | — | — | $ | — | $ | — | ||||||||||||||||||||
| State Street Institutional U.S. Government Money Market Fund, Class G Shares |
— | — | 3,712,893 | 3,560,873 | — | — | 152,020 | 152,020 | 1,114 | |||||||||||||||||||||||||||
| State Street Institutional U.S. Government Money Market Fund, Premier Class |
— | — | 586,362 | 586,362 | — | — | — | — | 155 | |||||||||||||||||||||||||||
| State Street Navigator Securities Lending Government Money Market Portfolio* |
— | — | 7,025,683 | 6,359,138 | — | — | 666,545 | 666,545 | 3,332 | |||||||||||||||||||||||||||
|
|
|
|
|
|
|
|
|
|
|
|
|
|
|
|||||||||||||||||||||||
| TOTAL |
$ | 7,487 | $ | 11,324,941 | $ | 10,513,863 | $ | — | $ | — | $ | 818,565 | $ | 4,601 | ||||||||||||||||||||||
|
|
|
|
|
|
|
|
|
|
|
|
|
|
|
|||||||||||||||||||||||
| * | Effective October 5, 2016, the name of State Street Navigator Securities Lending Prime Portfolio was changed to State Street Navigator Securities Lending Government Money Market Portfolio. |
See accompanying notes to financial statements.
157
Table of Contents
SPDR MSCI Emerging Markets StrategicFactors ETF
SCHEDULE OF INVESTMENTS
September 30, 2017
| Security Description |
Shares |
Value |
||||||
| COMMON STOCKS — 99.4% |
||||||||
| BRAZIL — 5.6% |
||||||||
| Ambev SA |
59,160 | $ | 393,509 | |||||
| Ambev SA ADR |
370,546 | 2,441,898 | ||||||
| B3 SA - Brasil Bolsa Balcao |
15,740 | 119,176 | ||||||
| Banco Bradesco SA |
17,977 | 189,821 | ||||||
| Banco Bradesco SA Preference Shares |
57,460 | 636,699 | ||||||
| Banco do Brasil SA |
27,627 | 304,817 | ||||||
| Banco Santander Brasil SA |
8,016 | 70,045 | ||||||
| BB Seguridade Participacoes SA |
56,501 | 511,396 | ||||||
| BR Malls Participacoes SA |
8,246 | 36,679 | ||||||
| Braskem SA Class A, Preference Shares |
2,722 | 36,512 | ||||||
| BRF SA (a) |
1,524 | 22,004 | ||||||
| BRF SA ADR (a) (b) |
6,629 | 95,524 | ||||||
| CCR SA |
7,568 | 42,372 | ||||||
| Centrais Eletricas Brasileiras SA (a) |
5,400 | 33,733 | ||||||
| Centrais Eletricas Brasileiras SA ADR (b) |
5,343 | 38,363 | ||||||
| Centrais Eletricas Brasileiras SA Class B, Preference Shares |
490 | 3,515 | ||||||
| Cia Brasileira de Distribuicao ADR (a) |
4,239 | 100,337 | ||||||
| Cia Brasileira de Distribuicao Preference Shares (a) |
532 | 12,614 | ||||||
| Cia de Saneamento Basico do Estado de Sao Paulo |
434 | 4,566 | ||||||
| Cia de Saneamento Basico do Estado de Sao Paulo ADR |
3,608 | 37,740 | ||||||
| Cia Energetica de Minas Gerais ADR (b) |
26,124 | 64,788 | ||||||
| Cia Energetica de Minas Gerais Preference Shares |
4,886 | 12,326 | ||||||
| Cia Paranaense de Energia ADR (b) |
2,833 | 25,100 | ||||||
| Cia Paranaense de Energia Preference Shares |
406 | 3,623 | ||||||
| Cia Siderurgica Nacional SA (a) |
1,232 | 3,743 | ||||||
| Cia Siderurgica Nacional SA ADR (a) (b) |
9,687 | 28,674 | ||||||
| Cielo SA |
120,219 | 835,374 | ||||||
| Cosan SA Industria e Comercio |
2,050 | 23,461 | ||||||
| CPFL Energia SA ADR (b) |
12,698 | 217,898 | ||||||
| Duratex SA |
3,346 | 10,017 | ||||||
| EDP - Energias do Brasil SA |
13,600 | 65,095 | ||||||
| Embraer SA |
980 | 5,543 | ||||||
| Embraer SA ADR |
3,084 | 69,729 | ||||||
| Engie Brasil Energia SA |
10,565 | 121,076 | ||||||
| Equatorial Energia SA |
13,697 | 265,223 | ||||||
| Fibria Celulose SA ADR (b) |
3,157 | 42,746 | ||||||
| Gerdau SA Preference Shares |
19,420 | 67,780 | ||||||
| Hypermarcas SA |
982 | 9,996 | ||||||
| Itau Unibanco Holding SA Preference Shares |
10,045 | 137,664 | ||||||
| Itau Unibanco Holding SA Preference Shares ADR |
50,510 | 691,987 | ||||||
| Itausa - Investimentos Itau SA Preference Shares |
315,633 | 1,100,622 | ||||||
| JBS SA |
32,918 | 88,457 | ||||||
| Klabin SA |
4,939 | 28,652 | ||||||
| Kroton Educacional SA |
12,004 | 76,089 | ||||||
| Localiza Rent a Car SA |
735 | 13,410 | ||||||
| Lojas Americanas SA |
712 | 3,536 | ||||||
| Lojas Americanas SA Preference Shares |
1,921 | 11,691 | ||||||
| Lojas Renner SA |
44,757 | 510,231 | ||||||
| M Dias Branco SA |
5,677 | 89,198 | ||||||
| Multiplan Empreendimentos Imobiliarios SA |
210 | 4,868 | ||||||
| Natura Cosmeticos SA |
604 | 5,958 | ||||||
| Odontoprev SA |
18,640 | 90,927 | ||||||
| Petroleo Brasileiro SA (a) |
14,974 | 74,843 | ||||||
| Petroleo Brasileiro SA ADR (a) |
26,329 | 264,343 | ||||||
| Petroleo Brasileiro SA Preference Shares (a) |
32,977 | 159,508 | ||||||
| Petroleo Brasileiro SA Preference Shares ADR (a) |
30,856 | 298,069 | ||||||
| Porto Seguro SA |
1,916 | 22,818 | ||||||
| Qualicorp SA |
746 | 8,938 | ||||||
| Raia Drogasil SA |
10,973 | 260,176 | ||||||
| Rumo SA (a) |
6,735 | 25,742 | ||||||
| Sul America SA |
15,478 | 87,540 | ||||||
| Suzano Papel e Celulose SA Class A, Preference Shares |
3,400 | 19,681 | ||||||
| Telefonica Brasil SA ADR |
5,624 | 89,084 | ||||||
| Telefonica Brasil SA Preference Shares |
644 | 10,275 | ||||||
| Tim Participacoes SA |
1,806 | 6,594 | ||||||
| Tim Participacoes SA ADR |
2,791 | 51,019 | ||||||
| Transmissora Alianca de Energia Eletrica SA |
1,400 | 9,848 | ||||||
| Ultrapar Participacoes SA |
378 | 9,000 | ||||||
| Ultrapar Participacoes SA ADR |
3,815 | 90,873 | ||||||
| Vale SA |
9,037 | 91,051 | ||||||
| Vale SA ADR |
23,948 | 241,156 | ||||||
| Vale SA Preference Shares |
6,600 | 61,636 | ||||||
| WEG SA |
31,877 | 215,661 | ||||||
|
|
|
|||||||
| 11,954,657 | ||||||||
|
|
|
|||||||
| CHILE — 1.8% |
||||||||
| AES Gener SA |
25,647 | 8,986 | ||||||
| Aguas Andinas SA Class A |
915,087 | 583,060 | ||||||
| Banco de Chile |
1,627,363 | 248,587 | ||||||
| Banco de Chile ADR |
9,893 | 901,945 | ||||||
| Banco de Credito e Inversiones |
2,041 | 129,266 | ||||||
| Banco Santander Chile |
90,118 | 6,710 | ||||||
| Banco Santander Chile ADR |
1,725 | 51,250 | ||||||
| Cencosud SA |
24,306 | 74,409 | ||||||
| Cencosud SA ADR (a) |
5,135 | 47,160 | ||||||
| Cia Cervecerias Unidas SA |
2,256 | 30,416 | ||||||
| Cia Cervecerias Unidas SA ADR |
4,502 | 121,239 | ||||||
| Colbun SA |
340,465 | 82,435 | ||||||
| Embotelladora Andina SA Class B, Preference Shares |
1,220 | 5,710 | ||||||
| Empresa Nacional de Telecomunicaciones SA |
1,189 | 12,315 | ||||||
| Empresas CMPC SA |
16,443 | 43,345 | ||||||
| Empresas COPEC SA |
11,327 | 148,520 | ||||||
| Enel Americas SA |
110,675 | 22,693 | ||||||
| Enel Americas SA ADR |
10,605 | 108,383 | ||||||
See accompanying notes to financial statements.
158
Table of Contents
SPDR MSCI Emerging Markets StrategicFactors ETF
SCHEDULE OF INVESTMENTS (continued)
September 30, 2017
| Security Description |
Shares |
Value |
||||||
| Enel Chile SA |
176,260 | $ | 21,522 | |||||
| Enel Chile SA ADR |
4,636 | 27,816 | ||||||
| Enel Generacion Chile SA |
26,934 | 23,551 | ||||||
| Enel Generacion Chile SA ADR (b) |
10,603 | 279,495 | ||||||
| Itau CorpBanca ADR |
1,333 | 18,529 | ||||||
| Latam Airlines Group SA |
616 | 8,119 | ||||||
| Latam Airlines Group SA ADR (b) |
3,952 | 52,364 | ||||||
| SACI Falabella |
80,660 | 787,745 | ||||||
| Sociedad Quimica y Minera de Chile SA ADR |
1,022 | 56,885 | ||||||
| Sociedad Quimica y Minera de Chile SA Class B, Preference Shares |
84 | 4,667 | ||||||
|
|
|
|||||||
| 3,907,122 | ||||||||
|
|
|
|||||||
| CHINA — 24.0% |
||||||||
| 3SBio, Inc. (a) (c) |
114,890 | 184,161 | ||||||
| 58.com, Inc. ADR (a) |
158 | 9,976 | ||||||
| AAC Technologies Holdings, Inc. |
93,500 | 1,570,563 | ||||||
| Agricultural Bank of China, Ltd. Class H |
1,387,000 | 621,519 | ||||||
| Air China, Ltd. Class H |
52,000 | 43,207 | ||||||
| Alibaba Group Holding, Ltd. ADR (a) (b) |
7,027 | 1,213,633 | ||||||
| Aluminum Corp. of China, Ltd. Class H (a) |
74,000 | 66,414 | ||||||
| Anhui Conch Cement Co., Ltd. Class H |
14,000 | 55,834 | ||||||
| ANTA Sports Products, Ltd. |
150,000 | 630,865 | ||||||
| Autohome, Inc. ADR (a) |
3,761 | 225,961 | ||||||
| AviChina Industry & Technology Co., Ltd. Class H |
4,000 | 2,417 | ||||||
| Baidu, Inc. ADR (a) |
3,002 | 743,565 | ||||||
| Bank of China, Ltd. Class H |
4,099,071 | 2,020,488 | ||||||
| Bank of Communications Co., Ltd. Class H |
435,000 | 317,449 | ||||||
| Beijing Capital International Airport Co., Ltd. Class H |
168,000 | 250,364 | ||||||
| Beijing Enterprises Holdings, Ltd. |
12,500 | 67,216 | ||||||
| Beijing Enterprises Water Group, Ltd. (a) |
70,000 | 56,371 | ||||||
| Brilliance China Automotive Holdings, Ltd. |
200,000 | 532,603 | ||||||
| Byd Co., Ltd. Class H (b) |
6,000 | 55,654 | ||||||
| CGN Power Co., Ltd. Class H (c) |
117,100 | 32,383 | ||||||
| China Cinda Asset Management Co., Ltd. Class H |
174,548 | 64,360 | ||||||
| China CITIC Bank Corp., Ltd. Class H |
526,000 | 334,024 | ||||||
| China Coal Energy Co., Ltd. Class H |
34,000 | 16,063 | ||||||
| China Communications Construction Co., Ltd. Class H |
134,000 | 167,271 | ||||||
| China Communications Services Corp., Ltd. Class H |
96,000 | 49,409 | ||||||
| China Conch Venture Holdings, Ltd. |
20,000 | 38,921 | ||||||
| China Construction Bank Corp. Class H |
3,482,394 | 2,889,103 | ||||||
| China Everbright Bank Co., Ltd. Class H |
495,274 | 228,909 | ||||||
| China Everbright International, Ltd. |
19,000 | 23,839 | ||||||
| China Everbright, Ltd. |
18,000 | 41,389 | ||||||
| China Evergrande Group (a) |
52,625 | 183,598 | ||||||
| China Galaxy Securities Co., Ltd. Class H |
51,334 | 45,020 | ||||||
| China Huarong Asset Management Co., Ltd. (c) |
284,200 | 126,987 | ||||||
| China Huishan Dairy Holdings Co., Ltd. (a) (d) |
1,072,393 | — | ||||||
| China Jinmao Holdings Group, Ltd. |
88,000 | 44,278 | ||||||
| China Life Insurance Co., Ltd. Class H |
83,000 | 247,065 | ||||||
| China Longyuan Power Group Corp., Ltd. Class H |
55,000 | 40,982 | ||||||
| China Medical System Holdings, Ltd. |
229,733 | 401,188 | ||||||
| China Mengniu Dairy Co., Ltd. (a) |
160,000 | 447,591 | ||||||
| China Merchants Bank Co., Ltd. Class H |
94,500 | 332,112 | ||||||
| China Merchants Port Holdings Co., Ltd. |
35,473 | 109,452 | ||||||
| China Minsheng Banking Corp., Ltd. Class H |
218,300 | 200,114 | ||||||
| China Mobile, Ltd. |
463,997 | 4,701,930 | ||||||
| China National Building Material Co., Ltd. Class H |
182,000 | 126,060 | ||||||
| China Oilfield Services, Ltd. Class H |
28,000 | 25,632 | ||||||
| China Overseas Land & Investment, Ltd. |
78,000 | 253,652 | ||||||
| China Pacific Insurance Group Co., Ltd. Class H |
36,000 | 155,095 | ||||||
| China Petroleum & Chemical Corp. Class H |
1,180,395 | 884,084 | ||||||
| China Power International Development, Ltd. |
106,000 | 34,878 | ||||||
| China Railway Construction Corp., Ltd. Class H |
70,500 | 89,358 | ||||||
| China Railway Group, Ltd. Class H |
131,000 | 108,346 | ||||||
| China Resources Beer Holdings Co., Ltd. |
130,092 | 352,266 | ||||||
| China Resources Gas Group, Ltd. |
158,000 | 550,220 | ||||||
| China Resources Land, Ltd. |
46,444 | 142,114 | ||||||
| China Resources Power Holdings Co., Ltd. |
94,267 | 170,172 | ||||||
| China Shenhua Energy Co., Ltd. Class H |
68,000 | 159,842 | ||||||
| China Southern Airlines Co., Ltd. Class H |
34,000 | 23,419 | ||||||
| China State Construction International Holdings, Ltd. |
112,000 | 163,181 | ||||||
| China Taiping Insurance Holdings Co., Ltd. |
32,610 | 87,258 | ||||||
| China Telecom Corp., Ltd. Class H |
660,000 | 337,998 | ||||||
| China Unicom Hong Kong, Ltd. (a) |
200,000 | 278,080 | ||||||
| China Vanke Co., Ltd. Class H |
79,492 | 261,557 | ||||||
| Chongqing Changan Automobile Co., Ltd. Class B |
74,200 | 98,133 | ||||||
| Chongqing Rural Commercial Bank Co., Ltd. Class H |
108,000 | 68,445 | ||||||
| CITIC Securities Co., Ltd. Class H |
28,000 | 61,587 | ||||||
| CITIC, Ltd. |
146,000 | 215,709 | ||||||
| CNOOC, Ltd. |
419,000 | 540,735 | ||||||
| COSCO SHIPPING Ports, Ltd. |
286,480 | 318,731 | ||||||
See accompanying notes to financial statements.
159
Table of Contents
SPDR MSCI Emerging Markets StrategicFactors ETF
SCHEDULE OF INVESTMENTS (continued)
September 30, 2017
| Security Description |
Shares |
Value |
||||||
| Country Garden Holdings Co., Ltd. |
80,266 | $ | 127,633 | |||||
| CRRC Corp., Ltd. Class H |
55,000 | 48,869 | ||||||
| CSPC Pharmaceutical Group, Ltd. |
710,000 | 1,188,984 | ||||||
| Ctrip.com International, Ltd. ADR (a) |
1,235 | 65,134 | ||||||
| Dongfeng Motor Group Co., Ltd. Class H |
232,000 | 306,533 | ||||||
| ENN Energy Holdings, Ltd. |
9,000 | 65,218 | ||||||
| Fang Holdings, Ltd. ADR (a) (b) |
42 | 170 | ||||||
| Far East Horizon, Ltd. |
22,000 | 20,674 | ||||||
| Fosun International, Ltd. |
52,500 | 110,637 | ||||||
| Fuyao Glass Industry Group Co., Ltd. Class H (c) |
45,600 | 165,511 | ||||||
| Geely Automobile Holdings, Ltd. |
390,000 | 1,098,493 | ||||||
| GF Securities Co., Ltd. Class H |
24,800 | 53,914 | ||||||
| GOME Retail Holdings, Ltd. |
282,000 | 31,772 | ||||||
| Great Wall Motor Co., Ltd. Class H |
260,500 | 320,176 | ||||||
| Guangdong Investment, Ltd. |
742,000 | 1,058,277 | ||||||
| Guangzhou Automobile Group Co., Ltd. Class H |
22,000 | 50,925 | ||||||
| Guangzhou R&F Properties Co., Ltd. Class H |
38,800 | 89,913 | ||||||
| Haitian International Holdings, Ltd. |
40,000 | 114,971 | ||||||
| Haitong Securities Co., Ltd. Class H |
42,000 | 67,861 | ||||||
| Hengan International Group Co., Ltd. |
84,374 | 781,011 | ||||||
| Huaneng Power International, Inc. Class H |
172,000 | 106,362 | ||||||
| Huaneng Renewables Corp., Ltd. Class H |
38,000 | 12,552 | ||||||
| Huatai Securities Co., Ltd. Class H (c) |
22,243 | 49,266 | ||||||
| Industrial & Commercial Bank of China, Ltd. Class H |
3,220,448 | 2,391,412 | ||||||
| JD.com, Inc. ADR (a) |
2,368 | 90,458 | ||||||
| Jiangsu Expressway Co., Ltd. Class H |
374,000 | 572,681 | ||||||
| Jiangxi Copper Co., Ltd. Class H |
36,000 | 56,876 | ||||||
| Kingsoft Corp., Ltd. |
2,000 | 4,660 | ||||||
| Kunlun Energy Co., Ltd. |
58,000 | 56,658 | ||||||
| Lenovo Group, Ltd. |
354,915 | 195,845 | ||||||
| Longfor Properties Co., Ltd. |
40,500 | 102,148 | ||||||
| Minth Group, Ltd. |
40,000 | 209,456 | ||||||
| NetEase, Inc. ADR |
7,770 | 2,049,804 | ||||||
| New China Life Insurance Co., Ltd. Class H |
12,200 | 68,961 | ||||||
| New Oriental Education & Technology Group, Inc. ADR |
10,970 | 968,212 | ||||||
| People’s Insurance Co. Group of China, Ltd. Class H |
230,000 | 102,769 | ||||||
| PetroChina Co., Ltd. Class H |
650,000 | 411,935 | ||||||
| PICC Property & Casualty Co., Ltd. Class H |
316,180 | 557,819 | ||||||
| Ping An Insurance Group Co. of China, Ltd. Class H |
64,500 | 495,061 | ||||||
| Semiconductor Manufacturing International Corp. (a) (b) |
278,200 | 314,149 | ||||||
| Shandong Weigao Group Medical Polymer Co., Ltd. Class H |
236,000 | 167,089 | ||||||
| Shanghai Electric Group Co., Ltd. Class H (a) (b) |
36,000 | 15,855 | ||||||
| Shanghai Fosun Pharmaceutical Group Co., Ltd. Class H |
1,500 | 6,222 | ||||||
| Shanghai Industrial Holdings, Ltd. |
7,000 | 21,195 | ||||||
| Shanghai Lujiazui Finance & Trade Zone Development Co., Ltd. Class B |
149,127 | 237,261 | ||||||
| Shanghai Pharmaceuticals Holding Co., Ltd. Class H |
57,800 | 141,194 | ||||||
| Shenzhou International Group Holdings, Ltd. |
124,000 | 971,590 | ||||||
| Sihuan Pharmaceutical Holdings Group, Ltd. |
598,000 | 217,435 | ||||||
| SINA Corp. (a) |
291 | 33,363 | ||||||
| Sino-Ocean Group Holding, Ltd. |
85,000 | 56,698 | ||||||
| Sinopec Engineering Group Co., Ltd. Class H |
57,713 | 50,910 | ||||||
| Sinopec Shanghai Petrochemical Co., Ltd. Class H |
54,000 | 32,148 | ||||||
| Sinopharm Group Co., Ltd. Class H |
36,000 | 158,552 | ||||||
| SOHO China, Ltd. (a) |
22,000 | 12,590 | ||||||
| Sunac China Holdings, Ltd. (b) |
29,697 | 135,925 | ||||||
| Sunny Optical Technology Group Co., Ltd. |
52,893 | 841,066 | ||||||
| TAL Education Group ADR |
26,190 | 882,865 | ||||||
| Tencent Holdings, Ltd. |
138,878 | 5,977,798 | ||||||
| Tingyi Cayman Islands Holding Corp. |
18,000 | 27,101 | ||||||
| TravelSky Technology, Ltd. Class H |
173,000 | 450,734 | ||||||
| Tsingtao Brewery Co., Ltd. Class H |
34,000 | 130,155 | ||||||
| Vipshop Holdings, Ltd. ADR (a) |
1,986 | 17,457 | ||||||
| Want Want China Holdings, Ltd. |
435,000 | 305,754 | ||||||
| Weibo Corp. ADR (a) (b) |
26 | 2,572 | ||||||
| Weichai Power Co., Ltd. Class H |
40,000 | 43,837 | ||||||
| Yanzhou Coal Mining Co., Ltd. Class H |
46,000 | 45,289 | ||||||
| YY, Inc. ADR (a) |
2,288 | 198,553 | ||||||
| Zhejiang Expressway Co., Ltd. Class H |
214,000 | 266,038 | ||||||
| Zhuzhou CRRC Times Electric Co., Ltd. Class H |
36,300 | 203,327 | ||||||
| Zijin Mining Group Co., Ltd. Class H |
82,000 | 28,136 | ||||||
| ZTE Corp. Class H (a) |
8,280 | 27,085 | ||||||
|
|
|
|||||||
| 51,230,354 | ||||||||
|
|
|
|||||||
| COLOMBIA — 0.4% |
||||||||
| Bancolombia SA |
3,790 | 42,253 | ||||||
| Bancolombia SA ADR (b) |
1,292 | 59,161 | ||||||
| Bancolombia SA Preference Shares |
2,894 | 33,288 | ||||||
| Cementos Argos SA |
1,555 | 6,195 | ||||||
| Ecopetrol SA |
9,534 | 4,545 | ||||||
| Ecopetrol SA ADR (b) |
3,907 | 37,077 | ||||||
| Grupo Argos SA |
7,463 | 53,671 | ||||||
| Grupo Aval Acciones y Valores SA Preference Shares |
32,251 | 14,606 | ||||||
| Grupo de Inversiones Suramericana SA |
2,297 | 31,975 | ||||||
| Grupo de Inversiones Suramericana SA Preference Shares |
7,957 | 108,867 | ||||||
| Interconexion Electrica SA ESP |
82,800 | 385,702 | ||||||
|
|
|
|||||||
| 777,340 | ||||||||
|
|
|
|||||||
| CZECH REPUBLIC — 0.3% |
||||||||
| CEZ A/S |
4,951 | 99,377 | ||||||
| Komercni banka A/S |
6,101 | 266,399 | ||||||
See accompanying notes to financial statements.
160
Table of Contents
SPDR MSCI Emerging Markets StrategicFactors ETF
SCHEDULE OF INVESTMENTS (continued)
September 30, 2017
| Security Description |
Shares |
Value |
||||||
| Moneta Money Bank A/S (c) |
45,251 | $ | 159,305 | |||||
| O2 Czech Republic A/S |
13,616 | 167,214 | ||||||
|
|
|
|||||||
| 692,295 | ||||||||
|
|
|
|||||||
| EGYPT — 0.3% |
||||||||
| Commercial International Bank Egypt SAE GDR |
145,908 | 663,152 | ||||||
| Egyptian Financial Group-Hermes Holding Co. |
7,087 | 8,898 | ||||||
|
|
|
|||||||
| 672,050 | ||||||||
|
|
|
|||||||
| GREECE — 0.6% |
||||||||
| Alpha Bank AE (a) |
47,752 | 94,276 | ||||||
| Eurobank Ergasias SA (a) |
69,936 | 61,843 | ||||||
| FF Group (a) |
440 | 9,566 | ||||||
| Hellenic Telecommunications Organization SA |
15,270 | 184,674 | ||||||
| JUMBO SA |
20,378 | 337,031 | ||||||
| National Bank of Greece SA (a) |
170,591 | 57,880 | ||||||
| OPAP SA |
19,875 | 210,291 | ||||||
| Piraeus Bank SA (a) |
13,883 | 47,596 | ||||||
| Titan Cement Co. SA |
8,671 | 219,573 | ||||||
|
|
|
|||||||
| 1,222,730 | ||||||||
|
|
|
|||||||
| HONG KONG — 0.8% |
||||||||
| Alibaba Pictures Group, Ltd. (a) (b) |
10,000 | 1,600 | ||||||
| China Gas Holdings, Ltd. |
44,000 | 131,819 | ||||||
| Fullshare Holdings, Ltd. (a) (b) |
363,393 | 158,185 | ||||||
| GCL-Poly Energy Holdings, Ltd. (a) (b) |
458,000 | 62,742 | ||||||
| Haier Electronics Group Co., Ltd. (a) |
98,000 | 238,893 | ||||||
| Hanergy Thin Film Power Group, Ltd. (a) (d) |
598,000 | — | ||||||
| Nine Dragons Paper Holdings, Ltd. |
14,000 | 27,531 | ||||||
| Shimao Property Holdings, Ltd. |
55,500 | 120,370 | ||||||
| Sino Biopharmaceutical, Ltd. |
652,000 | 689,505 | ||||||
| Sun Art Retail Group, Ltd. |
259,332 | 240,716 | ||||||
|
|
|
|||||||
| 1,671,361 | ||||||||
|
|
|
|||||||
| HUNGARY — 0.4% |
||||||||
| MOL Hungarian Oil & Gas PLC |
29,520 | 337,010 | ||||||
| OTP Bank PLC |
3,361 | 126,558 | ||||||
| Richter Gedeon Nyrt |
18,233 | 454,470 | ||||||
|
|
|
|||||||
| 918,038 | ||||||||
|
|
|
|||||||
| INDIA — 9.5% |
||||||||
| ACC, Ltd. |
193 | 4,896 | ||||||
| Adani Ports & Special Economic Zone, Ltd. |
40,771 | 235,157 | ||||||
| Ambuja Cements, Ltd. |
2,581 | 10,528 | ||||||
| Apollo Hospitals Enterprise, Ltd. |
134 | 2,062 | ||||||
| Ashok Leyland, Ltd. |
1,669 | 3,145 | ||||||
| Asian Paints, Ltd. |
47,533 | 823,532 | ||||||
| Aurobindo Pharma, Ltd. |
19,943 | 211,169 | ||||||
| Axis Bank, Ltd. |
21,555 | 168,015 | ||||||
| Bajaj Auto, Ltd. |
6,704 | 319,128 | ||||||
| Bajaj Finance, Ltd. |
200 | 5,628 | ||||||
| Bajaj Finserv, Ltd. |
170 | 13,415 | ||||||
| Bharat Forge, Ltd. |
339 | 3,056 | ||||||
| Bharat Forge, Ltd. Bonus Shares (e) |
339 | 3,056 | ||||||
| Bharat Heavy Electricals, Ltd. |
7,216 | 9,274 | ||||||
| Bharat Heavy Electricals, Ltd. Bonus Shares (e) |
3,608 | 4,637 | ||||||
| Bharat Petroleum Corp., Ltd. |
59,267 | 427,626 | ||||||
| Bharti Airtel, Ltd. |
11,555 | 68,893 | ||||||
| Bharti Infratel, Ltd. |
31,201 | 190,301 | ||||||
| Bosch, Ltd. |
457 | 143,740 | ||||||
| Cadila Healthcare, Ltd. |
19,375 | 139,514 | ||||||
| Cipla, Ltd. |
6,092 | 54,662 | ||||||
| Coal India, Ltd. |
66,895 | 277,381 | ||||||
| Container Corp. Of India, Ltd. |
170 | 3,505 | ||||||
| Dabur India, Ltd. |
144,889 | 676,533 | ||||||
| Dr Reddy’s Laboratories, Ltd. |
495 | 17,647 | ||||||
| Dr Reddy’s Laboratories, Ltd. ADR |
515 | 18,375 | ||||||
| Eicher Motors, Ltd. |
1,030 | 492,188 | ||||||
| GAIL India, Ltd. |
653 | 4,189 | ||||||
| GAIL India, Ltd. GDR |
1,277 | 49,101 | ||||||
| Glenmark Pharmaceuticals, Ltd. |
8,693 | 79,624 | ||||||
| Godrej Consumer Products, Ltd. |
14,065 | 197,916 | ||||||
| Grasim Industries, Ltd. |
3,474 | 60,308 | ||||||
| Havells India, Ltd. |
18,626 | 137,770 | ||||||
| HCL Technologies, Ltd. |
76,631 | 1,026,283 | ||||||
| Hero MotoCorp, Ltd. |
4,062 | 234,725 | ||||||
| Hindalco Industries, Ltd. |
28,413 | 104,657 | ||||||
| Hindustan Petroleum Corp., Ltd. |
13,907 | 90,868 | ||||||
| Hindustan Unilever, Ltd. |
69,131 | 1,242,389 | ||||||
| Housing Development Finance Corp., Ltd. |
10,800 | 288,047 | ||||||
| ICICI Bank, Ltd. |
1,894 | 8,020 | ||||||
| ICICI Bank, Ltd. ADR |
14,228 | 121,792 | ||||||
| Idea Cellular, Ltd. |
22,609 | 26,808 | ||||||
| Indiabulls Housing Finance, Ltd. |
3,349 | 61,871 | ||||||
| Indian Oil Corp., Ltd. |
37,783 | 231,661 | ||||||
| Infosys, Ltd. |
50,056 | 689,611 | ||||||
| Infosys, Ltd. ADR (b) |
115,836 | 1,690,047 | ||||||
| ITC, Ltd. |
266,687 | 1,054,581 | ||||||
| JSW Steel, Ltd. |
8,042 | 30,588 | ||||||
| Larsen & Toubro, Ltd. |
378 | 6,609 | ||||||
| Larsen & Toubro, Ltd. GDR |
2,777 | 49,014 | ||||||
| LIC Housing Finance, Ltd. |
1,712 | 16,443 | ||||||
| Lupin, Ltd. |
17,828 | 276,754 | ||||||
| Mahindra & Mahindra Financial Services, Ltd. |
1,058 | 6,679 | ||||||
| Mahindra & Mahindra, Ltd. |
336 | 6,452 | ||||||
| Mahindra & Mahindra, Ltd. GDR |
2,991 | 57,726 | ||||||
| Marico, Ltd. |
87,257 | 415,112 | ||||||
| Maruti Suzuki India, Ltd. |
7,602 | 928,510 | ||||||
| Motherson Sumi Systems, Ltd. |
34,388 | 177,099 | ||||||
| Nestle India, Ltd. |
2,329 | 257,306 | ||||||
| NTPC, Ltd. |
19,011 | 48,735 | ||||||
| Oil & Natural Gas Corp., Ltd. |
22,703 | 59,416 | ||||||
| Piramal Enterprises, Ltd. |
149 | 5,982 | ||||||
| Power Finance Corp., Ltd. |
10,713 | 19,993 | ||||||
| Reliance Industries, Ltd. |
7,230 | 86,435 | ||||||
| Reliance Industries, Ltd. GDR (c) |
14,262 | 340,149 | ||||||
| Rural Electrification Corp., Ltd. |
6,150 | 14,396 | ||||||
| Shree Cement, Ltd. |
468 | 133,121 | ||||||
| Shriram Transport Finance Co., Ltd. |
991 | 15,997 | ||||||
| Siemens, Ltd. |
93 | 1,693 | ||||||
See accompanying notes to financial statements.
161
Table of Contents
SPDR MSCI Emerging Markets StrategicFactors ETF
SCHEDULE OF INVESTMENTS (continued)
September 30, 2017
| Security Description |
Shares |
Value |
||||||
| State Bank of India GDR |
3,312 | $ | 127,181 | |||||
| Sun Pharmaceutical Industries, Ltd. |
87,240 | 672,130 | ||||||
| Tata Consultancy Services, Ltd. |
54,067 | 2,016,297 | ||||||
| Tata Motors, Ltd. (a) |
3,760 | 23,111 | ||||||
| Tata Motors, Ltd. ADR (a) |
6,190 | 193,561 | ||||||
| Tata Motors, Ltd. Class A (a) |
12,816 | 43,616 | ||||||
| Tata Power Co., Ltd. |
17,137 | 20,411 | ||||||
| Tata Steel, Ltd. |
742 | 7,413 | ||||||
| Tata Steel, Ltd. GDR |
6,218 | 61,869 | ||||||
| Tech Mahindra, Ltd. |
69,243 | 485,348 | ||||||
| Titan Co., Ltd. |
30,276 | 270,941 | ||||||
| UltraTech Cement, Ltd. |
253 | 14,928 | ||||||
| United Spirits, Ltd. (a) |
35 | 1,285 | ||||||
| UPL, Ltd. |
20,924 | 249,377 | ||||||
| Vedanta, Ltd. |
20,103 | 96,714 | ||||||
| Wipro, Ltd. |
92,875 | 398,472 | ||||||
| Wipro, Ltd. ADR (b) |
111,606 | 633,922 | ||||||
| Yes Bank, Ltd. |
14,150 | 75,819 | ||||||
| Zee Entertainment Enterprises, Ltd. |
30,215 | 240,582 | ||||||
|
|
|
|||||||
| 20,314,517 | ||||||||
|
|
|
|||||||
| INDONESIA — 4.1% |
||||||||
| Adaro Energy Tbk PT |
199,800 | 27,072 | ||||||
| AKR Corporindo Tbk PT |
13,800 | 7,275 | ||||||
| Astra International Tbk PT |
185,800 | 108,978 | ||||||
| Bank Central Asia Tbk PT |
1,271,325 | 1,916,096 | ||||||
| Bank Danamon Indonesia Tbk PT |
95,600 | 36,908 | ||||||
| Bank Mandiri Persero Tbk PT |
280,000 | 139,803 | ||||||
| Bank Negara Indonesia Persero Tbk PT |
168,900 | 92,795 | ||||||
| Bank Rakyat Indonesia Persero Tbk PT |
785,700 | 891,051 | ||||||
| Bumi Serpong Damai Tbk PT |
83,800 | 11,012 | ||||||
| Charoen Pokphand Indonesia Tbk PT |
404,900 | 82,369 | ||||||
| Gudang Garam Tbk PT |
58,800 | 287,255 | ||||||
| Hanjaya Mandala Sampoerna Tbk PT |
2,341,700 | 671,094 | ||||||
| Indocement Tunggal Prakarsa Tbk PT |
118,500 | 166,282 | ||||||
| Indofood CBP Sukses Makmur Tbk PT |
341,100 | 220,959 | ||||||
| Indofood Sukses Makmur Tbk PT |
299,500 | 187,340 | ||||||
| Jasa Marga Persero Tbk PT |
100,700 | 41,868 | ||||||
| Kalbe Farma Tbk PT |
3,959,500 | 489,462 | ||||||
| Lippo Karawaci Tbk PT |
200,900 | 10,814 | ||||||
| Matahari Department Store Tbk PT |
196,800 | 135,520 | ||||||
| Media Nusantara Citra Tbk PT |
30,000 | 2,940 | ||||||
| Pakuwon Jati Tbk PT |
1,268,878 | 57,466 | ||||||
| Perusahaan Gas Negara Persero Tbk |
213,700 | 24,989 | ||||||
| Semen Indonesia Persero Tbk PT |
183,400 | 137,867 | ||||||
| Summarecon Agung Tbk PT |
67,000 | 5,298 | ||||||
| Surya Citra Media Tbk PT |
435,600 | 70,827 | ||||||
| Telekomunikasi Indonesia Persero Tbk PT |
5,332,775 | 1,852,950 | ||||||
| Tower Bersama Infrastructure Tbk PT |
67,191 | 32,800 | ||||||
| Unilever Indonesia Tbk PT |
293,100 | 1,065,749 | ||||||
| United Tractors Tbk PT |
22,000 | 52,268 | ||||||
| Waskita Karya Persero Tbk PT |
17,300 | 2,280 | ||||||
| XL Axiata Tbk PT (a) |
39,100 | 10,857 | ||||||
|
|
|
|||||||
| 8,840,244 | ||||||||
|
|
|
|||||||
| MALAYSIA — 3.3% |
||||||||
| AirAsia Bhd |
10,400 | 8,497 | ||||||
| Alliance Bank Malaysia Bhd |
6,900 | 6,373 | ||||||
| AMMB Holdings Bhd |
41,200 | 42,542 | ||||||
| Astro Malaysia Holdings Bhd |
6,700 | 4,475 | ||||||
| Axiata Group Bhd |
24,502 | 30,406 | ||||||
| British American Tobacco Malaysia Bhd |
10,600 | 109,803 | ||||||
| CIMB Group Holdings Bhd |
67,272 | 100,370 | ||||||
| Dialog Group Bhd |
8,000 | 3,789 | ||||||
| DiGi.Com Bhd |
73,200 | 84,945 | ||||||
| Felda Global Ventures Holdings Bhd |
17,200 | 6,884 | ||||||
| Gamuda Bhd |
7,800 | 9,753 | ||||||
| Genting Bhd |
35,400 | 80,064 | ||||||
| Genting Malaysia Bhd |
29,200 | 37,205 | ||||||
| Genting Plantations Bhd |
800 | 1,951 | ||||||
| HAP Seng Consolidated Bhd |
49,400 | 106,463 | ||||||
| Hartalega Holdings Bhd |
64,300 | 105,987 | ||||||
| Hong Leong Bank Bhd |
193,520 | 726,874 | ||||||
| Hong Leong Financial Group Bhd |
2,900 | 11,401 | ||||||
| IHH Healthcare Bhd |
593,100 | 807,655 | ||||||
| IJM Corp. Bhd |
31,200 | 24,384 | ||||||
| IOI Corp. Bhd |
14,900 | 16,020 | ||||||
| IOI Properties Group Bhd |
18,308 | 8,758 | ||||||
| Kuala Lumpur Kepong Bhd |
2,600 | 15,123 | ||||||
| Malayan Banking Bhd |
424,901 | 958,983 | ||||||
| Malaysia Airports Holdings Bhd |
3,100 | 6,240 | ||||||
| Maxis Bhd |
438,600 | 602,458 | ||||||
| MISC Bhd |
20,800 | 35,960 | ||||||
| Petronas Chemicals Group Bhd |
239,000 | 412,625 | ||||||
| Petronas Dagangan Bhd |
32,700 | 188,340 | ||||||
| Petronas Gas Bhd |
135,900 | 576,107 | ||||||
| PPB Group Bhd |
3,300 | 13,177 | ||||||
| Public Bank Bhd |
220,111 | 1,065,499 | ||||||
| RHB Capital Bhd |
13,138 | 15,651 | ||||||
| Sapura Energy Bhd |
73,300 | 26,386 | ||||||
| Sime Darby Bhd |
20,727 | 44,277 | ||||||
| Telekom Malaysia Bhd |
135,785 | 209,024 | ||||||
| Tenaga Nasional Bhd |
120,300 | 407,980 | ||||||
| UMW Holdings Bhd (a) |
7,400 | 9,726 | ||||||
| Westports Holdings Bhd |
126,238 | 113,906 | ||||||
| YTL Corp. Bhd |
61,900 | 19,937 | ||||||
| YTL Power International Bhd |
17,800 | 5,775 | ||||||
|
|
|
|||||||
| 7,061,773 | ||||||||
|
|
|
|||||||
| MEXICO — 2.4% |
||||||||
| Alfa SAB de CV Class A |
49,296 | 62,410 | ||||||
| America Movil SAB de CV Series L |
408,239 | 363,294 | ||||||
| Arca Continental SAB de CV |
69,881 | 479,028 | ||||||
| Cemex SAB de CV Series CPO (a) |
166,070 | 151,353 | ||||||
| Coca-Cola Femsa SAB de CV Series L |
13,775 | 106,738 | ||||||
| El Puerto de Liverpool SAB de CV Series C1 |
1,702 | 13,778 | ||||||
| Fibra Uno Administracion SA de CV REIT |
55,097 | 93,208 | ||||||
| Fomento Economico Mexicano SAB de CV |
14,332 | 137,359 | ||||||
| Gentera SAB de CV |
57,470 | 93,393 | ||||||
| Gruma SAB de CV Class B |
24,990 | 366,375 | ||||||
| Grupo Aeroportuario del Pacifico SAB de CV Class B |
56,846 | 583,509 | ||||||
See accompanying notes to financial statements.
162
Table of Contents
SPDR MSCI Emerging Markets StrategicFactors ETF
SCHEDULE OF INVESTMENTS (continued)
September 30, 2017
| Security Description |
Shares |
Value |
||||||
| Grupo Aeroportuario del Sureste SAB de CV Class B |
19,970 | $ | 381,150 | |||||
| Grupo Bimbo SAB de CV Series A |
26,298 | 63,677 | ||||||
| Grupo Carso SAB de CV Series A1 |
6,463 | 25,547 | ||||||
| Grupo Financiero Banorte SAB de CV Series O |
34,273 | 237,014 | ||||||
| Grupo Financiero Inbursa SAB de CV Series O |
32,236 | 59,131 | ||||||
| Grupo Financiero Santander Mexico SAB de CV Class B |
27,438 | 55,860 | ||||||
| Grupo Lala SAB de CV |
35,590 | 60,364 | ||||||
| Grupo Mexico SAB de CV Series B |
50,952 | 156,257 | ||||||
| Grupo Televisa SAB Series CPO |
21,530 | 106,409 | ||||||
| Industrias Penoles SAB de CV |
733 | 18,258 | ||||||
| Infraestructura Energetica Nova SAB de CV |
33,760 | 189,555 | ||||||
| Kimberly-Clark de Mexico SAB de CV Class A |
7,326 | 14,947 | ||||||
| Mexichem SAB de CV |
13,846 | 36,660 | ||||||
| Promotora y Operadora de Infraestructura SAB de CV |
14,280 | 151,574 | ||||||
| Wal-Mart de Mexico SAB de CV |
502,389 | 1,153,661 | ||||||
|
|
|
|||||||
| 5,160,509 | ||||||||
|
|
|
|||||||
| PAKISTAN — 0.1% |
||||||||
| Engro Corp., Ltd. |
4,469 | 12,860 | ||||||
| Habib Bank, Ltd. |
38,734 | 66,476 | ||||||
| Lucky Cement, Ltd. |
18,906 | 101,451 | ||||||
| MCB Bank, Ltd. |
53,997 | 107,148 | ||||||
| Oil & Gas Development Co., Ltd. |
5,662 | 7,991 | ||||||
| United Bank, Ltd. |
6,406 | 11,566 | ||||||
|
|
|
|||||||
| 307,492 | ||||||||
|
|
|
|||||||
| PERU — 0.5% |
||||||||
| Cia de Minas Buenaventura SAA ADR |
3,178 | 40,647 | ||||||
| Credicorp, Ltd. |
5,158 | 1,057,493 | ||||||
| Southern Copper Corp. |
596 | 23,697 | ||||||
|
|
|
|||||||
| 1,121,837 | ||||||||
|
|
|
|||||||
| PHILIPPINES — 1.5% |
||||||||
| Aboitiz Equity Ventures, Inc. |
292,620 | 422,229 | ||||||
| Aboitiz Power Corp. |
465,400 | 392,571 | ||||||
| Alliance Global Group, Inc. |
30,800 | 9,725 | ||||||
| Ayala Corp. |
1,450 | 27,687 | ||||||
| Ayala Land, Inc. |
28,300 | 24,234 | ||||||
| Bank of the Philippine Islands |
238,130 | 466,186 | ||||||
| BDO Unibank, Inc. |
213,142 | 548,385 | ||||||
| DMCI Holdings, Inc. |
237,530 | 72,943 | ||||||
| Globe Telecom, Inc. |
130 | 5,246 | ||||||
| GT Capital Holdings, Inc. |
840 | 19,198 | ||||||
| International Container Terminal Services, Inc. |
4,380 | 8,967 | ||||||
| JG Summit Holdings, Inc. |
17,090 | 25,232 | ||||||
| Jollibee Foods Corp. |
104,870 | 503,298 | ||||||
| Megaworld Corp. |
143,000 | 14,722 | ||||||
| Metro Pacific Investments Corp. |
115,000 | 15,167 | ||||||
| Metropolitan Bank & Trust Co. |
93,851 | 159,807 | ||||||
| PLDT, Inc. |
1,481 | 48,629 | ||||||
| Robinsons Land Corp. |
56,500 | 28,139 | ||||||
| Security Bank Corp. |
22,860 | 109,441 | ||||||
| SM Investments Corp. |
1,685 | 29,289 | ||||||
| SM Prime Holdings, Inc. |
52,200 | 35,400 | ||||||
| Universal Robina Corp. |
90,590 | 272,486 | ||||||
|
|
|
|||||||
| 3,238,981 | ||||||||
|
|
|
|||||||
| POLAND — 1.0% |
||||||||
| Alior Bank SA (a) |
1,473 | 27,686 | ||||||
| Bank Handlowy w Warszawie SA |
551 | 10,449 | ||||||
| Bank Millennium SA (a) |
14,998 | 28,852 | ||||||
| Bank Pekao SA |
9,759 | 342,802 | ||||||
| Bank Zachodni WBK SA |
1,833 | 175,707 | ||||||
| CCC SA |
149 | 11,286 | ||||||
| Cyfrowy Polsat SA |
10,631 | 75,707 | ||||||
| Eurocash SA |
8,893 | 94,251 | ||||||
| Grupa Azoty SA |
685 | 15,001 | ||||||
| Grupa Lotos SA |
3,936 | 64,539 | ||||||
| KGHM Polska Miedz SA |
1,578 | 50,840 | ||||||
| LPP SA |
11 | 24,669 | ||||||
| mBank SA (a) |
297 | 34,151 | ||||||
| Orange Polska SA (a) |
16,362 | 23,753 | ||||||
| PGE Polska Grupa Energetyczna SA (a) |
114,342 | 417,335 | ||||||
| Polski Koncern Naftowy ORLEN SA |
12,090 | 403,780 | ||||||
| Polskie Gornictwo Naftowe i Gazownictwo SA |
28,305 | 52,742 | ||||||
| Powszechna Kasa Oszczednosci Bank Polski SA (a) |
17,139 | 166,171 | ||||||
| Powszechny Zaklad Ubezpieczen SA |
7,224 | 91,193 | ||||||
| Synthos SA |
6,586 | 9,290 | ||||||
| Tauron Polska Energia SA (a) |
79,133 | 81,436 | ||||||
|
|
|
|||||||
| 2,201,640 | ||||||||
|
|
|
|||||||
| QATAR — 0.8% |
||||||||
| Barwa Real Estate Co. |
1,726 | 15,199 | ||||||
| Commercial Bank PQSC (a) |
20,392 | 163,046 | ||||||
| Doha Bank QPSC |
17,897 | 142,557 | ||||||
| Ezdan Holding Group QSC |
5,573 | 16,073 | ||||||
| Industries Qatar QSC |
1,548 | 38,985 | ||||||
| Masraf Al Rayan QSC |
7,913 | 80,679 | ||||||
| Ooredoo QSC |
1,190 | 27,064 | ||||||
| Qatar Electricity & Water Co. QSC |
9,513 | 456,739 | ||||||
| Qatar Gas Transport Co., Ltd. |
8,042 | 34,878 | ||||||
| Qatar Insurance Co. SAQ |
9,011 | 129,544 | ||||||
| Qatar Islamic Bank SAQ |
11,543 | 288,864 | ||||||
| Qatar National Bank QPSC |
11,691 | 391,760 | ||||||
|
|
|
|||||||
| 1,785,388 | ||||||||
|
|
|
|||||||
| ROMANIA — 0.1% |
||||||||
| NEPI Rockcastle PLC |
17,384 | 236,765 | ||||||
|
|
|
|||||||
| RUSSIA — 3.8% |
||||||||
| Alrosa PJSC |
164,429 | 233,284 | ||||||
| Gazprom PJSC ADR |
308,074 | 1,290,830 | ||||||
| Inter RAO UES PJSC |
792,000 | 51,387 | ||||||
| LUKOIL PJSC ADR |
16,574 | 877,262 | ||||||
| Magnit PJSC GDR |
21,099 | 864,004 | ||||||
| MMC Norilsk Nickel PJSC ADR |
6,279 | 108,093 | ||||||
| Mobile TeleSystems PJSC ADR |
36,106 | 376,947 | ||||||
| Moscow Exchange MICEX-RTS PJSC |
14,640 | 29,459 | ||||||
| Novatek PJSC GDR |
6,475 | 759,518 | ||||||
| Novolipetsk Steel PJSC |
220,954 | 506,305 | ||||||
See accompanying notes to financial statements.
163
Table of Contents
SPDR MSCI Emerging Markets StrategicFactors ETF
SCHEDULE OF INVESTMENTS (continued)
September 30, 2017
| Security Description |
Shares |
Value |
||||||
| PhosAgro PJSC GDR |
544 | $ | 7,752 | |||||
| Rosneft Oil Co. PJSC (a) |
21,943 | 121,672 | ||||||
| Rosneft Oil Co. PJSC GDR |
41,984 | 233,221 | ||||||
| Rostelecom PJSC ADR |
5,746 | 43,095 | ||||||
| RusHydro PJSC ADR |
31,874 | 45,739 | ||||||
| Sberbank of Russia PJSC ADR (f) |
62,391 | 888,136 | ||||||
| Sberbank of Russia PJSC ADR (f) |
6,842 | 97,635 | ||||||
| Severstal PJSC GDR |
1,233 | 18,433 | ||||||
| Sistema PJSC FC GDR |
3,537 | 16,978 | ||||||
| Surgutneftegas OJSC ADR (f) |
44,694 | 231,068 | ||||||
| Surgutneftegas OJSC ADR (f) |
52,692 | 266,622 | ||||||
| Tatneft PJSC ADR (f) |
1,551 | 67,065 | ||||||
| Tatneft PJSC ADR (f) |
16,455 | 702,629 | ||||||
| Transneft PJSC Preference Shares |
36 | 111,019 | ||||||
| VTB Bank PJSC |
48,106,319 | 51,522 | ||||||
| VTB Bank PJSC GDR |
57,982 | 124,661 | ||||||
|
|
|
|||||||
| 8,124,336 | ||||||||
|
|
|
|||||||
| SOUTH AFRICA — 4.6% |
||||||||
| Anglo American Platinum, Ltd. (a) |
315 | 8,049 | ||||||
| AngloGold Ashanti, Ltd. |
4,371 | 41,209 | ||||||
| Aspen Pharmacare Holdings, Ltd. |
2,430 | 54,636 | ||||||
| Barclays Africa Group, Ltd. |
15,318 | 157,689 | ||||||
| Bid Corp., Ltd. |
21,787 | 490,359 | ||||||
| Bidvest Group, Ltd. |
29,182 | 373,158 | ||||||
| Brait SE (a) |
6,600 | 26,151 | ||||||
| Capitec Bank Holdings, Ltd. |
2,955 | 188,006 | ||||||
| Coronation Fund Managers, Ltd. |
17,099 | 85,226 | ||||||
| Discovery, Ltd. |
3,245 | 33,804 | ||||||
| Exxaro Resources, Ltd. |
3,833 | 34,874 | ||||||
| FirstRand, Ltd. (b) |
259,438 | 999,708 | ||||||
| Fortress Income Fund, Ltd. |
3,468 | 9,953 | ||||||
| Fortress Income Fund, Ltd. Class A |
137,945 | 176,230 | ||||||
| Foschini Group, Ltd. |
13,622 | 136,951 | ||||||
| Gold Fields, Ltd. |
12,701 | 55,479 | ||||||
| Growthpoint Properties, Ltd. REIT |
27,045 | 48,672 | ||||||
| Hyprop Investments, Ltd. |
2,387 | 18,689 | ||||||
| Impala Platinum Holdings, Ltd. (a) |
10,528 | 24,171 | ||||||
| Imperial Holdings, Ltd. |
4,348 | 61,579 | ||||||
| Investec, Ltd. |
1,818 | 13,195 | ||||||
| Liberty Holdings, Ltd. |
7,279 | 56,733 | ||||||
| Life Healthcare Group Holdings, Ltd. |
10,243 | 17,979 | ||||||
| Massmart Holdings, Ltd. |
7,509 | 62,041 | ||||||
| MMI Holdings, Ltd. |
19,703 | 25,317 | ||||||
| Mondi, Ltd. |
6,859 | 183,625 | ||||||
| Mr. Price Group, Ltd. |
20,863 | 278,184 | ||||||
| MTN Group, Ltd. |
23,936 | 220,490 | ||||||
| Naspers, Ltd. Class N |
875 | 189,224 | ||||||
| Nedbank Group, Ltd. |
4,799 | 72,025 | ||||||
| Netcare, Ltd. |
77,450 | 136,516 | ||||||
| Novus Holdings, Ltd. |
303 | 146 | ||||||
| Pick n Pay Stores, Ltd. |
61,582 | 262,747 | ||||||
| Pioneer Foods Group, Ltd. |
7,004 | 58,486 | ||||||
| PSG Group, Ltd. |
561 | 9,727 | ||||||
| Rand Merchant Investment Holdings, Ltd. |
38,383 | 117,885 | ||||||
| Redefine Properties, Ltd. REIT |
35,951 | 28,463 | ||||||
| Remgro, Ltd. |
5,564 | 84,615 | ||||||
| Resilient REIT, Ltd. REIT |
3,655 | 36,023 | ||||||
| RMB Holdings, Ltd. |
51,876 | 243,964 | ||||||
| Sanlam, Ltd. |
96,735 | 484,732 | ||||||
| Sappi, Ltd. |
11,220 | 76,498 | ||||||
| Sasol, Ltd. |
11,449 | 314,577 | ||||||
| Shoprite Holdings, Ltd. |
30,711 | 470,565 | ||||||
| Sibanye-Stillwater |
16,821 | 18,961 | ||||||
| SPAR Group, Ltd. |
28,561 | 353,414 | ||||||
| Standard Bank Group, Ltd. |
92,869 | 1,085,403 | ||||||
| Steinhoff International Holdings NV |
31,403 | 139,613 | ||||||
| Telkom SA SOC, Ltd. |
4,744 | 20,831 | ||||||
| Tiger Brands, Ltd. |
12,274 | 343,017 | ||||||
| Truworths International, Ltd. |
34,567 | 197,763 | ||||||
| Vodacom Group, Ltd. |
77,854 | 929,116 | ||||||
| Woolworths Holdings, Ltd. |
64,369 | 285,507 | ||||||
|
|
|
|||||||
| 9,841,975 | ||||||||
|
|
|
|||||||
| SOUTH KOREA — 12.3% |
||||||||
| Amorepacific Corp. |
1,889 | 427,987 | ||||||
| Amorepacific Corp. Preference Shares |
532 | 72,460 | ||||||
| AMOREPACIFIC Group |
329 | 35,475 | ||||||
| BGF retail Co., Ltd. |
1,403 | 101,671 | ||||||
| BNK Financial Group, Inc. |
11,275 | 98,442 | ||||||
| Celltrion, Inc. (a) |
90 | 11,158 | ||||||
| Cheil Worldwide, Inc. |
3,029 | 48,132 | ||||||
| CJ CheilJedang Corp. |
366 | 113,282 | ||||||
| CJ Corp. |
345 | 51,358 | ||||||
| CJ E&M Corp. |
78 | 5,257 | ||||||
| CJ Logistics Corp. (a) |
1,032 | 147,319 | ||||||
| Coway Co., Ltd. |
4,291 | 352,167 | ||||||
| Daelim Industrial Co., Ltd. |
596 | 41,681 | ||||||
| Daewoo Engineering & Construction Co., Ltd. (a) |
1,280 | 8,058 | ||||||
| DGB Financial Group, Inc. |
5,537 | 50,760 | ||||||
| Dongbu Insurance Co., Ltd. |
9,338 | 595,167 | ||||||
| Dongsuh Cos., Inc. |
104 | 2,433 | ||||||
| Doosan Bobcat, Inc. |
556 | 17,743 | ||||||
| Doosan Heavy Industries & Construction Co., Ltd. |
1,377 | 20,559 | ||||||
| E-MART, Inc. |
940 | 171,118 | ||||||
| GS Engineering & Construction Corp. (a) |
912 | 21,220 | ||||||
| GS Holdings Corp. |
1,010 | 57,848 | ||||||
| GS Retail Co., Ltd. |
2,608 | 78,671 | ||||||
| Hana Financial Group, Inc. |
9,900 | 409,277 | ||||||
| Hankook Tire Co., Ltd. |
1,239 | 65,122 | ||||||
| Hanmi Pharm Co., Ltd. (a) |
7 | 2,778 | ||||||
| Hanmi Science Co., Ltd. (a) |
10 | 802 | ||||||
| Hanon Systems |
11,770 | 129,482 | ||||||
| Hanssem Co., Ltd. |
1,478 | 195,501 | ||||||
| Hanwha Chemical Corp. |
2,271 | 64,342 | ||||||
| Hanwha Corp. |
2,894 | 111,176 | ||||||
| Hanwha Life Insurance Co., Ltd. |
14,527 | 86,882 | ||||||
| Hanwha Techwin Co., Ltd. (a) |
219 | 6,348 | ||||||
| Hotel Shilla Co., Ltd. |
70 | 3,557 | ||||||
| Hyosung Corp. |
446 | 56,658 | ||||||
| Hyundai Department Store Co., Ltd. |
165 | 12,735 | ||||||
| Hyundai Development Co-Engineering & Construction |
486 | 15,148 | ||||||
| Hyundai Engineering & Construction Co., Ltd. |
1,798 | 60,203 | ||||||
See accompanying notes to financial statements.
164
Table of Contents
SPDR MSCI Emerging Markets StrategicFactors ETF
SCHEDULE OF INVESTMENTS (continued)
September 30, 2017
| Security Description |
Shares |
Value |
||||||
| Hyundai Glovis Co., Ltd. |
395 | $ | 51,041 | |||||
| Hyundai Heavy Industries Co., Ltd. (a) |
1,050 | 132,929 | ||||||
| Hyundai Marine & Fire Insurance Co., Ltd. |
7,613 | 301,103 | ||||||
| Hyundai Mobis Co., Ltd. |
4,901 | 1,026,970 | ||||||
| Hyundai Motor Co. |
4,756 | 624,943 | ||||||
| Hyundai Motor Co. GDR |
304 | 12,251 | ||||||
| Hyundai Motor Co. Preference Shares (f) |
1,844 | 165,024 | ||||||
| Hyundai Motor Co. Preference Shares (f) |
1,083 | 88,505 | ||||||
| Hyundai Robotics Co., Ltd. (a) |
148 | 55,047 | ||||||
| Hyundai Steel Co. |
2,907 | 134,011 | ||||||
| Hyundai Wia Corp. |
499 | 28,450 | ||||||
| Industrial Bank of Korea |
9,717 | 122,168 | ||||||
| Kakao Corp. |
779 | 97,940 | ||||||
| Kangwon Land, Inc. |
19,599 | 598,913 | ||||||
| KB Financial Group, Inc. |
2,339 | 114,566 | ||||||
| KB Financial Group, Inc. ADR |
8,530 | 418,226 | ||||||
| KCC Corp. |
88 | 28,774 | ||||||
| KEPCO Plant Service & Engineering Co., Ltd. |
954 | 34,525 | ||||||
| Kia Motors Corp. |
14,934 | 412,678 | ||||||
| Korea Aerospace Industries, Ltd. |
4,236 | 161,622 | ||||||
| Korea Electric Power Corp. |
2,266 | 77,159 | ||||||
| Korea Electric Power Corp. ADR (b) |
29,666 | 497,202 | ||||||
| Korea Gas Corp. (a) |
1,400 | 51,460 | ||||||
| Korea Investment Holdings Co., Ltd. |
682 | 36,442 | ||||||
| Korea Zinc Co., Ltd. |
93 | 40,234 | ||||||
| Korean Air Lines Co., Ltd. (a) |
1,669 | 44,882 | ||||||
| KT Corp. |
123 | 3,130 | ||||||
| KT Corp. ADR |
11,016 | 152,792 | ||||||
| KT&G Corp. |
14,726 | 1,356,435 | ||||||
| Kumho Petrochemical Co., Ltd. |
181 | 11,394 | ||||||
| LG Chem, Ltd. |
684 | 234,101 | ||||||
| LG Chem, Ltd. Preference Shares |
108 | 23,904 | ||||||
| LG Corp. |
1,697 | 119,420 | ||||||
| LG Display Co., Ltd. |
2,309 | 61,588 | ||||||
| LG Display Co., Ltd. ADR |
14,500 | 194,590 | ||||||
| LG Electronics, Inc. |
3,066 | 220,577 | ||||||
| LG Household & Health Care, Ltd. |
611 | 499,320 | ||||||
| LG Household & Health Care, Ltd. Preference Shares |
204 | 106,511 | ||||||
| LG Innotek Co., Ltd. |
392 | 52,707 | ||||||
| Lotte Chemical Corp. |
234 | 77,227 | ||||||
| Lotte Chilsung Beverage Co., Ltd. |
4 | 4,729 | ||||||
| Lotte Confectionery Co., Ltd. |
391 | 56,669 | ||||||
| Lotte Shopping Co., Ltd. |
452 | 97,279 | ||||||
| Medy-Tox, Inc. |
244 | 105,346 | ||||||
| Mirae Asset Daewoo Co., Ltd. |
7,055 | 60,550 | ||||||
| NAVER Corp. |
2,628 | 1,709,399 | ||||||
| NCSoft Corp. |
928 | 376,353 | ||||||
| Netmarble Games Corp. (a) (c) |
181 | 23,942 | ||||||
| NH Investment & Securities Co., Ltd. |
2,276 | 27,025 | ||||||
| OCI Co., Ltd. |
282 | 25,237 | ||||||
| Orion Corp. (a) |
145 | 12,280 | ||||||
| Ottogi Corp. |
4 | 2,563 | ||||||
| Pan Ocean Co., Ltd. (a) |
4,005 | 18,847 | ||||||
| POSCO |
606 | 167,723 | ||||||
| POSCO ADR |
6,481 | 449,781 | ||||||
| Posco Daewoo Corp. |
966 | 16,278 | ||||||
| S-1 Corp. |
6,450 | 502,327 | ||||||
| S-Oil Corp. |
614 | 68,350 | ||||||
| Samsung Biologics Co., Ltd. (a) (c) |
2,909 | 857,194 | ||||||
| Samsung C&T Corp. |
1,165 | 137,316 | ||||||
| Samsung Card Co., Ltd. |
333 | 10,714 | ||||||
| Samsung Electro-Mechanics Co., Ltd. |
1,610 | 143,380 | ||||||
| Samsung Electronics Co., Ltd. |
524 | 1,173,035 | ||||||
| Samsung Electronics Co., Ltd. GDR (f) |
540 | 493,560 | ||||||
| Samsung Electronics Co., Ltd. GDR (f) |
2,388 | 2,703,216 | ||||||
| Samsung Electronics Co., Ltd. Preference Shares |
116 | 208,837 | ||||||
| Samsung Fire & Marine Insurance Co., Ltd. |
2,241 | 547,850 | ||||||
| Samsung Heavy Industries Co., Ltd. (a) |
6,664 | 65,165 | ||||||
| Samsung Life Insurance Co., Ltd. |
5,765 | 568,774 | ||||||
| Samsung SDI Co., Ltd. |
1,568 | 271,749 | ||||||
| Samsung SDS Co., Ltd. |
318 | 46,783 | ||||||
| Samsung Securities Co., Ltd. |
1,158 | 34,932 | ||||||
| Shinhan Financial Group Co., Ltd. |
2,097 | 92,093 | ||||||
| Shinhan Financial Group Co., Ltd. ADR (b) |
9,989 | 442,513 | ||||||
| Shinsegae, Inc. |
150 | 25,538 | ||||||
| SK Holdings Co., Ltd. |
1,331 | 334,682 | ||||||
| SK Hynix, Inc. |
14,337 | 1,037,707 | ||||||
| SK Innovation Co., Ltd. |
1,605 | 278,862 | ||||||
| SK Networks Co., Ltd. |
5,408 | 34,043 | ||||||
| SK Telecom Co., Ltd. |
510 | 113,546 | ||||||
| SK Telecom Co., Ltd. ADR |
20,203 | 496,792 | ||||||
| Woori Bank |
9,618 | 149,894 | ||||||
| Yuhan Corp. |
187 | 33,715 | ||||||
|
|
|
|||||||
| 26,247,306 | ||||||||
|
|
|
|||||||
| TAIWAN — 14.5% |
||||||||
| Acer, Inc. (a) |
107,258 | 53,587 | ||||||
| Advanced Semiconductor Engineering, Inc. |
135,248 | 165,470 | ||||||
| Advantech Co., Ltd. |
76,951 | 548,127 | ||||||
| Asia Cement Corp. |
43,200 | 38,108 | ||||||
| Asia Pacific Telecom Co., Ltd. (a) |
9,000 | 3,027 | ||||||
| Asustek Computer, Inc. |
42,000 | 345,568 | ||||||
| AU Optronics Corp. |
361,000 | 144,643 | ||||||
| Catcher Technology Co., Ltd. |
42,000 | 391,274 | ||||||
| Cathay Financial Holding Co., Ltd. |
124,100 | 197,257 | ||||||
| Chailease Holding Co., Ltd. |
10,160 | 24,492 | ||||||
| Chang Hwa Commercial Bank, Ltd. |
94,585 | 51,154 | ||||||
| Cheng Shin Rubber Industry Co., Ltd. |
21,000 | 42,036 | ||||||
| Chicony Electronics Co., Ltd. |
185,644 | 440,785 | ||||||
| China Airlines, Ltd. (a) |
81,000 | 30,585 | ||||||
| China Development Financial Holding Corp. |
356,000 | 106,833 | ||||||
| China Life Insurance Co., Ltd. |
47,711 | 44,920 | ||||||
| China Steel Corp. |
173,440 | 139,271 | ||||||
| Chunghwa Telecom Co., Ltd. |
496,540 | 1,711,134 | ||||||
| Compal Electronics, Inc. |
218,000 | 154,923 | ||||||
| CTBC Financial Holding Co., Ltd. |
358,900 | 224,875 | ||||||
| Delta Electronics, Inc. |
160,623 | 826,315 | ||||||
See accompanying notes to financial statements.
165
Table of Contents
SPDR MSCI Emerging Markets StrategicFactors ETF
SCHEDULE OF INVESTMENTS (continued)
September 30, 2017
| Security Description |
Shares |
Value |
||||||
| E.Sun Financial Holding Co., Ltd. |
156,750 | $ | 93,562 | |||||
| Eclat Textile Co., Ltd. |
12,379 | 150,431 | ||||||
| Eva Airways Corp. |
163,279 | 79,690 | ||||||
| Evergreen Marine Corp. Taiwan, Ltd. (a) |
35,000 | 20,199 | ||||||
| Far Eastern New Century Corp. |
102,560 | 81,171 | ||||||
| Far EasTone Telecommunications Co., Ltd. |
427,449 | 1,016,326 | ||||||
| Feng TAY Enterprise Co., Ltd. |
25,468 | 115,901 | ||||||
| First Financial Holding Co., Ltd. |
1,203,458 | 771,905 | ||||||
| Formosa Chemicals & Fibre Corp. |
41,000 | 124,660 | ||||||
| Formosa Petrochemical Corp. |
116,000 | 399,749 | ||||||
| Formosa Plastics Corp. |
84,000 | 254,294 | ||||||
| Formosa Taffeta Co., Ltd. |
171,000 | 171,992 | ||||||
| Foxconn Technology Co., Ltd. |
74,892 | 216,101 | ||||||
| Fubon Financial Holding Co., Ltd. |
115,000 | 179,379 | ||||||
| Giant Manufacturing Co., Ltd. |
17,000 | 79,887 | ||||||
| Highwealth Construction Corp. |
15,500 | 20,574 | ||||||
| Hiwin Technologies Corp. |
1,020 | 8,998 | ||||||
| Hon Hai Precision Industry Co., Ltd. |
1,330,163 | 4,605,828 | ||||||
| Hotai Motor Co., Ltd. |
3,000 | 34,577 | ||||||
| HTC Corp. (a) |
8,000 | 19,997 | ||||||
| Hua Nan Financial Holdings Co., Ltd. |
1,063,009 | 576,655 | ||||||
| Innolux Corp. |
384,751 | 179,535 | ||||||
| Inventec Corp. |
94,000 | 69,437 | ||||||
| Largan Precision Co., Ltd. |
7,000 | 1,230,379 | ||||||
| Lite-On Technology Corp. |
340,952 | 486,849 | ||||||
| MediaTek, Inc. |
22,877 | 214,632 | ||||||
| Mega Financial Holding Co., Ltd. |
221,657 | 173,238 | ||||||
| Merida Industry Co., Ltd. |
13,000 | 56,589 | ||||||
| Micro-Star International Co., Ltd. |
45,000 | 96,755 | ||||||
| Nan Ya Plastics Corp. |
60,000 | 147,804 | ||||||
| Nanya Technology Corp. |
50,000 | 141,472 | ||||||
| Nien Made Enterprise Co., Ltd. |
12,000 | 123,071 | ||||||
| Novatek Microelectronics Corp. |
47,000 | 176,692 | ||||||
| Pegatron Corp. |
58,000 | 150,528 | ||||||
| Phison Electronics Corp. |
16,000 | 189,949 | ||||||
| Pou Chen Corp. |
39,000 | 48,936 | ||||||
| Powertech Technology, Inc. |
54,000 | 155,639 | ||||||
| President Chain Store Corp. |
98,000 | 825,716 | ||||||
| Quanta Computer, Inc. |
115,000 | 264,708 | ||||||
| Realtek Semiconductor Corp. |
3,000 | 10,338 | ||||||
| Ruentex Development Co., Ltd. (a) |
11,443 | 10,491 | ||||||
| Ruentex Industries, Ltd. (a) |
34,000 | 50,343 | ||||||
| Shin Kong Financial Holding Co., Ltd. |
185,936 | 55,675 | ||||||
| Siliconware Precision Industries Co., Ltd. |
532,300 | 851,357 | ||||||
| SinoPac Financial Holdings Co., Ltd. |
278,620 | 83,428 | ||||||
| Standard Foods Corp. |
67,168 | 163,911 | ||||||
| Synnex Technology International Corp. |
302,900 | 363,592 | ||||||
| TaiMed Biologics, Inc. (a) |
6,000 | 37,990 | ||||||
| Taishin Financial Holding Co., Ltd. |
173,027 | 74,463 | ||||||
| Taiwan Business Bank |
378,575 | 103,121 | ||||||
| Taiwan Cement Corp. |
42,000 | 46,814 | ||||||
| Taiwan Cooperative Financial Holding Co., Ltd. |
1,917,165 | 989,435 | ||||||
| Taiwan Fertilizer Co., Ltd. |
10,000 | 12,944 | ||||||
| Taiwan High Speed Rail Corp. |
18,000 | 14,276 | ||||||
| Taiwan Mobile Co., Ltd. |
358,542 | 1,276,960 | ||||||
| Taiwan Semiconductor Manufacturing Co., Ltd. |
867,495 | 6,193,532 | ||||||
| Teco Electric and Machinery Co., Ltd. |
32,000 | 28,651 | ||||||
| Transcend Information, Inc. |
79,000 | 223,265 | ||||||
| Uni-President Enterprises Corp. |
54,164 | 113,422 | ||||||
| United Microelectronics Corp. |
467,000 | 233,315 | ||||||
| Vanguard International Semiconductor Corp. |
56,000 | 96,584 | ||||||
| Wistron Corp. |
134,671 | 107,696 | ||||||
| WPG Holdings, Ltd. |
161,000 | 214,231 | ||||||
| Yuanta Financial Holding Co., Ltd. |
222,466 | 95,739 | ||||||
| Yulon Motor Co., Ltd. |
25,000 | 21,394 | ||||||
| Zhen Ding Technology Holding, Ltd. |
4,000 | 8,099 | ||||||
|
|
|
|||||||
| 30,919,255 | ||||||||
|
|
|
|||||||
| THAILAND — 3.6% |
||||||||
| Advanced Info Service PCL (e) |
100,400 | 575,004 | ||||||
| Airports of Thailand PCL (e) |
38,200 | 67,580 | ||||||
| Airports of Thailand PCL NVDR |
242,470 | 428,957 | ||||||
| Bangkok Bank PCL |
3,700 | 21,634 | ||||||
| Bangkok Bank PCL NVDR |
3,500 | 19,573 | ||||||
| Bangkok Dusit Medical Services PCL (e) |
702,692 | 431,940 | ||||||
| Bangkok Expressway & Metro PCL (e) |
1,250,733 | 301,901 | ||||||
| Banpu PCL (e) |
24,370 | 12,861 | ||||||
| BEC World PCL (e) |
65,625 | 32,075 | ||||||
| Berli Jucker PCL NVDR |
11,700 | 18,506 | ||||||
| BTS Group Holdings PCL (e) |
1,846,898 | 473,493 | ||||||
| BTS Group Holdings PCL NVDR |
10,800 | 2,769 | ||||||
| Bumrungrad Hospital PCL (e) |
82,500 | 531,859 | ||||||
| Central Pattana PCL (e) |
69,400 | 162,315 | ||||||
| Central Pattana PCL NVDR |
31,700 | 74,141 | ||||||
| Charoen Pokphand Foods PCL (e) |
39,186 | 31,431 | ||||||
| CP ALL PCL (e) |
302,500 | 596,383 | ||||||
| Delta Electronics Thailand PCL (e) |
157,144 | 411,119 | ||||||
| Delta Electronics Thailand PCL NVDR |
300 | 785 | ||||||
| Electricity Generating PCL (e) |
42,300 | 298,066 | ||||||
| Energy Absolute PCL (e) |
900 | 1,032 | ||||||
| Energy Absolute PCL NVDR |
2,700 | 3,097 | ||||||
| Glow Energy PCL (e) |
68,800 | 184,120 | ||||||
| Glow Energy PCL NVDR |
84,800 | 226,938 | ||||||
| Home Product Center PCL (e) |
697,859 | 251,104 | ||||||
| Indorama Ventures PCL (e) |
1,400 | 1,774 | ||||||
| Indorama Ventures PCL NVDR |
24,800 | 31,418 | ||||||
| IRPC PCL (e) |
194,300 | 36,704 | ||||||
| Kasikornbank PCL |
14,000 | 89,835 | ||||||
| Kasikornbank PCL NVDR |
47,500 | 294,828 | ||||||
| KCE Electronics PCL NVDR |
92,500 | 277,361 | ||||||
| Krung Thai Bank PCL (e) |
96,900 | 54,624 | ||||||
| Minor International PCL (e) |
12,100 | 14,785 | ||||||
| Minor International PCL NVDR |
60,619 | 74,070 | ||||||
| PTT Exploration & Production PCL (e) |
31,928 | 85,684 | ||||||
| PTT Global Chemical PCL (e) |
41,703 | 96,286 | ||||||
| PTT PCL (e) |
24,656 | 301,639 | ||||||
| Robinson PCL (e) |
13,500 | 26,109 | ||||||
See accompanying notes to financial statements.
166
Table of Contents
SPDR MSCI Emerging Markets StrategicFactors ETF
SCHEDULE OF INVESTMENTS (continued)
September 30, 2017
| Security Description |
Shares |
Value |
||||||
| Robinson PCL NVDR |
83,300 | $ | 161,105 | |||||
| Siam Cement PCL |
42,150 | 634,462 | ||||||
| Siam Cement PCL NVDR |
7,400 | 110,944 | ||||||
| Siam Commercial Bank PCL (e) |
31,200 | 143,136 | ||||||
| Thai Oil PCL (e) |
15,588 | 43,235 | ||||||
| Thai Union Group PCL Class F (e) |
16,200 | 9,715 | ||||||
| Thai Union Group PCL NVDR |
146,600 | 87,916 | ||||||
| TMB Bank PCL (e) |
32,600 | 2,463 | ||||||
| TMB Bank PCL NVDR |
192,100 | 14,515 | ||||||
| True Corp. PCL (a) (e) |
124,300 | 22,736 | ||||||
|
|
|
|||||||
| 7,774,027 | ||||||||
|
|
|
|||||||
| TURKEY — 0.8% |
||||||||
| Akbank TAS |
47,103 | 124,510 | ||||||
| Anadolu Efes Biracilik Ve Malt Sanayii A/S . |
3,694 | 21,731 | ||||||
| Arcelik A/S |
3,519 | 22,483 | ||||||
| BIM Birlesik Magazalar A/S |
17,978 | 375,374 | ||||||
| Coca-Cola Icecek A/S |
584 | 6,116 | ||||||
| Emlak Konut Gayrimenkul Yatirim Ortakligi A/S REIT (a) |
130,431 | 98,297 | ||||||
| Eregli Demir ve Celik Fabrikalari TAS |
19,876 | 43,205 | ||||||
| Ford Otomotiv Sanayi A/S |
4,784 | 61,345 | ||||||
| Haci Omer Sabanci Holding A/S |
16,752 | 47,202 | ||||||
| KOC Holding A/S |
12,688 | 58,336 | ||||||
| Petkim Petrokimya Holding A/S |
5,373 | 9,035 | ||||||
| TAV Havalimanlari Holding A/S |
2,250 | 11,167 | ||||||
| Tofas Turk Otomobil Fabrikasi A/S |
7,848 | 68,150 | ||||||
| Tupras Turkiye Petrol Rafinerileri A/S |
2,022 | 69,142 | ||||||
| Turk Hava Yollari AO (a) |
24,073 | 59,233 | ||||||
| Turk Telekomunikasyon A/S (a) |
5,928 | 11,319 | ||||||
| Turkcell Iletisim Hizmetleri A/S |
18,918 | 67,509 | ||||||
| Turkiye Garanti Bankasi A/S |
59,459 | 161,852 | ||||||
| Turkiye Halk Bankasi A/S |
26,846 | 91,497 | ||||||
| Turkiye Is Bankasi Class C |
58,371 | 111,289 | ||||||
| Turkiye Sise ve Cam Fabrikalari A/S |
25,924 | 29,889 | ||||||
| Turkiye Vakiflar Bankasi TAO Class D |
24,930 | 43,956 | ||||||
| Ulker Biskuvi Sanayi A/S |
824 | 4,484 | ||||||
| Yapi ve Kredi Bankasi A/S (a) |
25,137 | 30,537 | ||||||
|
|
|
|||||||
| 1,627,658 | ||||||||
|
|
|
|||||||
| UNITED ARAB EMIRATES — 1.2% |
||||||||
| Abu Dhabi Commercial Bank PJSC |
46,434 | 89,767 | ||||||
| Aldar Properties PJSC |
66,658 | 42,289 | ||||||
| DAMAC Properties Dubai Co. PJSC |
190,189 | 196,784 | ||||||
| DP World, Ltd. |
18,234 | 409,536 | ||||||
| Dubai Islamic Bank PJSC |
96,995 | 159,781 | ||||||
| DXB Entertainments PJSC (a) |
58,609 | 12,128 | ||||||
| Emaar Malls PJSC |
6,474 | 4,107 | ||||||
| Emaar Properties PJSC |
44,433 | 102,715 | ||||||
| Emirates Telecommunications Group Co. PJSC |
203,889 | 960,418 | ||||||
| First Abu Dhabi Bank PJSC |
228,267 | 633,963 | ||||||
|
|
|
|||||||
| 2,611,488 | ||||||||
|
|
|
|||||||
| UNITED STATES — 1.1% |
||||||||
| Yum China Holdings, Inc. (a) |
56,530 | 2,259,504 | ||||||
|
|
|
|||||||
| TOTAL COMMON STOCKS (Cost $186,351,269) |
212,720,642 | |||||||
|
|
|
|||||||
| RIGHTS — 0.0% (g) |
||||||||
| CHINA — 0.0% (g) |
||||||||
| China State Construction International Holdings, Ltd. |
14,000 | 90 | ||||||
|
|
|
|||||||
| SHORT-TERM INVESTMENTS — 1.8% |
| |||||||
| State Street Institutional U.S. Government Money Market Fund, Class G Shares 0.96% (h) (i) |
647,704 | 647,704 | ||||||
| State Street Navigator Securities Lending Government Money Market Portfolio (h) (j) |
3,055,835 | 3,055,835 | ||||||
|
|
|
|||||||
| TOTAL SHORT-TERM INVESTMENTS |
3,703,539 | |||||||
|
|
|
|||||||
| TOTAL INVESTMENTS — 101.2% |
216,424,271 | |||||||
| LIABILITIES IN EXCESS OF OTHER ASSETS — (1.2)% |
(2,479,308 | ) | ||||||
|
|
|
|||||||
| NET ASSETS — 100.0% |
$ | 213,944,963 | ||||||
|
|
|
|||||||
| (a) | Non-income producing security. |
| (b) | All or a portion of the shares of the security are on loan at September 30, 2017. |
| (c) | Securities purchased pursuant to Rule 144A of the Securities Act of 1933, as amended. These securities, which represent 0.9% of net assets as of September 30, 2017, are considered liquid and may be resold in transactions exempt from registration, normally to qualified institutional buyers. |
| (d) | Fair valued as determined in good faith by the Trust’s Oversight Committee in accordance with policy and procedures approved by the Board of Trustees. Security value is determined based on Level 3 inputs. As of September 30, 2017, total aggregate fair value of the security is $0, representing 0.0% of the Fund’s net assets. |
| (e) | Fair valued as determined in good faith by the Trust’s Oversight Committee in accordance with policy and procedures approved by the Board of Trustees. As of September 30, 2017, total aggregate fair value of securities is $5,208,956 representing 2.4% of net assets. |
| (f) | Reflects separate holdings of the issuer’s common stock traded on different securities exchanges. |
| (g) | Amount is less than 0.05% of net assets. |
| (h) | The Fund invested in certain money market funds managed by SSGA Funds Management, Inc. Amounts related to these transactions during the period ended September 30, 2017 are shown in the Affiliate Table below. |
| (i) | The rate shown is the annualized seven-day yield at September 30, 2017. |
| (j) | Investment of cash collateral for securities loaned. |
ADR = American Depositary Receipt
GDR = Global Depositary Receipt
NVDR = Non Voting Depositary Receipt
REIT = Real Estate Investment Trust
See accompanying notes to financial statements.
167
Table of Contents
SPDR MSCI Emerging Markets StrategicFactors ETF
SCHEDULE OF INVESTMENTS (continued)
September 30, 2017
The following table summarizes the value of the Fund’s investments according to the fair value hierarchy as of September 30, 2017.
| Description |
Level 1 — Quoted Prices |
Level 2 — Other Significant Observable Inputs |
Level 3 — Significant Unobservable Inputs |
Total | ||||||||||||
| ASSETS: |
||||||||||||||||
| INVESTMENTS: |
||||||||||||||||
| Common Stocks |
||||||||||||||||
| Brazil |
$ | 11,954,657 | $ | — | $ | — | $ | 11,954,657 | ||||||||
| Chile |
3,907,122 | — | — | 3,907,122 | ||||||||||||
| China |
51,230,354 | — | 0 | (a) | 51,230,354 | |||||||||||
| Colombia |
777,340 | — | — | 777,340 | ||||||||||||
| Czech Republic |
692,295 | — | — | 692,295 | ||||||||||||
| Egypt |
672,050 | — | — | 672,050 | ||||||||||||
| Greece |
1,222,730 | — | — | 1,222,730 | ||||||||||||
| Hong Kong |
1,671,361 | — | 0 | (a) | 1,671,361 | |||||||||||
| Hungary |
918,038 | — | — | 918,038 | ||||||||||||
| India |
20,306,824 | 7,693 | — | 20,314,517 | ||||||||||||
| Indonesia |
8,840,244 | — | — | 8,840,244 | ||||||||||||
| Malaysia |
7,061,773 | — | — | 7,061,773 | ||||||||||||
| Mexico |
5,160,509 | — | — | 5,160,509 | ||||||||||||
| Pakistan |
307,492 | — | — | 307,492 | ||||||||||||
| Peru |
1,121,837 | — | — | 1,121,837 | ||||||||||||
| Philippines |
3,238,981 | — | — | 3,238,981 | ||||||||||||
| Poland |
2,201,640 | — | — | 2,201,640 | ||||||||||||
| Qatar |
1,785,388 | — | — | 1,785,388 | ||||||||||||
| Romania |
236,765 | — | — | 236,765 | ||||||||||||
| Russia |
8,124,336 | — | — | 8,124,336 | ||||||||||||
| South Africa |
9,841,975 | — | — | 9,841,975 | ||||||||||||
| South Korea |
26,247,306 | — | — | 26,247,306 | ||||||||||||
| Taiwan |
30,919,255 | — | — | 30,919,255 | ||||||||||||
| Thailand |
2,572,854 | 5,201,173 | — | 7,774,027 | ||||||||||||
| Turkey |
1,627,658 | — | — | 1,627,658 | ||||||||||||
| United Arab Emirates |
2,611,488 | — | — | 2,611,488 | ||||||||||||
| United States |
2,259,504 | — | — | 2,259,504 | ||||||||||||
| Rights |
||||||||||||||||
| China |
— | 90 | — | 90 | ||||||||||||
| Short-Term Investments |
3,703,539 | — | — | 3,703,539 | ||||||||||||
|
|
|
|
|
|
|
|
|
|||||||||
| TOTAL INVESTMENTS |
$ | 211,215,315 | $ | 5,208,956 | $ | 0 | $ | 216,424,271 | ||||||||
|
|
|
|
|
|
|
|
|
|||||||||
| (a) | Fund held Level 3 securities that were valued at $0 at September 30, 2017. |
See accompanying notes to financial statements.
168
Table of Contents
SPDR MSCI Emerging Markets StrategicFactors ETF
SCHEDULE OF INVESTMENTS (continued)
September 30, 2017
Affiliate Table
| Number of Shares Held at 9/30/16 |
Value at 9/30/16 |
Cost of Purchases |
Proceeds from Shares Sold |
Realized Gain (Loss) |
Change in Unrealized Appreciation/ Depreciation |
Number of Shares Held at 9/30/17 |
Value at 9/30/17 |
Dividend Income |
||||||||||||||||||||||||||||
| State Street Institutional Liquid Reserves Fund, Premier Class |
— | $ | — | $ | 1,677,403 | $ | 1,677,403 | $ | — | $ | — | — | $ | — | $ | 19 | ||||||||||||||||||||
| State Street Institutional U.S. Government Money Market Fund, Class G Shares |
— | — | 3,864,001 | 3,216,297 | — | — | 647,704 | 647,704 | 578 | |||||||||||||||||||||||||||
| State Street Institutional U.S. Government Money Market Fund, Premier Class |
— | — | 7,333,090 | 7,333,090 | — | — | — | — | 519 | |||||||||||||||||||||||||||
| State Street Navigator Securities Lending Government Money Market Portfolio* |
— | — | 7,265,944 | 4,210,109 | — | — | 3,055,835 | 3,055,835 | 9,943 | |||||||||||||||||||||||||||
|
|
|
|
|
|
|
|
|
|
|
|
|
|
|
|||||||||||||||||||||||
| TOTAL |
$ | — | $ | 20,140,438 | $ | 16,436,899 | $ | — | $ | — | $ | 3,703,539 | $ | 11,059 | ||||||||||||||||||||||
|
|
|
|
|
|
|
|
|
|
|
|
|
|
|
|||||||||||||||||||||||
| * | Effective October 5, 2016, the name of State Street Navigator Securities Lending Prime Portfolio was changed to State Street Navigator Securities Lending Government Money Market Portfolio. |
See accompanying notes to financial statements.
169
Table of Contents
SPDR MSCI World StrategicFactors ETF
SCHEDULE OF INVESTMENTS
September 30, 2017
| Security Description |
Shares |
Value |
||||||
| COMMON STOCKS — 99.7% |
| |||||||
| AUSTRALIA — 1.4% |
| |||||||
| AGL Energy, Ltd. |
260 | $ | 4,768 | |||||
| Amcor, Ltd. |
899 | 10,729 | ||||||
| AMP, Ltd. |
677 | 2,566 | ||||||
| Aurizon Holdings, Ltd. |
701 | 2,695 | ||||||
| Australia & New Zealand Banking Group, Ltd. |
830 | 19,277 | ||||||
| Bendigo & Adelaide Bank, Ltd. |
185 | 1,685 | ||||||
| BHP Billiton PLC |
207 | 3,651 | ||||||
| BHP Billiton, Ltd. |
405 | 8,192 | ||||||
| Brambles, Ltd. |
1,262 | 8,912 | ||||||
| Caltex Australia, Ltd. |
66 | 1,662 | ||||||
| Cochlear, Ltd. |
57 | 7,121 | ||||||
| Commonwealth Bank of Australia |
352 | 20,784 | ||||||
| CSL, Ltd. |
534 | 56,130 | ||||||
| Flight Centre Travel Group, Ltd. |
3 | 106 | ||||||
| Fortescue Metals Group, Ltd. |
788 | 3,178 | ||||||
| Incitec Pivot, Ltd. |
375 | 1,059 | ||||||
| Insurance Australia Group, Ltd. |
605 | 3,024 | ||||||
| LendLease Group |
254 | 3,572 | ||||||
| Macquarie Group, Ltd. |
60 | 4,280 | ||||||
| Medibank Pvt, Ltd. |
596 | 1,366 | ||||||
| National Australia Bank, Ltd. |
761 | 18,809 | ||||||
| Newcrest Mining, Ltd. |
326 | 5,377 | ||||||
| Oil Search, Ltd. |
299 | 1,642 | ||||||
| Orica, Ltd. |
174 | 2,699 | ||||||
| QBE Insurance Group, Ltd. |
329 | 2,584 | ||||||
| REA Group, Ltd. |
81 | 4,258 | ||||||
| Santos, Ltd. (a) |
3 | 10 | ||||||
| Scentre Group REIT |
1,405 | 4,333 | ||||||
| SEEK, Ltd. |
219 | 2,854 | ||||||
| Sonic Healthcare, Ltd. |
297 | 4,873 | ||||||
| South32, Ltd. |
572 | 1,468 | ||||||
| Suncorp Group, Ltd. |
251 | 2,570 | ||||||
| Telstra Corp., Ltd. |
7,942 | 21,749 | ||||||
| Transurban Group Stapled Security |
90 | 839 | ||||||
| Wesfarmers, Ltd. |
186 | 6,032 | ||||||
| Westfield Corp. REIT |
1,708 | 10,507 | ||||||
| Westpac Banking Corp. |
855 | 21,414 | ||||||
| Woodside Petroleum, Ltd. |
204 | 4,658 | ||||||
| Woolworths, Ltd. |
843 | 16,675 | ||||||
|
|
|
|||||||
| 298,108 | ||||||||
|
|
|
|||||||
| AUSTRIA — 0.1% |
| |||||||
| Erste Group Bank AG (a) |
99 | 4,277 | ||||||
| OMV AG |
90 | 5,244 | ||||||
| Raiffeisen Bank International AG (a) |
3 | 101 | ||||||
| Voestalpine AG |
69 | 3,519 | ||||||
|
|
|
|||||||
| 13,141 | ||||||||
|
|
|
|||||||
| BELGIUM — 0.3% |
| |||||||
| Ageas |
78 | 3,666 | ||||||
| Anheuser-Busch InBev SA |
87 | 10,419 | ||||||
| Colruyt SA |
63 | 3,228 | ||||||
| Groupe Bruxelles Lambert SA |
30 | 3,156 | ||||||
| KBC Group NV |
57 | 4,832 | ||||||
| Proximus SADP |
602 | 20,749 | ||||||
| Solvay SA |
24 | 3,586 | ||||||
| UCB SA |
144 | 10,253 | ||||||
| Umicore SA |
63 | 5,213 | ||||||
|
|
|
|||||||
| 65,102 | ||||||||
|
|
|
|||||||
| CANADA — 3.3% |
| |||||||
| Agnico Eagle Mines, Ltd. |
555 | 25,024 | ||||||
| Agrium, Inc. |
36 | 3,849 | ||||||
| Alimentation Couche-Tard, Inc. Class B |
287 | 13,057 | ||||||
| Bank of Montreal |
405 | 30,579 | ||||||
| Bank of Nova Scotia |
281 | 18,020 | ||||||
| Barrick Gold Corp. |
171 | 2,746 | ||||||
| BCE, Inc. |
471 | 22,016 | ||||||
| Bombardier, Inc. Class B (a) |
581 | 1,050 | ||||||
| Brookfield Asset Management, Inc. Class A |
147 | 6,056 | ||||||
| Canadian Imperial Bank of Commerce |
242 | 21,124 | ||||||
| Canadian National Railway Co. |
567 | 46,869 | ||||||
| Canadian Natural Resources, Ltd. |
186 | 6,215 | ||||||
| Canadian Pacific Railway, Ltd. |
96 | 16,087 | ||||||
| Canadian Tire Corp., Ltd. Class A |
33 | 4,099 | ||||||
| CI Financial Corp. |
120 | 2,618 | ||||||
| Constellation Software, Inc. |
18 | 9,798 | ||||||
| Dollarama, Inc. |
15 | 1,638 | ||||||
| Enbridge, Inc. (b) |
153 | 6,376 | ||||||
| Enbridge, Inc. (b) |
153 | 6,402 | ||||||
| Fairfax Financial Holdings, Ltd. |
36 | 18,691 | ||||||
| First Capital Realty, Inc. |
360 | 5,665 | ||||||
| Franco-Nevada Corp. |
719 | 55,570 | ||||||
| Gildan Activewear, Inc. |
156 | 4,863 | ||||||
| Goldcorp, Inc. |
1,819 | 23,562 | ||||||
| Great-West Lifeco, Inc. |
111 | 3,187 | ||||||
| Imperial Oil, Ltd. |
63 | 2,008 | ||||||
| Intact Financial Corp. |
498 | 41,042 | ||||||
| Loblaw Cos., Ltd. |
78 | 4,247 | ||||||
| Magna International, Inc. |
393 | 20,925 | ||||||
| Manulife Financial Corp. |
599 | 12,122 | ||||||
| Metro, Inc. |
225 | 7,720 | ||||||
| Onex Corp. |
54 | 4,158 | ||||||
| Pembina Pipeline Corp. (c) |
24 | 840 | ||||||
| Power Corp. of Canada |
117 | 2,966 | ||||||
| Power Financial Corp. |
99 | 2,740 | ||||||
| PrairieSky Royalty, Ltd. |
236 | 6,025 | ||||||
| Restaurant Brands International, Inc. |
7 | 446 | ||||||
| RioCan Real Estate Investment Trust |
441 | 8,438 | ||||||
| Rogers Communications, Inc. Class B |
719 | 36,989 | ||||||
| Royal Bank of Canada |
770 | 59,438 | ||||||
| Saputo, Inc. |
168 | 5,802 | ||||||
| Shaw Communications, Inc. Class B |
1,082 | 24,847 | ||||||
| Smart Real Estate Investment Trust REIT |
308 | 7,250 | ||||||
| Sun Life Financial, Inc. |
96 | 3,814 | ||||||
| Suncor Energy, Inc. |
596 | 20,840 | ||||||
| TELUS Corp. |
471 | 16,902 | ||||||
| Toronto-Dominion Bank |
875 | 49,149 | ||||||
| Wheaton Precious Metals Corp. |
456 | 8,678 | ||||||
|
|
|
|||||||
| 702,547 | ||||||||
|
|
|
|||||||
| CHILE — 0.0% (d) |
| |||||||
| Antofagasta PLC |
111 | 1,413 | ||||||
|
|
|
|||||||
| DENMARK — 1.3% |
| |||||||
| Carlsberg A/S Class B |
30 | 3,284 | ||||||
| Chr Hansen Holding A/S |
78 | 6,691 | ||||||
See accompanying notes to financial statements.
170
Table of Contents
SPDR MSCI World StrategicFactors ETF
SCHEDULE OF INVESTMENTS (continued)
September 30, 2017
| Security Description |
Shares |
Value |
||||||
| Coloplast A/S Class B |
578 | $ | 46,921 | |||||
| Danske Bank A/S |
156 | 6,240 | ||||||
| DONG Energy A/S (e) |
438 | 25,077 | ||||||
| DSV A/S |
186 | 14,074 | ||||||
| H Lundbeck A/S |
299 | 17,256 | ||||||
| ISS A/S |
435 | 17,497 | ||||||
| Novo Nordisk A/S Class B |
2,169 | 103,716 | ||||||
| Novozymes A/S Class B |
278 | 14,269 | ||||||
| Pandora A/S |
102 | 10,071 | ||||||
| Tryg A/S |
180 | 4,158 | ||||||
| Vestas Wind Systems A/S |
24 | 2,154 | ||||||
| William Demant Holding A/S (a) |
537 | 14,178 | ||||||
|
|
|
|||||||
| 285,586 | ||||||||
|
|
|
|||||||
| FINLAND — 0.3% |
| |||||||
| Elisa Oyj |
501 | 21,571 | ||||||
| Fortum Oyj |
3 | 60 | ||||||
| Kone Oyj Class B |
299 | 15,836 | ||||||
| Nokia Oyj (b) |
384 | 2,306 | ||||||
| Nokia Oyj (b) |
435 | 2,603 | ||||||
| Orion Oyj Class B |
105 | 4,873 | ||||||
| Sampo Oyj Class A |
72 | 3,807 | ||||||
| Stora Enso Oyj Class R |
308 | 4,351 | ||||||
| UPM-Kymmene Oyj |
177 | 4,798 | ||||||
| Wartsila Oyj Abp |
108 | 7,648 | ||||||
|
|
|
|||||||
| 67,853 | ||||||||
|
|
|
|||||||
| FRANCE — 2.1% |
| |||||||
| Aeroports de Paris |
75 | 12,129 | ||||||
| Air Liquide SA |
48 | 6,404 | ||||||
| Airbus SE |
90 | 8,555 | ||||||
| Alstom SA |
81 | 3,441 | ||||||
| Arkema SA |
33 | 4,048 | ||||||
| AXA SA |
779 | 23,567 | ||||||
| BNP Paribas SA |
522 | 42,118 | ||||||
| Bouygues SA |
81 | 3,845 | ||||||
| Bureau Veritas SA |
3 | 77 | ||||||
| Capgemini SE |
42 | 4,924 | ||||||
| Carrefour SA |
194 | 3,921 | ||||||
| Casino Guichard Perrachon SA |
3 | 178 | ||||||
| Cie de Saint-Gobain |
114 | 6,795 | ||||||
| Cie Generale des Etablissements Michelin |
51 | 7,446 | ||||||
| CNP Assurances |
144 | 3,376 | ||||||
| Credit Agricole SA |
1,001 | 18,200 | ||||||
| Danone SA |
80 | 6,277 | ||||||
| Dassault Systemes SE |
75 | 7,589 | ||||||
| Electricite de France SA |
3 | 36 | ||||||
| Engie SA |
762 | 12,945 | ||||||
| Essilor International SA |
45 | 5,573 | ||||||
| Hermes International |
26 | 13,111 | ||||||
| Iliad SA |
3 | 797 | ||||||
| Kering |
15 | 5,977 | ||||||
| L’Oreal SA |
189 | 40,196 | ||||||
| Lagardere SCA |
3 | 100 | ||||||
| Legrand SA |
48 | 3,466 | ||||||
| LVMH Moet Hennessy Louis Vuitton SE |
36 | 9,935 | ||||||
| Natixis SA |
471 | 3,770 | ||||||
| Orange SA |
635 | 10,405 | ||||||
| Pernod Ricard SA |
30 | 4,151 | ||||||
| Peugeot SA |
242 | 5,765 | ||||||
| Publicis Groupe SA |
101 | 7,055 | ||||||
| Renault SA |
75 | 7,369 | ||||||
| Rexel SA |
132 | 2,285 | ||||||
| Safran SA |
48 | 4,905 | ||||||
| Sanofi |
189 | 18,771 | ||||||
| Schneider Electric SE (a) |
78 | 6,790 | ||||||
| SCOR SE |
87 | 3,649 | ||||||
| Societe BIC SA |
24 | 2,877 | ||||||
| Societe Generale SA |
450 | 26,352 | ||||||
| Sodexo SA |
30 | 3,742 | ||||||
| Suez Environment Co. |
165 | 3,013 | ||||||
| Thales SA |
84 | 9,511 | ||||||
| TOTAL SA |
844 | 45,344 | ||||||
| Unibail-Rodamco SE REIT |
15 | 3,649 | ||||||
| Valeo SA |
207 | 15,363 | ||||||
| Veolia Environnement SA |
183 | 4,229 | ||||||
| Vinci SA |
111 | 10,550 | ||||||
| Vivendi SA |
171 | 4,330 | ||||||
| Zodiac Aerospace |
33 | 954 | ||||||
|
|
|
|||||||
| 459,855 | ||||||||
|
|
|
|||||||
| GERMANY — 2.4% |
| |||||||
| adidas AG |
33 | 7,467 | ||||||
| Allianz SE |
135 | 30,315 | ||||||
| BASF SE |
230 | 24,482 | ||||||
| Bayer AG |
126 | 17,175 | ||||||
| Bayerische Motoren Werke AG |
135 | 13,698 | ||||||
| Bayerische Motoren Werke AG Preference Shares |
33 | 2,941 | ||||||
| Beiersdorf AG |
66 | 7,103 | ||||||
| Brenntag AG |
54 | 3,008 | ||||||
| Commerzbank AG (a) |
1,004 | 13,662 | ||||||
| Continental AG |
96 | 24,372 | ||||||
| Daimler AG |
393 | 31,347 | ||||||
| Deutsche Bank AG |
1,527 | 26,410 | ||||||
| Deutsche Boerse AG |
18 | 1,952 | ||||||
| Deutsche Lufthansa AG |
3 | 83 | ||||||
| Deutsche Post AG |
854 | 38,027 | ||||||
| Deutsche Telekom AG |
845 | 15,769 | ||||||
| E.ON SE |
1,175 | 13,302 | ||||||
| Fresenius Medical Care AG & Co. KGaA |
30 | 2,936 | ||||||
| Fresenius SE & Co. KGaA |
63 | 5,083 | ||||||
| Fuchs Petrolub SE Preference Shares |
66 | 3,908 | ||||||
| Hannover Rueck SE |
36 | 4,339 | ||||||
| HeidelbergCement AG |
36 | 3,701 | ||||||
| Henkel AG & Co. KGaA |
81 | 9,858 | ||||||
| Henkel AG & Co. KGaA Preference Shares |
135 | 18,378 | ||||||
| HUGO BOSS AG |
69 | 6,084 | ||||||
| Infineon Technologies AG |
281 | 7,066 | ||||||
| KS AG (c) |
87 | 2,371 | ||||||
| Lanxess AG |
45 | 3,552 | ||||||
| Linde AG |
30 | 6,258 | ||||||
| MAN SE |
135 | 15,240 | ||||||
| Merck KGaA |
36 | 4,006 | ||||||
| METRO AG (a) |
254 | 5,370 | ||||||
| Muenchener Rueckversicherungs-Gesellschaft AG in Muenchen |
63 | 13,473 | ||||||
See accompanying notes to financial statements.
171
Table of Contents
SPDR MSCI World StrategicFactors ETF
SCHEDULE OF INVESTMENTS (continued)
September 30, 2017
| Security Description |
Shares |
Value |
||||||
| Porsche Automobil Holding SE Preference Shares |
180 | $ | 11,512 | |||||
| ProSiebenSat.1 Media SE |
150 | 5,113 | ||||||
| RWE AG (a) |
543 | 12,338 | ||||||
| SAP SE |
90 | 9,862 | ||||||
| Siemens AG |
153 | 21,561 | ||||||
| Telefonica Deutschland Holding AG |
968 | 5,433 | ||||||
| ThyssenKrupp AG |
111 | 3,290 | ||||||
| TUI AG |
1,316 | 22,353 | ||||||
| United Internet AG |
90 | 5,604 | ||||||
| Volkswagen AG |
48 | 8,129 | ||||||
| Volkswagen AG Preference Shares |
156 | 25,450 | ||||||
|
|
|
|||||||
| 513,381 | ||||||||
|
|
|
|||||||
| HONG KONG — 1.9% |
||||||||
| AIA Group, Ltd. |
1,200 | 8,849 | ||||||
| Bank of East Asia, Ltd. |
1,874 | 8,098 | ||||||
| BOC Hong Kong Holdings, Ltd. |
3,000 | 14,576 | ||||||
| CK Asset Holdings, Ltd. |
1,270 | 10,512 | ||||||
| CK Hutchison Holdings, Ltd. |
1,500 | 19,176 | ||||||
| CK Infrastructure Holdings, Ltd. |
3,000 | 25,811 | ||||||
| CLP Holdings, Ltd. |
6,000 | 61,493 | ||||||
| Hang Seng Bank, Ltd. |
3,000 | 73,130 | ||||||
| HK Electric Investments & HK Electric Investments, Ltd. (c) (e) |
10,331 | 9,417 | ||||||
| HKT Trust & HKT, Ltd. |
11,540 | 14,021 | ||||||
| Hong Kong & China Gas Co., Ltd. |
13,193 | 24,796 | ||||||
| Hong Kong Exchanges & Clearing, Ltd. |
938 | 25,219 | ||||||
| Jardine Matheson Holdings, Ltd. |
100 | 6,336 | ||||||
| Link REIT |
3,000 | 24,313 | ||||||
| MTR Corp., Ltd. |
6,059 | 35,373 | ||||||
| New World Development Co., Ltd. |
3,169 | 4,552 | ||||||
| Power Assets Holdings, Ltd. |
3,000 | 25,984 | ||||||
| Yue Yuen Industrial Holdings, Ltd. |
3,000 | 11,407 | ||||||
|
|
|
|||||||
| 403,063 | ||||||||
|
|
|
|||||||
| IRELAND — 0.3% |
||||||||
| Bank of Ireland Group PLC (a) |
274 | 2,245 | ||||||
| CRH PLC |
132 | 5,036 | ||||||
| Experian PLC |
773 | 15,546 | ||||||
| James Hardie Industries PLC |
326 | 4,533 | ||||||
| Kerry Group PLC Class A |
317 | 30,464 | ||||||
| Paddy Power Betfair PLC |
57 | 5,689 | ||||||
| XL Group, Ltd. |
96 | 3,787 | ||||||
|
|
|
|||||||
| 67,300 | ||||||||
|
|
|
|||||||
| ISRAEL — 0.5% |
||||||||
| Azrieli Group, Ltd. |
168 | 9,331 | ||||||
| Bank Hapoalim BM |
2,934 | 20,540 | ||||||
| Bank Leumi Le-Israel BM |
2,511 | 13,328 | ||||||
| Bezeq The Israeli Telecommunication Corp., Ltd. |
3,497 | 5,000 | ||||||
| Check Point Software Technologies, Ltd. (a) |
210 | 23,944 | ||||||
| Israel Chemicals, Ltd. |
3 | 13 | ||||||
| Mizrahi Tefahot Bank, Ltd. |
587 | 10,523 | ||||||
| Nice, Ltd. |
168 | 13,402 | ||||||
| Teva Pharmaceutical Industries, Ltd. |
456 | 7,972 | ||||||
|
|
|
|||||||
| 104,053 | ||||||||
|
|
|
|||||||
| ITALY — 0.7% |
| |||||||
| Assicurazioni Generali SpA |
602 | 11,216 | ||||||
| Atlantia SpA |
114 | 3,600 | ||||||
| Enel SpA |
2,802 | 16,877 | ||||||
| Eni SpA |
390 | 6,455 | ||||||
| Ferrari NV |
78 | 8,622 | ||||||
| Intesa Sanpaolo SpA |
3,458 | 12,231 | ||||||
| Luxottica Group SpA |
226 | 12,635 | ||||||
| Mediobanca SpA |
683 | 7,331 | ||||||
| Snam SpA |
6,545 | 31,538 | ||||||
| Telecom Italia SpA/Milano (a) (b) |
5,197 | 4,869 | ||||||
| Telecom Italia SpA/Milano Savings Shares (b) |
4,040 | 3,038 | ||||||
| UniCredit SpA (a) |
1,374 | 29,271 | ||||||
|
|
|
|||||||
| 147,683 | ||||||||
|
|
|
|||||||
| JAPAN — 9.9% |
| |||||||
| ABC-Mart, Inc. |
300 | 15,831 | ||||||
| Aeon Co., Ltd. (c) |
300 | 4,431 | ||||||
| Ajinomoto Co., Inc. |
600 | 11,705 | ||||||
| ANA Holdings, Inc. |
800 | 30,269 | ||||||
| Aozora Bank, Ltd. |
400 | 15,209 | ||||||
| Astellas Pharma, Inc. |
3,300 | 41,966 | ||||||
| Benesse Holdings, Inc. |
300 | 10,820 | ||||||
| Bridgestone Corp. |
300 | 13,608 | ||||||
| Canon, Inc. |
1,600 | 54,653 | ||||||
| Chubu Electric Power Co., Inc. |
300 | 3,723 | ||||||
| Chugai Pharmaceutical Co., Ltd. |
300 | 12,446 | ||||||
| Chugoku Bank, Ltd. |
600 | 8,219 | ||||||
| Chugoku Electric Power Co., Inc. (c) |
300 | 3,185 | ||||||
| Concordia Financial Group, Ltd. |
300 | 1,482 | ||||||
| Dai-ichi Life Holdings, Inc. |
900 | 16,143 | ||||||
| Daiichi Sankyo Co., Ltd. |
300 | 6,764 | ||||||
| Daito Trust Construction Co., Ltd. |
100 | 18,212 | ||||||
| Denso Corp. |
300 | 15,173 | ||||||
| East Japan Railway Co. |
100 | 9,226 | ||||||
| Eisai Co., Ltd. |
300 | 15,394 | ||||||
| FUJIFILM Holdings Corp. |
300 | 11,639 | ||||||
| Hino Motors, Ltd. |
300 | 3,667 | ||||||
| Hitachi Construction Machinery Co., Ltd. |
300 | 8,888 | ||||||
| Hitachi, Ltd. |
3,000 | 21,132 | ||||||
| Honda Motor Co., Ltd. |
600 | 17,760 | ||||||
| Hoya Corp. |
300 | 16,191 | ||||||
| Idemitsu Kosan Co., Ltd. |
300 | 8,462 | ||||||
| Inpex Corp. |
600 | 6,372 | ||||||
| Isetan Mitsukoshi Holdings, Ltd. (c) |
300 | 3,132 | ||||||
| Isuzu Motors, Ltd. |
300 | 3,974 | ||||||
| ITOCHU Corp. |
900 | 14,735 | ||||||
| Japan Airlines Co., Ltd. |
600 | 20,298 | ||||||
| Japan Exchange Group, Inc. |
300 | 5,306 | ||||||
| Japan Post Bank Co., Ltd. |
300 | 3,705 | ||||||
| Japan Post Holdings Co., Ltd. |
300 | 3,542 | ||||||
| Japan Prime Realty Investment Corp. REIT |
3 | 10,021 | ||||||
| Japan Real Estate Investment Corp. REIT |
3 | 14,418 | ||||||
| Japan Retail Fund Investment Corp. REIT |
9 | 16,143 | ||||||
| Japan Tobacco, Inc. |
900 | 29,487 | ||||||
| JFE Holdings, Inc. |
600 | 11,713 | ||||||
| JTEKT Corp. |
300 | 4,152 | ||||||
See accompanying notes to financial statements.
172
Table of Contents
SPDR MSCI World StrategicFactors ETF
SCHEDULE OF INVESTMENTS (continued)
September 30, 2017
| Security Description |
Shares |
Value |
||||||
| JXTG Holdings, Inc. |
1,900 | $ | 9,771 | |||||
| Kakaku.com, Inc. |
600 | 7,644 | ||||||
| Kansai Electric Power Co., Inc. |
300 | 3,836 | ||||||
| Kao Corp. |
300 | 17,643 | ||||||
| Kawasaki Heavy Industries, Ltd. |
400 | 13,255 | ||||||
| KDDI Corp. |
600 | 15,815 | ||||||
| Keikyu Corp. |
1,000 | 20,264 | ||||||
| Kirin Holdings Co., Ltd. |
300 | 7,057 | ||||||
| Kobe Steel, Ltd. |
300 | 3,427 | ||||||
| Komatsu, Ltd. |
300 | 8,531 | ||||||
| Konami Holdings Corp. |
200 | 9,612 | ||||||
| Konica Minolta, Inc. |
300 | 2,463 | ||||||
| Kubota Corp. |
300 | 5,452 | ||||||
| Kyowa Hakko Kirin Co., Ltd. |
600 | 10,202 | ||||||
| Kyushu Electric Power Co., Inc. |
300 | 3,185 | ||||||
| Kyushu Financial Group, Inc. |
300 | 1,844 | ||||||
| Kyushu Railway Co. |
457 | 13,580 | ||||||
| Lawson, Inc. |
100 | 6,618 | ||||||
| M3, Inc. |
300 | 8,542 | ||||||
| Marubeni Corp. |
3,000 | 20,481 | ||||||
| Mazda Motor Corp. |
300 | 4,597 | ||||||
| McDonald’s Holdings Co., Japan, Ltd. |
300 | 13,272 | ||||||
| MEIJI Holdings Co., Ltd. |
100 | 7,924 | ||||||
| Miraca Holdings, Inc. |
300 | 13,939 | ||||||
| Mitsubishi Chemical Holdings Corp. |
900 | 8,571 | ||||||
| Mitsubishi Corp. |
1,200 | 27,883 | ||||||
| Mitsubishi Heavy Industries, Ltd. |
400 | 15,810 | ||||||
| Mitsubishi Motors Corp. |
900 | 7,116 | ||||||
| Mitsubishi Tanabe Pharma Corp. |
900 | 20,628 | ||||||
| Mitsubishi UFJ Financial Group, Inc. |
8,100 | 52,580 | ||||||
| Mitsubishi UFJ Lease & Finance Co., Ltd. |
300 | 1,588 | ||||||
| Mitsui & Co., Ltd. |
900 | 13,296 | ||||||
| Mitsui OSK Lines, Ltd. |
400 | 12,117 | ||||||
| Mizuho Financial Group, Inc. |
15,000 | 26,265 | ||||||
| MS&AD Insurance Group Holdings, Inc. |
300 | 9,656 | ||||||
| Nagoya Railroad Co., Ltd. |
800 | 17,220 | ||||||
| NGK Spark Plug Co., Ltd. |
300 | 6,383 | ||||||
| NH Foods, Ltd. |
1,000 | 27,495 | ||||||
| Nikon Corp. (c) |
300 | 5,200 | ||||||
| Nippon Building Fund, Inc. REIT |
3 | 14,951 | ||||||
| Nippon Prologis REIT, Inc. |
6 | 12,638 | ||||||
| Nippon Steel & Sumitomo Metal Corp. |
300 | 6,885 | ||||||
| Nippon Telegraph & Telephone Corp. |
1,400 | 64,139 | ||||||
| Nippon Yusen KK (a) |
400 | 8,312 | ||||||
| Nissan Motor Co., Ltd. |
1,200 | 11,881 | ||||||
| Nissin Foods Holdings Co., Ltd. |
300 | 18,229 | ||||||
| Nitori Holdings Co., Ltd. |
300 | 42,882 | ||||||
| Nomura Holdings, Inc. |
1,500 | 8,395 | ||||||
| Nomura Real Estate Master Fund, Inc. |
12 | 15,596 | ||||||
| Nomura Research Institute, Ltd. |
600 | 23,400 | ||||||
| NSK, Ltd. |
600 | 8,086 | ||||||
| NTT Data Corp. |
3,000 | 32,088 | ||||||
| NTT DOCOMO, Inc. |
2,768 | 63,209 | ||||||
| Oracle Corp. Japan |
300 | 23,560 | ||||||
| Oriental Land Co., Ltd. |
300 | 22,851 | ||||||
| ORIX Corp. |
300 | 4,836 | ||||||
| Osaka Gas Co., Ltd. |
800 | 14,868 | ||||||
| Otsuka Corp. |
300 | 19,216 | ||||||
| Otsuka Holdings Co., Ltd. |
1,200 | 47,663 | ||||||
| Panasonic Corp. |
900 | 13,036 | ||||||
| Park24 Co., Ltd. (c) |
300 | 7,302 | ||||||
| Rakuten, Inc. |
300 | 3,270 | ||||||
| Recruit Holdings Co., Ltd. |
3,498 | 75,731 | ||||||
| Resona Holdings, Inc. |
1,500 | 7,702 | ||||||
| Ricoh Co., Ltd. |
300 | 2,916 | ||||||
| Sankyo Co., Ltd. |
300 | 9,568 | ||||||
| Santen Pharmaceutical Co., Ltd. |
400 | 6,300 | ||||||
| SBI Holdings, Inc. |
300 | 4,515 | ||||||
| Secom Co., Ltd. |
400 | 29,146 | ||||||
| Sekisui House, Ltd. |
300 | 5,054 | ||||||
| Seven & i Holdings Co., Ltd. |
300 | 11,580 | ||||||
| Showa Shell Sekiyu KK |
600 | 6,903 | ||||||
| SoftBank Group Corp. |
300 | 24,210 | ||||||
| Sompo Holdings, Inc. |
300 | 11,668 | ||||||
| Sony Corp. |
600 | 22,312 | ||||||
| Subaru Corp. |
600 | 21,641 | ||||||
| Sumitomo Corp. |
600 | 8,627 | ||||||
| Sumitomo Electric Industries, Ltd. |
300 | 4,899 | ||||||
| Sumitomo Mitsui Financial Group, Inc. |
900 | 34,540 | ||||||
| Sumitomo Mitsui Trust Holdings, Inc. |
300 | 10,823 | ||||||
| Suntory Beverage & Food, Ltd. |
600 | 26,705 | ||||||
| Suzuken Co., Ltd. |
300 | 10,661 | ||||||
| T&D Holdings, Inc. |
600 | 8,707 | ||||||
| Taisho Pharmaceutical Holdings Co., Ltd. |
300 | 22,760 | ||||||
| Takeda Pharmaceutical Co., Ltd. |
589 | 32,515 | ||||||
| Terumo Corp. |
300 | 11,793 | ||||||
| Tobu Railway Co., Ltd. |
800 | 21,961 | ||||||
| Toho Co., Ltd. |
300 | 10,461 | ||||||
| Tohoku Electric Power Co., Inc. |
300 | 3,814 | ||||||
| Tokio Marine Holdings, Inc. |
300 | 11,732 | ||||||
| Tokyo Electric Power Co. Holdings, Inc. (a) |
900 | 3,630 | ||||||
| Toshiba Corp. (a) |
3,000 | 8,395 | ||||||
| Toyo Suisan Kaisha, Ltd. |
300 | 11,020 | ||||||
| Toyota Motor Corp. |
1,100 | 65,571 | ||||||
| Toyota Tsusho Corp. |
300 | 9,848 | ||||||
| Unicharm Corp. |
300 | 6,865 | ||||||
| United Urban Investment Corp. REIT |
9 | 13,176 | ||||||
| USS Co., Ltd. |
900 | 18,150 | ||||||
| Yahoo! Japan Corp. (c) |
1,200 | 5,693 | ||||||
| Yamada Denki Co., Ltd. |
900 | 4,917 | ||||||
| Yamaha Motor Co., Ltd. |
300 | 8,981 | ||||||
| Yamato Holdings Co., Ltd. |
100 | 2,018 | ||||||
| Yokohama Rubber Co., Ltd. |
300 | 6,183 | ||||||
|
|
|
|||||||
| 2,134,942 | ||||||||
|
|
|
|||||||
| LUXEMBOURG — 0.1% |
| |||||||
| ArcelorMittal (a) |
297 | 7,663 | ||||||
| RTL Group SA |
99 | 7,495 | ||||||
| SES SA |
51 | 1,116 | ||||||
| Tenaris SA |
138 | 1,958 | ||||||
|
|
|
|||||||
| 18,232 | ||||||||
|
|
|
|||||||
| MEXICO — 0.0% (d) |
| |||||||
| Fresnillo PLC |
12 | 226 | ||||||
|
|
|
|||||||
| NETHERLANDS — 0.9% |
| |||||||
| Aegon NV |
945 | 5,506 | ||||||
| AerCap Holdings NV (a) |
299 | 15,282 | ||||||
See accompanying notes to financial statements.
173
Table of Contents
SPDR MSCI World StrategicFactors ETF
SCHEDULE OF INVESTMENTS (continued)
September 30, 2017
| Security Description |
Shares |
Value |
||||||
| Akzo Nobel NV |
45 | $ | 4,156 | |||||
| Altice NV Class A (a) |
36 | 721 | ||||||
| Altice NV Class B (a) |
12 | 240 | ||||||
| ASML Holding NV |
28 | 4,768 | ||||||
| EXOR NV |
81 | 5,137 | ||||||
| Heineken Holding NV |
48 | 4,511 | ||||||
| Heineken NV |
48 | 4,747 | ||||||
| ING Groep NV |
1,295 | 23,883 | ||||||
| Koninklijke Ahold Delhaize NV |
355 | 6,639 | ||||||
| Koninklijke DSM NV |
42 | 3,439 | ||||||
| Koninklijke KPN NV |
1,007 | 3,458 | ||||||
| Koninklijke Philips NV |
174 | 7,185 | ||||||
| NN Group NV |
176 | 7,368 | ||||||
| Randstad Holding NV |
54 | 3,341 | ||||||
| Royal Dutch Shell PLC Class A |
1,994 | 60,153 | ||||||
| Royal Dutch Shell PLC Class B |
1,202 | 37,003 | ||||||
|
|
|
|||||||
| 197,537 | ||||||||
|
|
|
|||||||
| NEW ZEALAND — 0.1% |
| |||||||
| Auckland International Airport, Ltd. |
3,152 | 14,674 | ||||||
| Ryman Healthcare, Ltd. |
1,531 | 10,260 | ||||||
|
|
|
|||||||
| 24,934 | ||||||||
|
|
|
|||||||
| NORWAY — 0.1% |
| |||||||
| DNB ASA |
281 | 5,666 | ||||||
| Norsk Hydro ASA |
581 | 4,226 | ||||||
| Statoil ASA |
364 | 7,284 | ||||||
| Telenor ASA |
135 | 2,856 | ||||||
| Yara International ASA |
180 | 8,066 | ||||||
|
|
|
|||||||
| 28,098 | ||||||||
|
|
|
|||||||
| PORTUGAL — 0.0% (d) |
| |||||||
| EDP - Energias de Portugal SA |
680 | 2,560 | ||||||
| Galp Energia SGPS SA |
180 | 3,191 | ||||||
| Jeronimo Martins SGPS SA |
216 | 4,262 | ||||||
|
|
|
|||||||
| 10,013 | ||||||||
|
|
|
|||||||
| SINGAPORE — 0.7% |
| |||||||
| Broadcom, Ltd. |
27 | 6,549 | ||||||
| Keppel Corp., Ltd. |
3,000 | 14,338 | ||||||
| Oversea-Chinese Banking Corp., Ltd. |
3,026 | 24,869 | ||||||
| SATS, Ltd. |
3,108 | 10,551 | ||||||
| Singapore Airlines, Ltd. |
3,000 | 22,180 | ||||||
| Singapore Press Holdings, Ltd. (c) |
6,000 | 12,018 | ||||||
| Singapore Telecommunications, Ltd. |
20,342 | 55,126 | ||||||
| StarHub, Ltd. |
3,000 | 5,744 | ||||||
|
|
|
|||||||
| 151,375 | ||||||||
|
|
|
|||||||
| SOUTH AFRICA — 0.1% |
| |||||||
| Investec PLC |
165 | 1,207 | ||||||
| Mondi PLC |
338 | 9,092 | ||||||
|
|
|
|||||||
| 10,299 | ||||||||
|
|
|
|||||||
| SPAIN — 0.9% |
| |||||||
| ACS Actividades de Construccion y Servicios SA |
80 | 2,966 | ||||||
| Amadeus IT Group SA |
354 | 23,013 | ||||||
| Banco Bilbao Vizcaya Argentaria SA |
3,137 | 28,040 | ||||||
| Banco de Sabadell SA |
1,253 | 2,616 | ||||||
| Banco Santander SA |
5,882 | 41,076 | ||||||
| CaixaBank SA |
3 | 15 | ||||||
| Distribuidora Internacional de Alimentacion SA |
210 | 1,225 | ||||||
| Endesa SA |
453 | 10,215 | ||||||
| Ferrovial SA |
150 | 3,303 | ||||||
| Gas Natural SDG SA |
3 | 66 | ||||||
| Iberdrola SA |
1,830 | 14,218 | ||||||
| Industria de Diseno Textil SA |
881 | 33,209 | ||||||
| Mapfre SA |
564 | 1,836 | ||||||
| Repsol SA |
894 | 16,477 | ||||||
| Telefonica SA |
1,389 | 15,094 | ||||||
|
|
|
|||||||
| 193,369 | ||||||||
|
|
|
|||||||
| SWEDEN — 0.8% |
| |||||||
| Alfa Laval AB |
228 | 5,556 | ||||||
| Assa Abloy AB Class B |
728 | 16,589 | ||||||
| Atlas Copco AB Class A |
540 | 22,818 | ||||||
| Atlas Copco AB Class B |
317 | 12,265 | ||||||
| Autoliv, Inc. (c) |
30 | 3,708 | ||||||
| Boliden AB |
222 | 7,498 | ||||||
| Electrolux AB Series B |
126 | 4,270 | ||||||
| Essity AB Class B (a) |
108 | 2,932 | ||||||
| Hennes & Mauritz AB Class B |
893 | 23,084 | ||||||
| Investor AB Class B |
201 | 9,907 | ||||||
| Kinnevik AB Class B |
233 | 7,582 | ||||||
| Nordea Bank AB |
1,106 | 14,959 | ||||||
| Sandvik AB |
210 | 3,615 | ||||||
| Skandinaviska Enskilda Banken AB Class A |
345 | 4,535 | ||||||
| Skanska AB Class B |
314 | 7,259 | ||||||
| SKF AB Class B |
323 | 7,024 | ||||||
| Svenska Handelsbanken AB Class A |
314 | 4,728 | ||||||
| Swedbank AB Class A |
201 | 5,546 | ||||||
| Telefonaktiebolaget LM Ericsson Class B |
507 | 2,905 | ||||||
| Telia Co. AB |
519 | 2,439 | ||||||
| Volvo AB Class B |
323 | 6,213 | ||||||
|
|
|
|||||||
| 175,432 | ||||||||
|
|
|
|||||||
| SWITZERLAND — 4.5% |
| |||||||
| ABB, Ltd. |
329 | 8,140 | ||||||
| Adecco Group AG (a) |
153 | 11,923 | ||||||
| Baloise Holding AG |
27 | 4,275 | ||||||
| Barry Callebaut AG (a) |
3 | 4,601 | ||||||
| Chocoladefabriken Lindt & Spruengli AG |
1 | 5,710 | ||||||
| Cie Financiere Richemont SA |
3 | 274 | ||||||
| Credit Suisse Group AG (a) |
1,062 | 16,826 | ||||||
| EMS-Chemie Holding AG |
39 | 25,957 | ||||||
| Ferguson PLC |
207 | 13,597 | ||||||
| Geberit AG |
30 | 14,203 | ||||||
| Givaudan SA |
12 | 26,131 | ||||||
| Glencore PLC (a) |
6,895 | 31,637 | ||||||
| Julius Baer Group, Ltd. (a) |
311 | 18,417 | ||||||
| Kuehne + Nagel International AG |
245 | 45,399 | ||||||
| LafargeHolcim, Ltd. (a) |
165 | 9,652 | ||||||
| Nestle SA |
1,324 | 110,972 | ||||||
| Novartis AG |
878 | 75,223 | ||||||
| Partners Group Holding AG |
71 | 48,209 | ||||||
| Roche Holding AG |
902 | 230,441 | ||||||
| Schindler Holding AG (b) |
57 | 12,601 | ||||||
| Schindler Holding AG (b) |
93 | 20,021 | ||||||
| SGS SA |
3 | 7,202 | ||||||
See accompanying notes to financial statements.
174
Table of Contents
SPDR MSCI World StrategicFactors ETF
SCHEDULE OF INVESTMENTS (continued)
September 30, 2017
| Security Description |
Shares |
Value |
||||||
| Sika AG |
3 | $ | 22,339 | |||||
| Sonova Holding AG |
207 | 35,149 | ||||||
| STMicroelectronics NV |
156 | 3,019 | ||||||
| Straumann Holding AG |
42 | 26,999 | ||||||
| Swatch Group AG |
3 | 239 | ||||||
| Swiss Life Holding AG (a) |
12 | 4,230 | ||||||
| Swiss Prime Site AG (a) |
222 | 19,972 | ||||||
| Swiss Re AG |
117 | 10,604 | ||||||
| Swisscom AG |
102 | 52,307 | ||||||
| TE Connectivity, Ltd. |
305 | 25,333 | ||||||
| UBS Group AG (a) |
1,205 | 20,611 | ||||||
| Vifor Pharma AG |
30 | 3,535 | ||||||
| Zurich Insurance Group AG |
39 | 11,906 | ||||||
|
|
|
|||||||
| 977,654 | ||||||||
|
|
|
|||||||
| UNITED KINGDOM — 6.9% |
| |||||||
| 3i Group PLC |
317 | 3,883 | ||||||
| Admiral Group PLC |
192 | 4,680 | ||||||
| Anglo American PLC |
1,030 | 18,511 | ||||||
| Ashtead Group PLC |
72 | 1,738 | ||||||
| Associated British Foods PLC |
63 | 2,699 | ||||||
| AstraZeneca PLC |
1,301 | 86,489 | ||||||
| Auto Trader Group PLC (e) |
51 | 269 | ||||||
| Aviva PLC |
1,010 | 6,972 | ||||||
| Babcock International Group PLC |
36 | 400 | ||||||
| BAE Systems PLC |
3,264 | 27,654 | ||||||
| Barclays PLC |
9,521 | 24,698 | ||||||
| Barratt Developments PLC |
156 | 1,286 | ||||||
| Berkeley Group Holdings PLC |
126 | 6,283 | ||||||
| BP PLC |
5,765 | 36,917 | ||||||
| British American Tobacco PLC |
1,544 | 96,781 | ||||||
| British American Tobacco PLC ADR |
444 | 27,728 | ||||||
| British Land Co. PLC REIT |
251 | 2,027 | ||||||
| BT Group PLC |
9,617 | 36,631 | ||||||
| Bunzl PLC |
260 | 7,908 | ||||||
| Burberry Group PLC |
381 | 8,997 | ||||||
| Capita PLC. |
788 | 5,973 | ||||||
| Carnival PLC |
78 | 4,963 | ||||||
| Centrica PLC |
200 | 502 | ||||||
| CNH Industrial NV |
281 | 3,375 | ||||||
| Cobham PLC |
629 | 1,230 | ||||||
| Coca-Cola European Partners PLC |
195 | 8,116 | ||||||
| Compass Group PLC |
2,674 | 56,791 | ||||||
| ConvaTec Group PLC (e) |
4,431 | 16,283 | ||||||
| Croda International PLC |
114 | 5,801 | ||||||
| Delphi Automotive PLC |
320 | 31,488 | ||||||
| Diageo PLC |
1,968 | 64,768 | ||||||
| Direct Line Insurance Group PLC |
665 | 3,244 | ||||||
| easyJet PLC |
749 | 12,230 | ||||||
| Fiat Chrysler Automobiles NV (a) |
1,226 | 21,973 | ||||||
| G4S PLC |
417 | 1,557 | ||||||
| GKN PLC |
2,062 | 9,572 | ||||||
| GlaxoSmithKline PLC |
1,642 | 32,791 | ||||||
| Hargreaves Lansdown PLC |
219 | 4,349 | ||||||
| HSBC Holdings PLC |
7,943 | 78,551 | ||||||
| IMI PLC |
3 | 50 | ||||||
| Imperial Brands PLC |
773 | 33,021 | ||||||
| International Consolidated Airlines Group SA |
480 | 3,825 | ||||||
| Intertek Group PLC |
165 | 11,029 | ||||||
| ITV PLC |
3,204 | 7,510 | ||||||
| J Sainsbury PLC |
513 | 1,637 | ||||||
| Johnson Matthey PLC |
153 | 7,020 | ||||||
| Kingfisher PLC |
4,351 | 17,425 | ||||||
| Land Securities Group PLC REIT |
177 | 2,312 | ||||||
| Legal & General Group PLC |
5,408 | 18,857 | ||||||
| Liberty Global PLC Class A (a) |
93 | 3,154 | ||||||
| Liberty Global PLC Series C (a) |
135 | 4,414 | ||||||
| Lloyds Banking Group PLC |
7,806 | 7,093 | ||||||
| London Stock Exchange Group PLC |
150 | 7,708 | ||||||
| Marks & Spencer Group PLC |
1,426 | 6,761 | ||||||
| Merlin Entertainments PLC (e) |
1,202 | 7,184 | ||||||
| Micro Focus International PLC ADR (a) |
148 | 4,721 | ||||||
| National Grid PLC |
1,788 | 22,180 | ||||||
| Next PLC |
230 | 16,231 | ||||||
| Old Mutual PLC |
1,070 | 2,788 | ||||||
| Pearson PLC |
159 | 1,306 | ||||||
| Pentair PLC |
42 | 2,854 | ||||||
| Persimmon PLC |
290 | 10,046 | ||||||
| Prudential PLC |
369 | 8,844 | ||||||
| Randgold Resources, Ltd. |
332 | 32,583 | ||||||
| Reckitt Benckiser Group PLC |
821 | 75,045 | ||||||
| RELX NV |
1,022 | 21,760 | ||||||
| RELX PLC |
1,148 | 25,213 | ||||||
| Rio Tinto PLC |
468 | 21,807 | ||||||
| Rio Tinto, Ltd. |
239 | 12,476 | ||||||
| Rolls-Royce Holdings PLC (a) |
1,717 | 20,433 | ||||||
| Royal Bank of Scotland Group PLC (a) |
2,289 | 8,240 | ||||||
| Royal Mail PLC |
2,322 | 11,969 | ||||||
| RSA Insurance Group PLC |
420 | 3,511 | ||||||
| Sage Group PLC |
896 | 8,397 | ||||||
| Schroders PLC |
90 | 4,051 | ||||||
| Sky PLC |
1,001 | 12,288 | ||||||
| Smith & Nephew PLC |
659 | 11,918 | ||||||
| Smiths Group PLC |
332 | 7,024 | ||||||
| SSE PLC |
51 | 956 | ||||||
| St James’s Place PLC |
387 | 5,950 | ||||||
| Standard Chartered PLC (a) |
2,050 | 20,397 | ||||||
| Standard Life Aberdeen PLC |
1,039 | 6,043 | ||||||
| Tate & Lyle PLC |
3 | 26 | ||||||
| Taylor Wimpey PLC |
2,592 | 6,799 | ||||||
| TechnipFMC PLC (a) |
6 | 166 | ||||||
| Tesco PLC (a) |
5,106 | 12,821 | ||||||
| Travis Perkins PLC |
117 | 2,273 | ||||||
| Unilever NV |
1,420 | 84,003 | ||||||
| Unilever PLC |
1,094 | 63,393 | ||||||
| Vodafone Group PLC |
10,545 | 29,540 | ||||||
| Weir Group PLC |
3 | 79 | ||||||
| Whitbread PLC |
123 | 6,215 | ||||||
| Wm Morrison Supermarkets PLC |
1,028 | 3,229 | ||||||
| WPP PLC |
228 | 4,237 | ||||||
|
|
|
|||||||
| 1,496,920 | ||||||||
|
|
|
|||||||
| UNITED STATES — 60.1% |
| |||||||
| 3M Co. |
647 | 135,805 | ||||||
| Abbott Laboratories |
747 | 39,860 | ||||||
| AbbVie, Inc. |
156 | 13,862 | ||||||
| Accenture PLC Class A |
923 | 124,670 | ||||||
See accompanying notes to financial statements.
175
Table of Contents
SPDR MSCI World StrategicFactors ETF
SCHEDULE OF INVESTMENTS (continued)
September 30, 2017
| Security Description |
Shares |
Value |
||||||
| Activision Blizzard, Inc. |
147 | $ | 9,483 | |||||
| Adobe Systems, Inc. (a) |
51 | 7,608 | ||||||
| Advance Auto Parts, Inc. |
57 | 5,654 | ||||||
| AES Corp. |
222 | 2,446 | ||||||
| Aetna, Inc. |
230 | 36,572 | ||||||
| Aflac, Inc. |
81 | 6,593 | ||||||
| AGCO Corp. |
57 | 4,205 | ||||||
| Agilent Technologies, Inc. |
54 | 3,467 | ||||||
| AGNC Investment Corp. REIT |
1,337 | 28,986 | ||||||
| Air Products & Chemicals, Inc. |
177 | 26,766 | ||||||
| Albemarle Corp. (c) |
63 | 8,588 | ||||||
| Align Technology, Inc. (a) |
75 | 13,970 | ||||||
| Alleghany Corp. (a) |
57 | 31,579 | ||||||
| Allergan PLC |
24 | 4,919 | ||||||
| Allstate Corp. |
564 | 51,837 | ||||||
| Ally Financial, Inc. |
290 | 7,035 | ||||||
| Alphabet, Inc. Class A (a) |
213 | 207,402 | ||||||
| Alphabet, Inc. Class C (a) |
225 | 215,800 | ||||||
| Altria Group, Inc. |
2,833 | 179,669 | ||||||
| Amazon.com, Inc. (a) |
15 | 14,420 | ||||||
| Ameren Corp. |
81 | 4,685 | ||||||
| American Electric Power Co., Inc. |
108 | 7,586 | ||||||
| American Express Co. |
120 | 10,855 | ||||||
| American International Group, Inc. |
285 | 17,496 | ||||||
| American Tower Corp. REIT |
56 | 7,654 | ||||||
| American Water Works Co., Inc. |
147 | 11,894 | ||||||
| Ameriprise Financial, Inc. |
30 | 4,455 | ||||||
| AmerisourceBergen Corp. |
51 | 4,220 | ||||||
| Amgen, Inc. |
656 | 122,311 | ||||||
| Amphenol Corp. Class A |
216 | 18,282 | ||||||
| Anadarko Petroleum Corp. |
57 | 2,784 | ||||||
| Analog Devices, Inc. |
106 | 9,134 | ||||||
| Andeavor |
63 | 6,498 | ||||||
| Annaly Capital Management, Inc. REIT |
4,043 | 49,284 | ||||||
| ANSYS, Inc. (a) |
299 | 36,696 | ||||||
| Anthem, Inc. |
90 | 17,089 | ||||||
| Aon PLC |
381 | 55,664 | ||||||
| Apache Corp. (c) |
120 | 5,496 | ||||||
| Apple, Inc. |
2,910 | 448,489 | ||||||
| Applied Materials, Inc. |
904 | 47,089 | ||||||
| Arch Capital Group, Ltd. (a) |
596 | 58,706 | ||||||
| Archer-Daniels-Midland Co. |
213 | 9,055 | ||||||
| Arconic, Inc. |
84 | 2,090 | ||||||
| Arrow Electronics, Inc. (a) |
57 | 4,583 | ||||||
| Assurant, Inc. |
48 | 4,585 | ||||||
| AT&T, Inc. |
3,925 | 153,742 | ||||||
| Athene Holding, Ltd. Class A (a) |
296 | 15,937 | ||||||
| Automatic Data Processing, Inc. |
1,166 | 127,467 | ||||||
| AutoZone, Inc. (a) (c) |
18 | 10,712 | ||||||
| AvalonBay Communities, Inc. REIT |
228 | 40,680 | ||||||
| Avnet, Inc. |
72 | 2,830 | ||||||
| Axis Capital Holdings, Ltd. |
363 | 20,804 | ||||||
| Baker Hughes a GE Co. |
81 | 2,966 | ||||||
| Ball Corp. |
24 | 991 | ||||||
| Bank of America Corp. |
3,347 | 84,813 | ||||||
| Bank of New York Mellon Corp. |
287 | 15,217 | ||||||
| Baxter International, Inc. |
599 | 37,587 | ||||||
| BB&T Corp. |
174 | 8,168 | ||||||
| Becton Dickinson and Co. |
375 | 73,481 | ||||||
| Bed Bath & Beyond, Inc. |
251 | 5,891 | ||||||
| Berkshire Hathaway, Inc. Class B (a) |
632 | 115,858 | ||||||
| Best Buy Co., Inc. |
284 | 16,177 | ||||||
| Biogen, Inc. (a) |
242 | 75,775 | ||||||
| BlackRock, Inc. |
18 | 8,048 | ||||||
| Boeing Co. |
61 | 15,507 | ||||||
| BorgWarner, Inc. |
51 | 2,613 | ||||||
| Boston Scientific Corp. (a) |
230 | 6,709 | ||||||
| Brighthouse Financial, Inc. (a) |
24 | 1,459 | ||||||
| Bristol-Myers Squibb Co. |
1,304 | 83,117 | ||||||
| Brixmor Property Group, Inc. REIT |
222 | 4,174 | ||||||
| Broadridge Financial Solutions, Inc. |
299 | 24,165 | ||||||
| Brown-Forman Corp. Class B |
198 | 10,751 | ||||||
| Bunge, Ltd. |
69 | 4,793 | ||||||
| C.H. Robinson Worldwide, Inc. (c) |
432 | 32,875 | ||||||
| C.R. Bard, Inc. |
30 | 9,615 | ||||||
| CA, Inc. |
257 | 8,579 | ||||||
| Camden Property Trust REIT |
54 | 4,938 | ||||||
| Campbell Soup Co. |
453 | 21,209 | ||||||
| Capital One Financial Corp. |
177 | 14,985 | ||||||
| Cardinal Health, Inc. |
260 | 17,399 | ||||||
| CarMax, Inc. (a) (c) |
72 | 5,458 | ||||||
| Carnival Corp. |
75 | 4,843 | ||||||
| Caterpillar, Inc. |
129 | 16,088 | ||||||
| CBS Corp. Class B |
363 | 21,054 | ||||||
| CDK Global, Inc. |
162 | 10,221 | ||||||
| Celanese Corp. Series A |
51 | 5,318 | ||||||
| CenterPoint Energy, Inc. |
141 | 4,119 | ||||||
| CenturyLink, Inc. (c) |
156 | 2,948 | ||||||
| Cerner Corp. (a) |
299 | 21,325 | ||||||
| CF Industries Holdings, Inc. |
225 | 7,911 | ||||||
| Charles Schwab Corp. |
117 | 5,118 | ||||||
| Charter Communications, Inc. Class A (a) |
123 | 44,701 | ||||||
| Chevron Corp. |
453 | 53,227 | ||||||
| Chipotle Mexican Grill, Inc. (a) (c) |
39 | 12,005 | ||||||
| Chubb, Ltd. |
372 | 53,029 | ||||||
| Church & Dwight Co., Inc. |
1,175 | 56,929 | ||||||
| Cigna Corp. |
51 | 9,534 | ||||||
| Cimarex Energy Co. |
24 | 2,728 | ||||||
| Cincinnati Financial Corp. |
299 | 22,894 | ||||||
| Cintas Corp. |
299 | 43,140 | ||||||
| Cisco Systems, Inc. |
1,420 | 47,755 | ||||||
| CIT Group, Inc. |
75 | 3,679 | ||||||
| Citigroup, Inc. |
1,325 | 96,380 | ||||||
| Citizens Financial Group, Inc. |
204 | 7,725 | ||||||
| Citrix Systems, Inc. (a) |
111 | 8,527 | ||||||
| Clorox Co. |
459 | 60,547 | ||||||
| CME Group, Inc. |
72 | 9,769 | ||||||
| Coach, Inc. |
287 | 11,560 | ||||||
| Coca-Cola Co. |
1,516 | 68,235 | ||||||
| Cognizant Technology Solutions Corp. Class A |
66 | 4,788 | ||||||
| Colgate-Palmolive Co. |
309 | 22,511 | ||||||
| Comcast Corp. Class A |
1,573 | 60,529 | ||||||
| Comerica, Inc. |
69 | 5,262 | ||||||
| Conagra Brands, Inc. |
96 | 3,239 | ||||||
| ConocoPhillips |
272 | 13,614 | ||||||
| Consolidated Edison, Inc. |
1,130 | 91,168 | ||||||
| Constellation Brands, Inc. Class A |
75 | 14,959 | ||||||
See accompanying notes to financial statements.
176
Table of Contents
SPDR MSCI World StrategicFactors ETF
SCHEDULE OF INVESTMENTS (continued)
September 30, 2017
| Security Description |
Shares |
Value |
||||||
| Core Laboratories NV (c) |
33 | $ | 3,257 | |||||
| Corning, Inc. |
278 | 8,318 | ||||||
| Costco Wholesale Corp. |
476 | 78,202 | ||||||
| Crown Castle International Corp. REIT |
357 | 35,693 | ||||||
| CSX Corp. |
156 | 8,465 | ||||||
| Cummins, Inc. |
129 | 21,676 | ||||||
| CVS Health Corp. |
440 | 35,781 | ||||||
| Danaher Corp. |
228 | 19,558 | ||||||
| Darden Restaurants, Inc. |
66 | 5,199 | ||||||
| DaVita, Inc. (a) |
45 | 2,673 | ||||||
| Deere & Co. |
81 | 10,173 | ||||||
| Dell Technologies, Inc. Class V (a) |
866 | 66,864 | ||||||
| Delta Air Lines, Inc. |
81 | 3,906 | ||||||
| Devon Energy Corp. |
75 | 2,753 | ||||||
| Dick’s Sporting Goods, Inc. |
84 | 2,269 | ||||||
| Discover Financial Services |
99 | 6,384 | ||||||
| DISH Network Corp. Class A (a) |
54 | 2,928 | ||||||
| Dollar General Corp. |
254 | 20,587 | ||||||
| Dollar Tree, Inc. (a) |
162 | 14,065 | ||||||
| Dominion Energy, Inc. |
743 | 57,159 | ||||||
| Dover Corp. |
36 | 3,290 | ||||||
| DowDuPont, Inc. |
1,460 | 101,076 | ||||||
| Dr. Pepper Snapple Group, Inc. |
444 | 39,281 | ||||||
| DTE Energy Co. |
48 | 5,153 | ||||||
| Duke Energy Corp. |
740 | 62,101 | ||||||
| DXC Technology Co. |
69 | 5,926 | ||||||
| Eastman Chemical Co. |
120 | 10,859 | ||||||
| Eaton Corp. PLC |
72 | 5,529 | ||||||
| Eaton Vance Corp. |
96 | 4,740 | ||||||
| eBay, Inc. (a) |
432 | 16,615 | ||||||
| Edison International |
72 | 5,556 | ||||||
| Edwards Lifesciences Corp. (a) |
162 | 17,708 | ||||||
| Eli Lilly & Co. |
1,217 | 104,102 | ||||||
| Emerson Electric Co. |
480 | 30,163 | ||||||
| Entergy Corp. |
54 | 4,123 | ||||||
| EOG Resources, Inc. |
63 | 6,095 | ||||||
| EQT Corp. |
39 | 2,544 | ||||||
| Equity Residential REIT |
351 | 23,141 | ||||||
| Estee Lauder Cos., Inc. Class A |
180 | 19,411 | ||||||
| Everest Re Group, Ltd. |
174 | 39,740 | ||||||
| Eversource Energy |
219 | 13,236 | ||||||
| Exelon Corp. |
228 | 8,589 | ||||||
| Expeditors International of Washington, Inc. |
740 | 44,296 | ||||||
| Express Scripts Holding Co. (a) |
198 | 12,537 | ||||||
| Exxon Mobil Corp. |
1,780 | 145,924 | ||||||
| F5 Networks, Inc. (a) |
54 | 6,510 | ||||||
| Facebook, Inc. Class A (a) |
182 | 31,098 | ||||||
| Fastenal Co. (c) |
222 | 10,119 | ||||||
| Federal Realty Investment Trust REIT |
18 | 2,236 | ||||||
| FedEx Corp. |
51 | 11,505 | ||||||
| Fidelity National Information Services, Inc. |
326 | 30,445 | ||||||
| Fifth Third Bancorp |
257 | 7,191 | ||||||
| FirstEnergy Corp. |
135 | 4,162 | ||||||
| Fiserv, Inc. (a) |
350 | 45,136 | ||||||
| FleetCor Technologies, Inc. (a) |
45 | 6,965 | ||||||
| Flex, Ltd. (a) |
311 | 5,153 | ||||||
| Flowserve Corp. |
105 | 4,472 | ||||||
| Fluor Corp. |
129 | 5,431 | ||||||
| FNF Group |
431 | 20,455 | ||||||
| Foot Locker, Inc. |
106 | 3,733 | ||||||
| Ford Motor Co. |
1,591 | 19,044 | ||||||
| Fortive Corp. |
326 | 23,078 | ||||||
| Franklin Resources, Inc. |
305 | 13,576 | ||||||
| Freeport-McMoRan, Inc. (a) |
540 | 7,582 | ||||||
| Gap, Inc. |
236 | 6,969 | ||||||
| Gartner, Inc. (a) |
150 | 18,661 | ||||||
| General Dynamics Corp. |
213 | 43,789 | ||||||
| General Electric Co. |
1,546 | 37,382 | ||||||
| General Mills, Inc. |
1,295 | 67,029 | ||||||
| General Motors Co. |
752 | 30,366 | ||||||
| Genuine Parts Co. |
201 | 19,226 | ||||||
| Gilead Sciences, Inc. |
1,328 | 107,595 | ||||||
| Goldman Sachs Group, Inc. |
126 | 29,886 | ||||||
| Halliburton Co. |
108 | 4,971 | ||||||
| Harris Corp. |
81 | 10,666 | ||||||
| Hartford Financial Services Group, Inc. |
120 | 6,652 | ||||||
| Hasbro, Inc. |
75 | 7,325 | ||||||
| HCA Healthcare, Inc. (a) |
63 | 5,014 | ||||||
| HCP, Inc. REIT |
78 | 2,171 | ||||||
| Henry Schein, Inc. (a) |
445 | 36,486 | ||||||
| Hershey Co. |
156 | 17,030 | ||||||
| Hess Corp. |
90 | 4,220 | ||||||
| Hewlett Packard Enterprise Co. |
809 | 11,900 | ||||||
| HollyFrontier Corp. |
66 | 2,374 | ||||||
| Home Depot, Inc. |
275 | 44,979 | ||||||
| Honeywell International, Inc. |
608 | 86,178 | ||||||
| Hormel Foods Corp. (c) |
363 | 11,667 | ||||||
| Host Hotels & Resorts, Inc. REIT |
147 | 2,718 | ||||||
| HP, Inc. |
1,435 | 28,643 | ||||||
| Humana, Inc. |
39 | 9,502 | ||||||
| Huntington Ingalls Industries, Inc. |
75 | 16,983 | ||||||
| Illinois Tool Works, Inc. |
351 | 51,934 | ||||||
| Ingersoll-Rand PLC |
54 | 4,815 | ||||||
| Intel Corp. |
4,318 | 164,429 | ||||||
| Intercontinental Exchange, Inc. |
90 | 6,183 | ||||||
| International Business Machines Corp. |
1,027 | 148,997 | ||||||
| International Flavors & Fragrances, Inc. |
57 | 8,146 | ||||||
| International Paper Co. |
96 | 5,455 | ||||||
| Interpublic Group of Cos., Inc. |
299 | 6,216 | ||||||
| Intuit, Inc. |
216 | 30,702 | ||||||
| Intuitive Surgical, Inc. (a) |
78 | 81,579 | ||||||
| Invesco, Ltd. |
87 | 3,048 | ||||||
| J.M. Smucker Co. |
147 | 15,425 | ||||||
| Jack Henry & Associates, Inc. |
374 | 38,443 | ||||||
| Jacobs Engineering Group, Inc. |
57 | 3,321 | ||||||
| JB Hunt Transport Services, Inc. |
204 | 22,660 | ||||||
| Johnson & Johnson |
3,195 | 415,382 | ||||||
| Johnson Controls International PLC |
269 | 10,838 | ||||||
| JPMorgan Chase & Co. |
1,145 | 109,359 | ||||||
| Juniper Networks, Inc. |
123 | 3,423 | ||||||
| Kellogg Co. (c) |
710 | 44,283 | ||||||
| KeyCorp |
248 | 4,667 | ||||||
| Kimberly-Clark Corp. |
249 | 29,302 | ||||||
| Kinder Morgan, Inc. |
378 | 7,250 | ||||||
| KLA-Tencor Corp. |
51 | 5,406 | ||||||
| Kohl’s Corp. (c) |
66 | 3,013 | ||||||
See accompanying notes to financial statements.
177
Table of Contents
SPDR MSCI World StrategicFactors ETF
SCHEDULE OF INVESTMENTS (continued)
September 30, 2017
| Security Description |
Shares |
Value |
||||||
| Kraft Heinz Co. |
72 | $ | 5,584 | |||||
| Kroger Co. |
335 | 6,720 | ||||||
| L Brands, Inc. (c) |
108 | 4,494 | ||||||
| L3 Technologies, Inc. |
27 | 5,088 | ||||||
| Laboratory Corp. of America Holdings (a) |
198 | 29,892 | ||||||
| Las Vegas Sands Corp. |
66 | 4,235 | ||||||
| Lear Corp. |
75 | 12,981 | ||||||
| Leucadia National Corp. |
120 | 3,030 | ||||||
| Liberty Interactive Corp. QVC Group Class A (a) |
120 | 2,828 | ||||||
| Liberty Media Corp.-Liberty SiriusXM Class A (a) |
99 | 4,148 | ||||||
| Liberty Media Corp.-Liberty SiriusXM Class C (a) |
198 | 8,290 | ||||||
| Lincoln National Corp. |
66 | 4,850 | ||||||
| Lockheed Martin Corp. |
75 | 23,272 | ||||||
| Loews Corp. |
81 | 3,877 | ||||||
| Lowe’s Cos., Inc. |
887 | 70,907 | ||||||
| lululemon athletica, Inc. (a) |
87 | 5,416 | ||||||
| LyondellBasell Industries NV Class A |
435 | 43,087 | ||||||
| M&T Bank Corp. |
51 | 8,213 | ||||||
| ManpowerGroup, Inc. |
39 | 4,595 | ||||||
| Marathon Oil Corp. |
480 | 6,509 | ||||||
| Marathon Petroleum Corp. |
351 | 19,684 | ||||||
| Markel Corp. (a) |
75 | 80,098 | ||||||
| Marriott International, Inc. Class A |
30 | 3,308 | ||||||
| Marsh & McLennan Cos., Inc. |
764 | 64,031 | ||||||
| Mastercard, Inc. Class A |
1,033 | 145,860 | ||||||
| Maxim Integrated Products, Inc. |
225 | 10,735 | ||||||
| McCormick & Co., Inc. |
510 | 52,346 | ||||||
| McDonald’s Corp. |
641 | 100,432 | ||||||
| McKesson Corp. |
236 | 36,252 | ||||||
| Medtronic PLC |
503 | 39,118 | ||||||
| Merck & Co., Inc. |
1,030 | 65,951 | ||||||
| MetLife, Inc. |
269 | 13,975 | ||||||
| Mettler-Toledo International, Inc. (a) |
27 | 16,906 | ||||||
| MGM Resorts International |
123 | 4,009 | ||||||
| Michael Kors Holdings, Ltd. (a) |
204 | 9,761 | ||||||
| Micron Technology, Inc. (a) |
267 | 10,501 | ||||||
| Microsoft Corp. |
5,844 | 435,320 | ||||||
| Molson Coors Brewing Co. Class B |
48 | 3,919 | ||||||
| Mondelez International, Inc. Class A |
326 | 13,255 | ||||||
| Monsanto Co. |
494 | 59,191 | ||||||
| Monster Beverage Corp. (a) |
329 | 18,177 | ||||||
| Morgan Stanley |
315 | 15,174 | ||||||
| Mosaic Co. |
72 | 1,554 | ||||||
| Motorola Solutions, Inc. |
312 | 26,479 | ||||||
| Murphy Oil Corp. (c) |
51 | 1,355 | ||||||
| Mylan NV (a) |
66 | 2,070 | ||||||
| National Oilwell Varco, Inc. |
375 | 13,399 | ||||||
| Navient Corp. |
210 | 3,154 | ||||||
| NetApp, Inc. |
87 | 3,807 | ||||||
| New York Community Bancorp, Inc. |
219 | 2,823 | ||||||
| Newell Brands, Inc. |
201 | 8,577 | ||||||
| Newmont Mining Corp. |
251 | 9,415 | ||||||
| News Corp. Class A |
189 | 2,506 | ||||||
| NextEra Energy, Inc. |
254 | 37,224 | ||||||
| NIKE, Inc. Class B |
1,328 | 68,857 | ||||||
| Noble Energy, Inc. |
45 | 1,276 | ||||||
| Nordstrom, Inc. |
117 | 5,517 | ||||||
| Norfolk Southern Corp. |
45 | 5,951 | ||||||
| Northern Trust Corp. |
54 | 4,964 | ||||||
| Northrop Grumman Corp. |
305 | 87,755 | ||||||
| Nucor Corp. |
63 | 3,531 | ||||||
| NVIDIA Corp. |
474 | 84,737 | ||||||
| O’Reilly Automotive, Inc. (a) |
189 | 40,705 | ||||||
| Occidental Petroleum Corp. |
453 | 29,087 | ||||||
| Omnicom Group, Inc. |
195 | 14,444 | ||||||
| ONEOK, Inc. |
48 | 2,660 | ||||||
| Oracle Corp. |
614 | 29,687 | ||||||
| PACCAR, Inc. |
54 | 3,906 | ||||||
| Parker-Hannifin Corp. |
27 | 4,726 | ||||||
| Patterson Cos., Inc. (c) |
18 | 696 | ||||||
| Paychex, Inc. |
1,187 | 71,172 | ||||||
| PayPal Holdings, Inc. (a) |
90 | 5,763 | ||||||
| People’s United Financial, Inc. |
91 | 1,651 | ||||||
| PepsiCo, Inc. |
831 | 92,598 | ||||||
| Pfizer, Inc. |
2,235 | 79,789 | ||||||
| PG&E Corp. |
851 | 57,945 | ||||||
| Philip Morris International, Inc. |
189 | 20,981 | ||||||
| Phillips 66 |
239 | 21,895 | ||||||
| Pioneer Natural Resources Co. |
15 | 2,213 | ||||||
| Plains GP Holdings L.P. Class A (a) |
111 | 2,428 | ||||||
| PNC Financial Services Group, Inc. |
162 | 21,833 | ||||||
| Polaris Industries, Inc. (c) |
57 | 5,964 | ||||||
| PPG Industries, Inc. |
36 | 3,912 | ||||||
| PPL Corp. |
132 | 5,009 | ||||||
| Praxair, Inc. |
198 | 27,668 | ||||||
| Priceline Group, Inc. (a) |
39 | 71,402 | ||||||
| Principal Financial Group, Inc. |
66 | 4,246 | ||||||
| Procter & Gamble Co. |
2,943 | 267,754 | ||||||
| Progressive Corp. |
450 | 21,789 | ||||||
| Prologis, Inc. REIT |
81 | 5,140 | ||||||
| Prudential Financial, Inc. |
105 | 11,164 | ||||||
| Public Service Enterprise Group, Inc. |
108 | 4,995 | ||||||
| Public Storage REIT |
308 | 65,909 | ||||||
| PulteGroup, Inc. |
162 | 4,427 | ||||||
| QUALCOMM, Inc. |
1,375 | 71,280 | ||||||
| Quest Diagnostics, Inc. |
54 | 5,057 | ||||||
| Ralph Lauren Corp. |
45 | 3,973 | ||||||
| Raytheon Co. |
380 | 70,900 | ||||||
| Realty Income Corp. REIT (c) |
299 | 17,100 | ||||||
| Red Hat, Inc. (a) |
150 | 16,629 | ||||||
| Regeneron Pharmaceuticals, Inc. (a) |
75 | 33,534 | ||||||
| Regions Financial Corp. |
405 | 6,168 | ||||||
| RenaissanceRe Holdings, Ltd. |
180 | 24,325 | ||||||
| Republic Services, Inc. |
1,007 | 66,522 | ||||||
| ResMed, Inc. |
102 | 7,850 | ||||||
| Robert Half International, Inc. |
114 | 5,739 | ||||||
| Rockwell Automation, Inc. |
111 | 19,781 | ||||||
| Rockwell Collins, Inc. |
114 | 14,901 | ||||||
| Ross Stores, Inc. |
584 | 37,709 | ||||||
| Royal Caribbean Cruises, Ltd. |
57 | 6,757 | ||||||
| SBA Communications Corp. REIT (a) |
48 | 6,914 | ||||||
| SCANA Corp. |
90 | 4,364 | ||||||
| Schlumberger, Ltd. |
332 | 23,160 | ||||||
See accompanying notes to financial statements.
178
Table of Contents
SPDR MSCI World StrategicFactors ETF
SCHEDULE OF INVESTMENTS (continued)
September 30, 2017
| Security Description |
Shares |
Value |
||||||
| Scripps Networks Interactive, Inc. Class A |
63 | $ | 5,411 | |||||
| Seagate Technology PLC |
72 | 2,388 | ||||||
| SEI Investments Co. |
117 | 7,144 | ||||||
| Sempra Energy |
66 | 7,533 | ||||||
| Sherwin-Williams Co. |
63 | 22,556 | ||||||
| Shire PLC |
87 | 4,421 | ||||||
| Simon Property Group, Inc. REIT |
21 | 3,381 | ||||||
| Skyworks Solutions, Inc. |
123 | 12,534 | ||||||
| Southern Co. |
1,421 | 69,828 | ||||||
| Southwest Airlines Co. |
18 | 1,008 | ||||||
| Stanley Black & Decker, Inc. |
36 | 5,435 | ||||||
| Starbucks Corp. |
1,933 | 103,821 | ||||||
| State Street Corp. (f) |
108 | 10,318 | ||||||
| Stericycle, Inc. (a) |
15 | 1,074 | ||||||
| Stryker Corp. |
488 | 69,306 | ||||||
| SunTrust Banks, Inc. |
159 | 9,503 | ||||||
| Symantec Corp. |
138 | 4,528 | ||||||
| Synchrony Financial |
96 | 2,981 | ||||||
| Synopsys, Inc. (a) |
354 | 28,508 | ||||||
| Sysco Corp. |
638 | 34,420 | ||||||
| T Rowe Price Group, Inc. |
201 | 18,221 | ||||||
| Target Corp. |
193 | 11,389 | ||||||
| TD Ameritrade Holding Corp. |
183 | 8,930 | ||||||
| Texas Instruments, Inc. |
1,010 | 90,536 | ||||||
| Textron, Inc. |
84 | 4,526 | ||||||
| Thermo Fisher Scientific, Inc. |
39 | 7,379 | ||||||
| Thomson Reuters Corp. |
447 | 20,462 | ||||||
| Tiffany & Co. |
87 | 7,985 | ||||||
| Time Warner, Inc. |
332 | 34,013 | ||||||
| TJX Cos., Inc. |
1,337 | 98,577 | ||||||
| Tractor Supply Co. |
117 | 7,405 | ||||||
| Travelers Cos., Inc. |
372 | 45,577 | ||||||
| TripAdvisor, Inc. (a) (c) |
84 | 3,405 | ||||||
| Twenty-First Century Fox, Inc. Class A |
195 | 5,144 | ||||||
| Twenty-First Century Fox, Inc. Class B |
387 | 9,981 | ||||||
| Tyson Foods, Inc. Class A |
84 | 5,918 | ||||||
| UDR, Inc. REIT |
596 | 22,666 | ||||||
| Ulta Salon Cosmetics & Fragrance, Inc. (a) |
45 | 10,173 | ||||||
| Under Armour, Inc. Class A (a) (c) |
102 | 1,681 | ||||||
| Under Armour, Inc. Class C (a) (c) |
102 | 1,532 | ||||||
| Union Pacific Corp. |
683 | 79,207 | ||||||
| United Parcel Service, Inc. Class B |
408 | 48,997 | ||||||
| United Technologies Corp. |
117 | 13,581 | ||||||
| UnitedHealth Group, Inc. |
423 | 82,845 | ||||||
| Universal Health Services, Inc. Class B |
36 | 3,994 | ||||||
| Unum Group |
90 | 4,602 | ||||||
| US Bancorp |
564 | 30,225 | ||||||
| Valero Energy Corp. |
242 | 18,617 | ||||||
| Varian Medical Systems, Inc. (a) |
432 | 43,226 | ||||||
| Ventas, Inc. REIT |
31 | 2,019 | ||||||
| Verisk Analytics, Inc. (a) |
150 | 12,478 | ||||||
| Verizon Communications, Inc. |
2,672 | 132,237 | ||||||
| VF Corp. (c) |
297 | 18,880 | ||||||
| Visa, Inc. Class A |
2,020 | 212,585 | ||||||
| VMware, Inc. Class A (a) (c) |
299 | 32,648 | ||||||
| Voya Financial, Inc. |
84 | 3,351 | ||||||
| W.W. Grainger, Inc. (c) |
48 | 8,628 | ||||||
| Wabtec Corp. (c) |
66 | 4,999 | ||||||
| Wal-Mart Stores, Inc. |
2,104 | 164,407 | ||||||
| Walgreens Boots Alliance, Inc. |
132 | 10,193 | ||||||
| Walt Disney Co. |
1,441 | 142,039 | ||||||
| Waste Management, Inc. |
983 | 76,939 | ||||||
| Waters Corp. (a) |
63 | 11,310 | ||||||
| WEC Energy Group, Inc. |
578 | 36,287 | ||||||
| Wells Fargo & Co. |
1,436 | 79,195 | ||||||
| Welltower, Inc. REIT |
154 | 10,823 | ||||||
| Western Digital Corp. |
45 | 3,888 | ||||||
| Western Union Co. |
501 | 9,619 | ||||||
| WestRock Co. |
66 | 3,744 | ||||||
| Weyerhaeuser Co. REIT |
102 | 3,471 | ||||||
| Whirlpool Corp. |
21 | 3,873 | ||||||
| Williams Cos., Inc. |
66 | 1,981 | ||||||
| Willis Towers Watson PLC |
36 | 5,552 | ||||||
| WR Berkley Corp. |
414 | 27,630 | ||||||
| Xcel Energy, Inc. |
1,010 | 47,793 | ||||||
| Xerox Corp. |
91 | 3,029 | ||||||
| Xilinx, Inc. (c) |
171 | 12,112 | ||||||
| Yum! Brands, Inc. |
84 | 6,183 | ||||||
| Zimmer Biomet Holdings, Inc. |
30 | 3,513 | ||||||
| Zoetis, Inc. |
24 | 1,530 | ||||||
|
|
|
|||||||
| 12,987,958 | ||||||||
|
|
|
|||||||
| TOTAL COMMON STOCKS |
21,536,074 | |||||||
|
|
|
|||||||
| SHORT-TERM INVESTMENTS — 20.5% |
| |||||||
| State Street Institutional U.S. Government Money Market Fund, Class G Shares 0.96% (g) (h) |
4,411,701 | 4,411,701 | ||||||
| State Street Navigator Securities Lending Government Money Market Portfolio (g) (i) |
24,983 | 24,983 | ||||||
|
|
|
|||||||
| TOTAL SHORT-TERM INVESTMENTS |
4,436,684 | |||||||
|
|
|
|||||||
| TOTAL INVESTMENTS — 120.2% |
25,972,758 | |||||||
| LIABILITIES IN EXCESS OF OTHER ASSETS — (20.2)% |
(4,367,219 | ) | ||||||
|
|
|
|||||||
| NET ASSETS — 100.0% |
$ | 21,605,539 | ||||||
|
|
|
|||||||
| (a) | Non-income producing security. |
| (b) | Reflects separate holdings of the issuer’s common stock traded on different securities exchanges. |
| (c) | All or a portion of the shares of the security are on loan at September 30, 2017. |
| (d) | Amount is less than 0.05% of net assets. |
| (e) | Securities purchased pursuant to Rule 144A of the Securities Act of 1933, as amended. These securities, which represent 0.3% of net assets as of September 30, 2017, are considered liquid and may be resold in transactions exempt from registration, normally to qualified institutional buyers. |
| (f) | The Fund invested in an affiliated entity, State Street Corp. Amounts related to these transactions during the period ended September 30, 2017 are shown in the Affiliate Table below. |
See accompanying notes to financial statements.
179
Table of Contents
SPDR MSCI World StrategicFactors ETF
SCHEDULE OF INVESTMENTS (continued)
September 30, 2017
| (g) | The Fund invested in certain money market funds managed by SSGA Funds Management, Inc. Amounts related to these transactions during the period ended September 30, 2017 are shown in the Affiliate Table below. |
| (h) | The rate shown is the annualized seven-day yield at September 30, 2017. |
| (i) | Investment of cash collateral for securities loaned. |
ADR = American Depositary Receipt
REIT = Real Estate Investment Trust
The following table summarizes the value of the Fund’s investments according to the fair value hierarchy as of September 30, 2017.
| Description |
Level 1 — Quoted Prices |
Level 2 — Other Significant Observable Inputs |
Level 3 — Significant Unobservable Inputs |
Total | ||||||||||||
| ASSETS: |
||||||||||||||||
| INVESTMENTS: |
||||||||||||||||
| Common Stocks |
||||||||||||||||
| Australia |
$ | 298,108 | $ | — | $ | — | $ | 298,108 | ||||||||
| Austria |
13,141 | — | — | 13,141 | ||||||||||||
| Belgium |
65,102 | — | — | 65,102 | ||||||||||||
| Canada |
702,547 | — | — | 702,547 | ||||||||||||
| Chile |
1,413 | — | — | 1,413 | ||||||||||||
| Denmark |
285,586 | — | — | 285,586 | ||||||||||||
| Finland |
67,853 | — | — | 67,853 | ||||||||||||
| France |
459,855 | — | — | 459,855 | ||||||||||||
| Germany |
513,381 | — | — | 513,381 | ||||||||||||
| Hong Kong |
403,063 | — | — | 403,063 | ||||||||||||
| Ireland |
67,300 | — | — | 67,300 | ||||||||||||
| Israel |
104,053 | — | — | 104,053 | ||||||||||||
| Italy |
147,683 | — | — | 147,683 | ||||||||||||
| Japan |
2,134,942 | — | — | 2,134,942 | ||||||||||||
| Luxembourg |
18,232 | — | — | 18,232 | ||||||||||||
| Mexico |
226 | — | — | 226 | ||||||||||||
| Netherlands |
197,537 | — | — | 197,537 | ||||||||||||
| New Zealand |
24,934 | — | — | 24,934 | ||||||||||||
| Norway |
28,098 | — | — | 28,098 | ||||||||||||
| Portugal |
10,013 | — | — | 10,013 | ||||||||||||
| Singapore |
151,375 | — | — | 151,375 | ||||||||||||
| South Africa |
10,299 | — | — | 10,299 | ||||||||||||
| Spain |
193,369 | — | — | 193,369 | ||||||||||||
| Sweden |
175,432 | — | — | 175,432 | ||||||||||||
| Switzerland |
977,654 | — | — | 977,654 | ||||||||||||
| United Kingdom |
1,496,920 | — | — | 1,496,920 | ||||||||||||
| United States |
12,987,958 | — | — | 12,987,958 | ||||||||||||
| Short-Term Investments |
4,436,684 | — | — | 4,436,684 | ||||||||||||
|
|
|
|
|
|
|
|
|
|||||||||
| TOTAL INVESTMENTS |
$ | 25,972,758 | $ | — | $ | — | $ | 25,972,758 | ||||||||
|
|
|
|
|
|
|
|
|
|||||||||
See accompanying notes to financial statements.
180
Table of Contents
SPDR MSCI World StrategicFactors ETF
SCHEDULE OF INVESTMENTS (continued)
September 30, 2017
Affiliate Table
| Number of Shares Held at 9/30/16 |
Value at 9/30/16 |
Cost of Purchases |
Proceeds from Shares Sold |
Realized Gain (Loss) |
Change in Unrealized Appreciation/ Depreciation |
Number of Shares Held at 9/30/17 |
Value at 9/30/17 |
Dividend Income |
||||||||||||||||||||||||||||
| State Street Corp |
36 | $ | 2,507 | $ | 8,517 | $ | 3,440 | $ | 1,052 | $ | 1,682 | 108 | $ | 10,318 | $ | 210 | ||||||||||||||||||||
| State Street Institutional Liquid Reserves Fund, Premier Class |
28,844 | 28,844 | 919 | 29,763 | — | — | — | — | 1 | |||||||||||||||||||||||||||
| State Street Institutional U.S. Government Money Market Fund, Class G Shares |
— | — | 5,114,339 | 702,638 | — | — | 4,411,701 | 4,411,701 | 492 | |||||||||||||||||||||||||||
| State Street Institutional U.S. Government Money Market Fund, Premier Class |
— | — | 318,206 | 318,206 | — | — | — | — | 74 | |||||||||||||||||||||||||||
| State Street Navigator Securities Lending Government Money Market Portfolio* |
— | — | 443,219 | 418,236 | — | — | 24,983 | 24,983 | 239 | |||||||||||||||||||||||||||
|
|
|
|
|
|
|
|
|
|
|
|
|
|
|
|||||||||||||||||||||||
| TOTAL |
$ | 31,351 | $ | 5,885,200 | $ | 1,472,283 | $ | 1,052 | $ | 1,682 | $ | 4,447,002 | $ | 1,016 | ||||||||||||||||||||||
|
|
|
|
|
|
|
|
|
|
|
|
|
|
|
|||||||||||||||||||||||
| * | Effective October 5, 2016, the name of State Street Navigator Securities Lending Prime Portfolio was changed to State Street Navigator Securities Lending Government Money Market Portfolio. |
See accompanying notes to financial statements.
181
Table of Contents
SPDR MSCI Canada StrategicFactors ETF
SCHEDULE OF INVESTMENTS
September 30, 2017
| Security Description |
Shares |
Value |
||||||
| COMMON STOCKS — 99.6% |
| |||||||
| AEROSPACE & DEFENSE — 1.1% |
| |||||||
| Bombardier, Inc. Class B (a) |
31,690 | $ | 57,266 | |||||
| CAE, Inc. |
21,880 | 381,914 | ||||||
|
|
|
|||||||
| 439,180 | ||||||||
|
|
|
|||||||
| AUTO COMPONENTS — 3.4% |
| |||||||
| Linamar Corp. |
4,683 | 285,102 | ||||||
| Magna International, Inc. |
19,646 | 1,046,038 | ||||||
|
|
|
|||||||
| 1,331,140 | ||||||||
|
|
|
|||||||
| BANKS — 20.1% |
| |||||||
| Bank of Montreal |
13,471 | 1,017,124 | ||||||
| Bank of Nova Scotia |
21,890 | 1,403,733 | ||||||
| Canadian Imperial Bank of Commerce |
17,398 | 1,518,682 | ||||||
| National Bank of Canada |
10,274 | 493,306 | ||||||
| Royal Bank of Canada |
21,615 | 1,668,502 | ||||||
| Toronto-Dominion Bank |
30,128 | 1,692,314 | ||||||
|
|
|
|||||||
| 7,793,661 | ||||||||
|
|
|
|||||||
| CAPITAL MARKETS — 1.6% |
| |||||||
| CI Financial Corp. |
26,672 | 582,001 | ||||||
| IGM Financial, Inc. |
769 | 25,788 | ||||||
|
|
|
|||||||
| 607,789 | ||||||||
|
|
|
|||||||
| CHEMICALS — 3.1% |
| |||||||
| Agrium, Inc. |
8,869 | 948,277 | ||||||
| Methanex Corp. |
805 | 40,358 | ||||||
| Potash Corp. of Saskatchewan, Inc. |
10,781 | 207,060 | ||||||
|
|
|
|||||||
| 1,195,695 | ||||||||
|
|
|
|||||||
| CONSTRUCTION & ENGINEERING — 1.3% |
| |||||||
| SNC-Lavalin Group, Inc. |
11,247 | 507,111 | ||||||
|
|
|
|||||||
| CONTAINERS & PACKAGING — 1.8% |
| |||||||
| CCL Industries, Inc. Class B |
14,290 | 689,905 | ||||||
|
|
|
|||||||
| DIVERSIFIED FINANCIAL SERVICES — 0.8% |
| |||||||
| Element Fleet Management Corp. |
3,226 | 23,860 | ||||||
| Onex Corp. |
3,934 | 302,886 | ||||||
|
|
|
|||||||
| 326,746 | ||||||||
|
|
|
|||||||
| DIVERSIFIED TELECOMMUNICATION SERVICES — 3.2% |
| |||||||
| BCE, Inc. |
19,047 | 890,327 | ||||||
| TELUS Corp. |
9,325 | 334,631 | ||||||
|
|
|
|||||||
| 1,224,958 | ||||||||
|
|
|
|||||||
| ELECTRIC UTILITIES — 2.7% |
| |||||||
| Emera, Inc. |
7,618 | 287,872 | ||||||
| Fortis, Inc. |
10,372 | 371,373 | ||||||
| Hydro One, Ltd. (b) |
22,216 | 403,588 | ||||||
|
|
|
|||||||
| 1,062,833 | ||||||||
|
|
|
|||||||
| FOOD & STAPLES RETAILING — 6.8% |
| |||||||
| Alimentation Couche-Tard, Inc. Class B |
19,212 | 874,076 | ||||||
| Empire Co., Ltd. Class A |
4,136 | 73,020 | ||||||
| George Weston, Ltd. |
2,808 | 243,944 | ||||||
| Jean Coutu Group PJC, Inc. Class A |
9,464 | 183,885 | ||||||
| Loblaw Cos., Ltd. |
7,589 | 413,234 | ||||||
| Metro, Inc. |
24,733 | 848,593 | ||||||
|
|
|
|||||||
| 2,636,752 | ||||||||
|
|
|
|||||||
| FOOD PRODUCTS — 2.2% |
| |||||||
| Saputo, Inc. |
24,272 | 838,210 | ||||||
|
|
|
|||||||
| HOTELS, RESTAURANTS & LEISURE — 0.2% |
| |||||||
| Restaurant Brands International, Inc. |
1,521 | 96,953 | ||||||
|
|
|
|||||||
| INSURANCE — 15.2% |
| |||||||
| Fairfax Financial Holdings, Ltd. |
804 | 417,432 | ||||||
| Great-West Lifeco, Inc. |
34,159 | 980,810 | ||||||
| Industrial Alliance Insurance & Financial Services, Inc. |
11,174 | 504,802 | ||||||
| Intact Financial Corp. |
14,521 | 1,196,721 | ||||||
| Manulife Financial Corp. |
25,667 | 519,435 | ||||||
| Power Corp. of Canada |
11,364 | 288,132 | ||||||
| Power Financial Corp. |
25,376 | 702,246 | ||||||
| Sun Life Financial, Inc. |
32,369 | 1,286,064 | ||||||
|
|
|
|||||||
| 5,895,642 | ||||||||
|
|
|
|||||||
| INTERNET SOFTWARE & SERVICES — 0.0% (c) |
| |||||||
| Shopify, Inc. Class A (a) |
29 | 3,365 | ||||||
|
|
|
|||||||
| IT SERVICES — 2.3% |
| |||||||
| CGI Group, Inc. Class A (a) |
17,267 | 893,275 | ||||||
|
|
|
|||||||
| MEDIA — 2.2% |
| |||||||
| Shaw Communications, Inc. Class B |
16,539 | 379,803 | ||||||
| Thomson Reuters Corp. |
10,288 | 470,945 | ||||||
|
|
|
|||||||
| 850,748 | ||||||||
|
|
|
|||||||
| METALS & MINING — 2.8% |
| |||||||
| Agnico Eagle Mines, Ltd. |
2,335 | 105,282 | ||||||
| Barrick Gold Corp. |
12,093 | 194,161 | ||||||
| First Quantum Minerals, Ltd. |
10,142 | 113,612 | ||||||
| Franco-Nevada Corp. |
2,794 | 215,942 | ||||||
| Goldcorp, Inc. |
9,251 | 119,831 | ||||||
| Kinross Gold Corp. (a) |
9,460 | 40,014 | ||||||
| Teck Resources, Ltd. Class B |
7,511 | 157,769 | ||||||
| Turquoise Hill Resources, Ltd. (a) |
13,707 | 42,305 | ||||||
| Wheaton Precious Metals Corp. |
2,200 | 41,866 | ||||||
| Yamana Gold, Inc. |
13,308 | 35,115 | ||||||
|
|
|
|||||||
| 1,065,897 | ||||||||
|
|
|
|||||||
| MULTI-UTILITIES — 0.2% |
| |||||||
| Atco, Ltd. Class I |
1,141 | 41,785 | ||||||
| Canadian Utilities, Ltd. Class A |
1,713 | 53,075 | ||||||
|
|
|
|||||||
| 94,860 | ||||||||
|
|
|
|||||||
| MULTILINE RETAIL — 2.4% |
| |||||||
| Canadian Tire Corp., Ltd. Class A |
6,110 | 758,907 | ||||||
| Dollarama, Inc. |
1,414 | 154,363 | ||||||
|
|
|
|||||||
| 913,270 | ||||||||
|
|
|
|||||||
| OIL, GAS & CONSUMABLE FUELS — 12.2% |
| |||||||
| AltaGas, Ltd. |
10,425 | 239,567 | ||||||
| ARC Resources, Ltd. |
2,674 | 36,754 | ||||||
| Cameco Corp. |
4,662 | 44,918 | ||||||
| Canadian Natural Resources, Ltd. |
9,137 | 305,309 | ||||||
| Cenovus Energy, Inc. |
13,289 | 132,927 | ||||||
| Crescent Point Energy Corp. |
8,424 | 67,492 | ||||||
| Enbridge, Inc. |
15,766 | 657,037 | ||||||
| Encana Corp. |
7,341 | 86,227 | ||||||
| Husky Energy, Inc. (a) |
6,562 | 81,956 | ||||||
| Imperial Oil, Ltd. |
11,848 | 377,613 | ||||||
| Inter Pipeline, Ltd. |
9,744 | 201,401 | ||||||
| Keyera Corp. |
15,662 | 477,631 | ||||||
| Pembina Pipeline Corp. |
12,667 | 443,418 | ||||||
See accompanying notes to financial statements.
182
Table of Contents
SPDR MSCI Canada StrategicFactors ETF
SCHEDULE OF INVESTMENTS (continued)
September 30, 2017
| Security Description |
Shares |
Value |
||||||
| Peyto Exploration & Development Corp. |
1,135 | $ | 18,514 | |||||
| PrairieSky Royalty, Ltd. |
832 | 21,242 | ||||||
| Seven Generations Energy, Ltd. Class A (a) |
807 | 12,737 | ||||||
| Suncor Energy, Inc. |
23,098 | 807,640 | ||||||
| Tourmaline Oil Corp. (a) |
2,041 | 41,403 | ||||||
| TransCanada Corp. |
12,244 | 603,756 | ||||||
| Veresen, Inc. |
3,727 | 55,787 | ||||||
| Vermilion Energy, Inc. |
490 | 17,376 | ||||||
|
|
|
|||||||
| 4,730,705 | ||||||||
|
|
|
|||||||
| PAPER & FOREST PRODUCTS — 0.1% |
| |||||||
| West Fraser Timber Co., Ltd. |
721 | 41,508 | ||||||
|
|
|
|||||||
| PHARMACEUTICALS — 0.3% |
| |||||||
| Valeant Pharmaceuticals International, Inc. (a) |
7,389 | 105,637 | ||||||
|
|
|
|||||||
| REAL ESTATE INVESTMENT TRUSTS (REITS) — 1.0% |
| |||||||
| H&R Real Estate Investment Trust REIT |
6,429 | 110,727 | ||||||
| RioCan Real Estate Investment Trust |
9,957 | 190,518 | ||||||
| Smart Real Estate Investment Trust REIT |
3,648 | 85,873 | ||||||
|
|
|
|||||||
| 387,118 | ||||||||
|
|
|
|||||||
| REAL ESTATE MANAGEMENT & DEVELOPMENT — 1.6% |
| |||||||
| Brookfield Asset Management, Inc. Class A |
11,248 | 463,357 | ||||||
| First Capital Realty, Inc. |
9,944 | 156,477 | ||||||
|
|
|
|||||||
| 619,834 | ||||||||
|
|
|
|||||||
| ROAD & RAIL — 5.2% |
| |||||||
| Canadian National Railway Co. |
14,870 | 1,229,169 | ||||||
| Canadian Pacific Railway, Ltd. |
4,591 | 769,346 | ||||||
|
|
|
|||||||
| 1,998,515 | ||||||||
|
|
|
|||||||
| SOFTWARE — 2.9% |
| |||||||
| Constellation Software, Inc. |
1,631 | 887,768 | ||||||
| Open Text Corp. |
7,261 | 233,741 | ||||||
|
|
|
|||||||
| 1,121,509 | ||||||||
|
|
|
|||||||
| TECHNOLOGY HARDWARE, STORAGE & PERIPHERALS — 0.1% |
| |||||||
| BlackBerry, Ltd. (a) |
1,880 | 20,970 | ||||||
|
|
|
|||||||
| TEXTILES, APPAREL & LUXURY GOODS — 1.7% |
| |||||||
| Gildan Activewear, Inc. |
20,951 | 653,164 | ||||||
|
|
|
|||||||
| TRADING COMPANIES & DISTRIBUTORS — 0.1% |
| |||||||
| Finning International, Inc. |
1,576 | 35,952 | ||||||
|
|
|
|||||||
| WIRELESS TELECOMMUNICATION SERVICES — 1.0% |
| |||||||
| Rogers Communications, Inc. Class B |
7,704 | 396,334 | ||||||
|
|
|
|||||||
| TOTAL COMMON STOCKS (Cost $33,003,214) |
38,579,236 | |||||||
|
|
|
|||||||
| SHORT-TERM INVESTMENT — 0.0% (c) |
| |||||||
| State Street Institutional U.S. Government Money Market Fund, Class G Shares 0.96% (d)
(e) |
13,104 | 13,104 | ||||||
|
|
|
|||||||
| TOTAL INVESTMENTS — 99.6% |
38,592,340 | |||||||
| OTHER ASSETS IN EXCESS OF LIABILITIES — 0.4% |
160,398 | |||||||
|
|
|
|||||||
| NET ASSETS — 100.0% |
$ | 38,752,738 | ||||||
|
|
|
|||||||
| (a) | Non-income producing security. |
| (b) | Security purchased pursuant to Rule 144A of the Securities Act of 1933, as amended. This security, which represents 1.0% of net assets as of September 30, 2017, is considered liquid and may be resold in transactions exempt from registration, normally to qualified institutional buyers. |
| (c) | Amount shown represents less than 0.05% of net assets. |
| (d) | The Fund invested in certain money market funds managed by SSGA Funds Management, Inc. Amounts related to these transactions during the period ended September 30, 2017 are shown in the Affiliate Table below. |
| (e) | The rate shown is the annualized seven-day yield at September 30, 2017. |
REIT = Real Estate Investment Trust
The following table summarizes the value of the Fund’s investments according to the fair value hierarchy as of September 30, 2017.
| Description |
Level 1 — Quoted Prices |
Level 2 — Other Significant Observable Inputs |
Level 3 — Significant Unobservable Inputs |
Total | ||||||||||||
| ASSETS: |
||||||||||||||||
| INVESTMENTS: |
||||||||||||||||
| Common Stocks |
||||||||||||||||
| Aerospace & Defense |
$ | 439,180 | $ | — | $ | — | $ | 439,180 | ||||||||
| Auto Components |
1,331,140 | — | — | 1,331,140 | ||||||||||||
| Banks |
7,793,661 | — | — | 7,793,661 | ||||||||||||
| Capital Markets |
607,789 | — | — | 607,789 | ||||||||||||
| Chemicals |
1,195,695 | — | — | 1,195,695 | ||||||||||||
| Construction & Engineering |
507,111 | — | — | 507,111 | ||||||||||||
| Containers & Packaging |
689,905 | — | — | 689,905 | ||||||||||||
| Diversified Financial Services |
326,746 | — | — | 326,746 | ||||||||||||
| Diversified Telecommunication Services |
1,224,958 | — | — | 1,224,958 | ||||||||||||
| Electric Utilities |
1,062,833 | — | — | 1,062,833 | ||||||||||||
See accompanying notes to financial statements.
183
Table of Contents
SPDR MSCI Canada StrategicFactors ETF
SCHEDULE OF INVESTMENTS (continued)
September 30, 2017
| Description |
Level 1 — Quoted Prices |
Level 2 — Other Significant Observable Inputs |
Level 3 — Significant Unobservable Inputs |
Total | ||||||||||||
| Food & Staples Retailing |
$ | 2,636,752 | $ | — | $ | — | $ | 2,636,752 | ||||||||
| Food Products |
838,210 | — | — | 838,210 | ||||||||||||
| Hotels, Restaurants & Leisure |
96,953 | — | — | 96,953 | ||||||||||||
| Insurance |
5,895,642 | — | — | 5,895,642 | ||||||||||||
| Internet Software & Services |
3,365 | — | — | 3,365 | ||||||||||||
| IT Services |
893,275 | — | — | 893,275 | ||||||||||||
| Media |
850,748 | — | — | 850,748 | ||||||||||||
| Metals & Mining |
1,065,897 | — | — | 1,065,897 | ||||||||||||
| Multi-Utilities |
94,860 | — | — | 94,860 | ||||||||||||
| Multiline Retail |
913,270 | — | — | 913,270 | ||||||||||||
| Oil, Gas & Consumable Fuels |
4,730,705 | — | — | 4,730,705 | ||||||||||||
| Paper & Forest Products |
41,508 | — | — | 41,508 | ||||||||||||
| Pharmaceuticals |
105,637 | — | — | 105,637 | ||||||||||||
| Real Estate Investment Trusts (REITs) |
387,118 | — | — | 387,118 | ||||||||||||
| Real Estate Management & Development |
619,834 | — | — | 619,834 | ||||||||||||
| Road & Rail |
1,998,515 | — | — | 1,998,515 | ||||||||||||
| Software |
1,121,509 | — | — | 1,121,509 | ||||||||||||
| Technology Hardware, Storage & Peripherals |
20,970 | — | — | 20,970 | ||||||||||||
| Textiles, Apparel & Luxury Goods |
653,164 | — | — | 653,164 | ||||||||||||
| Trading Companies & Distributors |
35,952 | — | — | 35,952 | ||||||||||||
| Wireless Telecommunication Services |
396,334 | — | — | 396,334 | ||||||||||||
| Short-Term Investment |
13,104 | — | — | 13,104 | ||||||||||||
|
|
|
|
|
|
|
|
|
|||||||||
| TOTAL INVESTMENTS |
$ | 38,592,340 | $ | — | $ | — | $ | 38,592,340 | ||||||||
|
|
|
|
|
|
|
|
|
|||||||||
Affiliate Table
| Number of Shares Held at 9/30/16 |
Value at 9/30/16 |
Cost of Purchases |
Proceeds from Shares Sold |
Realized Gain (Loss) |
Change in Unrealized Appreciation/ Depreciation |
Number of Shares Held at 9/30/17 |
Value at 9/30/17 |
Dividend Income |
||||||||||||||||||||||||||||
| State Street Institutional Liquid Reserves Fund, Premier Class |
9,298 | $ | 9,298 | $ | 263 | $ | 9,561 | $ | — | $ | — | — | $ | — | $ | — | ||||||||||||||||||||
| State Street Institutional U.S. Government Money Market Fund, Class G Shares |
— | — | 373,818 | 360,714 | — | — | 13,104 | 13,104 | 89 | |||||||||||||||||||||||||||
| State Street Institutional U.S. Government Money Market Fund, Premier Class |
— | — | 259,022 | 259,022 | — | — | — | — | 42 | |||||||||||||||||||||||||||
|
|
|
|
|
|
|
|
|
|
|
|
|
|
|
|||||||||||||||||||||||
| TOTAL |
$ | 9,298 | $ | 633,103 | $ | 629,297 | $ | — | $ | — | $ | 13,104 | $ | 131 | ||||||||||||||||||||||
|
|
|
|
|
|
|
|
|
|
|
|
|
|
|
|||||||||||||||||||||||
See accompanying notes to financial statements.
184
Table of Contents
SPDR MSCI Germany StrategicFactors ETF
SCHEDULE OF INVESTMENTS
September 30, 2017
| Security Description |
Shares |
Value |
||||||
| COMMON STOCKS — 99.5% |
| |||||||
| AIR FREIGHT & LOGISTICS — 4.2% |
| |||||||
| Deutsche Post AG |
17,672 | $ | 786,891 | |||||
|
|
|
|||||||
| AIRLINES — 1.0% |
| |||||||
| Deutsche Lufthansa AG |
7,104 | 197,445 | ||||||
|
|
|
|||||||
| AUTO COMPONENTS — 3.0% |
| |||||||
| Continental AG |
2,177 | 552,691 | ||||||
| Schaeffler AG Preference Shares |
1,085 | 17,509 | ||||||
|
|
|
|||||||
| 570,200 | ||||||||
|
|
|
|||||||
| AUTOMOBILES — 8.8% |
| |||||||
| Bayerische Motoren Werke AG |
2,776 | 281,676 | ||||||
| Bayerische Motoren Werke AG Preference Shares |
521 | 46,429 | ||||||
| Daimler AG |
9,707 | 774,259 | ||||||
| Porsche Automobil Holding SE Preference Shares |
966 | 61,782 | ||||||
| Volkswagen AG |
410 | 69,434 | ||||||
| Volkswagen AG Preference Shares |
2,608 | 425,478 | ||||||
|
|
|
|||||||
| 1,659,058 | ||||||||
|
|
|
|||||||
| BANKS — 0.9% |
| |||||||
| Commerzbank AG (a) |
12,974 | 176,539 | ||||||
|
|
|
|||||||
| CAPITAL MARKETS — 1.3% |
| |||||||
| Deutsche Bank AG |
14,501 | 250,803 | ||||||
|
|
|
|||||||
| CHEMICALS — 13.7% |
| |||||||
| BASF SE |
8,936 | 951,195 | ||||||
| Covestro AG (b) |
5,590 | 480,768 | ||||||
| Evonik Industries AG |
6,322 | 225,860 | ||||||
| Fuchs Petrolub SE Preference Shares |
3,994 | 236,510 | ||||||
| KS AG |
1,312 | 35,752 | ||||||
| Lanxess AG |
362 | 28,570 | ||||||
| Linde AG |
1,081 | 225,496 | ||||||
| Symrise AG |
5,230 | 397,375 | ||||||
|
|
|
|||||||
| 2,581,526 | ||||||||
|
|
|
|||||||
| CONSTRUCTION & ENGINEERING — 0.1% |
| |||||||
| HOCHTIEF AG |
75 | 12,657 | ||||||
|
|
|
|||||||
| CONSTRUCTION MATERIALS — 0.8% |
| |||||||
| HeidelbergCement AG |
1,461 | 150,214 | ||||||
|
|
|
|||||||
| DIVERSIFIED FINANCIAL SERVICES — 0.8% |
| |||||||
| Deutsche Boerse AG |
1,405 | 152,329 | ||||||
|
|
|
|||||||
| DIVERSIFIED TELECOMMUNICATION SERVICES — 3.2% |
| |||||||
| Deutsche Telekom AG |
27,076 | 505,266 | ||||||
| Telefonica Deutschland Holding AG |
18,621 | 104,521 | ||||||
|
|
|
|||||||
| 609,787 | ||||||||
|
|
|
|||||||
| ELECTRICAL EQUIPMENT — 1.3% |
| |||||||
| OSRAM Licht AG |
3,003 | 239,670 | ||||||
|
|
|
|||||||
| FOOD & STAPLES RETAILING — 0.3% |
| |||||||
| METRO AG (a) |
2,706 | 57,215 | ||||||
|
|
|
|||||||
| HEALTH CARE PROVIDERS & SERVICES — 3.1% |
| |||||||
| Fresenius Medical Care AG & Co. KGaA |
2,863 | 280,146 | ||||||
| Fresenius SE & Co. KGaA |
3,774 | 304,506 | ||||||
|
|
|
|||||||
| 584,652 | ||||||||
|
|
|
|||||||
| HOUSEHOLD PRODUCTS — 3.5% |
| |||||||
| Henkel AG & Co. KGaA |
1,065 | 129,619 | ||||||
| Henkel AG & Co. KGaA Preference Shares |
3,863 | 525,871 | ||||||
|
|
|
|||||||
| 655,490 | ||||||||
|
|
|
|||||||
| INDUSTRIAL CONGLOMERATES — 4.6% |
| |||||||
| Siemens AG |
6,217 | 876,088 | ||||||
|
|
|
|||||||
| INSURANCE — 12.3% |
| |||||||
| Allianz SE |
4,366 | 980,424 | ||||||
| Hannover Rueck SE |
3,230 | 389,296 | ||||||
| Muenchener Rueckversicherungs-Gesellschaft AG in Muenchen |
4,481 | 958,306 | ||||||
|
|
|
|||||||
| 2,328,026 | ||||||||
|
|
|
|||||||
| INTERNET & CATALOG RETAIL — 0.2% |
| |||||||
| Zalando SE (a) (b) |
683 | 34,236 | ||||||
|
|
|
|||||||
| INTERNET SOFTWARE & SERVICES — 0.4% |
| |||||||
| United Internet AG |
1,109 | 69,053 | ||||||
|
|
|
|||||||
| LIFE SCIENCES TOOLS & SERVICES — 0.3% |
| |||||||
| QIAGEN NV (a) |
1,883 | 59,280 | ||||||
|
|
|
|||||||
| MACHINERY — 3.0% |
| |||||||
| GEA Group AG |
6,317 | 287,441 | ||||||
| KION Group AG |
218 | 20,868 | ||||||
| MAN SE |
2,281 | 257,498 | ||||||
|
|
|
|||||||
| 565,807 | ||||||||
|
|
|
|||||||
| MEDIA — 4.1% |
| |||||||
| Axel Springer SE |
3,095 | 198,935 | ||||||
| ProSiebenSat.1 Media SE |
9,768 | 332,979 | ||||||
| RTL Group SA (c) |
702 | 52,773 | ||||||
| RTL Group SA (c) |
2,631 | 199,188 | ||||||
|
|
|
|||||||
| 783,875 | ||||||||
|
|
|
|||||||
| METALS & MINING — 0.3% |
| |||||||
| ThyssenKrupp AG |
2,072 | 61,422 | ||||||
|
|
|
|||||||
| MULTI-UTILITIES — 4.5% |
| |||||||
| E.ON SE |
18,224 | 206,309 | ||||||
| Innogy SE (b) |
11,398 | 507,390 | ||||||
| RWE AG (a) |
6,414 | 145,738 | ||||||
|
|
|
|||||||
| 859,437 | ||||||||
|
|
|
|||||||
| PERSONAL PRODUCTS — 2.9% |
| |||||||
| Beiersdorf AG |
5,177 | 557,126 | ||||||
|
|
|
|||||||
| PHARMACEUTICALS — 5.9% |
| |||||||
| Bayer AG |
5,996 | 817,300 | ||||||
| Merck KGaA |
2,687 | 298,979 | ||||||
|
|
|
|||||||
| 1,116,279 | ||||||||
|
|
|
|||||||
| REAL ESTATE MANAGEMENT & DEVELOPMENT — 1.8% |
| |||||||
| Deutsche Wohnen SE |
3,927 | 166,758 | ||||||
| Vonovia SE |
3,846 | 163,683 | ||||||
|
|
|
|||||||
| 330,441 | ||||||||
|
|
|
|||||||
| SEMICONDUCTORS & SEMICONDUCTOR EQUIPMENT — 2.5% |
| |||||||
| Infineon Technologies AG |
18,623 | 468,282 | ||||||
|
|
|
|||||||
| SOFTWARE — 4.2% |
| |||||||
| SAP SE |
7,231 | 792,359 | ||||||
|
|
|
|||||||
See accompanying notes to financial statements.
185
Table of Contents
SPDR MSCI Germany StrategicFactors ETF
SCHEDULE OF INVESTMENTS (continued)
September 30, 2017
| Security Description |
Shares |
Value |
||||||
| TEXTILES, APPAREL & LUXURY GOODS — 4.4% |
| |||||||
| adidas AG |
2,461 | $ | 556,858 | |||||
| HUGO BOSS AG |
3,199 | 282,088 | ||||||
|
|
|
|||||||
| 838,946 | ||||||||
|
|
|
|||||||
| TRADING COMPANIES & DISTRIBUTORS — 1.6% |
| |||||||
| Brenntag AG |
5,352 | 298,103 | ||||||
|
|
|
|||||||
| TRANSPORTATION INFRASTRUCTURE — 0.5% |
| |||||||
| Fraport AG Frankfurt Airport Services Worldwide |
1,079 | 102,481 | ||||||
|
|
|
|||||||
| TOTAL COMMON STOCKS |
18,825,717 | |||||||
|
|
|
|||||||
| SHORT-TERM INVESTMENT — 0.0% (d) |
| |||||||
| State Street Institutional U.S. Government Money Market Fund, Class G Shares 0.96% (e)
(f) |
1,300 | 1,300 | ||||||
|
|
|
|||||||
| TOTAL INVESTMENTS — 99.5% |
18,827,017 | |||||||
| OTHER ASSETS IN EXCESS OF LIABILITIES — 0.5% |
90,000 | |||||||
|
|
|
|||||||
| NET ASSETS — 100.0% |
$ | 18,917,017 | ||||||
|
|
|
|||||||
| (a) | Non-income producing security. |
| (b) | Securities purchased pursuant to Rule 144A of the Securities Act of 1933, as amended. These securities, which represent 5.4% of net assets as of September 30, 2017, are considered liquid and may be resold in transactions exempt from registration, normally to qualified institutional buyers. |
| (c) | Reflects separate holdings of the issuer’s common stock traded on different securities exchanges. |
| (d) | Amount is less than 0.05% of net assets. |
| (e) | The Fund invested in certain money market funds managed by SSGA Funds Management, Inc. Amounts related to these transactions during the period ended September 30, 2017 are shown in the Affiliate Table below. |
| (f) | The rate shown is the annualized seven-day yield at September 30, 2017. |
The following table summarizes the value of the Fund’s investments according to the fair value hierarchy as of September 30, 2017.
| Description |
Level 1 — Quoted Prices |
Level 2 — Other Significant Observable Inputs |
Level 3 — Significant Unobservable Inputs |
Total | ||||||||||||
| ASSETS: |
||||||||||||||||
| INVESTMENTS: |
||||||||||||||||
| Common Stocks |
||||||||||||||||
| Air Freight & Logistics |
$ | 786,891 | $ | — | $ | — | $ | 786,891 | ||||||||
| Airlines |
197,445 | — | — | 197,445 | ||||||||||||
| Auto Components |
570,200 | — | — | 570,200 | ||||||||||||
| Automobiles |
1,659,058 | — | — | 1,659,058 | ||||||||||||
| Banks |
176,539 | — | — | 176,539 | ||||||||||||
| Capital Markets |
250,803 | — | — | 250,803 | ||||||||||||
| Chemicals |
2,581,526 | — | — | 2,581,526 | ||||||||||||
| Construction & Engineering |
12,657 | — | — | 12,657 | ||||||||||||
| Construction Materials |
150,214 | — | — | 150,214 | ||||||||||||
| Diversified Financial Services |
152,329 | — | — | 152,329 | ||||||||||||
| Diversified Telecommunication Services |
609,787 | — | — | 609,787 | ||||||||||||
| Electrical Equipment |
239,670 | — | — | 239,670 | ||||||||||||
| Food & Staples Retailing |
57,215 | — | — | 57,215 | ||||||||||||
| Health Care Providers & Services |
584,652 | — | — | 584,652 | ||||||||||||
| Household Products |
655,490 | — | — | 655,490 | ||||||||||||
| Industrial Conglomerates |
876,088 | — | — | 876,088 | ||||||||||||
| Insurance |
2,328,026 | — | — | 2,328,026 | ||||||||||||
| Internet & Catalog Retail |
34,236 | — | — | 34,236 | ||||||||||||
| Internet Software & Services |
69,053 | — | — | 69,053 | ||||||||||||
| Life Sciences Tools & Services |
59,280 | — | — | 59,280 | ||||||||||||
| Machinery |
565,807 | — | — | 565,807 | ||||||||||||
| Media |
783,875 | — | — | 783,875 | ||||||||||||
| Metals & Mining |
61,422 | — | — | 61,422 | ||||||||||||
| Multi-Utilities |
859,437 | — | — | 859,437 | ||||||||||||
See accompanying notes to financial statements.
186
Table of Contents
SPDR MSCI Germany StrategicFactors ETF
SCHEDULE OF INVESTMENTS (continued)
September 30, 2017
| Description |
Level 1 — Quoted Prices |
Level 2 — Other Significant Observable Inputs |
Level 3 — Significant Unobservable Inputs |
Total | ||||||||||||
| Personal Products |
$ | 557,126 | $ | — | $ | — | $ | 557,126 | ||||||||
| Pharmaceuticals |
1,116,279 | — | — | 1,116,279 | ||||||||||||
| Real Estate Management & Development |
330,441 | — | — | 330,441 | ||||||||||||
| Semiconductors & Semiconductor Equipment |
468,282 | — | — | 468,282 | ||||||||||||
| Software |
792,359 | — | — | 792,359 | ||||||||||||
| Textiles, Apparel & Luxury Goods |
838,946 | — | — | 838,946 | ||||||||||||
| Trading Companies & Distributors |
298,103 | — | — | 298,103 | ||||||||||||
| Transportation Infrastructure |
102,481 | — | — | 102,481 | ||||||||||||
| Short-Term Investment |
1,300 | — | — | 1,300 | ||||||||||||
|
|
|
|
|
|
|
|
|
|||||||||
| TOTAL INVESTMENTS |
$ | 18,827,017 | $ | — | $ | — | $ | 18,827,017 | ||||||||
|
|
|
|
|
|
|
|
|
|||||||||
Affiliate Table
| Number of Shares Held at 9/30/16 |
Value at 9/30/16 |
Cost of Purchases |
Proceeds from Shares Sold |
Realized Gain (Loss) |
Change in Unrealized Appreciation/ Depreciation |
Number of Shares Held at 9/30/17 |
Value at 9/30/17 |
Dividend Income |
||||||||||||||||||||||||||||
| State Street Institutional Liquid Reserves Fund, Premier Class |
353 | $ | 353 | $ | — | $ | 353 | $ | — | $ | — | — | $ | — | $ | — | ||||||||||||||||||||
| State Street Institutional U.S. Government Money Market Fund, Class G Shares |
— | — | 397,053 | 395,753 | — | — | 1,300 | 1,300 | 93 | |||||||||||||||||||||||||||
| State Street Institutional U.S. Government Money Market Fund, Premier Class |
— | — | 28,981 | 28,981 | — | — | — | — | 4 | |||||||||||||||||||||||||||
|
|
|
|
|
|
|
|
|
|
|
|
|
|
|
|||||||||||||||||||||||
| TOTAL |
$ | 353 | $ | 426,034 | $ | 425,087 | $ | — | $ | — | $ | 1,300 | $ | 97 | ||||||||||||||||||||||
|
|
|
|
|
|
|
|
|
|
|
|
|
|
|
|||||||||||||||||||||||
See accompanying notes to financial statements.
187
Table of Contents
SPDR MSCI Japan StrategicFactors ETF
SCHEDULE OF INVESTMENTS
September 30, 2017
| Security Description |
Shares |
Value |
||||||
| COMMON STOCKS — 99.0% |
| |||||||
| AIR FREIGHT & LOGISTICS — 0.1% |
| |||||||
| Yamato Holdings Co., Ltd. |
600 | $ | 12,108 | |||||
|
|
|
|||||||
| AIRLINES — 1.1% |
| |||||||
| ANA Holdings, Inc. |
1,700 | 64,321 | ||||||
| Japan Airlines Co., Ltd. |
3,100 | 104,871 | ||||||
|
|
|
|||||||
| 169,192 | ||||||||
|
|
|
|||||||
| AUTO COMPONENTS — 3.8% |
| |||||||
| Aisin Seiki Co., Ltd. |
600 | 31,609 | ||||||
| Bridgestone Corp. |
7,300 | 331,131 | ||||||
| Denso Corp. |
1,000 | 50,575 | ||||||
| Koito Manufacturing Co., Ltd. |
1,300 | 81,535 | ||||||
| NGK Spark Plug Co., Ltd. |
200 | 4,255 | ||||||
| NOK Corp. |
200 | 4,478 | ||||||
| Stanley Electric Co., Ltd. |
100 | 3,425 | ||||||
| Sumitomo Electric Industries, Ltd. |
1,900 | 31,024 | ||||||
| Sumitomo Rubber Industries, Ltd. |
600 | 10,991 | ||||||
| Toyoda Gosei Co., Ltd. |
100 | 2,362 | ||||||
| Toyota Industries Corp. |
300 | 17,243 | ||||||
| Yokohama Rubber Co., Ltd. |
200 | 4,122 | ||||||
|
|
|
|||||||
| 572,750 | ||||||||
|
|
|
|||||||
| AUTOMOBILES — 7.5% |
| |||||||
| Honda Motor Co., Ltd. |
5,400 | 159,844 | ||||||
| Isuzu Motors, Ltd. |
6,100 | 80,799 | ||||||
| Mazda Motor Corp. |
1,800 | 27,584 | ||||||
| Mitsubishi Motors Corp. |
1,300 | 10,278 | ||||||
| Nissan Motor Co., Ltd. |
10,500 | 103,960 | ||||||
| Subaru Corp. |
7,400 | 266,904 | ||||||
| Suzuki Motor Corp. |
600 | 31,459 | ||||||
| Toyota Motor Corp. |
7,000 | 417,270 | ||||||
| Yamaha Motor Co., Ltd. |
400 | 11,975 | ||||||
|
|
|
|||||||
| 1,110,073 | ||||||||
|
|
|
|||||||
| BANKS — 7.1% |
| |||||||
| Aozora Bank, Ltd. |
900 | 34,220 | ||||||
| Bank of Kyoto, Ltd. |
200 | 10,163 | ||||||
| Chiba Bank, Ltd. |
3,000 | 21,454 | ||||||
| Chugoku Bank, Ltd. |
700 | 9,589 | ||||||
| Concordia Financial Group, Ltd. |
3,900 | 19,267 | ||||||
| Fukuoka Financial Group, Inc. |
2,000 | 9,239 | ||||||
| Hachijuni Bank, Ltd. |
1,300 | 8,119 | ||||||
| Hiroshima Bank, Ltd. |
500 | 4,046 | ||||||
| Japan Post Bank Co., Ltd. |
5,200 | 64,212 | ||||||
| Kyushu Financial Group, Inc. |
2,000 | 12,295 | ||||||
| Mebuki Financial Group, Inc. |
5,800 | 22,414 | ||||||
| Mitsubishi UFJ Financial Group, Inc. |
37,200 | 241,479 | ||||||
| Mizuho Financial Group, Inc. |
108,900 | 190,683 | ||||||
| Resona Holdings, Inc. |
11,600 | 59,564 | ||||||
| Seven Bank, Ltd. |
500 | 1,803 | ||||||
| Shinsei Bank, Ltd. |
500 | 8,000 | ||||||
| Shizuoka Bank, Ltd. |
1,000 | 8,990 | ||||||
| Sumitomo Mitsui Financial Group, Inc. |
5,400 | 207,240 | ||||||
| Sumitomo Mitsui Trust Holdings, Inc. |
1,000 | 36,077 | ||||||
| Suruga Bank, Ltd. |
2,600 | 56,035 | ||||||
| Yamaguchi Financial Group, Inc. |
3,000 | 35,100 | ||||||
|
|
|
|||||||
| 1,059,989 | ||||||||
|
|
|
|||||||
| BEVERAGES — 1.6% |
| |||||||
| Asahi Group Holdings, Ltd. |
1,500 | 60,712 | ||||||
| Coca-Cola Bottlers Japan, Inc. |
600 | 19,455 | ||||||
| Kirin Holdings Co., Ltd. |
3,800 | 89,392 | ||||||
| Suntory Beverage & Food, Ltd. |
1,500 | 66,761 | ||||||
|
|
|
|||||||
| 236,320 | ||||||||
|
|
|
|||||||
| BUILDING PRODUCTS — 1.9% |
| |||||||
| Asahi Glass Co., Ltd. |
400 | 14,836 | ||||||
| Daikin Industries, Ltd. |
2,400 | 242,953 | ||||||
| LIXIL Group Corp. |
500 | 13,263 | ||||||
| TOTO, Ltd. |
100 | 4,211 | ||||||
|
|
|
|||||||
| 275,263 | ||||||||
|
|
|
|||||||
| CAPITAL MARKETS — 0.4% |
| |||||||
| Daiwa Securities Group, Inc. |
3,000 | 16,985 | ||||||
| Nomura Holdings, Inc. |
6,000 | 33,580 | ||||||
| SBI Holdings, Inc. |
400 | 6,020 | ||||||
|
|
|
|||||||
| 56,585 | ||||||||
|
|
|
|||||||
| CHEMICALS — 3.1% |
| |||||||
| Air Water, Inc. |
200 | 3,688 | ||||||
| Asahi Kasei Corp. |
3,000 | 36,912 | ||||||
| Daicel Corp. |
400 | 4,819 | ||||||
| Hitachi Chemical Co., Ltd. |
1,000 | 27,406 | ||||||
| JSR Corp. |
300 | 5,698 | ||||||
| Kaneka Corp. |
1,000 | 7,764 | ||||||
| Kansai Paint Co., Ltd. |
1,900 | 47,802 | ||||||
| Kuraray Co., Ltd. |
1,200 | 22,430 | ||||||
| Mitsubishi Chemical Holdings Corp. |
3,200 | 30,475 | ||||||
| Mitsubishi Gas Chemical Co., Inc. |
300 | 7,028 | ||||||
| Mitsui Chemicals, Inc. |
400 | 12,153 | ||||||
| Nippon Paint Holdings Co., Ltd. |
100 | 3,398 | ||||||
| Nissan Chemical Industries, Ltd. |
1,400 | 49,251 | ||||||
| Nitto Denko Corp. |
100 | 8,335 | ||||||
| Shin-Etsu Chemical Co., Ltd. |
1,000 | 89,371 | ||||||
| Sumitomo Chemical Co., Ltd. |
3,000 | 18,736 | ||||||
| Taiyo Nippon Sanso Corp. |
100 | 1,183 | ||||||
| Teijin, Ltd. |
300 | 5,911 | ||||||
| Toray Industries, Inc. |
7,700 | 74,664 | ||||||
| Tosoh Corp. |
500 | 11,265 | ||||||
|
|
|
|||||||
| 468,289 | ||||||||
|
|
|
|||||||
| COMMERCIAL SERVICES & SUPPLIES — 1.3% |
| |||||||
| Dai Nippon Printing Co., Ltd. |
1,000 | 23,924 | ||||||
| Park24 Co., Ltd. |
2,000 | 48,683 | ||||||
| Secom Co., Ltd. |
1,000 | 72,865 | ||||||
| Sohgo Security Services Co., Ltd. |
100 | 4,584 | ||||||
| Toppan Printing Co., Ltd. |
4,000 | 39,657 | ||||||
|
|
|
|||||||
| 189,713 | ||||||||
|
|
|
|||||||
| CONSTRUCTION & ENGINEERING — 2.5% |
| |||||||
| JGC Corp. |
400 | 6,471 | ||||||
| Kajima Corp. |
8,000 | 79,456 | ||||||
| Obayashi Corp. |
4,700 | 56,326 | ||||||
| Shimizu Corp. |
4,000 | 44,312 | ||||||
| Taisei Corp. |
3,600 | 188,691 | ||||||
|
|
|
|||||||
| 375,256 | ||||||||
|
|
|
|||||||
| CONSTRUCTION MATERIALS — 0.1% |
| |||||||
| Taiheiyo Cement Corp. |
300 | 11,580 | ||||||
|
|
|
|||||||
See accompanying notes to financial statements.
188
Table of Contents
SPDR MSCI Japan StrategicFactors ETF
SCHEDULE OF INVESTMENTS (continued)
September 30, 2017
| Security Description |
Shares |
Value |
||||||
| CONSUMER FINANCE — 0.0% (a) |
| |||||||
| Acom Co., Ltd. (b) |
200 | $ | 775 | |||||
| AEON Financial Service Co., Ltd. |
100 | 2,088 | ||||||
| Credit Saison Co., Ltd. |
200 | 4,149 | ||||||
|
|
|
|||||||
| 7,012 | ||||||||
|
|
|
|||||||
| CONTAINERS & PACKAGING — 0.0% (a) |
| |||||||
| Toyo Seikan Group Holdings, Ltd. |
300 | 5,010 | ||||||
|
|
|
|||||||
| DIVERSIFIED CONSUMER SERVICES — 0.2% |
| |||||||
| Benesse Holdings, Inc. |
1,000 | 36,068 | ||||||
|
|
|
|||||||
| DIVERSIFIED FINANCIAL SERVICES — 1.1% |
| |||||||
| Japan Exchange Group, Inc. |
6,400 | 113,200 | ||||||
| Mitsubishi UFJ Lease & Finance Co., Ltd. |
1,000 | 5,295 | ||||||
| ORIX Corp. |
2,800 | 45,135 | ||||||
|
|
|
|||||||
| 163,630 | ||||||||
|
|
|
|||||||
| DIVERSIFIED TELECOMMUNICATION SERVICES — 0.8% |
| |||||||
| Nippon Telegraph & Telephone Corp. |
2,700 | 123,696 | ||||||
|
|
|
|||||||
| ELECTRIC UTILITIES — 1.5% |
| |||||||
| Chubu Electric Power Co., Inc. |
4,000 | 49,642 | ||||||
| Chugoku Electric Power Co., Inc. |
2,400 | 25,479 | ||||||
| Kansai Electric Power Co., Inc. |
2,600 | 33,249 | ||||||
| Kyushu Electric Power Co., Inc. |
1,200 | 12,739 | ||||||
| Tohoku Electric Power Co., Inc. |
3,400 | 43,223 | ||||||
| Tokyo Electric Power Co. Holdings, Inc. (b) |
14,200 | 57,272 | ||||||
|
|
|
|||||||
| 221,604 | ||||||||
|
|
|
|||||||
| ELECTRICAL EQUIPMENT — 0.6% |
| |||||||
| Fuji Electric Co., Ltd. |
1,000 | 5,544 | ||||||
| Mitsubishi Electric Corp. |
2,800 | 43,729 | ||||||
| Nidec Corp. |
300 | 36,832 | ||||||
|
|
|
|||||||
| 86,105 | ||||||||
|
|
|
|||||||
| ELECTRONIC EQUIPMENT, INSTRUMENTS & COMPONENTS — 5.8% |
| |||||||
| Alps Electric Co., Ltd. |
200 | 5,275 | ||||||
| Hamamatsu Photonics KK |
100 | 3,021 | ||||||
| Hirose Electric Co., Ltd. |
100 | 14,072 | ||||||
| Hitachi High-Technologies Corp. |
700 | 25,372 | ||||||
| Hitachi, Ltd. |
12,000 | 84,527 | ||||||
| Keyence Corp. |
700 | 371,563 | ||||||
| Kyocera Corp. |
1,000 | 62,026 | ||||||
| Murata Manufacturing Co., Ltd. |
1,700 | 249,794 | ||||||
| Nippon Electric Glass Co., Ltd. |
200 | 7,738 | ||||||
| Omron Corp. |
200 | 10,181 | ||||||
| Shimadzu Corp. |
500 | 9,843 | ||||||
| TDK Corp. |
200 | 13,574 | ||||||
| Yaskawa Electric Corp. |
200 | 6,334 | ||||||
| Yokogawa Electric Corp. |
200 | 3,404 | ||||||
|
|
|
|||||||
| 866,724 | ||||||||
|
|
|
|||||||
| FOOD & STAPLES RETAILING — 1.8% |
| |||||||
| Aeon Co., Ltd. |
2,800 | 41,354 | ||||||
| FamilyMart UNY Holdings Co., Ltd. |
500 | 26,341 | ||||||
| Lawson, Inc. |
500 | 33,092 | ||||||
| Seven & i Holdings Co., Ltd. |
1,800 | 69,480 | ||||||
| Sundrug Co., Ltd. |
1,000 | 41,398 | ||||||
| Tsuruha Holdings, Inc. |
500 | 59,743 | ||||||
|
|
|
|||||||
| 271,408 | ||||||||
|
|
|
|||||||
| FOOD PRODUCTS — 1.9% |
| |||||||
| Ajinomoto Co., Inc. |
1,900 | 37,067 | ||||||
| Calbee, Inc. |
900 | 31,622 | ||||||
| Kikkoman Corp. |
200 | 6,148 | ||||||
| MEIJI Holdings Co., Ltd. |
500 | 39,621 | ||||||
| NH Foods, Ltd. |
2,000 | 54,990 | ||||||
| Nisshin Seifun Group, Inc. |
1,300 | 21,770 | ||||||
| Nissin Foods Holdings Co., Ltd. |
700 | 42,535 | ||||||
| Toyo Suisan Kaisha, Ltd. |
1,000 | 36,734 | ||||||
| Yamazaki Baking Co., Ltd. |
700 | 12,636 | ||||||
|
|
|
|||||||
| 283,123 | ||||||||
|
|
|
|||||||
| GAS UTILITIES — 0.8% |
| |||||||
| Osaka Gas Co., Ltd. |
3,200 | 59,471 | ||||||
| Toho Gas Co., Ltd. |
400 | 11,709 | ||||||
| Tokyo Gas Co., Ltd. |
1,800 | 44,103 | ||||||
|
|
|
|||||||
| 115,283 | ||||||||
|
|
|
|||||||
| HEALTH CARE EQUIPMENT & SUPPLIES — 2.9% |
| |||||||
| Hoya Corp. |
4,800 | 259,050 | ||||||
| Olympus Corp. |
200 | 6,770 | ||||||
| Sysmex Corp. |
1,900 | 121,192 | ||||||
| Terumo Corp. |
1,200 | 47,173 | ||||||
|
|
|
|||||||
| 434,185 | ||||||||
|
|
|
|||||||
| HEALTH CARE PROVIDERS & SERVICES — 0.5% |
| |||||||
| Alfresa Holdings Corp. |
1,100 | 20,121 | ||||||
| Medipal Holdings Corp. |
1,400 | 24,302 | ||||||
| Miraca Holdings, Inc. |
400 | 18,585 | ||||||
| Suzuken Co., Ltd. |
500 | 17,768 | ||||||
|
|
|
|||||||
| 80,776 | ||||||||
|
|
|
|||||||
| HEALTH CARE TECHNOLOGY — 0.5% |
| |||||||
| M3, Inc. |
2,700 | 76,876 | ||||||
|
|
|
|||||||
| HOTELS, RESTAURANTS & LEISURE — 2.0% |
| |||||||
| McDonald’s Holdings Co., Japan, Ltd. |
2,000 | 88,482 | ||||||
| Oriental Land Co., Ltd. |
2,800 | 213,274 | ||||||
|
|
|
|||||||
| 301,756 | ||||||||
|
|
|
|||||||
| HOUSEHOLD DURABLES — 1.7% |
| |||||||
| Casio Computer Co., Ltd. |
200 | 2,814 | ||||||
| Iida Group Holdings Co., Ltd. |
300 | 5,346 | ||||||
| Nikon Corp. |
1,300 | 22,532 | ||||||
| Panasonic Corp. |
4,300 | 62,285 | ||||||
| Rinnai Corp. |
200 | 17,110 | ||||||
| Sekisui Chemical Co., Ltd. |
1,900 | 37,371 | ||||||
| Sekisui House, Ltd. |
2,600 | 43,805 | ||||||
| Sharp Corp. (b) |
100 | 3,016 | ||||||
| Sony Corp. |
1,700 | 63,219 | ||||||
|
|
|
|||||||
| 257,498 | ||||||||
|
|
|
|||||||
| HOUSEHOLD PRODUCTS — 0.1% |
| |||||||
| Lion Corp. |
400 | 7,299 | ||||||
| Unicharm Corp. |
400 | 9,154 | ||||||
|
|
|
|||||||
| 16,453 | ||||||||
|
|
|
|||||||
| INDEPENDENT POWER PRODUCERS & ENERGY TRADERS — 0.1% |
| |||||||
| Electric Power Development Co., Ltd. |
400 | 10,042 | ||||||
|
|
|
|||||||
See accompanying notes to financial statements.
189
Table of Contents
SPDR MSCI Japan StrategicFactors ETF
SCHEDULE OF INVESTMENTS (continued)
September 30, 2017
| Security Description |
Shares |
Value |
||||||
| INDUSTRIAL CONGLOMERATES — 0.2% |
| |||||||
| Seibu Holdings, Inc. |
200 | $ | 3,415 | |||||
| Toshiba Corp. (b) |
8,000 | 22,387 | ||||||
|
|
|
|||||||
| 25,802 | ||||||||
|
|
|
|||||||
| INSURANCE — 1.9% |
| |||||||
| Dai-ichi Life Holdings, Inc. |
2,800 | 50,222 | ||||||
| Japan Post Holdings Co., Ltd. |
4,200 | 49,587 | ||||||
| MS&AD Insurance Group Holdings, Inc. |
1,700 | 54,716 | ||||||
| Sompo Holdings, Inc. |
800 | 31,114 | ||||||
| Sony Financial Holdings, Inc. |
300 | 4,920 | ||||||
| T&D Holdings, Inc. |
1,300 | 18,865 | ||||||
| Tokio Marine Holdings, Inc. |
1,700 | 66,481 | ||||||
|
|
|
|||||||
| 275,905 | ||||||||
|
|
|
|||||||
| INTERNET & CATALOG RETAIL — 0.5% |
| |||||||
| Rakuten, Inc. |
600 | 6,540 | ||||||
| Start Today Co., Ltd. |
2,200 | 69,675 | ||||||
|
|
|
|||||||
| 76,215 | ||||||||
|
|
|
|||||||
| INTERNET SOFTWARE & SERVICES — 0.8% |
| |||||||
| DeNA Co., Ltd. |
1,100 | 24,645 | ||||||
| Kakaku.com, Inc. |
1,800 | 22,931 | ||||||
| Yahoo! Japan Corp. |
14,900 | 70,685 | ||||||
|
|
|
|||||||
| 118,261 | ||||||||
|
|
|
|||||||
| IT SERVICES — 1.7% |
| |||||||
| Fujitsu, Ltd. |
5,000 | 37,130 | ||||||
| Nomura Research Institute, Ltd. |
1,000 | 39,000 | ||||||
| NTT Data Corp. |
4,000 | 42,784 | ||||||
| Obic Co., Ltd. |
800 | 50,317 | ||||||
| Otsuka Corp. |
1,200 | 76,862 | ||||||
|
|
|
|||||||
| 246,093 | ||||||||
|
|
|
|||||||
| LEISURE EQUIPMENT & PRODUCTS — 1.6% |
| |||||||
| Bandai Namco Holdings, Inc. |
2,500 | 85,728 | ||||||
| Sankyo Co., Ltd. |
1,000 | 31,893 | ||||||
| Sega Sammy Holdings, Inc. |
200 | 2,793 | ||||||
| Shimano, Inc. |
800 | 106,534 | ||||||
| Yamaha Corp. |
300 | 11,060 | ||||||
|
|
|
|||||||
| 238,008 | ||||||||
|
|
|
|||||||
| MACHINERY — 2.1% |
| |||||||
| Amada Holdings Co., Ltd. |
300 | 3,291 | ||||||
| FANUC Corp. |
200 | 40,492 | ||||||
| Hino Motors, Ltd. |
500 | 6,112 | ||||||
| Hitachi Construction Machinery Co., Ltd. |
200 | 5,926 | ||||||
| Hoshizaki Corp. |
600 | 52,716 | ||||||
| IHI Corp. |
200 | 6,947 | ||||||
| JTEKT Corp. |
400 | 5,536 | ||||||
| Kawasaki Heavy Industries, Ltd. |
300 | 9,941 | ||||||
| Komatsu, Ltd. |
1,400 | 39,812 | ||||||
| Kubota Corp. |
1,200 | 21,806 | ||||||
| Kurita Water Industries, Ltd. |
300 | 8,662 | ||||||
| Makita Corp. |
900 | 36,259 | ||||||
| MINEBEA MITSUMI, Inc. |
500 | 7,818 | ||||||
| Mitsubishi Heavy Industries, Ltd. |
800 | 31,619 | ||||||
| Nabtesco Corp. |
100 | 3,713 | ||||||
| NGK Insulators, Ltd. |
300 | 5,618 | ||||||
| NSK, Ltd. |
600 | 8,086 | ||||||
| Sumitomo Heavy Industries, Ltd. |
200 | 8,013 | ||||||
| THK Co., Ltd. |
100 | 3,403 | ||||||
|
|
|
|||||||
| 305,770 | ||||||||
|
|
|
|||||||
| MARINE — 0.2% |
| |||||||
| Mitsui OSK Lines, Ltd. |
400 | 12,118 | ||||||
| Nippon Yusen KK (b) |
700 | 14,545 | ||||||
|
|
|
|||||||
| 26,663 | ||||||||
|
|
|
|||||||
| MEDIA — 0.2% |
| |||||||
| Dentsu, Inc. |
200 | 8,777 | ||||||
| Hakuhodo DY Holdings, Inc. |
700 | 9,191 | ||||||
| Toho Co., Ltd. |
400 | 13,948 | ||||||
|
|
|
|||||||
| 31,916 | ||||||||
|
|
|
|||||||
| METALS & MINING — 0.9% |
| |||||||
| Hitachi Metals, Ltd. |
400 | 5,565 | ||||||
| JFE Holdings, Inc. |
1,700 | 33,188 | ||||||
| Kobe Steel, Ltd. |
1,300 | 14,852 | ||||||
| Maruichi Steel Tube, Ltd. |
100 | 2,909 | ||||||
| Mitsubishi Materials Corp. |
400 | 13,823 | ||||||
| Nippon Steel & Sumitomo Metal Corp. |
2,000 | 45,902 | ||||||
| Sumitomo Metal Mining Co., Ltd. |
500 | 16,053 | ||||||
|
|
|
|||||||
| 132,292 | ||||||||
|
|
|
|||||||
| MULTILINE RETAIL — 0.8% |
| |||||||
| Don Quijote Holdings Co., Ltd. |
200 | 7,471 | ||||||
| Isetan Mitsukoshi Holdings, Ltd. |
800 | 8,351 | ||||||
| J Front Retailing Co., Ltd. |
400 | 5,526 | ||||||
| Marui Group Co., Ltd. |
300 | 4,294 | ||||||
| Ryohin Keikaku Co., Ltd. |
300 | 88,349 | ||||||
| Takashimaya Co., Ltd. |
1,000 | 9,363 | ||||||
|
|
|
|||||||
| 123,354 | ||||||||
|
|
|
|||||||
| OIL, GAS & CONSUMABLE FUELS — 0.7% |
| |||||||
| Idemitsu Kosan Co., Ltd. |
400 | 11,282 | ||||||
| Inpex Corp. |
1,900 | 20,179 | ||||||
| JXTG Holdings, Inc. |
13,800 | 70,971 | ||||||
| Showa Shell Sekiyu KK |
500 | 5,752 | ||||||
|
|
|
|||||||
| 108,184 | ||||||||
|
|
|
|||||||
| PAPER & FOREST PRODUCTS — 0.1% |
| |||||||
| Oji Holdings Corp. |
2,000 | 10,785 | ||||||
|
|
|
|||||||
| PERSONAL PRODUCTS — 2.2% |
| |||||||
| Kao Corp. |
4,900 | 288,171 | ||||||
| Kose Corp. |
300 | 34,354 | ||||||
| Shiseido Co., Ltd. |
200 | 7,999 | ||||||
|
|
|
|||||||
| 330,524 | ||||||||
|
|
|
|||||||
| PHARMACEUTICALS — 6.5% |
| |||||||
| Astellas Pharma, Inc. |
24,800 | 315,384 | ||||||
| Chugai Pharmaceutical Co., Ltd. |
800 | 33,190 | ||||||
| Daiichi Sankyo Co., Ltd. |
2,600 | 58,622 | ||||||
| Eisai Co., Ltd. |
500 | 25,656 | ||||||
| Hisamitsu Pharmaceutical Co., Inc. |
200 | 9,595 | ||||||
| Kyowa Hakko Kirin Co., Ltd. |
1,000 | 17,004 | ||||||
| Mitsubishi Tanabe Pharma Corp. |
3,300 | 75,636 | ||||||
| Ono Pharmaceutical Co., Ltd. |
200 | 4,530 | ||||||
| Otsuka Holdings Co., Ltd. |
1,800 | 71,495 | ||||||
| Santen Pharmaceutical Co., Ltd. |
1,500 | 23,626 | ||||||
| Shionogi & Co., Ltd. |
3,600 | 196,718 | ||||||
| Sumitomo Dainippon Pharma Co., Ltd. |
1,200 | 15,607 | ||||||
See accompanying notes to financial statements.
190
Table of Contents
SPDR MSCI Japan StrategicFactors ETF
SCHEDULE OF INVESTMENTS (continued)
September 30, 2017
| Security Description |
Shares |
Value |
||||||
| Taisho Pharmaceutical Holdings Co., Ltd. |
400 | $ | 30,347 | |||||
| Takeda Pharmaceutical Co., Ltd. |
1,700 | 93,846 | ||||||
|
|
|
|||||||
| 971,256 | ||||||||
|
|
|
|||||||
| PROFESSIONAL SERVICES — 0.7% |
| |||||||
| Recruit Holdings Co., Ltd. |
4,600 | 99,589 | ||||||
|
|
|
|||||||
| REAL ESTATE INVESTMENT TRUSTS (REITS) — 1.2% |
| |||||||
| Daiwa House REIT Investment Corp. |
7 | 16,753 | ||||||
| Japan Prime Realty Investment Corp. REIT |
7 | 23,382 | ||||||
| Japan Real Estate Investment Corp. REIT |
5 | 24,030 | ||||||
| Japan Retail Fund Investment Corp. REIT |
9 | 16,143 | ||||||
| Nippon Building Fund, Inc. REIT |
4 | 19,935 | ||||||
| Nippon Prologis REIT, Inc. |
13 | 27,382 | ||||||
| Nomura Real Estate Master Fund, Inc. |
23 | 29,893 | ||||||
| United Urban Investment Corp. REIT |
14 | 20,497 | ||||||
|
|
|
|||||||
| 178,015 | ||||||||
|
|
|
|||||||
| REAL ESTATE MANAGEMENT & DEVELOPMENT — 3.1% |
| |||||||
| Aeon Mall Co., Ltd. |
100 | 1,779 | ||||||
| Daito Trust Construction Co., Ltd. |
1,100 | 200,329 | ||||||
| Daiwa House Industry Co., Ltd. |
6,100 | 210,532 | ||||||
| Hulic Co., Ltd. |
200 | 1,960 | ||||||
| Mitsubishi Estate Co., Ltd. |
1,000 | 17,381 | ||||||
| Mitsui Fudosan Co., Ltd. |
900 | 19,509 | ||||||
| Nomura Real Estate Holdings, Inc. |
200 | 4,260 | ||||||
| Tokyo Tatemono Co., Ltd. |
200 | 2,557 | ||||||
| Tokyu Fudosan Holdings Corp. |
900 | 5,429 | ||||||
|
|
|
|||||||
| 463,736 | ||||||||
|
|
|
|||||||
| ROAD & RAIL — 4.2% |
| |||||||
| Central Japan Railway Co. |
600 | 105,166 | ||||||
| East Japan Railway Co. |
1,100 | 101,484 | ||||||
| Hankyu Hanshin Holdings, Inc. |
1,600 | 60,694 | ||||||
| Keikyu Corp. |
1,500 | 30,396 | ||||||
| Keio Corp. |
400 | 16,488 | ||||||
| Keisei Electric Railway Co., Ltd. |
600 | 16,604 | ||||||
| Kintetsu Group Holdings Co., Ltd. |
800 | 29,743 | ||||||
| Kyushu Railway Co. |
1,800 | 53,489 | ||||||
| Nagoya Railroad Co., Ltd. |
1,400 | 30,135 | ||||||
| Nippon Express Co., Ltd. |
400 | 26,047 | ||||||
| Odakyu Electric Railway Co., Ltd. |
1,100 | 20,863 | ||||||
| Tobu Railway Co., Ltd. |
1,600 | 43,921 | ||||||
| Tokyu Corp. |
2,000 | 28,304 | ||||||
| West Japan Railway Co. |
900 | 62,540 | ||||||
|
|
|
|||||||
| 625,874 | ||||||||
|
|
|
|||||||
| SEMICONDUCTORS & SEMICONDUCTOR EQUIPMENT — 0.7% |
| |||||||
| Disco Corp. |
300 | 61,005 | ||||||
| Rohm Co., Ltd. |
100 | 8,564 | ||||||
| Tokyo Electron, Ltd. |
200 | 30,702 | ||||||
|
|
|
|||||||
| 100,271 | ||||||||
|
|
|
|||||||
| SOFTWARE — 1.2% |
| |||||||
| Konami Holdings Corp. |
500 | 24,030 | ||||||
| LINE Corp. (b) |
100 | 3,611 | ||||||
| Nexon Co., Ltd. (b) |
100 | 2,608 | ||||||
| Oracle Corp. Japan |
1,100 | 86,386 | ||||||
| Trend Micro, Inc. |
1,300 | 63,981 | ||||||
|
|
|
|||||||
| 180,616 | ||||||||
|
|
|
|||||||
| SPECIALTY RETAIL — 2.6% |
| |||||||
| ABC-Mart, Inc. |
800 | 42,216 | ||||||
| Hikari Tsushin, Inc. |
400 | 50,104 | ||||||
| Nitori Holdings Co., Ltd. |
1,200 | 171,527 | ||||||
| Shimamura Co., Ltd. |
200 | 23,986 | ||||||
| USS Co., Ltd. |
3,100 | 62,515 | ||||||
| Yamada Denki Co., Ltd. |
6,800 | 37,152 | ||||||
|
|
|
|||||||
| 387,500 | ||||||||
|
|
|
|||||||
| TECHNOLOGY HARDWARE, STORAGE & PERIPHERALS — 1.7% |
| |||||||
| Brother Industries, Ltd. |
300 | 6,977 | ||||||
| Canon, Inc. |
3,400 | 116,137 | ||||||
| FUJIFILM Holdings Corp. |
1,700 | 65,952 | ||||||
| Konica Minolta, Inc. |
1,100 | 9,030 | ||||||
| NEC Corp. |
700 | 18,967 | ||||||
| Ricoh Co., Ltd. |
2,200 | 21,382 | ||||||
| Seiko Epson Corp. |
500 | 12,095 | ||||||
|
|
|
|||||||
| 250,540 | ||||||||
|
|
|
|||||||
| TEXTILES, APPAREL & LUXURY GOODS — 0.0% (a) |
| |||||||
| Asics Corp. |
200 | 2,978 | ||||||
|
|
|
|||||||
| TOBACCO — 1.8% |
| |||||||
| Japan Tobacco, Inc. |
8,400 | 275,212 | ||||||
|
|
|
|||||||
| TRADING COMPANIES & DISTRIBUTORS — 3.3% |
| |||||||
| ITOCHU Corp. |
4,200 | 68,766 | ||||||
| Marubeni Corp. |
9,500 | 64,858 | ||||||
| MISUMI Group, Inc. |
2,500 | 65,806 | ||||||
| Mitsubishi Corp. |
4,100 | 95,265 | ||||||
| Mitsui & Co., Ltd. |
7,500 | 110,803 | ||||||
| Sumitomo Corp. |
4,500 | 64,703 | ||||||
| Toyota Tsusho Corp. |
700 | 22,978 | ||||||
|
|
|
|||||||
| 493,179 | ||||||||
|
|
|
|||||||
| TRANSPORTATION INFRASTRUCTURE — 0.2% |
| |||||||
| Kamigumi Co., Ltd. |
1,000 | 23,142 | ||||||
|
|
|
|||||||
| WIRELESS TELECOMMUNICATION SERVICES — 5.1% |
| |||||||
| KDDI Corp. |
13,200 | 347,927 | ||||||
| NTT DOCOMO, Inc. |
13,900 | 317,416 | ||||||
| SoftBank Group Corp. |
1,100 | 88,770 | ||||||
|
|
|
|||||||
| 754,113 | ||||||||
|
|
|
|||||||
| TOTAL COMMON STOCKS |
14,750,160 | |||||||
|
|
|
|||||||
| SHORT-TERM INVESTMENT — 0.0% (a) |
| |||||||
| State Street Institutional U.S. Government Money Market Fund, Class G Shares 0.96% (c)
(d) |
131 | 131 | ||||||
|
|
|
|||||||
| TOTAL INVESTMENTS — 99.0% |
14,750,291 | |||||||
| OTHER ASSETS IN EXCESS OF LIABILITIES — 1.0% |
146,864 | |||||||
|
|
|
|||||||
| NET ASSETS — 100.0% |
$ | 14,897,155 | ||||||
|
|
|
|||||||
| (a) | Amount is less than 0.05% of net assets. |
| (b) | Non-income producing security. |
See accompanying notes to financial statements.
191
Table of Contents
SPDR MSCI Japan StrategicFactors ETF
SCHEDULE OF INVESTMENTS (continued)
September 30, 2017
| (c) | The Fund invested in certain money market funds managed by SSGA Funds Management, Inc. Amounts related to these transactions during the period ended September 30, 2017 are shown in the Affiliate Table below. |
| (d) | The rate shown is the annualized seven-day yield at September 30, 2017. |
REIT = Real Estate Investment Trust
The following table summarizes the value of the Fund’s investments according to the fair value hierarchy as of September 30, 2017.
| Description |
Level 1 — Quoted Prices |
Level 2 — Other Significant Observable Inputs |
Level 3 — Significant Unobservable Inputs |
Total | ||||||||||||
| ASSETS: |
||||||||||||||||
| INVESTMENTS: |
||||||||||||||||
| Common Stocks |
||||||||||||||||
| Air Freight & Logistics |
$ | 12,108 | $ | — | $ | — | $ | 12,108 | ||||||||
| Airlines |
169,192 | — | — | 169,192 | ||||||||||||
| Auto Components |
572,750 | — | — | 572,750 | ||||||||||||
| Automobiles |
1,110,073 | — | — | 1,110,073 | ||||||||||||
| Banks |
1,059,989 | — | — | 1,059,989 | ||||||||||||
| Beverages |
236,320 | — | — | 236,320 | ||||||||||||
| Building Products |
275,263 | — | — | 275,263 | ||||||||||||
| Capital Markets |
56,585 | — | — | 56,585 | ||||||||||||
| Chemicals |
468,289 | — | — | 468,289 | ||||||||||||
| Commercial Services & Supplies |
189,713 | — | — | 189,713 | ||||||||||||
| Construction & Engineering |
375,256 | — | — | 375,256 | ||||||||||||
| Construction Materials |
11,580 | — | — | 11,580 | ||||||||||||
| Consumer Finance |
7,012 | — | — | 7,012 | ||||||||||||
| Containers & Packaging |
5,010 | — | — | 5,010 | ||||||||||||
| Diversified Consumer Services |
36,068 | — | — | 36,068 | ||||||||||||
| Diversified Financial Services |
163,630 | — | — | 163,630 | ||||||||||||
| Diversified Telecommunication Services |
123,696 | — | — | 123,696 | ||||||||||||
| Electric Utilities |
221,604 | — | — | 221,604 | ||||||||||||
| Electrical Equipment |
86,105 | — | — | 86,105 | ||||||||||||
| Electronic Equipment, Instruments & Components |
866,724 | — | — | 866,724 | ||||||||||||
| Food & Staples Retailing |
271,408 | — | — | 271,408 | ||||||||||||
| Food Products |
283,123 | — | — | 283,123 | ||||||||||||
| Gas Utilities |
115,283 | — | — | 115,283 | ||||||||||||
| Health Care Equipment & Supplies |
434,185 | — | — | 434,185 | ||||||||||||
| Health Care Providers & Services |
80,776 | — | — | 80,776 | ||||||||||||
| Health Care Technology |
76,876 | — | — | 76,876 | ||||||||||||
| Hotels, Restaurants & Leisure |
301,756 | — | — | 301,756 | ||||||||||||
| Household Durables |
257,498 | — | — | 257,498 | ||||||||||||
| Household Products |
16,453 | — | — | 16,453 | ||||||||||||
| Independent Power Producers & Energy Traders |
10,042 | — | — | 10,042 | ||||||||||||
| Industrial Conglomerates |
25,802 | — | — | 25,802 | ||||||||||||
| Insurance |
275,905 | — | — | 275,905 | ||||||||||||
| Internet & Catalog Retail |
76,215 | — | — | 76,215 | ||||||||||||
| Internet Software & Services |
118,261 | — | — | 118,261 | ||||||||||||
| IT Services |
246,093 | — | — | 246,093 | ||||||||||||
| Leisure Equipment & Products |
238,008 | — | — | 238,008 | ||||||||||||
| Machinery |
305,770 | — | — | 305,770 | ||||||||||||
| Marine |
26,663 | — | — | 26,663 | ||||||||||||
| Media |
31,916 | — | — | 31,916 | ||||||||||||
| Metals & Mining |
132,292 | — | — | 132,292 | ||||||||||||
| Multiline Retail |
123,354 | — | — | 123,354 | ||||||||||||
| Oil, Gas & Consumable Fuels |
108,184 | — | — | 108,184 | ||||||||||||
See accompanying notes to financial statements.
192
Table of Contents
SPDR MSCI Japan StrategicFactors ETF
SCHEDULE OF INVESTMENTS (continued)
September 30, 2017
| Description |
Level 1 — Quoted Prices |
Level 2 — Other Significant Observable Inputs |
Level 3 — Significant Unobservable Inputs |
Total | ||||||||||||
| Paper & Forest Products |
$ | 10,785 | $ | — | $ | — | $ | 10,785 | ||||||||
| Personal Products |
330,524 | — | — | 330,524 | ||||||||||||
| Pharmaceuticals |
971,256 | — | — | 971,256 | ||||||||||||
| Professional Services |
99,589 | — | — | 99,589 | ||||||||||||
| Real Estate Investment Trusts (REITs) |
178,015 | — | — | 178,015 | ||||||||||||
| Real Estate Management & Development |
463,736 | — | — | 463,736 | ||||||||||||
| Road & Rail |
625,874 | — | — | 625,874 | ||||||||||||
| Semiconductors & Semiconductor Equipment |
100,271 | — | — | 100,271 | ||||||||||||
| Software |
180,616 | — | — | 180,616 | ||||||||||||
| Specialty Retail |
387,500 | — | — | 387,500 | ||||||||||||
| Technology Hardware, Storage & Peripherals |
250,540 | — | — | 250,540 | ||||||||||||
| Textiles, Apparel & Luxury Goods |
2,978 | — | — | 2,978 | ||||||||||||
| Tobacco |
275,212 | — | — | 275,212 | ||||||||||||
| Trading Companies & Distributors |
493,179 | — | — | 493,179 | ||||||||||||
| Transportation Infrastructure |
23,142 | — | — | 23,142 | ||||||||||||
| Wireless Telecommunication Services |
754,113 | — | — | 754,113 | ||||||||||||
| Short-Term Investment |
131 | — | — | 131 | ||||||||||||
|
|
|
|
|
|
|
|
|
|||||||||
| TOTAL INVESTMENTS |
$ | 14,750,291 | $ | — | $ | — | $ | 14,750,291 | ||||||||
|
|
|
|
|
|
|
|
|
|||||||||
Affiliate Table
| Number of Shares Held at 9/30/16 |
Value at 9/30/16 |
Cost of Purchases |
Proceeds from Shares Sold |
Realized Gain (Loss) |
Change in Unrealized Appreciation/ Depreciation |
Number of Shares Held at 9/30/17 |
Value at 9/30/17 |
Dividend Income |
||||||||||||||||||||||||||||
| State Street Institutional Liquid Reserves Fund, Premier Class |
754 | $ | 754 | $ | — | $ | 754 | $ | — | $ | — | — | $ | — | $ | — | ||||||||||||||||||||
| State Street Institutional U.S. Government Money Market Fund, Class G Shares |
— | — | 111,864 | 111,733 | — | — | 131 | 131 | 26 | |||||||||||||||||||||||||||
| State Street Institutional U.S. Government Money Market Fund, Premier Class |
— | — | 202,065 | 202,065 | — | — | — | — | 18 | |||||||||||||||||||||||||||
|
|
|
|
|
|
|
|
|
|
|
|
|
|
|
|||||||||||||||||||||||
| TOTAL |
$ | 754 | $ | 313,929 | $ | 314,552 | $ | — | $ | — | $ | 131 | $ | 44 | ||||||||||||||||||||||
|
|
|
|
|
|
|
|
|
|
|
|
|
|
|
|||||||||||||||||||||||
See accompanying notes to financial statements.
193
Table of Contents
SPDR MSCI United Kingdom StrategicFactors ETF
SCHEDULE OF INVESTMENTS
September 30, 2017
| Security Description |
Shares |
Value |
||||||
| COMMON STOCKS — 99.1% |
| |||||||
| AEROSPACE & DEFENSE — 2.7% |
| |||||||
| BAE Systems PLC |
14,523 | $ | 123,046 | |||||
| Cobham PLC |
2,021 | 3,951 | ||||||
| Meggitt PLC |
587 | 4,103 | ||||||
| Rolls-Royce Holdings PLC (a) |
1,064 | 12,662 | ||||||
|
|
|
|||||||
| 143,762 | ||||||||
|
|
|
|||||||
| AIR FREIGHT & LOGISTICS — 0.5% |
| |||||||
| Royal Mail PLC |
5,197 | 26,789 | ||||||
|
|
|
|||||||
| AIRLINES — 0.3% |
| |||||||
| easyJet PLC |
931 | 15,201 | ||||||
|
|
|
|||||||
| AUTO COMPONENTS — 0.7% |
| |||||||
| GKN PLC |
7,942 | 36,868 | ||||||
|
|
|
|||||||
| BANKS — 8.9% |
| |||||||
| Barclays PLC |
29,661 | 76,943 | ||||||
| HSBC Holdings PLC |
27,572 | 272,668 | ||||||
| Lloyds Banking Group PLC |
72,880 | 66,226 | ||||||
| Royal Bank of Scotland Group PLC (a) |
4,831 | 17,390 | ||||||
| Standard Chartered PLC (a) |
3,937 | 39,172 | ||||||
|
|
|
|||||||
| 472,399 | ||||||||
|
|
|
|||||||
| BEVERAGES — 2.4% |
| |||||||
| Coca-Cola HBC AG (a) |
456 | 15,448 | ||||||
| Diageo PLC |
3,358 | 110,514 | ||||||
|
|
|
|||||||
| 125,962 | ||||||||
|
|
|
|||||||
| CAPITAL MARKETS — 2.7% |
| |||||||
| 3i Group PLC |
6,263 | 76,717 | ||||||
| Hargreaves Lansdown PLC |
1,714 | 34,034 | ||||||
| Investec PLC |
534 | 3,905 | ||||||
| Schroders PLC |
677 | 30,473 | ||||||
|
|
|
|||||||
| 145,129 | ||||||||
|
|
|
|||||||
| CHEMICALS — 1.5% |
| |||||||
| Croda International PLC |
844 | 42,950 | ||||||
| Johnson Matthey PLC |
815 | 37,396 | ||||||
|
|
|
|||||||
| 80,346 | ||||||||
|
|
|
|||||||
| COMMERCIAL SERVICES & SUPPLIES — 0.4% |
| |||||||
| Babcock International Group PLC |
1,342 | 14,899 | ||||||
| G4S PLC |
1,205 | 4,499 | ||||||
|
|
|
|||||||
| 19,398 | ||||||||
|
|
|
|||||||
| CONSUMER FINANCE — 0.0% (b) |
| |||||||
| Provident Financial PLC |
80 | 891 | ||||||
|
|
|
|||||||
| DIVERSIFIED FINANCIAL SERVICES — 0.6% |
| |||||||
| London Stock Exchange Group PLC |
613 | 31,499 | ||||||
|
|
|
|||||||
| DIVERSIFIED TELECOMMUNICATION SERVICES — 2.5% |
| |||||||
| BT Group PLC |
33,628 | 128,087 | ||||||
| Inmarsat PLC |
566 | 4,887 | ||||||
|
|
|
|||||||
| 132,974 | ||||||||
|
|
|
|||||||
| ELECTRIC UTILITIES — 1.0% |
| |||||||
| SSE PLC |
2,936 | 55,029 | ||||||
|
|
|
|||||||
| FOOD & STAPLES RETAILING — 1.1% |
| |||||||
| J Sainsbury PLC |
3,639 | 11,615 | ||||||
| Tesco PLC (a) |
12,668 | 31,808 | ||||||
| Wm Morrison Supermarkets PLC |
4,813 | 15,117 | ||||||
|
|
|
|||||||
| 58,540 | ||||||||
|
|
|
|||||||
| FOOD PRODUCTS — 2.0% |
| |||||||
| Associated British Foods PLC |
1,859 | 79,637 | ||||||
| Tate & Lyle PLC |
2,720 | 23,666 | ||||||
|
|
|
|||||||
| 103,303 | ||||||||
|
|
|
|||||||
| HEALTH CARE EQUIPMENT & SUPPLIES — 2.4% |
| |||||||
| ConvaTec Group PLC (c) |
9,297 | 34,164 | ||||||
| Smith & Nephew PLC |
5,145 | 93,050 | ||||||
|
|
|
|||||||
| 127,214 | ||||||||
|
|
|
|||||||
| HEALTH CARE PROVIDERS & SERVICES — 0.0% (b) |
| |||||||
| Mediclinic International PLC |
134 | 1,169 | ||||||
|
|
|
|||||||
| HOTELS, RESTAURANTS & LEISURE — 4.8% |
| |||||||
| Carnival PLC |
427 | 27,172 | ||||||
| Compass Group PLC |
6,729 | 142,912 | ||||||
| InterContinental Hotels Group PLC |
37 | 1,960 | ||||||
| Merlin Entertainments PLC (c) |
2,346 | 14,022 | ||||||
| TUI AG |
1,576 | 26,769 | ||||||
| Whitbread PLC |
866 | 43,756 | ||||||
|
|
|
|||||||
| 256,591 | ||||||||
|
|
|
|||||||
| HOUSEHOLD DURABLES — 2.6% |
| |||||||
| Barratt Developments PLC |
1,156 | 9,531 | ||||||
| Berkeley Group Holdings PLC |
755 | 37,651 | ||||||
| Persimmon PLC |
1,516 | 52,516 | ||||||
| Taylor Wimpey PLC |
14,850 | 38,951 | ||||||
|
|
|
|||||||
| 138,649 | ||||||||
|
|
|
|||||||
| HOUSEHOLD PRODUCTS — 3.1% |
| |||||||
| Reckitt Benckiser Group PLC |
1,786 | 163,252 | ||||||
|
|
|
|||||||
| INDUSTRIAL CONGLOMERATES — 0.7% |
| |||||||
| DCC PLC |
87 | 8,456 | ||||||
| Smiths Group PLC |
1,430 | 30,256 | ||||||
|
|
|
|||||||
| 38,712 | ||||||||
|
|
|
|||||||
| INSURANCE — 6.5% |
| |||||||
| Admiral Group PLC |
2,407 | 58,677 | ||||||
| Aviva PLC |
5,738 | 39,608 | ||||||
| Direct Line Insurance Group PLC |
6,125 | 29,879 | ||||||
| Legal & General Group PLC |
29,275 | 102,081 | ||||||
| Old Mutual PLC |
3,940 | 10,266 | ||||||
| Prudential PLC |
2,262 | 54,217 | ||||||
| RSA Insurance Group PLC |
3,537 | 29,564 | ||||||
| St James’s Place PLC |
434 | 6,673 | ||||||
| Standard Life Aberdeen PLC |
2,147 | 12,487 | ||||||
|
|
|
|||||||
| 343,452 | ||||||||
|
|
|
|||||||
| INTERNET SOFTWARE & SERVICES — 0.1% |
| |||||||
| Auto Trader Group PLC (c) |
979 | 5,155 | ||||||
|
|
|
|||||||
| IT SERVICES — 0.4% |
| |||||||
| Worldpay Group PLC (c) |
4,092 | 22,344 | ||||||
|
|
|
|||||||
| MACHINERY — 0.4% |
| |||||||
| IMI PLC |
1,150 | 19,178 | ||||||
| Weir Group PLC |
124 | 3,269 | ||||||
|
|
|
|||||||
| 22,447 | ||||||||
|
|
|
|||||||
| MEDIA — 4.7% |
| |||||||
| ITV PLC |
20,216 | 47,383 | ||||||
| Pearson PLC |
1,130 | 9,278 | ||||||
| RELX PLC |
6,704 | 147,239 | ||||||
See accompanying notes to financial statements.
194
Table of Contents
SPDR MSCI United Kingdom StrategicFactors ETF
SCHEDULE OF INVESTMENTS (continued)
September 30, 2017
| Security Description |
Shares |
Value |
||||||
| Sky PLC |
1,551 | $ | 19,040 | |||||
| WPP PLC |
1,455 | 27,037 | ||||||
|
|
|
|||||||
| 249,977 | ||||||||
|
|
|
|||||||
| METALS & MINING — 4.2% |
| |||||||
| Anglo American PLC |
1,759 | 31,612 | ||||||
| Antofagasta PLC |
301 | 3,832 | ||||||
| BHP Billiton PLC |
2,001 | 35,290 | ||||||
| Fresnillo PLC |
458 | 8,633 | ||||||
| Glencore PLC (a) |
15,393 | 70,630 | ||||||
| Randgold Resources, Ltd. |
208 | 20,414 | ||||||
| Rio Tinto PLC |
1,062 | 49,484 | ||||||
|
|
|
|||||||
| 219,895 | ||||||||
|
|
|
|||||||
| MULTI-UTILITIES — 2.2% |
| |||||||
| Centrica PLC |
8,692 | 21,807 | ||||||
| National Grid PLC |
7,411 | 91,933 | ||||||
|
|
|
|||||||
| 113,740 | ||||||||
|
|
|
|||||||
| MULTILINE RETAIL — 1.9% |
| |||||||
| Marks & Spencer Group PLC |
8,311 | 39,406 | ||||||
| Next PLC |
855 | 60,338 | ||||||
|
|
|
|||||||
| 99,744 | ||||||||
|
|
|
|||||||
| OIL, GAS & CONSUMABLE FUELS — 9.7% |
| |||||||
| BP PLC |
28,447 | 182,166 | ||||||
| Royal Dutch Shell PLC Class A |
7,079 | 213,552 | ||||||
| Royal Dutch Shell PLC Class B |
3,845 | 118,365 | ||||||
|
|
|
|||||||
| 514,083 | ||||||||
|
|
|
|||||||
| PAPER & FOREST PRODUCTS — 0.8% |
| |||||||
| Mondi PLC |
1,654 | 44,493 | ||||||
|
|
|
|||||||
| PERSONAL PRODUCTS — 2.8% |
| |||||||
| Unilever PLC |
2,574 | 149,153 | ||||||
|
|
|
|||||||
| PHARMACEUTICALS — 7.4% |
| |||||||
| AstraZeneca PLC |
2,660 | 176,834 | ||||||
| GlaxoSmithKline PLC |
9,103 | 181,791 | ||||||
| Hikma Pharmaceuticals PLC |
130 | 2,112 | ||||||
| Shire PLC |
600 | 30,493 | ||||||
|
|
|
|||||||
| 391,230 | ||||||||
|
|
|
|||||||
| PROFESSIONAL SERVICES — 1.9% |
| |||||||
| Capita PLC |
3,181 | 24,113 | ||||||
| Experian PLC |
1,430 | 28,759 | ||||||
| Intertek Group PLC |
679 | 45,385 | ||||||
|
|
|
|||||||
| 98,257 | ||||||||
|
|
|
|||||||
| REAL ESTATE INVESTMENT TRUSTS (REITS) — 1.2% |
| |||||||
| British Land Co. PLC REIT |
833 | 6,728 | ||||||
| Hammerson PLC REIT |
1,392 | 10,029 | ||||||
| Intu Properties PLC REIT |
686 | 2,122 | ||||||
| Land Securities Group PLC REIT |
1,556 | 20,305 | ||||||
| Segro PLC REIT |
3,071 | 22,084 | ||||||
|
|
|
|||||||
| 61,268 | ||||||||
|
|
|
|||||||
| SOFTWARE — 1.1% |
| |||||||
| Micro Focus International PLC |
78 | 2,498 | ||||||
| Sage Group PLC |
5,868 | 54,991 | ||||||
|
|
|
|||||||
| 57,489 | ||||||||
|
|
|
|||||||
| SPECIALTY RETAIL — 1.1% |
| |||||||
| Dixons Carphone PLC |
1,289 | 3,345 | ||||||
| Kingfisher PLC |
14,095 | 56,448 | ||||||
|
|
|
|||||||
| 59,793 | ||||||||
|
|
|
|||||||
| TEXTILES, APPAREL & LUXURY GOODS — 0.8% |
| |||||||
| Burberry Group PLC |
1,868 | 44,109 | ||||||
|
|
|
|||||||
| TOBACCO — 4.9% |
| |||||||
| British American Tobacco PLC |
2,993 | 187,607 | ||||||
| Imperial Brands PLC |
1,695 | 72,407 | ||||||
|
|
|
|||||||
| 260,014 | ||||||||
|
|
|
|||||||
| TRADING COMPANIES & DISTRIBUTORS — 2.8% |
| |||||||
| Ashtead Group PLC |
214 | 5,165 | ||||||
| Bunzl PLC |
1,777 | 54,048 | ||||||
| Ferguson PLC |
1,021 | 67,066 | ||||||
| Travis Perkins PLC |
1,060 | 20,593 | ||||||
|
|
|
|||||||
| 146,872 | ||||||||
|
|
|
|||||||
| WATER UTILITIES — 0.8% |
| |||||||
| Severn Trent PLC |
858 | 25,014 | ||||||
| United Utilities Group PLC |
1,696 | 19,444 | ||||||
|
|
|
|||||||
| 44,458 | ||||||||
|
|
|
|||||||
| WIRELESS TELECOMMUNICATION SERVICES — 2.5% |
| |||||||
| Vodafone Group PLC |
46,339 | 129,812 | ||||||
|
|
|
|||||||
| TOTAL COMMON STOCKS (Cost $5,322,031) |
5,251,462 | |||||||
|
|
|
|||||||
| SHORT-TERM INVESTMENT — 0.0% (b) |
| |||||||
| State Street Institutional U.S. Government Money Market Fund, Class G Shares 0.96% (d)
(e) |
1,793 | 1,793 | ||||||
|
|
|
|||||||
| TOTAL INVESTMENTS — 99.1% (Cost $5,323,824) |
5,253,255 | |||||||
| OTHER ASSETS IN EXCESS OF LIABILITIES — 0.9% |
45,468 | |||||||
|
|
|
|||||||
| NET ASSETS — 100.0% |
$ | 5,298,723 | ||||||
|
|
|
|||||||
| (a) | Non-income producing security. |
| (b) | Amount shown represents less than 0.05% of net assets. |
| (c) | Securities purchased pursuant to Rule 144A of the Securities Act of 1933, as amended. These securities, which represent 1.4% of net assets as of September 30, 2017, are considered liquid and may be resold in transactions exempt from registration, normally to qualified institutional buyers. |
| (d) | The Fund invested in certain money market funds managed by SSGA Funds Management, Inc. Amounts related to these transactions during the period ended September 30, 2017 are shown in the Affiliate Table below. |
| (e) | The rate shown is the annualized seven-day yield at September 30, 2017. |
REIT = Real Estate Investment Trust
See accompanying notes to financial statements.
195
Table of Contents
SPDR MSCI United Kingdom StrategicFactors ETF
SCHEDULE OF INVESTMENTS (continued)
September 30, 2017
The following table summarizes the value of the Fund’s investments according to the fair value hierarchy as of September 30, 2017.
| Description |
Level 1 — Quoted Prices |
Level 2 — Other Significant Observable Inputs |
Level 3 — Significant Unobservable Inputs |
Total | ||||||||||||
| ASSETS: |
||||||||||||||||
| INVESTMENTS: |
||||||||||||||||
| Common Stocks |
||||||||||||||||
| Aerospace & Defense |
$ | 143,762 | $ | — | $ | — | $ | 143,762 | ||||||||
| Air Freight & Logistics |
26,789 | — | — | 26,789 | ||||||||||||
| Airlines |
15,201 | — | — | 15,201 | ||||||||||||
| Auto Components |
36,868 | — | — | 36,868 | ||||||||||||
| Banks |
472,399 | — | — | 472,399 | ||||||||||||
| Beverages |
125,962 | — | — | 125,962 | ||||||||||||
| Capital Markets |
145,129 | — | — | 145,129 | ||||||||||||
| Chemicals |
80,346 | — | — | 80,346 | ||||||||||||
| Commercial Services & Supplies |
19,398 | — | — | 19,398 | ||||||||||||
| Consumer Finance |
891 | — | — | 891 | ||||||||||||
| Diversified Financial Services |
31,499 | — | — | 31,499 | ||||||||||||
| Diversified Telecommunication Services |
132,974 | — | — | 132,974 | ||||||||||||
| Electric Utilities |
55,029 | — | — | 55,029 | ||||||||||||
| Food & Staples Retailing |
58,540 | — | — | 58,540 | ||||||||||||
| Food Products |
103,303 | — | — | 103,303 | ||||||||||||
| Health Care Equipment & Supplies |
127,214 | — | — | 127,214 | ||||||||||||
| Health Care Providers & Services |
1,169 | — | — | 1,169 | ||||||||||||
| Hotels, Restaurants & Leisure |
256,591 | — | — | 256,591 | ||||||||||||
| Household Durables |
138,649 | — | — | 138,649 | ||||||||||||
| Household Products |
163,252 | — | — | 163,252 | ||||||||||||
| Industrial Conglomerates |
38,712 | — | — | 38,712 | ||||||||||||
| Insurance |
343,452 | — | — | 343,452 | ||||||||||||
| Internet Software & Services |
5,155 | — | — | 5,155 | ||||||||||||
| IT Services |
22,344 | — | — | 22,344 | ||||||||||||
| Machinery |
22,447 | — | — | 22,447 | ||||||||||||
| Media |
249,977 | — | — | 249,977 | ||||||||||||
| Metals & Mining |
219,895 | — | — | 219,895 | ||||||||||||
| Multi-Utilities |
113,740 | — | — | 113,740 | ||||||||||||
| Multiline Retail |
99,744 | — | — | 99,744 | ||||||||||||
| Oil, Gas & Consumable Fuels |
514,083 | — | — | 514,083 | ||||||||||||
| Paper & Forest Products |
44,493 | — | — | 44,493 | ||||||||||||
| Personal Products |
149,153 | — | — | 149,153 | ||||||||||||
| Pharmaceuticals |
391,230 | — | — | 391,230 | ||||||||||||
| Professional Services |
98,257 | — | — | 98,257 | ||||||||||||
| Real Estate Investment Trusts (REITs) |
61,268 | — | — | 61,268 | ||||||||||||
| Software |
57,489 | — | — | 57,489 | ||||||||||||
| Specialty Retail |
59,793 | — | — | 59,793 | ||||||||||||
| Textiles, Apparel & Luxury Goods |
44,109 | — | — | 44,109 | ||||||||||||
| Tobacco |
260,014 | — | — | 260,014 | ||||||||||||
| Trading Companies & Distributors |
146,872 | — | — | 146,872 | ||||||||||||
| Water Utilities |
44,458 | — | — | 44,458 | ||||||||||||
| Wireless Telecommunication Services |
129,812 | — | — | 129,812 | ||||||||||||
| Short-Term Investment |
1,793 | — | — | 1,793 | ||||||||||||
|
|
|
|
|
|
|
|
|
|||||||||
| TOTAL INVESTMENTS |
$ | 5,253,255 | $ | — | $ | — | $ | 5,253,255 | ||||||||
|
|
|
|
|
|
|
|
|
|||||||||
See accompanying notes to financial statements.
196
Table of Contents
SPDR MSCI United Kingdom StrategicFactors ETF
SCHEDULE OF INVESTMENTS (continued)
September 30, 2017
Affiliate Table
| Number of Shares Held at 9/30/16 |
Value at 9/30/16 |
Cost of Purchases |
Proceeds from Shares Sold |
Realized Gain (Loss) |
Change in Unrealized Appreciation/ Depreciation |
Number of Shares Held at 9/30/17 |
Value at 9/30/17 |
Dividend Income |
||||||||||||||||||||||||||||
| State Street Institutional Liquid Reserves Fund, Premier Class |
1,019 | $ | 1,019 | $ | — | $ | 1,019 | $ | — | $ | — | — | $ | — | $ | — | ||||||||||||||||||||
| State Street Institutional U.S. Government Money Market Fund, Class G Shares |
— | — | 339,759 | 337,966 | — | — | 1,793 | 1,793 | 76 | |||||||||||||||||||||||||||
| State Street Institutional U.S. Government Money Market Fund, Premier Class |
— | — | 46,211 | 46,211 | — | — | — | — | 4 | |||||||||||||||||||||||||||
|
|
|
|
|
|
|
|
|
|
|
|
|
|
|
|||||||||||||||||||||||
| TOTAL |
$ | 1,019 | $ | 385,970 | $ | 385,196 | $ | — | $ | — | $ | 1,793 | $ | 80 | ||||||||||||||||||||||
|
|
|
|
|
|
|
|
|
|
|
|
|
|
|
|||||||||||||||||||||||
See accompanying notes to financial statements.
197
Table of Contents
SCHEDULE OF INVESTMENTS
September 30, 2017
| Security Description |
Shares |
Value |
||||||
| COMMON STOCKS — 99.5% |
| |||||||
| AUSTRALIA — 1.1% |
| |||||||
| APA Group |
271,815 | $ | 1,780,884 | |||||
|
|
|
|||||||
| CANADA — 17.0% |
| |||||||
| Bank of Montreal (a) |
14,403 | 1,087,495 | ||||||
| Bank of Nova Scotia (a) |
20,169 | 1,293,371 | ||||||
| Canadian Apartment Properties |
60,440 | 1,630,065 | ||||||
| Canadian Imperial Bank of Commerce (a) |
15,665 | 1,367,407 | ||||||
| Emera, Inc. |
49,219 | 1,859,905 | ||||||
| Enbridge Income Fund Holdings, Inc. |
75,458 | 1,939,168 | ||||||
| First Capital Realty, Inc. (a) |
97,310 | 1,531,252 | ||||||
| Fortis, Inc. |
45,168 | 1,617,257 | ||||||
| Great-West Lifeco, Inc. |
43,865 | 1,259,499 | ||||||
| IGM Financial, Inc. |
57,791 | 1,937,996 | ||||||
| National Bank of Canada (a) |
29,262 | 1,405,016 | ||||||
| Power Corp. of Canada |
58,216 | 1,476,056 | ||||||
| Power Financial Corp. |
54,651 | 1,512,390 | ||||||
| RioCan Real Estate Investment Trust |
98,770 | 1,889,870 | ||||||
| Rogers Communications, Inc. Class B (a) |
31,588 | 1,625,053 | ||||||
| Royal Bank of Canada |
15,491 | 1,195,779 | ||||||
| Shaw Communications, Inc. Class B (a) |
75,287 | 1,728,895 | ||||||
| TELUS Corp. |
49,867 | 1,789,494 | ||||||
|
|
|
|||||||
| 28,145,968 | ||||||||
|
|
|
|||||||
| CHINA — 2.7% |
| |||||||
| China Overseas Land & Investment, Ltd. |
454,000 | 1,476,385 | ||||||
| Guangdong Investment, Ltd. |
1,018,000 | 1,451,921 | ||||||
| Hengan International Group Co., Ltd. |
170,000 | 1,573,611 | ||||||
|
|
|
|||||||
| 4,501,917 | ||||||||
|
|
|
|||||||
| FINLAND — 2.1% |
| |||||||
| Fortum Oyj |
176,428 | 3,522,799 | ||||||
|
|
|
|||||||
| FRANCE — 5.2% |
| |||||||
| CNP Assurances |
69,469 | 1,628,563 | ||||||
| Sanofi |
17,149 | 1,703,180 | ||||||
| SCOR SE |
40,463 | 1,696,958 | ||||||
| TOTAL SA (a) |
36,585 | 1,965,531 | ||||||
| Unibail-Rodamco SE REIT |
6,819 | 1,658,637 | ||||||
|
|
|
|||||||
| 8,652,869 | ||||||||
|
|
|
|||||||
| GERMANY — 2.8% |
| |||||||
| Axel Springer SE |
28,000 | 1,799,733 | ||||||
| Deutsche EuroShop AG |
32,384 | 1,214,762 | ||||||
| Muenchener Rueckversicherungs-Gesellschaft AG in Muenchen |
7,423 | 1,587,482 | ||||||
|
|
|
|||||||
| 4,601,977 | ||||||||
|
|
|
|||||||
| HONG KONG — 6.8% |
| |||||||
| CK Infrastructure Holdings, Ltd. |
163,500 | 1,406,686 | ||||||
| CLP Holdings, Ltd. |
144,600 | 1,481,971 | ||||||
| Hysan Development Co., Ltd. |
335,000 | 1,576,203 | ||||||
| I-CABLE Communications, Ltd. (b) |
49,250 | 1,608 | ||||||
| Link REIT |
233,000 | 1,888,294 | ||||||
| Sino Land Co., Ltd. |
959,270 | 1,685,020 | ||||||
| Sun Hung Kai Properties, Ltd. |
104,000 | 1,689,682 | ||||||
| Wharf Holdings, Ltd. |
181,597 | 1,618,184 | ||||||
|
|
|
|||||||
| 11,347,648 | ||||||||
|
|
|
|||||||
| ITALY — 1.3% |
||||||||
| Atlantia SpA |
66,220 | 2,090,999 | ||||||
|
|
|
|||||||
| JAPAN — 2.0% |
||||||||
| Canon, Inc. |
57,600 | 1,967,503 | ||||||
| Chugoku Electric Power Co., Inc. (a) |
122,300 | 1,298,348 | ||||||
|
|
|
|||||||
| 3,265,851 | ||||||||
|
|
|
|||||||
| MEXICO — 1.0% |
||||||||
| Kimberly-Clark de Mexico SAB de CV Class A |
840,307 | 1,714,464 | ||||||
|
|
|
|||||||
| NETHERLANDS — 1.0% |
||||||||
| Boskalis Westminster |
48,176 | 1,684,404 | ||||||
|
|
|
|||||||
| PORTUGAL — 1.9% |
||||||||
| EDP - Energias de Portugal SA |
818,490 | 3,081,864 | ||||||
|
|
|
|||||||
| SINGAPORE — 3.4% |
||||||||
| Oversea-Chinese Banking Corp., Ltd. |
183,035 | 1,504,231 | ||||||
| Singapore Telecommunications, Ltd. |
637,106 | 1,726,536 | ||||||
| StarHub, Ltd. (a) |
1,226,126 | 2,347,603 | ||||||
|
|
|
|||||||
| 5,578,370 | ||||||||
|
|
|
|||||||
| SOUTH AFRICA — 5.7% |
||||||||
| AVI, Ltd. |
219,673 | 1,592,741 | ||||||
| Foschini Group, Ltd. |
138,729 | 1,394,739 | ||||||
| Mr. Price Group, Ltd. |
126,710 | 1,689,529 | ||||||
| Sanlam, Ltd. |
249,042 | 1,247,931 | ||||||
| Standard Bank Group, Ltd. |
133,126 | 1,555,905 | ||||||
| Truworths International, Ltd. (a) |
355,173 | 2,032,003 | ||||||
|
|
|
|||||||
| 9,512,848 | ||||||||
|
|
|
|||||||
| SOUTH KOREA — 1.1% |
||||||||
| SK Telecom Co., Ltd. |
8,450 | 1,881,303 | ||||||
|
|
|
|||||||
| SPAIN — 3.1% |
||||||||
| Abertis Infraestructuras SA |
135,626 | 2,741,762 | ||||||
| Enagas SA |
85,188 | 2,399,397 | ||||||
|
|
|
|||||||
| 5,141,159 | ||||||||
|
|
|
|||||||
| SWEDEN — 2.5% |
||||||||
| Castellum AB |
104,005 | 1,628,433 | ||||||
| Hennes & Mauritz AB Class B (a) |
50,857 | 1,314,674 | ||||||
| Skanska AB Class B |
52,587 | 1,215,724 | ||||||
|
|
|
|||||||
| 4,158,831 | ||||||||
|
|
|
|||||||
| SWITZERLAND — 4.6% |
||||||||
| Baloise Holding AG |
9,113 | 1,442,860 | ||||||
| Novartis AG |
18,493 | 1,584,405 | ||||||
| PSP Swiss Property AG |
15,275 | 1,408,154 | ||||||
| Roche Holding AG |
5,399 | 1,379,323 | ||||||
| Swiss Prime Site AG (b) |
19,458 | 1,750,536 | ||||||
|
|
|
|||||||
| 7,565,278 | ||||||||
|
|
|
|||||||
| THAILAND — 1.8% |
||||||||
| Bangkok Bank PCL |
244,490 | 1,429,552 | ||||||
| Thai Beverage PCL |
2,292,800 | 1,519,584 | ||||||
|
|
|
|||||||
| 2,949,136 | ||||||||
|
|
|
|||||||
| UNITED KINGDOM — 12.3% |
||||||||
| Ashmore Group PLC |
445,038 | 2,025,313 | ||||||
| BAE Systems PLC |
179,680 | 1,522,342 | ||||||
| Britvic PLC |
198,552 | 2,012,556 | ||||||
| Carillion PLC (a) |
1,019,859 | 701,250 | ||||||
See accompanying notes to financial statements.
198
Table of Contents
SPDR S&P Global Dividend ETF
SCHEDULE OF INVESTMENTS (continued)
September 30, 2017
| Security Description |
Shares |
Value |
||||||
| Close Brothers Group PLC |
65,432 | $ | 1,294,856 | |||||
| Essentra PLC. |
310,716 | 2,303,218 | ||||||
| GlaxoSmithKline PLC |
96,875 | 1,934,638 | ||||||
| Greene King PLC |
200,138 | 1,467,435 | ||||||
| IG Group Holdings PLC |
286,582 | 2,464,598 | ||||||
| IMI PLC |
91,970 | 1,533,757 | ||||||
| Pennon Group PLC |
153,829 | 1,644,885 | ||||||
| Tate & Lyle PLC |
172,665 | 1,502,289 | ||||||
|
|
|
|||||||
| 20,407,137 | ||||||||
|
|
|
|||||||
| UNITED STATES — 20.1% |
| |||||||
| AT&T, Inc. |
40,688 | 1,593,749 | ||||||
| CME Group, Inc. |
12,276 | 1,665,608 | ||||||
| Entergy Corp. |
24,552 | 1,874,791 | ||||||
| Gap, Inc. (a) |
66,785 | 1,972,161 | ||||||
| Garmin, Ltd. (a) |
32,060 | 1,730,278 | ||||||
| H&R Block, Inc. |
67,280 | 1,781,574 | ||||||
| Hawaiian Electric Industries, Inc. |
42,025 | 1,402,374 | ||||||
| Lazard, Ltd. Class A |
26,063 | 1,178,569 | ||||||
| Mattel, Inc. (a) |
80,225 | 1,241,883 | ||||||
| MDC Holdings, Inc. |
49,847 | 1,655,419 | ||||||
| Mercury General Corp. (a) |
19,537 | 1,107,553 | ||||||
| National Health Investors, Inc. REIT |
24,605 | 1,901,720 | ||||||
| Old Republic International Corp. |
57,454 | 1,131,269 | ||||||
| PPL Corp. |
46,879 | 1,779,058 | ||||||
| Public Service Enterprise Group, Inc. |
31,626 | 1,462,702 | ||||||
| Safety Insurance Group, Inc. |
16,193 | 1,235,526 | ||||||
| Southern Co. |
34,399 | 1,690,367 | ||||||
| Tupperware Brands Corp. |
32,902 | 2,034,002 | ||||||
| Verizon Communications, Inc. |
33,185 | 1,642,326 | ||||||
| Waddell & Reed Financial, Inc. Class A (a) |
160,829 | 3,227,838 | ||||||
|
|
|
|||||||
| 33,308,767 | ||||||||
|
|
|
|||||||
| TOTAL COMMON STOCKS |
164,894,473 | |||||||
|
|
|
|||||||
| SHORT-TERM INVESTMENTS — 3.6% |
| |||||||
| State Street Institutional U.S. Government Money Market Fund, Class G Shares 0.96% (c) (d) |
150,675 | 150,675 | ||||||
| State Street Navigator Securities Lending Government Money Market Portfolio (c) (e) |
5,848,371 | 5,848,371 | ||||||
|
|
|
|||||||
| TOTAL SHORT-TERM INVESTMENTS |
5,999,046 | |||||||
|
|
|
|||||||
| TOTAL INVESTMENTS — 103.1% |
170,893,519 | |||||||
| LIABILITIES IN EXCESS OF OTHER ASSETS — (3.1)% |
(5,168,344 | ) | ||||||
|
|
|
|||||||
| NET ASSETS — 100.0% |
$ | 165,725,175 | ||||||
|
|
|
|||||||
| (a) | All or a portion of the shares of the security are on loan at September 30, 2017. |
| (b) | Non-income producing security. |
| (c) | The Fund invested in certain money market funds managed by SSGA Funds Management, Inc. Amounts related to these transactions during the period ended September 30, 2017 are shown in the Affiliate Table below. |
| (d) | The rate shown is the annualized seven-day yield at September 30, 2017. |
| (e) | Investment of cash collateral for securities loaned. |
REIT = Real Estate Investment Trust
The following table summarizes the value of the Fund’s investments according to the fair value hierarchy as of September 30, 2017.
| Description |
Level 1 — Quoted Prices |
Level 2 — Other Significant Observable Inputs |
Level 3 — Significant Unobservable Inputs |
Total | ||||||||||||
| ASSETS: |
||||||||||||||||
| INVESTMENTS: |
||||||||||||||||
| Common Stocks |
||||||||||||||||
| Australia |
$ | 1,780,884 | $ | — | $ | — | $ | 1,780,884 | ||||||||
| Canada |
28,145,968 | — | — | 28,145,968 | ||||||||||||
| China |
4,501,917 | — | — | 4,501,917 | ||||||||||||
| Finland |
3,522,799 | — | — | 3,522,799 | ||||||||||||
| France |
8,652,869 | — | — | 8,652,869 | ||||||||||||
| Germany |
4,601,977 | — | — | 4,601,977 | ||||||||||||
| Hong Kong |
11,347,648 | — | — | 11,347,648 | ||||||||||||
| Italy |
2,090,999 | — | — | 2,090,999 | ||||||||||||
| Japan |
3,265,851 | — | — | 3,265,851 | ||||||||||||
| Mexico |
1,714,464 | — | — | 1,714,464 | ||||||||||||
| Netherlands |
1,684,404 | — | — | 1,684,404 | ||||||||||||
| Portugal |
3,081,864 | — | — | 3,081,864 | ||||||||||||
See accompanying notes to financial statements.
199
Table of Contents
SPDR S&P Global Dividend ETF
SCHEDULE OF INVESTMENTS (continued)
September 30, 2017
| Description |
Level 1 — Quoted Prices |
Level 2 — Other Significant Observable Inputs |
Level 3 — Significant Unobservable Inputs |
Total | ||||||||||||
| Singapore |
$ | 5,578,370 | $ | — | $ | — | $ | 5,578,370 | ||||||||
| South Africa |
9,512,848 | — | — | 9,512,848 | ||||||||||||
| South Korea |
1,881,303 | — | — | 1,881,303 | ||||||||||||
| Spain |
5,141,159 | — | — | 5,141,159 | ||||||||||||
| Sweden |
4,158,831 | — | — | 4,158,831 | ||||||||||||
| Switzerland |
7,565,278 | — | — | 7,565,278 | ||||||||||||
| Thailand |
2,949,136 | — | — | 2,949,136 | ||||||||||||
| United Kingdom |
20,407,137 | — | — | 20,407,137 | ||||||||||||
| United States |
33,308,767 | — | — | 33,308,767 | ||||||||||||
| Short-Term Investments |
5,999,046 | — | — | 5,999,046 | ||||||||||||
|
|
|
|
|
|
|
|
|
|||||||||
| TOTAL INVESTMENTS |
$ | 170,893,519 | $ | — | $ | — | $ | 170,893,519 | ||||||||
|
|
|
|
|
|
|
|
|
|||||||||
Affiliate Table
| Number of Shares Held at 9/30/16 |
Value at 9/30/16 |
Cost of Purchases |
Proceeds from Shares Sold |
Realized Gain (Loss) |
Change in Unrealized Appreciation/ Depreciation |
Number of Shares Held at 9/30/17 |
Value at 9/30/17 |
Dividend Income |
||||||||||||||||||||||||||||
| State Street Institutional Liquid Reserves Fund, Premier Class |
57,050 | $ | 57,050 | $ | 42,031 | $ | 99,081 | $ | — | $ | — | — | $ | — | $ | 4 | ||||||||||||||||||||
| State Street Institutional U.S. Government Money Market Fund, Class G Shares |
— | — | 11,272,535 | 11,121,860 | — | — | 150,675 | 150,675 | 1,898 | |||||||||||||||||||||||||||
| State Street Institutional U.S. Government Money Market Fund, Premier Class |
— | — | 9,450,223 | 9,450,223 | — | — | — | — | 590 | |||||||||||||||||||||||||||
| State Street Navigator Securities Lending Government Money Market Portfolio* |
8,297,041 | 8,297,041 | 70,491,725 | 72,940,395 | — | — | 5,848,371 | 5,848,371 | 66,565 | |||||||||||||||||||||||||||
|
|
|
|
|
|
|
|
|
|
|
|
|
|
|
|||||||||||||||||||||||
| TOTAL |
$ | 8,354,091 | $ | 91,256,514 | $ | 93,611,559 | $ | — | $ | — | $ | 5,999,046 | $ | 69,057 | ||||||||||||||||||||||
|
|
|
|
|
|
|
|
|
|
|
|
|
|
|
|||||||||||||||||||||||
| * | Effective October 5, 2016, the name of State Street Navigator Securities Lending Prime Portfolio was changed to State Street Navigator Securities Lending Government Money Market Portfolio. |
See accompanying notes to financial statements.
200
Table of Contents
SPDR S&P Emerging Markets Small Cap ETF
SCHEDULE OF INVESTMENTS
September 30, 2017
| Security Description |
Shares |
Value |
||||||
| COMMON STOCKS — 99.7% |
| |||||||
| BRAZIL — 4.8% |
| |||||||
| AES Tiete Energia SA |
48,858 | $ | 220,260 | |||||
| Aliansce Shopping Centers SA (a) |
93,409 | 547,198 | ||||||
| Alupar Investimento SA |
46,501 | 276,082 | ||||||
| Arezzo Industria e Comercio SA |
45,350 | 716,849 | ||||||
| Banco ABC Brasil SA (a) |
2,734 | 14,979 | ||||||
| Banco ABC Brasil SA Preference Shares |
77,088 | 429,898 | ||||||
| BR Properties SA |
93,094 | 328,742 | ||||||
| Cia de Saneamento de Minas Gerais-COPASA |
50,993 | 689,977 | ||||||
| Cia de Saneamento do Parana Preference Shares |
146,800 | 502,150 | ||||||
| Cia Energetica de Sao Paulo Class B, Preference Shares |
102,130 | 465,908 | ||||||
| Cia Ferro Ligas da Bahia - FERBASA Preference Shares |
104,377 | 499,257 | ||||||
| Cia Hering |
125,388 | 1,127,765 | ||||||
| Construtora Tenda SA (a) |
25,768 | 133,762 | ||||||
| Cosan Logistica SA (a) |
63,314 | 179,144 | ||||||
| Cosan, Ltd. |
57,300 | 467,182 | ||||||
| CVC Brasil Operadora e Agencia de Viagens SA |
93,400 | 1,209,152 | ||||||
| Cyrela Brazil Realty SA Empreendimentos e Participacoes |
157,466 | 686,983 | ||||||
| Direcional Engenharia SA (a) |
171,831 | 317,245 | ||||||
| Duratex SA |
148,200 | 443,689 | ||||||
| EcoRodovias Infraestrutura e Logistica SA |
135,838 | 489,990 | ||||||
| Eletropaulo Metropolitana Eletricidade de Sao Paulo SA Preference Shares |
99,999 | 400,546 | ||||||
| Even Construtora e Incorporadora SA (a) |
242,993 | 426,351 | ||||||
| Ez Tec Empreendimentos e Participacoes SA |
86,346 | 614,193 | ||||||
| GAEC Educacao SA |
77,185 | 563,670 | ||||||
| Gafisa SA (a) |
26,625 | 115,484 | ||||||
| Helbor Empreendimentos SA (a) |
184,035 | 144,289 | ||||||
| International Meal Co. Alimentacao SA Class A (a) |
97,857 | 329,784 | ||||||
| Iochpe Maxion SA |
104,440 | 709,551 | ||||||
| JSL SA (a) |
47,738 | 147,146 | ||||||
| Kepler Weber SA (a) |
18,547 | 133,100 | ||||||
| Light SA (a) |
71,495 | 443,686 | ||||||
| Linx SA |
65,683 | 406,165 | ||||||
| LPS Brasil Consultoria de Imoveis SA (a) |
100,405 | 224,734 | ||||||
| Magnesita Refratarios SA |
57,780 | 741,624 | ||||||
| Mahle-Metal Leve SA |
36,142 | 227,376 | ||||||
| Marcopolo SA Preference Shares |
483,388 | 664,761 | ||||||
| Marfrig Global Foods SA (a) |
200,025 | 409,137 | ||||||
| Metalurgica Gerdau SA Preference Shares (a) |
471,613 | 788,718 | ||||||
| Mills Estruturas e Servicos de Engenharia SA (a) |
145,457 | 213,370 | ||||||
| Minerva SA |
43,410 | 153,705 | ||||||
| MRV Engenharia e Participacoes SA |
246,250 | 1,071,211 | ||||||
| Paranapanema SA (a) |
253,596 | 125,068 | ||||||
| Prumo Logistica SA (a) |
30,880 | 108,851 | ||||||
| QGEP Participacoes SA |
173,819 | 432,466 | ||||||
| Randon SA Implementos e Participacoes Preference Shares |
256,066 | 560,194 | ||||||
| Restoque Comercio e Confeccoes de Roupas SA (a) |
8,600 | 110,384 | ||||||
| Santos Brasil Participacoes SA (a) |
167,697 | 185,025 | ||||||
| Sao Martinho SA |
75,183 | 422,840 | ||||||
| Ser Educacional SA (b) |
54,917 | 541,678 | ||||||
| SLC Agricola SA |
75,790 | 591,819 | ||||||
| TOTVS SA |
86,575 | 856,677 | ||||||
| Valid Solucoes e Servicos de Seguranca em Meios de Pagamento e Identificacao SA |
74,908 | 482,154 | ||||||
|
|
|
|||||||
| 23,091,969 | ||||||||
|
|
|
|||||||
| CHILE — 1.5% |
| |||||||
| CAP SA |
61,379 | 641,842 | ||||||
| Inversiones Aguas Metropolitanas SA |
534,651 | 949,377 | ||||||
| Inversiones La Construccion SA |
48,888 | 774,476 | ||||||
| Ripley Corp. SA |
1,117,414 | 1,066,048 | ||||||
| Salfacorp SA |
515,851 | 744,135 | ||||||
| SMU SA (a) |
2,113,136 | 547,188 | ||||||
| Sociedad Matriz SAAM SA |
7,920,417 | 842,690 | ||||||
| SONDA SA |
213,571 | 415,995 | ||||||
| Vina Concha y Toro SA |
610,747 | 1,016,462 | ||||||
|
|
|
|||||||
| 6,998,213 | ||||||||
|
|
|
|||||||
| CHINA — 13.8% |
| |||||||
| 21Vianet Group, Inc. ADR (a) (c) |
42,432 | 241,438 | ||||||
| 361 Degrees International, Ltd. |
909,000 | 399,179 | ||||||
| 500.com, Ltd. Class A, ADR (a) (c) |
26,912 | 296,032 | ||||||
| Anton Oilfield Services Group (a) (c) |
2,230,000 | 219,839 | ||||||
| AVIC International Holding HK, Ltd. (a) |
1,818,000 | 134,999 | ||||||
| Baozun, Inc. ADR (a) (c) |
21,424 | 701,850 | ||||||
| Beijing Capital Land, Ltd. Class H |
1,108,400 | 618,718 | ||||||
| Boshiwa International Holding, Ltd. (a) (c) (d) |
1,843,000 | — | ||||||
| Boyaa Interactive International, Ltd. (a) (c) |
829,000 | 331,146 | ||||||
| Changyou.com, Ltd. ADR (a) |
14,500 | 574,345 | ||||||
| Chaowei Power Holdings, Ltd. |
706,000 | 408,558 | ||||||
| Cheetah Mobile, Inc. ADR (a) (c) |
34,977 | 294,157 | ||||||
| China Aerospace International Holdings, Ltd. |
2,204,000 | 290,642 | ||||||
| China Aircraft Leasing Group Holdings, Ltd. |
489,500 | 507,631 | ||||||
| China Animal Healthcare, Ltd. (a) (c) (d) |
1,059,700 | — | ||||||
| China Aoyuan Property Group, Ltd. |
1,087,000 | 606,773 | ||||||
| China BlueChemical, Ltd. Class H |
1,784,000 | 580,148 | ||||||
| China Distance Education Holdings, Ltd. ADR (c) |
34,077 | 227,634 | ||||||
| China Dongxiang Group Co., Ltd. |
4,035,000 | 702,575 | ||||||
| China Electronics Corp. Holdings Co., Ltd. |
1,142,000 | 209,080 | ||||||
| China Energine International Holdings, Ltd. (a) (c) |
698,000 | 43,789 | ||||||
| China Fangda Group Co., Ltd. Class B |
423,850 | 293,033 | ||||||
See accompanying notes to financial statements.
201
Table of Contents
SPDR S&P Emerging Markets Small Cap ETF
SCHEDULE OF INVESTMENTS (continued)
September 30, 2017
| Security Description |
Shares |
Value |
||||||
| China Foods, Ltd. (c) |
694,000 | $ | 353,633 | |||||
| China Forestry Holdings Co., Ltd. (a) (c) (d) |
1,642,000 | — | ||||||
| China Greenland Broad Greenstate Group Co., Ltd. (c) |
760,000 | 146,927 | ||||||
| China Harmony New Energy Auto Holding, Ltd. (a) (c) |
670,500 | 389,731 | ||||||
| China Hongxing Sports, Ltd. (a) (c) (d) |
4,053,000 | — | ||||||
| China Huiyuan Juice Group, Ltd. (a) |
1,340,400 | 413,582 | ||||||
| China Lilang, Ltd. |
918,000 | 765,127 | ||||||
| China Logistics Property Holdings Co., Ltd. (a) (c) |
1,151,000 | 362,510 | ||||||
| China Maple Leaf Educational Systems, Ltd. (c) |
630,000 | 704,149 | ||||||
| China Modern Dairy Holdings, Ltd. (a) (c) |
2,268,000 | 493,631 | ||||||
| China National Materials Co., Ltd. |
1,204,000 | 678,249 | ||||||
| China Overseas Grand Oceans Group, Ltd. |
720,000 | 464,593 | ||||||
| China Pioneer Pharma Holdings, Ltd. |
443,000 | 147,464 | ||||||
| China Power Clean Energy Development Co., Ltd. |
495,000 | 278,215 | ||||||
| China Rare Earth Holdings, Ltd. (a) |
1,712,400 | 133,735 | ||||||
| China Resources Phoenix Healthcare Holdings Co., Ltd. (c) |
579,500 | 722,641 | ||||||
| China SCE Property Holdings, Ltd. |
2,162,800 | 1,054,997 | ||||||
| China Shanshui Cement Group, Ltd. (a) (c) (d) |
1,224,000 | 58,766 | ||||||
| China Shengmu Organic Milk, Ltd. (a) (b) (c) |
2,437,000 | 433,691 | ||||||
| China Shineway Pharmaceutical Group, Ltd. |
346,000 | 307,873 | ||||||
| China Silver Group, Ltd. (c) |
976,000 | 292,399 | ||||||
| China Singyes Solar Technologies Holdings, Ltd. (a) (c) |
513,600 | 171,623 | ||||||
| China Suntien Green Energy Corp., Ltd. Class H (c) |
1,491,000 | 370,330 | ||||||
| China Travel International Investment Hong Kong, Ltd. (c) |
3,200,000 | 1,171,726 | ||||||
| China Yurun Food Group, Ltd. (a) (c) |
1,008,000 | 120,020 | ||||||
| Chinasoft International, Ltd. (a) (c) |
1,736,000 | 962,382 | ||||||
| Chongqing Iron & Steel Co., Ltd. Class H (a) |
580,000 | 114,356 | ||||||
| CITIC Resources Holdings, Ltd. (c) |
3,117,000 | 359,161 | ||||||
| CITIC Telecom International Holdings, Ltd. |
1,761,000 | 507,285 | ||||||
| Colour Life Services Group Co., Ltd. (a) |
559,000 | 362,852 | ||||||
| Consun Pharmaceutical Group, Ltd. |
475,600 | 400,662 | ||||||
| Coolpad Group, Ltd. (a) (d) |
2,353,600 | 108,479 | ||||||
| CT Environmental Group, Ltd. (c) |
3,057,900 | 438,482 | ||||||
| Dah Chong Hong Holdings, Ltd. |
1,128,000 | 557,451 | ||||||
| Eastern Communications Co., Ltd. Class B |
246,074 | 173,728 | ||||||
| Fang Holdings, Ltd. ADR (a) (c) |
158,538 | 642,079 | ||||||
| Fanhua, Inc. ADR |
48,037 | 603,825 | ||||||
| First Tractor Co., Ltd. Class H (c) |
580,500 | 277,218 | ||||||
| Foshan Electrical and Lighting Co., Ltd. Class B |
157,800 | 123,239 | ||||||
| Foxsemicon Integrated Technology, Inc. |
75,000 | 503,314 | ||||||
| Fu Shou Yuan International Group, Ltd. (c) |
1,354,000 | 891,029 | ||||||
| Fufeng Group, Ltd. (a) |
1,059,600 | 725,781 | ||||||
| Future Land Holdings Co., Ltd. Class A |
531,529 | 1,429,882 | ||||||
| Genscript Biotech Corp. |
466,000 | 445,077 | ||||||
| Goodbaby International Holdings, Ltd. |
846,000 | 466,829 | ||||||
| Grand Baoxin Auto Group, Ltd. (a) |
828,601 | 476,323 | ||||||
| Greatview Aseptic Packaging Co., Ltd. |
912,048 | 560,491 | ||||||
| Greentown Service Group Co., Ltd. (c) |
1,206,000 | 739,593 | ||||||
| Guorui Properties, Ltd. |
1,026,000 | 350,727 | ||||||
| Harbin Electric Co., Ltd. Class H |
1,090,000 | 519,134 | ||||||
| Hilong Holding, Ltd. |
1,037,100 | 158,007 | ||||||
| HNA Holding Group Co., Ltd. (a) (c) |
3,614,000 | 168,885 | ||||||
| Hollysys Automation Technologies, Ltd. (c) |
42,196 | 911,856 | ||||||
| Honghua Group, Ltd. (a) |
2,440,000 | 209,303 | ||||||
| Huadian Energy Co., Ltd. Class B (a) |
345,900 | 169,837 | ||||||
| Huangshan Tourism Development Co., Ltd. Class B |
403,061 | 636,030 | ||||||
| Huayi Tencent Entertainment Co., Ltd. (a) (c) |
2,760,000 | 121,910 | ||||||
| JA Solar Holdings Co., Ltd. ADR (a) |
58,541 | 446,082 | ||||||
| Jiangnan Group, Ltd. |
504,000 | 30,005 | ||||||
| JinkoSolar Holding Co., Ltd. ADR (a) (c) |
21,265 | 530,562 | ||||||
| Jumei International Holding, Ltd. ADR (a) (c) |
42,681 | 123,775 | ||||||
| Kama Co., Ltd. Class B (a) |
268,100 | 302,149 | ||||||
| Kandi Technologies Group, Inc. (a) (c) |
40,417 | 232,398 | ||||||
| Kangda International Environmental Co., Ltd. (a) (b) |
1,706,200 | 369,170 | ||||||
| Kingdee International Software Group Co., Ltd. (a) (c) |
1,730,000 | 761,929 | ||||||
| Launch Tech Co., Ltd. Class H |
164,000 | 194,221 | ||||||
| Leyou Technologies Holdings, Ltd. (a) |
1,294,200 | 309,851 | ||||||
| Li Ning Co., Ltd. (a) |
1,971,749 | 1,756,997 | ||||||
| Lifetech Scientific Corp. (a) (c) |
2,214,000 | 521,561 | ||||||
| Lonking Holdings, Ltd. |
2,162,000 | 910,671 | ||||||
| Luoyang Glass Co., Ltd. Class H (a) (c) |
428,000 | 245,489 | ||||||
| Luye Pharma Group, Ltd. (c) |
1,718,500 | 1,003,285 | ||||||
| Maoye International Holdings, Ltd. |
1,490,000 | 164,057 | ||||||
| Nanjing Panda Electronics Co., Ltd. Class H |
130,000 | 82,720 | ||||||
| Noah Holdings, Ltd. ADS (a) (c) |
40,892 | 1,313,042 | ||||||
| NQ Mobile, Inc. Class A, ADR (a) |
94,603 | 331,111 | ||||||
| Ourgame International Holdings, Ltd. (a) |
538,000 | 143,270 | ||||||
| Ozner Water International Holding, Ltd. (a) (b) (c) |
1,177,000 | 302,888 | ||||||
| Pacific Online, Ltd. (c) |
833,100 | 149,326 | ||||||
| Parkson Retail Group, Ltd. (c) |
2,577,000 | 435,510 | ||||||
| Poly Culture Group Corp., Ltd. Class H |
149,100 | 356,586 | ||||||
| Poly Property Group Co., Ltd. (a) |
1,879,000 | 964,675 | ||||||
| Powerlong Real Estate Holdings, Ltd. |
1,201,000 | 611,978 | ||||||
See accompanying notes to financial statements.
202
Table of Contents
SPDR S&P Emerging Markets Small Cap ETF
SCHEDULE OF INVESTMENTS (continued)
September 30, 2017
| Security Description |
Shares |
Value |
||||||
| PW Medtech Group, Ltd. (a) |
2,262,000 | $ | 483,637 | |||||
| Real Gold Mining, Ltd. (a) (c) (d) |
251,500 | — | ||||||
| Renren, Inc. ADR (a) (c) |
21,333 | 191,144 | ||||||
| Shandong Airlines Co., Ltd. Class B |
208,300 | 371,226 | ||||||
| Shandong Zhonglu Oceanic Fisheries Co., Ltd. Class B (a) |
90,900 | 64,474 | ||||||
| Shang Gong Group Co., Ltd. Class B (a) |
247,000 | 256,880 | ||||||
| Shanghai Chlor-Alkali Chemical Co., Ltd. Class B (a) |
408,800 | 320,499 | ||||||
| Shanghai Diesel Engine Co., Ltd. Class B |
365,960 | 294,598 | ||||||
| Shanghai Fudan-Zhangjiang Bio-Pharmaceutical Co., Ltd. Class H |
443,000 | 226,301 | ||||||
| Shanghai Greencourt Investment Group Co., Ltd. Class B (a) |
466,800 | 277,746 | ||||||
| Shanghai Haixin Group Co. Class B |
614,508 | 429,541 | ||||||
| Shanghai Highly Group Co., Ltd. Class B |
254,700 | 227,192 | ||||||
| Shanghai Jin Jiang International Hotels Group Co., Ltd. Class H |
962,000 | 359,640 | ||||||
| Shanghai Jinjiang International Industrial Investment Co., Ltd. Class B |
115,600 | 159,875 | ||||||
| Shanghai Jinjiang International Travel Co., Ltd. Class B |
97,400 | 306,810 | ||||||
| Shanghai Potevio Co., Ltd. Class B (a) |
79,800 | 66,473 | ||||||
| Shenwan Hongyuan HK, Ltd. (c) |
465,000 | 169,671 | ||||||
| Shenzhen China Bicycle Co. Holdings, Ltd. Class B (a) |
231,500 | 91,288 | ||||||
| Shenzhen Chiwan Petroleum Class B (a) |
40,300 | 105,410 | ||||||
| Shenzhen SEG Co., Ltd. Class B |
150,300 | 79,858 | ||||||
| Shougang Concord International Enterprises Co., Ltd. (a) |
8,550,000 | 251,770 | ||||||
| Shougang Fushan Resources Group, Ltd. |
2,792,000 | 632,701 | ||||||
| Shunfeng International Clean Energy, Ltd. (a) |
1,347,300 | 74,172 | ||||||
| Sichuan Expressway Co., Ltd. Class H |
1,466,000 | 589,351 | ||||||
| Silergy Corp. |
58,000 | 1,329,310 | ||||||
| Sinofert Holdings, Ltd. (a) (c) |
1,434,000 | 260,704 | ||||||
| Sinopec Kantons Holdings, Ltd. |
986,000 | 664,007 | ||||||
| Sinosoft Technology Group, Ltd. (c) |
651,200 | 188,423 | ||||||
| Sinotrans Shipping, Ltd. (c) |
1,945,000 | 560,289 | ||||||
| Sinovac Biotech, Ltd. (a) |
65,847 | 463,563 | ||||||
| Sohu.com, Inc. (a) |
27,756 | 1,511,314 | ||||||
| Springland International Holdings, Ltd. |
1,214,000 | 216,045 | ||||||
| Sun King Power Electronics Group |
1,009,000 | 223,484 | ||||||
| Tarena International, Inc. ADR (c) |
35,846 | 521,559 | ||||||
| Tian Ge Interactive Holdings, Ltd. (b) (c) |
664,000 | 483,716 | ||||||
| Tiangong International Co., Ltd. |
1,536,000 | 175,021 | ||||||
| Tianjin Development Holdings, Ltd. |
748,000 | 383,064 | ||||||
| Tianjin Port Development Holdings, Ltd. (a) |
3,652,000 | 579,779 | ||||||
| Tianjin ZhongXin Pharmaceutical Group Corp., Ltd. |
324,100 | 350,028 | ||||||
| Tianneng Power International, Ltd. |
886,000 | 915,413 | ||||||
| Tong Ren Tang Technologies Co., Ltd. Class H |
677,000 | 865,893 | ||||||
| Tuniu Corp. ADR (a) (c) |
81,579 | 637,948 | ||||||
| V1 Group, Ltd. (a) (c) |
2,048,999 | 70,830 | ||||||
| Virscend Education Co., Ltd. (b) |
928,000 | 570,295 | ||||||
| West China Cement, Ltd. (a) |
2,352,000 | 382,429 | ||||||
| Wisdom Sports Group (a) (c) |
1,119,000 | 181,947 | ||||||
| Xiamen International Port Co., Ltd. Class H |
1,878,000 | 355,850 | ||||||
| Yangtze Optical Fibre and Cable Joint Stock, Ltd. Co. Class H (b) |
157,500 | 600,906 | ||||||
| Yestar Healthcare Holdings Co., Ltd. (c) |
1,527,200 | 674,567 | ||||||
| YuanShengTai Dairy Farm, Ltd. (a) |
4,759,000 | 237,624 | ||||||
| Yuexiu Transport Infrastructure, Ltd. |
1,050,549 | 789,522 | ||||||
| Zhengzhou Coal Mining Machinery Group Co., Ltd. Class H |
220,600 | 144,606 | ||||||
| Zhonglu Co., Ltd. Class B |
92,200 | 147,981 | ||||||
|
|
|
|||||||
| 65,942,067 | ||||||||
|
|
|
|||||||
| COLOMBIA — 0.0% (e) |
| |||||||
| Avianca Holdings SA Preference Shares |
187,788 | 184,480 | ||||||
|
|
|
|||||||
| CYPRUS — 0.2% |
| |||||||
| Globaltrans Investment PLC GDR |
100,294 | 938,752 | ||||||
|
|
|
|||||||
| CZECH REPUBLIC — 0.6% |
||||||||
| Moneta Money Bank A/S (b) |
454,240 | 1,599,138 | ||||||
| Philip Morris CR A/S |
1,483 | 1,117,021 | ||||||
|
|
|
|||||||
| 2,716,159 | ||||||||
|
|
|
|||||||
| EGYPT — 0.8% |
||||||||
| Eastern Tobacco |
41,880 | 710,418 | ||||||
| Egypt Kuwait Holding Co. SAE |
536,837 | 365,049 | ||||||
| Egyptian Financial Group-Hermes Holding Co. |
389,130 | 488,562 | ||||||
| ElSewedy Electric Co. |
102,991 | 612,403 | ||||||
| Ezz Steel (a) |
368,774 | 384,235 | ||||||
| Global Telecom Holding SAE (a) |
1,489,242 | 541,696 | ||||||
| Juhayna Food Industries (a) |
458,419 | 216,613 | ||||||
| Orascom Telecom Media And Technology Holding SAE |
2,912,994 | 127,082 | ||||||
| Sidi Kerir Petrochemicals Co. |
125,411 | 144,880 | ||||||
| Six of October Development & Investment (a) |
414,958 | 342,076 | ||||||
|
|
|
|||||||
| 3,933,014 | ||||||||
|
|
|
|||||||
| GREECE — 1.0% |
||||||||
| Aegean Airlines SA |
50,423 | 482,245 | ||||||
| Aegean Marine Petroleum Network, Inc. |
39,052 | 193,308 | ||||||
| Costamare, Inc. |
40,695 | 251,495 | ||||||
| Diana Shipping, Inc. (a) |
63,559 | 230,719 | ||||||
| Ellaktor SA (a) |
93,056 | 172,717 | ||||||
| FF Group (a) |
23,369 | 508,057 | ||||||
| Grivalia Properties REIC AE |
45,188 | 464,765 | ||||||
| Hellenic Exchanges - Athens Stock Exchange SA (a) |
71,972 | 415,216 | ||||||
| Holding Co. ADMIE IPTO SA (a) |
124,063 | 269,868 | ||||||
| Mytilineos Holdings SA (a) |
88,808 | 876,656 | ||||||
| Public Power Corp. SA (a) |
104,412 | 245,637 | ||||||
See accompanying notes to financial statements.
203
Table of Contents
SPDR S&P Emerging Markets Small Cap ETF
SCHEDULE OF INVESTMENTS (continued)
September 30, 2017
| Security Description |
Shares |
Value |
||||||
| Star Bulk Carriers Corp. (a) |
18,065 | $ | 175,411 | |||||
| StealthGas, Inc. (a) |
60,932 | 201,685 | ||||||
| Tsakos Energy Navigation, Ltd. |
100,884 | 452,969 | ||||||
|
|
|
|||||||
| 4,940,748 | ||||||||
|
|
|
|||||||
| HONG KONG — 3.2% |
||||||||
| Ajisen China Holdings, Ltd. |
621,000 | 282,247 | ||||||
| Anxin-China Holdings, Ltd. (a) (d) |
2,248,000 | — | ||||||
| Beijing Enterprises Clean Energy Group, Ltd. (a) (c) |
18,043,885 | 436,618 | ||||||
| Beijing Enterprises Medical & Health Group, Ltd. (a) (c) |
2,087,600 | 114,928 | ||||||
| BEP International Holdings, Ltd. (a) |
7,160,000 | 149,421 | ||||||
| Carnival Group International Holdings, Ltd. (a) (c) |
5,690,000 | 302,322 | ||||||
| CGN Meiya Power Holdings Co., Ltd. (a) (b) . |
1,720,000 | 235,625 | ||||||
| China All Access Holdings, Ltd. (c) |
1,150,000 | 359,251 | ||||||
| China Animation Characters Co., Ltd. (c) |
952,000 | 368,090 | ||||||
| China Beidahuang Industry Group Holdings, Ltd. Class A (a) |
2,002,400 | 98,701 | ||||||
| China Chengtong Development Group, Ltd. (a) |
2,608,000 | 193,663 | ||||||
| China Financial International Investments, Ltd. (a) (c) |
2,640,000 | 79,767 | ||||||
| China First Capital Group, Ltd. (a) |
2,474,000 | 991,412 | ||||||
| China High Precision Automation Group, Ltd. (a) (d) |
1,226,000 | — | ||||||
| China High Speed Transmission Equipment Group Co., Ltd. (c) |
806,000 | 1,033,982 | ||||||
| China Lumena New Materials Corp. (a) (c) (d) |
4,181,298 | — | ||||||
| China Metal Recycling Holdings, Ltd. (a) (c) (d) |
693,675 | — | ||||||
| China Minsheng Drawin Technology Group, Ltd. (a) (c) |
1,480,000 | 49,266 | ||||||
| China NT Pharma Group Co., Ltd. |
850,400 | 222,108 | ||||||
| China Nuclear Energy Technology Corp., Ltd. (a) |
1,180,000 | 243,230 | ||||||
| China Oil & Gas Group, Ltd. |
4,428,000 | 300,465 | ||||||
| China Overseas Property Holdings, Ltd. (c) |
1,601,232 | 383,359 | ||||||
| China Soft Power Technology Holdings, Ltd. (a) (c) |
1,736,000 | 36,895 | ||||||
| Comba Telecom Systems Holdings, Ltd. |
1,030,575 | 196,597 | ||||||
| Concord New Energy Group, Ltd. |
7,500,000 | 345,680 | ||||||
| Dawnrays Pharmaceutical Holdings, Ltd. |
628,000 | 361,811 | ||||||
| Digital China Holdings, Ltd. (a) (c) |
843,000 | 474,887 | ||||||
| Glorious Property Holdings, Ltd. (a) |
1,794,000 | 199,826 | ||||||
| Golden Meditech Holdings, Ltd. (a) (c) |
652,000 | 91,823 | ||||||
| Greater China Financial Holdings, Ltd. (a) |
1,560,300 | 44,348 | ||||||
| Hengdeli Holdings, Ltd. |
1,948,400 | 106,017 | ||||||
| Hi Sun Technology China, Ltd. (a) (c) |
1,599,000 | 368,494 | ||||||
| Hua Han Health Industry Holdings, Ltd. (a) (c) (d) |
2,414,560 | 122,881 | ||||||
| Huabao International Holdings, Ltd. |
1,247,000 | 771,123 | ||||||
| Ju Teng International Holdings, Ltd. |
885,500 | 349,180 | ||||||
| MIE Holdings Corp. (a) |
1,822,754 | 168,024 | ||||||
| Munsun Capital Group, Ltd. (a) (c) |
2,402,000 | 27,677 | ||||||
| National Agricultural Holdings, Ltd. (a) (c) |
396,000 | 60,333 | ||||||
| Neo Telemedia, Ltd. |
4,336,000 | 136,563 | ||||||
| NetDragon Websoft Holdings, Ltd. (c) |
232,000 | 775,244 | ||||||
| NewOcean Energy Holdings, Ltd. (a) (c) |
1,480,000 | 403,600 | ||||||
| Pou Sheng International Holdings, Ltd. |
1,986,000 | 363,601 | ||||||
| Qianhai Health Holdings, Ltd. (a) (c) |
849,005 | 12,500 | ||||||
| Skyworth Digital Holdings, Ltd. |
1,638,000 | 836,752 | ||||||
| SSY Group, Ltd. |
1,771,562 | 809,719 | ||||||
| Tech Pro Technology Development, Ltd. (a) |
6,035,100 | 52,542 | ||||||
| Tibet Water Resources, Ltd. (a) (c) |
1,775,000 | 688,575 | ||||||
| Tongfang Kontafarma Holdings, Ltd. (a) |
1,815,553 | 139,467 | ||||||
| United Laboratories International Holdings, Ltd. (a) (c) |
886,500 | 660,559 | ||||||
| Universal Medical Financial & Technical Advisory Services Co., Ltd. (b) (c) |
850,900 | 704,844 | ||||||
| Vision Values Holdings, Ltd. (a) |
120,000 | 9,218 | ||||||
| Wasion Group Holdings, Ltd. (c) |
695,000 | 352,363 | ||||||
|
|
|
|||||||
| 15,515,598 | ||||||||
|
|
|
|||||||
| HUNGARY — 0.2% |
||||||||
| Magyar Telekom Telecommunications PLC |
512,878 | 936,830 | ||||||
|
|
|
|||||||
| INDIA — 13.0% |
||||||||
| Abbott India, Ltd. |
3,433 | 222,370 | ||||||
| Adani Power, Ltd. (a) |
758,475 | 343,125 | ||||||
| Aditya Birla Capital, Ltd. (a) |
200,000 | 562,615 | ||||||
| Aditya Birla Fashion and Retail, Ltd. (a) |
257,789 | 643,289 | ||||||
| AIA Engineering, Ltd. |
49,189 | 1,000,573 | ||||||
| Arvind, Ltd. |
167,749 | 950,971 | ||||||
| Bajaj Corp., Ltd. |
55,731 | 339,701 | ||||||
| Bajaj Hindusthan Sugar, Ltd. (a) |
904,905 | 188,406 | ||||||
| Balrampur Chini Mills, Ltd. |
356,579 | 878,346 | ||||||
| Bata India, Ltd. |
98,133 | 1,036,541 | ||||||
| Bharat Financial Inclusion, Ltd. (a) |
98,867 | 1,434,495 | ||||||
| Blue Dart Express, Ltd. |
6,052 | 383,369 | ||||||
| CARE Ratings, Ltd. |
19,688 | 410,759 | ||||||
| Ceat, Ltd. |
32,081 | 842,102 | ||||||
| CG Power and Industrial Solutions, Ltd. (a) |
507,765 | 612,163 | ||||||
| Chennai Super Kings Cricket, Ltd. (a) (d) |
418,560 | — | ||||||
| City Union Bank, Ltd. |
110,035 | 273,403 | ||||||
| Cyient, Ltd. |
42,279 | 330,653 | ||||||
| Dish TV India, Ltd. (a) |
546,397 | 626,115 | ||||||
| Dr Lal PathLabs, Ltd. (b) |
29,841 | 364,310 | ||||||
| eClerx Services, Ltd. |
17,348 | 331,330 | ||||||
| Eros International Media, Ltd. (a) |
77,250 | 249,182 | ||||||
| Escorts, Ltd. |
109,606 | 1,106,883 | ||||||
| Force Motors, Ltd. |
9,904 | 570,723 | ||||||
| Fortis Healthcare, Ltd. (a) |
216,539 | 477,367 | ||||||
See accompanying notes to financial statements.
204
Table of Contents
SPDR S&P Emerging Markets Small Cap ETF
SCHEDULE OF INVESTMENTS (continued)
September 30, 2017
| Security Description |
Shares |
Value |
||||||
| Gateway Distriparks, Ltd. |
177,230 | $ | 619,030 | |||||
| GE T&D India, Ltd. |
82,153 | 490,377 | ||||||
| GMR Infrastructure, Ltd. (a) |
2,348,656 | 589,681 | ||||||
| Godfrey Phillips India, Ltd. |
22,611 | 348,996 | ||||||
| Godrej Properties, Ltd. (a) |
72,654 | 689,334 | ||||||
| Gujarat Pipavav Port, Ltd. |
352,519 | 721,013 | ||||||
| Hexaware Technologies, Ltd. |
207,066 | 855,431 | ||||||
| Housing Development & Infrastructure, Ltd. (a) |
336,408 | 290,984 | ||||||
| IDFC, Ltd. |
837,402 | 756,380 | ||||||
| IFCI, Ltd. (a) |
930,338 | 329,008 | ||||||
| India Cements, Ltd. |
377,570 | 995,948 | ||||||
| Indiabulls Real Estate, Ltd. (a) |
428,395 | 1,448,096 | ||||||
| Indiabulls Ventures, Ltd. |
162,596 | 635,872 | ||||||
| Indian Hotels Co., Ltd. |
566,493 | 1,008,621 | ||||||
| Info Edge India, Ltd. |
79,923 | 1,352,769 | ||||||
| Ipca Laboratories, Ltd. |
64,115 | 478,654 | ||||||
| IRB Infrastructure Developers, Ltd. |
199,119 | 648,844 | ||||||
| Jain Irrigation Systems, Ltd. |
274,663 | 397,992 | ||||||
| Jaiprakash Associates, Ltd. (a) |
787,131 | 216,304 | ||||||
| Jammu & Kashmir Bank, Ltd. (a) |
404,948 | 455,350 | ||||||
| Jindal Steel & Power, Ltd. (a) |
281,747 | 580,790 | ||||||
| JSW Energy, Ltd. |
676,382 | 763,674 | ||||||
| Jubilant Foodworks, Ltd. |
51,246 | 1,091,253 | ||||||
| Jubilant Life Sciences, Ltd. |
99,993 | 1,009,191 | ||||||
| Just Dial, Ltd. (a) |
47,423 | 270,076 | ||||||
| Jyothy Laboratories, Ltd. |
48,900 | 302,855 | ||||||
| Kajaria Ceramics, Ltd. |
111,956 | 1,214,856 | ||||||
| Karur Vysya Bank, Ltd. |
438,120 | 967,191 | ||||||
| KPIT Technologies, Ltd. |
225,793 | 418,090 | ||||||
| Mahindra CIE Automotive, Ltd. (a) |
108,144 | 396,600 | ||||||
| MakeMyTrip, Ltd. (a) (c) |
34,229 | 984,084 | ||||||
| Manappuram Finance, Ltd. |
527,777 | 780,919 | ||||||
| Marksans Pharma, Ltd. |
522,768 | 340,135 | ||||||
| McLeod Russel India, Ltd. |
119,297 | 298,608 | ||||||
| Mindtree, Ltd. |
165,294 | 1,176,315 | ||||||
| Monsanto India, Ltd. |
6,619 | 248,121 | ||||||
| Mphasis, Ltd. |
79,649 | 754,422 | ||||||
| Natco Pharma, Ltd. |
80,558 | 970,655 | ||||||
| NCC, Ltd. |
847,333 | 1,076,030 | ||||||
| Oberoi Realty, Ltd. |
41,580 | 269,773 | ||||||
| PC Jeweller, Ltd. |
105,245 | 532,992 | ||||||
| Persistent Systems, Ltd. |
52,014 | 533,359 | ||||||
| Pfizer, Ltd. |
11,230 | 312,435 | ||||||
| Phoenix Mills, Ltd. |
31,896 | 244,567 | ||||||
| PI Industries, Ltd. |
103,426 | 1,172,489 | ||||||
| Prestige Estates Projects, Ltd. |
113,474 | 474,690 | ||||||
| PTC India, Ltd. |
406,123 | 763,812 | ||||||
| PVR, Ltd. |
51,269 | 945,714 | ||||||
| Redington India, Ltd. |
346,193 | 827,588 | ||||||
| Reliance Capital, Ltd. |
121,394 | 1,089,052 | ||||||
| Reliance Communications, Ltd. (a) |
1,020,769 | 300,042 | ||||||
| Reliance Home Finance, Ltd. (a) |
121,394 | 184,637 | ||||||
| Reliance Naval and Engineering, Ltd. (a) |
336,907 | 271,558 | ||||||
| Sadbhav Engineering, Ltd. |
83,147 | 374,174 | ||||||
| Schaeffler India, Ltd. |
3,773 | 282,452 | ||||||
| Sintex Industries, Ltd. |
460,375 | 188,534 | ||||||
| Sintex Plastics Technology, Ltd. (a) |
455,415 | 634,458 | ||||||
| SKF India, Ltd. |
24,295 | 564,714 | ||||||
| Strides Shasun, Ltd. |
62,444 | 846,512 | ||||||
| Sun Pharma Advanced Research Co., Ltd. (a) |
114,651 | 667,335 | ||||||
| Suzlon Energy, Ltd. (a) |
3,642,606 | 869,943 | ||||||
| Symphony, Ltd. |
35,820 | 742,256 | ||||||
| Tata Elxsi, Ltd. |
17,644 | 219,686 | ||||||
| Tata Global Beverages, Ltd. |
448,023 | 1,411,561 | ||||||
| Thermax, Ltd. |
57,618 | 838,645 | ||||||
| Torrent Power, Ltd. |
216,055 | 696,589 | ||||||
| Union Bank of India (a) |
334,961 | 649,461 | ||||||
| Unitech, Ltd. (a) |
1,799,577 | 190,096 | ||||||
| Videocon d2h, Ltd. ADR (a) |
51,062 | 454,452 | ||||||
| WABCO India, Ltd. |
5,967 | 547,147 | ||||||
| Welspun Corp., Ltd. |
208,659 | 422,621 | ||||||
| Welspun India, Ltd. |
299,296 | 313,179 | ||||||
| WNS Holdings, Ltd. ADR (a) |
57,595 | 2,102,217 | ||||||
|
|
|
|||||||
| 62,090,080 | ||||||||
|
|
|
|||||||
| INDONESIA — 3.0% |
||||||||
| Adhi Karya Persero Tbk PT |
3,470,091 | 515,271 | ||||||
| AKR Corporindo Tbk PT |
1,759,100 | 927,286 | ||||||
| Alam Sutera Realty Tbk PT |
16,824,100 | 472,159 | ||||||
| Bank Pembangunan Daerah Jawa Barat Dan Banten Tbk PT |
3,996,700 | 771,506 | ||||||
| Blue Bird Tbk PT |
659,405 | 238,911 | ||||||
| Bumitama Agri, Ltd. |
498,900 | 270,033 | ||||||
| Ciputra Development Tbk PT |
10,693,399 | 948,742 | ||||||
| Eagle High Plantations Tbk PT (a) |
2,606,900 | 49,935 | ||||||
| Gajah Tunggal Tbk PT |
1,864,100 | 94,804 | ||||||
| Garuda Indonesia Persero Tbk PT (a) |
8,971,300 | 222,467 | ||||||
| Global Mediacom Tbk PT |
3,433,800 | 144,042 | ||||||
| Indah Kiat Pulp & Paper Corp. Tbk PT |
2,267,600 | 705,416 | ||||||
| Indo Tambangraya Megah Tbk PT |
525,635 | 790,267 | ||||||
| Intiland Development Tbk PT |
5,561,900 | 170,132 | ||||||
| Japfa Comfeed Indonesia Tbk PT |
5,202,900 | 490,585 | ||||||
| Kawasan Industri Jababeka Tbk PT |
25,746,784 | 584,937 | ||||||
| Link Net Tbk PT |
1,624,000 | 623,966 | ||||||
| Lippo Cikarang Tbk PT (a) |
462,100 | 143,409 | ||||||
| Lippo Karawaci Tbk PT |
10,867,800 | 584,984 | ||||||
| Matahari Putra Prima Tbk PT (a) |
2,499,900 | 121,571 | ||||||
| Medco Energi Internasional Tbk PT (a) |
6,407,600 | 371,069 | ||||||
| Media Nusantara Citra Tbk PT |
7,059,400 | 691,841 | ||||||
| Mitra Adiperkasa Tbk PT |
906,600 | 471,171 | ||||||
| MNC Investama Tbk PT (a) |
11,811,400 | 87,693 | ||||||
| Modernland Realty Tbk PT |
5,595,200 | 121,301 | ||||||
| Pembangunan Perumahan Persero Tbk PT |
3,978,198 | 682,281 | ||||||
| Perusahaan Perkebunan London Sumatra Indonesia Tbk PT |
6,347,100 | 664,445 | ||||||
| Siloam International Hospitals Tbk PT (a) |
1,026,275 | 761,953 | ||||||
| Summarecon Agung Tbk PT |
7,828,100 | 618,971 | ||||||
| Surya Semesta Internusa Tbk PT |
3,074,900 | 133,552 | ||||||
| Timah Persero Tbk PT |
3,733,129 | 225,889 | ||||||
| Wijaya Karya Persero Tbk PT |
4,903,736 | 651,696 | ||||||
|
|
|
|||||||
| 14,352,285 | ||||||||
|
|
|
|||||||
| MALAYSIA — 4.8% |
| |||||||
| Aeon Co. M Bhd |
947,600 | 460,055 | ||||||
See accompanying notes to financial statements.
205
Table of Contents
SPDR S&P Emerging Markets Small Cap ETF
SCHEDULE OF INVESTMENTS (continued)
September 30, 2017
| Security Description |
Shares |
Value |
||||||
| Alliance Bank Malaysia Bhd |
511,200 | $ | 472,156 | |||||
| Berjaya Corp. Bhd (a) |
3,841,767 | 313,892 | ||||||
| Berjaya Sports Toto Bhd |
1,090,858 | 638,110 | ||||||
| Bermaz Auto Bhd |
810,560 | 405,040 | ||||||
| Bumi Armada Bhd (a) |
2,912,800 | 503,575 | ||||||
| Bursa Malaysia Bhd |
461,673 | 1,093,364 | ||||||
| Cahya Mata Sarawak Bhd |
549,100 | 521,466 | ||||||
| Carlsberg Brewery Malaysia Bhd Class B |
102,300 | 359,534 | ||||||
| Datasonic Group Bhd |
1,128,400 | 334,044 | ||||||
| DRB-Hicom Bhd |
1,004,900 | 387,919 | ||||||
| Eastern & Oriental Bhd |
1,210,352 | 452,897 | ||||||
| Evergreen Fibreboard Bhd |
1,575,150 | 294,699 | ||||||
| Felda Global Ventures Holdings Bhd |
1,671,100 | 668,836 | ||||||
| Gas Malaysia Bhd |
535,700 | 362,842 | ||||||
| Heineken Malaysia Bhd |
125,100 | 551,062 | ||||||
| IGB Real Estate Investment Trust |
1,043,600 | 432,516 | ||||||
| Inari Amertron Bhd |
1,329,386 | 799,678 | ||||||
| Karex Bhd |
701,100 | 250,719 | ||||||
| KNM Group Bhd (a) |
3,371,006 | 211,561 | ||||||
| KPJ Healthcare Bhd |
3,480,372 | 857,214 | ||||||
| Lafarge Malaysia Bhd |
240,200 | 384,548 | ||||||
| Magnum Bhd |
1,259,200 | 539,764 | ||||||
| Malaysia Building Society Bhd |
1,578,200 | 422,348 | ||||||
| Malaysian Resources Corp. Bhd |
1,518,900 | 381,299 | ||||||
| Media Prima Bhd |
1,417,700 | 270,278 | ||||||
| My EG Services Bhd |
2,654,250 | 1,288,623 | ||||||
| OSK Holdings Bhd |
1,002,100 | 379,718 | ||||||
| Padini Holdings Bhd |
521,600 | 562,056 | ||||||
| Pavilion Real Estate Investment Trust |
1,027,400 | 425,802 | ||||||
| Pos Malaysia Bhd |
639,100 | 794,618 | ||||||
| PureCircle, Ltd. (a) |
42,200 | 279,125 | ||||||
| QL Resources Bhd |
209,750 | 197,207 | ||||||
| Silverlake Axis, Ltd. |
854,900 | 371,436 | ||||||
| Sunway Real Estate Investment Trust |
2,108,500 | 858,880 | ||||||
| TIME dotCom Bhd |
229,600 | 482,853 | ||||||
| Top Glove Corp. Bhd |
805,500 | 1,058,739 | ||||||
| UEM Sunrise Bhd (a) |
1,069,600 | 288,773 | ||||||
| UMW Holdings Bhd (a) |
342,200 | 449,783 | ||||||
| UMW Oil & Gas Corp. Bhd (a) |
1,322,415 | 93,955 | ||||||
| Unisem M Bhd |
389,700 | 347,938 | ||||||
| UOA Development Bhd |
1,444,100 | 885,783 | ||||||
| VS Industry Bhd |
1,308,600 | 824,364 | ||||||
| WCT Holdings Bhd (a) |
1,292,389 | 535,626 | ||||||
| Yinson Holdings Bhd |
659,700 | 559,319 | ||||||
|
|
|
|||||||
| 23,054,014 | ||||||||
|
|
|
|||||||
| MEXICO — 2.2% |
| |||||||
| Asesor de Activos Prisma SAPI de CV (a) |
361,568 | 241,122 | ||||||
| Axtel SAB de CV (a) (c) |
1,533,553 | 364,825 | ||||||
| Bolsa Mexicana de Valores SAB de CV |
534,596 | 896,427 | ||||||
| Concentradora Fibra Hotelera Mexicana SA de CV |
433,782 | 335,861 | ||||||
| Concentradora Hipotecaria SAPI de CV REIT |
535,580 | 622,018 | ||||||
| Consorcio ARA SAB de CV Series (c) |
1,711,936 | 599,579 | ||||||
| Controladora Vuela Cia de Aviacion SAB de CV Class A (a) (c) |
712,706 | 846,962 | ||||||
| Corp. Inmobiliaria Vesta SAB de CV |
377,097 | 540,334 | ||||||
| Credito Real SAB de CV SOFOM ER (c) |
246,898 | 419,309 | ||||||
| Genomma Lab Internacional SAB de CV Class B (a) |
578,183 | 744,410 | ||||||
| Grupo Aeromexico SAB de CV (a) |
155,145 | 287,150 | ||||||
| Grupo GICSA SA de CV (a) |
388,950 | 255,098 | ||||||
| Hoteles City Express SAB de CV (a) (c) |
313,570 | 376,438 | ||||||
| Macquarie Mexico Real Estate Management SA de CV REIT (a) |
615,219 | 816,825 | ||||||
| Megacable Holdings SAB de CV (c) |
222,054 | 926,282 | ||||||
| PLA Administradora Industrial S de RL de CV (a) |
695,589 | 1,202,775 | ||||||
| Prologis Property Mexico SA de CV REIT |
348,094 | 693,533 | ||||||
| Qualitas Controladora SAB de CV (c) |
165,484 | 274,299 | ||||||
| TV Azteca SAB de CV (c) |
1,314,789 | 243,275 | ||||||
|
|
|
|||||||
| 10,686,522 | ||||||||
|
|
|
|||||||
| MONACO — 0.2% |
| |||||||
| GasLog, Ltd. (c) |
49,108 | 856,935 | ||||||
| Navios Maritime Holdings, Inc. (a) |
86,463 | 144,393 | ||||||
|
|
|
|||||||
| 1,001,328 | ||||||||
|
|
|
|||||||
| PAKISTAN — 1.1% |
| |||||||
| DG Khan Cement Co., Ltd. |
659,100 | 919,017 | ||||||
| Engro Corp., Ltd. |
236,800 | 681,431 | ||||||
| Engro Fertilizers, Ltd. |
498,500 | 297,751 | ||||||
| Fauji Fertilizer Co., Ltd. |
290,500 | 229,311 | ||||||
| Lucky Cement, Ltd. |
75,000 | 402,454 | ||||||
| Maple Leaf Cement Factory, Ltd. |
570,000 | 454,431 | ||||||
| Pakistan State Oil Co., Ltd. |
324,200 | 1,359,778 | ||||||
| SUI Northern Gas Pipeline (a) |
777,100 | 987,634 | ||||||
|
|
|
|||||||
| 5,331,807 | ||||||||
|
|
|
|||||||
| PERU — 0.6% |
||||||||
| Ferreycorp SAA |
1,855,782 | 1,210,107 | ||||||
| Grana y Montero SAA (a) |
356,171 | 335,836 | ||||||
| InRetail Peru Corp. (b) |
36,822 | 699,618 | ||||||
| Volcan Cia Minera SAA Class B |
1,960,163 | 702,094 | ||||||
|
|
|
|||||||
| 2,947,655 | ||||||||
|
|
|
|||||||
| PHILIPPINES — 1.4% |
||||||||
| Belle Corp. |
3,241,400 | 239,917 | ||||||
| Cebu Air, Inc. |
400,388 | 864,626 | ||||||
| CEMEX Holdings Philippines, Inc. (a) (b) |
3,847,905 | 381,007 | ||||||
| Cosco Capital, Inc. |
5,304,300 | 885,451 | ||||||
| D&L Industries, Inc. |
4,735,000 | 941,417 | ||||||
| First Gen Corp. |
1,401,300 | 521,906 | ||||||
| First Philippine Holdings Corp. |
332,960 | 445,371 | ||||||
| Manila Water Co., Inc. |
975,100 | 592,168 | ||||||
| Nickel Asia Corp. |
3,514,600 | 456,626 | ||||||
| Philex Mining Corp. |
1,374,600 | 225,404 | ||||||
| Rizal Commercial Banking Corp. |
521,880 | 509,557 | ||||||
| Robinsons Land Corp. |
1,144,800 | 570,152 | ||||||
| SM Prime Holdings, Inc. |
1 | 1 | ||||||
|
|
|
|||||||
| 6,633,603 | ||||||||
|
|
|
|||||||
See accompanying notes to financial statements.
206
Table of Contents
SPDR S&P Emerging Markets Small Cap ETF
SCHEDULE OF INVESTMENTS (continued)
September 30, 2017
| Security Description |
Shares |
Value |
||||||
| POLAND — 2.3% |
||||||||
| Alumetal SA |
11,651 | $ | 161,466 | |||||
| Asseco Poland SA |
85,865 | 1,090,764 | ||||||
| Boryszew SA (a) |
81,304 | 223,121 | ||||||
| Ciech SA (a) |
49,710 | 888,899 | ||||||
| Dino Polska SA (a) (b) |
38,935 | 708,939 | ||||||
| Emperia Holding SA (a) |
26,068 | 672,455 | ||||||
| Enea SA |
123,192 | 500,348 | ||||||
| Energa SA |
176,513 | 649,096 | ||||||
| Eurocash SA |
80,845 | 856,827 | ||||||
| Getin Noble Bank SA (a) |
310,214 | 123,440 | ||||||
| Globe Trade Centre SA |
351,959 | 910,817 | ||||||
| Grupa Azoty SA |
39,642 | 868,133 | ||||||
| Grupa Kety SA |
7,969 | 880,342 | ||||||
| KRUK SA |
14,068 | 1,132,907 | ||||||
| Lubelski Wegiel Bogdanka SA |
9,867 | 203,083 | ||||||
| Netia SA |
481,796 | 505,073 | ||||||
| PKP Cargo SA (a) |
16,340 | 257,838 | ||||||
| Synthos SA |
446,810 | 630,251 | ||||||
|
|
|
|||||||
| 11,263,799 | ||||||||
|
|
|
|||||||
| QATAR — 0.6% |
||||||||
| Al Meera Consumer Goods Co. QSC |
12,351 | 486,848 | ||||||
| Gulf Warehousing Co. |
17,606 | 206,538 | ||||||
| Medicare Group |
17,038 | 330,394 | ||||||
| Qatar First Bank (a) |
270,561 | 532,093 | ||||||
| Salam International Investment, Ltd. QSC |
93,936 | 203,830 | ||||||
| Vodafone Qatar QSC (a) |
427,370 | 997,774 | ||||||
|
|
|
|||||||
| 2,757,477 | ||||||||
|
|
|
|||||||
| RUSSIA — 0.7% |
| |||||||
| DIXY Group PJSC (a) |
26,446 | 156,174 | ||||||
| Etalon Group PLC GDR |
106,646 | 440,981 | ||||||
| LSR Group PJSC GDR |
194,305 | 571,257 | ||||||
| QIWI PLC ADR (c) |
37,564 | 636,334 | ||||||
| Ros Agro PLC GDR |
40,153 | 493,882 | ||||||
| Sistema PJSC FC GDR |
135,714 | 651,427 | ||||||
| TMK PJSC GDR |
75,216 | 359,157 | ||||||
|
|
|
|||||||
| 3,309,212 | ||||||||
|
|
|
|||||||
| SINGAPORE — 0.2% |
| |||||||
| Asian Pay Television Trust |
1,386,300 | 581,900 | ||||||
| SIIC Environment Holdings, Ltd. (c) |
1,054,560 | 415,471 | ||||||
|
|
|
|||||||
| 997,371 | ||||||||
|
|
|
|||||||
| SOUTH AFRICA — 5.3% |
| |||||||
| Adcock Ingram Holdings, Ltd. |
182,810 | 819,108 | ||||||
| Advtech, Ltd. |
433,199 | 567,867 | ||||||
| AECI, Ltd. |
84,700 | 636,073 | ||||||
| African Rainbow Minerals, Ltd. |
63,723 | 481,515 | ||||||
| Alexander Forbes Group Holdings, Ltd. |
784,394 | 392,124 | ||||||
| ArcelorMittal South Africa, Ltd. (a) |
256,806 | 87,488 | ||||||
| Arrowhead Properties, Ltd. Class A |
1,110,727 | 683,588 | ||||||
| Attacq, Ltd. (a) |
457,636 | 627,015 | ||||||
| Aveng, Ltd. (a) |
364,936 | 78,379 | ||||||
| Balwin Properties, Ltd. |
258,410 | 128,033 | ||||||
| Blue Label Telecoms, Ltd. |
400,000 | 518,422 | ||||||
| Coronation Fund Managers, Ltd. |
188,356 | 938,816 | ||||||
| Curro Holdings, Ltd. (a) (c) |
178,995 | 501,093 | ||||||
| DataTec, Ltd. |
278,977 | 1,183,263 | ||||||
| Dis-Chem Pharmacies, Ltd. (b) |
100,000 | 208,184 | ||||||
| Emira Property Fund, Ltd. (c) |
602,672 | 591,402 | ||||||
| EOH Holdings, Ltd. |
101,163 | 716,926 | ||||||
| Famous Brands, Ltd. (a) |
65,360 | 566,348 | ||||||
| Grindrod, Ltd. (a) |
601,638 | 614,894 | ||||||
| Harmony Gold Mining Co., Ltd. |
265,601 | 474,453 | ||||||
| Hosken Consolidated Investments, Ltd. |
101,586 | 984,148 | ||||||
| JSE, Ltd. |
99,853 | 915,889 | ||||||
| KAP Industrial Holdings, Ltd. |
1,238,441 | 776,863 | ||||||
| Lewis Group, Ltd. |
179,785 | 399,448 | ||||||
| Montauk Holdings, Ltd. |
1 | 2 | ||||||
| Mpact, Ltd. |
212,878 | 405,182 | ||||||
| Murray & Roberts Holdings, Ltd. |
330,387 | 391,497 | ||||||
| Nampak, Ltd. (a) |
494,153 | 644,110 | ||||||
| Net 1 UEPS Technologies, Inc. (a) |
73,028 | 711,293 | ||||||
| Northam Platinum, Ltd. (a) (c) |
385,191 | 1,333,085 | ||||||
| Omnia Holdings, Ltd. |
54,818 | 565,008 | ||||||
| PPC, Ltd. (a) |
1,283,183 | 600,609 | ||||||
| Reunert, Ltd. |
227,544 | 1,141,217 | ||||||
| SA Corporate Real Estate, Ltd. (c) |
2,588,465 | 937,426 | ||||||
| Sun International, Ltd. |
105,551 | 400,551 | ||||||
| Super Group, Ltd. (a) |
379,457 | 1,208,417 | ||||||
| Tongaat Hulett, Ltd. |
91,425 | 778,661 | ||||||
| Trencor, Ltd. |
96,645 | 271,987 | ||||||
| Tsogo Sun Holdings, Ltd. |
200,000 | 300,093 | ||||||
| Vukile Property Fund, Ltd. REIT |
607,633 | 889,680 | ||||||
| Wilson Bayly Holmes-Ovcon, Ltd. |
81,042 | 883,974 | ||||||
|
|
|
|||||||
| 25,354,131 | ||||||||
|
|
|
|||||||
| TAIWAN — 29.3% |
| |||||||
| A-DATA Technology Co., Ltd. |
229,652 | 623,281 | ||||||
| Ability Enterprise Co., Ltd. |
328,141 | 229,409 | ||||||
| AcBel Polytech, Inc. |
847,000 | 645,222 | ||||||
| Accton Technology Corp. |
479,341 | 1,541,213 | ||||||
| Acer, Inc. (a) |
2,127,000 | 1,062,658 | ||||||
| Adlink Technology, Inc. |
157,625 | 348,268 | ||||||
| Advanced Ceramic X Corp. |
51,642 | 718,669 | ||||||
| AGV Products Corp. (a) |
1,720,414 | 432,883 | ||||||
| Alpha Networks, Inc. |
426,513 | 338,971 | ||||||
| Altek Corp. |
205,516 | 187,732 | ||||||
| AmTRAN Technology Co., Ltd. |
850,717 | 460,090 | ||||||
| Arcadyan Technology Corp. |
198,172 | 319,569 | ||||||
| Asia Optical Co., Inc. |
206,540 | 759,438 | ||||||
| Asia Polymer Corp. |
828,028 | 517,449 | ||||||
| ASPEED Technology, Inc. |
17,000 | 392,989 | ||||||
| Aten International Co., Ltd. |
201,000 | 515,691 | ||||||
| Basso Industry Corp. |
108,800 | 303,179 | ||||||
| BES Engineering Corp. |
3,242,356 | 706,766 | ||||||
| Bizlink Holding, Inc. |
85,000 | 776,448 | ||||||
| Capital Securities Corp. |
1,937,730 | 648,594 | ||||||
| Career Technology MFG. Co., Ltd. |
340,726 | 261,241 | ||||||
| Casetek Holdings, Ltd. |
110,000 | 357,670 | ||||||
| Cathay Real Estate Development Co., Ltd. |
807,332 | 444,613 | ||||||
| Center Laboratories, Inc. (a) |
316,527 | 489,028 | ||||||
| Chang Wah Electromaterials, Inc. (c) |
70,419 | 318,144 | ||||||
| Charoen Pokphand Enterprise |
321,675 | 682,090 | ||||||
| Cheng Loong Corp. |
1,149,128 | 676,426 | ||||||
See accompanying notes to financial statements.
207
Table of Contents
SPDR S&P Emerging Markets Small Cap ETF
SCHEDULE OF INVESTMENTS (continued)
September 30, 2017
| Security Description |
Shares |
Value |
||||||
| Cheng Uei Precision Industry Co., Ltd. |
364,915 | $ | 504,821 | |||||
| Chicony Electronics Co., Ltd. |
439,310 | 1,043,079 | ||||||
| Chin-Poon Industrial Co., Ltd. |
286,000 | 548,912 | ||||||
| China Bills Finance Corp. |
906,394 | 442,377 | ||||||
| China Chemical & Pharmaceutical Co., Ltd. |
622,000 | 366,136 | ||||||
| China Man-Made Fiber Corp. |
1,843,899 | 516,856 | ||||||
| China Motor Corp. |
733,000 | 646,608 | ||||||
| China Petrochemical Development Corp. (a) (c) |
2,002,575 | 917,946 | ||||||
| China Steel Chemical Corp. (c) |
161,000 | 621,191 | ||||||
| China Synthetic Rubber Corp. |
599,373 | 887,477 | ||||||
| Chipbond Technology Corp. |
643,000 | 1,072,939 | ||||||
| ChipMOS TECHNOLOGIES, Inc. ADR |
35,214 | 680,334 | ||||||
| Chlitina Holding, Ltd. |
65,678 | 225,251 | ||||||
| Chong Hong Construction Co., Ltd. |
245,275 | 564,576 | ||||||
| Chroma ATE, Inc. |
326,680 | 1,152,709 | ||||||
| Chung Hung Steel Corp. (a) |
713,239 | 248,142 | ||||||
| Clevo Co. |
492,265 | 478,077 | ||||||
| CMC Magnetics Corp. (a) |
1,211,788 | 168,637 | ||||||
| Compeq Manufacturing Co., Ltd. |
939,000 | 1,020,316 | ||||||
| Coretronic Corp. |
427,652 | 499,943 | ||||||
| CTCI Corp. |
626,000 | 1,005,349 | ||||||
| Cub Elecparts, Inc. |
50,000 | 587,818 | ||||||
| CyberTAN Technology, Inc. |
488,210 | 297,041 | ||||||
| D-Link Corp. (a) |
927,054 | 336,288 | ||||||
| Darwin Precisions Corp. |
705,576 | 557,266 | ||||||
| Dynapack International Technology Corp. |
163,000 | 212,324 | ||||||
| E Ink Holdings, Inc. |
662,000 | 927,813 | ||||||
| Elan Microelectronics Corp. |
492,899 | 681,060 | ||||||
| Elite Material Co., Ltd. |
286,782 | 1,361,846 | ||||||
| Elite Semiconductor Memory Technology, Inc. |
283,674 | 376,997 | ||||||
| eMemory Technology, Inc. |
67,000 | 858,379 | ||||||
| Ennoconn Corp. |
38,000 | 545,113 | ||||||
| Epistar Corp. (a) |
865,572 | 1,101,803 | ||||||
| Eternal Materials Co., Ltd. (c) |
970,659 | 987,496 | ||||||
| Eva Airways Corp. |
54,060 | 26,385 | ||||||
| Everlight Chemical Industrial Corp. |
526,304 | 326,293 | ||||||
| Everlight Electronics Co., Ltd. |
590,503 | 932,763 | ||||||
| Excelsior Medical Co., Ltd. |
253,403 | 371,447 | ||||||
| Far Eastern Department Stores, Ltd. |
811,490 | 408,100 | ||||||
| Far Eastern International Bank |
3,135,096 | 978,037 | ||||||
| Faraday Technology Corp. |
255,385 | 354,561 | ||||||
| Farglory Land Development Co., Ltd. |
218,464 | 246,388 | ||||||
| Feng Hsin Steel Co., Ltd. |
435,270 | 756,455 | ||||||
| Firich Enterprises Co., Ltd. (a) |
188,792 | 308,801 | ||||||
| FLEXium Interconnect, Inc. |
254,099 | 972,018 | ||||||
| Formosa Taffeta Co., Ltd. |
897,000 | 902,206 | ||||||
| Formosan Rubber Group, Inc. |
345,610 | 174,378 | ||||||
| Gemtek Technology Corp. |
417,234 | 328,845 | ||||||
| Genius Electronic Optical Co., Ltd. (a) |
56,000 | 722,068 | ||||||
| GeoVision, Inc. |
153,720 | 203,277 | ||||||
| Giant Manufacturing Co., Ltd. |
168,000 | 789,474 | ||||||
| Gigabyte Technology Co., Ltd. |
465,000 | 586,540 | ||||||
| Gigastorage Corp. (a) |
383,114 | 223,622 | ||||||
| Ginko International Co., Ltd. |
39,000 | 266,868 | ||||||
| Gintech Energy Corp. (a) |
467,275 | 266,583 | ||||||
| Global Unichip Corp. |
102,669 | 651,754 | ||||||
| Gloria Material Technology Corp. |
521,909 | 345,943 | ||||||
| Goldsun Building Materials Co., Ltd. (a) |
1,701,041 | 511,591 | ||||||
| Gourmet Master Co., Ltd. |
75,200 | 799,763 | ||||||
| Grand Pacific Petrochemical |
931,000 | 698,465 | ||||||
| Grape King Bio, Ltd. |
114,000 | 687,970 | ||||||
| Great Wall Enterprise Co., Ltd. |
807,867 | 852,518 | ||||||
| HannStar Display Corp. |
2,110,599 | 817,819 | ||||||
| HannsTouch Solution, Inc. (a) |
631,511 | 213,461 | ||||||
| Hey Song Corp. |
280,770 | 287,955 | ||||||
| Highwealth Construction Corp. |
703,730 | 934,083 | ||||||
| Himax Technologies, Inc. ADR (c) |
90,734 | 991,723 | ||||||
| Hiwin Technologies Corp. |
1,900 | 16,761 | ||||||
| Ho Tung Chemical Corp. (a) |
1,471,351 | 439,600 | ||||||
| Hota Industrial Manufacturing Co., Ltd. |
196,680 | 927,491 | ||||||
| HTC Corp. (a) (c) |
515,000 | 1,287,330 | ||||||
| Huaku Development Co., Ltd. |
289,260 | 631,480 | ||||||
| Huang Hsiang Construction Corp. |
285,484 | 262,663 | ||||||
| Ibase Technology, Inc. |
332,817 | 577,304 | ||||||
| Ichia Technologies, Inc. (a) |
350,000 | 210,642 | ||||||
| Iron Force Industrial Co., Ltd. |
76,000 | 334,586 | ||||||
| ITE Technology, Inc. |
495,887 | 549,459 | ||||||
| Jess-Link Products Co., Ltd. (f) |
191,230 | 189,502 | ||||||
| Jih Sun Financial Holdings Co., Ltd. |
1,728,422 | 412,669 | ||||||
| KEE TAI Properties Co., Ltd. |
926,076 | 306,921 | ||||||
| Kenda Rubber Industrial Co., Ltd. (c) |
650,247 | 916,702 | ||||||
| Kerry TJ Logistics Co., Ltd. |
223,000 | 266,579 | ||||||
| King Slide Works Co., Ltd. |
54,000 | 735,457 | ||||||
| King Yuan Electronics Co., Ltd. |
1,104,656 | 1,083,746 | ||||||
| King’s Town Bank Co., Ltd. |
1,179,000 | 1,244,163 | ||||||
| Kinpo Electronics |
1,724,371 | 585,708 | ||||||
| Kinsus Interconnect Technology Corp. |
296,030 | 696,047 | ||||||
| Kuoyang Construction Co., Ltd. |
802,527 | 317,581 | ||||||
| Land Mark Optoelectronics Corp. |
20,000 | 246,010 | ||||||
| LCY Chemical Corp. |
670,862 | 893,775 | ||||||
| Lien Hwa Industrial Corp. |
714,000 | 694,598 | ||||||
| Lingsen Precision Industries, Ltd. |
744,694 | 427,308 | ||||||
| Long Chen Paper Co., Ltd. |
569,000 | 840,628 | ||||||
| Longwell Co. |
297,000 | 568,065 | ||||||
| Lotes Co., Ltd. |
67,000 | 408,752 | ||||||
| Lumax International Corp., Ltd. |
171,322 | 328,249 | ||||||
| Lung Yen Life Service Corp. |
178,000 | 407,374 | ||||||
| Makalot Industrial Co., Ltd. |
148,070 | 646,988 | ||||||
| Masterlink Securities Corp. |
1,449,329 | 399,086 | ||||||
| Medigen Biotechnology Corp. (a) |
189,000 | 277,666 | ||||||
| Mercuries & Associates Holding, Ltd. |
531,978 | 392,966 | ||||||
| Merida Industry Co., Ltd. |
192,000 | 835,774 | ||||||
| Merry Electronics Co., Ltd. |
149,000 | 938,498 | ||||||
| Micro-Star International Co., Ltd. |
542,000 | 1,165,361 | ||||||
| Microbio Co., Ltd. (a) |
486,723 | 338,671 | ||||||
| MIN AIK Technology Co., Ltd. |
251,000 | 224,314 | ||||||
| Mirle Automation Corp. (c) |
279,331 | 385,964 | ||||||
| Mitac Holdings Corp. |
689,412 | 835,506 | ||||||
| Motech Industries, Inc. (a) (c) |
430,728 | 325,276 | ||||||
| Nan Kang Rubber Tire Co., Ltd. |
763,204 | 682,061 | ||||||
| Nantex Industry Co., Ltd. |
632,004 | 460,602 | ||||||
See accompanying notes to financial statements.
208
Table of Contents
SPDR S&P Emerging Markets Small Cap ETF
SCHEDULE OF INVESTMENTS (continued)
September 30, 2017
| Security Description |
Shares |
Value |
||||||
| Neo Solar Power Corp. (a) (c) |
925,758 | $ | 473,198 | |||||
| OBI Pharma, Inc. (a) |
113,000 | 644,671 | ||||||
| Oriental Union Chemical Corp. (a) |
659,500 | 529,575 | ||||||
| Pan-International Industrial Corp. (c) |
466,539 | 376,167 | ||||||
| Parade Technologies, Ltd. |
57,000 | 906,015 | ||||||
| PChome Online, Inc. |
79,670 | 408,544 | ||||||
| PharmaEngine, Inc. |
98,197 | 501,930 | ||||||
| Phytohealth Corp. (a) |
439,511 | 376,840 | ||||||
| Pixart Imaging, Inc. |
100,060 | 386,064 | ||||||
| Portwell, Inc. (a) |
163,000 | 267,420 | ||||||
| Poya International Co., Ltd. |
46,300 | 552,717 | ||||||
| President Securities Corp. (a) |
1,258,943 | 591,609 | ||||||
| Primax Electronics, Ltd. |
381,000 | 942,323 | ||||||
| Prince Housing & Development Corp. |
1,682,996 | 624,380 | ||||||
| Promate Electronic Co., Ltd. |
355,000 | 328,379 | ||||||
| Qisda Corp. |
1,350,641 | 953,163 | ||||||
| Radiant Opto-Electronics Corp. (c) |
444,331 | 1,040,348 | ||||||
| Radium Life Tech Co., Ltd. (a) |
893,810 | 386,127 | ||||||
| Realtek Semiconductor Corp. |
416,053 | 1,433,767 | ||||||
| Ritek Corp. (a) |
1,795,045 | 303,673 | ||||||
| Ruentex Development Co., Ltd. (a) |
740,000 | 678,407 | ||||||
| Ruentex Industries, Ltd. (a) |
490,000 | 725,531 | ||||||
| Sampo Corp. (c) |
805,527 | 391,819 | ||||||
| Sanyang Motor Co., Ltd. |
764,945 | 537,308 | ||||||
| ScinoPharm Taiwan, Ltd. |
469,500 | 505,513 | ||||||
| Senao International Co., Ltd. |
154,911 | 263,600 | ||||||
| Sercomm Corp. |
223,000 | 600,815 | ||||||
| Shin Kong No.1 REIT |
449,000 | 211,144 | ||||||
| Shinkong Insurance Co., Ltd. |
377,841 | 328,947 | ||||||
| Shinkong Synthetic Fibers Corp. |
2,370,796 | 711,458 | ||||||
| Sigurd Microelectronics Corp. |
858,694 | 712,180 | ||||||
| Silicon Integrated Systems Corp. (a) |
900,299 | 222,373 | ||||||
| Silicon Motion Technology Corp. ADR (c) |
28,288 | 1,358,673 | ||||||
| Simplo Technology Co., Ltd. |
109,277 | 580,187 | ||||||
| Sinbon Electronics Co., Ltd. |
350,444 | 926,844 | ||||||
| Sinmag Equipment Corp. |
66,726 | 338,867 | ||||||
| Sino-American Silicon Products, Inc. (a) (c) |
400,058 | 829,826 | ||||||
| Sinon Corp. |
796,662 | 454,500 | ||||||
| Sinphar Pharmaceutical Co., Ltd. |
407,879 | 295,915 | ||||||
| Sinyi Realty, Inc. |
591,611 | 631,138 | ||||||
| Soft-World International Corp. |
99,848 | 217,648 | ||||||
| Solartech Energy Corp. (a) |
422,207 | 183,786 | ||||||
| St Shine Optical Co., Ltd. |
37,000 | 783,340 | ||||||
| Synnex Technology International Corp. |
1,015,000 | 1,218,375 | ||||||
| Systex Corp. |
275,000 | 517,824 | ||||||
| Taichung Commercial Bank Co., Ltd. |
2,505,405 | 797,294 | ||||||
| Taiflex Scientific Co., Ltd. |
295,699 | 461,237 | ||||||
| Tainan Enterprises Co., Ltd. |
310,000 | 246,884 | ||||||
| Tainan Spinning Co., Ltd. |
1,528,105 | 675,261 | ||||||
| Taisun Enterprise Co., Ltd. (a) (c) |
705,549 | 422,296 | ||||||
| Taiwan Acceptance Corp. |
208,000 | 696,214 | ||||||
| Taiwan Business Bank |
4,034,648 | 1,099,004 | ||||||
| Taiwan Cogeneration Corp. |
667,469 | 511,761 | ||||||
| Taiwan Fertilizer Co., Ltd. |
622,000 | 805,088 | ||||||
| Taiwan Glass Industry Corp. (a) |
890,000 | 453,453 | ||||||
| Taiwan Hon Chuan Enterprise Co., Ltd. |
380,218 | 689,618 | ||||||
| Taiwan Land Development Corp. (a) |
851,781 | 287,916 | ||||||
| Taiwan Paiho, Ltd. |
202,000 | 929,264 | ||||||
| Taiwan Secom Co., Ltd. |
348,961 | 1,024,190 | ||||||
| Taiwan Surface Mounting Technology Corp. |
530,308 | 452,066 | ||||||
| Taiwan Union Technology Corp. |
212,000 | 562,089 | ||||||
| Taiyen Biotech Co., Ltd. |
427,979 | 395,885 | ||||||
| Tatung Co., Ltd. (a) (c) |
1,562,691 | 639,011 | ||||||
| Teco Electric and Machinery Co., Ltd. |
1,671,000 | 1,496,097 | ||||||
| Test Rite International Co., Ltd. |
471,896 | 348,584 | ||||||
| Thye Ming Industrial Co., Ltd. |
273,218 | 335,170 | ||||||
| Ton Yi Industrial Corp. |
690,000 | 316,284 | ||||||
| Tong Hsing Electronic Industries, Ltd. |
136,327 | 561,960 | ||||||
| Tong Yang Industry Co., Ltd. |
388,872 | 793,800 | ||||||
| Topco Scientific Co., Ltd. |
261,384 | 637,858 | ||||||
| TPK Holding Co., Ltd. (a) (c) |
217,000 | 699,861 | ||||||
| Transcend Information, Inc. |
194,484 | 549,640 | ||||||
| Tripod Technology Corp. |
448,353 | 1,552,469 | ||||||
| TSRC Corp. (c) |
649,028 | 684,900 | ||||||
| TTY Biopharm Co., Ltd. |
210,436 | 616,235 | ||||||
| Tung Ho Steel Enterprise Corp. |
635,258 | 505,919 | ||||||
| Tung Thih Electronic Co., Ltd. |
38,893 | 253,951 | ||||||
| TXC Corp. |
440,120 | 570,397 | ||||||
| U-Ming Marine Transport Corp. (a) |
413,000 | 467,151 | ||||||
| Unimicron Technology Corp. |
1,149,000 | 619,514 | ||||||
| Unity Opto Technology Co., Ltd. |
687,307 | 273,119 | ||||||
| Unizyx Holding Corp. |
516,694 | 240,251 | ||||||
| UPC Technology Corp. |
845,536 | 448,923 | ||||||
| USI Corp. |
1,422,344 | 698,883 | ||||||
| Visual Photonics Epitaxy Co., Ltd. |
210,371 | 418,328 | ||||||
| Voltronic Power Technology Corp. |
42,000 | 753,463 | ||||||
| Wafer Works Corp. (a) |
461,872 | 403,628 | ||||||
| Walsin Lihwa Corp. |
2,400,000 | 1,096,161 | ||||||
| Walsin Technology Corp. |
287,000 | 711,727 | ||||||
| Wan Hai Lines, Ltd. |
1,004,320 | 612,713 | ||||||
| Waterland Financial Holdings Co., Ltd. |
2,098,547 | 628,374 | ||||||
| Wei Chuan Foods Corp. (a) |
588,899 | 367,042 | ||||||
| Wistron NeWeb Corp. |
250,872 | 719,755 | ||||||
| WT Microelectronics Co., Ltd. |
408,000 | 645,152 | ||||||
| WUS Printed Circuit Co., Ltd. (a) |
352,750 | 230,909 | ||||||
| Yang Ming Marine Transport Corp. (a) (c) |
490,600 | 203,850 | ||||||
| Yeong Guan Energy Technology Group Co., Ltd. |
90,000 | 219,628 | ||||||
| YFY, Inc. (a) |
1,854,941 | 746,283 | ||||||
| Yieh Phui Enterprise Co., Ltd. |
1,151,079 | 427,043 | ||||||
| Yungtay Engineering Co., Ltd. |
373,000 | 693,748 | ||||||
| Zenitron Corp. |
413,348 | 249,448 | ||||||
| Zhen Ding Technology Holding, Ltd. |
428,000 | 866,614 | ||||||
| Zinwell Corp. (c) |
494,674 | 451,869 | ||||||
|
|
|
|||||||
| 140,372,848 | ||||||||
|
|
|
|||||||
| THAILAND — 6.1% |
| |||||||
| Bangkok Chain Hospital PCL NVDR |
1,750,700 | 797,920 | ||||||
| Bangkok Land PCL NVDR |
13,605,900 | 734,351 | ||||||
| Beauty Community PCL (f) |
2,181,600 | 1,046,645 | ||||||
| BEC World PCL NVDR |
964,300 | 471,307 | ||||||
| Carabao Group PCL Class F (f) |
423,821 | 1,108,797 | ||||||
| Central Plaza Hotel PCL NVDR |
847,500 | 1,130,847 | ||||||
See accompanying notes to financial statements.
209
Table of Contents
SPDR S&P Emerging Markets Small Cap ETF
SCHEDULE OF INVESTMENTS (continued)
September 30, 2017
| Security Description |
Shares |
Value |
||||||
| Chularat Hospital PCL NVDR |
6,941,000 | $ | 511,990 | |||||
| CPN Retail Growth Leasehold Property Fund |
1,327,300 | 859,661 | ||||||
| Dynasty Ceramic PCL NVDR |
3,565,420 | 425,498 | ||||||
| Esso Thailand PCL NVDR (a) |
1,459,500 | 590,802 | ||||||
| GFPT PCL (f) |
273,200 | 163,019 | ||||||
| Group Lease PCL NVDR |
716,579 | 502,787 | ||||||
| Gunkul Engineering PCL NVDR |
5,810,470 | 700,392 | ||||||
| Hana Microelectronics PCL (f) |
1,004,857 | 1,431,206 | ||||||
| Ichitan Group PCL NVDR |
1,360,300 | 326,309 | ||||||
| Inter Far East Energy Corp. NVDR (a) (d) |
283,900 | — | ||||||
| International Engineering PCL (a) (d) |
63,855,934 | — | ||||||
| Jasmine International PCL NVDR |
2,591,725 | 637,246 | ||||||
| KCE Electronics PCL NVDR |
357,300 | 1,071,364 | ||||||
| Kiatnakin Bank PCL NVDR |
457,700 | 957,259 | ||||||
| LPN Development PCL NVDR |
813,200 | 302,359 | ||||||
| Major Cineplex Group PCL NVDR |
963,200 | 880,888 | ||||||
| MK Restaurants Group PCL NVDR |
512,800 | 934,111 | ||||||
| Precious Shipping PCL (a) (f) |
552,600 | 187,238 | ||||||
| Pruksa Holding PCL NVDR |
1,212,831 | 854,619 | ||||||
| PTG Energy PCL NVDR |
715,200 | 488,952 | ||||||
| Robinson PCL NVDR |
580,100 | 1,121,932 | ||||||
| Siam Global House PCL NVDR |
1,598,513 | 771,696 | ||||||
| Sino-Thai Engineering & Construction PCL NVDR |
1,159,600 | 895,343 | ||||||
| Sri Trang Agro-Industry PCL NVDR |
822,100 | 313,064 | ||||||
| Srisawad Corp. PCL NVDR |
723,980 | 1,302,513 | ||||||
| Supalai PCL NVDR |
778,800 | 541,774 | ||||||
| Tesco Lotus Retail Growth Freehold & Leasehold Property Fund |
1,677,400 | 890,254 | ||||||
| Thai Airways International PCL NVDR (a) |
801,200 | 437,237 | ||||||
| Thai Vegetable Oil PCL NVDR |
421,600 | 363,448 | ||||||
| Thaicom PCL NVDR |
629,200 | 313,185 | ||||||
| Thoresen Thai Agencies PCL (f) |
2,864,506 | 846,038 | ||||||
| Tipco Asphalt PCL NVDR |
865,900 | 625,733 | ||||||
| Tisco Financial Group PCL (f) |
290,103 | 669,803 | ||||||
| TPI Polene PCL (f) |
974,800 | 65,474 | ||||||
| TPI Polene Power PCL NVDR |
4,025,600 | 917,378 | ||||||
| TTW PCL (f) |
1,541,800 | 499,294 | ||||||
| VGI Global Media PCL NVDR |
3,583,912 | 617,916 | ||||||
| WHA Corp. PCL NVDR |
8,927,630 | 952,994 | ||||||
|
|
|
|||||||
| 29,260,643 | ||||||||
|
|
|
|||||||
| TURKEY — 1.7% |
| |||||||
| Afyon Cimento Sanayi TAS (a) |
282,774 | 627,397 | ||||||
| AKIS Gayrimenkul Yatirimi A/S REIT |
295,484 | 257,586 | ||||||
| Albaraka Turk Katilim Bankasi A/S |
1,529,847 | 606,587 | ||||||
| Aygaz A/S |
113,709 | 481,555 | ||||||
| Dogan Sirketler Grubu Holding A/S (a) |
930,875 | 227,739 | ||||||
| Ihlas Holding A/S (a) |
1,023,296 | 169,777 | ||||||
| Kardemir Karabuk Demir Celik Sanayi ve Ticaret A/S Class D (a) |
1,358,530 | 867,204 | ||||||
| Koza Altin Isletmeleri A/S (a) |
79,113 | 694,110 | ||||||
| Koza Anadolu Metal Madencilik Isletmeleri A/S (a) |
167,090 | 331,727 | ||||||
| Migros Ticaret A/S (a) |
135,313 | 979,432 | ||||||
| NET Holding A/S (a) |
261,030 | 168,828 | ||||||
| Pegasus Hava Tasimaciligi A/S (a) |
38,303 | 268,415 | ||||||
| Sinpas Gayrimenkul Yatirim Ortakligi A/S (a) |
469,836 | 96,448 | ||||||
| Tekfen Holding A/S |
232,165 | 764,504 | ||||||
| Torunlar Gayrimenkul Yatirim Ortakligi A/S |
187,220 | 346,947 | ||||||
| Turkiye Sinai Kalkinma Bankasi A/S |
1,734,335 | 677,913 | ||||||
| Yazicilar Holding A/S Class A |
85,962 | 473,068 | ||||||
|
|
|
|||||||
| 8,039,237 | ||||||||
|
|
|
|||||||
| UNITED ARAB EMIRATES — 0.9% |
| |||||||
| Air Arabia PJSC |
1,745,367 | 541,766 | ||||||
| Ajman Bank PJSC (a) |
592,627 | 185,567 | ||||||
| Al Waha Capital PJSC |
1,056,398 | 494,739 | ||||||
| Arabtec Holding PJSC (a) |
748,942 | 587,301 | ||||||
| Dana Gas PJSC (a) |
2,857,920 | 591,404 | ||||||
| DXB Entertainments PJSC (a) |
2,695,207 | 557,733 | ||||||
| Eshraq Properties Co. PJSC (a) |
1,617,705 | 339,165 | ||||||
| National Central Cooling Co. PJSC |
635,102 | 356,230 | ||||||
| RAK Properties PJSC |
2,599,495 | 488,381 | ||||||
|
|
|
|||||||
| 4,142,286 | ||||||||
|
|
|
|||||||
| UNITED KINGDOM — 0.0% (e) |
| |||||||
| Pan African Resources PLC |
1,138,614 | 189,734 | ||||||
|
|
|
|||||||
| UNITED STATES — 0.2% |
| |||||||
| Luxoft Holding, Inc. (a) |
22,826 | 1,091,083 | ||||||
|
|
|
|||||||
| TOTAL COMMON STOCKS (Cost $529,539,474) |
478,072,945 | |||||||
|
|
|
|||||||
| WARRANTS — 0.0% (e) |
| |||||||
| THAILAND — 0.0% (e) |
| |||||||
| International Engineering PCL (expiring 5/22/19) (a) (d) |
13,635,806 | — | ||||||
| Supalai PCL |
194,700 | 112,091 | ||||||
| Superblock PCL (expiring 8/31/20) (a) |
2,640,860 | 32,466 | ||||||
|
|
|
|||||||
| 144,557 | ||||||||
|
|
|
|||||||
| TOTAL WARRANTS |
144,557 | |||||||
|
|
|
|||||||
| RIGHTS — 0.0% (e) |
| |||||||
| BRAZIL — 0.0% (e) |
| |||||||
| Cosan Logistica SA |
16,373 | 5,279 | ||||||
| Ser Educacional SA |
6,109 | 4,616 | ||||||
|
|
|
|||||||
| 9,895 | ||||||||
|
|
|
|||||||
| MALAYSIA — 0.0% (e) |
| |||||||
| UMW Oil & Gas Corp. Bhd (expiring 10/10/17) (a) |
3,702,762 | 4,385 | ||||||
|
|
|
|||||||
| THAILAND — 0.0% (e) |
| |||||||
| Sri Trang Agro-Industry PCL (expiring 10/4/17) (a) (f) |
90,480 | 7,325 | ||||||
|
|
|
|||||||
| TOTAL RIGHTS |
21,605 | |||||||
|
|
|
|||||||
| SHORT-TERM INVESTMENTS — 3.5% |
| |||||||
| State Street Institutional U.S. Government Money Market Fund, Class G Shares 0.96% (g) (h) |
379,285 | 379,285 | ||||||
See accompanying notes to financial statements.
210
Table of Contents
SPDR S&P Emerging Markets Small Cap ETF
SCHEDULE OF INVESTMENTS (continued)
September 30, 2017
| Security Description |
Shares |
Value |
||||||
| State Street Navigator Securities Lending Government Money Market Portfolio (g) (i) |
16,261,252 | $ | 16,261,252 | |||||
|
|
|
|||||||
| TOTAL SHORT-TERM INVESTMENTS |
16,640,537 | |||||||
|
|
|
|||||||
| TOTAL INVESTMENTS — 103.2% |
494,879,644 | |||||||
| LIABILITIES IN EXCESS OF OTHER ASSETS — (3.2)% |
(15,541,263 | ) | ||||||
|
|
|
|||||||
| NET ASSETS — 100.0% |
$ | 479,338,381 | ||||||
|
|
|
|||||||
| (a) | Non-income producing security. |
| (b) | Securities purchased pursuant to Rule 144A of the Securities Act of 1933, as amended. These securities, which represent 1.7% of net assets as of September 30, 2017, are considered liquid and may be resold in transactions exempt from registration, normally to qualified institutional buyers. |
| (c) | All or a portion of the shares of the security are on loan at September 30, 2017. |
| (d) | Fair valued as determined in good faith by the Trust’s Oversight Committee in accordance with policy and procedures approved by the Board of Trustees. Security value is determined based on Level 3 inputs. As of September 30, 2017, total aggregate fair value of the security is $290,126, representing 0.1% of the Fund’s net assets. |
| (e) | Amount is less than 0.05% of net assets. |
| (f) | Fair valued as determined in good faith by the Trust’s Oversight Committee in accordance with policy and procedures approved by the Board of Trustees. As of September 30, 2017, total aggregate fair value of securities is $6,326,432 representing 1.3% of net assets. |
| (g) | The Fund invested in certain money market funds managed by SSGA Funds Management, Inc. Amounts related to these transactions during the period ended September 30, 2017 are shown in the Affiliate Table below. |
| (h) | The rate shown is the annualized seven-day yield at September 30, 2017. |
| (i) | Investment of cash collateral for securities loaned. |
ADR = American Depositary Receipt
ADS = American Depositary Shares
GDR = Global Depositary Receipt
NVDR = Non Voting Depositary Receipt
REIC = Real Estate Investment Company
REIT = Real Estate Investment Trust
The following table summarizes the value of the Fund’s investments according to the fair value hierarchy as of September 30, 2017.
| Description |
Level 1 — Quoted Prices |
Level 2 — Other Significant Observable Inputs |
Level 3 — Significant Unobservable Inputs |
Total | ||||||||||||
| ASSETS: |
||||||||||||||||
| INVESTMENTS: |
||||||||||||||||
| Common Stocks |
||||||||||||||||
| Brazil |
$ | 23,091,969 | $ | — | $ | — | $ | 23,091,969 | ||||||||
| Chile |
6,998,213 | — | — | 6,998,213 | ||||||||||||
| China |
65,774,822 | — | 167,245 | 65,942,067 | ||||||||||||
| Colombia |
184,480 | — | — | 184,480 | ||||||||||||
| Cyprus |
938,752 | — | — | 938,752 | ||||||||||||
| Czech Republic |
2,716,159 | — | — | 2,716,159 | ||||||||||||
| Egypt |
3,933,014 | — | — | 3,933,014 | ||||||||||||
| Greece |
4,940,748 | — | — | 4,940,748 | ||||||||||||
| Hong Kong |
15,332,384 | 60,333 | 122,881 | 15,515,598 | ||||||||||||
| Hungary |
936,830 | — | — | 936,830 | ||||||||||||
| India |
61,455,622 | 634,458 | 0 | (a) | 62,090,080 | |||||||||||
| Indonesia |
14,352,285 | — | — | 14,352,285 | ||||||||||||
| Malaysia |
23,054,014 | — | — | 23,054,014 | ||||||||||||
| Mexico |
10,686,522 | — | — | 10,686,522 | ||||||||||||
| Monaco |
1,001,328 | — | — | 1,001,328 | ||||||||||||
| Pakistan |
5,331,807 | — | — | 5,331,807 | ||||||||||||
| Peru |
2,947,655 | — | — | 2,947,655 | ||||||||||||
| Philippines |
6,633,603 | — | — | 6,633,603 | ||||||||||||
| Poland |
11,263,799 | — | — | 11,263,799 | ||||||||||||
| Qatar |
2,757,477 | — | — | 2,757,477 | ||||||||||||
| Russia |
3,309,212 | — | — | 3,309,212 | ||||||||||||
| Singapore |
997,371 | — | — | 997,371 | ||||||||||||
| South Africa |
25,354,131 | — | — | 25,354,131 | ||||||||||||
| Taiwan |
140,183,346 | 189,502 | — | 140,372,848 | ||||||||||||
See accompanying notes to financial statements.
211
Table of Contents
SPDR S&P Emerging Markets Small Cap ETF
SCHEDULE OF INVESTMENTS (continued)
September 30, 2017
| Description |
Level 1 — Quoted Prices |
Level 2 — Other Significant Observable Inputs |
Level 3 — Significant Unobservable Inputs |
Total | ||||||||||||
| Thailand |
$ | 23,243,129 | $ | 6,017,514 | $ | 0 | (a) | $ | 29,260,643 | |||||||
| Turkey |
8,039,237 | — | — | 8,039,237 | ||||||||||||
| United Arab Emirates |
4,142,286 | — | — | 4,142,286 | ||||||||||||
| United Kingdom |
189,734 | — | — | 189,734 | ||||||||||||
| United States |
1,091,083 | — | — | 1,091,083 | ||||||||||||
| Warrants |
||||||||||||||||
| Thailand |
32,466 | 112,091 | 0 | (a) | 144,557 | |||||||||||
| Rights |
||||||||||||||||
| Brazil |
9,895 | — | — | 9,895 | ||||||||||||
| Malaysia |
4,385 | — | — | 4,385 | ||||||||||||
| Thailand |
— | 7,325 | — | 7,325 | ||||||||||||
| Short-Term Investments |
16,640,537 | — | — | 16,640,537 | ||||||||||||
|
|
|
|
|
|
|
|
|
|||||||||
| TOTAL INVESTMENTS |
$ | 487,568,295 | $ | 7,021,223 | $ | 290,126 | $ | 494,879,644 | ||||||||
|
|
|
|
|
|
|
|
|
|||||||||
| (a) | Fund held Level 3 securities that were valued at $0 at September 30, 2017. |
Affiliate Table
| Number of Shares Held at 9/30/16 |
Value at 9/30/16 |
Cost of Purchases |
Proceeds from Shares Sold |
Realized Gain (Loss) |
Change in Unrealized Appreciation/ Depreciation |
Number of Shares Held at 9/30/17 |
Value at 9/30/17 |
Dividend Income |
||||||||||||||||||||||||||||
| State Street Institutional Liquid Reserves Fund, Premier Class |
1,009,858 | $ | 1,009,858 | $ | 556,842 | $ | 1,566,700 | $ | — | $ | — | — | $ | — | $ | 56 | ||||||||||||||||||||
| State Street Institutional U.S. Government Money Market Fund, Class G Shares |
— | — | 11,284,298 | 10,905,013 | — | — | 379,285 | 379,285 | 4,397 | |||||||||||||||||||||||||||
| State Street Institutional U.S. Government Money Market Fund, Premier Class |
— | — | 31,615,132 | 31,615,132 | — | — | — | — | 3,132 | |||||||||||||||||||||||||||
| State Street Navigator Securities Lending Government Money Market Portfolio* |
14,070,192 | 14,070,192 | 53,344,753 | 51,153,693 | — | — | 16,261,252 | 16,261,252 | 457,009 | |||||||||||||||||||||||||||
|
|
|
|
|
|
|
|
|
|
|
|
|
|
|
|||||||||||||||||||||||
| TOTAL |
$ | 15,080,050 | $ | 96,801,025 | $ | 95,240,538 | $ | — | $ | — | $ | 16,640,537 | $ | 464,594 | ||||||||||||||||||||||
|
|
|
|
|
|
|
|
|
|
|
|
|
|
|
|||||||||||||||||||||||
| * | Effective October 5, 2016, the name of State Street Navigator Securities Lending Prime Portfolio was changed to State Street Navigator Securities Lending Government Money Market Portfolio. |
See accompanying notes to financial statements.
212
Table of Contents
[This Page Intentionally Left Blank]
213
Table of Contents
SPDR INDEX SHARES FUNDS
STATEMENTS OF ASSETS AND LIABILITIES
September 30, 2017
| SPDR STOXX Europe 50 ETF |
SPDR EURO STOXX Small Cap ETF |
SPDR S&P Emerging Asia Pacific ETF |
||||||||||
| ASSETS |
||||||||||||
| Investments in unaffiliated issuers, at value* (Note 2) |
$ | 316,776,043 | $ | 18,758,251 | $ | 410,443,267 | ||||||
| Investments in affiliated issuers, at value (Notes 2 and 4) |
205,031 | 720 | 7,837,275 | |||||||||
|
|
|
|
|
|
|
|||||||
| Total Investments |
316,981,074 | 18,758,971 | 418,280,542 | |||||||||
| Foreign currency, at value |
511,321 | 2,634 | 1,179,692 | |||||||||
| Cash |
— | — | — | |||||||||
| Receivable for investments sold |
— | — | 43,432 | |||||||||
| Foreign currency contracts sold |
— | — | 41,683 | |||||||||
| Dividends receivable — unaffiliated issuers (Note 2) |
327,712 | 5,024 | 545,019 | |||||||||
| Dividends receivable — affiliated issuers (Notes 2 and 4) |
107 | — | 1,256 | |||||||||
| Securities lending income receivable — unaffiliated issuers (Note 9) |
89 | — | 10,705 | |||||||||
| Securities lending income receivable — affiliated issuers (Notes 4 and 9) |
294 | — | 10,437 | |||||||||
| Receivable for foreign taxes recoverable |
191,475 | 19,341 | — | |||||||||
| Other Receivable |
— | 354 | — | |||||||||
|
|
|
|
|
|
|
|||||||
| TOTAL ASSETS |
318,012,072 | 18,786,324 | 420,112,766 | |||||||||
|
|
|
|
|
|
|
|||||||
| LIABILITIES |
||||||||||||
| Due to custodian (Note 4) |
— | — | 46,878 | |||||||||
| Payable upon return of securities loaned |
128,419 | — | 5,790,699 | |||||||||
| Payable for investments purchased |
— | — | — | |||||||||
| Deferred foreign taxes payable |
— | — | 142,765 | |||||||||
| Advisory fee payable (Note 4) |
218,737 | 17,667 | 478,974 | |||||||||
| Trustees’ fees and expenses payable (Note 5) |
319 | 62 | 694 | |||||||||
| Accrued expenses and other liabilities |
— | — | — | |||||||||
|
|
|
|
|
|
|
|||||||
| TOTAL LIABILITIES |
347,475 | 17,729 | 6,460,010 | |||||||||
|
|
|
|
|
|
|
|||||||
| NET ASSETS |
$ | 317,664,597 | $ | 18,768,595 | $ | 413,652,756 | ||||||
|
|
|
|
|
|
|
|||||||
| NET ASSETS CONSIST OF: |
||||||||||||
| Paid-in Capital |
$ | 358,268,451 | $ | 18,299,382 | $ | 405,978,586 | ||||||
| Undistributed (distribution in excess of) net investment income (loss) |
— | 39,536 | 3,688,117 | |||||||||
| Accumulated net realized gain (loss) on investments and foreign currency transactions |
(42,652,221 | ) | (2,502,559 | ) | (63,192,448 | ) | ||||||
| Net unrealized appreciation (depreciation) on: |
||||||||||||
| Investments — affiliated issuers |
— | — | — | |||||||||
| Investments — unaffiliated issuers** |
2,031,805 | 2,931,004 | 67,184,012 | |||||||||
| Foreign currency translations |
16,562 | 1,232 | (5,511 | ) | ||||||||
|
|
|
|
|
|
|
|||||||
| NET ASSETS |
$ | 317,664,597 | $ | 18,768,595 | $ | 413,652,756 | ||||||
|
|
|
|
|
|
|
|||||||
| NET ASSET VALUE PER SHARE |
||||||||||||
| Net asset value per share |
$ | 35.49 | $ | 62.56 | $ | 98.49 | ||||||
|
|
|
|
|
|
|
|||||||
| Shares outstanding (unlimited amount authorized, $0.01 par value) |
8,950,370 | 300,000 | 4,200,000 | |||||||||
|
|
|
|
|
|
|
|||||||
| COST OF INVESTMENTS: |
||||||||||||
| Investments in unaffiliated issuers |
$ | 314,744,238 | $ | 15,827,247 | $ | 343,116,490 | ||||||
| Investments in affiliated issuers |
205,031 | 720 | 7,837,275 | |||||||||
|
|
|
|
|
|
|
|||||||
| Total cost of investments |
$ | 314,949,269 | $ | 15,827,967 | $ | 350,953,765 | ||||||
|
|
|
|
|
|
|
|||||||
| Foreign currency, at cost |
$ | 513,506 | $ | 2,573 | $ | 1,183,776 | ||||||
|
|
|
|
|
|
|
|||||||
| * Includes investments in securities on loan, at value |
$ | 117,619 | $ | — | $ | 33,085,946 | ||||||
|
|
|
|
|
|
|
|||||||
| ** Includes deferred foreign taxes |
$ | — | $ | — | $ | 142,765 | ||||||
|
|
|
|
|
|
|
|||||||
See accompanying notes to financial statements.
214
Table of Contents
| SPDR S&P China ETF |
SPDR MSCI China A Shares IMI ETF |
SPDR S&P Emerging Markets Dividend ETF |
SPDR S&P International Small Cap ETF |
SPDR S&P Global Infrastructure ETF |
SPDR S&P Global Natural Resources ETF |
SPDR MSCI ACWI IMI ETF |
||||||||||||||||||||
| $ | 1,022,428,242 | $ | 2,347,300 | $ | 421,566,854 | $ | 882,992,491 | $ | 180,768,847 | $ | 1,219,527,997 | $ | 89,939,666 | |||||||||||||
| 24,973,180 | 966 | 16,587,238 | 66,103,180 | 7,508,576 | 28,253,835 | 1,159,510 | ||||||||||||||||||||
|
|
|
|
|
|
|
|
|
|
|
|
|
|
|
|||||||||||||
| 1,047,401,422 | 2,348,266 | 438,154,092 | 949,095,671 | 188,277,423 | 1,247,781,832 | 91,099,176 | ||||||||||||||||||||
| 4,555,650 | 12,883 | 850,848 | 792,753 | 666,184 | 4,216,990 | 96,692 | ||||||||||||||||||||
| 3 | — | 9 | 2,776 | — | 14,080 | — | ||||||||||||||||||||
| — | — | — | 520,655 | 11,269,496 | — | — | ||||||||||||||||||||
| — | — | — | — | — | — | — | ||||||||||||||||||||
| 1,724,877 | — | 894,546 | 2,801,715 | 328,829 | 2,960,399 | 151,954 | ||||||||||||||||||||
| 2,423 | 3 | 1,169 | 2,436 | 200 | 2,482 | 741 | ||||||||||||||||||||
| 61,824 | — | — | 33,832 | — | 1,809 | 364 | ||||||||||||||||||||
| 71,463 | — | 14,146 | 190,928 | 1,412 | 11,461 | 1,279 | ||||||||||||||||||||
| — | — | 24,122 | 160,024 | 24,388 | 34,401 | 12,664 | ||||||||||||||||||||
| — | — | — | 3,911 | — | 5,783 | 1,231 | ||||||||||||||||||||
|
|
|
|
|
|
|
|
|
|
|
|
|
|
|
|||||||||||||
| 1,053,817,662 | 2,361,152 | 439,938,932 | 953,604,701 | 200,567,932 | 1,255,029,237 | 91,364,101 | ||||||||||||||||||||
|
|
|
|
|
|
|
|
|
|
|
|
|
|
|
|||||||||||||
| — | — | — | — | — | — | 98 | ||||||||||||||||||||
| 22,187,451 | — | 16,561,043 | 66,029,680 | 7,104,926 | 27,454,617 | 985,141 | ||||||||||||||||||||
| 932,944 | — | — | 275,115 | 11,911,402 | 275,846 | — | ||||||||||||||||||||
| — | — | — | — | — | — | — | ||||||||||||||||||||
| 1,456,751 | 3,774 | 519,989 | 869,492 | 174,622 | 1,144,507 | 57,472 | ||||||||||||||||||||
| 1,404 | 22 | 313 | 877 | 32 | 726 | 56 | ||||||||||||||||||||
| — | 23 | — | — | — | — | — | ||||||||||||||||||||
|
|
|
|
|
|
|
|
|
|
|
|
|
|
|
|||||||||||||
| 24,578,550 | 3,819 | 17,081,345 | 67,175,164 | 19,190,982 | 28,875,696 | 1,042,767 | ||||||||||||||||||||
|
|
|
|
|
|
|
|
|
|
|
|
|
|
|
|||||||||||||
| $ | 1,029,239,112 | $ | 2,357,333 | $ | 422,857,587 | $ | 886,429,537 | $ | 181,376,950 | $ | 1,226,153,541 | $ | 90,321,334 | |||||||||||||
|
|
|
|
|
|
|
|
|
|
|
|
|
|
|
|||||||||||||
| $ | 968,564,061 | $ | 2,495,938 | $ | 655,080,801 | $ | 852,576,056 | $ | 190,830,660 | $ | 1,310,297,174 | $ | 80,213,859 | |||||||||||||
| 12,797,160 | — | 1,028,057 | 9,085,380 | 1,416,548 | 11,067,062 | 837,632 | ||||||||||||||||||||
|
|
(135,646,120 |
) |
(60,600 | ) | (237,301,088 | ) | 24,521,461 | (23,902,132 | ) | (196,823,419 | ) | 22,520 | ||||||||||||||
| — | — | — | — | — | — | 28,371 | ||||||||||||||||||||
| 183,524,158 | (78,088 | ) | 4,064,930 | 250,506 | 13,031,852 | 101,645,248 | 9,219,112 | |||||||||||||||||||
| (147 | ) | 83 | (15,113 | ) | (3,866 | ) | 22 | (32,524 | ) | (160 | ) | |||||||||||||||
|
|
|
|
|
|
|
|
|
|
|
|
|
|
|
|||||||||||||
| $ | 1,029,239,112 | $ | 2,357,333 | $ | 422,857,587 | $ | 886,429,537 | $ | 181,376,950 | $ | 1,226,153,541 | $ | 90,321,334 | |||||||||||||
|
|
|
|
|
|
|
|
|
|
|
|
|
|
|
|||||||||||||
| $ | 101.90 | $ | 23.57 | $ | 30.31 | $ | 34.90 | $ | 51.82 | $ | 45.84 | $ | 75.27 | |||||||||||||
|
|
|
|
|
|
|
|
|
|
|
|
|
|
|
|||||||||||||
| 10,100,000 | 100,000 | 13,950,000 | 25,400,000 | 3,500,000 | 26,750,000 | 1,200,000 | ||||||||||||||||||||
|
|
|
|
|
|
|
|
|
|
|
|
|
|
|
|||||||||||||
| $ | 838,904,084 | $ | 2,425,388 | $ | 417,501,924 | $ | 882,741,985 | $ | 167,736,995 | $ | 1,117,882,749 | $ | 80,720,554 | |||||||||||||
| 24,973,180 | 966 | 16,587,238 | 66,103,180 | 7,508,576 | 28,253,835 | 1,131,139 | ||||||||||||||||||||
|
|
|
|
|
|
|
|
|
|
|
|
|
|
|
|||||||||||||
| $ | 863,877,264 | $ | 2,426,354 | $ | 434,089,162 | $ | 948,845,165 | $ | 175,245,571 | $ | 1,146,136,584 | $ | 81,851,693 | |||||||||||||
|
|
|
|
|
|
|
|
|
|
|
|
|
|
|
|||||||||||||
| $ | 4,557,070 | $ | 12,801 | $ | 860,512 | $ | 803,390 | $ | 662,642 | $ | 4,244,344 | $ | 97,648 | |||||||||||||
|
|
|
|
|
|
|
|
|
|
|
|
|
|
|
|||||||||||||
| $ | 151,808,995 | $ | — | $ | 18,415,395 | $ | 86,596,964 | $ | 7,260,488 | $ | 49,252,396 | $ | 2,793,842 | |||||||||||||
|
|
|
|
|
|
|
|
|
|
|
|
|
|
|
|||||||||||||
| $ | — | $ | — | $ | — | $ | — | $ | — | $ | — | $ | — | |||||||||||||
|
|
|
|
|
|
|
|
|
|
|
|
|
|
|
|||||||||||||
215
Table of Contents
SPDR INDEX SHARES FUNDS
STATEMENTS OF ASSETS AND LIABILITIES (continued)
September 30, 2017
| SPDR MSCI ACWI Low Carbon Target ETF |
SPDR MSCI EAFE Fossil Fuel Reserves Free ETF |
SPDR MSCI Emerging Markets Fossil Fuel Reserves Free ETF |
||||||||||
| ASSETS |
||||||||||||
| Investments in unaffiliated issuers, at value* (Note 2) |
$ | 145,354,387 | $ | 45,708,096 | $ | 15,061,389 | ||||||
| Investments in affiliated issuers, at value (Notes 2 and 4) |
742,235 | 318,502 | 1,023,883 | |||||||||
|
|
|
|
|
|
|
|||||||
| Total Investments |
146,096,622 | 46,026,598 | 16,085,272 | |||||||||
| Foreign currency, at value |
319,312 | 75,907 | 356,220 | |||||||||
| Cash at broker |
— | — | 49,280 | |||||||||
| Cash |
611 | 53 | — | |||||||||
| Receivable for investments sold |
— | — | — | |||||||||
| Receivable for fund shares sold |
— | — | — | |||||||||
| Receivable from broker — variation margin on open futures contracts |
— | — | 27,789 | |||||||||
| Dividends receivable — unaffiliated issuers (Note 2) |
240,571 | 112,047 | 14,203 | |||||||||
| Dividends receivable — affiliated issuers (Notes 2 and 4) |
787 | 79 | 785 | |||||||||
| Securities lending income receivable — unaffiliated issuers (Note 9) |
681 | 59 | 56 | |||||||||
| Securities lending income receivable — affiliated issuers (Notes 4 and 9) |
492 | 179 | 136 | |||||||||
| Receivable from Adviser (Note 4) |
36,843 | 11,360 | — | |||||||||
| Receivable for foreign taxes recoverable |
34,637 | 25,460 | 374 | |||||||||
| Other Receivable |
1,381 | 1,382 | 1,383 | |||||||||
|
|
|
|
|
|
|
|||||||
| TOTAL ASSETS |
146,731,937 | 46,253,124 | 16,535,498 | |||||||||
|
|
|
|
|
|
|
|||||||
| LIABILITIES |
||||||||||||
| Due to custodian (Note 4) |
— | — | 31,998 | |||||||||
| Payable upon return of securities loaned |
378,038 | 242,956 | 172,291 | |||||||||
| Payable for investments purchased |
293 | 467 | 851 | |||||||||
| Payable for fund shares repurchased |
— | — | — | |||||||||
| Deferred foreign taxes payable |
11,771 | — | — | |||||||||
| Advisory fee payable (Note 4) |
108,233 | 29,768 | 12,238 | |||||||||
| Trustees’ fees and expenses payable (Note 5) |
82 | 32 | 7 | |||||||||
|
|
|
|
|
|
|
|||||||
| TOTAL LIABILITIES |
498,417 | 273,223 | 217,385 | |||||||||
|
|
|
|
|
|
|
|||||||
| NET ASSETS |
$ | 146,233,520 | $ | 45,979,901 | $ | 16,318,113 | ||||||
|
|
|
|
|
|
|
|||||||
| NET ASSETS CONSIST OF: |
||||||||||||
| Paid-in Capital |
$ | 125,301,986 | $ | 40,431,724 | $ | 14,668,805 | ||||||
| Undistributed (distribution in excess of) net investment income (loss) |
542,293 | 91,937 | (23,946 | ) | ||||||||
| Accumulated net realized gain (loss) on investments, foreign currency transactions and futures contracts |
(838,658 | ) | 171,907 | 97,502 | ||||||||
| Net unrealized appreciation (depreciation) on: |
||||||||||||
| Investments — affiliated issuers |
28,368 | — | — | |||||||||
| Investments — unaffiliated issuers** |
21,198,554 | 5,283,326 | 1,592,616 | |||||||||
| Foreign currency translations |
977 | 1,007 | (726 | ) | ||||||||
| Futures contracts |
— | — | (16,138 | ) | ||||||||
|
|
|
|
|
|
|
|||||||
| NET ASSETS |
$ | 146,233,520 | $ | 45,979,901 | $ | 16,318,113 | ||||||
|
|
|
|
|
|
|
|||||||
| NET ASSET VALUE PER SHARE |
||||||||||||
| Net asset value per share |
$ | 86.02 | $ | 70.74 | $ | 65.27 | ||||||
|
|
|
|
|
|
|
|||||||
| Shares outstanding (unlimited amount authorized, $0.01 par value) |
1,700,000 | 650,000 | 250,000 | |||||||||
|
|
|
|
|
|
|
|||||||
| COST OF INVESTMENTS: |
||||||||||||
| Investments in unaffiliated issuers |
$ | 124,144,062 | $ | 40,424,770 | $ | 13,468,773 | ||||||
| Investments in affiliated issuers |
713,867 | 318,502 | 1,023,883 | |||||||||
|
|
|
|
|
|
|
|||||||
| Total cost of investments |
$ | 124,857,929 | $ | 40,743,272 | $ | 14,492,656 | ||||||
|
|
|
|
|
|
|
|||||||
| Foreign currency, at cost |
$ | 320,657 | $ | 76,326 | $ | 356,946 | ||||||
|
|
|
|
|
|
|
|||||||
| * Includes investments in securities on loan, at value |
$ | 3,436,459 | $ | 681,466 | $ | 790,521 | ||||||
|
|
|
|
|
|
|
|||||||
| ** Includes deferred foreign taxes |
$ | 11,771 | $ | — | $ | — | ||||||
|
|
|
|
|
|
|
|||||||
See accompanying notes to financial statements.
216
Table of Contents
| SPDR MSCI EAFE StrategicFactors ETF |
SPDR MSCI Emerging Markets StrategicFactors ETF |
SPDR MSCI World StrategicFactors ETF |
SPDR MSCI Canada StrategicFactors ETF |
SPDR MSCI Germany StrategicFactors ETF |
SPDR MSCI Japan StrategicFactors ETF |
SPDR MSCI United Kingdom StrategicFactors ETF |
||||||||||||||||||||
| $ | 191,227,849 | $ | 212,720,732 | $ | 21,525,756 | $ | 38,579,236 | $ | 18,825,717 | $ | 14,750,160 | $ | 5,251,462 | |||||||||||||
| 818,565 | 3,703,539 | 4,447,002 | 13,104 | 1,300 | 131 | 1,793 | ||||||||||||||||||||
|
|
|
|
|
|
|
|
|
|
|
|
|
|
|
|||||||||||||
| 192,046,414 | 216,424,271 | 25,972,758 | 38,592,340 | 18,827,017 | 14,750,291 | 5,253,255 | ||||||||||||||||||||
| 698,500 | 631,090 | 40,636 | 114,165 | 20,504 | 43,125 | 40,348 | ||||||||||||||||||||
| — | — | — | — | — | — | — | ||||||||||||||||||||
| — | — | — | — | — | — | — | ||||||||||||||||||||
| — | 1,506 | 2,751,884 | — | — | — | — | ||||||||||||||||||||
| 6,316,199 | — | — | — | — | — | — | ||||||||||||||||||||
| — | — | — | — | — | — | — | ||||||||||||||||||||
| 499,510 | 169,791 | 47,561 | 74,557 | — | 108,547 | 11,045 | ||||||||||||||||||||
| 96 | 198 | 322 | 7 | 1 | — | — | ||||||||||||||||||||
| 22 | — | 66 | — | — | — | — | ||||||||||||||||||||
| 470 | 2,722 | 18 | — | — | — | — | ||||||||||||||||||||
| — | — | — | — | — | — | — | ||||||||||||||||||||
| 56,955 | 1,282 | 3,893 | — | 83,234 | 6,279 | 40 | ||||||||||||||||||||
| — | — | — | — | — | — | — | ||||||||||||||||||||
|
|
|
|
|
|
|
|
|
|
|
|
|
|
|
|||||||||||||
| 199,618,166 | 217,230,860 | 28,817,138 | 38,781,069 | 18,930,756 | 14,908,242 | 5,304,688 | ||||||||||||||||||||
|
|
|
|
|
|
|
|
|
|
|
|
|
|
|
|||||||||||||
| — | 339 | 4,362,858 | — | — | — | — | ||||||||||||||||||||
| 666,545 | 3,055,835 | 24,983 | — | — | — | — | ||||||||||||||||||||
| 6,180,487 | — | 63 | — | — | — | — | ||||||||||||||||||||
| — | — | 2,802,565 | — | — | — | — | ||||||||||||||||||||
| — | 77,759 | — | — | — | — | — | ||||||||||||||||||||
| 127,081 | 151,911 | 21,130 | 28,331 | 13,731 | 11,069 | 5,965 | ||||||||||||||||||||
| — | 53 | — | — | 8 | 18 | — | ||||||||||||||||||||
|
|
|
|
|
|
|
|
|
|
|
|
|
|
|
|||||||||||||
| 6,974,113 | 3,285,897 | 7,211,599 | 28,331 | 13,739 | 11,087 | 5,965 | ||||||||||||||||||||
|
|
|
|
|
|
|
|
|
|
|
|
|
|
|
|||||||||||||
| $ | 192,644,053 | $ | 213,944,963 | $ | 21,605,539 | $ | 38,752,738 | $ | 18,917,017 | $ | 14,897,155 | $ | 5,298,723 | |||||||||||||
|
|
|
|
|
|
|
|
|
|
|
|
|
|
|
|||||||||||||
| $ | 172,237,307 | $ | 191,943,788 | $ | 19,529,688 | $ | 33,536,562 | $ | 18,160,850 | $ | 14,043,455 | $ | 5,802,756 | |||||||||||||
| 1,154,134 | 2,413,893 | 164,753 | 167,770 | — | 102,102 | (3,879 | ) | |||||||||||||||||||
|
|
(241,705 |
) |
(6,699,950 | ) | 104,592 | (526,081 | ) | (984,972 | ) | (256,075 | ) | (430,277 | ) | |||||||||||||
| — | — | 1,801 | — | — | — | — | ||||||||||||||||||||
| 19,491,284 | 26,291,704 | 1,804,440 | 5,576,022 | 1,735,845 | 1,008,387 | (70,569 | ) | |||||||||||||||||||
| 3,033 | (4,472 | ) | 265 | (1,535 | ) | 5,294 | (714 | ) | 692 | |||||||||||||||||
| — | — | — | — | — | — | — | ||||||||||||||||||||
|
|
|
|
|
|
|
|
|
|
|
|
|
|
|
|||||||||||||
| $ | 192,644,053 | $ | 213,944,963 | $ | 21,605,539 | $ | 38,752,738 | $ | 18,917,017 | $ | 14,897,155 | $ | 5,298,723 | |||||||||||||
|
|
|
|
|
|
|
|
|
|
|
|
|
|
|
|||||||||||||
| $ | 63.16 | $ | 60.69 | $ | 72.02 | $ | 59.62 | $ | 63.06 | $ | 74.49 | $ | 52.99 | |||||||||||||
|
|
|
|
|
|
|
|
|
|
|
|
|
|
|
|||||||||||||
| 3,050,000 | 3,525,000 | 300,000 | 650,000 | 300,000 | 200,000 | 100,000 | ||||||||||||||||||||
|
|
|
|
|
|
|
|
|
|
|
|
|
|
|
|||||||||||||
| $ | 171,736,565 | $ | 186,351,269 | $ | 19,721,316 | $ | 33,003,214 | $ | 17,089,872 | $ | 13,741,773 | $ | 5,322,031 | |||||||||||||
| 818,565 | 3,703,539 | 4,445,201 | 13,104 | 1,300 | 131 | 1,793 | ||||||||||||||||||||
|
|
|
|
|
|
|
|
|
|
|
|
|
|
|
|||||||||||||
| $ | 172,555,130 | $ | 190,054,808 | $ | 24,166,517 | $ | 33,016,318 | $ | 17,091,172 | $ | 13,741,904 | $ | 5,323,824 | |||||||||||||
|
|
|
|
|
|
|
|
|
|
|
|
|
|
|
|||||||||||||
| $ | 699,471 | $ | 635,548 | $ | 40,468 | $ | 114,774 | $ | 19,931 | $ | 43,673 | $ | 39,861 | |||||||||||||
|
|
|
|
|
|
|
|
|
|
|
|
|
|
|
|||||||||||||
| $ | 789,798 | $ | 5,775,083 | $ | 281,413 | $ | — | $ | — | $ | — | $ | — | |||||||||||||
|
|
|
|
|
|
|
|
|
|
|
|
|
|
|
|||||||||||||
| $ | — | $ | 77,759 | $ | — | $ | — | $ | — | $ | — | $ | — | |||||||||||||
|
|
|
|
|
|
|
|
|
|
|
|
|
|
|
|||||||||||||
217
Table of Contents
SPDR INDEX SHARES FUNDS
STATEMENTS OF ASSETS AND LIABILITIES (continued)
September 30, 2017
| SPDR S&P Global Dividend ETF |
SPDR S&P Emerging Markets Small Cap ETF |
|||||||
| ASSETS |
||||||||
| Investments in unaffiliated issuers, at value* (Note 2) |
$ | 164,894,473 | $ | 478,239,107 | ||||
| Investments in affiliated issuers, at value (Notes 2 and 4) |
5,999,046 | 16,640,537 | ||||||
|
|
|
|
|
|||||
| Total Investments |
170,893,519 | 494,879,644 | ||||||
| Foreign currency, at value |
349,795 | 804,002 | ||||||
| Cash |
— | 1,162 | ||||||
| Dividends receivable — unaffiliated issuers (Note 2) |
436,398 | 592,488 | ||||||
| Dividends receivable — affiliated issuers (Notes 2 and 4) |
426 | 1,243 | ||||||
| Securities lending income receivable — unaffiliated issuers (Note 9) |
3,357 | 42,248 | ||||||
| Securities lending income receivable — affiliated issuers (Notes 4 and 9) |
7,810 | 48,686 | ||||||
| Receivable for foreign taxes recoverable |
43,734 | 661 | ||||||
|
|
|
|
|
|||||
| TOTAL ASSETS |
171,735,039 | 496,370,134 | ||||||
|
|
|
|
|
|||||
| LIABILITIES |
||||||||
| Payable upon return of securities loaned |
5,848,371 | 16,261,252 | ||||||
| Payable for investments purchased |
1,671 | 5 | ||||||
| Advisory fee payable (Note 4) |
159,761 | 770,045 | ||||||
| Trustees’ fees and expenses payable (Note 5) |
61 | 451 | ||||||
|
|
|
|
|
|||||
| TOTAL LIABILITIES |
6,009,864 | 17,031,753 | ||||||
|
|
|
|
|
|||||
| NET ASSETS |
$ | 165,725,175 | $ | 479,338,381 | ||||
|
|
|
|
|
|||||
| NET ASSETS CONSIST OF: |
||||||||
| Paid-in Capital |
$ | 162,134,736 | $ | 583,778,232 | ||||
| Undistributed (distribution in excess of) net investment income (loss) |
104,420 | 7,196,499 | ||||||
| Accumulated net realized gain (loss) on investments and foreign currency transactions |
(5,893,161 | ) | (60,237,684 | ) | ||||
| Net unrealized appreciation (depreciation) on: |
||||||||
| Investments — unaffiliated issuers |
9,381,082 | (51,394,793 | ) | |||||
| Foreign currency translations |
(1,902 | ) | (3,873 | ) | ||||
|
|
|
|
|
|||||
| NET ASSETS |
$ | 165,725,175 | $ | 479,338,381 | ||||
|
|
|
|
|
|||||
| NET ASSET VALUE PER SHARE |
||||||||
| Net asset value per share |
$ | 67.64 | $ | 49.42 | ||||
|
|
|
|
|
|||||
| Shares outstanding (unlimited amount authorized, $0.01 par value) |
2,450,000 | 9,700,000 | ||||||
|
|
|
|
|
|||||
| COST OF INVESTMENTS: |
||||||||
| Investments in unaffiliated issuers |
$ | 155,513,391 | $ | 529,633,900 | ||||
| Investments in affiliated issuers |
5,999,046 | 16,640,537 | ||||||
|
|
|
|
|
|||||
| Total cost of investments |
$ | 161,512,437 | $ | 546,274,437 | ||||
|
|
|
|
|
|||||
| Foreign currency, at cost |
$ | 353,511 | $ | 805,687 | ||||
|
|
|
|
|
|||||
| * Includes investments in securities on loan, at value |
$ | 21,720,651 | $ | 29,961,488 | ||||
|
|
|
|
|
|||||
See accompanying notes to financial statements.
218
Table of Contents
[This Page Intentionally Left Blank]
219
Table of Contents
SPDR INDEX SHARES FUNDS
STATEMENTS OF OPERATIONS
For the Year Ended September 30, 2017
| SPDR STOXX Europe 50 ETF |
SPDR EURO STOXX Small Cap ETF |
SPDR S&P Emerging Asia Pacific ETF |
||||||||||
| INVESTMENT INCOME |
||||||||||||
| Interest income — unaffiliated issuers (Note 2) |
$ | — | $ | — | $ | 2,538 | ||||||
| Dividend income — unaffiliated issuers (Note 2) |
8,706,239 | 324,171 | 9,319,533 | |||||||||
| Dividend income — affiliated issuers (Notes 2 and 4) |
1,979 | 22 | 4,480 | |||||||||
| Unaffiliated securities lending income (Note 9) |
9,224 | — | 109,960 | |||||||||
| Affiliated securities lending income (Notes 4 and 9) |
65,514 | — | 125,979 | |||||||||
| Dividend income — non cash transactions |
— | 21,137 | — | |||||||||
| Foreign taxes withheld |
(1,679,003 | ) | (47,268 | ) | (1,064,946 | ) | ||||||
|
|
|
|
|
|
|
|||||||
| TOTAL INVESTMENT INCOME (LOSS) |
7,103,953 | 298,062 | 8,497,544 | |||||||||
|
|
|
|
|
|
|
|||||||
| EXPENSES |
||||||||||||
| Advisory fees (Note 4) |
641,313 | 59,755 | 1,686,058 | |||||||||
| Trustees’ fees and expenses (Note 5) |
3,278 | 247 | 5,721 | |||||||||
| Miscellaneous expenses |
2,384 | 129 | 1,790 | |||||||||
|
|
|
|
|
|
|
|||||||
| TOTAL EXPENSES |
646,975 | 60,131 | 1,693,569 | |||||||||
|
|
|
|
|
|
|
|||||||
| NET EXPENSES |
646,975 | 60,131 | 1,693,569 | |||||||||
|
|
|
|
|
|
|
|||||||
| NET INVESTMENT INCOME (LOSS) |
6,456,978 | 237,931 | 6,803,975 | |||||||||
|
|
|
|
|
|
|
|||||||
| REALIZED AND UNREALIZED GAIN (LOSS) |
||||||||||||
| Net realized gain (loss) on: |
||||||||||||
| Investments — unaffiliated issuers* |
(3,494,788 | ) | 514,503 | (1,183,809 | ) | |||||||
| In-kind redemptions — unaffiliated issuers |
(2,103,617 | ) | — | (861,380 | ) | |||||||
| In-kind redemptions — affiliated issuers (Note 4) |
— | — | — | |||||||||
| Foreign currency transactions |
37,697 | 513 | (54,669 | ) | ||||||||
|
|
|
|
|
|
|
|||||||
| Net realized gain (loss) |
(5,560,708 | ) | 515,016 | (2,099,858 | ) | |||||||
|
|
|
|
|
|
|
|||||||
| Net change in unrealized appreciation/depreciation on: |
||||||||||||
| Investments — unaffiliated issuers** |
39,631,577 | 3,286,235 | 66,201,207 | |||||||||
| Investments — affiliated issuers (Note 4) |
— | — | — | |||||||||
| Foreign currency translations |
41,476 | 1,826 | (19,406 | ) | ||||||||
|
|
|
|
|
|
|
|||||||
| Net change in unrealized appreciation/depreciation |
39,673,053 | 3,288,061 | 66,181,801 | |||||||||
|
|
|
|
|
|
|
|||||||
| NET REALIZED AND UNREALIZED GAIN (LOSS) |
34,112,345 | 3,803,077 | 64,081,943 | |||||||||
|
|
|
|
|
|
|
|||||||
| NET INCREASE (DECREASE) IN NET ASSETS FROM OPERATIONS |
$ | 40,569,323 | $ | 4,041,008 | $ | 70,885,918 | ||||||
|
|
|
|
|
|
|
|||||||
| * Includes foreign capital gain taxes |
$ | — | $ | — | $ | (94,985 | ) | |||||
|
|
|
|
|
|
|
|||||||
| ** Includes foreign deferred taxes |
$ | — | $ | — | $ | 295,233 | ||||||
|
|
|
|
|
|
|
|||||||
See accompanying notes to financial statements.
220
Table of Contents
| SPDR S&P China ETF |
SPDR MSCI China A Shares IMI ETF |
SPDR S&P Emerging Markets Dividend ETF |
SPDR S&P International Small Cap ETF |
SPDR S&P Global Infrastructure ETF |
SPDR S&P Global Natural Resources ETF |
SPDR MSCI ACWI IMI ETF |
||||||||||||||||||||
| $ | — | $ | — | $ | — | $ | — | $ | — | $ | — | $ | — | |||||||||||||
| 21,560,077 | 31,615 | 18,173,184 | 17,387,012 | 4,955,798 | 28,156,881 | 2,137,067 | ||||||||||||||||||||
| 8,954 | 6 | 4,070 | 12,811 | 1,787 | 20,544 | 4,193 | ||||||||||||||||||||
| 635,436 | — | 32,406 | 417,812 | 13,408 | 52,969 | 6,335 | ||||||||||||||||||||
| 809,047 | — | 55,743 | 1,748,900 | 36,128 | 250,973 | 16,678 | ||||||||||||||||||||
| — | — | — | 925,401 | 357,771 | 4,976,432 | 125,402 | ||||||||||||||||||||
| (1,588,167 | ) | (4,280 | ) | (2,169,502 | ) | (1,991,174 | ) | (326,062 | ) | (2,438,035 | ) | (144,368 | ) | |||||||||||||
|
|
|
|
|
|
|
|
|
|
|
|
|
|
|
|||||||||||||
| 21,425,347 | 27,341 | 16,095,901 | 18,500,762 | 5,038,830 | 31,019,764 | 2,145,307 | ||||||||||||||||||||
|
|
|
|
|
|
|
|
|
|
|
|
|
|
|
|||||||||||||
| 5,168,166 | 14,208 | 1,736,160 | 3,091,526 | 511,026 | 3,847,896 | 214,735 | ||||||||||||||||||||
| 14,366 | — | 5,597 | 12,924 | 1,794 | 15,136 | 1,382 | ||||||||||||||||||||
| 4,705 | 48 | 4,362 | 14,314 | 1,020 | 54,297 | 640 | ||||||||||||||||||||
|
|
|
|
|
|
|
|
|
|
|
|
|
|
|
|||||||||||||
| 5,187,237 | 14,256 | 1,746,119 | 3,118,764 | 513,840 | 3,917,329 | 216,757 | ||||||||||||||||||||
|
|
|
|
|
|
|
|
|
|
|
|
|
|
|
|||||||||||||
| 5,187,237 | 14,256 | 1,746,119 | 3,118,764 | 513,840 | 3,917,329 | 216,757 | ||||||||||||||||||||
|
|
|
|
|
|
|
|
|
|
|
|
|
|
|
|||||||||||||
| 16,238,110 | 13,085 | 14,349,782 | 15,381,998 | 4,524,990 | 27,102,435 | 1,928,550 | ||||||||||||||||||||
|
|
|
|
|
|
|
|
|
|
|
|
|
|
|
|||||||||||||
| (7,596,608 | ) | (25,572 | ) | 28,597,226 | 27,230,948 | (2,142,666 | ) | (22,630,143 | ) | 312,562 | ||||||||||||||||
| 19,988,221 | — | 390,678 | 3,574,895 | 1,709,618 | 7,242,368 | 3,504,423 | ||||||||||||||||||||
| — | — | — | — | — | — | 5,382 | ||||||||||||||||||||
| (40,368 | ) | 453 | (261,724 | ) | (416,808 | ) | 12,782 | 1,077,453 | 4,569 | |||||||||||||||||
|
|
|
|
|
|
|
|
|
|
|
|
|
|
|
|||||||||||||
| 12,351,245 | (25,119 | ) | 28,726,180 | 30,389,035 | (420,266 | ) | (14,310,322 | ) | 3,826,936 | |||||||||||||||||
|
|
|
|
|
|
|
|
|
|
|
|
|
|
|
|||||||||||||
| 216,230,679 | 242,721 | 3,589,150 | 74,514,788 | 13,116,639 | 164,368,035 | 9,449,311 | ||||||||||||||||||||
| — | — | — | — | — | — | 27,250 | ||||||||||||||||||||
| (159 | ) | 80 | (13,221 | ) | 5,603 | 4,011 | (12,906 | ) | 382 | |||||||||||||||||
|
|
|
|
|
|
|
|
|
|
|
|
|
|
|
|||||||||||||
| 216,230,520 | 242,801 | 3,575,929 | 74,520,391 | 13,120,650 | 164,355,129 | 9,476,943 | ||||||||||||||||||||
|
|
|
|
|
|
|
|
|
|
|
|
|
|
|
|||||||||||||
| 228,581,765 | 217,682 | 32,302,109 | 104,909,426 | 12,700,384 | 150,044,807 | 13,303,879 | ||||||||||||||||||||
|
|
|
|
|
|
|
|
|
|
|
|
|
|
|
|||||||||||||
| $ |
244,819,875 |
|
$ | 230,767 | $ | 46,651,891 | $ | 120,291,424 | $ | 17,225,374 | $ | 177,147,242 | $ | 15,232,429 | ||||||||||||
|
|
|
|
|
|
|
|
|
|
|
|
|
|
|
|||||||||||||
| $ | — | $ | — | $ | (127,868 | ) | $ | — | $ | — | $ | — | $ | (171 | ) | |||||||||||
|
|
|
|
|
|
|
|
|
|
|
|
|
|
|
|||||||||||||
| $ | — | $ | — | $ | 1,464 | $ | — | $ | — | $ | — | $ | 224 | |||||||||||||
|
|
|
|
|
|
|
|
|
|
|
|
|
|
|
|||||||||||||
221
Table of Contents
SPDR INDEX SHARES FUNDS
STATEMENTS OF OPERATIONS (continued)
For the Year Ended September 30, 2017
| SPDR MSCI ACWI Low Carbon Target ETF |
SPDR MSCI EAFE Fossil Fuel Reserves Free ETF(a) |
SPDR MSCI Emerging Markets Fossil Fuel Reserves Free ETF(a) |
||||||||||
| INVESTMENT INCOME |
||||||||||||
| Interest income — unaffiliated issuers (Note 2) |
$ | — | $ | — | $ | 19 | ||||||
| Dividend income — unaffiliated issuers (Note 2) |
3,422,096 | 969,064 | 270,689 | |||||||||
| Dividend income — affiliated issuers (Notes 2 and 4) |
3,780 | 270 | 4,135 | |||||||||
| Unaffiliated securities lending income (Note 9) |
3,168 | 1,168 | 253 | |||||||||
| Affiliated securities lending income (Notes 4 and 9) |
3,078 | 1,224 | 687 | |||||||||
| Dividend income — non cash transactions |
— | 87,603 | — | |||||||||
| Foreign taxes withheld |
(230,743 | ) | (111,898 | ) | (37,758 | ) | ||||||
|
|
|
|
|
|
|
|||||||
| TOTAL INVESTMENT INCOME (LOSS) |
3,201,379 | 947,431 | 238,025 | |||||||||
|
|
|
|
|
|
|
|||||||
| EXPENSES |
||||||||||||
| Advisory fees (Note 4) |
387,108 | 93,909 | 25,997 | |||||||||
| Trustees’ fees and expenses (Note 5) |
2,039 | 451 | 96 | |||||||||
| Miscellaneous expenses |
1,075 | 73 | 128 | |||||||||
|
|
|
|
|
|
|
|||||||
| TOTAL EXPENSES |
390,222 | 94,433 | 26,221 | |||||||||
|
|
|
|
|
|
|
|||||||
| Expenses waived/reimbursed by the Adviser (Note 4) |
(131,075 | ) | (33,182 | ) | — | |||||||
|
|
|
|
|
|
|
|||||||
| NET EXPENSES |
259,147 | 61,251 | 26,221 | |||||||||
|
|
|
|
|
|
|
|||||||
| NET INVESTMENT INCOME (LOSS) |
2,942,232 | 886,180 | 211,804 | |||||||||
|
|
|
|
|
|
|
|||||||
| REALIZED AND UNREALIZED GAIN (LOSS) |
||||||||||||
| Net realized gain (loss) on: |
||||||||||||
| Investments — unaffiliated issuers* |
(98,917 | ) | 175,586 | 53,268 | ||||||||
| Investments — affiliated issuers (Note 4) |
(93 | ) | — | — | ||||||||
| In-kind redemptions — unaffiliated issuers |
— | — | — | |||||||||
| In-kind redemptions — affiliated issuers (Note 4) |
— | — | — | |||||||||
| Foreign currency transactions |
(719 | ) | 5,110 | (4,666 | ) | |||||||
| Futures contracts |
— | — | 44,234 | |||||||||
|
|
|
|
|
|
|
|||||||
| Net realized gain (loss) |
(99,729 | ) | 180,696 | 92,836 | ||||||||
|
|
|
|
|
|
|
|||||||
| Net change in unrealized appreciation/depreciation on: |
||||||||||||
| Investments — unaffiliated issuers** |
19,407,711 | 5,283,326 | 1,592,616 | |||||||||
| Investments — affiliated issuers (Note 4) |
37,399 | — | — | |||||||||
| Foreign currency translations |
(153 | ) | 1,007 | (726 | ) | |||||||
| Futures contracts |
— | — | (16,138 | ) | ||||||||
|
|
|
|
|
|
|
|||||||
| Net change in unrealized appreciation/depreciation |
19,444,957 | 5,284,333 | 1,575,752 | |||||||||
|
|
|
|
|
|
|
|||||||
| NET REALIZED AND UNREALIZED GAIN (LOSS) |
19,345,228 | 5,465,029 | 1,668,588 | |||||||||
|
|
|
|
|
|
|
|||||||
| NET INCREASE (DECREASE) IN NET ASSETS FROM OPERATIONS |
$ | 22,287,460 | $ | 6,351,209 | $ | 1,880,392 | ||||||
|
|
|
|
|
|
|
|||||||
| * Includes foreign capital gain taxes |
$ | (6,260 | ) | $ | — | $ | — | |||||
|
|
|
|
|
|
|
|||||||
| ** Includes foreign deferred taxes |
$ | 2,468 | $ | — | $ | — | ||||||
|
|
|
|
|
|
|
|||||||
| (a) | For the period October 24, 2016 (inception date) through September 30, 2017. |
See accompanying notes to financial statements.
222
Table of Contents
| SPDR MSCI EAFE StrategicFactors ETF |
SPDR MSCI Emerging Markets StrategicFactors ETF |
SPDR MSCI World StrategicFactors ETF |
SPDR MSCI Canada StrategicFactors ETF |
SPDR MSCI Germany StrategicFactors ETF |
SPDR MSCI Japan StrategicFactors ETF |
SPDR MSCI United Kingdom StrategicFactors ETF |
||||||||||||||||||||
| $ | — | $ | — | $ | — | $ | — | $ | — | $ | — | $ | — | |||||||||||||
| 3,739,423 | 5,118,304 | 596,945 | 810,382 | 295,705 | 306,424 | 202,513 | ||||||||||||||||||||
| 1,269 | 1,116 | 777 | 131 | 97 | 44 | 80 | ||||||||||||||||||||
| 1,210 | 1,265 | 347 | — | — | — | — | ||||||||||||||||||||
| 3,332 | 9,943 | 239 | — | — | — | — | ||||||||||||||||||||
| 404,815 | — | 32,790 | — | 61,872 | — | 53,315 | ||||||||||||||||||||
| (398,142 | ) | (618,195 | ) | (39,699 | ) | (121,747 | ) | (38,971 | ) | (35,125 | ) | (633 | ) | |||||||||||||
|
|
|
|
|
|
|
|
|
|
|
|
|
|
|
|||||||||||||
| 3,751,907 | 4,512,433 | 591,399 | 688,766 | 318,703 | 271,343 | 255,275 | ||||||||||||||||||||
|
|
|
|
|
|
|
|
|
|
|
|
|
|
|
|||||||||||||
| 321,651 | 483,548 | 67,549 | 85,705 | 34,849 | 41,368 | 15,980 | ||||||||||||||||||||
| 1,143 | 2,333 | 292 | 397 | 175 | 244 | 64 | ||||||||||||||||||||
| 689 | 1,227 | 312 | 54 | 55 | 60 | 46 | ||||||||||||||||||||
|
|
|
|
|
|
|
|
|
|
|
|
|
|
|
|||||||||||||
| 323,483 | 487,108 | 68,153 | 86,156 | 35,079 | 41,672 | 16,090 | ||||||||||||||||||||
|
|
|
|
|
|
|
|
|
|
|
|
|
|
|
|||||||||||||
| — | — | — | — | — | — | — | ||||||||||||||||||||
|
|
|
|
|
|
|
|
|
|
|
|
|
|
|
|||||||||||||
| 323,483 | 487,108 | 68,153 | 86,156 | 35,079 | 41,672 | 16,090 | ||||||||||||||||||||
|
|
|
|
|
|
|
|
|
|
|
|
|
|
|
|||||||||||||
| 3,428,424 | 4,025,325 | 523,246 | 602,610 | 283,624 | 229,671 | 239,185 | ||||||||||||||||||||
|
|
|
|
|
|
|
|
|
|
|
|
|
|
|
|||||||||||||
| (27,079 | ) | (716,686 | ) | 193,183 | (263,330 | ) | (446,777 | ) | (173,457 | ) | (256,083 | ) | ||||||||||||||
| — | — | — | — | — | — | — | ||||||||||||||||||||
| — | 31 | 1,498,466 | — | (182,465 | ) | 967,099 | 382,533 | |||||||||||||||||||
| — | — | 1,052 | — | — | — | — | ||||||||||||||||||||
| 30,112 | (37,291 | ) | 2,847 | 10,788 | 2,853 | (11,025 | ) | (607 | ) | |||||||||||||||||
| — | — | — | — | — | — | — | ||||||||||||||||||||
|
|
|
|
|
|
|
|
|
|
|
|
|
|
|
|||||||||||||
| 3,033 | (753,946 | ) | 1,695,548 | (252,542 | ) | (626,389 | ) | 782,617 | 125,843 | |||||||||||||||||
|
|
|
|
|
|
|
|
|
|
|
|
|
|
|
|||||||||||||
| 19,733,044 | 22,804,058 | 1,456,533 | 4,183,779 | 1,974,407 | 588,218 | 400,079 | ||||||||||||||||||||
| — | — | 1,682 | — | — | — | — | ||||||||||||||||||||
| 3,015 | (2,359 | ) | 398 | (998 | ) | 5,389 | (896 | ) | 740 | |||||||||||||||||
| — | — | — | — | — | — | — | ||||||||||||||||||||
|
|
|
|
|
|
|
|
|
|
|
|
|
|
|
|||||||||||||
| 19,736,059 | 22,801,699 | 1,458,613 | 4,182,781 | 1,979,796 | 587,322 | 400,819 | ||||||||||||||||||||
|
|
|
|
|
|
|
|
|
|
|
|
|
|
|
|||||||||||||
| 19,739,092 | 22,047,753 | 3,154,161 | 3,930,239 | 1,353,407 | 1,369,939 | 526,662 | ||||||||||||||||||||
|
|
|
|
|
|
|
|
|
|
|
|
|
|
|
|||||||||||||
| $ |
23,167,516 |
|
$ | 26,073,078 | $ | 3,677,407 | $ | 4,532,849 | $ | 1,637,031 | $ | 1,599,610 | $ | 765,847 | ||||||||||||
|
|
|
|
|
|
|
|
|
|
|
|
|
|
|
|||||||||||||
| $ | — | $ | (6,180 | ) | $ | — | $ | — | $ | — | $ | — | $ | — | ||||||||||||
|
|
|
|
|
|
|
|
|
|
|
|
|
|
|
|||||||||||||
| $ | — | $ | 15,133 | $ | — | $ | — | $ | — | $ | — | $ | — | |||||||||||||
|
|
|
|
|
|
|
|
|
|
|
|
|
|
|
|||||||||||||
223
Table of Contents
SPDR INDEX SHARES FUNDS
STATEMENTS OF OPERATIONS (continued)
For the Year Ended September 30, 2017
| SPDR S&P Global Dividend ETF |
SPDR S&P Emerging Markets Small Cap ETF |
|||||||
| INVESTMENT INCOME |
||||||||
| Dividend income — unaffiliated issuers (Note 2) |
$ | 5,720,946 | $ | 12,543,782 | ||||
| Dividend income — affiliated issuers (Notes 2 and 4) |
2,492 | 7,585 | ||||||
| Unaffiliated securities lending income (Note 9) |
25,147 | 344,059 | ||||||
| Affiliated securities lending income (Notes 4 and 9) |
66,565 | 457,009 | ||||||
| Foreign taxes withheld |
(484,497 | ) | (1,433,039 | ) | ||||
|
|
|
|
|
|||||
| TOTAL INVESTMENT INCOME (LOSS) |
5,330,653 | 11,919,396 | ||||||
|
|
|
|
|
|||||
| EXPENSES |
||||||||
| Advisory fees (Note 4) |
512,312 | 2,622,888 | ||||||
| Trustees’ fees and expenses (Note 5) |
1,854 | 6,337 | ||||||
| Miscellaneous expenses |
1,393 | 2,447 | ||||||
|
|
|
|
|
|||||
| TOTAL EXPENSES |
515,559 | 2,631,672 | ||||||
|
|
|
|
|
|||||
| NET EXPENSES |
515,559 | 2,631,672 | ||||||
|
|
|
|
|
|||||
| NET INVESTMENT INCOME (LOSS) |
4,815,094 | 9,287,724 | ||||||
|
|
|
|
|
|||||
| REALIZED AND UNREALIZED GAIN (LOSS) |
||||||||
| Net realized gain (loss) on: |
||||||||
| Investments — unaffiliated issuers* |
1,657,245 | 19,662,092 | ||||||
| In-kind redemptions — unaffiliated issuers |
903,821 | 1,423,196 | ||||||
| Foreign currency transactions |
11,969 | (308,696 | ) | |||||
|
|
|
|
|
|||||
| Net realized gain (loss) |
2,573,035 | 20,776,592 | ||||||
|
|
|
|
|
|||||
| Net change in unrealized appreciation/depreciation on: |
||||||||
| Investments — unaffiliated issuers** |
7,158,356 | 37,278,419 | ||||||
| Foreign currency translations |
(102 | ) | 413 | |||||
|
|
|
|
|
|||||
| Net change in unrealized appreciation/depreciation |
7,158,254 | 37,278,832 | ||||||
|
|
|
|
|
|||||
| NET REALIZED AND UNREALIZED GAIN (LOSS) |
9,731,289 | 58,055,424 | ||||||
|
|
|
|
|
|||||
| NET INCREASE (DECREASE) IN NET ASSETS FROM OPERATIONS |
$ | 14,546,383 | $ | 67,343,148 | ||||
|
|
|
|
|
|||||
| * Includes foreign capital gain taxes |
$ | (13,387 | ) | $ | (553,354 | ) | ||
|
|
|
|
|
|||||
| ** Includes foreign deferred taxes |
$ | 9,635 | $ | 210,639 | ||||
|
|
|
|
|
|||||
See accompanying notes to financial statements.
224
Table of Contents
[This Page Intentionally Left Blank]
225
Table of Contents
SPDR INDEX SHARES FUNDS
STATEMENTS OF CHANGES IN NET ASSETS
| SPDR STOXX Europe 50 ETF | SPDR EURO STOXX Small Cap ETF |
|||||||||||||||
| Year Ended 9/30/17 |
Year Ended 9/30/16 |
Year Ended 9/30/17 |
Year Ended 9/30/16 |
|||||||||||||
| INCREASE (DECREASE) IN NET ASSETS FROM OPERATIONS: |
||||||||||||||||
| Net investment income (loss) |
$ | 6,456,978 | $ | 7,534,831 | $ | 237,931 | $ | 564,210 | ||||||||
| Net realized gain (loss) |
(5,560,708 | ) | (11,770,497 | ) | 515,016 | (3,619,165 | ) | |||||||||
| Net change in unrealized appreciation/depreciation |
39,673,053 | 2,898,366 | 3,288,061 | 964,891 | ||||||||||||
|
|
|
|
|
|
|
|
|
|||||||||
| Net increase (decrease) in net assets resulting from operations |
40,569,323 | (1,337,300 | ) | 4,041,008 | (2,090,064 | ) | ||||||||||
|
|
|
|
|
|
|
|
|
|||||||||
| Net equalization credits and charges (Note 2) |
837,646 | (266,142 | ) | 1,847 | (23,442 | ) | ||||||||||
|
|
|
|
|
|
|
|
|
|||||||||
| DISTRIBUTIONS TO SHAREHOLDERS FROM: |
||||||||||||||||
| Net investment income |
(7,278,371 | ) | (7,235,067 | ) | (243,975 | ) | (524,645 | ) | ||||||||
| Return of capital |
— | — | — | — | ||||||||||||
|
|
|
|
|
|
|
|
|
|||||||||
| Total distributions to shareholders |
(7,278,371 | ) | (7,235,067 | ) | (243,975 | ) | (524,645 | ) | ||||||||
|
|
|
|
|
|
|
|
|
|||||||||
| FROM BENEFICIAL INTEREST TRANSACTIONS: |
||||||||||||||||
| Proceeds from sale of shares sold |
115,916,959 | — | 3,117,605 | 22,141,955 | ||||||||||||
| Cost of shares redeemed |
(17,804,866 | ) | (52,833,596 | ) | — | (19,380,808 | ) | |||||||||
| Net income equalization (Note 2) |
(837,646 | ) | 266,142 | (1,847 | ) | 23,442 | ||||||||||
| Other capital (Note 7) |
41,867 | — | — | — | ||||||||||||
|
|
|
|
|
|
|
|
|
|||||||||
| Net increase (decrease) in net assets from beneficial interest transactions |
97,316,314 | (52,567,454 | ) | 3,115,758 | 2,784,589 | |||||||||||
|
|
|
|
|
|
|
|
|
|||||||||
| Net increase (decrease) in net assets during the period |
131,444,912 | (61,405,963 | ) | 6,914,638 | 146,438 | |||||||||||
| Net assets at beginning of period |
186,219,685 | 247,625,648 | 11,853,957 | 11,707,519 | ||||||||||||
|
|
|
|
|
|
|
|
|
|||||||||
| NET ASSETS AT END OF PERIOD |
$ | 317,664,597 | $ | 186,219,685 | $ | 18,768,595 | $ | 11,853,957 | ||||||||
|
|
|
|
|
|
|
|
|
|||||||||
| Undistributed (distribution in excess of) net investment income (loss) |
$ | — | $ | 230,837 | $ | 39,536 | $ | 44,076 | ||||||||
|
|
|
|
|
|
|
|
|
|||||||||
| SHARES OF BENEFICIAL INTEREST: |
||||||||||||||||
| Shares sold |
3,400,000 | — | 50,000 | 450,000 | ||||||||||||
| Shares redeemed |
(600,000 | ) | (1,700,000 | ) | — | (450,000 | ) | |||||||||
|
|
|
|
|
|
|
|
|
|||||||||
| Net increase (decrease) |
2,800,000 | (1,700,000 | ) | 50,000 | — | |||||||||||
|
|
|
|
|
|
|
|
|
|||||||||
| * | Inception date. |
See accompanying notes to financial statements.
226
Table of Contents
| SPDR S&P Emerging Asia Pacific ETF | SPDR S&P China ETF | SPDR MSCI China A Shares IMI ETF |
||||||||||||||||||||
| Year Ended 9/30/17 |
Year Ended 9/30/16 |
Year Ended 9/30/17 |
Year Ended 9/30/16 |
Year Ended 9/30/17 |
For the Period 10/28/15* - 9/30/16 |
|||||||||||||||||
| $ | 6,803,975 | $ | 6,616,428 | $ | 16,238,110 | $ | 14,873,959 | $ | 13,085 | $ | 15,088 | |||||||||||
| (2,099,858 | ) | (11,195,076 | ) | 12,351,245 | (17,872,233 | ) | (25,119 | ) | (21,921 | ) | ||||||||||||
|
|
66,181,801 |
|
57,859,732 | 216,230,520 | 119,567,331 | 242,801 | (320,806 | ) | ||||||||||||||
|
|
|
|
|
|
|
|
|
|
|
|
|
|||||||||||
|
|
70,885,918 |
|
53,281,084 | 244,819,875 | 116,569,057 | 230,767 | (327,639 | ) | ||||||||||||||
|
|
|
|
|
|
|
|
|
|
|
|
|
|||||||||||
| — | — | — | — | — | — | |||||||||||||||||
|
|
|
|
|
|
|
|
|
|
|
|
|
|||||||||||
| (7,047,374 | ) | (15,794,101 | ) | (13,804,543 | ) | (22,176,022 | ) | (12,958 | ) | (31,418 | ) | |||||||||||
| — | — | — | — | (7,669 | ) | — | ||||||||||||||||
|
|
|
|
|
|
|
|
|
|
|
|
|
|||||||||||
| (7,047,374 | ) | (15,794,101 | ) | (13,804,543 | ) | (22,176,022 | ) | (20,627 | ) | (31,418 | ) | |||||||||||
|
|
|
|
|
|
|
|
|
|
|
|
|
|||||||||||
| 29,445,089 | — | 65,862,580 | 32,048,202 | — | 2,500,000 | |||||||||||||||||
| (15,502,785 | ) | (130,075,797 | ) | (79,843,509 | ) | (132,277,950 | ) | — | — | |||||||||||||
| — | — | — | — | — | — | |||||||||||||||||
| 13,499 | — | 81,680 | 51,557 | — | 6,250 | |||||||||||||||||
|
|
|
|
|
|
|
|
|
|
|
|
|
|||||||||||
|
|
13,955,803 |
|
(130,075,797 | ) | (13,899,249 | ) | (100,178,191 | ) | — | 2,506,250 | ||||||||||||
|
|
|
|
|
|
|
|
|
|
|
|
|
|||||||||||
|
|
77,794,347 |
|
(92,588,814 | ) | 217,116,083 | (5,785,156 | ) | 210,140 | 2,147,193 | |||||||||||||
| 335,858,409 | 428,447,223 | 812,123,029 | 817,908,185 | 2,147,193 | — | |||||||||||||||||
|
|
|
|
|
|
|
|
|
|
|
|
|
|||||||||||
| $ | 413,652,756 | $ | 335,858,409 | $ | 1,029,239,112 | $ | 812,123,029 | $ | 2,357,333 | $ | 2,147,193 | |||||||||||
|
|
|
|
|
|
|
|
|
|
|
|
|
|||||||||||
| $ |
3,688,117 |
|
$ | 4,012,484 | $ | 12,797,160 | $ | 10,188,330 | $ | — | $ | (580 | ) | |||||||||
|
|
|
|
|
|
|
|
|
|
|
|
|
|||||||||||
| 300,000 | — | 800,000 | 400,000 | — | 100,000 | |||||||||||||||||
| (200,000 | ) | (1,800,000 | ) | (1,000,000 | ) | (2,000,000 | ) | — | — | |||||||||||||
|
|
|
|
|
|
|
|
|
|
|
|
|
|||||||||||
| 100,000 | (1,800,000 | ) | (200,000 | ) | (1,600,000 | ) | — | 100,000 | ||||||||||||||
|
|
|
|
|
|
|
|
|
|
|
|
|
|||||||||||
227
Table of Contents
SPDR INDEX SHARES FUNDS
STATEMENTS OF CHANGES IN NET ASSETS (continued)
| SPDR S&P Emerging Markets Dividend ETF |
SPDR S&P International Small Cap ETF |
|||||||||||||||
| Year Ended 9/30/17 |
Year Ended 9/30/16 |
Year Ended 9/30/17 |
Year Ended 9/30/16 |
|||||||||||||
| INCREASE (DECREASE) IN NET ASSETS FROM OPERATIONS: |
||||||||||||||||
| Net investment income (loss) |
$ | 14,349,782 | $ | 13,195,227 | $ | 15,381,998 | $ | 14,450,508 | ||||||||
| Net realized gain (loss) |
28,726,180 | (86,415,279 | ) | 30,389,035 | 22,413,538 | |||||||||||
| Net change in unrealized appreciation/depreciation |
3,575,929 | 103,749,545 | 74,520,391 | 61,492,493 | ||||||||||||
|
|
|
|
|
|
|
|
|
|||||||||
| Net increase (decrease) in net assets resulting from operations |
46,651,891 | 30,529,493 | 120,291,424 | 98,356,539 | ||||||||||||
|
|
|
|
|
|
|
|
|
|||||||||
| Net equalization credits and charges (Note 2) |
447,960 | 388,020 | — | — | ||||||||||||
|
|
|
|
|
|
|
|
|
|||||||||
| DISTRIBUTIONS TO SHAREHOLDERS FROM: |
||||||||||||||||
| Net investment income |
(13,211,413 | ) | (13,540,223 | ) | (18,173,278 | ) | (14,251,797 | ) | ||||||||
| Net realized gains |
— | — | (8,822,560 | ) | (3,694,135 | ) | ||||||||||
|
|
|
|
|
|
|
|
|
|||||||||
| Total distributions to shareholders |
(13,211,413 | ) | (13,540,223 | ) | (26,995,838 | ) | (17,945,932 | ) | ||||||||
|
|
|
|
|
|
|
|
|
|||||||||
| FROM BENEFICIAL INTEREST TRANSACTIONS: |
||||||||||||||||
| Proceeds from sale of shares sold |
95,845,524 | 58,309,589 | 109,633,538 | 60,053,332 | ||||||||||||
| Cost of shares redeemed |
(6,518,090 | ) | (73,579,609 | ) | (18,811,709 | ) | (88,708,125 | ) | ||||||||
| Net income equalization (Note 2) |
(447,960 | ) | (388,020 | ) | — | — | ||||||||||
| Other capital (Note 7) |
47,441 | 160,241 | — | — | ||||||||||||
|
|
|
|
|
|
|
|
|
|||||||||
| Net increase (decrease) in net assets from beneficial interest transactions |
88,926,915 | (15,497,799 | ) | 90,821,829 | (28,654,793 | ) | ||||||||||
|
|
|
|
|
|
|
|
|
|||||||||
| Net increase (decrease) in net assets during the period |
122,815,353 | 1,879,491 | 184,117,415 | 51,755,814 | ||||||||||||
| Net assets at beginning of period |
300,042,234 | 298,162,743 | 702,312,122 | 650,556,308 | ||||||||||||
|
|
|
|
|
|
|
|
|
|||||||||
| NET ASSETS AT END OF PERIOD |
$ | 422,857,587 | $ | 300,042,234 | $ | 886,429,537 | $ | 702,312,122 | ||||||||
|
|
|
|
|
|
|
|
|
|||||||||
| Undistributed (distribution in excess of) net investment income (loss) |
$ | 1,028,057 | $ | (81,214 | ) | $ | 9,085,380 | $ | 10,334,470 | |||||||
|
|
|
|
|
|
|
|
|
|||||||||
| SHARES OF BENEFICIAL INTEREST: |
||||||||||||||||
| Shares sold |
3,250,000 | 2,150,000 | 3,500,000 | 2,100,000 | ||||||||||||
| Shares redeemed |
(250,000 | ) | (3,100,000 | ) | (600,000 | ) | (3,200,000 | ) | ||||||||
|
|
|
|
|
|
|
|
|
|||||||||
| Net increase (decrease) |
3,000,000 | (950,000 | ) | 2,900,000 | (1,100,000 | ) | ||||||||||
|
|
|
|
|
|
|
|
|
|||||||||
See accompanying notes to financial statements.
228
Table of Contents
| SPDR S&P Global Infrastructure ETF |
SPDR S&P Global Natural Resources ETF |
SPDR MSCI ACWI IMI ETF | ||||||||||||||||||||
| Year Ended 9/30/17 |
Year Ended 9/30/16 |
Year Ended 9/30/17 |
Year Ended 9/30/16 |
Year Ended 9/30/17 |
Year Ended 9/30/16 |
|||||||||||||||||
| $ | 4,524,990 | $ | 2,426,148 | $ | 27,102,435 | $ | 16,618,302 | $ | 1,928,550 | $ | 1,099,480 | |||||||||||
| (420,266 | ) | (3,623,229 | ) | (14,310,322 | ) | (54,248,801 | ) | 3,826,936 | (139,930 | ) | ||||||||||||
|
|
13,120,650 |
|
9,726,064 | 164,355,129 | 169,500,267 | 9,476,943 | 4,474,695 | |||||||||||||||
|
|
|
|
|
|
|
|
|
|
|
|
|
|||||||||||
|
|
17,225,374 |
|
8,528,983 | 177,147,242 | 131,869,768 | 15,232,429 | 5,434,245 | |||||||||||||||
|
|
|
|
|
|
|
|
|
|
|
|
|
|||||||||||
| — | — | — | — | — | — | |||||||||||||||||
|
|
|
|
|
|
|
|
|
|
|
|
|
|||||||||||
| (3,938,322 | ) | (2,376,551 | ) | (21,131,997 | ) | (17,723,932 | ) | (1,770,932 | ) | (914,554 | ) | |||||||||||
| — | — | — | — | — | — | |||||||||||||||||
|
|
|
|
|
|
|
|
|
|
|
|
|
|||||||||||
| (3,938,322 | ) | (2,376,551 | ) | (21,131,997 | ) | (17,723,932 | ) | (1,770,932 | ) | (914,554 | ) | |||||||||||
|
|
|
|
|
|
|
|
|
|
|
|
|
|||||||||||
| 91,715,714 | 35,842,130 | 383,018,989 | 197,305,994 | 26,144,694 | 25,177,393 | |||||||||||||||||
| (9,475,992 | ) | (12,443,846 | ) | (35,713,570 | ) | (158,440,483 | ) | (14,167,487 | ) | — | ||||||||||||
| — | — | — | — | — | — | |||||||||||||||||
| — | — | — | — | — | — | |||||||||||||||||
|
|
|
|
|
|
|
|
|
|
|
|
|
|||||||||||
|
|
82,239,722 |
|
23,398,284 | 347,305,419 | 38,865,511 | 11,977,207 | 25,177,393 | |||||||||||||||
|
|
|
|
|
|
|
|
|
|
|
|
|
|||||||||||
|
|
95,526,774 |
|
29,550,716 | 503,320,664 | 153,011,347 | 25,438,704 | 29,697,084 | |||||||||||||||
| 85,850,176 | 56,299,460 | 722,832,877 | 569,821,530 | 64,882,630 | 35,185,546 | |||||||||||||||||
|
|
|
|
|
|
|
|
|
|
|
|
|
|||||||||||
| $ | 181,376,950 | $ | 85,850,176 | $ | 1,226,153,541 | $ | 722,832,877 | $ | 90,321,334 | $ | 64,882,630 | |||||||||||
|
|
|
|
|
|
|
|
|
|
|
|
|
|||||||||||
| $ |
1,416,548 |
|
$ | 837,172 | $ | 11,067,062 | $ | 4,489,524 | $ | 837,631 | $ | 656,113 | ||||||||||
|
|
|
|
|
|
|
|
|
|
|
|
|
|||||||||||
| 1,900,000 | 800,000 | 9,150,000 | 5,450,000 | 400,000 | 400,000 | |||||||||||||||||
| (200,000 | ) | (300,000 | ) | (900,000 | ) | (4,450,000 | ) | (200,000 | ) | — | ||||||||||||
|
|
|
|
|
|
|
|
|
|
|
|
|
|||||||||||
| 1,700,000 | 500,000 | 8,250,000 | 1,000,000 | 200,000 | 400,000 | |||||||||||||||||
|
|
|
|
|
|
|
|
|
|
|
|
|
|||||||||||
229
Table of Contents
SPDR INDEX SHARES FUNDS
STATEMENTS OF CHANGES IN NET ASSETS (continued)
| SPDR MSCI ACWI Low Carbon Target ETF |
SPDR MSCI EAFE Fossil Fuel Reserves Free ETF |
SPDR MSCI Emerging Markets Fossil Fuel Reserves Free ETF |
||||||||||||||
| Year Ended 9/30/17 |
Year Ended 9/30/16 |
For the Period 10/24/16* - 9/30/17 |
For the Period 10/24/16* - 9/30/17 |
|||||||||||||
| INCREASE (DECREASE) IN NET ASSETS FROM OPERATIONS: |
||||||||||||||||
| Net investment income (loss) |
$ | 2,942,232 | $ | 2,121,256 | $ | 886,180 | $ | 211,804 | ||||||||
| Net realized gain (loss) |
(99,729 | ) | (801,855 | ) | 180,696 | 92,836 | ||||||||||
| Net change in unrealized appreciation/depreciation |
19,444,957 | 9,207,273 | 5,284,333 | 1,575,752 | ||||||||||||
|
|
|
|
|
|
|
|
|
|||||||||
| Net increase (decrease) in net assets resulting from operations |
22,287,460 | 10,526,674 | 6,351,209 | 1,880,392 | ||||||||||||
|
|
|
|
|
|
|
|
|
|||||||||
| Net equalization credits and charges (Note 2) |
276,534 | 25,820 | 10,704 | 26,909 | ||||||||||||
|
|
|
|
|
|
|
|
|
|||||||||
| DISTRIBUTIONS TO SHAREHOLDERS FROM: |
||||||||||||||||
| Net investment income |
(2,915,464 | ) | (2,080,165 | ) | (803,032 | ) | (231,170 | ) | ||||||||
| Net realized gains |
— | (59,509 | ) | — | — | |||||||||||
|
|
|
|
|
|
|
|
|
|||||||||
| Total distributions to shareholders |
(2,915,464 | ) | (2,139,674 | ) | (803,032 | ) | (231,170 | ) | ||||||||
|
|
|
|
|
|
|
|
|
|||||||||
| FROM BENEFICIAL INTEREST TRANSACTIONS: |
||||||||||||||||
| Proceeds from sale of shares sold |
30,178,050 | 6,822,239 | 40,431,724 | 14,664,269 | ||||||||||||
| Cost of shares redeemed |
— | — | — | — | ||||||||||||
| Net income equalization (Note 2) |
(276,534 | ) | (25,820 | ) | (10,704 | ) | (26,909 | ) | ||||||||
| Other capital (Note 7) |
— | — | — | 4,622 | ||||||||||||
|
|
|
|
|
|
|
|
|
|||||||||
| Net increase (decrease) in net assets from beneficial interest transactions |
29,901,516 | 6,796,419 | 40,421,020 | 14,641,982 | ||||||||||||
|
|
|
|
|
|
|
|
|
|||||||||
| Net increase (decrease) in net assets during the period |
49,550,046 | 15,209,239 | 45,979,901 | 16,318,113 | ||||||||||||
| Net assets at beginning of period |
96,683,474 | 81,474,235 | — | — | ||||||||||||
|
|
|
|
|
|
|
|
|
|||||||||
| NET ASSETS AT END OF PERIOD |
$ | 146,233,520 | $ | 96,683,474 | $ | 45,979,901 | $ | 16,318,113 | ||||||||
|
|
|
|
|
|
|
|
|
|||||||||
| Undistributed (distribution in excess of) net investment income (loss) |
$ | 542,293 | $ | 561,059 | $ | 91,937 | $ | (23,946 | ) | |||||||
|
|
|
|
|
|
|
|
|
|||||||||
| SHARES OF BENEFICIAL INTEREST: |
||||||||||||||||
| Shares sold |
400,000 | 100,000 | 650,000 | 250,000 | ||||||||||||
| Shares redeemed |
— | — | — | — | ||||||||||||
|
|
|
|
|
|
|
|
|
|||||||||
| Net increase (decrease) |
400,000 | 100,000 | 650,000 | 250,000 | ||||||||||||
|
|
|
|
|
|
|
|
|
|||||||||
| * | Inception date. |
See accompanying notes to financial statements.
230
Table of Contents
| SPDR MSCI EAFE StrategicFactors ETF |
SPDR MSCI Emerging Markets StrategicFactors ETF |
SPDR MSCI World StrategicFactors ETF |
||||||||||||||||||||
| Year Ended 9/30/17 |
Year Ended 9/30/16 |
Year Ended 9/30/17 |
Year Ended 9/30/16 |
Year Ended 9/30/17 |
Year Ended 9/30/16 |
|||||||||||||||||
| $ | 3,428,424 | $ | 171,032 | $ | 4,025,325 | $ | 2,429,219 | $ | 523,246 | $ | 140,223 | |||||||||||
| 3,033 | (176,756 | ) | (753,946 | ) | (3,098,829 | ) | 1,695,548 | (11,281 | ) | |||||||||||||
|
|
19,736,059 |
|
495,100 | 22,801,699 | 15,752,756 | 1,458,613 | 657,413 | |||||||||||||||
|
|
|
|
|
|
|
|
|
|
|
|
|
|||||||||||
|
|
23,167,516 |
|
489,376 | 26,073,078 | 15,083,146 | 3,677,407 | 786,355 | |||||||||||||||
|
|
|
|
|
|
|
|
|
|
|
|
|
|||||||||||
| |
— |
— | — | — | — | — | ||||||||||||||||
|
|
|
|
|
|
|
|
|
|
|
|
|
|||||||||||
| (2,367,462 | ) | (150,949 | ) | (2,754,029 | ) | (1,961,532 | ) | (400,647 | ) | (136,581 | ) | |||||||||||
| — | — | — | — | — | (70,354 | ) | ||||||||||||||||
|
|
|
|
|
|
|
|
|
|
|
|
|
|||||||||||
| (2,367,462 | ) | (150,949 | ) | (2,754,029 | ) | (1,961,532 | ) | (400,647 | ) | (206,935 | ) | |||||||||||
|
|
|
|
|
|
|
|
|
|
|
|
|
|||||||||||
| 163,529,104 | 2,708,203 | 74,051,529 | 57,249,195 | 19,119,111 | — | |||||||||||||||||
| — | — | — | (25,307,383 | ) | (7,165,424 | ) | — | |||||||||||||||
| — | — | — | — | — | — | |||||||||||||||||
| — | — | 35,154 | 104,679 | — | — | |||||||||||||||||
|
|
|
|
|
|
|
|
|
|
|
|
|
|||||||||||
|
|
163,529,104 |
|
2,708,203 | 74,086,683 | 32,046,491 | 11,953,687 | — | |||||||||||||||
|
|
|
|
|
|
|
|
|
|
|
|
|
|||||||||||
|
|
184,329,158 |
|
3,046,630 | 97,405,732 | 45,168,105 | 15,230,447 | 579,420 | |||||||||||||||
| 8,314,895 | 5,268,265 | 116,539,231 | 71,371,126 | 6,375,092 | 5,795,672 | |||||||||||||||||
|
|
|
|
|
|
|
|
|
|
|
|
|
|||||||||||
| $ | 192,644,053 | $ | 8,314,895 | $ | 213,944,963 | $ | 116,539,231 | $ | 21,605,539 | $ | 6,375,092 | |||||||||||
|
|
|
|
|
|
|
|
|
|
|
|
|
|||||||||||
| $ |
1,154,134 |
|
$ | 62,373 | $ | 2,413,893 | $ | 1,176,573 | $ | 164,753 | $ | 36,260 | ||||||||||
|
|
|
|
|
|
|
|
|
|
|
|
|
|||||||||||
| 2,900,000 | 50,000 | 1,350,000 | 1,175,000 | 300,000 | — | |||||||||||||||||
| — | — | — | (500,000 | ) | (100,000 | ) | — | |||||||||||||||
|
|
|
|
|
|
|
|
|
|
|
|
|
|||||||||||
| 2,900,000 | 50,000 | 1,350,000 | 675,000 | 200,000 | — | |||||||||||||||||
|
|
|
|
|
|
|
|
|
|
|
|
|
|||||||||||
231
Table of Contents
SPDR INDEX SHARES FUNDS
STATEMENTS OF CHANGES IN NET ASSETS (continued)
| SPDR MSCI Canada StrategicFactors ETF |
SPDR MSCI Germany StrategicFactors ETF |
|||||||||||||||
| Year Ended 9/30/17 |
Year Ended 9/30/16 |
Year Ended 9/30/17 |
Year Ended 9/30/16 |
|||||||||||||
| INCREASE (DECREASE) IN NET ASSETS FROM OPERATIONS: |
||||||||||||||||
| Net investment income (loss) |
$ | 602,610 | $ | 324,614 | $ | 283,624 | $ | 260,990 | ||||||||
| Net realized gain (loss) |
(252,542 | ) | (191,554 | ) | (626,389 | ) | (436,439 | ) | ||||||||
| Net change in unrealized appreciation/depreciation |
4,182,781 | 2,431,840 | 1,979,796 | 1,283,855 | ||||||||||||
|
|
|
|
|
|
|
|
|
|||||||||
| Net increase (decrease) in net assets resulting from operations |
4,532,849 | 2,564,900 | 1,637,031 | 1,108,406 | ||||||||||||
|
|
|
|
|
|
|
|
|
|||||||||
| Net equalization credits and charges (Note 2) |
48,731 | 31,271 | 117,483 | 43,205 | ||||||||||||
|
|
|
|
|
|
|
|
|
|||||||||
| DISTRIBUTIONS TO SHAREHOLDERS FROM: |
||||||||||||||||
| Net investment income |
(529,524 | ) | (294,086 | ) | (389,383 | ) | (263,141 | ) | ||||||||
| Net realized gains |
— | — | — | — | ||||||||||||
|
|
|
|
|
|
|
|
|
|||||||||
| Total distributions to shareholders |
(529,524 | ) | (294,086 | ) | (389,383 | ) | (263,141 | ) | ||||||||
|
|
|
|
|
|
|
|
|
|||||||||
| FROM BENEFICIAL INTEREST TRANSACTIONS: |
||||||||||||||||
| Proceeds from sale of shares sold |
16,319,215 | 6,840,285 | 11,900,436 | 2,497,423 | ||||||||||||
| Cost of shares redeemed |
— | — | (7,261,821 | ) | — | |||||||||||
| Net income equalization (Note 2) |
(48,731 | ) | (31,271 | ) | (117,483 | ) | (43,205 | ) | ||||||||
|
|
|
|
|
|
|
|
|
|||||||||
| Net increase (decrease) in net assets from beneficial interest transactions |
16,270,484 | 6,809,014 | 4,521,132 | 2,454,218 | ||||||||||||
|
|
|
|
|
|
|
|
|
|||||||||
| Net increase (decrease) in net assets during the period |
20,322,540 | 9,111,099 | 5,886,263 | 3,342,688 | ||||||||||||
| Net assets at beginning of period |
18,430,198 | 9,319,099 | 13,030,754 | 9,688,066 | ||||||||||||
|
|
|
|
|
|
|
|
|
|||||||||
| NET ASSETS AT END OF PERIOD |
$ | 38,752,738 | $ | 18,430,198 | $ | 18,917,017 | $ | 13,030,754 | ||||||||
|
|
|
|
|
|
|
|
|
|||||||||
| Undistributed (distribution in excess of) net investment income (loss) |
$ | 167,770 | $ | 83,628 | $ | — | $ | (1,413 | ) | |||||||
|
|
|
|
|
|
|
|
|
|||||||||
| SHARES OF BENEFICIAL INTEREST: |
||||||||||||||||
| Shares sold |
300,000 | 150,000 | 200,000 | 50,000 | ||||||||||||
| Shares redeemed |
— | — | (150,000 | ) | — | |||||||||||
|
|
|
|
|
|
|
|
|
|||||||||
| Net increase (decrease) |
300,000 | 150,000 | 50,000 | 50,000 | ||||||||||||
|
|
|
|
|
|
|
|
|
|||||||||
See accompanying notes to financial statements.
232
Table of Contents
| SPDR MSCI Japan StrategicFactors ETF |
SPDR MSCI United Kingdom StrategicFactors ETF |
SPDR S&P Global Dividend ETF | ||||||||||||||||||||
| Year Ended 9/30/17 |
Year Ended 9/30/16 |
Year Ended 9/30/17 |
Year Ended 9/30/16 |
Year Ended 9/30/17 |
Year Ended 9/30/16 |
|||||||||||||||||
| $ | 229,671 | $ | 170,716 | $ | 239,185 | $ | 90,890 | $ | 4,815,094 | $ | 3,147,006 | |||||||||||
| 782,617 | 1,112 | 125,843 | (99,454 | ) | 2,573,035 | (6,512,205 | ) | |||||||||||||||
|
|
587,322 |
|
1,271,980 | 400,819 | 11,455 | 7,158,254 | 11,373,653 | |||||||||||||||
|
|
|
|
|
|
|
|
|
|
|
|
|
|||||||||||
|
|
1,599,610 |
|
1,443,808 | 765,847 | 2,891 | 14,546,383 | 8,008,454 | |||||||||||||||
|
|
|
|
|
|
|
|
|
|
|
|
|
|||||||||||
| (1,004 | ) | 48,180 | 124,450 | — | 194,504 | 100,570 | ||||||||||||||||
|
|
|
|
|
|
|
|
|
|
|
|
|
|||||||||||
| (216,441 | ) | (191,385 | ) | (329,690 | ) | (96,601 | ) | (4,751,992 | ) | (3,120,664 | ) | |||||||||||
| — | (2,172 | ) | — | — | — | (388,876 | ) | |||||||||||||||
|
|
|
|
|
|
|
|
|
|
|
|
|
|||||||||||
| (216,441 | ) | (193,557 | ) | (329,690 | ) | (96,601 | ) | (4,751,992 | ) | (3,509,540 | ) | |||||||||||
|
|
|
|
|
|
|
|
|
|
|
|
|
|||||||||||
| 6,962,943 | 6,355,948 | 10,254,196 | — | 57,947,434 | 46,853,198 | |||||||||||||||||
| (6,935,724 | ) | (6,070,906 | ) | (7,804,799 | ) | — | (6,314,476 | ) | (20,303,786 | ) | ||||||||||||
| 1,004 | (48,180 | ) | (124,450 | ) | — | (194,504 | ) | (100,570 | ) | |||||||||||||
|
|
|
|
|
|
|
|
|
|
|
|
|
|||||||||||
|
|
28,223 |
|
236,862 | 2,324,947 | — | 51,438,454 | 26,448,842 | |||||||||||||||
|
|
|
|
|
|
|
|
|
|
|
|
|
|||||||||||
|
|
1,410,388 |
|
1,535,293 | 2,885,554 | (93,710 | ) | 61,427,349 | 31,048,326 | ||||||||||||||
| 13,486,767 | 11,951,474 | 2,413,169 | 2,506,879 | 104,297,826 | 73,249,500 | |||||||||||||||||
|
|
|
|
|
|
|
|
|
|
|
|
|
|||||||||||
| $ | 14,897,155 | $ | 13,486,767 | $ | 5,298,723 | $ | 2,413,169 | $ | 165,725,175 | $ | 104,297,826 | |||||||||||
|
|
|
|
|
|
|
|
|
|
|
|
|
|||||||||||
| $ |
102,102 |
|
$ | 43,397 | $ | (4,993 | ) | $ | (3,238 | ) | $ | 104,420 | $ | 42,404 | ||||||||
|
|
|
|
|
|
|
|
|
|
|
|
|
|||||||||||
| 100,000 | 100,000 | 200,000 | — | 900,000 | 750,000 | |||||||||||||||||
| (100,000 | ) | (100,000 | ) | (150,000 | ) | — | (100,000 | ) | (350,000 | ) | ||||||||||||
|
|
|
|
|
|
|
|
|
|
|
|
|
|||||||||||
| — | — | 50,000 | — | 800,000 | 400,000 | |||||||||||||||||
|
|
|
|
|
|
|
|
|
|
|
|
|
|||||||||||
233
Table of Contents
SPDR INDEX SHARES FUNDS
STATEMENTS OF CHANGES IN NET ASSETS (continued)
| SPDR S&P Emerging Markets Small Cap ETF |
||||||||
| Year Ended 9/30/17 |
Year Ended 9/30/16 |
|||||||
| INCREASE (DECREASE) IN NET ASSETS FROM OPERATIONS: |
||||||||
| Net investment income (loss) |
$ | 9,287,724 | $ | 7,344,778 | ||||
| Net realized gain (loss) |
20,776,592 | (44,057,831 | ) | |||||
| Net change in unrealized appreciation/depreciation |
37,278,832 | 91,799,184 | ||||||
|
|
|
|
|
|||||
| Net increase (decrease) in net assets resulting from operations. |
67,343,148 | 55,086,131 | ||||||
|
|
|
|
|
|||||
| DISTRIBUTIONS TO SHAREHOLDERS FROM: |
||||||||
| Net investment income |
(8,720,849 | ) | (8,865,797 | ) | ||||
|
|
|
|
|
|||||
| Total distributions to shareholders |
(8,720,849 | ) | (8,865,797 | ) | ||||
|
|
|
|
|
|||||
| FROM BENEFICIAL INTEREST TRANSACTIONS: |
||||||||
| Proceeds from sale of shares sold |
133,120,554 | 11,394,800 | ||||||
| Cost of shares redeemed |
(33,210,110 | ) | (111,075,298 | ) | ||||
| Other capital (Note 7) |
249,509 | 335,596 | ||||||
|
|
|
|
|
|||||
| Net increase (decrease) in net assets from beneficial interest transactions |
100,159,953 | (99,344,902 | ) | |||||
|
|
|
|
|
|||||
| Net increase (decrease) in net assets during the period |
158,782,252 | (53,124,568 | ) | |||||
| Net assets at beginning of period |
320,556,129 | 373,680,697 | ||||||
|
|
|
|
|
|||||
| NET ASSETS AT END OF PERIOD |
$ | 479,338,381 | $ | 320,556,129 | ||||
|
|
|
|
|
|||||
| Undistributed (distribution in excess of) net investment income (loss) |
$ | 7,196,499 | $ | 5,556,993 | ||||
|
|
|
|
|
|||||
| SHARES OF BENEFICIAL INTEREST: |
||||||||
| Shares sold |
3,000,000 | 300,000 | ||||||
| Shares redeemed |
(800,000 | ) | (2,900,000 | ) | ||||
|
|
|
|
|
|||||
| Net increase (decrease) |
2,200,000 | (2,600,000 | ) | |||||
|
|
|
|
|
|||||
See accompanying notes to financial statements.
234
Table of Contents
SPDR INDEX SHARES FUNDS
Selected data for a share outstanding throughout each period
| SPDR STOXX Europe 50 ETF | ||||||||||||||||||||
| Year Ended 9/30/17 |
Year Ended 9/30/16 |
Year Ended 9/30/15 |
Year Ended 9/30/14 |
Year Ended 9/30/13 |
||||||||||||||||
| Net asset value, beginning of period |
$ | 30.28 | $ | 31.54 | $ | 36.86 | $ | 36.47 | $ | 31.50 | ||||||||||
|
|
|
|
|
|
|
|
|
|
|
|||||||||||
| Income (loss) from investment operations: |
||||||||||||||||||||
| Net investment income (loss) (a) |
0.95 | 1.10 | 1.23 | 2.03 | (b) | 1.19 | ||||||||||||||
| Net realized and unrealized gain (loss) (c) |
5.14 | (1.21 | ) | (5.37 | ) | 0.22 | 4.84 | |||||||||||||
|
|
|
|
|
|
|
|
|
|
|
|||||||||||
| Total from investment operations |
6.09 | (0.11 | ) | (4.14 | ) | 2.25 | 6.03 | |||||||||||||
|
|
|
|
|
|
|
|
|
|
|
|||||||||||
| Net equalization credits and charges (a) |
0.12 | (0.04 | ) | 0.04 | 0.11 | 0.13 | ||||||||||||||
|
|
|
|
|
|
|
|
|
|
|
|||||||||||
| Other capital |
0.01 | — | — | — | — | |||||||||||||||
|
|
|
|
|
|
|
|
|
|
|
|||||||||||
| Distributions to shareholders from: |
||||||||||||||||||||
| Net investment income |
(1.01 | ) | (1.11 | ) | (1.22 | ) | (1.97 | ) | (1.19 | ) | ||||||||||
|
|
|
|
|
|
|
|
|
|
|
|||||||||||
| Net asset value, end of period |
$ | 35.49 | $ | 30.28 | $ | 31.54 | $ | 36.86 | $ | 36.47 | ||||||||||
|
|
|
|
|
|
|
|
|
|
|
|||||||||||
| Total return (d) |
20.83 | % | (0.42 | )% | (11.36 | )% | 6.33 | %(b) | 19.94 | %(e) | ||||||||||
| Ratios and Supplemental Data: |
||||||||||||||||||||
| Net assets, end of period (in 000s) |
$ | 317,665 | $ | 186,220 | $ | 247,626 | $ | 261,730 | $ | 109,419 | ||||||||||
| Ratios to average net assets: |
||||||||||||||||||||
| Total expenses |
0.29 | % | 0.29 | % | 0.29 | % | 0.29 | % | 0.29 | % | ||||||||||
| Net investment income (loss) |
2.92 | % | 3.57 | % | 3.50 | % | 5.28 | %(b) | 3.47 | % | ||||||||||
| Portfolio turnover rate (f) |
8 | % | 8 | % | 9 | % | 9 | % | 12 | % | ||||||||||
| (a) | Per share numbers have been calculated using average shares outstanding, which more appropriately presents the per share data for the period. |
| (b) | Net investment income per share and ratio of net investment income to average net assets reflect receipt of special dividends from portfolio holdings. The resulting increase to net investment income amounted to $0.76 per share and 1.96% of average net assets. If the special dividends were not received during the year ended September 30, 2014, the total return would have been 4.56%. |
| (c) | Amounts shown in this caption for a share outstanding may not accord with the change in aggregate gains and losses in securities for the fiscal period because of the timing of sales and repurchases of Fund shares in relation to fluctuating market values for the Fund. |
| (d) | Total return is calculated assuming a purchase of shares at net asset value on the first day and a sale at net asset value on the last day of each period reported. Distributions are assumed, for the purpose of this calculation, to be reinvested at net asset value per share on the respective payment dates of each distribution. Broker commission charges are not included in this calculation. |
| (e) | If the Adviser had not made a contribution during the period ended September 30, 2013, the total return would have been 19.93%. |
| (f) | Portfolio turnover rate excludes securities received or delivered from in-kind processing of creations or redemptions. |
See accompanying notes to financial statements.
235
Table of Contents
SPDR INDEX SHARES FUNDS
FINANCIAL HIGHLIGHTS (continued)
Selected data for a share outstanding throughout each period
| SPDR EURO STOXX Small Cap ETF | ||||||||||||||||
| Year Ended 9/30/17 |
Year Ended 9/30/16 |
Year Ended 9/30/15 |
For the Period 6/4/14* - 9/30/14 |
|||||||||||||
| Net asset value, beginning of period |
$ | 47.42 | $ | 46.83 | $ | 50.65 | $ | 60.00 | ||||||||
|
|
|
|
|
|
|
|
|
|||||||||
| Income (loss) from investment operations: |
||||||||||||||||
| Net investment income (loss) (a) |
0.94 | 1.00 | 1.18 | 0.16 | ||||||||||||
| Net realized and unrealized gain (loss) (b) |
15.17 | 0.43 | (4.00 | ) | (9.47 | ) | ||||||||||
|
|
|
|
|
|
|
|
|
|||||||||
| Total from investment operations |
16.11 | 1.43 | (2.82 | ) | (9.31 | ) | ||||||||||
|
|
|
|
|
|
|
|
|
|||||||||
| Net equalization credits and charges (a) |
0.01 | (0.04 | ) | 0.40 | — | |||||||||||
|
|
|
|
|
|
|
|
|
|||||||||
| Voluntary contribution from Adviser |
— | — | — | 0.07 | ||||||||||||
|
|
|
|
|
|
|
|
|
|||||||||
| Distributions to shareholders from: |
||||||||||||||||
| Net investment income |
(0.98 | ) | (0.80 | ) | (1.40 | ) | (0.11 | ) | ||||||||
|
|
|
|
|
|
|
|
|
|||||||||
| Net asset value, end of period |
$ | 62.56 | $ | 47.42 | $ | 46.83 | $ | 50.65 | ||||||||
|
|
|
|
|
|
|
|
|
|||||||||
| Total return (c) |
34.30 | % | 3.14 | % | (4.97 | )% | (15.43 | )%(d) | ||||||||
| Ratios and Supplemental Data: |
||||||||||||||||
| Net assets, end of period (in 000s) |
$ | 18,769 | $ | 11,854 | $ | 11,708 | $ | 7,598 | ||||||||
| Ratios to average net assets: |
||||||||||||||||
| Total expenses |
0.45 | % | 0.45 | % | 0.46 | % | 0.45 | %(e) | ||||||||
| Net investment income (loss) |
1.79 | % | 2.13 | % | 2.33 | % | 0.89 | %(e) | ||||||||
| Portfolio turnover rate (f) |
40 | % | 53 | % | 46 | % | 30 | %(g) | ||||||||
| * | Commencement of operations. |
| (a) | Per share numbers have been calculated using average shares outstanding, which more appropriately presents the per share data for the period. |
| (b) | Amounts shown in this caption for a share outstanding may not accord with the change in aggregate gains and losses in securities for the fiscal period because of the timing of sales and repurchases of Fund shares in relation to fluctuating market values for the Fund. |
| (c) | Total return is calculated assuming a purchase of shares at net asset value on the first day and a sale at net asset value on the last day of each period reported. Distributions are assumed, for the purpose of this calculation, to be reinvested at net asset value per share on the respective payment dates of each distribution. Total return for periods of less than one year is not annualized. Broker commission charges are not included in this calculation. |
| (d) | If the Adviser had not made a contribution during the period ended September 30, 2014, the total return would have been (15.54)%. |
| (e) | Annualized. |
| (f) | Portfolio turnover rate excludes securities received or delivered from in-kind processing of creations or redemptions. |
| (g) | Not annualized. |
See accompanying notes to financial statements.
236
Table of Contents
SPDR INDEX SHARES FUNDS
FINANCIAL HIGHLIGHTS (continued)
Selected data for a share outstanding throughout each period
| SPDR S&P Emerging Asia Pacific ETF | ||||||||||||||||||||
| Year Ended 9/30/17 |
Year Ended 9/30/16 |
Year Ended 9/30/15 |
Year Ended 9/30/14 |
Year Ended 9/30/13 |
||||||||||||||||
| Net asset value, beginning of period |
$ | 81.92 | $ | 72.62 | $ | 83.84 | $ | 75.37 | $ | 73.54 | ||||||||||
|
|
|
|
|
|
|
|
|
|
|
|||||||||||
| Income (loss) from investment operations: |
||||||||||||||||||||
| Net investment income (loss) (a) |
1.71 | 1.38 | 1.83 | 1.74 | 1.62 | |||||||||||||||
| Net realized and unrealized gain (loss) (b) |
16.67 | 10.81 | (11.83 | ) | 7.95 | 1.96 | ||||||||||||||
|
|
|
|
|
|
|
|
|
|
|
|||||||||||
| Total from investment operations |
18.38 | 12.19 | (10.00 | ) | 9.69 | 3.58 | ||||||||||||||
|
|
|
|
|
|
|
|
|
|
|
|||||||||||
| Other capital |
0.00 | (c) | — | — | — | — | ||||||||||||||
|
|
|
|
|
|
|
|
|
|
|
|||||||||||
| Distributions to shareholders from: |
||||||||||||||||||||
| Net investment income |
(1.81 | ) | (2.89 | ) | (1.22 | ) | (1.22 | ) | (1.75 | ) | ||||||||||
|
|
|
|
|
|
|
|
|
|
|
|||||||||||
| Net asset value, end of period |
$ | 98.49 | $ | 81.92 | $ | 72.62 | $ | 83.84 | $ | 75.37 | ||||||||||
|
|
|
|
|
|
|
|
|
|
|
|||||||||||
| Total return (d) |
23.02 | % | 17.24 | % | (12.15 | )% | 12.99 | % | 4.91 | % | ||||||||||
| Ratios and Supplemental Data: |
||||||||||||||||||||
| Net assets, end of period (in 000s) |
$ | 413,653 | $ | 335,858 | $ | 428,447 | $ | 687,494 | $ | 399,460 | ||||||||||
| Ratios to average net assets: |
||||||||||||||||||||
| Total expenses |
0.49 | % | 0.49 | % | 0.53 | % | 0.59 | % | 0.59 | % | ||||||||||
| Net investment income (loss) |
1.98 | % | 1.85 | % | 2.14 | % | 2.17 | % | 2.14 | % | ||||||||||
| Portfolio turnover rate (e) |
4 | % | 1 | % | 28 | % | 15 | % | 16 | % | ||||||||||
| (a) | Per share numbers have been calculated using average shares outstanding, which more appropriately presents the per share data for the period. |
| (b) | Amounts shown in this caption for a share outstanding may not accord with the change in aggregate gains and losses in securities for the fiscal period because of the timing of sales and repurchases of Fund shares in relation to fluctuating market values for the Fund. |
| (c) | Amount is less than $0.005 per share. |
| (d) | Total return is calculated assuming a purchase of shares at net asset value on the first day and a sale at net asset value on the last day of each period reported. Distributions are assumed, for the purpose of this calculation, to be reinvested at net asset value per share on the respective payment dates of each distribution. Broker commission charges are not included in this calculation. |
| (e) | Portfolio turnover rate excludes securities received or delivered from in-kind processing of creations or redemptions. |
See accompanying notes to financial statements.
237
Table of Contents
SPDR INDEX SHARES FUNDS
FINANCIAL HIGHLIGHTS (continued)
Selected data for a share outstanding throughout each period
| SPDR S&P China ETF | ||||||||||||||||||||
| Year Ended 9/30/17 |
Year Ended 9/30/16 |
Year Ended 9/30/15 |
Year Ended 9/30/14 |
Year Ended 9/30/13 |
||||||||||||||||
| Net asset value, beginning of period |
$ | 78.85 | $ | 68.73 | $ | 76.42 | $ | 74.18 | $ | 65.45 | ||||||||||
|
|
|
|
|
|
|
|
|
|
|
|||||||||||
| Income (loss) from investment operations: |
||||||||||||||||||||
| Net investment income (loss) (a) |
1.57 | (b) | 1.38 | 1.92 | 1.77 | 1.63 | ||||||||||||||
| Net realized and unrealized gain (loss) (c) |
22.78 | 10.68 | (8.34 | ) | 1.93 | 8.72 | ||||||||||||||
|
|
|
|
|
|
|
|
|
|
|
|||||||||||
| Total from investment operations |
24.35 | 12.06 | (6.42 | ) | 3.70 | 10.35 | ||||||||||||||
|
|
|
|
|
|
|
|
|
|
|
|||||||||||
| Other capital |
0.01 | 0.00 | (d) | 0.02 | — | — | ||||||||||||||
|
|
|
|
|
|
|
|
|
|
|
|||||||||||
| Distributions to shareholders from: |
||||||||||||||||||||
| Net investment income |
(1.31 | ) | (1.94 | ) | (1.29 | ) | (1.46 | ) | (1.62 | ) | ||||||||||
|
|
|
|
|
|
|
|
|
|
|
|||||||||||
| Net asset value, end of period |
$ | 101.90 | $ | 78.85 | $ | 68.73 | $ | 76.42 | $ | 74.18 | ||||||||||
|
|
|
|
|
|
|
|
|
|
|
|||||||||||
| Total return (e) |
31.50 | %(b) | 17.81 | % | (8.69 | )% | 5.00 | % | 16.20 | % | ||||||||||
| Ratios and Supplemental Data: |
||||||||||||||||||||
| Net assets, end of period (in 000s) |
$ | 1,029,239 | $ | 812,123 | $ | 817,908 | $ | 947,605 | $ | 897,623 | ||||||||||
| Ratios to average net assets: |
||||||||||||||||||||
| Total expenses |
0.59 | % | 0.59 | % | 0.59 | % | 0.59 | % | 0.59 | % | ||||||||||
| Net investment income (loss) |
1.85 | %(b) | 1.94 | % | 2.32 | % | 2.33 | % | 2.31 | % | ||||||||||
| Portfolio turnover rate (f) |
5 | % | 6 | % | 14 | % | 10 | % | 12 | % | ||||||||||
| (a) | Per share numbers have been calculated using average shares outstanding, which more appropriately presents the per share data for the period. |
| (b) | Net investment income per share and ratio of net investment income to average net assets reflect receipt of special dividend from portfolio holding. The resulting increase to net investment income amounted to $0.19 per share and 0.23% of average net assets. If the special dividends were not received during the year ended September 30, 2017, the total return would have been 31.24%. |
| (c) | Amounts shown in this caption for a share outstanding may not accord with the change in aggregate gains and losses in securities for the fiscal period because of the timing of sales and repurchases of Fund shares in relation to fluctuating market values for the Fund. |
| (d) | Amount is less than $0.005 per share. |
| (e) | Total return is calculated assuming a purchase of shares at net asset value on the first day and a sale at net asset value on the last day of each period reported. Distributions are assumed, for the purpose of this calculation, to be reinvested at net asset value per share on the respective payment dates of each distribution. Broker commission charges are not included in this calculation. |
| (f) | Portfolio turnover rate excludes securities received or delivered from in-kind processing of creations or redemptions. |
See accompanying notes to financial statements.
238
Table of Contents
SPDR INDEX SHARES FUNDS
FINANCIAL HIGHLIGHTS (continued)
Selected data for a share outstanding throughout each period
| SPDR MSCI China A Shares IMI ETF | ||||||||
| Year Ended 9/30/17 |
For the Period 10/29/15* - 9/30/16 |
|||||||
| Net asset value, beginning of period |
$ | 21.47 | $ | 25.00 | ||||
|
|
|
|
|
|||||
| Income (loss) from investment operations: |
||||||||
| Net investment income (loss) (a) |
0.13 | 0.15 | ||||||
| Net realized and unrealized gain (loss) (b) |
2.18 | (3.43 | ) | |||||
|
|
|
|
|
|||||
| Total from investment operations |
2.31 | (3.28 | ) | |||||
|
|
|
|
|
|||||
| Other capital |
— | 0.06 | ||||||
|
|
|
|
|
|||||
| Distributions to shareholders from: |
||||||||
| Net investment income |
(0.13 | ) | (0.31 | ) | ||||
| Return of capital |
(0.08 | ) | — | |||||
|
|
|
|
|
|||||
| Total distributions |
(0.21 | ) | (0.31 | ) | ||||
|
|
|
|
|
|||||
| Net asset value, end of period |
$ | 23.57 | $ | 21.47 | ||||
|
|
|
|
|
|||||
| Total return (c) |
10.82 | % | (12.92 | )% | ||||
| Ratios and Supplemental Data: |
||||||||
| Net assets, end of period (in 000s) |
$ | 2,357 | $ | 2,147 | ||||
| Ratios to average net assets: |
||||||||
| Total expenses |
0.65 | % | 0.66 | %(d) | ||||
| Net investment income (loss) |
0.60 | % | 0.74 | %(d) | ||||
| Portfolio turnover rate (e) |
1 | % | 14 | %(f) | ||||
| * | Commencement of operations. |
| (a) | Per share numbers have been calculated using average shares outstanding, which more appropriately presents the per share data for the period. |
| (b) | Amounts shown in this caption for a share outstanding may not accord with the change in aggregate gains and losses in securities for the fiscal period because of the timing of sales and repurchases of Fund shares in relation to fluctuating market values for the Fund. |
| (c) | Total return is calculated assuming a purchase of shares at net asset value on the first day and a sale at net asset value on the last day of each period reported. Distributions are assumed, for the purpose of this calculation, to be reinvested at net asset value per share on the respective payment dates of each distribution. Total return for periods of less than one year is not annualized. Broker commission charges are not included in this calculation. |
| (d) | Annualized. |
| (e) | Portfolio turnover rate excludes securities received or delivered from in-kind processing of creations or redemptions. |
| (f) | Not annualized. |
See accompanying notes to financial statements.
239
Table of Contents
SPDR INDEX SHARES FUNDS
FINANCIAL HIGHLIGHTS (continued)
Selected data for a share outstanding throughout each period
| SPDR S&P Emerging Markets Dividend ETF | ||||||||||||||||||||
| Year Ended 9/30/17 |
Year Ended 9/30/16 |
Year Ended 9/30/15 |
Year Ended 9/30/14 |
Year Ended 9/30/13 |
||||||||||||||||
| Net asset value, beginning of period |
$ | 27.40 | $ | 25.06 | $ | 36.66 | $ | 40.34 | $ | 43.70 | ||||||||||
|
|
|
|
|
|
|
|
|
|
|
|||||||||||
| Income (loss) from investment operations: |
||||||||||||||||||||
| Net investment income (loss) (a) |
1.18 | 1.28 | 1.44 | 1.77 | 2.45 | |||||||||||||||
| Net realized and unrealized gain (loss) (b) |
2.70 | 2.29 | (11.68 | ) | (3.86 | ) | (3.87 | ) | ||||||||||||
|
|
|
|
|
|
|
|
|
|
|
|||||||||||
| Total from investment operations |
3.88 | 3.57 | (10.24 | ) | (2.09 | ) | (1.42 | ) | ||||||||||||
|
|
|
|
|
|
|
|
|
|
|
|||||||||||
| Net equalization credits and charges (a) |
0.04 | 0.04 | (0.03 | ) | 0.04 | 0.09 | ||||||||||||||
|
|
|
|
|
|
|
|
|
|
|
|||||||||||
| Other capital |
0.00 | (c) | 0.02 | 0.01 | 0.01 | 0.05 | ||||||||||||||
|
|
|
|
|
|
|
|
|
|
|
|||||||||||
| Distributions to shareholders from: |
||||||||||||||||||||
| Net investment income |
(1.01 | ) | (1.29 | ) | (1.34 | ) | (1.64 | ) | (2.08 | ) | ||||||||||
|
|
|
|
|
|
|
|
|
|
|
|||||||||||
| Net asset value, end of period |
$ | 30.31 | $ | 27.40 | $ | 25.06 | $ | 36.66 | $ | 40.34 | ||||||||||
|
|
|
|
|
|
|
|
|
|
|
|||||||||||
| Total return (d) |
14.47 | % | 14.70 | % | (28.56 | )% | (5.16 | )% | (2.80 | )% | ||||||||||
| Ratios and Supplemental Data: |
||||||||||||||||||||
| Net assets, end of period (in 000s) |
$ | 422,858 | $ | 300,042 | $ | 298,163 | $ | 491,217 | $ | 538,651 | ||||||||||
| Ratios to average net assets: |
||||||||||||||||||||
| Total expenses |
0.49 | % | 0.49 | % | 0.53 | % | 0.59 | % | 0.60 | % | ||||||||||
| Net investment income (loss) |
4.05 | % | 4.91 | % | 4.32 | % | 4.50 | % | 5.71 | % | ||||||||||
| Portfolio turnover rate (e) |
123 | % | 48 | % | 78 | % | 67 | % | 85 | % | ||||||||||
| (a) | Per share numbers have been calculated using average shares outstanding, which more appropriately presents the per share data for the period. |
| (b) | Amounts shown in this caption for a share outstanding may not accord with the change in aggregate gains and losses in securities for the fiscal period because of the timing of sales and repurchases of Fund shares in relation to fluctuating market values for the Fund. |
| (c) | Amount is less than $0.005 per share. |
| (d) | Total return is calculated assuming a purchase of shares at net asset value on the first day and a sale at net asset value on the last day of each period reported. Distributions are assumed, for the purpose of this calculation, to be reinvested at net asset value per share on the respective payment dates of each distribution. Broker commission charges are not included in this calculation. |
| (e) | Portfolio turnover rate excludes securities received or delivered from in-kind processing of creations or redemptions. |
See accompanying notes to financial statements.
240
Table of Contents
SPDR INDEX SHARES FUNDS
FINANCIAL HIGHLIGHTS (continued)
Selected data for a share outstanding throughout each period
| SPDR S&P International Small Cap ETF | ||||||||||||||||||||
| Year Ended 9/30/17 |
Year Ended 9/30/16 |
Year Ended 9/30/15 |
Year Ended 9/30/14 |
Year Ended 9/30/13 |
||||||||||||||||
| Net asset value, beginning of period |
$ | 31.21 | $ | 27.57 | $ | 32.76 | $ | 32.82 | $ | 27.49 | ||||||||||
|
|
|
|
|
|
|
|
|
|
|
|||||||||||
| Income (loss) from investment operations: |
||||||||||||||||||||
| Net investment income (loss) (a) |
0.63 | 0.62 | 0.57 | 0.54 | 0.65 | |||||||||||||||
| Net realized and unrealized gain (loss) (b) |
4.23 | 3.76 | (2.14 | ) | 0.36 | 5.37 | ||||||||||||||
|
|
|
|
|
|
|
|
|
|
|
|||||||||||
| Total from investment operations |
4.86 | 4.38 | (1.57 | ) | 0.90 | 6.02 | ||||||||||||||
|
|
|
|
|
|
|
|
|
|
|
|||||||||||
| Distributions to shareholders from: |
||||||||||||||||||||
| Net investment income |
(0.79 | ) | (0.59 | ) | (0.49 | ) | (0.96 | ) | (0.69 | ) | ||||||||||
| Net realized gains |
(0.38 | ) | (0.15 | ) | (3.13 | ) | — | — | ||||||||||||
|
|
|
|
|
|
|
|
|
|
|
|||||||||||
| Total distributions |
(1.17 | ) | (0.74 | ) | (3.62 | ) | (0.96 | ) | (0.69 | ) | ||||||||||
|
|
|
|
|
|
|
|
|
|
|
|||||||||||
| Net asset value, end of period |
$ | 34.90 | $ | 31.21 | $ | 27.57 | $ | 32.76 | $ | 32.82 | ||||||||||
|
|
|
|
|
|
|
|
|
|
|
|||||||||||
| Total return (c) |
16.30 | % | 16.18 | % | (4.77 | )% | 2.69 | % | 22.25 | % | ||||||||||
| Ratios and Supplemental Data: |
||||||||||||||||||||
| Net assets, end of period (in 000s) |
$ | 886,430 | $ | 702,312 | $ | 650,556 | $ | 792,719 | $ | 813,871 | ||||||||||
| Ratios to average net assets: |
||||||||||||||||||||
| Total expenses |
0.40 | % | 0.40 | % | 0.47 | % | 0.60 | % | 0.59 | % | ||||||||||
| Net investment income (loss) |
1.99 | % | 2.15 | % | 1.93 | % | 1.59 | % | 2.20 | % | ||||||||||
| Portfolio turnover rate (d) |
31 | % | 20 | % | 17 | % | 51 | % | 21 | % | ||||||||||
| (a) | Per share numbers have been calculated using average shares outstanding, which more appropriately presents the per share data for the period. |
| (b) | Amounts shown in this caption for a share outstanding may not accord with the change in aggregate gains and losses in securities for the fiscal period because of the timing of sales and repurchases of Fund shares in relation to fluctuating market values for the Fund. |
| (c) | Total return is calculated assuming a purchase of shares at net asset value on the first day and a sale at net asset value on the last day of each period reported. Distributions are assumed, for the purpose of this calculation, to be reinvested at net asset value per share on the respective payment dates of each distribution. Broker commission charges are not included in this calculation. |
| (d) | Portfolio turnover rate excludes securities received or delivered from in-kind processing of creations or redemptions. |
See accompanying notes to financial statements.
241
Table of Contents
SPDR INDEX SHARES FUNDS
FINANCIAL HIGHLIGHTS (continued)
Selected data for a share outstanding throughout each period
| SPDR S&P Global Infrastructure ETF | ||||||||||||||||||||
| Year Ended 9/30/17 |
Year Ended 9/30/16 |
Year Ended 9/30/15 |
Year Ended 9/30/14 |
Year Ended 9/30/13 |
||||||||||||||||
| Net asset value, beginning of period |
$ | 47.69 | $ | 43.31 | $ | 48.84 | $ | 43.51 | $ | 40.42 | ||||||||||
|
|
|
|
|
|
|
|
|
|
|
|||||||||||
| Income (loss) from investment operations: |
||||||||||||||||||||
| Net investment income (loss) (a) |
1.73 | 1.58 | 1.46 | 1.68 | 1.99 | |||||||||||||||
| Net realized and unrealized gain (loss) (b) |
4.03 | 4.23 | (5.62 | ) | 5.20 | 2.71 | ||||||||||||||
|
|
|
|
|
|
|
|
|
|
|
|||||||||||
| Total from investment operations |
5.76 | 5.81 | (4.16 | ) | 6.88 | 4.70 | ||||||||||||||
|
|
|
|
|
|
|
|
|
|
|
|||||||||||
| Distributions to shareholders from: |
||||||||||||||||||||
| Net investment income |
(1.63 | ) | (1.43 | ) | (1.37 | ) | (1.55 | ) | (1.61 | ) | ||||||||||
|
|
|
|
|
|
|
|
|
|
|
|||||||||||
| Net asset value, end of period |
$ | 51.82 | $ | 47.69 | $ | 43.31 | $ | 48.84 | $ | 43.51 | ||||||||||
|
|
|
|
|
|
|
|
|
|
|
|||||||||||
| Total return (c) |
12.35 | % | 13.85 | % | (8.77 | )% | 15.95 | % | 11.99 | % | ||||||||||
| Ratios and Supplemental Data: |
||||||||||||||||||||
| Net assets, end of period (in 000s) |
$ | 181,377 | $ | 85,850 | $ | 56,299 | $ | 112,333 | $ | 52,217 | ||||||||||
| Ratios to average net assets: |
||||||||||||||||||||
| Total expenses |
0.40 | % | 0.40 | % | 0.40 | % | 0.41 | % | 0.50 | % | ||||||||||
| Net investment income (loss) |
3.54 | % | 3.55 | % | 3.03 | % | 3.51 | % | 4.79 | % | ||||||||||
| Portfolio turnover rate (d) |
22 | % | 21 | % | 7 | % | 14 | % | 74 | % | ||||||||||
| (a) | Per share numbers have been calculated using average shares outstanding, which more appropriately presents the per share data for the period. |
| (b) | Amounts shown in this caption for a share outstanding may not accord with the change in aggregate gains and losses in securities for the fiscal period because of the timing of sales and repurchases of Fund shares in relation to fluctuating market values for the Fund. |
| (c) | Total return is calculated assuming a purchase of shares at net asset value on the first day and a sale at net asset value on the last day of each period reported. Distributions are assumed, for the purpose of this calculation, to be reinvested at net asset value per share on the respective payment dates of each distribution. Broker commission charges are not included in this calculation. |
| (d) | Portfolio turnover rate excludes securities received or delivered from in-kind processing of creations or redemptions. |
See accompanying notes to financial statements.
242
Table of Contents
SPDR INDEX SHARES FUNDS
FINANCIAL HIGHLIGHTS (continued)
Selected data for a share outstanding throughout each period
| SPDR S&P Global Natural Resources ETF | ||||||||||||||||||||
| Year Ended 9/30/17 |
Year Ended 9/30/16 |
Year Ended 9/30/15 |
Year Ended 9/30/14 |
Year Ended 9/30/13 |
||||||||||||||||
| Net asset value, beginning of period |
$ | 39.07 | $ | 32.56 | $ | 48.62 | $ | 48.54 | $ | 50.90 | ||||||||||
|
|
|
|
|
|
|
|
|
|
|
|||||||||||
| Income (loss) from investment operations: |
||||||||||||||||||||
| Net investment income (loss) (a) |
1.19 | 0.97 | 1.51 | 1.33 | 1.30 | |||||||||||||||
| Net realized and unrealized gain (loss) (b) |
6.51 | 6.63 | (16.27 | ) | (0.10 | ) | (2.41 | ) | ||||||||||||
|
|
|
|
|
|
|
|
|
|
|
|||||||||||
| Total from investment operations |
7.70 | 7.60 | (14.76 | ) | 1.23 | (1.11 | ) | |||||||||||||
|
|
|
|
|
|
|
|
|
|
|
|||||||||||
| Distributions to shareholders from: |
||||||||||||||||||||
| Net investment income |
(0.93 | ) | (1.09 | ) | (1.30 | ) | (1.15 | ) | (1.25 | ) | ||||||||||
|
|
|
|
|
|
|
|
|
|
|
|||||||||||
| Net asset value, end of period |
$ | 45.84 | $ | 39.07 | $ | 32.56 | $ | 48.62 | $ | 48.54 | ||||||||||
|
|
|
|
|
|
|
|
|
|
|
|||||||||||
| Total return (c) |
19.95 | % | 23.87 | % | (30.97 | )% | 2.39 | % | (2.09 | )% | ||||||||||
| Ratios and Supplemental Data: |
||||||||||||||||||||
| Net assets, end of period (in 000s) |
$ | 1,226,154 | $ | 722,833 | $ | 569,822 | $ | 595,617 | $ | 407,763 | ||||||||||
| Ratios to average net assets: |
||||||||||||||||||||
| Total expenses |
0.41 | % | 0.40 | % | 0.40 | % | 0.40 | % | 0.40 | % | ||||||||||
| Net investment income (loss) |
2.82 | % | 2.75 | % | 3.52 | % | 2.63 | % | 2.63 | % | ||||||||||
| Portfolio turnover rate (d) |
25 | % | 23 | % | 21 | % | 18 | % | 31 | % | ||||||||||
| (a) | Per share numbers have been calculated using average shares outstanding, which more appropriately presents the per share data for the period. |
| (b) | Amounts shown in this caption for a share outstanding may not accord with the change in aggregate gains and losses in securities for the fiscal period because of the timing of sales and repurchases of Fund shares in relation to fluctuating market values for the Fund. |
| (c) | Total return is calculated assuming a purchase of shares at net asset value on the first day and a sale at net asset value on the last day of each period reported. Distributions are assumed, for the purpose of this calculation, to be reinvested at net asset value per share on the respective payment dates of each distribution. Broker commission charges are not included in this calculation. |
| (d) | Portfolio turnover rate excludes securities received or delivered from in-kind processing of creations or redemptions. |
See accompanying notes to financial statements.
243
Table of Contents
SPDR INDEX SHARES FUNDS
FINANCIAL HIGHLIGHTS (continued)
Selected data for a share outstanding throughout each period
| SPDR MSCI ACWI IMI ETF | ||||||||||||||||||||
| Year Ended 9/30/17 |
Year Ended 9/30/16 |
Year Ended 9/30/15 |
Year Ended 9/30/14 |
Year Ended 9/30/13 |
||||||||||||||||
| Net asset value, beginning of period |
$ | 64.88 | $ | 58.64 | $ | 63.82 | $ | 58.20 | $ | 50.04 | ||||||||||
|
|
|
|
|
|
|
|
|
|
|
|||||||||||
| Income (loss) from investment operations: |
||||||||||||||||||||
| Net investment income (loss) (a) |
1.55 | 1.53 | 1.74 | 1.48 | 1.30 | |||||||||||||||
| Net realized and unrealized gain (loss) (b) |
10.34 | 6.12 | (5.17 | ) | 5.39 | 8.16 | ||||||||||||||
|
|
|
|
|
|
|
|
|
|
|
|||||||||||
| Total from investment operations |
11.89 | 7.65 | (3.43 | ) | 6.87 | 9.46 | ||||||||||||||
|
|
|
|
|
|
|
|
|
|
|
|||||||||||
| Distributions to shareholders from: |
||||||||||||||||||||
| Net investment income |
(1.50 | ) | (1.41 | ) | (1.75 | ) | (1.21 | ) | (1.28 | ) | ||||||||||
| Net realized gains |
— | — | (0.00 | )(c) | (0.04 | ) | (0.02 | ) | ||||||||||||
|
|
|
|
|
|
|
|
|
|
|
|||||||||||
| Total distributions |
(1.50 | ) | (1.41 | ) | (1.75 | ) | (1.25 | ) | (1.30 | ) | ||||||||||
|
|
|
|
|
|
|
|
|
|
|
|||||||||||
| Net asset value, end of period |
$ | 75.27 | $ | 64.88 | $ | 58.64 | $ | 63.82 | $ | 58.20 | ||||||||||
|
|
|
|
|
|
|
|
|
|
|
|||||||||||
| Total return (d) |
18.58 | % | 13.20 | % | (5.61 | )% | 11.77 | % | 19.15 | % | ||||||||||
| Ratios and Supplemental Data: |
||||||||||||||||||||
| Net assets, end of period (in 000s) |
$ | 90,321 | $ | 64,883 | $ | 35,186 | $ | 57,434 | $ | 5,820 | ||||||||||
| Ratios to average net assets: |
||||||||||||||||||||
| Total expenses |
0.25 | % | 0.25 | % | 0.25 | % | 0.25 | % | 0.25 | % | ||||||||||
| Net investment income (loss) |
2.25 | % | 2.48 | % | 2.70 | % | 2.31 | % | 2.40 | % | ||||||||||
| Portfolio turnover rate (e) |
2 | % | 2 | % | 3 | % | 0 | %(f) | 0 | %(f) | ||||||||||
| (a) | Per share numbers have been calculated using average shares outstanding, which more appropriately presents the per share data for the period. |
| (b) | Amounts shown in this caption for a share outstanding may not accord with the change in aggregate gains and losses in securities for the fiscal period because of the timing of sales and repurchases of Fund shares in relation to fluctuating market values for the Fund. |
| (c) | Amount is less than $0.005 per share. |
| (d) | Total return is calculated assuming a purchase of shares at net asset value on the first day and a sale at net asset value on the last day of each period reported. Distributions are assumed, for the purpose of this calculation, to be reinvested at net asset value per share on the respective payment dates of each distribution. Broker commission charges are not included in this calculation. |
| (e) | Portfolio turnover rate excludes securities received or delivered from in-kind processing of creations or redemptions. |
| (f) | Amount shown represents less than 0.5% |
See accompanying notes to financial statements.
244
Table of Contents
SPDR INDEX SHARES FUNDS
FINANCIAL HIGHLIGHTS (continued)
Selected data for a share outstanding throughout each period
| SPDR MSCI ACWI Low Carbon Target ETF |
||||||||||||
| Year Ended 9/30/17 |
Year Ended 9/30/16 |
For the Period 11/26/14* - 9/30/15 |
||||||||||
| Net asset value, beginning of period |
$ | 74.37 | $ | 67.90 | $ | 75.00 | ||||||
|
|
|
|
|
|
|
|||||||
| Income (loss) from investment operations: |
||||||||||||
| Net investment income (loss) (a) |
1.82 | 1.69 | 1.53 | |||||||||
| Net realized and unrealized gain (loss) (b) |
11.37 | 6.47 | (7.64 | ) | ||||||||
|
|
|
|
|
|
|
|||||||
| Total from investment operations |
13.19 | 8.16 | (6.11 | ) | ||||||||
|
|
|
|
|
|
|
|||||||
| Net equalization credits and charges (a) |
0.17 | 0.02 | 0.03 | |||||||||
|
|
|
|
|
|
|
|||||||
| Distributions to shareholders from: |
||||||||||||
| Net investment income |
(1.71 | ) | (1.66 | ) | (1.02 | ) | ||||||
| Net realized gains |
— | (0.05 | ) | — | ||||||||
|
|
|
|
|
|
|
|||||||
| Total distributions |
(1.71 | ) | (1.71 | ) | (1.02 | ) | ||||||
|
|
|
|
|
|
|
|||||||
| Net asset value, end of period |
$ | 86.02 | $ | 74.37 | $ | 67.90 | ||||||
|
|
|
|
|
|
|
|||||||
| Total return (c) |
18.16 | % | 12.22 | % | (8.25 | )% | ||||||
| Ratios and Supplemental Data: |
||||||||||||
| Net assets, end of period (in 000s) |
$ | 146,234 | $ | 96,683 | $ | 81,474 | ||||||
| Ratios to average net assets: |
||||||||||||
| Total expenses |
0.30 | % | 0.30 | % | 0.30 | %(d) | ||||||
| Net expenses |
0.20 | % | 0.20 | % | 0.20 | %(d) | ||||||
| Net investment income (loss) |
2.28 | % | 2.38 | % | 2.42 | %(d) | ||||||
| Portfolio turnover rate (e) |
12 | % | 12 | % | 4 | %(f) | ||||||
| * | Commencement of operations. |
| (a) | Per share numbers have been calculated using average shares outstanding, which more appropriately presents the per share data for the period. |
| (b) | Amounts shown in this caption for a share outstanding may not accord with the change in aggregate gains and losses in securities for the fiscal period because of the timing of sales and repurchases of Fund shares in relation to fluctuating market values for the Fund. |
| (c) | Total return is calculated assuming a purchase of shares at net asset value on the first day and a sale at net asset value on the last day of each period reported. Distributions are assumed, for the purpose of this calculation, to be reinvested at net asset value per share on the respective payment dates of each distribution. Total return for periods of less than one year is not annualized. Broker commission charges are not included in this calculation. |
| (d) | Annualized. |
| (e) | Portfolio turnover rate excludes securities received or delivered from in-kind processing of creations or redemptions. |
| (f) | Not annualized. |
See accompanying notes to financial statements.
245
Table of Contents
SPDR SERIES TRUST
FINANCIAL HIGHLIGHTS (continued)
Selected data for a share outstanding throughout each period
| SPDR MSCI EAFE Fossil Fuel Reserves Free ETF |
||||
| For the Period 10/25/16* - 9/30/17 |
||||
| Net asset value, beginning of period |
$ | 60.00 | ||
|
|
|
|||
| Income (loss) from investment operations: |
||||
| Net investment income (loss) (a) |
1.72 | |||
| Net realized and unrealized gain (loss) (b) |
10.56 | |||
|
|
|
|||
| Total from investment operations |
12.28 | |||
|
|
|
|||
| Net equalization credits and charges (a) |
0.02 | |||
|
|
|
|||
| Distributions to shareholders from: |
||||
| Net investment income |
(1.56 | ) | ||
|
|
|
|||
| Net asset value, end of period |
$ | 70.74 | ||
|
|
|
|||
| Total return (c) |
20.89 | % | ||
| Ratios and Supplemental Data: |
||||
| Net assets, end of period (in 000s) |
$ | 45,980 | ||
| Ratios to average net assets: |
||||
| Total expenses |
0.30 | %(d) | ||
| Net expenses |
0.20 | %(d) | ||
| Net investment income (loss) |
2.83 | %(d) | ||
| Portfolio turnover rate (e) |
9 | %(f) | ||
| * | Commencement of operations. |
| (a) | Per share numbers have been calculated using average shares outstanding, which more appropriately presents the per share data for the period. |
| (b) | Amounts shown in this caption for a share outstanding may not accord with the change in aggregate gains and losses in securities for the fiscal period because of the timing of sales and repurchases of Fund shares in relation to fluctuating market values for the Fund. |
| (c) | Total return is calculated assuming a purchase of shares at net asset value on the first day and a sale at net asset value on the last day of each period reported. Distributions are assumed, for the purpose of this calculation, to be reinvested at net asset value per share on the respective payment dates of each distribution. Total return for periods of less than one year is not annualized. Broker commission charges are not included in this calculation. |
| (d) | Annualized. |
| (e) | Portfolio turnover rate excludes securities received or delivered from in-kind processing of creations or redemptions. |
| (f) | Not annualized. |
See accompanying notes to financial statements.
246
Table of Contents
SPDR SERIES TRUST
FINANCIAL HIGHLIGHTS (continued)
Selected data for a share outstanding throughout each period
| SPDR MSCI Emerging Markets Fossil Fuel Reserves Free ETF |
||||
| For the Period 10/25/16* - 9/30/17 |
||||
| Net asset value, beginning of period |
$ | 55.00 | ||
|
|
|
|||
| Income (loss) from investment operations: |
||||
| Net investment income (loss) (a) |
1.38 | |||
| Net realized and unrealized gain (loss) (b) |
9.81 | |||
|
|
|
|||
| Total from investment operations |
11.19 | |||
|
|
|
|||
| Net equalization credits and charges (a) |
0.17 | |||
|
|
|
|||
| Other capital |
0.03 | |||
|
|
|
|||
| Distributions to shareholders from: |
||||
| Net investment income |
(1.12 | ) | ||
|
|
|
|||
| Net asset value, end of period |
$ | 65.27 | ||
|
|
|
|||
| Total return (c) |
21.02 | % | ||
| Ratios and Supplemental Data: |
||||
| Net assets, end of period (in 000s) |
$ | 16,318 | ||
| Ratios to average net assets: |
||||
| Total expenses |
0.30 | %(d) | ||
| Net investment income (loss) |
2.44 | %(d) | ||
| Portfolio turnover rate (e) |
2 | %(f) | ||
| * | Commencement of operations. |
| (a) | Per share numbers have been calculated using average shares outstanding, which more appropriately presents the per share data for the period. |
| (b) | Amounts shown in this caption for a share outstanding may not accord with the change in aggregate gains and losses in securities for the fiscal period because of the timing of sales and repurchases of Fund shares in relation to fluctuating market values for the Fund. |
| (c) | Total return is calculated assuming a purchase of shares at net asset value on the first day and a sale at net asset value on the last day of each period reported. Distributions are assumed, for the purpose of this calculation, to be reinvested at net asset value per share on the respective payment dates of each distribution. Total return for periods of less than one year is not annualized. Broker commission charges are not included in this calculation. |
| (d) | Annualized. |
| (e) | Portfolio turnover rate excludes securities received or delivered from in-kind processing of creations or redemptions. (f) Not annualized. |
See accompanying notes to financial statements.
247
Table of Contents
SPDR INDEX SHARES FUNDS
FINANCIAL HIGHLIGHTS (continued)
Selected data for a share outstanding throughout each period
| SPDR MSCI EAFE StrategicFactors ETF | ||||||||||||||||
| Year Ended 9/30/17 |
Year Ended 9/30/16 |
Year Ended 9/30/15 |
For the Period 6/4/14* - 9/30/14 |
|||||||||||||
| Net asset value, beginning of period |
$ | 55.43 | $ | 52.68 | $ | 57.28 | $ | 60.00 | ||||||||
|
|
|
|
|
|
|
|
|
|||||||||
| Income (loss) from investment operations: |
||||||||||||||||
| Net investment income (loss) (a) |
1.90 | 1.56 | 1.60 | 0.45 | ||||||||||||
| Net realized and unrealized gain (loss) (b) |
6.86 | 2.70 | (4.56 | ) | (3.14 | ) | ||||||||||
|
|
|
|
|
|
|
|
|
|||||||||
| Total from investment operations |
8.76 | 4.26 | (2.96 | ) | (2.69 | ) | ||||||||||
|
|
|
|
|
|
|
|
|
|||||||||
| Distributions to shareholders from: |
||||||||||||||||
| Net investment income |
(1.03 | ) | (1.51 | ) | (1.64 | ) | (0.03 | ) | ||||||||
| Net realized gains |
— | — | (0.00 | )(c) | — | |||||||||||
|
|
|
|
|
|
|
|
|
|||||||||
| Total distributions |
(1.03 | ) | (1.51 | ) | (1.64 | ) | (0.03 | ) | ||||||||
|
|
|
|
|
|
|
|
|
|||||||||
| Net asset value, end of period |
$ | 63.16 | $ | 55.43 | $ | 52.68 | $ | 57.28 | ||||||||
|
|
|
|
|
|
|
|
|
|||||||||
| Total return (d) |
15.92 | % | 8.21 | % | (5.34 | )% | (4.48 | )% | ||||||||
| Ratios and Supplemental Data: |
||||||||||||||||
| Net assets, end of period (in 000s) |
$ | 192,644 | $ | 8,315 | $ | 5,268 | $ | 5,728 | ||||||||
| Ratios to average net assets: |
||||||||||||||||
| Total expenses |
0.30 | % | 0.30 | % | 0.30 | % | 0.30 | %(e) | ||||||||
| Net investment income (loss) |
3.20 | % | 2.89 | % | 2.80 | % | 2.35 | %(e) | ||||||||
| Portfolio turnover rate (f) |
9 | % | 20 | % | 14 | % | 0 | %(g)(h) | ||||||||
| * | Commencement of operations. |
| (a) | Per share numbers have been calculated using average shares outstanding, which more appropriately presents the per share data for the period. |
| (b) | Amounts shown in this caption for a share outstanding may not accord with the change in aggregate gains and losses in securities for the fiscal period because of the timing of sales and repurchases of Fund shares in relation to fluctuating market values for the Fund. |
| (c) | Amount is less than $0.005 per share. |
| (d) | Total return is calculated assuming a purchase of shares at net asset value on the first day and a sale at net asset value on the last day of each period reported. Distributions are assumed, for the purpose of this calculation, to be reinvested at net asset value per share on the respective payment dates of each distribution. Total return for periods of less than one year is not annualized. Broker commission charges are not included in this calculation. |
| (e) | Annualized. |
| (f) | Portfolio turnover rate excludes securities received or delivered from in-kind processing of creations or redemptions. |
| (g) | Not annualized. |
| (h) | Amount shown represents less than 0.5% |
See accompanying notes to financial statements.
248
Table of Contents
SPDR INDEX SHARES FUNDS
FINANCIAL HIGHLIGHTS (continued)
Selected data for a share outstanding throughout each period
| SPDR MSCI Emerging Markets StrategicFactors ETF | ||||||||||||||||
| Year Ended 9/30/17 |
Year Ended 9/30/16 |
Year Ended 9/30/15 |
For the Period 6/4/14* - 9/30/14 |
|||||||||||||
| Net asset value, beginning of period |
$ | 53.58 | $ | 47.58 | $ | 59.59 | $ | 60.00 | ||||||||
|
|
|
|
|
|
|
|
|
|||||||||
| Income (loss) from investment operations: |
||||||||||||||||
| Net investment income (loss) (a) |
1.40 | 1.27 | 1.58 | 0.77 | ||||||||||||
| Net realized and unrealized gain (loss) (b) |
6.69 | 5.69 | (12.48 | ) | (1.23 | ) | ||||||||||
|
|
|
|
|
|
|
|
|
|||||||||
| Total from investment operations |
8.09 | 6.96 | (10.90 | ) | (0.46 | ) | ||||||||||
|
|
|
|
|
|
|
|
|
|||||||||
| Other capital |
0.01 | 0.05 | 0.20 | 0.06 | ||||||||||||
|
|
|
|
|
|
|
|
|
|||||||||
| Distributions to shareholders from: |
||||||||||||||||
| Net investment income |
(0.99 | ) | (1.01 | ) | (1.31 | ) | (0.01 | ) | ||||||||
| Net realized gains |
— | — | (0.00 | )(c) | — | |||||||||||
|
|
|
|
|
|
|
|
|
|||||||||
| Total distributions |
(0.99 | ) | (1.01 | ) | (1.31 | ) | (0.01 | ) | ||||||||
|
|
|
|
|
|
|
|
|
|||||||||
| Net asset value, end of period |
$ | 60.69 | $ | 53.58 | $ | 47.58 | $ | 59.59 | ||||||||
|
|
|
|
|
|
|
|
|
|||||||||
| Total return (d) |
15.39 | % | 15.00 | % | (18.29 | )% | (0.65 | )% | ||||||||
| Ratios and Supplemental Data: |
||||||||||||||||
| Net assets, end of period (in 000s) |
$ | 213,945 | $ | 116,539 | $ | 71,371 | $ | 5,959 | ||||||||
| Ratios to average net assets: |
||||||||||||||||
| Total expenses |
0.30 | % | 0.30 | % | 0.30 | % | 0.31 | %(e) | ||||||||
| Net investment income (loss) |
2.50 | % | 2.59 | % | 2.82 | % | 3.85 | %(e) | ||||||||
| Portfolio turnover rate (f) |
17 | % | 34 | % | 23 | % | 0 | %(g)(h) | ||||||||
| * | Commencement of operations. |
| (a) | Per share numbers have been calculated using average shares outstanding, which more appropriately presents the per share data for the period. |
| (b) | Amounts shown in this caption for a share outstanding may not accord with the change in aggregate gains and losses in securities for the fiscal period because of the timing of sales and repurchases of Fund shares in relation to fluctuating market values for the Fund. |
| (c) | Amount is less than $0.005 per share. |
| (d) | Total return is calculated assuming a purchase of shares at net asset value on the first day and a sale at net asset value on the last day of each period reported. Distributions are assumed, for the purpose of this calculation, to be reinvested at net asset value per share on the respective payment dates of each distribution. Broker commission charges are not included in this calculation. |
| (e) | Annualized. |
| (f) | Portfolio turnover rate excludes securities received or delivered from in-kind processing of creations or redemptions. |
| (g) | Amount shown represents less than 0.5% |
| (h) | Not annualized. |
See accompanying notes to financial statements.
249
Table of Contents
SPDR INDEX SHARES FUNDS
FINANCIAL HIGHLIGHTS (continued)
Selected data for a share outstanding throughout each period
| SPDR MSCI World StrategicFactors ETF | ||||||||||||||||
| Year Ended 9/30/17 |
Year Ended 9/30/16 |
Year Ended 9/30/15 |
For the Period 6/4/14* - 9/30/14 |
|||||||||||||
| Net asset value, beginning of period |
$ | 63.75 | $ | 57.96 | $ | 59.95 | $ | 60.00 | ||||||||
|
|
|
|
|
|
|
|
|
|||||||||
| Income (loss) from investment operations: |
||||||||||||||||
| Net investment income (loss) (a) |
1.58 | 1.40 | 1.35 | 0.37 | ||||||||||||
| Net realized and unrealized gain (loss) (b) |
8.20 | 6.46 | (2.04 | ) | (0.38 | ) | ||||||||||
|
|
|
|
|
|
|
|
|
|||||||||
| Total from investment operations |
9.78 | 7.86 | (0.69 | ) | (0.01 | ) | ||||||||||
|
|
|
|
|
|
|
|
|
|||||||||
| Distributions to shareholders from: |
||||||||||||||||
| Net investment income |
(1.51 | ) | (1.37 | ) | (1.30 | ) | (0.04 | ) | ||||||||
| Net realized gains |
— | (0.70 | ) | (0.00 | )(c) | — | ||||||||||
|
|
|
|
|
|
|
|
|
|||||||||
| Total distributions |
(1.51 | ) | (2.07 | ) | (1.30 | ) | (0.04 | ) | ||||||||
|
|
|
|
|
|
|
|
|
|||||||||
| Net asset value, end of period |
$ | 72.02 | $ | 63.75 | $ | 57.96 | $ | 59.95 | ||||||||
|
|
|
|
|
|
|
|
|
|||||||||
| Total return (d) |
15.53 | % | 13.78 | % | (1.25 | )% | (0.02 | )% | ||||||||
| Ratios and Supplemental Data: |
||||||||||||||||
| Net assets, end of period (in 000s) |
$ | 21,606 | $ | 6,375 | $ | 5,796 | $ | 5,995 | ||||||||
| Ratios to average net assets: |
||||||||||||||||
| Total expenses |
0.30 | % | 0.30 | % | 0.30 | % | 0.30 | %(e) | ||||||||
| Net investment income (loss) |
2.32 | % | 2.29 | % | 2.18 | % | 1.90 | %(e) | ||||||||
| Portfolio turnover rate (f) |
12 | % | 18 | % | 13 | % | 0 | %(g)(h) | ||||||||
| * | Commencement of operations. |
| (a) | Per share numbers have been calculated using average shares outstanding, which more appropriately presents the per share data for the period. |
| (b) | Amounts shown in this caption for a share outstanding may not accord with the change in aggregate gains and losses in securities for the fiscal period because of the timing of sales and repurchases of Fund shares in relation to fluctuating market values for the Fund. |
| (c) | Amount is less than $0.005 per share. |
| (d) | Total return is calculated assuming a purchase of shares at net asset value on the first day and a sale at net asset value on the last day of each period reported. Distributions are assumed, for the purpose of this calculation, to be reinvested at net asset value per share on the respective payment dates of each distribution. Total return for periods of less than one year is not annualized. Broker commission charges are not included in this calculation. |
| (e) | Annualized. |
| (f) | Portfolio turnover rate excludes securities received or delivered from in-kind processing of creations or redemptions. |
| (g) | Not annualized. |
| (h) | Amount shown represents less than 0.5% |
See accompanying notes to financial statements.
250
Table of Contents
SPDR INDEX SHARES FUNDS
FINANCIAL HIGHLIGHTS (continued)
Selected data for a share outstanding throughout each period
| SPDR MSCI Canada StrategicFactors ETF | ||||||||||||||||
| Year Ended 9/30/17 |
Year Ended 9/30/16 |
Year Ended 9/30/15 |
For the Period 6/11/14* - 9/30/14 |
|||||||||||||
| Net asset value, beginning of period |
$ | 52.66 | $ | 46.60 | $ | 59.82 | $ | 60.00 | ||||||||
|
|
|
|
|
|
|
|
|
|||||||||
| Income (loss) from investment operations: |
||||||||||||||||
| Net investment income (loss) (a) |
1.17 | 1.13 | 1.18 | 0.39 | ||||||||||||
| Net realized and unrealized gain (loss) (b) |
6.80 | 5.90 | (13.19 | ) | (0.55 | ) | ||||||||||
|
|
|
|
|
|
|
|
|
|||||||||
| Total from investment operations |
7.97 | 7.03 | (12.01 | ) | (0.16 | ) | ||||||||||
|
|
|
|
|
|
|
|
|
|||||||||
| Net equalization credits and charges (a) |
0.09 | 0.11 | 0.40 | — | ||||||||||||
|
|
|
|
|
|
|
|
|
|||||||||
| Distributions to shareholders from: |
||||||||||||||||
| Net investment income |
(1.10 | ) | (1.08 | ) | (1.61 | ) | (0.02 | ) | ||||||||
|
|
|
|
|
|
|
|
|
|||||||||
| Net asset value, end of period |
$ | 59.62 | $ | 52.66 | $ | 46.60 | $ | 59.82 | ||||||||
|
|
|
|
|
|
|
|
|
|||||||||
| Total return (c) |
15.52 | % | 15.62 | % | (19.84 | )% | (0.26 | )% | ||||||||
| Ratios and Supplemental Data: |
||||||||||||||||
| Net assets, end of period (in 000s) |
$ | 38,753 | $ | 18,430 | $ | 9,319 | $ | 2,991 | ||||||||
| Ratios to average net assets: |
||||||||||||||||
| Total expenses |
0.30 | % | 0.30 | % | 0.30 | % | 0.30 | %(d) | ||||||||
| Net investment income (loss) |
2.11 | % | 2.30 | % | 2.21 | % | 2.06 | %(d) | ||||||||
| Portfolio turnover rate (e) |
17 | % | 21 | % | 15 | % | 2 | %(f) | ||||||||
| * | Commencement of operations. |
| (a) | Per share numbers have been calculated using average shares outstanding, which more appropriately presents the per share data for the period. |
| (b) | Amounts shown in this caption for a share outstanding may not accord with the change in aggregate gains and losses in securities for the fiscal period because of the timing of sales and repurchases of Fund shares in relation to fluctuating market values for the Fund. |
| (c) | Total return is calculated assuming a purchase of shares at net asset value on the first day and a sale at net asset value on the last day of each period reported. Distributions are assumed, for the purpose of this calculation, to be reinvested at net asset value per share on the respective payment dates of each distribution. Total return for periods of less than one year is not annualized. Broker commission charges are not included in this calculation. |
| (d) | Annualized. |
| (e) | Portfolio turnover rate excludes securities received or delivered from in-kind processing of creations or redemptions. |
| (f) | Not annualized. |
See accompanying notes to financial statements.
251
Table of Contents
SPDR INDEX SHARES FUNDS
FINANCIAL HIGHLIGHTS (continued)
Selected data for a share outstanding throughout each period
| SPDR MSCI Germany StrategicFactors ETF | ||||||||||||||||
| Year Ended 9/30/17 |
Year Ended 9/30/16 |
Year Ended 9/30/15 |
For the Period 6/11/14* - 9/30/14 |
|||||||||||||
| Net asset value, beginning of period |
$ | 52.12 | $ | 48.44 | $ | 53.58 | $ | 60.00 | ||||||||
|
|
|
|
|
|
|
|
|
|||||||||
| Income (loss) from investment operations: |
||||||||||||||||
| Net investment income (loss) (a) |
1.39 | (b) | 1.20 | 1.24 | 0.02 | (c) | ||||||||||
| Net realized and unrealized gain (loss) (d) |
10.33 | 3.33 | (5.39 | ) | (6.44 | ) | ||||||||||
|
|
|
|
|
|
|
|
|
|||||||||
| Total from investment operations |
11.72 | 4.53 | (4.15 | ) | (6.42 | ) | ||||||||||
|
|
|
|
|
|
|
|
|
|||||||||
| Net equalization credits and charges (a) |
0.58 | 0.20 | 0.18 | — | ||||||||||||
|
|
|
|
|
|
|
|
|
|||||||||
| Distributions to shareholders from: |
||||||||||||||||
| Net investment income |
(1.36 | ) | (1.05 | ) | (1.17 | ) | (0.00 | )(e) | ||||||||
|
|
|
|
|
|
|
|
|
|||||||||
| Net asset value, end of period |
$ | 63.06 | $ | 52.12 | $ | 48.44 | $ | 53.58 | ||||||||
|
|
|
|
|
|
|
|
|
|||||||||
| Total return (f) |
23.78 | %(b) | 9.99 | % | (7.64 | )% | (10.70 | )%(c) | ||||||||
| Ratios and Supplemental Data: |
||||||||||||||||
| Net assets, end of period (in 000s) |
$ | 18,917 | $ | 13,031 | $ | 9,688 | $ | 5,358 | ||||||||
| Ratios to average net assets: |
||||||||||||||||
| Total expenses |
0.30 | % | 0.30 | % | 0.30 | % | 0.30 | %(g) | ||||||||
| Net investment income (loss) |
2.44 | %(b) | 2.37 | % | 2.26 | % | 0.11 | %(c)(g) | ||||||||
| Portfolio turnover rate (h) |
19 | % | 27 | % | 18 | % | 1 | %(i) | ||||||||
| * | Commencement of operations. |
| (a) | Per share numbers have been calculated using average shares outstanding, which more appropriately presents the per share data for the period. |
| (b) | Net investment income per share and ratio of net investment income to average net assets reflect receipt of special dividend from portfolio holding. The resulting increase to net investment income amounted to $0.29 per share and 0.50% of average net assets. If the special dividends were not received during the year ended September 30, 2017, the total return would have been 23.40%. |
| (c) | Net investment income per share and ratio of net investment income to average net assets reflect receipt of special dividends from portfolio holdings. The resulting increase to net investment income amounted to $0.02 per share and 0.04% of average net assets. If the special dividends were not received during the year ended September 30, 2014, the total return would have been (10.73)%. |
| (d) | Amounts shown in this caption for a share outstanding may not accord with the change in aggregate gains and losses in securities for the fiscal period because of the timing of sales and repurchases of Fund shares in relation to fluctuating market values for the Fund. |
| (e) | Amount is less than $0.005 per share. |
| (f) | Total return is calculated assuming a purchase of shares at net asset value on the first day and a sale at net asset value on the last day of each period reported. Distributions are assumed, for the purpose of this calculation, to be reinvested at net asset value per share on the respective payment dates of each distribution. Total return for periods of less than one year is not annualized. Broker commission charges are not included in this calculation. |
| (g) | Annualized. |
| (h) | Portfolio turnover rate excludes securities received or delivered from in-kind processing of creations or redemptions. |
| (i) | Not annualized. |
See accompanying notes to financial statements.
252
Table of Contents
SPDR INDEX SHARES FUNDS
FINANCIAL HIGHLIGHTS (continued)
Selected data for a share outstanding throughout each period
| SPDR MSCI Japan StrategicFactors ETF | ||||||||||||||||
| Year Ended 9/30/17 |
Year Ended 9/30/16 |
Year Ended 9/30/15 |
For the Period 6/11/14* - 9/30/14 |
|||||||||||||
| Net asset value, beginning of period |
$ | 67.43 | $ | 59.76 | $ | 60.46 | $ | 60.00 | ||||||||
|
|
|
|
|
|
|
|
|
|||||||||
| Income (loss) from investment operations: |
||||||||||||||||
| Net investment income (loss) (a) |
1.16 | 0.95 | 0.88 | 0.41 | ||||||||||||
| Net realized and unrealized gain (loss) (b) |
6.99 | 7.42 | (0.97 | ) | 0.05 | |||||||||||
|
|
|
|
|
|
|
|
|
|||||||||
| Total from investment operations |
8.15 | 8.37 | (0.09 | ) | 0.46 | |||||||||||
|
|
|
|
|
|
|
|
|
|||||||||
| Net equalization credits and charges (a) |
(0.01 | ) | 0.27 | 0.24 | — | |||||||||||
|
|
|
|
|
|
|
|
|
|||||||||
| Distributions to shareholders from: |
||||||||||||||||
| Net investment income |
(1.08 | ) | (0.96 | ) | (0.84 | ) | — | |||||||||
| Net realized gains |
— | (0.01 | ) | (0.01 | ) | — | ||||||||||
|
|
|
|
|
|
|
|
|
|||||||||
| Total distributions |
(1.08 | ) | (0.97 | ) | (0.85 | ) | — | |||||||||
|
|
|
|
|
|
|
|
|
|||||||||
| Net asset value, end of period |
$ | 74.49 | $ | 67.43 | $ | 59.76 | $ | 60.46 | ||||||||
|
|
|
|
|
|
|
|
|
|||||||||
| Total return (c) |
12.21 | % | 14.55 | % | 0.21 | % | 0.76 | % | ||||||||
| Ratios and Supplemental Data: |
||||||||||||||||
| Net assets, end of period (in 000s) |
$ | 14,897 | $ | 13,487 | $ | 11,951 | $ | 6,046 | ||||||||
| Ratios to average net assets: |
||||||||||||||||
| Total expenses |
0.30 | % | 0.30 | % | 0.30 | % | 0.30 | %(d) | ||||||||
| Net investment income (loss) |
1.67 | % | 1.48 | % | 1.38 | % | 2.21 | %(d) | ||||||||
| Portfolio turnover rate (e) |
22 | % | 23 | % | 23 | % | 0 | %(f)(g) | ||||||||
| * | Commencement of operations. |
| (a) | Per share numbers have been calculated using average shares outstanding, which more appropriately presents the per share data for the period. |
| (b) | Amounts shown in this caption for a share outstanding may not accord with the change in aggregate gains and losses in securities for the fiscal period because of the timing of sales and repurchases of Fund shares in relation to fluctuating market values for the Fund. |
| (c) | Total return is calculated assuming a purchase of shares at net asset value on the first day and a sale at net asset value on the last day of each period reported. Distributions are assumed, for the purpose of this calculation, to be reinvested at net asset value per share on the respective payment dates of each distribution. Total return for periods of less than one year is not annualized. Broker commission charges are not included in this calculation. |
| (d) | Annualized. |
| (e) | Portfolio turnover rate excludes securities received or delivered from in-kind processing of creations or redemptions. |
| (f) | Amount shown represents less than 0.5% |
| (g) | Not annualized. |
See accompanying notes to financial statements.
253
Table of Contents
SPDR INDEX SHARES FUNDS
FINANCIAL HIGHLIGHTS (continued)
Selected data for a share outstanding throughout each period
| SPDR MSCI United Kingdom StrategicFactors ETF | ||||||||||||||||
| Year Ended 9/30/17 |
Year Ended 9/30/16 |
Year Ended 9/30/15 |
For the Period 6/11/14* - 9/30/14 |
|||||||||||||
| Net asset value, beginning of period |
$ | 48.26 | $ | 50.14 | $ | 57.08 | $ | 60.00 | ||||||||
|
|
|
|
|
|
|
|
|
|||||||||
| Income (loss) from investment operations: |
||||||||||||||||
| Net investment income (loss) (a) |
2.26 | 1.82 | 2.18 | 0.62 | (b) | |||||||||||
| Net realized and unrealized gain (loss) (c) |
3.20 | (1.77 | ) | (7.43 | ) | (3.53 | ) | |||||||||
|
|
|
|
|
|
|
|
|
|||||||||
| Total from investment operations |
5.46 | 0.05 | (5.25 | ) | (2.91 | ) | ||||||||||
|
|
|
|
|
|
|
|
|
|||||||||
| Net equalization credits and charges (a) |
1.18 | — | 0.34 | — | ||||||||||||
|
|
|
|
|
|
|
|
|
|||||||||
| Distributions to shareholders from: |
||||||||||||||||
| Net investment income |
(1.91 | ) | (1.93 | ) | (2.03 | ) | (0.01 | ) | ||||||||
|
|
|
|
|
|
|
|
|
|||||||||
| Net asset value, end of period |
$ | 52.99 | $ | 48.26 | $ | 50.14 | $ | 57.08 | ||||||||
|
|
|
|
|
|
|
|
|
|||||||||
| Total return (d) |
14.13 | % | 0.18 | % | (8.85 | )% | (4.86 | )%(b) | ||||||||
| Ratios and Supplemental Data: |
||||||||||||||||
| Net assets, end of period (in 000s) |
$ | 5,299 | $ | 2,413 | $ | 2,507 | $ | 5,708 | ||||||||
| Ratios to average net assets: |
||||||||||||||||
| Total expenses |
0.30 | % | 0.31 | % | 0.30 | % | 0.30 | %(e) | ||||||||
| Net investment income (loss) |
4.49 | % | 3.71 | % | 3.90 | % | 3.40 | %(b)(e) | ||||||||
| Portfolio turnover rate (f) |
27 | % | 24 | % | 31 | % | 0 | %(g)(h) | ||||||||
| * | Commencement of operations. |
| (a) | Per share numbers have been calculated using average shares outstanding, which more appropriately presents the per share data for the period. |
| (b) | Net investment income per share and ratio of net investment income to average net assets reflect receipt of special dividends from portfolio holdings. The resulting increase to net investment income amounted to $0.10 per share and 0.18% of average net assets. If the special dividends were not received during the year ended September 30, 2014, the total return would have been (5.02)%. |
| (c) | Amounts shown in this caption for a share outstanding may not accord with the change in aggregate gains and losses in securities for the fiscal period because of the timing of sales and repurchases of Fund shares in relation to fluctuating market values for the Fund. |
| (d) | Total return is calculated assuming a purchase of shares at net asset value on the first day and a sale at net asset value on the last day of each period reported. Distributions are assumed, for the purpose of this calculation, to be reinvested at net asset value per share on the respective payment dates of each distribution. Total return for periods of less than one year is not annualized. Broker commission charges are not included in this calculation. |
| (e) | Annualized. |
| (f) | Portfolio turnover rate excludes securities received or delivered from in-kind processing of creations or redemptions. |
| (g) | Amount shown represents less than 0.5% |
| (h) | Not annualized. |
See accompanying notes to financial statements.
254
Table of Contents
SPDR INDEX SHARES FUNDS
FINANCIAL HIGHLIGHTS (continued)
Selected data for a share outstanding throughout each period
| SPDR S&P Global Dividend ETF | ||||||||||||||||||||
| Year Ended 9/30/17 |
Year Ended 9/30/16 |
Year Ended 9/30/15 |
Year Ended 9/30/14 |
For the Period 5/29/13* - 9/30/13 |
||||||||||||||||
| Net asset value, beginning of period |
$ | 63.21 | $ | 58.60 | $ | 64.89 | $ | 63.33 | $ | 60.00 | ||||||||||
|
|
|
|
|
|
|
|
|
|
|
|||||||||||
| Income (loss) from investment operations: |
||||||||||||||||||||
| Net investment income (loss) (a) |
2.44 | 2.56 | 2.70 | 2.99 | 0.75 | |||||||||||||||
| Net realized and unrealized gain (loss) (b) |
4.19 | 4.87 | (6.27 | ) | 1.32 | 3.20 | ||||||||||||||
|
|
|
|
|
|
|
|
|
|
|
|||||||||||
| Total from investment operations. |
6.63 | 7.43 | (3.57 | ) | 4.31 | 3.95 | ||||||||||||||
|
|
|
|
|
|
|
|
|
|
|
|||||||||||
| Net equalization credits and charges (a) |
0.10 | 0.08 | 0.39 | 0.06 | 0.01 | |||||||||||||||
|
|
|
|
|
|
|
|
|
|
|
|||||||||||
| Distributions to shareholders from: |
||||||||||||||||||||
| Net investment income |
(2.30 | ) | (2.61 | ) | (2.61 | ) | (2.81 | ) | (0.63 | ) | ||||||||||
| Net realized gains |
— | (0.29 | ) | (0.50 | ) | — | — | |||||||||||||
|
|
|
|
|
|
|
|
|
|
|
|||||||||||
| Total distributions |
(2.30 | ) | (2.90 | ) | (3.11 | ) | (2.81 | ) | (0.63 | ) | ||||||||||
|
|
|
|
|
|
|
|
|
|
|
|||||||||||
| Net asset value, end of period |
$ | 67.64 | $ | 63.21 | $ | 58.60 | $ | 64.89 | $ | 63.33 | ||||||||||
|
|
|
|
|
|
|
|
|
|
|
|||||||||||
| Total return (c) |
10.83 | % | 13.16 | % | (5.17 | )% | 6.85 | % | 6.61 | % | ||||||||||
| Ratios and Supplemental Data: |
||||||||||||||||||||
| Net assets, end of period (in 000s) |
$ | 165,725 | $ | 104,298 | $ | 73,250 | $ | 29,200 | $ | 9,499 | ||||||||||
| Ratios to average net assets: |
||||||||||||||||||||
| Total expenses |
0.40 | % | 0.40 | % | 0.40 | % | 0.40 | % | 0.40 | %(d) | ||||||||||
| Net investment income (loss) |
3.76 | % | 4.27 | % | 4.16 | % | 4.46 | % | 3.61 | %(d) | ||||||||||
| Portfolio turnover rate (e) |
47 | % | 49 | % | 31 | % | 37 | % | 10 | %(f) | ||||||||||
| * | Commencement of operations. |
| (a) | Per share numbers have been calculated using average shares outstanding, which more appropriately presents the per share data for the period. |
| (b) | Amounts shown in this caption for a share outstanding may not accord with the change in aggregate gains and losses in securities for the fiscal period because of the timing of sales and repurchases of Fund shares in relation to fluctuating market values for the Fund. |
| (c) | Total return is calculated assuming a purchase of shares at net asset value on the first day and a sale at net asset value on the last day of each period reported. Distributions are assumed, for the purpose of this calculation, to be reinvested at net asset value per share on the respective payment dates of each distribution. Total return for periods of less than one year is not annualized. Broker commission charges are not included in this calculation. |
| (d) | Annualized. |
| (e) | Portfolio turnover rate excludes securities received or delivered from in-kind processing of creations or redemptions. |
| (f) | Not annualized. |
See accompanying notes to financial statements.
255
Table of Contents
SPDR INDEX SHARES FUNDS
FINANCIAL HIGHLIGHTS (continued)
Selected data for a share outstanding throughout each period
| SPDR S&P Emerging Markets Small Cap ETF | ||||||||||||||||||||
| Year Ended 9/30/17 |
Year Ended 9/30/16 |
Year Ended 9/30/15 |
Year Ended 9/30/14 |
Year Ended 9/30/13 |
||||||||||||||||
| Net asset value, beginning of period |
$ | 42.74 | $ | 37.00 | $ | 48.31 | $ | 46.15 | $ | 44.43 | ||||||||||
|
|
|
|
|
|
|
|
|
|
|
|||||||||||
| Income (loss) from investment operations: |
||||||||||||||||||||
| Net investment income (loss) (a) |
1.04 | 0.89 | 1.01 | 1.01 | 0.95 | |||||||||||||||
| Net realized and unrealized gain (loss) (b) |
6.61 | 5.84 | (11.19 | ) | 2.11 | 1.81 | ||||||||||||||
|
|
|
|
|
|
|
|
|
|
|
|||||||||||
| Total from investment operations |
7.65 | 6.73 | (10.18 | ) | 3.12 | 2.76 | ||||||||||||||
|
|
|
|
|
|
|
|
|
|
|
|||||||||||
| Net equalization credits and charges (a) |
— | — | 0.00 | — | — | |||||||||||||||
|
|
|
|
|
|
|
|
|
|
|
|||||||||||
| Other capital |
0.03 | 0.04 | 0.04 | 0.05 | 0.03 | |||||||||||||||
|
|
|
|
|
|
|
|
|
|
|
|||||||||||
| Distributions to shareholders from: |
||||||||||||||||||||
| Net investment income |
(1.00 | ) | (1.03 | ) | (1.17 | ) | (1.01 | ) | (1.07 | ) | ||||||||||
|
|
|
|
|
|
|
|
|
|
|
|||||||||||
| Net asset value, end of period |
$ | 49.42 | $ | 42.74 | $ | 37.00 | $ | 48.31 | $ | 46.15 | ||||||||||
|
|
|
|
|
|
|
|
|
|
|
|||||||||||
| Total return (d) |
18.46 | % | 18.67 | % | (21.38 | )% | 6.90 | % | 6.29 | %(c) | ||||||||||
| Ratios and Supplemental Data: |
||||||||||||||||||||
| Net assets, end of period (in 000s) |
$ | 479,338 | $ | 320,556 | $ | 373,681 | $ | 570,082 | $ | 761,466 | ||||||||||
| Ratios to average net assets: |
||||||||||||||||||||
| Total expenses |
0.65 | % | 0.65 | % | 0.65 | % | 0.65 | % | 0.65 | % | ||||||||||
| Net investment income (loss) |
2.30 | % | 2.29 | % | 2.26 | % | 2.10 | % | 2.05 | % | ||||||||||
| Portfolio turnover rate (e) |
34 | % | 19 | % | 12 | % | 23 | % | 18 | % | ||||||||||
| (a) | Per share numbers have been calculated using average shares outstanding, which more appropriately presents the per share data for the period. |
| (b) | Amounts shown in this caption for a share outstanding may not accord with the change in aggregate gains and losses in securities for the fiscal period because of the timing of sales and repurchases of Fund shares in relation to fluctuating market values for the Fund. |
| (c) | If the Adviser had not made a contribution during the period ended September 30, 2013, the total return would have remained 6.29%. |
| (d) | Total return is calculated assuming a purchase of shares at net asset value on the first day and a sale at net asset value on the last day of each period reported. Distributions are assumed, for the purpose of this calculation, to be reinvested at net asset value per share on the respective payment dates of each distribution. Broker commission charges are not included in this calculation. |
| (e) | Portfolio turnover rate excludes securities received or delivered from in-kind processing of creations or redemptions. |
See accompanying notes to financial statements.
256
Table of Contents
SPDR INDEX SHARES FUNDS
September 30, 2017
| 1. | Organization |
SPDR Index Shares Funds (the “Trust”), a Massachusetts business trust, registered under the Investment Company Act of 1940, as amended (“1940 Act”), is an open-end management investment company.
As of September 30, 2017, the Trust consists of thirty (30) series, each of which represents a separate series of beneficial interest in the Trust. The Declaration of Trust permits the Board of Trustees of the Trust (the “Board”) to authorize the issuance of an unlimited number of shares of beneficial interest at $0.01 par value. The financial statements herein relate to the following Funds (each a “Fund”, and collectively, the “Funds”):
SPDR STOXX Europe 50 ETF
SPDR EURO STOXX Small Cap ETF
SPDR S&P Emerging Asia Pacific ETF
SPDR S&P China ETF
SPDR MSCI China A Shares IMI ETF
SPDR S&P Emerging Markets Dividend ETF
SPDR S&P International Small Cap ETF
SPDR S&P Global Infrastructure ETF
SPDR S&P Global Natural Resources ETF
SPDR MSCI ACWI IMI ETF
SPDR MSCI ACWI Low Carbon Target ETF
SPDR MSCI EAFE Fossil Fuel Reserves Free ETF
SPDR MSCI Emerging Markets Fossil Fuel Reserves Free ETF
SPDR MSCI EAFE StrategicFactors ETF
SPDR MSCI Emerging Markets StrategicFactors ETF
SPDR MSCI World StrategicFactors ETF
SPDR MSCI Canada StrategicFactors ETF
SPDR MSCI Germany StrategicFactors ETF
SPDR MSCI Japan StrategicFactors ETF
SPDR MSCI United Kingdom StrategicFactors ETF
SPDR S&P Global Dividend ETF
SPDR S&P Emerging Markets Small Cap ETF
Each fund is classified as a non-diversified investment company under the 1940 Act.
SPDR MSCI EAFE Fossil Fuel Reserves Free ETF and SPDR MSCI Emerging Markets Fossil Fuel Reserves Free ETF were formed on October 24, 2016, and commenced operations on October 25, 2016.
On July 31, 2017, SPDR Euro STOXX 50 Currency Hedged ETF, SPDR S&P International Dividend Currency Hedged Fund ETF, SPDR S&P Russia ETF, SPDR S&P Emerging Europe ETF, SPDR S&P Emerging Latin America ETF, SPDR S&P Emerging Middle East & Africa ETF, SPDR MSCI Australia StrategicFactors ETF, SPDR MSCI Spain StrategicFactors ETF, SPDR S&P International Consumer Discretionary Sector ETF, SPDR S&P International Consumer Staples Sector ETF, SPDR S&P International Energy Sector ETF, SPDR S&P International Financial Sector ETF, SPDR S&P International Health Care Sector ETF, SPDR S&P International Industrial Sector ETF, SPDR S&P International Materials Sector ETF, SPDR S&P International Technology Sector ETF, SPDR S&P International Telecommunications Sector ETF and SPDR S&P International Utilities Sector ETF were liquidated and closed.
Under the Trust’s organizational documents, its officers and trustees are indemnified against certain liabilities arising out of the performance of their duties to the Trust. Additionally, in the normal course of business, the Trust enters into contracts with service providers that contain general indemnification clauses. The Trust’s maximum exposure under these arrangements is unknown as this would involve future claims that may be made against the Trust that have not yet occurred.
| 2. | Summary of Significant Accounting Policies |
The following is a summary of significant accounting policies followed by the Trust in the preparation of its financial statements:
The preparation of financial statements in accordance with U.S. generally accepted accounting principles (“U.S. GAAP”) requires management to make estimates and assumptions that affect the reported amounts and disclosures in the financial statements. Actual results could differ from those estimates. Each Fund is an investment company under U.S. GAAP and follows the accounting and reporting guidance applicable to investment companies.
Security Valuation
Each Fund’s investments are valued at fair value each day that the New York Stock Exchange (“the NYSE”) listing exchange is open and, for financial reporting purposes, as of the report date should the reporting period end on a day that the NYSE is not open. Fair value is generally defined as the price a fund would receive to sell an asset or pay to
257
Table of Contents
SPDR INDEX SHARES FUNDS
NOTES TO FINANCIAL STATEMENTS (continued)
September 30, 2017
transfer a liability in an orderly transaction between market participants at the measurement date. By its nature, a fair value price is a good faith estimate of the valuation in a current sale and may not reflect an actual market price. The investments of each Fund are valued pursuant to the policy and procedures developed by the Oversight Committee (the “Committee”) and approved by the Board. The Committee provides oversight of the valuation of investments for the Funds. The Board has responsibility for determining the fair value of investments.
Valuation techniques used to value each Fund’s investments by major category are as follows:
| • | Equity investments (including registered investment companies that are exchange-traded funds) traded on a recognized securities exchange for which market quotations are readily available are valued at the last sale price or official closing price, as applicable, on the primary market or exchange on which they trade. Equity investments traded on a recognized exchange for which there were no sales on that day are valued at the last published sale price or at fair value. |
| • | Rights and warrants are valued at the last reported sale price obtained from independent pricing services or brokers on the valuation date. If no price is obtained from pricing services or brokers, valuation will be based upon the intrinsic value, pursuant to the valuation policy and procedures approved by the Board. |
| • | Investments in registered investment companies (including money market funds) or other unitized pooled investment vehicles that are not traded on an exchange are valued at that day’s published net asset value per share or unit. |
| • | Exchange-traded futures contracts are valued at the closing settlement price on the primary market on which they are traded most extensively. Exchange-traded futures contracts traded on a recognized exchange for which there were no sales on that day are valued at the last reported sale price obtained from independent pricing services or brokers or at fair value. |
In the event prices or quotations are not readily available or that the application of these valuation methods results in a price for an investment that is deemed to be not representative of the fair value of such investment, fair value will be determined in good faith by the Committee, in accordance with the valuation policy and procedures approved by the Board.
Fair value pricing could result in a difference between the prices used to calculate a Fund’s net asset value (NAV) and the prices used by the Funds’ underlying benchmarks. Various inputs are used in determining the value of the Funds’ investments.
The Funds value their assets and liabilities at fair value using a fair value hierarchy consisting of three broad levels that prioritize the inputs to valuation techniques giving the highest priority to readily available unadjusted quoted prices in active markets for identical assets or liabilities (Level 1 measurements) and the lowest priority to unobservable inputs (Level 3 measurements) when market prices are not readily available or reliable. The categorization of a value determined for an investment within the hierarchy is based upon the pricing transparency of the investment and is not necessarily an indication of the risk associated with investing in it.
The three levels of the fair value hierarchy are as follows:
| • | Level 1 — Unadjusted quoted prices in active markets for an identical asset or liability; |
| • | Level 2 — Inputs other than quoted prices included within Level 1 that are observable for the asset or liability either directly or indirectly, including quoted prices for similar assets or liabilities in active markets, quoted prices for identical or similar assets or liabilities in markets that are not considered to be active, inputs other than quoted prices that are observable for the asset or liability (such as exchange rates, financing terms, interest rates, yield curves, volatilities, prepayment speeds, loss severities, credit risks and default rates) or other market-corroborated inputs; and |
| • | Level 3 — Unobservable inputs for the asset or liability, including the Committee’s assumptions used in determining the fair value of investments. |
The value of each Fund’s investments according to the fair value hierarchy as of September 30, 2017, is disclosed in each Fund’s respective Schedule of Investments.
Changes in valuation techniques may result in transfers in or out of an assigned level within the fair value hierarchy. Transfers between different levels of the fair value hierarchy are recognized at the end of the reporting period.
258
Table of Contents
SPDR INDEX SHARES FUNDS
NOTES TO FINANCIAL STATEMENTS (continued)
September 30, 2017
The SPDR MSCI China A Shares IMI ETF had transfers of securities from Level 1 to Level 2 during the period ended September 30, 2017 in the amounts of $70,274 as securities were halted and fair valued. At September 30, 2017, these investments were valued using alternative valuation procedures under the valuation policy and procedures adopted by the Board. At September 30, 2016, these investments were valued at exchange closing prices in accordance with the Fund’s valuation policy.
Additionally, the fund also had a transfer from Level 2 to Level 1 during the period ended September 30, 2017, in the amounts of $94,300. At September 30, 2017, these investments were valued at exchange closing prices in accordance with the Fund’s valuation policy. During the period ended September 30, 2016 these securities were halted and fair valued. At September 30, 2016, these investments were valued using alternative valuation procedures under the valuation policy and procedures adopted by the Board.
Investment Transactions and Income Recognition
Investment transactions are accounted for on the trade date for financial reporting purposes. Realized gains and losses from the sale or disposition of investments and foreign exchange transactions, if any, are determined using the identified cost method.
Dividend income and capital gain distributions, if any, are recognized daily on the ex-dividend date, net of any foreign taxes withheld at source, if any. Non-cash dividends received in the form of stock, if any, are recorded as dividend income at fair value. Distributions received by the Funds may include a return of capital that is estimated by management. Such amounts are recorded as a reduction of the cost of investments or reclassified to capital gains.
Certain Funds invest in Real Estate Investment Trusts (REITs). REITs determine the tax character of their distributions annually and may characterize a portion of their distributions as a return of capital or capital gain. The Funds’ policy is to record all REIT distributions initially as dividend income and re-designate the prior calendar year’s to return of capital or capital gain distributions at year end based on information provided by the REIT and/or SSGA Funds Management, Inc. (the “Adviser” or “SSGA FM”) estimates of such re-designations for which actual information has not yet been reported.
Expenses
Certain expenses, which are directly identifiable to a specific Fund, are applied to that Fund within the Trust. Other expenses which cannot be attributed to a specific Fund are allocated in such a manner as deemed equitable, taking into consideration the nature and type of expense and the relative net assets of the Funds within the Trust.
Foreign Currency Translation
The accounting records of the Funds are maintained in U.S. dollars. Foreign currencies as well as investment securities and other assets and liabilities denominated in a foreign currency are translated to U.S. dollars using exchange rates at period end. Purchases and sales of securities, income receipts and expense payments denominated in foreign currencies are translated into U.S. dollars at the prevailing exchange rate on the respective dates of the transactions.
The effects of exchange rate fluctuations on investments are included with the net realized and unrealized gain (loss) on investment securities. Other foreign currency transactions resulting in realized and unrealized gain (loss) are disclosed separately.
Foreign Taxes
The Funds may be subject to foreign taxes (a portion of which may be reclaimable) on income, stock dividends, realized and unrealized capital gains on investments or certain foreign currency transactions. Foreign taxes are recorded in accordance with SSGA Funds Management, Inc. (“SSGAFM”) understanding of the applicable foreign tax regulations and rates that exist in the foreign jurisdictions in which the Funds invest. These foreign taxes, if any, are paid by the Funds and are reflected in the Statements of Operations, if applicable. Foreign taxes payable or deferred as of September 30, 2017, if any, are disclosed in the Funds’ Statements of Assets and Liabilities.
259
Table of Contents
SPDR INDEX SHARES FUNDS
NOTES TO FINANCIAL STATEMENTS (continued)
September 30, 2017
The following Funds’ NAVs were impacted by adjustments to certain foreign tax accruals:
| Fund |
Per Share Impact ($) |
Date | ||||||
| SPDR MSCI ACWI IMI ETF |
0.00 | * | 8/17/2017 | |||||
| SPDR MSCI ACWI Low Carbon Target ETF |
0.00 | * | 8/17/2017 | |||||
| SPDR S&P Emerging Asia Pacific ETF |
0.13 | 8/21/2017 | ||||||
| SPDR S&P Emerging Markets Small Cap ETF |
0.04 | 8/21/2017 | ||||||
| SPDR MSCI Emerging Markets StrategicFactors ETF |
0.02 | 8/21/2017 | ||||||
| SPDR MSCI Emerging Markets Fossil Fuel Reserves Free ETF |
0.01 | 8/21/2017 | ||||||
| SPDR S&P Emerging Markets Dividend ETF |
0.01 | 8/21/2017 | ||||||
| SPDR S&P Global Dividend ETF |
0.01 | 8/21/2017 | ||||||
| * | Amounts are less than $0.005 per share. |
Equalization
Certain Funds in the Trust follow the accounting practice known as “Equalization” by which a portion of the proceeds from sales and costs of reacquiring Fund shares, equivalent on a per share basis to the amount of distributable net investment income on the date of the transaction, is credited or charged to undistributed net investment income. As a result, undistributed net investment income per share is unaffected by sales or reacquisition of Fund shares. Amounts related to Equalization can be found on the Statements of Changes in Net Assets.
The following Funds utilized equalization during the period ended September 30, 2017 :
SPDR STOXX Europe 50 ETF
SPDR EURO STOXX Small Cap ETF
SPDR S&P Emerging Markets Dividend ETF
SPDR MSCI ACWI Low Carbon Target ETF
SPDR MSCI EAFE Fossil Fuel Reserves Free ETF
SPDR MSCI Emerging Markets Fossil Fuel Reserves Free ETF
SPDR MSCI Canada StrategicFactors ETF
SPDR MSCI Germany StrategicFactors ETF
SPDR MSCI Japan StrategicFactors ETF
SPDR MSCI United Kingdom StrategicFactors ETF
SPDR S&P Global Dividend ETF
Distributions
The following Funds declare and distribute from net investment income, if any, to its shareholders quarterly:
SPDR STOXX Europe 50 ETF
SPDR MSCI China A Shares IMI ETF
SPDR S&P Emerging Markets Dividend ETF
SPDR MSCI EAFE Fossil Fuel Reserves Free ETF
SPDR MSCI Emerging Markets Fossil Fuel Reserves Free ETF
SPDR S&P Global Dividend ETF
The following Funds declare and distribute from net investment income, if any, to its shareholders semi-annually:
SPDR EURO STOXX Small Cap ETF
SPDR S&P Emerging Asia Pacific ETF
SPDR S&P China ETF
SPDR S&P International Small Cap ETF
SPDR S&P Global Infrastructure ETF
SPDR S&P Global Natural Resources ETF
SPDR MSCI ACWI IMI ETF
SPDR MSCI ACWI Low Carbon Target ETF
SPDR MSCI EAFE StrategicFactors ETF
SPDR MSCI Emerging Markets StrategicFactors ETF
SPDR MSCI World StrategicFactors ETF
SPDR MSCI Canada StrategicFactors ETF
SPDR MSCI Germany StrategicFactors ETF
SPDR MSCI Japan StrategicFactors ETF
SPDR MSCI United Kingdom StrategicFactors ETF
SPDR S&P Emerging Markets Small Cap ETF
Net realized capital gains, if any, are distributed annually, unless additional distributions are required for compliance with applicable tax regulations. The amount and character of income and capital gains to be distributed are determined
260
Table of Contents
SPDR INDEX SHARES FUNDS
NOTES TO FINANCIAL STATEMENTS (continued)
September 30, 2017
in accordance with applicable tax regulations which may differ from net investment income and realized gains recognized for U.S. GAAP purposes.
| 3. | Derivative Financial Instruments Futures Contracts |
Certain Funds may enter into futures contracts to meet the Funds’ objectives. A futures contract is a standardized, exchange-traded agreement to buy or sell a financial instrument at a set price on a future date. Upon entering into a futures contract, the Fund is required to deposit with the broker, cash or securities in an amount equal to the minimum initial margin requirements of the clearing house. Subsequent payments are made or received by the Funds equal to the daily change in the contract value and are recorded as variation margin receivable or payable with a corresponding offset to unrealized gains or losses. The Funds recognize a realized gain or loss when the contract is closed.
Losses may arise if the value of a futures contract decreases due to unfavorable changes in the market rates or values of the underlying instrument during the term of the contract or if the counterparty does not perform under the contract. The use of futures contracts also involves the risk that the movements in the price of the futures contracts do not correlate the movement of the assets underlying such contracts.
For the period ended September 30, 2017, the following Funds entered into futures contracts for the strategies listed below:
| Funds | Strategies | |
| SPDR MSCI Emerging Markets Fossil Fuel Reserves Free ETF | Return enhancement, hedging and exposing cash reserves to markets |
The following table summarizes the value of the Fund’s derivative instruments as of September 30, 2017 and the related location in the accompanying Statement of Assets and Liabilities, presented by primary underlying risk exposure:
| Liability Derivatives | ||||||||||||||||||||||||
| Interest Rate Contracts Risk |
Foreign Exchange Contracts Risk |
Credit Contracts Risk |
Equity Contracts Risk |
Commodity Contracts Risk |
Total | |||||||||||||||||||
| SPDR MSCI Emerging Markets Fossil Fuel Reserves Free ETF |
||||||||||||||||||||||||
| Futures Contracts (a) |
$ | — | $ | — | $ | — | $ | (16,138 | ) | $ | — | $ | (16,138 | ) | ||||||||||
| (a) | Unrealized depreciation on open futures contracts. The Statements of Assets and Liabilities only reflect the current day’s net variation margin. |
| Net Realized Gain (Loss) | ||||||||||||||||||||||||
| Interest Rate Contracts Risk |
Foreign Exchange Contracts Risk |
Credit Contracts Risk |
Equity Contracts Risk |
Commodity Contracts Risk |
Total | |||||||||||||||||||
| SPDR MSCI Emerging Markets Fossil Fuel Reserves Free ETF |
||||||||||||||||||||||||
| Futures Contracts |
$ | — | $ | — | $ | — | $ | 44,234 | $ | — | $ | 44,234 | ||||||||||||
| Net Change in Unrealized Appreciation (Depreciation) | ||||||||||||||||||||||||
| Interest Rate Contracts Risk |
Foreign Exchange Contracts Risk |
Credit Contracts Risk |
Equity Contracts Risk |
Commodity Contracts Risk |
Total | |||||||||||||||||||
| SPDR MSCI Emerging Markets Fossil Fuel Reserves Free ETF |
||||||||||||||||||||||||
| Futures Contracts |
$ | — | $ | — | $ | — | $ | (16,138 | ) | $ | — | $ | (16,138 | ) | ||||||||||
261
Table of Contents
SPDR INDEX SHARES FUNDS
NOTES TO FINANCIAL STATEMENTS (continued)
September 30, 2017
| 4. | Fees and Transactions with Affiliates |
Advisory Fee
The Trust, on behalf of each Fund, has entered into an Investment Advisory Agreement with SSGA FM. For its advisory services to the Funds, facilities furnished, and expenses borne by the Adviser, each Fund pays the Adviser a fee accrued daily and paid quarterly, based on a percentage of each Fund’s average daily net assets as shown in the following table:
| Annual Rate | ||||
| SPDR STOXX Europe 50 ETF |
0.29 | % | ||
| SPDR EURO STOXX Small Cap ETF |
0.45 | |||
| SPDR S&P Emerging Asia Pacific ETF |
0.49 | |||
| SPDR S&P China ETF |
0.59 | |||
| SPDR MSCI China A Shares IMI ETF |
0.65 | |||
| SPDR S&P Emerging Markets Dividend ETF |
0.49 | |||
| SPDR S&P International Small Cap ETF |
0.40 | |||
| SPDR S&P Global Infrastructure ETF |
0.40 | |||
| SPDR S&P Global Natural Resources ETF |
0.40 | |||
| SPDR MSCI ACWI IMI ETF |
0.25 | |||
| SPDR MSCI ACWI Low Carbon Target ETF |
0.30 | |||
| SPDR MSCI EAFE Fossil Fuel Reserves Free ETF |
0.30 | |||
| SPDR MSCI Emerging Markets Fossil Fuel Reserves Free ETF |
0.30 | |||
| SPDR MSCI EAFE StrategicFactors ETF |
0.30 | |||
| SPDR MSCI Emerging Markets StrategicFactors ETF |
0.30 | |||
| SPDR MSCI World StrategicFactors ETF |
0.30 | |||
| SPDR MSCI Canada StrategicFactors ETF |
0.30 | |||
| SPDR MSCI Germany StrategicFactors ETF |
0.30 | |||
| SPDR MSCI Japan StrategicFactors ETF |
0.30 | |||
| SPDR MSCI United Kingdom StrategicFactors ETF |
0.30 | |||
| SPDR S&P Global Dividend ETF |
0.40 | |||
| SPDR S&P Emerging Markets Small Cap ETF |
0.65 | |||
The Adviser pays all operating expenses of each Fund other than management fee, distribution fee pursuant to each Fund’s Distribution and Service Plan, if any, brokerage, taxes, interest, fees and expenses of the Independent Trustees (including any Trustees’ counsel fees, acquired fund fees and expenses, litigation expenses and other extraordinary expenses).
The Adviser has contractually agreed to waive its management fee and reimburse certain expenses, until January 31, 2018, so that the net annual Fund operating expenses of the SPDR MSCI ACWI Low Carbon Target ETF and the SPDR MSCI EAFE Fossil Fuel Reserves Free ETF will be limited to 0.20% of each Fund’s average daily net assets before application of any fees and expenses not paid by the Adviser under the Investment Advisory Agreement. Such fees and expenses paid by the Adviser are limited to certain direct operating expenses of the Fund and, therefore, do not include the Fund’s acquired fund fees and expenses, if any. The contractual fee waiver does not provide for the recoupment by the Adviser of any fees the Adviser previously waived. The Adviser may continue the waiver from year to year, but there is no guarantee that the Adviser will do so and after January 31, 2018, the waiver may be cancelled or modified at any time. For the period ended September 30, 2017, the SPDR MSCI ACWI Low Carbon Target ETF and the SPDR MSCI EAFE Fossil Fuel Reserves Free ETF waived $131,075 and $33,182, respectively.
Administrator and Sub-Administrator Fees
SSGA FM serves as administrator and State Street, an affiliate of the Advisor, serves as custodian, sub-administrator and transfer agent. State Street receives fees for its services as custodian, sub-administrator and transfer agent from the Adviser.
262
Table of Contents
SPDR INDEX SHARES FUNDS
NOTES TO FINANCIAL STATEMENTS (continued)
September 30, 2017
Distribution Fees
State Street Global Advisors Funds Distributors, LLC (“SSGA FD” or the “Distributor”), an affiliate of the Adviser, serves as the Distributor of the Trust. Effective May 1, 2017, the Distributor’s name changed from State Street Global Markets, LLC to State Street Global Advisors Funds Distributors, LLC.
Other Transactions with Affiliates — Securities Lending
State Street, an affiliate of the Funds, acts as the securities lending agent for the Funds, pursuant to an amended and restated securities lending authorization agreement dated January 6, 2017.
Proceeds collected by State Street on investment of cash collateral or any fee income are allocated as follows (after deduction of such other amounts payable to State Street under the terms of the securities lending agreement): 85% payable to the Fund, and 15% payable to State Street.
In addition, cash collateral from lending activities is invested in the State Street Navigator Securities Lending Government Money Market Portfolio, an affiliated money market fund, for which SSGA FM serves as investment adviser. See Note 9 for additional information regarding securities lending.
Other Transactions with Affiliates
The Funds may invest in affiliated entities, including securities issued by State Street Corporation, affiliated funds, or entities deemed to be affiliates as a result of the Funds owning more than five percent of the entity’s voting securities or outstanding shares. Amounts relating to these transactions during the year ended September 30, 2017, are disclosed in the Schedules of Investments.
Due to Custodian
In certain circumstances, the Funds may have cash overdrafts with the custodian. The Due to custodian amount, if any, reflects cash overdrawn with State Street as custodian who is an affiliate of the Funds. The SPDR S&P Emerging Asia Pacific ETF has a cash overdraft related to unsettled foreign currency transactions. The SPDR MSCI ACWI IMI ETF and SPDR MSCI Emerging Markets StrategicFactors ETF have cash overdrafts due to investment related expense payments. The SPDR MSCI World StrategicFactors ETF has a cash overdraft due to capital settlement activities.
| 5. | Trustees’ Fees |
The fees and expenses of the Trust’s trustees who are not “interested persons” of the Trust, as defined in the 1940 Act (“Independent Trustees”), are paid directly by the Funds. The Independent Trustees are reimbursed for travel and other out-of-pocket expenses in connection with meeting attendance and industry seminars.
| 6. | Investment Transactions |
Purchases and sales of investments (excluding in-kind transactions, short term investments and derivative contracts) for the period ended September 30, 2017, were as follows:
| Purchases | Sales | |||||||
| SPDR STOXX Europe 50 ETF |
$ | 17,165,176 | $ | 17,675,933 | ||||
| SPDR EURO STOXX Small Cap ETF |
5,402,200 | 5,401,821 | ||||||
| SPDR S&P Emerging Asia Pacific ETF |
19,979,716 | 13,834,365 | ||||||
| SPDR S&P China ETF |
106,129,444 | 41,914,538 | ||||||
| SPDR MSCI China A Shares IMI ETF |
30,728 | 44,951 | ||||||
| SPDR S&P Emerging Markets Dividend ETF |
470,309,557 | 432,619,481 | ||||||
| SPDR S&P International Small Cap ETF |
247,981,041 | 236,850,945 | ||||||
| SPDR S&P Global Infrastructure ETF |
28,497,722 | 28,387,517 | ||||||
| SPDR S&P Global Natural Resources ETF |
240,148,503 | 234,584,248 | ||||||
263
Table of Contents
SPDR INDEX SHARES FUNDS
NOTES TO FINANCIAL STATEMENTS (continued)
September 30, 2017
| Purchases | Sales | |||||||
| SPDR MSCI ACWI IMI ETF |
$ | 2,679,988 | $ | 1,904,086 | ||||
| SPDR MSCI ACWI Low Carbon Target ETF |
17,578,734 | 15,072,393 | ||||||
| SPDR MSCI EAFE Fossil Fuel Reserves Free ETF |
3,166,568 | 3,101,853 | ||||||
| SPDR MSCI Emerging Markets Fossil Fuel Reserves Free ETF |
6,314,736 | 188,409 | ||||||
| SPDR MSCI EAFE StrategicFactors ETF |
9,610,357 | 10,087,214 | ||||||
| SPDR MSCI Emerging Markets StrategicFactors ETF |
62,546,188 | 27,583,601 | ||||||
| SPDR MSCI World StrategicFactors ETF |
2,786,506 | 2,694,414 | ||||||
| SPDR MSCI Canada StrategicFactors ETF |
5,032,790 | 5,034,710 | ||||||
| SPDR MSCI Germany StrategicFactors ETF |
2,198,834 | 2,305,323 | ||||||
| SPDR MSCI Japan StrategicFactors ETF |
3,073,005 | 3,118,120 | ||||||
| SPDR MSCI United Kingdom StrategicFactors ETF |
1,416,861 | 1,476,318 | ||||||
| SPDR S&P Global Dividend ETF |
60,295,409 | 60,202,640 | ||||||
| SPDR S&P Emerging Markets Small Cap ETF |
196,794,533 | 136,938,594 | ||||||
For the period ended September 30, 2017, the following Funds had in-kind contributions, redemptions and net realized gains/losses in the amounts as follows:
| In-kind Contributions |
In-kind Redemptions |
In-kind Net Realized Gains/(Losses) |
||||||||||
| SPDR STOXX Europe 50 ETF |
$ | 115,738,590 | $ | 17,806,053 | $ | (2,103,617 | ) | |||||
| SPDR EURO STOXX Small Cap ETF |
3,118,046 | — | — | |||||||||
| SPDR S&P Emerging Asia Pacific ETF |
18,843,814 | 9,813,310 | (861,380 | ) | ||||||||
| SPDR S&P China ETF |
— | 78,782,702 | 19,988,221 | |||||||||
| SPDR S&P Emerging Markets Dividend ETF |
56,185,913 | 3,202,518 | 390,678 | |||||||||
| SPDR S&P International Small Cap ETF |
92,082,891 | 15,768,388 | 3,574,895 | |||||||||
| SPDR S&P Global Infrastructure ETF |
91,642,859 | 9,470,530 | 1,709,618 | |||||||||
| SPDR S&P Global Natural Resources ETF |
381,677,113 | 35,570,585 | 7,242,368 | |||||||||
| SPDR MSCI ACWI IMI ETF |
25,786,833 | 13,964,995 | 3,509,805 | |||||||||
| SPDR MSCI ACWI Low Carbon Target ETF |
28,074,091 | — | — | |||||||||
| SPDR MSCI EAFE Fossil Fuel Reserves Free ETF |
40,186,853 | — | — | |||||||||
| SPDR MSCI Emerging Markets Fossil Fuel Reserves Free ETF |
7,299,332 | — | — | |||||||||
| SPDR MSCI EAFE StrategicFactors ETF |
163,803,824 | — | — | |||||||||
| SPDR MSCI Emerging Markets StrategicFactors ETF |
40,632,302 | 693 | 31 | |||||||||
| SPDR MSCI World StrategicFactors ETF |
19,158,560 | 7,114,743 | 1,499,518 | |||||||||
| SPDR MSCI Canada StrategicFactors ETF |
16,317,176 | — | — | |||||||||
| SPDR MSCI Germany StrategicFactors ETF |
11,901,808 | 7,261,834 | (182,465 | ) | ||||||||
| SPDR MSCI Japan StrategicFactors ETF |
6,892,818 | 6,864,881 | 967,099 | |||||||||
| SPDR MSCI United Kingdom StrategicFactors ETF |
10,255,120 | 7,804,722 | 382,533 | |||||||||
| SPDR S&P Global Dividend ETF |
57,364,408 | 6,255,386 | 903,821 | |||||||||
| SPDR S&P Emerging Markets Small Cap ETF |
56,933,660 | 14,668,411 | 1,423,196 | |||||||||
| 7. | Shareholder Transactions |
Each Fund issues and redeems its shares, at NAV, by each Fund only in aggregations of a specified number of shares or multiples thereof (“Creation Units”). Except when aggregated in Creation Units, shares of each Fund are not redeemable. Transactions in capital shares for each Fund are disclosed in detail in the Statements of Changes in Net Assets.
264
Table of Contents
SPDR INDEX SHARES FUNDS
NOTES TO FINANCIAL STATEMENTS (continued)
September 30, 2017
The consideration for the purchase of Creation Units of a Fund may consist of the in-kind deposit of a designated portfolio of securities and a specified amount of cash. Investors purchasing and redeeming Creation Units may pay a purchase transaction fee and a redemption transaction fee directly to the Trust and/or custodian, to offset transfer and other transaction costs associated with the issuance and redemption of Creation Units, including Creation Units for cash. An additional variable fee may be charged for certain transactions. Such variable charges, if any, are included in “Other Capital” on the Statements of Changes on Net Assets.
| 8. | Income Tax Information |
The Funds have qualified and intend to continue to qualify as regulated investment companies under Subchapter M of the Internal Revenue Code of 1986, as amended. Each Fund will not be subject to federal income taxes to the extent it distributes its taxable income, including any net realized capital gains, for each fiscal year. Therefore, no provision for federal income tax is required.
The Funds file federal and various state and local tax returns as required. No income tax returns are currently under examination. Generally, the federal returns are subject to examination by the Internal Revenue Service for a period of three years from date of filing, while the state returns may remain open for an additional year depending upon jurisdiction. SSGA FM has analyzed each Fund’s tax positions taken on tax returns for all open years and does not believe there are any uncertain tax positions that would require recognition of a tax liability.
Distributions to shareholders are recorded on ex-dividend date. Income dividends and gain distributions are determined in accordance with income tax rules and regulations, which may differ from generally accepted accounting principles. Certain capital accounts in the financial statements have been adjusted for permanent book-tax differences. These adjustments have no impact on net asset values or results of operations. Temporary book-tax differences will reverse in the future. These book-tax differences are primarily due to differing treatments for character of distributions, nontaxable dividend adjustments to income, in-kind transactions, foreign currencies, foreign capital gains taxes, REITs, expired capital loss carryforwards, distribution redesignations, passive foreign investment companies, return of capital, wash sale loss deferrals, partnership basis adjustments and futures contracts. In addition, certain Funds claimed a portion of the payments made to redeeming shareholders as a distribution for income tax purposes.
The tax character of distributions paid during the year ended September 30, 2017, was as follows:
| Ordinary Income |
Long-Term Capital Gains |
Tax Return of Capital |
Total | |||||||||||||
| SPDR STOXX Europe 50 ETF |
$ | 7,278,371 | $ | — | $ | — | $ | 7,278,371 | ||||||||
| SPDR EURO STOXX Small Cap ETF |
243,975 | — | — | 243,975 | ||||||||||||
| SPDR S&P Emerging Asia Pacific ETF |
7,047,374 | — | — | 7,047,374 | ||||||||||||
| SPDR S&P China ETF |
13,804,543 | — | — | 13,804,543 | ||||||||||||
| SPDR MSCI China A Shares IMI ETF |
12,958 | — | 7,669 | 20,627 | ||||||||||||
| SPDR S&P Emerging Markets Dividend ETF |
13,211,413 | — | — | 13,211,413 | ||||||||||||
| SPDR S&P International Small Cap ETF |
23,340,656 | 3,655,182 | — | 26,995,838 | ||||||||||||
| SPDR S&P Global Infrastructure ETF |
3,938,322 | — | — | 3,938,322 | ||||||||||||
| SPDR S&P Global Natural Resources ETF |
21,131,997 | — | — | 21,131,997 | ||||||||||||
| SPDR MSCI ACWI IMI ETF |
1,770,932 | — | — | 1,770,932 | ||||||||||||
| SPDR MSCI ACWI Low Carbon Target ETF |
2,915,464 | — | — | 2,915,464 | ||||||||||||
| SPDR MSCI EAFE Fossil Fuel Reserves Free ETF |
803,032 | — | — | 803,032 | ||||||||||||
| SPDR MSCI Emerging Markets Fossil Fuel Reserves Free ETF |
231,170 | — | — | 231,170 | ||||||||||||
| SPDR MSCI EAFE StrategicFactors ETF |
2,367,462 | — | — | 2,367,462 | ||||||||||||
| SPDR MSCI Emerging Markets StrategicFactors ETF |
2,754,029 | — | — | 2,754,029 | ||||||||||||
| SPDR MSCI World StrategicFactors ETF |
400,647 | — | — | 400,647 | ||||||||||||
| SPDR MSCI Canada StrategicFactors ETF |
529,524 | — | — | 529,524 | ||||||||||||
| SPDR MSCI Germany StrategicFactors ETF |
389,383 | — | — | 389,383 | ||||||||||||
265
Table of Contents
SPDR INDEX SHARES FUNDS
NOTES TO FINANCIAL STATEMENTS (continued)
September 30, 2017
| Ordinary Income |
Long-Term Capital Gains |
Tax Return of Capital |
Total | |||||||||||||
| SPDR MSCI Japan StrategicFactors ETF |
$ | 216,441 | $ | — | $ | — | $ | 216,441 | ||||||||
| SPDR MSCI United Kingdom StrategicFactors ETF |
329,690 | — | — | 329,690 | ||||||||||||
| SPDR S&P Global Dividend ETF |
4,751,992 | — | — | 4,751,992 | ||||||||||||
| SPDR S&P Emerging Markets Small Cap ETF |
8,720,849 | — | — | 8,720,849 | ||||||||||||
The tax character of distributions paid during the year ended September 30, 2016 was as follows:
| Ordinary Income |
Long-Term Capital Gains |
Tax Return of Capital |
Total | |||||||||||||
| SPDR STOXX Europe 50 ETF |
$ | 7,235,067 | $ | — | $ | — | $ | 7,235,067 | ||||||||
| SPDR EURO STOXX Small Cap ETF |
524,645 | — | — | 524,645 | ||||||||||||
| SPDR S&P Emerging Asia Pacific ETF |
15,794,101 | — | — | 15,794,101 | ||||||||||||
| SPDR S&P China ETF |
22,176,022 | — | — | 22,176,022 | ||||||||||||
| SPDR MSCI China A Shares IMI ETF |
28,775 | — | 2,643 | 31,418 | ||||||||||||
| SPDR S&P Emerging Markets Dividend ETF |
13,540,223 | — | — | 13,540,223 | ||||||||||||
| SPDR S&P International Small Cap ETF |
17,762,030 | 183,902 | — | 17,945,932 | ||||||||||||
| SPDR S&P Global Infrastructure ETF |
2,376,551 | — | — | 2,376,551 | ||||||||||||
| SPDR S&P Global Natural Resources ETF |
17,723,932 | — | — | 17,723,932 | ||||||||||||
| SPDR MSCI ACWI IMI ETF |
914,554 | — | — | 914,554 | ||||||||||||
| SPDR MSCI ACWI Low Carbon Target ETF |
2,131,916 | 7,758 | — | 2,139,674 | ||||||||||||
| SPDR MSCI EAFE StrategicFactors ETF |
150,949 | — | — | 150,949 | ||||||||||||
| SPDR MSCI Emerging Markets StrategicFactors ETF |
1,961,532 | — | — | 1,961,532 | ||||||||||||
| SPDR MSCI World StrategicFactors ETF |
197,356 | 9,579 | — | 206,935 | ||||||||||||
| SPDR MSCI Canada StrategicFactors ETF |
294,086 | — | — | 294,086 | ||||||||||||
| SPDR MSCI Germany StrategicFactors ETF |
263,141 | — | — | 263,141 | ||||||||||||
| SPDR MSCI Japan StrategicFactors ETF |
191,965 | 1,592 | — | 193,557 | ||||||||||||
| SPDR MSCI United Kingdom StrategicFactors ETF |
96,601 | — | — | 96,601 | ||||||||||||
| SPDR S&P Global Dividend ETF |
3,129,411 | 380,129 | — | 3,509,540 | ||||||||||||
| SPDR S&P Emerging Markets Small Cap ETF |
8,865,797 | — | — | 8,865,797 | ||||||||||||
At September 30, 2017 the components of distributable earnings on a tax basis were as follows:
| Undistributed Ordinary Income |
Capital Loss Carryforwards |
Undistributed Long-Term Capital Gains |
Net Unrealized Gains (Losses) |
Total | ||||||||||||||||
| SPDR STOXX Europe 50 ETF |
$ | — | $ | (42,202,958 | ) | $ | — | $ | 1,599,105 | $ | (40,603,853 | ) | ||||||||
| SPDR EURO STOXX Small Cap ETF |
63,478 | (2,441,164 | ) | — | 2,846,899 | 469,213 | ||||||||||||||
| SPDR S&P Emerging Asia Pacific ETF |
6,080,033 | (62,678,430 | ) | — | 64,272,567 | 7,674,170 | ||||||||||||||
| SPDR S&P China ETF |
17,189,363 | (133,072,924 | ) | — | 176,558,614 | 60,675,053 | ||||||||||||||
| SPDR MSCI China A Shares IMI ETF |
— | (60,600 | ) | — | (78,006 | ) | (138,606 | ) | ||||||||||||
| SPDR S&P Emerging Markets Dividend ETF |
1,515,410 | (236,859,694 | ) | — | 3,119,892 | (232,224,392 | ) | |||||||||||||
| SPDR S&P International Small Cap ETF |
34,892,780 | — | 7,749,490 | (8,788,791 | ) | 33,853,479 | ||||||||||||||
| SPDR S&P Global Infrastructure ETF |
1,548,726 | (23,467,657 | ) | — | 12,465,222 | (9,453,709 | ) | |||||||||||||
| SPDR S&P Global Natural Resources ETF |
11,067,062 | (182,862,806 | ) | — | 87,652,111 | (84,143,633 | ) | |||||||||||||
| SPDR MSCI ACWI IMI ETF |
1,057,718 | — | — | 9,049,756 | 10,107,474 | |||||||||||||||
| SPDR MSCI ACWI Low Carbon Target ETF |
744,293 | (854,267 | ) | — | 21,041,510 | 20,931,536 | ||||||||||||||
266
Table of Contents
SPDR INDEX SHARES FUNDS
NOTES TO FINANCIAL STATEMENTS (continued)
September 30, 2017
| Undistributed Ordinary Income |
Capital Loss Carryforwards |
Undistributed Long-Term Capital Gains |
Net Unrealized Gains (Losses) |
Total | ||||||||||||||||
| SPDR MSCI EAFE Fossil Fuel Reserves Free ETF |
$ | 346,784 | $ | — | $ | — | $ | 5,201,393 | $ | 5,548,177 | ||||||||||
| SPDR MSCI Emerging Markets Fossil Fuel Reserves Free ETF |
99,604 | — | — | 1,549,705 | 1,649,309 | |||||||||||||||
| SPDR MSCI EAFE StrategicFactors ETF |
1,303,780 | (223,804 | ) | — | 19,326,784 | 20,406,760 | ||||||||||||||
| SPDR MSCI Emerging Markets StrategicFactors ETF |
2,663,726 | (6,334,490 | ) | — | 25,671,939 | 22,001,175 | ||||||||||||||
| SPDR MSCI World StrategicFactors ETF |
280,594 | — | — | 1,795,257 | 2,075,851 | |||||||||||||||
| SPDR MSCI Canada StrategicFactors ETF |
174,969 | (445,754 | ) | — | 5,486,965 | 5,216,180 | ||||||||||||||
| SPDR MSCI Germany StrategicFactors ETF |
— | (946,348 | ) | — | 1,702,516 | 756,168 | ||||||||||||||
| SPDR MSCI Japan StrategicFactors ETF |
122,557 | (252,277 | ) | — | 983,419 | 853,699 | ||||||||||||||
| SPDR MSCI United Kingdom StrategicFactors ETF |
— | (386,422 | ) | — | (117,611 | ) | (504,033 | ) | ||||||||||||
| SPDR S&P Global Dividend ETF |
763,109 | (5,144,070 | ) | — | 7,971,403 | 3,590,442 | ||||||||||||||
| SPDR S&P Emerging Markets Small Cap ETF |
10,065,058 | (59,164,915 | ) | — | (55,340,006 | ) | (104,439,863 | ) | ||||||||||||
As of September 30, 2017, the following Funds had capital loss carryforwards available to offset future realized capital gains through the indicated expiration dates as follows:
| Expiring 2018 |
Expiring 2019 |
Expiring 2020 |
Non-Expiring Short Term* |
Non-Expiring Long Term* |
||||||||||||||||
| SPDR STOXX Europe 50 ETF |
$ | 6,195,941 | $ | 2,032,222 | $ | — | $ | 2,863,060 | $ | 31,111,735 | ||||||||||
| SPDR EURO STOXX Small Cap ETF |
— | — | — | 2,296,632 | 144,532 | |||||||||||||||
| SPDR S&P Emerging Asia Pacific ETF |
— | — | — | 16,428,688 | 46,249,742 | |||||||||||||||
| SPDR S&P China ETF |
3,455,043 | 20,718,358 | — | 15,887,574 | 93,011,949 | |||||||||||||||
| SPDR MSCI China A Shares IMI ETF |
— | — | — | 35,994 | 24,606 | |||||||||||||||
| SPDR S&P Emerging Markets Dividend ETF |
— | 362,314 | — | 92,363,612 | 144,133,768 | |||||||||||||||
| SPDR S&P Global Infrastructure ETF |
3,044,553 | 1,744,492 | — | 559,837 | 18,118,775 | |||||||||||||||
| SPDR S&P Global Natural Resources ETF |
— | — | — | 17,879,682 | 164,983,124 | |||||||||||||||
| SPDR MSCI ACWI Low Carbon Target ETF |
— | — | — | 67,604 | 786,663 | |||||||||||||||
| SPDR MSCI EAFE StrategicFactors ETF |
— | — | — | — | 223,804 | |||||||||||||||
| SPDR MSCI Emerging Markets StrategicFactors ETF |
— | — | — | 2,801,433 | 3,533,057 | |||||||||||||||
| SPDR MSCI Canada StrategicFactors ETF |
— | — | — | — | 445,754 | |||||||||||||||
| SPDR MSCI Germany StrategicFactors ETF |
— | — | — | 329,599 | 616,749 | |||||||||||||||
| SPDR MSCI Japan StrategicFactors ETF |
— | — | — | 14,006 | 238,271 | |||||||||||||||
| SPDR MSCI United Kingdom StrategicFactors ETF |
— | — | — | 89,617 | 296,805 | |||||||||||||||
| SPDR S&P Global Dividend ETF |
— | — | — | 2,672,502 | 2,471,567 | |||||||||||||||
| SPDR S&P Emerging Markets Small Cap ETF |
— | — | — | — | 59,164,915 | |||||||||||||||
| * | Must be utilized prior to losses subject to expiration. |
As of September 30, 2017, gross unrealized appreciation and gross unrealized depreciation of investments and other financial instruments based on cost for federal income tax purposes were as follows:
| Tax Cost |
Gross Unrealized Appreciation |
Gross Unrealized Depreciation |
Net Unrealized Appreciation (Depreciation) |
|||||||||||||
| SPDR STOXX Europe 50 ETF |
$ | 315,398,531 | $ | 18,070,262 | $ | 16,487,719 | $ | 1,582,543 | ||||||||
| SPDR EURO STOXX Small Cap ETF |
15,913,304 | 3,055,939 | 210,272 | 2,845,667 | ||||||||||||
267
Table of Contents
SPDR INDEX SHARES FUNDS
NOTES TO FINANCIAL STATEMENTS (continued)
September 30, 2017
| Tax Cost |
Gross Unrealized Appreciation |
Gross Unrealized Depreciation |
Net Unrealized Appreciation (Depreciation) |
|||||||||||||
| SPDR S&P Emerging Asia Pacific ETF |
$ | 353,859,698 | $ | 113,446,517 | $ | 49,025,673 | $ | 64,420,844 | ||||||||
| SPDR S&P China ETF |
870,842,661 | 304,437,519 | 127,878,758 | 176,558,761 | ||||||||||||
| SPDR MSCI China A Shares IMI ETF |
2,426,354 | 311,717 | 389,805 | (78,088 | ) | |||||||||||
| SPDR S&P Emerging Markets Dividend ETF |
435,017,911 | 19,636,666 | 16,500,485 | 3,136,181 | ||||||||||||
| SPDR S&P International Small Cap ETF |
957,880,596 | 107,353,320 | 116,138,245 | (8,784,925 | ) | |||||||||||
| SPDR S&P Global Infrastructure ETF |
175,812,223 | 16,152,541 | 3,687,341 | 12,465,200 | ||||||||||||
| SPDR S&P Global Natural Resources ETF |
1,160,097,197 | 117,957,309 | 30,272,674 | 87,684,635 | ||||||||||||
| SPDR MSCI ACWI IMI ETF |
82,049,260 | 13,307,768 | 4,257,852 | 9,049,916 | ||||||||||||
| SPDR MSCI ACWI Low Carbon Target ETF |
125,044,319 | 25,555,371 | 4,503,068 | 21,052,303 | ||||||||||||
| SPDR MSCI EAFE Fossil Fuel Reserves Free ETF |
40,826,212 | 5,743,638 | 543,252 | 5,200,386 | ||||||||||||
| SPDR MSCI Emerging Markets Fossil Fuel Reserves Free ETF |
14,518,704 | 1,870,924 | 302,227 | 1,568,697 | ||||||||||||
| SPDR MSCI EAFE StrategicFactors ETF |
172,722,678 | 21,215,834 | 1,892,098 | 19,323,736 | ||||||||||||
| SPDR MSCI Emerging Markets StrategicFactors ETF |
190,670,101 | 32,289,028 | 6,534,858 | 25,754,170 | ||||||||||||
| SPDR MSCI World StrategicFactors ETF |
24,177,766 | 2,356,389 | 561,397 | 1,794,992 | ||||||||||||
| SPDR MSCI Canada StrategicFactors ETF |
33,103,840 | 5,639,492 | 150,992 | 5,488,500 | ||||||||||||
| SPDR MSCI Germany StrategicFactors ETF |
17,129,795 | 1,860,387 | 163,165 | 1,697,222 | ||||||||||||
| SPDR MSCI Japan StrategicFactors ETF |
13,766,158 | 1,347,031 | 362,898 | 984,133 | ||||||||||||
| SPDR MSCI United Kingdom StrategicFactors ETF |
5,371,558 | 206,449 | 324,752 | (118,303 | ) | |||||||||||
| SPDR S&P Global Dividend ETF |
162,920,214 | 12,807,816 | 4,834,511 | 7,973,305 | ||||||||||||
| SPDR S&P Emerging Markets Small Cap ETF |
550,215,767 | 51,926,355 | 107,262,478 | (55,336,123 | ) | |||||||||||
| 9. | Securities Lending |
Each Fund may lend securities to qualified broker-dealers or institutional investors. The loans are secured at all times by cash, cash equivalents or U.S. government securities in an amount at least equal to the market value of the securities loaned, plus accrued interest and dividends, determined on a daily basis and adjusted accordingly. The value of the collateral with respect to a loaned security may be temporarily more or less than the value of a security due to market fluctuations of securities values. With respect to each loan, if on any U.S. business day the aggregate market value of securities collateral plus cash collateral is less than the aggregate market value of the securities which are subject to the loan, the borrower will be notified to provide additional collateral on the next business day.
The Funds will regain record ownership of loaned securities to exercise certain beneficial rights; however, the Funds may bear the risk of delay in recovery of, or even loss of rights in the securities loaned should the borrower fail financially. In addition, a Fund will bear the risk of loss of any cash collateral that it may invest. Each Fund receives compensation for lending its securities from interest or dividends earned on the cash, cash equivalents or U.S. government securities held as collateral, net of fee rebates paid to the borrower and net of fees paid to State Street as the lending agent. Additionally, a Fund will receive a fee from the borrower for non-cash collateral equal to a percentage of the market value of the loaned securities.
The market value of securities on loan as of September 30, 2017, and the value of the invested cash collateral are disclosed in the Funds’ Statements of Assets and Liabilities. Non-cash collateral is not disclosed in the Funds’ Statements of Assets and Liabilities as it is held by the lending agent on behalf of the Funds, and the Funds do not have the ability to re-hypothecate those securities. Securities lending income, as disclosed in the Funds’ Statements of Operations, represents the income earned from the non-cash collateral and the investment of cash collateral, net of fee rebates paid to the borrower and net of fees paid to State Street as lending agent.
268
Table of Contents
SPDR INDEX SHARES FUNDS
NOTES TO FINANCIAL STATEMENTS (continued)
September 30, 2017
The following is a summary of each Fund’s securities lending agreements and related cash and non-cash collateral received as of September 30, 2017:
| Fund |
Market Value of Securities on Loan |
Cash Collateral Received |
Non Cash Collateral Received* |
Total Collateral Received |
||||||||||||
| SPDR STOXX Europe 50 ETF |
$ | 117,619 | $ | 128,419 | $ | — | $ | 128,419 | ||||||||
| SPDR S&P Emerging Asia Pacific ETF |
33,085,946 | 5,790,699 | 28,553,180 | 34,343,879 | ||||||||||||
| SPDR S&P China ETF |
151,808,995 | 22,187,451 | 136,228,983 | 158,416,434 | ||||||||||||
| SPDR S&P Emerging Markets Dividend ETF |
18,415,395 | 16,561,043 | 2,840,864 | 19,401,907 | ||||||||||||
| SPDR S&P International Small Cap ETF |
86,596,964 | 66,029,680 | 26,215,656 | 92,245,336 | ||||||||||||
| SPDR S&P Global Infrastructure ETF |
7,260,488 | 7,104,926 | 547,744 | 7,652,670 | ||||||||||||
| SPDR S&P Global Natural Resources ETF |
49,252,396 | 27,454,617 | 23,664,351 | 51,118,968 | ||||||||||||
| SPDR MSCI ACWI IMI ETF |
2,793,842 | 985,141 | 1,928,617 | 2,913,758 | ||||||||||||
| SPDR MSCI ACWI Low Carbon Target ETF |
3,436,459 | 378,038 | 3,161,479 | 3,539,517 | ||||||||||||
| SPDR MSCI EAFE Fossil Fuel Reserves Free ETF |
681,466 | 242,956 | 477,692 | 720,648 | ||||||||||||
| SPDR MSCI Emerging Markets Fossil Fuel Reserves Free ETF |
790,521 | 172,291 | 633,240 | 805,531 | ||||||||||||
| SPDR MSCI EAFE StrategicFactors ETF |
789,798 | 666,545 | 175,738 | 842,283 | ||||||||||||
| SPDR MSCI Emerging Markets StrategicFactors ETF |
5,775,083 | 3,055,835 | 2,873,167 | 5,929,002 | ||||||||||||
| SPDR MSCI World StrategicFactors ETF |
281,413 | 24,983 | 264,529 | 289,512 | ||||||||||||
| SPDR S&P Global Dividend ETF |
21,720,651 | 5,848,371 | 16,898,895 | 22,747,266 | ||||||||||||
| SPDR S&P Emerging Markets Small Cap ETF |
29,961,488 | 16,261,252 | 16,667,287 | 32,928,539 | ||||||||||||
| * | The non-cash collateral includes U.S. Treasuries and U.S. Government Agency securities. |
The following tables reflect a breakdown of transactions accounted for as secured borrowings, the gross obligation by the type of collateral pledged or securities loaned, and the remaining contractual maturity of those transactions as of September 30, 2017:
| Remaining Contractual Maturity of the Agreements As of September 30, 2017 |
||||||||||||||||||||||||||
| Fund |
Securities Lending |
Overnight and Continuous |
<30 days | Between 30 & 90 days |
>90 days | Total Borrowings |
Gross Amount of Recognized Liabilities for Securities Lending Transactions |
|||||||||||||||||||
| SPDR STOXX Europe 50 ETF |
Common Stocks |
$ | 128,419 | $ | — | $ | — | $ | — | $ | 128,419 | $ | 128,419 | |||||||||||||
| SPDR S&P Emerging Asia Pacific ETF |
Common Stocks |
5,790,699 | — | — | — | 5,790,699 | 5,790,699 | |||||||||||||||||||
| SPDR S&P China ETF |
Common Stocks |
22,187,451 | — | — | — | 22,187,451 | 22,187,451 | |||||||||||||||||||
| SPDR S&P Emerging Markets Dividend ETF |
Common Stocks |
16,561,043 | — | — | — | 16,561,043 | 16,561,043 | |||||||||||||||||||
| SPDR S&P International Small Cap ETF |
Common Stocks |
66,029,023 | — | — | — | 66,029,023 | 66,029,023 | |||||||||||||||||||
| Warrants |
657 | — | — | — | 657 | 657 | ||||||||||||||||||||
|
|
|
|
|
|
|
|
|
|
|
|
|
|||||||||||||||
| Total |
$ | 66,029,680 | $ | — | $ | — | $ | — | $ | 66,029,680 | $ | 66,029,680 | ||||||||||||||
|
|
|
|
|
|
|
|
|
|
|
|
|
|||||||||||||||
| SPDR S&P Global Infrastructure ETF |
Common Stocks |
7,104,926 | — | — | — | 7,104,926 | 7,104,926 | |||||||||||||||||||
| SPDR S&P Global Natural Resources ETF |
Common Stocks |
27,454,617 | — | — | — | 27,454,617 | 27,454,617 | |||||||||||||||||||
| SPDR MSCI ACWI IMI ETF |
Common Stocks |
985,141 | — | — | — | 985,141 | 985,141 | |||||||||||||||||||
| SPDR MSCI ACWI Low Carbon Target ETF |
Common Stocks |
378,038 | — | — | — | 378,038 | 378,038 | |||||||||||||||||||
| SPDR MSCI EAFE Fossil Fuel Reserves Free ETF |
Common Stocks |
242,956 | — | — | — | 242,956 | 242,956 | |||||||||||||||||||
| SPDR MSCI Emerging Markets Fossil Fuel Reserves Free ETF |
Common Stocks |
172,291 | — | — | — | 172,291 | 172,291 | |||||||||||||||||||
269
Table of Contents
SPDR INDEX SHARES FUNDS
NOTES TO FINANCIAL STATEMENTS (continued)
September 30, 2017
| Remaining Contractual Maturity of the Agreements As of September 30, 2017 |
||||||||||||||||||||||||||
| Fund |
Securities Lending |
Overnight and Continuous |
<30 days | Between 30 & 90 days |
>90 days | Total Borrowings |
Gross Amount of Recognized Liabilities for Securities Lending Transactions |
|||||||||||||||||||
| SPDR MSCI EAFE StrategicFactors ETF |
Common Stocks |
$ | 666,545 | $ | — | $ | — | $ | — | $ | 666,545 | $ | 666,545 | |||||||||||||
| SPDR MSCI Emerging Markets StrategicFactors ETF |
Common Stocks |
3,055,835 | — | — | — | 3,055,835 | 3,055,835 | |||||||||||||||||||
| SPDR MSCI World StrategicFactors ETF |
Common Stocks |
24,983 | — | — | — | 24,983 | 24,983 | |||||||||||||||||||
| SPDR Global Dividend ETF |
Common Stocks |
5,848,371 | — | — | — | 5,848,371 | 5,848,371 | |||||||||||||||||||
| SPDR S&P Emerging Markets Small Cap ETF |
Common Stocks |
16,261,252 | — | — | — | 16,261,252 | 16,261,252 | |||||||||||||||||||
| 10. | Line of Credit |
Certain Funds and other affiliated funds (each a “Participant” and, collectively, the “Participants”) participate in a $360 million revolving credit facility provided by a syndication of banks under which the Participants may borrow to fund shareholder redemptions. This agreement expires in October 2017 unless extended or renewed. Prior to October 13, 2016, the Participants could borrow up to $360 million at any time outstanding, subject to asset coverage and other limitations as specified in the agreements.
The following funds participate in the credit facility:
SPDR S&P Emerging Asia Pacific ETF
SPDR S&P China ETF
SPDR MSCI China A Shares IMI ETF
SPDR S&P Emerging Markets Dividend ETF
SPDR S&P International Small Cap ETF
SPDR S&P Global Infrastructure ETF
SPDR S&P Global Natural Resources ETF
SPDR MSCI ACWI IMI ETF
SPDR MSCI ACWI Low Carbon Target ETF
SPDR MSCI EAFE Fossil Fuel Free ETF
SPDR MSCI Emerging Markets Fossil Fuel Free ETF
SPDR MSCI Emerging Markets StrategicFactors ETF
SPDR S&P Global Dividend ETF
SPDR S&P Emerging Markets Small Cap ETF
The Participants are charged an annual commitment fee which is calculated based on the unused portion of the shared credit line. Commitment fees are allocated among each of the Participants based on relative net assets. Commitment fees are ordinary fund operating expenses paid by the Adviser. A Participant incurs and pays the interest expense related to its borrowing. Interest is calculated at a rate per annum equal to the sum of 1% plus the greater of the New York Fed Bank Rate and 1-month LIBOR rate. Prior to October 13, 2016, interest was calculated at a rate per annum equal to the sum of the New York Fed Bank Rate plus 1%.
Effective October 12, 2017, the Agreement was renewed and as a result, the Funds and other affiliated Funds participate in a $500 million revolving credit facility.
The Funds had no outstanding loans during the period ended September 30, 2017.
| 11. | Risks |
Concentration Risk
As a result of the Funds’ ability to invest a large percentage of their assets in obligations of issuers within the same country, state, region, currency or economic sector, an adverse economic, business or political development may affect the value of the Funds’ investments more than if the Funds were more broadly diversified.
Foreign and Emerging Markets Risk
Investing in foreign markets involves risks and considerations not typically associated with investing in the U.S. Foreign securities may be subject to risk of loss because of government regulation, economic, political and social instability in the countries in which the Funds invest. Foreign markets may be less liquid than investments in the U.S. and may be
270
Table of Contents
SPDR INDEX SHARES FUNDS
NOTES TO FINANCIAL STATEMENTS (continued)
September 30, 2017
subject to the risks of currency fluctuations. To the extent that a Fund invests in securities of issuers located in emerging markets, these risks may be even more pronounced.
Market and Credit Risk
In the normal course of business, the Funds trade financial instruments and enter into financial transactions where risk of potential loss exists due to changes in the general economic conditions and fluctuations of the market (market risk). Additionally, a Fund may also be exposed to credit risk in the event that an issuer or guarantor fails to perform or that an institution or entity with which the Fund has unsettled or open transactions defaults.
| 12. | Subsequent Events |
Management has evaluated the impact of all subsequent events on the Funds through the date on which the financial statements were available to be issued and has determined that there were no subsequent events requiring adjustment or disclosure in the financial statements.
271
Table of Contents
SPDR INDEX SHARES FUNDS
REPORT OF INDEPENDENT REGISTERED PUBLIC ACCOUNTING FIRM
To the Trustees and Shareholders of
the SPDR Index Shares Funds:
In our opinion, the accompanying statements of assets and liabilities, including the schedules of investments, and the related statements of operations and of changes in net assets and the financial highlights present fairly, in all material respects, the financial position of the twenty two funds, listed in Note 1, (each a “Fund”) as of September 30, 2017, the results of each of their operations for the periods then ended, the changes in each of their net assets and the financial highlights for the periods indicated, in conformity with accounting principles generally accepted in the United States of America. These financial statements and financial highlights (hereafter referred to as “financial statements”) are the responsibility of the Trust’s management. Our responsibility is to express an opinion on these financial statements based on our audits. We conducted our audits of these financial statements in accordance with the standards of the Public Company Accounting Oversight Board (United States). Those standards require that we plan and perform the audit to obtain reasonable assurance about whether the financial statements are free of material misstatement. An audit includes examining, on a test basis, evidence supporting the amounts and disclosures in the financial statements, assessing the accounting principles used and significant estimates made by management, and evaluating the overall financial statement presentation. We believe that our audits, which included confirmation of securities as of September 30, 2017 by correspondence with the custodian and brokers and the application of alternative auditing procedures where securities purchased had not been received, provide a reasonable basis for the opinion expressed above.
/s/ PricewaterhouseCoopers LLP
Boston, Massachusetts
November 21, 2017
272
Table of Contents
SPDR INDEX SHARES FUNDS
September 30, 2017 (Unaudited)
Expense Example
As a shareholder of a Fund, you incur two types of costs (1) transaction costs, including sales charges (loads), if applicable, on purchase payments, reinvested dividends, or other distributions and (2) ongoing costs, including advisory fees and other Fund expenses. This example is intended to help you understand your ongoing costs (in dollars) of investing in the Fund and to compare these costs with the ongoing costs of investing in other mutual funds. It is based on an investment of $1,000 made at the beginning of the period shown and held for the entire period from April 1, 2017 to September 30, 2017.
The table below illustrates your Fund’s cost in two ways:
Based on actual fund return — This section helps you to estimate the actual expenses that you paid over the period. The “Ending Account Value” shown is derived from each Fund’s actual return, and the third column shows the dollar amount that would have been paid by an investor who started with $1,000 in the Fund. You may use the information here, together with the amount you invested, to estimate the expenses that you paid over the period. To do so, simply divide your account value by $1,000 (for example, an $8,600 account value divided by $1,000 = 8.6), then multiply the result by the number given for the Fund under the heading “Expenses Paid During Period”.
Based on hypothetical 5% return — This section is intended to help you compare your Fund’s costs with those of other mutual funds. It assumes that the Fund had a yearly return of 5% before expenses, but that the expense ratio is unchanged. In this case, because the return used is not the Fund’s actual return, the results do not apply to your investment. The example is useful in making comparisons because the U.S. Securities and Exchange Commission (the “SEC”) requires all mutual funds to calculate expenses based on a 5% return. You can assess your Fund’s costs by comparing this hypothetical example with the hypothetical examples that appear in shareholder reports of other funds.
Please note that the expenses shown in the table are meant to highlight your ongoing costs only and do not reflect any transaction costs, such as sales load charges (loads). Therefore, the hypothetical 5% return section of the table is useful in comparing ongoing costs only, and will not help you determine the relative total costs of owning different funds. In addition, if these transaction costs were included, your costs would have been higher.
| Actual | Hypothetical (assuming a 5% return before expenses) |
|||||||||||||||||||
| Annualized Expense Ratio |
Ending Account Value |
Expenses Paid During Period(a) |
Ending Account Value |
Expenses Paid During Period(a) |
||||||||||||||||
| SPDR STOXX Europe 50 ETF |
0.29 | % | $ | 1,126.60 | $ | 1.55 | $ | 1,023.60 | $ | 1.47 | ||||||||||
| SPDR EURO STOXX Small Cap ETF |
0.45 | 1,222.40 | 2.51 | 1,022.80 | 2.28 | |||||||||||||||
| SPDR S&P Emerging Asia Pacific ETF |
0.49 | 1,151.90 | 2.64 | 1,022.60 | 2.48 | |||||||||||||||
| SPDR S&P China ETF |
0.59 | 1,247.10 | 3.32 | 1,022.10 | 2.99 | |||||||||||||||
| SPDR MSCI China A Shares IMI ETF |
0.65 | 1,101.20 | 3.42 | 1,021.80 | 3.29 | |||||||||||||||
| SPDR S&P Emerging Markets Dividend ETF |
0.49 | 1,064.70 | 2.54 | 1,022.60 | 2.48 | |||||||||||||||
| SPDR S&P International Small Cap ETF |
0.40 | 1,110.80 | 2.12 | 1,023.10 | 2.03 | |||||||||||||||
| SPDR S&P Global Infrastructure ETF |
0.40 | 1,088.50 | 2.09 | 1,023.10 | 2.03 | |||||||||||||||
| SPDR S&P Global Natural Resources ETF |
0.41 | 1,095.80 | 2.15 | 1,023.00 | 2.08 | |||||||||||||||
| SPDR MSCI ACWI IMI ETF |
0.25 | 1,097.50 | 1.31 | 1,023.80 | 1.27 | |||||||||||||||
| SPDR MSCI ACWI Low Carbon Target ETF |
0.20 | 1,092.00 | 1.05 | 1,024.10 | 1.01 | |||||||||||||||
| SPDR MSCI EAFE Fossil Fuel Reserves Free ETF |
0.19 | 1,113.40 | 1.01 | 1,024.10 | 0.96 | |||||||||||||||
| SPDR MSCI Emerging Markets Fossil Fuel Reserves Free ETF |
0.30 | 1,150.00 | 1.62 | 1,023.60 | 1.52 | |||||||||||||||
| SPDR MSCI EAFE StrategicFactors ETF |
0.30 | 1,111.70 | 1.59 | 1,023.60 | 1.52 | |||||||||||||||
| SPDR MSCI Emerging Markets StrategicFactors ETF |
0.30 | 1,104.50 | 1.58 | 1,023.60 | 1.52 | |||||||||||||||
273
Table of Contents
SPDR INDEX SHARES FUNDS
OTHER INFORMATION (continued)
September 30, 2017 (Unaudited)
| Actual | Hypothetical (assuming a 5% return before expenses) |
|||||||||||||||||||
| Annualized Expense Ratio |
Ending Account Value |
Expenses Paid During Period(a) |
Ending Account Value |
Expenses Paid During Period(a) |
||||||||||||||||
| SPDR MSCI World StrategicFactors ETF |
0.30 | % | $ | 1,080.10 | $ | 1.56 | $ | 1,023.60 | $ | 1.52 | ||||||||||
| SPDR MSCI Canada StrategicFactors ETF |
0.30 | 1,100.10 | 1.58 | 1,023.60 | 1.52 | |||||||||||||||
| SPDR MSCI Germany StrategicFactors ETF |
0.30 | 1,144.10 | 1.61 | 1,023.60 | 1.52 | |||||||||||||||
| SPDR MSCI Japan StrategicFactors ETF |
0.30 | 1,092.40 | 1.57 | 1,023.60 | 1.52 | |||||||||||||||
| SPDR MSCI United Kingdom StrategicFactors ETF |
0.30 | 1,107.80 | 1.59 | 1,023.60 | 1.52 | |||||||||||||||
| SPDR S&P Global Dividend ETF |
0.40 | 1,073.40 | 2.08 | 1,023.10 | 2.03 | |||||||||||||||
| SPDR S&P Emerging Markets Small Cap ETF |
0.65 | 1,091.90 | 3.41 | 1,021.80 | 3.29 | |||||||||||||||
| (a) | Expenses are equal to the Fund’s annualized net expense ratio multiplied by the average account value of the period, multiplied by 183, then divided by 365. |
Tax Information
For federal income tax purposes, the following information is furnished with respect to the distributions of the Trust for its fiscal year ended September 30, 2017.
Dividends Received Deduction
Each Fund reports the maximum amount allowable of its net taxable income as eligible for the corporate dividends received deduction.
Qualified Dividend Income
A portion of dividends distributed by the Funds during the fiscal year ended September 30, 2017 are considered qualified dividend income and are eligible for reduced tax rates. These lower rates range from 5% to 20% depending on the individual’s tax bracket. Each Fund reports the maximum amount allowable of its net taxable income as qualified dividend income as provided in the Jobs and Growth Tax Relief Reconciliation Act of 2003.
Qualified Interest Income
Each fund reports the maximum amount allowable of its net taxable income and short-term capital gain as qualified interest income.
Long term capital gains dividends were paid from the following Funds during the year ended September 30, 2017:
| Amount | ||||
| SPDR S&P International Small Cap ETF |
$ | 4,180,963 | ||
| SPDR MSCI ACWI IMI ETF |
22,728 | |||
| SPDR MSCI World StrategicFactors ETF |
18,850 | |||
Foreign Tax Credit
The Trust has made an election under Internal Revenue Code Section 853 to pass through foreign taxes paid by a Fund to its shareholders. For the year ended September 30, 2017, the total amount of foreign taxes that will be passed through are:
| Amount | ||||
| SPDR STOXX Europe 50 ETF |
$ | 499,242 | ||
| SPDR EURO STOXX Small Cap ETF |
46,945 | |||
274
Table of Contents
SPDR INDEX SHARES FUNDS
OTHER INFORMATION (continued)
September 30, 2017 (Unaudited)
| Amount | ||||
| SPDR S&P Emerging Asia Pacific ETF |
$ | 1,101,815 | ||
| SPDR S&P China ETF |
1,548,749 | |||
| SPDR MSCI China A Shares IMI ETF |
3,246 | |||
| SPDR S&P Emerging Markets Dividend ETF |
1,816,423 | |||
| SPDR S&P International Small Cap ETF |
1,366,695 | |||
| SPDR S&P Global Infrastructure ETF |
191,583 | |||
| SPDR S&P Global Natural Resources ETF |
1,272,746 | |||
| SPDR MSCI ACWI IMI ETF |
91,862 | |||
| SPDR MSCI EAFE Fossil Fuel Reserves Free ETF |
93,256 | |||
| SPDR MSCI Emerging Markets Fossil Fuel Reserves Free ETF |
37,041 | |||
| SPDR MSCI EAFE StrategicFactors ETF |
295,554 | |||
| SPDR MSCI Emerging Markets StrategicFactors ETF |
611,189 | |||
| SPDR MSCI Canada StrategicFactors ETF |
121,536 | |||
| SPDR MSCI Germany StrategicFactors ETF |
38,964 | |||
| SPDR MSCI Japan StrategicFactors ETF |
35,125 | |||
| SPDR MSCI United Kingdom StrategicFactors ETF |
212 | |||
| SPDR S&P Global Dividend ETF |
260,179 | |||
| SPDR S&P Emerging Markets Small Cap ETF |
1,924,919 | |||
The amount of foreign source income earned on the following Funds during the year ended September 30, 2017 were as follows:
| Amount | ||||
| SPDR STOXX Europe 50 ETF |
$ | 8,708,219 | ||
| SPDR EURO STOXX Small Cap ETF |
345,271 | |||
| SPDR S&P Emerging Asia Pacific ETF |
9,324,013 | |||
| SPDR S&P China ETF |
21,569,031 | |||
| SPDR MSCI China A Shares IMI ETF |
31,621 | |||
| SPDR S&P Emerging Markets Dividend ETF |
18,177,254 | |||
| SPDR S&P International Small Cap ETF |
18,319,773 | |||
| SPDR S&P Global Infrastructure ETF |
3,573,501 | |||
| SPDR S&P Global Natural Resources ETF |
24,718,947 | |||
| SPDR MSCI ACWI IMI ETF |
1,307,795 | |||
| SPDR MSCI EAFE Fossil Fuel Reserves Free ETF |
1,056,937 | |||
| SPDR MSCI Emerging Markets Fossil Fuel Reserves Free ETF |
274,824 | |||
| SPDR MSCI EAFE StrategicFactors ETF |
4,145,507 | |||
| SPDR MSCI Emerging Markets StrategicFactors ETF |
5,119,221 | |||
| SPDR MSCI Canada StrategicFactors ETF |
810,513 | |||
| SPDR MSCI Germany StrategicFactors ETF |
357,646 | |||
| SPDR MSCI Japan StrategicFactors ETF |
306,442 | |||
| SPDR MSCI United Kingdom StrategicFactors ETF |
255,874 | |||
| SPDR S&P Global Dividend ETF |
4,588,788 | |||
| SPDR S&P Emerging Markets Small Cap ETF |
12,551,367 | |||
275
Table of Contents
SPDR INDEX SHARES FUNDS
OTHER INFORMATION (continued)
September 30, 2017 (Unaudited)
Proxy Voting Policies and Procedures and Records
A description of the Trust’s proxy voting policies and procedures that are used by the Funds’ investment adviser to vote proxies relating to the Funds’ portfolio of securities are available (i) without charge, upon request by calling 1-866-787-2257 (toll free) or (ii) on the website of the SEC, at www.sec.gov.
Information regarding how the investment adviser voted for the most recent period ended June 30 is available by August 31 of each year by calling the same number and on the SEC’s website, at www.sec.gov, and on the Funds’ website at www.spdrs.com.
Quarterly Portfolio Schedule
The Funds file a complete schedule of investments with the SEC for the first and third quarters of each fiscal year on Form N-Q. The Funds’ Forms N-Q are available on the SEC’s website at www.sec.gov and may be reviewed and copied at the SEC’s Public Reference Room in Washington DC. Information on the operation of the Public Reference Room may be obtained by calling 1-800-SEC-0330. The information on the Form N-Q is available upon request, without charge, by calling 1-866-787-2257 (toll free) and on the Funds’ website at www.spdrs.com.
Approval of Advisory Agreement
At an in-person meeting held prior to September 30, 2017, the Board of Trustees of the Trust (the “Board”) evaluated proposals to continue the Investment Advisory Agreement (the “Agreement”) between the Trust and SSGA Funds Management, Inc. (the “Adviser” or “SSGA FM”) with respect to the operational series of the Trust (collectively, the “Current ETFs”) and to continue the Agreement with respect to the previously approved non-operational series of the Trust (together with the Current ETFs, the “SPDR ETFs”). The Trustees who are not “interested persons” of the Trust within the meaning of the Investment Company Act of 1940, as amended (the “Independent Trustees”), also met separately with their independent legal counsel to consider the Agreement.
In evaluating the Agreement, the Board drew on materials provided to them by SSGA FM, the Trust’s investment adviser and administrator, and other materials provided by State Street Bank and Trust Company, the Trust’s sub-administrator, transfer agent and custodian (“State Street”). In deciding whether to approve the Agreement, the Board considered various factors, including the (i) nature, extent and quality of services provided by the Adviser with respect to the SPDR ETFs under the Agreement, (ii) investment performance of the Current ETFs, (iii) profits realized by the Adviser and its affiliates from its relationship with the Trust, (iv) fees charged to comparable funds, (v) other benefits to the Adviser, and (vi) extent to which economies of scale would be shared as the SPDR ETFs grow.
Nature, Extent and Quality of Services
The Board considered the nature, extent and quality of services provided by the Adviser. In doing so, the Trustees relied on their prior experience in overseeing the management of the Trust and materials provided prior to and at the meeting. The Board reviewed the Agreement and the Adviser’s responsibilities for managing investment operations of each of the SPDR ETFs in accordance with each SPDR ETF’s investment objectives and policies, and applicable legal and regulatory requirements. The Board appreciated the nature of the SPDR ETFs as exchange-traded funds and the experience and expertise of the Adviser with exchange-traded funds. The Board considered the background and experience of the Adviser’s senior management, including those individuals responsible for portfolio management, oversight of sub-advisers and regulatory compliance of the SPDR ETFs. The Board also considered the portfolio management resources, structures and practices of the Adviser, including those associated with monitoring and securing each SPDR ETF’s compliance with its investment objectives and policies and with applicable laws and regulations. The Board also considered information about the Adviser’s best execution procedures and overall investment management business, noting that the Adviser serves a wide range of clients across a broad spectrum of asset classes. The Board looked at the Adviser’s general knowledge of the investment management business and that of its affiliates which make up State Street Global Advisors, through which the Adviser shares all of its senior personnel. The Board considered that the Adviser and its affiliates constitute one of the world’s largest investment management enterprises for indexed products generally and exchange-traded funds in particular. The Board specifically considered the Adviser’s experience in managing equity exchange-traded funds with index-based investment objectives and in overseeing third-party sub-advisers, as applicable.
276
Table of Contents
SPDR INDEX SHARES FUNDS
OTHER INFORMATION (continued)
September 30, 2017 (Unaudited)
Investment Performance
The Board then reviewed the Current ETFs’ performance, noting that the distinctive indexed investment objective of each of the Current ETFs made analysis of investment performance, in absolute terms, less of a priority than that which normally attaches to the performance of actively-managed funds. Instead, the Board focused on the extent to which each Current ETF achieved its objective as a passively-managed index fund. The Board reviewed information regarding the Current ETFs’ index tracking, noting that each Current ETF satisfactorily tracked its benchmark index.
Profits Realized by the Adviser
The Board considered the profitability of the advisory arrangement with the Current ETFs to the Adviser, including data on the Current ETFs’ historical profitability to the Adviser. The Independent Trustees, with their independent legal counsel, had the opportunity to discuss, with representatives of the Adviser and State Street, methodologies used in computing costs that formed the bases of profitability calculations and determined that these methodologies were reasonable.
Fees Charged to Comparable Funds
The Board evaluated each SPDR ETF’s unitary fee through review of comparative information with respect to fees paid by similar funds — i.e., exchange-traded funds tracking similar equity indexes. The Board reviewed the universe of similar exchange-traded funds for each SPDR ETF based upon data independently obtained from Broadridge Financial Solutions, Inc. (formerly Lipper Analytical Services) and related comparative information for similar exchange-traded funds. In doing so, the Board used a fund by fund analysis of the data.
Other Benefits
The Board also considered whether the Adviser or its affiliates benefited in other ways from its relationship with the Trust, noting that the Adviser does not maintain soft-dollar arrangements in connection with the Trust’s brokerage transactions.
Economies of Scale
The Board reviewed information regarding economies of scale or other efficiencies that may result as each SPDR ETF’s assets grow in size. The Board noted that the Agreement did not provide for breakpoints in each SPDR ETF’s advisory fee rates as assets of a SPDR ETF increase. However, the Board further noted the Adviser’s assertion that future economies of scale (among several factors) had been taken into consideration for the SPDR ETFs by fixing relatively low advisory fees, effectively sharing the benefits of lower fees with the SPDR ETFs from inception. The Adviser also asserted that one of the benefits of the unitary fee was to provide an unvarying expense structure, which could be lost or diluted with the addition of breakpoints. The Board noted that it intends to continue to monitor fees as the SPDR ETFs grow in size and assess whether fee breakpoints may be warranted.
Conclusion
The Board, including the Independent Trustees voting separately, approved the Agreement for each SPDR ETF after weighing the foregoing factors, none of which was dispositive in itself and may have been weighed differently by each Trustee. The Board’s conclusions with respect to the Agreement were as follows: (a) the nature and extent of the services provided by the Adviser with respect to the SPDR ETFs were appropriate; (b) the performance and, more importantly, the index tracking, of each Current ETF had been satisfactory; (c) the Adviser’s unitary fee for each SPDR ETF, considered in relation to services provided and in relation to fees charged to comparable funds, was fair and reasonable; (d) profitability of the Trust’s relationships with the Adviser was not excessive; (e) any additional potential benefits to the Adviser or its affiliates were not of a magnitude to materially affect the Board’s conclusions; and (f) fees paid to the Adviser adequately shared the economies of scale with respect to the Current ETFs by way of the relatively low fee structure of the Trust.
Approval of State Street Global Advisors Asia Limited Sub-Advisory Agreement
At an in-person meeting held prior to September 30, 2017, the Board also evaluated a proposal to continue the Sub-Advisory Agreement (the “SSGA Asia Limited Sub-Advisory Agreement”) between the Adviser and State Street Global Advisors Asia Limited (“SSGA Asia Limited”), an affiliate of the Adviser, with respect to the SPDR MSCI
277
Table of Contents
SPDR INDEX SHARES FUNDS
OTHER INFORMATION (continued)
September 30, 2017 (Unaudited)
China A Shares IMI ETF (the “Fund”), which is sub-advised by SSGA Asia Limited. The Independent Trustees also met separately with their independent legal counsel to consider the SSGA Asia Limited Sub-Advisory Agreement.
In evaluating the SSGA Asia Limited Sub-Advisory Agreement, the Board drew on materials provided to them by SSGA Asia Limited and the Adviser. In deciding whether to approve the SSGA Asia Limited Sub-Advisory Agreement, the Board considered various factors, including the (i) nature, extent and quality of services provided by SSGA Asia Limited with respect to the Fund under the SSGA Asia Limited Sub-Advisory Agreement and (ii) investment performance of the Fund. The Board was informed of the portion of the current advisory fee that the Adviser would pay to SSGA Asia Limited under the SSGA Asia Limited Sub-Advisory Agreement and also considered that such fees would be paid directly by the Adviser and would not result in increased fees payable by the Fund.
The Board considered the background and experience of SSGA Asia Limited’s senior management and, in particular, SSGA Asia Limited’s experience in investing in Asian equity securities. The Board reviewed the Fund’s performance, noting that the Fund tracked its benchmark index. The Board also considered the unitary fee paid to the Adviser by the Fund and SSGA Asia Limited’s fees paid by the Adviser. The Board also considered whether SSGA Asia Limited benefited in other ways from its relationship with the Trust.
The Board, including the Independent Trustees voting separately, approved the SSGA Asia Limited Sub-Advisory Agreement for the Fund after weighing the foregoing factors as well as the relevant factors discussed in relation to the Agreement between the Trust and the Adviser, none of which was dispositive in itself and may have been weighed differently by each Trustee. The Board’s conclusions with respect to the SSGA Asia Limited Sub-Advisory Agreement were as follows: (a) the nature and extent of the services provided by SSGA Asia Limited with respect to the Fund were appropriate; (b) the performance and, more importantly, the index tracking, of the Fund had been satisfactory; (c) SSGA Asia Limited’s fees for the Fund and the unitary fee, considered in relation to the services provided, were fair and reasonable; (d) any additional potential benefits to SSGA Asia Limited were not of a magnitude to materially affect the Board’s conclusions; and (e) fees paid to SSGA Asia Limited adequately shared the economies of scale with the Fund by way of the relatively low fee structure of the Trust.
278
Table of Contents
SPDR INDEX SHARES FUNDS
OTHER INFORMATION (continued)
September 30, 2017 (Unaudited)
TRUSTEES AND OFFICERS INFORMATION
| Name, Address and Year of Birth |
Position(s) with Funds |
Term of Office and Length
of Time Served |
Principal Occupation(s) During
Past 5 Years |
Number of |
Other Directorships Held by Trustee | |||||
| Independent Trustees |
||||||||||
| FRANK NESVET c/o SPDR Index Shares Funds State Street Financial Center One Lincoln Street Boston, MA 02111-2900 1943 |
Independent Trustee, Chairman, Trustee Committee Chair |
Term: Unlimited Served: since September 2000 |
Retired. | 148 | None. | |||||
| DAVID M. KELLY c/o SPDR Index Shares Funds State Street Financial Center One Lincoln Street Boston, MA 02111-2900 1938 |
Independent Trustee | Term: Unlimited Served: since September 2000 |
Retired. | 148 | Chicago Stock Exchange (Former Director, retired); Penson Worldwide Inc. (Former Director, retired). | |||||
| BONNY EUGENIA BOATMAN c/o SPDR Index Shares Funds State Street Financial Center One Lincoln Street Boston, MA 02111-2900 1950 |
Independent Trustee | Term: Unlimited Served: since April 2010 |
Retired. | 148 | None. | |||||
| DWIGHT D. CHURCHILL c/o SPDR Index Shares Funds State Street Financial Center One Lincoln Street Boston, MA 02111-2900 1953 |
Independent Trustee | Term: Unlimited Served: since April 2010 |
Self-employed consultant since 2010; CEO and President, CFA Institute (June 2014-January 2015). |
148 | Affiliated Managers Group, Inc. (Director). | |||||
| CARL G. VERBONCOEUR c/o SPDR Index Shares Funds State Street Financial Center One Lincoln Street Boston, MA 02111-2900 1952 |
Independent Trustee, Audit Committee Chair | Term: Unlimited Served: since April 2010 |
Self-employed consultant since 2009. | 148 | The Motley Fool Funds Trust (Trustee). |
279
Table of Contents
SPDR INDEX SHARES FUNDS
OTHER INFORMATION (continued)
September 30, 2017 (Unaudited)
| Name, Address and Year of Birth |
Position(s) with Funds |
Term of Office and Length of Time Served |
Principal Occupation(s) During Past 5 Years |
Number of Portfolios in Fund Complex Overseen by Trustee† |
Other Directorships Held by Trustee During the Past 5 Years | |||||
| Interested Trustee |
||||||||||
| JAMES E. ROSS* SSGA Funds Management, Inc. State Street Financial Center One Lincoln Street Boston, MA 02111 1965 |
Interested Trustee |
Term: Unlimited Served as Trustee: since April 2010 |
Chairman and Director, SSGA Funds Management, Inc. (2005-present); Executive Vice President, State Street Global Advisors (2006-present); Chief Executive Officer and Director, State Street Global Advisors Funds Distributors, LLC (May 2017-present); Director, State Street Global Markets, LLC (2013-April 2017); President, SSGA Funds Management, Inc. (2005-2012); Principal, State Street Global Advisors (2000-2005). |
234 | SSGA SPDR ETFs Europe I plc (Director) (November 2016-present); SSGA SPDR ETFs Europe II plc (Director) (November 2016-present). |
| † | For the purpose of determining the number of portfolios overseen by the Trustees, “Fund Complex” comprises registered investment companies for which SSGA Funds Management, Inc. serves as investment adviser. |
| * | Mr. Ross is an Interested Trustee because of his employment with the Adviser and ownership interest in an affiliate of the Adviser. Mr. Ross previously served as an Interested Trustee from November 2005 to December 2009. |
| Name, Address and Year of Birth |
Position(s) with Funds |
Term of Office and Length of Time Served |
Principal Occupation(s) During the Past 5 Years | |||
| Officers |
||||||
| ELLEN M. NEEDHAM SSGA Funds Management, Inc. State Street Financial Center One Lincoln Street Boston, MA 02111 1967 |
President | Term: Unlimited Served: since October 2012 |
President and Director, SSGA Funds Management, Inc. (2001-present)*; Senior Managing Director, State Street Global Advisors (1992-present)*; Director, State Street Global Advisors Funds Distributors, LLC (May 2017-present). | |||
| BRUCE S. ROSENBERG SSGA Funds Management, Inc. State Street Financial Center One Lincoln Street Boston, MA 02111 1961 |
Treasurer | Term: Unlimited Served: since February 2016 |
Managing Director, State Street Global Advisors and SSGA Funds Management, Inc. (July 2015-present); Director, Credit Suisse (April 2008-July 2015). |
280
Table of Contents
SPDR INDEX SHARES FUNDS
OTHER INFORMATION (continued)
September 30, 2017 (Unaudited)
| Name, Address and Year of Birth |
Position(s) with Funds |
Term of Office and Length of Time Served |
Principal Occupation(s) During the Past 5 Years | |||
| ANN M. CARPENTER SSGA Funds Management, Inc. State Street Financial Center One Lincoln Street Boston, MA 02111 1966 |
Vice President; Deputy Treasurer |
Term: Unlimited Served: since August 2012; Term: Unlimited Served: Since April 2015 |
Chief Operating Officer, SSGA Funds Management, Inc. (2005-Present)*; Managing Director, State Street Global Advisors (2005-present).* | |||
| MICHAEL P. RILEY SSGA Funds Management, Inc. State Street Financial Center One Lincoln Street Boston, MA 02111 1969 |
Vice President |
Term: Unlimited Served: since February 2005 |
Managing Director, State Street Global Advisors (2005-present).* | |||
| JOSHUA A. WEINBERG SSGA Funds Management, Inc. State Street Financial Center One Lincoln Street Boston, MA 02111 1978 |
Chief Legal Officer |
Term: Unlimited Served: since February 2015 |
Vice President and Managing Counsel, State Street Global Advisors (2011-present); Clerk, SSGA Funds Management, Inc. (2013-present); Associate, Financial Services Group, Dechert LLP (2006-2011). | |||
| JESSE D. HALLEE State Street Bank and Trust Company One Hundred Summer Street, SUM0703 Boston, MA 02111 1976 |
Secretary | Term: Unlimited Served: since August 2017 |
Vice President and Managing Counsel, State Street Bank and Trust Company (2013-present); Vice President and Counsel, Brown Brothers Harriman & Co. (2007-2013).** | |||
| CHAD C. HALLETT SSGA Funds Management, Inc. State Street Financial Center One Lincoln Street Boston, MA 02111 1969 |
Deputy Treasurer |
Term: Unlimited Served: since February 2016 |
Vice President, State Street Global Advisors and SSGA Funds Management, Inc. (November 2014-present); Vice President, State Street Bank and Trust Company (2001-November 2014).* | |||
| DARLENE ANDERSON-VASQUEZ SSGA Funds Management, Inc. State Street Financial Center One Lincoln Street Boston, MA 02111 1968 |
Deputy Treasurer |
Term: Unlimited Served: since November 2016 |
Managing Director, State Street Global Advisors and SSGA Funds Management, Inc. (May 2016-present); Senior Vice President, John Hancock Investments (September 2007-May 2016). | |||
| ARTHUR A. JENSEN SSGA Funds Management, Inc. 1600 Summer Street Stamford, CT 06905 1966 |
Deputy Treasurer |
Term: Unlimited Served: since August 2017 |
Vice President at State Street Global Advisors (July 2016-present); Mutual Funds Controller of GE Asset Management Incorporated (April 2011-July 2016). | |||
| SUJATA UPRETI SSGA Funds Management, Inc. State Street Financial Center One Lincoln Street Boston, MA 02111 1974 |
Assistant Treasurer |
Term: Unlimited Served: since February 2016 |
Vice President, State Street Global Advisors and SSGA Funds Management, Inc. (May 2015-present); Assistant Director, Cambridge Associates, LLC (July 2014-January 2015); Vice President, Bank of New York Mellon (July 2012-August 2013); Manager, PricewaterhouseCoopers, LLP (September 2003-July 2012). |
281
Table of Contents
SPDR INDEX SHARES FUNDS
OTHER INFORMATION (continued)
September 30, 2017 (Unaudited)
| Name, Address and Year of Birth |
Position(s) with Funds |
Term of Office and Length of Time Served |
Principal Occupation(s) During the Past 5 Years | |||
| DANIEL FOLEY SSGA Funds Management, Inc. State Street Financial Center One Lincoln Street Boston, MA 02111 1972 |
Assistant Treasurer |
Term: Unlimited Served: since February 2016 |
Vice President, State Street Global Advisors and SSGA Funds Management, Inc. (April 2007-present).* | |||
| DANIEL G. PLOURDE SSGA Funds Management, Inc. State Street Financial Center One Lincoln Street Boston, MA 02111 1980 |
Assistant Treasurer |
Term: Unlimited Served: since May 2017 |
Assistant Vice President, SSGA Funds Management, Inc. (May 2015-present); Officer, State Street Bank and Trust Company (March 2009-May 2015). | |||
| BRIAN HARRIS SSGA Funds Management, Inc. State Street Financial Center One Lincoln Street Boston, MA 02111 1973 |
Chief Compliance Officer; Anti-Money Laundering Officer; Code of Ethics Compliance Officer |
Term: Unlimited Served: since November 2013 |
Managing Director, State Street Global Advisors and SSGA Funds Management, Inc. (June 2013-present)*; Senior Vice President and Global Head of Investment Compliance, BofA Global Capital Management (2010-2013). |
| * | Served in various capacities and/or with various affiliated entities during noted time period. |
| ** | Served in various capacities and/or with unaffiliated mutual funds or closed-end funds for which State Street Bank and Trust Company or its affiliates act as a provider of services during the noted time period. |
Statement of Additional Information (SAI) includes additional information about Funds’ directors and is available, without charge, upon request and by calling 1-866-787-2257.
282
Table of Contents
SPDR® Index Shares Funds
SPDR Index Shares Funds
Trustees
Bonny E. Boatman
Dwight D. Churchill
David M. Kelly
Frank Nesvet, Chairman
James E. Ross
Carl G. Verboncoeur
Investment Manager and Administrator
SSGA Funds Management, Inc.
State Street Financial Center
One Lincoln Street
Boston, MA 02111
Distributor
State Street Global Advisors Funds Distributors, LLC
One Lincoln Street
Boston, MA 02111
Custodian, Sub-Administrator and Transfer Agent
State Street Bank and Trust Company
One Lincoln Street
Boston, MA 02111
Legal Counsel
Morgan, Lewis & Bockius LLP
1111 Pennsylvania Avenue, NW
Washington, DC 20004
Independent Registered Public Accounting Firm
PricewaterhouseCoopers LLP
101 Seaport Boulevard
Suite 500
Boston, MA 02210
Fund Shares are distributed by State Street Global Advisors Funds Distributors, LLC, a wholly-owned subsidiary of State Street Corporation. State Street Global Advisors Funds Distributors, LLC; member FINRA, SIPC.
The information contained in this report is intended for the general information of shareholders of the Trust. This report is not authorized for distribution to prospective investors unless preceded or accompanied by a current Trust prospectus which contains important information concerning the Trust. You may obtain a current prospectus and SAI from the Distributor by calling 1-866-787-2257 or visiting www.spdrs.com. Please read the prospectus carefully before you invest.
Table of Contents
SPDR® Index Shares Funds
For more complete information, please call 866.787.2257 or
visit spdrs.com today.
ssga.com | spdrs.com
The Funds are not sponsored, endorsed, sold, or promoted by Stoxx, S&P Dow Jones Indices LLC, MSCI Inc., and Russell Investment Group. Neither do these companies make any representation regarding the advisability of investing in the Funds. The Funds are distributed by State Street Global Advisors Funds Distributors, LLC, an indirect wholly-owned subsidiary of State Street Corporation. State Street Global Advisors Funds Distributors, LLC is a member of FINRA, SIPC. References to State Street may include State Street Corporation and its affiliates. Shares of the Funds are not insured by the FDIC or by another governmental agency; they are not obligations of the FDIC nor are they deposits or obligations of or guaranteed by State Street Bank and Trust Company. Fund shares are subject to investment risks, including possible loss of the principal invested. The Funds pay State Street for its services as investment advisor, custodian, sub-administrator, securities lending agent, transfer agent and shareholder servicing agent.
Standard & Poor’s®, S&P® and SPDR® are registered trademarks of Standard & Poor’s Financial Services LLC (S&P); Dow Jones is a registered trademark of Dow Jones Trademark Holdings LLC (Dow Jones); and these trademarks have been licensed for use by S&P Dow Jones Indices LLC (SPDJI) and sublicensed for certain purposes by State Street Corporation. State Street Corporation’s financial products are not sponsored, endorsed, sold or promoted by SPDJI, Dow Jones, S&P, their respective affiliates and third party licensors and none of such parties make any representation regarding the advisability of investing in such product(s) nor do they have any liability in relation thereto, including for any errors, omissions, or interruptions of any index.
Distributor: State Street Global Advisors Funds Distributors, LLC, member FINRA, SIPC, an indirect wholly owned subsidiary of State Street Corporation. References to State Street may include State Street Corporation and its affiliates. Certain State Street affiliates provide services and receive fees from the SPDR ETFs.
Before investing, consider the funds’ investment objectives, risks, charges and expenses. To obtain a prospectus or summary prospectus which contains this and other information, call 1-866-787-2257 or visit www.spdrs.com. Read it carefully.
Not FDIC Insured • No Bank Guarantee • May Lose Value
The information contained in this report is intended for the general information of shareholders of the Trust. This report is not authorized for distribution to prospective investors unless preceded or accompanied by a current Trust prospectus which contains important information concerning the Trust. You may obtain a current prospectus and SAI from the Distributor by calling 1-866-787-2257 or visiting www.spdrs.com. Please read the prospectus carefully before you invest.
| State Street Global Advisors | © 2017 State Street Corporation. All Rights Reserved. 0515 Exp. Date: 11/30/2018 SPDRIDEXAR IBG-25720 |
Table of Contents
Annual Report
September 30, 2017
SPDR® Index Shares Funds
SPDR EURO STOXX 50 ETF
SPDR MSCI ACWI ex-US ETF
SPDR S&P International Dividend ETF
The information contained in this report is intended for the general information of shareholders of the Trust. This report is not authorized for distribution to prospective investors unless preceded or accompanied by a current Trust prospectus which contains important information concerning the Trust. You may obtain a current prospectus and SAI from the Distributor by calling 1-866-787-2257 or visiting www.spdrs.com. Please read the prospectus carefully before you invest.

Table of Contents
The information contained in this report is intended for the general information of shareholders of the Trust. This report is not authorized for distribution to prospective investors unless preceded or accompanied by a current Trust prospectus which contains important information concerning the Trust. You may obtain a current prospectus and SAI from the Distributor by calling 1-866-787-2257 or visiting www.spdrs.com. Please read the prospectus carefully before you invest.
Table of Contents

NOTES TO PERFORMANCE SUMMARY (UNAUDITED)
The performance chart of a Fund’s total return at net asset value (“NAV”), the total return based on market price and its benchmark index is provided for comparative purposes only and represents the periods noted. A Fund’s per share NAV is the value of one share of a Fund and is calculated by dividing the value of total assets less total liabilities by the number of shares outstanding. The NAV return is based on the NAV of a Fund and the market return is based on the market price per share of a Fund. The market price used to calculate the market return is determined by using the midpoint between the highest bid and the lowest offer on the exchange on which the shares of a Fund are listed for trading, as of the time that a Fund’s NAV is calculated. NAV and market returns assume that dividends and capital gain distributions have been reinvested in a Fund at NAV. Market returns do not include brokerage commissions that may be payable on secondary market transactions. If brokerage commissions were included market returns would be lower.
An index is a statistical measure of a specified financial market or sector. An index does not actually hold a portfolio of securities and therefore does not reflect deductions for fees or expenses. In comparison, a Fund’s performance is negatively impacted by these deductions. Index returns reflect all items of income, gain and loss and the reinvestment of dividends and other income.
The EURO STOXX 50 Index is designed to represent the performance of some of the largest companies across components of the 19 EURO STOXX Supersector Indexes. The EURO STOXX Supersector Indexes are subsets of the EURO STOXX Index. The EURO STOXX Index is a broad yet liquid subset of the STOXX Europe 600 Index. The Index captures approximately 60% of the free-float market capitalization of the EURO STOXX Total Market Index, which in turn covers approximately 95% of the free float market capitalization of the represented countries.
The MSCI ACWI ex-USA Index is a float-adjusted market capitalization index that is designed to measure the combined equity market performance of developed and emerging market countries excluding the United States.
The S&P International Dividend Opportunities® Index is designed to measure the performance of the 100 highest dividend-yielding common stocks and ADRs listed in primary exchanges of countries included in the S&P/Citigroup Broad Market Index.
1
Table of Contents
MANAGEMENT’S DISCUSSION OF FUND PERFORMANCE
(UNAUDITED)
The SPDR EURO STOXX 50 ETF (the “Fund”) seeks to provide investment results that, before fees and expenses, correspond generally to the total return performance of the EURO STOXX 50® Index. The Fund’s benchmark is the EURO STOXX 50® Index (the “Index”).
For the 12-month period ended September 30, 2017 (the “Reporting Period”), the total return for the Fund was 29.30%, and the Index was 29.21%. The Fund and Index returns reflect the reinvestment of dividends and other income. The Fund’s performance reflects the expenses of managing the Fund, including brokerage and advisory expenses. The Index is unmanaged and Index returns do not reflect fees and expenses of any kind, which would have a negative impact on returns. Fees and expenses, cash drag and tax withholdings contributed to the difference between the Fund’s performance and that of the Index.
While Brexit created some uncertainty in the first half of 2016, the rollout of additional monetary policies by major central banks globally provided the much needed fodder to create an aggressive rally and end 2016 on an optimistic note. In the first half of 2017, U.S. stockholders who were invested in European equities benefitted from a better than 8% gain of the Euro against the U.S. dollar. In addition to an improving economic backdrop, European shares benefitted from an easing of political uncertainty with the defeat of populist candidates in the Netherlands in February and in presidential polls in France that spanned April and May. Positive returns continued to be realized for the Fund from strong economic and earnings growth in the Eurozone in the second half of 2017. As Eurozone industrial production trended higher, the Fund witnessed another double-digit positive performance in the third quarter of 2017.
The Fund did not invest in derivatives during the Reporting Period.
On an individual security level, the top positive contributors to the Fund’s performance were Banco Santander S.A., Allianz SE, and BNP Paribas SA Class A. The top negative contributors to the Fund’s performance were Unibail-Rodamco SE, Royal Ahold Delhaize N.V., and Anheuser-Busch InBev SA/NV.
The views expressed above reflect those of the Fund’s portfolio manager only through the Reporting Period, and do not necessarily represent the views of the Adviser as a whole. Any such views are subject to change at any time based upon market or other conditions and the Adviser disclaims any responsibility to update such views. These views may not be relied on as investment advice and, because investment decisions for a fund are based on numerous factors, may not be relied on as an indication of trading intent on behalf of any fund.
2
Table of Contents
SPDR EURO STOXX 50 ETF
PERFORMANCE SUMMARY (UNAUDITED)
Performance as of September 30, 2017
| Cumulative Total Return | Average Annual Total Return | |||||||||||||||||||||||||||||
| Net Asset Value |
Market Value |
Euro Stoxx 50 Index |
Net Asset Value |
Market Value |
Euro Stoxx 50 Index |
|||||||||||||||||||||||||
| ONE YEAR | 29.30% | 28.98% | 29.21% | 29.30% | 28.98% | 29.21% | ||||||||||||||||||||||||
| FIVE YEARS | 56.13% | 55.70% | 54.18% | 9.32% | 9.26% | 9.05% | ||||||||||||||||||||||||
| TEN YEARS | –3.85% | –4.01% | –6.96% | –0.39% | –0.41% | –0.72% | ||||||||||||||||||||||||
Comparison of Change in Value of a $10,000 Investment
(Based on Net Asset Value)

Line graph is based on cumulative total return.
The total expense ratio for SPDR EURO STOXX 50 ETF as stated in the Fees and Expenses table of the prospectus dated January 31, 2017 (as supplemented October 16, 2017) is 0.29%.
Performance quoted represents past performance, which is no guarantee of future results. Investment return and principal value will fluctuate, so you may have a gain or loss when shares are sold. Current performance may be higher or lower than that quoted. Visit www.spdrs.com for most recent month-end performance. The returns do not reflect the deduction of taxes that a shareholder would pay on Fund distributions or on the redemption or sale of Fund shares. See “Notes to Performance Summary” on page 1 for more information.
3
Table of Contents
SPDR EURO STOXX 50 ETF
PORTFOLIOS STATISTICS (UNAUDITED)
Top Ten Holdings as of September 30, 2017
| Description | % of Net Assets | |||||||
| TOTAL SA |
4.6 | % | ||||||
| Siemens AG |
4.1 | |||||||
| Sanofi |
3.9 | |||||||
| Bayer AG |
3.9 | |||||||
| Banco Santander SA |
3.9 | |||||||
| SAP SE |
3.8 | |||||||
| Allianz SE |
3.5 | |||||||
| BASF SE |
3.4 | |||||||
| Unilever NV |
3.2 | |||||||
| BNP Paribas SA |
3.2 | |||||||
| TOTAL |
37.5 | % | ||||||
(The ten largest holdings are subject to change, and there are no guarantees the Fund will continue to remain invested in any particular company.)
Sector Breakdown as of September 30, 2017
| % of Net Assets | ||||||||
| Financials |
22.9 | % | ||||||
| Industrials |
13.5 | |||||||
| Consumer Discretionary |
11.3 | |||||||
| Health Care |
11.2 | |||||||
| Consumer Staples |
10.5 | |||||||
| Information Technology |
7.3 | |||||||
| Materials |
6.3 | |||||||
| Energy |
6.1 | |||||||
| Utilities |
5.0 | |||||||
| Telecommunication Services |
4.9 | |||||||
| Real Estate |
0.8 | |||||||
| Short-Term Investments |
0.1 | |||||||
| Other Assets |
0.1 | |||||||
| TOTAL |
100.0 | % | ||||||
(The Fund’s sector breakdown is expressed as a percentage of net assets and may change over time.)
4
Table of Contents
MANAGEMENT’S DISCUSSION OF FUND PERFORMANCE
(UNAUDITED)
The SPDR MSCI ACWI ex-US ETF (the “Fund”) seeks to provide investment results that, before fees and expenses, correspond generally to the total return performance of an index based upon broad based world (ex-US) equity markets. The Fund’s benchmark is the MSCI All Country World Index ex USA Index (the “Index”).
For the 12-month period ended September 30, 2017 (the “Reporting Period”), the total return for the Fund was 19.24%, and the Index was 19.61%. The Fund and Index returns reflect the reinvestment of dividends and other income. The Fund’s performance reflects the expenses of managing the Fund, including brokerage and advisory expenses. The Index is unmanaged and Index returns do not reflect fees and expenses of any kind, which would have a negative impact on returns. Fund expenses, cash drag, lending, compounding and slight variations between the Fund’s holdings and the Index constituents contributed to the difference between the Fund’s performance and that of the Index.
The Fund would start the Reporting Period with lackluster performance as one of the most identifiable causes for the angst across asset classes was a sharp rise in global sovereign bond yields coincident with a paring back of expectations for future global central bank policy support. The MSCI ACWI ex-US index would not look back after it saw a positive turn in performance starting in December 2016 and would go on to post double digit gains for the Reporting Period. The first quarter of 2017 witnessed an optimistic tone in all regional indices globally, largely on the back of growth expectations. In addition to an improving economic backdrop, European shares in the Fund benefitted from an easing of political uncertainty with the defeat of populist candidates in the Netherlands in February and in presidential polls in France that spanned April and May. The third quarter of 2017 also saw a positive performance for the Fund as markets continued to rally on back of strong retail sales and improved macroeconomic and manufacturing data
The Fund did not invest in derivatives during the Reporting Period.
On an individual security level, the top positive contributors to the Fund’s performance were Samsung Electronics Co., Ltd., Tencent Holdings Ltd., and Alibaba Group Holding Ltd. Sponsored ADR. The top negative contributors to the Fund’s performance were Astellas Pharma Inc., Anheuser-Busch InBev SA/NV, and Teva Pharmaceutical Industries Limited.
The views expressed above reflect those of the Fund’s portfolio manager only through the Reporting Period, and do not necessarily represent the views of the Adviser as a whole. Any such views are subject to change at any time based upon market or other conditions and the Adviser disclaims any responsibility to update such views. These views may not be relied on as investment advice and, because investment decisions for a fund are based on numerous factors, may not be relied on as an indication of trading intent on behalf of any fund.
5
Table of Contents
SPDR MSCI ACWI EX-US ETF
PERFORMANCE SUMMARY (UNAUDITED)
Performance as of September 30, 2017
| Cumulative Total Return | Average Annual Total Return | |||||||||||||||||||||||||||||
| Net Asset Value |
Market Value |
MSCI ACWI Ex USA Index |
Net Asset Value |
Market Value |
MSCI ACWI Ex USA Index |
|||||||||||||||||||||||||
| ONE YEAR | 19.24% | 19.32% | 19.61% | 19.24% | 19.32% | 19.61% | ||||||||||||||||||||||||
| FIVE YEARS | 41.35% | 42.73% | 40.08% | 7.17% | 7.37% | 6.97% | ||||||||||||||||||||||||
| TEN YEARS | 16.51% | 16.73% | 13.51% | 1.54% | 1.56% | 1.28% | ||||||||||||||||||||||||
Comparison of Change in Value of a $10,000 Investment
(Based on Net Asset Value)

Line graph is based on cumulative total return.
The total expense ratio for SPDR MSCI ACWI Ex-US ETF as stated in the Fees and Expenses table of the prospectus dated January 31, 2017 (as supplemented October 16, 2017) is 0.34% (0.30% after fee waiver). SSGA Funds Management, Inc. has contractually agreed to limit its management fee to the extent necessary to limit annual operating expenses to 0.30% until January 31, 2018.
Performance quoted represents past performance, which is no guarantee of future results. Investment return and principal value will fluctuate, so you may have a gain or loss when shares are sold. Current performance may be higher or lower than that quoted. Visit www.spdrs.com for most recent month-end performance. The returns do not reflect the deduction of taxes that a shareholder would pay on Fund distributions or on the redemption or sale of Fund shares. See “Notes to Performance Summary” on page 1 for more information.
6
Table of Contents
SPDR MSCI ACWI EX-US ETF
PORTFOLIO STATISTICS (UNAUDITED)
Top Ten Holdings as of September 30, 2017
| Description | % of Net Assets | |||||||
| Nestle SA |
1.3 | % | ||||||
| Tencent Holdings, Ltd. |
1.2 | |||||||
| Samsung Electronics Co., Ltd. GDR |
1.1 | |||||||
| Novartis AG |
1.0 | |||||||
| HSBC Holdings PLC |
1.0 | |||||||
| Taiwan Semiconductor Manufacturing Co., Ltd. ADR |
0.9 | |||||||
| Roche Holding AG |
0.9 | |||||||
| Alibaba Group Holding, Ltd. ADR |
0.9 | |||||||
| Toyota Motor Corp. |
0.8 | |||||||
| Royal Dutch Shell PLC |
0.7 | |||||||
| TOTAL |
9.8 | % | ||||||
(The ten largest holdings are subject to change, and there are no guarantees the Fund will continue to remain invested in any particular company.)
Sector Breakdown as of September 30, 2017
| % of Net Assets | ||||||||
| Financials |
23.0 | % | ||||||
| Industrials |
12.8 | |||||||
| Consumer Discretionary |
11.0 | |||||||
| Information Technology |
10.6 | |||||||
| Consumer Staples |
9.5 | |||||||
| Health Care |
8.1 | |||||||
| Materials |
7.5 | |||||||
| Energy |
6.4 | |||||||
| Telecommunication Services |
4.6 | |||||||
| Utilities |
3.1 | |||||||
| Real Estate |
2.7 | |||||||
| Short-Term Investments |
1.5 | |||||||
| Liabilities in Excess of Other Assets |
(0.8 | ) | ||||||
| TOTAL |
100.0 | % | ||||||
(The Fund’s sector breakdown is expressed as a percentage of net assets and may change over time.)
7
Table of Contents
SPDR S&P INTERNATIONAL DIVIDEND ETF
MANAGEMENT’S DISCUSSION OF FUND PERFORMANCE
(UNAUDITED)
The SPDR S&P International Dividend ETF (the “Fund”) seeks to provide investment results that, before fees and expenses, correspond generally to the total return performance of an index that tracks exchange listed common stocks of companies domiciled in countries outside the United States that offer high dividend yields. The Fund’s benchmark is the S&P International Dividend Opportunities® Index (the “Index”).
For the 12-month period ended September 30, 2017 (the “Reporting Period”), the total return for the Fund was 15.84%, and the Index was 16.95%. The Fund and Index returns reflect the reinvestment of dividends and other income. The Fund’s performance reflects the expenses of managing the Fund, including brokerage and advisory expenses. The Index is unmanaged and Index returns do not reflect fees and expenses of any kind, which would have a negative impact on returns. Fund expenses, income from securities lending, cash drag, transaction costs, compounding differences resulting from performance volatility, and slight variations between the Fund’s holdings and the Index constituents contributed to the difference between the Fund’s performance and that of the Index.
Over the last twelve months, the performance of the S&P International Dividend ETF was lower than the MSCI EAFE index, its broad-based market cap counterpart. Despite negative returns for the MSCI EAFE index in the fourth quarter of 2016, the Fund finished in positive territory in this first quarter of the Reporting Period. This performance came on the heels of the U.S. election when markets saw a rise in growth assets. During the first quarter of 2017, the Fund experienced the strongest quarterly performance and returned roughly 6.1%. The strong advance for equities occurred despite a faster than anticipated first 2017 hike by the Federal Reserve in March that might otherwise have dragged down performance, suggesting that a sustainable global growth narrative was more compelling. The early week of the second quarter of 2017 saw earnings advanced for many developed market companies. The improving earnings trend provided fuel for gains across the major regional market indices in the first half of 2017. This continued into the third quarter of 2017, where we saw the S&P International Dividend ETF return 4.2% for the quarter.
The Fund did not invest in derivatives during the Reporting Period.
On an individual security level, the top positive contributors to the Fund’s performance were STMicroelectronics NV, Rio Tinto plc and Phison Electronics Corp. The top negative contributors to the Fund’s performance were Telstra Corporation Limited, Electricite de France SA, and Crescent Point Energy Corp.
The views expressed above reflect those of the Fund’s portfolio manager only through the Reporting Period, and do not necessarily represent the views of the Adviser as a whole. Any such views are subject to change at any time based upon market or other conditions and the Adviser disclaims any responsibility to update such views. These views may not be relied on as investment advice and, because investment decisions for a fund are based on numerous factors, may not be relied on as an indication of trading intent on behalf of any fund.
8
Table of Contents
SPDR S&P INTERNATIONAL DIVIDEND ETF
PERFORMANCE SUMMARY (UNAUDITED)
Performance as of September 30, 2017
| Cumulative Total Return | Average Annual Total Return | |||||||||||||||||||||||||||||
| Net Asset Value |
Market Value |
S&P International Dividend Opportunities Index |
Net Asset Value |
Market Value |
S&P International Dividend Opportunities Index |
|||||||||||||||||||||||||
| ONE YEAR | 15.84% | 15.66% | 16.95% | 15.84% | 15.66% | 16.95% | ||||||||||||||||||||||||
| FIVE YEARS | 16.24% | 16.84% | 19.65% | 3.06% | 3.16% | 3.65% | ||||||||||||||||||||||||
| SINCE INCEPTION(1) | –0.80% | –0.42% | 0.10% | –0.08% | –0.04% | 0.01% | ||||||||||||||||||||||||
| (1) | For the period February 12, 2008 to September 30, 2017. Since shares of the Fund did not trade in the secondary market until the day after the Fund’s inception, for the period from inception to the first day of secondary market trading in shares of the Fund (2/12/08, 2/13/08, respectively), the NAV of the Fund is used as a proxy for the secondary market trading price to calculate market returns. |
Comparison of Change in Value of a $10,000 Investment
(Based on Net Asset Value)
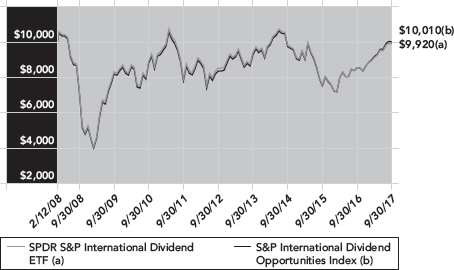
Line graph is based on cumulative total return.
The total expense ratio for SPDR S&P International Dividend ETF as stated in the Fees and Expenses table of the prospectus dated January 31, 2017 (as supplemented October 16, 2017) is 0.45%.
Performance quoted represents past performance, which is no guarantee of future results. Investment return and principal value will fluctuate, so you may have a gain or loss when shares are sold. Current performance may be higher or lower than that quoted. Visit www.spdrs.com for most recent month-end performance. The returns do not reflect the deduction of taxes that a shareholder would pay on Fund distributions or on the redemption or sale of Fund shares. See “Notes to Performance Summary” on page 1 for more information.
9
Table of Contents
SPDR S&P INTERNATIONAL DIVIDEND ETF
PORTFOLIO STATISTICS (UNAUDITED)
Top Ten Holdings as of September 30, 2017
| Description | % of Net Assets | |||||||
| EDP - Energias de Portugal SA |
2.4 | % | ||||||
| Gazprom PJSC ADR |
2.3 | |||||||
| SSE PLC |
2.1 | |||||||
| Westpac Banking Corp. |
2.0 | |||||||
| Enagas SA |
1.9 | |||||||
| Swiss Re AG |
1.8 | |||||||
| Muenchener Rueckversicherungs-Gesellschaft AG in Muenchen |
1.7 | |||||||
| Swisscom AG |
1.7 | |||||||
| Power Corp. of Canada |
1.7 | |||||||
| BCE, Inc. |
1.6 | |||||||
| TOTAL |
19.2 | % | ||||||
(The ten largest holdings are subject to change, and there are no guarantees the Fund will continue to remain invested in any particular company.)
Sector Breakdown as of September 30, 2017
| % of Net Assets | ||||||||
| Financials |
23.0 | % | ||||||
| Utilities |
19.9 | |||||||
| Real Estate |
13.9 | |||||||
| Industrials |
13.5 | |||||||
| Telecommunication Services |
8.6 | |||||||
| Consumer Staples |
7.7 | |||||||
| Consumer Discretionary |
5.7 | |||||||
| Energy |
4.2 | |||||||
| Health Care |
1.7 | |||||||
| Materials |
0.8 | |||||||
| Information Technology |
0.5 | |||||||
| Short-Term Investments |
0.1 | |||||||
| Other Assets |
0.4 | |||||||
| TOTAL |
100.0 | % | ||||||
(The Fund’s sector breakdown is expressed as a percentage of net assets and may change over time.)
10
Table of Contents
SCHEDULE OF INVESTMENTS
September 30, 2017
| Security Description |
Shares | Value | ||||||
| COMMON STOCKS — 99.8% |
||||||||
| BELGIUM — 3.1% |
||||||||
| Anheuser-Busch InBev SA/NV |
1,165,065 | $ | 139,524,454 | |||||
|
|
|
|||||||
| FINLAND — 1.2% |
||||||||
| Nokia Oyj |
9,185,959 | 55,166,946 | ||||||
|
|
|
|||||||
| FRANCE — 36.1% |
||||||||
| Air Liquide SA |
609,743 | 81,346,546 | ||||||
| Airbus SE |
946,604 | 89,984,794 | ||||||
| AXA SA |
3,267,943 | 98,863,388 | ||||||
| BNP Paribas SA |
1,809,655 | 146,012,209 | ||||||
| Cie de Saint-Gobain |
882,199 | 52,584,789 | ||||||
| Danone SA |
981,914 | 77,043,499 | ||||||
| Engie SA |
2,734,828 | 46,459,819 | ||||||
| Essilor International SA |
343,806 | 42,575,349 | ||||||
| L’Oreal SA |
382,986 | 81,452,570 | ||||||
| LVMH Moet Hennessy Louis Vuitton SE |
426,409 | 117,682,252 | ||||||
| Orange SA |
3,151,384 | 51,636,320 | ||||||
| Safran SA |
564,492 | 57,685,051 | ||||||
| Sanofi |
1,805,647 | 179,330,668 | ||||||
| Schneider Electric SE (a) |
878,106 | 76,435,036 | ||||||
| Societe Generale SA |
1,268,566 | 74,287,538 | ||||||
| TOTAL SA (b) |
3,928,901 | 211,080,407 | ||||||
| Unibail-Rodamco SE REIT |
156,778 | 38,134,292 | ||||||
| Vinci SA |
877,410 | 83,396,795 | ||||||
| Vivendi SA |
1,608,860 | 40,740,697 | ||||||
|
|
|
|||||||
| 1,646,732,019 | ||||||||
|
|
|
|||||||
| GERMANY — 32.8% |
||||||||
| adidas AG |
287,418 | 65,034,922 | ||||||
| Allianz SE |
706,157 | 158,573,750 | ||||||
| BASF SE |
1,442,881 | 153,587,804 | ||||||
| Bayer AG |
1,299,144 | 177,083,187 | ||||||
| Bayerische Motoren Werke AG |
505,943 | 51,337,112 | ||||||
| Daimler AG |
1,565,632 | 124,879,494 | ||||||
| Deutsche Bank AG |
2,930,928 | 50,692,091 | ||||||
| Deutsche Post AG |
1,507,265 | 67,114,802 | ||||||
| Deutsche Telekom AG |
5,129,655 | 95,724,581 | ||||||
| E.ON SE |
3,464,411 | 39,219,701 | ||||||
| Fresenius SE & Co. KGaA |
643,242 | 51,900,050 | ||||||
| Muenchener Rueckversicherungs-Gesellschaft AG in Muenchen |
244,025 | 52,187,155 | ||||||
| SAP SE |
1,567,737 | 171,789,581 | ||||||
See accompanying notes to financial statements.
11
Table of Contents
SPDR EURO STOXX 50 ETF
SCHEDULE OF INVESTMENTS (continued)
September 30, 2017
| Security Description |
Shares | Value | ||||||
| Siemens AG |
1,335,371 | $ | 188,178,033 | |||||
| Volkswagen AG Preference Shares |
288,161 | 47,011,599 | ||||||
|
|
|
|||||||
| 1,494,313,862 | ||||||||
|
|
|
|||||||
| IRELAND — 1.1% |
||||||||
| CRH PLC |
1,316,457 | 50,230,056 | ||||||
|
|
|
|||||||
| ITALY — 4.8% |
||||||||
| Enel SpA |
12,199,370 | 73,480,537 | ||||||
| Eni SpA |
3,989,454 | 66,028,621 | ||||||
| Intesa Sanpaolo SpA |
22,617,948 | 80,002,862 | ||||||
|
|
|
|||||||
| 219,512,020 | ||||||||
|
|
|
|||||||
| LUXEMBOURG — 0.0% (c) |
||||||||
| APERAM SA |
1 | 52 | ||||||
|
|
|
|||||||
| NETHERLANDS — 6.9% |
||||||||
| ASML Holding NV |
610,311 | 103,933,413 | ||||||
| ING Groep NV |
6,103,300 | 112,558,953 | ||||||
| Koninklijke Ahold Delhaize NV |
1,914,780 | 35,810,971 | ||||||
| Koninklijke Philips NV |
1,481,011 | 61,157,201 | ||||||
|
|
|
|||||||
| 313,460,538 | ||||||||
|
|
|
|||||||
| SPAIN — 10.6% |
||||||||
| Banco Bilbao Vizcaya Argentaria SA |
10,473,433 | 93,617,928 | ||||||
| Banco Santander SA |
25,199,689 | 175,975,773 | ||||||
| Iberdrola SA |
9,089,796 | 70,622,392 | ||||||
| Industria de Diseno Textil SA |
1,745,463 | 65,794,228 | ||||||
| Telefonica SA |
7,004,037 | 76,111,307 | ||||||
|
|
|
|||||||
| 482,121,628 | ||||||||
|
|
|
|||||||
| UNITED KINGDOM — 3.2% |
||||||||
| Unilever NV |
2,471,257 | 146,192,786 | ||||||
|
|
|
|||||||
| TOTAL COMMON STOCKS |
4,547,254,361 | |||||||
|
|
|
|||||||
| SHORT-TERM INVESTMENTS — 0.1% |
||||||||
| State Street Institutional U.S. Government Money Market Fund, Class G Shares 0.96% (d) (e) |
164,128 | 164,128 | ||||||
| State Street Navigator Securities Lending Government Money Market Portfolio (d) (f) |
2,656,640 | 2,656,640 | ||||||
|
|
|
|||||||
| TOTAL SHORT-TERM INVESTMENTS |
2,820,768 | |||||||
|
|
|
|||||||
| TOTAL INVESTMENTS — 99.9% |
4,550,075,129 | |||||||
|
|
|
|||||||
| OTHER ASSETS IN EXCESS OF LIABILITIES — 0.1% |
5,591,929 | |||||||
|
|
|
|||||||
See accompanying notes to financial statements.
12
Table of Contents
SPDR EURO STOXX 50 ETF
SCHEDULE OF INVESTMENTS (continued)
September 30, 2017
| Security Description |
Value | |||||||
| NET ASSETS — 100.0% |
$ | 4,555,667,058 | ||||||
|
|
|
|||||||
| (a) | Non-income producing security. |
| (b) | All or a portion of the shares of the security are on loan at September 30, 2017. |
| (c) | Amount is less than 0.05% of net assets. |
| (d) | The Fund invested in certain money market funds managed by SSGA Funds Management, Inc. Amounts related to these transactions during the period ended September 30, 2017 are shown in the Affiliate Table below. |
| (e) | The rate shown is the annualized seven-day yield at September 30, 2017. |
| (f) | Investment of cash collateral for securities loaned. |
REIT = Real Estate Investment Trust
The following table summarizes the value of the Fund’s investments according to the fair value hierarchy as of September 30, 2017.
| Description |
Level 1 — Quoted Prices |
Level 2 — Other Significant Observable Inputs |
Level 3 — Significant Unobservable Inputs |
Total | ||||||||||||
| ASSETS: |
||||||||||||||||
| INVESTMENTS: |
||||||||||||||||
| Common Stocks |
||||||||||||||||
| Belgium |
$ | 139,524,454 | $ | — | $ | — | $ | 139,524,454 | ||||||||
| Finland |
55,166,946 | — | — | 55,166,946 | ||||||||||||
| France |
1,646,732,019 | — | — | 1,646,732,019 | ||||||||||||
| Germany |
1,494,313,862 | — | — | 1,494,313,862 | ||||||||||||
| Ireland |
50,230,056 | — | — | 50,230,056 | ||||||||||||
| Italy |
219,512,020 | — | — | 219,512,020 | ||||||||||||
| Luxembourg |
52 | — | — | 52 | ||||||||||||
| Netherlands |
313,460,538 | — | — | 313,460,538 | ||||||||||||
| Spain |
482,121,628 | — | — | 482,121,628 | ||||||||||||
| United Kingdom |
146,192,786 | — | — | 146,192,786 | ||||||||||||
| Short-Term Investments |
2,820,768 | — | — | 2,820,768 | ||||||||||||
|
|
|
|
|
|
|
|
|
|||||||||
| TOTAL INVESTMENTS |
$ | 4,550,075,129 | $ | — | $ | — | $ | 4,550,075,129 | ||||||||
|
|
|
|
|
|
|
|
|
|||||||||
See accompanying notes to financial statements.
13
Table of Contents
SPDR EURO STOXX 50 ETF
SCHEDULE OF INVESTMENTS (continued)
September 30, 2017
Affiliate Table
| Number of Shares Held at 9/30/16 |
Value at 9/30/16 |
Cost of Purchases |
Proceeds from Shares Sold |
Realized Gain (Loss) |
Change in Unrealized Appreciation/ Depreciation |
Number of Shares Held at 9/30/17 |
Value at 9/30/17 |
Dividend Income |
||||||||||||||||||||||||||||
| State Street Institutional Liquid Reserves Fund, Premier Class |
225,328 | $ | 225,328 | $ | — | $ | 225,328 | $ | — | $ | — | — | $ | — | $ | — | ||||||||||||||||||||
| State Street Institutional U.S. Government Money Market Fund, Class G Shares |
— | — | 87,182,540 | 87,018,412 | — | — | 164,128 | 164,128 | 19,057 | |||||||||||||||||||||||||||
| State Street Institutional U.S. Government Money Market Fund, Premier Class |
— | — | 21,025,666 | 21,025,666 | — | — | — | — | 2,287 | |||||||||||||||||||||||||||
| State Street Navigator Securities Lending Government Money Market Portfolio* |
23,347,306 | 23,347,306 | 1,332,349,646 | 1,353,040,312 | — | — | 2,656,640 | 2,656,640 | 1,560,906 | |||||||||||||||||||||||||||
|
|
|
|
|
|
|
|
|
|
|
|
|
|
|
|||||||||||||||||||||||
| Total |
$ | 23,572,634 | $ | 1,440,557,852 | $ | 1,461,309,718 | $ | — | $ | — | $ | 2,820,768 | $ | 1,582,250 | ||||||||||||||||||||||
|
|
|
|
|
|
|
|
|
|
|
|
|
|
|
|||||||||||||||||||||||
| * | Effective October 5, 2016, the name of State Street Navigator Securities Lending Prime Portfolio was changed to State Street Navigator Securities Lending Government Money Market Portfolio. |
See accompanying notes to financial statements.
14
Table of Contents
SCHEDULE OF INVESTMENTS
September 30, 2017
| Security Description |
Shares | Value | ||||||
| COMMON STOCKS — 99.3% |
||||||||
| AUSTRALIA — 4.8% |
||||||||
| Alumina, Ltd. (a) |
513,981 | $ | 887,249 | |||||
| Amcor, Ltd. |
151,142 | 1,803,808 | ||||||
| AMP, Ltd. |
251,473 | 953,047 | ||||||
| Australia & New Zealand Banking Group, Ltd. |
233,266 | 5,417,750 | ||||||
| BHP Billiton PLC |
136,782 | 2,412,285 | ||||||
| BHP Billiton, Ltd. |
229,175 | 4,635,814 | ||||||
| Boral, Ltd. |
296,584 | 1,575,478 | ||||||
| Brambles, Ltd. |
171,931 | 1,214,151 | ||||||
| Coca-Cola Amatil, Ltd. |
141,857 | 860,411 | ||||||
| Commonwealth Bank of Australia |
135,019 | 7,972,182 | ||||||
| CSL, Ltd. |
38,695 | 4,067,296 | ||||||
| Fortescue Metals Group, Ltd. |
193,643 | 780,981 | ||||||
| Insurance Australia Group, Ltd. |
268,066 | 1,339,853 | ||||||
| LendLease Group |
133,716 | 1,880,170 | ||||||
| Macquarie Group, Ltd. |
37,871 | 2,701,731 | ||||||
| Medibank Pvt, Ltd. |
207,602 | 475,653 | ||||||
| National Australia Bank, Ltd. |
190,236 | 4,701,962 | ||||||
| Newcrest Mining, Ltd. |
55,948 | 922,769 | ||||||
| Origin Energy, Ltd. (b) |
211,345 | 1,240,422 | ||||||
| Qantas Airways, Ltd. |
65,029 | 297,476 | ||||||
| QBE Insurance Group, Ltd. |
83,261 | 653,961 | ||||||
| Santos, Ltd. (b) |
171,881 | 542,163 | ||||||
| Scentre Group REIT |
200,455 | 618,138 | ||||||
| Sonic Healthcare, Ltd. |
85,470 | 1,402,308 | ||||||
| South32, Ltd. (c) |
153,574 | 397,147 | ||||||
| South32, Ltd. (c) |
274,580 | 704,519 | ||||||
| Suncorp Group, Ltd. |
177,888 | 1,821,516 | ||||||
| Sydney Airport |
70,663 | 394,219 | ||||||
| Telstra Corp., Ltd. |
303,080 | 829,963 | ||||||
| Transurban Group |
137,459 | 1,281,343 | ||||||
| Vicinity Centres REIT |
439,150 | 916,580 | ||||||
| Wesfarmers, Ltd. |
89,212 | 2,893,107 | ||||||
| Westfield Corp. REIT |
132,393 | 814,436 | ||||||
| Westpac Banking Corp. |
255,891 | 6,409,051 | ||||||
| Woodside Petroleum, Ltd. |
59,785 | 1,365,089 | ||||||
| Woolworths, Ltd. |
108,362 | 2,143,511 | ||||||
|
|
|
|||||||
| 69,327,539 | ||||||||
|
|
|
|||||||
| AUSTRIA — 0.3% |
||||||||
| Erste Group Bank AG (b) |
46,176 | 1,994,964 | ||||||
See accompanying notes to financial statements.
15
Table of Contents
SPDR MSCI ACWI ex-US ETF
SCHEDULE OF INVESTMENTS (continued)
September 30, 2017
| Security Description |
Shares | Value | ||||||
| OMV AG |
22,230 | $ | 1,295,355 | |||||
| Raiffeisen Bank International AG (b) |
26,756 | 896,895 | ||||||
|
|
|
|||||||
| 4,187,214 | ||||||||
|
|
|
|||||||
| BELGIUM — 1.0% |
||||||||
| Ageas |
35,164 | 1,652,857 | ||||||
| Anheuser-Busch InBev SA/NV |
60,599 | 7,257,142 | ||||||
| KBC Group NV |
28,788 | 2,440,177 | ||||||
| Solvay SA |
11,163 | 1,668,087 | ||||||
| UCB SA |
14,904 | 1,061,223 | ||||||
|
|
|
|||||||
| 14,079,486 | ||||||||
|
|
|
|||||||
| BRAZIL — 1.8% |
||||||||
| Ambev SA ADR |
443,493 | 2,922,619 | ||||||
| B3 SA - Brasil Bolsa Balcao |
137,330 | 1,039,803 | ||||||
| Banco Bradesco SA Preference Shares ADR |
314,882 | 3,485,744 | ||||||
| Banco do Brasil SA |
56,932 | 628,148 | ||||||
| BB Seguridade Participacoes SA |
49,413 | 447,242 | ||||||
| Braskem SA Class A, Preference Shares |
30,533 | 409,565 | ||||||
| BRF SA (b) |
38,116 | 550,324 | ||||||
| Cia Energetica de Minas Gerais ADR (a) |
178,782 | 443,379 | ||||||
| Cia Siderurgica Nacional SA ADR (a) (b) |
140,496 | 415,868 | ||||||
| Cielo SA |
73,456 | 510,429 | ||||||
| EDP - Energias do Brasil SA |
139,795 | 669,110 | ||||||
| Embraer SA |
53,024 | 299,891 | ||||||
| Fibria Celulose SA |
9,602 | 130,075 | ||||||
| Gerdau SA ADR (a) |
102,518 | 351,637 | ||||||
| Itau Unibanco Holding SA Preference Shares ADR |
284,108 | 3,892,280 | ||||||
| JBS SA |
33,027 | 88,750 | ||||||
| Kroton Educacional SA |
100,301 | 635,770 | ||||||
| Lojas Renner SA |
94,675 | 1,079,298 | ||||||
| Natura Cosmeticos SA |
25,383 | 250,367 | ||||||
| Odontoprev SA |
166,484 | 812,117 | ||||||
| Petroleo Brasileiro SA Preference Shares ADR (b) |
257,400 | 2,486,484 | ||||||
| Porto Seguro SA |
9,636 | 114,755 | ||||||
| Qualicorp SA |
75,349 | 902,811 | ||||||
| Raia Drogasil SA |
27,466 | 651,234 | ||||||
| Sul America SA |
52,046 | 294,359 | ||||||
| Tim Participacoes SA ADR |
22,807 | 416,912 | ||||||
| Vale SA ADR (a) |
252,551 | 2,543,189 | ||||||
|
|
|
|||||||
| 26,472,160 | ||||||||
|
|
|
|||||||
| CANADA — 6.5% |
||||||||
| Agnico Eagle Mines, Ltd. |
12,535 | 565,185 | ||||||
| Agrium, Inc. |
16,449 | 1,758,734 | ||||||
See accompanying notes to financial statements.
16
Table of Contents
SPDR MSCI ACWI ex-US ETF
SCHEDULE OF INVESTMENTS (continued)
September 30, 2017
| Security Description |
Shares | Value | ||||||
| Alimentation Couche-Tard, Inc. Class B |
22,423 | $ | 1,020,164 | |||||
| Bank of Montreal |
53,390 | 4,031,198 | ||||||
| Bank of Nova Scotia |
83,687 | 5,366,567 | ||||||
| Barrick Gold Corp. |
90,162 | 1,447,610 | ||||||
| BlackBerry, Ltd. (b) |
44,769 | 499,362 | ||||||
| Bombardier, Inc. Class B (b) |
159,543 | 288,304 | ||||||
| Brookfield Asset Management, Inc. Class A (a) |
83,297 | 3,431,385 | ||||||
| CAE, Inc. |
50,430 | 880,252 | ||||||
| Cameco Corp. (a) |
37,167 | 358,104 | ||||||
| Canadian Imperial Bank of Commerce (a) |
33,044 | 2,884,431 | ||||||
| Canadian National Railway Co. |
62,146 | 5,137,052 | ||||||
| Canadian Natural Resources, Ltd. |
95,259 | 3,183,044 | ||||||
| Canadian Pacific Railway, Ltd. |
12,212 | 2,046,449 | ||||||
| Canadian Tire Corp., Ltd. Class A |
10,863 | 1,349,265 | ||||||
| Cenovus Energy, Inc. (a) |
72,193 | 722,132 | ||||||
| CGI Group, Inc. Class A (b) |
11,586 | 599,380 | ||||||
| Constellation Software, Inc. |
1,361 | 740,804 | ||||||
| Crescent Point Energy Corp. (a) |
40,670 | 325,841 | ||||||
| Dollarama, Inc. |
3,820 | 417,019 | ||||||
| Enbridge, Inc. |
81,896 | 3,412,961 | ||||||
| Encana Corp. |
72,576 | 852,470 | ||||||
| Fairfax Financial Holdings, Ltd. |
1,213 | 629,782 | ||||||
| First Quantum Minerals, Ltd. (a) |
55,324 | 619,749 | ||||||
| Franco-Nevada Corp. |
12,535 | 968,803 | ||||||
| Gildan Activewear, Inc. |
47,983 | 1,495,908 | ||||||
| Goldcorp, Inc. (a) |
66,535 | 861,845 | ||||||
| H&R Real Estate Investment Trust |
3,671 | 63,226 | ||||||
| Husky Energy, Inc. (b) |
38,344 | 478,898 | ||||||
| IGM Financial, Inc. |
19,131 | 641,550 | ||||||
| Imperial Oil, Ltd. (a) |
42,178 | 1,344,273 | ||||||
| Kinross Gold Corp. (b) |
113,728 | 481,047 | ||||||
| Loblaw Cos., Ltd. |
37,588 | 2,046,730 | ||||||
| Magna International, Inc. |
16,273 | 866,445 | ||||||
| Manulife Financial Corp. |
132,149 | 2,674,362 | ||||||
| National Bank of Canada (a) |
40,404 | 1,939,999 | ||||||
| Onex Corp. |
5,990 | 461,182 | ||||||
| Open Text Corp. |
19,138 | 616,076 | ||||||
| Potash Corp. of Saskatchewan, Inc. (a) |
75,384 | 1,447,826 | ||||||
| PrairieSky Royalty, Ltd. (a) |
4,391 | 112,105 | ||||||
| Restaurant Brands International, Inc. |
11,747 | 748,787 | ||||||
| Rogers Communications, Inc. Class B (a) |
44,768 | 2,303,101 | ||||||
| Royal Bank of Canada |
105,703 | 8,159,411 | ||||||
| Seven Generations Energy, Ltd. Class A (b) |
10,692 | 168,760 | ||||||
| Shaw Communications, Inc. Class B (a) |
47,972 | 1,101,632 | ||||||
See accompanying notes to financial statements.
17
Table of Contents
SPDR MSCI ACWI ex-US ETF
SCHEDULE OF INVESTMENTS (continued)
September 30, 2017
| Security Description |
Shares | Value | ||||||
| Shopify, Inc. Class A (b) |
4,725 | $ | 548,268 | |||||
| Smart Real Estate Investment Trust REIT |
6,328 | 148,960 | ||||||
| SNC-Lavalin Group, Inc. (a) |
25,074 | 1,130,550 | ||||||
| Sun Life Financial, Inc. |
53,353 | 2,119,786 | ||||||
| Suncor Energy, Inc. |
112,571 | 3,936,137 | ||||||
| Teck Resources, Ltd. Class B |
40,254 | 845,538 | ||||||
| TELUS Corp. |
31,405 | 1,126,979 | ||||||
| Thomson Reuters Corp. |
39,403 | 1,803,719 | ||||||
| Toronto-Dominion Bank |
133,492 | 7,498,351 | ||||||
| TransCanada Corp. (a) |
56,402 | 2,781,203 | ||||||
| Trisura Group, Ltd. (b) |
6 | 128 | ||||||
| Turquoise Hill Resources, Ltd. (b) |
16,955 | 52,330 | ||||||
| Veresen, Inc. |
7,308 | 109,388 | ||||||
| West Fraser Timber Co., Ltd. |
6,595 | 379,675 | ||||||
| Wheaton Precious Metals Corp. |
30,002 | 570,941 | ||||||
| Yamana Gold, Inc. |
99,520 | 262,596 | ||||||
|
|
|
|||||||
| 94,863,759 | ||||||||
|
|
|
|||||||
| CHILE — 0.3% |
||||||||
| Embotelladora Andina SA Class B, Preference Shares |
22,494 | 105,285 | ||||||
| Enel Americas SA ADR |
189,509 | 1,936,782 | ||||||
| Enel Chile SA ADR |
144,376 | 866,256 | ||||||
| Enel Generacion Chile SA ADR |
46,838 | 1,234,650 | ||||||
| Sociedad Quimica y Minera de Chile SA ADR |
10,988 | 611,592 | ||||||
|
|
|
|||||||
| 4,754,565 | ||||||||
|
|
|
|||||||
| CHINA — 7.0% |
||||||||
| 58.com, Inc. ADR (b) |
3,084 | 194,724 | ||||||
| AAC Technologies Holdings, Inc. |
82,500 | 1,385,791 | ||||||
| Agricultural Bank of China, Ltd. Class H |
2,165,000 | 970,144 | ||||||
| Air China, Ltd. Class H |
64,000 | 53,178 | ||||||
| Alibaba Group Holding, Ltd. ADR (a) (b) |
72,205 | 12,470,526 | ||||||
| Alibaba Health Information Technology, Ltd. (a) (b) |
84,000 | 41,942 | ||||||
| Anhui Conch Cement Co., Ltd. Class H |
8,500 | 33,899 | ||||||
| ANTA Sports Products, Ltd. |
29,000 | 121,967 | ||||||
| Autohome, Inc. ADR (b) |
1,263 | 75,881 | ||||||
| AviChina Industry & Technology Co., Ltd. Class H |
591,000 | 357,141 | ||||||
| Baidu, Inc. ADR (b) |
19,324 | 4,786,362 | ||||||
| Bank of China, Ltd. Class H |
5,951,436 | 2,933,544 | ||||||
| Bank of Communications Co., Ltd. Class H |
1,190,710 | 868,942 | ||||||
| Beijing Enterprises Water Group, Ltd. (b) |
410,000 | 330,175 | ||||||
| BOC Hong Kong Holdings, Ltd. |
166,500 | 808,977 | ||||||
| Brilliance China Automotive Holdings, Ltd. |
312,000 | 830,860 | ||||||
| Byd Co., Ltd. Class H (a) |
24,500 | 227,256 | ||||||
| CGN Power Co., Ltd. Class H (d) |
185,400 | 51,271 | ||||||
See accompanying notes to financial statements.
18
Table of Contents
SPDR MSCI ACWI ex-US ETF
SCHEDULE OF INVESTMENTS (continued)
September 30, 2017
| Security Description |
Shares | Value | ||||||
| China CITIC Bank Corp., Ltd. Class H |
574,000 | $ | 364,505 | |||||
| China Coal Energy Co., Ltd. Class H (a) |
40,000 | 18,897 | ||||||
| China Communications Construction Co., Ltd. Class H |
366,000 | 456,873 | ||||||
| China Conch Venture Holdings, Ltd. |
16,000 | 31,137 | ||||||
| China Construction Bank Corp. Class H |
4,849,720 | 4,023,479 | ||||||
| China Everbright Bank Co., Ltd. Class H |
36,000 | 16,639 | ||||||
| China Everbright International, Ltd. |
26,000 | 32,622 | ||||||
| China Everbright, Ltd. |
44,000 | 101,174 | ||||||
| China Evergrande Group (b) |
235,000 | 819,869 | ||||||
| China Galaxy Securities Co., Ltd. Class H |
194,500 | 170,577 | ||||||
| China Huishan Dairy Holdings Co., Ltd. (a) (e) |
1,418,000 | — | ||||||
| China Life Insurance Co., Ltd. Class H |
602,000 | 1,791,965 | ||||||
| China Mengniu Dairy Co., Ltd. (b) |
428,000 | 1,197,306 | ||||||
| China Merchants Bank Co., Ltd. Class H |
463,014 | 1,627,221 | ||||||
| China Merchants Port Holdings Co., Ltd. |
414,312 | 1,278,364 | ||||||
| China Minsheng Banking Corp., Ltd. Class H (a) |
308,000 | 282,341 | ||||||
| China Mobile, Ltd. |
488,500 | 4,950,232 | ||||||
| China Oilfield Services, Ltd. Class H |
100,000 | 91,541 | ||||||
| China Overseas Land & Investment, Ltd. |
388,000 | 1,261,756 | ||||||
| China Pacific Insurance Group Co., Ltd. Class H |
194,200 | 836,651 | ||||||
| China Petroleum & Chemical Corp. Class H |
2,425,800 | 1,816,858 | ||||||
| China Railway Construction Corp., Ltd. Class H |
122,500 | 155,268 | ||||||
| China Railway Group, Ltd. Class H |
247,000 | 204,286 | ||||||
| China Resources Beer Holdings Co., Ltd. |
389,670 | 1,055,158 | ||||||
| China Resources Land, Ltd. |
52,000 | 159,115 | ||||||
| China Shenhua Energy Co., Ltd. Class H |
191,500 | 450,144 | ||||||
| China Southern Airlines Co., Ltd. Class H |
110,000 | 75,768 | ||||||
| China Taiping Insurance Holdings Co., Ltd. |
144,600 | 386,923 | ||||||
| China Telecom Corp., Ltd. Class H |
1,880,000 | 962,782 | ||||||
| China Unicom Hong Kong, Ltd. (b) |
768,000 | 1,067,827 | ||||||
| China Vanke Co., Ltd. Class H |
73,300 | 241,183 | ||||||
| CITIC Securities Co., Ltd. Class H |
112,000 | 246,349 | ||||||
| CITIC, Ltd. |
388,000 | 573,255 | ||||||
| CNOOC, Ltd. |
1,558,217 | 2,010,937 | ||||||
| COSCO SHIPPING Ports, Ltd. |
496,147 | 552,001 | ||||||
| Country Garden Holdings Co., Ltd. |
225,000 | 357,778 | ||||||
| CRRC Corp., Ltd. Class H |
333,000 | 295,879 | ||||||
| CSPC Pharmaceutical Group, Ltd. |
426,000 | 713,391 | ||||||
| Ctrip.com International, Ltd. ADR (b) |
13,758 | 725,597 | ||||||
| ENN Energy Holdings, Ltd. |
38,000 | 275,366 | ||||||
| Fosun International, Ltd. (a) |
89,000 | 187,556 | ||||||
| Geely Automobile Holdings, Ltd. |
960,000 | 2,703,983 | ||||||
| GF Securities Co., Ltd. Class H |
147,600 | 320,874 | ||||||
| GOME Retail Holdings, Ltd. (a) |
1,562,000 | 175,984 | ||||||
See accompanying notes to financial statements.
19
Table of Contents
SPDR MSCI ACWI ex-US ETF
SCHEDULE OF INVESTMENTS (continued)
September 30, 2017
| Security Description |
Shares | Value | ||||||
| Great Wall Motor Co., Ltd. Class H (a) |
268,500 | $ | 330,009 | |||||
| Guangzhou Automobile Group Co., Ltd. Class H |
104,000 | 240,736 | ||||||
| Haitong Securities Co., Ltd. Class H |
152,000 | 245,591 | ||||||
| Hengan International Group Co., Ltd. |
96,500 | 893,255 | ||||||
| Huaneng Power International, Inc. Class H |
832,000 | 514,494 | ||||||
| Huaneng Renewables Corp., Ltd. Class H |
884,000 | 291,999 | ||||||
| Huatai Securities Co., Ltd. Class H (d) |
155,000 | 343,311 | ||||||
| Industrial & Commercial Bank of China, Ltd. Class H |
5,237,045 | 3,888,878 | ||||||
| JD.com, Inc. ADR (b) |
49,163 | 1,878,027 | ||||||
| Jiangsu Expressway Co., Ltd. Class H |
14,000 | 21,437 | ||||||
| Kingsoft Corp., Ltd. |
149,000 | 347,190 | ||||||
| Lenovo Group, Ltd. |
436,000 | 240,588 | ||||||
| Momo, Inc. ADR (b) |
5,983 | 187,507 | ||||||
| NetEase, Inc. ADR |
4,971 | 1,311,400 | ||||||
| New China Life Insurance Co., Ltd. Class H |
72,500 | 409,806 | ||||||
| New Oriental Education & Technology Group, Inc. ADR |
6,068 | 535,562 | ||||||
| PetroChina Co., Ltd. Class H |
1,502,000 | 951,887 | ||||||
| PICC Property & Casualty Co., Ltd. Class H |
425,610 | 750,881 | ||||||
| Ping An Insurance Group Co. of China, Ltd. Class H |
386,000 | 2,962,692 | ||||||
| Semiconductor Manufacturing International Corp. (a) (b) |
105,900 | 119,584 | ||||||
| Shandong Weigao Group Medical Polymer Co., Ltd. Class H |
124,000 | 87,792 | ||||||
| Shanghai Electric Group Co., Ltd. Class H (b) |
320,000 | 140,935 | ||||||
| Shanghai Lujiazui Finance & Trade Zone Development Co., Ltd. Class B |
80,540 | 128,139 | ||||||
| Shanghai Pharmaceuticals Holding Co., Ltd. Class H |
33,100 | 80,857 | ||||||
| Sihuan Pharmaceutical Holdings Group, Ltd. (a) |
122,000 | 44,360 | ||||||
| SINA Corp. (b) |
3,233 | 370,663 | ||||||
| Sinopec Shanghai Petrochemical Co., Ltd. Class H |
312,000 | 185,745 | ||||||
| Sinopharm Group Co., Ltd. Class H |
66,400 | 292,440 | ||||||
| Sunac China Holdings, Ltd. (a) |
157,300 | 719,971 | ||||||
| Sunny Optical Technology Group Co., Ltd. |
37,000 | 588,347 | ||||||
| TAL Education Group ADR |
10,380 | 349,910 | ||||||
| Tencent Holdings, Ltd. |
407,300 | 17,531,625 | ||||||
| Tingyi Cayman Islands Holding Corp. |
384,000 | 578,161 | ||||||
| TravelSky Technology, Ltd. Class H |
56,000 | 145,902 | ||||||
| Tsingtao Brewery Co., Ltd. Class H |
8,000 | 30,625 | ||||||
| Vipshop Holdings, Ltd. ADR (b) |
18,504 | 162,650 | ||||||
| Want Want China Holdings, Ltd. (a) |
192,000 | 134,953 | ||||||
| Weibo Corp. ADR (a) (b) |
2,915 | 288,410 | ||||||
| Yanzhou Coal Mining Co., Ltd. Class H |
382,000 | 376,097 | ||||||
| YY, Inc. ADR (b) |
2,845 | 246,889 | ||||||
| Zhuzhou CRRC Times Electric Co., Ltd. Class H |
79,900 | 447,543 | ||||||
See accompanying notes to financial statements.
20
Table of Contents
SPDR MSCI ACWI ex-US ETF
SCHEDULE OF INVESTMENTS (continued)
September 30, 2017
| Security Description |
Shares | Value | ||||||
| Zijin Mining Group Co., Ltd. Class H |
1,502,000 | $ | 515,365 | |||||
| ZTE Corp. Class H (b) |
37,800 | 123,650 | ||||||
|
|
|
|||||||
| 101,645,854 | ||||||||
|
|
|
|||||||
| COLOMBIA — 0.1% |
||||||||
| Bancolombia SA ADR |
24,728 | 1,132,295 | ||||||
| Cementos Argos SA |
106,442 | 424,067 | ||||||
|
|
|
|||||||
| 1,556,362 | ||||||||
|
|
|
|||||||
| DENMARK — 1.3% |
||||||||
| AP Moeller - Maersk A/S Class B |
965 | 1,833,482 | ||||||
| Danske Bank A/S |
65,027 | 2,601,163 | ||||||
| DSV A/S |
44,937 | 3,400,186 | ||||||
| Genmab A/S (b) |
2,721 | 600,843 | ||||||
| Novo Nordisk A/S Class B |
147,758 | 7,065,381 | ||||||
| Novozymes A/S Class B |
14,118 | 724,650 | ||||||
| Pandora A/S (a) |
7,869 | 776,924 | ||||||
| Vestas Wind Systems A/S |
19,513 | 1,751,421 | ||||||
|
|
|
|||||||
| 18,754,050 | ||||||||
|
|
|
|||||||
| EGYPT — 0.1% |
||||||||
| Commercial International Bank Egypt SAE |
139,696 | 646,005 | ||||||
| Global Telecom Holding SAE (b) |
710,220 | 258,335 | ||||||
|
|
|
|||||||
| 904,340 | ||||||||
|
|
|
|||||||
| FINLAND — 0.7% |
||||||||
| Elisa Oyj |
10,187 | 438,609 | ||||||
| Fortum Oyj |
11,262 | 224,872 | ||||||
| Kone Oyj Class B |
30,269 | 1,603,123 | ||||||
| Metso Oyj |
25,285 | 927,845 | ||||||
| Neste Oyj |
9,139 | 399,212 | ||||||
| Nokia Oyj (c) |
203,167 | 1,220,134 | ||||||
| Nokia Oyj (c) |
107,640 | 644,149 | ||||||
| Sampo Oyj Class A |
31,971 | 1,690,242 | ||||||
| Stora Enso Oyj Class R |
67,385 | 951,967 | ||||||
| UPM-Kymmene Oyj |
58,381 | 1,582,582 | ||||||
| Wartsila Oyj Abp |
10,586 | 749,634 | ||||||
|
|
|
|||||||
| 10,432,369 | ||||||||
|
|
|
|||||||
| FRANCE — 7.1% |
||||||||
| Accor SA |
24,023 | 1,193,793 | ||||||
| Air Liquide SA |
32,241 | 4,301,311 | ||||||
| Airbus SE |
45,796 | 4,353,398 | ||||||
| Alstom SA |
20,470 | 869,613 | ||||||
| AXA SA |
130,058 | 3,934,577 | ||||||
| BNP Paribas SA |
75,267 | 6,072,926 | ||||||
See accompanying notes to financial statements.
21
Table of Contents
SPDR MSCI ACWI ex-US ETF
SCHEDULE OF INVESTMENTS (continued)
September 30, 2017
| Security Description |
Shares | Value | ||||||
| Bouygues SA |
23,177 | $ | 1,100,103 | |||||
| Capgemini SE |
15,062 | 1,765,671 | ||||||
| Carrefour SA |
65,194 | 1,317,551 | ||||||
| Cie de Saint-Gobain |
34,664 | 2,066,200 | ||||||
| Cie Generale des Etablissements Michelin |
13,473 | 1,967,080 | ||||||
| Credit Agricole SA |
77,165 | 1,403,032 | ||||||
| Danone SA |
53,283 | 4,180,721 | ||||||
| Electricite de France SA |
6,195 | 75,251 | ||||||
| Engie SA |
90,017 | 1,529,227 | ||||||
| Essilor International SA |
20,361 | 2,521,412 | ||||||
| Hermes International |
979 | 493,678 | ||||||
| ICADE REIT |
655 | 58,439 | ||||||
| Kering |
7,042 | 2,805,957 | ||||||
| Klepierre SA REIT |
3,382 | 132,780 | ||||||
| Lagardere SCA |
17,382 | 582,050 | ||||||
| Legrand SA |
19,286 | 1,392,618 | ||||||
| L’Oreal SA |
22,239 | 4,729,739 | ||||||
| LVMH Moet Hennessy Louis Vuitton SE |
20,461 | 5,646,918 | ||||||
| Orange SA |
171,547 | 2,810,846 | ||||||
| Pernod Ricard SA |
17,805 | 2,463,793 | ||||||
| Peugeot SA |
33,542 | 799,015 | ||||||
| Publicis Groupe SA |
24,998 | 1,746,264 | ||||||
| Renault SA |
16,163 | 1,588,057 | ||||||
| Safran SA |
21,746 | 2,222,209 | ||||||
| Sanofi |
89,202 | 8,859,237 | ||||||
| Schneider Electric SE (b) |
46,742 | 4,068,673 | ||||||
| Societe Generale SA |
54,802 | 3,209,219 | ||||||
| Sodexo SA |
13,542 | 1,688,986 | ||||||
| TOTAL SA |
170,054 | 9,136,160 | ||||||
| Unibail-Rodamco SE REIT |
6,767 | 1,645,988 | ||||||
| Valeo SA |
16,613 | 1,232,992 | ||||||
| Veolia Environnement SA |
41,172 | 951,567 | ||||||
| Vinci SA |
43,444 | 4,129,301 | ||||||
| Vivendi SA |
110,964 | 2,809,909 | ||||||
| Zodiac Aerospace |
14,950 | 432,392 | ||||||
|
|
|
|||||||
| 104,288,653 | ||||||||
|
|
|
|||||||
| GERMANY — 6.7% |
||||||||
| adidas AG |
15,905 | 3,598,871 | ||||||
| Allianz SE |
38,986 | 8,754,648 | ||||||
| BASF SE |
69,661 | 7,415,081 | ||||||
| Bayer AG |
63,715 | 8,684,838 | ||||||
| Bayerische Motoren Werke AG |
25,269 | 2,563,999 | ||||||
| CECONOMY AG |
17,297 | 203,728 | ||||||
See accompanying notes to financial statements.
22
Table of Contents
SPDR MSCI ACWI ex-US ETF
SCHEDULE OF INVESTMENTS (continued)
September 30, 2017
| Security Description |
Shares | Value | ||||||
| Commerzbank AG (b) |
57,381 | $ | 780,790 | |||||
| Continental AG |
8,096 | 2,055,391 | ||||||
| Covestro AG (d) |
1,239 | 106,560 | ||||||
| Daimler AG |
70,566 | 5,628,555 | ||||||
| Deutsche Bank AG |
131,508 | 2,274,507 | ||||||
| Deutsche Boerse AG |
23,194 | 2,514,682 | ||||||
| Deutsche Lufthansa AG |
35,754 | 993,729 | ||||||
| Deutsche Post AG |
95,423 | 4,248,951 | ||||||
| Deutsche Telekom AG |
259,439 | 4,841,396 | ||||||
| E.ON SE |
165,766 | 1,876,594 | ||||||
| Fresenius Medical Care AG & Co. KGaA |
26,858 | 2,628,073 | ||||||
| Fresenius SE & Co. KGaA |
29,078 | 2,346,162 | ||||||
| Henkel AG & Co. KGaA Preference Shares |
6,760 | 920,241 | ||||||
| Infineon Technologies AG |
37,196 | 935,308 | ||||||
| KS AG (a) |
5,645 | 153,825 | ||||||
| Linde AG |
12,200 | 2,544,909 | ||||||
| MAN SE |
4,319 | 487,564 | ||||||
| Merck KGaA |
19,719 | 2,194,106 | ||||||
| METRO AG (b) |
17,575 | 371,599 | ||||||
| Muenchener Rueckversicherungs-Gesellschaft AG in Muenchen |
18,544 | 3,965,817 | ||||||
| OSRAM Licht AG |
7,177 | 572,798 | ||||||
| RWE AG (b) |
42,755 | 971,474 | ||||||
| SAP SE |
82,135 | 9,000,194 | ||||||
| Siemens AG |
65,189 | 9,186,314 | ||||||
| ThyssenKrupp AG |
34,996 | 1,037,409 | ||||||
| TUI AG |
27,931 | 474,416 | ||||||
| United Internet AG |
1,504 | 93,649 | ||||||
| Volkswagen AG |
5,454 | 923,635 | ||||||
| Volkswagen AG Preference Shares |
10,295 | 1,679,563 | ||||||
| Vonovia SE |
22,890 | 974,180 | ||||||
|
|
|
|||||||
| 98,003,556 | ||||||||
|
|
|
|||||||
| GREECE — 0.1% |
||||||||
| Alpha Bank AE (b) |
92,708 | 183,031 | ||||||
| Eurobank Ergasias SA (b) |
116,542 | 103,056 | ||||||
| Hellenic Telecommunications Organization SA |
2,846 | 34,419 | ||||||
| JUMBO SA |
25,790 | 426,540 | ||||||
| National Bank of Greece SA (b) |
434,446 | 147,404 | ||||||
| OPAP SA |
37,108 | 392,628 | ||||||
| Piraeus Bank SA (b) |
29,026 | 99,512 | ||||||
|
|
|
|||||||
| 1,386,590 | ||||||||
|
|
|
|||||||
| HONG KONG — 2.6% |
||||||||
| AIA Group, Ltd. |
927,800 | 6,842,060 | ||||||
| Alibaba Pictures Group, Ltd. (a) (b) |
510,000 | 81,619 | ||||||
See accompanying notes to financial statements.
23
Table of Contents
SPDR MSCI ACWI ex-US ETF
SCHEDULE OF INVESTMENTS (continued)
September 30, 2017
| Security Description |
Shares | Value | ||||||
| ASM Pacific Technology, Ltd. |
7,400 | $ | 106,585 | |||||
| Bank of East Asia, Ltd. |
341,524 | 1,475,724 | ||||||
| CK Asset Holdings, Ltd. |
223,032 | 1,846,060 | ||||||
| CK Hutchison Holdings, Ltd. |
269,032 | 3,439,237 | ||||||
| CLP Holdings, Ltd. |
114,500 | 1,173,483 | ||||||
| Fullshare Holdings, Ltd. (a) (b) |
362,500 | 157,796 | ||||||
| Galaxy Entertainment Group, Ltd. |
173,000 | 1,218,201 | ||||||
| Haier Electronics Group Co., Ltd. (b) |
23,000 | 56,067 | ||||||
| Hanergy Thin Film Power Group, Ltd. (b) (e) |
448,000 | — | ||||||
| Hang Lung Properties, Ltd. |
388,000 | 920,983 | ||||||
| Hang Seng Bank, Ltd. |
57,900 | 1,411,418 | ||||||
| Henderson Land Development Co., Ltd. |
213,263 | 1,412,980 | ||||||
| Hong Kong & China Gas Co., Ltd. |
1,346,252 | 2,530,244 | ||||||
| Hong Kong Exchanges & Clearing, Ltd. |
104,156 | 2,800,358 | ||||||
| I-CABLE Communications, Ltd. (b) |
5,870 | 192 | ||||||
| Jardine Matheson Holdings, Ltd. |
3,200 | 202,752 | ||||||
| Jardine Strategic Holdings, Ltd. |
1,000 | 43,200 | ||||||
| Li & Fung, Ltd. (a) |
776,000 | 389,455 | ||||||
| Link REIT |
308,786 | 2,502,484 | ||||||
| Melco Resorts & Entertainment, Ltd. ADR |
6,351 | 153,186 | ||||||
| New World Development Co., Ltd. |
829,923 | 1,192,177 | ||||||
| Sands China, Ltd. |
232,400 | 1,209,502 | ||||||
| Shangri-La Asia, Ltd. |
386,333 | 716,210 | ||||||
| Sino Biopharmaceutical, Ltd. |
740,000 | 782,567 | ||||||
| SJM Holdings, Ltd. |
38,000 | 34,786 | ||||||
| Sun Art Retail Group, Ltd. |
221,000 | 205,135 | ||||||
| Sun Hung Kai Properties, Ltd. |
181,185 | 2,943,702 | ||||||
| Swire Pacific, Ltd. Class A |
107,506 | 1,043,307 | ||||||
| Techtronic Industries Co., Ltd. |
171,500 | 915,609 | ||||||
| WH Group, Ltd. (d) |
287,601 | 305,618 | ||||||
| Wharf Holdings, Ltd. |
6,000 | 53,465 | ||||||
| Wheelock & Co., Ltd. |
6,000 | 42,211 | ||||||
|
|
|
|||||||
| 38,208,373 | ||||||||
|
|
|
|||||||
| HUNGARY — 0.1% |
||||||||
| MOL Hungarian Oil & Gas PLC |
96,000 | 1,095,968 | ||||||
| OTP Bank PLC |
23,804 | 896,337 | ||||||
|
|
|
|||||||
| 1,992,305 | ||||||||
|
|
|
|||||||
| INDIA — 1.9% |
||||||||
| ACC, Ltd. |
23,334 | 591,888 | ||||||
| Adani Ports & Special Economic Zone, Ltd. |
47,851 | 275,993 | ||||||
| Ambuja Cements, Ltd. |
120,160 | 490,150 | ||||||
| Apollo Hospitals Enterprise, Ltd. |
23,701 | 364,659 | ||||||
| Aurobindo Pharma, Ltd. |
26,987 | 285,756 | ||||||
See accompanying notes to financial statements.
24
Table of Contents
SPDR MSCI ACWI ex-US ETF
SCHEDULE OF INVESTMENTS (continued)
September 30, 2017
| Security Description |
Shares | Value | ||||||
| Axis Bank, Ltd. |
75,227 | $ | 586,372 | |||||
| Bajaj Auto, Ltd. |
5,523 | 262,909 | ||||||
| Bajaj Finance, Ltd. |
16,595 | 466,969 | ||||||
| Bajaj Finserv, Ltd. |
1,830 | 144,407 | ||||||
| Bharat Forge, Ltd. |
4,521 | 40,760 | ||||||
| Bharat Forge, Ltd., Bonus Shares (b) (f) |
4,521 | 40,760 | ||||||
| Bharat Heavy Electricals, Ltd. |
65,429 | 84,090 | ||||||
| Bharat Heavy Electricals, Ltd., Bonus Shares (b) (f) |
32,715 | 42,045 | ||||||
| Bharat Petroleum Corp., Ltd. |
42,933 | 309,772 | ||||||
| Bharti Airtel, Ltd. |
29,682 | 176,970 | ||||||
| Bharti Infratel, Ltd. |
64,413 | 392,868 | ||||||
| Bosch, Ltd. |
127 | 39,945 | ||||||
| Cadila Healthcare, Ltd. |
7,500 | 54,005 | ||||||
| Dabur India, Ltd. |
56,740 | 264,937 | ||||||
| Dr Reddy’s Laboratories, Ltd. ADR |
19,098 | 681,417 | ||||||
| Eicher Motors, Ltd. |
757 | 361,734 | ||||||
| Glenmark Pharmaceuticals, Ltd. |
18,511 | 169,552 | ||||||
| Godrej Consumer Products, Ltd. |
24,504 | 344,808 | ||||||
| HCL Technologies, Ltd. |
37,623 | 503,867 | ||||||
| Hindalco Industries, Ltd. |
17,345 | 63,889 | ||||||
| Hindustan Petroleum Corp., Ltd. |
42,561 | 278,093 | ||||||
| Hindustan Unilever, Ltd. |
43,086 | 774,321 | ||||||
| Housing Development Finance Corp., Ltd. |
89,672 | 2,391,642 | ||||||
| ICICI Bank, Ltd. ADR |
110,351 | 944,604 | ||||||
| Idea Cellular, Ltd. |
59,786 | 70,888 | ||||||
| Indiabulls Housing Finance, Ltd. |
22,642 | 418,298 | ||||||
| Indian Oil Corp., Ltd. |
16,740 | 102,639 | ||||||
| Infosys, Ltd. ADR (a) |
166,686 | 2,431,949 | ||||||
| ITC, Ltd. |
175,803 | 695,192 | ||||||
| LIC Housing Finance, Ltd. |
31,678 | 304,244 | ||||||
| Lupin, Ltd. |
10,181 | 158,045 | ||||||
| Mahindra & Mahindra Financial Services, Ltd. |
104,955 | 662,557 | ||||||
| Mahindra & Mahindra, Ltd. |
33,816 | 652,649 | ||||||
| Marico, Ltd. |
89,406 | 425,335 | ||||||
| Maruti Suzuki India, Ltd. |
2,673 | 326,481 | ||||||
| Motherson Sumi Systems, Ltd. |
17,305 | 89,121 | ||||||
| Nestle India, Ltd. |
3,502 | 386,898 | ||||||
| Piramal Enterprises, Ltd. |
5,369 | 215,545 | ||||||
| Power Finance Corp., Ltd. |
55,145 | 102,911 | ||||||
| Reliance Industries, Ltd. GDR (d) |
136,130 | 3,246,700 | ||||||
| Rural Electrification Corp., Ltd. |
19,627 | 45,943 | ||||||
| Shree Cement, Ltd. |
1,880 | 534,761 | ||||||
| Shriram Transport Finance Co., Ltd. |
25,628 | 413,689 | ||||||
| Siemens, Ltd. |
30,839 | 561,282 | ||||||
See accompanying notes to financial statements.
25
Table of Contents
SPDR MSCI ACWI ex-US ETF
SCHEDULE OF INVESTMENTS (continued)
September 30, 2017
| Security Description |
Shares | Value | ||||||
| State Bank of India |
8,543 | $ | 33,200 | |||||
| Sun Pharmaceutical Industries, Ltd. |
40,183 | 309,585 | ||||||
| Tata Consultancy Services, Ltd. |
20,843 | 777,289 | ||||||
| Tata Motors, Ltd. ADR (b) |
38,752 | 1,211,775 | ||||||
| Tata Power Co., Ltd. |
250,189 | 297,990 | ||||||
| Tech Mahindra, Ltd. |
7,934 | 55,612 | ||||||
| United Spirits, Ltd. (b) |
4,279 | 157,066 | ||||||
| UPL, Ltd. |
20,106 | 239,628 | ||||||
| Vedanta, Ltd. |
35,767 | 172,073 | ||||||
| Yes Bank, Ltd. |
57,058 | 305,730 | ||||||
| Zee Entertainment Enterprises, Ltd. |
81,075 | 645,547 | ||||||
|
|
|
|||||||
| 27,479,804 | ||||||||
|
|
|
|||||||
| INDONESIA — 0.5% |
||||||||
| Adaro Energy Tbk PT |
385,000 | 52,166 | ||||||
| Astra International Tbk PT |
2,082,700 | 1,221,570 | ||||||
| Bank Central Asia Tbk PT |
678,000 | 1,021,858 | ||||||
| Bank Danamon Indonesia Tbk PT |
16,800 | 6,486 | ||||||
| Bank Mandiri Persero Tbk PT |
1,576,400 | 787,088 | ||||||
| Bank Rakyat Indonesia Persero Tbk PT |
1,492,300 | 1,692,396 | ||||||
| Bumi Serpong Damai Tbk PT |
195,500 | 25,691 | ||||||
| Charoen Pokphand Indonesia Tbk PT |
1,994,900 | 405,823 | ||||||
| Gudang Garam Tbk PT |
95,000 | 464,103 | ||||||
| Matahari Department Store Tbk PT |
209,700 | 144,403 | ||||||
| Summarecon Agung Tbk PT |
555,700 | 43,940 | ||||||
| Surya Citra Media Tbk PT |
35,100 | 5,707 | ||||||
| Telekomunikasi Indonesia Persero Tbk PT |
5,347,200 | 1,857,962 | ||||||
| United Tractors Tbk PT |
50,300 | 119,504 | ||||||
|
|
|
|||||||
| 7,848,697 | ||||||||
|
|
|
|||||||
| IRELAND — 0.4% |
||||||||
| Bank of Ireland Group PLC (b) |
72,843 | 596,777 | ||||||
| CRH PLC |
69,042 | 2,634,331 | ||||||
| James Hardie Industries PLC |
103,443 | 1,438,271 | ||||||
| Kerry Group PLC Class A |
16,825 | 1,616,899 | ||||||
| Paddy Power Betfair PLC |
1,563 | 155,989 | ||||||
|
|
|
|||||||
| 6,442,267 | ||||||||
|
|
|
|||||||
| ISRAEL — 0.3% |
||||||||
| Bank Hapoalim BM |
224,839 | 1,573,987 | ||||||
| Bank Leumi Le-Israel BM |
218,961 | 1,162,180 | ||||||
| Check Point Software Technologies, Ltd. (b) |
790 | 90,076 | ||||||
See accompanying notes to financial statements.
26
Table of Contents
SPDR MSCI ACWI ex-US ETF
SCHEDULE OF INVESTMENTS (continued)
September 30, 2017
| Security Description |
Shares | Value | ||||||
| Nice, Ltd. |
10,254 | $ | 817,975 | |||||
| Teva Pharmaceutical Industries, Ltd. ADR |
72,995 | 1,284,712 | ||||||
|
|
|
|||||||
| 4,928,930 | ||||||||
|
|
|
|||||||
| ITALY — 1.5% |
||||||||
| Assicurazioni Generali SpA |
90,548 | 1,687,042 | ||||||
| Atlantia SpA |
68,345 | 2,158,099 | ||||||
| Enel SpA |
516,915 | 3,113,537 | ||||||
| Eni SpA |
178,150 | 2,948,523 | ||||||
| Ferrari NV |
14,554 | 1,608,736 | ||||||
| Intesa Sanpaolo SpA |
932,522 | 3,298,461 | ||||||
| Leonardo SpA |
50,965 | 954,975 | ||||||
| Mediobanca SpA |
61,926 | 664,737 | ||||||
| Saipem SpA (a) (b) |
42,827 | 184,698 | ||||||
| Snam SpA |
175,003 | 843,277 | ||||||
| Telecom Italia SpA/Milano (b) |
1,275,459 | 1,194,969 | ||||||
| UniCredit SpA (b) |
119,214 | 2,539,644 | ||||||
|
|
|
|||||||
| 21,196,698 | ||||||||
|
|
|
|||||||
| JAPAN — 16.2% |
||||||||
| Acom Co., Ltd. (a) (b) |
42,400 | 164,229 | ||||||
| Aeon Co., Ltd. |
57,700 | 852,185 | ||||||
| Aisin Seiki Co., Ltd. |
37,300 | 1,964,989 | ||||||
| Ajinomoto Co., Inc. |
24,200 | 472,111 | ||||||
| Alps Electric Co., Ltd. |
6,100 | 160,893 | ||||||
| Asahi Glass Co., Ltd. |
33,600 | 1,246,213 | ||||||
| Asahi Group Holdings, Ltd. |
58,100 | 2,351,562 | ||||||
| Asahi Kasei Corp. |
164,000 | 2,017,856 | ||||||
| Astellas Pharma, Inc. |
233,200 | 2,965,627 | ||||||
| Bridgestone Corp. |
58,100 | 2,635,443 | ||||||
| Canon, Inc. |
77,200 | 2,637,001 | ||||||
| Central Japan Railway Co. |
19,200 | 3,365,309 | ||||||
| Chiba Bank, Ltd. (a) |
185,000 | 1,323,013 | ||||||
| Chubu Electric Power Co., Inc. |
77,400 | 960,581 | ||||||
| Concordia Financial Group, Ltd. |
194,000 | 958,410 | ||||||
| Credit Saison Co., Ltd. |
57,600 | 1,194,830 | ||||||
| Dai-ichi Life Holdings, Inc. |
55,300 | 991,878 | ||||||
| Daiichi Sankyo Co., Ltd. |
77,500 | 1,747,390 | ||||||
| Daikin Industries, Ltd. |
37,600 | 3,806,263 | ||||||
| Daiwa Securities Group, Inc. |
192,000 | 1,087,031 | ||||||
| Denso Corp. |
38,800 | 1,962,319 | ||||||
| Dentsu, Inc. |
2,200 | 96,549 | ||||||
| East Japan Railway Co. |
38,300 | 3,533,474 | ||||||
| Eisai Co., Ltd. |
19,400 | 995,464 | ||||||
| Electric Power Development Co., Ltd. |
19,400 | 487,047 | ||||||
See accompanying notes to financial statements.
27
Table of Contents
SPDR MSCI ACWI ex-US ETF
SCHEDULE OF INVESTMENTS (continued)
September 30, 2017
| Security Description |
Shares | Value | ||||||
| FANUC Corp. |
17,000 | $ | 3,441,834 | |||||
| Fast Retailing Co., Ltd. |
1,900 | 560,219 | ||||||
| FUJIFILM Holdings Corp. |
57,800 | 2,242,372 | ||||||
| Fujitsu, Ltd. |
194,000 | 1,440,631 | ||||||
| Hitachi, Ltd. |
387,000 | 2,726,001 | ||||||
| Honda Motor Co., Ltd. |
135,600 | 4,013,852 | ||||||
| Hoya Corp. |
38,800 | 2,093,990 | ||||||
| Inpex Corp. |
76,800 | 815,657 | ||||||
| ITOCHU Corp. |
190,200 | 3,114,099 | ||||||
| Japan Real Estate Investment Corp. REIT |
233 | 1,119,824 | ||||||
| Japan Retail Fund Investment Corp. REIT |
723 | 1,296,795 | ||||||
| Japan Tobacco, Inc. |
77,500 | 2,539,155 | ||||||
| JFE Holdings, Inc. |
41,400 | 808,213 | ||||||
| JSR Corp. |
38,800 | 736,947 | ||||||
| JXTG Holdings, Inc. |
313,708 | 1,613,339 | ||||||
| Kajima Corp. |
194,000 | 1,926,816 | ||||||
| Kamigumi Co., Ltd. |
85,500 | 1,978,657 | ||||||
| Kansai Electric Power Co., Inc. |
96,400 | 1,232,779 | ||||||
| Kao Corp. |
36,700 | 2,158,344 | ||||||
| KDDI Corp. |
116,400 | 3,068,083 | ||||||
| Keikyu Corp. (a) |
95,712 | 1,939,483 | ||||||
| Keyence Corp. |
6,700 | 3,556,390 | ||||||
| Kintetsu Group Holdings Co., Ltd. |
38,700 | 1,438,809 | ||||||
| Kobe Steel, Ltd. |
38,800 | 443,271 | ||||||
| Komatsu, Ltd. |
96,800 | 2,752,692 | ||||||
| Konica Minolta, Inc. |
97,000 | 796,233 | ||||||
| Kose Corp. |
2,200 | 251,926 | ||||||
| Kubota Corp. |
117,800 | 2,140,629 | ||||||
| Kyocera Corp. |
38,600 | 2,394,218 | ||||||
| LIXIL Group Corp. |
38,500 | 1,021,285 | ||||||
| Makita Corp. |
38,400 | 1,547,053 | ||||||
| Marubeni Corp. |
193,000 | 1,317,643 | ||||||
| Marui Group Co., Ltd. (a) |
67,900 | 971,767 | ||||||
| Mazda Motor Corp. |
14,900 | 228,335 | ||||||
| Mebuki Financial Group, Inc. |
228,800 | 884,182 | ||||||
| MEIJI Holdings Co., Ltd. |
3,200 | 253,578 | ||||||
| Mitsubishi Chemical Holdings Corp. |
194,000 | 1,847,537 | ||||||
| Mitsubishi Corp. |
135,600 | 3,150,729 | ||||||
| Mitsubishi Electric Corp. |
193,000 | 3,014,205 | ||||||
| Mitsubishi Estate Co., Ltd. |
173,618 | 3,017,666 | ||||||
| Mitsubishi Heavy Industries, Ltd. |
38,700 | 1,529,572 | ||||||
| Mitsubishi UFJ Financial Group, Inc. |
806,800 | 5,237,230 | ||||||
| Mitsui & Co., Ltd. |
190,100 | 2,808,478 | ||||||
| Mitsui Chemicals, Inc. |
38,800 | 1,178,839 | ||||||
See accompanying notes to financial statements.
28
Table of Contents
SPDR MSCI ACWI ex-US ETF
SCHEDULE OF INVESTMENTS (continued)
September 30, 2017
| Security Description |
Shares | Value | ||||||
| Mitsui Fudosan Co., Ltd. |
26,000 | $ | 563,585 | |||||
| Mizuho Financial Group, Inc. (a) |
1,117,400 | 1,956,554 | ||||||
| MS&AD Insurance Group Holdings, Inc. |
58,100 | 1,869,998 | ||||||
| Murata Manufacturing Co., Ltd. |
17,200 | 2,527,322 | ||||||
| NEC Corp. |
17,800 | 482,299 | ||||||
| Nidec Corp. |
24,300 | 2,983,396 | ||||||
| Nintendo Co., Ltd. |
5,900 | 2,178,332 | ||||||
| Nippon Steel & Sumitomo Metal Corp. |
63,700 | 1,461,990 | ||||||
| Nippon Telegraph & Telephone Corp. |
59,300 | 2,716,742 | ||||||
| Nippon Yusen KK (b) |
19,400 | 403,115 | ||||||
| Nissan Motor Co., Ltd. |
193,700 | 1,917,813 | ||||||
| Nitori Holdings Co., Ltd. |
3,100 | 443,113 | ||||||
| Nitto Denko Corp. |
19,300 | 1,608,605 | ||||||
| Nomura Holdings, Inc. |
213,700 | 1,196,029 | ||||||
| NTT Data Corp. |
97,000 | 1,037,516 | ||||||
| NTT DOCOMO, Inc. |
122,100 | 2,788,238 | ||||||
| Obayashi Corp. |
140,200 | 1,680,183 | ||||||
| Ono Pharmaceutical Co., Ltd. |
24,400 | 552,639 | ||||||
| Oriental Land Co., Ltd. (a) |
5,800 | 441,782 | ||||||
| ORIX Corp. |
154,700 | 2,493,698 | ||||||
| Osaka Gas Co., Ltd. |
77,400 | 1,438,465 | ||||||
| Otsuka Holdings Co., Ltd. |
8,700 | 345,558 | ||||||
| Panasonic Corp. |
195,200 | 2,827,465 | ||||||
| Rakuten, Inc. |
42,500 | 463,266 | ||||||
| Recruit Holdings Co., Ltd. |
37,000 | 801,039 | ||||||
| Resona Holdings, Inc. |
58,100 | 298,333 | ||||||
| Rohm Co., Ltd. |
19,200 | 1,644,277 | ||||||
| Ryohin Keikaku Co., Ltd. |
1,300 | 382,845 | ||||||
| Secom Co., Ltd. |
19,400 | 1,413,573 | ||||||
| Seven & i Holdings Co., Ltd. |
77,500 | 2,991,494 | ||||||
| Sharp Corp. (a) (b) |
7,100 | 214,138 | ||||||
| Shin-Etsu Chemical Co., Ltd. |
36,300 | 3,244,152 | ||||||
| Shionogi & Co., Ltd. |
17,600 | 961,734 | ||||||
| Shiseido Co., Ltd. |
20,600 | 823,890 | ||||||
| Shizuoka Bank, Ltd. |
149,000 | 1,339,564 | ||||||
| SMC Corp. (a) |
1,300 | 458,375 | ||||||
| SoftBank Group Corp. |
76,600 | 6,181,623 | ||||||
| Sompo Holdings, Inc. |
52,600 | 2,045,776 | ||||||
| Sony Corp. |
96,600 | 3,592,303 | ||||||
| Subaru Corp. |
23,100 | 833,172 | ||||||
| Sumitomo Chemical Co., Ltd. |
194,000 | 1,211,584 | ||||||
| Sumitomo Corp. |
96,900 | 1,393,263 | ||||||
| Sumitomo Electric Industries, Ltd. |
77,500 | 1,265,447 | ||||||
| Sumitomo Mitsui Financial Group, Inc. |
62,400 | 2,394,776 | ||||||
See accompanying notes to financial statements.
29
Table of Contents
SPDR MSCI ACWI ex-US ETF
SCHEDULE OF INVESTMENTS (continued)
September 30, 2017
| Security Description |
Shares | Value | ||||||
| Sumitomo Mitsui Trust Holdings, Inc. |
19,300 | $ | 696,285 | |||||
| Sysmex Corp. |
1,400 | 89,300 | ||||||
| T&D Holdings, Inc. |
38,500 | 558,697 | ||||||
| Takeda Pharmaceutical Co., Ltd. |
77,500 | 4,278,284 | ||||||
| TDK Corp. |
19,400 | 1,316,715 | ||||||
| Teijin, Ltd. |
64,600 | 1,272,889 | ||||||
| Terumo Corp. |
55,500 | 2,181,739 | ||||||
| Tohoku Electric Power Co., Inc. |
38,900 | 494,522 | ||||||
| Tokio Marine Holdings, Inc. |
58,100 | 2,272,076 | ||||||
| Tokyo Electric Power Co. Holdings, Inc. (b) |
135,500 | 546,502 | ||||||
| Tokyo Electron, Ltd. |
19,400 | 2,978,119 | ||||||
| Tokyo Gas Co., Ltd. |
70,600 | 1,729,799 | ||||||
| Tokyu Corp. |
99,500 | 1,408,106 | ||||||
| Toppan Printing Co., Ltd. |
194,000 | 1,923,369 | ||||||
| Toray Industries, Inc. |
194,000 | 1,881,144 | ||||||
| Toshiba Corp. (b) |
234,000 | 654,822 | ||||||
| Toyota Motor Corp. |
194,100 | 11,570,302 | ||||||
| Toyota Tsusho Corp. |
58,100 | 1,907,160 | ||||||
| West Japan Railway Co. |
20,000 | 1,389,775 | ||||||
| Yahoo! Japan Corp. (a) |
251,900 | 1,194,995 | ||||||
| Yakult Honsha Co., Ltd. |
900 | 64,843 | ||||||
| Yamada Denki Co., Ltd. (a) |
116,700 | 637,592 | ||||||
| Yamaha Corp. |
26,800 | 988,051 | ||||||
| Yamaha Motor Co., Ltd. |
58,200 | 1,742,407 | ||||||
|
|
|
|||||||
| 236,273,578 | ||||||||
|
|
|
|||||||
| LUXEMBOURG — 0.1% |
||||||||
| ArcelorMittal (b) |
37,953 | 979,244 | ||||||
| SES SA |
25,109 | 549,448 | ||||||
|
|
|
|||||||
| 1,528,692 | ||||||||
|
|
|
|||||||
| MACAU — 0.0% (g) |
||||||||
| MGM China Holdings, Ltd. (a) |
59,600 | 142,844 | ||||||
| Wynn Macau, Ltd. |
62,400 | 168,169 | ||||||
|
|
|
|||||||
| 311,013 | ||||||||
|
|
|
|||||||
| MALAYSIA — 0.4% |
||||||||
| AirAsia Bhd |
512,000 | 418,330 | ||||||
| Alliance Bank Malaysia Bhd |
620,500 | 573,108 | ||||||
| AMMB Holdings Bhd |
199,900 | 206,410 | ||||||
| Astro Malaysia Holdings Bhd |
95,600 | 63,847 | ||||||
| British American Tobacco Malaysia Bhd |
36,300 | 376,024 | ||||||
| CIMB Group Holdings Bhd |
383,051 | 571,515 | ||||||
| Dialog Group Bhd |
850,600 | 402,889 | ||||||
| Felda Global Ventures Holdings Bhd |
632,600 | 253,190 | ||||||
See accompanying notes to financial statements.
30
Table of Contents
SPDR MSCI ACWI ex-US ETF
SCHEDULE OF INVESTMENTS (continued)
September 30, 2017
| Security Description |
Shares | Value | ||||||
| Gamuda Bhd |
52,866 | $ | 66,106 | |||||
| Genting Bhd |
177,200 | 400,772 | ||||||
| Genting Malaysia Bhd |
445,000 | 566,987 | ||||||
| Genting Plantations Bhd |
197,700 | 482,252 | ||||||
| Hong Leong Financial Group Bhd |
33,239 | 130,673 | ||||||
| IOI Properties Group Bhd |
581,700 | 278,279 | ||||||
| Malaysia Airports Holdings Bhd |
146,700 | 295,311 | ||||||
| Petronas Chemicals Group Bhd |
18,000 | 31,076 | ||||||
| PPB Group Bhd |
106,100 | 423,646 | ||||||
| RHB Capital Bhd |
107,810 | 128,427 | ||||||
| Sapura Energy Bhd |
141,400 | 50,901 | ||||||
| Tenaga Nasional Bhd |
132,900 | 450,711 | ||||||
| UMW Holdings Bhd (b) |
37,800 | 49,684 | ||||||
| Westports Holdings Bhd |
148,500 | 133,993 | ||||||
|
|
|
|||||||
| 6,354,131 | ||||||||
|
|
|
|||||||
| MEXICO — 0.9% |
||||||||
| America Movil SAB de CV |
2,790,310 | 2,483,110 | ||||||
| Cemex SAB de CV (b) |
1,648,361 | 1,502,285 | ||||||
| Fomento Economico Mexicano SAB de CV |
262,492 | 2,515,749 | ||||||
| Fresnillo PLC |
21,249 | 400,547 | ||||||
| Gentera SAB de CV |
251,820 | 409,224 | ||||||
| Grupo Financiero Banorte SAB de CV Class O |
369,149 | 2,552,844 | ||||||
| Grupo Mexico SAB de CV Class B |
227,769 | 698,512 | ||||||
| Grupo Televisa SAB |
317,404 | 1,568,733 | ||||||
| Industrias Penoles SAB de CV |
16,398 | 408,441 | ||||||
| Kimberly-Clark de Mexico SAB de CV Class A |
228,530 | 466,266 | ||||||
| Wal-Mart de Mexico SAB de CV |
293,176 | 673,235 | ||||||
|
|
|
|||||||
| 13,678,946 | ||||||||
|
|
|
|||||||
| NETHERLANDS — 3.2% |
||||||||
| Akzo Nobel NV |
22,599 | 2,087,095 | ||||||
| Altice NV Class B (b) |
4,415 | 88,208 | ||||||
| Altice NV Class A (b) |
24,592 | 492,636 | ||||||
| ASML Holding NV |
30,449 | 5,185,338 | ||||||
| Gemalto NV |
1,668 | 74,528 | ||||||
| Heineken NV |
24,721 | 2,444,684 | ||||||
| ING Groep NV |
239,139 | 4,410,276 | ||||||
| Koninklijke Ahold Delhaize NV |
133,484 | 2,496,470 | ||||||
| Koninklijke DSM NV |
22,032 | 1,803,961 | ||||||
| Koninklijke KPN NV |
465,993 | 1,600,355 | ||||||
| Koninklijke Philips NV |
98,664 | 4,074,253 | ||||||
| NXP Semiconductors NV (b) |
12,478 | 1,411,137 | ||||||
| Royal Dutch Shell PLC Class A |
332,811 | 10,039,908 | ||||||
See accompanying notes to financial statements.
31
Table of Contents
SPDR MSCI ACWI ex-US ETF
SCHEDULE OF INVESTMENTS (continued)
September 30, 2017
| Security Description |
Shares | Value | ||||||
| Royal Dutch Shell PLC Class B |
268,983 | $ | 8,280,414 | |||||
| Wolters Kluwer NV |
35,863 | 1,657,519 | ||||||
|
|
|
|||||||
| 46,146,782 | ||||||||
|
|
|
|||||||
| NEW ZEALAND — 0.1% |
||||||||
| Mercury NZ, Ltd. |
233,008 | 571,017 | ||||||
| Meridian Energy, Ltd. |
226,063 | 464,932 | ||||||
| Spark New Zealand, Ltd. |
165,235 | 435,987 | ||||||
|
|
|
|||||||
| 1,471,936 | ||||||||
|
|
|
|||||||
| NORWAY — 0.5% |
||||||||
| DNB ASA |
104,849 | 2,114,024 | ||||||
| Norsk Hydro ASA |
171,551 | 1,247,793 | ||||||
| Statoil ASA |
87,390 | 1,748,832 | ||||||
| Telenor ASA |
75,492 | 1,597,032 | ||||||
| Yara International ASA |
19,327 | 866,040 | ||||||
|
|
|
|||||||
| 7,573,721 | ||||||||
|
|
|
|||||||
| PERU — 0.1% |
||||||||
| Cia de Minas Buenaventura SAA ADR |
19,018 | 243,240 | ||||||
| Credicorp, Ltd. |
7,302 | 1,497,056 | ||||||
|
|
|
|||||||
| 1,740,296 | ||||||||
|
|
|
|||||||
| PHILIPPINES — 0.3% |
||||||||
| Alliance Global Group, Inc. |
600,500 | 189,608 | ||||||
| Ayala Land, Inc. |
525,600 | 450,075 | ||||||
| BDO Unibank, Inc. |
39,837 | 102,495 | ||||||
| DMCI Holdings, Inc. |
1,421,350 | 436,482 | ||||||
| Globe Telecom, Inc. |
2,815 | 113,599 | ||||||
| GT Capital Holdings, Inc. |
7,980 | 182,379 | ||||||
| JG Summit Holdings, Inc. |
250,860 | 370,368 | ||||||
| Jollibee Foods Corp. |
107,770 | 517,216 | ||||||
| Megaworld Corp. |
1,716,000 | 176,669 | ||||||
| Metro Pacific Investments Corp. |
3,745,400 | 493,985 | ||||||
| PLDT, Inc. ADR |
15,842 | 505,677 | ||||||
| SM Prime Holdings, Inc. |
557,600 | 378,140 | ||||||
| Universal Robina Corp. |
63,500 | 191,002 | ||||||
|
|
|
|||||||
| 4,107,695 | ||||||||
|
|
|
|||||||
| POLAND — 0.3% |
||||||||
| Alior Bank SA (b) |
36,876 | 693,104 | ||||||
| Bank Millennium SA (b) |
128,962 | 248,089 | ||||||
| Bank Zachodni WBK SA |
3,675 | 352,276 | ||||||
| CCC SA |
7,694 | 582,759 | ||||||
| Eurocash SA |
24,347 | 258,039 | ||||||
| Grupa Azoty SA |
11,973 | 262,200 | ||||||
See accompanying notes to financial statements.
32
Table of Contents
SPDR MSCI ACWI ex-US ETF
SCHEDULE OF INVESTMENTS (continued)
September 30, 2017
| Security Description |
Shares | Value | ||||||
| LPP SA |
48 | $ | 107,647 | |||||
| Orange Polska SA (b) |
93,225 | 135,337 | ||||||
| Polski Koncern Naftowy ORLEN SA |
17,975 | 600,326 | ||||||
| Powszechna Kasa Oszczednosci Bank Polski SA (b) |
48,684 | 472,017 | ||||||
|
|
|
|||||||
| 3,711,794 | ||||||||
|
|
|
|||||||
| PORTUGAL — 0.1% |
||||||||
| EDP - Energias de Portugal SA |
164,462 | 619,250 | ||||||
| Jeronimo Martins SGPS SA |
20,844 | 411,271 | ||||||
|
|
|
|||||||
| 1,030,521 | ||||||||
|
|
|
|||||||
| QATAR — 0.0% (g) |
||||||||
| Commercial Bank PQSC (b) |
11,821 | 94,516 | ||||||
| Ezdan Holding Group QSC |
13,561 | 39,110 | ||||||
| Qatar Electricity & Water Co. QSC |
5,645 | 271,028 | ||||||
| Qatar Gas Transport Co., Ltd. |
18,457 | 80,049 | ||||||
|
|
|
|||||||
| 484,703 | ||||||||
|
|
|
|||||||
| ROMANIA — 0.0% (g) |
||||||||
| NEPI Rockcastle PLC |
7,094 | 96,618 | ||||||
|
|
|
|||||||
| RUSSIA — 0.7% |
||||||||
| Gazprom PJSC ADR |
455,752 | 1,909,601 | ||||||
| LUKOIL PJSC ADR |
50,748 | 2,691,167 | ||||||
| Magnit PJSC GDR |
8,042 | 329,320 | ||||||
| MMC Norilsk Nickel PJSC ADR |
37,885 | 651,622 | ||||||
| Mobile TeleSystems PJSC ADR |
91,012 | 950,165 | ||||||
| RusHydro PJSC ADR (c) |
58,736 | 83,993 | ||||||
| RusHydro PJSC ADR (a) (c) |
116,159 | 166,688 | ||||||
| Sberbank of Russia PJSC ADR |
119,978 | 1,707,887 | ||||||
| Surgutneftegas OJSC ADR |
124,978 | 646,136 | ||||||
| Tatneft PJSC ADR |
38,069 | 1,625,546 | ||||||
|
|
|
|||||||
| 10,762,125 | ||||||||
|
|
|
|||||||
| SINGAPORE — 0.9% |
||||||||
| CapitaLand, Ltd. |
387,000 | 1,020,259 | ||||||
| DBS Group Holdings, Ltd. |
209,858 | 3,217,529 | ||||||
| Singapore Exchange, Ltd. |
387,000 | 2,106,064 | ||||||
| Singapore Press Holdings, Ltd. (a) |
581,000 | 1,163,754 | ||||||
| Singapore Telecommunications, Ltd. |
944,300 | 2,559,022 | ||||||
| United Overseas Bank, Ltd. |
197,929 | 3,425,260 | ||||||
|
|
|
|||||||
| 13,491,888 | ||||||||
|
|
|
|||||||
| SOUTH AFRICA — 1.5% |
||||||||
| Anglo American Platinum, Ltd. (b) |
7,211 | 184,247 | ||||||
| AngloGold Ashanti, Ltd. |
40,536 | 382,169 | ||||||
See accompanying notes to financial statements.
33
Table of Contents
SPDR MSCI ACWI ex-US ETF
SCHEDULE OF INVESTMENTS (continued)
September 30, 2017
| Security Description |
Shares | Value | ||||||
| Aspen Pharmacare Holdings, Ltd. |
24,259 | $ | 545,439 | |||||
| Bid Corp., Ltd. (a) |
22,572 | 508,027 | ||||||
| Bidvest Group, Ltd. (a) |
22,619 | 289,235 | ||||||
| Brait SE (b) |
32,065 | 127,049 | ||||||
| Capitec Bank Holdings, Ltd. |
5,009 | 318,688 | ||||||
| Coronation Fund Managers, Ltd. |
45,106 | 224,820 | ||||||
| Discovery, Ltd. (a) |
74,137 | 772,310 | ||||||
| FirstRand, Ltd. (a) |
314,437 | 1,211,639 | ||||||
| Foschini Group, Ltd. |
30,096 | 302,576 | ||||||
| Gold Fields, Ltd. |
47,341 | 206,789 | ||||||
| Impala Platinum Holdings, Ltd. (b) |
58,439 | 134,168 | ||||||
| Imperial Holdings, Ltd. |
21,031 | 297,853 | ||||||
| Massmart Holdings, Ltd. |
25,988 | 214,717 | ||||||
| Mr. Price Group, Ltd. |
28,795 | 383,948 | ||||||
| MTN Group, Ltd. |
122,313 | 1,126,702 | ||||||
| Naspers, Ltd. Class N |
33,229 | 7,185,979 | ||||||
| Novus Holdings, Ltd. |
11,373 | 5,500 | ||||||
| Pioneer Foods Group, Ltd. |
29,547 | 246,726 | ||||||
| PSG Group, Ltd. |
15,831 | 274,482 | ||||||
| Rand Merchant Investment Holdings, Ltd. |
34,023 | 104,494 | ||||||
| Remgro, Ltd. |
37,710 | 573,477 | ||||||
| Resilient REIT, Ltd. |
48,168 | 474,742 | ||||||
| Sanlam, Ltd. |
232,180 | 1,163,436 | ||||||
| Sasol, Ltd. |
42,433 | 1,165,906 | ||||||
| Sibanye-Stillwater |
136,381 | 153,728 | ||||||
| Standard Bank Group, Ltd. (a) |
127,348 | 1,488,375 | ||||||
| Steinhoff International Holdings NV (a) |
206,316 | 917,249 | ||||||
| Truworths International, Ltd. (a) |
56,316 | 322,193 | ||||||
| Woolworths Holdings, Ltd. |
45,884 | 203,517 | ||||||
|
|
|
|||||||
| 21,510,180 | ||||||||
|
|
|
|||||||
| SOUTH KOREA — 3.5% |
||||||||
| Amorepacific Corp. |
387 | 87,682 | ||||||
| Amorepacific Corp. Preference Shares |
2,017 | 274,721 | ||||||
| AMOREPACIFIC Group |
502 | 54,129 | ||||||
| BGF retail Co., Ltd. |
2,172 | 157,398 | ||||||
| Celltrion, Inc. (b) |
8,293 | 1,028,163 | ||||||
| CJ CheilJedang Corp. |
2,274 | 703,831 | ||||||
| CJ Corp. |
746 | 111,052 | ||||||
| Coway Co., Ltd. |
3,030 | 248,675 | ||||||
| E-MART, Inc. |
2,642 | 480,951 | ||||||
| Hana Financial Group, Inc. |
43,216 | 1,786,596 | ||||||
| Hanmi Pharm Co., Ltd. (a) (b) |
345 | 136,904 | ||||||
| Hanmi Science Co., Ltd. (a) (b) |
1,721 | 138,089 | ||||||
See accompanying notes to financial statements.
34
Table of Contents
SPDR MSCI ACWI ex-US ETF
SCHEDULE OF INVESTMENTS (continued)
September 30, 2017
| Security Description |
Shares | Value | ||||||
| Hanssem Co., Ltd. |
1,124 | $ | 148,676 | |||||
| Hotel Shilla Co., Ltd. |
875 | 44,462 | ||||||
| Hyundai Department Store Co., Ltd. |
4,444 | 342,995 | ||||||
| Hyundai Development Co-Engineering & Construction |
11,169 | 348,132 | ||||||
| Hyundai Heavy Industries Co., Ltd. (b) |
3,854 | 487,912 | ||||||
| Hyundai Mobis Co., Ltd. |
6,188 | 1,296,652 | ||||||
| Hyundai Motor Co. |
13,649 | 1,793,491 | ||||||
| Hyundai Robotics Co., Ltd. (b) |
800 | 297,551 | ||||||
| Hyundai Steel Co. |
6,302 | 290,519 | ||||||
| KB Financial Group, Inc. |
44,941 | 2,201,240 | ||||||
| Kia Motors Corp. |
27,125 | 749,558 | ||||||
| Korea Aerospace Industries, Ltd. |
4,292 | 163,758 | ||||||
| Korea Electric Power Corp. ADR (a) |
46,892 | 785,910 | ||||||
| Korea Zinc Co., Ltd. |
2,354 | 1,018,385 | ||||||
| KT Corp. ADR |
38,273 | 530,847 | ||||||
| KT&G Corp. |
13,111 | 1,207,675 | ||||||
| LG Chem, Ltd. |
766 | 262,166 | ||||||
| LG Chem, Ltd. Preference Shares |
536 | 118,633 | ||||||
| LG Electronics, Inc. |
14,733 | 1,059,937 | ||||||
| LG Household & Health Care, Ltd. |
1,289 | 1,053,393 | ||||||
| Lotte Chemical Corp. |
2,606 | 860,058 | ||||||
| NAVER Corp. |
2,722 | 1,770,542 | ||||||
| NCSoft Corp. |
2,275 | 922,633 | ||||||
| POSCO ADR |
27,995 | 1,942,853 | ||||||
| Samsung C&T Corp. |
4,300 | 506,832 | ||||||
| Samsung Electronics Co., Ltd. GDR (a) |
14,507 | 16,421,924 | ||||||
| Samsung Electronics Co., Ltd. Preference Shares |
512 | 921,765 | ||||||
| Samsung Fire & Marine Insurance Co., Ltd. |
4,591 | 1,122,347 | ||||||
| Samsung Heavy Industries Co., Ltd. (b) |
20,495 | 200,414 | ||||||
| Samsung SDS Co., Ltd. |
1,368 | 201,256 | ||||||
| Samsung Securities Co., Ltd. |
25,557 | 770,938 | ||||||
| Shinhan Financial Group Co., Ltd. |
39,901 | 1,752,320 | ||||||
| SK Holdings Co., Ltd. |
4,157 | 1,045,284 | ||||||
| SK Hynix, Inc. |
33,426 | 2,419,361 | ||||||
| SK Innovation Co., Ltd. |
5,941 | 1,032,225 | ||||||
| SK Telecom Co., Ltd. ADR |
18,977 | 466,644 | ||||||
|
|
|
|||||||
| 51,767,479 | ||||||||
|
|
|
|||||||
| SPAIN — 2.3% |
||||||||
| Abertis Infraestructuras SA |
90,248 | 1,824,418 | ||||||
| ACS Actividades de Construccion y Servicios SA |
43,869 | 1,626,130 | ||||||
| Aena SME SA (d) |
971 | 175,344 | ||||||
| Amadeus IT Group SA |
23,772 | 1,545,397 | ||||||
| Banco Bilbao Vizcaya Argentaria SA |
445,842 | 3,985,208 | ||||||
See accompanying notes to financial statements.
35
Table of Contents
SPDR MSCI ACWI ex-US ETF
SCHEDULE OF INVESTMENTS (continued)
September 30, 2017
| Security Description |
Shares | Value | ||||||
| Banco de Sabadell SA |
232,162 | $ | 484,700 | |||||
| Banco Santander SA |
1,099,317 | 7,676,808 | ||||||
| CaixaBank SA |
32,676 | 163,789 | ||||||
| Distribuidora Internacional de Alimentacion SA (a) |
77,323 | 451,114 | ||||||
| Ferrovial SA |
74,528 | 1,640,992 | ||||||
| Gas Natural SDG SA |
32,477 | 719,125 | ||||||
| Iberdrola SA |
486,637 | 3,780,885 | ||||||
| Industria de Diseno Textil SA |
92,714 | 3,494,801 | ||||||
| Mapfre SA |
222,148 | 723,264 | ||||||
| Repsol SA |
98,489 | 1,815,200 | ||||||
| Telefonica SA |
347,919 | 3,780,758 | ||||||
|
|
|
|||||||
| 33,887,933 | ||||||||
|
|
|
|||||||
| SWEDEN — 2.0% |
||||||||
| Assa Abloy AB Class B |
121,515 | 2,769,030 | ||||||
| Atlas Copco AB Class B |
84,295 | 3,261,360 | ||||||
| Essity AB Class B (b) |
5,354 | 145,356 | ||||||
| Hennes & Mauritz AB Class B (a) |
83,235 | 2,151,658 | ||||||
| Husqvarna AB Class B |
194,451 | 1,996,361 | ||||||
| Nordea Bank AB |
210,145 | 2,842,320 | ||||||
| Sandvik AB |
104,943 | 1,806,403 | ||||||
| Securitas AB Class B |
63,282 | 1,057,497 | ||||||
| Skandinaviska Enskilda Banken AB Class A |
113,249 | 1,488,740 | ||||||
| Skanska AB Class B |
63,093 | 1,458,605 | ||||||
| SKF AB Class B |
51,671 | 1,123,647 | ||||||
| Svenska Handelsbanken AB Class A |
139,088 | 2,094,239 | ||||||
| Swedbank AB Class A |
68,986 | 1,903,330 | ||||||
| Tele2 AB Class B |
86,875 | 991,963 | ||||||
| Telefonaktiebolaget LM Ericsson Class B |
265,369 | 1,520,556 | ||||||
| Telia Co. AB |
153,080 | 719,419 | ||||||
| Volvo AB Class B |
108,904 | 2,094,731 | ||||||
|
|
|
|||||||
| 29,425,215 | ||||||||
|
|
|
|||||||
| SWITZERLAND — 6.1% |
||||||||
| ABB, Ltd. |
184,916 | 4,575,123 | ||||||
| Adecco Group AG |
15,679 | 1,221,782 | ||||||
| Cie Financiere Richemont SA |
39,643 | 3,625,884 | ||||||
| Coca-Cola HBC AG (b) |
12,520 | 424,136 | ||||||
| Credit Suisse Group AG (b) |
149,846 | 2,374,059 | ||||||
| Ferguson PLC |
19,344 | 1,270,653 | ||||||
| Geberit AG |
4,263 | 2,018,272 | ||||||
| Givaudan SA |
1,130 | 2,460,635 | ||||||
| Glencore PLC (b) |
806,311 | 3,699,711 | ||||||
| Julius Baer Group, Ltd. (b) |
12,128 | 718,204 | ||||||
| Kuehne + Nagel International AG |
9,087 | 1,683,856 | ||||||
See accompanying notes to financial statements.
36
Table of Contents
SPDR MSCI ACWI ex-US ETF
SCHEDULE OF INVESTMENTS (continued)
September 30, 2017
| Security Description |
Shares | Value | ||||||
| LafargeHolcim, Ltd. (b) |
25,791 | $ | 1,508,651 | |||||
| Lonza Group AG (b) |
4,243 | 1,113,809 | ||||||
| Nestle SA |
227,943 | 19,105,185 | ||||||
| Novartis AG |
172,131 | 14,747,478 | ||||||
| Roche Holding AG |
50,225 | 12,831,356 | ||||||
| SGS SA |
775 | 1,860,609 | ||||||
| Sika AG |
147 | 1,094,600 | ||||||
| Sonova Holding AG |
2,299 | 390,374 | ||||||
| STMicroelectronics NV |
25,416 | 491,866 | ||||||
| Swatch Group AG, Bearer Shares (a) |
4,434 | 1,845,820 | ||||||
| Swiss Re AG |
26,470 | 2,399,151 | ||||||
| UBS Group AG (b) |
261,336 | 4,469,937 | ||||||
| Zurich Insurance Group AG |
12,338 | 3,766,686 | ||||||
|
|
|
|||||||
| 89,697,837 | ||||||||
|
|
|
|||||||
| TAIWAN — 2.6% |
||||||||
| Advanced Semiconductor Engineering, Inc. ADR |
214,954 | 1,328,416 | ||||||
| Advantech Co., Ltd. |
28,599 | 203,713 | ||||||
| Asia Pacific Telecom Co., Ltd. (b) |
48,000 | 16,146 | ||||||
| Asustek Computer, Inc. |
11,000 | 90,506 | ||||||
| AU Optronics Corp. ADR (a) |
258,893 | 1,045,928 | ||||||
| Catcher Technology Co., Ltd. |
32,000 | 298,114 | ||||||
| Cathay Financial Holding Co., Ltd. |
218,000 | 346,511 | ||||||
| Chicony Electronics Co., Ltd. |
151,581 | 359,907 | ||||||
| China Airlines, Ltd. (b) |
742,000 | 280,171 | ||||||
| China Development Financial Holding Corp. |
426,000 | 127,839 | ||||||
| China Life Insurance Co., Ltd. |
193,296 | 181,988 | ||||||
| Chunghwa Telecom Co., Ltd. ADR |
69,344 | 2,365,324 | ||||||
| Compal Electronics, Inc. |
226,000 | 160,609 | ||||||
| CTBC Financial Holding Co., Ltd. |
540,558 | 338,695 | ||||||
| Delta Electronics, Inc. |
59,785 | 307,560 | ||||||
| E.Sun Financial Holding Co., Ltd. |
799,741 | 477,355 | ||||||
| Eclat Textile Co., Ltd. |
15,650 | 190,180 | ||||||
| Eva Airways Corp. |
508,897 | 248,373 | ||||||
| Feng TAY Enterprise Co., Ltd. |
34,036 | 154,893 | ||||||
| Formosa Plastics Corp. |
314,000 | 950,574 | ||||||
| Foxconn Technology Co., Ltd. |
24,240 | 69,945 | ||||||
| Fubon Financial Holding Co., Ltd. |
338,000 | 527,219 | ||||||
| Giant Manufacturing Co., Ltd. |
17,000 | 79,887 | ||||||
| Globalwafers Co., Ltd. |
6,000 | 58,567 | ||||||
| Highwealth Construction Corp. |
153,400 | 203,613 | ||||||
| Hiwin Technologies Corp. |
6,429 | 56,713 | ||||||
| Hon Hai Precision Industry Co., Ltd. GDR |
847,793 | 5,934,551 | ||||||
| Hotai Motor Co., Ltd. |
7,000 | 80,679 | ||||||
See accompanying notes to financial statements.
37
Table of Contents
SPDR MSCI ACWI ex-US ETF
SCHEDULE OF INVESTMENTS (continued)
September 30, 2017
| Security Description |
Shares | Value | ||||||
| HTC Corp. (b) |
51,000 | $ | 127,483 | |||||
| Innolux Corp. |
217,000 | 101,258 | ||||||
| Largan Precision Co., Ltd. |
5,000 | 878,842 | ||||||
| MediaTek, Inc. |
61,000 | 572,302 | ||||||
| Mega Financial Holding Co., Ltd. |
25,948 | 20,280 | ||||||
| Merida Industry Co., Ltd. |
28,000 | 121,884 | ||||||
| OBI Pharma, Inc. (b) |
8,000 | 45,640 | ||||||
| Pegatron Corp. |
48,000 | 124,575 | ||||||
| Phison Electronics Corp. |
18,000 | 213,692 | ||||||
| Pou Chen Corp. |
134,000 | 168,141 | ||||||
| Powertech Technology, Inc. |
151,000 | 435,213 | ||||||
| President Chain Store Corp. |
35,000 | 294,898 | ||||||
| Ruentex Development Co., Ltd. (b) |
42,189 | 38,677 | ||||||
| Siliconware Precision Industries Co., Ltd. ADR (a) |
105,251 | 830,430 | ||||||
| Standard Foods Corp. |
230,822 | 563,277 | ||||||
| Taishin Financial Holding Co., Ltd. |
808,500 | 347,940 | ||||||
| Taiwan Business Bank |
1,872,173 | 509,964 | ||||||
| Taiwan Semiconductor Manufacturing Co., Ltd. ADR |
351,867 | 13,212,606 | ||||||
| Teco Electric and Machinery Co., Ltd. |
372,000 | 333,063 | ||||||
| Transcend Information, Inc. |
134,000 | 378,703 | ||||||
| Uni-President Enterprises Corp. |
348,000 | 728,730 | ||||||
| United Microelectronics Corp. ADR (a) |
793,696 | 1,984,240 | ||||||
| Zhen Ding Technology Holding, Ltd. |
21,000 | 42,521 | ||||||
|
|
|
|||||||
| 38,558,335 | ||||||||
|
|
|
|||||||
| THAILAND — 0.5% |
||||||||
| Bangkok Bank PCL |
194,276 | 1,135,947 | ||||||
| BEC World PCL (f) |
79,500 | 38,856 | ||||||
| Bumrungrad Hospital PCL (f) |
76,300 | 491,889 | ||||||
| Central Pattana PCL (f) |
231,800 | 542,141 | ||||||
| CP ALL PCL NVDR |
349,600 | 699,724 | ||||||
| Delta Electronics Thailand PCL (f) |
72,600 | 189,935 | ||||||
| Indorama Ventures PCL (f) |
42,200 | 53,462 | ||||||
| IRPC PCL (f) |
4,932,600 | 931,795 | ||||||
| Kasikornbank PCL |
61,200 | 392,708 | ||||||
| Minor International PCL (f) |
209,400 | 255,864 | ||||||
| PTT PCL (f) |
111,662 | 1,366,060 | ||||||
| Siam Commercial Bank PCL NVDR |
112,600 | 516,576 | ||||||
| Thai Union Group PCL Class F (f) |
232,600 | 139,490 | ||||||
| TMB Bank PCL (f) |
1,180,800 | 89,224 | ||||||
|
|
|
|||||||
| 6,843,671 | ||||||||
|
|
|
|||||||
| TURKEY — 0.3% |
||||||||
| Akbank Turk AS |
487,340 | 1,288,208 | ||||||
| Emlak Konut Gayrimenkul Yatirim Ortakligi A/S REIT (b) |
889,312 | 670,216 | ||||||
See accompanying notes to financial statements.
38
Table of Contents
SPDR MSCI ACWI ex-US ETF
SCHEDULE OF INVESTMENTS (continued)
September 30, 2017
| Security Description |
Shares | Value | ||||||
| Turkiye Garanti Bankasi A/S |
373,448 | $ | 1,016,556 | |||||
| Turkiye Is Bankasi Class C |
519,000 | 989,517 | ||||||
|
|
|
|||||||
| 3,964,497 | ||||||||
|
|
|
|||||||
| UNITED ARAB EMIRATES — 0.1% |
||||||||
| Abu Dhabi Commercial Bank PJSC |
66,098 | 127,781 | ||||||
| DP World, Ltd. |
9,119 | 204,813 | ||||||
| DXB Entertainments PJSC (b) |
358,911 | 74,271 | ||||||
| Emaar Malls PJSC |
71,379 | 45,284 | ||||||
| Emaar Properties PJSC |
130,890 | 302,576 | ||||||
| Emirates Telecommunications Group Co. PJSC |
13,287 | 62,589 | ||||||
| First Abu Dhabi Bank PJSC |
26,397 | 73,312 | ||||||
|
|
|
|||||||
| 890,626 | ||||||||
|
|
|
|||||||
| UNITED KINGDOM — 11.2% |
||||||||
| 3i Group PLC |
162,903 | 1,995,442 | ||||||
| Anglo American PLC |
101,356 | 1,821,509 | ||||||
| Associated British Foods PLC |
1,791 | 76,724 | ||||||
| AstraZeneca PLC |
86,785 | 5,769,358 | ||||||
| Aviva PLC |
282,545 | 1,950,348 | ||||||
| BAE Systems PLC |
242,120 | 2,051,366 | ||||||
| Barclays PLC |
1,164,005 | 3,019,522 | ||||||
| Barratt Developments PLC |
43,578 | 359,276 | ||||||
| Berkeley Group Holdings PLC |
3,834 | 191,198 | ||||||
| BP PLC |
1,390,467 | 8,904,126 | ||||||
| British American Tobacco PLC |
159,824 | 10,018,068 | ||||||
| British Land Co. PLC REIT |
210,780 | 1,702,413 | ||||||
| BT Group PLC |
549,870 | 2,094,424 | ||||||
| Burberry Group PLC |
51,695 | 1,220,676 | ||||||
| Capita PLC |
48,675 | 368,972 | ||||||
| Centrica PLC |
620,264 | 1,556,171 | ||||||
| CNH Industrial NV |
65,237 | 783,571 | ||||||
| Cobham PLC |
158,481 | 309,796 | ||||||
| Compass Group PLC |
184,532 | 3,919,149 | ||||||
| Diageo PLC |
219,668 | 7,229,421 | ||||||
| Experian PLC |
74,149 | 1,491,235 | ||||||
| Fiat Chrysler Automobiles NV (b) |
101,560 | 1,820,173 | ||||||
| G4S PLC |
114,495 | 427,503 | ||||||
| GlaxoSmithKline PLC |
334,433 | 6,678,780 | ||||||
| Hammerson PLC REIT |
188,155 | 1,355,593 | ||||||
| HSBC Holdings PLC |
1,437,990 | 14,220,715 | ||||||
| Imperial Brands PLC |
88,893 | 3,797,343 | ||||||
| Inmarsat PLC |
7,751 | 66,918 | ||||||
| InterContinental Hotels Group PLC |
13,105 | 694,150 | ||||||
| Intu Properties PLC REIT (a) |
50,093 | 154,913 | ||||||
See accompanying notes to financial statements.
39
Table of Contents
SPDR MSCI ACWI ex-US ETF
SCHEDULE OF INVESTMENTS (continued)
September 30, 2017
| Security Description |
Shares | Value | ||||||
| ITV PLC |
51,957 | $ | 121,780 | |||||
| J Sainsbury PLC |
194,903 | 622,088 | ||||||
| Land Securities Group PLC REIT |
98,172 | 1,280,906 | ||||||
| Legal & General Group PLC |
88,393 | 308,222 | ||||||
| Lloyds Banking Group PLC |
3,945,015 | 3,584,833 | ||||||
| Marks & Spencer Group PLC (a) |
163,381 | 774,653 | ||||||
| National Grid PLC |
352,928 | 4,378,034 | ||||||
| Next PLC |
16,548 | 1,167,805 | ||||||
| Old Mutual PLC |
553,004 | 1,440,843 | ||||||
| Pearson PLC |
87,837 | 721,221 | ||||||
| Persimmon PLC |
14,245 | 493,467 | ||||||
| Prudential PLC |
133,853 | 3,208,265 | ||||||
| Randgold Resources, Ltd. |
5,438 | 533,694 | ||||||
| Reckitt Benckiser Group PLC |
64,685 | 5,912,636 | ||||||
| RELX NV |
118,894 | 2,531,421 | ||||||
| RELX PLC |
127,882 | 2,808,648 | ||||||
| Rio Tinto PLC |
87,215 | 4,063,826 | ||||||
| Rio Tinto, Ltd. (a) |
30,541 | 1,594,324 | ||||||
| Rolls-Royce Holdings PLC (b) |
143,215 | 1,704,321 | ||||||
| Royal Bank of Scotland Group PLC (b) |
214,842 | 773,355 | ||||||
| RSA Insurance Group PLC |
90,844 | 759,318 | ||||||
| Sage Group PLC |
176,595 | 1,654,947 | ||||||
| Segro PLC REIT |
87,990 | 632,757 | ||||||
| Severn Trent PLC |
57,767 | 1,684,142 | ||||||
| Sky PLC |
114,098 | 1,400,678 | ||||||
| Smith & Nephew PLC |
121,768 | 2,202,228 | ||||||
| Smiths Group PLC |
29,174 | 617,258 | ||||||
| SSE PLC |
126,684 | 2,374,419 | ||||||
| Standard Chartered PLC (b) |
199,367 | 1,983,637 | ||||||
| Standard Life Aberdeen PLC |
253,388 | 1,473,718 | ||||||
| Taylor Wimpey PLC |
172,665 | 452,887 | ||||||
| Tesco PLC (b) |
712,105 | 1,788,023 | ||||||
| Unilever NV |
123,317 | 7,295,095 | ||||||
| Unilever PLC |
100,631 | 5,831,149 | ||||||
| United Utilities Group PLC |
85,595 | 981,295 | ||||||
| Vodafone Group PLC |
2,066,175 | 5,788,110 | ||||||
| Whitbread PLC |
12,517 | 632,441 | ||||||
| WPP PLC |
126,132 | 2,343,766 | ||||||
|
|
|
|||||||
| 163,969,063 | ||||||||
|
|
|
|||||||
| UNITED STATES — 0.3% |
||||||||
| Shire PLC |
49,543 | 2,517,859 | ||||||
See accompanying notes to financial statements.
40
Table of Contents
SPDR MSCI ACWI ex-US ETF
SCHEDULE OF INVESTMENTS (continued)
September 30, 2017
| Security Description |
Shares | Value | ||||||
| Valeant Pharmaceuticals International, Inc. (b) |
27,588 | $ | 394,414 | |||||
| Yum China Holdings, Inc. (b) |
20,092 | 803,077 | ||||||
|
|
|
|||||||
| 3,715,350 | ||||||||
|
|
|
|||||||
| TOTAL COMMON STOCKS |
1,451,748,196 | |||||||
|
|
|
|||||||
| SHORT-TERM INVESTMENTS — 1.5% |
||||||||
| State Street Institutional U.S. Government Money Market Fund, Class G Shares 0.96% (h) (i) |
1,559,265 | 1,559,265 | ||||||
| State Street Navigator Securities Lending Government Money Market Portfolio (h) (j) |
19,433,641 | 19,433,641 | ||||||
|
|
|
|||||||
| TOTAL SHORT-TERM INVESTMENTS |
20,992,906 | |||||||
|
|
|
|||||||
| TOTAL INVESTMENTS — 100.8% |
1,472,741,102 | |||||||
|
|
|
|||||||
| LIABILITIES IN EXCESS OF OTHER ASSETS — (0.8)% |
(10,966,530 | ) | ||||||
|
|
|
|||||||
| NET ASSETS — 100.0% |
$ | 1,461,774,572 | ||||||
|
|
|
|||||||
| (a) | All or a portion of the shares of the security are on loan at September 30, 2017. |
| (b) | Non-income producing security. |
| (c) | Reflects separate holdings of the issuer’s common stock traded on different securities exchanges. |
| (d) | Securities purchased pursuant to Rule 144A of the Securities Act of 1933, as amended. These securities, which represent 0.2% of net assets as of September 30, 2017, are considered liquid and may be resold in transactions exempt from registration, normally to qualified institutional buyers. |
| (e) | Fair valued as determined in good faith by the Trust’s Oversight Committee in accordance with policy and procedures approved by the Board of Trustees. Security value is determined based on Level 3 inputs. As of September 30, 2017, total aggregate fair value of the securities is $0, representing less than 0.05% of the Fund’s net assets. |
| (f) | Fair valued as determined in good faith by the Trust’s Oversight Committee in accordance with policy and procedures approved by the Board of Trustees. As of September 30, 2017, total aggregate fair value of securities is $4,181,521 representing 0.3% of net assets. |
| (g) | Amount is less than 0.05% of net assets. |
| (h) | The Fund invested in certain money market funds managed by SSGA Funds Management, Inc. Amounts related to these transactions during the period ended September 30, 2017 are shown in the Affiliate Table below. |
| (i) | The rate shown is the annualized seven-day yield at September 30, 2017. |
| (j) | Investment of cash collateral for securities loaned. |
ADR = American Depositary Receipt
GDR = Global Depositary Receipt
NVDR = Non Voting Depositary Receipt
REIT = Real Estate Investment Trust
See accompanying notes to financial statements.
41
Table of Contents
SPDR MSCI ACWI ex-US ETF
SCHEDULE OF INVESTMENTS (continued)
September 30, 2017
The following table summarizes the value of the Fund’s investments according to the fair value hierarchy as of September 30, 2017.
| Description |
Level 1 — Quoted Prices |
Level 2 — Other Significant Observable Inputs |
Level 3 — Significant Unobservable Inputs |
Total | ||||||||||||
| ASSETS: |
||||||||||||||||
| INVESTMENTS: |
||||||||||||||||
| Common Stocks |
||||||||||||||||
| Australia |
$ | 69,327,539 | $ | — | $ | — | $ | 69,327,539 | ||||||||
| Austria |
4,187,214 | — | — | 4,187,214 | ||||||||||||
| Belgium |
14,079,486 | — | — | 14,079,486 | ||||||||||||
| Brazil |
26,472,160 | — | — | 26,472,160 | ||||||||||||
| Canada |
94,863,759 | — | — | 94,863,759 | ||||||||||||
| Chile |
4,754,565 | — | — | 4,754,565 | ||||||||||||
| China |
101,645,854 | — | 0 | (a) | 101,645,854 | |||||||||||
| Colombia |
1,556,362 | — | — | 1,556,362 | ||||||||||||
| Denmark |
18,754,050 | — | — | 18,754,050 | ||||||||||||
| Egypt |
904,340 | — | — | 904,340 | ||||||||||||
| Finland |
10,432,369 | — | — | 10,432,369 | ||||||||||||
| France |
104,288,653 | — | — | 104,288,653 | ||||||||||||
| Germany |
98,003,556 | — | — | 98,003,556 | ||||||||||||
| Greece |
1,386,590 | — | — | 1,386,590 | ||||||||||||
| Hong Kong |
38,208,373 | — | 0 | (a) | 38,208,373 | |||||||||||
| Hungary |
1,992,305 | — | — | 1,992,305 | ||||||||||||
| India |
27,396,999 | 82,805 | — | 27,479,804 | ||||||||||||
| Indonesia |
7,848,697 | — | — | 7,848,697 | ||||||||||||
| Ireland |
6,442,267 | — | — | 6,442,267 | ||||||||||||
| Israel |
4,928,930 | — | — | 4,928,930 | ||||||||||||
| Italy |
21,196,698 | — | — | 21,196,698 | ||||||||||||
| Japan |
236,273,578 | — | — | 236,273,578 | ||||||||||||
| Luxembourg |
1,528,692 | — | — | 1,528,692 | ||||||||||||
| Macau |
311,013 | — | — | 311,013 | ||||||||||||
| Malaysia |
6,354,131 | — | — | 6,354,131 | ||||||||||||
| Mexico |
13,678,946 | — | — | 13,678,946 | ||||||||||||
| Netherlands |
46,146,782 | — | — | 46,146,782 | ||||||||||||
| New Zealand |
1,471,936 | — | — | 1,471,936 | ||||||||||||
| Norway |
7,573,721 | — | — | 7,573,721 | ||||||||||||
| Peru |
1,740,296 | — | — | 1,740,296 | ||||||||||||
| Philippines |
4,107,695 | — | — | 4,107,695 | ||||||||||||
| Poland |
3,711,794 | — | — | 3,711,794 | ||||||||||||
| Portugal |
1,030,521 | — | — | 1,030,521 | ||||||||||||
| Qatar |
484,703 | — | — | 484,703 | ||||||||||||
See accompanying notes to financial statements.
42
Table of Contents
SPDR MSCI ACWI ex-US ETF
SCHEDULE OF INVESTMENTS (continued)
September 30, 2017
| Description |
Level 1 — Quoted Prices |
Level 2 — Other Significant Observable Inputs |
Level 3 — Significant Unobservable Inputs |
Total | ||||||||||||
| Romania |
$ | 96,618 | $ | — | $ | — | $ | 96,618 | ||||||||
| Russia |
10,762,125 | — | — | 10,762,125 | ||||||||||||
| Singapore |
13,491,888 | — | — | 13,491,888 | ||||||||||||
| South Africa |
21,510,180 | — | — | 21,510,180 | ||||||||||||
| South Korea |
51,767,479 | — | — | 51,767,479 | ||||||||||||
| Spain |
33,887,933 | — | — | 33,887,933 | ||||||||||||
| Sweden |
29,425,215 | — | — | 29,425,215 | ||||||||||||
| Switzerland |
89,697,837 | — | — | 89,697,837 | ||||||||||||
| Taiwan |
38,558,335 | — | — | 38,558,335 | ||||||||||||
| Thailand |
2,744,955 | 4,098,716 | — | 6,843,671 | ||||||||||||
| Turkey |
3,964,497 | — | — | 3,964,497 | ||||||||||||
| United Arab Emirates |
890,626 | — | — | 890,626 | ||||||||||||
| United Kingdom |
163,969,063 | — | — | 163,969,063 | ||||||||||||
| United States |
3,715,350 | — | — | 3,715,350 | ||||||||||||
| Short-Term Investments |
20,992,906 | — | — | 20,992,906 | ||||||||||||
|
|
|
|
|
|
|
|
|
|||||||||
| TOTAL INVESTMENTS |
$ | 1,468,559,581 | $ | 4,181,521 | $ | 0 | $ | 1,472,741,102 | ||||||||
|
|
|
|
|
|
|
|
|
|||||||||
| (a) | Fund held Level 3 securities that were valued at $0 at September 30, 2017. |
Affiliate Table
| Number of Shares Held at 9/30/16 |
Value at 9/30/16 |
Cost of Purchases |
Proceeds from Shares Sold |
Realized Gain (Loss) |
Change in Unrealized Appreciation/ Depreciation |
Number of Shares Held at 9/30/17 |
Value at 9/30/17 |
Dividend Income |
||||||||||||||||||||||||||||
| State Street Institutional U.S. Government Money Market Fund, Class G Shares |
— | $ | — | $ | 30,618,484 | $ | 29,059,219 | $ | — | $ | — | 1,559,265 | $ | 1,559,265 | $ | 9,305 | ||||||||||||||||||||
| State Street Institutional U.S. Government Money Market Fund, Premier Class |
809,652 | 809,652 | 24,262,565 | 25,072,217 | — | — | — | — | 2,991 | |||||||||||||||||||||||||||
| State Street Navigator Securities Lending Government Money Market Portfolio* |
23,136,429 | 23,136,429 | 257,453,612 | 261,156,400 | — | — | 19,433,641 | 19,433,641 | 252,683 | |||||||||||||||||||||||||||
|
|
|
|
|
|
|
|
|
|
|
|
|
|
|
|||||||||||||||||||||||
| Total |
$ | 23,946,081 | $ | 312,334,661 | $ | 315,287,836 | $ | — | $ | — | $ | 20,992,906 | $ | 264,979 | ||||||||||||||||||||||
|
|
|
|
|
|
|
|
|
|
|
|
|
|
|
|||||||||||||||||||||||
| * | Effective October 5, 2016, the name of State Street Navigator Securities Lending Prime Portfolio was changed to State Street Navigator Securities Lending Government Money Market Portfolio. |
See accompanying notes to financial statements.
43
Table of Contents
SPDR S&P International Dividend ETF
SCHEDULE OF INVESTMENTS
September 30, 2017
| Security Description |
Shares | Value | ||||||
| COMMON STOCKS — 99.5% |
||||||||
| AUSTRALIA — 11.5% |
||||||||
| AusNet Services |
5,299,372 | $ | 7,027,275 | |||||
| carsales.com, Ltd. |
676,862 | 6,814,008 | ||||||
| Charter Hall Group REIT |
940,601 | 3,963,287 | ||||||
| Commonwealth Bank of Australia |
313,361 | 18,502,367 | ||||||
| DuluxGroup, Ltd. |
1,796,939 | 9,869,774 | ||||||
| Goodman Group REIT |
730,022 | 4,719,967 | ||||||
| GPT Group REIT |
1,860,082 | 7,239,184 | ||||||
| Investa Office Fund REIT |
1,104,283 | 3,899,139 | ||||||
| Mirvac Group REIT |
4,106,457 | 7,378,679 | ||||||
| Sonic Healthcare, Ltd. |
733,878 | 12,040,755 | ||||||
| Stockland REIT |
2,454,039 | 8,279,913 | ||||||
| Transurban Group |
2,124,529 | 19,804,092 | ||||||
| Vicinity Centres REIT |
4,576,882 | 9,552,723 | ||||||
| Westpac Banking Corp. |
1,009,112 | 25,274,239 | ||||||
|
|
|
|||||||
| 144,365,402 | ||||||||
|
|
|
|||||||
| BELGIUM — 0.8% |
||||||||
| bpost SA |
348,099 | 10,349,789 | ||||||
|
|
|
|||||||
| CANADA — 14.3% |
||||||||
| BCE, Inc. |
437,307 | 20,441,344 | ||||||
| Canadian Imperial Bank of Commerce |
232,172 | 20,266,435 | ||||||
| Emera, Inc. (a) |
490,983 | 18,553,438 | ||||||
| Fortis, Inc. |
413,961 | 14,822,031 | ||||||
| H&R Real Estate Investment Trust |
240,725 | 4,146,017 | ||||||
| Intact Financial Corp. |
139,777 | 11,519,462 | ||||||
| Power Corp. of Canada |
818,474 | 20,752,257 | ||||||
| Royal Bank of Canada |
199,495 | 15,399,390 | ||||||
| Smart Real Estate Investment Trust REIT |
132,331 | 3,115,040 | ||||||
| Sun Life Financial, Inc. |
408,431 | 16,227,511 | ||||||
| TELUS Corp. |
505,711 | 18,147,611 | ||||||
| Toronto-Dominion Bank |
281,458 | 15,809,719 | ||||||
|
|
|
|||||||
| 179,200,255 | ||||||||
|
|
|
|||||||
| FINLAND — 1.2% |
||||||||
| Kone Oyj Class B |
289,458 | 15,330,429 | ||||||
|
|
|
|||||||
| FRANCE — 2.3% |
||||||||
| Bureau Veritas SA |
517,043 | 13,346,598 | ||||||
See accompanying notes to financial statements.
44
Table of Contents
SPDR S&P International Dividend ETF
SCHEDULE OF INVESTMENTS (continued)
September 30, 2017
| Security Description |
Shares | Value | ||||||
| Danone SA |
143,657 | $ | 11,271,698 | |||||
| ICADE REIT |
48,938 | 4,366,277 | ||||||
|
|
|
|||||||
| 28,984,573 | ||||||||
|
|
|
|||||||
| GERMANY — 6.2% |
||||||||
| Axel Springer SE |
233,203 | 14,989,398 | ||||||
| Deutsche EuroShop AG (a) |
276,987 | 10,390,111 | ||||||
| Deutsche Post AG |
349,894 | 15,579,919 | ||||||
| Fielmann AG |
91,787 | 7,954,908 | ||||||
| Muenchener Rueckversicherungs-Gesellschaft AG in Muenchen |
99,414 | 21,260,665 | ||||||
| Talanx AG |
175,751 | 7,106,866 | ||||||
|
|
|
|||||||
| 77,281,867 | ||||||||
|
|
|
|||||||
| HONG KONG — 6.9% |
||||||||
| CK Infrastructure Holdings, Ltd. |
1,745,500 | 15,017,553 | ||||||
| CLP Holdings, Ltd. |
1,381,500 | 14,158,664 | ||||||
| Hang Seng Bank, Ltd. |
766,900 | 18,694,581 | ||||||
| Link REIT |
693,000 | 5,616,257 | ||||||
| Power Assets Holdings, Ltd. |
1,926,500 | 16,685,793 | ||||||
| Sino Land Co., Ltd. |
4,288,181 | 7,532,467 | ||||||
| Yue Yuen Industrial Holdings, Ltd. |
2,208,500 | 8,397,768 | ||||||
|
|
|
|||||||
| 86,103,083 | ||||||||
|
|
|
|||||||
| ITALY — 1.4% |
||||||||
| Atlantia SpA |
559,450 | 17,665,498 | ||||||
|
|
|
|||||||
| JAPAN — 6.5% |
||||||||
| Activia Properties, Inc. REIT |
1,031 | 4,277,324 | ||||||
| Advance Residence Investment Corp. |
2,021 | 4,969,687 | ||||||
| Daiwa House REIT Investment Corp. |
2,095 | 5,013,930 | ||||||
| GLP J - REIT |
3,960 | 4,126,576 | ||||||
| Hikari Tsushin, Inc. |
88,800 | 11,123,173 | ||||||
| Japan Prime Realty Investment Corp. REIT |
1,428 | 4,769,937 | ||||||
| Japan Real Estate Investment Corp. REIT |
830 | 3,989,073 | ||||||
| Japan Retail Fund Investment Corp. REIT |
3,033 | 5,440,081 | ||||||
| Kenedix Office Investment Corp. REIT |
777 | 4,272,758 | ||||||
| Lawson, Inc. (a) |
203,100 | 13,441,967 | ||||||
| Nippon Building Fund, Inc. REIT |
837 | 4,171,430 | ||||||
| Nippon Prologis REIT, Inc. |
2,432 | 5,122,615 | ||||||
| Orix JREIT, Inc. REIT |
3,651 | 5,238,187 | ||||||
| United Urban Investment Corp. REIT |
3,806 | 5,572,148 | ||||||
|
|
|
|||||||
| 81,528,886 | ||||||||
|
|
|
|||||||
| MALAYSIA — 2.7% |
||||||||
| Gamuda Bhd |
7,341,700 | 9,180,385 | ||||||
See accompanying notes to financial statements.
45
Table of Contents
SPDR S&P International Dividend ETF
SCHEDULE OF INVESTMENTS (continued)
September 30, 2017
| Security Description |
Shares | Value | ||||||
| Public Bank Bhd |
2,540,400 | $ | 12,297,401 | |||||
| Tenaga Nasional Bhd |
3,549,600 | 12,037,957 | ||||||
|
|
|
|||||||
| 33,515,743 | ||||||||
|
|
|
|||||||
| NEW ZEALAND — 0.9% |
||||||||
| Spark New Zealand, Ltd. |
4,374,197 | 11,541,692 | ||||||
|
|
|
|||||||
| PORTUGAL — 2.4% |
||||||||
| EDP - Energias de Portugal SA |
8,052,258 | 30,319,208 | ||||||
|
|
|
|||||||
| RUSSIA — 2.3% |
||||||||
| Gazprom PJSC ADR |
6,878,615 | 28,821,397 | ||||||
|
|
|
|||||||
| SINGAPORE — 3.2% |
||||||||
| CapitaLand, Ltd. |
3,422,900 | 9,023,883 | ||||||
| Singapore Exchange, Ltd. |
2,253,600 | 12,264,151 | ||||||
| Singapore Telecommunications, Ltd. |
6,755,400 | 18,306,913 | ||||||
|
|
|
|||||||
| 39,594,947 | ||||||||
|
|
|
|||||||
| SOUTH AFRICA — 1.3% |
||||||||
| AVI, Ltd. |
929,485 | 6,739,240 | ||||||
| Shoprite Holdings, Ltd. |
652,908 | 10,004,083 | ||||||
|
|
|
|||||||
| 16,743,323 | ||||||||
|
|
|
|||||||
| SPAIN — 5.0% |
||||||||
| Enagas SA |
848,731 | 23,905,273 | ||||||
| Iberdrola SA |
2,400,334 | 18,649,190 | ||||||
| Red Electrica Corp. SA |
928,960 | 19,526,279 | ||||||
|
|
|
|||||||
| 62,080,742 | ||||||||
|
|
|
|||||||
| SWEDEN — 3.5% |
||||||||
| ICA Gruppen AB |
343,100 | 12,866,749 | ||||||
| Intrum Justitia AB (a) |
361,711 | 12,762,595 | ||||||
| Skanska AB Class B |
755,475 | 17,465,330 | ||||||
|
|
|
|||||||
| 43,094,674 | ||||||||
|
|
|
|||||||
| SWITZERLAND — 9.9% |
||||||||
| Baloise Holding AG |
94,296 | 14,929,875 | ||||||
| Helvetia Holding AG |
21,216 | 11,533,295 | ||||||
| Nestle SA |
134,105 | 11,240,094 | ||||||
| PSP Swiss Property AG |
107,986 | 9,954,890 | ||||||
| Roche Holding AG Bearer Shares |
34,251 | 8,725,580 | ||||||
| Schindler Holding AG |
48,009 | 10,612,986 | ||||||
| Swiss Prime Site AG (b) |
148,387 | 13,349,616 | ||||||
See accompanying notes to financial statements.
46
Table of Contents
SPDR S&P International Dividend ETF
SCHEDULE OF INVESTMENTS (continued)
September 30, 2017
| Security Description |
Shares | Value | ||||||
| Swiss Re AG |
249,083 | $ | 22,576,043 | |||||
| Swisscom AG |
40,922 | 20,985,424 | ||||||
|
|
|
|||||||
| 123,907,803 | ||||||||
|
|
|
|||||||
| TAIWAN — 2.0% |
||||||||
| Hua Nan Financial Holdings Co., Ltd. |
13,730,350 | 7,448,366 | ||||||
| Taiwan Mobile Co., Ltd. |
4,961,000 | 17,668,777 | ||||||
|
|
|
|||||||
| 25,117,143 | ||||||||
|
|
|
|||||||
| THAILAND — 1.3% |
||||||||
| Bangkok Bank PCL (c) |
210,800 | 1,178,837 | ||||||
| Bangkok Bank PCL (c) |
2,348,072 | 13,729,356 | ||||||
| Bangkok Bank PCL NVDR |
198,100 | 1,107,816 | ||||||
|
|
|
|||||||
| 16,016,009 | ||||||||
|
|
|
|||||||
| UNITED KINGDOM — 13.9% |
||||||||
| Diageo PLC |
378,084 | 12,442,997 | ||||||
| Experian PLC |
563,153 | 11,325,756 | ||||||
| Imperial Brands PLC |
427,402 | 18,257,814 | ||||||
| Kingfisher PLC |
3,734,889 | 14,957,575 | ||||||
| National Grid PLC |
1,599,083 | 19,836,455 | ||||||
| Pennon Group PLC |
1,648,151 | 17,623,594 | ||||||
| RELX PLC |
429,870 | 9,441,152 | ||||||
| Segro PLC REIT |
706,061 | 5,077,456 | ||||||
| SSE PLC |
1,376,101 | 25,792,051 | ||||||
| Ultra Electronics Holdings PLC |
269,999 | 6,513,149 | ||||||
| United Utilities Group PLC |
1,639,105 | 18,791,351 | ||||||
| WPP PLC |
723,609 | 13,445,993 | ||||||
|
|
|
|||||||
| 173,505,343 | ||||||||
|
|
|
|||||||
| TOTAL COMMON STOCKS (Cost $1,201,686,140) |
1,245,067,806 | |||||||
|
|
|
|||||||
| SHORT-TERM INVESTMENTS — 0.1% |
||||||||
| State Street Institutional U.S. Government Money Market Fund, Class G Shares 0.96% (d) (e) |
870,594 | 870,594 | ||||||
| State Street Navigator Securities Lending Government Money Market Portfolio (d) (f) |
513,248 | 513,248 | ||||||
|
|
|
|||||||
| TOTAL SHORT-TERM INVESTMENTS (Cost $1,383,842) |
1,383,842 | |||||||
|
|
|
|||||||
| TOTAL INVESTMENTS — 99.6% (Cost $1,203,069,982) |
1,246,451,648 | |||||||
|
|
|
|||||||
| OTHER ASSETS IN EXCESS OF LIABILITIES — 0.4% |
5,509,914 | |||||||
|
|
|
|||||||
| NET ASSETS — 100.0% |
$ | 1,251,961,562 | ||||||
|
|
|
|||||||
See accompanying notes to financial statements.
47
Table of Contents
SPDR S&P International Dividend ETF
SCHEDULE OF INVESTMENTS (continued)
September 30, 2017
| (a) | All or a portion of the shares of the security are on loan at September 30, 2017. |
| (b) | Non-income producing security. |
| (c) | Reflects separate holdings of the issuer’s common stock traded on different securities exchanges. |
| (d) | The Fund invested in certain money market funds managed by SSGA Funds Management, Inc. Amounts related to these transactions during the period ended September 30, 2017 are shown in the Affiliate Table below. |
| (e) | The rate shown is the annualized seven-day yield at September 30, 2017. |
| (f) | Investment of cash collateral for securities loaned. |
| ADR | = | American Depositary Receipt | ||
| NVDR | = | Non Voting Depositary Receipt | ||
| REIT | = | Real Estate Investment Trust |
See accompanying notes to financial statements.
48
Table of Contents
SPDR S&P International Dividend ETF
SCHEDULE OF INVESTMENTS (continued)
September 30, 2017
The following table summarizes the value of the Fund’s investments according to the fair value hierarchy as of September 30, 2017.
| Description |
Level 1 — Quoted Prices |
Level 2 — Other Significant Observable Inputs |
Level 3 — Significant Unobservable Inputs |
Total | ||||||||||||
| ASSETS: |
||||||||||||||||
| INVESTMENTS: |
||||||||||||||||
| Common Stocks |
||||||||||||||||
| Australia |
$ | 144,365,402 | $ | — | $ | — | $ | 144,365,402 | ||||||||
| Belgium |
10,349,789 | — | — | 10,349,789 | ||||||||||||
| Canada |
179,200,255 | — | — | 179,200,255 | ||||||||||||
| Finland |
15,330,429 | — | — | 15,330,429 | ||||||||||||
| France |
28,984,573 | — | — | 28,984,573 | ||||||||||||
| Germany |
77,281,867 | — | — | 77,281,867 | ||||||||||||
| Hong Kong |
86,103,083 | — | — | 86,103,083 | ||||||||||||
| Italy |
17,665,498 | — | — | 17,665,498 | ||||||||||||
| Japan |
81,528,886 | — | — | 81,528,886 | ||||||||||||
| Malaysia |
33,515,743 | — | — | 33,515,743 | ||||||||||||
| New Zealand |
11,541,692 | — | — | 11,541,692 | ||||||||||||
| Portugal |
30,319,208 | — | — | 30,319,208 | ||||||||||||
| Russia |
28,821,397 | — | — | 28,821,397 | ||||||||||||
| Singapore |
39,594,947 | — | — | 39,594,947 | ||||||||||||
| South Africa |
16,743,323 | — | — | 16,743,323 | ||||||||||||
| Spain |
62,080,742 | — | — | 62,080,742 | ||||||||||||
| Sweden |
43,094,674 | — | — | 43,094,674 | ||||||||||||
| Switzerland |
123,907,803 | — | — | 123,907,803 | ||||||||||||
| Taiwan |
25,117,143 | — | — | 25,117,143 | ||||||||||||
| Thailand |
16,016,009 | — | — | 16,016,009 | ||||||||||||
| United Kingdom |
173,505,343 | — | — | 173,505,343 | ||||||||||||
| Short-Term Investments |
1,383,842 | — | — | 1,383,842 | ||||||||||||
|
|
|
|
|
|
|
|
|
|||||||||
| TOTAL INVESTMENTS |
$ | 1,246,451,648 | $ | — | $ | — | $ | 1,246,451,648 | ||||||||
|
|
|
|
|
|
|
|
|
|||||||||
See accompanying notes to financial statements.
49
Table of Contents
SPDR S&P International Dividend ETF
SCHEDULE OF INVESTMENTS (continued)
September 30, 2017
Affiliate Table
| Number of Shares Held at 9/30/16 |
Value at 9/30/16 |
Cost of Purchases |
Proceeds from Shares Sold |
Realized Gain (Loss) |
Change in Unrealized Appreciation/ Depreciation |
Number of Shares Held at 9/30/17 |
Value at 9/30/17 |
Dividend Income |
||||||||||||||||||||||||||||
| State Street Institutional Liquid Reserves Fund, Premier Class |
34,299 | $ | 34,299 | $ | 957 | $ | 35,256 | $ | — | $ | — | — | $ | — | $ | — | ||||||||||||||||||||
| State Street Institutional U.S. Government Money Market Fund, Class G Shares |
— | — | 94,096,970 | 93,226,376 | — | — | 870,594 | 870,594 | 11,710 | |||||||||||||||||||||||||||
| State Street Institutional U.S. Government Money Market Fund, Premier Class |
— | — | 92,524,112 | 92,524,112 | — | — | — | — | 6,955 | |||||||||||||||||||||||||||
| State Street Navigator Securities Lending Government Money Market Portfolio* |
85,141,270 | 85,141,270 | 547,348,412 | 631,976,434 | — | — | 513,248 | 513,248 | 523,392 | |||||||||||||||||||||||||||
|
|
|
|
|
|
|
|
|
|
|
|
|
|
|
|||||||||||||||||||||||
| Total |
$ | 85,175,569 | $ | 733,970,451 | $ | 817,762,178 | $ | — | $ | — | $ | 1,383,842 | $ | 542,057 | ||||||||||||||||||||||
|
|
|
|
|
|
|
|
|
|
|
|
|
|
|
|||||||||||||||||||||||
| * | Effective October 5, 2016, the name of State Street Navigator Securities Lending Prime Portfolio was changed to State Street Navigator Securities Lending Government Money Market Portfolio. |
See accompanying notes to financial statements.
50
Table of Contents
STATEMENTS OF ASSETS AND LIABILITIES
September 30, 2017
| SPDR EURO STOXX 50 ETF |
SPDR MSCI ACWI ex-US ETF |
|||||||
| ASSETS |
||||||||
| Investments in unaffiliated issuers, at value* (Note 2) |
$ | 4,547,254,361 | $ | 1,451,748,196 | ||||
| Investments in affiliated issuers, at value (Notes 2 and 3) |
2,820,768 | 20,992,906 | ||||||
|
|
|
|
|
|||||
| Total Investments |
4,550,075,129 | 1,472,741,102 | ||||||
| Foreign currency, at value |
3,760,253 | 6,093,734 | ||||||
| Cash |
1 | — | ||||||
| Receivable for investments sold |
— | 31,705 | ||||||
| Receivable for fund shares sold |
24,490,982 | — | ||||||
| Dividends receivable — unaffiliated issuers (Note 2) |
2,795,676 | 3,411,547 | ||||||
| Dividends receivable — affiliated issuers (Notes 2 and 3) |
3,743 | 1,008 | ||||||
| Securities lending income receivable — unaffiliated issuers (Note 8) |
1,371 | 4,945 | ||||||
| Securities lending income receivable — affiliated issuers (Notes 3 and 8) |
6,495 | 12,966 | ||||||
| Receivable from Adviser (Note 3) |
— | 160,306 | ||||||
| Receivable for foreign taxes recoverable |
4,816,705 | 305,845 | ||||||
| Other Receivable |
30,970 | 3,519 | ||||||
|
|
|
|
|
|||||
| TOTAL ASSETS |
4,585,981,325 | 1,482,766,677 | ||||||
|
|
|
|
|
|||||
| LIABILITIES |
||||||||
| Due to custodian (Note 3) |
— | 3,358 | ||||||
| Payable upon return of securities loaned |
2,656,640 | 19,433,641 | ||||||
| Payable for investments purchased |
24,491,789 | 215,869 | ||||||
| Deferred foreign taxes payable |
— | 140,261 | ||||||
| Advisory fee payable (Note 3) |
3,161,517 | 1,198,384 | ||||||
| Trustees’ fees and expenses payable (Note 4) |
4,321 | 592 | ||||||
|
|
|
|
|
|||||
| TOTAL LIABILITIES |
30,314,267 | 20,992,105 | ||||||
|
|
|
|
|
|||||
| NET ASSETS |
$ | 4,555,667,058 | $ | 1,461,774,572 | ||||
|
|
|
|
|
|||||
| NET ASSETS CONSIST OF: |
||||||||
| Paid-in Capital (Note 6) |
$ | 4,638,204,827 | $ | 1,452,200,915 | ||||
| Undistributed (distribution in excess of) net investment income (loss) |
— | 9,518,243 | ||||||
| Accumulated net realized gain (loss) on investments and foreign currency transactions |
(368,245,513 | ) | (100,969,882 | ) | ||||
| Net unrealized appreciation (depreciation) on: |
||||||||
| Investments — unaffiliated issuers** |
285,392,868 | 101,002,664 | ||||||
| Foreign currency translations |
314,876 | 22,632 | ||||||
|
|
|
|
|
|||||
| NET ASSETS |
$ | 4,555,667,058 | $ | 1,461,774,572 | ||||
|
|
|
|
|
|||||
| NET ASSET VALUE PER SHARE |
||||||||
| Net asset value per share |
$ | 41.30 | $ | 37.67 | ||||
|
|
|
|
|
|||||
| Shares outstanding (unlimited amount authorized, $0.01 par value) |
110,300,967 | 38,800,000 | ||||||
|
|
|
|
|
|||||
| COST OF INVESTMENTS: |
||||||||
| Investments in unaffiliated issuers |
$ | 4,261,861,493 | $ | 1,350,605,271 | ||||
| Investments in affiliated issuers |
2,820,768 | 20,992,906 | ||||||
|
|
|
|
|
|||||
| Total cost of investments |
$ | 4,264,682,261 | $ | 1,371,598,177 | ||||
|
|
|
|
|
|||||
| Foreign currency, at cost |
$ | 3,787,872 | $ | 6,098,006 | ||||
|
|
|
|
|
|||||
| * Includes investments in securities on loan, at value |
$ | 2,433,203 | $ | 49,186,246 | ||||
|
|
|
|
|
|||||
| ** Includes deferred foreign taxes |
$ | — | $ | 140,261 | ||||
|
|
|
|
|
|||||
See accompanying notes to financial statements.
51
Table of Contents
SPDR INDEX SHARES FUNDS
STATEMENTS OF ASSETS AND LIABILITIES (continued)
September 30, 2017
| SPDR S&P International Dividend ETF |
||||
| ASSETS |
||||
| Investments in unaffiliated issuers, at value* (Note 2) |
$ | 1,245,067,806 | ||
| Investments in affiliated issuers, at value (Notes 2 and 3) |
1,383,842 | |||
|
|
|
|||
| Total Investments |
1,246,451,648 | |||
| Foreign currency, at value |
2,880,257 | |||
| Cash |
27 | |||
| Receivable for fund shares sold |
4,003,325 | |||
| Dividends receivable — unaffiliated issuers (Note 2) |
3,555,006 | |||
| Dividends receivable — affiliated issuers (Notes 2 and 3) |
3,637 | |||
| Securities lending income receivable — unaffiliated issuers (Note 8) |
36,510 | |||
| Securities lending income receivable — affiliated issuers (Notes 3 and 8) |
16,994 | |||
| Receivable for foreign taxes recoverable |
558,662 | |||
|
|
|
|||
| TOTAL ASSETS |
1,257,506,066 | |||
|
|
|
|||
| LIABILITIES |
||||
| Payable upon return of securities loaned |
513,248 | |||
| Payable for investments purchased |
3,629,954 | |||
| Advisory fee payable (Note 3) |
1,400,051 | |||
| Trustees’ fees and expenses payable (Note 4) |
1,251 | |||
|
|
|
|||
| TOTAL LIABILITIES |
5,544,504 | |||
|
|
|
|||
| NET ASSETS |
$ | 1,251,961,562 | ||
|
|
|
|||
| NET ASSETS CONSIST OF: |
||||
| Paid-in Capital (Note 6) |
$ | 1,629,444,114 | ||
| Undistributed (distribution in excess of) net investment income (loss) |
5,335,031 | |||
| Accumulated net realized gain (loss) on investments and foreign currency transactions |
(426,162,008 | ) | ||
| Net unrealized appreciation (depreciation) on: |
||||
| Investments — unaffiliated issuers |
43,381,666 | |||
| Foreign currency translations |
(37,241 | ) | ||
|
|
|
|||
| NET ASSETS |
$ | 1,251,961,562 | ||
|
|
|
|||
| NET ASSET VALUE PER SHARE |
||||
| Net asset value per share |
$ | 40.25 | ||
|
|
|
|||
| Shares outstanding (unlimited amount authorized, $0.01 par value) |
31,101,326 | |||
|
|
|
|||
| COST OF INVESTMENTS: |
||||
| Investments in unaffiliated issuers |
$ | 1,201,686,140 | ||
| Investments in affiliated issuers |
1,383,842 | |||
|
|
|
|||
| Total cost of investments |
$ | 1,203,069,982 | ||
|
|
|
|||
| Foreign currency, at cost |
$ | 2,892,049 | ||
|
|
|
|||
| * Includes investments in securities on loan, at value |
$ | 12,121,687 | ||
|
|
|
|||
See accompanying notes to financial statements.
52
Table of Contents
SPDR INDEX SHARES FUNDS
STATEMENTS OF OPERATIONS
For the Year Ended September 30, 2017
| SPDR EURO STOXX 50 ETF |
SPDR MSCI ACWI ex-US ETF |
|||||||
| INVESTMENT INCOME |
||||||||
| Dividend income — unaffiliated issuers (Note 2) |
$ | 104,965,185 | $ | 33,790,399 | ||||
| Dividend income — affiliated issuers (Notes 2 and 3) |
21,344 | 12,296 | ||||||
| Dividend income — non-cash transactions |
6,425,133 | 4,342,554 | ||||||
| Unaffiliated securities lending income (Note 8) |
129,371 | 83,850 | ||||||
| Affiliated securities lending income (Notes 3 and 8) |
1,560,906 | 252,683 | ||||||
| Foreign taxes withheld |
(14,712,714 | ) | (4,455,437 | ) | ||||
|
|
|
|
|
|||||
| TOTAL INVESTMENT INCOME (LOSS) |
98,389,225 | 34,026,345 | ||||||
|
|
|
|
|
|||||
| EXPENSES |
||||||||
| Advisory fee (Note 3) |
9,129,597 | 3,960,041 | ||||||
| Trustees’ fees and expenses (Note 4) |
48,315 | 17,480 | ||||||
| Miscellaneous expenses |
42,922 | 14,698 | ||||||
|
|
|
|
|
|||||
| TOTAL EXPENSES |
9,220,834 | 3,992,219 | ||||||
|
|
|
|
|
|||||
| Expenses waived/reimbursed by the Adviser (Note 3) |
— | (496,100 | ) | |||||
|
|
|
|
|
|||||
| NET EXPENSES |
9,220,834 | 3,496,119 | ||||||
|
|
|
|
|
|||||
| NET INVESTMENT INCOME (LOSS) |
89,168,391 | 30,530,226 | ||||||
|
|
|
|
|
|||||
| REALIZED AND UNREALIZED GAIN (LOSS) |
||||||||
| Net realized gain (loss) on: |
||||||||
| Investments — unaffiliated issuers |
(30,730,944 | ) | (2,568,713 | ) | ||||
| In-kind redemptions — unaffiliated issuers |
(17,150,660 | ) | — | |||||
| Foreign currency transactions |
393,041 | (111,245 | ) | |||||
|
|
|
|
|
|||||
| Net realized gain (loss) |
(47,488,563 | ) | (2,679,958 | ) | ||||
|
|
|
|
|
|||||
| Net change in unrealized appreciation/depreciation on: |
||||||||
| Investments — unaffiliated issuers* |
767,294,458 | 194,865,923 | ||||||
| Foreign currency translations |
350,971 | 49,345 | ||||||
|
|
|
|
|
|||||
| Net change in unrealized appreciation/depreciation |
767,645,429 | 194,915,268 | ||||||
|
|
|
|
|
|||||
| NET REALIZED AND UNREALIZED GAIN (LOSS) |
720,156,866 | 192,235,310 | ||||||
|
|
|
|
|
|||||
| NET INCREASE (DECREASE) IN NET ASSETS FROM OPERATIONS |
$ | 809,325,257 | $ | 222,765,536 | ||||
|
|
|
|
|
|||||
| * Includes foreign deferred taxes |
$ | — | $ | 8,135 | ||||
|
|
|
|
|
|||||
See accompanying notes to financial statements.
53
Table of Contents
SPDR INDEX SHARES FUNDS
STATEMENTS OF OPERATIONS (continued)
For the Year Ended September 30, 2017
| SPDR S&P International Dividend ETF |
||||
| INVESTMENT INCOME |
||||
| Dividend income — unaffiliated issuers (Note 2) |
$ | 49,623,290 | ||
| Dividend income — affiliated issuers (Notes 2 and 3) |
18,665 | |||
| Dividend income — non-cash transactions |
4,456,026 | |||
| Unaffiliated securities lending income (Note 8) |
196,921 | |||
| Affiliated securities lending income (Notes 3 and 8) |
523,392 | |||
| Foreign taxes withheld |
(5,382,127 | ) | ||
|
|
|
|||
| TOTAL INVESTMENT INCOME (LOSS) |
49,436,167 | |||
|
|
|
|||
| EXPENSES |
||||
| Advisory fee (Note 3) |
5,054,474 | |||
| Trustees’ fees and expenses (Note 4) |
18,806 | |||
| Miscellaneous expenses |
32,794 | |||
|
|
|
|||
| TOTAL EXPENSES |
5,106,074 | |||
|
|
|
|||
| NET EXPENSES |
5,106,074 | |||
|
|
|
|||
| NET INVESTMENT INCOME (LOSS) |
44,330,093 | |||
|
|
|
|||
| REALIZED AND UNREALIZED GAIN (LOSS) |
||||
| Net realized gain (loss) on: |
||||
| Investments — unaffiliated issuers* |
66,345,960 | |||
| In-kind redemptions — unaffiliated issuers |
11,028,129 | |||
| Foreign currency transactions |
89,951 | |||
|
|
|
|||
| Net realized gain (loss) |
77,464,040 | |||
|
|
|
|||
| Net change in unrealized appreciation/depreciation on: |
||||
| Investments — unaffiliated issuers** |
45,346,291 | |||
| Foreign currency translations |
(9,917 | ) | ||
|
|
|
|||
| Net change in unrealized appreciation/depreciation |
45,336,374 | |||
|
|
|
|||
| NET REALIZED AND UNREALIZED GAIN (LOSS) |
122,800,414 | |||
|
|
|
|||
| NET INCREASE (DECREASE) IN NET ASSETS FROM OPERATIONS |
$ | 167,130,507 | ||
|
|
|
|||
| * Includes foreign capital gain taxes |
$ | (61,846 | ) | |
|
|
|
|||
| ** Includes foreign deferred taxes |
$ | 7,238 | ||
|
|
|
|||
See accompanying notes to financial statements.
54
Table of Contents
SPDR INDEX SHARES FUNDS
STATEMENTS OF CHANGES IN NET ASSETS
| SPDR EURO STOXX 50 ETF | ||||||||
| Year Ended 9/30/17 |
Year Ended 9/30/16 |
|||||||
| INCREASE (DECREASE) IN NET ASSETS FROM OPERATIONS: |
||||||||
| Net investment income (loss) |
$ | 89,168,391 | $ | 104,577,239 | ||||
| Net realized gain (loss) |
(47,488,563 | ) | (195,079,777 | ) | ||||
| Net change in unrealized appreciation/depreciation |
767,645,429 | 73,088,643 | ||||||
|
|
|
|
|
|||||
| Net increase (decrease) in net assets resulting from operations |
809,325,257 | (17,413,895 | ) | |||||
|
|
|
|
|
|||||
| Net equalization credits and charges (Note 2) |
11,045,586 | (5,772,043 | ) | |||||
|
|
|
|
|
|||||
| DISTRIBUTIONS TO SHAREHOLDERS FROM: |
||||||||
| Net investment income |
(96,010,453 | ) | (104,977,475 | ) | ||||
|
|
|
|
|
|||||
| FROM BENEFICIAL INTEREST TRANSACTIONS: |
||||||||
| Proceeds from sale of shares sold |
1,783,480,945 | 221,677,717 | ||||||
| Cost of shares redeemed |
(479,844,142 | ) | (1,604,991,739 | ) | ||||
| Net income equalization (Note 2) |
(11,045,586 | ) | 5,772,043 | |||||
|
|
|
|
|
|||||
| Net increase (decrease) in net assets from beneficial interest transactions |
1,292,591,217 | (1,377,541,979 | ) | |||||
|
|
|
|
|
|||||
| Net increase (decrease) in net assets during the period |
2,016,951,607 | (1,505,705,392 | ) | |||||
| Net assets at beginning of period |
2,538,715,451 | 4,044,420,843 | ||||||
|
|
|
|
|
|||||
| NET ASSETS AT END OF PERIOD |
$ | 4,555,667,058 | $ | 2,538,715,451 | ||||
|
|
|
|
|
|||||
| SHARES OF BENEFICIAL INTEREST: |
||||||||
| Shares sold |
46,900,000 | 7,350,000 | ||||||
| Shares redeemed |
(14,100,000 | ) | (49,600,000 | ) | ||||
|
|
|
|
|
|||||
| Net increase (decrease) |
32,800,000 | (42,250,000 | ) | |||||
|
|
|
|
|
|||||
See accompanying notes to financial statements.
55
Table of Contents
SPDR INDEX SHARES FUNDS
STATEMENTS OF CHANGES IN NET ASSETS (continued)
| SPDR MSCI ACWI ex-US ETF | ||||||||
| Year Ended 9/30/17 |
Year Ended 9/30/16 |
|||||||
| INCREASE (DECREASE) IN NET ASSETS FROM OPERATIONS: |
||||||||
| Net investment income (loss) |
$ | 30,530,226 | $ | 21,504,119 | ||||
| Net realized gain (loss) |
(2,679,958 | ) | (15,298,989 | ) | ||||
| Net change in unrealized appreciation/depreciation |
194,915,268 | 55,379,547 | ||||||
|
|
|
|
|
|||||
| Net increase (decrease) in net assets resulting from operations |
222,765,536 | 61,584,677 | ||||||
|
|
|
|
|
|||||
| DISTRIBUTIONS TO SHAREHOLDERS FROM: |
||||||||
| Net investment income |
(27,970,511 | ) | (21,463,385 | ) | ||||
|
|
|
|
|
|||||
| FROM BENEFICIAL INTEREST TRANSACTIONS: |
||||||||
| Proceeds from sale of shares sold |
419,780,280 | 212,231,021 | ||||||
| Cost of shares redeemed |
— | (120,364,715 | ) | |||||
| Other capital (Note 6) |
(99,689 | ) | — | |||||
|
|
|
|
|
|||||
| Net increase (decrease) in net assets from beneficial interest transactions |
419,680,591 | 91,866,306 | ||||||
|
|
|
|
|
|||||
| Net increase (decrease) in net assets during the period |
614,475,616 | 131,987,598 | ||||||
| Net assets at beginning of period |
847,298,956 | 715,311,358 | ||||||
|
|
|
|
|
|||||
| NET ASSETS AT END OF PERIOD |
$ | 1,461,774,572 | $ | 847,298,956 | ||||
|
|
|
|
|
|||||
| Undistributed (distribution in excess of) net investment income (loss) |
$ | 9,518,243 | $ | 6,930,019 | ||||
|
|
|
|
|
|||||
| SHARES OF BENEFICIAL INTEREST: |
||||||||
| Shares sold |
12,600,000 | 6,800,000 | ||||||
| Shares redeemed |
— | (4,200,000 | ) | |||||
|
|
|
|
|
|||||
| Net increase (decrease) |
12,600,000 | 2,600,000 | ||||||
|
|
|
|
|
|||||
See accompanying notes to financial statements.
56
Table of Contents
SPDR INDEX SHARES FUNDS
STATEMENTS OF CHANGES IN NET ASSETS (continued)
| SPDR S&P International Dividend ETF | ||||||||
| Year Ended 9/30/17 |
Year Ended 9/30/16 |
|||||||
| INCREASE (DECREASE) IN NET ASSETS FROM OPERATIONS: |
||||||||
| Net investment income (loss) |
$ | 44,330,093 | $ | 43,644,772 | ||||
| Net realized gain (loss) |
77,464,040 | (135,946,162 | ) | |||||
| Net change in unrealized appreciation/depreciation |
45,336,374 | 209,134,151 | ||||||
|
|
|
|
|
|||||
| Net increase (decrease) in net assets resulting from operations |
167,130,507 | 116,832,761 | ||||||
|
|
|
|
|
|||||
| Net equalization credits and charges (Note 2) |
(211,475 | ) | 1,385,049 | |||||
|
|
|
|
|
|||||
| DISTRIBUTIONS TO SHAREHOLDERS FROM: |
||||||||
| Net investment income |
(58,780,820 | ) | (43,184,596 | ) | ||||
|
|
|
|
|
|||||
| FROM BENEFICIAL INTEREST TRANSACTIONS: |
||||||||
| Proceeds from sale of shares sold |
226,668,368 | 120,199,049 | ||||||
| Cost of shares redeemed |
(93,577,293 | ) | (157,754,804 | ) | ||||
| Net income equalization (Note 2) |
211,475 | (1,385,049 | ) | |||||
| Other capital (Note 6) |
12,771 | — | ||||||
|
|
|
|
|
|||||
| Net increase (decrease) in net assets from beneficial interest transactions |
133,315,321 | (38,940,804 | ) | |||||
|
|
|
|
|
|||||
| Net increase (decrease) in net assets during the period |
241,453,533 | 36,092,410 | ||||||
| Net assets at beginning of period |
1,010,508,029 | 974,415,619 | ||||||
|
|
|
|
|
|||||
| NET ASSETS AT END OF PERIOD |
$ | 1,251,961,562 | $ | 1,010,508,029 | ||||
|
|
|
|
|
|||||
| Undistributed (distribution in excess of) net investment income (loss) |
$ | 5,335,031 | $ | 7,669,747 | ||||
|
|
|
|
|
|||||
| SHARES OF BENEFICIAL INTEREST: |
||||||||
| Shares sold |
5,950,000 | 3,400,000 | ||||||
| Shares redeemed |
(2,450,000 | ) | (4,500,000 | ) | ||||
|
|
|
|
|
|||||
| Net increase (decrease) |
3,500,000 | (1,100,000 | ) | |||||
|
|
|
|
|
|||||
See accompanying notes to financial statements.
57
Table of Contents
FINANCIAL HIGHLIGHTS
Selected data for a share outstanding throughout each period
| SPDR EURO STOXX 50 ETF | ||||||||||||||||||||
| Year Ended 9/30/17 |
Year Ended 9/30/16 |
Year Ended 9/30/15 |
Year Ended 9/30/14 |
Year Ended 9/30/13 |
||||||||||||||||
| Net asset value, beginning of period |
$ | 32.76 | $ | 33.77 | $ | 39.88 | $ | 38.33 | $ | 30.96 | ||||||||||
|
|
|
|
|
|
|
|
|
|
|
|||||||||||
| Income (loss) from investment operations: |
||||||||||||||||||||
| Net investment income (loss) (a) |
1.04 | 1.05 | 1.20 | 1.32 | 1.19 | |||||||||||||||
| Net realized and unrealized gain (loss) (b) |
8.34 | (0.83 | ) | (6.11 | ) | 1.46 | 7.19 | |||||||||||||
|
|
|
|
|
|
|
|
|
|
|
|||||||||||
| Total from investment operations |
9.38 | 0.22 | (4.91 | ) | 2.78 | 8.38 | ||||||||||||||
|
|
|
|
|
|
|
|
|
|
|
|||||||||||
| Net equalization credits and charges (a) |
0.13 | (0.06 | ) | (0.01 | ) | 0.06 | 0.13 | |||||||||||||
|
|
|
|
|
|
|
|
|
|
|
|||||||||||
| Distributions to shareholders from: |
||||||||||||||||||||
| Net investment income |
(0.97 | ) | (1.17 | ) | (1.19 | ) | (1.29 | ) | (1.14 | ) | ||||||||||
|
|
|
|
|
|
|
|
|
|
|
|||||||||||
| Net asset value, end of period |
$ | 41.30 | $ | 32.76 | $ | 33.77 | $ | 39.88 | $ | 38.33 | ||||||||||
|
|
|
|
|
|
|
|
|
|
|
|||||||||||
| Total return (c) |
29.30 | % | 0.62 | % | (12.60 | )% | 7.20 | % | 28.10 | %(d) | ||||||||||
| Ratios and Supplemental Data: |
||||||||||||||||||||
| Net assets, end of period (in 000s) |
$ | 4,555,667 | $ | 2,538,715 | $ | 4,044,421 | $ | 4,949,488 | $ | 3,285,263 | ||||||||||
| Ratios to average net assets: |
||||||||||||||||||||
| Total expenses |
0.29 | % | 0.29 | % | 0.29 | % | 0.29 | % | 0.29 | % | ||||||||||
| Net investment income (loss) |
2.83 | % | 3.13 | % | 3.16 | % | 3.16 | % | 3.43 | % | ||||||||||
| Portfolio turnover rate (e) |
4 | % | 7 | % | 6 | % | 6 | % | 8 | % | ||||||||||
| (a) | Per share numbers have been calculated using average shares outstanding, which more appropriately presents the per share data for the period. |
| (b) | Amounts shown in this caption for a share outstanding may not accord with the change in aggregate gains and losses in securities for the fiscal period because of the timing of sales and repurchases of Fund shares in relation to fluctuating market values for the Fund. |
| (c) | Total return is calculated assuming a purchase of shares at net asset value on the first day and a sale at net asset value on the last day of each period reported. Distributions are assumed, for the purpose of this calculation, to be reinvested at net asset value per share on the respective payment dates of each distribution. Total returns for periods of less than one year are not annualized. Broker commission charges are not included in this calculation. |
| (d) | If the Adviser had not made a contribution during the period ended September 30, 2013, the total return would have remained 28.10%. |
| (e) | Portfolio turnover rate excludes securities received or delivered from in-kind processing of creations or redemptions. |
See accompanying notes to financial statements.
58
Table of Contents
SPDR INDEX SHARES FUNDS
FINANCIAL HIGHLIGHTS (continued)
Selected data for a share outstanding throughout each period
| SPDR MSCI ACWI ex-US ETF | ||||||||||||||||||||
| Year Ended 9/30/17 |
Year Ended 9/30/16 |
Year Ended 9/30/15 |
Year Ended 9/30/14 |
Year Ended 9/30/13 |
||||||||||||||||
| Net asset value, beginning of period |
$ | 32.34 | $ | 30.31 | $ | 35.09 | $ | 34.29 | $ | 30.49 | ||||||||||
|
|
|
|
|
|
|
|
|
|
|
|||||||||||
| Income (loss) from investment operations: |
||||||||||||||||||||
| Net investment income (loss) (a) |
0.90 | 0.87 | 0.94 | 1.17 | 0.90 | |||||||||||||||
| Net realized and unrealized gain (loss) (b) |
5.22 | 2.00 | (4.92 | ) | 0.72 | 3.88 | ||||||||||||||
|
|
|
|
|
|
|
|
|
|
|
|||||||||||
| Total from investment operations |
6.12 | 2.87 | (3.98 | ) | 1.89 | 4.78 | ||||||||||||||
|
|
|
|
|
|
|
|
|
|
|
|||||||||||
| Other capital |
(0.00 | )(c) | — | — | — | — | ||||||||||||||
|
|
|
|
|
|
|
|
|
|
|
|||||||||||
| Distributions to shareholders from: |
||||||||||||||||||||
| Net investment income |
(0.79 | ) | (0.84 | ) | (0.80 | ) | (1.09 | ) | (0.98 | ) | ||||||||||
|
|
|
|
|
|
|
|
|
|
|
|||||||||||
| Net asset value, end of period |
$ | 37.67 | $ | 32.34 | $ | 30.31 | $ | 35.09 | $ | 34.29 | ||||||||||
|
|
|
|
|
|
|
|
|
|
|
|||||||||||
| Total return (d) |
19.24 | % | 9.66 | % | (11.58 | )% | 5.43 | % | 15.96 | % | ||||||||||
| Ratios and Supplemental Data: |
||||||||||||||||||||
| Net assets, end of period (in 000s) |
$ | 1,461,775 | $ | 847,299 | $ | 715,311 | $ | 575,494 | $ | 493,824 | ||||||||||
| Ratios to average net assets: |
||||||||||||||||||||
| Total expenses |
0.34 | % | 0.34 | % | 0.34 | % | 0.35 | % | 0.34 | % | ||||||||||
| Net expenses |
0.30 | % | 0.30 | % | 0.32 | % | 0.35 | % | 0.34 | % | ||||||||||
| Net investment income (loss) |
2.62 | % | 2.80 | % | 2.74 | % | 3.25 | % | 2.76 | % | ||||||||||
| Portfolio turnover rate (e) |
3 | % | 7 | % | 8 | % | 3 | % | 2 | % | ||||||||||
| (a) | Per share numbers have been calculated using average shares outstanding, which more appropriately presents the per share data for the period. |
| (b) | Amounts shown in this caption for a share outstanding may not accord with the change in aggregate gains and losses in securities for the fiscal period because of the timing of sales and repurchases of Fund shares in relation to fluctuating market values for the Fund. |
| (c) | Amount is less than $0.005 per share. |
| (d) | Total return is calculated assuming a purchase of shares at net asset value on the first day and a sale at net asset value on the last day of each period reported. Distributions are assumed, for the purpose of this calculation, to be reinvested at net asset value per share on the respective payment dates of each distribution. Total returns for periods of less than one year are not annualized. Broker commission charges are not included in this calculation. |
| (e) | Portfolio turnover rate excludes securities received or delivered from in-kind processing of creations or redemptions. |
See accompanying notes to financial statements.
59
Table of Contents
SPDR INDEX SHARES FUNDS
FINANCIAL HIGHLIGHTS (continued)
Selected data for a share outstanding throughout each period
| SPDR S&P International Dividend ETF | ||||||||||||||||||||
| Year Ended 9/30/17 |
Year Ended 9/30/16 |
Year Ended 9/30/15 |
Year Ended 9/30/14 |
Year Ended 9/30/13 |
||||||||||||||||
| Net asset value, beginning of period |
$ | 36.61 | $ | 33.95 | $ | 46.33 | $ | 46.60 | $ | 45.27 | ||||||||||
|
|
|
|
|
|
|
|
|
|
|
|||||||||||
| Income (loss) from investment operations: |
||||||||||||||||||||
| Net investment income (loss) (a) |
1.51 | 1.68 | 2.05 | 2.41 | 3.27 | |||||||||||||||
| Net realized and unrealized gain (loss) (b) |
4.13 | 2.56 | (12.36 | ) | (0.29 | ) | 1.20 | |||||||||||||
|
|
|
|
|
|
|
|
|
|
|
|||||||||||
| Total from investment operations |
5.64 | 4.24 | (10.31 | ) | 2.12 | 4.47 | ||||||||||||||
|
|
|
|
|
|
|
|
|
|
|
|||||||||||
| Net equalization credits and charges (a) |
(0.01 | ) | 0.05 | (0.01 | ) | 0.03 | 0.00 | (c) | ||||||||||||
|
|
|
|
|
|
|
|
|
|
|
|||||||||||
| Other capital |
0.00 | (c) | — | — | — | — | ||||||||||||||
|
|
|
|
|
|
|
|
|
|
|
|||||||||||
| Distributions to shareholders from: |
||||||||||||||||||||
| Net investment income |
(1.99 | ) | (1.63 | ) | (2.06 | ) | (2.42 | ) | (3.14 | ) | ||||||||||
|
|
|
|
|
|
|
|
|
|
|
|||||||||||
| Net asset value, end of period |
$ | 40.25 | $ | 36.61 | $ | 33.95 | $ | 46.33 | $ | 46.60 | ||||||||||
|
|
|
|
|
|
|
|
|
|
|
|||||||||||
| Total return (d) |
15.84 | % | 12.98 | % | (22.86 | )% | 4.43 | % | 10.24 | % | ||||||||||
| Ratios and Supplemental Data: |
||||||||||||||||||||
| Net assets, end of period (in 000s) |
$ | 1,251,962 | $ | 1,010,508 | $ | 974,416 | $ | 1,450,114 | $ | 1,304,826 | ||||||||||
| Ratios to average net assets: |
||||||||||||||||||||
| Total expenses |
0.45 | % | 0.45 | % | 0.46 | % | 0.46 | % | 0.45 | % | ||||||||||
| Net investment income (loss) |
3.95 | % | 4.81 | % | 4.84 | % | 4.96 | % | 6.97 | % | ||||||||||
| Portfolio turnover rate (e) |
122 | % | 39 | % | 76 | % | 62 | % | 121 | % | ||||||||||
| (a) | Per share numbers have been calculated using average shares outstanding, which more appropriately presents the per share data for the period. |
| (b) | Amounts shown in this caption for a share outstanding may not accord with the change in aggregate gains and losses in securities for the fiscal period because of the timing of sales and repurchases of Fund shares in relation to fluctuating market values for the Fund. |
| (c) | Amount is less than $0.005 per share. |
| (d) | Total return is calculated assuming a purchase of shares at net asset value on the first day and a sale at net asset value on the last day of each period reported. Distributions are assumed, for the purpose of this calculation, to be reinvested at net asset value per share on the respective payment dates of each distribution. Total returns for periods of less than one year are not annualized. Broker commission charges are not included in this calculation. |
| (e) | Portfolio turnover rate excludes securities received or delivered from in-kind processing of creations or redemptions. |
See accompanying notes to financial statements.
60
Table of Contents
NOTES TO FINANCIAL STATEMENTS
September 30, 2017
| 1. | Organization |
SPDR Index Shares Funds (the “Trust”), a Massachusetts business trust, registered under the Investment Company Act of 1940, as amended (“1940 Act”), is an open-end management investment company.
As of September 30, 2017, the Trust consists of thirty (30) series, each of which represents a separate series of beneficial interest in the Trust. The Declaration of Trust permits the Board of Trustees of the Trust (the “Board”) to authorize the issuance of an unlimited number of shares of beneficial interest at $0.01 par value. The financial statements herein relate to the following series (each a “Fund”, and collectively, the “Funds”):
SPDR EURO STOXX 50 ETF
SPDR MSCI ACWI ex-US ETF
SPDR S&P International Dividend ETF
Each fund is classified as a non-diversified investment company under the 1940 Act.
Under the Trust’s organizational documents, its officers and trustees are indemnified against certain liabilities arising out of the performance of their duties to the Trust. Additionally, in the normal course of business, the Trust enters into contracts with service providers that contain general indemnification clauses. The Trust’s maximum exposure under these arrangements is unknown as this would involve future claims that may be made against the Trust that have not yet occurred.
| 2. | Summary of Significant Accounting Policies |
The following is a summary of significant accounting policies followed by the Trust in the preparation of its financial statements:
The preparation of financial statements in accordance with U.S. generally accepted accounting principles (“U.S. GAAP”) requires management to make estimates and assumptions that affect the reported amounts and disclosures in the financial statements. Actual results could differ from those estimates. Each Fund is an investment company under U.S. GAAP and follows the accounting and reporting guidance applicable to investment companies.
Security Valuation
Each Fund’s investments are valued at fair value each day that the New York Stock Exchange (“NYSE”) is open and, for financial reporting purposes, as of the report date should the reporting period end on a day that the NYSE is not open. Fair value is
61
Table of Contents
SPDR INDEX SHARES FUNDS
NOTES TO FINANCIAL STATEMENTS (continued)
September 30, 2017
generally defined as the price a fund would receive to sell an asset or pay to transfer a liability in an orderly transaction between market participants at the measurement date. By its nature, a fair value price is a good faith estimate of the valuation in a current sale and may not reflect an actual market price. The investments of each Fund are valued pursuant to the policy and procedures developed by the Oversight Committee (the “Committee”) and approved by the Board. The Committee provides oversight of the valuation of investments for the Funds. The Board has responsibility for determining the fair value of investments.
Valuation techniques used to value each Fund’s investments by major category are as follows:
| • | Equity investments traded on a recognized securities exchange for which market quotations are readily available are valued at the last sale price or official closing price, as applicable, on the primary market or exchange on which they trade. Equity investments traded on a recognized exchange for which there were no sales on that day are valued at the last published sale price or at fair value. |
| • | Investments in registered investment companies (including money market funds) or other unitized pooled investment vehicles that are not traded on an exchange are valued at that day’s published net asset value (“NAV”) per share or unit. |
In the event prices or quotations are not readily available or that the application of these valuation methods results in a price for an investment that is deemed to be not representative of the fair value of such investment, fair value will be determined in good faith by the Committee, in accordance with the valuation policy and procedures approved by the Board.
Fair value pricing could result in a difference between the prices used to calculate a Fund’s NAV and the prices used by the Funds’ underlying benchmarks. Various inputs are used in determining the value of the Funds’ investments.
The Funds value their assets and liabilities at fair value using a fair value hierarchy consisting of three broad levels that prioritize the inputs to valuation techniques giving the highest priority to readily available unadjusted quoted prices in active markets for identical assets or liabilities (Level 1 measurements) and the lowest priority to unobservable inputs (Level 3 measurements) when market prices are not readily available or reliable. The categorization of a value determined for an investment within the hierarchy is based upon the pricing transparency of the investment and is not necessarily an indication of the risk associated with investing in it.
62
Table of Contents
SPDR INDEX SHARES FUNDS
NOTES TO FINANCIAL STATEMENTS (continued)
September 30, 2017
The three levels of the fair value hierarchy are as follows:
| • | Level 1 – Unadjusted quoted prices in active markets for an identical asset or liability; |
| • | Level 2 – Inputs other than quoted prices included within Level 1 that are observable for the asset or liability either directly or indirectly, including quoted prices for similar assets or liabilities in active markets, quoted prices for identical or similar assets or liabilities in markets that are not considered to be active, inputs other than quoted prices that are observable for the asset or liability (such as exchange rates, financing terms, interest rates, yield curves, volatilities, prepayment speeds, loss severities, credit risks and default rates) or other market-corroborated inputs; and |
| • | Level 3 – Unobservable inputs for the asset or liability, including the Committee’s assumptions used in determining the fair value of investments. |
The value of each Fund’s investments according to the fair value hierarchy as of September 30, 2017, is disclosed in each Fund’s respective Schedule of Investments.
Changes in valuation techniques may result in transfers in or out of an assigned level within the fair value hierarchy. Transfers between different levels of the fair value hierarchy are recognized at the end of the reporting period. The Funds had no material transfers between levels for the period ended September 30, 2017.
Investment Transactions and Income Recognition
Investment transactions are accounted for on trade date for financial reporting purposes. Realized gains and losses from the sale or disposition of investments and foreign exchange transactions, if any, are determined using the identified cost method.
Dividend income and capital gain distributions, if any, are recognized on the ex-dividend date, net of any foreign taxes withheld at source, if any. Non-cash dividends received in the form of stock are recorded as dividend income at fair value. Distributions received by the Funds may include a return of capital that is estimated by management. Such amounts are recorded as a reduction of the cost of investments or reclassified to capital gains.
Certain Funds invest in real estate investment trusts (“REITs”). REITs determine the tax character of their distributions annually and may characterize a portion of their distributions as a return of capital or capital gain. The Funds’ policy is to record all REIT distributions initially as dividend income and re-designate the prior calendar year’s to return of capital or capital gain distributions at year end based on information provided by the REIT and/or SSGA Funds Management, Inc’s. (the “Adviser” or “SSGA FM”) estimates of such re-designations for which actual information has not yet been reported.
63
Table of Contents
SPDR INDEX SHARES FUNDS
NOTES TO FINANCIAL STATEMENTS (continued)
September 30, 2017
Expenses
Certain expenses, which are directly identifiable to a specific Fund, are applied to that Fund within the Trust. Other expenses which cannot be attributed to a specific Fund are allocated in such a manner as deemed equitable, taking into consideration the nature and type of expense and the relative net assets of the Funds within the Trust.
Foreign Currency Translation
The accounting records of the Funds are maintained in U.S. dollars. Foreign currencies as well as investment securities and other assets and liabilities denominated in a foreign currency are translated to U.S. dollars using exchange rates at period end. Purchases and sales of securities, income receipts and expense payments denominated in foreign currencies are translated into U.S. dollars at the prevailing exchange rate on the respective dates of the transactions.
The effects of exchange rate fluctuations on investments are included with the net realized and unrealized gain (loss) on investment securities. Other foreign currency transactions resulting in realized and unrealized gain (loss) are disclosed separately.
Foreign Taxes
The Funds may be subject to foreign taxes (a portion of which may be reclaimable) on income, stock dividends, realized and unrealized capital gains on investments or certain foreign currency transactions. Foreign taxes are recorded in accordance with SSGA FM’s understanding of the applicable foreign tax regulations and rates that exist in the foreign jurisdictions in which the Funds invest. These foreign taxes, if any, are paid by the Funds and are reflected in the Statements of Operations, if applicable. Foreign taxes payable or deferred as of September 30, 2017, if any, are disclosed in the Funds’ Statements of Assets and Liabilities.
As of August 17, 2017, SPDR MSCI ACWI ex-US ETF and SPDR S&P International Dividend ETF NAV’s were impacted by an adjustment to certain foreign tax accruals. The per share impacts on both funds were less than $0.005, on August 17, 2017.
Equalization
Certain Funds in the Trust follow the accounting practice known as “Equalization” by which a portion of the proceeds from sales and costs of reacquiring Fund shares, equivalent on a per share basis to the amount of distributable net investment income on the date of the transaction, is credited or charged to undistributed net investment income. As a result, undistributed net investment income per share is unaffected by sales or reacquisition of Fund shares. Amounts related to Equalization can be found on the Statements of Changes in Net Assets.
64
Table of Contents
SPDR INDEX SHARES FUNDS
NOTES TO FINANCIAL STATEMENTS (continued)
September 30, 2017
The following Funds utilized equalization during the period ended September 30, 2017:
SPDR EURO STOXX 50 ETF
SPDR S&P International Dividend ETF
Distributions
The SPDR EURO STOXX 50 ETF and the SPDR S&P International Dividend ETF declare and distribute from net investment income, if any, to its shareholders quarterly. The SPDR MSCI ACWI Ex-US ETF declares and distributes from net investment income, if any, to its shareholders semi-annually.
Net realized capital gains, if any, are distributed annually, unless additional distributions are required for compliance with applicable tax regulations. The amount and character of income and capital gains to be distributed are determined in accordance with applicable tax regulations which may differ from net investment income and realized gains recognized for U.S. GAAP purposes.
| 3. | Fees and Transactions with Affiliates |
Advisory Fee
The Trust, on behalf of each Fund, has entered into an Investment Advisory Agreement with SSGA FM. For its advisory services to the Funds, facilities furnished, and expenses borne by the Adviser, each Fund pays the Adviser a fee accrued daily and paid quarterly, based on a percentage of each Fund’s average daily net assets as shown in the following table:
| Annual Rate | ||||
| SPDR EURO STOXX 50 ETF |
0.29 | % | ||
| SPDR MSCI ACWI ex-US ETF |
0.34 | |||
| SPDR S&P International Dividend ETF |
0.45 | |||
The Adviser pays all operating expenses of each Fund other than management fee, distribution fee pursuant to each Fund’s Distribution and Service Plan, if any, brokerage expenses, taxes, interest, the fees and expenses of the Independent Trustees (including any Trustees’ counsel fees), litigation expenses, acquired fund fees and expenses and other extraordinary expenses.
65
Table of Contents
SPDR INDEX SHARES FUNDS
NOTES TO FINANCIAL STATEMENTS (continued)
September 30, 2017
The Adviser has contractually agreed to waive its advisory fee and reimburse certain expenses, until January 31, 2018, so that the net annual Fund operating expenses of the SPDR MSCI ACWI ex-US ETF will be limited to 0.30% of the Fund’s average daily net assets before application of any fees and expenses not paid by the Adviser under the Investment Advisory Agreement. Such fees and expenses paid by the Adviser are limited to certain direct operating expenses of the Fund and, therefore, do not include the Fund’s acquired fund fees and expenses, if any. The contractual fee waiver does not provide for the recoupment by the Adviser of any fees the Adviser previously waived. The Adviser may continue the waiver from year to year, but there is no guarantee that the Adviser will do so and after January 31, 2018, the waiver may be cancelled or modified at any time. The waiver and/or reimbursement may not be terminated prior to January 31, 2018 except with the approval of the Board. For the period ended September 30, 2017, SPDR MSCI ACWI ex-US ETF waived $496,100.
Administrator, Sub-Administrator, Custodian, and Transfer Agent Fees
SSGA FM serves as administrator and State Street Bank and Trust Company (“State Street”), an affiliate of the Adviser, serves as custodian, sub-administrator and transfer agent. State Street receives fees for its services as custodian, sub-administrator and transfer agent from the Adviser.
Distribution Fees
State Street Global Advisors Funds Distributors, LLC (“SSGA FD” or the “Distributor”), an affiliate of the Adviser, serves as the distributor of the Trust. Effective May 1, 2017, the Distributor’s name changed from State Street Global Markets, LLC to State Street Global Advisors Funds Distributors, LLC.
Other Transactions with Affiliates — Securities Lending
State Street, an affiliate of the Funds, acts as the securities lending agent for the Funds, pursuant to an amended and restated securities lending authorization agreement dated January 6, 2017.
Proceeds collected by State Street on investment of cash collateral or any fee income are allocated as follows (after deduction of such other amounts payable to State Street under the terms of the securities lending agreement): 85% payable to the Fund, and 15% payable to State Street.
In addition, cash collateral from lending activities is invested in the State Street Navigator Securities Lending Government Money Market Portfolio, an affiliated money market fund, for which SSGA FM serves as investment adviser. See Note 8 for additional information regarding securities lending.
66
Table of Contents
SPDR INDEX SHARES FUNDS
NOTES TO FINANCIAL STATEMENTS (continued)
September 30, 2017
Other Transactions with Affiliates
The Funds may invest in affiliated entities, including securities issued by State Street Corporation, affiliated funds, or entities deemed to be affiliates as a result of the Funds owning more than five percent of the entity’s voting securities or outstanding shares. Amounts relating to these transactions during the period ended September 30, 2017, are disclosed in the Schedules of Investments.
Due to Custodian
In certain circumstances, the Funds may have cash overdraft with the custodian. The Due to Custodian amount, if any, reflects cash overdrawn with State Street as custodian who is an affiliate of the Funds. The SPDR MSCI ACWI ex-US ETF had a cash overdraft due to an investment related expense payment.
| 4. | Trustees’ Fees |
The fees and expenses of the Trust’s trustees, who are not “interested persons” of the Trust, as defined in the 1940 Act (“Independent Trustees”), are paid directly by the Funds. The Independent Trustees are reimbursed for travel and other out-of-pocket expenses in connection with meeting attendance and industry seminars.
| 5. | Investment Transactions |
Purchases and sales of investments (excluding in-kind transactions, short term investments and derivative contracts) for the period ended September 30, 2017, were as follows:
| Purchases | Sales | |||||||
| SPDR EURO STOXX 50 ETF |
$ | 115,792,401 | $ | 136,863,192 | ||||
| SPDR MSCI ACWI ex-US ETF |
63,733,828 | 33,702,287 | ||||||
| SPDR S&P International Dividend ETF |
1,373,163,238 | 1,370,228,373 | ||||||
For the period ended September 30, 2017, the following Funds had in-kind contributions, redemptions and net realized gains/losses in the amounts as follows:
| In-kind Contributions |
In-kind Redemptions |
In-kind Net Realized Gains/(Losses) |
||||||||||
| SPDR EURO STOXX 50 ETF |
$ | 1,779,914,449 | $ | 476,005,966 | $ | (17,150,660 | ) | |||||
| SPDR MSCI ACWI ex-US ETF |
392,032,603 | — | — | |||||||||
67
Table of Contents
SPDR INDEX SHARES FUNDS
NOTES TO FINANCIAL STATEMENTS (continued)
September 30, 2017
| In-kind Contributions |
In-kind Redemptions |
In-kind Net Realized Gains/(Losses) |
||||||||||
| SPDR S&P International Dividend ETF |
$ | 204,361,605 | $ | 89,620,279 | $ | 11,028,129 | ||||||
| 6. | Shareholder Transactions |
Each Fund issues and redeems its shares, at NAV, by each Fund only in aggregations of a specified number of shares or multiples thereof (“Creation Units”). Except when aggregated in Creation Units, shares of each Fund are not redeemable. Transactions in capital shares for each Fund are disclosed in detail in the Statements of Changes in Net Assets.
The consideration for the purchase of Creation Units of a Fund may consist of the in-kind deposit of a designated portfolio of securities and a specified amount of cash. Investors purchasing and redeeming Creation Units may pay a purchase transaction fee and a redemption transaction fee directly to the Trust and/or custodian, to offset transfer and other transaction costs associated with the issuance and redemption of Creation Units, including Creation Units for cash. An additional variable fee may be charged for certain transactions. Such variable charges, if any, are included in “Other Capital” on the Statements of Changes on Net Assets.
| 7. | Income Tax Information |
The Funds have qualified and intend to continue to qualify as regulated investment companies under Subchapter M of the Internal Revenue Code of 1986, as amended. Each Fund will not be subject to federal income taxes to the extent it distributes its taxable income, including any net realized capital gains, for each fiscal year. Therefore, no provision for federal income tax is required.
The Funds file federal and various state and local tax returns as required. No income tax returns are currently under examination. Generally, the federal returns are subject to examination by the Internal Revenue Service for a period of three years from date of filing, while the state returns may remain open for an additional year depending upon jurisdiction. SSGA FM has analyzed each Fund’s tax positions taken on tax returns for all open years and does not believe there are any uncertain tax positions that would require recognition of a tax liability.
Distributions to shareholders are recorded on ex-dividend date. Income dividends and gain distributions are determined in accordance with income tax rules and regulations, which may differ from generally accepted accounting principles. Certain capital accounts in the financial statements have been adjusted for permanent book- tax
68
Table of Contents
SPDR INDEX SHARES FUNDS
NOTES TO FINANCIAL STATEMENTS (continued)
September 30, 2017
differences. These adjustments have no impact on net asset values or results of operations. Temporary book-tax differences will reverse in the future. These book-tax differences are primarily due to differing treatments for character of distributions, expiration of capital loss carryforwards, in-kind transactions, foreign currencies, passive foreign investment companies, wash sale loss deferrals, non-deductible excise tax and capital gain tax. In addition, certain Funds claimed a portion of the payments made to redeeming shareholders as a distribution for income tax purposes.
The tax character of distributions paid during the year ended September 30, 2017, was as follows:
| Ordinary Income |
Total | |||||||
| SPDR EURO STOXX 50 ETF |
$ | 96,010,453 | $ | 96,010,453 | ||||
| SPDR MSCI ACWI ex-US ETF |
27,970,511 | 27,970,511 | ||||||
| SPDR S&P International Dividend ETF |
58,780,820 | 58,780,820 | ||||||
The tax character of distributions paid during the year ended September 30, 2016, was as follows:
| Ordinary Income |
Total | |||||||
| SPDR EURO STOXX 50 ETF |
$ | 104,977,475 | $ | 104,977,475 | ||||
| SPDR MSCI ACWI ex-US ETF |
21,463,385 | 21,463,385 | ||||||
| SPDR S&P International Dividend ETF |
43,184,596 | 43,184,596 | ||||||
At September 30, 2017, the components of distributable earnings on a tax basis were as follows:
| Undistributed Ordinary Income |
Capital Loss Carryforwards |
Undistributed Long-Term Capital Gains |
Net Unrealized Gains (Losses) |
Qualified Late-Year Losses* |
Total | |||||||||||||||||||
| SPDR EURO STOXX 50 ETF |
$ | — | $ | (365,700,572 | ) | $ | — | $ | 283,162,803 | $ | — | $ | (82,537,769 | ) | ||||||||||
| SPDR MSCI ACWI ex-US ETF |
13,123,732 | (99,184,558 | ) | — | 95,634,478 | — | 9,573,652 | |||||||||||||||||
69
Table of Contents
SPDR INDEX SHARES FUNDS
NOTES TO FINANCIAL STATEMENTS (continued)
September 30, 2017
| Undistributed Ordinary Income |
Capital Loss Carryforwards |
Undistributed Long-Term Capital Gains |
Net Unrealized Gains (Losses) |
Qualified Late-Year Losses* |
Total | |||||||||||||||||||
| SPDR S&P International Dividend ETF |
$ | 6,642,719 | $ | (425,210,816 | ) | $ | — | $ | 41,085,546 | $ | — | (377,482,551 | ) | |||||||||||
| * | The Funds have elected to defer certain qualified late-year losses and recognize such losses in the next taxable year. |
As of September 30, 2017, the following Funds had capital loss carryforwards available to offset future realized capital gains through the indicated expiration dates as follows:
| Expiring 2018 |
Expiring 2019 |
Non-Expiring Short Term** |
Non-Expiring Long Term** |
|||||||||||||
| SPDR EURO STOXX 50 ETF |
$ | 14,945,357 | $ | 8,709,645 | $ | 38,250,695 | $ | 303,794,875 | ||||||||
| SPDR MSCI ACWI ex-US ETF |
36,957,682 | 2,453,209 | 7,376,864 | 52,396,803 | ||||||||||||
| SPDR S&P International Dividend ETF |
13,759,514 | — | 149,817,841 | 261,633,461 | ||||||||||||
| ** | Must be utilized prior to losses subject to expiration. |
As of September 30, 2017, gross unrealized appreciation and gross unrealized depreciation of investments based on cost for federal income tax purposes were as follows:
| Tax Cost | Gross Unrealized Appreciation |
Gross Unrealized Depreciation |
Net Unrealized Appreciation (Depreciation) |
|||||||||||||
| SPDR EURO STOXX 50 ETF |
$ | 4,267,227,202 | $ | 450,172,190 | $ | 167,324,263 | $ | 282,847,927 | ||||||||
| SPDR MSCI ACWI ex-US ETF |
1,376,988,981 | 192,822,041 | 97,069,920 | 95,752,121 | ||||||||||||
| SPDR S&P International Dividend ETF |
1,205,328,860 | 65,724,703 | 24,601,915 | 41,122,788 | ||||||||||||
| 8. | Securities Lending |
Each Fund may lend securities to qualified broker-dealers or institutional investors. The loans are secured at all times by cash, cash equivalents or U.S. government securities in an amount at least equal to the market value of the securities loaned, plus accrued interest and dividends, determined on a daily basis and adjusted accordingly. The value of the collateral with respect to a loaned security may be temporarily more or less than the value of a security due to market fluctuations of securities values. With respect to
70
Table of Contents
SPDR INDEX SHARES FUNDS
NOTES TO FINANCIAL STATEMENTS (continued)
September 30, 2017
each loan, if on any U.S. business day the aggregate market value of securities collateral plus cash collateral is less than the aggregate market value of the securities which are subject to the loan, the borrower will be notified to provide additional collateral on the next business day.
The Funds will regain record ownership of loaned securities to exercise certain beneficial rights; however, the Funds may bear the risk of delay in recovery of, or even loss of rights in the securities loaned should the borrower fail financially. In addition, a Fund will bear the risk of loss of any cash collateral that it may invest. Each Fund receives compensation for lending its securities from interest or dividends earned on the cash, cash equivalents or U.S. government securities held as collateral, net of fee rebates paid to the borrower and net of fees paid to State Street as the lending agent. Additionally, a Fund will receive a fee from the borrower for non-cash collateral equal to a percentage of the market value of the loaned securities.
The market value of securities on loan as of September 30, 2017, and the value of the invested cash collateral are disclosed in the Funds’ Statements of Assets and Liabilities. Non-cash collateral is not disclosed in the Funds’ Statements of Assets and Liabilities as it is held by the lending agent on behalf of the Funds, and the Funds do not have the ability to re-hypothecate those securities. Securities lending income, as disclosed in the Funds’ Statements of Operations, represents the income earned from the non-cash collateral and the investment of cash collateral, net of fee rebates paid to the borrower and net of fees paid to State Street as lending agent.
The following is a summary of each Fund’s securities lending agreements and related cash and non-cash collateral received as of September 30, 2017:
| Fund |
Market Value of Securities on Loan |
Cash Collateral Received |
Non Cash Collateral Received* |
Total Collateral Received |
||||||||||||
| SPDR EURO STOXX 50 ETF |
$ | 2,433,203 | $ | 2,656,640 | $ | — | $ | 2,656,640 | ||||||||
| SPDR MSCI ACWI ex-US ETF |
49,186,246 | 19,433,641 | 31,800,235 | 51,233,876 | ||||||||||||
| SPDR S&P International Dividend ETF |
12,121,687 | 513,248 | 11,924,542 | 12,437,790 | ||||||||||||
| * | The non-cash collateral includes U.S. Treasuries and U.S. Government Agency securities. |
71
Table of Contents
SPDR INDEX SHARES FUNDS
NOTES TO FINANCIAL STATEMENTS (continued)
September 30, 2017
The following table reflects a breakdown of transactions accounted for as secured borrowings, the gross obligation by the type of collateral pledged or securities loaned, and the remaining contractual maturity of those transactions as of September 30, 2017:
| Remaining Contractual Maturity of the Agreements As of September 30, 2017 |
||||||||||||||||||||||||||||
| Fund |
Securities Lending Transactions |
Overnight and Continuous |
<30 Days | Between 30 & 90 Days |
>90 Days | Total Borrowings |
Gross Amount of Recognized Liabilities for Securities Lending Transactions |
|||||||||||||||||||||
| SPDR EURO STOXX 50 ETF |
Common Stocks | $ | 2,656,640 | $ | — | $ | — | $ | — | $ | 2,656,640 | $ | 2,656,640 | |||||||||||||||
| SPDR MSCI ACWI ex-US ETF |
Common Stocks | 19,433,641 | — | — | — | 19,433,641 | 19,433,641 | |||||||||||||||||||||
| SPDR S&P International Dividend ETF |
Common Stocks | 513,248 | — | — | — | 513,248 | 513,248 | |||||||||||||||||||||
| 9. | Line of Credit |
Certain Funds and other affiliated funds (each a “Participant” and, collectively, the “Participants”) participate in a $360 million revolving credit facility provided by a syndication of banks under which the Participants may borrow to fund shareholder redemptions. This agreement expires in October 2017 unless extended or renewed. Prior to October 13, 2016, the participants could borrow up to $360 million at any time outstanding, subject to asset coverage and other limitations as specified in the agreements.
The following funds participate in the credit facility:
SPDR MSCI ACWI ex-US ETF
SPDR S&P International Dividend ETF
The Participants are charged an annual commitment fee which is calculated based on the unused portion of the shared credit line. Commitment fees are allocated among each of the Participants based on relative net assets. Commitment fees are ordinary fund operating expenses paid by the Adviser. A Participant incurs and pays the interest expense related to its borrowing. Interest is calculated at a rate per annum equal to the sum of 1% plus the greater of the New York Fed Bank Rate and 1-month LIBOR rate. Prior to October 13, 2016, interest was calculated at a rate per annum equal to the sum of the New York Fed Bank Rate plus 1%.
Effective October 12, 2017, the Agreement was renewed, and as a result, the Funds and other affiliated Funds participate in a $500 million revolving credit facility.
The Funds had no outstanding loans as of September 30, 2017.
72
Table of Contents
SPDR INDEX SHARES FUNDS
NOTES TO FINANCIAL STATEMENTS (continued)
September 30, 2017
| 10. | Risks |
Concentration Risk
As a result of the Funds’ ability to invest a large percentage of their assets in obligations of issuers within the same country, state, region, currency or economic sector, an adverse economic, business or political development may affect the value of the Funds’ investments more than if the Funds were more broadly diversified.
Foreign and Emerging Markets Risk
Investing in foreign markets involve risks and considerations not typically associated with investing in the U.S. Foreign securities may be subject to risk of loss because of government regulation, economic, political and social instability in the countries in which the Funds invest. Foreign markets may be less liquid than investments in the U.S. and may be subject to the risks of currency fluctuations. To the extent that a Fund invests in securities of issuers located in emerging markets, these risks may be even more pronounced.
Market and Credit Risk
In the normal course of business, the Funds trade financial instruments and enter into financial transactions where risk of potential loss exists due to changes in the general economic conditions and fluctuations of the market (market risk). Additionally, the Fund may also be exposed to credit risk in the event that an issuer or guarantor fails to perform or that an institution or entity with which the Fund has unsettled or open transactions defaults.
| 11. | Subsequent Events |
Management has evaluated the impact of all subsequent events on the Funds through the date on which the financial statements were available to be issued and has determined that there were no subsequent events requiring adjustment or disclosure in the financial statements.
73
Table of Contents
[THIS PAGE INTENTIONALLY LEFT BLANK]
74
Table of Contents
REPORT OF INDEPENDENT REGISTERED PUBLIC ACCOUNTING FIRM
To the Trustees and Shareholders of the SPDR Index Shares Funds:
In our opinion, the accompanying statements of assets and liabilities, including the schedules of investments, and the related statements of operations and of changes in net assets and the financial highlights present fairly, in all material respects, the financial position of the three funds, listed in Note 1, (each a “Fund”) as of September 30, 2017, the results of each of their operations for the year then ended, the changes in each of their net assets for each of the two years in the period then ended and the financial highlights for each of the five years in the period then ended, in conformity with accounting principles generally accepted in the United States of America. These financial statements and financial highlights (hereafter referred to as “financial statements”) are the responsibility of the Trust’s management. Our responsibility is to express an opinion on these financial statements based on our audits. We conducted our audits of these financial statements in accordance with the standards of the Public Company Accounting Oversight Board (United States). Those standards require that we plan and perform the audit to obtain reasonable assurance about whether the financial statements are free of material misstatement. An audit includes examining, on a test basis, evidence supporting the amounts and disclosures in the financial statements, assessing the accounting principles used and significant estimates made by management, and evaluating the overall financial statement presentation. We believe that our audits, which included confirmation of securities as of September 30, 2017 by correspondence with the custodian and brokers and the application of alternative auditing procedures where securities purchased had not been received, provide a reasonable basis for the opinion expressed above.
/s/ PricewaterhouseCoopersLLP
Boston, Massachusetts
November 21, 2017
75
Table of Contents
OTHER INFORMATION
September 30, 2017 (Unaudited)
Expense Example
As a shareholder of a Fund, you incur two types of costs (1) transaction costs, including sales charges (loads), if applicable, on purchase payments, reinvested dividends, or other distributions and (2) ongoing costs, including advisory fees and other Fund expenses. This example is intended to help you understand your ongoing costs (in dollars) of investing in the Fund and to compare these costs with the ongoing costs of investing in other mutual funds. It is based on an investment of $1,000 made at the beginning of the period shown and held for the entire period from April 1, 2017 to September 30, 2017.
The table below illustrates your Fund’s cost in two ways:
Based on actual fund return — This section helps you to estimate the actual expenses that you paid over the period. The “Ending Account Value” shown is derived from each Fund’s actual return, and the third column shows the dollar amount that would have been paid by an investor who started with $1,000 in the Fund. You may use the information here, together with the amount you invested, to estimate the expenses that you paid over the period. To do so, simply divide your account value by $1,000 (for example, an $8,600 account value divided by $1,000 = 8.6), then multiply the result by the number given for the Fund under the heading “Expenses Paid During Period”.
Based on hypothetical 5% return — This section is intended to help you compare your Fund’s costs with those of other mutual funds. It assumes that the Fund had a yearly return of 5% before expenses, but that the expense ratio is unchanged. In this case, because the return used is not the Fund’s actual return, the results do not apply to your investment. The example is useful in making comparisons because the U.S. Securities and Exchange Commission (the “SEC”) requires all mutual funds to calculate expenses based on a 5% return. You can assess your Fund’s costs by comparing this hypothetical example with the hypothetical examples that appear in shareholder reports of other funds.
Please note that the expenses shown in the table are meant to highlight your ongoing costs only and do not reflect any transaction costs, such as sales load charges (loads). Therefore, the hypothetical 5% return section of the table is useful in comparing ongoing costs only, and will not help you determine the relative total costs of owning different funds. In addition, if these transaction costs were included, your costs would have been higher.
76
Table of Contents
SPDR INDEX SHARES FUNDS
OTHER INFORMATION (continued)
September 30, 2017 (Unaudited)
| SPDR EURO STOXX 50 ETF |
SPDR MSCI ACWI ex-US ETF |
SPDR S&P International Dividend ETF |
||||||||||
| Annualized Expense Ratio |
0.29 | % | 0.30 | % | 0.46 | % | ||||||
| Actual: |
||||||||||||
| Ending Account Value |
$ | 1,157.50 | $ | 1,122.70 | $ | 1,085.20 | ||||||
| Expenses Paid During Period(a) |
1.57 | 1.60 | 2.40 | |||||||||
| Hypothetical (assuming a 5% return before expenses): |
||||||||||||
| Ending Account Value |
1,023.60 | 1,023.60 | 1,022.80 | |||||||||
| Expenses Paid During Period(a) |
1.47 | 1.52 | 2.33 | |||||||||
| (a) | Expenses are equal to the Fund’s annualized net expense ratio multiplied by the average account value of the period, multiplied by 183, then divided by 365. |
Tax Information
For federal income tax purposes, the following information is furnished with respect to the distributions of the Trust for its fiscal year ended September 30, 2017.
Dividends Received Deduction
Each Fund reports the maximum amount allowable of its net taxable income as eligible for the corporate dividends received deduction.
Qualified Dividend Income
A portion of dividends distributed by the Funds during the fiscal year ended September 30, 2017 are considered qualified dividend income and are eligible for reduced tax rates. These lower rates range from 5% to 20% depending on the individual’s tax bracket. Each Fund reports the maximum amount allowable of its net taxable income as qualified dividend income as provided in the Jobs and Growth Tax Relief Reconciliation Act of 2003.
77
Table of Contents
SPDR INDEX SHARES FUNDS
OTHER INFORMATION (continued)
September 30, 2017 (Unaudited)
Foreign Tax Credit
The Trust has made an election under Internal Revenue Code Section 853 to pass through foreign taxes paid by a Fund to its shareholders. For the year ended September 30, 2017, the total amount of foreign taxes that will be passed through are:
| Amount | ||||
| SPDR EURO STOXX 50 ETF |
$ | 9,826,313 | ||
| SPDR MSCI ACWI ex-US ETF |
2,613,954 | |||
| SPDR S&P International Dividend ETF |
3,221,384 | |||
The amount of foreign source income earned on the following Funds during the year ended September 30, 2017 were as follows:
| Amount | ||||
| SPDR EURO STOXX 50 ETF |
$ | 111,411,662 | ||
| SPDR MSCI ACWI ex-US ETF |
38,145,249 | |||
| SPDR S&P International Dividend ETF |
54,097,981 | |||
Proxy Voting Policies and Procedures and Records
A description of the Trust’s proxy voting policies and procedures that are used by the Funds’ investment adviser to vote proxies relating to the Funds’ portfolio of securities are available (i) without charge, upon request by calling 1-866-787-2257 (toll free) or (ii) on the SEC’s website, at www.sec.gov.
Information regarding how the investment adviser voted for the most recent period ended June 30 is available by August 31 of each year by calling the same number and on the SEC’s website, at www.sec.gov, and on the Funds’ website at www.spdrs.com.
Quarterly Portfolio Schedule
The Funds file a complete schedule of investments with the SEC for the first and third quarters of each fiscal year on Form N-Q. The Funds’ Forms N-Q are available on the SEC’s website at www.sec.gov and may be reviewed and copied at the SEC’s Public Reference Room in Washington DC. Information on the operation of the Public Reference Room may be obtained by calling 1-800-SEC-0330. The information on the Form N-Q is available upon request, without charge, by calling 1-866-787-2257 (toll free) and on the Funds’ website at www.spdrs.com.
78
Table of Contents
SPDR INDEX SHARES FUNDS
OTHER INFORMATION (continued)
September 30, 2017 (Unaudited)
Approval of Advisory Agreement
At an in-person meeting held prior to September 30, 2017, the Board of Trustees of the Trust (the “Board”) evaluated proposals to continue the Investment Advisory Agreement (the “Agreement”) between the Trust and SSGA Funds Management, Inc. (the “Adviser” or “SSGA FM”) with respect to the operational series of the Trust (collectively, the “Current ETFs”) and to continue the Agreement with respect to the previously approved non-operational series of the Trust (together with the Current ETFs, the “SPDR ETFs”). The Trustees who are not “interested persons” of the Trust within the meaning of the Investment Company Act of 1940, as amended (the “Independent Trustees”), also met separately with their independent legal counsel to consider the Agreement.
In evaluating the Agreement, the Board drew on materials provided to them by SSGA FM, the Trust’s investment adviser and administrator, and other materials provided by State Street Bank and Trust Company, the Trust’s sub-administrator, transfer agent and custodian (“State Street”). In deciding whether to approve the Agreement, the Board considered various factors, including the (i) nature, extent and quality of services provided by the Adviser with respect to the SPDR ETFs under the Agreement, (ii) investment performance of the Current ETFs, (iii) profits realized by the Adviser and its affiliates from its relationship with the Trust, (iv) fees charged to comparable funds, (v) other benefits to the Adviser, and (vi) extent to which economies of scale would be shared as the SPDR ETFs grow.
Nature, Extent and Quality of Services
The Board considered the nature, extent and quality of services provided by the Adviser. In doing so, the Trustees relied on their prior experience in overseeing the management of the Trust and materials provided prior to and at the meeting. The Board reviewed the Agreement and the Adviser’s responsibilities for managing investment operations of each of the SPDR ETFs in accordance with each SPDR ETF’s investment objectives and policies, and applicable legal and regulatory requirements. The Board appreciated the nature of the SPDR ETFs as exchange-traded funds and the experience and expertise of the Adviser with exchange-traded funds. The Board considered the background and experience of the Adviser’s senior management, including those individuals responsible for portfolio management, oversight of sub-advisers and regulatory compliance of the SPDR ETFs. The Board also considered the portfolio management resources, structures and practices of the Adviser, including those associated with monitoring and securing each SPDR ETF’s compliance with its investment objectives and policies and with applicable laws and regulations. The Board also considered information about the Adviser’s best execution procedures and overall investment management business, noting that the Adviser serves a wide range of clients across a broad spectrum of asset
79
Table of Contents
SPDR INDEX SHARES FUNDS
OTHER INFORMATION (continued)
September 30, 2017 (Unaudited)
classes. The Board looked at the Adviser’s general knowledge of the investment management business and that of its affiliates which make up State Street Global Advisors, through which the Adviser shares all of its senior personnel. The Board considered that the Adviser and its affiliates constitute one of the world’s largest investment management enterprises for indexed products generally and exchange-traded funds in particular. The Board specifically considered the Adviser’s experience in managing equity exchange-traded funds with index-based investment objectives and in overseeing third-party sub-advisers, as applicable.
Investment Performance
The Board then reviewed the Current ETFs’ performance, noting that the distinctive indexed investment objective of each of the Current ETFs made analysis of investment performance, in absolute terms, less of a priority than that which normally attaches to the performance of actively-managed funds. Instead, the Board focused on the extent to which each Current ETF achieved its objective as a passively-managed index fund. The Board reviewed information regarding the Current ETFs’ index tracking, noting that each Current ETF satisfactorily tracked its benchmark index.
Profits Realized by the Adviser
The Board considered the profitability of the advisory arrangement with the Current ETFs to the Adviser, including data on the Current ETFs’ historical profitability to the Adviser. The Independent Trustees, with their independent legal counsel, had the opportunity to discuss, with representatives of the Adviser and State Street, methodologies used in computing costs that formed the bases of profitability calculations and determined that these methodologies were reasonable.
Fees Charged to Comparable Funds
The Board evaluated each SPDR ETF’s unitary fee through review of comparative information with respect to fees paid by similar funds – i.e., exchange-traded funds tracking similar equity indexes. The Board reviewed the universe of similar exchange-traded funds for each SPDR ETF based upon data independently obtained from Broadridge Financial Solutions, Inc. (formerly Lipper Analytical Services) and related comparative information for similar exchange-traded funds. In doing so, the Board used a fund by fund analysis of the data.
Other Benefits
The Board also considered whether the Adviser or its affiliates benefited in other ways from its relationship with the Trust, noting that the Adviser does not maintain soft-dollar arrangements in connection with the Trust’s brokerage transactions.
80
Table of Contents
SPDR INDEX SHARES FUNDS
OTHER INFORMATION (continued)
September 30, 2017 (Unaudited)
Economies of Scale
The Board reviewed information regarding economies of scale or other efficiencies that may result as each SPDR ETF’s assets grow in size. The Board noted that the Agreement did not provide for breakpoints in each SPDR ETF’s advisory fee rates as assets of a SPDR ETF increase. However, the Board further noted the Adviser’s assertion that future economies of scale (among several factors) had been taken into consideration for the SPDR ETFs by fixing relatively low advisory fees, effectively sharing the benefits of lower fees with the SPDR ETFs from inception. The Adviser also asserted that one of the benefits of the unitary fee was to provide an unvarying expense structure, which could be lost or diluted with the addition of breakpoints. The Board noted that it intends to continue to monitor fees as the SPDR ETFs grow in size and assess whether fee breakpoints may be warranted.
Conclusion
The Board, including the Independent Trustees voting separately, approved the Agreement for each SPDR ETF after weighing the foregoing factors, none of which was dispositive in itself and may have been weighed differently by each Trustee. The Board’s conclusions with respect to the Agreement were as follows: (a) the nature and extent of the services provided by the Adviser with respect to the SPDR ETFs were appropriate; (b) the performance and, more importantly, the index tracking, of each Current ETF had been satisfactory; (c) the Adviser’s unitary fee for each SPDR ETF, considered in relation to services provided and in relation to fees charged to comparable funds, was fair and reasonable; (d) profitability of the Trust’s relationships with the Adviser was not excessive; (e) any additional potential benefits to the Adviser or its affiliates were not of a magnitude to materially affect the Board’s conclusions; and (f) fees paid to the Adviser adequately shared the economies of scale with respect to the Current ETFs by way of the relatively low fee structure of the Trust.
Approval of State Street Global Advisors Asia Limited Sub-Advisory Agreement
At an in-person meeting held prior to September 30, 2017, the Board also evaluated a proposal to continue the Sub-Advisory Agreement (the “SSGA Asia Limited Sub-Advisory Agreement”) between the Adviser and State Street Global Advisors Asia Limited (“SSGA Asia Limited”), an affiliate of the Adviser, with respect to the SPDR MSCI China A Shares IMI ETF (the “Fund”), which is sub-advised by SSGA Asia Limited. The Independent Trustees also met separately with their independent legal counsel to consider the SSGA Asia Limited Sub-Advisory Agreement.
81
Table of Contents
SPDR INDEX SHARES FUNDS
OTHER INFORMATION (continued)
September 30, 2017 (Unaudited)
In evaluating the SSGA Asia Limited Sub-Advisory Agreement, the Board drew on materials provided to them by SSGA Asia Limited and the Adviser. In deciding whether to approve the SSGA Asia Limited Sub-Advisory Agreement, the Board considered various factors, including the (i) nature, extent and quality of services provided by SSGA Asia Limited with respect to the Fund under the SSGA Asia Limited Sub-Advisory Agreement and (ii) investment performance of the Fund. The Board was informed of the portion of the current advisory fee that the Adviser would pay to SSGA Asia Limited under the SSGA Asia Limited Sub-Advisory Agreement and also considered that such fees would be paid directly by the Adviser and would not result in increased fees payable by the Fund.
The Board considered the background and experience of SSGA Asia Limited’s senior management and, in particular, SSGA Asia Limited’s experience in investing in Asian equity securities. The Board reviewed the Fund’s performance, noting that the Fund tracked its benchmark index. The Board also considered the unitary fee paid to the Adviser by the Fund and SSGA Asia Limited’s fees paid by the Adviser. The Board also considered whether SSGA Asia Limited benefited in other ways from its relationship with the Trust.
The Board, including the Independent Trustees voting separately, approved the SSGA Asia Limited Sub-Advisory Agreement for the Fund after weighing the foregoing factors as well as the relevant factors discussed in relation to the Agreement between the Trust and the Adviser, none of which was dispositive in itself and may have been weighed differently by each Trustee. The Board’s conclusions with respect to the SSGA Asia Limited Sub-Advisory Agreement were as follows: (a) the nature and extent of the services provided by SSGA Asia Limited with respect to the Fund were appropriate; (b) the performance and, more importantly, the index tracking, of the Fund had been satisfactory; (c) SSGA Asia Limited’s fees for the Fund and the unitary fee, considered in relation to the services provided, were fair and reasonable; (d) any additional potential benefits to SSGA Asia Limited were not of a magnitude to materially affect the Board’s conclusions; and (e) fees paid to SSGA Asia Limited adequately shared the economies
of scale with the Fund by way of the relatively low fee structure of the Trust.
82
Table of Contents
SPDR INDEX SHARES FUNDS
OTHER INFORMATION (continued)
September 30, 2017 (Unaudited)
TRUSTEES AND OFFICERS
| Name, Address |
Position(s) |
Term of |
Principal Occupation(s) 5 Years |
Number of Portfolios in Fund Complex Overseen by Trustee† |
Other | |||||||
| Trustees |
||||||||||||
| Independent Trustees |
||||||||||||
| FRANK NESVET |
Independent Trustee, Chairman, Trustee Committee Chair | Term: Unlimited Served: since September 2000 |
Retired. | 148 | None. | |||||||
| DAVID M. KELLY |
Independent Trustee | Term: Unlimited Served: since September 2000 |
Retired. | 148 | Chicago Stock Exchange (Former Director, retired); Penson Worldwide Inc. (Former Director, retired). | |||||||
| BONNY EUGENIA BOATMAN |
Independent Trustee | Term: Unlimited Served: since April 2010 |
Retired. | 148 | None. | |||||||
| DWIGHT D. CHURCHILL |
Independent Trustee | Term: Unlimited Served: since April 2010 |
Self-employed consultant since 2010; CEO and President, CFA Institute (June 2014-January 2015). | 148 | Affiliated Managers Group, Inc. (Director). | |||||||
| CARL G. VERBONCOEUR |
Independent Trustee, Audit Committee Chair | Term: Unlimited Served: since April 2010 |
Self-employed consultant since 2009. | 148 | The Motley Fool Funds Trust (Trustee). | |||||||
83
Table of Contents
SPDR INDEX SHARES FUNDS
OTHER INFORMATION (continued)
September 30, 2017 (Unaudited)
| Name, Address |
Position(s) |
Term of |
Principal Occupation(s) |
Number of Portfolios in Fund Complex Overseen by Trustee† |
Other | |||||||
| Interested Trustee |
||||||||||||
| JAMES E. ROSS* |
Interested Trustee | Term: Unlimited Served as Trustee: since April 2010 | Chairman and Director, SSGA Funds Management, Inc. (2005-present); Executive Vice President, State Street Global Advisors (2006-present); Chief Executive Officer and Director, State Street Global Advisors Funds Distributors, LLC (May 2017- present); Director, State Street Global Markets, LLC (2013-April 2017); President, SSGA Funds Management, Inc. (2005-2012); Principal, State Street Global Advisors (2000 -2005). | 234 | SSGA SPDR ETFs Europe I plc (Director) (November 2016- present); SSGA SPDR ETFs Europe II plc (Director) (November 2016- present). | |||||||
| † | For the purpose of determining the number of portfolios overseen by the Trustees, “Fund Complex” comprises registered investment companies for which SSGA Funds Management, Inc. serves as investment adviser. |
| * | Mr. Ross is an Interested Trustee because of his employment with the Adviser and ownership interest in an affiliate of the Adviser. Mr. Ross previously served as an Interested Trustee from November 2005 to December 2009. |
84
Table of Contents
SPDR INDEX SHARES FUNDS
OTHER INFORMATION (continued)
September 30, 2017 (Unaudited)
| Name, Address |
Position(s) with Funds |
Term of |
Principal Occupation(s) During the Past 5 Years | |||||
| Officers |
||||||||
| ELLEN M. NEEDHAM |
President | Term: Unlimited Served: since October 2012 |
President and Director, SSGA Funds Management, Inc. (2001 - present)*; Senior Managing Director, State Street Global Advisors (1992 - present)*; Director, State Street Global Advisors Funds Distributors, LLC (May 2017 - present). | |||||
| BRUCE S. ROSENBERG |
Treasurer | Term: Unlimited Served: since February 2016 |
Managing Director, State Street Global Advisors and SSGA Funds Management, Inc. (July 2015 - present); Director, Credit Suisse (April 2008 - July 2015). | |||||
| ANN M. CARPENTER |
|
Vice President; Deputy Treasurer |
|
Term: Unlimited Served: since August 2012; Term: Unlimited Served: since April 2015 |
Chief Operating Officer, SSGA Funds Management, Inc. (2005 - Present)*; Managing Director, State Street Global Advisors (2005 - present).* | |||
| MICHAEL P. RILEY |
|
Vice President |
|
Term: Unlimited Served: since February 2005 |
Managing Director, State Street Global Advisors (2005 - present).* | |||
| JOSHUA A. WEINBERG |
|
Chief Legal Officer |
|
Term: Unlimited Served: since February 2015 |
Managing Director and Managing Counsel, State Street Global Advisors (2011 - present); Clerk, SSGA Funds Management, Inc. (2013 - present); Associate, Financial Services Group, Dechert LLP (2006 - 2011). | |||
| JESSE D. HALLEE |
Secretary | Term: Unlimited Served: since August 2017 |
Vice President and Managing Counsel, State Street Bank and Trust Company (2013 – present); Vice President and Counsel, Brown Brothers Harriman & Co. (2007- 2013).** | |||||
85
Table of Contents
SPDR INDEX SHARES FUNDS
OTHER INFORMATION (continued)
September 30, 2017 (Unaudited)
| Name, Address |
Position(s) with Funds |
Term of |
Principal Occupation(s) During the Past 5 Years | |||
| CHAD C. HALLETT |
Deputy Treasurer |
Term: Unlimited Served: since February 2016 |
Vice President, State Street Global Advisors and SSGA Funds Management, Inc. (November 2014 - present); Vice President, State Street Bank and Trust Company (2001 - November 2014).* | |||
| DARLENE ANDERSON-VASQUEZ |
Deputy Treasurer |
Term: Unlimited Served: since November 2016 |
Managing Director, State Street Global Advisors and SSGA Funds Management, Inc. (May 2016 - present); Senior Vice President, John Hancock Investments (September 2007 - May 2016). | |||
| ARTHUR A. JENSEN |
Deputy Treasurer |
Term: Unlimited Served: Since August 2017 |
Vice President at State Street Global Advisors (July 2016 – present); Mutual Funds Controller of GE Asset Management Incorporated (April 2011 - July 2016). | |||
| SUJATA UPRETI |
Assistant Treasurer |
Term: Unlimited Served: since February 2016 |
Vice President, State Street Global Advisors and SSGA Funds Management, Inc. (May 2015 - present); Assistant Director, Cambridge Associates, LLC (July 2014 - January 2015); Vice President, Bank of New York Mellon (July 2012 - August 2013); Manager, PricewaterhouseCoopers, LLP (September 2003 - July 2012). | |||
| DANIEL FOLEY |
Assistant Treasurer |
Term: Unlimited Served: since February 2016 |
Vice President, State Street Global Advisors and SSGA Funds Management, Inc. (April 2007 - present).* | |||
| DANIEL G. PLOURDE |
Assistant Treasurer |
Term: Unlimited Served: since May 2017 |
Assistant Vice President, SSGA Funds Management, Inc. (May 2015 - present); Officer, State Street Bank and Trust Company (March 2009 - May 2015). | |||
86
Table of Contents
SPDR INDEX SHARES FUNDS
OTHER INFORMATION (continued)
September 30, 2017 (Unaudited)
| Name, Address |
Position(s) with Funds |
Term of |
Principal Occupation(s) During the Past 5 Years | |||
| BRIAN HARRIS |
Chief Compliance Officer; Anti- Money Laundering Officer; Code of Ethics Compliance Officer |
Term: Unlimited Served: since November 2013 |
Managing Director, State Street Global Advisors and SSGA Funds Management, Inc. (June 2013 - present)*; Senior Vice President and Global Head of Investment Compliance, BofA Global Capital Management (2010 -2013). |
| * | Served in various capacities and/or with various affiliated entities during noted time period. |
| ** | Served in various capacities and/or with unaffiliated mutual funds or closed-end funds for which State Street Bank and Trust Company or its affiliates act as a provider of services during the noted time period. |
The Trust’s Statement of Additional Information (SAI) includes additional information about Funds’ directors and is available, without charge, upon request and by calling 1-866-787-2257.
87
Table of Contents
SPDR® Index Shares Funds
SPDR Index Shares Funds
| Trustees
Bonny E. Boatman Dwight D. Churchill David M. Kelly Frank Nesvet, Chairman James E. Ross Carl G. Verboncoeur
Investment Manager and Administrator
SSGA Funds Management, Inc. State Street Financial Center One Lincoln Street Boston, MA 02111
Distributor
State Street Global Advisors Funds Distributors, LLC One Lincoln Street Boston, MA 02111 |
Custodian, Sub-Administrator and Transfer Agent
State Street Bank and Trust Company One Lincoln Street Boston, MA 02111
Legal Counsel
Morgan, Lewis & Bockius LLP 1111 Pennsylvania Avenue, NW Washington, DC 20004
Independent Registered Public Accounting Firm
PricewaterhouseCoopers LLP 101 Seaport Boulevard Suite 500 Boston, MA 02210 | |
Fund Shares are distributed by State Street Global Advisors Funds Distributors, LLC, a wholly-owned subsidiary of State Street Corporation. State Street Global Advisors Funds Distributors, LLC; member FINRA, SIPC.
The information contained in this report is intended for the general information of shareholders of the Trust. This report is not authorized for distribution to prospective investors unless preceded or accompanied by a current Trust prospectus which contains important information concerning the Trust. You may obtain a current prospectus and SAI from the Distributor by calling 1-866-787-2257 or visiting www.spdrs.com. Please read the prospectus carefully before you invest.
Table of Contents
SPDR® Index Shares Funds
For more complete information, please call 866.787.2257 or visit spdrs.com today.
ssga.com | spdrs.com
The information contained in this report is intended for the general information of shareholders of the Trust. This report is not authorized for distribution to prospective investors unless preceded or accompanied by a current Trust prospectus which contains important information concerning the Trust. You may obtain a current prospectus and SAI from the Distributor by calling 1-866-787-2257 or visiting www.spdrs.com. Please read the prospectus carefully before you invest.
| State Street Global Advisors IBG - 25721 |
© 2017 State Street Corporation - All Rights Reserved 0515 Exp. Date: 11/30/2018 SPDRISIAR |
Table of Contents
Annual Report
September 30, 2017
SPDR® Index Shares Funds
SPDR Portfolio Emerging Markets ETF
(formerly, SPDR S&P Emerging Markets ETF)
SPDR Portfolio World ex-US ETF
(formerly, SPDR S&P World ex-US ETF)
The information contained in this report is intended for the general information of shareholders of the Trust. This report is not authorized for distribution to prospective investors unless preceded or accompanied by a current Trust prospectus which contains important information concerning the Trust. You may obtain a current prospectus and SAI from the Distributor by calling 1-866-787-2257 or visiting www.spdrs.com. Please read the prospectus carefully before you invest.

Table of Contents
| 1 | ||||
| Management’s Discussion of Fund Performance, Performance |
||||
| Summary & Portfolio Statistics (Unaudited) |
||||
| SPDR Portfolio Emerging Markets ETF (SPEM) (formerly, SPDR S&P Emerging Markets ETF (GMM)) |
2 | |||
| SPDR Portfolio World ex-US ETF (SPDW) (formerly, SPDR S&P World ex-US ETF (GWL)) |
5 | |||
| Schedules of Investments |
||||
| SPDR Portfolio Emerging Markets ETF (SPEM) (formerly, SPDR S&P Emerging Markets ETF (GMM)) |
8 | |||
| SPDR Portfolio World ex-US ETF (SPDW) (formerly, SPDR S&P World ex-US ETF (GWL)) |
42 | |||
| 83 | ||||
| 87 | ||||
| 89 | ||||
| 105 | ||||
| 106 |
The information contained in this report is intended for the general information of shareholders of the Trust. This report is not authorized for distribution to prospective investors unless preceded or accompanied by a current Trust prospectus which contains important information concerning the Trust. You may obtain a current prospectus and SAI from the Distributor by calling 1-866-787-2257 or visiting www.spdrs.com. Please read the prospectus carefully before you invest.
Table of Contents

NOTES TO PERFORMANCE SUMMARY (UNAUDITED)
The performance chart of a Fund’s total return at net asset value (“NAV”), the total return based on market price and its benchmark index is provided for comparative purposes only and represents the periods noted. A Fund’s per share NAV is the value of one share of a Fund and is calculated by dividing the value of total assets less total liabilities by the number of shares outstanding. The NAV return is based on the NAV of a Fund and the market return is based on the market price per share of a Fund. The market price used to calculate the market return is determined by using the midpoint between the highest bid and the lowest offer on the exchange on which the shares of a Fund are listed for trading, as of the time that a Fund’s NAV is calculated. NAV and market returns assume that dividends and capital gain distributions have been reinvested in a Fund at NAV. Market returns do not include brokerage commissions that may be payable on secondary market transactions. If brokerage commissions were included market returns would be lower.
An index is a statistical measure of a specified financial market or sector. An index does not actually hold a portfolio of securities and therefore does not reflect deductions for fees or expenses. In comparison, a Fund’s performance is negatively impacted by these deductions. Index returns reflect all items of income, gain and loss and the reinvestment of dividends and other income.
The S&P Emerging BMI Index is a market capitalization weighted index designed to define and measure the investable universe of publicly traded companies domiciled in emerging markets. The S&P Emerging BMI Index is “float-adjusted”, meaning that only those shares publicly available to investors are included in the Index calculation.
The S&P Developed Ex-U.S. BMI Index is a market capitalization weighted index designed to define and measure the investable universe of publicly traded companies domiciled in developed countries outside the United States. The S&P Developed Ex-U.S. BMI Index is “float-adjusted”, meaning that only those shares publicly available to investors are included in the Index calculation.
1
Table of Contents
SPDR PORTFOLIO EMERGING MARKETS ETF
MANAGEMENT’S DISCUSSION OF FUND PERFORMANCE
(UNAUDITED)
The SPDR Portfolio Emerging Markets ETF (the “Fund”)* seeks to provide investment results that, before fees and expenses, correspond generally to the total return performance of an index upon the emerging markets of the world. The Fund’s benchmark is the S&P Emerging BMI Index (the “Index”).
For the 12-month period ended September 30, 2017 (the “Reporting Period”), the total return for the Fund was 21.36%, and the Index was 21.92%. The Fund and Index returns reflect the reinvestment of dividends and other income. The Fund’s performance reflects the expenses of managing the Fund, including brokerage and advisory expenses. The Index is unmanaged and Index returns do not reflect fees and expenses of any kind, which would have a negative impact on returns. Fund expenses, cumulative security misweights and the fund’s cash position contributed to the difference between the Fund’s performance and that of the Index.
During the prior twelve months, there has been a continued general lessening of geopolitical tensions which has had a positive impact on this Fund’s return. Though there have certainly been some flash points, most notably North Korea’s continued pursuit of advanced nuclear weapons. For non-geopolitical issues, accelerated GDP growth has allayed many of the fears regarding a hard landing for the Chinese economy. This was not unique as the emerging markets in general have seen better growth during the prior twelve months. Additionally, these markets have been helped by a slower than anticipated moving Federal Reserve. This is particularly helpful for many of the Emerging Market countries due to the propensity to have borrowed in US Dollars which has led to reductions in both debt servicing concerns and capital outflows. In general, the environment of accommodative Central Banks has buoyed this fund’s returns. Finally, many of the emerging market countries have been positively impacted by stabilizing commodity prices.
The Fund invested in futures to achieve the desired exposure during the Reporting Period. This investment was not material to the fund.
On an individual security level, the top positive contributors to the Fund’s performance were Tencent Holdings Ltd., Alibaba Group Holding Ltd. ADR, and Taiwan Semiconductor Manufacturing Co., Ltd. The top negative contributors to the Fund’s performance were Sun Pharamaceutical Industries, Ltd, Tata Motors Ltd. ADR, and China Mobile Ltd.
| * | Prior to October 16, 2017, the SPDR Portfolio Emerging Markets ETF was known as SPDR S&P Emerging Markets ETF. |
The views expressed above reflect those of the Fund’s portfolio manager only through the Reporting Period, and do not necessarily represent the views of the Adviser as a whole. Any such views are subject to change at any time based upon market or other conditions and the Adviser disclaims any responsibility to update such views. These views may not be relied on as investment advice and, because investment decisions for a fund are based on numerous factors, may not be relied on as an indication of trading intent on behalf of any fund.
2
Table of Contents
SPDR PORTFOLIO EMERGING MARKETS ETF
PERFORMANCE SUMMARY (UNAUDITED)
Performance as of September 30, 2017
| Cumulative Total Return | Average Annual Total Return | |||||||||||||||||||||||||||||
| Net Asset Value |
Market Value |
S&P Emerging BMI Index |
Net Asset Value |
Market Value |
S&P Emerging BMI Index |
|||||||||||||||||||||||||
| ONE YEAR | 21.36 | % | 21.11 | % | 21.92 | % | 21.36 | % | 21.11 | % | 21.92 | % | ||||||||||||||||||
| FIVE YEARS | 24.25 | % | 25.68 | % | 26.42 | % | 4.44 | % | 4.68 | % | 4.80 | % | ||||||||||||||||||
| TEN YEARS | 20.16 | % | 20.66 | % | 20.93 | % | 1.85 | % | 1.90 | % | 1.92 | % | ||||||||||||||||||
Comparison of Change in Value of a $10,000 Investment
(Based on Net Asset Value)
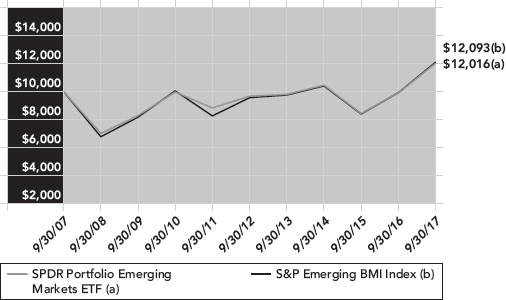
Line graph is based on cumulative total return.
The total expense ratio for SPDR Portfolio Emerging Markets ETF as stated in the Fees and Expenses table of the prospectus dated January 31, 2017 (as supplemented June 30, 2017) was 0.59%.
Performance quoted represents past performance, which is no guarantee of future results. Investment return and principal value will fluctuate, so you may have a gain or loss when shares are sold. Current performance may be higher or lower than that quoted. Visit www.spdrs.com for most recent month-end performance. The returns do not reflect the deduction of taxes that a shareholder would pay on Fund distributions or on the redemption or sale of Fund shares. See ‘‘Notes to Performance Summary” on page 1 for more information.
3
Table of Contents
SPDR PORTFOLIO EMERGING MARKETS ETF
PORTFOLIO STATISTICS (UNAUDITED)
Top Ten Holdings as of September 30, 2017
| Description |
% of Net Assets |
|||||||
| Tencent Holdings, Ltd. |
4.8 | % | ||||||
| Alibaba Group Holding, Ltd. ADR |
3.7 | |||||||
| Taiwan Semiconductor Manufacturing Co., Ltd. |
2.1 | |||||||
| Naspers, Ltd. |
1.8 | |||||||
| China Construction Bank Corp. |
1.6 | |||||||
| Baidu, Inc. ADR |
1.4 | |||||||
| Industrial & Commercial Bank of China, Ltd. |
1.1 | |||||||
| China Mobile, Ltd. |
1.1 | |||||||
| Itau Unibanco Holding SA Preference Shares ADR |
1.1 | |||||||
| Housing Development Finance Corp., Ltd. |
1.0 | |||||||
| TOTAL |
19.7 | % | ||||||
(The ten largest holdings are subject to change, and there are no guarantees the Fund will continue to remain invested in any particular company.)
Sector Breakdown as of September 30, 2017
|
% of Net Assets |
||||||||
| Financials |
24.0 | % | ||||||
| Information Technology |
21.5 | |||||||
| Consumer Discretionary |
10.9 | |||||||
| Energy |
7.9 | |||||||
| Materials |
7.8 | |||||||
| Consumer Staples |
6.9 | |||||||
| Industrials |
6.3 | |||||||
| Telecommunication Services |
5.1 | |||||||
| Real Estate |
4.1 | |||||||
| Utilities |
2.7 | |||||||
| Health Care |
2.1 | |||||||
| Short-Term Investments |
1.5 | |||||||
| Liabilities in Excess of Other Assets |
(0.8 | ) | ||||||
| TOTAL |
100.0 | % | ||||||
(The Fund’s sector breakdown is expressed as a percentage of net assets and may change over time.)
4
Table of Contents
SPDR PORTFOLIO WORLD EX-US ETF
MANAGEMENT’S DISCUSSION OF FUND PERFORMANCE
(UNAUDITED)
The SPDR Portfolio World ex-US ETF (the “Fund”)* seeks to provide investment results that, before fees and expenses, correspond generally to the total return performance of an index based upon the developed world (ex-US) equity markets. The Fund’s benchmark is the S&P Developed Ex-U.S.BMI Index (the “Index”).
For the 12-month period ended September 30, 2017 (the “Reporting Period”), the total return for the Fund was 18.75%, and the Index was 18.88%. The Fund and Index returns reflect the reinvestment of dividends and other income. The Fund’s performance reflects the expenses of managing the Fund, including brokerage and advisory expenses. The Index is unmanaged and Index returns do not reflect fees and expenses of any kind, which would have a negative impact on returns. Cash, security misweights, transaction costs and compounding (the exponential growth of outperformance or underperformance) also contributed to the difference between the Fund’s performance and that of the Index
Despite a rough start in the first quarter of the period with slightly negative returns, the Fund was able to bounce back the following three quarters and finished up with double digit positive performance. Initial start to the final quarter of 2016 was shadowed with doubts pertaining to the U.S. political election, but the trading days following the Trump victory saw a surprising but persistent rise in growth assets. The first quarter of 2017 witnessed an optimistic tone in all regional indices globally, largely on the back of growth expectations. In addition to an improving economic backdrop, European shares in the Fund benefitted from an easing of political uncertainty with the defeat of populist candidates in the Netherlands in February and in presidential polls in France that spanned April and May. The third quarter of 2017 also saw a positive performance for the Fund as markets continued to rally on back of strong retail sales and improved macroeconomic and manufacturing data.
The Fund did not invest in derivatives during the Reporting Period.
On an individual security level, the top positive contributors to the Fund’s performance were Samsung Electronics Co., Ltd., HSBC Holdings PLC, and Banco Santander SA. The top negative contributors to the Fund’s performance were Anheuser-Busch InBev SA/NV, Shire PLC, and Teva Pharmaceutical Industries Ltd.
* Prior to October 16, 2017, the SPDR Portfolio World ex-US ETF was known as SPDR S&P World ex-US ETF.
The views expressed above reflect those of the Fund’s portfolio manager only through the Reporting Period, and do not necessarily represent the views of the Adviser as a whole. Any such views are subject to change at any time based upon market or other conditions and the Adviser disclaims any responsibility to update such views. These views may not be relied on as investment advice and, because investment decisions for a fund are based on numerous factors, may not be relied on as an indication of trading intent on behalf of any fund.
5
Table of Contents
SPDR PORTFOLIO WORLD EX-US ETF
PERFORMANCE SUMMARY (UNAUDITED)
Performance as of September 30, 2017
| Cumulative Total Return |
Average Annual Total Return | |||||||||||||||||||||||||||||
| Net Asset Value |
Market Value |
S&P Developed Ex-US BMI Index |
Net Asset Value |
Market Value |
S&P Developed Ex-US BMI Index |
|||||||||||||||||||||||||
| ONE YEAR | 18.75 | % | 19.10 | % | 18.88 | % | 18.75 | % | 19.10 | % | 18.88 | % | ||||||||||||||||||
| FIVE YEARS | 46.63 | % | 47.47 | % | 48.92 | % | 7.96 | % | 8.08 | % | 8.29 | % | ||||||||||||||||||
| TEN YEARS | 17.41 | % | 17.85 | % | 18.97 | % | 1.62 | % | 1.66 | % | 1.75 | % | ||||||||||||||||||
Comparison of Change in Value of a $10,000 Investment
(Based on Net Asset Value)
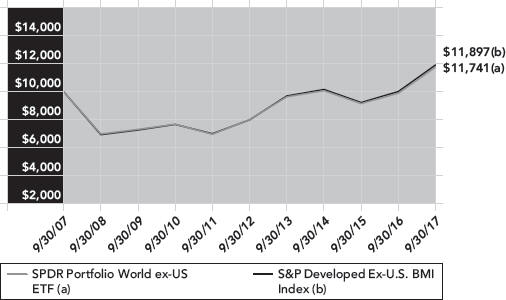
The total expense ratio for SPDR Portfolio World Ex-US ETF as stated in the Fees and Expenses table of the prospectus dated January 31, 2017 (as supplemented June 30, 2017) was 0.34%.
Performance quoted represents past performance, which is no guarantee of future results. Investment return and principal value will fluctuate, so you may have a gain or loss when shares are sold. Current performance may be higher or lower than that quoted. Visit www.spdrs.com for most recent month-end performance. The returns do not reflect the deduction of taxes that a shareholder would pay on Fund distributions or on the redemption or sale of Fund shares. See ‘‘Notes to Performance Summary’’ on page 1 for more information.
6
Table of Contents
SPDR PORTFOLIO WORLD EX-US ETF
PORTFOLIO STATISTICS (UNAUDITED)
Top Ten Holdings as of September 30, 2017
| Description |
% of Net Assets |
|||||||
| Samsung Electronics Co., Ltd. GDR |
1.3 | % | ||||||
| Nestle SA |
1.3 | |||||||
| Novartis AG |
1.1 | |||||||
| HSBC Holdings PLC |
1.0 | |||||||
| Roche Holding AG |
0.9 | |||||||
| Toyota Motor Corp. |
0.9 | |||||||
| British American Tobacco PLC |
0.7 | |||||||
| Royal Dutch Shell PLC |
0.7 | |||||||
| TOTAL SA |
0.7 | |||||||
| BP PLC |
0.6 | |||||||
| TOTAL |
9.2 | % | ||||||
(The ten largest holdings are subject to change, and there are no guarantees the Fund will continue to remain invested in any particular company.)
Sector Breakdown as of September 30, 2017
|
% of Net Assets |
||||||||
| Financials |
21.0 | % | ||||||
| Industrials |
14.5 | |||||||
| Consumer Discretionary |
12.0 | |||||||
| Consumer Staples |
10.0 | |||||||
| Health Care |
9.2 | |||||||
| Information Technology |
8.4 | |||||||
| Materials |
8.2 | |||||||
| Energy |
5.8 | |||||||
| Real Estate |
3.8 | |||||||
| Telecommunication Services |
3.5 | |||||||
| Utilities |
3.1 | |||||||
| Short-Term Investments |
2.4 | |||||||
| Liabilities in Excess of Other Assets |
(1.9 | ) | ||||||
| TOTAL |
100.0 | % | ||||||
(The Fund’s sector breakdown is expressed as a percentage of net assets and may change over time.)
7
Table of Contents
SPDR Portfolio Emerging Markets ETF
(formerly, SPDR S&P Emerging Markets ETF)
SCHEDULE OF INVESTMENTS
September 30, 2017
| Security Description |
Shares | Value | ||||||
| COMMON STOCKS — 99.3% |
||||||||
| BRAZIL — 8.7% |
||||||||
| Ambev SA ADR |
568,929 | $ | 3,749,242 | |||||
| B2W Cia Digital (a) |
10,229 | 68,363 | ||||||
| B3 SA - Brasil Bolsa Balcao |
223,459 | 1,691,935 | ||||||
| Banco Bradesco SA Preference Shares ADR |
485,145 | 5,370,555 | ||||||
| Banco Bradesco SA |
25,200 | 266,089 | ||||||
| Banco do Brasil SA |
105,290 | 1,161,697 | ||||||
| Banco Pan SA Preference Shares (a) |
43,930 | 26,110 | ||||||
| Banco Santander Brasil SA |
2,420 | 21,146 | ||||||
| BB Seguridade Participacoes SA |
69,838 | 632,111 | ||||||
| BR Malls Participacoes SA |
143,104 | 636,541 | ||||||
| Bradespar SA Preference Shares |
58,165 | 443,158 | ||||||
| Brasil Brokers Participacoes SA (a) |
22,191 | 8,699 | ||||||
| Braskem SA Preference Shares ADR |
22,505 | 601,784 | ||||||
| BRF SA ADR (a) (b) |
64,035 | 922,744 | ||||||
| CCR SA |
62,761 | 351,389 | ||||||
| Centrais Eletricas Brasileiras SA ADR (a) (b) |
72,081 | 446,902 | ||||||
| Cia Brasileira de Distribuicao ADR (a) |
28,474 | 673,980 | ||||||
| Cia de Saneamento Basico do Estado de Sao Paulo |
91,576 | 963,485 | ||||||
| Cia Energetica de Minas Gerais ADR (b) |
160,801 | 398,786 | ||||||
| Cia Energetica de Sao Paulo Class B, Preference Shares |
6,389 | 29,146 | ||||||
| Cia Hering |
5,036 | 45,295 | ||||||
| Cia Siderurgica Nacional SA ADR (a) (b) |
184,315 | 545,572 | ||||||
| Cielo SA |
129,816 | 902,061 | ||||||
| Construtora Tenda SA (a) |
730 | 3,789 | ||||||
| Cosan Logistica SA (a) |
5,233 | 14,807 | ||||||
| Cosan SA Industria e Comercio |
22,997 | 263,184 | ||||||
| CPFL Energia SA |
16,914 | 145,551 | ||||||
| Cyrela Brazil Realty SA Empreendimentos e Participacoes |
64,792 | 282,671 | ||||||
| Duratex SA |
49,508 | 148,220 | ||||||
| Eletropaulo Metropolitana Eletricidade de Sao Paulo SA Preference Shares |
3,919 | 15,698 | ||||||
| Embraer SA |
98,966 | 559,727 | ||||||
| Engie Brasil Energia SA |
23,842 | 273,232 | ||||||
| Estacio Participacoes SA |
27,871 | 273,058 | ||||||
| Eternit SA (a) |
20,314 | 7,321 | ||||||
| Fibria Celulose SA ADR |
35,461 | 480,142 | ||||||
| GAEC Educacao SA |
3,234 | 23,617 | ||||||
| Gafisa SA (a) |
828 | 3,591 | ||||||
| Gerdau SA ADR (b) |
137,260 | 470,802 | ||||||
| Hypermarcas SA |
5,932 | 60,386 | ||||||
| Itau Unibanco Holding SA Preference Shares ADR |
438,050 | 6,001,285 | ||||||
| Itausa - Investimentos Itau SA Preference Shares |
593,861 | 2,070,811 | ||||||
See accompanying notes to financial statements.
8
Table of Contents
SPDR Portfolio Emerging Markets ETF
(formerly, SPDR S&P Emerging Markets ETF)
SCHEDULE OF INVESTMENTS (continued)
September 30, 2017
| Security Description |
Shares | Value | ||||||
| Itausa - Investimentos Itau SA |
55,084 | $ | 182,676 | |||||
| JBS SA |
45,724 | 122,869 | ||||||
| Kepler Weber SA (a) |
2,407 | 17,274 | ||||||
| Klabin SA |
18,868 | 109,457 | ||||||
| Kroton Educacional SA |
138,093 | 875,319 | ||||||
| Log-in Logistica Intermodal SA (a) |
2,664 | 2,998 | ||||||
| Lojas Americanas SA Preference Shares |
118,880 | 723,469 | ||||||
| Lojas Renner SA |
179,904 | 2,050,911 | ||||||
| Magnesita Refratarios SA |
6,039 | 77,512 | ||||||
| Marcopolo SA Preference Shares |
45,856 | 63,062 | ||||||
| Metalurgica Gerdau SA Preference Shares (a) |
182,829 | 305,760 | ||||||
| Mills Estruturas e Servicos de Engenharia SA (a) |
9,006 | 13,211 | ||||||
| MMX Mineracao e Metalicos SA (a) |
4,073 | 4,391 | ||||||
| MRV Engenharia e Participacoes SA |
11,270 | 49,026 | ||||||
| Natura Cosmeticos SA |
35,411 | 349,279 | ||||||
| Oi SA ADR (a) |
317 | 2,469 | ||||||
| PDG Realty SA Empreendimentos e Participacoes (a) |
3,603 | 2,802 | ||||||
| Petroleo Brasileiro SA Preference Shares ADR (a) |
275,715 | 2,663,407 | ||||||
| Petroleo Brasileiro SA ADR (a) |
122,806 | 1,232,972 | ||||||
| Profarma Distribuidora de Produtos Farmaceuticos SA (a) |
3,163 | 8,790 | ||||||
| Prumo Logistica SA (a) |
3,611 | 12,729 | ||||||
| Qualicorp SA |
9,864 | 118,188 | ||||||
| Raia Drogasil SA |
7,668 | 181,812 | ||||||
| Restoque Comercio e Confeccoes de Roupas SA (a) |
1,870 | 24,002 | ||||||
| Rodobens Negocios Imobiliarios SA (a) |
10,193 | 19,302 | ||||||
| Rossi Residencial SA (a) |
14,444 | 33,289 | ||||||
| Rumo SA (a) |
7,443 | 28,448 | ||||||
| Suzano Papel e Celulose SA Class A, Preference Shares |
10,004 | 57,908 | ||||||
| T4F Entretenimento SA |
17,969 | 49,309 | ||||||
| Telefonica Brasil SA ADR |
25,473 | 403,492 | ||||||
| Telefonica Brasil SA Preference Shares |
83,061 | 1,325,289 | ||||||
| Tim Participacoes SA ADR |
28,540 | 521,711 | ||||||
| TOTVS SA |
7,240 | 71,641 | ||||||
| Ultrapar Participacoes SA |
33,831 | 805,467 | ||||||
| Usinas Siderurgicas de Minas Gerais SA ADR (a) (b) |
98,850 | 247,125 | ||||||
| Vale SA ADR |
380,380 | 3,830,427 | ||||||
| WEG SA |
149,508 | 1,011,483 | ||||||
|
|
|
|||||||
| 48,653,958 | ||||||||
|
|
|
|||||||
| CHILE — 1.7% |
||||||||
| AntarChile SA |
39,612 | 582,593 | ||||||
| Empresas COPEC SA |
94,833 | 1,243,454 | ||||||
| Empresas Iansa SA |
804,780 | 24,063 | ||||||
| Enel Americas SA ADR |
102,323 | 1,045,741 | ||||||
See accompanying notes to financial statements.
9
Table of Contents
SPDR Portfolio Emerging Markets ETF
(formerly, SPDR S&P Emerging Markets ETF)
SCHEDULE OF INVESTMENTS (continued)
September 30, 2017
| Security Description |
Shares | Value | ||||||
| Enel Chile SA ADR |
81,470 | $ | 488,820 | |||||
| Enel Generacion Chile SA ADR |
21,204 | 558,938 | ||||||
| Enjoy SA (a) |
414,294 | 36,903 | ||||||
| Latam Airlines Group SA ADR |
63,037 | 835,240 | ||||||
| Multiexport Foods SA |
425,902 | 166,161 | ||||||
| Parque Arauco SA |
638,881 | 1,749,718 | ||||||
| SACI Falabella |
236,125 | 2,306,055 | ||||||
| Sociedad Quimica y Minera de Chile SA Class B, Preference Shares |
2,804 | 155,786 | ||||||
| Vina Concha y Toro SA ADR (b) |
13,925 | 461,335 | ||||||
|
|
|
|||||||
| 9,654,807 | ||||||||
|
|
|
|||||||
| CHINA — 31.1% |
||||||||
| 21Vianet Group, Inc. ADR (a) (b) |
1,624 | 9,241 | ||||||
| 3SBio, Inc. (a) (b) (c) |
74,000 | 118,617 | ||||||
| 500.com, Ltd. Class A, ADR (a) (b) |
928 | 10,208 | ||||||
| 58.com, Inc. ADR (a) |
3,940 | 248,772 | ||||||
| AAC Technologies Holdings, Inc. |
118,492 | 1,990,366 | ||||||
| Agile Group Holdings, Ltd. (b) |
490,999 | 716,631 | ||||||
| Agricultural Bank of China, Ltd. Class H |
2,782,000 | 1,246,623 | ||||||
| Air China, Ltd. Class H |
327,744 | 272,326 | ||||||
| Alibaba Group Holding, Ltd. ADR (a) (b) |
120,788 | 20,861,295 | ||||||
| Aluminum Corp. of China, Ltd. Class H (a) (b) |
780,000 | 700,040 | ||||||
| Angang Steel Co., Ltd. Class H (b) |
158,640 | 139,940 | ||||||
| Anhui Conch Cement Co., Ltd. Class H |
271,135 | 1,081,319 | ||||||
| Anhui Expressway Co., Ltd. Class H |
8,000 | 6,094 | ||||||
| ANTA Sports Products, Ltd. |
77,000 | 323,844 | ||||||
| Anton Oilfield Services Group (a) (b) |
130,000 | 12,816 | ||||||
| Autohome, Inc. ADR (a) |
3,485 | 209,379 | ||||||
| AVIC International Holding HK, Ltd. (a) |
334,000 | 24,802 | ||||||
| AVIC International Holdings, Ltd. Class H |
154,000 | 86,753 | ||||||
| AviChina Industry & Technology Co., Ltd. Class H |
240,000 | 145,032 | ||||||
| BAIC Motor Corp., Ltd. Class H (b) (c) |
6,500 | 6,167 | ||||||
| Baidu, Inc. ADR (a) |
31,509 | 7,804,464 | ||||||
| BAIOO Family Interactive, Ltd. (c) |
318,000 | 22,799 | ||||||
| Bank of China, Ltd. Class H |
7,954,900 | 3,921,078 | ||||||
| Bank of Communications Co., Ltd. Class H |
2,253,864 | 1,644,798 | ||||||
| BBMG Corp. Class H (b) |
78,000 | 39,546 | ||||||
| Beijing Capital International Airport Co., Ltd. Class H |
468,000 | 697,443 | ||||||
| Beijing Capital Land, Ltd. Class H |
28,000 | 15,630 | ||||||
| Beijing Enterprises Holdings, Ltd. |
69,500 | 373,718 | ||||||
| Beijing Enterprises Water Group, Ltd. (a) |
492,000 | 396,210 | ||||||
| Beijing Jingneng Clean Energy Co., Ltd. Class H |
136,000 | 37,958 | ||||||
| Bitauto Holdings, Ltd. ADR (a) (b) |
2,088 | 93,292 | ||||||
| BOE Technology Group Co., Ltd. Class B |
82,800 | 39,329 | ||||||
See accompanying notes to financial statements.
10
Table of Contents
SPDR Portfolio Emerging Markets ETF
(formerly, SPDR S&P Emerging Markets ETF)
SCHEDULE OF INVESTMENTS (continued)
September 30, 2017
| Security Description |
Shares | Value | ||||||
| Boer Power Holdings, Ltd. (a) |
7,000 | $ | 1,837 | |||||
| Boyaa Interactive International, Ltd. (a) (b) |
64,000 | 25,565 | ||||||
| Brilliance China Automotive Holdings, Ltd. |
326,000 | 868,142 | ||||||
| Byd Co., Ltd. Class H (b) |
71,000 | 658,577 | ||||||
| BYD Electronic International Co., Ltd. (b) |
69,500 | 205,545 | ||||||
| C.banner International Holdings, Ltd. (a) |
12,000 | 4,225 | ||||||
| Cabbeen Fashion, Ltd. |
88,000 | 24,336 | ||||||
| CAR, Inc. (a) (b) |
79,000 | 72,216 | ||||||
| CGN Mining Co., Ltd. |
325,000 | 21,637 | ||||||
| CGN Power Co., Ltd. Class H (c) |
1,046,000 | 289,265 | ||||||
| Changyou.com, Ltd. ADR (a) |
696 | 27,569 | ||||||
| Chanjet Information Technology Co., Ltd. Class H (a) |
2,600 | 4,088 | ||||||
| Chaowei Power Holdings, Ltd. (b) |
75,000 | 43,402 | ||||||
| Cheetah Mobile, Inc. ADR (a) (b) |
1,160 | 9,756 | ||||||
| China Aerospace International Holdings, Ltd. |
164,000 | 21,627 | ||||||
| China Agri-Industries Holdings, Ltd. |
148,000 | 68,972 | ||||||
| China Aircraft Leasing Group Holdings, Ltd. |
6,500 | 6,741 | ||||||
| China Aoyuan Property Group, Ltd. |
86,000 | 48,006 | ||||||
| China Biologic Products Holdings, Inc. (a) |
1,761 | 162,487 | ||||||
| China Child Care Corp., Ltd. (a) |
155,000 | 9,029 | ||||||
| China Cinda Asset Management Co., Ltd. Class H |
1,304,000 | 480,817 | ||||||
| China CITIC Bank Corp., Ltd. Class H |
1,221,000 | 775,367 | ||||||
| China Coal Energy Co., Ltd. Class H (b) |
780,000 | 368,494 | ||||||
| China Communications Construction Co., Ltd. Class H |
549,241 | 685,611 | ||||||
| China Communications Services Corp., Ltd. Class H |
152,000 | 78,231 | ||||||
| China Conch Venture Holdings, Ltd. |
162,700 | 316,622 | ||||||
| China Construction Bank Corp. Class H |
10,610,280 | 8,802,619 | ||||||
| China Datang Corp. Renewable Power Co., Ltd. Class H |
222,000 | 27,854 | ||||||
| China Distance Education Holdings, Ltd. ADR |
1,392 | 9,299 | ||||||
| China Dongxiang Group Co., Ltd. |
82,000 | 14,278 | ||||||
| China Eastern Airlines Corp., Ltd. Class H |
144,000 | 71,164 | ||||||
| China Electronics Corp. Holdings Co., Ltd. (b) |
134,000 | 24,533 | ||||||
| China Energine International Holdings, Ltd. (a) (b) |
288,000 | 18,067 | ||||||
| China Everbright International, Ltd. |
298,000 | 373,897 | ||||||
| China Everbright, Ltd. |
24,000 | 55,186 | ||||||
| China Evergrande Group (a) (b) |
457,000 | 1,594,383 | ||||||
| China Fangda Group Co., Ltd. Class B |
328,100 | 226,835 | ||||||
| China Financial Services Holdings, Ltd. |
182,000 | 15,379 | ||||||
| China Foods, Ltd. |
16,000 | 8,153 | ||||||
| China Galaxy Securities Co., Ltd. Class H |
313,900 | 275,291 | ||||||
| China Hanking Holdings, Ltd. |
91,000 | 14,097 | ||||||
| China Harmony New Energy Auto Holding, Ltd. (a) (b) |
7,000 | 4,069 | ||||||
| China Hongqiao Group, Ltd. (a) (b) |
24,500 | 22,114 | ||||||
| China Huarong Energy Co., Ltd. (a) (b) |
128,400 | 6,658 | ||||||
See accompanying notes to financial statements.
11
Table of Contents
SPDR Portfolio Emerging Markets ETF
(formerly, SPDR S&P Emerging Markets ETF)
SCHEDULE OF INVESTMENTS (continued)
September 30, 2017
| Security Description |
Shares | Value | ||||||
| China Huishan Dairy Holdings Co., Ltd. (b) (d) |
310,600 | $ | — | |||||
| China Huiyuan Juice Group, Ltd. (a) |
44,500 | 13,730 | ||||||
| China International Marine Containers Group Co., Ltd. Class H |
22,900 | 43,274 | ||||||
| China Lesso Group Holdings, Ltd. |
77,000 | 52,545 | ||||||
| China Life Insurance Co., Ltd. Class H |
843,260 | 2,510,120 | ||||||
| China Lodging Group, Ltd. ADR (a) |
2,088 | 248,096 | ||||||
| China Longyuan Power Group Corp., Ltd. Class H |
241,000 | 179,577 | ||||||
| China Machinery Engineering Corp. Class H |
14,000 | 8,747 | ||||||
| China Medical System Holdings, Ltd. |
163,000 | 284,651 | ||||||
| China Mengniu Dairy Co., Ltd. (a) |
456,620 | 1,277,369 | ||||||
| China Merchants Bank Co., Ltd. Class H |
551,923 | 1,939,684 | ||||||
| China Merchants China Direct Investments, Ltd. |
4,000 | 6,678 | ||||||
| China Merchants Port Holdings Co., Ltd. |
173,820 | 536,323 | ||||||
| China Minsheng Banking Corp., Ltd. Class H (b) |
637,900 | 584,757 | ||||||
| China Mobile, Ltd. |
621,366 | 6,296,634 | ||||||
| China Modern Dairy Holdings, Ltd. (a) (b) |
6,000 | 1,306 | ||||||
| China Molybdenum Co., Ltd. Class H |
222,000 | 133,302 | ||||||
| China National Accord Medicines Corp., Ltd. Class B |
7,100 | 36,160 | ||||||
| China National Building Material Co., Ltd. Class H (b) |
156,000 | 108,052 | ||||||
| China National Materials Co., Ltd. |
86,000 | 48,446 | ||||||
| China Oilfield Services, Ltd. Class H |
321,723 | 294,509 | ||||||
| China Overseas Grand Oceans Group, Ltd. |
73,000 | 47,105 | ||||||
| China Overseas Land & Investment, Ltd. |
627,200 | 2,039,623 | ||||||
| China Pacific Insurance Group Co., Ltd. Class H |
268,800 | 1,158,042 | ||||||
| China Petroleum & Chemical Corp. Class H |
3,099,200 | 2,321,216 | ||||||
| China Power Clean Energy Development Co., Ltd. |
34,246 | 19,248 | ||||||
| China Power International Development, Ltd. |
780,000 | 256,648 | ||||||
| China Railway Construction Corp., Ltd. Class H |
278,990 | 353,618 | ||||||
| China Railway Group, Ltd. Class H |
635,487 | 525,593 | ||||||
| China Rare Earth Holdings, Ltd. (a) |
169,200 | 13,214 | ||||||
| China Resources Beer Holdings Co., Ltd. |
178,625 | 483,685 | ||||||
| China Resources Gas Group, Ltd. |
44,000 | 153,226 | ||||||
| China Resources Land, Ltd. |
338,222 | 1,034,927 | ||||||
| China Resources Power Holdings Co., Ltd. |
318,432 | 574,838 | ||||||
| China Sanjiang Fine Chemicals Co., Ltd. |
73,000 | 24,580 | ||||||
| China Shenhua Energy Co., Ltd. Class H |
539,056 | 1,267,117 | ||||||
| China Singyes Solar Technologies Holdings, Ltd. (b) |
9,600 | 3,208 | ||||||
| China South City Holdings, Ltd. |
166,000 | 47,394 | ||||||
| China Southern Airlines Co., Ltd. Class H |
156,000 | 107,453 | ||||||
| China State Construction International Holdings, Ltd. (b) |
142,000 | 206,891 | ||||||
| China Taiping Insurance Holdings Co., Ltd. |
124,035 | 331,895 | ||||||
| China Telecom Corp., Ltd. Class H |
2,037,615 | 1,043,499 | ||||||
| China Travel International Investment Hong Kong, Ltd. (b) |
790,000 | 289,270 | ||||||
| China Unicom Hong Kong, Ltd. (a) |
629,668 | 875,491 | ||||||
See accompanying notes to financial statements.
12
Table of Contents
SPDR Portfolio Emerging Markets ETF
(formerly, SPDR S&P Emerging Markets ETF)
SCHEDULE OF INVESTMENTS (continued)
September 30, 2017
| Security Description |
Shares | Value | ||||||
| China Vanke Co., Ltd. Class H |
117,100 | $ | 385,301 | |||||
| China Yurun Food Group, Ltd. (a) |
12,000 | 1,429 | ||||||
| China ZhengTong Auto Services Holdings, Ltd. |
38,000 | 41,256 | ||||||
| ChinaCache International Holdings, Ltd. ADR (a) (b) |
2,088 | 1,775 | ||||||
| Chinasoft International, Ltd. |
142,000 | 78,720 | ||||||
| Chong Sing Holdings FinTech Gr (a) (b) |
529,618 | 71,875 | ||||||
| Chongqing Changan Automobile Co., Ltd. Class B |
115,300 | 152,489 | ||||||
| Chongqing Machinery & Electric Co., Ltd. Class H |
138,000 | 17,315 | ||||||
| CIFI Holdings Group Co., Ltd. |
26,000 | 14,480 | ||||||
| CIMC Enric Holdings, Ltd. (a) |
10,000 | 6,542 | ||||||
| CITIC Resources Holdings, Ltd. (b) |
162,000 | 18,667 | ||||||
| CITIC Securities Co., Ltd. Class H |
188,000 | 413,515 | ||||||
| CITIC Telecom International Holdings, Ltd. |
80,000 | 23,045 | ||||||
| CITIC, Ltd. |
703,000 | 1,038,655 | ||||||
| CNOOC, Ltd. |
2,032,603 | 2,623,150 | ||||||
| Cogobuy Group (b) (c) |
64,000 | 39,331 | ||||||
| Colour Life Services Group Co., Ltd. (b) |
69,000 | 44,789 | ||||||
| Comtec Solar Systems Group, Ltd. (a) |
296,000 | 14,022 | ||||||
| Coolpad Group, Ltd. (a) (d) |
253,600 | 11,689 | ||||||
| COSCO SHIPPING Development Co., Ltd. Class H (a) |
930,117 | 210,776 | ||||||
| COSCO SHIPPING Energy Transportation Co., Ltd. Class H |
296,000 | 164,093 | ||||||
| COSCO SHIPPING Holdings Co., Ltd. Class H (a) |
470,925 | 252,625 | ||||||
| COSCO SHIPPING Ports, Ltd. |
318,368 | 354,209 | ||||||
| Cosmo Lady China Holdings Co., Ltd. (b) (c) |
71,000 | 27,907 | ||||||
| Country Garden Holdings Co., Ltd. |
677,466 | 1,077,257 | ||||||
| CRRC Corp., Ltd. Class H |
461,000 | 409,610 | ||||||
| CSG Holding Co., Ltd. Class B |
16,100 | 9,956 | ||||||
| Ctrip.com International, Ltd. ADR (a) |
38,487 | 2,029,804 | ||||||
| Daqo New Energy Corp. ADR (a) |
1,392 | 40,396 | ||||||
| Datang International Power Generation Co., Ltd. Class H (a) |
936,000 | 299,589 | ||||||
| Dazhong Transportation Group Co., Ltd. Class B |
162,450 | 112,578 | ||||||
| Dongfang Electric Corp., Ltd. Class H (a) |
31,200 | 30,798 | ||||||
| Dongfeng Motor Group Co., Ltd. Class H |
620,000 | 819,184 | ||||||
| E-Commodities Holdings, Ltd. (b) |
6,500 | 641 | ||||||
| Fang Holdings, Ltd. ADR (a) (b) |
19,289 | 78,120 | ||||||
| Fanhua, Inc. ADR |
4,413 | 55,471 | ||||||
| Fantasia Holdings Group Co., Ltd. |
117,000 | 16,627 | ||||||
| Far East Horizon, Ltd. |
233,000 | 218,959 | ||||||
| Fufeng Group, Ltd. |
71,000 | 48,632 | ||||||
| Future Land Holdings Co., Ltd. Class A |
59,871 | 161,060 | ||||||
| Geely Automobile Holdings, Ltd. |
410,000 | 1,154,826 | ||||||
| GF Securities Co., Ltd. Class H |
184,400 | 400,875 | ||||||
| Goldpac Group, Ltd. |
64,000 | 20,894 | ||||||
| GOME Retail Holdings, Ltd. (b) |
1,175,000 | 132,382 | ||||||
See accompanying notes to financial statements.
13
Table of Contents
SPDR Portfolio Emerging Markets ETF
(formerly, SPDR S&P Emerging Markets ETF)
SCHEDULE OF INVESTMENTS (continued)
September 30, 2017
| Security Description |
Shares | Value | ||||||
| Goodbaby International Holdings, Ltd. |
67,000 | $ | 36,971 | |||||
| Grand Baoxin Auto Group, Ltd. (a) |
3,158 | 1,815 | ||||||
| Great Wall Motor Co., Ltd. Class H (b) |
377,250 | 463,672 | ||||||
| Greatview Aseptic Packaging Co., Ltd. |
10,000 | 6,145 | ||||||
| Greentown China Holdings, Ltd. (b) |
72,500 | 87,252 | ||||||
| Guangdong Electric Power Development Co., Ltd. Class B |
222,940 | 101,613 | ||||||
| Guangdong Investment, Ltd. |
626,000 | 892,832 | ||||||
| Guangshen Railway Co., Ltd. Class H (b) |
624,000 | 365,898 | ||||||
| Guangzhou Automobile Group Co., Ltd. Class H |
332,636 | 769,977 | ||||||
| Guangzhou Baiyunshan Pharmaceutical Holdings Co., Ltd. Class H |
6,000 | 15,671 | ||||||
| Guangzhou R&F Properties Co., Ltd. |
280,800 | 650,707 | ||||||
| Guodian Technology & Environment Group Corp., Ltd. Class H (a) |
73,000 | 5,701 | ||||||
| Guotai Junan International Holdings, Ltd. (b) |
225,000 | 71,729 | ||||||
| Haichang Ocean Park Holdings, Ltd. (a) (c) |
86,000 | 21,911 | ||||||
| Haitian International Holdings, Ltd. |
5,000 | 14,371 | ||||||
| Haitong Securities Co., Ltd. Class H |
280,800 | 453,698 | ||||||
| Hangzhou Steam Turbine Co., Ltd. Class B (a) |
46,800 | 51,230 | ||||||
| Harbin Electric Co., Ltd. Class H |
156,000 | 74,298 | ||||||
| Health and Happiness H&H International Holdings, Ltd. (a) (b) |
5,000 | 24,422 | ||||||
| Hengan International Group Co., Ltd. |
80,000 | 740,523 | ||||||
| HNA Infrastructure Co., Ltd. Class H |
65,000 | 61,582 | ||||||
| Honghua Group, Ltd. (a) |
14,000 | 1,201 | ||||||
| Honworld Group, Ltd. (b) (c) |
35,000 | 16,759 | ||||||
| Hopson Development Holdings, Ltd. |
26,000 | 29,659 | ||||||
| Huadian Fuxin Energy Corp., Ltd. Class H |
128,000 | 29,498 | ||||||
| Huadian Power International Corp., Ltd. Class H |
445,308 | 180,160 | ||||||
| Huaneng Power International, Inc. Class H |
624,000 | 385,871 | ||||||
| Huaneng Renewables Corp., Ltd. Class H |
308,000 | 101,737 | ||||||
| Huangshan Tourism Development Co., Ltd. Class B |
107,832 | 170,159 | ||||||
| Huatai Securities Co., Ltd. Class H (c) |
77,400 | 171,434 | ||||||
| Huayi Tencent Entertainment Co., Ltd. (a) (b) |
110,000 | 4,859 | ||||||
| Industrial & Commercial Bank of China, Ltd. Class H |
8,566,590 | 6,361,302 | ||||||
| Inner Mongolia Yitai Coal Co., Ltd. Class B |
57,736 | 86,662 | ||||||
| JA Solar Holdings Co., Ltd. ADR (a) |
2,555 | 19,469 | ||||||
| JD.com, Inc. ADR (a) |
93,875 | 3,586,025 | ||||||
| Jiangnan Group, Ltd. (b) |
134,000 | 7,977 | ||||||
| Jiangsu Expressway Co., Ltd. Class H |
446,000 | 682,930 | ||||||
| Jiangxi Copper Co., Ltd. Class H |
158,000 | 249,622 | ||||||
| JinkoSolar Holding Co., Ltd. ADR (a) (b) |
1,624 | 40,519 | ||||||
| Jumei International Holding, Ltd. ADR (a) (b) |
928 | 2,691 | ||||||
| Kama Co., Ltd. Class B (a) |
13,100 | 14,764 | ||||||
| Kingdee International Software Group Co., Ltd. (a) (b) |
170,000 | 74,872 | ||||||
| Kingsoft Corp., Ltd. |
75,000 | 174,760 | ||||||
| Konka Group Co., Ltd. Class B (a) |
1,644,900 | 688,648 | ||||||
See accompanying notes to financial statements.
14
Table of Contents
SPDR Portfolio Emerging Markets ETF
(formerly, SPDR S&P Emerging Markets ETF)
SCHEDULE OF INVESTMENTS (continued)
September 30, 2017
| Security Description |
Shares | Value | ||||||
| Kunlun Energy Co., Ltd. (b) |
780,000 | $ | 761,955 | |||||
| KWG Property Holding, Ltd. |
167,168 | 178,710 | ||||||
| Lao Feng Xiang Co., Ltd. Class B |
21,830 | 84,351 | ||||||
| Lenovo Group, Ltd. |
1,092,000 | 602,573 | ||||||
| Li Ning Co., Ltd. (a) |
228,333 | 203,464 | ||||||
| Lianhua Supermarket Holdings Co., Ltd. Class H (a) |
13,000 | 5,326 | ||||||
| Lifetech Scientific Corp. (a) (b) |
154,000 | 36,278 | ||||||
| Livzon Pharmaceutical Group, Inc. Class H |
11,866 | 68,668 | ||||||
| Luye Pharma Group, Ltd. (b) |
74,000 | 43,202 | ||||||
| Maanshan Iron & Steel Co., Ltd. Class H (a) (b) |
468,000 | 228,886 | ||||||
| Metallurgical Corp. of China, Ltd. Class H |
158,000 | 51,988 | ||||||
| Minth Group, Ltd. |
34,000 | 178,038 | ||||||
| MOBI Development Co., Ltd. |
228,000 | 42,910 | ||||||
| Momo, Inc. ADR (a) |
1,856 | 58,167 | ||||||
| NetEase, Inc. ADR |
10,816 | 2,853,369 | ||||||
| New China Life Insurance Co., Ltd. Class H |
76,100 | 430,155 | ||||||
| New Oriental Education & Technology Group, Inc. ADR |
12,932 | 1,141,378 | ||||||
| Noah Holdings, Ltd. ADR (a) (b) |
1,392 | 44,697 | ||||||
| NQ Mobile, Inc. Class A, ADR (a) |
4,189 | 14,661 | ||||||
| Ourgame International Holdings, Ltd. (a) |
65,000 | 17,310 | ||||||
| Ozner Water International Holding, Ltd. (a) (b) (c) |
83,000 | 21,359 | ||||||
| Pacific Online, Ltd. |
64,000 | 11,471 | ||||||
| Parkson Retail Group, Ltd. (b) |
194,634 | 32,893 | ||||||
| People’s Insurance Co. Group of China, Ltd. Class H |
553,000 | 247,093 | ||||||
| PetroChina Co., Ltd. Class H |
2,420,970 | 1,534,280 | ||||||
| PICC Property & Casualty Co., Ltd. Class H |
787,506 | 1,389,355 | ||||||
| Ping An Insurance Group Co. of China, Ltd. Class H |
543,000 | 4,167,725 | ||||||
| Poly Culture Group Corp., Ltd. Class H |
7,200 | 17,219 | ||||||
| Poly Property Group Co., Ltd. (a) |
90,000 | 46,206 | ||||||
| PW Medtech Group, Ltd. (a) |
68,000 | 14,539 | ||||||
| ReneSola, Ltd. ADR (a) (b) |
3,861 | 8,996 | ||||||
| Renhe Commercial Holdings Co., Ltd. (a) (b) |
1,709,000 | 39,384 | ||||||
| Semiconductor Manufacturing International Corp. (a) (b) |
282,400 | 318,892 | ||||||
| Shandong Airlines Co., Ltd. Class B |
5,800 | 10,337 | ||||||
| Shandong Chenming Paper Holdings, Ltd. Class B |
30,000 | 54,963 | ||||||
| Shandong Weigao Group Medical Polymer Co., Ltd. Class H |
272,000 | 192,577 | ||||||
| Shanghai Baosight Software Co., Ltd. Class B |
7,200 | 11,059 | ||||||
| Shanghai Electric Group Co., Ltd. Class H (a) (b) |
642,077 | 282,784 | ||||||
| Shanghai Fosun Pharmaceutical Group Co., Ltd. Class H |
33,500 | 138,963 | ||||||
| Shanghai Fudan Microelectronics Group Co., Ltd. Class H (a) |
16,000 | 11,553 | ||||||
| Shanghai Fudan-Zhangjiang Bio-Pharmaceutical Co., Ltd. Class H |
8,000 | 4,087 | ||||||
| Shanghai Greencourt Investment Group Co., Ltd. Class B (a) |
149,848 | 89,160 | ||||||
| Shanghai Huayi Group Corp., Ltd. Class B |
200 | 198 | ||||||
| Shanghai Industrial Urban Development Group, Ltd. |
26,000 | 5,725 | ||||||
See accompanying notes to financial statements.
15
Table of Contents
SPDR Portfolio Emerging Markets ETF
(formerly, SPDR S&P Emerging Markets ETF)
SCHEDULE OF INVESTMENTS (continued)
September 30, 2017
| Security Description |
Shares | Value | ||||||
| Shanghai Jin Jiang International Hotels Group Co., Ltd. Class H |
28,000 | $ | 10,468 | |||||
| Shanghai Jinjiang International Industrial Investment Co., Ltd. Class B |
85,582 | 118,360 | ||||||
| Shanghai Jinjiang International Travel Co., Ltd. Class B |
6,000 | 18,900 | ||||||
| Shanghai Jinqiao Export Processing Zone Development Co., Ltd. Class B |
114,966 | 166,241 | ||||||
| Shanghai Lujiazui Finance & Trade Zone Development Co., Ltd. Class B |
57,040 | 90,751 | ||||||
| Shanghai Pharmaceuticals Holding Co., Ltd. Class H |
31,300 | 76,460 | ||||||
| Shanghai Prime Machinery Co., Ltd. Class H |
136,000 | 28,730 | ||||||
| Shengjing Bank Co., Ltd. Class H (c) |
71,300 | 56,232 | ||||||
| Shenwan Hongyuan HK, Ltd. (b) |
10,000 | 3,649 | ||||||
| Shenzhen Expressway Co., Ltd. Class H |
284,482 | 276,079 | ||||||
| Shenzhen International Holdings, Ltd. |
79,365 | 149,164 | ||||||
| Shenzhen Investment, Ltd. |
189,099 | 85,704 | ||||||
| Shenzhou International Group Holdings, Ltd. |
64,000 | 501,466 | ||||||
| Shougang Concord International Enterprises Co., Ltd. (a) |
440,000 | 12,957 | ||||||
| Shunfeng International Clean Energy, Ltd. (a) |
138,000 | 7,597 | ||||||
| Silver Grant International Industries, Ltd. (a) |
142,000 | 20,362 | ||||||
| SINA Corp. (a) |
9,085 | 1,041,595 | ||||||
| Sinofert Holdings, Ltd. (a) (b) |
130,000 | 23,634 | ||||||
| SinoMedia Holding, Ltd. (a) (b) |
65,000 | 15,479 | ||||||
| Sino-Ocean Group Holding, Ltd. |
610,480 | 407,211 | ||||||
| Sinopec Oilfield Service Corp. Class H (a) (b) |
148,000 | 25,770 | ||||||
| Sinopec Shanghai Petrochemical Co., Ltd. Class H |
622,600 | 370,657 | ||||||
| Sinopharm Group Co., Ltd. Class H |
96,400 | 424,566 | ||||||
| Sinosoft Technology Group, Ltd. (b) |
78,600 | 22,743 | ||||||
| Sinotrans, Ltd. Class H |
704,300 | 357,980 | ||||||
| Sinovac Biotech, Ltd. (a) |
12,489 | 87,923 | ||||||
| SITC International Holdings Co., Ltd. |
69,000 | 62,545 | ||||||
| SOHO China, Ltd. |
45,000 | 25,753 | ||||||
| SPT Energy Group, Inc. (a) |
20,000 | 1,331 | ||||||
| Sunac China Holdings, Ltd. (b) |
156,000 | 714,020 | ||||||
| Sunny Optical Technology Group Co., Ltd. |
74,000 | 1,176,693 | ||||||
| Synertone Communication Corp. (a) |
54,400 | 801 | ||||||
| TCL Multimedia Technology Holdings, Ltd. (b) |
52,000 | 24,633 | ||||||
| Tencent Holdings, Ltd. |
625,367 | 26,917,995 | ||||||
| Tian Ge Interactive Holdings, Ltd. (b) (c) |
70,000 | 50,994 | ||||||
| Tiangong International Co., Ltd. |
138,000 | 15,725 | ||||||
| Tianneng Power International, Ltd. |
130,000 | 134,316 | ||||||
| Tingyi Cayman Islands Holding Corp. |
448,000 | 674,521 | ||||||
| Tong Ren Tang Technologies Co., Ltd. Class H |
10,000 | 12,790 | ||||||
| TravelSky Technology, Ltd. Class H |
309,841 | 807,260 | ||||||
| Trigiant Group, Ltd. |
22,000 | 3,098 | ||||||
| Uni-President China Holdings, Ltd. |
72,000 | 70,887 | ||||||
| Universal Health International Group Holding, Ltd. (a) |
69,000 | 1,431 | ||||||
| V1 Group, Ltd. (a) |
478,200 | 16,530 | ||||||
See accompanying notes to financial statements.
16
Table of Contents
SPDR Portfolio Emerging Markets ETF
(formerly, SPDR S&P Emerging Markets ETF)
SCHEDULE OF INVESTMENTS (continued)
September 30, 2017
| Security Description |
Shares | Value | ||||||
| Vipshop Holdings, Ltd. ADR (a) |
31,858 | $ | 280,032 | |||||
| Want Want China Holdings, Ltd. (b) |
860,000 | 604,478 | ||||||
| Weibo Corp. ADR (a) (b) |
2,592 | 256,452 | ||||||
| West China Cement, Ltd. (a) |
174,000 | 28,292 | ||||||
| Wisdom Sports Group (a) (b) |
75,000 | 12,195 | ||||||
| Xiamen International Port Co., Ltd. Class H |
26,000 | 4,927 | ||||||
| Xinchen China Power Holdings, Ltd. (a) |
81,000 | 11,407 | ||||||
| Xinjiang Goldwind Science & Technology Co., Ltd. Class H (b) |
16,260 | 20,318 | ||||||
| Xinyi Solar Holdings, Ltd. |
306,000 | 108,912 | ||||||
| Yangtze Optical Fibre and Cable Joint Stock, Ltd. Co. Class H (b) (c) |
6,500 | 24,799 | ||||||
| Yanzhou Coal Mining Co., Ltd. Class H |
468,000 | 460,768 | ||||||
| Yestar Healthcare Holdings Co., Ltd. (b) |
22,500 | 9,938 | ||||||
| Yingli Green Energy Holding Co., Ltd. ADR (a) (b) |
2,303 | 5,274 | ||||||
| Yuexiu Property Co., Ltd. |
1,092,000 | 222,295 | ||||||
| Yuexiu Transport Infrastructure, Ltd. |
1,258 | 945 | ||||||
| Yum China Holdings, Inc. (a) |
23,535 | 940,694 | ||||||
| YY, Inc. ADR (a) |
2,782 | 241,422 | ||||||
| Zhaojin Mining Industry Co., Ltd. (b) |
36,500 | 30,842 | ||||||
| Zhejiang Expressway Co., Ltd. Class H |
491,862 | 611,466 | ||||||
| Zhuzhou CRRC Times Electric Co., Ltd. Class H |
73,800 | 413,375 | ||||||
| Zijin Mining Group Co., Ltd. Class H |
849,000 | 291,308 | ||||||
| ZTE Corp. Class H (a) |
157,327 | 514,641 | ||||||
|
|
|
|||||||
| 174,942,906 | ||||||||
|
|
|
|||||||
| COLOMBIA — 0.6% |
||||||||
| Almacenes Exito SA |
16,087 | 84,687 | ||||||
| Avianca Holdings SA Preference Shares |
240,642 | 236,403 | ||||||
| Banco Davivienda SA Preference Shares |
27,055 | 306,411 | ||||||
| Banco de Bogota SA |
8,685 | 203,999 | ||||||
| Bancolombia SA ADR |
9,068 | 415,224 | ||||||
| Bancolombia SA |
25,147 | 280,350 | ||||||
| Bolsa de Valores de Colombia |
15,984,307 | 137,161 | ||||||
| Celsia SA ESP |
15,578 | 24,852 | ||||||
| Cementos Argos SA |
17,658 | 70,350 | ||||||
| Cementos Argos SA Preference Shares |
21,363 | 75,217 | ||||||
| Cemex Latam Holdings SA (a) |
6,077 | 23,880 | ||||||
| Constructora Conconcreto SA |
46,029 | 15,987 | ||||||
| Corp. Financiera Colombiana SA |
8,409 | 82,122 | ||||||
| Ecopetrol SA |
241,965 | 115,349 | ||||||
| Empresa de Telecomunicaciones de Bogota (a) |
476,634 | 83,585 | ||||||
| Grupo Argos SA Preference Shares |
27,378 | 178,994 | ||||||
| Grupo Argos SA |
6,496 | 46,717 | ||||||
| Grupo Aval Acciones y Valores SA |
636,684 | 285,092 | ||||||
| Grupo de Inversiones Suramericana SA Preference Shares |
10,032 | 137,256 | ||||||
See accompanying notes to financial statements.
17
Table of Contents
SPDR Portfolio Emerging Markets ETF
(formerly, SPDR S&P Emerging Markets ETF)
SCHEDULE OF INVESTMENTS (continued)
September 30, 2017
| Security Description |
Shares | Value | ||||||
| Grupo de Inversiones Suramericana SA |
9,848 | $ | 137,086 | |||||
| Grupo Nutresa SA |
8,972 | 81,999 | ||||||
| Interconexion Electrica SA ESP |
36,663 | 170,785 | ||||||
|
|
|
|||||||
| 3,193,506 | ||||||||
|
|
|
|||||||
| CZECH REPUBLIC — 0.3% |
||||||||
| CEZ A/S |
33,008 | 662,541 | ||||||
| Komercni banka A/S |
17,439 | 761,469 | ||||||
| UNIPETROL A/S |
23,529 | 363,867 | ||||||
|
|
|
|||||||
| 1,787,877 | ||||||||
|
|
|
|||||||
| EGYPT — 0.3% |
||||||||
| Commercial International Bank Egypt SAE |
313,749 | 1,450,889 | ||||||
| Egypt Kuwait Holding Co. SAE |
122,974 | 83,622 | ||||||
| Egyptian Financial Group-Hermes Holding Co. |
150,036 | 188,374 | ||||||
| Global Telecom Holding SAE (a) |
287,399 | 104,539 | ||||||
| Orascom Telecom Media And Technology Holding SAE |
67,694 | 2,953 | ||||||
|
|
|
|||||||
| 1,830,377 | ||||||||
|
|
|
|||||||
| GREECE — 0.2% |
||||||||
| Alpha Bank AE (a) |
6,446 | 12,726 | ||||||
| Diana Shipping, Inc. (a) |
5,627 | 20,426 | ||||||
| Ellaktor SA (a) |
266 | 494 | ||||||
| Eurobank Ergasias SA (a) |
5,298 | 4,685 | ||||||
| FF Group (a) |
1,831 | 39,807 | ||||||
| Fourlis Holdings SA (a) |
132 | 918 | ||||||
| Frigoglass SAIC (a) |
77 | 17 | ||||||
| GEK Terna Holding Real Estate Construction SA (a) |
325 | 1,483 | ||||||
| Grivalia Properties REIC AE REIT |
10,219 | 105,104 | ||||||
| Hellenic Exchanges - Athens Stock Exchange SA |
19,381 | 111,811 | ||||||
| Hellenic Telecommunications Organization SA |
16,184 | 195,728 | ||||||
| Holding Co. ADMIE IPTO SA (a) |
5,208 | 11,329 | ||||||
| Intralot SA-Integrated Lottery Systems & Services (a) |
42,961 | 56,375 | ||||||
| JUMBO SA |
6,636 | 109,753 | ||||||
| Marfin Investment Group Holdings SA (a) |
7,345 | 825 | ||||||
| Mytilineos Holdings SA (a) |
159 | 1,569 | ||||||
| National Bank of Greece SA (a) |
3,087 | 1,047 | ||||||
| OPAP SA |
19,975 | 211,349 | ||||||
| Piraeus Bank SA (a) |
49 | 168 | ||||||
| Public Power Corp. SA (a) |
6,444 | 15,160 | ||||||
See accompanying notes to financial statements.
18
Table of Contents
SPDR Portfolio Emerging Markets ETF
(formerly, SPDR S&P Emerging Markets ETF)
SCHEDULE OF INVESTMENTS (continued)
September 30, 2017
| Security Description |
Shares | Value | ||||||
| Terna Energy SA |
171 | $ | 823 | |||||
| Titan Cement Co. SA |
3,201 | 81,058 | ||||||
|
|
|
|||||||
| 982,655 | ||||||||
|
|
|
|||||||
| HONG KONG — 1.2% |
||||||||
| AGTech Holdings, Ltd. (a) (b) |
56,000 | 11,256 | ||||||
| Alibaba Pictures Group, Ltd. (a) (b) |
1,432,400 | 229,237 | ||||||
| AMVIG Holdings, Ltd. |
130,000 | 36,949 | ||||||
| Asian Citrus Holdings, Ltd. (a) (d) |
51,000 | 1,959 | ||||||
| Beijing Enterprises Clean Energy Group, Ltd. (a) (b) |
1,794,856 | 43,431 | ||||||
| BEP International Holdings, Ltd. |
830,000 | 17,321 | ||||||
| Bosideng International Holdings, Ltd. |
160,000 | 14,749 | ||||||
| Carnival Group International Holdings, Ltd. (a) (b) |
680,000 | 36,130 | ||||||
| CGN Meiya Power Holdings Co., Ltd. (a) (c) |
24,000 | 3,288 | ||||||
| Chia Tai Enterprises International, Ltd. (a) |
2,300 | 583 | ||||||
| China All Access Holdings, Ltd. |
28,000 | 8,747 | ||||||
| China Animation Characters Co., Ltd. (b) |
65,000 | 25,132 | ||||||
| China Chengtong Development Group, Ltd. (a) |
488,000 | 36,237 | ||||||
| China Fiber Optic Network System Group, Ltd. (a) (d) |
88,800 | — | ||||||
| China Financial International Investments, Ltd. (a) |
640,000 | 19,338 | ||||||
| China Financial Leasing Group, Ltd. (a) |
80,000 | 1,629 | ||||||
| China Gas Holdings, Ltd. |
288,000 | 862,816 | ||||||
| China High Speed Transmission Equipment Group Co., Ltd. (b) |
32,000 | 41,051 | ||||||
| China Jicheng Holdings, Ltd. (a) (c) |
2,289,000 | 2,931 | ||||||
| China National Culture Group, Ltd. (a) |
670,000 | 1,716 | ||||||
| China NT Pharma Group Co., Ltd. |
276,100 | 72,112 | ||||||
| China Ocean Industry Group, Ltd. (a) (b) |
735,000 | 5,552 | ||||||
| China Oil & Gas Group, Ltd. |
132,000 | 8,957 | ||||||
| China Overseas Property Holdings, Ltd. (b) |
62,066 | 14,860 | ||||||
| China Public Procurement, Ltd. (a) |
67,200 | 2,056 | ||||||
| China Soft Power Technology Holdings, Ltd. (a) (b) |
168,000 | 3,570 | ||||||
| China Vanguard You Champion Holdings, Ltd. (a) |
70,000 | 5,108 | ||||||
| Citychamp Watch & Jewellery Group, Ltd. (b) |
158,000 | 36,614 | ||||||
| Comba Telecom Systems Holdings, Ltd. |
146,117 | 27,874 | ||||||
| Concord New Energy Group, Ltd. |
120,000 | 5,531 | ||||||
| CP Pokphand Co., Ltd. |
500,000 | 40,329 | ||||||
| Digital China Holdings, Ltd. (a) (b) |
88,000 | 49,573 | ||||||
| Essex Bio-technology, Ltd. |
89,000 | 55,834 | ||||||
| Eternity Investment, Ltd. (a) |
40,574 | 909 | ||||||
| Feiyu Technology International Co., Ltd. (a) (c) |
19,500 | 3,071 | ||||||
| First Shanghai Investments, Ltd. (a) |
40,000 | 5,480 | ||||||
| Fullshare Holdings, Ltd. (a) (b) |
699,500 | 304,493 | ||||||
| GCL-Poly Energy Holdings, Ltd. (a) (b) |
853,000 | 116,854 | ||||||
| Global Bio-Chem Technology Group Co., Ltd. (a) |
338,000 | 5,799 | ||||||
See accompanying notes to financial statements.
19
Table of Contents
SPDR Portfolio Emerging Markets ETF
(formerly, SPDR S&P Emerging Markets ETF)
SCHEDULE OF INVESTMENTS (continued)
September 30, 2017
| Security Description |
Shares | Value | ||||||
| Golden Meditech Holdings, Ltd. (a) (b) |
44,000 | $ | 6,197 | |||||
| Haier Electronics Group Co., Ltd. (a) |
72,000 | 175,513 | ||||||
| Hanergy Thin Film Power Group, Ltd. (a) (d) |
856,000 | — | ||||||
| Hengdeli Holdings, Ltd. |
2,129,600 | 115,877 | ||||||
| Hi Sun Technology China, Ltd. (a) |
225,000 | 51,852 | ||||||
| Hua Han Health Industry Holdings, Ltd. (a) (b) (d) |
283,600 | 14,433 | ||||||
| Hua Hong Semiconductor, Ltd. (c) |
7,000 | 9,464 | ||||||
| Huabao International Holdings, Ltd. |
56,000 | 34,629 | ||||||
| Imperial Pacific International Holdings, Ltd. (a) (b) |
3,170,000 | 47,079 | ||||||
| Joy City Property, Ltd. |
332,000 | 61,208 | ||||||
| Ju Teng International Holdings, Ltd. |
134,500 | 53,037 | ||||||
| Kingboard Chemical Holdings, Ltd. |
153,340 | 811,785 | ||||||
| Kingboard Laminates Holdings, Ltd. |
81,500 | 131,682 | ||||||
| Lee & Man Paper Manufacturing, Ltd. |
76,000 | 97,302 | ||||||
| Life Healthcare Group, Ltd. (a) |
88,000 | 2,287 | ||||||
| Millennium Pacific Group Holdings, Ltd. (a) |
190,000 | 3,576 | ||||||
| Munsun Capital Group, Ltd. (a) (b) |
442,000 | 5,093 | ||||||
| National Agricultural Holdings, Ltd. (a) (b) |
72,000 | 10,970 | ||||||
| Neo Telemedia, Ltd. |
1,212,000 | 38,172 | ||||||
| NetDragon Websoft Holdings, Ltd. (b) |
34,500 | 115,284 | ||||||
| NewOcean Energy Holdings, Ltd. (a) (b) |
22,000 | 5,999 | ||||||
| Newtree Group Holdings, Ltd. (a) |
35,000 | 1,972 | ||||||
| Nine Dragons Paper Holdings, Ltd. |
234,000 | 460,169 | ||||||
| Portico International Holdings, Ltd. (a) |
37,000 | 12,127 | ||||||
| Pou Sheng International Holdings, Ltd. (b) |
168,000 | 30,758 | ||||||
| Qianhai Health Holdings, Ltd. (a) (b) |
59,221 | 872 | ||||||
| Real Nutriceutical Group, Ltd. (a) |
113,000 | 4,340 | ||||||
| Shimao Property Holdings, Ltd. |
234,000 | 507,504 | ||||||
| SIM Technology Group, Ltd. |
470,000 | 28,583 | ||||||
| Sino Biopharmaceutical, Ltd. |
462,000 | 488,576 | ||||||
| Skyworth Digital Holdings, Ltd. |
157,225 | 80,316 | ||||||
| Solargiga Energy Holdings, Ltd. (a) |
1,020,000 | 32,647 | ||||||
| SSY Group, Ltd. |
23,740 | 10,851 | ||||||
| Sun Art Retail Group, Ltd. |
122,000 | 113,242 | ||||||
| Suncorp Technologies, Ltd. (a) |
1,480,000 | 6,632 | ||||||
| Tech Pro Technology Development, Ltd. (a) |
448,000 | 3,900 | ||||||
| Tibet Water Resources, Ltd. (a) (b) |
67,000 | 25,991 | ||||||
| United Laboratories International Holdings, Ltd. (a) (b) |
12,000 | 8,942 | ||||||
| Universal Medical Financial & Technical Advisory Services Co., Ltd. (b) (c) |
81,600 | 67,593 | ||||||
| Vision Values Holdings, Ltd. (a) |
90,000 | 6,914 | ||||||
| Wanda Hotel Development Co., Ltd. (a) |
84,000 | 17,315 | ||||||
| Wasion Group Holdings, Ltd. (b) |
24,000 | 12,168 | ||||||
| WH Group, Ltd. (c) |
756,000 | 803,359 | ||||||
See accompanying notes to financial statements.
20
Table of Contents
SPDR Portfolio Emerging Markets ETF
(formerly, SPDR S&P Emerging Markets ETF)
SCHEDULE OF INVESTMENTS (continued)
September 30, 2017
| Security Description |
Shares | Value | ||||||
| Xinyi Automobile Glass Hong Kong Enterprises, Ltd. (a) |
12,250 | $ | 2,494 | |||||
| Xinyi Glass Holdings, Ltd. (a) |
278,000 | 274,772 | ||||||
| Yip’s Chemical Holdings, Ltd. |
10,000 | 3,751 | ||||||
|
|
|
|||||||
| 6,956,303 | ||||||||
|
|
|
|||||||
| HUNGARY — 0.7% |
||||||||
| MOL Hungarian Oil & Gas PLC |
88,392 | 1,009,113 | ||||||
| OTP Bank PLC |
44,629 | 1,680,500 | ||||||
| Richter Gedeon Nyrt |
38,218 | 952,609 | ||||||
|
|
|
|||||||
| 3,642,222 | ||||||||
|
|
|
|||||||
| INDIA — 11.7% |
||||||||
| Adani Enterprises, Ltd. |
1,130 | 2,012 | ||||||
| Adani Ports & Special Economic Zone, Ltd. |
92,060 | 530,980 | ||||||
| Adani Power, Ltd. (a) |
2,692 | 1,218 | ||||||
| Adani Transmission, Ltd. (a) |
1,363 | 3,188 | ||||||
| Aditya Birla Capital, Ltd. (a) (e) |
322 | 906 | ||||||
| AIA Engineering, Ltd. |
1,345 | 27,359 | ||||||
| Alok Industries, Ltd. (a) |
501,100 | 21,480 | ||||||
| Amtek Auto, Ltd. (a) |
13,295 | 4,702 | ||||||
| Anant Raj, Ltd. |
127,722 | 107,543 | ||||||
| Apollo Hospitals Enterprise, Ltd. |
11,395 | 175,321 | ||||||
| Ashok Leyland, Ltd. |
68,560 | 129,206 | ||||||
| Asian Paints, Ltd. |
9,906 | 171,626 | ||||||
| Aurobindo Pharma, Ltd. |
37,196 | 393,855 | ||||||
| Axis Bank, Ltd. |
137,740 | 1,073,642 | ||||||
| Bajaj Finance, Ltd. |
5,679 | 159,802 | ||||||
| Bajaj Hindusthan Sugar, Ltd. (a) |
192,482 | 40,076 | ||||||
| Balrampur Chini Mills, Ltd. |
91,347 | 225,011 | ||||||
| BF Investment, Ltd. (a) |
22,006 | 76,020 | ||||||
| Bharat Financial Inclusion, Ltd. (a) |
5,783 | 83,908 | ||||||
| Bharat Forge, Ltd. |
2,503 | 22,566 | ||||||
| Bharat Forge, Ltd., Bonus Shares (a) (e) |
2,503 | 22,566 | ||||||
| Bharat Heavy Electricals, Ltd. |
148,256 | 190,540 | ||||||
| Bharat Heavy Electricals, Ltd., Bonus Shares (a) (e) |
74,128 | 95,270 | ||||||
| Bharat Petroleum Corp., Ltd. |
26,137 | 188,585 | ||||||
| Bharti Airtel, Ltd. |
242,129 | 1,443,618 | ||||||
| Bharti Infratel, Ltd. |
39,396 | 240,284 | ||||||
| Biocon, Ltd. |
14,017 | 71,276 | ||||||
| Bosch, Ltd. |
160 | 50,325 | ||||||
| Britannia Industries, Ltd. |
9,520 | 633,149 | ||||||
| Cipla, Ltd. |
101,206 | 908,096 | ||||||
| Coal India, Ltd. |
64,926 | 269,216 | ||||||
| CORE Education & Technologies, Ltd. (a) (d) |
9,253 | — | ||||||
| DCB Bank, Ltd. |
268,639 | 746,859 | ||||||
See accompanying notes to financial statements.
21
Table of Contents
SPDR Portfolio Emerging Markets ETF
(formerly, SPDR S&P Emerging Markets ETF)
SCHEDULE OF INVESTMENTS (continued)
September 30, 2017
| Security Description |
Shares | Value | ||||||
| Dewan Housing Finance Corp., Ltd. |
74,979 | $ | 630,928 | |||||
| Dr Reddy’s Laboratories, Ltd. ADR |
30,992 | 1,105,795 | ||||||
| Educomp Solutions, Ltd. (a) |
24,628 | 2,243 | ||||||
| Eicher Motors, Ltd. |
1,004 | 479,764 | ||||||
| Era Infra Engineering, Ltd. (a) (d) |
2,941 | — | ||||||
| Fortis Healthcare, Ltd. (a) |
52,894 | 116,607 | ||||||
| GAIL India, Ltd. |
148,439 | 952,287 | ||||||
| Gammon India, Ltd. (a) |
72,401 | 7,205 | ||||||
| Gateway Distriparks, Ltd. |
31,648 | 110,540 | ||||||
| Gitanjali Gems, Ltd. |
2,198 | 2,194 | ||||||
| Glenmark Pharmaceuticals, Ltd. |
8,593 | 78,708 | ||||||
| Godrej Consumer Products, Ltd. |
14,773 | 207,878 | ||||||
| Godrej Industries, Ltd. |
54,451 | 490,367 | ||||||
| Grasim Industries, Ltd. GDR |
230 | 3,995 | ||||||
| Grasim Industries, Ltd. |
11,088 | 192,487 | ||||||
| GRUH Finance, Ltd. |
88,971 | 669,666 | ||||||
| GTL Infrastructure, Ltd. (a) |
559,098 | 53,068 | ||||||
| GTL, Ltd. (a) |
2,690 | 612 | ||||||
| Gujarat NRE Coke, Ltd. (a) |
20,074 | 476 | ||||||
| Gujarat Pipavav Port, Ltd. |
5,241 | 10,720 | ||||||
| GVK Power & Infrastructure, Ltd. (a) |
248,057 | 44,432 | ||||||
| HCL Technologies, Ltd. |
54,301 | 727,228 | ||||||
| HDFC Bank, Ltd. |
98,438 | 2,721,211 | ||||||
| Hero MotoCorp, Ltd. |
32,411 | 1,872,886 | ||||||
| Hindalco Industries, Ltd. |
103,157 | 379,969 | ||||||
| Hindustan Construction Co., Ltd. (a) |
30,019 | 15,740 | ||||||
| Hindustan Unilever, Ltd. |
139,244 | 2,502,427 | ||||||
| Housing Development & Infrastructure, Ltd. (a) |
26,069 | 22,549 | ||||||
| Housing Development Finance Corp., Ltd. |
211,838 | 5,649,932 | ||||||
| ICICI Bank, Ltd. ADR |
322,376 | 2,759,539 | ||||||
| Idea Cellular, Ltd. |
43,841 | 51,982 | ||||||
| IDFC Bank, Ltd. |
27 | 23 | ||||||
| IDFC, Ltd. |
18 | 16 | ||||||
| Indiabulls Housing Finance, Ltd. |
14,479 | 267,491 | ||||||
| Indiabulls Real Estate, Ltd. (a) |
38,436 | 129,925 | ||||||
| Indian Hotels Co., Ltd. |
139,190 | 247,823 | ||||||
| Indian Oil Corp., Ltd. |
35,105 | 215,241 | ||||||
| IndusInd Bank, Ltd. |
10,099 | 260,082 | ||||||
| Infosys, Ltd. ADR (b) |
304,212 | 4,438,453 | ||||||
| IRB Infrastructure Developers, Ltd. |
8,114 | 26,440 | ||||||
| ITC, Ltd. |
275,132 | 1,087,976 | ||||||
| ITC, Ltd. GDR |
60,326 | 238,553 | ||||||
| IVRCL, Ltd. (a) |
18,163 | 1,154 | ||||||
| Jain Irrigation Systems, Ltd. |
21,491 | 31,141 | ||||||
See accompanying notes to financial statements.
22
Table of Contents
SPDR Portfolio Emerging Markets ETF
(formerly, SPDR S&P Emerging Markets ETF)
SCHEDULE OF INVESTMENTS (continued)
September 30, 2017
| Security Description |
Shares | Value | ||||||
| Jaiprakash Associates, Ltd. (a) |
115,022 | $ | 31,608 | |||||
| Jet Airways India, Ltd. (a) |
28,781 | 212,311 | ||||||
| Jindal Steel & Power, Ltd. (a) |
10,341 | 21,317 | ||||||
| Kotak Mahindra Bank, Ltd. |
59,833 | 918,059 | ||||||
| Lanco Infratech, Ltd. (a) |
41,296 | 506 | ||||||
| Larsen & Toubro, Ltd. GDR |
104,600 | 1,846,190 | ||||||
| LIC Housing Finance, Ltd. |
32,018 | 307,509 | ||||||
| Lupin, Ltd. |
19,468 | 302,213 | ||||||
| Magma Fincorp, Ltd. |
15,426 | 40,218 | ||||||
| Mahanagar Telephone Nigam, Ltd. (a) |
101,378 | 30,575 | ||||||
| Mahindra & Mahindra Financial Services, Ltd. |
28,859 | 182,180 | ||||||
| Mahindra & Mahindra, Ltd. GDR |
77,830 | 1,502,119 | ||||||
| Marico, Ltd. |
19,372 | 92,159 | ||||||
| Marksans Pharma, Ltd. |
19,743 | 12,846 | ||||||
| Maruti Suzuki India, Ltd. |
23,051 | 2,815,455 | ||||||
| Mindtree, Ltd. |
5,967 | 42,464 | ||||||
| Monnet Ispat & Energy, Ltd. (a) |
6,962 | 3,198 | ||||||
| MRF, Ltd. |
300 | 289,369 | ||||||
| NCC, Ltd. |
35,906 | 45,597 | ||||||
| NTPC, Ltd. |
203,407 | 521,441 | ||||||
| Oil & Natural Gas Corp., Ltd. |
434,574 | 1,137,330 | ||||||
| OnMobile Global, Ltd. |
6,417 | 5,310 | ||||||
| Opto Circuits India, Ltd. (a) |
5,832 | 665 | ||||||
| Page Industries, Ltd. |
376 | 106,137 | ||||||
| Power Grid Corp. of India, Ltd. |
54,030 | 174,530 | ||||||
| PS IT Infrastructure & Services, Ltd. (a) |
132 | 131 | ||||||
| PTC India, Ltd. |
93,131 | 175,155 | ||||||
| Punj Lloyd, Ltd. (a) |
11,138 | 3,598 | ||||||
| Rajesh Exports, Ltd. |
15,160 | 190,173 | ||||||
| RattanIndia Infrastructure, Ltd. (a) |
65,489 | 6,016 | ||||||
| REI Agro, Ltd. (a) |
1,873,023 | 5,735 | ||||||
| Reliance Capital, Ltd. |
12,815 | 114,966 | ||||||
| Reliance Communications, Ltd. (a) |
157,604 | 46,326 | ||||||
| Reliance Home Finance, Ltd. (a) |
12,479 | 18,980 | ||||||
| Reliance Industries, Ltd. GDR (c) (f) |
3,404 | 81,185 | ||||||
| Reliance Industries, Ltd. GDR (f) |
193,676 | 4,638,540 | ||||||
| Reliance Infrastructure, Ltd. |
37,667 | 268,173 | ||||||
| Rolta India, Ltd. (a) |
8,356 | 6,742 | ||||||
| Ruchi Soya Industries, Ltd. (a) |
60,603 | 22,499 | ||||||
| SE Investments, Ltd. |
10,341 | 29,802 | ||||||
| Sharda Cropchem, Ltd. |
3,925 | 26,601 | ||||||
| Shree Renuka Sugars, Ltd. (a) |
137,091 | 29,068 | ||||||
| Shriram Transport Finance Co., Ltd. |
13,304 | 214,754 | ||||||
| Siemens, Ltd. |
34,335 | 624,911 | ||||||
See accompanying notes to financial statements.
23
Table of Contents
SPDR Portfolio Emerging Markets ETF
(formerly, SPDR S&P Emerging Markets ETF)
SCHEDULE OF INVESTMENTS (continued)
September 30, 2017
| Security Description |
Shares | Value | ||||||
| Sintex Industries, Ltd. |
92,757 | $ | 37,986 | |||||
| Sintex Plastics Technology, Ltd. (a) |
70,273 | 97,900 | ||||||
| State Bank of India GDR |
17,332 | 665,549 | ||||||
| Strides Shasun, Ltd. |
3,771 | 51,121 | ||||||
| Sun Pharma Advanced Research Co., Ltd. (a) |
4,072 | 23,701 | ||||||
| Sun Pharmaceutical Industries, Ltd. |
120,611 | 929,233 | ||||||
| Sun TV Network, Ltd. |
11,395 | 132,939 | ||||||
| Suzlon Energy, Ltd. (a) |
652,062 | 155,728 | ||||||
| Symphony, Ltd. |
1,705 | 35,331 | ||||||
| Tata Communications, Ltd. |
25,607 | 268,654 | ||||||
| Tata Consultancy Services, Ltd. |
69,810 | 2,603,394 | ||||||
| Tata Elxsi, Ltd. |
4,296 | 53,490 | ||||||
| Tata Motors, Ltd. ADR (a) |
56,333 | 1,761,533 | ||||||
| Tata Power Co., Ltd. |
369,539 | 440,143 | ||||||
| Tata Steel, Ltd. |
53,879 | 538,254 | ||||||
| Tech Mahindra, Ltd. |
49,109 | 344,222 | ||||||
| UltraTech Cement, Ltd. |
1,876 | 110,693 | ||||||
| Unitech, Ltd. (a) |
211,452 | 22,336 | ||||||
| United Breweries, Ltd. |
8,021 | 100,870 | ||||||
| United Spirits, Ltd. (a) |
7,172 | 263,257 | ||||||
| UPL, Ltd. |
18,683 | 222,669 | ||||||
| Vedanta, Ltd. |
99,889 | 480,559 | ||||||
| Videocon Industries, Ltd. (a) |
36,996 | 9,260 | ||||||
| VST Industries, Ltd. |
2,987 | 130,386 | ||||||
| Welspun India, Ltd. |
25,057 | 26,219 | ||||||
| Wipro, Ltd. ADR (b) |
248,025 | 1,408,782 | ||||||
| Wockhardt, Ltd. |
3,416 | 32,178 | ||||||
| Yes Bank, Ltd. |
58,295 | 312,358 | ||||||
| Zee Entertainment Enterprises, Ltd. |
62,846 | 500,401 | ||||||
|
|
|
|||||||
| 65,821,765 | ||||||||
|
|
|
|||||||
| INDONESIA — 2.7% |
||||||||
| Alam Sutera Realty Tbk PT |
961,700 | 26,990 | ||||||
| Astra International Tbk PT |
3,196,088 | 1,874,608 | ||||||
| Bank Central Asia Tbk PT |
2,109,987 | 3,180,098 | ||||||
| Bank Danamon Indonesia Tbk PT |
642,918 | 248,212 | ||||||
| Bank Mandiri Persero Tbk PT |
3,187,098 | 1,591,301 | ||||||
| Bank Negara Indonesia Persero Tbk PT |
258,600 | 142,077 | ||||||
| Bank Rakyat Indonesia Persero Tbk PT |
1,599,265 | 1,813,704 | ||||||
| Barito Pacific Tbk PT (a) |
2,509,400 | 371,687 | ||||||
| Bekasi Fajar Industrial Estate Tbk PT |
598,700 | 12,090 | ||||||
| Bumi Resources Tbk PT (a) |
1,115,100 | 16,475 | ||||||
| Bumi Serpong Damai Tbk PT |
509,000 | 66,889 | ||||||
| Charoen Pokphand Indonesia Tbk PT |
556,100 | 113,127 | ||||||
See accompanying notes to financial statements.
24
Table of Contents
SPDR Portfolio Emerging Markets ETF
(formerly, SPDR S&P Emerging Markets ETF)
SCHEDULE OF INVESTMENTS (continued)
September 30, 2017
| Security Description |
Shares | Value | ||||||
| Ciputra Development Tbk PT |
796,752 | $ | 70,690 | |||||
| Citra Marga Nusaphala Persada Tbk PT (a) |
217,241 | 21,613 | ||||||
| Garuda Indonesia Persero Tbk PT (a) |
1,705,000 | 42,280 | ||||||
| Global Mediacom Tbk PT |
81,500 | 3,419 | ||||||
| Indocement Tunggal Prakarsa Tbk PT |
66,800 | 93,735 | ||||||
| Indofood Sukses Makmur Tbk PT |
1,402,951 | 877,560 | ||||||
| Indosat Tbk PT |
337,900 | 156,795 | ||||||
| Japfa Comfeed Indonesia Tbk PT |
146,500 | 13,814 | ||||||
| Kalbe Farma Tbk PT |
7,028,167 | 868,802 | ||||||
| Kawasan Industri Jababeka Tbk PT |
657,831 | 14,945 | ||||||
| Lippo Cikarang Tbk PT (a) |
23,100 | 7,169 | ||||||
| Lippo Karawaci Tbk PT |
1,646,800 | 88,643 | ||||||
| Matahari Putra Prima Tbk PT (a) |
81,700 | 3,973 | ||||||
| Mayora Indah Tbk PT |
1,178,975 | 171,564 | ||||||
| Medco Energi Internasional Tbk PT (a) |
3,521,000 | 203,904 | ||||||
| Media Nusantara Citra Tbk PT |
109,300 | 10,712 | ||||||
| Modernland Realty Tbk PT |
1,030,200 | 22,334 | ||||||
| Pakuwon Jati Tbk PT |
726,000 | 32,880 | ||||||
| Perusahaan Gas Negara Persero Tbk |
1,930,400 | 225,732 | ||||||
| Semen Indonesia Persero Tbk PT |
109,500 | 82,314 | ||||||
| Sigmagold Inti Perkasa Tbk PT (a) |
1,312,600 | 4,873 | ||||||
| Summarecon Agung Tbk PT |
560,900 | 44,351 | ||||||
| Telekomunikasi Indonesia Persero Tbk PT |
4,885,000 | 1,697,364 | ||||||
| Tiga Pilar Sejahtera Food Tbk (a) |
791,800 | 54,672 | ||||||
| Unilever Indonesia Tbk PT |
80,700 | 293,435 | ||||||
| United Tractors Tbk PT |
339,915 | 807,579 | ||||||
| XL Axiata Tbk PT (a) |
103,525 | 28,746 | ||||||
|
|
|
|||||||
| 15,401,156 | ||||||||
|
|
|
|||||||
| MALAYSIA — 2.6% |
||||||||
| Aeon Co. M Bhd |
1,097,190 | 532,680 | ||||||
| AEON Credit Service M Bhd |
22,650 | 68,875 | ||||||
| AirAsia Bhd |
170,200 | 139,062 | ||||||
| Alliance Bank Malaysia Bhd |
637,500 | 588,810 | ||||||
| Axiata Group Bhd |
203,700 | 252,786 | ||||||
| Berjaya Sports Toto Bhd |
314,614 | 184,037 | ||||||
| Bintulu Port Holdings Bhd |
94 | 131 | ||||||
| British American Tobacco Malaysia Bhd |
7,200 | 74,583 | ||||||
| Bursa Malaysia Bhd |
132,793 | 314,489 | ||||||
| Capitaland Malaysia Mall Trust REIT |
211,000 | 70,958 | ||||||
| Carlsberg Brewery Malaysia Bhd Class B |
334,476 | 1,175,518 | ||||||
| CIMB Group Holdings Bhd |
296,962 | 443,069 | ||||||
| Dialog Group Bhd |
2,297,367 | 1,088,155 | ||||||
| DiGi.Com Bhd |
841,200 | 976,171 | ||||||
See accompanying notes to financial statements.
25
Table of Contents
SPDR Portfolio Emerging Markets ETF
(formerly, SPDR S&P Emerging Markets ETF)
SCHEDULE OF INVESTMENTS (continued)
September 30, 2017
| Security Description |
Shares | Value | ||||||
| Felda Global Ventures Holdings Bhd |
58,900 | $ | 23,574 | |||||
| Genting Bhd |
508,400 | 1,149,845 | ||||||
| Genting Malaysia Bhd |
121,400 | 154,679 | ||||||
| Guan Chong Bhd |
128,700 | 49,986 | ||||||
| Hap Seng Plantations Holdings Bhd |
13,500 | 8,472 | ||||||
| IHH Healthcare Bhd |
141,600 | 192,824 | ||||||
| IOI Corp. Bhd |
805,060 | 865,594 | ||||||
| IOI Properties Group Bhd |
675,562 | 323,182 | ||||||
| Iskandar Waterfront City Bhd (a) |
48,600 | 14,502 | ||||||
| KLCCP Stapled Group |
84,900 | 160,853 | ||||||
| KNM Group Bhd (a) |
682,121 | 42,809 | ||||||
| KPJ Healthcare Bhd |
240,080 | 59,132 | ||||||
| Lingkaran Trans Kota Holdings Bhd |
53,700 | 73,762 | ||||||
| Magnum Bhd |
484,260 | 207,581 | ||||||
| Malayan Banking Bhd |
395,637 | 892,936 | ||||||
| Malaysian Resources Corp. Bhd |
896,500 | 225,054 | ||||||
| MPHB Capital Bhd (a) |
240,830 | 77,568 | ||||||
| Naim Holdings Bhd (a) |
87 | 26 | ||||||
| OSK Holdings Bhd |
938,306 | 355,545 | ||||||
| Pavilion Real Estate Investment Trust |
202,100 | 83,760 | ||||||
| Petronas Chemicals Group Bhd |
99,100 | 171,093 | ||||||
| Pos Malaysia Bhd |
159,700 | 198,561 | ||||||
| Public Bank Bhd |
181,800 | 880,045 | ||||||
| Sapura Energy Bhd |
82,600 | 29,734 | ||||||
| Sime Darby Bhd |
170,024 | 363,201 | ||||||
| SP Setia Bhd Group |
48,996 | 42,237 | ||||||
| SP Setia Bhd Group Preference Shares |
10,257 | 2,623 | ||||||
| Sunway Real Estate Investment Trust |
209,900 | 85,501 | ||||||
| TA Enterprise Bhd |
829,400 | 124,729 | ||||||
| TA Global Bhd |
595,956 | 52,221 | ||||||
| Telekom Malaysia Bhd |
107,527 | 165,524 | ||||||
| Tenaga Nasional Bhd |
191,500 | 649,445 | ||||||
| UEM Edgenta Bhd |
108,100 | 68,355 | ||||||
| UEM Sunrise Bhd (a) |
670,388 | 180,993 | ||||||
| UMW Holdings Bhd (a) |
46,300 | 60,856 | ||||||
| UMW Oil & Gas Corp. Bhd (a) |
38,463 | 2,733 | ||||||
| Unisem M Bhd |
45,400 | 40,535 | ||||||
| United Plantations Bhd |
8,800 | 56,895 | ||||||
See accompanying notes to financial statements.
26
Table of Contents
SPDR Portfolio Emerging Markets ETF
(formerly, SPDR S&P Emerging Markets ETF)
SCHEDULE OF INVESTMENTS (continued)
September 30, 2017
| Security Description |
Shares | Value | ||||||
| VS Industry Bhd |
212,400 | $ | 133,803 | |||||
| WCT Holdings Bhd (a) |
1,212,896 | 502,680 | ||||||
|
|
|
|||||||
| 14,682,772 | ||||||||
|
|
|
|||||||
| MALTA — 0.0% (g) |
||||||||
| Tiso Blackstar Group SE |
295 | 200 | ||||||
|
|
|
|||||||
| MEXICO — 4.0% |
||||||||
| Alfa SAB de CV Class A |
637,487 | 807,072 | ||||||
| America Movil SAB de CV |
3,626,111 | 3,226,893 | ||||||
| Axtel SAB de CV (a) (b) |
257,835 | 61,338 | ||||||
| Cemex SAB de CV (a) |
1,875,445 | 1,709,245 | ||||||
| Coca-Cola Femsa SAB de CV |
94,267 | 730,444 | ||||||
| Consorcio ARA SAB de CV |
256,184 | 89,724 | ||||||
| Desarrolladora Homex SAB de CV (a) |
5,133 | 274 | ||||||
| El Puerto de Liverpool SAB de CV (b) |
53,358 | 431,936 | ||||||
| Fibra Uno Administracion SA de CV REIT |
219,424 | 371,200 | ||||||
| Fomento Economico Mexicano SAB de CV |
313,040 | 3,000,205 | ||||||
| Grupo Aeroportuario del Sureste SAB de CV Class B |
69,300 | 1,322,670 | ||||||
| Grupo Bimbo SAB de CV Class A |
438,217 | 1,061,079 | ||||||
| Grupo Elektra SAB DE CV (b) |
7,968 | 361,344 | ||||||
| Grupo Financiero Banorte SAB de CV Class O |
246,681 | 1,705,918 | ||||||
| Grupo Financiero Inbursa SAB de CV |
197,732 | 362,705 | ||||||
| Grupo Mexico SAB de CV Class B |
488,065 | 1,496,777 | ||||||
| Grupo Televisa SAB |
293,239 | 1,449,300 | ||||||
| Impulsora del Desarrollo y el Empleo en America Latina SAB de CV (a) |
252,452 | 472,672 | ||||||
| Industrias CH SAB de CV Class B |
68,532 | 295,538 | ||||||
| Industrias Penoles SAB de CV |
23,765 | 591,938 | ||||||
| Kimberly-Clark de Mexico SAB de CV Class A |
390,402 | 796,530 | ||||||
| Sare Holding SAB de CV Class B (a) |
287,303 | 1,408 | ||||||
| Telesites SAB de CV (a) |
182,940 | 140,837 | ||||||
| TV Azteca SAB de CV |
589,378 | 109,052 | ||||||
| Urbi Desarrollos Urbanos SAB de CV (a) |
51,528 | 21,140 | ||||||
| Wal-Mart de Mexico SAB de CV |
762,221 | 1,750,326 | ||||||
|
|
|
|||||||
| 22,367,565 | ||||||||
|
|
|
|||||||
| MONACO — 0.0%(g) |
||||||||
| GasLog, Ltd. (b) |
2,634 | 45,963 | ||||||
|
|
|
|||||||
| NETHERLANDS — 0.0% (g) |
||||||||
| VEON, Ltd. ADR |
62,233 | 260,134 | ||||||
|
|
|
|||||||
| PERU — 0.9% |
||||||||
| Cia de Minas Buenaventura SAA ADR (f) |
45,110 | 576,957 | ||||||
| Cia de Minas Buenaventura SAA ADR (f) |
5,932 | 75,930 | ||||||
| Credicorp, Ltd. |
11,417 | 2,340,713 | ||||||
| Southern Copper Corp. (b) (f) |
35,635 | 1,416,848 | ||||||
See accompanying notes to financial statements.
27
Table of Contents
SPDR Portfolio Emerging Markets ETF
(formerly, SPDR S&P Emerging Markets ETF)
SCHEDULE OF INVESTMENTS (continued)
September 30, 2017
| Security Description |
Shares | Value | ||||||
| Southern Copper Corp. (f) |
4,688 | $ | 185,551 | |||||
| Volcan Cia Minera SAA Class B |
708,652 | 253,826 | ||||||
|
|
|
|||||||
| 4,849,825 | ||||||||
|
|
|
|||||||
| PHILIPPINES — 1.5% |
||||||||
| Alliance Global Group, Inc. |
318,900 | 100,693 | ||||||
| Ayala Land, Inc. |
2,051,680 | 1,756,869 | ||||||
| Bank of the Philippine Islands |
739,697 | 1,448,102 | ||||||
| BDO Unibank, Inc. |
586,696 | 1,509,487 | ||||||
| Bloomberry Resorts Corp. (a) |
124,200 | 26,160 | ||||||
| Cebu Air, Inc. |
222,480 | 480,439 | ||||||
| Cebu Holdings, Inc. |
1,130,400 | 117,937 | ||||||
| D&L Industries, Inc. |
338,500 | 67,301 | ||||||
| DoubleDragon Properties Corp. (a) |
224,360 | 176,663 | ||||||
| East West Banking Corp. |
128,000 | 81,765 | ||||||
| Filinvest Land, Inc. |
9,438,000 | 377,152 | ||||||
| First Philippine Holdings Corp. |
62,310 | 83,347 | ||||||
| Global Ferronickel Holdings, Inc. (a) |
236,333 | 12,980 | ||||||
| GMA Holdings, Inc. |
547,000 | 61,915 | ||||||
| GT Capital Holdings, Inc. |
1,510 | 34,510 | ||||||
| JG Summit Holdings, Inc. |
74,150 | 109,474 | ||||||
| Megawide Construction Corp. (a) |
711,788 | 225,589 | ||||||
| Megaworld Corp. |
1,014,300 | 104,426 | ||||||
| Nickel Asia Corp. |
85,200 | 11,069 | ||||||
| PLDT, Inc. |
15,725 | 516,330 | ||||||
| Puregold Price Club, Inc. |
48,100 | 49,379 | ||||||
| San Miguel Corp. |
21,600 | 41,797 | ||||||
| SM Investments Corp. |
25,470 | 442,721 | ||||||
| SM Prime Holdings, Inc. |
476,790 | 323,338 | ||||||
| Top Frontier Investment Holdings, Inc. (a) |
2,411 | 13,887 | ||||||
| Universal Robina Corp. |
35,620 | 107,142 | ||||||
| Vista Land & Lifescapes, Inc. |
162,078 | 20,292 | ||||||
|
|
|
|||||||
| 8,300,764 | ||||||||
|
|
|
|||||||
| POLAND — 1.2% |
||||||||
| Asseco Poland SA |
13,253 | 168,356 | ||||||
| Bank Pekao SA |
24,170 | 849,013 | ||||||
| Bank Zachodni WBK SA |
3,575 | 342,691 | ||||||
| Bioton SA (a) |
162 | 221 | ||||||
| Eurocash SA |
1,240 | 13,142 | ||||||
| Getin Holding SA (a) |
47,432 | 22,128 | ||||||
| Getin Noble Bank SA (a) |
44,014 | 17,514 | ||||||
| Globe Trade Centre SA |
41,074 | 106,293 | ||||||
| Grupa Lotos SA |
25,681 | 421,092 | ||||||
| KGHM Polska Miedz SA |
25,887 | 834,022 | ||||||
See accompanying notes to financial statements.
28
Table of Contents
SPDR Portfolio Emerging Markets ETF
(formerly, SPDR S&P Emerging Markets ETF)
SCHEDULE OF INVESTMENTS (continued)
September 30, 2017
| Security Description |
Shares | Value | ||||||
| LPP SA |
73 | $ | 163,712 | |||||
| mBank SA (a) |
3,915 | 450,167 | ||||||
| Orange Polska SA (a) |
158,497 | 230,093 | ||||||
| Orbis SA |
12,413 | 323,274 | ||||||
| PGE Polska Grupa Energetyczna SA (a) |
90,191 | 329,187 | ||||||
| Polimex-Mostostal SA (a) |
2,327 | 3,359 | ||||||
| Polski Koncern Naftowy ORLEN SA |
34,245 | 1,143,709 | ||||||
| Powszechna Kasa Oszczednosci Bank Polski SA (a) |
71,666 | 694,839 | ||||||
| Powszechny Zaklad Ubezpieczen SA |
46,094 | 581,875 | ||||||
|
|
|
|||||||
| 6,694,687 | ||||||||
|
|
|
|||||||
| QATAR — 0.5% |
||||||||
| Aamal Co. |
7,312 | 17,091 | ||||||
| Industries Qatar QSC |
6,850 | 172,513 | ||||||
| Mannai Corp. QSC |
4,488 | 87,708 | ||||||
| Masraf Al Rayan QSC |
48,736 | 496,898 | ||||||
| Mazaya Qatar Real Estate Development QSC (a) |
27,952 | 76,545 | ||||||
| Medicare Group |
3,639 | 70,566 | ||||||
| National Leasing |
39,164 | 134,464 | ||||||
| Ooredoo QSC |
12,506 | 284,419 | ||||||
| Qatar Electricity & Water Co. QSC |
1,166 | 55,982 | ||||||
| Qatar Insurance Co. SAQ |
11,927 | 171,464 | ||||||
| Qatar National Bank QPSC |
30,608 | 1,025,661 | ||||||
| Qatari Investors Group QSC |
12,282 | 124,481 | ||||||
| Vodafone Qatar QSC (a) |
48,503 | 113,239 | ||||||
|
|
|
|||||||
| 2,831,031 | ||||||||
|
|
|
|||||||
| RUSSIA — 4.0% |
||||||||
| Evraz PLC |
29,866 | 125,418 | ||||||
| Gazprom PJSC ADR |
757,259 | 3,172,915 | ||||||
| LSR Group PJSC |
18,041 | 53,041 | ||||||
| LUKOIL PJSC ADR |
61,747 | 3,268,269 | ||||||
| Magnit PJSC GDR |
21,188 | 867,649 | ||||||
| Mail.Ru Group, Ltd. GDR (a) |
5,311 | 175,051 | ||||||
| Mechel PJSC ADR (a) |
22,735 | 117,540 | ||||||
| MMC Norilsk Nickel PJSC ADR |
90,385 | 1,555,978 | ||||||
| Mobile TeleSystems PJSC ADR |
115,029 | 1,200,903 | ||||||
| Novatek PJSC |
11,939 | 1,400,445 | ||||||
| Novolipetsk Steel PJSC |
4,876 | 110,929 | ||||||
| Novorossiysk Commercial Sea Port PJSC |
7,599 | 79,789 | ||||||
| Polymetal International PLC |
16,463 | 185,977 | ||||||
| Rosneft Oil Co. PJSC GDR |
185,122 | 1,028,353 | ||||||
| Rostelecom PJSC ADR |
13,687 | 102,652 | ||||||
| Sberbank of Russia PJSC ADR (f) |
89,829 | 1,278,716 | ||||||
| Sberbank of Russia PJSC ADR (f) |
149,792 | 2,137,532 | ||||||
See accompanying notes to financial statements.
29
Table of Contents
SPDR Portfolio Emerging Markets ETF
(formerly, SPDR S&P Emerging Markets ETF)
SCHEDULE OF INVESTMENTS (continued)
September 30, 2017
| Security Description |
Shares | Value | ||||||
| Severstal PJSC GDR |
69,309 | $ | 1,036,170 | |||||
| Sistema PJSC FC GDR |
20,014 | 96,067 | ||||||
| Surgutneftegas OJSC ADR |
267,435 | 1,353,221 | ||||||
| Tatneft PJSC ADR (f) |
26,583 | 1,135,094 | ||||||
| Tatneft PJSC ADR (b) (f) |
12,997 | 561,990 | ||||||
| TMK PJSC |
6,857 | 32,742 | ||||||
| VTB Bank PJSC GDR |
304,603 | 654,896 | ||||||
| X5 Retail Group NV GDR (a) |
5,549 | 249,095 | ||||||
| Yandex NV Class A (a) |
15,291 | 503,838 | ||||||
|
|
|
|||||||
| 22,484,270 | ||||||||
|
|
|
|||||||
| SOUTH AFRICA — 6.5% |
||||||||
| Adbee Rf, Ltd. (a) |
2,377 | 8,450 | ||||||
| Adcock Ingram Holdings, Ltd. |
13,437 | 60,207 | ||||||
| Adcorp Holdings, Ltd. |
77,569 | 85,023 | ||||||
| African Phoenix Investments, Ltd. (a) |
159,430 | 7,439 | ||||||
| African Rainbow Minerals, Ltd. |
16,544 | 125,013 | ||||||
| Allied Electronics Corp., Ltd. (a) |
52,875 | 48,949 | ||||||
| Anglo American Platinum, Ltd. (a) |
4,524 | 115,592 | ||||||
| AngloGold Ashanti, Ltd. |
39,827 | 375,484 | ||||||
| ArcelorMittal South Africa, Ltd. (a) |
23,877 | 8,134 | ||||||
| Aspen Pharmacare Holdings, Ltd. |
39,661 | 891,737 | ||||||
| Aveng, Ltd. (a) |
89,262 | 19,171 | ||||||
| Barclays Africa Group, Ltd. |
53,650 | 552,294 | ||||||
| Barloworld, Ltd. |
38,174 | 352,012 | ||||||
| Bid Corp., Ltd. (b) |
15,300 | 344,356 | ||||||
| Bidvest Group, Ltd. (b) |
55,976 | 715,780 | ||||||
| Coronation Fund Managers, Ltd. |
80,648 | 401,971 | ||||||
| Discovery, Ltd. |
54,984 | 572,786 | ||||||
| FirstRand, Ltd. (b) |
423,343 | 1,631,293 | ||||||
| Foschini Group, Ltd. |
36,695 | 368,920 | ||||||
| Gold Fields, Ltd. |
88,801 | 387,890 | ||||||
| Grindrod, Ltd. (a) |
150,205 | 153,514 | ||||||
| Group Five, Ltd. |
42,685 | 34,426 | ||||||
| Growthpoint Properties, Ltd. REIT |
119,852 | 215,694 | ||||||
| Harmony Gold Mining Co., Ltd. |
35,955 | 64,228 | ||||||
| Impala Platinum Holdings, Ltd. (a) |
63,840 | 146,568 | ||||||
| Imperial Holdings, Ltd. |
29,476 | 417,456 | ||||||
| Investec, Ltd. |
32,537 | 236,151 | ||||||
| Invicta Holdings, Ltd. |
60,883 | 225,451 | ||||||
| Kumba Iron Ore, Ltd. |
6,331 | 103,345 | ||||||
| Lewis Group, Ltd. |
38,580 | 85,717 | ||||||
| Massmart Holdings, Ltd. |
25,116 | 207,513 | ||||||
| Mediclinic International PLC (b) |
19,559 | 170,219 | ||||||
See accompanying notes to financial statements.
30
Table of Contents
SPDR Portfolio Emerging Markets ETF
(formerly, SPDR S&P Emerging Markets ETF)
SCHEDULE OF INVESTMENTS (continued)
September 30, 2017
| Security Description |
Shares | Value | ||||||
| MMI Holdings, Ltd. (b) |
142,807 | $ | 183,499 | |||||
| Mr. Price Group, Ltd. |
26,179 | 349,066 | ||||||
| MTN Group, Ltd. |
161,714 | 1,489,649 | ||||||
| Murray & Roberts Holdings, Ltd. |
106,919 | 126,695 | ||||||
| Naspers, Ltd. Class N |
46,456 | 10,046,400 | ||||||
| Nedbank Group, Ltd. |
43,398 | 651,332 | ||||||
| Netcare, Ltd. |
335,941 | 592,142 | ||||||
| Northam Platinum, Ltd. (a) |
44,931 | 155,499 | ||||||
| Novus Holdings, Ltd. |
16,068 | 7,771 | ||||||
| PPC, Ltd. (a) |
61,172 | 28,632 | ||||||
| PSG Group, Ltd. |
36,504 | 632,916 | ||||||
| Rand Merchant Investment Holdings, Ltd. |
177,201 | 544,234 | ||||||
| Remgro, Ltd. |
75,813 | 1,152,930 | ||||||
| RMB Holdings, Ltd. |
144,432 | 679,240 | ||||||
| Sanlam, Ltd. |
227,434 | 1,139,654 | ||||||
| Sappi, Ltd. |
45,352 | 309,210 | ||||||
| Sasol, Ltd. |
53,382 | 1,466,745 | ||||||
| Shoprite Holdings, Ltd. |
76,146 | 1,166,736 | ||||||
| Sibanye-Stillwater |
196,473 | 221,464 | ||||||
| Standard Bank Group, Ltd. (b) |
146,331 | 1,710,239 | ||||||
| Steinhoff International Holdings NV (b) |
326,769 | 1,452,764 | ||||||
| Sun International, Ltd. |
26,553 | 100,765 | ||||||
| Telkom SA SOC, Ltd. |
42,993 | 188,784 | ||||||
| Tiger Brands, Ltd. |
31,383 | 877,051 | ||||||
| Trans Hex Group, Ltd. (a) |
1,667 | 309 | ||||||
| Truworths International, Ltd. (b) |
64,111 | 366,789 | ||||||
| Vodacom Group, Ltd. |
56,244 | 671,221 | ||||||
| Wilson Bayly Holmes-Ovcon, Ltd. |
36,977 | 403,331 | ||||||
| Woolworths Holdings, Ltd. |
130,965 | 580,892 | ||||||
| Zambezi Platinum RF, Ltd. Preference Shares |
11,534 | 49,117 | ||||||
|
|
|
|||||||
| 36,477,859 | ||||||||
|
|
|
|||||||
| TAIWAN — 13.7% |
||||||||
| Acer, Inc. |
452,701 | 226,171 | ||||||
| Adlink Technology, Inc. |
80,665 | 178,227 | ||||||
| Advanced Ceramic X Corp. |
4,000 | 55,665 | ||||||
| Advanced Semiconductor Engineering, Inc. |
971,117 | 1,188,116 | ||||||
| Advanced Wireless Semiconductor Co. |
13,000 | 22,164 | ||||||
| Advancetek Enterprise Co., Ltd. |
479,996 | 292,835 | ||||||
| Advantech Co., Ltd. |
5,499 | 39,170 | ||||||
| AGV Products Corp. (a) |
789,415 | 198,629 | ||||||
| Airmate Cayman International Co., Ltd. |
11,000 | 10,647 | ||||||
| APCB, Inc. |
154,000 | 143,975 | ||||||
| Asustek Computer, Inc. |
81,340 | 669,250 | ||||||
See accompanying notes to financial statements.
31
Table of Contents
SPDR Portfolio Emerging Markets ETF
(formerly, SPDR S&P Emerging Markets ETF)
SCHEDULE OF INVESTMENTS (continued)
September 30, 2017
| Security Description |
Shares | Value | ||||||
| AU Optronics Corp. ADR (b) |
163,743 | $ | 661,522 | |||||
| Audix Corp. |
90,600 | 118,912 | ||||||
| Bank of Kaohsiung Co., Ltd. |
240,390 | 73,725 | ||||||
| Basso Industry Corp. |
399,900 | 1,114,350 | ||||||
| Biostar Microtech International Corp. (a) |
309,000 | 135,526 | ||||||
| C Sun Manufacturing, Ltd. (a) |
152,000 | 129,825 | ||||||
| Carnival Industrial Corp. (a) |
307,000 | 49,304 | ||||||
| Catcher Technology Co., Ltd. |
83,000 | 773,232 | ||||||
| Cathay Financial Holding Co., Ltd. |
786,541 | 1,250,207 | ||||||
| Cathay No 1 REIT |
223,000 | 96,336 | ||||||
| Center Laboratories, Inc. (a) |
99,961 | 154,438 | ||||||
| Chailease Holding Co., Ltd. |
80,608 | 194,316 | ||||||
| Champion Building Materials Co., Ltd. (a) |
223,000 | 56,037 | ||||||
| Chang Hwa Commercial Bank, Ltd. |
1,312,465 | 709,815 | ||||||
| Chang Wah Electromaterials, Inc. |
7,431 | 33,572 | ||||||
| Charoen Pokphand Enterprise |
726,060 | 1,539,561 | ||||||
| Chen Full International Co., Ltd. |
12,000 | 17,570 | ||||||
| Cheng Loong Corp. |
79,000 | 46,503 | ||||||
| Cheng Shin Rubber Industry Co., Ltd. |
68,850 | 137,818 | ||||||
| China Airlines, Ltd. (a) |
306,000 | 115,542 | ||||||
| China Chemical & Pharmaceutical Co., Ltd. |
235,000 | 138,331 | ||||||
| China Development Financial Holding Corp. |
1,906,945 | 572,260 | ||||||
| China Steel Chemical Corp. |
86,595 | 334,112 | ||||||
| China Steel Corp. |
1,232,451 | 989,651 | ||||||
| Chipbond Technology Corp. |
66,000 | 110,131 | ||||||
| Chlitina Holding, Ltd. |
2,000 | 6,859 | ||||||
| Chong Hong Construction Co., Ltd. |
7,717 | 17,763 | ||||||
| Chung Hwa Pulp Corp. |
307,794 | 110,637 | ||||||
| Chunghwa Chemical Synthesis & Biotech Co., Ltd. |
83,000 | 59,532 | ||||||
| Chunghwa Telecom Co., Ltd. |
389,457 | 1,342,114 | ||||||
| CMC Magnetics Corp. (a) |
370,933 | 51,620 | ||||||
| Coland Holdings, Ltd. |
11,938 | 13,897 | ||||||
| Compal Electronics, Inc. |
781,774 | 555,574 | ||||||
| Coxon Precise Industrial Co., Ltd. (a) |
10,000 | 9,201 | ||||||
| CTBC Financial Holding Co., Ltd. |
2,162,527 | 1,354,967 | ||||||
| Da-Li Development Co., Ltd. |
224,444 | 238,329 | ||||||
| Delta Electronics, Inc. |
311,167 | 1,600,780 | ||||||
| Dimerco Express Corp. |
404,000 | 306,424 | ||||||
| E.Sun Financial Holding Co., Ltd. |
274,687 | 163,957 | ||||||
| Eclat Textile Co., Ltd. |
8,854 | 107,595 | ||||||
| Elan Microelectronics Corp. |
2,000 | 2,764 | ||||||
| Elite Advanced Laser Corp. |
11,520 | 42,738 | ||||||
| Elite Material Co., Ltd. |
13,000 | 61,733 | ||||||
| Elite Semiconductor Memory Technology, Inc. |
239,750 | 318,623 | ||||||
See accompanying notes to financial statements.
32
Table of Contents
SPDR Portfolio Emerging Markets ETF
(formerly, SPDR S&P Emerging Markets ETF)
SCHEDULE OF INVESTMENTS (continued)
September 30, 2017
| Security Description |
Shares | Value | ||||||
| Episil-Precision, Inc. (a) |
909 | $ | 700 | |||||
| Epistar Corp. (a) |
84,180 | 107,154 | ||||||
| Etron Technology, Inc. (a) |
12,445 | 4,822 | ||||||
| Eva Airways Corp. |
221,291 | 108,004 | ||||||
| Excelsior Medical Co., Ltd. |
72,344 | 106,044 | ||||||
| Far Eastern New Century Corp. |
855,850 | 677,364 | ||||||
| Feng TAY Enterprise Co., Ltd. |
15,747 | 71,662 | ||||||
| Flytech Technology Co., Ltd. |
8,854 | 26,424 | ||||||
| Formosa Chemicals & Fibre Corp. |
399,243 | 1,213,897 | ||||||
| Formosa Petrochemical Corp. |
59,000 | 203,321 | ||||||
| Formosa Plastics Corp. |
634,714 | 1,921,473 | ||||||
| Founding Construction & Development Co., Ltd. |
683,677 | 349,459 | ||||||
| Foxconn Technology Co., Ltd. |
221,223 | 638,340 | ||||||
| Fubon Financial Holding Co., Ltd. |
1,004,903 | 1,567,468 | ||||||
| Fullerton Technology Co., Ltd. |
76,000 | 59,273 | ||||||
| Fwusow Industry Co., Ltd. |
310,383 | 183,216 | ||||||
| Giant Manufacturing Co., Ltd. |
72,302 | 339,765 | ||||||
| Grape King Bio, Ltd. |
73,664 | 444,549 | ||||||
| Great Wall Enterprise Co., Ltd. |
78,300 | 82,628 | ||||||
| HannStar Display Corp. |
216,500 | 83,890 | ||||||
| Himax Technologies, Inc. ADR (b) |
7,931 | 86,686 | ||||||
| Hiwin Technologies Corp. |
9,548 | 84,227 | ||||||
| Hocheng Corp. (a) |
459,000 | 142,737 | ||||||
| Hon Hai Precision Industry Co., Ltd. |
1,614,495 | 5,590,357 | ||||||
| Hong TAI Electric Industrial |
301,000 | 100,750 | ||||||
| Hota Industrial Manufacturing Co., Ltd. |
9,574 | 45,148 | ||||||
| Hotai Motor Co., Ltd. |
72,433 | 834,828 | ||||||
| HTC Corp. (a) |
149,198 | 372,946 | ||||||
| Hua Nan Financial Holdings Co., Ltd. |
1,349,683 | 732,169 | ||||||
| Hung Sheng Construction, Ltd. |
159,000 | 117,452 | ||||||
| Ibase Technology, Inc. |
248,222 | 430,566 | ||||||
| Innolux Corp. |
615,820 | 287,358 | ||||||
| Iron Force Industrial Co., Ltd. |
6,000 | 26,415 | ||||||
| Janfusun Fancyworld Corp. (a) |
886,112 | 63,411 | ||||||
| KEE TAI Properties Co., Ltd. |
155,000 | 51,370 | ||||||
| Kenda Rubber Industrial Co., Ltd. |
4,766 | 6,719 | ||||||
| Kerry TJ Logistics Co., Ltd. |
148,000 | 176,923 | ||||||
| Kindom Construction Corp. |
85,000 | 49,614 | ||||||
| Kung Long Batteries Industrial Co., Ltd. |
9,000 | 43,777 | ||||||
| Kuoyang Construction Co., Ltd. |
85,225 | 33,726 | ||||||
| Kwong Fong Industries Corp. |
61,974 | 44,349 | ||||||
| Land Mark Optoelectronics Corp. |
2,600 | 31,981 | ||||||
| Largan Precision Co., Ltd. |
6,000 | 1,054,610 | ||||||
| Leofoo Development Co., Ltd. (a) |
306,645 | 79,887 | ||||||
See accompanying notes to financial statements.
33
Table of Contents
SPDR Portfolio Emerging Markets ETF
(formerly, SPDR S&P Emerging Markets ETF)
SCHEDULE OF INVESTMENTS (continued)
September 30, 2017
| Security Description |
Shares | Value | ||||||
| Li Cheng Enterprise Co., Ltd. |
9,225 | $ | 18,618 | |||||
| Lite-On Technology Corp. |
400,265 | 571,543 | ||||||
| Long Bon International Co., Ltd. |
11,000 | 5,169 | ||||||
| Long Chen Paper Co., Ltd. |
2,276,165 | 3,362,755 | ||||||
| Makalot Industrial Co., Ltd. |
4,139 | 18,085 | ||||||
| MediaTek, Inc. |
148,329 | 1,391,624 | ||||||
| Medigen Biotechnology Corp. (a) |
5,248 | 7,710 | ||||||
| Mega Financial Holding Co., Ltd. |
922,333 | 720,858 | ||||||
| Merida Industry Co., Ltd. |
2,100 | 9,141 | ||||||
| Merry Electronics Co., Ltd. |
13,356 | 84,125 | ||||||
| Mosel Vitelic, Inc. (a) |
3,758 | 620 | ||||||
| Namchow Holdings Co., Ltd. |
147,000 | 294,737 | ||||||
| Nan Ya Plastics Corp. |
626,486 | 1,543,283 | ||||||
| Nanya Technology Corp. |
3,982 | 11,267 | ||||||
| National Petroleum Co., Ltd. |
705,003 | 897,412 | ||||||
| Neo Solar Power Corp. (a) |
63,938 | 32,682 | ||||||
| New Era Electronics Co., Ltd. |
70,000 | 45,360 | ||||||
| Newmax Technology Co., Ltd. (a) |
67,185 | 101,584 | ||||||
| Nexcom International Co., Ltd. |
165,638 | 166,599 | ||||||
| Novatek Microelectronics Corp. |
76,225 | 286,560 | ||||||
| OBI Pharma, Inc. (a) |
3,000 | 17,115 | ||||||
| Pacific Hospital Supply Co., Ltd. |
68,000 | 160,335 | ||||||
| Pan Jit International, Inc. |
9,000 | 6,604 | ||||||
| Parade Technologies, Ltd. |
4,000 | 63,580 | ||||||
| PChome Online, Inc. |
3,519 | 18,045 | ||||||
| Pegatron Corp. |
149,686 | 388,481 | ||||||
| Phytohealth Corp. (a) |
9,000 | 7,717 | ||||||
| Pihsiang Machinery Manufacturing Co., Ltd. (a) |
51,000 | 29,096 | ||||||
| Portwell, Inc. (a) |
72,000 | 118,124 | ||||||
| Pou Chen Corp. |
537,462 | 674,397 | ||||||
| Powertech Technology, Inc. |
161,285 | 464,857 | ||||||
| Promate Electronic Co., Ltd. |
151,000 | 139,677 | ||||||
| ProMOS Technologies, Inc. (a) (d) |
130,950 | — | ||||||
| Quanta Computer, Inc. |
545,664 | 1,256,013 | ||||||
| Radiant Opto-Electronics Corp. |
14,000 | 32,779 | ||||||
| Sampo Corp. |
537,000 | 261,204 | ||||||
| Sesoda Corp. |
233,574 | 221,835 | ||||||
| Shih Wei Navigation Co., Ltd. (a) |
297,321 | 85,302 | ||||||
| Shin Kong Financial Holding Co., Ltd. |
698,663 | 209,203 | ||||||
| Silicon Motion Technology Corp. ADR (b) |
2,186 | 104,994 | ||||||
| Siliconware Precision Industries Co., Ltd. |
300,473 | 480,574 | ||||||
| Sinbon Electronics Co., Ltd. |
169,068 | 447,146 | ||||||
| Sinon Corp. |
302,000 | 172,293 | ||||||
| SinoPac Financial Holdings Co., Ltd. |
1,940,907 | 581,171 | ||||||
See accompanying notes to financial statements.
34
Table of Contents
SPDR Portfolio Emerging Markets ETF
(formerly, SPDR S&P Emerging Markets ETF)
SCHEDULE OF INVESTMENTS (continued)
September 30, 2017
| Security Description |
Shares | Value | ||||||
| Sinphar Pharmaceutical Co., Ltd. |
214,524 | $ | 155,637 | |||||
| Solar Applied Materials Technology Co. (a) |
123,418 | 63,085 | ||||||
| Solartech Energy Corp. (a) |
10,041 | 4,371 | ||||||
| Stark Technology, Inc. |
116,400 | 132,622 | ||||||
| Supreme Electronics Co., Ltd. |
390,818 | 386,642 | ||||||
| Ta Ya Electric Wire & Cable (a) |
927,000 | 231,719 | ||||||
| Tainan Enterprises Co., Ltd. |
86,000 | 68,490 | ||||||
| Taishin Financial Holding Co., Ltd. |
1,787,615 | 769,304 | ||||||
| Taisun Enterprise Co., Ltd. (a) |
382,000 | 228,641 | ||||||
| Taiwan Acceptance Corp. |
9,000 | 30,125 | ||||||
| Taiwan Cement Corp. |
699,533 | 779,720 | ||||||
| Taiwan Chinsan Electronic Industrial Co., Ltd. |
75,000 | 135,536 | ||||||
| Taiwan Cogeneration Corp. |
88,000 | 67,471 | ||||||
| Taiwan Fire & Marine Insurance Co., Ltd. |
69,000 | 45,395 | ||||||
| Taiwan FU Hsing Industrial Co., Ltd. |
80,000 | 103,021 | ||||||
| Taiwan Land Development Corp. (a) |
490,750 | 165,881 | ||||||
| Taiwan Mobile Co., Ltd. |
4,000 | 14,246 | ||||||
| Taiwan Paiho, Ltd. |
90,433 | 416,020 | ||||||
| Taiwan Pulp & Paper Corp. (a) |
746,000 | 498,170 | ||||||
| Taiwan Sakura Corp. |
176,200 | 222,545 | ||||||
| Taiwan Semiconductor Manufacturing Co., Ltd. ADR |
59,861 | 2,247,781 | ||||||
| Taiwan Semiconductor Manufacturing Co., Ltd. |
1,655,500 | 11,819,541 | ||||||
| Taiwan TEA Corp. |
239,913 | 125,795 | ||||||
| Taiwan Union Technology Corp. |
309,000 | 819,272 | ||||||
| Taiyen Biotech Co., Ltd. |
141,500 | 130,889 | ||||||
| Tatung Co., Ltd. (a) |
395,885 | 161,884 | ||||||
| TPK Holding Co., Ltd. (a) |
8,000 | 25,801 | ||||||
| Transasia Airways Corp. (a) (d) |
361,784 | — | ||||||
| Tripod Technology Corp. |
161,320 | 558,587 | ||||||
| TrueLight Corp. |
9,100 | 10,953 | ||||||
| Tung Thih Electronic Co., Ltd. |
5,000 | 32,647 | ||||||
| Uni-President Enterprises Corp. |
302,993 | 634,483 | ||||||
| United Microelectronics Corp. ADR (b) |
599,179 | 1,497,948 | ||||||
| Unity Opto Technology Co., Ltd. |
12,759 | 5,070 | ||||||
| Ve Wong Corp. |
149,000 | 117,435 | ||||||
| Visual Photonics Epitaxy Co., Ltd. |
226,151 | 449,707 | ||||||
| Wei Chuan Foods Corp. (a) |
76,000 | 47,368 | ||||||
| Wei Mon Industry Co., Ltd. (a) (d) |
240,450 | — | ||||||
| Weikeng Industrial Co., Ltd. |
162,526 | 88,970 | ||||||
| Winbond Electronics Corp. |
86,000 | 74,871 | ||||||
| Wistron Corp. |
398,911 | 319,008 | ||||||
See accompanying notes to financial statements.
35
Table of Contents
SPDR Portfolio Emerging Markets ETF
(formerly, SPDR S&P Emerging Markets ETF)
SCHEDULE OF INVESTMENTS (continued)
September 30, 2017
| Security Description |
Shares | Value | ||||||
| Zeng Hsing Industrial Co., Ltd. |
70,350 | $ | 305,073 | |||||
| Zenitron Corp. |
319,000 | 192,511 | ||||||
|
|
|
|||||||
| 77,314,520 | ||||||||
|
|
|
|||||||
| THAILAND — 3.1% |
||||||||
| Advanced Info Service PCL (e) |
251,915 | 1,442,752 | ||||||
| Airports of Thailand PCL (e) |
402,700 | 712,423 | ||||||
| Bangkok Dusit Medical Services PCL (e) |
115,500 | 70,997 | ||||||
| Bangkok Expressway & Metro PCL (e) |
7,488,108 | 1,807,474 | ||||||
| Bangkok Land PCL (e) |
1,624,000 | 87,652 | ||||||
| Bank of Ayudhya PCL |
50,800 | 57,502 | ||||||
| Banpu PCL (e) |
549,960 | 290,234 | ||||||
| BEC World PCL (e) |
62,200 | 30,401 | ||||||
| BTS Group Holdings PCL (e) |
76,500 | 19,612 | ||||||
| Bumrungrad Hospital PCL (e) |
16,700 | 107,661 | ||||||
| Central Pattana PCL (e) |
121,600 | 284,402 | ||||||
| Central Plaza Hotel PCL (e) |
89,900 | 120,630 | ||||||
| CH Karnchang PCL (e) |
15,448 | 12,970 | ||||||
| Charoen Pokphand Foods PCL (e) |
45,900 | 36,816 | ||||||
| CP ALL PCL (e) |
420,200 | 828,430 | ||||||
| Electricity Generating PCL (e) |
186,774 | 1,316,099 | ||||||
| IRPC PCL (e) |
2,110,158 | 398,621 | ||||||
| Jasmine International PCL (e) |
638,541 | 157,003 | ||||||
| Kasikornbank PCL |
134,400 | 862,417 | ||||||
| Krung Thai Bank PCL (e) |
103,500 | 58,345 | ||||||
| Land & Houses PCL (e) |
163,300 | 48,721 | ||||||
| Minor International PCL (e) |
21,928 | 26,794 | ||||||
| Pruksa Holding PCL (e) |
61,700 | 43,477 | ||||||
| PTT Exploration & Production PCL (e) |
265,730 | 713,128 | ||||||
| PTT Global Chemical PCL (e) |
53,100 | 122,600 | ||||||
| PTT PCL (e) |
132,736 | 1,623,877 | ||||||
| Quality Houses PCL (e) |
569,783 | 47,154 | ||||||
| Sansiri PCL (e) |
592,033 | 40,475 | ||||||
| Siam Cement PCL |
91,923 | 1,383,668 | ||||||
| Siam Commercial Bank PCL (e) |
270,402 | 1,240,525 | ||||||
| Siam Future Development PCL (e) |
414,913 | 79,623 | ||||||
| Tesco Lotus Retail Growth Freehold & Leasehold Property Fund |
203,266 | 107,880 | ||||||
| Thai Airways International PCL (a) (e) |
146,400 | 79,894 | ||||||
| Thai Beverage PCL |
932,300 | 617,895 | ||||||
| Thai Oil PCL (e) |
260,395 | 722,235 | ||||||
| Thaicom PCL (e) |
92,800 | 46,191 | ||||||
| TICON Industrial Connection PCL (e) |
263,480 | 127,197 | ||||||
| Tisco Financial Group PCL NVDR |
14,200 | 32,786 | ||||||
| Tisco Financial Group PCL (e) |
322,018 | 743,490 | ||||||
See accompanying notes to financial statements.
36
Table of Contents
SPDR Portfolio Emerging Markets ETF
(formerly, SPDR S&P Emerging Markets ETF)
SCHEDULE OF INVESTMENTS (continued)
September 30, 2017
| Security Description |
Shares | Value | ||||||
| TMB Bank PCL (e) |
10,556,117 | $ | 797,644 | |||||
| Total Access Communication PCL (a) (e) |
16,200 | 27,688 | ||||||
| True Corp. PCL (a) (e) |
1,174,910 | 214,901 | ||||||
| TTCL PCL (e) |
16,000 | 7,868 | ||||||
| U City PCL (a) (e) |
19,312,900 | 17,373 | ||||||
|
|
|
|||||||
| 17,615,525 | ||||||||
|
|
|
|||||||
| TURKEY — 1.3% |
||||||||
| Akbank Turk AS |
238,946 | 631,617 | ||||||
| Anadolu Efes Biracilik Ve Malt Sanayii A/S |
51,360 | 302,143 | ||||||
| Aselsan Elektronik Sanayi Ve Ticaret A/S |
14,186 | 104,916 | ||||||
| BIM Birlesik Magazalar A/S |
9,360 | 195,433 | ||||||
| Coca-Cola Icecek A/S |
1,078 | 11,289 | ||||||
| Dogan Sirketler Grubu Holding A/S (a) |
335,247 | 82,018 | ||||||
| Eregli Demir ve Celik Fabrikalari TAS |
353,326 | 768,035 | ||||||
| Haci Omer Sabanci Holding A/S |
127,471 | 359,174 | ||||||
| KOC Holding A/S |
191,303 | 879,560 | ||||||
| Migros Ticaret A/S (a) |
2,005 | 14,513 | ||||||
| Tupras Turkiye Petrol Rafinerileri A/S |
26,120 | 893,167 | ||||||
| Turk Hava Yollari AO (a) |
62,750 | 154,400 | ||||||
| Turkcell Iletisim Hizmetleri A/S |
109,846 | 391,987 | ||||||
| Turkiye Garanti Bankasi A/S |
474,073 | 1,290,466 | ||||||
| Turkiye Halk Bankasi A/S |
24,437 | 83,287 | ||||||
| Turkiye Is Bankasi Class C |
298,472 | 569,062 | ||||||
| Turkiye Vakiflar Bankasi TAO |
41,712 | 73,545 | ||||||
| Ulker Biskuvi Sanayi A/S |
65,968 | 358,956 | ||||||
| Yapi ve Kredi Bankasi A/S (a) |
192,013 | 233,260 | ||||||
|
|
|
|||||||
| 7,396,828 | ||||||||
|
|
|
|||||||
| UNITED ARAB EMIRATES — 0.8% |
||||||||
| Abu Dhabi Commercial Bank PJSC |
215,465 | 416,539 | ||||||
| Agthia Group PJSC |
14,828 | 21,479 | ||||||
| Air Arabia PJSC |
497,778 | 154,511 | ||||||
| Ajman Bank PJSC (a) |
214,727 | 67,236 | ||||||
| Al Waha Capital PJSC |
96,003 | 44,961 | ||||||
| Aldar Properties PJSC |
417,606 | 264,937 | ||||||
| Arabtec Holding PJSC (a) |
74,617 | 58,513 | ||||||
| Bank of Sharjah |
88,235 | 29,310 | ||||||
| DAMAC Properties Dubai Co. PJSC |
346,082 | 358,082 | ||||||
| Depa, Ltd. |
52,265 | 19,077 | ||||||
| Deyaar Development PJSC (a) |
323,951 | 43,574 | ||||||
| DP World, Ltd. |
17,056 | 383,078 | ||||||
| Dubai Financial Market PJSC (a) |
195,262 | 59,015 | ||||||
| Dubai Investments PJSC |
168,078 | 106,174 | ||||||
| Emaar Malls PJSC |
104,183 | 66,096 | ||||||
See accompanying notes to financial statements.
37
Table of Contents
SPDR Portfolio Emerging Markets ETF
(formerly, SPDR S&P Emerging Markets ETF)
SCHEDULE OF INVESTMENTS (continued)
September 30, 2017
| Security Description |
Shares | Value | ||||||
| Emaar Properties PJSC |
360,598 | $ | 833,588 | |||||
| Eshraq Properties Co. PJSC (a) |
246,758 | 51,735 | ||||||
| First Abu Dhabi Bank PJSC |
202,373 | 562,048 | ||||||
| Gulf General Investment Co. (a) |
192,415 | 19,228 | ||||||
| Gulf Pharmaceutical Industries PSC |
37,561 | 26,898 | ||||||
| Invest bank PSC |
27,643 | 18,591 | ||||||
| National Central Cooling Co. PJSC |
375,318 | 210,517 | ||||||
| Orascom Construction, Ltd. (a) |
1,396 | 9,423 | ||||||
| RAK Properties PJSC |
378,091 | 71,034 | ||||||
| Ras Al Khaimah Ceramics |
34,427 | 22,497 | ||||||
| SHUAA Capital PSC (a) |
517,256 | 157,741 | ||||||
| Union National Bank PJSC |
75,945 | 88,090 | ||||||
| Union Properties PJSC (a) |
158,120 | 36,380 | ||||||
|
|
|
|||||||
| 4,200,352 | ||||||||
|
|
|
|||||||
| TOTAL COMMON STOCKS |
558,389,827 | |||||||
|
|
|
|||||||
| WARRANTS — 0.0% (g) |
||||||||
| MALAYSIA — 0.0% (g) |
||||||||
| KNM Group Bhd (expiring 11/15/17) (a) |
66,712 | 79 | ||||||
| VS Industry Bhd (expiring 1/6/19) (a) |
19,500 | 4,480 | ||||||
|
|
|
|||||||
| 4,559 | ||||||||
|
|
|
|||||||
| SOUTH AFRICA — 0.0% (g) |
||||||||
| Adcock Ingram Holdings, Ltd. (expiring 7/26/19) (a) |
335 | 273 | ||||||
|
|
|
|||||||
| TOTAL WARRANTS |
4,832 | |||||||
|
|
|
|||||||
| RIGHTS — 0.0% (g) |
||||||||
| BRAZIL — 0.0% (g) |
||||||||
| Cosan Logistica SA (expiring 10/26/17) (a) |
1,353 | 436 | ||||||
|
|
|
|||||||
| CHINA — 0.0% (g) |
||||||||
| China State Construction International Holdings, Ltd. (expiring 10/3/17) (a) (e) |
17,250 | 110 | ||||||
|
|
|
|||||||
| GREECE — 0.0% (g) |
||||||||
| Frigoglass SAIC (expiring 10/18/17) (a) |
77 | — | ||||||
|
|
|
|||||||
| MALAYSIA — 0.0% (g) |
||||||||
| UMW Oil & Gas Corp. Bhd (expiring 10/10/17) (a) |
107,696 | 128 | ||||||
|
|
|
|||||||
| TOTAL RIGHTS |
674 | |||||||
|
|
|
|||||||
See accompanying notes to financial statements.
38
Table of Contents
SPDR Portfolio Emerging Markets ETF
(formerly, SPDR S&P Emerging Markets ETF)
SCHEDULE OF INVESTMENTS (continued)
September 30, 2017
| Security Description |
Shares | Value | ||||||
| SHORT-TERM INVESTMENTS — 1.5% |
||||||||
| State Street Navigator Securities Lending Government Money Market Portfolio (h) (i) |
8,647,800 | $ | 8,647,800 | |||||
|
|
|
|||||||
| TOTAL INVESTMENTS — 100.8% |
567,043,133 | |||||||
|
|
|
|||||||
| LIABILITIES IN EXCESS OF OTHER ASSETS — (0.8)% |
(4,607,142 | ) | ||||||
|
|
|
|||||||
| NET ASSETS — 100.0% |
$ | 562,435,991 | ||||||
|
|
|
|||||||
| (a) | Non-income producing security. |
| (b) | All or a portion of the shares of the security are on loan at September 30, 2017. |
| (c) | Securities purchased pursuant to Rule 144A of the Securities Act of 1933, as amended. These securities, which represent 0.3% of net assets as of September 30, 2017, are considered liquid and may be resold in transactions exempt from registration, normally to qualified institutional buyers. |
| (d) | Fair valued as determined in good faith by the Trust’s Oversight Committee in accordance with policy and procedures approved by the Board of Trustees. Security value is determined based on Level 3 inputs. As of September 30, 2017, total aggregate fair value of the securities is $28,081, representing less than 0.05% of the Fund’s net assets. |
| (e) | Fair valued as determined in good faith by the Trust’s Oversight Committee in accordance with policy and procedures approved by the Board of Trustees. As of September 30, 2017, total aggregate fair value of securities is $14,672,229 representing 2.5% of net assets. |
| (f) | Reflects separate holdings of the issuer’s common stock traded on different securities exchanges. |
| (g) | Amount is less than 0.05% of net assets. |
| (h) | The Fund invested in certain money market funds managed by SSGA Funds Management, Inc. Amounts related to these transactions during the period ended September 30, 2017 are shown in the Affiliate Table below. |
| (i) | Investment of cash collateral for securities loaned. |
| ADR | = | American Depositary Receipt | ||
| GDR | = | Global Depositary Receipt | ||
| NVDR | = | Non Voting Depositary Receipt | ||
| REIC | = | Real Estate Investment Company | ||
| REIT | = | Real Estate Investment Trust |
At September 30, 2017, open futures contracts purchased were as follows:
| Futures Contracts |
Expiration Date |
Number of Contracts |
Notional Amount |
Value | Unrealized Appreciation/ Depreciation |
|||||||||||||
| MSCI Taiwan Index Futures |
10/30/2017 | 13 | $ | 501,239 | $ | 500,149 | $ | (1,090 | ) | |||||||||
During the period ended September 30, 2017, average notional value related to futures contracts was $475,290 or less than 0.5% of net assets.
See accompanying notes to financial statements.
39
Table of Contents
SPDR Portfolio Emerging Markets ETF
(formerly, SPDR S&P Emerging Markets ETF)
SCHEDULE OF INVESTMENTS (continued)
September 30, 2017
The following table summarizes the value of the Fund’s investments according to the fair value hierarchy as of September 30, 2017.
| Description |
Level 1 — Quoted Prices |
Level 2 — Other Significant Observable Inputs |
Level 3 — Significant Unobservable Inputs |
Total | ||||||||||||
| ASSETS: |
||||||||||||||||
| INVESTMENTS: |
||||||||||||||||
| Common Stocks |
||||||||||||||||
| Brazil |
$ | 48,653,958 | $ | — | $ | — | $ | 48,653,958 | ||||||||
| Chile |
9,654,807 | — | — | 9,654,807 | ||||||||||||
| China |
174,909,103 | 22,114 | 11,689 | 174,942,906 | ||||||||||||
| Colombia |
3,193,506 | — | — | 3,193,506 | ||||||||||||
| Czech Republic |
1,787,877 | — | — | 1,787,877 | ||||||||||||
| Egypt |
1,830,377 | — | — | 1,830,377 | ||||||||||||
| Greece |
982,655 | — | — | 982,655 | ||||||||||||
| Hong Kong |
6,926,010 | 13,901 | 16,392 | 6,956,303 | ||||||||||||
| Hungary |
3,642,222 | — | — | 3,642,222 | ||||||||||||
| India |
65,360,704 | 461,061 | 0 | (a) | 65,821,765 | |||||||||||
| Indonesia |
15,396,283 | 4,873 | — | 15,401,156 | ||||||||||||
| Malaysia |
14,682,641 | 131 | — | 14,682,772 | ||||||||||||
| Malta |
200 | — | — | 200 | ||||||||||||
| Mexico |
22,367,565 | — | — | 22,367,565 | ||||||||||||
| Monaco |
45,963 | — | — | 45,963 | ||||||||||||
| Netherlands |
260,134 | — | — | 260,134 | ||||||||||||
| Peru |
4,849,825 | — | — | 4,849,825 | ||||||||||||
| Philippines |
8,300,764 | — | — | 8,300,764 | ||||||||||||
| Poland |
6,694,687 | — | — | 6,694,687 | ||||||||||||
| Qatar |
2,831,031 | — | — | 2,831,031 | ||||||||||||
| Russia |
22,484,270 | — | — | 22,484,270 | ||||||||||||
| South Africa |
36,469,409 | 8,450 | — | 36,477,859 | ||||||||||||
| Taiwan |
77,285,424 | 29,096 | 0 | (a) | 77,314,520 | |||||||||||
| Thailand |
3,062,148 | 14,553,377 | — | 17,615,525 | ||||||||||||
| Turkey |
7,396,828 | — | — | 7,396,828 | ||||||||||||
| United Arab Emirates |
4,154,863 | 45,489 | — | 4,200,352 | ||||||||||||
| Warrants |
||||||||||||||||
| Malaysia |
4,480 | 79 | — | 4,559 | ||||||||||||
| South Africa |
273 | — | — | 273 | ||||||||||||
| Rights |
||||||||||||||||
| Brazil |
436 | — | — | 436 | ||||||||||||
| China |
— | 110 | — | 110 | ||||||||||||
| Greece |
0 | — | — | 0 | ||||||||||||
See accompanying notes to financial statements.
40
Table of Contents
SPDR Portfolio Emerging Markets ETF
(formerly, SPDR S&P Emerging Markets ETF)
SCHEDULE OF INVESTMENTS (continued)
September 30, 2017
| Description |
Level 1 — Quoted Prices |
Level 2 — Other Significant Observable Inputs |
Level 3 — Significant Unobservable Inputs |
Total | ||||||||||||
| Malaysia |
$ | 128 | $ | — | $ | — | $ | 128 | ||||||||
| Short-Term Investments |
8,647,800 | — | — | 8,647,800 | ||||||||||||
|
|
|
|
|
|
|
|
|
|||||||||
| TOTAL INVESTMENTS |
$ | 551,876,371 | $ | 15,138,681 | $ | 28,081 | $ | 567,043,133 | ||||||||
|
|
|
|
|
|
|
|
|
|||||||||
| LIABILITIES: |
||||||||||||||||
| OTHER FINANCIAL INSTRUMENTS: |
||||||||||||||||
| Futures Contracts |
(1,090 | ) | — | — | (1,090 | ) | ||||||||||
|
|
|
|
|
|
|
|
|
|||||||||
| TOTAL OTHER FINANCIAL INSTRUMENTS: |
$ | (1,090 | ) | $ | — | $ | — | $ | (1,090 | ) | ||||||
|
|
|
|
|
|
|
|
|
|||||||||
| (a) | Fund held Level 3 securities that were valued at $0 at September 30, 2017. |
Affiliate Table
| Number of Shares Held at 9/30/16 |
Value at 9/30/16 |
Cost of Purchases |
Proceeds from Shares Sold |
Realized Gain (Loss) |
Change in Unrealized Appreciation/ Depreciation |
Number of Shares Held at 9/30/17 |
Value at 9/30/17 |
Dividend Income |
||||||||||||||||||||||||||||
| State Street Institutional |
||||||||||||||||||||||||||||||||||||
| U.S. Government Money Market Fund, Class G Shares |
— | $ | — | $ | 20,734,160 | $ | 20,734,160 | $ | — | $ | — | — | $ | — | $ | 5,881 | ||||||||||||||||||||
| State Street Institutional |
||||||||||||||||||||||||||||||||||||
| U.S. Government Money Market Fund, Premier Class |
1,745,114 | 1,745,114 | 12,134,238 | 13,879,352 | — | — | — | — | 1,677 | |||||||||||||||||||||||||||
| State Street Navigator Securities |
||||||||||||||||||||||||||||||||||||
| Lending Government Money Market Portfolio* |
3,656,112 | 3,656,112 | 44,196,372 | 39,204,684 | — | — | 8,647,800 | 8,647,800 | 73,463 | |||||||||||||||||||||||||||
|
|
|
|
|
|
|
|
|
|
|
|
|
|
|
|||||||||||||||||||||||
| Total |
$ | 5,401,226 | $ | 77,064,770 | $ | 73,818,196 | $ | — | $ | — | $ | 8,647,800 | $ | 81,021 | ||||||||||||||||||||||
|
|
|
|
|
|
|
|
|
|
|
|
|
|
|
|||||||||||||||||||||||
| * | Effective October 5, 2016, the name of State Street Navigator Securities Lending Prime Portfolio was changed to State Street Navigator Securities Lending Government Money Market Portfolio. |
See accompanying notes to financial statements.
41
Table of Contents
SPDR Portfolio World ex-US ETF
(formerly, SPDR S&P World ex-US ETF)
SCHEDULE OF INVESTMENTS
September 30, 2017
| Security Description |
Shares | Value | ||||||
| COMMON STOCKS — 99.5% |
||||||||
| AUSTRALIA — 5.6% |
||||||||
| Abacus Property Group REIT |
14,579 | $ | 43,241 | |||||
| AGL Energy, Ltd. |
34,041 | 624,219 | ||||||
| Alumina, Ltd. |
335,088 | 578,439 | ||||||
| Amcor, Ltd. |
92,974 | 1,109,600 | ||||||
| AMP, Ltd. |
188,401 | 714,013 | ||||||
| Ansell, Ltd. |
29,677 | 518,813 | ||||||
| APA Group |
130,909 | 857,693 | ||||||
| Aristocrat Leisure, Ltd. |
60,228 | 992,416 | ||||||
| Arrium, Ltd. (a) (b) (c) |
163,093 | — | ||||||
| Australia & New Zealand Banking Group, Ltd. |
139,605 | 3,242,414 | ||||||
| BHP Billiton PLC |
95,355 | 1,681,680 | ||||||
| BHP Billiton, Ltd. |
159,422 | 3,224,831 | ||||||
| BlueScope Steel, Ltd. |
42,840 | 368,750 | ||||||
| Boral, Ltd. |
34,672 | 184,180 | ||||||
| Brambles, Ltd. |
135,537 | 957,142 | ||||||
| BWP Trust REIT |
206,651 | 478,339 | ||||||
| Caltex Australia, Ltd. |
13,659 | 344,033 | ||||||
| carsales.com, Ltd. |
18,362 | 184,851 | ||||||
| Challenger, Ltd. |
33,659 | 328,811 | ||||||
| Coca-Cola Amatil, Ltd. |
31,972 | 193,921 | ||||||
| Cochlear, Ltd. |
2,813 | 351,411 | ||||||
| Commonwealth Bank of Australia |
85,419 | 5,043,556 | ||||||
| Computershare, Ltd. |
86,919 | 986,868 | ||||||
| CSL, Ltd. |
25,791 | 2,710,935 | ||||||
| CSR, Ltd. |
121,025 | 449,171 | ||||||
| Dexus Property Group REIT |
23,688 | 176,574 | ||||||
| Fairfax Media, Ltd. |
124,363 | 92,214 | ||||||
| Fortescue Metals Group, Ltd. |
86,728 | 349,783 | ||||||
| Goodman Group REIT |
80,106 | 517,927 | ||||||
| GPT Group REIT |
89,267 | 347,415 | ||||||
| GWA Group, Ltd. |
111,026 | 227,374 | ||||||
| Harvey Norman Holdings, Ltd. (c) |
29,655 | 90,283 | ||||||
| Healthscope, Ltd. |
104,851 | 137,393 | ||||||
| Iluka Resources, Ltd. |
26,788 | 199,682 | ||||||
| Incitec Pivot, Ltd. |
84,781 | 239,484 | ||||||
| Infigen Energy (b) (c) |
79,435 | 47,370 | ||||||
| Ingenia Communities Group REIT |
74,289 | 153,888 | ||||||
| Insurance Australia Group, Ltd. |
215,436 | 1,076,796 | ||||||
| LendLease Group |
84,664 | 1,190,454 | ||||||
| Macquarie Group, Ltd. |
22,777 | 1,624,919 | ||||||
| Medibank Pvt, Ltd. |
139,341 | 319,255 | ||||||
| Mirvac Group REIT |
91,205 | 163,882 | ||||||
See accompanying notes to financial statements.
42
Table of Contents
SPDR Portfolio World ex-US ETF
(formerly, SPDR S&P World ex-US ETF)
SCHEDULE OF INVESTMENTS (continued)
September 30, 2017
| Security Description |
Shares | Value | ||||||
| National Australia Bank, Ltd. |
124,177 | $ | 3,069,217 | |||||
| Newcrest Mining, Ltd. |
44,070 | 726,861 | ||||||
| Oil Search, Ltd. |
59,174 | 325,016 | ||||||
| Orica, Ltd. |
15,455 | 239,746 | ||||||
| Origin Energy, Ltd. (b) |
113,937 | 668,717 | ||||||
| Orora, Ltd. |
95,420 | 232,101 | ||||||
| OZ Minerals, Ltd. |
24,250 | 141,186 | ||||||
| Perpetual, Ltd. |
15,366 | 624,790 | ||||||
| QBE Insurance Group, Ltd. |
68,390 | 537,159 | ||||||
| Ramsay Health Care, Ltd. |
6,519 | 318,570 | ||||||
| REA Group, Ltd. |
2,661 | 139,893 | ||||||
| Santos, Ltd. (b) |
126,961 | 400,472 | ||||||
| Scentre Group REIT |
264,490 | 815,601 | ||||||
| SEEK, Ltd. |
17,933 | 233,721 | ||||||
| Sonic Healthcare, Ltd. |
30,516 | 500,677 | ||||||
| South32, Ltd. (d) |
92,360 | 238,846 | ||||||
| South32, Ltd. (d) |
160,082 | 410,739 | ||||||
| Stockland REIT |
125,834 | 424,563 | ||||||
| Suncorp Group, Ltd. |
65,101 | 666,613 | ||||||
| Sydney Airport |
56,170 | 313,365 | ||||||
| Tatts Group, Ltd. |
205,964 | 643,206 | ||||||
| Telstra Corp., Ltd. |
219,432 | 600,899 | ||||||
| TPG Telecom, Ltd. (c) |
18,343 | 70,093 | ||||||
| Transurban Group |
101,121 | 942,614 | ||||||
| Treasury Wine Estates, Ltd. |
63,346 | 680,454 | ||||||
| Vicinity Centres REIT |
165,309 | 345,028 | ||||||
| Wesfarmers, Ltd. |
59,853 | 1,941,007 | ||||||
| Westfield Corp. REIT |
102,143 | 628,348 | ||||||
| Westpac Banking Corp. |
161,648 | 4,048,639 | ||||||
| Woodside Petroleum, Ltd. |
46,791 | 1,068,393 | ||||||
| Woolworths, Ltd. |
82,110 | 1,624,220 | ||||||
| WorleyParsons, Ltd. (b) |
25,044 | 265,285 | ||||||
|
|
|
|||||||
| 57,010,059 | ||||||||
|
|
|
|||||||
| AUSTRIA — 0.3% |
||||||||
| ams AG (b) |
3,071 | 222,803 | ||||||
| ANDRITZ AG |
1,811 | 104,704 | ||||||
| Erste Group Bank AG (b) |
17,843 | 770,880 | ||||||
| OMV AG |
17,710 | 1,031,972 | ||||||
| Raiffeisen Bank International AG (b) |
6,671 | 223,620 | ||||||
| voestalpine AG |
15,786 | 805,181 | ||||||
|
|
|
|||||||
| 3,159,160 | ||||||||
|
|
|
|||||||
| BELGIUM — 1.2% |
||||||||
| Ackermans & van Haaren NV |
1,124 | 197,126 | ||||||
See accompanying notes to financial statements.
43
Table of Contents
SPDR Portfolio World ex-US ETF
(formerly, SPDR S&P World ex-US ETF)
SCHEDULE OF INVESTMENTS (continued)
September 30, 2017
| Security Description |
Shares | Value | ||||||
| Aedifica SA REIT |
3,647 | $ | 344,143 | |||||
| Ageas |
23,379 | 1,098,912 | ||||||
| Anheuser-Busch InBev SA/NV |
49,106 | 5,880,777 | ||||||
| Bekaert SA |
4,967 | 238,285 | ||||||
| Colruyt SA (c) |
3,179 | 162,862 | ||||||
| Galapagos NV (b) |
2,187 | 222,842 | ||||||
| Gimv NV |
948 | 58,278 | ||||||
| Groupe Bruxelles Lambert SA |
4,065 | 427,702 | ||||||
| KBC Group NV |
17,095 | 1,449,036 | ||||||
| Proximus SADP |
7,180 | 247,473 | ||||||
| Solvay SA |
3,726 | 556,776 | ||||||
| UCB SA |
11,801 | 840,277 | ||||||
| Umicore SA |
5,112 | 422,978 | ||||||
|
|
|
|||||||
| 12,147,467 | ||||||||
|
|
|
|||||||
| CANADA — 8.3% |
||||||||
| AGF Management, Ltd. Class B |
33,531 | 216,900 | ||||||
| Agnico Eagle Mines, Ltd. |
11,524 | 519,601 | ||||||
| Agrium, Inc. |
12,324 | 1,317,687 | ||||||
| Air Canada (b) |
13,300 | 279,049 | ||||||
| Alamos Gold, Inc. Class A |
12,349 | 83,238 | ||||||
| Algonquin Power & Utilities Corp. (c) |
13,450 | 141,851 | ||||||
| Alimentation Couche-Tard, Inc. Class B |
21,230 | 965,887 | ||||||
| AltaGas, Ltd. |
7,335 | 168,559 | ||||||
| ARC Resources, Ltd. (c) |
18,813 | 258,582 | ||||||
| Argonaut Gold, Inc. (b) |
17,622 | 34,521 | ||||||
| Atco, Ltd. Class I |
3,726 | 136,450 | ||||||
| Athabasca Oil Corp. (b) |
17,275 | 15,470 | ||||||
| Avigilon Corp. (b) (c) |
3,446 | 49,266 | ||||||
| B2Gold Corp. (b) |
55,967 | 153,941 | ||||||
| Badger Daylighting, Ltd. (c) |
3,325 | 70,639 | ||||||
| Bank of Montreal |
30,410 | 2,296,099 | ||||||
| Bank of Nova Scotia |
60,336 | 3,869,146 | ||||||
| Barrick Gold Corp. |
60,741 | 975,236 | ||||||
| BCE, Inc. |
13,805 | 645,297 | ||||||
| BlackBerry, Ltd. (b) |
32,562 | 363,203 | ||||||
| Bombardier, Inc. Class B (b) |
120,971 | 218,602 | ||||||
| Brookfield Asset Management, Inc. Class A |
53,124 | 2,188,421 | ||||||
| CAE, Inc. |
14,541 | 253,812 | ||||||
| Cameco Corp. (c) |
33,619 | 323,919 | ||||||
| Canadian Imperial Bank of Commerce |
22,362 | 1,951,993 | ||||||
| Canadian National Railway Co. |
40,394 | 3,339,009 | ||||||
| Canadian Natural Resources, Ltd. |
65,786 | 2,198,214 | ||||||
| Canadian Pacific Railway, Ltd. |
10,026 | 1,680,126 | ||||||
See accompanying notes to financial statements.
44
Table of Contents
SPDR Portfolio World ex-US ETF
(formerly, SPDR S&P World ex-US ETF)
SCHEDULE OF INVESTMENTS (continued)
September 30, 2017
| Security Description |
Shares | Value | ||||||
| Canadian Solar, Inc. (b) (c) |
2,294 | $ | 38,631 | |||||
| Canadian Tire Corp., Ltd. Class A |
4,206 | 522,416 | ||||||
| Canadian Utilities, Ltd. Class A |
5,877 | 182,092 | ||||||
| Canadian Western Bank |
22,328 | 601,829 | ||||||
| CCL Industries, Inc. Class B |
6,089 | 293,970 | ||||||
| Cenovus Energy, Inc. (c) |
38,736 | 387,468 | ||||||
| CES Energy Solutions Corp. |
15,786 | 79,646 | ||||||
| CGI Group, Inc. Class A (b) |
21,407 | 1,107,450 | ||||||
| CI Financial Corp. |
12,150 | 265,121 | ||||||
| Cineplex, Inc. (c) |
3,179 | 99,235 | ||||||
| Constellation Software, Inc. |
1,019 | 554,651 | ||||||
| Crescent Point Energy Corp. (c) |
35,826 | 287,032 | ||||||
| CT Real Estate Investment Trust |
14,696 | 163,217 | ||||||
| Detour Gold Corp. (b) |
9,713 | 106,865 | ||||||
| Dollarama, Inc. |
5,688 | 620,943 | ||||||
| ECN Capital Corp. |
16,198 | 51,289 | ||||||
| Eldorado Gold Corp. |
33,293 | 72,940 | ||||||
| Element Fleet Management Corp. |
19,405 | 143,522 | ||||||
| Emera, Inc. (c) |
7,353 | 277,858 | ||||||
| Empire Co., Ltd. |
8,138 | 143,675 | ||||||
| Enbridge Income Fund Holdings, Inc. |
4,861 | 124,921 | ||||||
| Enbridge, Inc. |
80,063 | 3,336,572 | ||||||
| Encana Corp. |
47,523 | 558,200 | ||||||
| Enerplus Corp. |
7,881 | 77,572 | ||||||
| Exchange Income Corp. (c) |
7,197 | 201,008 | ||||||
| Fairfax Financial Holdings, Ltd. |
1,900 | 986,469 | ||||||
| Finning International, Inc. |
7,000 | 159,685 | ||||||
| Firm Capital Mortgage Investment Corp. |
29,322 | 289,551 | ||||||
| First Capital Realty, Inc. |
6,791 | 106,862 | ||||||
| First Majestic Silver Corp. (b) (c) |
13,838 | 94,271 | ||||||
| First Quantum Minerals, Ltd. |
33,676 | 377,244 | ||||||
| Fortis, Inc. |
20,405 | 730,609 | ||||||
| Franco-Nevada Corp. |
8,593 | 664,134 | ||||||
| George Weston, Ltd. |
2,351 | 204,243 | ||||||
| Gildan Activewear, Inc. |
11,687 | 364,351 | ||||||
| Goldcorp, Inc. |
47,239 | 611,899 | ||||||
| Gran Tierra Energy, Inc. (b) |
25,165 | 56,944 | ||||||
| Great-West Lifeco, Inc. |
15,286 | 438,908 | ||||||
| H&R Real Estate Investment Trust |
6,791 | 116,962 | ||||||
| Home Capital Group, Inc. (c) |
3,438 | 38,183 | ||||||
| Husky Energy, Inc. (b) |
30,104 | 375,984 | ||||||
| Hydro One, Ltd. |
8,367 | 152,000 | ||||||
| IAMGOLD Corp. (b) |
42,521 | 259,413 | ||||||
| Imperial Oil, Ltd. |
12,442 | 396,544 | ||||||
See accompanying notes to financial statements.
45
Table of Contents
SPDR Portfolio World ex-US ETF
(formerly, SPDR S&P World ex-US ETF)
SCHEDULE OF INVESTMENTS (continued)
September 30, 2017
| Security Description |
Shares | Value | ||||||
| Industrial Alliance Insurance & Financial Services, Inc. |
5,114 | $ | 231,033 | |||||
| Innergex Renewable Energy, Inc. |
25,431 | 292,203 | ||||||
| Intact Financial Corp. |
7,113 | 586,205 | ||||||
| Inter Pipeline, Ltd. |
16,942 | 350,178 | ||||||
| International Petroleum Corp. (b) |
3,745 | 16,242 | ||||||
| K-Bro Linen, Inc. |
7,000 | 217,559 | ||||||
| Keyera Corp. |
8,652 | 263,853 | ||||||
| Kinross Gold Corp. (b) |
55,281 | 233,828 | ||||||
| Linamar Corp. |
2,520 | 153,418 | ||||||
| Loblaw Cos., Ltd. |
11,787 | 641,822 | ||||||
| Lundin Mining Corp. |
37,206 | 254,654 | ||||||
| MacDonald Dettwiler & Associates, Ltd. |
2,294 | 130,195 | ||||||
| Magna International, Inc. |
19,785 | 1,053,439 | ||||||
| Manulife Financial Corp. |
104,683 | 2,118,520 | ||||||
| Methanex Corp. |
4,214 | 211,264 | ||||||
| Metro, Inc. |
12,362 | 424,142 | ||||||
| National Bank of Canada |
18,845 | 904,843 | ||||||
| New Gold, Inc. (b) |
30,125 | 111,525 | ||||||
| Obsidian Energy, Ltd. (b) (c) |
25,711 | 27,137 | ||||||
| Onex Corp. |
4,105 | 316,052 | ||||||
| Open Text Corp. |
10,996 | 353,975 | ||||||
| Pan American Silver Corp. |
7,497 | 127,383 | ||||||
| Parex Resources, Inc. (b) |
18,329 | 220,566 | ||||||
| Pembina Pipeline Corp. |
15,488 | 542,170 | ||||||
| Pengrowth Energy Corp. (b) (c) |
23,130 | 23,488 | ||||||
| Peyto Exploration & Development Corp. (c) |
6,667 | 108,749 | ||||||
| Potash Corp. of Saskatchewan, Inc. (c) |
53,970 | 1,036,549 | ||||||
| Power Corp. of Canada |
18,813 | 477,000 | ||||||
| Power Financial Corp. |
15,651 | 433,120 | ||||||
| PrairieSky Royalty, Ltd. (c) |
10,340 | 263,988 | ||||||
| Precision Drilling Corp. (b) |
15,581 | 48,338 | ||||||
| Pure Industrial Real Estate Trust |
42,348 | 215,355 | ||||||
| Quebecor, Inc. Class B |
4,155 | 155,781 | ||||||
| Restaurant Brands International, Inc. |
11,502 | 733,170 | ||||||
| Richmont Mines, Inc. (b) |
7,482 | 69,576 | ||||||
| RioCan Real Estate Investment Trust |
7,845 | 150,107 | ||||||
| Ritchie Bros Auctioneers, Inc. (c) |
5,367 | 169,295 | ||||||
| Rogers Communications, Inc. Class B |
28,397 | 1,460,891 | ||||||
| Royal Bank of Canada |
80,081 | 6,181,601 | ||||||
| Russel Metals, Inc. |
2,990 | 65,937 | ||||||
| Saputo, Inc. |
13,229 | 456,851 | ||||||
| Secure Energy Services, Inc. (c) |
9,639 | 66,744 | ||||||
| SEMAFO, Inc. (b) |
23,233 | 61,303 | ||||||
| Seven Generations Energy, Ltd. Class A (b) |
8,794 | 138,803 | ||||||
See accompanying notes to financial statements.
46
Table of Contents
SPDR Portfolio World ex-US ETF
(formerly, SPDR S&P World ex-US ETF)
SCHEDULE OF INVESTMENTS (continued)
September 30, 2017
| Security Description |
Shares | Value | ||||||
| Shaw Communications, Inc. Class B |
41,058 | $ | 942,858 | |||||
| Sherritt International Corp. (b) |
47,466 | 40,610 | ||||||
| Shopify, Inc. Class A (b) |
2,896 | 336,039 | ||||||
| SNC-Lavalin Group, Inc. |
10,015 | 451,562 | ||||||
| Stantec, Inc. |
3,872 | 107,214 | ||||||
| Stars Group, Inc. (b) |
9,336 | 190,355 | ||||||
| Sun Life Financial, Inc. |
38,923 | 1,546,463 | ||||||
| Suncor Energy, Inc. |
96,924 | 3,389,027 | ||||||
| Tahoe Resources, Inc. |
7,197 | 37,750 | ||||||
| Teck Resources, Ltd. Class B |
29,591 | 621,561 | ||||||
| TELUS Corp. |
23,687 | 850,016 | ||||||
| Thomson Reuters Corp. |
21,342 | 976,956 | ||||||
| TMX Group, Ltd. |
2,477 | 139,630 | ||||||
| Toromont Industries, Ltd. |
3,872 | 177,153 | ||||||
| Toronto-Dominion Bank |
99,128 | 5,568,098 | ||||||
| Tourmaline Oil Corp. (b) |
6,397 | 129,766 | ||||||
| TransCanada Corp. (c) |
44,657 | 2,202,053 | ||||||
| Trinidad Drilling, Ltd. (b) |
11,462 | 17,322 | ||||||
| Turquoise Hill Resources, Ltd. (b) |
47,962 | 148,030 | ||||||
| Valeant Pharmaceuticals International, Inc. (b) |
16,951 | 242,341 | ||||||
| Veresen, Inc. |
15,383 | 230,256 | ||||||
| Vermilion Energy, Inc. (c) |
5,631 | 199,684 | ||||||
| Waste Connections, Inc. |
12,943 | 903,055 | ||||||
| West Fraser Timber Co., Ltd. |
2,062 | 118,709 | ||||||
| Wheaton Precious Metals Corp. |
20,109 | 382,676 | ||||||
| Whitecap Resources, Inc. (c) |
18,167 | 140,903 | ||||||
| Yamana Gold, Inc. |
58,894 | 155,399 | ||||||
| Yellow Pages, Ltd. (b) (c) |
5,683 | 39,215 | ||||||
|
|
|
|||||||
| 83,820,650 | ||||||||
|
|
|
|||||||
| CHILE — 0.0% (e) |
||||||||
| Antofagasta PLC |
17,326 | 220,599 | ||||||
|
|
|
|||||||
| CHINA — 0.2% |
||||||||
| APT Satellite Holdings, Ltd. |
176,000 | 82,246 | ||||||
| Bloomage BioTechnology Corp., Ltd. |
24,147 | 48,228 | ||||||
| BOC Hong Kong Holdings, Ltd. |
183,500 | 891,575 | ||||||
| China Everbright Water, Ltd. (c) |
118,215 | 36,998 | ||||||
| Chong Hing Bank, Ltd. |
1,385 | 2,827 | ||||||
| ENN Energy Holdings, Ltd. |
38,000 | 275,366 | ||||||
| Fosun International, Ltd. (c) |
122,500 | 258,152 | ||||||
See accompanying notes to financial statements.
47
Table of Contents
SPDR Portfolio World ex-US ETF
(formerly, SPDR S&P World ex-US ETF)
SCHEDULE OF INVESTMENTS (continued)
September 30, 2017
| Security Description |
Shares | Value | ||||||
| HC International, Inc. |
60,000 | $ | 48,395 | |||||
| Sino Grandness Food Industry Group, Ltd. (b) (c) |
367,445 | 59,529 | ||||||
|
|
|
|||||||
| 1,703,316 | ||||||||
|
|
|
|||||||
| DENMARK — 1.5% |
||||||||
| AP Moeller - Maersk A/S Class B |
319 | 606,094 | ||||||
| AP Moller - Maersk A/S Class A |
159 | 292,246 | ||||||
| Carlsberg A/S Class B |
5,215 | 570,810 | ||||||
| Chr Hansen Holding A/S |
4,865 | 417,344 | ||||||
| Coloplast A/S Class B |
4,361 | 354,018 | ||||||
| Danske Bank A/S |
50,465 | 2,018,664 | ||||||
| DONG Energy A/S |
10,165 | 581,983 | ||||||
| DSV A/S |
8,849 | 669,565 | ||||||
| FLSmidth & Co. A/S |
9,286 | 614,120 | ||||||
| Genmab A/S (b) |
2,717 | 599,960 | ||||||
| GN Store Nord A/S |
7,226 | 247,724 | ||||||
| ISS A/S |
9,043 | 363,743 | ||||||
| Jyske Bank A/S |
2,388 | 137,822 | ||||||
| Novo Nordisk A/S Class B |
98,725 | 4,720,757 | ||||||
| Novozymes A/S Class B |
11,013 | 565,276 | ||||||
| Pandora A/S (c) |
6,179 | 610,067 | ||||||
| SimCorp A/S |
2,011 | 122,836 | ||||||
| TDC A/S |
13,159 | 77,117 | ||||||
| Vestas Wind Systems A/S |
13,614 | 1,221,947 | ||||||
|
|
|
|||||||
| 14,792,093 | ||||||||
|
|
|
|||||||
| FINLAND — 1.1% |
||||||||
| Amer Sports Oyj (b) |
6,790 | 180,129 | ||||||
| Caverion Corp. (b) |
13,188 | 121,141 | ||||||
| Elisa Oyj |
7,680 | 330,668 | ||||||
| Fortum Oyj |
22,622 | 451,701 | ||||||
| Kemira Oyj |
21,484 | 282,430 | ||||||
| Kesko Oyj Class B |
3,791 | 203,336 | ||||||
| Kone Oyj Class B |
19,325 | 1,023,501 | ||||||
| Konecranes Oyj |
3,476 | 154,346 | ||||||
| Metso Oyj |
13,845 | 508,049 | ||||||
| Neste Oyj |
12,312 | 537,816 | ||||||
| Nokia Oyj (d) |
199,445 | 1,197,782 | ||||||
| Nokia Oyj (d) |
107,106 | 640,954 | ||||||
| Nokian Renkaat Oyj |
5,630 | 250,457 | ||||||
| Orion Oyj Class B |
5,061 | 234,897 | ||||||
| Sampo Oyj Class A |
27,339 | 1,445,357 | ||||||
| Sanoma Oyj |
18,907 | 206,308 | ||||||
| Stockmann Oyj Abp Class B (b) |
19,802 | 140,459 | ||||||
| Stora Enso Oyj Class R |
41,972 | 592,950 | ||||||
See accompanying notes to financial statements.
48
Table of Contents
SPDR Portfolio World ex-US ETF
(formerly, SPDR S&P World ex-US ETF)
SCHEDULE OF INVESTMENTS (continued)
September 30, 2017
| Security Description |
Shares | Value | ||||||
| Tikkurila Oyj |
9,290 | $ | 169,242 | |||||
| UPM-Kymmene Oyj |
34,809 | 943,597 | ||||||
| Valmet Oyj |
13,581 | 267,002 | ||||||
| Wartsila Oyj Abp |
10,140 | 718,051 | ||||||
| YIT Oyj |
19,547 | 159,910 | ||||||
|
|
|
|||||||
| 10,760,083 | ||||||||
|
|
|
|||||||
| FRANCE — 8.2% |
||||||||
| Accor SA |
17,780 | 883,555 | ||||||
| Aeroports de Paris |
1,612 | 260,701 | ||||||
| Air Liquide SA |
18,210 | 2,429,418 | ||||||
| Airbus SE |
31,483 | 2,992,795 | ||||||
| Albioma SA |
16,040 | 361,804 | ||||||
| Alstom SA |
15,855 | 673,557 | ||||||
| Arkema SA |
2,191 | 268,733 | ||||||
| Atos SE |
4,154 | 644,550 | ||||||
| AXA SA |
97,683 | 2,955,153 | ||||||
| BNP Paribas SA |
55,146 | 4,449,461 | ||||||
| Bollore SA |
26,311 | 131,542 | ||||||
| Bourbon Corp. (c) |
19,485 | 176,219 | ||||||
| Bouygues SA |
16,273 | 772,403 | ||||||
| Bureau Veritas SA |
11,207 | 289,290 | ||||||
| Capgemini SE |
7,888 | 924,686 | ||||||
| Carrefour SA |
45,841 | 926,433 | ||||||
| Casino Guichard Perrachon SA |
7,005 | 415,556 | ||||||
| CGG SA (b) (c) |
2,134 | 11,857 | ||||||
| Christian Dior SE |
90 | 28,829 | ||||||
| Cie de Saint-Gobain |
33,027 | 1,968,624 | ||||||
| Cie Generale des Etablissements Michelin |
9,792 | 1,429,648 | ||||||
| Cie Plastic Omnium SA |
3,614 | 154,642 | ||||||
| Credit Agricole SA |
60,149 | 1,093,643 | ||||||
| Danone SA |
31,232 | 2,450,543 | ||||||
| Dassault Systemes SE |
5,066 | 512,600 | ||||||
| Edenred |
18,579 | 505,174 | ||||||
| Eiffage SA |
2,664 | 275,886 | ||||||
| Electricite de France SA |
20,723 | 251,724 | ||||||
| Elis SA |
9,199 | 246,374 | ||||||
| Engie SA |
81,800 | 1,389,635 | ||||||
| Essilor International SA |
10,153 | 1,257,301 | ||||||
| Eutelsat Communications SA |
4,306 | 127,569 | ||||||
| Faurecia |
2,793 | 193,920 | ||||||
| Fonciere Des Regions REIT |
2,617 | 271,915 | ||||||
| Gecina SA REIT |
2,129 | 345,319 | ||||||
| Groupe Eurotunnel SE |
20,460 | 246,716 | ||||||
See accompanying notes to financial statements.
49
Table of Contents
SPDR Portfolio World ex-US ETF
(formerly, SPDR S&P World ex-US ETF)
SCHEDULE OF INVESTMENTS (continued)
September 30, 2017
| Security Description |
Shares | Value | ||||||
| Groupe Fnac SA (b) (d) |
664 | $ | 63,921 | |||||
| Groupe Fnac SA (b) (d) |
1,233 | 118,842 | ||||||
| Hermes International |
1,804 | 909,698 | ||||||
| Iliad SA |
1,119 | 297,450 | ||||||
| Ingenico Group SA |
2,576 | 244,237 | ||||||
| Ipsen SA |
1,768 | 235,035 | ||||||
| Kering |
5,800 | 2,311,070 | ||||||
| Klepierre SA REIT |
9,535 | 374,352 | ||||||
| Lagardere SCA |
15,592 | 522,111 | ||||||
| Legrand SA |
13,722 | 990,848 | ||||||
| L’Oreal SA |
13,133 | 2,793,096 | ||||||
| LVMH Moet Hennessy Louis Vuitton SE |
13,504 | 3,726,894 | ||||||
| Natixis SA |
23,460 | 187,762 | ||||||
| Nexans SA |
4,882 | 289,556 | ||||||
| Orange SA |
104,710 | 1,715,703 | ||||||
| Orpea |
2,305 | 273,042 | ||||||
| Pernod Ricard SA |
10,497 | 1,452,537 | ||||||
| Peugeot SA |
30,237 | 720,285 | ||||||
| Publicis Groupe SA |
16,908 | 1,181,128 | ||||||
| Renault SA |
12,814 | 1,259,009 | ||||||
| Rexel SA |
14,830 | 256,669 | ||||||
| Rubis SCA |
4,380 | 279,251 | ||||||
| Safran SA |
17,159 | 1,753,466 | ||||||
| Sanofi |
60,337 | 5,992,464 | ||||||
| Schneider Electric SE (b) (d) |
28,118 | 2,447,541 | ||||||
| Schneider Electric SE (b) (d) |
2,000 | 173,322 | ||||||
| SCOR SE |
9,168 | 384,492 | ||||||
| SEB SA |
1,326 | 243,291 | ||||||
| Societe BIC SA |
1,372 | 164,469 | ||||||
| Societe Generale SA |
41,721 | 2,443,192 | ||||||
| Sodexo SA |
5,058 | 630,844 | ||||||
| Suez |
19,519 | 356,399 | ||||||
| Technicolor SA |
23,776 | 82,075 | ||||||
| Teleperformance |
2,880 | 430,018 | ||||||
| Television Francaise 1 (c) |
5,957 | 87,079 | ||||||
| Thales SA |
5,095 | 576,912 | ||||||
| TOTAL SA |
122,673 | 6,590,613 | ||||||
| Ubisoft Entertainment SA (b) |
7,969 | 547,922 | ||||||
| Unibail-Rodamco SE REIT |
4,875 | 1,185,783 | ||||||
| Valeo SA |
19,255 | 1,429,077 | ||||||
| Vallourec SA (b) (c) |
24,952 | 148,376 | ||||||
| Veolia Environnement SA |
43,010 | 994,047 | ||||||
| Vinci SA |
23,592 | 2,242,392 | ||||||
| Vivendi SA |
63,297 | 1,602,852 | ||||||
See accompanying notes to financial statements.
50
Table of Contents
SPDR Portfolio World ex-US ETF
(formerly, SPDR S&P World ex-US ETF)
SCHEDULE OF INVESTMENTS (continued)
September 30, 2017
| Security Description |
Shares | Value | ||||||
| Wendel SA |
1,442 | $ | 233,633 | |||||
| Zodiac Aerospace |
6,064 | 175,386 | ||||||
|
|
|
|||||||
| 83,435,916 | ||||||||
|
|
|
|||||||
| GERMANY — 7.6% |
||||||||
| Aareal Bank AG |
2,522 | 106,812 | ||||||
| adidas AG |
10,308 | 2,332,422 | ||||||
| Allianz SE |
22,656 | 5,087,604 | ||||||
| Aurubis AG |
1,427 | 115,627 | ||||||
| Axel Springer SE |
3,100 | 199,256 | ||||||
| BASF SE |
45,518 | 4,845,174 | ||||||
| Bayer AG |
41,839 | 5,702,973 | ||||||
| Bayerische Motoren Werke AG |
15,809 | 1,604,110 | ||||||
| Bayerische Motoren Werke AG Preference Shares |
2,725 | 242,836 | ||||||
| Beiersdorf AG |
5,034 | 541,737 | ||||||
| Bilfinger SE |
6,711 | 281,092 | ||||||
| Brenntag AG |
7,827 | 435,959 | ||||||
| CECONOMY AG |
8,188 | 96,440 | ||||||
| Commerzbank AG (b) |
46,164 | 628,159 | ||||||
| Continental AG |
5,533 | 1,404,703 | ||||||
| Covestro AG (f) |
4,202 | 361,393 | ||||||
| Daimler AG |
49,246 | 3,928,008 | ||||||
| Deutsche Bank AG |
102,141 | 1,766,588 | ||||||
| Deutsche Boerse AG |
11,697 | 1,268,183 | ||||||
| Deutsche EuroShop AG |
3,169 | 118,873 | ||||||
| Deutsche Lufthansa AG |
9,017 | 250,614 | ||||||
| Deutsche Post AG |
59,752 | 2,660,610 | ||||||
| Deutsche Telekom AG |
169,358 | 3,160,393 | ||||||
| Deutsche Wohnen AG |
17,016 | 722,578 | ||||||
| DMG Mori AG |
3,605 | 223,746 | ||||||
| Drillisch AG |
2,172 | 152,370 | ||||||
| Duerr AG |
1,218 | 162,927 | ||||||
| E.ON SE |
101,909 | 1,153,685 | ||||||
| Evonik Industries AG |
6,129 | 218,965 | ||||||
| Fraport AG Frankfurt Airport Services Worldwide |
2,620 | 248,842 | ||||||
| Freenet AG |
6,507 | 217,623 | ||||||
| Fresenius Medical Care AG & Co. KGaA |
10,872 | 1,063,832 | ||||||
| Fresenius SE & Co. KGaA |
19,996 | 1,613,379 | ||||||
| FUCHS PETROLUB SE Preference Shares |
3,514 | 208,086 | ||||||
| GEA Group AG |
8,895 | 404,748 | ||||||
| Gerresheimer AG |
2,129 | 164,832 | ||||||
| Hamborner REIT AG |
23,509 | 254,300 | ||||||
| Hannover Rueck SE |
3,044 | 366,879 | ||||||
| HeidelbergCement AG |
7,160 | 736,162 | ||||||
See accompanying notes to financial statements.
51
Table of Contents
SPDR Portfolio World ex-US ETF
(formerly, SPDR S&P World ex-US ETF)
SCHEDULE OF INVESTMENTS (continued)
September 30, 2017
| Security Description |
Shares | Value | ||||||
| Hella KGaA Hueck & Co. |
2,202 | $ | 129,835 | |||||
| Henkel AG & Co. KGaA Preference Shares |
9,963 | 1,356,266 | ||||||
| Henkel AG & Co. KGaA |
6,304 | 767,244 | ||||||
| HOCHTIEF AG |
824 | 139,057 | ||||||
| HUGO BOSS AG |
3,289 | 290,025 | ||||||
| Infineon Technologies AG |
57,065 | 1,434,921 | ||||||
| Innogy SE |
6,845 | 304,710 | ||||||
| KION Group AG |
3,865 | 369,968 | ||||||
| KS AG (c) |
10,631 | 289,691 | ||||||
| LANXESS AG |
4,638 | 366,048 | ||||||
| LEG Immobilien AG |
2,959 | 299,405 | ||||||
| Linde AG |
9,127 | 1,903,884 | ||||||
| MAN SE |
4,736 | 534,639 | ||||||
| Merck KGaA |
10,492 | 1,167,430 | ||||||
| METRO AG (b) |
8,188 | 173,124 | ||||||
| MorphoSys AG (b) (c) |
1,105 | 93,233 | ||||||
| MTU Aero Engines AG |
1,897 | 302,643 | ||||||
| Muenchener Rueckversicherungs-Gesellschaft AG in Muenchen |
7,441 | 1,591,331 | ||||||
| Norma Group SE |
2,486 | 163,523 | ||||||
| OSRAM Licht AG |
3,991 | 318,523 | ||||||
| Porsche Automobil Holding SE Preference Shares |
8,813 | 563,653 | ||||||
| ProSiebenSat.1 Media SE |
11,203 | 381,896 | ||||||
| Puma SE |
107 | 41,655 | ||||||
| Rheinmetall AG |
2,164 | 243,958 | ||||||
| RWE AG (b) |
27,191 | 617,830 | ||||||
| Salzgitter AG (c) |
5,145 | 233,443 | ||||||
| SAP SE |
47,844 | 5,242,653 | ||||||
| Sartorius AG Preference Shares |
2,343 | 224,029 | ||||||
| Siemens AG |
41,178 | 5,802,728 | ||||||
| Software AG |
2,546 | 124,323 | ||||||
| STADA Arzneimittel AG |
3,782 | 368,149 | ||||||
| Symrise AG |
6,181 | 469,632 | ||||||
| TAG Immobilien AG |
7,232 | 121,576 | ||||||
| Telefonica Deutschland Holding AG |
25,605 | 143,723 | ||||||
| ThyssenKrupp AG |
26,083 | 773,195 | ||||||
| TUI AG |
24,017 | 407,936 | ||||||
| Uniper SE |
10,182 | 279,262 | ||||||
| United Internet AG |
6,209 | 386,612 | ||||||
| Volkswagen AG |
1,946 | 329,555 | ||||||
| Volkswagen AG Preference Shares |
9,038 | 1,474,491 | ||||||
| Vonovia SE |
22,351 | 951,240 | ||||||
See accompanying notes to financial statements.
52
Table of Contents
SPDR Portfolio World ex-US ETF
(formerly, SPDR S&P World ex-US ETF)
SCHEDULE OF INVESTMENTS (continued)
September 30, 2017
| Security Description |
Shares | Value | ||||||
| Wirecard AG |
6,795 | $ | 621,838 | |||||
| Zalando SE (b) |
5,611 | 281,253 | ||||||
|
|
|
|||||||
| 77,132,650 | ||||||||
|
|
|
|||||||
| HONG KONG — 2.7% |
||||||||
| AIA Group, Ltd. |
625,400 | 4,612,012 | ||||||
| ASM Pacific Technology, Ltd. |
12,700 | 182,922 | ||||||
| Bank of East Asia, Ltd. |
67,572 | 291,978 | ||||||
| China Water Industry Group, Ltd. (b) (c) |
856,000 | 178,637 | ||||||
| CK Asset Holdings, Ltd. |
159,348 | 1,318,940 | ||||||
| CK Hutchison Holdings, Ltd. |
159,348 | 2,037,064 | ||||||
| CK Infrastructure Holdings, Ltd. |
26,000 | 223,693 | ||||||
| CLP Holdings, Ltd. |
93,000 | 953,135 | ||||||
| Dah Sing Banking Group, Ltd. |
142,925 | 314,004 | ||||||
| Dah Sing Financial Holdings, Ltd. |
71,685 | 487,341 | ||||||
| Dairy Farm International Holdings, Ltd. |
15,300 | 117,657 | ||||||
| Esprit Holdings, Ltd. (b) |
179,419 | 100,153 | ||||||
| Galaxy Entertainment Group, Ltd. |
137,000 | 964,702 | ||||||
| Hang Lung Group, Ltd. |
153,000 | 549,458 | ||||||
| Hang Lung Properties, Ltd. |
104,000 | 246,861 | ||||||
| Hang Seng Bank, Ltd. |
37,000 | 901,942 | ||||||
| Henderson Land Development Co., Ltd. |
63,405 | 420,092 | ||||||
| HK Electric Investments & HK Electric Investments, Ltd. (c) |
114,500 | 104,375 | ||||||
| HKT Trust & HKT, Ltd. |
136,900 | 166,333 | ||||||
| Hong Kong & China Gas Co., Ltd. |
411,506 | 773,414 | ||||||
| Hong Kong Exchanges & Clearing, Ltd. |
62,962 | 1,692,809 | ||||||
| Hongkong Land Holdings, Ltd. |
113,200 | 815,040 | ||||||
| Hopewell Highway Infrastructure, Ltd. |
6,975 | 4,313 | ||||||
| Hysan Development Co., Ltd. |
26,841 | 126,289 | ||||||
| I-CABLE Communications, Ltd. (b) |
39,107 | 1,277 | ||||||
| Jardine Matheson Holdings, Ltd. |
14,505 | 919,037 | ||||||
| Jardine Strategic Holdings, Ltd. |
9,900 | 427,680 | ||||||
| Kerry Properties, Ltd. |
29,000 | 120,111 | ||||||
| Li & Fung, Ltd. |
444,000 | 222,833 | ||||||
| Link REIT |
137,351 | 1,113,129 | ||||||
| Melco International Development, Ltd. |
34,000 | 97,943 | ||||||
| Melco Resorts & Entertainment, Ltd. ADR |
7,355 | 177,403 | ||||||
| MTR Corp., Ltd. |
75,679 | 441,825 | ||||||
| New World Development Co., Ltd. |
278,067 | 399,441 | ||||||
| Noble Group, Ltd. (b) (c) |
22,940 | 6,673 | ||||||
| NWS Holdings, Ltd. |
72,000 | 140,300 | ||||||
| Pacific Basin Shipping, Ltd. (b) |
1,300,000 | 292,932 | ||||||
| PCCW, Ltd. |
206,000 | 111,562 | ||||||
| Power Assets Holdings, Ltd. |
71,000 | 614,945 | ||||||
See accompanying notes to financial statements.
53
Table of Contents
SPDR Portfolio World ex-US ETF
(formerly, SPDR S&P World ex-US ETF)
SCHEDULE OF INVESTMENTS (continued)
September 30, 2017
| Security Description |
Shares | Value | ||||||
| Sands China, Ltd. |
129,200 | $ | 672,408 | |||||
| Shangri-La Asia, Ltd. |
60,000 | 111,232 | ||||||
| Sino Land Co., Ltd. |
388,091 | 681,707 | ||||||
| SJM Holdings, Ltd. |
57,000 | 52,178 | ||||||
| Sun Hung Kai Properties, Ltd. |
76,509 | 1,243,037 | ||||||
| Sundart Holdings, Ltd. |
82,000 | 48,713 | ||||||
| Swire Pacific, Ltd. Class A |
25,500 | 247,468 | ||||||
| Swire Properties, Ltd. |
54,200 | 183,889 | ||||||
| Techtronic Industries Co., Ltd. |
69,000 | 368,379 | ||||||
| VTech Holdings, Ltd. |
8,700 | 126,757 | ||||||
| Wharf Holdings, Ltd. |
110,000 | 980,194 | ||||||
| Wheelock & Co., Ltd. |
34,000 | 239,198 | ||||||
| Yue Yuen Industrial Holdings, Ltd. |
34,000 | 129,284 | ||||||
|
|
|
|||||||
| 27,754,699 | ||||||||
|
|
|
|||||||
| IRELAND — 0.6% |
||||||||
| AerCap Holdings NV (b) |
4,129 | 211,033 | ||||||
| Bank of Ireland Group PLC (b) |
45,496 | 372,732 | ||||||
| C&C Group PLC |
20,173 | 72,738 | ||||||
| CRH PLC |
40,199 | 1,533,812 | ||||||
| Glanbia PLC |
6,188 | 116,681 | ||||||
| Green REIT PLC |
33,284 | 59,298 | ||||||
| Greencore Group PLC |
40,745 | 107,254 | ||||||
| ICON PLC (b) |
3,046 | 346,878 | ||||||
| James Hardie Industries PLC |
21,092 | 293,263 | ||||||
| Kerry Group PLC Class A |
7,660 | 736,134 | ||||||
| Kingspan Group PLC |
7,165 | 304,767 | ||||||
| Paddy Power Betfair PLC |
4,204 | 419,565 | ||||||
| Ryanair Holdings PLC ADR (b) |
6,210 | 654,658 | ||||||
| Smurfit Kappa Group PLC |
9,643 | 302,099 | ||||||
| UDG Healthcare PLC |
12,294 | 140,119 | ||||||
|
|
|
|||||||
| 5,671,031 | ||||||||
|
|
|
|||||||
| ISRAEL — 0.5% |
||||||||
| Bank Hapoalim BM |
54,282 | 380,002 | ||||||
| Bank Leumi Le-Israel BM |
73,387 | 389,517 | ||||||
| Bezeq The Israeli Telecommunication Corp., Ltd. |
106,783 | 152,681 | ||||||
| Check Point Software Technologies, Ltd. (b) |
7,265 | 828,355 | ||||||
| Israel Chemicals, Ltd. |
22,123 | 98,196 | ||||||
| Mazor Robotics, Ltd. (b) |
7,828 | 186,803 | ||||||
| Nice, Ltd. |
3,144 | 250,801 | ||||||
| Rami Levy Chain Stores Hashikma Marketing 2006, Ltd. |
8,134 | 415,611 | ||||||
| Reit 1, Ltd. |
75,923 | 295,086 | ||||||
| Shufersal, Ltd. |
116,767 | 686,204 | ||||||
| Stratasys, Ltd. (b) |
2,350 | 54,332 | ||||||
See accompanying notes to financial statements.
54
Table of Contents
SPDR Portfolio World ex-US ETF
(formerly, SPDR S&P World ex-US ETF)
SCHEDULE OF INVESTMENTS (continued)
September 30, 2017
| Security Description |
Shares | Value | ||||||
| Strauss Group, Ltd. |
33,361 | $ | 626,593 | |||||
| Teva Pharmaceutical Industries, Ltd. ADR |
53,974 | 949,942 | ||||||
|
|
|
|||||||
| 5,314,123 | ||||||||
|
|
|
|||||||
| ITALY — 2.1% |
||||||||
| A2A SpA |
73,532 | 126,482 | ||||||
| Assicurazioni Generali SpA |
69,212 | 1,289,521 | ||||||
| Atlantia SpA |
20,489 | 646,972 | ||||||
| Azimut Holding SpA |
4,935 | 106,765 | ||||||
| Banca Generali SpA |
3,623 | 125,709 | ||||||
| Banca IFIS SpA |
9,662 | 528,401 | ||||||
| Banca Monte dei Paschi di Siena SpA (a) (b) |
1,496 | 13,335 | ||||||
| Banca Popolare di Sondrio SCPA |
36,792 | 158,324 | ||||||
| Banco BPM SpA (b) |
50,491 | 209,394 | ||||||
| Biesse SpA |
548 | 24,275 | ||||||
| BPER Banca |
26,704 | 159,741 | ||||||
| Brembo SpA |
22,210 | 375,995 | ||||||
| Cairo Communication SpA |
25,535 | 129,202 | ||||||
| Credito Valtellinese SpA (b) (c) |
7,591 | 36,471 | ||||||
| Davide Campari-Milano SpA |
24,004 | 174,238 | ||||||
| Enel SpA |
356,816 | 2,149,212 | ||||||
| Eni SpA |
131,556 | 2,177,356 | ||||||
| Esprinet SpA |
20,112 | 118,549 | ||||||
| Falck Renewables SpA |
5,897 | 11,182 | ||||||
| Ferrari NV |
5,198 | 574,564 | ||||||
| GEDI Gruppo Editoriale SpA (b) |
2,606 | 2,311 | ||||||
| Immobiliare Grande Distribuzione SIIQ SpA REIT |
195,749 | 204,223 | ||||||
| Interpump Group SpA |
9,907 | 308,261 | ||||||
| Intesa Sanpaolo SpA |
679,345 | 2,402,939 | ||||||
| Iren SpA |
149,583 | 401,420 | ||||||
| Italgas SpA |
16,207 | 91,010 | ||||||
| Leonardo SpA |
38,902 | 728,940 | ||||||
| Luxottica Group SpA |
7,048 | 394,027 | ||||||
| Mediaset SpA (b) (c) |
36,158 | 125,160 | ||||||
| Mediobanca SpA |
20,983 | 225,239 | ||||||
| Moncler SpA |
7,982 | 230,435 | ||||||
| PRADA SpA |
21,700 | 75,568 | ||||||
| Prysmian SpA |
9,050 | 305,775 | ||||||
| Recordati SpA |
7,830 | 361,008 | ||||||
| Reply SpA |
1,948 | 468,415 | ||||||
| Saipem SpA (b) (c) |
49,422 | 213,140 | ||||||
| Salvatore Ferragamo SpA (c) |
3,376 | 94,789 | ||||||
| Snam SpA |
108,035 | 520,582 | ||||||
| Societa Cattolica di Assicurazioni S.c.r.l |
25,113 | 218,211 | ||||||
See accompanying notes to financial statements.
55
Table of Contents
SPDR Portfolio World ex-US ETF
(formerly, SPDR S&P World ex-US ETF)
SCHEDULE OF INVESTMENTS (continued)
September 30, 2017
| Security Description |
Shares | Value | ||||||
| Sogefi SpA (b) |
19,177 | $ | 116,642 | |||||
| Telecom Italia SpA/Milano (b) (d) |
722,883 | 677,264 | ||||||
| Telecom Italia SpA/Milano (d) |
304,876 | 229,230 | ||||||
| Terna Rete Elettrica Nazionale SpA |
70,848 | 413,924 | ||||||
| UniCredit SpA (b) |
98,242 | 2,092,872 | ||||||
| Unione di Banche Italiane SpA |
51,395 | 266,490 | ||||||
| Unipol Gruppo Finanziario SpA |
18,195 | 83,416 | ||||||
| UnipolSai Assicurazioni SpA (c) |
46,261 | 108,067 | ||||||
| Yoox Net-A-Porter Group SpA (b) (c) |
3,613 | 141,679 | ||||||
| Zignago Vetro SpA |
19,689 | 189,004 | ||||||
|
|
|
|||||||
| 20,825,729 | ||||||||
|
|
|
|||||||
| JAPAN — 22.3% |
||||||||
| Acom Co., Ltd. (b) |
27,600 | 106,904 | ||||||
| Activia Properties, Inc. REIT |
20 | 82,974 | ||||||
| Advance Residence Investment Corp. |
38 | 93,443 | ||||||
| Advantest Corp. |
27,600 | 516,128 | ||||||
| Aeon Co., Ltd. |
66,220 | 978,019 | ||||||
| AEON Financial Service Co., Ltd. |
3,500 | 73,100 | ||||||
| AEON REIT Investment Corp. |
58 | 58,688 | ||||||
| Air Water, Inc. |
10,200 | 188,115 | ||||||
| Aisin Seiki Co., Ltd. |
10,900 | 574,219 | ||||||
| Ajinomoto Co., Inc. |
28,200 | 550,146 | ||||||
| Akita Bank, Ltd. |
16,555 | 519,895 | ||||||
| Alconix Corp. |
63,200 | 1,135,820 | ||||||
| Alfresa Holdings Corp. |
12,000 | 219,500 | ||||||
| Alps Electric Co., Ltd. |
11,000 | 290,135 | ||||||
| Amada Holdings Co., Ltd. |
18,200 | 199,680 | ||||||
| ANA Holdings, Inc. |
3,600 | 136,209 | ||||||
| Aomori Bank, Ltd. |
1,010 | 35,266 | ||||||
| Aoyama Trading Co., Ltd. |
2,100 | 75,090 | ||||||
| Aozora Bank, Ltd. |
5,100 | 193,915 | ||||||
| Asahi Glass Co., Ltd. |
10,200 | 378,315 | ||||||
| Asahi Group Holdings, Ltd. |
37,836 | 1,531,389 | ||||||
| Asahi Kasei Corp. |
63,550 | 781,919 | ||||||
| Asics Corp. |
11,400 | 169,737 | ||||||
| Astellas Pharma, Inc. |
149,700 | 1,903,749 | ||||||
| Atom Corp. (c) |
52,700 | 392,798 | ||||||
| Awa Bank, Ltd. |
11,550 | 76,135 | ||||||
| Bandai Namco Holdings, Inc. |
12,400 | 425,212 | ||||||
| Bank of Iwate, Ltd. |
12,955 | 523,080 | ||||||
| Bank of Kyoto, Ltd. |
3,200 | 162,608 | ||||||
| Bank of Okinawa, Ltd. |
16,500 | 663,283 | ||||||
| Benesse Holdings, Inc. |
4,100 | 147,879 | ||||||
See accompanying notes to financial statements.
56
Table of Contents
SPDR Portfolio World ex-US ETF
(formerly, SPDR S&P World ex-US ETF)
SCHEDULE OF INVESTMENTS (continued)
September 30, 2017
| Security Description |
Shares | Value | ||||||
| Bridgestone Corp. |
35,665 | $ | 1,617,781 | |||||
| Brother Industries, Ltd. |
11,200 | 260,486 | ||||||
| Calbee, Inc. (c) |
3,700 | 130,000 | ||||||
| Can Do Co., Ltd. |
5,300 | 84,892 | ||||||
| Canon, Inc. |
66,016 | 2,254,977 | ||||||
| Casio Computer Co., Ltd. (c) |
37,100 | 522,066 | ||||||
| Central Japan Railway Co. |
11,300 | 1,980,625 | ||||||
| Chiba Bank, Ltd. |
35,550 | 254,233 | ||||||
| Chubu Electric Power Co., Inc. |
30,965 | 384,294 | ||||||
| Chugai Pharmaceutical Co., Ltd. |
18,680 | 774,980 | ||||||
| Chugoku Bank Ltd. |
10,200 | 139,727 | ||||||
| Chugoku Electric Power Co., Inc. (c) |
10,700 | 113,592 | ||||||
| Coca-Cola Bottlers Japan, Inc. |
9,800 | 317,772 | ||||||
| COLOPL, Inc. (c) |
2,000 | 23,062 | ||||||
| Colowide Co., Ltd. |
2,400 | 44,177 | ||||||
| Concordia Financial Group, Ltd. |
63,700 | 314,694 | ||||||
| COOKPAD, Inc. (c) |
10,900 | 75,433 | ||||||
| Credit Saison Co., Ltd. |
31,000 | 643,051 | ||||||
| CyberAgent, Inc. |
5,800 | 169,005 | ||||||
| Dai Nippon Printing Co., Ltd. |
13,500 | 322,973 | ||||||
| Daicel Corp. |
14,100 | 169,854 | ||||||
| Daifuku Co., Ltd. |
5,300 | 260,845 | ||||||
| Dai-ichi Life Holdings, Inc. |
61,500 | 1,103,083 | ||||||
| Daiichi Sankyo Co., Ltd. |
49,665 | 1,119,795 | ||||||
| Daiken Medical Co., Ltd. |
15,800 | 109,483 | ||||||
| Daikin Industries, Ltd. |
20,410 | 2,066,112 | ||||||
| Daishi Bank, Ltd. |
1,518 | 71,455 | ||||||
| Daito Trust Construction Co., Ltd. |
5,355 | 975,237 | ||||||
| Daiwa House Industry Co., Ltd. |
34,600 | 1,194,163 | ||||||
| Daiwa House REIT Investment Corp. |
51 | 122,057 | ||||||
| Daiwa Securities Group, Inc. |
133,550 | 756,109 | ||||||
| DeNA Co., Ltd. |
10,800 | 241,972 | ||||||
| Denso Corp. |
26,910 | 1,360,979 | ||||||
| Dentsu, Inc. |
12,000 | 526,629 | ||||||
| DIC Corp. |
5,300 | 191,867 | ||||||
| Disco Corp. |
1,300 | 264,354 | ||||||
| Don Quijote Holdings Co., Ltd. |
3,400 | 127,011 | ||||||
| Dowa Holdings Co., Ltd. |
4,400 | 161,240 | ||||||
| East Japan Railway Co. |
19,400 | 1,789,801 | ||||||
| Ebara Corp. |
3,800 | 126,087 | ||||||
| Eighteenth Bank, Ltd. |
8,251 | 20,157 | ||||||
| Eisai Co., Ltd. |
16,651 | 854,406 | ||||||
| Electric Power Development Co., Ltd. |
5,500 | 138,080 | ||||||
| euglena Co., Ltd. (b) (c) |
5,000 | 52,592 | ||||||
See accompanying notes to financial statements.
57
Table of Contents
SPDR Portfolio World ex-US ETF
(formerly, SPDR S&P World ex-US ETF)
SCHEDULE OF INVESTMENTS (continued)
September 30, 2017
| Security Description |
Shares | Value | ||||||
| Ezaki Glico Co., Ltd. |
2,700 | $ | 142,478 | |||||
| F@N Communications, Inc. |
5,200 | 58,206 | ||||||
| FamilyMart UNY Holdings Co., Ltd |
3,800 | 200,187 | ||||||
| FANUC Corp. |
11,655 | 2,359,681 | ||||||
| Fast Retailing Co., Ltd. |
3,100 | 914,041 | ||||||
| Feed One Co., Ltd. |
248,400 | 580,369 | ||||||
| Financial Products Group Co., Ltd. (c) |
15,200 | 168,656 | ||||||
| Foster Electric Co., Ltd. |
18,200 | 367,185 | ||||||
| Frontier Real Estate Investment Corp. |
20 | 81,109 | ||||||
| Fuji Electric Co., Ltd. |
27,000 | 149,674 | ||||||
| FUJIFILM Holdings Corp. |
33,110 | 1,284,514 | ||||||
| Fujitsu, Ltd. |
126,513 | 939,477 | ||||||
| Fukuoka Corp. REIT |
10 | 14,232 | ||||||
| Fukuoka Financial Group, Inc. |
165,550 | 764,767 | ||||||
| Furukawa Electric Co., Ltd. |
13,455 | 738,701 | ||||||
| GLP J - REIT |
179 | 186,530 | ||||||
| GMO internet, Inc. (c) |
3,500 | 42,629 | ||||||
| GS Yuasa Corp. |
17,000 | 89,255 | ||||||
| GungHo Online Entertainment, Inc. (c) |
18,700 | 50,502 | ||||||
| Gunma Bank Ltd. |
22,000 | 136,028 | ||||||
| Gurunavi, Inc. |
5,200 | 75,299 | ||||||
| Hachijuni Bank Ltd. |
25,500 | 159,255 | ||||||
| Hakuhodo DY Holdings, Inc. |
14,600 | 191,701 | ||||||
| Hamamatsu Photonics KK |
11,000 | 332,253 | ||||||
| Hankyu Hanshin Holdings, Inc. |
15,700 | 595,558 | ||||||
| Hankyu REIT, Inc. |
202 | 240,286 | ||||||
| Haseko Corp. |
15,000 | 199,885 | ||||||
| Heiwa Real Estate REIT, Inc. |
479 | 387,234 | ||||||
| Hino Motors, Ltd. |
11,700 | 143,021 | ||||||
| Hirose Electric Co., Ltd. |
900 | 126,647 | ||||||
| Hiroshima Bank Ltd. |
15,500 | 125,443 | ||||||
| Hisamitsu Pharmaceutical Co., Inc. |
3,300 | 158,309 | ||||||
| Hitachi Chemical Co., Ltd. |
4,800 | 131,551 | ||||||
| Hitachi Construction Machinery Co., Ltd. |
5,200 | 154,062 | ||||||
| Hitachi Metals, Ltd. |
13,700 | 190,594 | ||||||
| Hitachi, Ltd. |
293,475 | 2,067,217 | ||||||
| Hokkoku Bank, Ltd. |
16,555 | 725,058 | ||||||
| Honda Motor Co., Ltd. |
95,675 | 2,832,045 | ||||||
| Hoshizaki Corp. |
2,000 | 175,721 | ||||||
| Hoya Corp. |
18,806 | 1,014,938 | ||||||
| Hulic Co., Ltd. |
17,200 | 168,539 | ||||||
| Hyakugo Bank, Ltd. |
10,550 | 47,143 | ||||||
| Ibiden Co., Ltd. (c) |
17,000 | 270,786 | ||||||
| Ichigo Office REIT Investment |
657 | 443,584 | ||||||
See accompanying notes to financial statements.
58
Table of Contents
SPDR Portfolio World ex-US ETF
(formerly, SPDR S&P World ex-US ETF)
SCHEDULE OF INVESTMENTS (continued)
September 30, 2017
| Security Description |
Shares | Value | ||||||
| Idemitsu Kosan Co., Ltd. |
4,700 | $ | 132,568 | |||||
| IHI Corp. |
4,500 | 156,310 | ||||||
| Iida Group Holdings Co., Ltd. |
5,000 | 89,104 | ||||||
| Industrial & Infrastructure Fund Investment Corp. REIT |
40 | 169,502 | ||||||
| Infomart Corp. |
29,600 | 212,471 | ||||||
| Inpex Corp. |
53,100 | 563,950 | ||||||
| Intage Holdings, Inc. |
26,400 | 317,321 | ||||||
| Iriso Electronics Co., Ltd. |
4,400 | 230,231 | ||||||
| Isetan Mitsukoshi Holdings, Ltd. (c) |
19,500 | 203,549 | ||||||
| Isuzu Motors, Ltd. |
69,900 | 925,873 | ||||||
| ITOCHU Corp. |
121,950 | 1,996,658 | ||||||
| Iwatani Corp. |
2,800 | 85,195 | ||||||
| Iyo Bank Ltd. |
15,900 | 128,680 | ||||||
| J Front Retailing Co., Ltd. |
5,100 | 70,453 | ||||||
| Jafco Co., Ltd. |
2,100 | 107,271 | ||||||
| Japan Airlines Co., Ltd. |
4,000 | 135,317 | ||||||
| Japan Airport Terminal Co., Ltd. (c) |
4,800 | 170,995 | ||||||
| Japan Excellent, Inc. |
108 | 128,278 | ||||||
| Japan Exchange Group, Inc. |
32,400 | 573,077 | ||||||
| Japan Hotel REIT Investment Corp. |
180 | 113,694 | ||||||
| Japan Logistics Fund, Inc. REIT |
37 | 68,862 | ||||||
| Japan Post Bank Co., Ltd. (c) |
19,400 | 239,559 | ||||||
| Japan Post Holdings Co., Ltd. (c) |
23,200 | 273,911 | ||||||
| Japan Prime Realty Investment Corp. REIT |
29 | 96,868 | ||||||
| Japan Real Estate Investment Corp. REIT |
35 | 168,214 | ||||||
| Japan Retail Fund Investment Corp. REIT |
150 | 269,045 | ||||||
| Japan Tissue Engineering Co., Ltd. (b) (c) |
2,200 | 23,473 | ||||||
| Japan Tobacco, Inc. |
56,600 | 1,854,402 | ||||||
| JFE Holdings, Inc. |
33,110 | 646,375 | ||||||
| JGC Corp. |
11,900 | 192,510 | ||||||
| JSR Corp. |
28,500 | 541,314 | ||||||
| JTEKT Corp. |
12,900 | 178,548 | ||||||
| JXTG Holdings, Inc. |
175,700 | 903,591 | ||||||
| Kajima Corp. |
126,475 | 1,256,155 | ||||||
| Kakaku.com, Inc. |
14,300 | 182,172 | ||||||
| Kaken Pharmaceutical Co., Ltd. |
2,000 | 101,630 | ||||||
| Kansai Electric Power Co., Inc. |
62,000 | 792,866 | ||||||
| Kansai Paint Co., Ltd. |
14,400 | 362,287 | ||||||
| Kao Corp. |
28,300 | 1,664,336 | ||||||
| Kawasaki Heavy Industries, Ltd. |
4,600 | 152,428 | ||||||
| KDDI Corp. |
95,100 | 2,506,656 | ||||||
| Keihan Holdings Co., Ltd. |
4,800 | 140,506 | ||||||
| Keikyu Corp. |
12,000 | 243,166 | ||||||
| Keio Corp. |
5,200 | 214,347 | ||||||
See accompanying notes to financial statements.
59
Table of Contents
SPDR Portfolio World ex-US ETF
(formerly, SPDR S&P World ex-US ETF)
SCHEDULE OF INVESTMENTS (continued)
September 30, 2017
| Security Description |
Shares | Value | ||||||
| Keisei Electric Railway Co., Ltd. |
12,100 | $ | 334,842 | |||||
| Kenedix Office Investment Corp. REIT |
42 | 230,960 | ||||||
| Kenedix, Inc. |
15,900 | 88,282 | ||||||
| Kewpie Corp. |
5,500 | 132,608 | ||||||
| Keyence Corp. |
4,400 | 2,335,539 | ||||||
| Kikkoman Corp. |
8,000 | 245,902 | ||||||
| Kintetsu Group Holdings Co., Ltd. |
9,510 | 353,571 | ||||||
| Kirin Holdings Co., Ltd. |
43,800 | 1,030,359 | ||||||
| Kiyo Bank, Ltd. |
36,400 | 610,520 | ||||||
| KNT-CT Holdings Co., Ltd. (b) |
15,000 | 280,105 | ||||||
| Kobayashi Pharmaceutical Co., Ltd. |
2,500 | 141,474 | ||||||
| Kobe Steel, Ltd. |
18,199 | 207,915 | ||||||
| Koito Manufacturing Co., Ltd. |
5,000 | 313,597 | ||||||
| Komatsu, Ltd. |
62,120 | 1,766,500 | ||||||
| Konami Holdings Corp. |
4,300 | 206,663 | ||||||
| Konica Minolta, Inc. |
56,175 | 461,118 | ||||||
| Kose Corp. |
1,400 | 160,316 | ||||||
| Kubota Corp. |
79,650 | 1,447,378 | ||||||
| Kuraray Co., Ltd. |
17,800 | 332,707 | ||||||
| Kurita Water Industries, Ltd. |
17,310 | 499,778 | ||||||
| Kyocera Corp. |
17,600 | 1,091,664 | ||||||
| Kyoritsu Maintenance Co., Ltd. (c) |
1,200 | 35,819 | ||||||
| Kyoto Kimono Yuzen Co., Ltd. (c) |
27,300 | 221,669 | ||||||
| Kyowa Hakko Kirin Co., Ltd. |
12,100 | 205,742 | ||||||
| Kyushu Electric Power Co., Inc. (c) |
20,300 | 215,507 | ||||||
| Kyushu Financial Group, Inc. |
11,900 | 73,156 | ||||||
| Kyushu Railway Co. |
7,000 | 208,013 | ||||||
| Lawson, Inc. |
1,500 | 99,276 | ||||||
| Leopalace21 Corp. |
1,600 | 11,144 | ||||||
| Lion Corp. |
10,000 | 182,472 | ||||||
| LIXIL Group Corp. |
12,200 | 323,628 | ||||||
| M3, Inc. |
11,100 | 316,044 | ||||||
| Mabuchi Motor Co., Ltd. |
3,500 | 175,054 | ||||||
| Makita Corp. |
13,400 | 539,857 | ||||||
| Marubeni Corp. |
168,050 | 1,147,305 | ||||||
| Marui Group Co., Ltd. (c) |
12,500 | 178,897 | ||||||
| Matsuya Co., Ltd. (c) |
31,000 | 275,396 | ||||||
| Mazda Motor Corp. |
21,800 | 334,074 | ||||||
| MCUBS MidCity Investment Corp. |
139 | 423,551 | ||||||
| Mebuki Financial Group, Inc. |
42,800 | 165,398 | ||||||
| Medipal Holdings Corp. |
35,399 | 614,486 | ||||||
| MEIJI Holdings Co., Ltd. |
7,500 | 594,323 | ||||||
| Meiko Network Japan Co., Ltd. |
30,900 | 437,840 | ||||||
| Milbon Co., Ltd. |
600 | 36,406 | ||||||
See accompanying notes to financial statements.
60
Table of Contents
SPDR Portfolio World ex-US ETF
(formerly, SPDR S&P World ex-US ETF)
SCHEDULE OF INVESTMENTS (continued)
September 30, 2017
| Security Description |
Shares | Value | ||||||
| MINEBEA MITSUMI, Inc. |
19,500 | $ | 304,891 | |||||
| MISUMI Group, Inc. |
14,400 | 379,045 | ||||||
| Mitsubishi Chemical Holdings Corp. |
78,300 | 745,681 | ||||||
| Mitsubishi Corp. |
97,538 | 2,266,341 | ||||||
| Mitsubishi Electric Corp. |
143,950 | 2,248,160 | ||||||
| Mitsubishi Estate Co., Ltd. |
65,625 | 1,140,633 | ||||||
| Mitsubishi Gas Chemical Co., Inc. |
12,100 | 283,460 | ||||||
| Mitsubishi Heavy Industries, Ltd. |
22,310 | 881,781 | ||||||
| Mitsubishi Logistics Corp. (c) |
4,500 | 111,895 | ||||||
| Mitsubishi Materials Corp. |
5,700 | 196,980 | ||||||
| Mitsubishi Motors Corp. |
49,500 | 391,374 | ||||||
| Mitsubishi Tanabe Pharma Corp. |
13,100 | 300,253 | ||||||
| Mitsubishi UFJ Financial Group, Inc. |
678,924 | 4,407,140 | ||||||
| Mitsubishi UFJ Lease & Finance Co., Ltd. |
26,800 | 141,898 | ||||||
| Mitsui & Co., Ltd. |
117,226 | 1,731,860 | ||||||
| Mitsui Chemicals, Inc. |
27,110 | 823,668 | ||||||
| Mitsui Fudosan Co., Ltd. |
48,700 | 1,055,639 | ||||||
| Mitsui OSK Lines, Ltd. |
14,255 | 431,835 | ||||||
| Mixi, Inc. (c) |
2,100 | 101,301 | ||||||
| Mizuho Financial Group, Inc. |
1,279,900 | 2,241,090 | ||||||
| Mori Hills Investment Corp. REIT |
52 | 62,318 | ||||||
| Morinaga & Co., Ltd. |
2,600 | 144,592 | ||||||
| MS&AD Insurance Group Holdings, Inc. |
33,399 | 1,074,975 | ||||||
| Murata Manufacturing Co., Ltd. |
12,500 | 1,836,717 | ||||||
| Musashino Bank, Ltd. |
16,555 | 491,951 | ||||||
| Nabtesco Corp. |
5,200 | 193,097 | ||||||
| Nachi-Fujikoshi Corp. |
15,000 | 84,351 | ||||||
| Nagoya Railroad Co., Ltd. |
8,000 | 172,203 | ||||||
| Nankai Electric Railway Co., Ltd. |
5,400 | 133,555 | ||||||
| Nanto Bank, Ltd. |
16,355 | 459,129 | ||||||
| NEC Corp. |
11,700 | 317,017 | ||||||
| Nexon Co., Ltd. (b) |
8,900 | 232,136 | ||||||
| NGK Insulators, Ltd. |
15,900 | 297,759 | ||||||
| NGK Spark Plug Co., Ltd. |
5,200 | 110,638 | ||||||
| NH Foods, Ltd. |
9,000 | 247,457 | ||||||
| NHK Spring Co., Ltd. |
12,700 | 136,855 | ||||||
| Nichirei Corp. |
9,600 | 240,927 | ||||||
| Nidec Corp. |
15,700 | 1,927,544 | ||||||
| Nikon Corp. |
32,800 | 568,496 | ||||||
| Nintendo Co., Ltd. |
5,700 | 2,104,491 | ||||||
| Nippon Accommodations Fund, Inc. REIT |
11 | 42,704 | ||||||
| Nippon Building Fund, Inc. REIT |
73 | 363,816 | ||||||
| Nippon Electric Glass Co., Ltd. |
4,000 | 154,755 | ||||||
| Nippon Express Co., Ltd. |
4,100 | 266,984 | ||||||
See accompanying notes to financial statements.
61
Table of Contents
SPDR Portfolio World ex-US ETF
(formerly, SPDR S&P World ex-US ETF)
SCHEDULE OF INVESTMENTS (continued)
September 30, 2017
| Security Description |
Shares | Value | ||||||
| Nippon Paint Holdings Co., Ltd. |
12,100 | $ | 411,162 | |||||
| Nippon Paper Industries Co., Ltd. (c) |
4,200 | 78,056 | ||||||
| Nippon Prologis REIT, Inc. |
100 | 210,634 | ||||||
| Nippon Shinyaku Co., Ltd. |
2,600 | 180,394 | ||||||
| Nippon Steel & Sumitomo Metal Corp. |
42,400 | 973,130 | ||||||
| Nippon Suisan Kaisha, Ltd. |
104,100 | 581,699 | ||||||
| Nippon Telegraph & Telephone Corp. |
33,700 | 1,543,916 | ||||||
| Nippon Television Holdings, Inc. |
2,000 | 35,109 | ||||||
| Nippon Yusen KK (b) |
16,555 | 343,998 | ||||||
| Nissan Chemical Industries, Ltd. |
5,900 | 207,560 | ||||||
| Nissan Motor Co., Ltd. |
132,341 | 1,310,301 | ||||||
| Nissei ASB Machine Co., Ltd. |
4,300 | 172,856 | ||||||
| Nisshin Seifun Group, Inc. |
13,600 | 227,744 | ||||||
| Nissin Foods Holdings Co., Ltd. |
4,100 | 249,136 | ||||||
| Nitori Holdings Co., Ltd. |
3,500 | 500,289 | ||||||
| Nitto Denko Corp. |
11,800 | 983,499 | ||||||
| NOK Corp. |
5,700 | 127,606 | ||||||
| Nomura Holdings, Inc. |
214,485 | 1,200,422 | ||||||
| Nomura Real Estate Holdings, Inc. |
6,000 | 127,819 | ||||||
| Nomura Real Estate Master Fund, Inc. |
199 | 258,639 | ||||||
| Nomura Research Institute, Ltd. |
3,600 | 140,399 | ||||||
| NSK, Ltd. |
20,200 | 272,229 | ||||||
| NTT Data Corp. |
66,000 | 705,939 | ||||||
| NTT DOCOMO, Inc. |
62,900 | 1,436,365 | ||||||
| Obayashi Corp. |
34,950 | 418,847 | ||||||
| Obic Co., Ltd. |
3,900 | 245,298 | ||||||
| Odakyu Electric Railway Co., Ltd. |
18,599 | 352,764 | ||||||
| Ogaki Kyoritsu Bank, Ltd. |
16,555 | 463,272 | ||||||
| Oji Holdings Corp. |
23,000 | 124,026 | ||||||
| Oki Electric Industry Co., Ltd. |
3,600 | 47,940 | ||||||
| Olympus Corp. |
17,400 | 588,940 | ||||||
| Omron Corp. |
11,700 | 595,576 | ||||||
| Ono Pharmaceutical Co., Ltd. |
28,100 | 636,441 | ||||||
| Oriental Land Co., Ltd. |
14,400 | 1,096,838 | ||||||
| ORIX Corp. |
66,100 | 1,065,504 | ||||||
| Orix JREIT, Inc. REIT |
59 | 84,649 | ||||||
| Osaka Gas Co., Ltd. |
22,800 | 423,734 | ||||||
| Otsuka Corp. |
2,500 | 160,130 | ||||||
| Otsuka Holdings Co., Ltd. |
28,900 | 1,147,887 | ||||||
| Panasonic Corp. |
132,650 | 1,921,431 | ||||||
| Park24 Co., Ltd. |
5,100 | 124,142 | ||||||
| Pigeon Corp. |
12,500 | 426,976 | ||||||
| Rakuten, Inc. |
35,200 | 383,693 | ||||||
| Raysum Co., Ltd. |
3,300 | 27,997 | ||||||
See accompanying notes to financial statements.
62
Table of Contents
SPDR Portfolio World ex-US ETF
(formerly, SPDR S&P World ex-US ETF)
SCHEDULE OF INVESTMENTS (continued)
September 30, 2017
| Security Description |
Shares | Value | ||||||
| Recruit Holdings Co., Ltd. |
77,900 | $ | 1,686,513 | |||||
| Renesas Electronics Corp. (b) |
12,900 | 140,500 | ||||||
| Resona Holdings, Inc. |
112,400 | 577,153 | ||||||
| Ricoh Co., Ltd. |
31,400 | 305,171 | ||||||
| Ringer Hut Co., Ltd. (c) |
900 | 20,436 | ||||||
| Rinnai Corp. |
1,700 | 145,436 | ||||||
| Riso Kyoiku Co., Ltd. |
22,106 | 171,640 | ||||||
| Rock Field Co., Ltd. |
30,200 | 535,506 | ||||||
| Rohm Co., Ltd. |
5,700 | 488,145 | ||||||
| Rohto Pharmaceutical Co., Ltd. |
5,901 | 132,892 | ||||||
| Ryohin Keikaku Co., Ltd. |
1,000 | 294,497 | ||||||
| San-In Godo Bank, Ltd. |
10,650 | 92,247 | ||||||
| Sanrio Co., Ltd. (c) |
3,900 | 73,971 | ||||||
| Santen Pharmaceutical Co., Ltd. |
20,300 | 319,743 | ||||||
| Sawai Pharmaceutical Co., Ltd. |
1,600 | 90,828 | ||||||
| SBI Holdings, Inc. |
11,500 | 173,064 | ||||||
| SCREEN Holdings Co., Ltd. |
2,800 | 194,021 | ||||||
| Secom Co., Ltd. |
16,748 | 1,220,336 | ||||||
| Sega Sammy Holdings, Inc. |
5,300 | 74,016 | ||||||
| Seibu Holdings, Inc. |
12,400 | 211,725 | ||||||
| Seiko Epson Corp. |
20,600 | 498,324 | ||||||
| Seino Holdings Co., Ltd. |
11,600 | 162,718 | ||||||
| Sekisui Chemical Co., Ltd. |
19,400 | 381,572 | ||||||
| Sekisui House SI Residential Investment Corp. REIT |
178 | 174,260 | ||||||
| Sekisui House, Ltd. |
32,800 | 552,616 | ||||||
| Seria Co., Ltd. |
3,800 | 210,989 | ||||||
| Seven & i Holdings Co., Ltd. |
49,528 | 1,911,777 | ||||||
| Seven Bank, Ltd. (c) |
36,300 | 130,927 | ||||||
| Sharp Corp. (b) (c) |
5,800 | 174,930 | ||||||
| Shiga Bank, Ltd. |
11,550 | 64,232 | ||||||
| Shikoku Bank, Ltd. |
1,820 | 27,522 | ||||||
| Shikoku Electric Power Co., Inc. (c) |
11,700 | 137,513 | ||||||
| Shimadzu Corp. |
17,400 | 342,543 | ||||||
| Shimamura Co., Ltd. |
1,400 | 167,903 | ||||||
| Shimano, Inc. |
3,700 | 492,720 | ||||||
| Shimizu Corp. |
31,513 | 349,102 | ||||||
| Shin-Etsu Chemical Co., Ltd. |
22,317 | 1,994,483 | ||||||
| Shinsei Bank, Ltd. |
5,200 | 83,198 | ||||||
| Shionogi & Co., Ltd. |
16,300 | 890,697 | ||||||
| Shiseido Co., Ltd. |
20,200 | 807,892 | ||||||
| Shizuoka Bank, Ltd. |
27,000 | 242,740 | ||||||
| Showa Denko KK |
6,700 | 208,622 | ||||||
| SMC Corp. |
3,100 | 1,093,048 | ||||||
| SMS Co., Ltd. |
11,400 | 363,070 | ||||||
See accompanying notes to financial statements.
63
Table of Contents
SPDR Portfolio World ex-US ETF
(formerly, SPDR S&P World ex-US ETF)
SCHEDULE OF INVESTMENTS (continued)
September 30, 2017
| Security Description |
Shares | Value | ||||||
| SoftBank Group Corp. |
47,336 | $ | 3,820,017 | |||||
| Sohgo Security Services Co., Ltd. |
3,800 | 174,193 | ||||||
| Sojitz Corp. |
61,800 | 170,744 | ||||||
| Sompo Holdings, Inc. |
33,800 | 1,314,586 | ||||||
| Sony Corp. |
64,220 | 2,388,175 | ||||||
| Sony Financial Holdings, Inc. |
8,900 | 145,955 | ||||||
| Square Enix Holdings Co., Ltd. |
3,400 | 127,766 | ||||||
| Stanley Electric Co., Ltd. |
29,173 | 999,084 | ||||||
| Start Today Co., Ltd. |
12,700 | 402,217 | ||||||
| Starts Proceed Investment Corp. REIT |
51 | 69,864 | ||||||
| Subaru Corp. |
33,300 | 1,201,066 | ||||||
| SUMCO Corp. |
9,600 | 150,953 | ||||||
| Sumitomo Chemical Co., Ltd. |
165,550 | 1,033,906 | ||||||
| Sumitomo Corp. |
88,275 | 1,269,250 | ||||||
| Sumitomo Dainippon Pharma Co., Ltd. (c) |
5,300 | 68,931 | ||||||
| Sumitomo Electric Industries, Ltd. |
53,720 | 877,159 | ||||||
| Sumitomo Forestry Co., Ltd. |
8,600 | 134,465 | ||||||
| Sumitomo Heavy Industries, Ltd. |
4,800 | 192,316 | ||||||
| Sumitomo Metal Mining Co., Ltd. |
12,000 | 385,271 | ||||||
| Sumitomo Mitsui Financial Group, Inc. |
68,600 | 2,632,719 | ||||||
| Sumitomo Mitsui Trust Holdings, Inc. |
29,055 | 1,048,215 | ||||||
| Sumitomo Realty & Development Co., Ltd. |
20,000 | 604,984 | ||||||
| Sumitomo Rubber Industries, Ltd. |
12,200 | 223,483 | ||||||
| Sun Corp. (c) |
3,000 | 20,202 | ||||||
| Sun Frontier Fudousan Co., Ltd. |
3,100 | 33,461 | ||||||
| Suntory Beverage & Food, Ltd. |
5,000 | 222,538 | ||||||
| Suruga Bank, Ltd. |
11,300 | 243,538 | ||||||
| Suzuken Co. Ltd/Aichi Japan |
4,100 | 145,694 | ||||||
| Suzuki Motor Corp. |
21,800 | 1,143,016 | ||||||
| Sysmex Corp. |
8,200 | 523,040 | ||||||
| T&D Holdings, Inc. |
49,900 | 724,130 | ||||||
| Tadano, Ltd. |
5,200 | 60,747 | ||||||
| Taiheiyo Cement Corp. |
6,200 | 239,320 | ||||||
| Taisei Corp. |
22,088 | 1,157,703 | ||||||
| Taisho Pharmaceutical Holdings Co., Ltd. (c) |
2,100 | 159,321 | ||||||
| Taiyo Yuden Co., Ltd. |
21,800 | 322,454 | ||||||
| Takashimaya Co., Ltd. |
21,000 | 196,633 | ||||||
| Takeda Pharmaceutical Co., Ltd. |
46,265 | 2,553,997 | ||||||
| Takeuchi Manufacturing Co., Ltd. |
19,000 | 397,166 | ||||||
| TDK Corp. |
13,655 | 926,791 | ||||||
| Teijin, Ltd. |
33,910 | 668,168 | ||||||
| Temp Holdings Co., Ltd. |
5,700 | 132,822 | ||||||
| Terumo Corp. |
16,900 | 664,350 | ||||||
| THK Co., Ltd. |
5,400 | 183,734 | ||||||
See accompanying notes to financial statements.
64
Table of Contents
SPDR Portfolio World ex-US ETF
(formerly, SPDR S&P World ex-US ETF)
SCHEDULE OF INVESTMENTS (continued)
September 30, 2017
| Security Description |
Shares | Value | ||||||
| Tobu Railway Co., Ltd. |
9,400 | $ | 258,038 | |||||
| Toho Bank, Ltd. |
12,101 | 45,474 | ||||||
| Toho Co., Ltd. |
10,800 | 376,582 | ||||||
| Toho Gas Co., Ltd. |
4,400 | 128,797 | ||||||
| Tohoku Electric Power Co., Inc. |
30,800 | 391,550 | ||||||
| Tokio Marine Holdings, Inc. |
45,065 | 1,762,325 | ||||||
| Tokyo Dome Corp. |
38,200 | 352,934 | ||||||
| Tokyo Electric Power Co. Holdings, Inc. (b) |
66,575 | 268,512 | ||||||
| Tokyo Electron, Ltd. |
8,455 | 1,297,938 | ||||||
| Tokyo Gas Co., Ltd. |
33,495 | 820,674 | ||||||
| Tokyo Tatemono Co., Ltd. |
10,700 | 136,786 | ||||||
| Tokyu Corp. |
25,275 | 357,687 | ||||||
| Tokyu Fudosan Holdings Corp. |
20,900 | 126,070 | ||||||
| Toppan Printing Co., Ltd. |
28,000 | 277,600 | ||||||
| Toray Industries, Inc. |
147,550 | 1,430,736 | ||||||
| Toshiba Corp. (b) |
288,513 | 807,370 | ||||||
| Tosoh Corp. |
14,000 | 315,409 | ||||||
| TOTO, Ltd. |
7,800 | 328,450 | ||||||
| Toyo Seikan Group Holdings, Ltd. |
9,600 | 160,334 | ||||||
| Toyo Suisan Kaisha, Ltd. |
3,000 | 110,203 | ||||||
| Toyo Tire & Rubber Co., Ltd. |
10,700 | 240,397 | ||||||
| Toyota Industries Corp. |
11,400 | 655,248 | ||||||
| Toyota Motor Corp. |
144,288 | 8,601,008 | ||||||
| Toyota Tsusho Corp. |
10,800 | 354,515 | ||||||
| Trend Micro, Inc. |
4,500 | 221,472 | ||||||
| Tsumura & Co. |
3,500 | 125,927 | ||||||
| Tsuruha Holdings, Inc. |
1,500 | 179,230 | ||||||
| Ube Industries, Ltd. |
5,200 | 150,135 | ||||||
| Unicharm Corp. |
19,200 | 439,383 | ||||||
| United Urban Investment Corp. REIT |
150 | 219,606 | ||||||
| USS Co., Ltd. |
12,210 | 246,228 | ||||||
| Warabeya Nichiyo Holdings Co., Ltd. |
16,800 | 428,339 | ||||||
| West Japan Railway Co. |
10,700 | 743,530 | ||||||
| Yahoo! Japan Corp. |
54,600 | 259,018 | ||||||
| Yakult Honsha Co., Ltd. |
9,200 | 662,835 | ||||||
| Yamada Denki Co., Ltd. (c) |
87,080 | 475,762 | ||||||
| Yamagata Bank, Ltd. (c) |
1,635 | 37,944 | ||||||
| Yamaguchi Financial Group, Inc. |
12,000 | 140,399 | ||||||
| Yamaha Corp. |
12,400 | 457,158 | ||||||
| Yamaha Motor Co., Ltd. |
13,500 | 404,167 | ||||||
| Yamanashi Chuo Bank, Ltd. |
7,550 | 31,725 | ||||||
| Yamato Holdings Co., Ltd. (c) |
17,400 | 351,122 | ||||||
| Yamazaki Baking Co., Ltd. |
11,600 | 209,401 | ||||||
| Yaskawa Electric Corp. |
12,300 | 389,548 | ||||||
See accompanying notes to financial statements.
65
Table of Contents
SPDR Portfolio World ex-US ETF
(formerly, SPDR S&P World ex-US ETF)
SCHEDULE OF INVESTMENTS (continued)
September 30, 2017
| Security Description |
Shares | Value | ||||||
| Yokogawa Electric Corp. |
12,000 | $ | 204,255 | |||||
| Yokohama Rubber Co., Ltd. |
6,300 | 129,845 | ||||||
| Zenrin Co., Ltd. |
1,400 | 42,535 | ||||||
|
|
|
|||||||
| 225,493,422 | ||||||||
|
|
|
|||||||
| JORDAN — 0.0% (e) |
||||||||
| Hikma Pharmaceuticals PLC |
7,019 | 114,040 | ||||||
|
|
|
|||||||
| LUXEMBOURG — 0.2% |
||||||||
| APERAM SA |
2,286 | 119,802 | ||||||
| ArcelorMittal (b) |
31,120 | 802,942 | ||||||
| Eurofins Scientific SE |
483 | 305,258 | ||||||
| Millicom International Cellular SA |
2,970 | 195,578 | ||||||
| SES SA |
16,956 | 371,040 | ||||||
| Tenaris SA |
18,857 | 267,513 | ||||||
|
|
|
|||||||
| 2,062,133 | ||||||||
|
|
|
|||||||
| MACAU — 0.0% (e) |
||||||||
| MGM China Holdings, Ltd. (c) |
21,600 | 51,769 | ||||||
| Wynn Macau, Ltd. |
56,400 | 151,999 | ||||||
|
|
|
|||||||
| 203,768 | ||||||||
|
|
|
|||||||
| MALTA — 0.0% (e) |
||||||||
| Catena Media PLC (b) (c) |
10,497 | 97,738 | ||||||
|
|
|
|||||||
| MEXICO — 0.0% (e) |
||||||||
| Fresnillo PLC |
9,984 | 188,200 | ||||||
|
|
|
|||||||
| NETHERLANDS — 3.7% |
||||||||
| ABN AMRO Group NV |
10,649 | 319,011 | ||||||
| Aegon NV |
119,527 | 696,350 | ||||||
| Akzo Nobel NV |
18,299 | 1,689,975 | ||||||
| Altice NV Class A (b) |
15,786 | 316,231 | ||||||
| ASML Holding NV |
26,036 | 4,433,822 | ||||||
| ASR Nederland NV |
7,376 | 295,125 | ||||||
| Constellium NV Class A (b) |
4,098 | 42,005 | ||||||
| EXOR NV |
4,861 | 308,309 | ||||||
| Fugro NV (b) |
6,695 | 94,701 | ||||||
| Gemalto NV |
3,633 | 162,327 | ||||||
| Heineken Holding NV |
4,816 | 452,631 | ||||||
| Heineken NV |
10,957 | 1,083,548 | ||||||
| ING Groep NV |
207,983 | 3,835,687 | ||||||
| Koninklijke Ahold Delhaize NV |
80,380 | 1,503,298 | ||||||
| Koninklijke DSM NV |
14,679 | 1,201,904 | ||||||
| Koninklijke KPN NV |
230,658 | 792,146 | ||||||
| Koninklijke Philips NV |
66,230 | 2,734,917 | ||||||
| NN Group NV |
15,572 | 651,870 | ||||||
See accompanying notes to financial statements.
66
Table of Contents
SPDR Portfolio World ex-US ETF
(formerly, SPDR S&P World ex-US ETF)
SCHEDULE OF INVESTMENTS (continued)
September 30, 2017
| Security Description |
Shares | Value | ||||||
| NXP Semiconductors NV (b) |
16,348 | $ | 1,848,795 | |||||
| OCI NV (b) |
2,007 | 47,003 | ||||||
| Philips Lighting NV |
7,403 | 298,875 | ||||||
| PostNL NV |
40,831 | 175,897 | ||||||
| QIAGEN NV (b) |
11,676 | 367,584 | ||||||
| Randstad Holding NV |
3,218 | 199,118 | ||||||
| Royal Dutch Shell PLC Class A |
218,868 | 6,602,590 | ||||||
| Royal Dutch Shell PLC Class B |
184,441 | 5,677,860 | ||||||
| SBM Offshore NV |
20,983 | 380,649 | ||||||
| Wolters Kluwer NV |
15,273 | 705,889 | ||||||
|
|
|
|||||||
| 36,918,117 | ||||||||
|
|
|
|||||||
| NEW ZEALAND — 0.3% |
||||||||
| a2 Milk Co., Ltd. (b) |
142,529 | 662,510 | ||||||
| Air New Zealand, Ltd. |
63,149 | 153,842 | ||||||
| Auckland International Airport, Ltd. |
26,916 | 125,307 | ||||||
| Fisher & Paykel Healthcare Corp., Ltd. |
122,373 | 1,130,563 | ||||||
| Fletcher Building, Ltd. |
17,924 | 103,529 | ||||||
| Goodman Property Trust REIT |
116,893 | 108,163 | ||||||
| Infratil, Ltd. |
49,972 | 112,709 | ||||||
| Investore Property, Ltd. (c) |
20,402 | 19,763 | ||||||
| Kiwi Property Group, Ltd. |
132,475 | 129,284 | ||||||
| Spark New Zealand, Ltd. |
90,093 | 237,718 | ||||||
| Stride Property Group (c) |
77,110 | 91,418 | ||||||
| Vital Healthcare Property Trust REIT |
102,597 | 165,023 | ||||||
| Xero, Ltd. (b) |
5,386 | 120,310 | ||||||
|
|
|
|||||||
| 3,160,139 | ||||||||
|
|
|
|||||||
| NORWAY — 0.7% |
||||||||
| Akastor ASA (b) (c) |
7,000 | 15,301 | ||||||
| Aker Solutions ASA (b) |
7,000 | 37,056 | ||||||
| DNB ASA |
60,503 | 1,219,895 | ||||||
| DNO ASA (b) (c) |
40,134 | 55,056 | ||||||
| Marine Harvest ASA (b) |
17,334 | 342,965 | ||||||
| Norsk Hydro ASA |
101,451 | 737,914 | ||||||
| Orkla ASA |
97,199 | 997,595 | ||||||
| REC Silicon ASA (b) |
151,894 | 19,368 | ||||||
| Schibsted ASA Class A |
3,514 | 90,584 | ||||||
| Schibsted ASA Class B |
3,379 | 79,803 | ||||||
| Statoil ASA |
57,933 | 1,159,344 | ||||||
| Storebrand ASA |
56,263 | 477,793 | ||||||
| Telenor ASA |
51,562 | 1,090,793 | ||||||
See accompanying notes to financial statements.
67
Table of Contents
SPDR Portfolio World ex-US ETF
(formerly, SPDR S&P World ex-US ETF)
SCHEDULE OF INVESTMENTS (continued)
September 30, 2017
| Security Description |
Shares | Value | ||||||
| TGS Nopec Geophysical Co. ASA |
5,702 | $ | 135,740 | |||||
| Yara International ASA |
17,007 | 762,081 | ||||||
|
|
|
|||||||
| 7,221,288 | ||||||||
|
|
|
|||||||
| PORTUGAL — 0.2% |
||||||||
| Banco Comercial Portugues SA Class R (b) |
421,224 | 122,152 | ||||||
| EDP - Energias de Portugal SA |
172,816 | 650,705 | ||||||
| Galp Energia SGPS SA |
21,065 | 373,421 | ||||||
| Jeronimo Martins SGPS SA |
12,116 | 239,059 | ||||||
| Mota-Engil SGPS SA |
27,258 | 102,216 | ||||||
| NOS SGPS SA |
64,630 | 400,365 | ||||||
| Pharol SGPS SA (b) (c) |
74,758 | 33,054 | ||||||
|
|
|
|||||||
| 1,920,972 | ||||||||
|
|
|
|||||||
| SINGAPORE — 1.2% |
||||||||
| AIMS AMP Capital Industrial REIT |
147,398 | 153,048 | ||||||
| Ascendas REIT |
104,815 | 205,315 | ||||||
| Ascendas Hospitality Trust REIT |
210,800 | 129,620 | ||||||
| Cache Logistics Trust REIT |
198,829 | 122,259 | ||||||
| CapitaLand, Ltd. |
328,500 | 866,033 | ||||||
| China New Town Development Co., Ltd. (g) |
1,443,800 | 73,016 | ||||||
| City Developments, Ltd. |
27,400 | 228,611 | ||||||
| ComfortDelGro Corp., Ltd. |
104,900 | 160,677 | ||||||
| COSCO Corp. Singapore, Ltd. (b) (c) |
480,500 | 100,845 | ||||||
| Croesus Retail Trust |
376,766 | 323,232 | ||||||
| DBS Group Holdings, Ltd. |
92,692 | 1,421,148 | ||||||
| Flex, Ltd. (b) |
69,003 | 1,143,380 | ||||||
| Genting Singapore PLC |
666,000 | 573,821 | ||||||
| Global Logistic Properties, Ltd. |
81,500 | 198,056 | ||||||
| IGG, Inc. (c) |
52,000 | 69,638 | ||||||
| Jardine Cycle & Carriage, Ltd. |
3,333 | 96,557 | ||||||
| Keppel REIT |
45,509 | 39,545 | ||||||
| Keppel Corp., Ltd. |
170,675 | 815,701 | ||||||
| Lippo Malls Indonesia Retail Trust REIT |
983,100 | 311,302 | ||||||
| Oversea-Chinese Banking Corp., Ltd. |
182,837 | 1,502,604 | ||||||
| Sembcorp Industries, Ltd. |
45,800 | 99,833 | ||||||
| Singapore Airlines, Ltd. |
56,156 | 415,189 | ||||||
| Singapore Exchange, Ltd. |
43,900 | 238,905 | ||||||
| Singapore Press Holdings, Ltd. (c) |
81,000 | 162,245 | ||||||
| Singapore Technologies Engineering, Ltd. |
40,000 | 101,329 | ||||||
| Singapore Telecommunications, Ltd. |
393,500 | 1,066,372 | ||||||
| Soilbuild Business Space REIT |
280,000 | 144,335 | ||||||
| United Overseas Bank, Ltd. |
61,508 | 1,064,427 | ||||||
See accompanying notes to financial statements.
68
Table of Contents
SPDR Portfolio World ex-US ETF
(formerly, SPDR S&P World ex-US ETF)
SCHEDULE OF INVESTMENTS (continued)
September 30, 2017
| Security Description |
Shares | Value | ||||||
| UOL Group, Ltd. |
31,954 | $ | 191,072 | |||||
| Wilmar International, Ltd. |
163,000 | 381,708 | ||||||
|
|
|
|||||||
| 12,399,823 | ||||||||
|
|
|
|||||||
| SOUTH AFRICA — 0.1% |
||||||||
| Investec PLC |
28,492 | 208,333 | ||||||
| Mondi PLC |
36,499 | 981,826 | ||||||
|
|
|
|||||||
| 1,190,159 | ||||||||
|
|
|
|||||||
| SOUTH KOREA — 4.7% |
||||||||
| Advanced Process Systems Corp. (b) (d) |
1,756 | 15,025 | ||||||
| Advanced Process Systems Corp. (b) (d) |
2,237 | 78,125 | ||||||
| Amorepacific Corp. |
1,324 | 299,976 | ||||||
| AMOREPACIFIC Group |
1,497 | 161,417 | ||||||
| Asiana Airlines, Inc. (b) |
39,479 | 145,631 | ||||||
| BNK Financial Group, Inc. |
16,928 | 147,798 | ||||||
| Celltrion, Inc. (b) |
4,687 | 581,092 | ||||||
| CJ CGV Co., Ltd. (c) |
5,856 | 329,267 | ||||||
| CMG Pharmaceutical Co., Ltd. (b) (c) |
11,037 | 32,089 | ||||||
| Coway Co., Ltd. |
1,986 | 162,993 | ||||||
| Crown Confectionery Co., Ltd. (d) |
3,815 | 57,291 | ||||||
| Crown Confectionery Co., Ltd. (b) (d) |
4,576 | 69,318 | ||||||
| CUROCOM Co., Ltd. (b) (c) |
14,051 | 32,571 | ||||||
| Dae Han Flour Mills Co., Ltd. |
2,193 | 328,371 | ||||||
| Daewoo Shipbuilding & Marine Engineering Co., Ltd. (a) (b) |
3,626 | 7,092 | ||||||
| Digitech Systems Co., Ltd. (a) (b) |
19,094 | — | ||||||
| DIO Corp. (b) |
1,884 | 49,923 | ||||||
| Dongkuk Industries Co., Ltd. |
78,665 | 276,789 | ||||||
| Dongwon F&B Co., Ltd. |
1,157 | 199,509 | ||||||
| Dongwon Industries Co., Ltd. |
1,294 | 314,645 | ||||||
| DY Corp. |
12,613 | 79,840 | ||||||
| E-MART, Inc. |
883 | 160,742 | ||||||
| Eyegene, Inc. (b) |
3,003 | 43,655 | ||||||
| GS Home Shopping, Inc. |
1,128 | 213,910 | ||||||
| Hana Financial Group, Inc. |
12,899 | 533,259 | ||||||
| Hana Tour Service, Inc. |
3,987 | 299,717 | ||||||
| Hancom, Inc. |
9,291 | 141,148 | ||||||
| Hankook Shell Oil Co., Ltd. |
466 | 158,676 | ||||||
| Hankook Tire Co., Ltd. |
2,226 | 116,999 | ||||||
| Hanssem Co., Ltd. |
2,355 | 311,505 | ||||||
| Harim Co., Ltd. (c) |
35,615 | 106,812 | ||||||
| Hotel Shilla Co., Ltd. |
4,784 | 243,095 | ||||||
| HS Industries Co., Ltd. |
9,017 | 75,735 | ||||||
| Huons Co., Ltd. (b) |
2,451 | 142,521 | ||||||
| Huons Global Co., Ltd. |
2,289 | 86,236 | ||||||
See accompanying notes to financial statements.
69
Table of Contents
SPDR Portfolio World ex-US ETF
(formerly, SPDR S&P World ex-US ETF)
SCHEDULE OF INVESTMENTS (continued)
September 30, 2017
| Security Description |
Shares | Value | ||||||
| Hyundai Construction Equipment Co., Ltd. (b) |
86 | $ | 27,970 | |||||
| Hyundai Electric & Energy System Co., Ltd. (b) |
89 | 17,872 | ||||||
| Hyundai Elevator Co., Ltd. |
3,181 | 138,727 | ||||||
| Hyundai Engineering Plastics Co., Ltd. |
55,795 | 320,053 | ||||||
| Hyundai Glovis Co., Ltd. |
707 | 91,357 | ||||||
| Hyundai Heavy Industries Co., Ltd. (b) |
42 | 5,317 | ||||||
| Hyundai Hy Communications & Network Co., Ltd. |
55,480 | 173,655 | ||||||
| Hyundai Mobis Co., Ltd. |
3,004 | 629,467 | ||||||
| Hyundai Motor Co. |
7,644 | 1,004,428 | ||||||
| Hyundai Motor Co. Preference Shares |
1,297 | 116,072 | ||||||
| Hyundai Robotics Co., Ltd. (b) |
850 | 316,148 | ||||||
| Hyundai Steel Co. |
2,760 | 127,234 | ||||||
| Infinitt Healthcare Co., Ltd. (b) |
18,972 | 97,067 | ||||||
| Interpark Holdings Corp. |
12,293 | 45,722 | ||||||
| Jeil Pharmaceutical Co. |
219 | 6,195 | ||||||
| Jeil Pharmaceutical Co., Ltd. (b) |
530 | 24,988 | ||||||
| Jenax, Inc. (b) (c) |
19,950 | 492,937 | ||||||
| JoyCity Corp. (b) (c) |
4,148 | 46,357 | ||||||
| Kakao Corp. |
1,931 | 242,776 | ||||||
| Kangstem Biotech Co., Ltd. (b) |
2,874 | 24,591 | ||||||
| Kangwon Land, Inc. |
4,589 | 140,232 | ||||||
| KB Financial Group, Inc. |
28,983 | 1,419,607 | ||||||
| KCC Corp. |
198 | 64,741 | ||||||
| Kia Motors Corp. |
11,002 | 304,024 | ||||||
| KIWOOM Securities Co., Ltd. |
8,704 | 550,198 | ||||||
| Koh Young Technology, Inc. |
14,632 | 855,934 | ||||||
| Korea Aerospace Industries, Ltd. |
2,971 | 113,356 | ||||||
| Korea Electric Power Corp. ADR (c) |
37,923 | 635,590 | ||||||
| Korea Zinc Co., Ltd. |
721 | 311,918 | ||||||
| Korean Air Lines Co., Ltd. (b) |
4,720 | 126,927 | ||||||
| KT Corp. ADR |
35,624 | 494,105 | ||||||
| KT&G Corp. |
5,358 | 493,534 | ||||||
| KyungDong City Gas Co., Ltd. (b) |
868 | 40,393 | ||||||
| LG Chem, Ltd. |
2,193 | 750,562 | ||||||
| LG Chem, Ltd. Preference Shares |
951 | 210,485 | ||||||
| LG Display Co., Ltd. ADR |
49,527 | 664,652 | ||||||
| LG Display Co., Ltd. |
10,987 | 293,057 | ||||||
| LG Electronics, Inc. |
6,205 | 446,407 | ||||||
| LG Household & Health Care, Ltd. |
508 | 415,146 | ||||||
| LG Uplus Corp. |
12,132 | 141,409 | ||||||
| Lotte Chemical Corp. |
707 | 233,331 | ||||||
| Lotte Food Co., Ltd. |
485 | 257,458 | ||||||
| Lotte Shopping Co., Ltd. |
274 | 58,970 | ||||||
| Medy-Tox, Inc. |
884 | 381,663 | ||||||
See accompanying notes to financial statements.
70
Table of Contents
SPDR Portfolio World ex-US ETF
(formerly, SPDR S&P World ex-US ETF)
SCHEDULE OF INVESTMENTS (continued)
September 30, 2017
| Security Description |
Shares | Value | ||||||
| Mirae Asset Daewoo Co., Ltd. |
19,966 | $ | 171,359 | |||||
| Modetour Network, Inc. |
20,675 | 437,743 | ||||||
| Muhak Co., Ltd. |
12,410 | 196,657 | ||||||
| NAVER Corp. |
1,603 | 1,042,681 | ||||||
| NCSoft Corp. |
823 | 333,770 | ||||||
| Netmarble Games Corp. (b) |
3,175 | 419,970 | ||||||
| Nexon GT Co., Ltd. (b) |
10,545 | 116,926 | ||||||
| NHN Entertainment Corp. (b) |
550 | 32,798 | ||||||
| OCI Co., Ltd. |
752 | 67,298 | ||||||
| Orientbio, Inc. (b) (c) |
20,373 | 20,456 | ||||||
| Orion Corp/Republic of Korea (b) |
914 | 77,407 | ||||||
| Orion Holdings Corp. |
475 | 9,414 | ||||||
| Ottogi Corp. |
387 | 248,010 | ||||||
| POSCO ADR |
23,249 | 1,613,481 | ||||||
| S-1 Corp. |
1,878 | 146,259 | ||||||
| Sajo Industries Co., Ltd. (c) |
7,608 | 445,048 | ||||||
| Samsung Biologics Co., Ltd. (b) |
812 | 239,272 | ||||||
| Samsung C&T Corp. |
4,657 | 548,911 | ||||||
| Samsung Electro-Mechanics Co., Ltd. |
2,792 | 248,644 | ||||||
| Samsung Electronics Co., Ltd. GDR (c) |
11,592 | 13,122,144 | ||||||
| Samsung Electronics Co., Ltd. Preference Shares |
751 | 1,352,043 | ||||||
| Samsung Engineering Co., Ltd. (b) |
7,192 | 69,072 | ||||||
| Samsung Fire & Marine Insurance Co., Ltd. |
1,378 | 336,875 | ||||||
| Samsung Heavy Industries Co., Ltd. (b) |
13,744 | 134,398 | ||||||
| Samsung Life Insurance Co., Ltd. |
4,048 | 399,375 | ||||||
| Samsung SDI Co., Ltd. |
1,533 | 265,683 | ||||||
| Samsung SDS Co., Ltd. |
1,874 | 275,697 | ||||||
| Shinhan Financial Group Co., Ltd. |
20,987 | 921,680 | ||||||
| Shinsegae Food Co., Ltd. |
2,882 | 323,340 | ||||||
| SK Bioland Co., Ltd. (c) |
13,721 | 184,488 | ||||||
| SK Holdings Co., Ltd. |
1,290 | 324,372 | ||||||
| SK Hynix, Inc. |
25,794 | 1,866,960 | ||||||
| SK Innovation Co., Ltd. |
6,029 | 1,047,515 | ||||||
| SK Telecom Co., Ltd. ADR |
29,687 | 730,003 | ||||||
| S-Oil Corp. |
2,047 | 227,871 | ||||||
| Woori Bank |
26,915 | 419,464 | ||||||
| Youlchon Chemical Co., Ltd. |
11,474 | 140,251 | ||||||
| Yungjin Pharmaceutical Co., Ltd. (b) (c) |
6,646 | 56,227 | ||||||
|
|
|
|||||||
| 47,968,966 | ||||||||
|
|
|
|||||||
| SPAIN — 2.8% |
||||||||
| Abertis Infraestructuras SA |
36,998 | 747,937 | ||||||
| Acciona SA |
1,332 | 107,158 | ||||||
| Acerinox SA |
7,183 | 103,599 | ||||||
See accompanying notes to financial statements.
71
Table of Contents
SPDR Portfolio World ex-US ETF
(formerly, SPDR S&P World ex-US ETF)
SCHEDULE OF INVESTMENTS (continued)
September 30, 2017
| Security Description |
Shares | Value | ||||||
| ACS Actividades de Construccion y Servicios SA |
10,171 | $ | 377,017 | |||||
| Aena SME SA (f) |
3,705 | 669,052 | ||||||
| Amadeus IT Group SA |
22,638 | 1,471,677 | ||||||
| Atresmedia Corp. de Medios de Comunicacion SA |
11,539 | 121,272 | ||||||
| Banco Bilbao Vizcaya Argentaria SA |
343,395 | 3,069,474 | ||||||
| Banco de Sabadell SA |
242,300 | 505,865 | ||||||
| Banco Santander SA |
809,108 | 5,650,205 | ||||||
| Bankia SA |
37,805 | 182,348 | ||||||
| Bankinter SA |
41,523 | 392,904 | ||||||
| Bolsas y Mercados Espanoles SHMSF SA |
3,493 | 120,579 | ||||||
| CaixaBank SA |
176,730 | 885,864 | ||||||
| Cellnex Telecom SA |
7,541 | 172,594 | ||||||
| Distribuidora Internacional de Alimentacion SA (c) |
38,841 | 226,604 | ||||||
| Ebro Foods SA (c) |
5,206 | 123,398 | ||||||
| Enagas SA |
11,481 | 323,373 | ||||||
| Endesa SA |
15,630 | 352,464 | ||||||
| Faes Farma SA |
13,998 | 46,832 | ||||||
| Ferrovial SA |
21,849 | 481,081 | ||||||
| Gamesa Corp. Tecnologica SA |
11,300 | 147,549 | ||||||
| Gas Natural SDG SA |
18,206 | 403,128 | ||||||
| Grifols SA Class B, Preference Shares |
13,146 | 288,833 | ||||||
| Grifols SA |
20,767 | 605,176 | ||||||
| Grifols SA ADR |
12,800 | 280,192 | ||||||
| Iberdrola SA |
305,377 | 2,372,601 | ||||||
| Indra Sistemas SA (b) |
25,300 | 399,742 | ||||||
| Industria de Diseno Textil SA |
56,766 | 2,139,762 | ||||||
| Inmobiliaria Colonial Socimi SA REIT |
14,805 | 146,916 | ||||||
| Let’s GOWEX SA (a) (b) (c) |
4,019 | — | ||||||
| Mapfre SA |
48,695 | 158,540 | ||||||
| Mediaset Espana Comunicacion SA |
10,164 | 114,788 | ||||||
| Merlin Properties Socimi SA |
15,957 | 221,090 | ||||||
| NH Hotel Group SA |
43,019 | 288,359 | ||||||
| Pharma Mar SA (b) |
53,450 | 207,890 | ||||||
| Red Electrica Corp. SA |
21,945 | 461,273 | ||||||
| Repsol SA |
73,039 | 1,346,145 | ||||||
| Sacyr SA (b) |
26,211 | 68,790 | ||||||
| Telefonica SA |
233,353 | 2,535,795 | ||||||
| Viscofan SA (c) |
2,143 | 131,309 | ||||||
|
|
|
|||||||
| 28,449,175 | ||||||||
|
|
|
|||||||
| SWEDEN — 2.7% |
||||||||
| Alfa Laval AB |
42,151 | 1,027,135 | ||||||
| Assa Abloy AB Class B |
50,164 | 1,143,115 | ||||||
| Atlas Copco AB Class B |
20,210 | 781,922 | ||||||
See accompanying notes to financial statements.
72
Table of Contents
SPDR Portfolio World ex-US ETF
(formerly, SPDR S&P World ex-US ETF)
SCHEDULE OF INVESTMENTS (continued)
September 30, 2017
| Security Description |
Shares | Value | ||||||
| Atlas Copco AB Class A |
32,997 | $ | 1,394,288 | |||||
| Bilia AB Class A |
15,224 | 167,863 | ||||||
| BillerudKorsnas AB |
8,982 | 151,858 | ||||||
| Boliden AB |
13,470 | 454,977 | ||||||
| Castellum AB |
13,489 | 211,201 | ||||||
| Electrolux AB Class B |
24,445 | 828,375 | ||||||
| Elekta AB Class B (c) |
13,185 | 136,173 | ||||||
| Essity AB Class B (b) |
24,945 | 677,233 | ||||||
| Getinge AB Class B |
4,491 | 84,017 | ||||||
| Getinge AB Class B, Subscription Shares (g) |
641 | 11,992 | ||||||
| Hennes & Mauritz AB Class B (c) |
51,614 | 1,334,242 | ||||||
| Hexagon AB Class B |
10,196 | 504,282 | ||||||
| Hexpol AB |
15,814 | 166,038 | ||||||
| Husqvarna AB Class B |
20,820 | 213,752 | ||||||
| ICA Gruppen AB |
3,890 | 145,881 | ||||||
| Industrivarden AB Class A |
9,818 | 261,497 | ||||||
| Industrivarden AB Class C |
8,305 | 209,905 | ||||||
| Investor AB Class B |
18,806 | 926,897 | ||||||
| JM AB |
4,169 | 130,703 | ||||||
| Karo Pharma AB (c) |
59,424 | 297,034 | ||||||
| Kinnevik AB Class B |
16,309 | 530,689 | ||||||
| KNOW IT AB |
19,366 | 309,624 | ||||||
| Lundin Petroleum AB (b) |
11,519 | 251,482 | ||||||
| NetEnt AB (b) |
71,894 | 556,666 | ||||||
| Nibe Industrier AB Class B |
19,089 | 191,887 | ||||||
| Nordea Bank AB |
161,352 | 2,182,369 | ||||||
| Opus Group AB (c) |
74,541 | 57,077 | ||||||
| Qliro Group AB (b) |
58,244 | 137,719 | ||||||
| SAAB AB Class B |
5,038 | 255,161 | ||||||
| Sandvik AB |
77,897 | 1,340,855 | ||||||
| Securitas AB Class B |
16,197 | 270,666 | ||||||
| Skandinaviska Enskilda Banken AB Class A |
87,930 | 1,155,904 | ||||||
| Skanska AB Class B |
20,234 | 467,777 | ||||||
| SKF AB Class B |
18,494 | 402,174 | ||||||
| Svenska Cellulosa AB SCA Class B |
24,945 | 210,871 | ||||||
| Svenska Handelsbanken AB Class A |
75,319 | 1,134,074 | ||||||
| Swedbank AB Class A |
52,125 | 1,438,134 | ||||||
| Swedish Match AB |
8,005 | 280,192 | ||||||
| Swedish Orphan Biovitrum AB (b) |
11,152 | 170,784 | ||||||
| Tele2 AB Class B |
43,314 | 494,571 | ||||||
| Telefonaktiebolaget LM Ericsson Class B |
191,124 | 1,095,134 | ||||||
| Telia Co. AB |
128,249 | 602,722 | ||||||
| Tethys Oil AB |
15,617 | 119,103 | ||||||
| Trelleborg AB Class B |
12,279 | 306,887 | ||||||
See accompanying notes to financial statements.
73
Table of Contents
SPDR Portfolio World ex-US ETF
(formerly, SPDR S&P World ex-US ETF)
SCHEDULE OF INVESTMENTS (continued)
September 30, 2017
| Security Description |
Shares | Value | ||||||
| Volvo AB Class B |
80,130 | $ | 1,541,273 | |||||
| Volvo AB Class A |
17,695 | 339,273 | ||||||
|
|
|
|||||||
| 27,103,448 | ||||||||
|
|
|
|||||||
| SWITZERLAND — 7.1% |
||||||||
| ABB, Ltd. |
101,352 | 2,507,614 | ||||||
| Adecco Group AG |
15,151 | 1,180,638 | ||||||
| Aryzta AG (b) (c) |
1,871 | 57,507 | ||||||
| Baloise Holding AG |
2,529 | 400,416 | ||||||
| Chocoladefabriken Lindt & Spruengli AG (d) |
42 | 239,820 | ||||||
| Chocoladefabriken Lindt & Spruengli AG (d) |
5 | 346,993 | ||||||
| Cie Financiere Richemont SA |
26,416 | 2,416,098 | ||||||
| Clariant AG (b) |
14,457 | 346,633 | ||||||
| Coca-Cola HBC AG (b) |
8,814 | 298,589 | ||||||
| Comet Holding AG (b) |
2,738 | 405,776 | ||||||
| Credit Suisse Group AG (b) |
107,863 | 1,708,908 | ||||||
| Dufry AG (b) |
1,620 | 257,499 | ||||||
| EMS-Chemie Holding AG |
344 | 228,954 | ||||||
| Ferguson PLC |
18,184 | 1,194,456 | ||||||
| Flughafen Zurich AG |
922 | 208,679 | ||||||
| Geberit AG |
1,950 | 923,207 | ||||||
| Georg Fischer AG |
202 | 249,264 | ||||||
| Givaudan SA |
472 | 1,027,805 | ||||||
| Glencore PLC (b) |
576,506 | 2,645,264 | ||||||
| Idorsia, Ltd. (b) |
4,988 | 89,182 | ||||||
| Julius Baer Group, Ltd. (b) |
16,675 | 987,472 | ||||||
| Kuehne + Nagel International AG |
6,116 | 1,133,318 | ||||||
| LafargeHolcim, Ltd. (b) (d) |
29,402 | 1,719,877 | ||||||
| LafargeHolcim, Ltd. (b) (d) |
492 | 28,730 | ||||||
| Leonteq AG (b) |
2,325 | 142,489 | ||||||
| Logitech International SA |
8,503 | 310,294 | ||||||
| Lonza Group AG (b) |
3,429 | 900,130 | ||||||
| Meyer Burger Technology AG (b) (c) |
6,337 | 8,841 | ||||||
| Nestle SA |
153,315 | 12,850,193 | ||||||
| Novartis AG |
130,063 | 11,143,264 | ||||||
| Partners Group Holding AG |
920 | 624,680 | ||||||
| PSP Swiss Property AG |
1,980 | 182,530 | ||||||
| Roche Holding AG Bearer Shares |
1,310 | 333,728 | ||||||
| Roche Holding AG |
36,938 | 9,436,827 | ||||||
| Schindler Holding AG |
2,256 | 498,717 | ||||||
| SGS SA |
273 | 655,414 | ||||||
| Sika AG |
117 | 871,212 | ||||||
| Sonova Holding AG |
2,856 | 484,953 | ||||||
| STMicroelectronics NV |
41,326 | 798,789 | ||||||
See accompanying notes to financial statements.
74
Table of Contents
SPDR Portfolio World ex-US ETF
(formerly, SPDR S&P World ex-US ETF)
SCHEDULE OF INVESTMENTS (continued)
September 30, 2017
| Security Description |
Shares | Value | ||||||
| Straumann Holding AG |
519 | $ | 333,628 | |||||
| Sulzer AG |
4,264 | 504,136 | ||||||
| Swatch Group AG, Bearer Shares |
2,982 | 1,241,370 | ||||||
| Swatch Group AG, Common Shares |
2,961 | 236,091 | ||||||
| Swiss Life Holding AG (b) |
1,629 | 574,258 | ||||||
| Swiss Prime Site AG |
3,539 | 318,386 | ||||||
| Swiss Re AG |
17,688 | 1,603,181 | ||||||
| Swisscom AG |
1,291 | 662,044 | ||||||
| Temenos Group AG (b) |
4,870 | 497,267 | ||||||
| u-blox Holding AG (b) |
885 | 174,787 | ||||||
| UBS Group AG (b) |
185,409 | 3,171,268 | ||||||
| Vifor Pharma AG (c) |
1,882 | 221,732 | ||||||
| Zurich Insurance Group AG |
8,600 | 2,625,506 | ||||||
|
|
|
|||||||
| 72,008,414 | ||||||||
|
|
|
|||||||
| UNITED KINGDOM — 13.6% |
||||||||
| 3i Group PLC |
104,757 | 1,283,196 | ||||||
| Admiral Group PLC |
12,409 | 302,504 | ||||||
| Afren PLC (a) (c) |
55,933 | — | ||||||
| Aggreko PLC |
10,972 | 138,226 | ||||||
| Amec Foster Wheeler PLC |
46,011 | 314,518 | ||||||
| Anglo American PLC |
78,448 | 1,409,820 | ||||||
| Ashtead Group PLC |
22,140 | 534,377 | ||||||
| Associated British Foods PLC |
18,021 | 771,999 | ||||||
| AstraZeneca PLC |
68,489 | 4,553,063 | ||||||
| Auto Trader Group PLC |
37,626 | 198,138 | ||||||
| Aviva PLC |
256,897 | 1,773,306 | ||||||
| Avon Rubber PLC |
23,168 | 291,406 | ||||||
| Babcock International Group PLC |
26,128 | 290,077 | ||||||
| BAE Systems PLC |
157,877 | 1,337,616 | ||||||
| Balfour Beatty PLC |
135,522 | 489,468 | ||||||
| Barclays PLC |
703,712 | 1,825,485 | ||||||
| Barratt Developments PLC |
81,241 | 669,786 | ||||||
| BBA Aviation PLC |
59,324 | 237,503 | ||||||
| Bellway PLC |
5,137 | 227,231 | ||||||
| Berkeley Group Holdings PLC |
5,364 | 267,498 | ||||||
| Big Yellow Group PLC REIT |
14,056 | 142,757 | ||||||
| Booker Group PLC |
83,998 | 231,027 | ||||||
| BP PLC |
968,858 | 6,204,271 | ||||||
| British American Tobacco PLC |
112,427 | 7,047,135 | ||||||
| British Land Co. PLC REIT |
87,227 | 704,509 | ||||||
| Britvic PLC |
10,873 | 110,211 | ||||||
| BT Group PLC |
476,253 | 1,814,021 | ||||||
| BTG PLC (b) |
19,071 | 172,965 | ||||||
See accompanying notes to financial statements.
75
Table of Contents
SPDR Portfolio World ex-US ETF
(formerly, SPDR S&P World ex-US ETF)
SCHEDULE OF INVESTMENTS (continued)
September 30, 2017
| Security Description |
Shares | Value | ||||||
| Bunzl PLC |
16,769 | $ | 510,033 | |||||
| Burberry Group PLC |
27,692 | 653,892 | ||||||
| Cairn Energy PLC (b) |
22,093 | 56,763 | ||||||
| Capita PLC |
47,032 | 356,518 | ||||||
| Capital & Counties Properties PLC |
37,377 | 132,739 | ||||||
| Carnival PLC |
16,033 | 1,020,251 | ||||||
| Centamin PLC |
114,800 | 223,177 | ||||||
| Centrica PLC |
336,468 | 844,160 | ||||||
| CNH Industrial NV |
50,213 | 603,116 | ||||||
| Cobham PLC |
87,930 | 171,884 | ||||||
| Coca-Cola European Partners PLC |
11,649 | 484,831 | ||||||
| Compass Group PLC |
84,391 | 1,792,323 | ||||||
| Croda International PLC |
3,665 | 186,507 | ||||||
| CYBG PLC (b) |
37,239 | 150,189 | ||||||
| Daily Mail & General Trust PLC |
11,470 | 99,796 | ||||||
| DCC PLC |
4,308 | 418,748 | ||||||
| Derwent London PLC |
5,686 | 213,144 | ||||||
| Diageo PLC |
137,074 | 4,511,197 | ||||||
| Dialog Semiconductor PLC (b) |
3,952 | 174,571 | ||||||
| Direct Line Insurance Group PLC |
72,257 | 352,487 | ||||||
| Dixons Carphone PLC |
51,248 | 132,976 | ||||||
| Drax Group PLC |
19,373 | 80,912 | ||||||
| DS Smith PLC |
27,847 | 184,152 | ||||||
| easyJet PLC |
12,657 | 206,662 | ||||||
| Experian PLC |
55,937 | 1,124,967 | ||||||
| Fiat Chrysler Automobiles NV (b) |
53,852 | 965,143 | ||||||
| Firstgroup PLC (b) |
174,574 | 274,034 | ||||||
| Foxtons Group PLC (c) |
18,364 | 16,692 | ||||||
| G4S PLC |
182,962 | 683,146 | ||||||
| GKN PLC |
86,558 | 401,812 | ||||||
| GlaxoSmithKline PLC |
262,585 | 5,243,942 | ||||||
| Grafton Group PLC |
10,958 | 122,172 | ||||||
| Great Portland Estates PLC REIT |
16,512 | 135,357 | ||||||
| Greene King PLC |
15,484 | 113,530 | ||||||
| Halma PLC |
19,131 | 287,472 | ||||||
| Hammerson PLC REIT |
38,393 | 276,608 | ||||||
| Hansteen Holdings PLC REIT |
66,790 | 123,660 | ||||||
| Hargreaves Lansdown PLC |
9,946 | 197,492 | ||||||
| Hays PLC |
69,792 | 177,347 | ||||||
| Hiscox, Ltd. |
14,783 | 253,870 | ||||||
| HomeServe PLC |
20,189 | 225,360 | ||||||
| Howden Joinery Group PLC |
29,983 | 173,377 | ||||||
| HSBC Holdings PLC |
1,034,508 | 10,230,560 | ||||||
| IG Group Holdings PLC |
18,242 | 156,881 | ||||||
See accompanying notes to financial statements.
76
Table of Contents
SPDR Portfolio World ex-US ETF
(formerly, SPDR S&P World ex-US ETF)
SCHEDULE OF INVESTMENTS (continued)
September 30, 2017
| Security Description |
Shares | Value | ||||||
| IMI PLC |
11,648 | $ | 194,250 | |||||
| Imperial Brands PLC |
48,226 | 2,060,125 | ||||||
| Inchcape PLC |
20,947 | 242,534 | ||||||
| Indivior PLC (b) |
40,566 | 184,883 | ||||||
| Informa PLC |
38,000 | 342,604 | ||||||
| Inmarsat PLC |
15,460 | 133,474 | ||||||
| InterContinental Hotels Group PLC |
10,472 | 554,684 | ||||||
| International Consolidated Airlines Group SA |
34,137 | 271,822 | ||||||
| International Personal Finance PLC |
16,908 | 47,638 | ||||||
| Intertek Group PLC |
8,467 | 565,943 | ||||||
| Intu Properties PLC REIT |
41,393 | 128,008 | ||||||
| ITV PLC |
183,307 | 429,646 | ||||||
| J Sainsbury PLC |
123,372 | 393,777 | ||||||
| John Wood Group PLC |
17,846 | 162,933 | ||||||
| Johnson Matthey PLC |
9,969 | 457,422 | ||||||
| Just Eat PLC (b) |
26,002 | 233,210 | ||||||
| Keller Group PLC |
5,048 | 55,434 | ||||||
| Kingfisher PLC |
196,044 | 785,122 | ||||||
| Land Securities Group PLC REIT |
61,773 | 805,984 | ||||||
| Legal & General Group PLC |
295,796 | 1,031,425 | ||||||
| Lloyds Banking Group PLC |
3,507,776 | 3,187,514 | ||||||
| London Stock Exchange Group PLC |
15,595 | 801,352 | ||||||
| Lonmin PLC (b) (c) |
10,873 | 10,284 | ||||||
| Man Group PLC |
137,964 | 310,782 | ||||||
| Marks & Spencer Group PLC |
125,705 | 596,016 | ||||||
| Meggitt PLC |
31,645 | 221,198 | ||||||
| Melrose Industries PLC |
92,899 | 265,230 | ||||||
| Micro Focus International PLC |
21,651 | 693,377 | ||||||
| National Grid PLC |
197,808 | 2,453,787 | ||||||
| NEX Group PLC |
46,016 | 408,701 | ||||||
| Next PLC |
10,695 | 754,754 | ||||||
| Ocado Group PLC (b) (c) |
19,997 | 78,528 | ||||||
| Old Mutual PLC |
377,289 | 983,020 | ||||||
| Ophir Energy PLC (b) |
29,659 | 28,849 | ||||||
| Pearson PLC |
59,694 | 490,141 | ||||||
| Pennon Group PLC |
20,823 | 222,659 | ||||||
| Persimmon PLC |
24,781 | 858,448 | ||||||
| Petrofac, Ltd. |
11,969 | 72,262 | ||||||
| Provident Financial PLC (c) |
3,322 | 37,015 | ||||||
| Prudential PLC |
127,695 | 3,060,667 | ||||||
| Randgold Resources, Ltd. |
8,663 | 850,201 | ||||||
| Reckitt Benckiser Group PLC |
33,154 | 3,030,494 | ||||||
| RELX NV |
52,963 | 1,127,657 | ||||||
| RELX PLC |
61,214 | 1,344,431 | ||||||
See accompanying notes to financial statements.
77
Table of Contents
SPDR Portfolio World ex-US ETF
(formerly, SPDR S&P World ex-US ETF)
SCHEDULE OF INVESTMENTS (continued)
September 30, 2017
| Security Description |
Shares | Value | ||||||
| Rentokil Initial PLC |
92,534 | $ | 373,190 | |||||
| Rightmove PLC |
5,144 | 279,164 | ||||||
| Rio Tinto PLC |
59,114 | 2,754,446 | ||||||
| Rio Tinto, Ltd. (c) |
19,700 | 1,028,394 | ||||||
| Rolls-Royce Holdings PLC (b) |
109,099 | 1,298,325 | ||||||
| Royal Bank of Scotland Group PLC (b) |
163,025 | 586,832 | ||||||
| Royal Mail PLC |
22,873 | 117,902 | ||||||
| RPC Group PLC |
20,394 | 271,017 | ||||||
| RSA Insurance Group PLC |
68,303 | 570,909 | ||||||
| Sage Group PLC |
56,127 | 525,990 | ||||||
| Schroders PLC |
5,705 | 256,795 | ||||||
| Segro PLC REIT |
47,183 | 339,304 | ||||||
| Serco Group PLC (b) |
90,590 | 140,136 | ||||||
| Severn Trent PLC |
11,945 | 348,245 | ||||||
| Shaftesbury PLC |
13,955 | 190,223 | ||||||
| Shire PLC |
45,282 | 2,301,308 | ||||||
| Sky PLC |
66,793 | 819,957 | ||||||
| Smith & Nephew PLC |
47,872 | 865,786 | ||||||
| Smiths Group PLC |
49,279 | 1,042,636 | ||||||
| Spirax-Sarco Engineering PLC |
3,637 | 269,597 | ||||||
| Sports Direct International PLC (b) |
7,839 | 43,173 | ||||||
| SSE PLC |
76,232 | 1,428,805 | ||||||
| St James’s Place PLC |
26,190 | 402,679 | ||||||
| Standard Chartered PLC (b) |
145,489 | 1,447,568 | ||||||
| Standard Life Aberdeen PLC |
212,150 | 1,233,875 | ||||||
| TalkTalk Telecom Group PLC (c) |
21,781 | 61,280 | ||||||
| Tate & Lyle PLC |
45,575 | 396,530 | ||||||
| Taylor Wimpey PLC |
123,258 | 323,297 | ||||||
| Telecom Plus PLC |
3,149 | 45,882 | ||||||
| Tesco PLC (b) |
475,243 | 1,193,287 | ||||||
| Thomas Cook Group PLC |
53,642 | 86,578 | ||||||
| TP ICAP PLC |
29,252 | 205,649 | ||||||
| Travis Perkins PLC |
8,004 | 155,494 | ||||||
| Trinity Mirror PLC |
23,631 | 27,028 | ||||||
| Tullow Oil PLC (b) |
90,726 | 226,526 | ||||||
| UBM PLC |
19,685 | 180,251 | ||||||
| Unilever NV |
84,947 | 5,025,232 | ||||||
| Unilever PLC |
73,380 | 4,252,067 | ||||||
| United Utilities Group PLC |
35,542 | 407,468 | ||||||
| Victrex PLC |
4,771 | 151,768 | ||||||
| Vodafone Group PLC |
1,439,188 | 4,031,691 | ||||||
| Weir Group PLC |
5,728 | 151,010 | ||||||
| Whitbread PLC |
9,468 | 478,385 | ||||||
| William Hill PLC |
71,992 | 243,788 | ||||||
See accompanying notes to financial statements.
78
Table of Contents
SPDR Portfolio World ex-US ETF
(formerly, SPDR S&P World ex-US ETF)
SCHEDULE OF INVESTMENTS (continued)
September 30, 2017
| Security Description |
Shares | Value | ||||||
| Wm Morrison Supermarkets PLC |
197,336 | $ | 619,793 | |||||
| Workspace Group PLC REIT |
11,809 | 140,611 | ||||||
| Worldpay Group PLC |
71,341 | 389,559 | ||||||
| WPP PLC |
67,137 | 1,247,530 | ||||||
|
|
|
|||||||
| 138,031,808 | ||||||||
|
|
|
|||||||
| TOTAL COMMON STOCKS |
1,008,279,185 | |||||||
|
|
|
|||||||
| RIGHTS — 0.0% (e) |
||||||||
| SOUTH KOREA — 0.0% (e) |
||||||||
| Hyundai Construction Equipment Co., Ltd. (expiring 11/14/17) (b) (g) |
26 | 2,225 | ||||||
| Hyundai Electric & Energy System Co., Ltd. (expiring 11/11/17) (b) (g) |
27 | 1,037 | ||||||
|
|
|
|||||||
| TOTAL RIGHTS |
3,262 | |||||||
|
|
|
|||||||
| SHORT-TERM INVESTMENTS — 2.4% |
||||||||
| State Street Institutional U.S. Government Money Market Fund, Class G Shares 0.96% (h) (i) |
1,169,081 | 1,169,081 | ||||||
| State Street Navigator Securities Lending Government Money Market Portfolio (h) (j) |
22,963,226 | 22,963,226 | ||||||
|
|
|
|||||||
| TOTAL SHORT-TERM INVESTMENTS |
24,132,307 | |||||||
|
|
|
|||||||
| TOTAL INVESTMENTS — 101.9% |
1,032,414,754 | |||||||
|
|
|
|||||||
| LIABILITIES IN EXCESS OF OTHER ASSETS — (1.9)% |
(19,039,031 | ) | ||||||
|
|
|
|||||||
| NET ASSETS — 100.0% |
$ | 1,013,375,723 | ||||||
|
|
|
|||||||
See accompanying notes to financial statements.
79
Table of Contents
SPDR Portfolio World ex-US ETF
(formerly, SPDR S&P World ex-US ETF)
SCHEDULE OF INVESTMENTS (continued)
September 30, 2017
| (a) | Fair valued as determined in good faith by the Trust’s Oversight Committee in accordance with policy and procedures approved by the Board of Trustees. Security value is determined based on Level 3 inputs. As of September 30, 2017, total aggregate fair value of the securities is $20,427, representing less than 0.05% of the Fund’s net assets. |
| (b) | Non-income producing security. |
| (c) | All or a portion of the shares of the security are on loan at September 30, 2017. |
| (d) | Reflects separate holdings of the issuer’s common stock traded on different securities exchanges. |
| (e) | Amount is less than 0.05% of net assets. |
| (f) | Securities purchased pursuant to Rule 144A of the Securities Act of 1933, as amended. These securities, which represent 0.1% of net assets as of September 30, 2017, are considered liquid and may be resold in transactions exempt from registration, normally to qualified institutional buyers. |
| (g) | Fair valued as determined in good faith by the Trust’s Oversight Committee in accordance with policy and procedures approved by the Board of Trustees. As of September 30, 2017, total aggregate fair value of securities is $88,270 representing less than 0.05% of net assets. |
| (h) | The Fund invested in certain money market funds managed by SSGA Funds Management, Inc. Amounts related to these transactions during the period ended September 30, 2017 are shown in the Affiliate Table below. |
| (i) | The rate shown is the annualized seven-day yield at September 30, 2017. |
| (j) | Investment of cash collateral for securities loaned. |
ADR = American Depositary Receipt
GDR = Global Depositary Receipt
REIT = Real Estate Investment Trust
The following table summarizes the value of the Fund’s investments according to the fair value hierarchy as of September 30, 2017.
| Description |
Level 1 — Quoted Prices |
Level 2 — Other Significant Observable Inputs |
Level 3 — Significant Unobservable Inputs |
Total | ||||||||||||
| ASSETS: |
||||||||||||||||
| INVESTMENTS: |
||||||||||||||||
| Common Stocks |
||||||||||||||||
| Australia |
$ | 57,010,059 | $ | — | $ | 0 | (a) | $ | 57,010,059 | |||||||
| Austria |
3,159,160 | — | — | 3,159,160 | ||||||||||||
| Belgium |
12,147,467 | — | — | 12,147,467 | ||||||||||||
| Canada |
83,820,650 | — | — | 83,820,650 | ||||||||||||
| Chile |
220,599 | — | — | 220,599 | ||||||||||||
| China |
1,703,316 | — | — | 1,703,316 | ||||||||||||
| Denmark |
14,792,093 | — | — | 14,792,093 | ||||||||||||
| Finland |
10,760,083 | — | — | 10,760,083 | ||||||||||||
| France |
83,435,916 | — | — | 83,435,916 | ||||||||||||
| Germany |
77,132,650 | — | — | 77,132,650 | ||||||||||||
| Hong Kong |
27,754,699 | — | — | 27,754,699 | ||||||||||||
| Ireland |
5,671,031 | — | — | 5,671,031 | ||||||||||||
See accompanying notes to financial statements.
80
Table of Contents
SPDR Portfolio World ex-US ETF
(formerly, SPDR S&P World ex-US ETF)
SCHEDULE OF INVESTMENTS (continued)
September 30, 2017
| Description |
Level 1 — Quoted Prices |
Level 2 — Other Significant Observable Inputs |
Level 3 — Significant Unobservable Inputs |
Total | ||||||||||||
| Israel |
$ | 5,314,123 | $ | — | $ | — | $ | 5,314,123 | ||||||||
| Italy |
20,812,394 | — | 13,335 | 20,825,729 | ||||||||||||
| Japan |
225,493,422 | — | — | 225,493,422 | ||||||||||||
| Jordan |
114,040 | — | — | 114,040 | ||||||||||||
| Luxembourg |
2,062,133 | — | — | 2,062,133 | ||||||||||||
| Macau |
203,768 | — | — | 203,768 | ||||||||||||
| Malta |
97,738 | — | — | 97,738 | ||||||||||||
| Mexico |
188,200 | — | — | 188,200 | ||||||||||||
| Netherlands |
36,918,117 | — | — | 36,918,117 | ||||||||||||
| New Zealand |
3,160,139 | — | — | 3,160,139 | ||||||||||||
| Norway |
7,221,288 | — | — | 7,221,288 | ||||||||||||
| Portugal |
1,920,972 | — | — | 1,920,972 | ||||||||||||
| Singapore |
12,326,807 | 73,016 | — | 12,399,823 | ||||||||||||
| South Africa |
1,190,159 | — | — | 1,190,159 | ||||||||||||
| South Korea |
47,961,874 | — | 7,092 | 47,968,966 | ||||||||||||
| Spain |
28,449,175 | — | 0 | (a) | 28,449,175 | |||||||||||
| Sweden |
27,091,456 | 11,992 | — | 27,103,448 | ||||||||||||
| Switzerland |
72,008,414 | — | — | 72,008,414 | ||||||||||||
| United Kingdom |
138,031,808 | — | 0 | (a) | 138,031,808 | |||||||||||
| Rights |
||||||||||||||||
| South Korea |
— | 3,262 | — | 3,262 | ||||||||||||
| Short-Term Investments |
24,132,307 | — | — | 24,132,307 | ||||||||||||
|
|
|
|
|
|
|
|
|
|||||||||
| TOTAL INVESTMENTS |
$ | 1,032,306,057 | $ | 88,270 | $ | 20,427 | $ | 1,032,414,754 | ||||||||
|
|
|
|
|
|
|
|
|
|||||||||
| (a) | Fund held Level 3 securities that were valued at $0 at September 30, 2017. |
See accompanying notes to financial statements.
81
Table of Contents
SPDR Portfolio World ex-US ETF
(formerly, SPDR S&P World ex-US ETF)
SCHEDULE OF INVESTMENTS (continued)
September 30, 2017
Affiliate Table
| Number of Shares Held at 9/30/16 |
Value at 9/30/16 |
Cost of Purchases |
Proceeds from Shares Sold |
Realized Gain (Loss) |
Change in Unrealized Appreciation/ Depreciation |
Number of Shares Held at 9/30/17 |
Value at 9/30/17 |
Dividend Income |
||||||||||||||||||||||||||||
| State Street Institutional Liquid Reserves Fund, Premier Class |
365,689 | $ | 365,689 | $ | 1,564 | $ | 367,253 | $ | — | $ | — | — | $ | — | $ | 15 | ||||||||||||||||||||
| State Street Institutional U.S. Government Money Market Fund, Class G Shares |
— | — | 21,922,148 | 20,753,067 | — | — | 1,169,081 | 1,169,081 | 5,023 | |||||||||||||||||||||||||||
| State Street Institutional U.S. Government Money Market Fund, Premier Class |
— | — | 19,913,887 | 19,913,887 | — | — | — | — | 2,572 | |||||||||||||||||||||||||||
| State Street Navigator Securities Lending Government Money Market Portfolio* |
27,460,160 | 27,460,160 | 190,490,329 | 194,987,263 | — | — | 22,963,226 | 22,963,226 | 354,638 | |||||||||||||||||||||||||||
|
|
|
|
|
|
|
|
|
|
|
|
|
|
|
|||||||||||||||||||||||
| Total |
$ | 27,825,849 | $ | 232,327,928 | $ | 236,021,470 | $ | — | $ | — | $ | 24,132,307 | $ | 362,248 | ||||||||||||||||||||||
|
|
|
|
|
|
|
|
|
|
|
|
|
|
|
|||||||||||||||||||||||
| * | Effective October 5, 2016, the name of State Street Navigator Securities Lending Prime Portfolio was changed to State Street Navigator Securities Lending Government Money Market Portfolio. |
See accompanying notes to financial statements.
82
Table of Contents
SPDR INDEX SHARES FUNDS
STATEMENTS OF ASSETS AND LIABILITIES
September 30, 2017
| SPDR Portfolio Emerging Markets ETF (formerly, SPDR S&P Emerging Markets ETF) |
SPDR Portfolio World ex-US ETF (formerly, SPDR S&P World ex-US ETF) |
|||||||
| ASSETS |
||||||||
| Investments in unaffiliated issuers, at value* (Note 2) |
$ | 558,395,333 | $ | 1,008,282,447 | ||||
| Investments in affiliated issuers, at value (Notes 2 and 4) |
8,647,800 | 24,132,307 | ||||||
|
|
|
|
|
|||||
| Total Investments |
567,043,133 | 1,032,414,754 | ||||||
| Foreign currency, at value |
4,463,563 | 1,896,389 | ||||||
| Cash at broker |
18,590 | — | ||||||
| Cash |
— | 2,875 | ||||||
| Receivable from broker — variation margin on open futures contracts |
11,527 | — | ||||||
| Dividends receivable — unaffiliated issuers (Note 2) |
619,348 | 2,509,903 | ||||||
| Dividends receivable — affiliated issuers (Notes 2 and 4) |
1,118 | 396 | ||||||
| Securities lending income receivable — unaffiliated issuers (Note 9) |
5,949 | 11,602 | ||||||
| Securities lending income receivable — affiliated issuers (Notes 4 and 9) |
12,086 | 26,112 | ||||||
| Receivable for foreign taxes recoverable |
961 | 325,663 | ||||||
| Other Receivable |
3,322 | — | ||||||
|
|
|
|
|
|||||
| TOTAL ASSETS |
572,179,597 | 1,037,187,694 | ||||||
|
|
|
|
|
|||||
| LIABILITIES |
||||||||
| Due to custodian (Note 4) |
27,863 | — | ||||||
| Payable upon return of securities loaned |
8,647,800 | 22,963,226 | ||||||
| Payable for investments purchased |
— | 1,316 | ||||||
| Deferred foreign taxes payable |
287,885 | — | ||||||
| Advisory fee payable (Note 4) |
779,870 | 846,643 | ||||||
| Trustees’ fees and expenses payable (Note 5) |
188 | 786 | ||||||
|
|
|
|
|
|||||
| TOTAL LIABILITIES |
9,743,606 | 23,811,971 | ||||||
|
|
|
|
|
|||||
| NET ASSETS |
$ | 562,435,991 | $ | 1,013,375,723 | ||||
|
|
|
|
|
|||||
| NET ASSETS CONSIST OF: |
||||||||
| Paid-in Capital (Note 7) |
$ | 539,645,829 | $ | 937,573,312 | ||||
| Undistributed (distribution in excess of) net investment income (loss) |
5,456,624 | 5,551,897 | ||||||
| Accumulated net realized gain (loss) on investments, foreign currency transactions, and futures contracts |
(27,458,841 | ) | (5,799,704 | ) | ||||
| Net unrealized appreciation (depreciation) on: |
||||||||
| Investments — unaffiliated issuers** |
44,819,656 | 76,039,414 | ||||||
| Foreign currency translations |
(26,187 | ) | 10,804 | |||||
| Futures contracts |
(1,090 | ) | — | |||||
|
|
|
|
|
|||||
| NET ASSETS |
$ | 562,435,991 | $ | 1,013,375,723 | ||||
|
|
|
|
|
|||||
| NET ASSET VALUE PER SHARE |
||||||||
| Net asset value per share |
$ | 72.11 | $ | 30.52 | ||||
|
|
|
|
|
|||||
| Shares outstanding (unlimited amount authorized, $0.01 par value) |
7,800,000 | 33,200,000 | ||||||
|
|
|
|
|
|||||
| COST OF INVESTMENTS: |
||||||||
| Investments in unaffiliated issuers |
$ | 513,287,792 | $ | 932,243,033 | ||||
| Investments in affiliated issuers |
8,647,800 | 24,132,307 | ||||||
|
|
|
|
|
|||||
| Total cost of investments |
$ | 521,935,592 | $ | 956,375,340 | ||||
|
|
|
|
|
|||||
| Foreign currency, at cost |
$ | 4,489,076 | $ | 1,906,676 | ||||
|
|
|
|
|
|||||
| * Includes investments in securities on loan, at value |
$ | 39,335,507 | $ | 39,933,446 | ||||
|
|
|
|
|
|||||
| ** Includes deferred foreign taxes |
$ | 287,885 | $ | — | ||||
|
|
|
|
|
|||||
See accompanying notes to financial statements.
83
Table of Contents
SPDR INDEX SHARES FUNDS
STATEMENTS OF OPERATIONS
For the Year Ended September 30, 2017
| SPDR Portfolio Emerging Markets ETF (formerly, SPDR S&P Emerging Markets ETF) |
SPDR Portfolio World ex-US ETF (formerly, SPDR S&P World ex-US ETF) |
|||||||
| INVESTMENT INCOME |
||||||||
| Dividend income — unaffiliated issuers (Note 2) |
$ | 11,200,726 | $ | 22,924,047 | ||||
| Dividend income — affiliated issuers (Notes 2 and 4) |
7,558 | 7,610 | ||||||
| Dividend income — non-cash transactions |
— | 2,828,735 | ||||||
| Unaffiliated securities lending income (Note 9) |
58,016 | 83,893 | ||||||
| Affiliated securities lending income (Notes 4 and 9) |
73,463 | 354,638 | ||||||
| Foreign taxes withheld |
(1,252,664 | ) | (3,429,886 | ) | ||||
|
|
|
|
|
|||||
| TOTAL INVESTMENT INCOME (LOSS) |
10,087,099 | 22,769,037 | ||||||
|
|
|
|
|
|||||
| EXPENSES |
||||||||
| Advisory fee (Note 4) |
2,164,523 | 2,728,589 | ||||||
| Trustees’ fees and expenses (Note 5) |
5,004 | 11,962 | ||||||
| Miscellaneous expenses |
1,303 | 6,933 | ||||||
|
|
|
|
|
|||||
| TOTAL EXPENSES |
2,170,830 | 2,747,484 | ||||||
|
|
|
|
|
|||||
| Expenses waived/reimbursed by the Adviser (Note 4) |
(28 | ) | — | |||||
|
|
|
|
|
|||||
| NET EXPENSES |
2,170,802 | 2,747,484 | ||||||
|
|
|
|
|
|||||
| NET INVESTMENT INCOME (LOSS) |
7,916,297 | 20,021,553 | ||||||
|
|
|
|
|
|||||
| REALIZED AND UNREALIZED GAIN (LOSS) |
||||||||
| Net realized gain (loss) on: |
||||||||
| Investments — unaffiliated issuers* |
(686,170 | ) | 686,173 | |||||
| In-kind redemptions — unaffiliated issuers |
— | 9,777,509 | ||||||
| Foreign currency transactions |
(100,124 | ) | (47,517 | ) | ||||
| Futures contracts |
67,586 | — | ||||||
|
|
|
|
|
|||||
| Net realized gain (loss) |
(718,708 | ) | 10,416,165 | |||||
|
|
|
|
|
|||||
| Net change in unrealized appreciation/depreciation on: |
||||||||
| Investments — unaffiliated issuers** |
71,364,488 | 118,509,621 | ||||||
| Foreign currency translations |
(26,274 | ) | 33,116 | |||||
| Futures contracts |
2,556 | — | ||||||
|
|
|
|
|
|||||
| Net change in unrealized appreciation/depreciation |
71,340,770 | 118,542,737 | ||||||
|
|
|
|
|
|||||
| NET REALIZED AND UNREALIZED GAIN (LOSS) |
70,622,062 | 128,958,902 | ||||||
|
|
|
|
|
|||||
| NET INCREASE (DECREASE) IN NET ASSETS FROM OPERATIONS |
$ | 78,538,359 | $ | 148,980,455 | ||||
|
|
|
|
|
|||||
| * Includes foreign capital gain taxes |
$ | (705 | ) | $ | — | |||
|
|
|
|
|
|||||
| ** Includes foreign deferred taxes |
$ | (115,974 | ) | $ | — | |||
|
|
|
|
|
|||||
See accompanying notes to financial statements.
84
Table of Contents
SPDR INDEX SHARES FUNDS
STATEMENTS OF CHANGES IN NET ASSETS
| SPDR Portfolio Emerging Markets ETF (formerly, SPDR S&P Emerging Markets ETF) |
||||||||
| Year Ended 9/30/17 |
Year Ended 9/30/16 |
|||||||
| INCREASE (DECREASE) IN NET ASSETS FROM OPERATIONS: |
||||||||
| Net investment income (loss) |
$ | 7,916,297 | $ | 3,657,638 | ||||
| Net realized gain (loss) |
(718,708 | ) | (7,774,303 | ) | ||||
| Net change in unrealized appreciation/depreciation |
71,340,770 | 34,425,127 | ||||||
|
|
|
|
|
|||||
| Net increase (decrease) in net assets resulting from operations |
78,538,359 | 30,308,462 | ||||||
|
|
|
|
|
|||||
| DISTRIBUTIONS TO SHAREHOLDERS FROM: |
||||||||
| Net investment income |
(4,140,214 | ) | (3,843,662 | ) | ||||
|
|
|
|
|
|||||
| FROM BENEFICIAL INTEREST TRANSACTIONS: |
||||||||
| Proceeds from sale of shares sold |
253,169,111 | 78,159,264 | ||||||
| Cost of shares redeemed |
— | (58,547,453 | ) | |||||
| Other capital (Note 7) |
85,243 | — | ||||||
|
|
|
|
|
|||||
| Net increase (decrease) in net assets from beneficial interest transactions |
253,254,354 | 19,611,811 | ||||||
|
|
|
|
|
|||||
| Net increase (decrease) in net assets during the period |
327,652,499 | 46,076,611 | ||||||
| Net assets at beginning of period |
234,783,492 | 188,706,881 | ||||||
|
|
|
|
|
|||||
| NET ASSETS AT END OF PERIOD |
$ | 562,435,991 | $ | 234,783,492 | ||||
|
|
|
|
|
|||||
| Undistributed (distribution in excess of) net investment income (loss) |
$ | 5,456,624 | $ | 1,781,014 | ||||
|
|
|
|
|
|||||
| SHARES OF BENEFICIAL INTEREST: |
||||||||
| Shares sold |
3,900,000 | 1,400,000 | ||||||
| Shares redeemed |
— | (1,100,000 | ) | |||||
|
|
|
|
|
|||||
| Net increase (decrease) |
3,900,000 | 300,000 | ||||||
|
|
|
|
|
|||||
See accompanying notes to financial statements.
85
Table of Contents
SPDR INDEX SHARES FUNDS
STATEMENTS OF CHANGES IN NET ASSETS (continued)
| SPDR Portfolio World ex-US
ETF (formerly, SPDR S&P World ex-US ETF) |
||||||||
| Year Ended 9/30/17 |
Year Ended 9/30/16 |
|||||||
| INCREASE (DECREASE) IN NET ASSETS FROM OPERATIONS: |
||||||||
| Net investment income (loss) |
$ | 20,021,553 | $ | 18,870,297 | ||||
| Net realized gain (loss) |
10,416,165 | 14,852,852 | ||||||
| Net change in unrealized appreciation/depreciation |
118,542,737 | 14,490,157 | ||||||
|
|
|
|
|
|||||
| Net increase (decrease) in net assets resulting from operations |
148,980,455 | 48,213,306 | ||||||
|
|
|
|
|
|||||
| DISTRIBUTIONS TO SHAREHOLDERS FROM: |
||||||||
| Net investment income |
(21,128,852 | ) | (19,011,480 | ) | ||||
| Net realized gains |
— | (1,091,428 | ) | |||||
|
|
|
|
|
|||||
| Total distributions to shareholders |
(21,128,852 | ) | (20,102,908 | ) | ||||
|
|
|
|
|
|||||
| FROM BENEFICIAL INTEREST TRANSACTIONS: |
||||||||
| Proceeds from sale of shares sold |
341,888,994 | 68,130,074 | ||||||
| Cost of shares redeemed |
(91,199,248 | ) | (176,321,620 | ) | ||||
| Other capital (Note 7) |
1,822 | — | ||||||
|
|
|
|
|
|||||
| Net increase (decrease) in net assets from beneficial interest transactions |
250,691,568 | (108,191,546 | ) | |||||
|
|
|
|
|
|||||
| Net increase (decrease) in net assets during the period |
378,543,171 | (80,081,148 | ) | |||||
| Net assets at beginning of period |
634,832,552 | 714,913,700 | ||||||
|
|
|
|
|
|||||
| NET ASSETS AT END OF PERIOD |
$ | 1,013,375,723 | $ | 634,832,552 | ||||
|
|
|
|
|
|||||
| Undistributed (distribution in excess of) net investment income (loss) |
$ | 5,551,897 | $ | 5,988,823 | ||||
|
|
|
|
|
|||||
| SHARES OF BENEFICIAL INTEREST: |
||||||||
| Shares sold |
12,600,000 | 2,600,000 | ||||||
| Shares redeemed |
(3,400,000 | ) | (7,000,000 | ) | ||||
|
|
|
|
|
|||||
| Net increase (decrease) |
9,200,000 | (4,400,000 | ) | |||||
|
|
|
|
|
|||||
See accompanying notes to financial statements.
86
Table of Contents
SPDR INDEX SHARES FUNDS
Selected data for a share outstanding throughout each period
| SPDR Portfolio Emerging Markets ETF (formerly, SPDR S&P Emerging Markets ETF) |
||||||||||||||||||||
| Year Ended 9/30/17 |
Year Ended 9/30/16 |
Year Ended 9/30/15 |
Year Ended 9/30/14 |
Year Ended 9/30/13 |
||||||||||||||||
| Net asset value, beginning of period |
$ | 60.20 | $ | 52.42 | $ | 66.35 | $ | 63.14 | $ | 63.85 | ||||||||||
|
|
|
|
|
|
|
|
|
|
|
|||||||||||
| Income (loss) from investment operations: |
||||||||||||||||||||
| Net investment income (loss) (a) |
1.40 | 1.12 | 1.28 | 1.39 | 1.38 | |||||||||||||||
| Net realized and unrealized gain (loss) (b) |
11.28 | 7.82 | (13.88 | ) | 2.85 | (0.55 | ) | |||||||||||||
|
|
|
|
|
|
|
|
|
|
|
|||||||||||
| Total from investment operations |
12.68 | 8.94 | (12.60 | ) | 4.24 | 0.83 | ||||||||||||||
|
|
|
|
|
|
|
|
|
|
|
|||||||||||
| Net equalization credits and charges |
— | — | 0.00 | (c) | — | — | ||||||||||||||
|
|
|
|
|
|
|
|
|
|
|
|||||||||||
| Other capital |
0.02 | — | — | — | — | |||||||||||||||
|
|
|
|
|
|
|
|
|
|
|
|||||||||||
| Distributions to shareholders from: |
||||||||||||||||||||
| Net investment income |
(0.79 | ) | (1.16 | ) | (1.33 | ) | (1.03 | ) | (1.54 | ) | ||||||||||
|
|
|
|
|
|
|
|
|
|
|
|||||||||||
| Net asset value, end of period |
$ | 72.11 | $ | 60.20 | $ | 52.42 | $ | 66.35 | $ | 63.14 | ||||||||||
|
|
|
|
|
|
|
|
|
|
|
|||||||||||
| Total return (d) |
21.36 | % | 17.38 | % | (19.34 | )% | 6.73 | % | 1.31 | % | ||||||||||
| Ratios and Supplemental Data: |
||||||||||||||||||||
| Net assets, end of period (in 000s) |
$ | 562,436 | $ | 234,783 | $ | 188,707 | $ | 285,285 | $ | 189,412 | ||||||||||
| Ratios to average net assets: |
||||||||||||||||||||
| Total expenses |
0.59 | % | 0.59 | % | 0.59 | % | 0.59 | % | 0.59 | % | ||||||||||
| Net expenses |
0.59 | % | 0.59 | % | 0.59 | % | 0.59 | % | 0.59 | % | ||||||||||
| Net investment income (loss) |
2.16 | % | 2.05 | % | 2.02 | % | 2.12 | % | 2.15 | % | ||||||||||
| Portfolio turnover rate (e) |
0 | %(f) | 12 | % | 18 | % | 9 | % | 21 | % | ||||||||||
| (a) | Per share numbers have been calculated using average shares outstanding, which more appropriately presents the per share data for the period. |
| (b) | Amounts shown in this caption for a share outstanding may not accord with the change in aggregate gains and losses in securities for the fiscal period because of the timing of sales and repurchases of Fund shares in relation to fluctuating market values for the Fund. |
| (c) | Amount is less than $0.005 per share. |
| (d) | Total return is calculated assuming a purchase of shares at net asset value on the first day and a sale at net asset value on the last day of each period reported. Distributions are assumed, for the purpose of this calculation, to be reinvested at net asset value per share on the respective payment dates of each distribution. Total returns for periods of less than one year are not annualized. Broker commission charges are not included in this calculation. |
| (e) | Portfolio turnover rate excludes transactions involving securities received or delivered from in-kind processing of creations or redemptions. |
| (f) | Amount is less than 0.005%. |
See accompanying notes to financial statements.
87
Table of Contents
SPDR INDEX SHARES FUNDS
FINANCIAL HIGHLIGHTS (continued)
Selected data for a share outstanding throughout each period
| SPDR Portfolio World ex-US ETF (formerly, SPDR S&P World ex-US ETF) |
||||||||||||||||||||
| Year Ended 9/30/17 |
Year Ended 9/30/16 |
Year Ended 9/30/15 |
Year Ended 9/30/14 |
Year Ended 9/30/13 |
||||||||||||||||
| Net asset value, beginning of period |
$ | 26.45 | $ | 25.17 | $ | 28.46 | $ | 28.00 | $ | 23.91 | ||||||||||
|
|
|
|
|
|
|
|
|
|
|
|||||||||||
| Income (loss) from investment operations: |
||||||||||||||||||||
| Net investment income (loss) (a) |
0.70 | 0.69 | 0.71 | 0.89 | 0.73 | |||||||||||||||
| Net realized and unrealized gain (loss) (b) |
4.16 | 1.32 | (3.25 | ) | 0.40 | 4.04 | ||||||||||||||
|
|
|
|
|
|
|
|
|
|
|
|||||||||||
| Total from investment operations |
4.86 | 2.01 | (2.54 | ) | 1.29 | 4.77 | ||||||||||||||
|
|
|
|
|
|
|
|
|
|
|
|||||||||||
| Other capital |
0.00 | (c) | — | — | — | — | ||||||||||||||
|
|
|
|
|
|
|
|
|
|
|
|||||||||||
| Distributions to shareholders from: |
||||||||||||||||||||
| Net investment income |
(0.79 | ) | (0.69 | ) | (0.75 | ) | (0.83 | ) | (0.68 | ) | ||||||||||
| Net realized gains |
— | (0.04 | ) | — | — | — | ||||||||||||||
|
|
|
|
|
|
|
|
|
|
|
|||||||||||
| Total distributions |
(0.79 | ) | (0.73 | ) | (0.75 | ) | (0.83 | ) | (0.68 | ) | ||||||||||
|
|
|
|
|
|
|
|
|
|
|
|||||||||||
| Net asset value, end of period |
$ | 30.52 | $ | 26.45 | $ | 25.17 | $ | 28.46 | $ | 28.00 | ||||||||||
|
|
|
|
|
|
|
|
|
|
|
|||||||||||
| Total return (d) |
18.75 | % | 8.12 | % | (9.14 | )% | 4.52 | % | 20.27 | % | ||||||||||
| Ratios and Supplemental Data: |
||||||||||||||||||||
| Net assets, end of period (in 000s) |
$ | 1,013,376 | $ | 634,833 | $ | 714,914 | $ | 825,443 | $ | 688,755 | ||||||||||
| Ratios to average net assets: |
||||||||||||||||||||
| Total expenses |
0.34 | % | 0.34 | % | 0.34 | % | 0.34 | % | 0.34 | % | ||||||||||
| Net investment income (loss) |
2.49 | % | 2.70 | % | 2.53 | % | 3.06 | % | 2.79 | % | ||||||||||
| Portfolio turnover rate (e) |
5 | % | 3 | % | 8 | % | 17 | % | 2 | % | ||||||||||
| (a) | Per share numbers have been calculated using average shares outstanding, which more appropriately presents the per share data for the period. |
| (b) | Amounts shown in this caption for a share outstanding may not accord with the change in aggregate gains and losses in securities for the fiscal period because of the timing of sales and repurchases of Fund shares in relation to fluctuating market values for the Fund. |
| (c) | Amount is less than $0.005 per share. |
| (d) | Total return is calculated assuming a purchase of shares at net asset value on the first day and a sale at net asset value on the last day of each period reported. Distributions are assumed, for the purpose of this calculation, to be reinvested at net asset value per share on the respective payment dates of each distribution. Total returns for periods of less than one year are not annualized. Broker commission charges are not included in this calculation. |
| (e) | Portfolio turnover rate excludes securities received or delivered from in-kind processing of creations or redemptions. |
See accompanying notes to financial statements.
88
Table of Contents
SPDR INDEX SHARES FUNDS
September 30, 2017
| 1. | Organization |
SPDR Index Shares Funds (the “Trust”), a Massachusetts business trust, registered under the Investment Company Act of 1940, as amended (“1940 Act”), is an open-end management investment company.
As of September 30, 2017, the Trust consists of thirty (30) series, each of which represents a separate series of beneficial interest in the Trust. The Declaration of Trust permits the Board of Trustees of the Trust (the “Board”) to authorize the issuance of an unlimited number of shares of beneficial interest at $0.01 par value. The financial statements herein relate to the following series (each a “Fund”, and collectively, the “Funds”):
SPDR Portfolio Emerging Markets ETF
(effective October 16, 2017, the Fund changed its name from SPDR S&P Emerging Markets ETF)
SPDR Portfolio World ex-US ETF
(effective October 16, 2017, the Fund changed its name from SPDR S&P World ex-US ETF)
Each fund is classified as a non-diversified investment company under the 1940 Act.
Under the Trust’s organizational documents, its officers and trustees are indemnified against certain liabilities arising out of the performance of their duties to the Trust. Additionally, in the normal course of business, the Trust enters into contracts with service providers that contain general indemnification clauses. The Trust’s maximum exposure under these arrangements is unknown as this would involve future claims that may be made against the Trust that have not yet occurred.
| 2. | Summary of Significant Accounting Policies |
The following is a summary of significant accounting policies followed by the Trust in the preparation of its financial statements:
The preparation of financial statements in accordance with U.S. generally accepted accounting principles (“U.S. GAAP”) requires management to make estimates and assumptions that affect the reported amounts and disclosures in the financial statements. Actual results could differ from those estimates. Each Fund is an investment company under U.S. GAAP and follows the accounting and reporting guidance applicable to investment companies.
89
Table of Contents
SPDR INDEX SHARES FUNDS
NOTES TO FINANCIAL STATEMENTS (continued)
September 30, 2017
Security Valuation
Each Fund’s investments are valued at fair value each day that the New York Stock Exchange (“NYSE”) is open and, for financial reporting purposes, as of the report date should the reporting period end on a day that the NYSE is not open. Fair value is generally defined as the price a fund would receive to sell an asset or pay to transfer a liability in an orderly transaction between market participants at the measurement date. By its nature, a fair value price is a good faith estimate of the valuation in a current sale and may not reflect an actual market price. The investments of each Fund are valued pursuant to the policy and procedures developed by the Oversight Committee (the “Committee”) and approved by the Board. The Committee provides oversight of the valuation of investments for the Funds. The Board has responsibility for determining the fair value of investments.
Valuation techniques used to value each Fund’s investments by major category are as follows:
| • | Equity investments (including registered investment companies that are exchange-traded funds) traded on a recognized securities exchange for which market quotations are readily available are valued at the last sale price or official closing price, as applicable, on the primary market or exchange on which they trade. Equity investments traded on a recognized exchange for which there were no sales on that day are valued at the last published sale price or at fair value. |
| • | Rights and warrants are valued at the last reported sale price obtained from independent pricing services or brokers on the valuation date. If no price is obtained from pricing services or brokers, valuation will be based upon the intrinsic value, pursuant to the valuation policy and procedures approved by the Board. |
| • | Investments in registered investment companies (including money market funds) or other unitized pooled investment vehicles that are not traded on an exchange are valued at that day’s published net asset value (“NAV”) per share or unit. |
| • | Exchange-traded futures contracts are valued at the closing settlement price on the primary market on which they are traded most extensively. Exchange-traded futures contracts traded on a recognized exchange for which there were no sales on that day are valued at the last reported sale price obtained from independent pricing services or brokers or at fair value. |
In the event prices or quotations are not readily available or that the application of these valuation methods results in a price for an investment that is deemed to be not representative of the fair value of such investment, fair value will be determined in good faith by the Committee, in accordance with the valuation policy and procedures approved by the Board.
90
Table of Contents
SPDR INDEX SHARES FUNDS
NOTES TO FINANCIAL STATEMENTS (continued)
September 30, 2017
Fair value pricing could result in a difference between the prices used to calculate a Fund’s NAV and the prices used by the Funds’ underlying benchmarks. Various inputs are used in determining the value of the Funds’ investments.
The Funds value their assets and liabilities at fair value using a fair value hierarchy consisting of three broad levels that prioritize the inputs to valuation techniques giving the highest priority to readily available unadjusted quoted prices in active markets for identical assets or liabilities (Level 1 measurements) and the lowest priority to unobservable inputs (Level 3 measurements) when market prices are not readily available or reliable. The categorization of a value determined for an investment within the hierarchy is based upon the pricing transparency of the investment and is not necessarily an indication of the risk associated with investing in it.
The three levels of the fair value hierarchy are as follows:
| • | Level 1 – Unadjusted quoted prices in active markets for an identical asset or liability; |
| • | Level 2 – Inputs other than quoted prices included within Level 1 that are observable for the asset or liability either directly or indirectly, including quoted prices for similar assets or liabilities in active markets, quoted prices for identical or similar assets or liabilities in markets that are not considered to be active, inputs other than quoted prices that are observable for the asset or liability (such as exchange rates, financing terms, interest rates, yield curves, volatilities, prepayment speeds, loss severities, credit risks and default rates) or other market-corroborated inputs; and |
| • | Level 3 – Unobservable inputs for the asset or liability, including the Committee’s assumptions used in determining the fair value of investments. |
The value of each Fund’s investments according to the fair value hierarchy as of September 30, 2017, is disclosed in each Fund’s respective Schedule of Investments.
Changes in valuation techniques may result in transfers in or out of an assigned level within the fair value hierarchy. Transfers between different levels of the fair value hierarchy are recognized at the end of the reporting period. The Funds had no material transfers between levels for the period ended September 30, 2017.
91
Table of Contents
SPDR INDEX SHARES FUNDS
NOTES TO FINANCIAL STATEMENTS (continued)
September 30, 2017
Investment Transactions and Income Recognition
Investment transactions are accounted for on trade date for financial reporting purposes. Realized gains and losses from the sale or disposition of investments and foreign exchange transactions, if any, are determined using the identified cost method.
Dividend income and capital gain distributions, if any, are recognized on the ex-dividend date, net of any foreign taxes withheld at source, if any. Non-cash dividends received in the form of stock are recorded as dividend income at fair value.
Distributions received by the Funds may include a return of capital that is estimated by management. Such amounts are recorded as a reduction of the cost of investments or reclassified to capital gains.
Certain Funds invest in real estate investment trusts (“REITs”). REITs determine the tax character of their distributions annually and may characterize a portion of their distributions as a return of capital or capital gain. The Funds’ policy is to record all REIT distributions initially as dividend income and re-designate the prior calendar year’s to return of capital or capital gain distributions at year end based on information provided by the REIT and/or SSGA Funds Management, Inc’s. (the “Adviser” or “SSGA FM”) estimates of such re-designations for which actual information has not yet been reported.
Expenses
Certain expenses, which are directly identifiable to a specific Fund, are applied to that Fund within the Trust. Other expenses which cannot be attributed to a specific Fund are allocated in such a manner as deemed equitable, taking into consideration the nature and type of expense and the relative net assets of the Funds within the Trust.
Foreign Currency Translation
The accounting records of the Funds are maintained in U.S. dollars. Foreign currencies as well as investment securities and other assets and liabilities denominated in a foreign currency are translated to U.S. dollars using exchange rates at period end. Purchases and sales of securities, income receipts and expense payments denominated in foreign currencies are translated into U.S. dollars at the prevailing exchange rate on the respective dates of the transactions.
The effects of exchange rate fluctuations on investments are included with the net realized and unrealized gain (loss) on investment securities. Other foreign currency transactions resulting in realized and unrealized gain (loss) are disclosed separately.
92
Table of Contents
SPDR INDEX SHARES FUNDS
NOTES TO FINANCIAL STATEMENTS (continued)
September 30, 2017
Foreign Taxes
The Funds may be subject to foreign taxes (a portion of which may be reclaimable) on income, stock dividends, realized and unrealized capital gains on investments or certain foreign currency transactions. Foreign taxes are recorded in accordance with SSGA FM’s understanding of the applicable foreign tax regulations and rates that exist in the foreign jurisdictions in which the Funds invest. These foreign taxes, if any, are paid by the Funds and are reflected in the Statements of Operations, if applicable. Foreign taxes payable or deferred as of September 30, 2017, if any, are disclosed in the Funds’ Statements of Assets and Liabilities.
As of August 21, 2017, SPDR Portfolio Emerging Markets ETF’s NAV was impacted by an adjustment to certain foreign tax accruals. The per share impact was $0.03 on August 21, 2017.
Equalization
Certain Funds in the Trust follow the accounting practice known as “Equalization” by which a portion of the proceeds from sales and costs of reacquiring Fund shares, equivalent on a per share basis to the amount of distributable net investment income on the date of the transaction, is credited or charged to undistributed net investment income. As a result, undistributed net investment income per share is unaffected by sales or reacquisition of Fund shares. Amounts related to Equalization can be found on the Statements of Changes in Net Assets.
Distributions
The SPDR Portfolio Emerging Markets ETF and the SPDR Portfolio World Ex-US ETF declare and distribute from net investment income, if any, to its shareholders semi-annually.
Net realized capital gains, if any, are distributed annually, unless additional distributions are required for compliance with applicable tax regulations. The amount and character of income and capital gains to be distributed are determined in accordance with applicable tax regulations which may differ from net investment income and realized gains recognized for U.S. GAAP purposes.
93
Table of Contents
SPDR INDEX SHARES FUNDS
NOTES TO FINANCIAL STATEMENTS (continued)
September 30, 2017
| 3. | Derivative Financial Instruments |
Futures Contracts
Certain Funds may enter into futures contracts to meet the Funds’ objectives. A futures contract is a standardized, exchange-traded agreement to buy or sell a financial instrument at a set price on a future date. Upon entering into a futures contract, the Fund is required to deposit with the broker, cash or securities in an amount equal to the minimum initial margin requirements of the clearing house. Subsequent payments are made or received by the Funds equal to the daily change in the contract value and are recorded as variation margin receivable or payable with a corresponding offset to unrealized gains or losses. The Funds recognize a realized gain or loss when the contract is closed.
Losses may arise if the value of a futures contract decreases due to unfavorable changes in the market rates or values of the underlying instrument during the term of the contract or if the counterparty does not perform under the contract. The use of futures contracts also involves the risk that the movements in the price of the futures contracts do not correlate the movement of the assets underlying such contracts.
For the period ended September 30, 2017, the SPDR Portfolio Emerging Markets ETF entered into futures contracts for return enhancement, hedging and exposing cash reserves to the market.
The following tables summarize the value of the Funds’ derivative instruments as of September 30, 2017, and the related location in the accompanying Statements of Assets and Liabilities and Statements of Operations, presented by primary underlying risk exposure:
| Liability Derivatives | ||||||||||||||||||||||||
| Interest Rate Contracts Risk |
Foreign Exchange Contracts Risk |
Credit Contracts Risk |
Equity Contracts Risk |
Commodity Contracts Risk |
Total | |||||||||||||||||||
| SPDR Portfolio Emerging Markets ETF |
||||||||||||||||||||||||
| Futures Contracts(a) |
$ | — | $ | — | $ | — | $ | (1,090 | ) | $ | — | $ | (1,090 | ) | ||||||||||
| (a) | Unrealized depreciation on open futures contracts. The Statements of Assets and Liabilities only reflect the current day’s net variation margin. |
94
Table of Contents
SPDR INDEX SHARES FUNDS
NOTES TO FINANCIAL STATEMENTS (continued)
September 30, 2017
| Net Realized Gain (Loss) | ||||||||||||||||||||||||
| Interest Rate Contracts Risk |
Foreign Exchange Contracts Risk |
Credit Contracts Risk |
Equity Contracts Risk |
Commodity Contracts Risk |
Total | |||||||||||||||||||
| SPDR Portfolio Emerging Markets ETF |
||||||||||||||||||||||||
| Futures Contracts |
$ | — | $ | — | $ | — | $ | 67,586 | $ | — | $ | 67,586 | ||||||||||||
| Net Change in Unrealized Appreciation (Depreciation) | ||||||||||||||||||||||||
| Interest Rate Contracts Risk |
Foreign Exchange Contracts Risk |
Credit Contracts Risk |
Equity Contracts Risk |
Commodity Contracts Risk |
Total | |||||||||||||||||||
| SPDR Portfolio Emerging Markets ETF |
||||||||||||||||||||||||
| Futures Contracts |
$ | — | $ | — | $ | — | $ | 2,556 | $ | — | $ | 2,556 | ||||||||||||
| 4. | Fees and Transactions with Affiliates |
Advisory Fee
The Trust, on behalf of each Fund, has entered into an Investment Advisory Agreement with SSGA FM. For its advisory services to the Funds, facilities furnished, and expenses borne by the Adviser, each Fund pays the Adviser a fee accrued daily and paid quarterly, based on a percentage of each Fund’s average daily net assets as shown in the following table:
| Annual Rate | ||||
| SPDR Portfolio Emerging Markets ETF |
0.59 | % | ||
| SPDR Portfolio World ex-US ETF |
0.34 | |||
The Adviser pays all operating expenses of each Fund other than management fee, distribution fee pursuant to each Fund’s Distribution and Service Plan, if any, brokerage, taxes, interest, fees and expenses of the Independent Trustees (including any Trustees’ counsel fees, acquired fund fees and expenses, litigation expenses and other extraordinary expenses).
95
Table of Contents
SPDR INDEX SHARES FUNDS
NOTES TO FINANCIAL STATEMENTS (continued)
September 30, 2017
Administrator, Sub-Administrator, Custodian, and Transfer Agent Fees
SSGA FM serves as administrator and State Street Bank and Trust Company (“State Street”), an affiliate of the Adviser, serves as custodian, sub-administrator and transfer agent. State Street receives fees for its services as custodian, sub-administrator and transfer agent from the Adviser.
Distribution Fees
State Street Global Advisors Funds Distributors, LLC (“SSGA FD” or the “Distributor”), an affiliate of the Adviser, serves as the distributor of the Trust. Effective May 1, 2017, the Distributor’s name changed from State Street Global Markets, LLC to State Street Global Advisors Funds Distributors, LLC.
Other Transactions with Affiliates — Securities Lending
State Street, an affiliate of the Funds, acts as the securities lending agent for the Funds, pursuant to an amended and restated securities lending authorization agreement dated January 6, 2017.
Proceeds collected by State Street on investment of cash collateral or any fee income are allocated as follows (after deduction of such other amounts payable to State Street under the terms of the securities lending agreement): 85% payable to the Fund, and 15% payable to State Street.
In addition, cash collateral from lending activities is invested in the State Street Navigator Securities Lending Government Money Market Portfolio, an affiliated money market fund, for which SSGA FM serves as investment adviser. See Note 9 for additional information regarding securities lending.
Other Transactions with Affiliates
The Funds may invest in affiliated entities, including securities issued by State Street Corporation, affiliated funds, or entities deemed to be affiliates as a result of the Funds owning more than five percent of the entity’s voting securities or outstanding shares. Amounts relating to these transactions during the period ended September 30, 2017, are disclosed in the Schedules of Investments.
96
Table of Contents
SPDR INDEX SHARES FUNDS
NOTES TO FINANCIAL STATEMENTS (continued)
September 30, 2017
Due to Custodian
In certain circumstances, the Funds may have cash overdraft with the custodian. The Due to Custodian amount, if any, reflects cash overdrawn with State Street as custodian who is an affiliate of the Funds. The SPDR Portfolio Emerging Markets ETF had a cash overdraft related to the settlement of foreign currency and investment transactions.
| 5. | Trustees’ Fees |
The fees and expenses of the Trust’s trustees, who are not “interested persons” of the Trust, as defined in the 1940 Act (“Independent Trustees”), are paid directly by the Funds. The Independent Trustees are reimbursed for travel and other out-of-pocket expenses in connection with meeting attendance and industry seminars.
| 6. | Investment Transactions |
Purchases and sales of investments (excluding in-kind transactions, short term investments and derivative contracts) for the period ended September 30, 2017, were as follows:
| Purchases | Sales | |||||||
| SPDR Portfolio Emerging Markets ETF |
$ | 86,756,245 | $ | 1,020,941 | ||||
| SPDR Portfolio World ex-US ETF |
54,989,322 | 40,051,950 | ||||||
For the period ended September 30, 2017, the following Funds had in-kind contributions, redemptions and net realized gains/losses in the amounts as follows:
| In-kind Contributions |
In-kind Redemptions |
In-kind Net Realized Gains/(Losses) |
||||||||||
| SPDR Portfolio Emerging Markets ETF |
$ | 170,326,580 | $ | — | $ | — | ||||||
| SPDR Portfolio World ex-US ETF |
322,393,930 | 86,001,029 | 9,777,509 | |||||||||
| 7. | Shareholder Transactions |
Each Fund issues and redeems its shares, at NAV, by each Fund only in aggregations of a specified number of shares or multiples thereof (“Creation Units”). Except when aggregated in Creation Units, shares of each Fund are not redeemable. Transactions in capital shares for each Fund are disclosed in detail in the Statements of Changes in Net Assets.
97
Table of Contents
SPDR INDEX SHARES FUNDS
NOTES TO FINANCIAL STATEMENTS (continued)
September 30, 2017
The consideration for the purchase of Creation Units of a Fund may consist of the in-kind deposit of a designated portfolio of securities and a specified amount of cash. Investors purchasing and redeeming Creation Units may pay a purchase transaction fee and a redemption transaction fee directly to the Trust and/or custodian, to offset transfer and other transaction costs associated with the issuance and redemption of Creation Units, including Creation Units for cash. An additional variable fee may be charged for certain transactions. Such variable charges, if any, are included in “Other Capital” on the Statements of Changes on Net Assets.
| 8. | Income Tax Information |
The Funds have qualified and intend to continue to qualify as regulated investment companies under Subchapter M of the Internal Revenue Code of 1986, as amended. Each Fund will not be subject to federal income taxes to the extent it distributes its taxable income, including any net realized capital gains, for each fiscal year. Therefore, no provision for federal income tax is required.
The Funds file federal and various state and local tax returns as required. No income tax returns are currently under examination. Generally, the federal returns are subject to examination by the Internal Revenue Service for a period of three years from date of filing, while the state returns may remain open for an additional year depending upon jurisdiction. SSGA FM has analyzed each Fund’s tax positions taken on tax returns for all open years and does not believe there are any uncertain tax positions that would require recognition of a tax liability.
Distributions to shareholders are recorded on ex-dividend date. Income dividends and gain distributions are determined in accordance with income tax rules and regulations, which may differ from generally accepted accounting principles.
Certain capital accounts in the financial statements have been adjusted for permanent book-tax differences. These adjustments have no impact on net asset values or results of operations. Temporary book-tax differences will reverse in the future. These book-tax differences are primarily due to differing treatments for character of distributions, nontaxable dividend adjustments to income, in-kind transactions, foreign currencies, passive foreign investment companies, wash sale losses and distributions in excess of current earnings. In addition, certain Funds claimed a portion of the payments made to redeeming shareholders as a distribution for income tax purposes.
98
Table of Contents
SPDR INDEX SHARES FUNDS
NOTES TO FINANCIAL STATEMENTS (continued)
September 30, 2017
The tax character of distributions paid during the year ended September 30, 2017, was as follows:
| Ordinary Income |
Total | |||||||
| SPDR Portfolio Emerging Markets ETF |
$ | 4,140,214 | $ | 4,140,214 | ||||
| SPDR Portfolio World ex-US ETF |
21,128,852 | 21,128,852 | ||||||
The tax character of distributions paid during the year ended September 30, 2016, was as follows:
| Ordinary Income |
Long-Term Capital Gains |
Total | ||||||||||
| SPDR Portfolio Emerging Markets ETF |
$ | 3,843,662 | $ | — | $ | 3,843,662 | ||||||
| SPDR Portfolio World ex-US ETF |
19,228,167 | 874,741 | 20,102,908 | |||||||||
At September 30, 2017, the components of distributable earnings on a tax basis were as follows:
| Undistributed Ordinary Income |
Capital Loss Carryforwards |
Undistributed Long-Term Capital Gains |
Net Unrealized Gains (Losses) |
Qualified Late-Year Losses* |
Total | |||||||||||||||||||
| SPDR Portfolio Emerging Markets ETF |
$ | 6,841,377 | $ | (25,583,133 | ) | $ | — | $ | 41,530,941 | $ | — | $ | 22,789,185 | |||||||||||
| SPDR Portfolio World ex-US ETF |
8,887,468 | (5,336,368 | ) | — | 72,251,314 | — | 75,802,414 | |||||||||||||||||
| * | The Funds have elected to defer certain qualified late-year losses and recognize such losses in the next taxable year. |
As of September 30, 2017, the following Funds had capital loss carryforwards available to offset future realized capital gains through the indicated expiration dates as follows:
| Expiring 2018 |
Expiring 2019 |
Non-Expiring Short Term** |
Non-Expiring Long Term** |
|||||||||||||
| SPDR Portfolio Emerging Markets ETF |
$ | — | $ | — | $ | 3,187,264 | $ | 22,395,869 | ||||||||
| SPDR Portfolio World ex-US ETF |
— | — | — | 5,336,368 | ||||||||||||
| ** | Must be utilized prior to losses subject to expiration. |
99
Table of Contents
SPDR INDEX SHARES FUNDS
NOTES TO FINANCIAL STATEMENTS (continued)
September 30, 2017
As of September 30, 2017, gross unrealized appreciation and gross unrealized depreciation of investments based on cost for federal income tax purposes were as follows:
| Tax Cost | Gross Unrealized Appreciation |
Gross Unrealized Depreciation |
Net Unrealized Appreciation (Depreciation) |
|||||||||||||
| SPDR Portfolio Emerging Markets ETF |
$ | 525,196,049 | $ | 84,252,614 | $ | 42,405,530 | $ | 41,847,084 | ||||||||
| SPDR Portfolio World ex-US ETF |
960,174,244 | 139,352,776 | 67,112,266 | 72,240,510 | ||||||||||||
| 9. | Securities Lending |
Each Fund may lend securities to qualified broker-dealers or institutional investors. The loans are secured at all times by cash, cash equivalents or U.S. government securities in an amount at least equal to the market value of the securities loaned, plus accrued interest and dividends, determined on a daily basis and adjusted accordingly. The value of the collateral with respect to a loaned security may be temporarily more or less than the value of a security due to market fluctuations of securities values. With respect to each loan, if on any U.S. business day the aggregate market value of securities collateral plus cash collateral is less than the aggregate market value of the securities which are subject to the loan, the borrower will be notified to provide additional collateral on the next business day.
The Funds will regain record ownership of loaned securities to exercise certain beneficial rights; however, the Funds may bear the risk of delay in recovery of, or even loss of rights in the securities loaned should the borrower fail financially. In addition, a Fund will bear the risk of loss of any cash collateral that it may invest. Each Fund receives compensation for lending its securities from interest or dividends earned on the cash, cash equivalents or U.S. government securities held as collateral, net of fee rebates paid to the borrower and net of fees paid to State Street as the lending agent. Additionally, a Fund will receive a fee from the borrower for non-cash collateral equal to a percentage of the market value of the loaned securities.
The market value of securities on loan as of September 30, 2017, and the value of the invested cash collateral are disclosed in the Funds’ Statements of Assets and Liabilities. Non-cash collateral is not disclosed in the Funds’ Statements of Assets and Liabilities as it is held by the lending agent on behalf of the Funds, and the Funds do not have the ability to re-hypothecate those securities. Securities lending income, as disclosed in the Funds’ Statements of Operations, represents the income earned from the non-cash collateral and the investment of cash collateral, net of fee rebates paid to the borrower and net of fees paid to State Street as lending agent.
100
Table of Contents
SPDR INDEX SHARES FUNDS
NOTES TO FINANCIAL STATEMENTS (continued)
September 30, 2017
The following is a summary of each Fund’s securities lending agreements and related cash and non-cash collateral received as of September 30, 2017:
| Fund |
Market Value of Securities on Loan |
Cash Collateral Received |
Non Cash Collateral Received* |
Total Collateral Received |
||||||||||||
| SPDR Portfolio Emerging Markets ETF |
$ | 39,335,507 | $ | 8,647,800 | $ | 31,997,253 | $ | 40,645,053 | ||||||||
| SPDR Portfolio World ex-US ETF |
39,933,446 | 22,963,226 | 18,950,373 | 41,913,599 | ||||||||||||
| * | The non-cash collateral includes U.S. Treasuries and U.S. Government Agency securities. |
The following table reflects a breakdown of transactions accounted for as secured borrowings, the gross obligation by the type of collateral pledged or securities loaned, and the remaining contractual maturity of those transactions as of September 30, 2017:
| Remaining Contractual Maturity of the Agreements As of September 30, 2017 |
||||||||||||||||||||||||||||
| Fund |
Securities Lending Transactions |
Overnight and Continuous |
<30 Days | Between 30 & 90 Days |
>90 Days | Total Borrowings |
Gross Amount of Recognized Liabilities for Securities Lending Transactions |
|||||||||||||||||||||
| SPDR Portfolio Emerging Markets ETF |
Common Stocks | $ | 8,647,800 | $ | — | $ | — | $ | — | $ | 8,647,800 | $ | 8,647,800 | |||||||||||||||
| SPDR Portfolio World ex-US ETF |
Common Stocks | 22,963,226 | — | — | — | 22,963,226 | 22,963,226 | |||||||||||||||||||||
| 10. | Line of Credit |
Certain Funds and other affiliated funds (each a “Participant” and, collectively, the “Participants”) participate in a $360 million revolving credit facility provided by a syndication of banks under which the Participants may borrow to fund shareholder redemptions. This agreement expires in October 2017 unless extended or renewed. Prior to October 13, 2016, the participants could borrow up to $360 million at any time outstanding, subject to asset coverage and other limitations as specified in the agreements.
The SPDR Portfolio Emerging Markets ETF participates in the credit facility.
The Participants are charged an annual commitment fee which is calculated based on the unused portion of the shared credit line. Commitment fees are allocated among each of the Participants based on relative net assets. Commitment fees are ordinary fund operating expenses paid by the Adviser. A Participant incurs and pays the interest expense related to its borrowing. Interest is calculated at a rate per annum equal to the
101
Table of Contents
SPDR INDEX SHARES FUNDS
NOTES TO FINANCIAL STATEMENTS (continued)
September 30, 2017
sum of 1% plus the greater of the New York Fed Bank Rate and 1-month LIBOR rate. Prior to October 13, 2016, interest was calculated at a rate per annum equal to the sum of the New York Fed Bank Rate plus 1%.
Effective October 12, 2017, the Agreement was renewed, and as a result, the Funds and other affiliated Funds participate in a $500 million revolving credit facility.
The Funds had no outstanding loans as of September 30, 2017.
| 11. | Risks |
Concentration Risk
As a result of the Funds’ ability to invest a large percentage of their assets in obligations of issuers within the same country, state, region, currency or economic sector, an adverse economic, business or political development may affect the value of the Funds’ investments more than if the Funds were more broadly diversified.
Foreign and Emerging Markets Risk
Investing in foreign markets involve risks and considerations not typically associated with investing in the U.S. Foreign securities may be subject to risk of loss because of government regulation, economic, political and social instability in the countries in which the Funds invest. Foreign markets may be less liquid than investments in the U.S. and may be subject to the risks of currency fluctuations. To the extent that a Fund invests in securities of issuers located in emerging markets, these risks may be even more pronounced.
Market and Credit Risk
In the normal course of business, the Funds trade financial instruments and enter into financial transactions where risk of potential loss exists due to changes in the general economic conditions and fluctuations of the market (market risk). Additionally, the Fund may also be exposed to credit risk in the event that an issuer or guarantor fails to perform or that an institution or entity with which the Fund has unsettled or open transactions defaults.
| 12. | Subsequent Events |
Management has evaluated the impact of all subsequent events on the Funds through the date on which the financial statements were available to be issued and has determined that there were no subsequent events requiring adjustment or disclosure in the financial statements other than below.
102
Table of Contents
SPDR INDEX SHARES FUNDS
NOTES TO FINANCIAL STATEMENTS (continued)
September 30, 2017
The Board authorized a 2-for-1 split for the SPDR Portfolio Emerging Markets ETF, effective after the close of trading on October 13, 2017 for the shareholders of record on October 11, 2017. The impact of the stock split was to increase the number of shares outstanding by a factor of 2, while decreasing the NAV of shares outstanding by a factor of 2, resulting in no effect to the net assets of the aforementioned Fund.
The Board approved changing the names of the SPDR S&P Emerging Markets ETF and SPDR S&P World ex-US ETF. On October 16, 2017, all references to SPDR S&P Emerging Markets ETF and SPDR S&P World ex-US ETF in the Prospectus, Summary Prospectus and Statement of Additional Information were replaced by references to SPDR Portfolio Emerging Markets ETF and SPDR Portfolio World ex-US ETF, respectively.
Effective October 16, 2017, the Adviser has agreed to reduce the advisory fee for each Fund as follows:
| Old advisory fee (percentage of average daily net assets) |
New advisory fee (percentage of average daily net assets) |
|||||||
| SPDR Portfolio Emerging Markets ETF |
0.59 | % | 0.11 | % | ||||
| SPDR Portfolio World ex-US ETF |
0.34 | % | 0.04 | % | ||||
103
Table of Contents
[THIS PAGE INTENTIONALLY LEFT BLANK]
104
Table of Contents
SPDR INDEX SHARES FUNDS
REPORT OF INDEPENDENT REGISTERED PUBLIC
ACCOUNTING FIRM
To the Trustees and Shareholders of the SPDR Index Shares Funds:
In our opinion, the accompanying statements of assets and liabilities, including the schedules of investments, and the related statements of operations and of changes in net assets and the financial highlights present fairly, in all material respects, the financial position of the two funds, listed in Note 1, (each a “Fund”) as of September 30, 2017, the results of each of their operations for the year then ended, the changes in each of their net assets for each of the two years in the period then ended and the financial highlights for each of the five years in the period then ended, in conformity with accounting principles generally accepted in the United States of America. These financial statements and financial highlights (hereafter referred to as “financial statements”) are the responsibility of the Trust’s management. Our responsibility is to express an opinion on these financial statements based on our audits. We conducted our audits of these financial statements in accordance with the standards of the Public Company Accounting Oversight Board (United States). Those standards require that we plan and perform the audit to obtain reasonable assurance about whether the financial statements are free of material misstatement. An audit includes examining, on a test basis, evidence supporting the amounts and disclosures in the financial statements, assessing the accounting principles used and significant estimates made by management, and evaluating the overall financial statement presentation. We believe that our audits, which included confirmation of securities as of September 30, 2017 by correspondence with the custodian and brokers and the application of alternative auditing procedures where securities purchased had not been received, provide a reasonable basis for the opinion expressed above.
/s/ PricewaterhouseCoopersLLP
Boston, Massachusetts
November 21, 2017
105
Table of Contents
SPDR INDEX SHARES FUNDS
September 30, 2017 (Unaudited)
Expense Example
As a shareholder of a Fund, you incur two types of costs (1) transaction costs, including sales charges (loads), if applicable, on purchase payments, reinvested dividends, or other distributions and (2) ongoing costs, including advisory fees and other Fund expenses. This example is intended to help you understand your ongoing costs (in dollars) of investing in the Fund and to compare these costs with the ongoing costs of investing in other mutual funds. It is based on an investment of $1,000 made at the beginning of the period shown and held for the entire period from April 1, 2017 to September 30, 2017.
The table below illustrates your Fund’s cost in two ways:
Based on actual fund return — This section helps you to estimate the actual expenses that you paid over the period. The “Ending Account Value” shown is derived from each Fund’s actual return, and the third column shows the dollar amount that would have been paid by an investor who started with $1,000 in the Fund. You may use the information here, together with the amount you invested, to estimate the expenses that you paid over the period. To do so, simply divide your account value by $1,000 (for example, an $8,600 account value divided by $1,000 = 8.6), then multiply the result by the number given for the Fund under the heading “Expenses Paid During Period”.
Based on hypothetical 5% return — This section is intended to help you compare your Fund’s costs with those of other mutual funds. It assumes that the Fund had a yearly return of 5% before expenses, but that the expense ratio is unchanged. In this case, because the return used is not the Fund’s actual return, the results do not apply to your investment. The example is useful in making comparisons because the U.S. Securities and Exchange Commission (the “SEC”) requires all mutual funds to calculate expenses based on a 5% return. You can assess your Fund’s costs by comparing this hypothetical example with the hypothetical examples that appear in shareholder reports of other funds.
Please note that the expenses shown in the table are meant to highlight your ongoing costs only and do not reflect any transaction costs, such as sales load charges (loads). Therefore, the hypothetical 5% return section of the table is useful in comparing ongoing costs only, and will not help you determine the relative total costs of owning different funds. In addition, if these transaction costs were included, your costs would have been higher.
106
Table of Contents
SPDR INDEX SHARES FUNDS
OTHER INFORMATION (continued)
September 30, 2017 (Unaudited)
| SPDR Portfolio Emerging Markets ETF |
SPDR Portfolio World ex-US ETF |
|||||||
| Annualized Expense Ratio |
0.59 | % | 0.34 | % | ||||
| Actual: |
||||||||
| Ending Account Value |
$ | 1,135.60 | $ | 1,116.30 | ||||
| Expenses Paid During Period(a) |
3.16 | 1.80 | ||||||
| Hypothetical (assuming a 5% return before expenses): |
||||||||
| Ending Account Value |
1,022.10 | 1,023.40 | ||||||
| Expenses Paid During Period(a) |
2.99 | 1.72 | ||||||
| (a) | Expenses are equal to the Fund’s annualized net expense ratio multiplied by the average account value of the period, multiplied by 183, then divided by 365. |
Tax Information
For federal income tax purposes, the following information is furnished with respect to the distributions of the Trust for its fiscal year ended September 30, 2017.
Dividends Received Deduction
Each Fund reports the maximum amount allowable of its net taxable income as eligible for the corporate dividends received deduction.
Qualified Dividend Income
A portion of dividends distributed by the Funds during the fiscal year ended September 30, 2017 are considered qualified dividend income and are eligible for reduced tax rates. These lower rates range from 5% to 20% depending on the individual’s tax bracket. Each Fund reports the maximum amount allowable of its net taxable income as qualified dividend income as provided in the Jobs and Growth Tax Relief Reconciliation Act of 2003.
107
Table of Contents
SPDR INDEX SHARES FUNDS
OTHER INFORMATION (continued)
September 30, 2017 (Unaudited)
Foreign Tax Credit
The Trust has made an election under Internal Revenue Code Section 853 to pass through foreign taxes paid by a Fund to its shareholders. For the year ended September 30, 2017, the total amount of foreign taxes that will be passed through are:
| Amount | ||||
| SPDR Portfolio Emerging Markets ETF |
$ | 1,171,137 | ||
| SPDR Portfolio World ex-US ETF |
1,649,945 | |||
The amount of foreign source income earned on the following Funds during the year ended September 30, 2017 were as follows:
| Amount | ||||
| SPDR Portfolio Emerging Markets ETF |
$ | 11,206,950 | ||
| SPDR Portfolio World ex-US ETF |
25,760,392 | |||
Premium/Discount Information
Information regarding how often the Shares of each Fund traded on the exchange at a price above (i.e. at a premium) or below (i.e. at a discount) the NAV of the Fund during the past calendar year can be found at http://www.spdrs.com.
Proxy Voting Policies and Procedures and Records
A description of the Trust’s proxy voting policies and procedures that are used by the Funds’ investment adviser to vote proxies relating to the Funds’ portfolio of securities are available (i) without charge, upon request by calling 1-866-787-2257 (toll free) or (ii) on the SEC’s website, at www.sec.gov.
Information regarding how the investment adviser voted for the most recent period ended June 30 is available by August 31 of each year by calling the same number and on the SEC’s website, at www.sec.gov, and on the Funds’ website at www.spdrs.com.
Quarterly Portfolio Schedule
The Funds file a complete schedule of investments with the SEC for the first and third quarters of each fiscal year on Form N-Q. The Funds’ Forms N-Q are available on the SEC’s website at www.sec.gov and may be reviewed and copied at the SEC’s Public Reference Room in Washington DC. Information on the operation of the Public Reference Room may be obtained by calling 1-800-SEC-0330. The information on the Form N-Q is available upon request, without charge, by calling 1-866-787-2257 (toll free) and on the Funds’ website at www.spdrs.com.
108
Table of Contents
SPDR INDEX SHARES FUNDS
OTHER INFORMATION (continued)
September 30, 2017 (Unaudited)
Approval of Advisory Agreement
At an in-person meeting held prior to September 30, 2017, the Board of Trustees of the Trust (the “Board”) evaluated proposals to continue the Investment Advisory Agreement (the “Agreement”) between the Trust and SSGA Funds Management, Inc. (the “Adviser” or “SSGA FM”) with respect to the operational series of the Trust (collectively, the “Current ETFs”) and to continue the Agreement with respect to the previously approved non-operational series of the Trust (together with the Current ETFs, the “SPDR ETFs”). The Trustees who are not “interested persons” of the Trust within the meaning of the Investment Company Act of 1940, as amended (the “Independent Trustees”), also met separately with their independent legal counsel to consider the Agreement.
In evaluating the Agreement, the Board drew on materials provided to them by SSGA FM, the Trust’s investment adviser and administrator, and other materials provided by State Street Bank and Trust Company, the Trust’s sub-administrator, transfer agent and custodian (“State Street”). In deciding whether to approve the Agreement, the Board considered various factors, including the (i) nature, extent and quality of services provided by the Adviser with respect to the SPDR ETFs under the Agreement, (ii) investment performance of the Current ETFs, (iii) profits realized by the Adviser and its affiliates from its relationship with the Trust, (iv) fees charged to comparable funds, (v) other benefits to the Adviser, and (vi) extent to which economies of scale would be shared as the SPDR ETFs grow.
Nature, Extent and Quality of Services
The Board considered the nature, extent and quality of services provided by the Adviser. In doing so, the Trustees relied on their prior experience in overseeing the management of the Trust and materials provided prior to and at the meeting. The Board reviewed the Agreement and the Adviser’s responsibilities for managing investment operations of each of the SPDR ETFs in accordance with each SPDR ETF’s investment objectives and policies, and applicable legal and regulatory requirements. The Board appreciated the nature of the SPDR ETFs as exchange-traded funds and the experience and expertise of the Adviser with exchange-traded funds. The Board considered the background and experience of the Adviser’s senior management, including those individuals responsible for portfolio management, oversight of sub-advisers and regulatory compliance of the SPDR ETFs. The Board also considered the portfolio management resources, structures and practices of the Adviser, including those associated with monitoring and securing each SPDR ETF’s compliance with its investment objectives and policies and with
109
Table of Contents
SPDR INDEX SHARES FUNDS
OTHER INFORMATION (continued)
September 30, 2017 (Unaudited)
applicable laws and regulations. The Board also considered information about the Adviser’s best execution procedures and overall investment management business, noting that the Adviser serves a wide range of clients across a broad spectrum of asset classes. The Board looked at the Adviser’s general knowledge of the investment management business and that of its affiliates which make up State Street Global Advisors, through which the Adviser shares all of its senior personnel. The Board considered that the Adviser and its affiliates constitute one of the world’s largest investment management enterprises for indexed products generally and exchange-traded funds in particular. The Board specifically considered the Adviser’s experience in managing equity exchange-traded funds with index-based investment objectives and in overseeing third-party sub-advisers, as applicable.
Investment Performance
The Board then reviewed the Current ETFs’ performance, noting that the distinctive indexed investment objective of each of the Current ETFs made analysis of investment performance, in absolute terms, less of a priority than that which normally attaches to the performance of actively-managed funds. Instead, the Board focused on the extent to which each Current ETF achieved its objective as a passively-managed index fund. The Board reviewed information regarding the Current ETFs’ index tracking, noting that each Current ETF satisfactorily tracked its benchmark index.
Profits Realized by the Adviser
The Board considered the profitability of the advisory arrangement with the Current ETFs to the Adviser, including data on the Current ETFs’ historical profitability to the Adviser. The Independent Trustees, with their independent legal counsel, had the opportunity to discuss, with representatives of the Adviser and State Street, methodologies used in computing costs that formed the bases of profitability calculations and determined that these methodologies were reasonable.
Fees Charged to Comparable Funds
The Board evaluated each SPDR ETF’s unitary fee through review of comparative information with respect to fees paid by similar funds – i.e., exchange-traded funds tracking similar equity indexes. The Board reviewed the universe of similar exchange-traded funds for each SPDR ETF based upon data independently obtained from Broadridge Financial Solutions, Inc. (formerly Lipper Analytical Services) and related comparative information for similar exchange-traded funds. In doing so, the Board used a fund by fund analysis of the data.
110
Table of Contents
SPDR INDEX SHARES FUNDS
OTHER INFORMATION (continued)
September 30, 2017 (Unaudited)
Other Benefits
The Board also considered whether the Adviser or its affiliates benefited in other ways from its relationship with the Trust, noting that the Adviser does not maintain soft-dollar arrangements in connection with the Trust’s brokerage transactions.
Economies of Scale
The Board reviewed information regarding economies of scale or other efficiencies that may result as each SPDR ETF’s assets grow in size. The Board noted that the Agreement did not provide for breakpoints in each SPDR ETF’s advisory fee rates as assets of a SPDR ETF increase. However, the Board further noted the Adviser’s assertion that future economies of scale (among several factors) had been taken into consideration for the SPDR ETFs by fixing relatively low advisory fees, effectively sharing the benefits of lower fees with the SPDR ETFs from inception. The Adviser also asserted that one of the benefits of the unitary fee was to provide an unvarying expense structure, which could be lost or diluted with the addition of breakpoints. The Board noted that it intends to continue to monitor fees as the SPDR ETFs grow in size and assess whether fee breakpoints may be warranted.
Conclusion
The Board, including the Independent Trustees voting separately, approved the Agreement for each SPDR ETF after weighing the foregoing factors, none of which was dispositive in itself and may have been weighed differently by each Trustee. The Board’s conclusions with respect to the Agreement were as follows: (a) the nature and extent of the services provided by the Adviser with respect to the SPDR ETFs were appropriate; (b) the performance and, more importantly, the index tracking, of each Current ETF had been satisfactory; (c) the Adviser’s unitary fee for each SPDR ETF, considered in relation to services provided and in relation to fees charged to comparable funds, was fair and reasonable; (d) profitability of the Trust’s relationships with the Adviser was not excessive; (e) any additional potential benefits to the Adviser or its affiliates were not of a magnitude to materially affect the Board’s conclusions; and (f) fees paid to the Adviser adequately shared the economies of scale with respect to the Current ETFs by way of the relatively low fee structure of the Trust.
Approval of State Street Global Advisors Asia Limited Sub-Advisory Agreement
At an in-person meeting held prior to September 30, 2017, the Board also evaluated a proposal to continue the Sub-Advisory Agreement (the “SSGA Asia Limited Sub-Advisory Agreement”) between the Adviser and State Street Global Advisors Asia Limited (“SSGA Asia Limited”), an affiliate of the Adviser, with respect to the SPDR MSCI China A Shares IMI ETF (the “Fund”), which is sub-advised by SSGA Asia Limited. The Independent Trustees also met separately with their independent legal counsel to consider the SSGA Asia Limited Sub-Advisory Agreement.
111
Table of Contents
SPDR INDEX SHARES FUNDS
OTHER INFORMATION (continued)
September 30, 2017 (Unaudited)
In evaluating the SSGA Asia Limited Sub-Advisory Agreement, the Board drew on materials provided to them by SSGA Asia Limited and the Adviser. In deciding whether to approve the SSGA Asia Limited Sub-Advisory Agreement, the Board considered various factors, including the (i) nature, extent and quality of services provided by SSGA Asia Limited with respect to the Fund under the SSGA Asia Limited Sub-Advisory Agreement and (ii) investment performance of the Fund. The Board was informed of the portion of the current advisory fee that the Adviser would pay to SSGA Asia Limited under the SSGA Asia Limited Sub-Advisory Agreement and also considered that such fees would be paid directly by the Adviser and would not result in increased fees payable by the Fund.
The Board considered the background and experience of SSGA Asia Limited’s senior management and, in particular, SSGA Asia Limited’s experience in investing in Asian equity securities. The Board reviewed the Fund’s performance, noting that the Fund tracked its benchmark index. The Board also considered the unitary fee paid to the Adviser by the Fund and SSGA Asia Limited’s fees paid by the Adviser. The Board also considered whether SSGA Asia Limited benefited in other ways from its relationship with the Trust.
The Board, including the Independent Trustees voting separately, approved the SSGA Asia Limited Sub-Advisory Agreement for the Fund after weighing the foregoing factors as well as the relevant factors discussed in relation to the Agreement between the Trust and the Adviser, none of which was dispositive in itself and may have been weighed differently by each Trustee. The Board’s conclusions with respect to the SSGA Asia Limited Sub-Advisory Agreement were as follows: (a) the nature and extent of the services provided by SSGA Asia Limited with respect to the Fund were appropriate; (b) the performance and, more importantly, the index tracking, of the Fund had been satisfactory; (c) SSGA Asia Limited’s fees for the Fund and the unitary fee, considered in relation to the services provided, were fair and reasonable; (d) any additional potential benefits to SSGA Asia Limited were not of a magnitude to materially affect the Board’s conclusions; and (e) fees paid to SSGA Asia Limited adequately shared the economies of scale with the Fund by way of the relatively low fee structure of the Trust.
112
Table of Contents
SPDR INDEX SHARES FUNDS
OTHER INFORMATION (continued)
September 30, 2017 (Unaudited)
TRUSTEES AND OFFICERS
| Name, Address |
Position(s) with Funds |
Term of Office and Length of Time Served |
Principal Occupation(s) During Past 5 Years |
Number of Portfolios in Fund Complex Overseen by Trustee† |
Other Directorships Held by
Trustee Past 5 Years | |||||||
| Trustees |
||||||||||||
| Independent Trustees |
||||||||||||
| FRANK NESVET |
Independent Trustee, Chairman, Trustee Committee Chair | Term: Unlimited Served: since September 2000 | Retired. | 148 | None. | |||||||
| DAVID M. KELLY |
Independent Trustee | Term: Unlimited Served: since September 2000 | Retired. | 148 | Chicago Stock Exchange (Former Director, retired); Penson Worldwide Inc. (Former Director, retired). | |||||||
| BONNY EUGENIA BOATMAN |
Independent Trustee | Term: Unlimited Served: since April 2010 | Retired. | 148 | None. | |||||||
| DWIGHT D. CHURCHILL |
Independent Trustee | Term: Unlimited Served: since April 2010 | Self-employed consultant since 2010; CEO and President, CFA Institute (June 2014-January 2015). | 148 | Affiliated Managers Group, Inc. (Director). | |||||||
| CARL G. VERBONCOEUR |
Independent Trustee, Audit Committee Chair | Term: Unlimited Served: since April 2010 | Self-employed consultant since 2009. | 148 | The Motley Fool Funds Trust (Trustee). | |||||||
113
Table of Contents
SPDR INDEX SHARES FUNDS
OTHER INFORMATION (continued)
September 30, 2017 (Unaudited)
| Name, Address |
Position(s) with Funds |
Term of Office and Length of Time Served |
Principal Occupation(s) During Past 5 Years |
Number of Portfolios in Fund Complex Overseen by Trustee† |
Other Directorships Held by
Trustee Past 5 Years | |||||||
| Interested Trustee |
||||||||||||
| JAMES E. ROSS* |
Interested Trustee | Term: Unlimited Served as Trustee: since April 2010 | Chairman and Director, SSGA Funds Management, Inc. (2005-present); Executive Vice President, State Street Global Advisors (2006-present); Chief Executive Officer and Director, State Street Global Advisors Funds Distributors, LLC (May 2017- present); Director, State Street Global Markets, LLC (2013-April 2017); President, SSGA Funds Management, Inc. (2005-2012); Principal, State Street Global Advisors (2000 - 2005). | 234 | SSGA SPDR ETFs Europe I plc (Director) (November 2016- present); SSGA SPDR ETFs Europe II plc (Director) (November 2016- present). | |||||||
| † | For the purpose of determining the number of portfolios overseen by the Trustees, “Fund Complex” comprises registered investment companies for which SSGA Funds Management, Inc. serves as investment adviser. |
| * | Mr. Ross is an Interested Trustee because of his employment with the Adviser and ownership interest in an affiliate of the Adviser. Mr. Ross previously served as an Interested Trustee from November 2005 to December 2009. |
114
Table of Contents
SPDR INDEX SHARES FUNDS
OTHER INFORMATION (continued)
September 30, 2017 (Unaudited)
| Name, Address and Year of Birth |
Position(s) with Funds |
Term of Office and Length of Time Served |
Principal Occupation(s) During the Past 5 Years | |||||
| Officers |
||||||||
| ELLEN M. NEEDHAM |
President | Term: Unlimited Served: since October 2012 | President and Director, SSGA Funds Management, Inc. (2001 - present)*; Senior Managing Director, State Street Global Advisors (1992 - present)*; Director, State Street Global Advisors Funds Distributors, LLC (May 2017 - present). | |||||
| BRUCE S. ROSENBERG |
Treasurer | Term: Unlimited Served: since February 2016 | Managing Director, State Street Global Advisors and SSGA Funds Management, Inc. (July 2015 - present); Director, Credit Suisse (April 2008 - July 2015). | |||||
| ANN M. CARPENTER |
|
Vice President; Deputy Treasurer |
|
Term: Unlimited Served: since August 2012; Term: Unlimited Served: since April 2015 | Chief Operating Officer, SSGA Funds Management, Inc. (2005 - Present)*; Managing Director, State Street Global Advisors (2005 - present).* | |||
| MICHAEL P. RILEY |
|
Vice President |
|
Term: Unlimited Served: since February 2005 | Managing Director, State Street Global Advisors (2005 - present).* | |||
| JOSHUA A. WEINBERG |
|
Chief Legal Officer |
|
Term: Unlimited Served: since February 2015 | Managing Director and Managing Counsel, State Street Global Advisors (2011 - present); Clerk, SSGA Funds Management, Inc. (2013 - present); Associate, Financial Services Group, Dechert LLP (2006 - 2011). | |||
| JESSE D. HALLEE |
Secretary | Term: Unlimited Served: since August 2017 | Vice President and Managing Counsel, State Street Bank and Trust Company (2013 – present); Vice President and Counsel, Brown Brothers Harriman & Co. (2007- 2013).** | |||||
115
Table of Contents
SPDR INDEX SHARES FUNDS
OTHER INFORMATION (continued)
September 30, 2017 (Unaudited)
| Name, Address and Year of Birth |
Position(s) with Funds |
Term of Office and Length of Time Served |
Principal Occupation(s) During the Past 5 Years | |||
| CHAD C. HALLETT |
Deputy Treasurer |
Term: Unlimited Served: since February 2016 | Vice President, State Street Global Advisors and SSGA Funds Management, Inc. (November 2014 - present); Vice President, State Street Bank and Trust Company (2001 - November 2014).* | |||
| DARLENE ANDERSON-VASQUEZ |
Deputy Treasurer |
Term: Unlimited Served: since November 2016 | Managing Director, State Street Global Advisors and SSGA Funds Management, Inc. (May 2016 - present); Senior Vice President, John Hancock Investments (September 2007 - May 2016). | |||
| ARTHUR A. JENSEN |
Deputy Treasurer |
Term: Unlimited Served: Since August 2017 | Vice President at State Street Global Advisors (July 2016 – present); Mutual Funds Controller of GE Asset Management Incorporated (April 2011 - July 2016). | |||
| SUJATA UPRETI |
Assistant Treasurer |
Term: Unlimited Served: since February 2016 | Vice President, State Street Global Advisors and SSGA Funds Management, Inc. (May 2015 - present); Assistant Director, Cambridge Associates, LLC (July 2014 - January 2015); Vice President, Bank of New York Mellon (July 2012 - August 2013); Manager, PricewaterhouseCoopers, LLP (September 2003 - July 2012). | |||
| DANIEL FOLEY |
Assistant Treasurer |
Term: Unlimited Served: since February 2016 | Vice President, State Street Global Advisors and SSGA Funds Management, Inc. (April 2007 - present).* | |||
| DANIEL G. PLOURDE |
Assistant Treasurer |
Term: Unlimited Served: since May 2017 | Assistant Vice President, SSGA Funds Management, Inc. (May 2015 - present); Officer, State Street Bank and Trust Company (March 2009 - May 2015). | |||
116
Table of Contents
SPDR INDEX SHARES FUNDS
OTHER INFORMATION (continued)
September 30, 2017 (Unaudited)
| Name, Address and Year of Birth |
Position(s) with Funds |
Term of Office and Length of Time Served |
Principal Occupation(s) During the Past 5 Years | |||
| BRIAN HARRIS |
Chief Compliance Officer; Anti- Money Laundering Officer; Code of Ethics Compliance Officer |
Term: Unlimited Served: since November 2013 | Managing Director, State Street Global Advisors and SSGA Funds Management, Inc. (June 2013 - present)*; Senior Vice President and Global Head of Investment Compliance, BofA Global Capital Management (2010 - 2013). |
| * | Served in various capacities and/or with various affiliated entities during noted time period. |
| ** | Served in various capacities and/or with unaffiliated mutual funds or closed-end funds for which State Street Bank and Trust Company or its affiliates act as a provider of services during the noted time period. |
The Trust’s Statement of Additional Information (SAI) includes additional information about Funds’ directors and is available, without charge, upon request and by calling 1-866-787-2257.
117
Table of Contents
| SPDR® Index Shares Funds |
||
| SPDR Index Shares Funds |
||
| Trustees
Bonny E. Boatman Dwight D. Churchill David M. Kelly Frank Nesvet, Chairman James E. Ross Carl G. Verboncoeur
Investment Manager and Administrator
SSGA Funds Management, Inc. State Street Financial Center One Lincoln Street Boston, MA 02111
Distributor
State Street Global Advisors Funds Distributors, LLC One Lincoln Street Boston, MA 02111 |
Custodian, Sub-Administrator and Transfer Agent
State Street Bank and Trust Company One Lincoln Street Boston, MA 02111
Legal Counsel
Morgan, Lewis & Bockius LLP 1111 Pennsylvania Avenue, NW Washington, DC 20004
Independent Registered Public Accounting Firm
PricewaterhouseCoopers LLP 101 Seaport Boulevard Suite 500 Boston, MA 02210 | |
Fund Shares are distributed by State Street Global Advisors Funds Distributors, LLC, a wholly-owned subsidiary of State Street Corporation. State Street Global Advisors Funds Distributors, LLC; member FINRA, SIPC.
The information contained in this report is intended for the general information of shareholders of the Trust. This report is not authorized for distribution to prospective investors unless preceded or accompanied by a current Trust prospectus which contains important information concerning the Trust. You may obtain a current prospectus and SAI from the Distributor by calling 1-866-787-2257 or visiting www.spdrs.com. Please read the prospectus carefully before you invest.
Table of Contents
SPDR® Index Shares Funds
For more complete information, please call 866.787.2257 or visit spdrs.com today.
ssga.com | spdrs.com
The information contained in this report is intended for the general information of shareholders of the Trust. This report is not authorized for distribution to prospective investors unless preceded or accompanied by a current Trust prospectus which contains important information concerning the Trust. You may obtain a current prospectus and SAI from the Distributor by calling 1-866-787-2257 or visiting www.spdrs.com. Please read the prospectus carefully before you invest.
| State Street Global Advisors |
© 2017 State Street Corporation - All Rights Reserved | |
| IBG - 25741 |
0515 Exp. Date: 11/30/2018 SPDRISPTAR |
Table of Contents
Annual Report
September 30, 2017
SPDR® Index Shares Funds
SPDR Dow Jones Global Real Estate ETF
SPDR Dow Jones International Real Estate ETF
SPDR S&P North American Natural Resources ETF
The information contained in this report is intended for the general information of shareholders of the Trust. This report is not authorized for distribution to prospective investors unless preceded or accompanied by a current Trust prospectus which contains important information concerning the Trust. You may obtain a current prospectus and SAI from the Distributor by calling 1-866-787-2257 or visiting www.spdrs.com. Please read the prospectus carefully before you invest.

Table of Contents
| 1 | ||||
| 2 | ||||
| 5 | ||||
| 8 | ||||
| 11 | ||||
| 20 | ||||
| 27 | ||||
| 30 | ||||
| 37 | ||||
| 40 | ||||
| 53 | ||||
| 54 |
The information contained in this report is intended for the general information of shareholders of the Trust. This report is not authorized for distribution to prospective investors unless preceded or accompanied by a current Trust prospectus which contains important information concerning the Trust. You may obtain a current prospectus and SAI from the Distributor by calling 1-866-787-2257 or visiting www.spdrs.com. Please read the prospectus carefully before you invest.
Table of Contents

NOTES TO PERFORMANCE SUMMARY (UNAUDITED )
The performance chart of a Fund’s total return at net asset value (“NAV”), the total return based on market price and its benchmark index is provided for comparative purposes only and represents the periods noted. A Fund’s per share NAV is the value of one share of a Fund and is calculated by dividing the value of total assets less total liabilities by the number of shares outstanding. The NAV return is based on the NAV of a Fund and the market return is based on the market price per share of a Fund. The market price used to calculate the market return is determined by using the midpoint between the highest bid and the lowest offer on the exchange on which the shares of a Fund are listed for trading, as of the time that a Fund’s NAV is calculated. NAV and market returns assume that dividends and capital gain distributions have been reinvested in a Fund at NAV. Market returns do not include brokerage commissions that may be payable on secondary market transactions. If brokerage commissions were included market returns would be lower.
An index is a statistical measure of a specified financial market or sector. An index does not actually hold a portfolio of securities and therefore does not reflect deductions for fees or expenses. In comparison, a Fund’s performance is negatively impacted by these deductions. Index returns reflect all items of income, gain and loss and the reinvestment of dividends and other income.
The Dow Jones Global Select Real Estate Securities Index is a float-adjusted market capitalization index designed to measure the performance of publicly traded global real estate securities. The Dow Jones Global Select Real Estate Securities Index is a measure of the types of global real estate securities that represent the ownership and operation of commercial or residential real estate.
The Dow Jones Global ex-U.S. Select Real Estate Securities Index is a float-adjusted market capitalization index designed to measure the performance of publicly traded real estate securities in countries excluding the United States. The Dow Jones Global ex-U.S. Select Real Estate Securities Index is a measure of the type of global real estate securities that represent the ownership and operation of commercial or residential real estate.
The S&P BMI North American Natural Resources Index comprises publicly traded large- and mid-capitalization U.S. and Canadian companies in the natural resources and commodities businesses that meet certain investability requirements and are classified within the sub-industries of one of three natural resources categories: energy, metals & mining or agriculture.
1
Table of Contents
SPDR DOW JONES GLOBAL REAL ESTATE ETF
MANAGEMENT’S DISCUSSION OF FUND PERFORMANCE
(UNAUDITED )
The SPDR Dow Jones Global Real Estate ETF (the “Fund”) seeks to provide investment results that, before fees and expenses, correspond generally to the total return performance of an index based upon the global real estate market. The Fund’s benchmark is the Dow Jones Global Select Real Estate Securities Index (the “Index”).
For the 12-month period ended September 30, 2017 (the “Reporting Period”), the total return for the Fund was –0.55%, and the Index was –0.85%. The Fund and Index returns reflect the reinvestment of dividends and other income. The Fund’s performance reflects the expenses of managing the Fund, including brokerage and advisory expenses. The Index is unmanaged and Index returns do not reflect fees and expenses of any kind, which would have a negative impact on returns. Expenses, cash drag, and dividend tax withholdings contributed to the difference between the Fund’s performance and that of the Index.
Global real estate securities were affected by the general uncertainty surrounding the world during the Reporting Period. The Index had a slight negative return for the fiscal year and significantly lagged the MSCI World in all four quarters leading to an overall underperformance versus that index of over to 19%. The realization of the Brexit vote combined with contentious election campaigns in the United States, France and Germany, created an enormous amount of fear worldwide. This fear led to a less active than normal amount of corporate activity throughout the industry as REIT firms waited for the proverbial dust to settle around them. Given the events in Europe, currencies there weakened versus the strengthening U.S. dollar. The multiple Fed rate hikes in the U.S. during the period gave investors more options for income generation and real estate securities’ higher yield characteristics became less attractive. Mother Nature put a strain on REITs in the United States as Hurricanes Matthew, Harvey and Irma all brought various levels of destruction to the southern part of the country. Retail REITs were hurt the most during the fiscal year however, especially in regions such as the United States, Australia and Hong Kong, as there was a distinct shift from brick-and-mortar to online commerce. The period saw many stores close their doors for good including Bebe Stores, as well as prominent stores such as Macy’s, Sears, JC Penney, and Kohl’s closing many locations and focusing more on their online presence.
The Fund did not invest in derivatives during the Reporting Period.
On an individual security level, the top positive contributors to the Fund’s performance were Prologis, Inc., Digital Realty Trust, Inc. and Global Logistic Properties, Ltd. The top negative contributors to the Fund’s performance were General Growth Properties Inc., Kimco Realty Corp. and Simon Property Group, Inc.
The views expressed above reflect those of the Fund’s portfolio manager only through the Reporting Period, and do not necessarily represent the views of the Adviser as a whole. Any such views are subject to change at any time based upon market or other conditions and the Adviser disclaims any responsibility to update such views. These views may not be relied on as investment advice and, because investment decisions for a fund are based on numerous factors, may not be relied on as an indication of trading intent on behalf of any fund.
2
Table of Contents

SPDR DOW JONES GLOBAL REAL ESTATE ETF
PERFORMANCE SUMMARY (UNAUDITED)
Performance as of September 30, 2017
| Cumulative Total Return | Average Annual Total Return | |||||||||||||||||||||||||||||
| Net Asset Value |
Market Value |
Dow Jones Global Select Real Estate Securities Index |
Net Asset Value |
Market Value |
Dow Jones Global Select Real Estate Securities Index |
|||||||||||||||||||||||||
| ONE YEAR | –0.55 | % | –0.59 | % | –0.85 | % | –0.55 | % | –0.59 | % | –0.85 | % | ||||||||||||||||||
| FIVE YEARS | 39.79 | % | 40.11 | % | 38.35 | % | 6.93 | % | 6.98 | % | 6.71 | % | ||||||||||||||||||
| SINCE INCEPTION(1) | 40.77 | % | 41.07 | % | 37.23 | % | 3.70 | % | 3.73 | % | 3.42 | % | ||||||||||||||||||
| (1) | For the period May 7, 2008 to September 30, 2017. Since shares of the Fund did not trade in the secondary market until several days after the Fund’s inception, for the period from inception to the first day of secondary market trading in shares of the Fund (5/7/08, 5/13/08, respectively), the NAV of the Fund is used as a proxy for the secondary market trading price to calculate markets returns. |
Comparison of Change in Value of a $10,000 Investment
(Based on Net Asset Value)
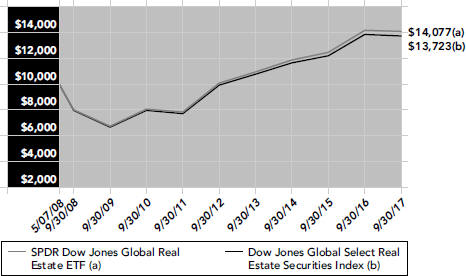
Line graph is based on cumulative total return.
The total expense ratio for SPDR Dow Jones Global Real Estate ETF as stated in the Fees and Expenses table of the prospectus dated January 31, 2017 (as supplemented October 16, 2017) is 0.50%.
Performance quoted represents past performance, which is no guarantee of future results. Investment return and principal value will fluctuate, so you may have a gain or loss when shares are sold. Current performance may be higher or lower than that quoted. Visit www.spdrs.com for most recent month-end performance. The returns do not reflect the deduction of taxes that a shareholder would pay on Fund distributions or on the redemption or sale of Fund shares. See Notes to Performance Summary on page 1 for more information.
3
Table of Contents

SPDR DOW JONES GLOBAL REAL ESTATE ETF
PORTFOLIO STATISTICS (UNAUDITED)
Top Ten Holdings as of September 30, 2017
| Description |
% of Net Assets |
|||||||
| Simon Property Group, Inc. REIT |
4.5 | % | ||||||
| Prologis, Inc. REIT |
3.1 | |||||||
| Public Storage REIT |
2.9 | |||||||
| Welltower, Inc. REIT |
2.4 | |||||||
| AvalonBay Communities, Inc. REIT |
2.2 | |||||||
| Digital Realty Trust, Inc. REIT |
2.2 | |||||||
| Equity Residential REIT |
2.2 | |||||||
| Unibail-Rodamco SE REIT |
2.2 | |||||||
| Ventas, Inc. REIT |
2.1 | |||||||
| Mitsui Fudosan Co., Ltd. |
1.9 | |||||||
| TOTAL |
25.7 | % | ||||||
(The ten largest holdings are subject to change, and there are no guarantees the Fund will continue to remain invested in any particular company.)
Industry Breakdown as of September 30, 2017
|
% of Net Assets |
||||||||
| Real Estate Investment Trusts (REITs) |
88.6 | % | ||||||
| Real Estate Management & Development |
10.9 | |||||||
| Diversified Financial Services |
0.0 | * | ||||||
| Short-Term Investments |
1.0 | |||||||
| Liabilities in Excess of Other Assets |
(0.5 | ) | ||||||
| TOTAL |
100.0 | % | ||||||
| * | Amount shown represents less than 0.05% of net assets. |
(The Fund’s industry breakdown is expressed as a percentage of net assets and may change over time.)
4
Table of Contents
SPDR DOW JONES INTERNATIONAL REAL ESTATE ETF
MANAGEMENT’S DISCUSSION OF FUND PERFORMANCE
(UNAUDITED )
The SPDR Dow Jones International Real Estate ETF (the “Fund”) seeks to provide investment results, before fees and expenses, correspond generally to the total return performance of an index based upon the international real estate market. The Fund’s benchmark is the Dow Jones Global ex-U.S. Select Real Estate Securities Index (the “Index”).
For the 12-month period ended September 30, 2017 (the “Reporting Period”), the total return for the Fund was 0.48%, and the Index was 0.83%. The Fund and Index returns reflect the reinvestment of dividends and other income. The Fund’s performance reflects the expenses of managing the Fund, including brokerage and advisory expenses. The Index is unmanaged and Index returns do not reflect fees and expenses of any kind, which would have a negative impact on returns. Expenses, cash drag, and dividend tax withholdings contributed to the difference between the Fund’s performance and that of the Index.
Global real estate securities were affected by the general uncertainty surrounding the world during the period. The Index had a modest gain for the fiscal year, but significantly lagged the MSCI World ex USA Index in all four quarters leading to an overall underperformance versus that index of close to 18%. The realization of the Brexit vote combined with contentious election campaigns in the United States, France and Germany, created an enormous amount of fear worldwide. This fear led to a less active than normal amount of corporate activity throughout the industry as REIT firms waited for the proverbial dust to settle around them. Given the events in Europe, currencies there weakened versus the strengthening U.S. dollar. The multiple Fed rate hikes in the U.S. during the period gave investors more options for income generation and real estate securities’ higher yield characteristics became less attractive. Retail REITs were hurt the most during the fiscal year, especially in regions such as Australia and Hong Kong, as there was a distinct shift from brick-and-mortar to online commerce.
The Fund did not invest in derivatives during the Reporting Period.
On an individual security level, the top positive contributors to the Fund’s performance were Global Logistic Properties, Ltd., Link Real Estate Investment Trust, and LEG Immobilien AG. The top negative contributors to the Fund’s performance were Nippon Building Fund, Inc., Scentre Group, and Westfield Corp.
The views expressed above reflect those of the Fund’s portfolio manager only through the Reporting Period, and do not necessarily represent the views of the Adviser as a whole. Any such views are subject to change at any time based upon market or other conditions and the Adviser disclaims any responsibility to update such views. These views may not be relied on as investment advice and, because investment decisions for a fund are based on numerous factors, may not be relied on as an indication of trading intent on behalf of any fund.
5
Table of Contents
SPDR DOW JONES INTERNATIONAL REAL ESTATE ETF
PERFORMANCE SUMMARY (UNAUDITED )
Performance as of September 30, 2017
| Cumulative Total Return | Average Annual Total Return | |||||||||||||||||||||||||||||
| Net Asset Value |
Market Value |
Dow Jones Global ex-U.S. Select Real Estate Securities Index |
Net Asset Value |
Market Value |
Dow Jones Global ex-U.S. Select Real Estate Securities Index |
|||||||||||||||||||||||||
| ONE YEAR | 0.48 | % | 0.36 | % | 0.83 | % | 0.48 | % | 0.36 | % | 0.83 | % | ||||||||||||||||||
| FIVE YEARS | 25.61 | % | 25.93 | % | 27.64 | % | 4.67 | % | 4.72 | % | 5.00 | % | ||||||||||||||||||
| TEN YEARS | 0.06 | % | –0.21 | % | 3.37 | % | 0.01 | % | –0.02 | % | 0.33 | % | ||||||||||||||||||
Comparison of Change in Value of a $10,000 Investment (Based on Net Asset Value)
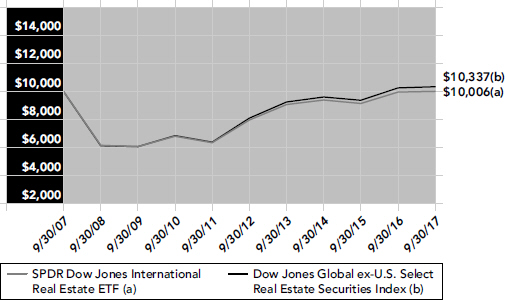
Line graph is based on cumulative total return.
The total expense ratio for SPDR Dow Jones International Real Estate ETF as stated in the Fees and Expenses table of the prospectus dated January 31, 2017 (as supplemented October 16, 2017) is 0.59%.
Performance quoted represents past performance, which is no guarantee of future results. Investment return and principal value will fluctuate, so you may have a gain or loss when shares are sold. Current performance may be higher or lower than that quoted. Visit www.spdrs.com for most recent month-end performance. The returns do not reflect the deduction of taxes that a shareholder would pay on Fund distributions or on the redemption or sale of Fund shares. See “Notes to Performance Summary” on page 1 for more information.
6
Table of Contents
SPDR DOW JONES INTERNATIONAL REAL ESTATE ETF
PORTFOLIO STATISTICS (UNAUDITED )
Top Ten Holdings as of September 30, 2017
| Description |
% of Net Assets |
|||||||
| Unibail-Rodamco SE REIT |
5.5 | % | ||||||
| Mitsui Fudosan Co., Ltd. |
4.9 | |||||||
| Link REIT |
4.1 | |||||||
| Scentre Group REIT |
3.7 | |||||||
| Westfield Corp. REIT |
2.7 | |||||||
| Goodman Group REIT |
2.3 | |||||||
| Land Securities Group PLC REIT |
2.2 | |||||||
| Hongkong Land Holdings, Ltd. |
1.9 | |||||||
| British Land Co. PLC REIT |
1.9 | |||||||
| Klepierre SA REIT |
1.8 | |||||||
| TOTAL |
31.0 | % | ||||||
(The ten largest holdings are subject to change, and there are no guarantees the Fund will continue to remain invested in any particular company.)
Industry Breakdown as of September 30, 2017
|
% of Net Assets |
||||||||
| Real Estate Investment Trusts (REITs) |
72.1 | % | ||||||
| Real Estate Management & Development |
27.3 | |||||||
| Diversified Financial Services |
0.0 | * | ||||||
| Short-Term Investments |
1.8 | |||||||
| Liabilities in Excess of Other Assets |
(1.2 | ) | ||||||
| TOTAL |
100.0 | % | ||||||
| * | Amount shown represents less than 0.05% of net assets. |
| (The Fund’s industry breakdown is expressed as a percentage of net assets and may change over time.) |
7
Table of Contents
SPDR S&P NORTH AMERICAN NATURAL RESOURCES ETF
MANAGEMENT’S DISCUSSION OF FUND PERFORMANCE
(UNAUDITED )
The SPDR S&P North American Natural Resources ETF (the “Fund”) seeks to provide investment results that, before fees and expenses, correspond generally to the total return performance of an index that tracks publicly-traded North American companies in natural resources and/or commodities businesses. The Fund’s benchmark is the S&P BMI North American Natural Resources Index (the “Index”).
For the 12-month period ended September 30, 2017 (the “Reporting Period”), the total return for the Fund was 3.74%, and the Index was 3.67%. The Fund and Index returns reflect the reinvestment of dividends and other income. The Fund’s performance reflects the expenses of managing the Fund, including brokerage and advisory expenses. The Index is unmanaged and Index returns do not reflect fees and expenses of any kind, which would have a negative impact on returns. Fund expenses, a slight cash drag, security misweights and differences in tax withholdings contributed to the difference between the Fund’s performance and that of the Index.
The Fund ended the Reporting Period with slight positive performance, but lagged the broader equity markets. The U.S. Presidential election late last year spurred equities on a significant run as hopeful investors looked ahead to the positive economic growth the new president and his administration would bring. Despite a number of geopolitical events, precious metals were not utilized as the safe haven investment it often is when there are global concerns. Precious metals mining companies struggled in an environment where prices traded largely sideways. There were some bright spots however as oil and energy companies are now reaping some of the benefits of their multi-year plans to cut costs and operate profitably in a lower oil price environment. Additionally, copper prices have continued to rally on expectations of further signs of a health economic outlook for China allowing copper mining companies to benefit.
The Fund did not invest in derivatives during the Reporting Period.
On an individual security level, the top positive contributors to the Fund’s performance were Chevron Corp., Freeport-McMoRan, Inc., and Monsanto Co. The top negative contributors to the Fund’s performance were Agnico-Eagle Mines, Ltd., Goldcorp, Inc., and Silver Wheaton Corp.
The views expressed above reflect those of the Fund’s portfolio manager only through the Reporting Period, and do not necessarily represent the views of the Adviser as a whole. Any such views are subject to change at any time based upon market or other conditions and the Adviser disclaims any responsibility to update such views. These views may not be relied on as investment advice and, because investment decisions for a fund are based on numerous factors, may not be relied on as an indication of trading intent on behalf of any fund.
8
Table of Contents
SPDR S&P NORTH AMERICAN NATURAL RESOURCES ETF
PERFORMANCE SUMMARY (UNAUDITED)
Performance as of September 30, 2017
| Cumulative Total Return | Average Annual Total Return | |||||||||||||||||||||||||||||
| Net Asset Value |
Market Value |
S&P BMI North American Natural Resources Index |
Net Asset Value |
Market Value |
S&P BMI North American Natural Resources Index |
|||||||||||||||||||||||||
| ONE YEAR | 3.74 | % | 3.70 | % | 3.67 | % | 3.74 | % | 3.70 | % | 3.67 | % | ||||||||||||||||||
| SINCE INCEPTION(1) | 42.34 | % | 42.46 | % | 42.35 | % | 21.71 | % | 21.76 | % | 21.77 | % | ||||||||||||||||||
| (1) | For the period ended December 15, 2015 to September 30, 2017. Since shares of the Fund did not trade in the secondary market until the day after the Fund’s inception, for the period from inception to the first day of secondary market trading in shares of the Fund (12/15/15, 12/16/15, respectively), the NAV of the Fund is used as a proxy for the secondary market trading price to calculate market returns. |
Comparison of Change in Value of a $10,000 Investment
(Based on Net Asset Value)
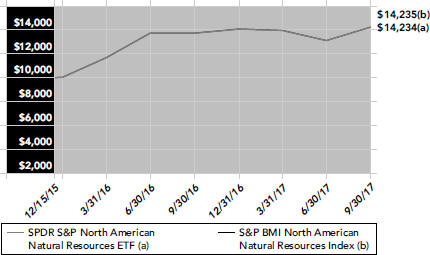
Line graph is based on cumulative total return.
The total expense ratio for SPDR S&P North American Natural Resources ETF as stated in the Fees and Expenses table of the prospectus dated January 31, 2017 (as supplemented October 16, 2017) is 0.35%.
Performance quoted represents past performance, which is no guarantee of future results. Investment return and principal value will fluctuate, so you may have a gain or loss when shares are sold. Current performance may be higher or lower than that quoted. Visit www.spdrs.com for most recent month-end performance. The returns do not reflect the deduction of taxes that a shareholder would pay on Fund distributions or on the redemption or sale of Fund shares. See “Notes to Performance Summary” on page 1 for more information.
9
Table of Contents
SPDR S&P NORTH AMERICAN NATURAL RESOURCES ETF
PORTFOLIO STATISTICS (UNAUDITED)
Top Ten Holdings as of September 30, 2017
| Description |
% of Net Assets |
|||||||
| Chevron Corp. |
10.5 | % | ||||||
| Exxon Mobil Corp. |
10.1 | |||||||
| Monsanto Co. |
6.6 | |||||||
| Newmont Mining Corp. |
4.7 | |||||||
| Barrick Gold Corp. |
4.4 | |||||||
| Freeport-McMoRan, Inc. |
4.4 | |||||||
| Franco-Nevada Corp. |
3.3 | |||||||
| ConocoPhillips |
3.2 | |||||||
| Archer-Daniels-Midland Co. |
3.0 | |||||||
| Suncor Energy, Inc. |
3.0 | |||||||
| TOTAL |
53.2 | % | ||||||
(The ten largest holdings are subject to change, and there are no guarantees the Fund will continue to remain invested in any particular company.)
Industry Breakdown as of September 30, 2017
|
% of Net Assets |
||||||||
| Oil, Gas & Consumable Fuels |
47.7 | % | ||||||
| Metals & Mining |
32.1 | |||||||
| Chemicals |
13.9 | |||||||
| Food Products |
5.3 | |||||||
| Paper & Forest Products |
0.5 | |||||||
| Short-Term Investments |
0.8 | |||||||
| Liabilities in Excess of Other Assets |
(0.3 | ) | ||||||
| TOTAL |
100.0 | % | ||||||
(The Fund’s industry breakdown is expressed as a percentage of net assets and may change over time.)
10
Table of Contents
SPDR Dow Jones Global Real Estate ETF
SCHEDULE OF INVESTMENTS
September 30, 2017
| Security Description |
Shares | Value | ||||||
| COMMON STOCKS — 99.5% |
||||||||
| AUSTRALIA — 5.8% |
||||||||
| BGP Holdings PLC (a) |
1,313,937 | $ | 20,619 | |||||
| BWP Trust REIT |
1,165,867 | 2,698,652 | ||||||
| Charter Hall Retail REIT |
798,538 | 2,474,962 | ||||||
| Dexus Property Group REIT |
2,454,195 | 18,293,993 | ||||||
| Goodman Group REIT |
3,874,318 | 25,049,457 | ||||||
| GPT Group REIT |
4,364,419 | 16,985,719 | ||||||
| Investa Office Fund REIT |
1,203,799 | 4,250,522 | ||||||
| Scentre Group REIT |
12,958,576 | 39,960,017 | ||||||
| Vicinity Centres REIT |
7,944,225 | 16,580,935 | ||||||
| Westfield Corp. REIT |
4,651,332 | 28,613,385 | ||||||
|
|
|
|||||||
| 154,928,261 | ||||||||
|
|
|
|||||||
| AUSTRIA — 0.4% |
||||||||
| CA Immobilien Anlagen AG |
177,848 | 5,109,119 | ||||||
| IMMOFINANZ AG (b) (c) |
2,220,061 | 5,732,027 | ||||||
|
|
|
|||||||
| 10,841,146 | ||||||||
|
|
|
|||||||
| BELGIUM — 0.2% |
||||||||
| Cofinimmo SA REIT |
47,601 | 6,114,156 | ||||||
|
|
|
|||||||
| BRAZIL — 0.3% |
||||||||
| BR Malls Participacoes SA |
2,115,921 | 9,411,823 | ||||||
|
|
|
|||||||
| CANADA — 1.3% |
||||||||
| Artis Real Estate Investment Trust |
184,178 | 1,946,854 | ||||||
| Boardwalk Real Estate Investment Trust |
54,212 | 1,647,622 | ||||||
| Canadian Apartment Properties REIT |
161,753 | 4,362,474 | ||||||
| Canadian Real Estate Investment Trust |
86,782 | 3,200,938 | ||||||
| Dream Office Real Estate Investment Trust |
93,085 | 1,565,248 | ||||||
| First Capital Realty, Inc. (c) |
396,738 | 6,242,997 | ||||||
| H&R Real Estate Investment Trust |
343,026 | 5,907,952 | ||||||
| RioCan Real Estate Investment Trust |
389,321 | 7,449,288 | ||||||
| Smart Real Estate Investment Trust REIT |
154,910 | 3,646,544 | ||||||
|
|
|
|||||||
| 35,969,917 | ||||||||
|
|
|
|||||||
| FRANCE — 4.2% |
||||||||
| Fonciere Des Regions REIT |
129,198 | 13,424,125 | ||||||
| Gecina SA REIT |
112,101 | 18,182,531 | ||||||
| Klepierre SA REIT |
504,621 | 19,811,845 | ||||||
See accompanying notes to financial statements.
11
Table of Contents
SPDR Dow Jones Global Real Estate ETF
SCHEDULE OF INVESTMENTS (continued)
September 30, 2017
| Security Description |
Shares | Value | ||||||
| Mercialys SA REIT (c) |
133,726 | $ | 2,671,735 | |||||
| Unibail-Rodamco SE REIT |
241,771 | 58,807,779 | ||||||
|
|
|
|||||||
| 112,898,015 | ||||||||
|
|
|
|||||||
| GERMANY — 0.7% |
||||||||
| Deutsche EuroShop AG |
117,997 | 4,426,208 | ||||||
| LEG Immobilien AG |
152,604 | 15,441,151 | ||||||
|
|
|
|||||||
| 19,867,359 | ||||||||
|
|
|
|||||||
| HONG KONG — 3.2% |
||||||||
| Champion REIT |
4,917,462 | 3,393,437 | ||||||
| Hang Lung Properties, Ltd. |
4,918,018 | 11,673,737 | ||||||
| Hongkong Land Holdings, Ltd. |
2,861,300 | 20,601,360 | ||||||
| Hysan Development Co., Ltd. |
1,241,731 | 5,842,449 | ||||||
| Link REIT |
5,390,182 | 43,683,475 | ||||||
|
|
|
|||||||
| 85,194,458 | ||||||||
|
|
|
|||||||
| ITALY — 0.1% |
||||||||
| Beni Stabili SpA SIIQ |
2,453,082 | 2,128,623 | ||||||
|
|
|
|||||||
| JAPAN — 10.4% |
||||||||
| Activia Properties, Inc. REIT |
1,622 | 6,729,214 | ||||||
| Advance Residence Investment Corp. |
3,277 | 8,058,221 | ||||||
| Aeon Mall Co., Ltd. |
276,900 | 4,927,204 | ||||||
| AEON REIT Investment Corp. |
3,320 | 3,359,375 | ||||||
| Daiwa House REIT Investment Corp. |
3,715 | 8,891,050 | ||||||
| Daiwa Office Investment Corp. |
747 | 3,736,161 | ||||||
| Frontier Real Estate Investment Corp. |
1,202 | 4,874,632 | ||||||
| Fukuoka Corp. REIT |
1,810 | 2,575,952 | ||||||
| GLP J - REIT |
6,957 | 7,249,643 | ||||||
| Heiwa Real Estate Co., Ltd. |
79,400 | 1,352,195 | ||||||
| Hoshino Resorts REIT, Inc. (c) |
411 | 2,044,685 | ||||||
| Hulic Co., Ltd. |
1,176,000 | 11,523,369 | ||||||
| Hulic, Inc. REIT |
2,247 | 3,313,659 | ||||||
| Industrial & Infrastructure Fund Investment Corp. REIT |
981 | 4,157,038 | ||||||
| Invincible Investment Corp. REIT (c) |
7,835 | 3,233,116 | ||||||
| Japan Excellent, Inc. |
3,158 | 3,750,940 | ||||||
| Japan Hotel REIT Investment Corp. |
9,783 | 6,179,286 | ||||||
| Japan Prime Realty Investment Corp. REIT |
2,240 | 7,482,255 | ||||||
| Japan Real Estate Investment Corp. REIT |
3,183 | 15,297,855 | ||||||
| Japan Rental Housing Investments, Inc. |
3,977 | 2,805,257 | ||||||
| Japan Retail Fund Investment Corp. REIT |
6,480 | 11,622,725 | ||||||
| Kenedix Office Investment Corp. REIT |
987 | 5,427,557 | ||||||
| Kenedix Residential Investment Corp. |
872 | 2,241,102 | ||||||
| Kenedix Retail REIT Corp. |
1,225 | 2,544,352 | ||||||
| Leopalace21 Corp. |
637,800 | 4,442,191 | ||||||
See accompanying notes to financial statements.
12
Table of Contents
SPDR Dow Jones Global Real Estate ETF
SCHEDULE OF INVESTMENTS (continued)
September 30, 2017
| Security Description |
Shares | Value | ||||||
| MCUBS MidCity Investment Corp. |
674 | $ | 2,053,765 | |||||
| Mitsui Fudosan Co., Ltd. |
2,413,300 | 52,311,571 | ||||||
| Mori Hills Investment Corp. REIT |
3,531 | 4,231,616 | ||||||
| Mori Trust Sogo REIT, Inc. |
2,330 | 3,485,737 | ||||||
| Nippon Building Fund, Inc. REIT |
3,434 | 17,114,325 | ||||||
| Nippon Prologis REIT, Inc. |
4,980 | 10,489,566 | ||||||
| Nomura Real Estate Master Fund, Inc. |
10,166 | 13,212,684 | ||||||
| NTT Urban Development Corp. |
261,700 | 2,603,864 | ||||||
| Orix JREIT, Inc. REIT |
6,508 | 9,337,201 | ||||||
| Premier Investment Corp. |
3,180 | 3,017,137 | ||||||
| Tokyu Fudosan Holdings Corp. |
1,250,200 | 7,541,294 | ||||||
| Tokyu REIT, Inc. |
2,371 | 2,887,790 | ||||||
| United Urban Investment Corp. REIT |
7,422 | 10,866,127 | ||||||
| Unizo Holdings Co., Ltd. |
54,400 | 1,260,868 | ||||||
|
|
|
|||||||
| 278,232,579 | ||||||||
|
|
|
|||||||
| MEXICO — 0.4% |
||||||||
| Fibra Uno Administracion SA de CV REIT |
6,631,002 | 11,217,665 | ||||||
|
|
|
|||||||
| NETHERLANDS — 0.4% |
||||||||
| Eurocommercial Properties NV |
119,016 | 5,090,549 | ||||||
| Wereldhave NV |
98,012 | 4,623,782 | ||||||
|
|
|
|||||||
| 9,714,331 | ||||||||
|
|
|
|||||||
| PHILIPPINES — 0.7% |
||||||||
| SM Prime Holdings, Inc. |
28,232,000 | 19,145,708 | ||||||
|
|
|
|||||||
| SINGAPORE — 3.0% |
||||||||
| Ascendas REIT |
5,831,720 | 11,423,377 | ||||||
| CapitaLand Commercial Trust |
5,390,573 | 6,569,755 | ||||||
| CapitaLand Mall Trust REIT |
6,545,504 | 9,640,272 | ||||||
| CapitaLand, Ltd. |
6,196,551 | 16,336,133 | ||||||
| Global Logistic Properties, Ltd. |
7,180,192 | 17,448,826 | ||||||
| Keppel REIT |
4,366,412 | 3,794,224 | ||||||
| Mapletree Commercial Trust REIT |
4,601,700 | 5,150,841 | ||||||
| Mapletree Logistics Trust |
3,625,521 | 3,310,612 | ||||||
| Suntec Real Estate Investment Trust |
5,400,395 | 7,416,869 | ||||||
|
|
|
|||||||
| 81,090,909 | ||||||||
|
|
|
|||||||
| SOUTH AFRICA — 1.0% |
||||||||
| Growthpoint Properties, Ltd. REIT (c) |
6,393,076 | 11,505,406 | ||||||
| Hyprop Investments, Ltd. |
601,925 | 4,712,869 | ||||||
| Redefine Properties, Ltd. REIT |
12,901,186 | 10,213,937 | ||||||
|
|
|
|||||||
| 26,432,212 | ||||||||
|
|
|
|||||||
| SPAIN — 0.7% |
||||||||
| Inmobiliaria Colonial Socimi SA REIT |
781,105 | 7,751,203 | ||||||
See accompanying notes to financial statements.
13
Table of Contents
SPDR Dow Jones Global Real Estate ETF
SCHEDULE OF INVESTMENTS (continued)
September 30, 2017
| Security Description |
Shares | Value | ||||||
| Martinsa Fadesa SA (a) (b) |
178 | $ | — | |||||
| Merlin Properties Socimi SA |
810,366 | 11,227,926 | ||||||
|
|
|
|||||||
| 18,979,129 | ||||||||
|
|
|
|||||||
| SWEDEN — 0.8% |
||||||||
| Castellum AB |
663,656 | 10,391,031 | ||||||
| Fabege AB |
342,677 | 7,011,101 | ||||||
| Kungsleden AB |
453,425 | 3,113,622 | ||||||
|
|
|
|||||||
| 20,515,754 | ||||||||
|
|
|
|||||||
| SWITZERLAND — 0.9% |
||||||||
| PSP Swiss Property AG |
98,011 | 9,035,326 | ||||||
| Swiss Prime Site AG |
173,783 | 15,634,363 | ||||||
|
|
|
|||||||
| 24,669,689 | ||||||||
|
|
|
|||||||
| THAILAND — 0.3% |
||||||||
| Central Pattana PCL NVDR |
3,343,700 | 7,820,348 | ||||||
|
|
|
|||||||
| UNITED KINGDOM — 4.8% |
||||||||
| Big Yellow Group PLC REIT |
358,784 | 3,643,914 | ||||||
| British Land Co. PLC REIT |
2,515,232 | 20,314,854 | ||||||
| Capital & Counties Properties PLC (c) |
1,834,519 | 6,515,014 | ||||||
| Derwent London PLC |
269,144 | 10,089,050 | ||||||
| Grainger PLC |
1,006,076 | 3,620,168 | ||||||
| Great Portland Estates PLC REIT |
796,254 | 6,527,276 | ||||||
| Hammerson PLC REIT |
1,927,996 | 13,890,554 | ||||||
| Intu Properties PLC REIT (c) |
2,120,234 | 6,556,829 | ||||||
| Land Securities Group PLC REIT |
1,821,725 | 23,769,033 | ||||||
| Segro PLC REIT |
2,417,532 | 17,385,060 | ||||||
| Shaftesbury PLC |
539,293 | 7,351,190 | ||||||
| UNITE Group PLC REIT |
583,232 | 5,379,640 | ||||||
| Workspace Group PLC REIT |
287,838 | 3,427,328 | ||||||
|
|
|
|||||||
| 128,469,910 | ||||||||
|
|
|
|||||||
| UNITED STATES — 59.9% |
||||||||
| Acadia Realty Trust REIT |
202,853 | 5,805,653 | ||||||
| Alexandria Real Estate Equities, Inc. REIT |
227,826 | 27,104,459 | ||||||
| American Assets Trust, Inc. REIT |
100,263 | 3,987,460 | ||||||
| American Campus Communities, Inc. REIT |
329,694 | 14,555,990 | ||||||
| American Homes 4 Rent Class A, REIT |
555,308 | 12,055,737 | ||||||
| Apartment Investment & Management Co. Class A, REIT |
381,834 | 16,747,239 | ||||||
| Apple Hospitality REIT, Inc. |
509,152 | 9,628,064 | ||||||
| Ashford Hospitality Prime, Inc. REIT |
81,960 | 778,620 | ||||||
| Ashford Hospitality Trust, Inc. REIT |
204,611 | 1,364,755 | ||||||
| AvalonBay Communities, Inc. REIT |
336,104 | 59,967,676 | ||||||
| Boston Properties, Inc. REIT |
375,583 | 46,151,639 | ||||||
See accompanying notes to financial statements.
14
Table of Contents
SPDR Dow Jones Global Real Estate ETF
SCHEDULE OF INVESTMENTS (continued)
September 30, 2017
| Security Description |
Shares | Value | ||||||
| Brandywine Realty Trust REIT |
427,566 | $ | 7,478,129 | |||||
| Brixmor Property Group, Inc. REIT |
741,172 | 13,934,034 | ||||||
| Camden Property Trust REIT |
224,557 | 20,535,738 | ||||||
| CBL & Associates Properties, Inc. REIT (c) |
413,458 | 3,468,913 | ||||||
| Cedar Realty Trust, Inc. REIT |
185,481 | 1,042,403 | ||||||
| Chesapeake Lodging Trust REIT |
145,327 | 3,919,469 | ||||||
| Columbia Property Trust, Inc. REIT |
293,959 | 6,399,487 | ||||||
| Corporate Office Properties Trust REIT |
241,397 | 7,925,064 | ||||||
| Cousins Properties, Inc. REIT |
1,019,938 | 9,526,221 | ||||||
| CubeSmart REIT |
437,735 | 11,363,601 | ||||||
| DCT Industrial Trust, Inc. REIT |
226,509 | 13,119,401 | ||||||
| DDR Corp. REIT |
740,728 | 6,785,068 | ||||||
| DiamondRock Hospitality Co. REIT |
487,717 | 5,340,501 | ||||||
| Digital Realty Trust, Inc. REIT |
498,376 | 58,972,832 | ||||||
| Douglas Emmett, Inc. REIT |
372,211 | 14,672,558 | ||||||
| Duke Realty Corp. REIT |
865,475 | 24,942,989 | ||||||
| Easterly Government Properties, Inc. REIT (c) |
93,411 | 1,930,805 | ||||||
| EastGroup Properties, Inc. REIT |
83,845 | 7,388,421 | ||||||
| Education Realty Trust, Inc. REIT |
178,375 | 6,409,014 | ||||||
| Equity Commonwealth REIT (b) |
301,289 | 9,159,186 | ||||||
| Equity LifeStyle Properties, Inc. REIT |
211,539 | 17,997,738 | ||||||
| Equity Residential REIT |
894,141 | 58,950,716 | ||||||
| Essex Property Trust, Inc. REIT |
160,654 | 40,810,936 | ||||||
| Extra Space Storage, Inc. REIT |
306,346 | 24,483,172 | ||||||
| Federal Realty Investment Trust REIT |
175,735 | 21,828,044 | ||||||
| First Industrial Realty Trust, Inc. REIT |
289,665 | 8,716,020 | ||||||
| First Potomac Realty Trust REIT |
143,791 | 1,601,832 | ||||||
| Forest City Realty Trust, Inc. Class A, REIT |
648,516 | 16,543,643 | ||||||
| Franklin Street Properties Corp. REIT |
258,469 | 2,744,941 | ||||||
| GGP, Inc. REIT |
1,523,901 | 31,651,424 | ||||||
| HCP, Inc. REIT |
1,141,177 | 31,758,956 | ||||||
| Healthcare Realty Trust, Inc. REIT |
300,709 | 9,724,929 | ||||||
| Hersha Hospitality Trust REIT |
94,305 | 1,760,674 | ||||||
| Highwoods Properties, Inc. REIT |
251,386 | 13,094,697 | ||||||
| Hospitality Properties Trust REIT |
399,087 | 11,369,989 | ||||||
| Host Hotels & Resorts, Inc. REIT |
1,800,853 | 33,297,772 | ||||||
| Hudson Pacific Properties, Inc. REIT |
377,412 | 12,654,624 | ||||||
| Independence Realty Trust, Inc. REIT |
198,349 | 2,017,209 | ||||||
| Invitation Homes, Inc. REIT (c) |
188,617 | 4,272,175 | ||||||
| JBG SMITH Properties REIT (b) |
226,629 | 7,752,978 | ||||||
| Kilroy Realty Corp. REIT |
239,130 | 17,006,926 | ||||||
| Kimco Realty Corp. REIT |
1,035,255 | 20,239,235 | ||||||
| Kite Realty Group Trust REIT |
205,249 | 4,156,292 | ||||||
| LaSalle Hotel Properties REIT |
274,807 | 7,974,899 | ||||||
See accompanying notes to financial statements.
15
Table of Contents
SPDR Dow Jones Global Real Estate ETF
SCHEDULE OF INVESTMENTS (continued)
September 30, 2017
| Security Description |
Shares | Value | ||||||
| Liberty Property Trust REIT |
358,162 | $ | 14,706,132 | |||||
| Life Storage, Inc. REIT (c) |
113,083 | 9,251,320 | ||||||
| LTC Properties, Inc. REIT |
96,251 | 4,521,872 | ||||||
| Macerich Co. REIT |
264,689 | 14,549,954 | ||||||
| Mack-Cali Realty Corp. REIT |
218,891 | 5,189,906 | ||||||
| Mid-America Apartment Communities, Inc. REIT |
276,445 | 29,546,442 | ||||||
| National Storage Affiliates Trust REIT (c) |
107,423 | 2,603,934 | ||||||
| NexPoint Residential Trust, Inc. REIT |
46,628 | 1,106,482 | ||||||
| NorthStar Realty Europe Corp. REIT |
134,844 | 1,727,352 | ||||||
| Paramount Group, Inc. REIT |
492,612 | 7,881,792 | ||||||
| Park Hotels & Resorts, Inc. REIT |
349,487 | 9,631,862 | ||||||
| Parkway, Inc. REIT |
103,193 | 2,376,535 | ||||||
| Pebblebrook Hotel Trust REIT (c) |
167,122 | 6,039,789 | ||||||
| Pennsylvania Real Estate Investment Trust |
167,509 | 1,757,169 | ||||||
| Piedmont Office Realty Trust, Inc. Class A, REIT |
354,463 | 7,145,974 | ||||||
| Prologis, Inc. REIT |
1,294,888 | 82,173,592 | ||||||
| PS Business Parks, Inc. REIT |
47,664 | 6,363,144 | ||||||
| Public Storage REIT |
364,267 | 77,949,495 | ||||||
| Quality Care Properties, Inc. REIT (b) |
229,219 | 3,552,895 | ||||||
| Ramco-Gershenson Properties Trust REIT |
191,247 | 2,488,123 | ||||||
| Regency Centers Corp. REIT |
359,496 | 22,303,132 | ||||||
| Retail Opportunity Investments Corp. REIT |
268,670 | 5,107,417 | ||||||
| Retail Properties of America, Inc. Class A, REIT |
560,375 | 7,357,724 | ||||||
| Rexford Industrial Realty, Inc. REIT |
174,614 | 4,997,453 | ||||||
| RLJ Lodging Trust REIT |
424,423 | 9,337,306 | ||||||
| Ryman Hospitality Properties, Inc. REIT |
124,657 | 7,789,816 | ||||||
| Saul Centers, Inc. REIT |
29,981 | 1,856,124 | ||||||
| Senior Housing Properties Trust REIT |
577,150 | 11,283,282 | ||||||
| Seritage Growth Properties REIT (c) |
60,672 | 2,795,159 | ||||||
| Simon Property Group, Inc. REIT |
756,815 | 121,854,783 | ||||||
| SL Green Realty Corp. REIT |
240,788 | 24,396,640 | ||||||
| Starwood Waypoint Homes REIT |
311,773 | 11,339,184 | ||||||
| Summit Hotel Properties, Inc. REIT |
256,741 | 4,105,289 | ||||||
| Sun Communities, Inc. REIT |
192,116 | 16,460,499 | ||||||
| Sunstone Hotel Investors, Inc. REIT |
544,664 | 8,752,750 | ||||||
| Tanger Factory Outlet Centers, Inc. REIT (c) |
230,189 | 5,621,215 | ||||||
| Taubman Centers, Inc. REIT |
148,097 | 7,360,421 | ||||||
| Tier REIT, Inc |
115,059 | 2,220,639 | ||||||
| UDR, Inc. REIT |
650,986 | 24,756,998 | ||||||
| Universal Health Realty Income Trust REIT |
30,590 | 2,309,239 | ||||||
| Urban Edge Properties REIT |
256,969 | 6,198,092 | ||||||
| Ventas, Inc. REIT |
866,948 | 56,464,323 | ||||||
| Vornado Realty Trust REIT |
419,555 | 32,255,388 | ||||||
| Washington Prime Group, Inc. REIT |
455,050 | 3,790,567 | ||||||
See accompanying notes to financial statements.
16
Table of Contents
SPDR Dow Jones Global Real Estate ETF
SCHEDULE OF INVESTMENTS (continued)
September 30, 2017
| Security Description |
Shares | Value | ||||||
| Washington Real Estate Investment Trust |
188,131 | $ | 6,163,172 | |||||
| Weingarten Realty Investors REIT |
291,687 | 9,258,145 | ||||||
| Welltower, Inc. REIT |
898,059 | 63,115,587 | ||||||
| Xenia Hotels & Resorts, Inc. REIT |
259,999 | 5,472,979 | ||||||
|
|
|
|||||||
| 1,610,158,034 | ||||||||
|
|
|
|||||||
| TOTAL COMMON STOCKS |
2,673,800,026 | |||||||
|
|
|
|||||||
| RIGHTS — 0.0% (d) |
||||||||
| SINGAPORE — 0.0% (d) |
||||||||
| CapitaLand Commercial Trust (expiring 10/19/17) (b) (e) |
894,835 | 192,416 | ||||||
| Mapletree Logistics Trust (expiring 10/4/17) (b) (e) |
362,552 | 25,364 | ||||||
|
|
|
|||||||
| TOTAL RIGHTS |
217,780 | |||||||
|
|
|
|||||||
| SHORT-TERM INVESTMENTS — 1.0% |
||||||||
| State Street Institutional U.S. Government Money Market Fund, Class G Shares 0.96% (f) (g) |
3,970,115 | 3,970,115 | ||||||
| State Street Navigator Securities Lending Government Money Market Portfolio (f) (h) |
22,923,440 | 22,923,440 | ||||||
|
|
|
|||||||
| TOTAL SHORT-TERM INVESTMENTS |
26,893,555 | |||||||
|
|
|
|||||||
| TOTAL INVESTMENTS — 100.5% |
2,700,911,361 | |||||||
|
|
|
|||||||
| LIABILITIES IN EXCESS OF OTHER ASSETS — (0.5)% |
(12,745,140 | ) | ||||||
|
|
|
|||||||
| NET ASSETS — 100.0% |
$ | 2,688,166,221 | ||||||
|
|
|
|||||||
| (a) | Fair valued as determined in good faith by the Trust’s Oversight Committee in accordance with policy and procedures approved by the Board of Trustees. Security value is determined based on Level 3 inputs. As of September 30, 2017, total aggregate fair value of the securities is $20,619, representing less than 0.05% of the Fund’s net assets. |
| (b) | Non-income producing security. |
| (c) | All or a portion of the shares of the security are on loan at September 30, 2017. |
| (d) | Amount is less than 0.05% of net assets. |
| (e) | Fair valued as determined in good faith by the Trust’s Oversight Committee in accordance with policy and procedures approved by the Board of Trustees. As of September 30, 2017, total aggregate fair value of securities is $217,780 representing less than 0.05% of net assets. |
| (f) | The Fund invested in certain money market funds managed by SSGA Funds Management, Inc. Amounts related to these transactions during the period ended September 30, 2017 are shown in the Affiliate Table below. |
| (g) | The rate shown is the annualized seven-day yield at September 30, 2017. |
| (h) | Investment of cash collateral for securities loaned. |
See accompanying notes to financial statements.
17
Table of Contents
SPDR Dow Jones Global Real Estate ETF
SCHEDULE OF INVESTMENTS (continued)
September 30, 2017
NVDR = Non Voting Depositary Receipt
REIT = Real Estate Investment Trust
The following table summarizes the value of the Fund’s investments according to the fair value hierarchy as of September 30, 2017.
| Description |
Level 1 — Quoted Prices |
Level 2 — Other Significant Observable Inputs |
Level 3 — Significant Unobservable Inputs |
Total | ||||||||||||
| ASSETS: |
||||||||||||||||
| INVESTMENTS: |
||||||||||||||||
| Common Stocks |
||||||||||||||||
| Australia |
$ | 154,907,642 | $ | — | $ | 20,619 | $ | 154,928,261 | ||||||||
| Austria |
10,841,146 | — | — | 10,841,146 | ||||||||||||
| Belgium |
6,114,156 | — | — | 6,114,156 | ||||||||||||
| Brazil |
9,411,823 | — | — | 9,411,823 | ||||||||||||
| Canada |
35,969,917 | — | — | 35,969,917 | ||||||||||||
| France |
112,898,015 | — | — | 112,898,015 | ||||||||||||
| Germany |
19,867,359 | — | — | 19,867,359 | ||||||||||||
| Hong Kong |
85,194,458 | — | — | 85,194,458 | ||||||||||||
| Italy |
2,128,623 | — | — | 2,128,623 | ||||||||||||
| Japan |
278,232,579 | — | — | 278,232,579 | ||||||||||||
| Mexico |
11,217,665 | — | — | 11,217,665 | ||||||||||||
| Netherlands |
9,714,331 | — | — | 9,714,331 | ||||||||||||
| Philippines |
19,145,708 | — | — | 19,145,708 | ||||||||||||
| Singapore |
81,090,909 | — | — | 81,090,909 | ||||||||||||
| South Africa |
26,432,212 | — | — | 26,432,212 | ||||||||||||
| Spain |
18,979,129 | — | 0 | (a) | 18,979,129 | |||||||||||
| Sweden |
20,515,754 | — | — | 20,515,754 | ||||||||||||
| Switzerland |
24,669,689 | — | — | 24,669,689 | ||||||||||||
| Thailand |
7,820,348 | — | — | 7,820,348 | ||||||||||||
| United Kingdom |
128,469,910 | — | — | 128,469,910 | ||||||||||||
| United States |
1,610,158,034 | — | — | 1,610,158,034 | ||||||||||||
| Rights |
||||||||||||||||
| Singapore |
— | 217,780 | — | 217,780 | ||||||||||||
| Short-Term Investments |
26,893,555 | — | — | 26,893,555 | ||||||||||||
|
|
|
|
|
|
|
|
|
|||||||||
| TOTAL INVESTMENTS |
$ | 2,700,672,962 | $ | 217,780 | $ | 20,619 | $ | 2,700,911,361 | ||||||||
|
|
|
|
|
|
|
|
|
|||||||||
| (a) | Fund held a Level 3 security that was valued at $ 0 at September 30, 2017. |
See accompanying notes to financial statements.
18
Table of Contents
SPDR Dow Jones Global Real Estate ETF
SCHEDULE OF INVESTMENTS (continued)
September 30, 2017
Affiliate Table
| Number of Shares Held at 9/30/16 |
Value at 9/30/16 |
Cost of Purchases |
Proceeds from Shares Sold |
Realized Gain (Loss) |
Change in Unrealized Appreciation/ Depreciation |
Number of Shares Held at 9/30/17 |
Value at 9/30/17 |
Dividend Income |
||||||||||||||||||||||||||||
| State Street Institutional Liquid Reserves Fund, Premier Class |
3,984,959 | $ | 3,984,959 | $ | 43,517 | $ | 4,028,476 | $ | — | $ | — | — | $ | — | $ | 129 | ||||||||||||||||||||
| State Street Institutional U.S. Government Money Market Fund, Class G Shares |
— | — | 82,191,492 | 78,221,377 | — | — | 3,970,115 | 3,970,115 | 22,776 | |||||||||||||||||||||||||||
| State Street Institutional U.S. Government Money Market Fund, Premier Class |
— | — | 104,183,620 | 104,183,620 | — | — | — | — | 15,710 | |||||||||||||||||||||||||||
| State Street Navigator Securities Lending Government Money Market Portfolio* |
35,695,682 | 35,695,682 | 310,962,860 | 323,735,102 | — | — | 22,923,440 | 22,923,440 | 261,535 | |||||||||||||||||||||||||||
|
|
|
|
|
|
|
|
|
|
|
|
|
|
|
|||||||||||||||||||||||
| Total |
$ | 39,680,641 | $ | 497,381,489 | $ | 510,168,575 | $ | — | $ | — | $ | 26,893,555 | $ | 300,150 | ||||||||||||||||||||||
|
|
|
|
|
|
|
|
|
|
|
|
|
|
|
|||||||||||||||||||||||
| * | Effective October 5, 2016, the name of State Street Navigator Securities Lending Prime Portfolio was changed to State Street Navigator Securities Lending Government Money Market Portfolio. |
See accompanying notes to financial statements.
19
Table of Contents
SPDR Dow Jones International Real Estate ETF
SCHEDULE OF INVESTMENTS
September 30, 2017
| Security Description |
Shares | Value | ||||||
| COMMON STOCKS — 99.4% |
||||||||
| AUSTRALIA — 14.5% |
||||||||
| BGP Holdings PLC (a) |
32,410,441 | $ | 508,601 | |||||
| BWP Trust REIT |
4,038,846 | 9,348,784 | ||||||
| Charter Hall Retail REIT |
2,753,561 | 8,534,295 | ||||||
| Dexus Property Group REIT |
8,367,235 | 62,370,813 | ||||||
| Goodman Group REIT |
13,205,715 | 85,381,733 | ||||||
| GPT Group REIT |
14,880,540 | 57,913,019 | ||||||
| Investa Office Fund REIT |
4,115,894 | 14,532,908 | ||||||
| Scentre Group REIT |
44,158,823 | 136,171,391 | ||||||
| Vicinity Centres REIT |
27,086,753 | 56,534,613 | ||||||
| Westfield Corp. REIT |
15,852,975 | 97,522,017 | ||||||
|
|
|
|||||||
| 528,818,174 | ||||||||
|
|
|
|||||||
| AUSTRIA — 1.0% |
||||||||
| CA Immobilien Anlagen AG |
610,895 | 17,549,453 | ||||||
| IMMOFINANZ AG (b) (c) |
7,582,797 | 19,578,201 | ||||||
|
|
|
|||||||
| 37,127,654 | ||||||||
|
|
|
|||||||
| BELGIUM — 0.6% |
||||||||
| Cofinimmo SA REIT |
162,573 | 20,881,846 | ||||||
|
|
|
|||||||
| BRAZIL — 0.9% |
||||||||
| BR Malls Participacoes SA |
7,333,916 | 32,621,974 | ||||||
|
|
|
|||||||
| CANADA — 3.4% |
||||||||
| Artis Real Estate Investment Trust |
616,569 | 6,517,445 | ||||||
| Boardwalk Real Estate Investment Trust |
188,644 | 5,733,305 | ||||||
| Canadian Apartment Properties REIT |
557,594 | 15,038,297 | ||||||
| Canadian Real Estate Investment Trust |
300,012 | 11,065,889 | ||||||
| Dream Office Real Estate Investment Trust |
315,841 | 5,310,947 | ||||||
| First Capital Realty, Inc. (c) |
1,354,758 | 21,318,224 | ||||||
| H&R Real Estate Investment Trust |
1,171,633 | 20,179,087 | ||||||
| RioCan Real Estate Investment Trust |
1,322,957 | 25,313,526 | ||||||
| Smart Real Estate Investment Trust REIT |
534,778 | 12,588,545 | ||||||
|
|
|
|||||||
| 123,065,265 | ||||||||
|
|
|
|||||||
| FRANCE — 10.5% |
||||||||
| Fonciere Des Regions REIT |
440,650 | 45,785,079 | ||||||
| Gecina SA REIT |
382,206 | 61,992,956 | ||||||
| Klepierre SA REIT |
1,720,290 | 67,540,033 | ||||||
See accompanying notes to financial statements.
20
Table of Contents
SPDR Dow Jones International Real Estate ETF
SCHEDULE OF INVESTMENTS (continued)
September 30, 2017
| Security Description |
Shares | Value | ||||||
| Mercialys SA REIT (c) |
461,031 | $ | 9,211,017 | |||||
| Unibail-Rodamco SE REIT |
823,784 | 200,375,180 | ||||||
|
|
|
|||||||
| 384,904,265 | ||||||||
|
|
|
|||||||
| GERMANY — 1.8% |
||||||||
| Deutsche EuroShop AG |
396,377 | 14,868,572 | ||||||
| LEG Immobilien AG |
520,370 | 52,653,350 | ||||||
|
|
|
|||||||
| 67,521,922 | ||||||||
|
|
|
|||||||
| HONG KONG — 7.9% |
||||||||
| Champion REIT |
16,823,174 | 11,609,319 | ||||||
| Hang Lung Properties, Ltd. |
16,771,755 | 39,810,560 | ||||||
| Hongkong Land Holdings, Ltd. |
9,754,200 | 70,230,240 | ||||||
| Hysan Development Co., Ltd. |
4,245,846 | 19,977,062 | ||||||
| Link REIT |
18,366,355 | 148,845,849 | ||||||
|
|
|
|||||||
| 290,473,030 | ||||||||
|
|
|
|||||||
| ITALY — 0.2% |
||||||||
| Beni Stabili SpA SIIQ |
8,595,789 | 7,458,861 | ||||||
|
|
|
|||||||
| JAPAN — 26.0% |
||||||||
| Activia Properties, Inc. REIT |
5,507 | 22,846,968 | ||||||
| Advance Residence Investment Corp. |
11,183 | 27,499,262 | ||||||
| Aeon Mall Co., Ltd. |
949,940 | 16,903,388 | ||||||
| AEON REIT Investment Corp. (c) |
12,382 | 12,528,848 | ||||||
| Daiwa House REIT Investment Corp. |
12,625 | 30,215,209 | ||||||
| Daiwa Office Investment Corp. |
2,552 | 12,763,967 | ||||||
| Frontier Real Estate Investment Corp. |
4,109 | 16,663,781 | ||||||
| Fukuoka Corp. REIT |
6,233 | 8,870,667 | ||||||
| GLP J - REIT |
23,633 | 24,627,112 | ||||||
| Heiwa Real Estate Co., Ltd. |
275,200 | 4,686,700 | ||||||
| Hoshino Resorts REIT, Inc. (c) |
1,407 | 6,999,689 | ||||||
| Hulic Co., Ltd. |
4,011,990 | 39,312,619 | ||||||
| Hulic, Inc. REIT |
7,692 | 11,343,419 | ||||||
| Industrial & Infrastructure Fund Investment Corp. REIT |
3,289 | 13,937,307 | ||||||
| Invincible Investment Corp. REIT (c) |
26,821 | 11,067,698 | ||||||
| Japan Excellent, Inc. |
10,920 | 12,970,319 | ||||||
| Japan Hotel REIT Investment Corp. |
33,110 | 20,913,437 | ||||||
| Japan Prime Realty Investment Corp. REIT |
7,647 | 25,543,215 | ||||||
| Japan Real Estate Investment Corp. REIT |
10,856 | 52,175,152 | ||||||
| Japan Rental Housing Investments, Inc. |
13,709 | 9,669,920 | ||||||
| Japan Retail Fund Investment Corp. REIT |
22,107 | 39,651,786 | ||||||
| Kenedix Office Investment Corp. REIT |
3,350 | 18,421,801 | ||||||
| Kenedix Residential Investment Corp. |
2,917 | 7,496,896 | ||||||
| Kenedix Retail REIT Corp. |
4,251 | 8,829,421 | ||||||
| Leopalace21 Corp. |
2,180,400 | 15,186,191 | ||||||
See accompanying notes to financial statements.
21
Table of Contents
SPDR Dow Jones International Real Estate ETF
SCHEDULE OF INVESTMENTS (continued)
September 30, 2017
| Security Description |
Shares | Value | ||||||
| MCUBS MidCity Investment Corp. |
2,448 | $ | 7,459,370 | |||||
| Mitsui Fudosan Co., Ltd. |
8,220,500 | 178,190,557 | ||||||
| Mori Hills Investment Corp. REIT |
12,317 | 14,760,923 | ||||||
| Mori Trust Sogo REIT, Inc. |
8,059 | 12,056,462 | ||||||
| Nippon Building Fund, Inc. REIT |
11,709 | 58,355,164 | ||||||
| Nippon Prologis REIT, Inc. |
16,989 | 35,784,586 | ||||||
| Nomura Real Estate Master Fund, Inc. |
34,670 | 45,060,374 | ||||||
| NTT Urban Development Corp. |
907,031 | 9,024,783 | ||||||
| Orix JREIT, Inc. REIT |
22,210 | 31,865,278 | ||||||
| Premier Investment Corp. |
10,884 | 10,326,578 | ||||||
| Tokyu Fudosan Holdings Corp. |
4,246,500 | 25,615,187 | ||||||
| Tokyu REIT, Inc. |
8,163 | 9,942,232 | ||||||
| United Urban Investment Corp. REIT |
25,317 | 37,065,177 | ||||||
| Unizo Holdings Co., Ltd. |
187,700 | 4,350,458 | ||||||
|
|
|
|||||||
| 950,981,901 | ||||||||
|
|
|
|||||||
| MEXICO — 1.1% |
||||||||
| Fibra Uno Administracion SA de CV REIT |
22,886,682 | 38,717,396 | ||||||
|
|
|
|||||||
| NETHERLANDS — 0.9% |
||||||||
| Eurocommercial Properties NV |
408,507 | 17,472,651 | ||||||
| Wereldhave NV |
336,464 | 15,872,913 | ||||||
|
|
|
|||||||
| 33,345,564 | ||||||||
|
|
|
|||||||
| PHILIPPINES — 1.8% |
||||||||
| SM Prime Holdings, Inc. |
95,775,800 | 64,950,960 | ||||||
|
|
|
|||||||
| SINGAPORE — 7.6% |
||||||||
| Ascendas REIT |
19,892,268 | 38,965,671 | ||||||
| CapitaLand Commercial Trust (c) |
18,395,734 | 22,419,780 | ||||||
| CapitaLand Mall Trust REIT |
22,331,747 | 32,890,382 | ||||||
| CapitaLand, Ltd. |
21,127,597 | 55,699,250 | ||||||
| Global Logistic Properties, Ltd. |
24,481,315 | 59,492,867 | ||||||
| Keppel REIT (c) |
14,594,053 | 12,681,603 | ||||||
| Mapletree Commercial Trust REIT |
15,723,400 | 17,599,741 | ||||||
| Mapletree Logistics Trust |
12,401,139 | 11,323,990 | ||||||
| Suntec Real Estate Investment Trust |
18,435,576 | 25,319,304 | ||||||
|
|
|
|||||||
| 276,392,588 | ||||||||
|
|
|
|||||||
| SOUTH AFRICA — 2.5% |
||||||||
| Growthpoint Properties, Ltd. REIT (c) |
21,797,840 | 39,228,847 | ||||||
| Hyprop Investments, Ltd. |
2,056,756 | 16,103,703 | ||||||
| Redefine Properties, Ltd. REIT |
44,014,387 | 34,846,421 | ||||||
|
|
|
|||||||
| 90,178,971 | ||||||||
|
|
|
|||||||
| SPAIN — 1.8% |
||||||||
| Inmobiliaria Colonial Socimi SA REIT |
2,666,184 | 26,457,561 | ||||||
See accompanying notes to financial statements.
22
Table of Contents
SPDR Dow Jones International Real Estate ETF
SCHEDULE OF INVESTMENTS (continued)
September 30, 2017
| Security Description |
Shares | Value | ||||||
| Martinsa Fadesa SA (a) (b) |
35,998 | $ | — | |||||
| Merlin Properties Socimi SA |
2,764,356 | 38,301,194 | ||||||
|
|
|
|||||||
| 64,758,755 | ||||||||
|
|
|
|||||||
| SWEDEN — 1.9% |
||||||||
| Castellum AB |
2,264,126 | 35,449,999 | ||||||
| Fabege AB |
1,164,405 | 23,823,487 | ||||||
| Kungsleden AB |
1,569,280 | 10,776,081 | ||||||
|
|
|
|||||||
| 70,049,567 | ||||||||
|
|
|
|||||||
| SWITZERLAND — 2.3% |
||||||||
| PSP Swiss Property AG |
334,456 | 30,832,446 | ||||||
| Swiss Prime Site AG (b) |
592,576 | 53,311,018 | ||||||
|
|
|
|||||||
| 84,143,464 | ||||||||
|
|
|
|||||||
| THAILAND — 0.7% |
||||||||
| Central Pattana PCL NVDR |
11,249,259 | 26,310,111 | ||||||
|
|
|
|||||||
| UNITED KINGDOM — 12.0% |
||||||||
| Big Yellow Group PLC REIT |
1,239,928 | 12,593,067 | ||||||
| British Land Co. PLC REIT |
8,581,044 | 69,306,790 | ||||||
| Capital & Counties Properties PLC |
6,231,977 | 22,131,913 | ||||||
| Derwent London PLC |
918,312 | 34,423,563 | ||||||
| Grainger PLC |
3,478,744 | 12,517,581 | ||||||
| Great Portland Estates PLC REIT |
2,705,857 | 22,181,209 | ||||||
| Hammerson PLC REIT |
6,575,118 | 47,371,485 | ||||||
| Intu Properties PLC REIT (c) |
7,239,554 | 22,388,340 | ||||||
| Land Securities Group PLC REIT |
6,216,220 | 81,106,399 | ||||||
| Segro PLC REIT |
8,242,830 | 59,276,192 | ||||||
| Shaftesbury PLC |
1,841,196 | 25,097,640 | ||||||
| UNITE Group PLC REIT |
2,010,480 | 18,544,350 | ||||||
| Workspace Group PLC REIT |
995,363 | 11,851,928 | ||||||
|
|
|
|||||||
| 438,790,457 | ||||||||
|
|
|
|||||||
| TOTAL COMMON STOCKS |
3,631,492,725 | |||||||
|
|
|
|||||||
| RIGHTS — 0.0% (d) |
||||||||
| SINGAPORE — 0.0% (d) |
||||||||
| CapitaLand Commercial Trust (expiring 10/19/17) (b) (e) |
3,064,996 | 659,066 | ||||||
| Mapletree Logistics Trust (expiring 10/4/17) (b) (e) |
1,251,663 | 87,565 | ||||||
|
|
|
|||||||
| TOTAL RIGHTS |
746,631 | |||||||
|
|
|
|||||||
See accompanying notes to financial statements.
23
Table of Contents
SPDR Dow Jones International Real Estate ETF
SCHEDULE OF INVESTMENTS (continued)
September 30, 2017
| Security Description |
Shares | Value | ||||||
| SHORT-TERM INVESTMENTS — 1.8% |
||||||||
| State Street Institutional U.S. Government Money Market Fund, Class G Shares 0.96% (f) (g) |
3,755,745 | $ | 3,755,745 | |||||
| State Street Navigator Securities Lending Government Money Market Portfolio (f) (h) |
60,686,836 | 60,686,836 | ||||||
|
|
|
|||||||
| TOTAL SHORT-TERM INVESTMENTS |
64,442,581 | |||||||
|
|
|
|||||||
| TOTAL INVESTMENTS — 101.2% |
3,696,681,937 | |||||||
|
|
|
|||||||
| LIABILITIES IN EXCESS OF OTHER ASSETS — (1.2)% |
(42,049,351 | ) | ||||||
|
|
|
|||||||
| NET ASSETS — 100.0% |
$ | 3,654,632,586 | ||||||
|
|
|
|||||||
| (a) | Fair valued as determined in good faith by the Trust’s Oversight Committee in accordance with policy and procedures approved by the Board of Trustees. Security value is determined based on Level 3 inputs. As of September 30, 2017, total aggregate fair value of the securities is $508,601, representing less than 0.05% of the Fund’s net assets. |
| (b) | Non-income producing security. |
| (c) | All or a portion of the shares of the security are on loan at September 30, 2017. |
| (d) | Amount is less than 0.05% of net assets. |
| (e) | Fair valued as determined in good faith by the Trust’s Oversight Committee in accordance with policy and procedures approved by the Board of Trustees. As of September 30, 2017, total aggregate fair value of securities is $746,631 representing less than 0.05% of net assets. |
| (f) | The Fund invested in certain money market funds managed by SSGA Funds Management, Inc. Amounts related to these transactions during the period ended September 30, 2017 are shown in the Affiliate Table below. |
| (g) | The rate shown is the annualized seven-day yield at September 30, 2017. |
| (h) | Investment of cash collateral for securities loaned. |
NVDR = Non Voting Depositary Receipt
REIT = Real Estate Investment Trust
See accompanying notes to financial statements.
24
Table of Contents
SPDR Dow Jones International Real Estate ETF
SCHEDULE OF INVESTMENTS (continued)
September 30, 2017
The following table summarizes the value of the Fund’s investments according to the fair value hierarchy as of September 30, 2017.
| Description |
Level 1 — Quoted Prices |
Level 2 — Other Significant Observable Inputs |
Level 3 — Significant Unobservable Inputs |
Total | ||||||||||||
| ASSETS: |
||||||||||||||||
| INVESTMENTS: |
||||||||||||||||
| Common Stocks |
||||||||||||||||
| Australia |
$ | 528,309,573 | $ | — | $ | 508,601 | $ | 528,818,174 | ||||||||
| Austria |
37,127,654 | — | — | 37,127,654 | ||||||||||||
| Belgium |
20,881,846 | — | — | 20,881,846 | ||||||||||||
| Brazil |
32,621,974 | — | — | 32,621,974 | ||||||||||||
| Canada |
123,065,265 | — | — | 123,065,265 | ||||||||||||
| France |
384,904,265 | — | — | 384,904,265 | ||||||||||||
| Germany |
67,521,922 | — | — | 67,521,922 | ||||||||||||
| Hong Kong |
290,473,030 | — | — | 290,473,030 | ||||||||||||
| Italy |
7,458,861 | — | — | 7,458,861 | ||||||||||||
| Japan |
950,981,901 | — | — | 950,981,901 | ||||||||||||
| Mexico |
38,717,396 | — | — | 38,717,396 | ||||||||||||
| Netherlands |
33,345,564 | — | — | 33,345,564 | ||||||||||||
| Philippines |
64,950,960 | — | — | 64,950,960 | ||||||||||||
| Singapore |
276,392,588 | — | — | 276,392,588 | ||||||||||||
| South Africa |
90,178,971 | — | — | 90,178,971 | ||||||||||||
| Spain |
64,758,755 | — | 0 | (a) | 64,758,755 | |||||||||||
| Sweden |
70,049,567 | — | — | 70,049,567 | ||||||||||||
| Switzerland |
84,143,464 | — | — | 84,143,464 | ||||||||||||
| Thailand |
26,310,111 | — | — | 26,310,111 | ||||||||||||
| United Kingdom |
438,790,457 | — | — | 438,790,457 | ||||||||||||
| Rights |
||||||||||||||||
| Singapore |
— | 746,631 | — | 746,631 | ||||||||||||
| Short-Term Investments |
64,442,581 | — | — | 64,442,581 | ||||||||||||
|
|
|
|
|
|
|
|
|
|||||||||
| TOTAL INVESTMENTS |
$ | 3,695,426,705 | $ | 746,631 | $ | 508,601 | $ | 3,696,681,937 | ||||||||
|
|
|
|
|
|
|
|
|
|||||||||
| (a) | Fund held a Level 3 security that was valued at $ 0 at September 30, 2017. |
See accompanying notes to financial statements.
25
Table of Contents
SPDR Dow Jones International Real Estate ETF
SCHEDULE OF INVESTMENTS (continued)
September 30, 2017
Affiliate Table
| Number of Shares Held at 9/30/16 |
Value at 9/30/16 |
Cost of Purchases |
Proceeds from Shares Sold |
Realized Gain (Loss) |
Change in Unrealized Appreciation/ Depreciation |
Number of Shares Held at 9/30/17 |
Value at 9/30/17 |
Dividend Income |
||||||||||||||||||||||||||||
| State Street Institutional Liquid Reserves Fund, Premier Class |
1,657,995 | $ | 1,657,995 | $ | 4,425 | $ | 1,662,420 | $ | — | $ | — | — | $ | — | $ | 11 | ||||||||||||||||||||
| State Street Institutional U.S. Government Money Market Fund, Class G Shares |
— | — | 110,961,016 | 107,205,271 | — | — | 3,755,745 | 3,755,745 | 24,291 | |||||||||||||||||||||||||||
| State Street Institutional U.S. Government Money Market Fund, Premier Class |
— | — | 305,799,317 | 305,799,317 | — | — | — | — | 35,284 | |||||||||||||||||||||||||||
| State Street Navigator Securities Lending Government Money Market Portfolio* |
113,855,927 | 113,855,927 | 1,051,641,711 | 1,104,810,802 | — | — | 60,686,836 | 60,686,836 | 902,154 | |||||||||||||||||||||||||||
|
|
|
|
|
|
|
|
|
|
|
|
|
|
|
|||||||||||||||||||||||
| Total |
$ | 115,513,922 | $ | 1,468,406,469 | $ | 1,519,477,810 | $ | — | $ | — | $ | 64,442,581 | $ | 961,740 | ||||||||||||||||||||||
|
|
|
|
|
|
|
|
|
|
|
|
|
|
|
|||||||||||||||||||||||
| * | Effective October 5, 2016, the name of State Street Navigator Securities Lending Prime Portfolio was changed to State Street Navigator Securities Lending Government Money Market Portfolio. |
See accompanying notes to financial statements.
26
Table of Contents
SPDR S&P North American Natural Resources ETF
SCHEDULE OF INVESTMENTS
September 30, 2017
| Security Description |
Shares | Value | ||||||
| COMMON STOCKS — 99.5% |
||||||||
| CANADA — 35.5% |
||||||||
| Agnico Eagle Mines, Ltd. |
554,928 | $ | 25,020,901 | |||||
| Agrium, Inc. |
175,964 | 18,814,141 | ||||||
| ARC Resources, Ltd. (a) |
184,932 | 2,541,863 | ||||||
| Barrick Gold Corp. |
2,800,838 | 44,969,278 | ||||||
| Cameco Corp. (a) |
206,973 | 1,994,183 | ||||||
| Canadian Natural Resources, Ltd. |
565,390 | 18,892,295 | ||||||
| Cenovus Energy, Inc. (a) |
533,421 | 5,335,703 | ||||||
| Crescent Point Energy Corp. |
284,831 | 2,282,019 | ||||||
| Detour Gold Corp. (b) |
419,464 | 4,615,060 | ||||||
| Eldorado Gold Corp. |
1,903,903 | 4,171,186 | ||||||
| Encana Corp. |
508,975 | 5,978,366 | ||||||
| First Quantum Minerals, Ltd. |
1,656,220 | 18,553,266 | ||||||
| Franco-Nevada Corp. |
429,166 | 33,169,300 | ||||||
| Goldcorp, Inc. |
2,055,425 | 26,624,463 | ||||||
| Husky Energy, Inc. (b) |
157,720 | 1,969,845 | ||||||
| Imperial Oil, Ltd. (a) |
132,991 | 4,238,613 | ||||||
| Kinross Gold Corp. (b) |
2,995,456 | 12,670,181 | ||||||
| Lundin Mining Corp. |
1,519,005 | 10,396,740 | ||||||
| Peyto Exploration & Development Corp. (a) |
86,233 | 1,406,591 | ||||||
| Potash Corp. of Saskatchewan, Inc. |
1,069,786 | 20,546,324 | ||||||
| PrairieSky Royalty, Ltd. |
110,284 | 2,815,630 | ||||||
| Seven Generations Energy, Ltd. Class A (b) |
132,908 | 2,097,792 | ||||||
| Suncor Energy, Inc. |
873,137 | 30,529,949 | ||||||
| Teck Resources, Ltd. Class B |
1,122,711 | 23,582,631 | ||||||
| Tourmaline Oil Corp. (b) |
129,551 | 2,628,001 | ||||||
| Vermilion Energy, Inc. (a) |
62,988 | 2,233,653 | ||||||
| West Fraser Timber Co., Ltd. |
86,992 | 5,008,135 | ||||||
| Wheaton Precious Metals Corp. |
1,061,416 | 20,198,857 | ||||||
| Whitecap Resources, Inc. (a) |
193,097 | 1,497,654 | ||||||
| Yamana Gold, Inc. |
2,277,715 | 6,010,042 | ||||||
|
|
|
|||||||
| 360,792,662 | ||||||||
|
|
|
|||||||
| UNITED STATES — 64.0% |
||||||||
| Anadarko Petroleum Corp. |
293,032 | 14,314,613 | ||||||
| Antero Resources Corp. (a) (b) |
75,801 | 1,508,440 | ||||||
| Apache Corp. (a) |
198,918 | 9,110,444 | ||||||
| Archer-Daniels-Midland Co. |
726,719 | 30,892,825 | ||||||
| Bunge, Ltd. |
178,763 | 12,416,878 | ||||||
| Cabot Oil & Gas Corp. |
243,473 | 6,512,903 | ||||||
| CF Industries Holdings, Inc. |
296,902 | 10,439,074 | ||||||
| Chevron Corp. |
904,632 | 106,294,260 | ||||||
| Cimarex Energy Co. |
49,729 | 5,652,695 | ||||||
See accompanying notes to financial statements.
27
Table of Contents
SPDR S&P North American Natural Resources ETF
SCHEDULE OF INVESTMENTS (continued)
September 30, 2017
| Security Description |
Shares | Value | ||||||
| Concho Resources, Inc. (a) (b) |
77,498 | $ | 10,208,037 | |||||
| ConocoPhillips |
647,027 | 32,383,701 | ||||||
| Continental Resources, Inc. (a) (b) |
45,096 | 1,741,157 | ||||||
| Devon Energy Corp. |
274,923 | 10,092,423 | ||||||
| EOG Resources, Inc. |
301,927 | 29,208,418 | ||||||
| EQT Corp. |
90,647 | 5,913,810 | ||||||
| Exxon Mobil Corp. |
1,253,811 | 102,787,426 | ||||||
| FMC Corp. |
170,635 | 15,239,412 | ||||||
| Freeport-McMoRan, Inc. (b) |
3,198,022 | 44,900,229 | ||||||
| Hess Corp. |
141,368 | 6,628,745 | ||||||
| Ingredion, Inc. |
91,311 | 11,015,759 | ||||||
| Marathon Oil Corp. |
444,551 | 6,028,112 | ||||||
| Monsanto Co. |
558,834 | 66,959,490 | ||||||
| Mosaic Co. |
447,013 | 9,651,011 | ||||||
| Newmont Mining Corp. |
1,281,145 | 48,055,749 | ||||||
| Noble Energy, Inc. |
238,107 | 6,752,714 | ||||||
| Occidental Petroleum Corp. |
399,884 | 25,676,552 | ||||||
| Pioneer Natural Resources Co. |
89,007 | 13,132,093 | ||||||
| Range Resources Corp. (a) |
98,423 | 1,926,138 | ||||||
| Southwestern Energy Co. (b) |
264,613 | 1,616,785 | ||||||
| Tahoe Resources, Inc. |
750,372 | 3,935,906 | ||||||
|
|
|
|||||||
| 650,995,799 | ||||||||
|
|
|
|||||||
| TOTAL COMMON STOCKS |
1,011,788,461 | |||||||
|
|
|
|||||||
| SHORT-TERM INVESTMENTS — 0.8% |
||||||||
| State Street Institutional U.S. Government Money Market Fund, Class G Shares 0.96% (c) (d) |
3,488,016 | 3,488,016 | ||||||
| State Street Navigator Securities Lending Government Money Market Portfolio (c) (e) |
4,770,511 | 4,770,511 | ||||||
|
|
|
|||||||
| TOTAL SHORT-TERM INVESTMENTS |
8,258,527 | |||||||
|
|
|
|||||||
| TOTAL INVESTMENTS — 100.3% |
1,020,046,988 | |||||||
|
|
|
|||||||
| LIABILITIES IN EXCESS OF OTHER ASSETS — (0.3)% |
(3,286,984 | ) | ||||||
|
|
|
|||||||
| NET ASSETS — 100.0% |
$ | 1,016,760,004 | ||||||
|
|
|
|||||||
See accompanying notes to financial statements.
28
Table of Contents
SPDR S&P North American Natural Resources ETF
SCHEDULE OF INVESTMENTS (continued)
September 30, 2017
| (a) | All or a portion of the shares of the security are on loan at September 30, 2017. |
| (b) | Non-income producing security. |
| (c) | The Fund invested in certain money market funds managed by SSGA Funds Management, Inc. Amounts related to these transactions during the period ended September 30, 2017 are shown in the Affiliate Table below. |
| (d) | The rate shown is the annualized seven-day yield at September 30, 2017. |
| (e) | Investment of cash collateral for securities loaned. |
The following table summarizes the value of the Fund’s investments according to the fair value hierarchy as of September 30, 2017.
| Description |
Level 1 — Quoted Prices |
Level 2 — Other Significant Observable Inputs |
Level 3 — Significant Unobservable Inputs |
Total | ||||||||||||
| ASSETS: |
||||||||||||||||
| INVESTMENTS: |
||||||||||||||||
| Common Stocks |
||||||||||||||||
| Canada |
$ | 360,792,662 | $ | — | $ | — | $ | 360,792,662 | ||||||||
| United States |
650,995,799 | — | — | 650,995,799 | ||||||||||||
| Short-Term Investments |
8,258,527 | — | — | 8,258,527 | ||||||||||||
|
|
|
|
|
|
|
|
|
|||||||||
| TOTAL INVESTMENTS |
$ | 1,020,046,988 | $ | — | $ | — | $ | 1,020,046,988 | ||||||||
|
|
|
|
|
|
|
|
|
|||||||||
Affiliate Table
| Number of Shares Held at 9/30/16 |
Value at 9/30/16 |
Cost of Purchases |
Proceeds from Shares Sold |
Realized Gain (Loss) |
Change in Unrealized Appreciation/ Depreciation |
Number of Shares Held at 9/30/17 |
Value at 9/30/17 |
Dividend Income |
||||||||||||||||||||||||||||
| State Street Institutional Liquid Reserves Fund, Premier Class |
2,657,077 | $ | 2,657,077 | $ | 1,336 | $ | 2,658,413 | $ | — | $ | — | — | $ | — | $ | 98 | ||||||||||||||||||||
| State Street Institutional U.S. Government Money Market Fund, Class G Shares |
— | — | 13,156,693 | 9,668,677 | — | — | 3,488,016 | 3,488,016 | 6,082 | |||||||||||||||||||||||||||
| State Street Institutional U.S. Government Money Market Fund, Premier Class |
— | — | 48,418,568 | 48,418,568 | — | — | — | — | 8,168 | |||||||||||||||||||||||||||
| State Street Navigator Securities Lending Government Money Market Portfolio* |
— | — | 86,480,745 | 81,710,234 | — | — | 4,770,511 | 4,770,511 | 5,674 | |||||||||||||||||||||||||||
|
|
|
|
|
|
|
|
|
|
|
|
|
|
|
|||||||||||||||||||||||
| Total |
$ | 2,657,077 | $ | 148,057,342 | $ | 142,455,892 | $ | — | $ | — | $ | 8,258,527 | $ | 20,022 | ||||||||||||||||||||||
|
|
|
|
|
|
|
|
|
|
|
|
|
|
|
|||||||||||||||||||||||
| * | Effective October 5, 2016, the name of State Street Navigator Securities Lending Prime Portfolio was changed to State Street Navigator Securities Lending Government Money Market Portfolio. |
See accompanying notes to financial statements.
29
Table of Contents
STATEMENTS OF ASSETS AND LIABILITIES
September 30, 2017
| SPDR Dow Jones Global Real Estate ETF |
SPDR Dow Jones International Real Estate ETF |
|||||||
| ASSETS |
||||||||
| Investments in unaffiliated issuers, at value* (Note 2) |
$ | 2,674,017,806 | $ | 3,632,239,356 | ||||
| Investments in affiliated issuers, at value (Notes 2 and 3) |
26,893,555 | 64,442,581 | ||||||
|
|
|
|
|
|||||
| Total Investments |
2,700,911,361 | 3,696,681,937 | ||||||
| Foreign currency, at value |
2,118,755 | 3,918,097 | ||||||
| Cash |
463,542 | — | ||||||
| Receivable for investments sold |
498,212 | 13,056,442 | ||||||
| Dividends receivable — unaffiliated issuers (Note 2) |
10,422,896 | 18,811,178 | ||||||
| Dividends receivable — affiliated issuers (Notes 2 and 3) |
7,450 | 10,664 | ||||||
| Securities lending income receivable — unaffiliated issuers (Note 8) |
731 | — | ||||||
| Securities lending income receivable — affiliated issuers (Notes 3 and 8) |
26,447 | 85,634 | ||||||
| Receivable for foreign taxes recoverable |
214,325 | 777,870 | ||||||
|
|
|
|
|
|||||
| TOTAL ASSETS |
2,714,663,719 | 3,733,341,822 | ||||||
|
|
|
|
|
|||||
| LIABILITIES |
||||||||
| Payable upon return of securities loaned |
22,923,440 | 60,686,836 | ||||||
| Payable for investments purchased |
173,561 | 1,058,806 | ||||||
| Payable for fund shares repurchased |
— | 11,420,275 | ||||||
| Advisory fee payable (Note 3) |
3,397,734 | 5,535,312 | ||||||
| Trustees’ fees and expenses payable (Note 4) |
2,763 | 8,007 | ||||||
|
|
|
|
|
|||||
| TOTAL LIABILITIES |
26,497,498 | 78,709,236 | ||||||
|
|
|
|
|
|||||
| NET ASSETS |
$ | 2,688,166,221 | $ | 3,654,632,586 | ||||
|
|
|
|
|
|||||
| NET ASSETS CONSIST OF: |
||||||||
| Paid-in Capital (Note 6) |
$ | 2,596,166,348 | $ | 4,342,358,518 | ||||
| Undistributed (distribution in excess of) net investment income (loss) |
(18,273,130 | ) | (92,868,098 | ) | ||||
| Accumulated net realized gain (loss) on investments and foreign currency transactions |
(44,198,561 | ) | (766,494,180 | ) | ||||
| Net unrealized appreciation (depreciation) on: |
||||||||
| Investments — unaffiliated issuers |
154,511,506 | 171,678,813 | ||||||
| Foreign currency translations |
(39,942 | ) | (42,467 | ) | ||||
|
|
|
|
|
|||||
| NET ASSETS |
$ | 2,688,166,221 | $ | 3,654,632,586 | ||||
|
|
|
|
|
|||||
| NET ASSET VALUE PER SHARE |
||||||||
| Net asset value per share |
$ | 47.66 | $ | 38.37 | ||||
|
|
|
|
|
|||||
| Shares outstanding (unlimited amount authorized, $0.01 par value) |
56,400,000 | 95,235,379 | ||||||
|
|
|
|
|
|||||
| COST OF INVESTMENTS: |
||||||||
| Investments in unaffiliated issuers |
$ | 2,519,506,300 | $ | 3,460,560,543 | ||||
| Investments in affiliated issuers |
26,893,555 | 64,442,581 | ||||||
|
|
|
|
|
|||||
| Total cost of investments |
$ | 2,546,399,855 | $ | 3,525,003,124 | ||||
|
|
|
|
|
|||||
| Foreign currency, at cost |
$ | 2,135,712 | $ | 3,890,573 | ||||
|
|
|
|
|
|||||
| * Includes investments in securities on loan, at value |
$ | 45,012,420 | $ | 67,514,651 | ||||
|
|
|
|
|
|||||
See accompanying notes to financial statements.
30
Table of Contents
SPDR INDEX SHARES FUNDS
STATEMENTS OF ASSETS AND LIABILITIES (continued)
September 30, 2017
| SPDR S&P North American Natural Resources ETF |
||||
| ASSETS |
||||
| Investments in unaffiliated issuers, at value* (Note 2) |
$ | 1,011,788,461 | ||
| Investments in affiliated issuers, at value (Notes 2 and 3) |
8,258,527 | |||
|
|
|
|||
| Total Investments |
1,020,046,988 | |||
| Foreign currency, at value |
1,530,282 | |||
| Dividends receivable — unaffiliated issuers (Note 2) |
800,001 | |||
| Dividends receivable — affiliated issuers (Notes 2 and 3) |
2,030 | |||
| Securities lending income receivable — unaffiliated issuers (Note 8) |
2,267 | |||
| Securities lending income receivable — affiliated issuers (Notes 3 and 8) |
3,205 | |||
|
|
|
|||
| TOTAL ASSETS |
1,022,384,773 | |||
|
|
|
|||
| LIABILITIES |
||||
| Payable upon return of securities loaned |
4,770,511 | |||
| Advisory fee payable (Note 3) |
853,157 | |||
| Trustees’ fees and expenses payable (Note 4) |
1,101 | |||
|
|
|
|||
| TOTAL LIABILITIES |
5,624,769 | |||
|
|
|
|||
| NET ASSETS |
$ | 1,016,760,004 | ||
|
|
|
|||
| NET ASSETS CONSIST OF: |
||||
| Paid-in Capital (Note 6) |
$ | 801,325,418 | ||
| Undistributed (distribution in excess of) net investment income (loss) |
4,191,349 | |||
| Accumulated net realized gain (loss) on investments and foreign currency transactions |
4,285,844 | |||
| Net unrealized appreciation (depreciation) on: |
||||
| Investments — unaffiliated issuers |
206,991,189 | |||
| Foreign currency translations |
(33,796 | ) | ||
|
|
|
|||
| NET ASSETS |
$ | 1,016,760,004 | ||
|
|
|
|||
| NET ASSET VALUE PER SHARE |
||||
| Net asset value per share |
$ | 33.67 | ||
|
|
|
|||
| Shares outstanding (unlimited amount authorized, $0.01 par value) |
30,200,000 | |||
|
|
|
|||
| COST OF INVESTMENTS: |
||||
| Investments in unaffiliated issuers |
$ | 804,797,272 | ||
| Investments in affiliated issuers |
8,258,527 | |||
|
|
|
|||
| Total cost of investments |
$ | 813,055,799 | ||
|
|
|
|||
| Foreign currency, at cost |
$ | 1,561,276 | ||
|
|
|
|||
| * Includes investments in securities on loan, at value |
$ | 30,253,882 | ||
|
|
|
|||
See accompanying notes to financial statements.
31
Table of Contents
SPDR INDEX SHARES FUNDS
STATEMENTS OF OPERATIONS
For the Year Ended September 30, 2017
| SPDR Dow Jones Global Real Estate ETF |
SPDR Dow Jones International Real Estate ETF |
|||||||
| INVESTMENT INCOME |
||||||||
| Dividend income — unaffiliated issuers (Note 2) |
$ | 76,387,934 | $ | 149,094,550 | ||||
| Dividend income — affiliated issuers (Notes 2 and 3) |
38,615 | 59,586 | ||||||
| Dividend income — non-cash transactions |
4,898,709 | — | ||||||
| Unaffiliated securities lending income (Note 8) |
26,968 | 40,752 | ||||||
| Affiliated securities lending income (Notes 3 and 8) |
261,535 | 902,154 | ||||||
| Foreign taxes withheld |
(4,137,659 | ) | (14,920,570 | ) | ||||
|
|
|
|
|
|||||
| TOTAL INVESTMENT INCOME (LOSS) |
77,476,102 | 135,176,472 | ||||||
|
|
|
|
|
|||||
| EXPENSES |
||||||||
| Advisory fee (Note 3) |
12,810,788 | 21,997,436 | ||||||
| Trustees’ fees and expenses (Note 4) |
44,507 | 71,883 | ||||||
| Miscellaneous expenses |
18,422 | 45,903 | ||||||
|
|
|
|
|
|||||
| TOTAL EXPENSES |
12,873,717 | 22,115,222 | ||||||
|
|
|
|
|
|||||
| NET EXPENSES |
12,873,717 | 22,115,222 | ||||||
|
|
|
|
|
|||||
| NET INVESTMENT INCOME (LOSS) |
64,602,385 | 113,061,250 | ||||||
|
|
|
|
|
|||||
| REALIZED AND UNREALIZED GAIN (LOSS) |
||||||||
| Net realized gain (loss) on: |
||||||||
| Investments — unaffiliated issuers* |
(28,254,442 | ) | (130,349,103 | ) | ||||
| In-kind redemptions — unaffiliated issuers |
44,786,107 | 135,498,630 | ||||||
| Foreign currency transactions |
46,510 | 98,240 | ||||||
|
|
|
|
|
|||||
| Net realized gain (loss) |
16,578,175 | 5,247,767 | ||||||
|
|
|
|
|
|||||
| Net change in unrealized appreciation/depreciation on: |
||||||||
| Investments — unaffiliated issuers** |
(96,418,461 | ) | (154,870,315 | ) | ||||
| Foreign currency translations |
(14,251 | ) | 101,874 | |||||
|
|
|
|
|
|||||
| Net change in unrealized appreciation/depreciation |
(96,432,712 | ) | (154,768,441 | ) | ||||
|
|
|
|
|
|||||
| NET REALIZED AND UNREALIZED GAIN (LOSS) |
(79,854,537 | ) | (149,520,674 | ) | ||||
|
|
|
|
|
|||||
| NET INCREASE (DECREASE) IN NET ASSETS FROM OPERATIONS |
$ | (15,252,152 | ) | $ | (36,459,424 | ) | ||
|
|
|
|
|
|||||
| * Includes foreign capital gain taxes |
$ | (18,074 | ) | $ | (253,105 | ) | ||
|
|
|
|
|
|||||
| ** Includes foreign deferred taxes |
$ | 171,069 | $ | 910,178 | ||||
|
|
|
|
|
|||||
See accompanying notes to financial statements.
32
Table of Contents
SPDR INDEX SHARES FUNDS
STATEMENTS OF OPERATIONS (continued)
For the Year Ended September 30, 2017
| SPDR S&P North American Natural Resources ETF |
||||
| INVESTMENT INCOME |
||||
| Dividend income — unaffiliated issuers (Note 2) |
$ | 17,438,772 | ||
| Dividend income — affiliated issuers (Notes 2 and 3) |
14,348 | |||
| Unaffiliated securities lending income (Note 8) |
6,238 | |||
| Affiliated securities lending income (Notes 3 and 8) |
5,674 | |||
| Foreign taxes withheld |
(687,804 | ) | ||
|
|
|
|||
| TOTAL INVESTMENT INCOME (LOSS) |
16,777,228 | |||
|
|
|
|||
| EXPENSES |
||||
| Advisory fee (Note 3) |
3,122,111 | |||
| Trustees’ fees and expenses (Note 4) |
15,354 | |||
| Miscellaneous expenses |
6,105 | |||
|
|
|
|||
| TOTAL EXPENSES |
3,143,570 | |||
|
|
|
|||
| NET EXPENSES |
3,143,570 | |||
|
|
|
|||
| NET INVESTMENT INCOME (LOSS) |
13,633,658 | |||
|
|
|
|||
| REALIZED AND UNREALIZED GAIN (LOSS) |
||||
| Net realized gain (loss) on: |
||||
| Investments — unaffiliated issuers |
4,376,876 | |||
| In-kind redemptions — unaffiliated issuers |
3,039,696 | |||
| Foreign currency transactions |
40,519 | |||
|
|
|
|||
| Net realized gain (loss) |
7,457,091 | |||
|
|
|
|||
| Net change in unrealized appreciation/depreciation on: |
||||
| Investments — unaffiliated issuers |
18,003,654 | |||
| Foreign currency translations |
(19,929 | ) | ||
|
|
|
|||
| Net change in unrealized appreciation/depreciation |
17,983,725 | |||
|
|
|
|||
| NET REALIZED AND UNREALIZED GAIN (LOSS) |
25,440,816 | |||
|
|
|
|||
| NET INCREASE (DECREASE) IN NET ASSETS FROM OPERATIONS |
$ | 39,074,474 | ||
|
|
|
|||
See accompanying notes to financial statements.
33
Table of Contents
SPDR INDEX SHARES FUNDS
STATEMENTS OF CHANGES IN NET ASSETS
| SPDR Dow Jones Global Real Estate ETF |
||||||||
| Year Ended 9/30/17 |
Year Ended 9/30/16 |
|||||||
| INCREASE (DECREASE) IN NET ASSETS FROM OPERATIONS: |
||||||||
| Net investment income (loss) |
$ | 64,602,385 | $ | 55,808,517 | ||||
| Net realized gain (loss) |
16,578,175 | 34,503,402 | ||||||
| Net change in unrealized appreciation/depreciation |
(96,432,712 | ) | 181,111,849 | |||||
|
|
|
|
|
|||||
| Net increase (decrease) in net assets resulting from operations |
(15,252,152 | ) | 271,423,768 | |||||
|
|
|
|
|
|||||
| Net equalization credits and charges (Note 2) |
(65,431 | ) | 1,321,112 | |||||
|
|
|
|
|
|||||
| DISTRIBUTIONS TO SHAREHOLDERS FROM: |
||||||||
| Net investment income |
(89,877,393 | ) | (72,124,923 | ) | ||||
| Net realized gains |
(857,139 | ) | — | |||||
|
|
|
|
|
|||||
| Total distributions to shareholders |
(90,734,532 | ) | (72,124,923 | ) | ||||
|
|
|
|
|
|||||
| FROM BENEFICIAL INTEREST TRANSACTIONS: |
||||||||
| Proceeds from sale of shares sold |
475,561,849 | 428,829,539 | ||||||
| Cost of shares redeemed |
(175,481,476 | ) | (33,249,580 | ) | ||||
| Net income equalization (Note 2) |
65,431 | (1,321,112 | ) | |||||
|
|
|
|
|
|||||
| Net increase (decrease) in net assets from beneficial interest transactions |
300,145,804 | 394,258,847 | ||||||
|
|
|
|
|
|||||
| Net increase (decrease) in net assets during the period |
194,093,689 | 594,878,804 | ||||||
| Net assets at beginning of period |
2,494,072,532 | 1,899,193,728 | ||||||
|
|
|
|
|
|||||
| NET ASSETS AT END OF PERIOD |
$ | 2,688,166,221 | $ | 2,494,072,532 | ||||
|
|
|
|
|
|||||
| Undistributed (distribution in excess of) net investment income (loss) |
$ | (18,273,130 | ) | $ | (26,720,149 | ) | ||
|
|
|
|
|
|||||
| SHARES OF BENEFICIAL INTEREST: |
||||||||
| Shares sold |
10,000,000 | 8,800,000 | ||||||
| Shares redeemed |
(3,800,000 | ) | (700,000 | ) | ||||
|
|
|
|
|
|||||
| Net increase (decrease) |
6,200,000 | 8,100,000 | ||||||
|
|
|
|
|
|||||
See accompanying notes to financial statements.
34
Table of Contents
SPDR INDEX SHARES FUNDS
STATEMENTS OF CHANGES IN NET ASSETS (continued)
| SPDR Dow Jones International Real Estate ETF |
||||||||
| Year Ended 9/30/17 |
Year Ended 9/30/16 |
|||||||
| INCREASE (DECREASE) IN NET ASSETS FROM OPERATIONS: |
||||||||
| Net investment income (loss) |
$ | 113,061,250 | $ | 123,120,861 | ||||
| Net realized gain (loss) |
5,247,767 | 221,864,440 | ||||||
| Net change in unrealized appreciation/depreciation |
(154,768,441 | ) | 41,798,563 | |||||
|
|
|
|
|
|||||
| Net increase (decrease) in net assets resulting from operations |
(36,459,424 | ) | 386,783,864 | |||||
|
|
|
|
|
|||||
| Net equalization credits and charges (Note 2) |
15,880,576 | 9,706,216 | ||||||
|
|
|
|
|
|||||
| DISTRIBUTIONS TO SHAREHOLDERS FROM: |
||||||||
| Net investment income |
(311,582,179 | ) | (125,444,680 | ) | ||||
|
|
|
|
|
|||||
| FROM BENEFICIAL INTEREST TRANSACTIONS: |
||||||||
| Proceeds from sale of shares sold |
256,719,441 | 131,028,564 | ||||||
| Cost of shares redeemed |
(782,280,454 | ) | (617,190,864 | ) | ||||
| Net income equalization (Note 2) |
(15,880,576 | ) | (9,706,216 | ) | ||||
|
|
|
|
|
|||||
| Net increase (decrease) in net assets from beneficial interest transactions |
(541,441,589 | ) | (495,868,516 | ) | ||||
|
|
|
|
|
|||||
| Net increase (decrease) in net assets during the period |
(873,602,616 | ) | (224,823,116 | ) | ||||
| Net assets at beginning of period |
4,528,235,202 | 4,753,058,318 | ||||||
|
|
|
|
|
|||||
| NET ASSETS AT END OF PERIOD |
$ | 3,654,632,586 | $ | 4,528,235,202 | ||||
|
|
|
|
|
|||||
| Undistributed (distribution in excess of) net investment income (loss) |
$ | (92,868,098 | ) | $ | (45,167,352 | ) | ||
|
|
|
|
|
|||||
| SHARES OF BENEFICIAL INTEREST: |
||||||||
| Shares sold |
7,000,000 | 3,300,000 | ||||||
| Shares redeemed |
(20,600,000 | ) | (15,600,000 | ) | ||||
|
|
|
|
|
|||||
| Net increase (decrease) |
(13,600,000 | ) | (12,300,000 | ) | ||||
|
|
|
|
|
|||||
See accompanying notes to financial statements.
35
Table of Contents
SPDR INDEX SHARES FUNDS
STATEMENTS OF CHANGES IN NET ASSETS (continued)
| SPDR S&P North American Natural Resources ETF |
||||||||
| Year Ended 9/30/17 |
For the Period 12/15/15*- 9/30/16 |
|||||||
| INCREASE (DECREASE) IN NET ASSETS FROM OPERATIONS: |
||||||||
| Net investment income (loss) |
$ | 13,633,658 | $ | 9,889,106 | ||||
| Net realized gain (loss) |
7,457,091 | 63,360,453 | ||||||
| Net change in unrealized appreciation/depreciation |
17,983,725 | 188,973,668 | ||||||
|
|
|
|
|
|||||
| Net increase (decrease) in net assets resulting from operations |
39,074,474 | 262,223,227 | ||||||
|
|
|
|
|
|||||
| Net equalization credits and charges (Note 2) |
344 ,809 | (458,114 | ) | |||||
|
|
|
|
|
|||||
| DISTRIBUTIONS TO SHAREHOLDERS FROM: |
||||||||
| Net investment income |
(13,273,288 | ) | (6,136,433 | ) | ||||
| Net realized gains |
(27,661,995 | ) | — | |||||
|
|
|
|
|
|||||
| Total distributions to shareholders |
(40,935,283 | ) | (6,136,433 | ) | ||||
|
|
|
|
|
|||||
| FROM BENEFICIAL INTEREST TRANSACTIONS: |
||||||||
| Proceeds from sale of shares sold |
199,954,790 | 716,933,368 | ||||||
| Cost of shares redeemed |
(10,426,420 | ) | (144,438,843 | ) | ||||
| Net income equalization (Note 2) |
(344,809 | ) | 458,114 | |||||
| Other capital (Note 6) |
— | 511,124 | ||||||
|
|
|
|
|
|||||
| Net increase (decrease) in net assets from beneficial interest transactions |
189,183,561 | 573,463,763 | ||||||
|
|
|
|
|
|||||
| Net increase (decrease) in net assets during the period |
187,667,561 | 829,092,443 | ||||||
| Net assets at beginning of period |
829,092,443 | — | ||||||
|
|
|
|
|
|||||
| NET ASSETS AT END OF PERIOD |
$ | 1,016,760,004 | $ | 829,092,443 | ||||
|
|
|
|
|
|||||
| Undistributed (distribution in excess of) net investment income (loss) |
$ | 4,191,349 | $ | 3,747,048 | ||||
|
|
|
|
|
|||||
| SHARES OF BENEFICIAL INTEREST: |
||||||||
| Shares sold |
6,150,000 | 29,050,000 | ||||||
| Shares redeemed |
(300,000 | ) | (4,700,000 | ) | ||||
|
|
|
|
|
|||||
| Net increase (decrease) |
5,850,000 | 24,350,000 | ||||||
|
|
|
|
|
|||||
| * | Inception date. |
See accompanying notes to financial statements.
36
Table of Contents
FINANCIAL HIGHLIGHTS
Selected data for a share outstanding throughout each period
| SPDR Dow Jones Global Real Estate ETF | ||||||||||||||||||||
| Year Ended 9/30/17 |
Year Ended 9/30/16 |
Year Ended 9/30/15 |
Year Ended 9/30/14 |
Year Ended 9/30/13 |
||||||||||||||||
| Net asset value, beginning of period |
$ | 49.68 | $ | 45.11 | $ | 44.24 | $ | 42.16 | $ | 40.56 | ||||||||||
|
|
|
|
|
|
|
|
|
|
|
|||||||||||
| Income (loss) from investment operations: |
||||||||||||||||||||
| Net investment income (loss) (a) |
1.19 | 1.23 | 1.17 | 1.23 | 1.16 | |||||||||||||||
| Net realized and unrealized gain (loss) (b) |
(1.51 | ) | 4.88 | 1.04 | 2.24 | 2.21 | ||||||||||||||
|
|
|
|
|
|
|
|
|
|
|
|||||||||||
| Total from investment operations |
(0.32 | ) | 6.11 | 2.21 | 3.47 | 3.37 | ||||||||||||||
|
|
|
|
|
|
|
|
|
|
|
|||||||||||
| Net equalization credits and charges (a) |
(0.00 | )(c) | 0.03 | 0.02 | 0.07 | 0.10 | ||||||||||||||
|
|
|
|
|
|
|
|
|
|
|
|||||||||||
| Distributions to shareholders from: |
||||||||||||||||||||
| Net investment income |
(1.68 | ) | (1.57 | ) | (1.36 | ) | (1.46 | ) | (1.87 | ) | ||||||||||
| Net realized gains |
(0.02 | ) | — | — | — | — | ||||||||||||||
|
|
|
|
|
|
|
|
|
|
|
|||||||||||
| Total distributions |
(1.70 | ) | (1.57 | ) | (1.36 | ) | (1.46 | ) | (1.87 | ) | ||||||||||
|
|
|
|
|
|
|
|
|
|
|
|||||||||||
| Net asset value, end of period |
$ | 47.66 | $ | 49.68 | $ | 45.11 | $ | 44.24 | $ | 42.16 | ||||||||||
|
|
|
|
|
|
|
|
|
|
|
|||||||||||
| Total return (d) |
(0.55 | )% | 13.71 | % | 4.96 | % | 8.44 | % | 8.61 | % | ||||||||||
| Ratios and Supplemental Data: |
||||||||||||||||||||
| Net assets, end of period (in 000s) |
$ | 2,688,166 | $ | 2,494,073 | $ | 1,899,194 | $ | 1,473,132 | $ | 1,003,377 | ||||||||||
| Ratios to average net assets: |
||||||||||||||||||||
| Total expenses |
0.50 | % | 0.50 | % | 0.50 | % | 0.50 | % | 0.50 | % | ||||||||||
| Net investment income (loss) |
2.52 | % | 2.56 | % | 2.46 | % | 2.77 | % | 2.71 | % | ||||||||||
| Portfolio turnover rate (e) |
13 | % | 9 | % | 6 | % | 7 | % | 8 | % | ||||||||||
| (a) | Per share numbers have been calculated using average shares outstanding, which more appropriately presents the per share data for the period. |
| (b) | Amounts shown in this caption for a share outstanding may not accord with the change in aggregate gains and losses in securities for the fiscal period because of the timing of sales and repurchases of Fund shares in relation to fluctuating market values for the Fund. |
| (c) | Amount is less than $0.005 per share. |
| (d) | Total return is calculated assuming a purchase of shares at net asset value on the first day and a sale at net asset value on the last day of each period reported. Distributions are assumed, for the purpose of this calculation, to be reinvested at net asset value per share on the respective payment dates of each distribution. Total returns for periods of less than one year are not annualized. Broker commission charges are not included in this calculation. |
| (e) | Portfolio turnover rate excludes securities received or delivered from in-kind processing of creations or redemptions. |
See accompanying notes to financial statements.
37
Table of Contents
SPDR INDEX SHARES FUNDS
FINANCIAL HIGHLIGHTS (continued)
Selected data for a share outstanding throughout each period
| SPDR Dow Jones International Real Estate ETF | ||||||||||||||||||||
| Year Ended 9/30/17 |
Year Ended 9/30/16 |
Year Ended 9/30/15 |
Year Ended 9/30/14 |
Year Ended 9/30/13 |
||||||||||||||||
| Net asset value, beginning of period |
$ | 41.61 | $ | 39.24 | $ | 41.54 | $ | 42.00 | $ | 39.29 | ||||||||||
|
|
|
|
|
|
|
|
|
|
|
|||||||||||
| Income (loss) from investment operations: |
||||||||||||||||||||
| Net investment income (loss) (a) |
1.16 | 1.08 | 1.02 | 1.39 | 1.29 | |||||||||||||||
| Net realized and unrealized gain (loss) (b) |
(1.36 | ) | 2.32 | (2.07 | ) | 0.16 | 4.01 | |||||||||||||
|
|
|
|
|
|
|
|
|
|
|
|||||||||||
| Total from investment operations |
(0.20 | ) | 3.40 | (1.05 | ) | 1.55 | 5.30 | |||||||||||||
|
|
|
|
|
|
|
|
|
|
|
|||||||||||
| Net equalization credits and charges (a) |
0.16 | 0.08 | (0.01 | ) | (0.06 | ) | 0.02 | |||||||||||||
|
|
|
|
|
|
|
|
|
|
|
|||||||||||
| Distributions to shareholders from: |
||||||||||||||||||||
| Net investment income |
(3.20 | ) | (1.11 | ) | (1.24 | ) | (1.95 | ) | (2.61 | ) | ||||||||||
|
|
|
|
|
|
|
|
|
|
|
|||||||||||
| Net asset value, end of period |
$ | 38.37 | $ | 41.61 | $ | 39.24 | $ | 41.54 | $ | 42.00 | ||||||||||
|
|
|
|
|
|
|
|
|
|
|
|||||||||||
| Total return (c) |
0.48 | % | 8.93 | % | (2.66 | )% | 3.57 | % | 13.83 | %(d) | ||||||||||
| Ratios and Supplemental Data: |
||||||||||||||||||||
| Net assets, end of period (in 000s) |
$ | 3,654,633 | $ | 4,528,235 | $ | 4,753,058 | $ | 4,903,056 | $ | 4,045,899 | ||||||||||
| Ratios to average net assets: |
||||||||||||||||||||
| Total expenses |
0.59 | % | 0.59 | % | 0.60 | % | 0.59 | % | 0.59 | % | ||||||||||
| Net investment income (loss) |
3.03 | % | 2.65 | % | 2.40 | % | 3.27 | % | 3.10 | % | ||||||||||
| Portfolio turnover rate (e) |
18 | % | 14 | % | 8 | % | 8 | % | 11 | % | ||||||||||
| (a) | Per share numbers have been calculated using average shares outstanding, which more appropriately presents the per share data for the period. |
| (b) | Amounts shown in this caption for a share outstanding may not accord with the change in aggregate gains and losses in securities for the fiscal period because of the timing of sales and repurchases of Fund shares in relation to fluctuating market values for the Fund. |
| (c) | Total return is calculated assuming a purchase of shares at net asset value on the first day and a sale at net asset value on the last day of each period reported. Distributions are assumed, for the purpose of this calculation, to be reinvested at net asset value per share on the respective payment dates of each distribution. Total returns for periods of less than one year are not annualized. Broker commission charges are not included in this calculation. |
| (d) | If the Advisor had not made a contribution during the period ended September 30, 2013, the total return would have remained 13.83%. |
| (e) | Portfolio turnover rate excludes securities received or delivered from in-kind processing of creations or redemptions. |
See accompanying notes to financial statements.
38
Table of Contents
SPDR INDEX SHARES FUNDS
FINANCIAL HIGHLIGHTS (continued)
Selected data for a share outstanding throughout each period
| SPDR S&P North American Natural Resources ETF | ||||||||
| Year Ended 9/30/17 | For the Period 12/16/15*- 9/30/16 |
|||||||
| Net asset value, beginning of period |
$ | 34.05 | $ | 25.00 | ||||
|
|
|
|
|
|||||
| Income (loss) from investment operations: |
||||||||
| Net investment income (loss) (a) |
0.50 | 0.39 | ||||||
| Net realized and unrealized gain (loss) (b) |
0.75 | 8.91 | ||||||
|
|
|
|
|
|||||
| Total from investment operations |
1.25 | 9.30 | ||||||
|
|
|
|
|
|||||
| Net equalization credits and charges (a) |
0.01 | (0.02 | ) | |||||
|
|
|
|
|
|||||
| Distributions to shareholders from: |
||||||||
| Net investment income |
(0.51 | ) | (0.25 | ) | ||||
| Net realized gains |
(1.13 | ) | — | |||||
|
|
|
|
|
|||||
| Total distributions |
(1.64 | ) | (0.25 | ) | ||||
|
|
|
|
|
|||||
| Net asset value, end of period |
$ | 33.67 | $ | 34.05 | ||||
|
|
|
|
|
|||||
| Total return (c) |
3.74 | % | 37.21 | % | ||||
| Ratios and Supplemental Data: |
||||||||
| Net assets, end of period (in 000s) |
$ | 1,016,760 | $ | 829,092 | ||||
| Ratios to average net assets: |
||||||||
| Total expenses |
0.35 | % | 0.35 | %(d) | ||||
| Net investment income (loss) |
1.53 | % | 1.63 | %(d) | ||||
| Portfolio turnover rate (e) |
15 | % | 15 | %(f) | ||||
| * | Commencement of operations. |
| (a) | Per share numbers have been calculated using average shares outstanding, which more appropriately presents the per share data for the period. |
| (b) | Amounts shown in this caption for a share outstanding may not accord with the change in aggregate gains and losses in securities for the fiscal period because of the timing of sales and repurchases of Fund shares in relation to fluctuating market values for the Fund. |
| (c) | Total return is calculated assuming a purchase of shares at net asset value on the first day and a sale at net asset value on the last day of each period reported. Distributions are assumed, for the purpose of this calculation, to be reinvested at net asset value per share on the respective payment dates of each distribution. Total returns for periods of less than one year are not annualized. Broker commission charges are not included in this calculation. |
| (d) | Annualized. |
| (e) | Portfolio turnover rate excludes securities received or delivered from in-kind processing of creations or redemptions. |
| (f) | Not annualized. |
See accompanying notes to financial statements.
39
Table of Contents
NOTES TO FINANCIAL STATEMENTS
September 30, 2017
| 1. | Organization |
SPDR Index Shares Funds (the “Trust”), a Massachusetts business trust, registered under the Investment Company Act of 1940, as amended (“1940 Act”), is an open-end management investment company.
As of September 30, 2017, the Trust consists of thirty (30) series, each of which represents a separate series of beneficial interest in the Trust. The Declaration of Trust permits the Board of Trustees of the Trust (the “Board”) to authorize the issuance of an unlimited number of shares of beneficial interest at $0.01 par value. The financial statements herein relate to the following series (each a “Fund”, and collectively, the “Funds”):
SPDR Dow Jones Global Real Estate ETF
SPDR Dow Jones International Real Estate ETF
SPDR S&P North American Natural Resources ETF
Each fund is classified as a non-diversified investment company under the 1940 Act.
Under the Trust’s organizational documents, its officers and trustees are indemnified against certain liabilities arising out of the performance of their duties to the Trust. Additionally, in the normal course of business, the Trust enters into contracts with service providers that contain general indemnification clauses. The Trust’s maximum exposure under these arrangements is unknown as this would involve future claims that may be made against the Trust that have not yet occurred.
| 2. | Summary of Significant Accounting Policies |
The following is a summary of significant accounting policies followed by the Trust in the preparation of its financial statements:
The preparation of financial statements in accordance with U.S. generally accepted accounting principles (“U.S. GAAP”) requires management to make estimates and assumptions that affect the reported amounts and disclosures in the financial statements. Actual results could differ from those estimates. Each Fund is an investment company under U.S. GAAP and follows the accounting and reporting guidance applicable to investment companies.
Security Valuation
Each Fund’s investments are valued at fair value each day that the New York Stock Exchange (“NYSE”) is open and, for financial reporting purposes, as of the report date should the reporting period end on a day that the NYSE is not open. Fair value is
40
Table of Contents
SPDR INDEX SHARES FUNDS
NOTES TO FINANCIAL STATEMENTS (continued)
September 30, 2017
generally defined as the price a fund would receive to sell an asset or pay to transfer a liability in an orderly transaction between market participants at the measurement date. By its nature, a fair value price is a good faith estimate of the valuation in a current sale and may not reflect an actual market price. The investments of each Fund are valued pursuant to the policy and procedures developed by the Oversight Committee (the “Committee”) and approved by the Board. The Committee provides oversight of the valuation of investments for the Funds. The Board has responsibility for determining the fair value of investments.
Valuation techniques used to value each Fund’s investments by major category are as follows:
| • | Equity investments (including registered investment companies that are exchange-traded funds) traded on a recognized securities exchange for which market quotations are readily available are valued at the last sale price or official closing price, as applicable, on the primary market or exchange on which they trade. Equity investments traded on a recognized exchange for which there were no sales on that day are valued at the last published sale price or at fair value. |
| • | Rights and warrants are valued at the last reported sale price obtained from independent pricing services or brokers on the valuation date. If no price is obtained from pricing services or brokers, valuation will be based upon the intrinsic value, pursuant to the valuation policy and procedures approved by the Board. |
| • | Investments in registered investment companies (including money market funds) or other unitized pooled investment vehicles that are not traded on an exchange are valued at that day’s published net asset value (“NAV”) per share or unit. |
In the event prices or quotations are not readily available or that the application of these valuation methods results in a price for an investment that is deemed to be not representative of the fair value of such investment, fair value will be determined in good faith by the Committee, in accordance with the valuation policy and procedures approved by the Board.
Fair value pricing could result in a difference between the prices used to calculate a Fund’s NAV and the prices used by the Funds’ underlying benchmarks. Various inputs are used in determining the value of the Funds’ investments.
The Funds value their assets and liabilities at fair value using a fair value hierarchy consisting of three broad levels that prioritize the inputs to valuation techniques giving the highest priority to readily available unadjusted quoted prices in active markets for identical assets or liabilities (Level 1 measurements) and the lowest priority to unobservable inputs (Level 3 measurements) when market prices are not readily
41
Table of Contents
SPDR INDEX SHARES FUNDS
NOTES TO FINANCIAL STATEMENTS (continued)
September 30, 2017
available or reliable. The categorization of a value determined for an investment within the hierarchy is based upon the pricing transparency of the investment and is not necessarily an indication of the risk associated with investing in it.
The three levels of the fair value hierarchy are as follows:
| • | Level 1 – Unadjusted quoted prices in active markets for an identical asset or liability; |
| • | Level 2 – Inputs other than quoted prices included within Level 1 that are observable for the asset or liability either directly or indirectly, including quoted prices for similar assets or liabilities in active markets, quoted prices for identical or similar assets or liabilities in markets that are not considered to be active, inputs other than quoted prices that are observable for the asset or liability (such as exchange rates, financing terms, interest rates, yield curves, volatilities, prepayment speeds, loss severities, credit risks and default rates) or other market-corroborated inputs; and |
| • | Level 3 – Unobservable inputs for the asset or liability, including the Committee’s assumptions used in determining the fair value of investments. |
The value of each Fund’s investments according to the fair value hierarchy as of September 30, 2017, is disclosed in each Fund’s respective Schedule of Investments.
Changes in valuation techniques may result in transfers in or out of an assigned level within the fair value hierarchy. Transfers between different levels of the fair value hierarchy are recognized at the end of the reporting period. The Funds had no material transfers between levels for the period ended September 30, 2017.
Investment Transactions and Income Recognition
Investment transactions are accounted for on trade date for financial reporting purposes. Realized gains and losses from the sale or disposition of investments and foreign exchange transactions, if any, are determined using the identified cost method.
Dividend income and capital gain distributions, if any, are recognized on the ex-dividend date, net of any foreign taxes withheld at source, if any. Non-cash dividends received in the form of stock are recorded as dividend income at fair value.
Distributions received by the Funds may include a return of capital that is estimated by management. Such amounts are recorded as a reduction of the cost of investments or reclassified to capital gains.
Certain Funds invest in real estate investment trusts (“REITs”). REITs determine the tax character of their distributions annually and may characterize a portion of their distributions as a return of capital or capital gain. The Funds’ policy is to record all
42
Table of Contents
SPDR INDEX SHARES FUNDS
NOTES TO FINANCIAL STATEMENTS (continued)
September 30, 2017
REIT distributions initially as dividend income and re-designate the prior calendar year’s to return of capital or capital gain distributions at year end based on information provided by the REIT and/or SSGA Funds Management, Inc’s. (the “Adviser” or “SSGA FM”) estimates of such re-designations for which actual information has not yet been reported.
Expenses
Certain expenses, which are directly identifiable to a specific Fund, are applied to that Fund within the Trust. Other expenses which cannot be attributed to a specific Fund are allocated in such a manner as deemed equitable, taking into consideration the nature and type of expense and the relative net assets of the Funds within the Trust.
Foreign Currency Translation
The accounting records of the Funds are maintained in U.S. dollars. Foreign currencies as well as investment securities and other assets and liabilities denominated in a foreign currency are translated to U.S. dollars using exchange rates at period end. Purchases and sales of securities, income receipts and expense payments denominated in foreign currencies are translated into U.S. dollars at the prevailing exchange rate on the respective dates of the transactions.
The effects of exchange rate fluctuations on investments are included with the net realized and unrealized gain (loss) on investment securities. Other foreign currency transactions resulting in realized and unrealized gain (loss) are disclosed separately.
Foreign Taxes
The Funds may be subject to foreign taxes (a portion of which may be reclaimable) on income, stock dividends, realized and unrealized capital gains on investments or certain foreign currency transactions. Foreign taxes are recorded in accordance with SSGA FM’s understanding of the applicable foreign tax regulations and rates that exist in the foreign jurisdictions in which the Funds invest. These foreign taxes, if any, are paid by the Funds and are reflected in the Statements of Operations, if applicable. Foreign taxes payable or deferred as of September 30, 2017, if any, are disclosed in the Funds’ Statements of Assets and Liabilities.
As of August 21, 2017, SPDR Dow Jones International Real Estate ETF and SPDR Dow Jones Global Real Estate ETF NAV’s were impacted by an adjustment to certain foreign tax accruals. The per share impacts were $0.01 and $0.01, respectively, on August 21, 2017.
43
Table of Contents
SPDR INDEX SHARES FUNDS
NOTES TO FINANCIAL STATEMENTS (continued)
September 30, 2017
Equalization
The Funds in the Trust follow the accounting practice known as “Equalization” by which a portion of the proceeds from sales and costs of reacquiring Fund shares, equivalent on a per share basis to the amount of distributable net investment income on the date of the transaction, is credited or charged to undistributed net investment income. As a result, undistributed net investment income per share is unaffected by sales or reacquisition of Fund shares. Amounts related to Equalization can be found on the Statements of Changes in Net Assets.
The following Funds utilized equalization during the period ended September 30, 2017:
SPDR Dow Jones Global Real Estate ETF
SPDR Dow Jones International Real Estate ETF
SPDR S&P North American Natural Resources ETF
Distributions
The SPDR Dow Jones Global Real Estate ETF and the SPDR Dow Jones International Real Estate ETF declare and distribute from net investment income, if any, to its shareholders quarterly. The SPDR S&P North American Natural Resources ETF declares and distributes from net investment income, if any, to its shareholders semi-annually.
Net realized capital gains, if any, are distributed annually, unless additional distributions are required for compliance with applicable tax regulations. The amount and character of income and capital gains to be distributed are determined in accordance with applicable tax regulations which may differ from net investment income and realized gains recognized for U.S. GAAP purposes.
| 3. | Fees and Transactions with Affiliates |
Advisory Fee
The Trust, on behalf of each Fund, has entered into an Investment Advisory Agreement with SSGA FM. For its advisory services to the Funds, facilities furnished, and expenses borne by the Adviser, each Fund pays the Adviser a fee accrued daily and paid
44
Table of Contents
SPDR INDEX SHARES FUNDS
NOTES TO FINANCIAL STATEMENTS (continued)
September 30, 2017
quarterly, based on a percentage of each Fund’s average daily net assets as shown in the following table:
| Annual Rate | ||||
| SPDR Dow Jones Global Real Estate ETF |
0.50 | % | ||
| SPDR Dow Jones International Real Estate ETF |
0.59 | |||
| SPDR S&P North American Natural Resources ETF |
0.35 | |||
The Adviser pays all operating expenses of each Fund other than management fee, distribution fee pursuant to each Fund’s Distribution and Service Plan, if any, brokerage expenses, taxes, interest, the fees and expenses of the Trust’s trustees who are “not interested persons” of the Trust, as defined in the 1940 Act, (“Independent Trustees”) (including any Trustees’ counsel fees), litigation expenses, acquired fund fees and expenses and other extraordinary expenses.
Administrator, Sub-Administrator, Custodian, and Transfer Agent Fees
SSGA FM serves as administrator and State Street Bank and Trust Company (“State Street”), an affiliate of the Adviser, serves as custodian, sub-administrator and transfer agent. State Street receives fees for its services as custodian, sub-administrator and transfer agent from the Adviser.
Distribution Fees
State Street Global Advisors Funds Distributors, LLC (“SSGA FD” or the “Distributor”), an affiliate of the Adviser, serves as the distributor of the Trust. Effective May 1, 2017, the Distributor’s name changed from State Street Global Markets, LLC to State Street Global Advisors Funds Distributors, LLC.
Other Transactions with Affiliates — Securities Lending
State Street, an affiliate of the Funds, acts as the securities lending agent for the Funds, pursuant to an amended and restated securities lending authorization agreement dated January 6, 2017.
Proceeds collected by State Street on investment of cash collateral or any fee income are allocated as follows (after deduction of such other amounts payable to State Street under the terms of the securities lending agreement): 85% payable to the Fund, and 15% payable to State Street.
45
Table of Contents
SPDR INDEX SHARES FUNDS
NOTES TO FINANCIAL STATEMENTS (continued)
September 30, 2017
In addition, cash collateral from lending activities is invested in the State Street Navigator Securities Lending Government Money Market Portfolio, an affiliated money market fund, for which SSGA FM serves as investment adviser. See Note 8 for additional information regarding securities lending.
Other Transactions with Affiliates
The Funds may invest in affiliated entities, including securities issued by State Street Corporation, affiliated funds, or entities deemed to be affiliates as a result of the Funds owning more than five percent of the entity’s voting securities or outstanding shares. Amounts relating to these transactions during the period ended September 30, 2017, are disclosed in the Schedules of Investments.
| 4. | Trustees’ Fees |
The fees and expenses of the Trust’s trustees, who are not “interested persons” of the Trust, as defined in the 1940 Act (“Independent Trustees”), are paid directly by the Funds. The Independent Trustees are reimbursed for travel and other out-of-pocket expenses in connection with meeting attendance and industry seminars.
| 5. | Investment Transactions |
Purchases and sales of investments (excluding in-kind transactions, short term investments and derivative contracts) for the period ended September 30, 2017, were as follows:
| Purchases | Sales | |||||||
| SPDR Dow Jones Global Real Estate ETF |
$ | 320,693,303 | $ | 324,911,981 | ||||
| SPDR Dow Jones International Real Estate ETF |
673,571,525 | 888,948,571 | ||||||
| SPDR S&P North American Natural Resources ETF |
132,820,370 | 161,751,018 | ||||||
For the period ended September 30, 2017, the following Funds had in-kind contributions, redemptions and net realized gains/losses in the amounts as follows:
| In-kind Contributions |
In-kind Redemptions |
In-kind Net Realized Gains/(Losses) |
||||||||||
| SPDR Dow Jones Global Real Estate ETF |
$ | 475,411,345 | $ | 175,648,531 | $ | 44,786,107 | ||||||
| SPDR Dow Jones International Real Estate ETF |
255,502,235 | 776,822,654 | 135,498,630 | |||||||||
| SPDR S&P North American Natural Resources ETF |
199,938,880 | 10,426,549 | 3,039,696 | |||||||||
46
Table of Contents
SPDR INDEX SHARES FUNDS
NOTES TO FINANCIAL STATEMENTS (continued)
September 30, 2017
| 6. | Shareholder Transactions |
Each Fund issues and redeems its shares, at NAV, by each Fund only in aggregations of a specified number of shares or multiples thereof (“Creation Units”). Except when aggregated in Creation Units, shares of each Fund are not redeemable. Transactions in capital shares for each Fund are disclosed in detail in the Statements of Changes in Net Assets.
The consideration for the purchase of Creation Units of a Fund may consist of the in-kind deposit of a designated portfolio of securities and a specified amount of cash. Investors purchasing and redeeming Creation Units may pay a purchase transaction fee and a redemption transaction fee directly to the Trust and/or custodian, to offset transfer and other transaction costs associated with the issuance and redemption of Creation Units, including Creation Units for cash. An additional variable fee may be charged for certain transactions. Such variable charges, if any, are included in “Other Capital” on the Statements of Changes on Net Assets.
| 7. | Income Tax Information |
The Funds have qualified and intend to continue to qualify as regulated investment companies under Subchapter M of the Internal Revenue Code of 1986, as amended. Each Fund will not be subject to federal income taxes to the extent it distributes its taxable income, including any net realized capital gains, for each fiscal year. Therefore, no provision for federal income tax is required.
The Funds file federal and various state and local tax returns as required. No income tax returns are currently under examination. Generally, the federal returns are subject to examination by the Internal Revenue Service for a period of three years from date of filing, while the state returns may remain open for an additional year depending upon jurisdiction. SSGA FM has analyzed each Fund’s tax positions taken on tax returns for all open years and does not believe there are any uncertain tax positions that would require recognition of a tax liability.
Distributions to shareholders are recorded on ex-dividend date. Income dividends and gain distributions are determined in accordance with income tax rules and regulations, which may differ from generally accepted accounting principles.
Certain capital accounts in the financial statements have been adjusted for permanent book- tax differences. These adjustments have no impact on NAV or results of operations. Temporary book-tax differences will reverse in the future. These book-tax differences are primarily due to differing treatments for character of distributions, nontaxable dividend adjustments to income, in-kind transactions, foreign currencies, passive foreign investment company, wash sale loss deferrals and distributions in excess of current earnings. In addition, certain Funds claimed a portion of the payments made to redeeming shareholders as a distribution for income tax purposes.
47
Table of Contents
SPDR INDEX SHARES FUNDS
NOTES TO FINANCIAL STATEMENTS (continued)
September 30, 2017
The tax character of distributions paid during the year ended September 30, 2017, was as follows:
| Ordinary Income |
Long-Term Capital Gains |
Total | ||||||||||
| SPDR Dow Jones Global Real Estate ETF |
$ | 87,939,400 | $ | 2,795,132 | $ | 90,734,532 | ||||||
| SPDR Dow Jones International Real Estate ETF |
311,582,179 | — | 311,582,179 | |||||||||
| SPDR S&P North American Natural Resources ETF |
40,935,283 | — | 40,935,283 | |||||||||
The tax character of distributions paid during the year ended September 30, 2016, was as follows:
| Ordinary Income |
Total | |||||||
| SPDR Dow Jones Global Real Estate ETF |
$ | 72,124,923 | $ | 72,124,923 | ||||
| SPDR Dow Jones International Real Estate ETF |
125,444,680 | 125,444,680 | ||||||
| SPDR S&P North American Natural Resources ETF |
6,136,433 | 6,136,433 | ||||||
At September 30, 2017, the components of distributable earnings on a tax basis were as follows:
| Undistributed Ordinary Income |
Capital Loss Carryforwards |
Undistributed Long-Term Capital Gains |
Net Unrealized Gains (Losses) |
Qualified Late- Year Losses* |
Total | |||||||||||||||||||
| SPDR Dow Jones Global Real Estate ETF |
$ | — | $ | (32,356,879 | ) | $ | — | $ | 124,356,743 | $ | — | $ | 91,999,864 | |||||||||||
| SPDR Dow Jones International Real Estate ETF |
— | (717,428,403 | ) | — | 29,702,479 | — | (687,725,924 | ) | ||||||||||||||||
| SPDR S&P North American Natural Resources ETF |
6,049,217 | — | 3,446,622 | 205,938,747 | — | 215,434,586 | ||||||||||||||||||
48
Table of Contents
SPDR INDEX SHARES FUNDS
NOTES TO FINANCIAL STATEMENTS (continued)
September 30, 2017
| * | The Funds have elected to defer certain qualified late-year losses and recognize such losses in the next taxable year. |
As of September 30, 2017, the following Funds had capital loss carryforwards available to offset future realized capital gains through the indicated expiration dates as follows:
| Expiring 2018 | Expiring 2019 | Non-Expiring Short Term** |
Non-Expiring Long Term** |
|||||||||||||
| SPDR Dow Jones Global Real Estate ETF |
$ | — | $ | — | $ | 14,145,669 | $ | 18,211,210 | ||||||||
| SPDR Dow Jones International Real Estate ETF |
162,058,595 | 64,649,806 | 91,361,555 | 399,358,447 | ||||||||||||
| ** | Must be utilized prior to losses subject to expiration. |
As of September 30, 2017, gross unrealized appreciation and gross unrealized depreciation of investments based on cost for federal income tax purposes were as follows:
| Tax Cost |
Gross Unrealized Appreciation |
Gross Unrealized Depreciation |
Net Unrealized Appreciation (Depreciation) |
|||||||||||||
| SPDR Dow Jones Global Real Estate ETF |
$ | 2,576,514,676 | $ | 251,452,246 | $ | 127,055,561 | $ | 124,396,685 | ||||||||
| SPDR Dow Jones International Real Estate ETF |
3,666,936,992 | 213,174,913 | 183,429,968 | 29,744,945 | ||||||||||||
| SPDR S&P North American Natural Resources ETF |
814,074,445 | 218,419,661 | 12,447,118 | 205,972,543 | ||||||||||||
| 8. | Securities Lending |
Each Fund may lend securities to qualified broker-dealers or institutional investors. The loans are secured at all times by cash, cash equivalents or U.S. government securities in an amount at least equal to the market value of the securities loaned, plus accrued interest and dividends, determined on a daily basis and adjusted accordingly. The value of the collateral with respect to a loaned security may be temporarily more or less than the value of a security due to market fluctuations of securities values. With respect to each loan, if on any U.S. business day the aggregate market value of securities collateral plus cash collateral is less than the aggregate market value of the securities which are subject to the loan, the borrower will be notified to provide additional collateral on the next business day.
49
Table of Contents
SPDR INDEX SHARES FUNDS
NOTES TO FINANCIAL STATEMENTS (continued)
September 30, 2017
The Funds will regain record ownership of loaned securities to exercise certain beneficial rights; however, the Funds may bear the risk of delay in recovery of, or even loss of rights in the securities loaned should the borrower fail financially. In addition, a Fund will bear the risk of loss of any cash collateral that it may invest. Each Fund receives compensation for lending its securities from interest or dividends earned on the cash, cash equivalents or U.S. government securities held as collateral, net of fee rebates paid to the borrower and net of fees paid to State Street as the lending agent.
Additionally, a Fund will receive a fee from the borrower for non-cash collateral equal to a percentage of the market value of the loaned securities.
The market value of securities on loan as of September 30, 2017, and the value of the invested cash collateral are disclosed in the Funds’ Statements of Assets and Liabilities. Non-cash collateral is not disclosed in the Funds’ Statements of Assets and Liabilities as it is held by the lending agent on behalf of the Funds, and the Funds do not have the ability to re-hypothecate those securities. Securities lending income, as disclosed in the Funds’ Statements of Operations, represents the income earned from the non-cash collateral and the investment of cash collateral, net of fee rebates paid to the borrower and net of fees paid to State Street as lending agent.
The following is a summary of each Fund’s securities lending agreements and related cash and non-cash collateral received as of September 30, 2017:
| Fund |
Market Value of Securities on Loan |
Cash Collateral Received |
Non Cash Collateral Received* |
Total Collateral Received |
||||||||||||
| SPDR Dow Jones Global Real Estate ETF |
$ | 45,012,420 | $ | 22,923,440 | $ | 24,100,766 | $ | 47,024,206 | ||||||||
| SPDR Dow Jones International Real Estate ETF |
67,514,651 | 60,686,836 | 10,536,100 | 71,222,936 | ||||||||||||
| SPDR S&P North American Natural Resources ETF |
30,253,882 | 4,770,511 | 26,656,504 | 31,427,015 | ||||||||||||
| * | The non-cash collateral includes U.S. Treasuries and U.S. Government Agency securities. |
50
Table of Contents
SPDR INDEX SHARES FUNDS
NOTES TO FINANCIAL STATEMENTS (continued)
September 30, 2017
The following table reflects a breakdown of transactions accounted for as secured borrowings, the gross obligation by the type of collateral pledged or securities loaned, and the remaining contractual maturity of those transactions as of September 30, 2017:
| Remaining Contractual Maturity of the Agreements As of September 30, 2017 | ||||||||||||||||||||||||||||
| Fund |
Securities Lending Transactions |
Overnight and Continuous |
<30 Days | Between 30 & 90 Days |
>90 Days | Total Borrowings |
Gross Amount of Recognized Liabilities for Securities Lending Transactions |
|||||||||||||||||||||
| SPDR Dow Jones Global Real Estate ETF |
Common Stocks | $ | 22,923,440 | $ | — | $ | — | $ | — | $ | 22,923,440 | $ | 22,923,440 | |||||||||||||||
| SPDR Dow Jones International Real Estate ETF |
Common Stocks | 60,686,836 | — | — | — | 60,686,836 | 60,686,836 | |||||||||||||||||||||
| SPDR S&P North American Natural Resources ETF |
Common Stocks | 4,770,511 | — | — | — | 4,770,511 | 4,770,511 | |||||||||||||||||||||
| 9. | Line of Credit |
Certain Funds and other affiliated funds (each a “Participant” and, collectively, the “Participants”) participate in a $360 million revolving credit facility provided by a syndication of banks under which the Participants may borrow to fund shareholder redemptions. This agreement expires in October 2017 unless extended or renewed. Prior to October 13, 2016, the participants could borrow up to $360 million at any time outstanding, subject to asset coverage and other limitations as specified in the agreements.
The following funds participate in the credit facility:
SPDR Dow Jones Global Real Estate ETF
SPDR Dow Jones International Real Estate ETF
The Participants are charged an annual commitment fee which is calculated based on the unused portion of the shared credit line. Commitment fees are allocated among each of the Participants based on relative net assets. Commitment fees are ordinary fund operating expenses paid by the Adviser. A Participant incurs and pays the interest expense related to its borrowing. Interest is calculated at a rate per annum equal to the sum of 1% plus the greater of the New York Fed Bank Rate and 1-month LIBOR rate. Prior to October 13, 2016, interest was calculated at a rate per annum equal to the sum of the New York Fed Bank Rate plus 1%.
Effective October 12, 2017, the Agreement was renewed, and as a result, the Funds and other affiliated Funds participate in a $500 million revolving credit facility.
51
Table of Contents
SPDR INDEX SHARES FUNDS
NOTES TO FINANCIAL STATEMENTS (continued)
September 30, 2017
The Funds had no outstanding loans as of September 30, 2017.
| 10. | Risks |
Concentration Risk
As a result of the Funds’ ability to invest a large percentage of their assets in obligations of issuers within the same country, state, region, currency or economic sector, an adverse economic, business or political development may affect the value of the Funds’ investments more than if the Funds were more broadly diversified.
Foreign and Emerging Markets Risk
Investing in foreign markets involve risks and considerations not typically associated with investing in the U.S. Foreign securities may be subject to risk of loss because of government regulation, economic, political and social instability in the countries in which the Funds invest. Foreign markets may be less liquid than investments in the U.S. and may be subject to the risks of currency fluctuations. To the extent that a Fund invests in securities of issuers located in emerging markets, these risks may be even more pronounced.
Market and Credit Risk
In the normal course of business, the Funds trade financial instruments and enter into financial transactions where risk of potential loss exists due to changes in the general economic conditions and fluctuations of the market (market risk). Additionally, the Fund may also be exposed to credit risk in the event that an issuer or guarantor fails to perform or that an institution or entity with which the Fund has unsettled or open transactions defaults.
| 11. | Subsequent Events |
Management has evaluated the impact of all subsequent events on the Funds through the date on which the financial statements were available to be issued and has determined that there were no subsequent events requiring adjustment or disclosure in the financial statements.
52
Table of Contents
REPORT OF INDEPENDENT REGISTERED PUBLIC
ACCOUNTING FIRM
To the Trustees and Shareholders of the SPDR Index Shares Funds:
In our opinion, the accompanying statements of assets and liabilities, including the schedules of investments, and the related statements of operations and of changes in net assets and the financial highlights present fairly, in all material respects, the financial position of the three funds, listed in Note 1, (each a “Fund”) as of September 30, 2017, the results of each of their operations for the year then ended, the changes in each of their net assets and the financial highlights for the periods indicated, in conformity with accounting principles generally accepted in the United States of America. These financial statements and financial highlights (hereafter referred to as “financial statements”) are the responsibility of the Trust’s management. Our responsibility is to express an opinion on these financial statements based on our audits. We conducted our audits of these financial statements in accordance with the standards of the Public Company Accounting Oversight Board (United States). Those standards require that we plan and perform the audit to obtain reasonable assurance about whether the financial statements are free of material misstatement. An audit includes examining, on a test basis, evidence supporting the amounts and disclosures in the financial statements, assessing the accounting principles used and significant estimates made by management, and evaluating the overall financial statement presentation. We believe that our audits, which included confirmation of securities as of September 30, 2017 by correspondence with the custodian and brokers and the application of alternative auditing procedures where securities purchased had not been received, provide a reasonable basis for the opinion expressed above.
/s/ PricewaterhouseCoopersLLP
Boston, Massachusetts
November 21, 2017
53
Table of Contents
OTHER INFORMATION
September 30, 2017 (Unaudited)
Expense Example
As a shareholder of a Fund, you incur two types of costs (1) transaction costs, including sales charges (loads), if applicable, on purchase payments, reinvested dividends, or other distributions and (2) ongoing costs, including advisory fees and other Fund expenses. This example is intended to help you understand your ongoing costs (in dollars) of investing in the Fund and to compare these costs with the ongoing costs of investing in other mutual funds. It is based on an investment of $1,000 made at the beginning of the period shown and held for the entire period from April 1, 2017 to September 30, 2017.
The table below illustrates your Fund’s cost in two ways:
Based on actual fund return — This section helps you to estimate the actual expenses that you paid over the period. The “Ending Account Value” shown is derived from each Fund’s actual return, and the third column shows the dollar amount that would have been paid by an investor who started with $1,000 in the Fund. You may use the information here, together with the amount you invested, to estimate the expenses that you paid over the period. To do so, simply divide your account value by $1,000 (for example, an $8,600 account value divided by $1,000 = 8.6), then multiply the result by the number given for the Fund under the heading “Expenses Paid During Period”.
Based on hypothetical 5% return — This section is intended to help you compare your Fund’s costs with those of other mutual funds. It assumes that the Fund had a yearly return of 5% before expenses, but that the expense ratio is unchanged. In this case, because the return used is not the Fund’s actual return, the results do not apply to your investment. The example is useful in making comparisons because the U.S. Securities and Exchange Commission (the “SEC”) requires all mutual funds to calculate expenses based on a 5% return. You can assess your Fund’s costs by comparing this hypothetical example with the hypothetical examples that appear in shareholder reports of other funds.
Please note that the expenses shown in the table are meant to highlight your ongoing costs only and do not reflect any transaction costs, such as sales load charges (loads). Therefore, the hypothetical 5% return section of the table is useful in comparing ongoing costs only, and will not help you determine the relative total costs of owning different funds. In addition, if these transaction costs were included, your costs would have been higher.
54
Table of Contents
SPDR INDEX SHARES FUNDS
OTHER INFORMATION (continued)
September 30, 2017 (Unaudited)
| SPDR Dow Jones Global Real Estate ETF |
SPDR Dow Jones International Real Estate ETF |
SPDR S&P North American Natural Resources ETF |
||||||||||
| Annualized Expense Ratio |
0.50 | % | 0.59 | % | 0.35 | % | ||||||
| Actual: |
||||||||||||
| Ending Account Value |
$ | 1,029.50 | $ | 1,047.50 | $ | 1,020.70 | ||||||
| Expenses Paid During Period(a) |
2.54 | 3.03 | 1.77 | |||||||||
| Hypothetical (assuming a 5% return before expenses): |
||||||||||||
| Ending Account Value |
1,022.60 | 1,022.10 | 1,023.30 | |||||||||
| Expenses Paid During Period(a) |
2.54 | 2.99 | 1.78 | |||||||||
| (a) | Expenses are equal to the Fund’s annualized net expense ratio multiplied by the average account value of the period, multiplied by 183, then divided by 365. |
Tax Information
For federal income tax purposes, the following information is furnished with respect to the distributions of the Trust for its fiscal year ended September 30, 2017.
Dividends Received Deduction
Each Fund reports the maximum amount allowable of its net taxable income as eligible for the corporate dividends received deduction.
Qualified Dividend Income
A portion of dividends distributed by the Funds during the fiscal year ended September 30, 2017 are considered qualified dividend income and are eligible for reduced tax rates. These lower rates range from 5% to 20% depending on the individual’s tax bracket. Each Fund reports the maximum amount allowable of its net taxable income as qualified dividend income as provided in the Jobs and Growth Tax Relief Reconciliation Act of 2003.
Qualified Interest Income
Each fund reports the maximum amount allowable of its net taxable income and short-term capital gain as qualified interest income.
55
Table of Contents
SPDR INDEX SHARES FUNDS
OTHER INFORMATION (continued)
September 30, 2017 (Unaudited)
Long term capital gains dividends were paid from the following Funds during the year ended September 30, 2017:
| Amount | ||||
| SPDR Dow Jones Global Real Estate ETF |
$ | 2,795,132 | ||
| SPDR S&P North American Natural Resources ETF |
40,235 | |||
Foreign Tax Credit
The Trust has made an election under Internal Revenue Code Section 853 to pass through foreign taxes paid by a Fund to its shareholders. For the year ended September 30, 2017, the total amount of foreign taxes that will be passed through are:
| Amount | ||||
| SPDR Dow Jones International Real Estate ETF |
$ | 9,552,989 | ||
The amount of foreign source income earned on the following Funds during the year ended September 30, 2017 were as follows:
| Amount | ||||
| SPDR Dow Jones International Real Estate ETF |
$ | 149,154,136 | ||
Premium/Discount Information
Information regarding how often the Shares of each Fund traded on the exchange at a price above (i.e. at a premium) or below (i.e. at a discount) the NAV of the Fund during the past calendar year can be found at http://www.spdrs.com.
Proxy Voting Policies and Procedures and Records
A description of the Trust’s proxy voting policies and procedures that are used by the Funds’ investment adviser to vote proxies relating to the Funds’ portfolio of securities are available (i) without charge, upon request by calling 1-866-787-2257 (toll free) or (ii) on the SEC’s website, at www.sec.gov.
Information regarding how the investment adviser voted for the most recent period ended June 30 is available by August 31 of each year by calling the same number and on the SEC’s website, at www.sec.gov, and on the Funds’ website at www.spdrs.com.
56
Table of Contents
SPDR INDEX SHARES FUNDS
OTHER INFORMATION (continued)
September 30, 2017 (Unaudited)
Quarterly Portfolio Schedule
The Funds file a complete schedule of investments with the SEC for the first and third quarters of each fiscal year on Form N-Q. The Funds’ Forms N-Q are available on the SEC’s website at www.sec.gov and may be reviewed and copied at the SEC’s Public Reference Room in Washington DC. Information on the operation of the Public Reference Room may be obtained by calling 1-800-SEC-0330. The information on the Form N-Q is available upon request, without charge, by calling 1-866-787-2257 (toll free) and on the Funds’ website at www.spdrs.com.
Approval of Advisory Agreement
At an in-person meeting held prior to September 30, 2017, the Board of Trustees of the Trust (the “Board”) evaluated proposals to continue the Investment Advisory Agreement (the “Agreement”) between the Trust and SSGA Funds Management, Inc. (the “Adviser” or “SSGA FM”) with respect to the operational series of the Trust (collectively, the “Current ETFs”) and to continue the Agreement with respect to the previously approved non-operational series of the Trust (together with the Current ETFs, the “SPDR ETFs”). The Trustees who are not “interested persons” of the Trust within the meaning of the Investment Company Act of 1940, as amended (the “Independent Trustees”), also met separately with their independent legal counsel to consider the Agreement.
In evaluating the Agreement, the Board drew on materials provided to them by SSGA FM, the Trust’s investment adviser and administrator, and other materials provided by State Street Bank and Trust Company, the Trust’s sub-administrator, transfer agent and custodian (“State Street”). In deciding whether to approve the Agreement, the Board considered various factors, including the (i) nature, extent and quality of services provided by the Adviser with respect to the SPDR ETFs under the Agreement, (ii) investment performance of the Current ETFs, (iii) profits realized by the Adviser and its affiliates from its relationship with the Trust, (iv) fees charged to comparable funds, (v) other benefits to the Adviser, and (vi) extent to which economies of scale would be shared as the SPDR ETFs grow.
Nature, Extent and Quality of Services
The Board considered the nature, extent and quality of services provided by the Adviser. In doing so, the Trustees relied on their prior experience in overseeing the management of the Trust and materials provided prior to and at the meeting. The Board reviewed the Agreement and the Adviser’s responsibilities for managing investment operations of each of the SPDR ETFs in accordance with each SPDR ETF’s investment objectives and policies, and applicable legal and regulatory requirements. The Board appreciated the
57
Table of Contents
SPDR INDEX SHARES FUNDS
OTHER INFORMATION (continued)
September 30, 2017 (Unaudited)
nature of the SPDR ETFs as exchange-traded funds and the experience and expertise of the Adviser with exchange-traded funds. The Board considered the background and experience of the Adviser’s senior management, including those individuals responsible for portfolio management, oversight of sub-advisers and regulatory compliance of the SPDR ETFs. The Board also considered the portfolio management resources, structures and practices of the Adviser, including those associated with monitoring and securing each SPDR ETF’s compliance with its investment objectives and policies and with applicable laws and regulations. The Board also considered information about the Adviser’s best execution procedures and overall investment management business, noting that the Adviser serves a wide range of clients across a broad spectrum of asset classes. The Board looked at the Adviser’s general knowledge of the investment management business and that of its affiliates which make up State Street Global Advisors, through which the Adviser shares all of its senior personnel. The Board considered that the Adviser and its affiliates constitute one of the world’s largest investment management enterprises for indexed products generally and exchange-traded funds in particular. The Board specifically considered the Adviser’s experience in managing equity exchange-traded funds with index-based investment objectives and in overseeing third-party sub-advisers, as applicable.
Investment Performance
The Board then reviewed the Current ETFs’ performance, noting that the distinctive indexed investment objective of each of the Current ETFs made analysis of investment performance, in absolute terms, less of a priority than that which normally attaches to the performance of actively-managed funds. Instead, the Board focused on the extent to which each Current ETF achieved its objective as a passively-managed index fund. The Board reviewed information regarding the Current ETFs’ index tracking, noting that each Current ETF satisfactorily tracked its benchmark index.
Profits Realized by the Adviser
The Board considered the profitability of the advisory arrangement with the Current ETFs to the Adviser, including data on the Current ETFs’ historical profitability to the Adviser. The Independent Trustees, with their independent legal counsel, had the opportunity to discuss, with representatives of the Adviser and State Street, methodologies used in computing costs that formed the bases of profitability calculations and determined that these methodologies were reasonable.
58
Table of Contents
SPDR INDEX SHARES FUNDS
OTHER INFORMATION (continued)
September 30, 2017 (Unaudited)
Fees Charged to Comparable Funds
The Board evaluated each SPDR ETF’s unitary fee through review of comparative information with respect to fees paid by similar funds – i.e., exchange-traded funds tracking similar equity indexes. The Board reviewed the universe of similar exchange-traded funds for each SPDR ETF based upon data independently obtained from Broadridge Financial Solutions, Inc. (formerly Lipper Analytical Services) and related comparative information for similar exchange-traded funds. In doing so, the Board used a fund by fund analysis of the data.
Other Benefits
The Board also considered whether the Adviser or its affiliates benefited in other ways from its relationship with the Trust, noting that the Adviser does not maintain soft-dollar arrangements in connection with the Trust’s brokerage transactions.
Economies of Scale
The Board reviewed information regarding economies of scale or other efficiencies that may result as each SPDR ETF’s assets grow in size. The Board noted that the Agreement did not provide for breakpoints in each SPDR ETF’s advisory fee rates as assets of a SPDR ETF increase. However, the Board further noted the Adviser’s assertion that future economies of scale (among several factors) had been taken into consideration for the SPDR ETFs by fixing relatively low advisory fees, effectively sharing the benefits of lower fees with the SPDR ETFs from inception. The Adviser also asserted that one of the benefits of the unitary fee was to provide an unvarying expense structure, which could be lost or diluted with the addition of breakpoints. The Board noted that it intends to continue to monitor fees as the SPDR ETFs grow in size and assess whether fee breakpoints may be warranted.
Conclusion
The Board, including the Independent Trustees voting separately, approved the Agreement for each SPDR ETF after weighing the foregoing factors, none of which was dispositive in itself and may have been weighed differently by each Trustee. The Board’s conclusions with respect to the Agreement were as follows: (a) the nature and extent of the services provided by the Adviser with respect to the SPDR ETFs were appropriate; (b) the performance and, more importantly, the index tracking, of each Current ETF had been satisfactory; (c) the Adviser’s unitary fee for each SPDR ETF, considered in relation to services provided and in relation to fees charged to comparable funds, was fair and reasonable; (d) profitability of the Trust’s relationships with the Adviser was not excessive; (e) any additional potential benefits to the Adviser or its affiliates were not of a magnitude to materially affect the Board’s conclusions; and (f) fees paid to the Adviser adequately shared the economies of scale with respect to the Current ETFs by way of the relatively low fee structure of the Trust.
59
Table of Contents
SPDR INDEX SHARES FUNDS
OTHER INFORMATION (continued)
September 30, 2017 (Unaudited)
Approval of State Street Global Advisors Asia Limited Sub-Advisory Agreement
At an in-person meeting held prior to September 30, 2017, the Board also evaluated a proposal to continue the Sub-Advisory Agreement (the “SSGA Asia Limited Sub-Advisory Agreement”) between the Adviser and State Street Global Advisors Asia Limited (“SSGA Asia Limited”), an affiliate of the Adviser, with respect to the SPDR MSCI China A Shares IMI ETF (the “Fund”), which is sub-advised by SSGA Asia Limited. The Independent Trustees also met separately with their independent legal counsel to consider the SSGA Asia Limited Sub-Advisory Agreement.
In evaluating the SSGA Asia Limited Sub-Advisory Agreement, the Board drew on materials provided to them by SSGA Asia Limited and the Adviser. In deciding whether to approve the SSGA Asia Limited Sub-Advisory Agreement, the Board considered various factors, including the (i) nature, extent and quality of services provided by SSGA Asia Limited with respect to the Fund under the SSGA Asia Limited Sub-Advisory Agreement and (ii) investment performance of the Fund. The Board was informed of the portion of the current advisory fee that the Adviser would pay to SSGA Asia Limited under the SSGA Asia Limited Sub-Advisory Agreement and also considered that such fees would be paid directly by the Adviser and would not result in increased fees payable by the Fund.
The Board considered the background and experience of SSGA Asia Limited’s senior management and, in particular, SSGA Asia Limited’s experience in investing in Asian equity securities. The Board reviewed the Fund’s performance, noting that the Fund tracked its benchmark index. The Board also considered the unitary fee paid to the Adviser by the Fund and SSGA Asia Limited’s fees paid by the Adviser. The Board also considered whether SSGA Asia Limited benefited in other ways from its relationship with the Trust.
The Board, including the Independent Trustees voting separately, approved the SSGA Asia Limited Sub-Advisory Agreement for the Fund after weighing the foregoing factors as well as the relevant factors discussed in relation to the Agreement between the Trust and the Adviser, none of which was dispositive in itself and may have been weighed differently by each Trustee. The Board’s conclusions with respect to the SSGA Asia Limited Sub-Advisory Agreement were as follows: (a) the nature and extent of the services provided by SSGA Asia Limited with respect to the Fund were appropriate; (b) the performance and, more importantly, the index tracking, of the Fund had been satisfactory; (c) SSGA Asia Limited’s fees for the Fund and the unitary fee, considered in relation to the services provided, were fair and reasonable; (d) any additional potential
60
Table of Contents
SPDR INDEX SHARES FUNDS
OTHER INFORMATION (continued)
September 30, 2017 (Unaudited)
benefits to SSGA Asia Limited were not of a magnitude to materially affect the Board’s conclusions; and (e) fees paid to SSGA Asia Limited adequately shared the economies of scale with the Fund by way of the relatively low fee structure of the Trust.
TRUSTEES AND OFFICERS
| Name, Address |
Position(s) |
Term of |
Principal Occupation(s) 5 Years |
Number of Portfolios in Fund Complex Overseen by Trustee† |
Other | |||||||
| Trustees |
||||||||||||
| Independent Trustees |
||||||||||||
| FRANK NESVET |
Independent Trustee, Chairman, Trustee Committee Chair | Term: Unlimited Served: since September 2000 | Retired. | 148 | None. | |||||||
| DAVID M. KELLY |
Independent Trustee | Term: Unlimited Served: since September 2000 | Retired. | 148 | Chicago Stock Exchange (Former Director, retired); Penson Worldwide Inc. (Former Director, retired). | |||||||
| BONNY EUGENIA BOATMAN |
Independent Trustee | Term: Unlimited Served: since April 2010 | Retired. | 148 | None. | |||||||
| DWIGHT D. CHURCHILL |
Independent Trustee | Term: Unlimited Served: since April 2010 | Self-employed consultant since 2010; CEO and President, CFA Institute (June 2014-January 2015). | 148 | Affiliated Managers Group, Inc. (Director). | |||||||
| CARL G. VERBONCOEUR |
Independent Trustee, Audit Committee Chair | Term: Unlimited Served: since April 2010 | Self-employed consultant since 2009. | 148 | The Motley Fool Funds Trust (Trustee). | |||||||
61
Table of Contents
SPDR INDEX SHARES FUNDS
OTHER INFORMATION (continued)
September 30, 2017 (Unaudited)
| Name, Address |
Position(s) |
Term of |
Principal Occupation(s) 5 Years |
Number of Portfolios in Fund Complex Overseen by Trustee† |
Other | |||||||
| Interested Trustee |
||||||||||||
| JAMES E. ROSS* |
Interested Trustee | Term: Unlimited Served as Trustee: since April 2010 | Chairman and Director, SSGA Funds Management, Inc. (2005-present); Executive Vice President, State Street Global Advisors (2006-present); Chief Executive Officer and Director, State Street Global Advisors Funds Distributors, LLC (May 2017- present); Director, State Street Global Markets, LLC (2013-April 2017); President, SSGA Funds Management, Inc. (2005-2012); Principal, State Street Global Advisors (2000 - 2005). | 234 | SSGA SPDR ETFs Europe I plc (Director) (November 2016- present); SSGA SPDR ETFs Europe II plc (Director) (November 2016- present). | |||||||
| † | For the purpose of determining the number of portfolios overseen by the Trustees, “Fund Complex” comprises registered investment companies for which SSGA Funds Management, Inc. serves as investment adviser. |
| * | Mr. Ross is an Interested Trustee because of his employment with the Adviser and ownership interest in an affiliate of the Adviser. Mr. Ross previously served as an Interested Trustee from November 2005 to December 2009. |
62
Table of Contents
SPDR INDEX SHARES FUNDS
OTHER INFORMATION (continued)
September 30, 2017 (Unaudited)
| Name, Address |
Position(s) with Funds |
Term of |
Principal Occupation(s) During the Past 5 Years | |||||
| Officers |
||||||||
| ELLEN M. NEEDHAM |
President | Term: Unlimited Served: since October 2012 | President and Director, SSGA Funds Management, Inc. (2001 - present)*; Senior Managing Director, State Street Global Advisors (1992 - present)*; Director, State Street Global Advisors Funds Distributors, LLC (May 2017 - present). | |||||
| BRUCE S. ROSENBERG |
Treasurer | Term: Unlimited Served: since February 2016 | Managing Director, State Street Global Advisors and SSGA Funds Management, Inc. (July 2015 - present); Director, Credit Suisse (April 2008 - July 2015). | |||||
| ANN M. CARPENTER |
|
Vice President; Deputy Treasurer |
|
Term: Unlimited Served: since August 2012; Term: Unlimited Served: since April 2015 | Chief Operating Officer, SSGA Funds Management, Inc. (2005 - Present)*; Managing Director, State Street Global Advisors (2005 - present).* | |||
| MICHAEL P. RILEY |
|
Vice President |
|
Term: Unlimited Served: since February 2005 | Managing Director, State Street Global Advisors (2005 - present).* | |||
| JOSHUA A. WEINBERG |
|
Chief Legal Officer |
|
Term: Unlimited Served: since February 2015 | Managing Director and Managing Counsel, State Street Global Advisors (2011 - present); Clerk, SSGA Funds Management, Inc. (2013 - present); Associate, Financial Services Group, Dechert LLP (2006 - 2011). | |||
| JESSE D. HALLEE |
Secretary | Term: Unlimited Served: since August 2017 | Vice President and Managing Counsel, State Street Bank and Trust Company (2013 – present); Vice President and Counsel, Brown Brothers Harriman & Co. (2007- 2013).** | |||||
63
Table of Contents
SPDR INDEX SHARES FUNDS
OTHER INFORMATION (continued)
September 30, 2017 (Unaudited)
| Name, Address |
Position(s) with Funds |
Term of |
Principal Occupation(s) During the Past 5 Years | |||
| CHAD C. HALLETT |
Deputy Treasurer |
Term: Unlimited Served: since February 2016 | Vice President, State Street Global Advisors and SSGA Funds Management, Inc. (November 2014 - present); Vice President, State Street Bank and Trust Company (2001 - November 2014).* | |||
| DARLENE ANDERSON-VASQUEZ |
Deputy Treasurer |
Term: Unlimited Served: since November 2016 | Managing Director, State Street Global Advisors and SSGA Funds Management, Inc. (May 2016 - present); Senior Vice President, John Hancock Investments (September 2007 - May 2016). | |||
| ARTHUR A. JENSEN |
Deputy Treasurer |
Term: Unlimited Served: Since August 2017 | Vice President at State Street Global Advisors (July 2016 – present); Mutual Funds Controller of GE Asset Management Incorporated (April 2011 - July 2016). | |||
| SUJATA UPRETI |
Assistant Treasurer |
Term: Unlimited Served: since February 2016 | Vice President, State Street Global Advisors and SSGA Funds Management, Inc. (May 2015 - present); Assistant Director, Cambridge Associates, LLC (July 2014 - January 2015); Vice President, Bank of New York Mellon (July 2012 - August 2013); Manager, PricewaterhouseCoopers, LLP (September 2003 - July 2012). | |||
| DANIEL FOLEY |
Assistant Treasurer |
Term: Unlimited Served: since February 2016 | Vice President, State Street Global Advisors and SSGA Funds Management, Inc. (April 2007 - present).* | |||
| DANIEL G. PLOURDE |
Assistant Treasurer |
Term: Unlimited Served: since May 2017 | Assistant Vice President, SSGA Funds Management, Inc. (May 2015 - present); Officer, State Street Bank and Trust Company (March 2009 - May 2015). | |||
64
Table of Contents
SPDR INDEX SHARES FUNDS
OTHER INFORMATION (continued)
September 30, 2017 (Unaudited)
| Name, Address |
Position(s) with Funds |
Term of |
Principal Occupation(s) During the Past 5 Years | |||
| BRIAN HARRIS |
Chief Compliance Officer; Anti- Money Laundering Officer; Code of Ethics Compliance Officer |
Term: Unlimited Served: since November 2013 | Managing Director, State Street Global Advisors and SSGA Funds Management, Inc. (June 2013 - present)*; Senior Vice President and Global Head of Investment Compliance, BofA Global Capital Management (2010 - 2013). |
| * | Served in various capacities and/or with various affiliated entities during noted time period. |
| ** | Served in various capacities and/or with unaffiliated mutual funds or closed-end funds for which State Street Bank and Trust Company or its affiliates act as a provider of services during the noted time period. |
The Trust’s Statement of Additional Information (SAI) includes additional information about Funds’ directors and is available, without charge, upon request and by calling 1-866-787-2257.
65
Table of Contents
SPDR® Index Shares Funds
SPDR Index Shares Funds
| Trustees
Bonny E. Boatman Dwight D. Churchill David M. Kelly Frank Nesvet, Chairman James E. Ross Carl G. Verboncoeur
Investment Manager and Administrator
SSGA Funds Management, Inc. State Street Financial Center One Lincoln Street Boston, MA 02111
Distributor
State Street Global Advisors Funds Distributors, LLC One Lincoln Street Boston, MA 02111 |
Custodian, Sub-Administrator and Transfer Agent
State Street Bank and Trust Company One Lincoln Street Boston, MA 02111
Legal Counsel
Morgan, Lewis & Bockius LLP 1111 Pennsylvania Avenue, NW Washington, DC 20004
Independent Registered Public Accounting Firm
PricewaterhouseCoopers LLP 101 Seaport Boulevard Suite 500 Boston, MA 02210 | |
Fund Shares are distributed by State Street Global Advisors Funds Distributors, LLC, a wholly-owned subsidiary of State Street Corporation. State Street Global Advisors Funds Distributors, LLC; member FINRA, SIPC.
The information contained in this report is intended for the general information of shareholders of the Trust. This report is not authorized for distribution to prospective investors unless preceded or accompanied by a current Trust prospectus which contains important information concerning the Trust. You may obtain a current prospectus and SAI from the Distributor by calling 1-866-787-2257 or visiting www.spdrs.com. Please read the prospectus carefully before you invest.
Table of Contents
SPDR® Index Shares Funds
For more complete information, please call 866.787.2257 or visit spdrs.com today.
ssga.com | spdrs.com
The information contained in this report is intended for the general information of shareholders of the Trust. This report is not authorized for distribution to prospective investors unless preceded or accompanied by a current Trust prospectus which contains important information concerning the Trust. You may obtain a current prospectus and SAI from the Distributor by calling 1-866-787-2257 or visiting www.spdrs.com. Please read the prospectus carefully before you invest.
| State Street Global Advisors | © 2017 State Street Corporation - All Rights Reserved | |
| IBG - 25740 | 0515 Exp. Date: 11/30/2018 SPDRISRAAR |
Table of Contents
Item 2. Code of Ethics.
As of the end of the period covered by this report, the registrant has adopted a code of ethics that applies to the registrant’s principal executive officer, principal financial officer, principal accounting officer or controller, or persons performing similar functions, regardless of whether these individuals are employed by the registrant or a third party (the “Code of Ethics”). During the period covered by this report, no substantive amendments were made to the Code of Ethics. During the period covered by this report, the registrant did not grant any waivers, including any implicit waivers, from any provision of the Code of Ethics.
The Code of Ethics is attached hereto as Exhibit 13(a)(1).
Item 3. Audit Committee Financial Expert.
(a)(1) The Board of Trustees of the registrant has determined that the registrant has five Board members serving on the Audit Committee that possess the attributes identified in Instructions 2(b) of Item 3 to Form N-CSR to qualify as an “audit committee financial expert.”
(2) Bonny Boatman, Dwight Churchill, David M. Kelly, Frank Nesvet and Carl Verboncoeur are the registrant’s audit committee financial experts. The Board also determined that each of the foregoing persons are not “interested person(s)” of the registrant as that term is defined in Section 2(a)(19) of the Investment Company Act of 1940, as amended (the “1940 Act”).
Item 4. Principal Accountant Fees and Services.
(a) Audit Fees.
For the fiscal years ending September 30, 2017 and September 30, 2016, the aggregate audit fees billed for professional services rendered by the principal accountant were $588,387 and $917,123, respectively. The nature of the services are (1) auditing of the statements of assets and liabilities, related statements of operations and changes in net assets, and the financial highlights of each series of the registrant; (2) auditing and reporting on the financial statements to be included in the amendment to the registrant’s registration statement on Form N-1A to be filed with the Securities and Exchange Commission; (3) review of the amendment to the registration statement; (4) issuance of a Report on Internal Control for inclusion in the registrant’s Form N-SAR; and (5) Rule 17f-2 securities counts.
(b) Audit-Related Fees.
For the fiscal years ending September 30, 2017 and September 30, 2016, the principal accountant did not bill the registrant any fees for assurances and related services that are reasonably related to the performance of the audit of the registrant’s financial statements and are not reported under paragraph (a) of this Item.
(c) Tax Fees.
For the fiscal years ending September 30, 2017 and September 30, 2016, the aggregate tax fees billed for professional services rendered by the principal accountant were $525,270 and $ 534,450, respectively. Services included the review of the registrant’s federal, state and local income, franchise and other tax returns.
(d) All Other Fees.
There were no other fees billed by the principal accountant for the fiscal years ending September 30, 2017 and September 30, 2016.
Table of Contents
(e)(1) Audit Committee Pre-Approval Policies and Procedures.
The registrant’s Audit Committee Charter states the following with respect to pre-approval procedures:
Before the independent auditors are engaged by the Trust to render audit or non-audit services, either:
| a. | The Audit Committee shall pre-approve all auditing services and permissible non-audit services (e.g., tax services) provided to the Trust. The Audit Committee may delegate to one or more of its members the authority to grant pre-approvals. Any decision of any member to whom authority is delegated under this section shall be presented to the full Audit Committee at its next regularly scheduled meeting; or |
| b. | The engagement to render the auditing service or permissible non-audit service is entered into pursuant to pre-approval policies and procedures established by the Audit Committee. Any such policies and procedures must (1) be detailed as to the particular service and (2) not involve any delegation of the Audit Committee’s responsibilities to the investment adviser. The Audit Committee must be informed of each service entered into pursuant to the policies and procedures. A copy of any such policies and procedures shall be attached as an exhibit to the Audit Committee Charter. |
| c. | De Minimis Exceptions to Pre-Approval Requirements. Pre-Approval for a service provided to the Trust other than audit, review or attest services is not required if: (1) the aggregate amount of all such non-audit services provided to the Trust constitutes not more than 5 percent of the total amount of revenues paid by the Trust to the independent auditors during the fiscal year in which the non-audit services are provided; (2) such services were not recognized by the Trust at the time of the engagement to be non-audit services; and (3) such services are promptly brought to the attention of the Audit Committee and are approved by the Audit Committee or by one or more members of the Audit Committee to whom authority to grant such approvals has been delegated by the Audit Committee prior to the completion of the audit. |
| d. | Pre-Approval of Non-Audit Services Provided to the investment adviser and Certain Control Persons. The Audit Committee shall pre-approve any non-audit services proposed to be provided by the independent auditors to (a) the investment adviser and (b) any entity controlling, controlled by, or under common control with the investment adviser that provides ongoing services to the Trust, if the independent auditors’ engagement with the investment adviser or any such control persons relates directly to the operations and financial reporting of the Trust. It shall be the responsibility of the independent auditors to notify the Audit Committee of any non-audit services that need to be pre-approved. |
| e. | Application of De Minimis Exception. The De Minimis exception set forth above applies to pre-approvals under this Section as well, except that the “total amount of revenues” calculation is based on the total amount of revenues paid to the independent auditors by the Trust and any other entity that has its services approved under this Section (i.e., the investment adviser or any control person). |
(e)(2) Percentage of Services.
One hundred percent of the services described in each of paragraphs (b) through (d) of this Item were approved by the registrant’s Audit Committee pursuant to paragraph (c)(7)(i)(C) of Rule 2-01 of Regulation S-X.
(f) Not applicable.
Table of Contents
(g) The aggregate non-audit fees for services rendered by the principal accountant to the registrant and its adviser and any entity controlling, controlled by, or under common control with the adviser that provided ongoing services to the registrant for the twelve months ended December 31, 2016 and December 31, 2015 were approximately $4,919,389 and $2,599,622, respectively. Such information is not readily available on a fiscal year basis.
(h) The registrant’s principal accountant notified the registrant’s Audit Committee of all non-audit services that were rendered by the principal accountant to the registrant’s adviser and any entity controlling, controlled by, or under common control with the adviser that provides services to the registrant, which services were not required to be pre-approved pursuant to paragraph (c)(7)(ii) of Rule 2-01 of Regulation S-X, allowing the registrant’s Audit Committee to consider whether such services were compatible with maintaining the principal accountant’s independence.
Item 5. Disclosure of Audit Committees for Listed Companies.
The registrant has an audit committee which was established by the Board of Trustees of the registrant in accordance with Section 3(a)(58)(A) of the Securities Exchange Act of 1934, as amended. The members of the registrant’s audit committee are Bonny Boatman, Dwight Churchill, David Kelly, Frank Nesvet and Carl Verboncoeur.
Item 6. Investments.
| (a) | A Schedule of Investments for each series of the registrant is included as part of the report to shareholders filed under Item 1 of this Form N-CSR. |
| (b) | Not applicable to the registrant. |
Item 7. Disclosure of Proxy Voting Policies and Procedures for Closed-End Management Investment Companies.
Not applicable to the registrant.
Item 8. Portfolio Managers of Closed-End Management Investment Companies.
Not applicable to the registrant.
Item 9. Purchases of Equity Securities by Closed-End Management Investment Company and Affiliated Purchasers.
Not applicable to the registrant.
Item 10. Submission of Matters to a Vote of Security Holders.
The registrant has not adopted any material changes to the procedures by which shareholders may recommend nominees to the registrant’s Board.
Item 11. Controls and Procedures.
(a) Within 90 days of the filing date of this Form N-CSR, Ellen M. Needham, the registrant’s President and Principal Executive Officer, and Bruce S. Rosenberg, the registrant’s Treasurer and Principal Financial Officer, reviewed the registrant’s disclosure controls and procedures (as defined in Rule 30a-3(c)
Table of Contents
under the Investment Company Act of 1940, as amended (the “1940 Act”) and evaluated their effectiveness. Based on their review, Ms. Needham and Mr. Rosenberg determined that the disclosure controls and procedures adequately ensure that information required to be disclosed by the registrant in its periodic reports is recorded, processed, summarized and reported within the time periods required by the U.S. Securities and Exchange Commission.
(b) There were no changes in the registrant’s internal control over financial reporting (as defined in Rule 30a-3(d) under the 1940 Act) that occurred during the second fiscal quarter of the period covered by this report that have materially affected, or are reasonably likely to materially affect, the registrant’s internal control over financial reporting.
Item 12. Disclosure of Securities Lending Activities for Closed-End Management Investment Companies.
(a) Not applicable.
(b) Not applicable.
Item 13. Exhibits.
(a)(1) Code of Ethics referred to in Item 2.
(a)(2) Separate certifications required by Rule 30a-2 under the 1940 Act for each principal executive officer and principal financial officer of the registrant are attached.
(a)(3) Not applicable to the registrant.
(b) A single certification required by Rule 30a-2(b) under the 1940 Act, Rule 13a-14(b) or Rule 15d-14(b) under the Securities Exchange Act of 1934, as amended, and Section 1350 of Chapter 63 of Title 18 of the United States Code for the principal executive officer and principal financial officer of the registrant is attached.
Table of Contents
SIGNATURES
Pursuant to the requirements of the Securities Exchange Act of 1934, as amended, and the Investment Company Act of 1940, as amended, the registrant has duly caused this report to be signed on its behalf by the undersigned, thereunto duly authorized.
| SPDR® Index Shares Funds | ||
| By: | /s/ Ellen M. Needham | |
| Ellen M. Needham President and Principal Executive Officer | ||
| Date: | December 5, 2017 | |
Pursuant to the requirements of the Securities Exchange Act of 1934, as amended, and the Investment Company Act of 1940, as amended, this report has been signed below by the following persons on behalf of the registrant and in the capacities and on the dates indicated.
| By: | /s/ Ellen M. Needham | |
| Ellen M. Needham President and Principal Executive Officer | ||
| Date: | December 5, 2017 | |
| By: | /s/ Bruce S. Rosenberg | |
| Bruce S. Rosenberg Treasurer and Principal Financial Officer | ||
| Date: | December 5, 2017 | |