| SHL Telemedicine Ltd. |
1 January - 30 June, 2023 |
Letter to Shareholders
Dear Shareholders
Looking at the first half of 2023, we maintained stable revenues while making significant strategic advancements across all operations, while maintaining a robust cash position, despite challenging market conditions and shifts in the financial markets.
The prevailing macro challenges in the healthcare industry underscore the growing demand for telemedicine technology and services. Our solutions not only enhance access and care outcomes but also reduce costs for our customers. With a robust foundation in Israel, promising infrastructure in Germany, and key collaborations in the US with Tier 1 customers including CVS, Henry Schein and Mayo Clinic, our financial position remains strong. We are steadfast in our balanced growth strategy.
During the period, the company commenced trading of the Nasdaq® and the Company’s American Depositary Shares (“ADRs”), trade on Nasdaq® (symbol “SHLT”), in parallel to the company’s ordinary shares continuing to be listed on the Swiss Stock Exchange.
Overall, revenues for the period were USD 29.0 million, a slight increase compared to USD 28.8 million observed in the first half of 2022 when adjusted for constant currency. Adjusted EBITDA1 for the period was USD 0.4 million, a decrease compared to USD 3.1 million in the first half of 2022 when adjusted for constant currency, and similar compared to USD 0.6 million in the second half of 2022 when adjusted for constant currency. The decrease is mainly related to increased investment in Germany and the USA as well as Nasdaq listing expenses. This resulted in a negative operating cash flow of USD 3.3 million, compared to positive operating cash flow of USD 1.7 million in the first half of 2022. Net loss for the period was USD 2.1 million, compared to a small net loss of USD 0.1 million in the first half of 2022 when adjusted for constant currency.
Germany
Revenues were USD 6.8 million, slightly down from USD 7.0 million in the first half of 2022 when adjusted for constant currency, but up from USD 6.7 million in the second half of 2022 in constant currency. The commercial service of the Virtual Visits to the BARMER insureds across Germany started during April 2023. Barmer is one of the three largest health insurers in Germany serving about 8.7 million insured, and AOK PLUS is another large health insurer in Germany serving about 3.5 million insureds, which together brings SHL to over 12.5 million insureds in Germany who can now use this service. The investments in the German operation during the period, mainly in R&D costs related to the Virtual Visit service resulted in a negative contribution of about USD 1.2 million. We are witnessing a steady increase in the adoption of the Doctors’ Virtual Visit services and believe it is a promising new growth engine for the German operation.
1 EBITDA excluding stock base compensation expenses and extraordinary expenses.
Letter to Shareholders
2
USA
In the US revenues in the first half of 2023 were USD 0.6 million. We adjusted our strategy to prioritize direct-to-consumer sales of the SmartHeart® ECG, viewing it as a move of considerable strategic importance. The direct-to-consumer sales of SmartHeart® will start already during the second half of 2023 and will utilize the infrastructure of a network of cardiologists that is already set up across the US and is available to perform a remote review and interpretation of SmartHeart® ECG from anywhere. In parallel, we are optimistically awaiting the results from the HELP-MI clinical trial conducted by Mayo Clinic which we believe will hold significant value for our B2B plan of introducing the SmartHeart® platform to hospital systems. We continue to see growing utilization of our SmartHeart® platform by Tier1 strategic customers including through the deployment of SmartHeart® in the CVS MinuteClincs. These relationships will bolster our credibility and augment our SmartHeart® direct-to-consumer move.
During the second part of 2023 the company expects results from the HELP-MI clinical trial conducted by Mayo Clinic, as well as from another clinical trial conducted by Imperial College London. Both trials relate to the utilization of the SmartHeart® 12-lead ECG technology for remote monitoring of post-MI (heart attack) patients at home. Very positive and strong initial results from these trials were recently presented at the highly regarded Imperial Vulnerable Plaque and Patient Meeting 2023 (VPM) showing meaningful reduction in the rate of readmissions and visits to Emergency Department of post-ACS (Acute Coronary Syndrome) patients that are telemonitored at home with SmartHeart®. These initial results reflect our accumulated experience in this field, will lead to material cost savings to hospital systems and will support a compelling business case for SmartHeart® with hospital systems.
Israel
Revenues increased by 3% to USD 21.6 million, compared to USD 21.0 in the first half of 2022 when adjusted for constant currency. Our B2C private-pay subscription activity is stable with moderate growth compared to the first half of 2022 as well as the second half of 2022. We began expanding the use of both the B2C and B2B operations and infrastructures, and expect to add new products and services in all sectors of our activity in Israel, already this year.
On behalf of the Board of Directors and the management team, we thank all employees for their hard work and our business partners and shareholders for the trust they have placed in SHL.
Sincerely, | |||||
/s/ Ehud Barak | /s/ Yariv Alroy | /s/ Erez Nachtomy | |||
Ehud Barak | Yariv Alroy | Erez Nachtomy | |||
Co-Chairman of the Board | Co-Chairman of the Board | CEO | |||
Letter to Shareholders
3
INDEX
5 | | | Review of Interim Condensed Consolidated Financial Statements |
6 | | | |
8 | | | |
9 | | | |
11 | | | |
13 | | | Notes to Interim Condensed Consolidated Financial Statements |
Financial Statements
4
The Shareholders and Board of Directors
SHL Telemedicine Ltd.
Auditors’ review report to the shareholders and board of directors of SHL Telemedicine Ltd.
Introduction
We have reviewed the accompanying interim condensed consolidated financial statements of SHL Telemedicine Ltd. (“the Company”) and its subsidiaries as of June 30, 2023, which comprise the interim consolidated balance sheet as of June 30, 2023, and the related interim consolidated statements of comprehensive income, changes in equity and cash flows for the six month period then ended and explanatory notes. Management is responsible for the preparation and presentation of this interim financial information in accordance with International Accounting Standard 34, “Interim Financial Reporting” (“IAS 34”). Our responsibility is to express a conclusion on this interim financial information based on our review.
Scope of review
We conducted our review in accordance with International Standard on Review Engagements 2410, “Review of Interim Financial Information Performed by the Independent Auditor of the Entity”. A review of interim financial information consists of making inquiries, primarily of persons responsible for financial and accounting matters, and applying analytical and other review procedures. A review is substantially less in scope than an audit conducted in accordance with International Standards on Auditing and consequently does not enable us to obtain assurance that we would become aware of all significant matters that might be identified in an audit. Accordingly, we do not express an audit opinion.
Conclusion
Based on our review, nothing has come to our attention that causes us to believe that the accompanying interim condensed consolidated financial statements are not prepared, in all material respects, in accordance with IAS 34.
Tel-Aviv, Israel | |
September 20, 2023 | |
/s/ KOST FORER GABBAY & KASIERER | |
KOST FORER GABBAY & KASIERER | |
A Member of Ernst & Young Global |
Financial Statements
5
CONSOLIDATED BALANCE SHEETS U.S. dollars in thousands
| June 30, |
| December 31, | |||
2023 |
| 2022 |
| 2022 | ||
| Unaudited |
| Audited | |||
ASSETS |
|
|
|
|
| |
CURRENT ASSETS: |
|
|
|
|
| |
Cash and cash equivalents |
| |
| | | |
Short-term investments |
| |
| | | |
Trade receivables |
| |
| | | |
Inventory |
| |
| | | |
Other accounts receivable |
| |
| | | |
| |
| | | ||
NON-CURRENT ASSETS: |
|
|
|
|
| |
Inventory |
| |
| — | | |
Prepaid expenses |
| |
| | | |
Call option to non-controlling interests, net |
| — |
| | | |
Long-term deposits |
| |
| | | |
Right-of-use assets |
| |
| | | |
Deferred taxes |
| |
| | | |
Other financial assets |
| — |
| | — | |
| |
| | | ||
PROPERTY AND EQUIPMENT, NET |
| |
| | | |
GOODWILL |
| |
| | | |
INTANGIBLE ASSETS, NET |
| |
| | | |
Total assets |
| |
| | | |
The accompanying notes are an integral part of the interim condensed consolidated financial statements.
Financial Statements
6
CONSOLIDATED BALANCE SHEETS U.S. dollars in thousands
June 30, | December 31, | |||||
| 2023 |
| 2022 |
| 2022 | |
Unaudited | Audited | |||||
LIABILITIES AND EQUITY |
|
|
|
|
|
|
CURRENT LIABILITIES: |
|
|
|
|
|
|
Credit from banks and others |
| |
| |
| |
Current maturities of lease liabilities |
| |
| |
| |
Deferred revenues |
| |
| |
| |
Income taxes payable |
| |
| |
| |
Trade payables |
| |
| |
| |
Other payables |
| |
| |
| |
| |
| |
| | |
NON-CURRENT LIABILITIES: |
|
|
|
|
|
|
Liability for share options |
| — |
| |
| |
Put option to non-controlling interests, net |
| |
| — |
| — |
Loans from banks |
| |
| |
| |
Deferred taxes |
| |
| |
| |
Lease liabilities |
| |
| |
| |
Employee benefit liabilities |
| |
| |
| |
| |
| |
| | |
Total liabilities |
| |
| |
| |
EQUITY: |
|
|
|
|
|
|
Attributable to equity holders of the Company: |
|
|
|
|
|
|
Issued capital |
| |
| |
| |
Additional paid-in capital |
| |
| |
| |
Treasury shares |
| ( |
| ( |
| ( |
Foreign currency translation reserve |
| ( |
| ( |
| ( |
Capital reserve for options |
| |
| |
| |
Capital reserve for remeasurement gains on defined benefit plans |
| |
| |
| |
Accumulated deficit |
| ( |
| ( |
| ( |
| |
| |
| | |
Non-controlling interests |
| |
| |
| |
Total equity |
| |
| |
| |
Total liabilities and equity |
| |
| |
| |
The accompanying notes are an integral part of the interim condensed consolidated financial statements.
September 20, 2023 |
| /s/ Yariv Alroy |
| /s/ Erez Nachtomy |
Date of approval of the | Yariv Alroy | Erez Nachtomy | ||
financial statements | Chairman of the Board | CEO |
Financial Statements
7
CONSOLIDATED STATEMENTS OF COMPREHENSIVE INCOME
U.S. dollars in thousands (except per share data)
Six months ended | Year ended | |||||||
June 30, | December 31, | |||||||
|
| 2023 |
| 2022 |
| 2022 | ||
| Note | Unaudited |
| Audited | ||||
Revenues |
| |
| |
| | ||
Cost of revenues |
| |
| |
| | ||
Gross profit |
| |
| |
| | ||
Research and development costs |
| |
| |
| | ||
Selling and marketing expenses |
| |
| |
| | ||
General and administrative expenses |
| |
| |
| | ||
Other expenses |
| |
| |
| | ||
Operating loss |
| ( |
| ( |
| ( | ||
Financial income |
| |
| |
| | ||
Financial expenses |
| ( |
| ( |
| ( | ||
Profit (loss) before taxes on income |
| ( |
| |
| | ||
Taxes on income |
| |
| |
| | ||
Net profit (loss) |
| ( |
| |
| | ||
Other comprehensive income: |
|
|
|
|
|
| ||
Other comprehensive income not to be reclassified to profit or loss in subsequent periods: |
|
|
|
|
|
| ||
Re-measurement gain on defined benefit plans |
| — |
| — |
| | ||
Other comprehensive loss to be reclassified to profit or loss in subsequent periods: |
|
|
|
|
|
| ||
Foreign currency translation reserve |
| ( |
| ( |
| ( | ||
Total other loss |
| ( |
| ( |
| ( | ||
Total comprehensive loss |
| ( |
| ( |
| ( | ||
Net profit (loss) attributable to: |
|
|
|
|
|
| ||
Equity holders of the Company |
| ( |
| |
| ( | ||
Non-controlling interests |
| |
| |
| | ||
| ( |
| |
| | |||
Total comprehensive loss attributable to: |
|
|
|
|
|
| ||
Equity holders of the Company |
| ( |
| ( |
| ( | ||
Non-controlling interests |
| ( |
| ( |
| ( | ||
| ( |
| ( |
| ( | |||
Earnings per share attributable to Equity holders of the Company: |
|
|
|
|
|
| ||
Basic earnings (loss) |
| ( |
| |
| ( | ||
Diluted loss |
| ( |
| ( |
| ( | ||
The accompanying notes are an integral part of the interim condensed consolidated financial statements.
Financial Statements
8
CONSOLIDATED STATEMENTS OF CHANGES IN EQUITY
U.S. dollars in thousands
Capital | ||||||||||||||||||||
Foreign | Capital | reserve for | ||||||||||||||||||
Additional | currency | reserve | remeasurement | Non- | ||||||||||||||||
Issued | paid-in | Treasury | translation | for | gains on defined | Accumulated | controlling | Total | ||||||||||||
| capital |
| capital |
| shares |
| reserve |
| options |
| benefit plans |
| deficit |
| Total |
| interests |
| equity | |
Balance as of January 1, 2023 (audited) |
| |
| |
| ( |
| ( |
| |
| |
| ( |
| |
| |
| |
Exercise of share options |
| |
| |
| — |
| — |
| |
| — |
| — |
| |
| — |
| |
Share-based payments |
| — |
| |
| — |
| — |
| — |
| — |
| — |
| |
| |
| |
Equity component of transaction |
|
|
|
|
|
|
|
|
|
|
|
|
|
|
|
|
|
|
|
|
with non-controlling interest |
| — |
| |
| — |
| — |
| — |
| — |
| — |
| |
| ( |
| — |
Net profit (loss) |
| — |
| — |
| — |
| — |
| — |
| — |
| ( |
| ( |
| |
| ( |
Total other comprehensive loss |
| — |
| — |
| — |
| ( |
| — |
| — |
| — |
| ( |
| ( |
| ( |
Dividend to non-controlling interests |
| — |
| — |
| — |
| — |
| — |
| — |
| — |
| — |
| ( |
| ( |
Balance as of June 30, 2023 (unaudited) |
| |
| |
| ( |
| ( |
| |
| |
| ( |
| |
| |
| |
Capital | ||||||||||||||||||||
Foreign | Capital | reserve for | ||||||||||||||||||
Additional | currency | reserve | remeasurement | Non- | ||||||||||||||||
Issued | paid-in | Treasury | translation | for | gains on defined | Accumulated | controlling | Total | ||||||||||||
| capital |
| capital |
| shares |
| reserve |
| options |
| benefit plans |
| deficit |
| Total |
| interests |
| equity | |
Balance as of January 1, 2022 (audited) |
| |
| |
| ( |
| |
| |
| |
| ( |
| |
| |
| |
Exercise of share options |
| *— |
| |
| — |
| — |
| — |
| — |
| — |
| |
| — |
| |
Share-based payments |
| — |
| |
| — |
| — |
| — |
| — |
| — |
| |
| |
| |
Exercise of Employee options |
| — |
| ( |
| |
| — |
| — |
| — |
| — |
| — |
| — |
| — |
Equity component of transaction |
|
|
|
|
|
|
|
|
|
|
|
|
|
|
|
|
|
|
|
|
with non-controlling interest |
| — |
| |
| — |
| — |
| — |
| — |
| — |
| |
| ( |
| — |
Net profit |
| — |
| — |
| — |
| — |
| — |
| — |
| |
| |
| |
| |
Total other comprehensive loss |
| — |
| — |
| — |
| ( |
| — |
| — |
| — |
| ( |
| ( |
| ( |
Balance as of June 30, 2022 (unaudited) |
| |
| |
| ( |
| ( |
| |
| |
| ( |
| |
| |
| |
* | Represents an amount lower than $ 1. |
The accompanying notes are an integral part of the interim condensed consolidated financial statements.
Financial Statements
9
CONSOLIDATED STATEMENTS OF CHANGES IN EQUITY
U.S. dollars in thousands
Capital | ||||||||||||||||||||
Foreign | Capital | reserve for | ||||||||||||||||||
Additional | currency | reserve | remeasurement | Non- | ||||||||||||||||
Issued | paid-in | Treasury | translation | for | gains on defined | Accumulated | controlling | Total | ||||||||||||
| capital |
| capital |
| shares |
| reserve |
| options |
| benefit plans |
| deficit |
| Total |
| interests |
| equity | |
Balance as of January 1, 2022 (audited) |
| |
| |
| ( |
| |
| |
| |
| ( |
| |
| |
| |
Exercise of share options |
| |
| |
| — |
| — |
| — |
| — |
| — |
| |
| — |
| |
Exercise of Employee options |
| * |
| ( |
| |
| — |
| — |
| — |
| — |
| — |
| — |
| — |
Share-based payments |
| — |
| |
| — |
| — |
| — |
| — |
| — |
| |
| |
| |
Equity component of transaction with non-controlling interest |
| — |
| |
| — |
| — |
| — |
| — |
| — |
| |
| ( |
| — |
Dividend paid to non-controlling interests |
| — |
| — |
| — |
| — |
| — |
| — |
| — |
| — |
| ( |
| ( |
PPA Adjustments |
| — |
| — |
| — |
| — |
| — |
| — |
| — |
| — |
| ( |
| ( |
Net profit (loss) |
| — |
| — |
| — |
| — |
| — |
| — |
| ( |
| ( |
| |
| |
Total other comprehensive income (loss) |
| — |
| — |
| — |
| ( |
| — |
| |
| — |
| ( |
| ( |
| ( |
Balance as of December 31, 2022 (audited) |
| |
| |
| ( |
| ( |
| |
| |
| ( |
| |
| |
| |
* | Represents an amount lower than $ 1. |
The accompanying notes are an integral part of the interim condensed consolidated financial statements.
Financial Statements
10
CONSOLIDATED STATEMENTS OF CASH FLOWS
U.S. dollars in thousands
Six months ended | Year ended | |||||
June 30, | December 31, | |||||
| 2023 |
| 2022 |
| 2022 | |
| Unaudited | Audited | ||||
Cash flows from operating activities: |
|
|
|
|
|
|
Net profit (loss) |
| ( |
| |
| |
Adjustments required to reconcile net profit (loss) to net cash provided by (used in) operating activities: |
|
|
|
|
|
|
Income and expenses not involving operating cash flows: |
|
|
|
|
|
|
Depreciation and amortization |
| |
| |
| |
Capital loss from sale of property and equipment |
| |
| |
| |
Change in employee benefit liabilities, net |
| |
| |
| |
Financial income, net |
| ( |
| ( |
| ( |
Valuation loss (gain) of short-term investments |
| ( |
| |
| |
Cost of share-based payments |
| |
| |
| |
Taxes on income |
| |
| |
| |
| |
| |
| | |
Changes in operating assets and liabilities: |
|
|
|
|
|
|
Increase in trade receivables, net |
| ( |
| ( |
| ( |
Increase in inventory |
| ( |
| ( |
| ( |
Decrease (increase) in prepaid expenses |
| ( |
| |
| ( |
Increase in other accounts receivable |
| ( |
| ( |
| ( |
Increase in trade payables |
| |
| |
| |
Decrease in deferred revenues |
| ( |
| ( |
| ( |
Increase (decrease) in other accounts payable |
| ( |
| ( |
| |
| ( |
| ( |
| ( | |
Cash paid and received: |
|
|
|
|
|
|
Interest received |
| |
| |
| |
Interest paid |
| ( |
| ( |
| ( |
Income tax received |
| |
| |
| |
Income taxes paid |
| ( |
| ( |
| ( |
| ( |
| ( |
| ( | |
Net cash provided by (used in) operating activities |
| ( |
| |
| ( |
The accompanying notes are an integral part of the interim condensed consolidated financial statements.
Financial Statements
11
CONSOLIDATED STATEMENTS OF CASH FLOWS
U.S. dollars in thousands
Six months ended | Year ended | |||||
June 30, | December 31, | |||||
| 2023 |
| 2022 |
| 2022 | |
| Unaudited |
| Audited | |||
Cash flows from investing activities: |
|
|
|
|
|
|
Purchase of property and equipment |
| ( |
| ( |
| ( |
Investment in intangible assets |
| ( |
| ( |
| ( |
Investment in long-term deposits |
| ( |
| — |
| ( |
Proceeds from long-term deposits |
| |
| — |
| — |
Purchase of short-term investments |
| ( |
| ( |
| ( |
Proceeds from sale of short-term investments |
| |
| |
| |
Net cash provided by (used in) investing activities |
| ( |
| |
| ( |
Cash flows from financing activities: |
|
|
|
|
|
|
Dividend paid to non-controlling interests |
| ( |
| — |
| ( |
Payment of lease liabilities |
| ( |
| ( |
| ( |
Payment of liability to underwriter |
| ( |
| — |
| — |
Exercise of share options |
| |
| |
| |
Payment of long-term loans |
| ( |
| ( |
| ( |
Other |
| |
| — |
| — |
Net cash provided by (used in) financing activities |
| |
| ( |
| ( |
Effect of exchange rate changes on cash and cash equivalents |
| ( |
| ( |
| ( |
Increase (decrease) in cash and cash equivalents |
| |
| |
| ( |
Cash and cash equivalents at the beginning of the period |
| |
| |
| |
Cash and cash equivalents at the end of the period |
| |
| |
| |
Non-cash transactions: |
|
|
|
|
|
|
Right-of-use asset recognized with corresponding lease liability |
| |
| |
| |
Liability derecognized and recorded in equity upon exercise of share options |
| |
| |
| |
The accompanying notes are an integral part of the interim condensed consolidated financial statements.
Financial Statements
12
NOTES TO CONSOLIDATED STATEMENTS U.S. dollars in thousands
NOTE 1 | GENERAL
| a. | These consolidated financial statements have been prepared in a condensed format as of June 30, 2023, and for the six months then ended. These condensed consolidated financial statements should be read in conjunction with the annual consolidated financial statements and accompanying notes of SHL Telemedicine Ltd. (“the Company”) as of December 31, 2022 and for the year then ended (“the annual financial statements”). |
| b. | Following are data regarding the Israeli CPI and the exchange rates of the Euro, U.S. dollar and the Swiss Franc in relation to the new Israeli Shekel (NIS): |
Israeli | Exchange rate of | |||||||
CPI | € 1 | U.S. $1 | CHF 1 | |||||
For the year ended |
| Points* |
| NIS | ||||
June 30, 2023 |
| |
| |
| |
| |
June 30, 2022 |
| |
| |
| |
| |
December 31, 2022 |
| |
| |
| |
| |
Change during the period |
| % | ||||||
June 2023 (6 months) |
| |
| |
| |
| |
June 2022 (6 months) |
| |
| |
| |
| |
December 31, 2022 |
| |
| |
| |
| |
* | The index on an average basis of 1993 = 100. |
NOTE 2 | SIGNIFICANT ACCOUNTING POLICIES
a. | Basis of preparation of the interim condensed consolidated financial statements: |
The interim condensed consolidated financial statements for the six months ended June 30, 2022 have been prepared in accordance with generally accepted accounting principles for the preparation of financial statements for interim periods, as prescribed in IAS 34, “Interim Financial Reporting.
The significant accounting policies and methods of computation adopted in the preparation of the interim condensed consolidated financial statements are consistent with those followed in the preparation of the annual financial statements, except as described in b. below.
b. | Initial adoption of amendments to International Financial Reporting Standards: |
1. Amendment to IAS 8, “Accounting Policies, Changes to Accounting Estimates and Errors”:
In February 2021, the IASB issued an amendment to IAS 8, “Accounting Policies, Changes to Accounting Estimates and Errors” (“the Amendment”), in which it introduces a new definition of “accounting estimates”.
Accounting estimates are defined as “monetary amounts in financial statements that are subject to measurement uncertainty”. The Amendment clarifies the distinction between changes in accounting estimates and changes in accounting policies and the correction of errors.
The Amendment is to be applied prospectively for annual reporting periods beginning on or after January 1, 2023 and is applicable to changes in accounting policies and changes in accounting estimates that occur on or after the start of that period.
The application of the Amendment did not have a material impact on the Company’s interim financial statements.
Financial Statements
13
NOTES TO CONSOLIDATED STATEMENTS U.S. dollars in thousands
2. Amendment to IAS 12, “Income Taxes:
In May 2021, the IASB issued an amendment to IAS 12, “Income Taxes” (“IAS 12”), which narrows the scope of the initial recognition exception under IAS 12.15 and IAS 12.24 (“the Amendment”).
According to the recognition guidelines of deferred tax assets and liabilities, IAS 12 excludes recognition of deferred tax assets and liabilities in respect of certain temporary differences arising from the initial recognition of certain transactions. This exception is referred to as the “initial recognition exception”. The Amendment narrows the scope of the initial recognition exception and clarifies that it does not apply to the recognition of deferred tax assets and liabilities arising from transactions that are not a business combination and that give rise to equal taxable and deductible temporary differences, even if they meet the other criteria of the initial recognition exception.
The Amendment is effective for annual reporting periods beginning on or after January 1, 2023. In relation to leases and decommissioning obligations, the Amendment is applied commencing from the earliest reporting period presented in the financial statements in which the Amendment is initially applied. The cumulative effect of the initial application of the Amendment is recognized as an adjustment to the opening balance of retained earnings (or another component of equity, as appropriate) at that date.
The application of the Amendment did not have a material impact on the Company’s interim financial statements.
NOTE 3 | REVENUES
Six months ended | Year ended | |||||
June 30, | December 31, | |||||
2023 |
| 2022 | 2022 | |||
| Unaudited |
| Audited | |||
Revenues for services performed during the period |
| | |
| | |
Revenues from sale of devices |
| |
| |
| |
| |
| |
| | |
NOTE 4 | MATERIAL EVENTS DURING THE REPORTING PERIOD
| a. | During January 2023 and February 2023 the Company received proceeds of approximately CHF |
| b. | In April, 2023 the Company’s Board of Directors approved the appointment of Bernd Altpeter as Co-Managing Director of SHL German Operation. |
| c. | During the period, the Company’s Board of Directors approved the grant of |
| d. | On March 31, 2023 the Company announced that the U.S. Securities and Exchange Commission (the “SEC”) declared effective the Company’s registration statement of its securities under the U.S. Securities Exchange Act of 1934, as amended (the “Exchange Act“), in connection with the NASDAQ Listing of its American Depositary Shares (“ADRs”), each representing one ordinary share of the Company. The ADRs commenced trading on The NASDAQ Capital Market (the “Nasdaq”), on April 3 2023 under the ticker symbol “SHLT”, in parallel to its ordinary shares continuing to be listed on the Swiss Stock Exchange. |
Financial Statements
14
NOTES TO CONSOLIDATED STATEMENTS U.S. dollars in thousands
| e. | In March, 2023, in connection with services provided in respect of the exercise of options described in Note 4a. above, the Company signed an agreement with the underwriter for the extension of the exercise period of the Share Options previously granted in 2021 for an additional |
The Company used the Black and Scholes option pricing model when estimating the incremental fair value of the Share Options after the modifications described above.
The following table lists the significant inputs to the Black and Scholes model used for the fair value measurement of the Share Options:
Expected dividend |
| — | % |
Expected volatility of the share price |
| | % |
Risk-free interest rate |
| | % |
Expected average life of options |
| | years |
Share price |
| CHF |
Based on the above inputs, the total incremental fair value of the Share Options to acquire Units as of the date of the modifications was $
NOTE 5 | SEGMENT INFORMATION
As presented in the annual financial statements, the Group operates in three geographic segments: Israel, Europe (principally Germany) and Rest of the world (“Row”).
Management monitors the operating results of its geographical units separately for the purpose of making decisions about resource allocation and performance assessment. Segment performance is evaluated based on segment profit. SG&A Group expenses and some research and development expenses are mostly allocated to the separate geographic units. Some corporate expenses, some research and development expenses, finance costs and finance income and income taxes are managed on a group basis and are not allocated to the geographic segments.
Revenues are allocated based on the location of the end customer. The Group presents disaggregated revenue information based on types of customers: Individual customers and communities, Institutions and payers (income from service agreements with institutions, insurance companies and HMOs), and others.
Financial Statements
15
NOTES TO CONSOLIDATED STATEMENTS U.S. dollars in thousands
a. Segment revenues:
Individuals | Institutions | |||||||
and | and | |||||||
| communities |
| payers |
| Others |
| Total | |
Six months ended June 30, 2023 (unaudited): | ||||||||
Europe |
| — |
| |
| — |
| |
Israel |
| |
| |
| — |
| |
Row |
| — |
| — |
| |
| |
Total revenues |
| |
| |
| |
| |
Six months ended June 30, 2022 (unaudited): | ||||||||
Europe | — | | — | | ||||
Israel | | | — | | ||||
Row | — | — | | | ||||
Total revenues | | | | | ||||
Year ended December 31, 2022 (audited): | ||||||||
Europe | — | | — | | ||||
Israel | | | — | | ||||
Row | — | — | | | ||||
Total revenues | | | | |
b. Segment profit (loss):
Six months ended | Year ended | |||||
June 30, | December 31, | |||||
2023 |
| 2022 | 2022 | |||
| Unaudited |
| Audited | |||
Europe |
| ( |
| ( |
| ( |
Israel |
| |
| |
| |
Row |
| ( |
| ( |
| ( |
| ( |
| |
| | |
Unallocated income and expenses: |
|
|
|
|
|
|
Corporate and |
|
|
|
|
|
|
R&D expenses |
| ( |
| ( |
| ( |
Other expenses |
| ( |
| — |
| ( |
Operating loss |
| ( |
| ( |
| ( |
Financial income, net |
| |
| |
| |
Profit (loss) before taxes on income |
| ( |
| |
| |
Financial Statements
16
NOTES TO CONSOLIDATED STATEMENTS U.S. dollars in thousands
NOTE 6 | FINANCIAL INSTRUMENTS
Fair value:
Reconciliation of fair value measurements that are categorized within Level 3 of the fair value hierarchy in financial instruments:
| Financial instruments | |||||||
Call (put) | ||||||||
option to | ||||||||
Liability for | Liability to | non-controlling | ||||||
| share options |
| underwriters |
| interests, net |
| Total | |
Balance as of January 1, 2023 |
| ( |
| ( |
| |
| ( |
Remeasurement recognized in: |
|
|
|
|
|
|
|
|
Profit (loss) |
| |
| ( |
| ( |
| |
Other comprehensive income (loss) |
| ( |
| |
| |
| |
Exercise of Share Options into shares |
| |
| — |
| — |
| |
Payment |
| — |
| |
| — |
| |
As of June 30, 2023 |
| — |
| — |
| ( |
| ( |
Presented in balance sheet: |
|
|
|
|
|
|
|
|
Put option for non-controlling interests, net |
| — |
| — |
| ( |
| ( |
The Company used the Monte Carlo option pricing model when estimating the fair value of the Put and Call Options granted in the acquisition of Mediton Group.
The fair value was estimated using the following data and assumptions: underlying asset value –
The following table demonstrates the effect on fair value of a reasonably possible change in the underlying asset value with all other variables held constant:
| Increase/decrease in |
| Effect on | |
underlying asset value | Fair value, net | |||
| + | % | | |
| - | % | ( |
Financial Statements
17
Information For Investors
Capital structure
As of June 30, 2023, the issued share capital is divided into 16,386,180 registered shares with a par value of NIS 0.01 each (excluding 1,372 ordinary shares of NIS 0.01 par value each held by SHL).
Significant shareholders’
As of June 30, 2023, SHL was aware of the following shareholders with more than 3% of all voting rights in the company.
| % | % |
| ||||
Number of | Including | Excluding |
| ||||
Ordinary | Treasury | Treasury |
| ||||
| Shares Held |
| shares |
| shares |
| |
Mrs. Cai Mengke and Kun Shen |
| 5,969,413 |
| 36.43 | % | 36.43 | % |
More Provident Funds |
| 1,812,525 |
| 11.06 | % | 11.06 | % |
Value Base Group |
| 1,368,837 |
| 8.35 | % | 8.35 | % |
Sphera Funds Management Ltd |
| 819,776 |
| 5.00 | % | 5.00 | % |
Yariv Alroy |
| 801,456 |
| 4.89 | % | 4.89 | % |
Danbar Finance Ltd. |
| 760,000 |
| 4.64 | % | 4.64 | % |
SHL Treasury shares |
| 1,372 |
| 0.01 | % | — |
The above table of Significant Shareholders reflects both actual holdings as of June 30, 2023, after deducting from the total number of shares outstanding 1,372 Ordinary Shares held by SHL, and actual holding as of June 30, 2023 calculated including ordinary shares held by SHL, all as indicated above, but does not reflect holding on a fully diluted basis. All in accordance with notifications received by the Company from shareholders and the SAG registrar as of June 30, 2023.
Statistics on SHL Telemedicine
as at June 30, 2023
Registered shares with a par value of NIS 0.01 each |
| |
Securities number |
| 1,128,957 |
Number of shares* |
| 16,386,180 |
Market price high/low (CHF) |
| 15.20/7.90 |
Market capitalization high/low (CHF million) |
| 249.1/129.5 |
Market capitalization 30/06/23 (CHF million) |
| 154.0 |
Share capital – nominal value (NIS) |
| 163,875 |
* | Excluding 1,372 ordinary shares held by SHL. |
Financial Statements
18
Share price development
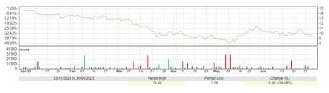
Listing
All SHL shares are listed on SIX Swiss Exchange
Ticker symbol: |
| SHLTN |
Currency: |
| CHF |
Listing date: | November 15, 2000 |
SHL American Depository Shares (“ADS”) are listed on the Nasdaq Capital Market Exchange
Ticker symbol: |
| SHLT |
Currency: |
| USD |
Listing date: | April 3, 2023 | |
Depository bank: | Bank of New York Mellon |
Investor relations
SHL Telemedicine Ltd.
Erez Nachtomy, CEO
Email: erezna@shl-telemedicine.com
Amir Hai, Chief Financial Officer
Email: amirh@shl-telemedicine.com
90 Yigal Alon St., Tel Aviv 6789130, Israel
Tel. ++972 3 561 2212
Fax: ++972 3 624 2414
Financial Statements
19
Forward Looking Statements
This announcement contains “forward-looking statements” within the meaning of the U.S. Private Securities Litigation Reform Act of 1995, specifically Section 27A of the U.S. Securities Act of 1933, as amended, and Section 21E of the U.S. Securities Exchange Act of 1934, as amended. All statements, other than statements of historical facts, are forward-looking statements, including, the Company’s anticipation with respect to changes in its results of operations from prior periods. Readers are cautioned that forward-looking statements are not guarantees of future performance and involve known and unknown risks, uncertainties and other factors that could cause actual results to differ materially from historical results or any future results expressed or implied by forward-looking statements. Factors that can cause actual results to differ from expectations and those contained in forward-looking statements include those risks described in Item 3.D. “Key Information—Risk Factors” contained in the Company’s Registration Statement on Form 20-F filed with the U.S. Securities Exchange Commission (the “SEC”) on March 28, 2023 and in its subsequent filings and submissions with the SEC, including, but not limited to, the Company’s ability to operate and comply with the complex and evolving regulations in the highly regulated healthcare industry; the continued development, consumer acceptance and market adoption of the Company’s products and services in the relatively new, unproven and volatile and rapidly changing telehealth market; the Company’s ability to develop and introduce new products and solutions and enhancements to existing ones; the significant and increasing levels of competition in the telemedicine market; the impacts of COVID-19 and future pandemics and epidemics; the Company’s ability to continue to attract and retain key employees and personal in the highly competitive healthcare industry; the loss or breach of the Company’s proprietary rights and data security and privacy risks; political, judicial, legal, economic and military conditions in Israel and the surrounding region; global economic and financial market conditions and the Company’s ability to adapt to and comply with the different business and market factors, conditions, requirements and laws and regulations in the various countries in which the Company operates internationally; currency fluctuations; labor disputes; the Company’s ability to manage growth and integrate acquired businesses and expanding operations; the Company’s ability to obtain adequate levels of insurance to cover potential losses; the Company’s dependence on key suppliers and sub-contractors and other third parties; and other matters and risks not yet known to the Company or not currently considered material by it. You should not place undue reliance on these forward-looking statements. All written and oral forward-looking statements, attributable to the Company, or persons acting on its behalf, are qualified in their entirety by these cautionary statements. Unless required by law, the Company undertakes no obligation to publicly update or revise any forward-looking statements.
Financial Statements
20