Exhibit 99.3
>// CONTENTS
Chairman’s Letter 3
Board of Directors & Officers 6
Board Committees 7
Financial Highlights 9
Forward-Looking Information 11
Information on the Company 11
Business Overview 12
Growth Charts 14
Our Fleet 16
Our Newbuildings Under Construction 17
Fleet Deployment 18
Operations & Ship Management 19
Map of Operations 20
Operating, Financial Review & Prospects 22
Financial Analysis 2007 vs. 2006 29
Financial Analysis 2006 vs. 2005 31
Liquidity & Capital Resources 35
General Market Overview
World Oil Demand / Supply & Trade 39
Management’s Report on Financial Reporting Controls 45
FINANCIAL STATEMENTS F PAGES
TEN’s Fleet 44
TEN’s Fleet under construction 45
Shareholder Information 46
 07.00
07.00
M/T SELECAO ON HER MAIDEN VOYAGE, SOUTH KOREA SEA

CHAIRMAN’S LETTER
April 5, 2008
Tsakos Energy Navigation (TEN) has completed its fourteenth year of highly successful operations. Over that span of time its operations have grown from four vessels to a fleet of fifty ships including six new buildings to be delivered through early 2010.
TEN has navigated through three industry downturns and generated a profit in each of fifty-seven quarters since it’s inception. This achievement has not been at the expense of building a young and growing fleet with an average age of 5.6 years compared with an industry standard of 10.6 years. Meanwhile it has produced exceptional growth in per share earnings, cash dividends, and price appreciation. It has delivered rewarding shareholder value to its investors. Since listing on the NYSE in early March of 2002, the annualized rate of return has been 32.16% as compared with the return of the S&P 500 of 3.90%.
Built on the foundations: of quality service resulting in strong customer alliances; backed by a modern, diversified, and growing fleet; a consistent strategic focus; a sound financial base; a business plan based on balance and solid implementation have positioned TEN for its future success.
HIGHLIGHTS OF 2007
Record voyage revenues of $500.6 million
Profits of $183.2 million
Earnings per share (basic) of $4.81, second only to the record $5.15 per share in 2006.
Declared cash dividends of $1.725 attributable to 2007 operations up 25.5% from the $1.375 for fiscal 2006.
Total return for shareholders in 2007 was 69.33% vs 5.46% for the S&P 500.
Liquidity of shares was enhanced via a 2-for-1 stock split in November.
Received nine new buildings.
Sold three older vessels.
Maintained a diversified fleet, including six new buildings for future delivery, of 25 crude carriers, 24 product carriers, and one LNG Transporter.
Strengthened its balanced employment policy with 80% of currently available capacity under contract for the balance of 2008 and 62% for 2009.
TANKER INDUSTRY CHALLENGES
The recent oil spill in Korean waters by a single hull VLCC has accelerated the movement to double-hulled ships. The growing concerns about climate change have focused attention on pollution contributors including all forms of passenger and cargo transporters. New regulations to deal with these issues are in the making.
Additionally, shipping clients have imposed ever higher standards for on-board and shore based management by their service providers. The vetting process is more comprehensive as well as more frequent. A universal concern is the need for highly qualified seafarers which is growing while that critical population is shrinking.
These developments have intensified the pressures on operating costs. Personnel compensation will surely rise. The push for cleaner bunkers at a time of sharply rising oil prices will impact fuel costs. Insurance premiums, corporate governance, and other overheads continue to rise. The path of the US dollar in FX markets may add a further burden. The need for expense management while maintaining high quality service will be essential. Productivity gains will be a must.
ANNUAL REPORT AND ACCOUNTS 2007 2 .. 3

Meanwhile appreciating asset values are pleasing, but can be a two-edged sword. Maintaining a modern fleet when vessel values are on the rise requires ever rising capital to support the new building program. For the time being the industry’s cost of capital is manageable, but the continued availability of adequate funding at an acceptable price is less than certain.
These multiple challenges will surely accelerate consolidation in this highly fragmented industry. TEN believes this will benefit the tanker industry, your company, and the clients it serves.
OUTLOOK FOR 2008
Last year at this time we observed that the world economy was hitting on all cylinders including an abundance of financial liquidity. We asked, “In such a Goldilocks environment one must ask, what can go wrong?” The response was:
“Certainly geopolitical strains have explosive risks. The potential of a spike in inflation could arise from the dramatic increase in raw material pricing. The twin deficits of the USA, the lack of savings by consumers against that backdrop and the reversal in residential real estate values could produce serious consequences. Protectionism could retard the growth in world trade. Certainly respect for risks is warranted, but on balance the most likely outcome is a continuation of world prosperity. Against this backdrop the world’s thirst for petroleum products will continue unabated. Undoubtedly, consumption will be influenced by the very high price of oil and environmental concerns. Nevertheless, the general expectation calls for an increase of 1.8% in 2008. The advanced economies will experience very modest increases, but the developing economies of China, India, Brazil, and the Pacific Rim are in a super growth phase.”
The expectations regarding the health of the world economy were too optimistic. The implosion of the financial service companies has undermined credit availability in key markets and worthy projects have gone unfunded. One very positive surprise has been the minimal demand destruction for oil products despite the sharply higher prices for gasoline, diesel, heating oil, etc. Demand in OECD countries declined 0.3%, but this was more than offset by a robust increase in non- OECD economies with worldwide demand growing 1.4%.
Looking ahead, the world economy should continue to grow, but at a much more pedestrian pace. The USA is no longer the locomotive. Euroland is both blessed and burdened by its strong currency as is the case of Japan which is in a slow growth mode. This troika dominates markets of consumer demand which will be modest at best. The drivers of growth have shifted to exporter reliant economies producing basic raw materials or fabricated goods. China, India, Australia, Korea, the Middle East, South America and Africa have earned an enormous transfer of wealth which is being deployed in capital investments, housing and consumerism. These developing and emerging economies provide hope that they can carry the growth burden until the world’s financial crisis and related credit crunch can be absorbed and resolved.
As always, the impact on demand for ocean movement of oil and its products will be complex. The biggest consumers of petroleum products are importers who are distant from the sources of production. Geopolitical strategies have altered conventional oil trade routes to the benefit of transport demand. The combination of these diverse influences has and will continue to drive ton/miles at a somewhat faster rate than basic consumption growth. The most recent forecasts for oil demand in 2008 reflect an increase of 1.9%. The supply of tankers is also complex. An early phase-out of single hull tankers through conversions and scrapping could sustain market balance. A key symptom is the strong appetite of major charterers to fix longer term employment, which is very encouraging.
The charter market is off to a good but mixed start in 2008. Crude carriers have been universally strong, while product carriers have been soft. 2007 marked the fifth consecutive year of general prosperity for tanker owners although cost pressure intensified. This will be an ongoing challenge in 2008. Meanwhile, the charter environment is upbeat. Not all markets will move in tandem, but on balance profits in 2008 should represent the sixth consecutive year of acceptable returns.

TEN’S PROSPECTS
TEN’s longer term prospects shine brightly. The strategy of developing a fleet of sister ships groupings is contributing to both quality of service and productivity. The leadership position in ice class service is an important edge. The “DNA” aframax opens unique opportunities in trade routes with restricted capacity ports. The modern fleet and policy of onboard maintenance will sustain the excellent utilization experience. The strengths provided by the commercial and technical managers within the Tsakos Group bring longstanding customer ties and almost four decades of operating experience.
TEN maintains a balanced fleet designed to provide its clients need. The chartering policy seeks balance thereby providing a solid floor of revenues and considerable upside in strong freight markets. This approach has resulted in consistent profitability along with strong secular growth. Risk management has also contributed to reduce volatility of financing costs and to a lesser degree bunker expenses.
Net Asset Value (NAV), which theoretically represents the liquidation value of an enterprise, has risen significantly in recent years and 2007 was no exception. Based on guidance from independent shipbrokers, TEN estimates that the resale value of its 42 owned ships, plus the excess market values of its two chartered –in suezmaxes over the price of their purchase options which will be exercised later this year, and the resale values of six new building purchase contracts exceed their year-end 2007 book values by in excess of $1.25 billion dollars. The resulting financial strength and capacity is even stronger than what is reflected in the accounting statements.
ANNUAL GENERAL MEETING
The shareholders Annual General Meeting (AGM) will be held in Athens, Greece on Wednesday, 4th of June 2008. The key proposals include the election of directors and the appointment of auditors for the current fiscal year. The AGM is a foundation of corporate governance. Your participation by proxy or preferably in person is critical. Athens is again hosting its biannual shipping conference-“Posidonia”. This premier event is an added reason for you to join us.
As a final note, on behalf of the entire Board of Directors and the other shareowners, I wish to congratulate TEN’s management team for yet another outstanding performance. The support of our shareholders is indeed appreciated.
Yours sincerely,
D.John Stavropoulos
Chairman of the Board
ANNUAL REPORT AND ACCOUNTS 2007 4 .. 5

BOARD OF DIRECTORS AND OFFICERS
D. JOHN STAVROPOULOS
CHAIRMAN
Mr. Stavropoulos served as Executive Vice President and Chief Credit Officer of The First National Bank of Chicago and its parent, First Chicago Corporation, before retiring in 1990 after 33 years with the bank. He chaired the bank’s Credit Strategy Committee, Country Risk Management Council and Economic Council. His memberships in professional societies have included Robert Morris Associates (national director), the Association of Reserve City Bankers and the Financial Analysts Federation. Mr. Stavropoulos was appointed by President George H.W.Bush to serve for life on the Presidential Credit Standards Advisory Committee. Mr. Stavropoulos was a director of CIPSCO from 1979 to 1992, an instructor of Economics and Finance at Northwestern University from 1962 to 1968, serves as a life member on the Alumni Advisory Board of the Kellogg School of Management and is a Chartered Financial Analyst.
MICHAEL G. JOLLIFFE
DEPUTY CHAIRMAN
Mr. Jolliffe is Deputy Chairman of Lannet, a telephone company quoted on the Athens Stock Exchange. He is also Chairman of StealthGas Inc, a shipping company with a fleet of LPG ships quoted on the Nasdaq Global Select Market. Mr. Jolliffe is also Chairman of Wigham-Richardson Shipbrokers Ltd., one of the oldest established shipbroking companies in the City of London, and Chairman of Shipping Spares Repairs and Supplies Ltd., an agency company based in Piraeus, Greece. Mr. Jolliffe is also the Joint President of Hanjin Eurobulk Ltd., a joint venture between Hanjin Shipping Co., Ltd., of Seoul, Korea and Wigham-Richardson Shipbrokers Ltd.
TORBEN JANHOLT
DIRECTOR
Mr. Janholt has been President and Chief Executive Officer of J. Lauritzen A/S, a major Danish ship-owning and trading company, since 1998. Between 1995 and 1998 he was Director OTS of the United Nations World Food Programme based in Rome. In 1992, he took a position as director with the Armada A/S shipping group. Prior to 1992, Mr. Janholt held various senior positions within the Lauritzen Group, including Managing Director of Lauritzen Naval Madrid from 1990 to 1992 and Senior Vice President of J. Lauritzen USA Inc. New York from 1982 to 1989. Mr. Janholt is either Chairman or a board member for various companies in the J.Lauritzen Group and Chairman of the Danish Shipowners Association. Mr. Janholt is also a member of the executive committee of the International Chamber of Shipping and a member of the Board of the European Community Shipowners Association.
WILLIAM A. O’ NEIL
DIRECTOR
Mr. O’Neil is Secretary-General Emeritus of the International Maritime Organization, the United Nations agency concerned with maritime safety and security and the prevention of pollution from ships. He was first elected Secretary-General of the IMO in 1990 and was re-elected four times, remaining Secretary-General until the end of 2003. Mr. O’Neil has served in various positions with the Canadian Federal Department of Transport and subsequently held senior positions during the construction and operation of the St. Lawrence Seaway Authority. He was appointed the first Commissioner of the Canadian Coast Guard where he served from 1975 until 1980 and then became President and Chief Executive Officer of the St. Lawrence Seaway Authority for ten years. Mr. O’Neil originally represented Canada in 1972 at the IMO Council, later becoming Chairman of the IMO Council in 1980. In 1991, he became Chancellor of the World Maritime University, Malmo, Sweden and Chairman of the Governing Board of the International Maritime Law Institute in Malta. Mr. O’Neil is a past President of the Institute of Chartered Shipbrokers and is President of Videotel Marine International, both of which are engaged in the training of seafarers. He is a civil engineer graduate of the University of Toronto, a fellow of the Royal Academy of Engineering and the Chairman of the Advisory Board of the Panama Canal Authority.
PETER NICHOLSON
DIRECTOR
Mr. Nicholson is trained as a naval architect and spent the majority of his professional career with Camper & Nicholson Limited, the world-famous yacht builder. He became Managing Director of the firm and later, Chairman. When Camper & Nicholson merged with Crest Securities to form Crest Nicholson Plc in 1972, Mr. Nicholson became an executive director, a role he held until 1988 when he became a non-executive in order to pursue a wider range of business interests. Since that time, he has been a non-executive director of Lloyds TSB Group Plc (from 1990 to 2000) and Chairman of Carisbrooke Shipping Plc (from 1990 to 1999). He was a director of various companies in the Marsh Group of insurance brokers and remained a consultant to the company until recently. He has served on the boards of a variety of small companies, has been active in the administration of the United Kingdom marine industry and is a trustee of the British Marine Federation. He is a Younger Brother of Trinity House. He was Chairman of the Royal National Lifeboat Institution from 2000 to 2004.
FRANCIS T. NUSSPICKEL
DIRECTOR
Mr. Nusspickel is a retired partner of Arthur Andersen LLP with 35 years of public accounting experience. He is a Certified Public Accountant in several U.S. states. During his years with Arthur Andersen, he served as a member of their Transportation Industry Group and was worldwide Industry Head for the Ocean Shipping segment. His responsibilities included projects for mergers and acquisitions, fraud investigations, arbitrations and debt and equity offerings. He was President of the New York State Society of Certified Public Accountants from 1996 to 1997, a member of the AICPA Council from 1992 to 1998, and from 2004 to 2007 was Chairman of the Professional Ethics Committee of the New York State Society of Certified Public Accountants. Mr. Nusspickel is also a Director of Symmetry Medical Inc., a New York Stock Exchange listed medical device manufacturer.
ARISTIDES A.N. PATRINOS
DIRECTOR
Dr. Patrinos has been instrumental in advancing the scientific and policy framework underpinning key governmental energy and environmental initiatives. Dr. Patrinos is President of Synthetic Genomics, Inc., a privately-held company dedicated to developing and commercializing clean and sustainable biofuels that alleviate our dependence on petroleum, enable carbon sequestration and reduce greenhouse gases. Dr. Patrinos joined Synthetic Genomics from the U.S. Department of Energy’s Office of Science. There he served as associate director of the Office of Biological and Environmental Research, overseeing the department’s research activities in human and microbial genome research, structural biology, nuclear medicine, and global environmental change. Dr. Patrinos played an historic role in the Human Genome Project, the founding of the DOE Joint Genome Institute and the design and launch of the DOE’s Genomes to Life Program, a research program dedicated to developing technologies to use microbes for innovative solutions to energy and environmental challenges. Dr. Patrinos is a Fellow of the American Association for the Advancement of Science and of the American Meteorological Society, and a Member of the American Geophysical Union, the American Society of Mechanical Engineers, and the Greek Technical Society. He is the recipient of numerous awards and honorary degrees, including three Presidential Rank Awards and two Secretary of Energy Gold Medals, as well as an honorary doctorate from the National Technical University of Athens. A native of Greece, Dr. Patrinos received his undergraduate degree from the National Technical University of Athens, and a Ph.D. in mechanical engineering and astronautical sciences from Northwestern University.

NIKOLAS P. TSAKOS
PRESIDENT
Mr. Tsakos has been President, Chief Executive Officer and a director of the Company since inception. Mr. Tsakos is the sole shareholder of Tsakos Energy Management Limited. He has been involved in ship management since 1981 and has seafaring experience of 36 months. He is the former President of the Hellenic Marine Environment Protection Agency (HELMEPA). Mr. Tsakos is a member of the council of the Independent Tanker Owners Association (INTERTANKO), a board member of the UK P&I Club, a board member of the Union of Greek Shipowners (UGS), a council member of the board of the Greek Shipping Co-operation Committee (GSCC) and a council member of the American Bureau of Shipping (ABS), Bureau Veritas (BV) and of the Greek Committee of Det Norske Veritas (DNV). He graduated from Columbia University in New York in 1985 with a degree in Economics and Political Science and obtained a Masters Degree in Shipping, Trade and Finance from the City of London University Business School in 1987. Mr. Tsakos served as an officer in the Hellenic Navy in 1988.
GEORGE V. SAROGLOU
CHIEF OPERATING OFFICER
Mr. Saroglou has been Chief Operating Officer of the Company since 1996. Mr. Saroglou is a shareholder and director of Pansystems S.A., a leading Greek information technology systems integrator, where he also worked from 1987 until 1994. From 1995 to 1996 he was employed in the Trading Department of the Tsakos Group. He graduated from McGill University in Canada in 1987 with a Bachelors Degree in Science (Mathematics).
PAUL DURHAM
CHIEF FINANCIAL OFFICER
Mr. Durham joined the Tsakos Group in 1999 and has served as our Chief Financial Officer and Chief Accounting Officer since June 2000. Mr. Durham is a United Kingdom Chartered Accountant. From 1989 through 1998, Mr. Durham was employed in Athens with the Latsis Group, a shipping, refinery and banking enterprise, becoming Financial Director of Shipping in 1995. From 1983 to 1989, Mr. Durham was employed by RJR Nabisco Corporation, serving as audit manager for Europe, Asia and Africa until 1986 and then as financial controller of one of their United Kingdom food divisions. Mr. Durham worked with Ernst & Young (London and Paris) from 1972 to 1979 and Deloitte & Touche (Chicago and Athens) from 1979 to 1983.
VLADIMIR JADRO
CHIEF MARINE OFFICER
Mr. Jadro joined Tsakos Energy Navigation Limited in February 2006. He was appointed Chief Marine Officer of the Company in June 2006. Mr. Jadro was employed by Exxon/ExxonMobil Corp. from 1980 until 2004 in various technical and operational positions including: operations, repairs, new building constructions, off shore conversions and projects of the marine department of ExxonMobil Corp. He was in charge of various tankers and gas carriers from 28,000 dwt to 409,000 dwt, and responsible for the company vetting system. He was also involved in the development of oil companies’ international “SIRE” vessel inspection system. From 1978 until 1980 he was employed by the Bethlehem Steel shipyard in charge of machinery repairs, dry-dockings and steel renewals. From 1967 until 1977, Mr. Jadro was employed on various tankers starting as third engineer and advancing to Chief Engineer.
BOARD OF DIRECTORS AND OFFICERS
AUDIT COMMITTEE
Francis T. Nusspickel - Chairman
Peter Nicholson
D. John Stavropoulos
Michael G. Jolliffe
CHARTERING COMMITTEE
Nikolas P. Tsakos - Chairman
D. John Stavropoulos
George V. Saroglou
CAPITAL MARKETS COMMITTEE
Michael G. Jolliffe - Chairman
D. John Stavropoulos
Nikolas P. Tsakos
RISK COMMITTEE
D. John Stavropoulos - Chairman
Peter Nicholson
Nikolas P. Tsakos
Paul Durham
CORPORATE GOVERNANCE,
NOMINATING / COMPENSATION COMMITTEE
Peter Nicholson - Chairman
D. John Stavropoulos
Michael G. Jolliffe
William A. O’ Neil
Torben Janholt
Francis T. Nusspickel
Aristides A.N. Patrinos
OPERATIONAL AND ENVIRONMENTAL R&D COMMITTEE
Aristides A.N. Patrinos - Chairman
William A. O’ Neil
Francis T. Nusspickel
Vasilis Papageorgiou *
* (Mr. Papageorgiou is the Deputy Chairman of the
Company’s technical manager, Tsakos Shipping)
ANNUAL REPORT AND ACCOUNTS 2007 6 .. 7

08.00
SECOND OFFICER L. ARMAOS ON DUTY AT M/T ARCHANGEL’S DECK,
PORT OF KALAMATA, GREECE

FINANCIAL HIGHLIGHTS
(Expressed in thousands of US Dollars – except share and per share data)
2007 2006 2005
VOYAGE REVENUES 500,617 427,654 295,623
OPERATING INCOME 249,702 205,246 154,765
NET INCOME 183,171 196,404 161,755
EARNINGS PER SHARE (BASIC) 4.81 5.15 4.09
EARNINGS PER SHARE (DILUTED) 4.79 5.15 4.09
WEIGHTED AVERAGE OUTSTANDING SHARES (BASIC) 38,075,859 38,127,692 39,544,540
WEIGHTED AVERAGE OUTSTANDING SHARES (DILUTED) 38,234,079 38,141,052 39,573,692
AT YEAR-END:
TOTAL ASSETS 2,362,776 1,969,875 1,089,174
TOTAL LIABILITIES 1,508,236 1,214,386 481,988
STOCKHOLDERS’ EQUITY 854,540 755,489 607,186
OUTSTANDING SHARES 38,059,142 38,079,742 38,354,390
STOCKHOLDERS’ EQUITY PER SHARE OF COMMON STOCK 22.45 19.84 15.83
SHARE PRICE 37.03 22.95 18.24
NUMBER OF VESSELS 43 37 25
TOTAL DWT 4,669,748 4,180,827 2,924,944
AVERAGE DEADWEIGHT AGE OF VESSELS 5.6 5.9 6.3
All share and per share amounts have been restated to give effect to the two-for-one stock split.
ANNUAL REPORT AND ACCOUNTS 2007
8 .. 9
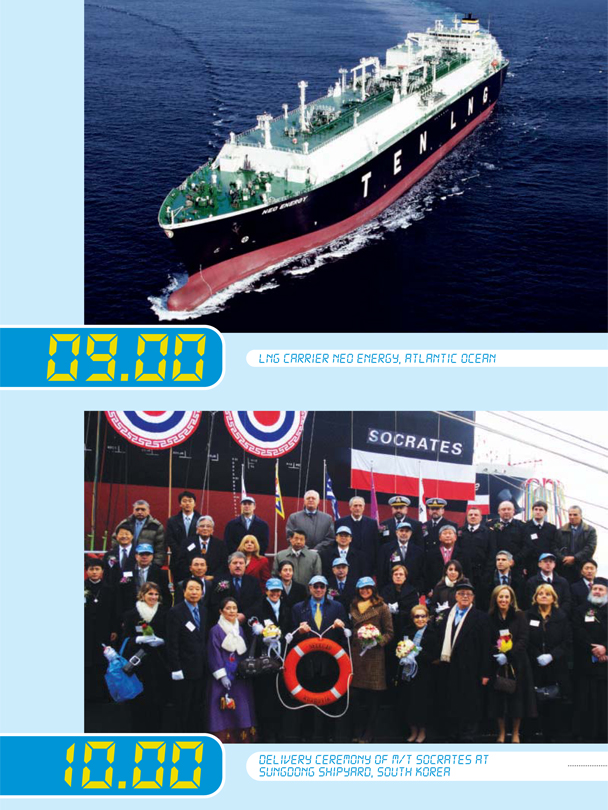
09.00
LNG CARRIER NEO ENERGY, ATLANTIC OCEAN
10.00
DELIVERY CEREMONY OF M/T SOCRATES AT SUNGDONG SHIPYARD, SOUTH KOREA

FORWARD-LOOKING INFORMATION
This Annual Report contains forward-looking statements based on beliefs of our management. Any statements contained in this Annual Report that are not historical facts are forward-looking statements as defined in the U.S. Private Securities Litigation Reform Act of 1995. We have based these forward-looking statements on our current expectations and projections about future events, including:
general economic and business conditions;
global and regional political conditions;
acts of terrorism and other hostilities;
availability of crude oil and petroleum products;
demand for crude oil and petroleum products and substitutes;
actions taken by OPEC and major oil producers and refiners;
competition in the marine transportation industry;
developments in international trade;
international trade sanctions;
changes in seaborne and other transportation patterns;
our ability to find new charters for our vessels at attractive rates;
capital expenditures;
meeting our requirements with customers;
tanker supply and demand;
regulations;
interest rate movements; and
foreign exchange
The words “anticipate,” “believe,” “estimate,” “expect,” “forecast,” “intend,” “may,” “plan,” “project,” “predict,” “should” and “will” and similar expressions as they relate to us are intended to identify such forward-looking statements. Such statements reflect our current views and assumptions and all forward-looking statements are subject to various risks and uncertainties that could cause actual results to differ materially from expectations. The factors that could affect our future financial results are discussed more fully in the Annual Report on Form 20-F and in our other filings with the U.S. Securities and Exchange Commission (“SEC”). We caution readers of this Annual Report not to place undue reliance on these forward-looking statements, which speak only as of their dates. We undertake no obligation to publicly update or revise any forward-looking statements.
INFORMATION ON THE COMPANY
Tsakos Energy Navigation is a leading provider of international seaborne crude oil and petroleum product transportation services. In 2007 it also started to transport liquefied natural gas. It was incorporated in 1993 as an exempted company under the laws of Bermuda under the name Maritime Investment Fund Limited. In 1996, Maritime Investment Fund Limited was renamed MIF Limited. Our common shares were listed in 1993 on the Oslo Stock Exchange (OSE) and the Bermuda Stock Exchange although we de-listed from the OSE in March 2005 due to limited trading. The Company’s shares are no longer actively traded on the Bermuda exchange. In July 2001, the Company’s name was changed to Tsakos Energy Navigation Limited to enhance our brand recognition in the tanker industry, particularly among charterers. In March 2002, we completed an initial public offering of the common shares in the United States and our common shares began trading on the New York Stock Exchange (NYSE) under the ticker symbol “TNP.” Since incorporation, the Company has owned and operated 61 vessels and has sold 20 vessels (of which three have been chartered back. One of these, Olympia, was repurchased at the end of its charter in January 2007 and sold again after a further one year’s trading).
ANNUAL REPORT AND ACCOUNTS 2007 10 .. 11

BUSINESS OVERVIEW
Tsakos Energy Navigation owns a fleet of modern tankers providing world-wide marine transportation services for national, major and other independent oil companies and refiners under long, medium and short-term charters. We believe that we have established a reputation as a safe, cost efficient operator of modern and well-maintained tankers. We also believe that these attributes, together with our strategy of proactively working towards meeting our customers’ chartering needs, has contributed to our ability to attract leading charterers as customers and to our success in obtaining charter renewals.
Our technical management is undertaken, by Tsakos Shipping and Trading (“Tsakos Shipping”) one of the world’s largest independent tanker managers, based on the number of tankers under management.
Tsakos Shipping has a total of 65 operating vessels under management (with a further 18 to be delivered, six of which are vessels under construction for Tsakos Energy Navigation, as of March 31, 2008). This enables Tsakos Shipping to achieve significant economies of scale when procuring supplies and underwriting insurance. These economies of scale, as well as Tsakos Shipping’s ability to spread their operating costs over a larger vessel base, have resulted in cost savings to us.
Tsakos Shipping’s established operations have allowed us to manage the growth of our fleet without having to integrate additional resources. The size of our operating fleet increased from 231,103 dwt at inception to approximately 4.7 million dwt at March 31, 2008 (including two chartered-in vessels) with no significant adverse impact on the organization.
We have access to Tsakos Shipping’s network offices around the world and a pool of over 3,000 available seafarers, which is supported by Tsakos Shipping’s sponsorship of naval academies in the Philippines, and a Tsakos Shipping manning office in Odessa, Ukraine.
As of March 31, 2008, our fleet consisted of 44 vessels (including two chartered-in vessels) of which three are VLCC tankers, ten are suezmax tankers, nine are aframax tankers (including three LR2 aframax product carriers), seven are panamax tankers, six are handymax MR2 product carriers, eight are handysize MR1 product carriers and one is a liquefied natural gas (LNG) carrier. 23 of the operating vessels are of ice-class specification. This fleet diversity, which includes a number of sister ships, provides us with the opportunity to be one of the more versatile operators in the market. The current fleet totals approximately 4.7 million dwt, all of which is double-hulled. This compares favorably to the worldwide average of 25% single-hulled dwt as of March 31, 2008. As of March 31, 2008, the average age of the tankers in our current operating fleet was 5.6 years, compared with the industry average of 10.6 years.
In addition to the vessels currently operating in our fleet, we are building an additional six vessels. In the first quarter of 2008, the Company took delivery of two panamaxes, Selecao and Socrates. Furthermore the Company sold its 1999 aframax tanker Olympia, which it had repurchased in January, 2007. In the last quarter of 2008, the Company expects to take delivery of two aframax tankers of DNA design. In 2009, the Company expects delivery of a further three aframax tankers of DNA design and in early 2010, one further aframax tanker of DNA design. The resulting fleet (assuming no sales) would comprise 50 vessels with 5.3 million dwt, which will include six vessels built between 1990 and 1998 of 1.1million dwt.
We believe the following factors distinguish us from other public tanker companies:
MODERN, HIGH-QUALITY, FLEET.
We own a fleet of modern, high-quality tankers that are designed for enhanced safety and low operating costs. Since inception, we have committed to investments of over $3.1 billion, including investments of approximately $2.4 billion in newbuilding constructions, in order to maintain and improve the quality of our fleet. We believe that increasingly stringent environmental regulations and heightened concerns about liability for oil pollution have contributed to a significant demand for our vessels by leading oil companies, oil traders and major government oil entities. Tsakos Shipping, the technical manager of our fleet, has received ISO 14001certification, based in part upon audits conducted on our vessels.
DIVERSIFIED FLEET.
Our diversified fleet, which includes VLCC, suezmax, aframax, panamax, handysize and handymax tankers, as well as one LNG carrier, allows us to better serve our customers’ international crude oil and petroleum product transportation needs. We have also committed a sizable part of our newbuilding and acquisition program to ice-class vessels. By March 31, 2008, we had 23 ice-class vessels. Additionally, we have entered the LNG market with the delivery of our first LNG carrier in the first quarter of 2007.
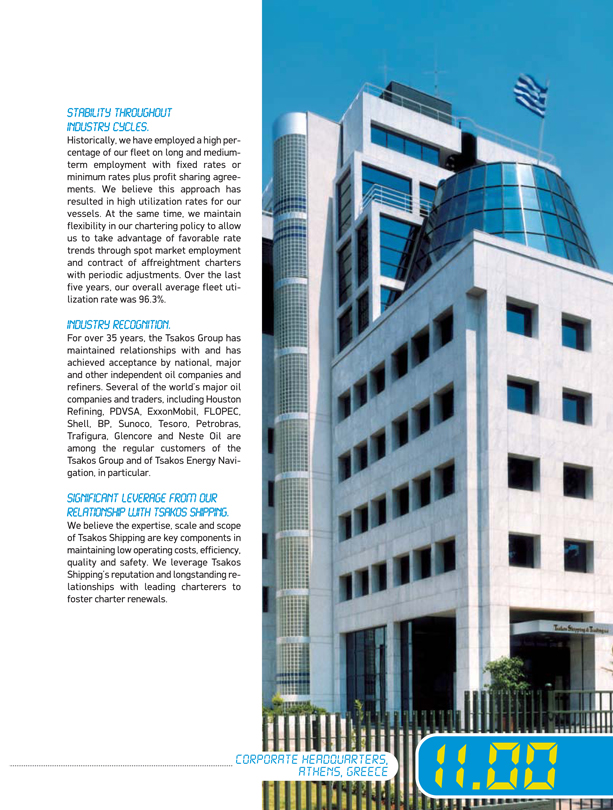
STABILITY THROUGHOUT INDUSTRY CYCLES.
Historically, we have employed a high percentage of our fleet on long and medium-term employment with fixed rates or minimum rates plus profit sharing agreements. We believe this approach has resulted in high utilization rates for our vessels. At the same time, we maintain flexibility in our chartering policy to allow us to take advantage of favorable rate trends through spot market employment and contract of affreightment charters with periodic adjustments. Over the last five years, our overall average fleet utilization rate was 96.3%.
INDUSTRY RECOGNITION.
For over 35 years, the Tsakos Group has maintained relationships with and has achieved acceptance by national, major and other independent oil companies and refiners. Several of the world’s major oil companies and traders, including Houston Refining, PDVSA, ExxonMobil, FLOPEC, Shell, BP, Sunoco, Tesoro, Petrobras, Trafigura, Glencore and Neste Oil are among the regular customers of the Tsakos Group and of Tsakos Energy Navigation, in particular.
SIGNIFICANT LEVERAGE FROM OUR
RELATIONSHIP WITH TSAKOS SHIPPING.
We believe the expertise, scale and scope of Tsakos Shipping are key components in maintaining low operating costs, efficiency, quality and safety. We leverage Tsakos Shipping’s reputation and longstanding relationships with leading charterers to foster charter renewals.
CORPORATE HEADQUARTERS,
ATHENS, GREECE
11.00

GROWTH CHARTS
The 1993-1999 financial data is in accordance with International Accounting Standards (IAS) while 2000-2007 is in accordance with US Generally Accepted Accounting Principles (US GAAP)
VOYAGE REVENUES
(in million US$)
OPERATING INCOME
(in million US$)
Data adjusted to reflect bonus share distributions of:
5.0% in June 1995. 2.5% in June 1996. 2.0% in June 1997. 2.2% in June 1998
NET INCOME
(in million US$)
EPS (BASIC)
For 101 days of operation only
Includes capital gains from the sale of vessels.
Includes a non-cash charge for the value impairment of two vessels totalling $10.8 million.
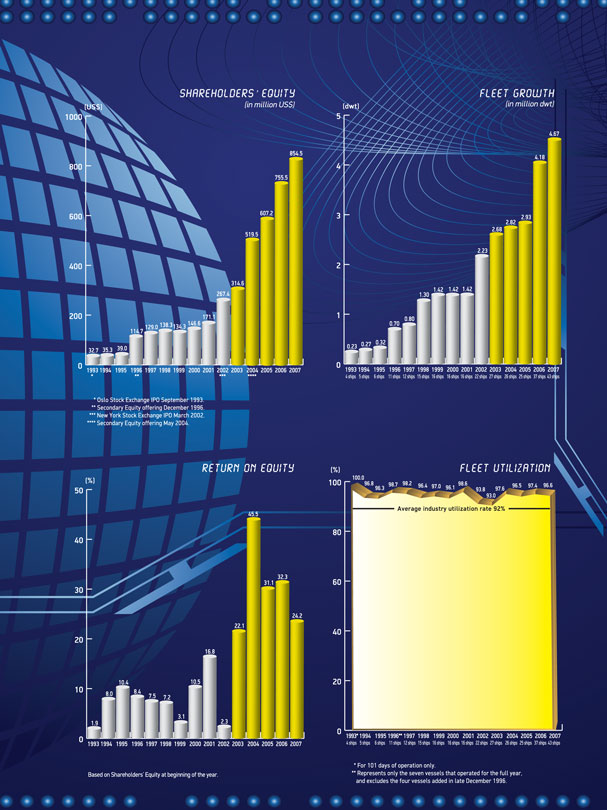
SHAREHOLDERS’ EQUITY
(in million US$)
FLEET GROWTH
(in million dwt)
Oslo Stock Exchange IPO September 1993.
Secondary Equity offering December 1996.
New York Stock Exchange IPO March 2002.
Secondary Equity offering May 2004.
RETURN ON EQUITY
FLEET UTILIZATION
Based on Shareholders’ Equity at beginning of the year
For 101 days of operation only.
Represents only the seven vessels that operated for the full year and excludes the four vessels added in late December 1996.

OUR FLEET
(as of March 31, 2008)
VESSEL TYPE YEAR BUILT YEAR ACQUIRED CHARTER TYPE EXPIRATION OF CHARTER
VLCC
1. MILLENNIUM 1998 1998 BAREBOAT CHARTER SEPTEMBER 2013
2. LA MADRINA (2)(7) 1994 2004 TIME CHARTER APRIL 2011
3. LA PRUDENCIA (2)(7) 1993 2006 TIME CHARTER APRIL 2011
SUEZMAX
1. ARCTIC 2007 2007 SPOT ---
2. ANTARCTIC (2) 2007 2007 TIME CHARTER OCTOBER 2010
3. ARCHANGEL 2006 2006 SPOT ---
4. ALASKA 2006 2006 SPOT ---
5. EUROCHAMPION 2004 (2) 2005 2005 TIME CHARTER NOVEMBER 2010
6. EURONIKE 2005 2005 TIME CHARTER SEPTEMBER 2009
7. SILIA T 2002 2002 TIME CHARTER OCTOBER 2011
8. CAPE BAKER (1) 2002 2002 TIME CHARTER OCTOBER 2009
9. CAPE BALBOA (1) 2002 2002 TIME CHARTER NOVEMBER 2009
10. TRIATHLON (3) (2) 2002 2002 TIME CHARTER JANUARY 2013
AFRAMAX
1. IZUMO PRINCESS (5) 2007 2007 COA EVERGREEN
2. SAKURA PRINCESS (5) 2007 2007 TIME CHARTER JUNE 2009
3. PROTEAS (2) 2006 2006 TIME CHARTER JULY 2008
4. PROMITHEAS (2) 2006 2006 TIME CHARTER AUGUST 2008
5. PROPONTIS (2) 2006 2006 TIME CHARTER OCTOBER 2008
6. PARTHENON (6) 2003 2003 COA SEPTEMBER 2009
7. MARATHON (6) 2003 2003 COA SEPTEMBER 2009
8. OPAL QUEEN (5) 2001 2002 COA EVERGREEN
9. VERGINA II 1991 1996 TIME CHARTER JULY 2009
PANAMAX
1. SELECAO 2008 2008 TIME CHARTER FEBRUARY 2011
2. SOCRATES 2008 2008 TIME CHARTER MARCH 2011
3. ANDES (7) 2003 2003 TIME CHARTER NOVEMBER 2011
4. MAYA (7) (8) 2003 2003 TIME CHARTER SEPTEMBER 2012
5. INCA (7) (8) 2003 2003 TIME CHARTER MAY 2013
6. VICTORY III 1990 1996 TIME CHARTER DECEMBER 2008
7. HESNES 1990 1996 TIME CHARTER DECEMBER 2008
HANDYMAX
1. ARTEMIS (2) 2005 2006 TIME CHARTER JUNE 2009
2. AFRODITE (2) 2005 2006 TIME CHARTER JUNE 2009
3. ARIADNE (2) 2005 2006 TIME CHARTER OCTOBER 2009
4. ARIS (2) 2005 2006 TIME CHARTER MAY 2009
5. APOLLON (2) 2005 2006 TIME CHARTER SEPTEMBER 2009
6. AJAX (2) 2005 2006 TIME CHARTER MAY 2009
HANDYSIZE
1. ANDROMEDA (2) 2007 2007 TIME CHARTER MAY 2010
2. AEGEAS (2) 2007 2007 TIME CHARTER APRIL 2010
3. BYZANTION (2) 2007 2007 TIME CHARTER MAY 2010
4. BOSPOROS (2) 2007 2007 TIME CHARTER AUGUST 2010
5. DIDIMON 2005 2005 TIME CHARTER MARCH 2010
6. ARION (2) (7) 2006 2006 TIME CHARTER OCTOBER 2009
7. DELPHI 2004 2006 TIME CHARTER OCTOBER 2008
8. ANTARES (2) (7) 2006 2006 TIME CHARTER MAY 2009
LNG
1. NEO ENERGY 2007 2007 TIME CHARTER JUNE 2008
TOTAL VESSELS 44
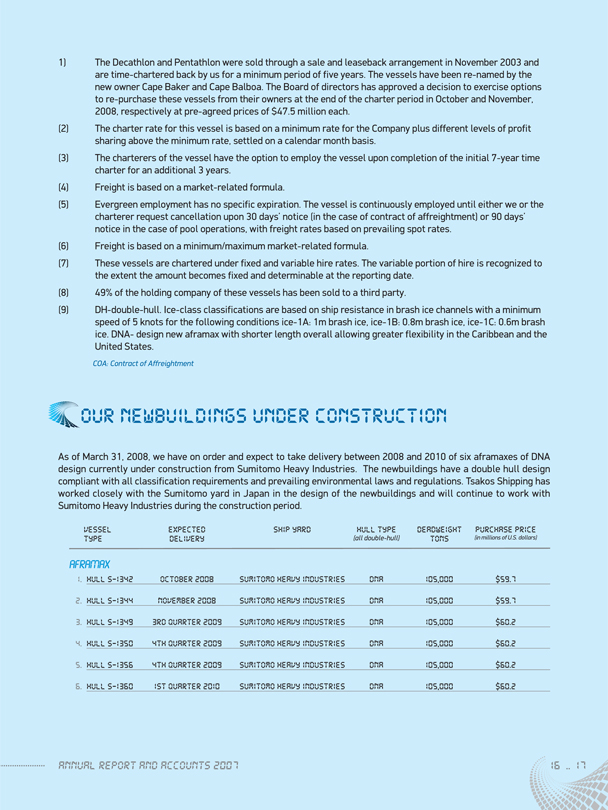
1) The Decathlon and Pentathlon were sold through a sale and leaseback arrangement in November 2003 and are time-chartered back by us for a minimum period of five years. The vessels have been re-named by the new owner Cape Baker and Cape Balboa. The Board of directors has approved a decision to exercise options to re-purchase these vessels from their owners at the end of the charter period in October and November, 2008, respectively at pre-agreed prices of $47.5 million each.
(2) The charter rate for this vessel is based on a minimum rate for the Company plus different levels of profit sharing above the minimum rate, settled on a calendar month basis.
(3) The charterers of the vessel have the option to employ the vessel upon completion of the initial 7-year time charter for an additional 3 years.
(4) Freight is based on a market-related formula.
(5) Evergreen employment has no specific expiration. The vessel is continuously employed until either we or the charterer request cancellation upon 30 days’ notice (in the case of contract of affreightment) or 90 days’ notice in the case of pool operations, with freight rates based on prevailing spot rates.
(6) Freight is based on a minimum/maximum market-related formula.
(7) These vessels are chartered under fixed and variable hire rates. The variable portion of hire is recognized to the extent the amount becomes fixed and determinable at the reporting date.
(8) 49% of the holding company of these vessels has been sold to a third party.
(9) DH-double-hull. Ice-class classifications are based on ship resistance in brash ice channels with a minimum speed of 5 knots for the following conditions ice-1A: 1m brash ice, ice-1B: 0.8m brash ice, ice-1C: 0.6m brash ice. DNA- design new aframax with shorter length overall allowing greater flexibility in the Caribbean and the United States.
COA: Contract of Affreightment
OUR NEWBUILDINGS UNDER CONSTRUCTION
As of March 31, 2008, we have on order and expect to take delivery between 2008 and 2010 of six aframaxes of DNA design currently under construction from Sumitomo Heavy Industries. The newbuildings have a double hull design compliant with all classification requirements and prevailing environmental laws and regulations. Tsakos Shipping has worked closely with the Sumitomo yard in Japan in the design of the newbuildings and will continue to work with Sumitomo Heavy Industries during the construction period.
VESSEL EXPECTED SHIP YARD HULL TYPE DEADWEIGHT PURCHASE PRICE
TYPE DELIVERY(all double-hull) TONS (in millions of U.S. dollars)
AFRAMAX
1. HULL S-1342 OCTOBER 2008 SUMITOMO HEAVY INDUSTRIES DNA 105,000 $59.7
2. HULL S-1344 NOVEMBER 2008 SUMITOMO HEAVY INDUSTRIES DNA 105,000 $59.7
3. HULL S-1349 3RD QUARTER 2009 SUMITOMO HEAVY INDUSTRIES DNA 105,000 $60.2
4. HULL S-1350 4TH QUARTER 2009 SUMITOMO HEAVY INDUSTRIES DNA 105,000 $60.2
5. HULL S-1356 4TH QUARTER 2009 SUMITOMO HEAVY INDUSTRIES DNA 105,000 $60.2
6. HULL S-1360 1ST QUARTER 2010 SUMITOMO HEAVY INDUSTRIES DNA 105,000 $60.2
ANNUAL REPORT AND ACCOUNTS 2007 16 .. 17
FLEET DEPLOYMENT
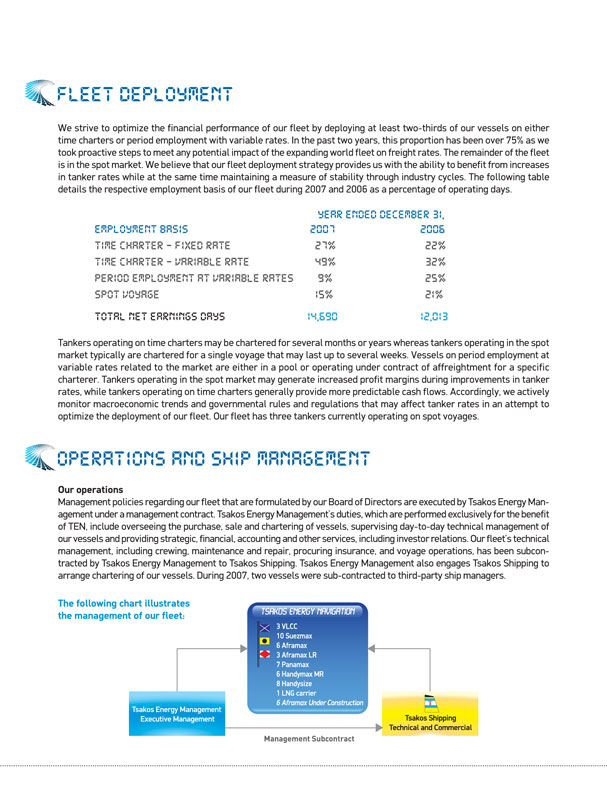
We strive to optimize the financial performance of our fleet by deploying at least two-thirds of our vessels on either time charters or period employment with variable rates. In the past two years, this proportion has been over 75% as we took proactive steps to meet any potential impact of the expanding world fleet on freight rates. The remainder of the fleet is in the spot market. We believe that our fleet deployment strategy provides us with the ability to benefit from increases in tanker rates while at the same time maintaining a measure of stability through industry cycles. The following table details the respective employment basis of our fleet during 2007 and 2006 as a percentage of operating days.
YEAR ENDED DECEMBER 31,
EMPLOYMENT BASIS 2007 2006
TIME CHARTER – FIXED RATE 27% 22%
TIME CHARTER – VARIABLE RATE 49% 32%
PERIOD EMPLOYMENT AT VARIABLE RATES 9% 25%
SPOT VOYAGE 15% 21%
TOTAL NET EARNINGS DAYS 14,690 12,013
Tankers operating on time charters may be chartered for several months or years whereas tankers operating in the spot market typically are chartered for a single voyage that may last up to several weeks. Vessels on period employment at variable rates related to the market are either in a pool or operating under contract of affreightment for a specific charterer. Tankers operating in the spot market may generate increased profit margins during improvements in tanker rates, while tankers operating on time charters generally provide more predictable cash flows. Accordingly, we actively monitor macroeconomic trends and governmental rules and regulations that may affect tanker rates in an attempt to optimize the deployment of our fleet. Our fleet has three tankers currently operating on spot voyages.
OPERATIONS AND SHIP MANAGEMENT
Our operations
Management policies regarding our fleet that are formulated by our Board of Directors are executed by Tsakos Energy Management under a management contract. Tsakos Energy Management’s duties, which are performed exclusively for the benefit of TEN, include overseeing the purchase, sale and chartering of vessels, supervising day-to-day technical management of our vessels and providing strategic, financial, accounting and other services, including investor relations. Our fleet’s technical management, including crewing, maintenance and repair, procuring insurance, and voyage operations, has been subcontracted by Tsakos Energy Management to Tsakos Shipping. Tsakos Energy Management also engages Tsakos Shipping to arrange chartering of our vessels. During 2007, two vessels were sub-contracted to third-party ship managers.
The following chart illustrates the management of our fleet:

FIRST OFFICER A. KOUGIAS, DECK OFFICER MISS S. MIGROU AND A/B M. RAFAEL AT THE BRIDGE OF M/T PROTEAS
(courtesy of Captain. I. Frangos) 12.00
M/T MAYA CROSSING THE GOLDEN GATE BRIDGE, SAN FRANCISCO BAY 13.00

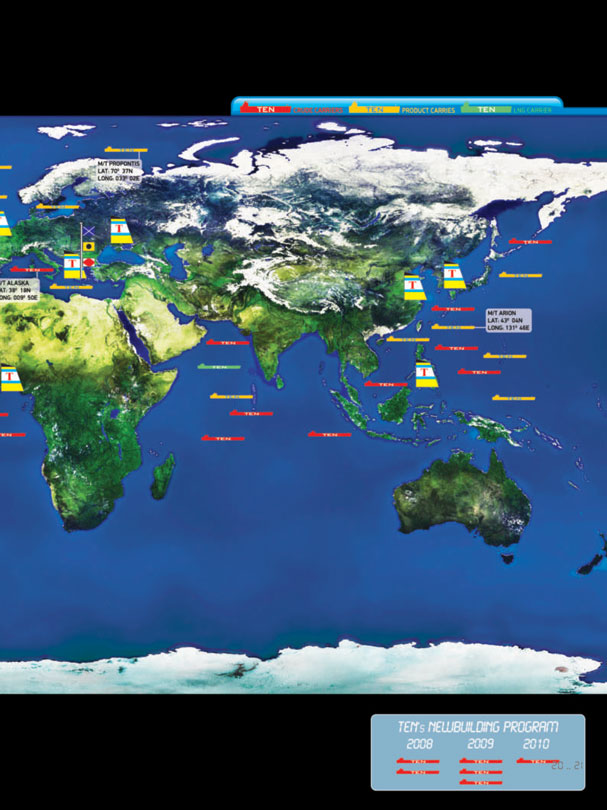
MAP OF OPERATION
(as of March 31, 2008)

OPERATING AND FINANCIAL REVIEW AND PROSPECTS
The following discussion of our financial condition and results of operations should be read in conjunction with the financial statements and the notes to those statements included elsewhere in this Annual Report. This discussion includes forward-looking statements that involve risks and uncertainties. As a result of many factors, our actual results may differ materially from those anticipated in these forward-looking statements.
OVERVIEW
As at March 31, 2008, we operated a fleet of 44 modern double-hull tankers providing world-wide marine transportation services for national, major and other independent oil companies and refiners under long, medium and short-term charters and one LNG carrier. The charter rates that we obtain for these services are determined in a highly competitive global tanker charter market. We operate our tankers in markets that have historically exhibited both cyclical and seasonal variations in demand and corresponding fluctuations in charter rates. Tanker markets are typically stronger in the winter months as a result of increased oil consumption in the northern hemisphere. In addition, unpredictable weather conditions in the winter months tend to disrupt vessel scheduling. The oil price volatility resulting from these factors has historically led to increased oil trading activities. Changes in available tanker capacity have also had a strong impact on tanker charter markets over the past 20 years.
RESULTS FROM OPERATIONS – 2007
World oil demand in 2007 grew by 1.4% over 2006 and, despite another year of increases in world tanker tonnage (by 6.2%), 2007 was another year with strong revenues and net income for operators, albeit somewhat down from 2006. The third quarter in 2007 reverted to its more usual characteristic of being a soft quarter, in comparison to the unusually strong third quarter of 2006 and the fourth quarter did not gather strength until December. The delay for the fourth quarter to take off is partly explained by the large drawdown on existing reserves of crude oil by refiners as forward oil prices fell lower than current prices. A relatively mild first part of winter also slowed down demand. The doubling of the price of oil also began to bite by the end of the year, overall world economic growth being 4.9%, still considered a strong growth rate, but down from the 5.3% growth in 2006. However, while prices were at a level that continued to encourage exploration and exploitation of previously uneconomic sources, they continued to impact tanker profitability by increasing the cost of bunker (fuel) and lubricants. The year also saw a continuation of high US interest rates which naturally impacted a capital-intensive industry, until the Federal Reserve took steps to generate financial liquidity by reducing interest rates in the latter part of the year, the real benefits of which may not be felt until well into 2008. The action to reduce rates did not help to slow the decline of the US Dollar against other currencies, in particular the Euro, and this also negatively impacted the industry, especially those companies which have significant expenditure initially in Euro.
Our fleet achieved voyage revenues of $500.6 million, up by 17.1% from $427.7 million in 2006. Capital gains on the sale of three operating vessels were $68.9 million. Operating income increased from $205.2 million in 2006 to $249.7 million in 2007, a 21.7% increase. Net income was $183.2 million, compared to $196.4 million in the prior year, a 6.7% decrease. Diluted income per share decreased from $5.15 in 2006, based on 38.14 million diluted weighted average shares outstanding, to $4.79 in 2007, based on 38.23 million diluted weighted average shares outstanding. Revenues, capital gains and operational income increased, in part due to our move towards more time charters with profit-share, which protect the Company with healthy minimum rates during periods of soft rates, and also allow us to take advantage of the charter market when rates move up. However, financing costs, including negative movements on non-hedging interest rate swaps, increased significantly and impacted net income accordingly.
Some of the more significant developments for the Company during 2007 were:
The delivery of the LNG carrier Neo Energy, the 1A ice-class suezmaxes Arctic and Antarctic, the DNA aframaxes Izumo Princess and Sakura Princess and the ice-class product carriers Aegeas, Andromeda, Byzantion and Bosporos.
The signing of contracts for two Sumitomo built DNA aframaxes for delivery in 2009 and in 2010.

PANORAMIC VIEW OF MANHATTAN FROM M/T APOLLON AT BAYONNE OIL TERMINAL, NJ 15.00
RINGING THE CLOSING BELL, NYSE 16.00
The sale of the panamax Bregen and aframaxes Maria Tsakos and Athens 2004 for a combined gain of over $68 million.
The repurchase of the aframax Olympia at a price substantially below market price and the later agreement to sell the same vessel Olympia in early 2008 with a gain of $34 million.
The dry-docking of Silia T., Cape Baker, Cape Balboa, Triathlon, La Prudencia and La Madrina for their mandatory special survey.
The two-for-one stock split in mid-November, 2007, increasing the total shares outstanding from approximately 19 million to 38 million.
The payment to the Company’s shareholders of two dividends; $0.750 per common share in April in respect of the fiscal year 2006, and $0.825 per common share in November, the first dividend with respect to fiscal year 2007. Total cash paid out on dividends amounted to $60.0 million.
The completion of the upgrade of the aframax Vergina II to double-hull.
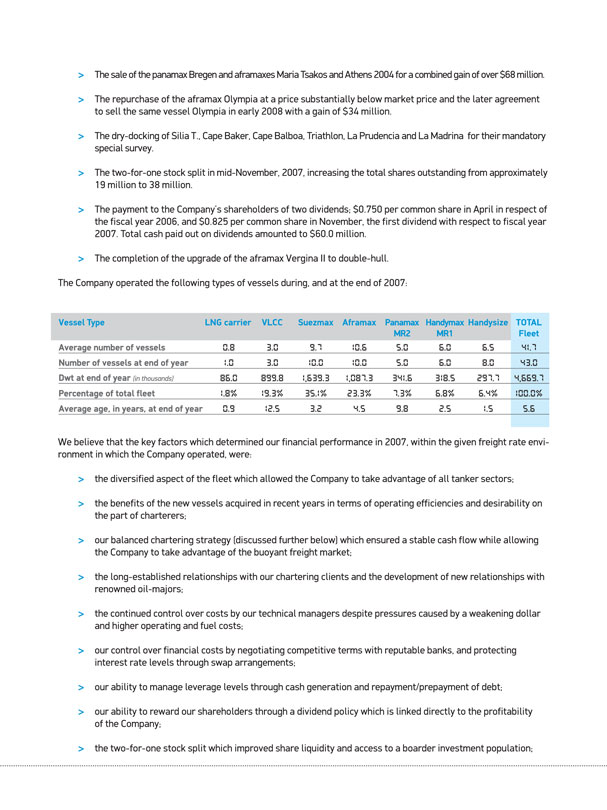
The Company operated the following types of vessels during, and at the end of 2007:
Vessel Type LNG carrier VLCC Suezmax Aframax Panamax MR2 HandymaxMR1 Handysize TOTAL Fleet
Average number of vessels 0.8 3.0 9.7 10.6 5.0 6.0 6.5 41.7
Number of vessels at end of year 1.0 3.0 10.0 10.0 5.0 6.0 8.0 43.0
Dwt at end of year (in thousands) 86.0 899.8 1,639.3 1,087.3 341.6 318.5 297.7 4,669.7
Percentage of total fleet 1.8% 19.3% 35.1% 23.3% 7.3% 6.8% 6.4% 100.0%
Average age, in years, at end of year 0.9 12.5 3.2 4.5 9.8 2.5 1.5 5.6
We believe that the key factors which determined our financial performance in 2007, within the given freight rate environment in which the Company operated, were:
the diversified aspect of the fleet which allowed the Company to take advantage of all tanker sectors;
the benefits of the new vessels acquired in recent years in terms of operating efficiencies and desirability on the part of charterers;
our balanced chartering strategy (discussed further below) which ensured a stable cash flow while allowing the Company to take advantage of the buoyant freight market;
the long-established relationships with our chartering clients and the development of new relationships with renowned oil-majors;
the continued control over costs by our technical managers despite pressures caused by a weakening dollar and higher operating and fuel costs;
our control over financial costs by negotiating competitive terms with reputable banks, and protecting interest rate levels through swap arrangements;
our ability to manage leverage levels through cash generation and repayment/prepayment of debt;
our ability to reward our shareholders through a dividend policy which is linked directly to the profitability of the Company;
the two-for-one stock split which improved share liquidity and access to a boarder investment population;

our ability to raise of new finance through bank debt at competitive terms despite the current tight credit environment, and
the sale of both older and newer vessels when attractive opportunities arose.
We believe that the above factors will also be those that will be behind the future financial performance of the Company and which are evident as we proceed through 2008, to which may be added:
a continuing buoyant charter market in comparison to historical levels;
the securing of a high level of utilization for our vessels (as at March 31, 2008, 80% of the remaining operational days available for 2008, and 62% for 2009, excluding expected new deliveries, have secured employment);
the continued appetite by oil majors to fix forward on medium to long term charters at current market rates which are significantly higher than the historical average.
the delivery of the six newbuildings that will join the fleet between March 31, 2008 and 2010 (two of which are to be delivered during the remainder of 2008);
the rapid development of new strategic areas with purpose-built vessels to access ice-bound ports and carry LNG (liquefied natural gas), and
the repurchase of common shares at favorable prices. During the first quarter of 2008 we bought back 265,600 shares under a fixed repurchase plan at a total cost of approximately $8.3 million.
Looking forward and given increasing demand and the lack of clarity over oil production from Iran, Nigeria and Iraq, and continued discussion by the Organization of Petroleum Exporting Countries (OPEC) about their production levels, high oil prices may continue through 2008, although there is now some expectation that oil prices may decrease significantly later in the year. The expected increasing demand from China and India will continue to have a beneficial impact on transportation requirements for petroleum and its products in the foreseeable future. Another indication of the strength of the market can be seen in continued demand growth despite price hikes. Historically, as oil prices have risen, some global consumers have been forced to curtail imports. However, even in the current environment, it appears that price has not materially dissuaded imports.
We expect that 2008 should once again prove to be a good year for the tanker industry. The current financial crisis and any possible recession in the U.S. is likely to be contained within 2008 and, although a certain amount of pain may possibly still be felt within the financial sector, the underlying economic and business fundamentals are said to remain sound and are not expected to have a major impact on the demand for and transportation of oil. The aforementioned economic stimuli, coupled with geopolitical events in areas such as Nigeria, Iraq, Iran and Venezuela, should continue to fuel the market and maintain the new trading patterns with long-haul requirements we have seen emerge over the past two years. Additionally, despite the expected surge in deliveries of new vessels, the IMO and European Union regulations relating to the phase-out of single-hull tankers should begin to have a significant compensating impact on the supply/demand balance of tanker availability.
Our current fleet consists of three VLCCs, ten suezmaxes, nine aframaxes, seven panamaxes, six handymaxes, eight handysizes and one LNG carrier. All vessels are owned by our subsidiaries with the exception of the two suezmaxes, Cape Baker and Cape Balboa, acquired in 2002 and sold in October and November 2003, respectively, that were time chartered back from the owners for five years. We have exercised options to repurchase these vessels in the latter part of 2008 at a price of $47.5 million each which is well below current market values.
ANNUAL REPORT AND ACCOUNTS 2007 24 .. 25
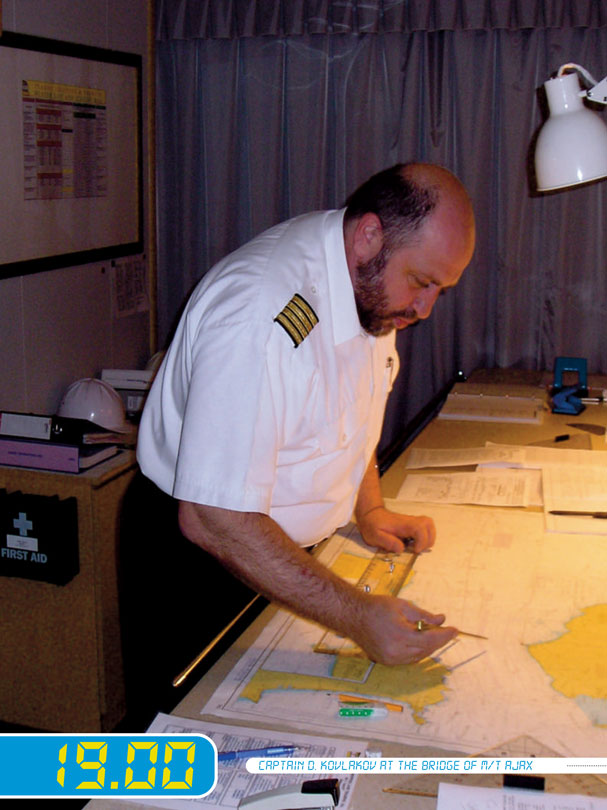
19.00 CAPTAIN D. KOVLAKOV AT THE BRIDGE OF M/T AJAX

CHARTERING STRATEGY
We typically charter our vessels to third parties in any of three basic types of charter. First are “voyage charters” or “spot voyages”, under which a shipowner is paid freight on the basis of moving cargo from a loading port to a discharging port at a given rate per ton or other unit of cargo. Port charges, bunkers and other voyage expenses (in addition to normal vessel operating expenses) are the responsibility of the shipowner.
Second are “time charters,” under which a shipowner is paid hire on a per day basis for a given period of time. Normal vessel operating expenses, such as maintenance and repair, crew wages and insurance premiums, are incurred by the shipowner, while voyage expenses, including bunkers and port charges, are the responsibility of the charterer. The time charterer decides the destination and types of cargoes to be transported, subject to the terms of the charter. Time charters can be for periods of time ranging from one or two months to more than three years. The agreed hire may be for a fixed daily rate throughout the period or may be at a guaranteed minimum fixed daily rate plus a share of a determined daily rate above the minimum, based on a given variable charter index or on a decision by an independent brokers’ panel for a defined period. Many of our charters have been renewed on this time charter with profit share basis over the past two years. Time charters can also be “evergreen,” which means that they automatically renew for successive terms unless the shipowner or the charterer elects to terminate the charter.
Third are “bareboat charters” under which the shipowner is paid a fixed amount of hire for a given period of time. The charterer is responsible for substantially all the costs of operating the vessel including voyage expenses, vessel operating expenses and technical and commercial management. Longer-term time charters and bareboat charters are sometimes known as “period charters”.
We also enter into “contracts of affreightment” which are contracts for multiple employments that provide for periodic adjustments, within prescribed ranges, to the charter rates. At the beginning of 2007 two of our vessels also operated within a pool of similar vessels whereby all income (less voyage expenses) is earned on a market basis and shared between pool participants on the basis of a formula which takes into account the vessel’s age, size and technical features. None of our vessels have operated in a pool since January, 2007.
The chartering strategy of the Company continues to be one of fixing the greater portion of our fleet on medium to long-term employment in order to secure a stable income flow, but one which also ensures a satisfactory return. This strategy has enabled the Company to level the affects of the cyclical nature of the tanker industry, achieving almost optimal utilization of the fleet. In order to capitalize on possible upturns in rates, the Company has chartered out several of its vessels on a market basis. We currently have 41 of our 44 vessels managed on time charter or other form of period employment, ensuring that at least 80% of 2008 availability and 62% of 2009 has secured employment.
The Board of Directors, through its Chartering Committee, formulates the chartering strategy of the Company and the Company’s commercial manager Tsakos Energy Management implements this strategy through the technical manager, Tsakos Shipping. They evaluate the opportunities for each type of vessel, taking into account the strategic preference for medium and long-term charters and ensure optimal positioning to take account of redelivery opportunities at advantageous rates.
The cooperation with Tsakos Shipping enables the Company to take advantage of the long-established relationships they have built with many of the world’s major oil companies and refiners over 36 years of existence and high quality commercial and technical service. Tsakos Shipping manages the vessels of the Company plus another 21 operating vessels, mostly container vessels, bulk carriers and a few single hull tankers. Apart from the customer relations, the Company is also able to take advantage of the inherent economies of scale associated with a large fleet manager and its commitment to contain running costs without jeopardizing the vessels’ operations. Tsakos Shipping provides top grade officers and crew for the Company’s vessels and first class superintendent engineers and port captains to ensure that the vessels are in prime condition.
ANNUAL REPORT AND ACCOUNTS 2007 26 .. 27

20.00 CHIEF ENGINEER L. TSIKOURIAS AND TEAM IN THE CONTROL ROOM OF M/T MAYA
21.00 LNG NEO ENERGY AT LAKE CHARLES TERMINAL, LA
FINANCIAL ANALYSIS
(Percentage changes are based on the full numbers in the accompanying consolidated financial statements)
YEAR ENDED DECEMBER 31, 2007 VERSUS YEAR ENDED DECEMBER 31, 2006
Voyage revenues
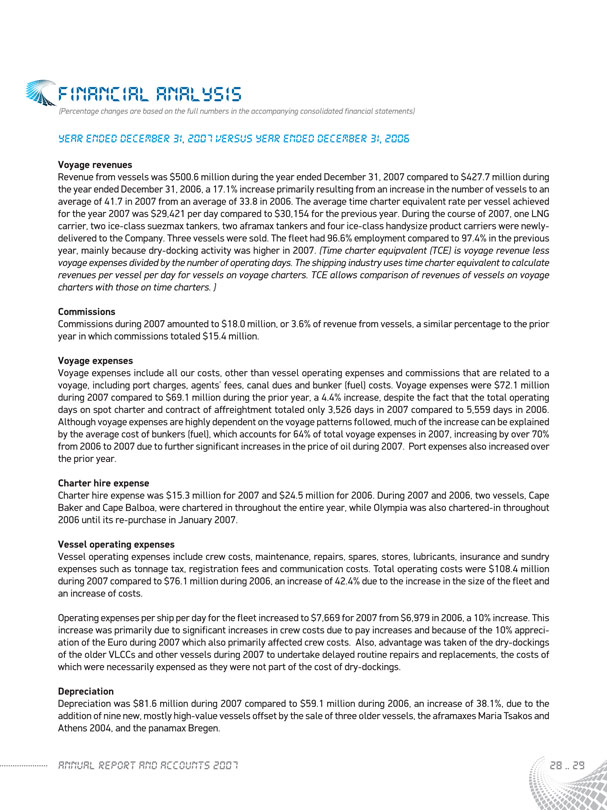
Revenue from vessels was $500.6 million during the year ended December 31, 2007 compared to $427.7 million during the year ended December 31, 2006, a 17.1% increase primarily resulting from an increase in the number of vessels to an average of 41.7 in 2007 from an average of 33.8 in 2006. The average time charter equivalent rate per vessel achieved for the year 2007 was $29,421 per day compared to $30,154 for the previous year. During the course of 2007, one LNG carrier, two ice-class suezmax tankers, two aframax tankers and four ice-class handysize product carriers were newly-delivered to the Company. Three vessels were sold. The fleet had 96.6% employment compared to 97.4% in the previous year, mainly because dry-docking activity was higher in 2007. (Time charter equipvalent (TCE) is voyage revenue less voyage expenses divided by the number of operating days. The shipping industry uses time charter equivalent to calculate revenues per vessel per day for vessels on voyage charters. TCE allows comparison of revenues of vessels on voyage charters with those on time charters. )
Commissions
Commissions during 2007 amounted to $18.0 million, or 3.6% of revenue from vessels, a similar percentage to the prior year in which commissions totaled $15.4 million.
Voyage expenses
Voyage expenses include all our costs, other than vessel operating expenses and commissions that are related to a voyage, including port charges, agents’ fees, canal dues and bunker (fuel) costs. Voyage expenses were $72.1 million during 2007 compared to $69.1 million during the prior year, a 4.4% increase, despite the fact that the total operating days on spot charter and contract of affreightment totaled only 3,526 days in 2007 compared to 5,559 days in 2006. Although voyage expenses are highly dependent on the voyage patterns followed, much of the increase can be explained by the average cost of bunkers (fuel), which accounts for 64% of total voyage expenses in 2007, increasing by over 70% from 2006 to 2007 due to further significant increases in the price of oil during 2007. Port expenses also increased over the prior year.
Charter hire expense
Charter hire expense was $15.3 million for 2007 and $24.5 million for 2006. During 2007 and 2006, two vessels, Cape Baker and Cape Balboa, were chartered in throughout the entire year, while Olympia was also chartered-in throughout 2006 until its re-purchase in January 2007.
Vessel operating expenses
Vessel operating expenses include crew costs, maintenance, repairs, spares, stores, lubricants, insurance and sundry expenses such as tonnage tax, registration fees and communication costs. Total operating costs were $108.4 million during 2007 compared to $76.1 million during 2006, an increase of 42.4% due to the increase in the size of the fleet and an increase of costs.
Operating expenses per ship per day for the fleet increased to $7,669 for 2007 from $6,979 in 2006, a 10% increase. This increase was primarily due to significant increases in crew costs due to pay increases and because of the 10% appreciation of the Euro during 2007 which also primarily affected crew costs. Also, advantage was taken of the dry-dockings of the older VLCCs and other vessels during 2007 to undertake delayed routine repairs and replacements, the costs of which were necessarily expensed as they were not part of the cost of dry-dockings.
Depreciation
Depreciation was $81.6 million during 2007 compared to $59.1 million during 2006, an increase of 38.1%, due to the addition of nine new, mostly high-value vessels offset by the sale of three older vessels, the aframaxes Maria Tsakos and Athens 2004, and the panamax Bregen.
ANNUAL REPORT AND ACCOUNTS 2007 28 .. 29

Amortization
We amortize the cost of dry-docking and special surveys over the period to the next dry-docking, and this amortization is included as part of the normal costs we incur in connection with the operation of our vessels. During 2007, amortization of deferred dry-docking charges was $3.2 million compared to $4.9 million during 2006, a decrease of 33.8%. The decrease was mainly due to the sale of three vessels in 2007 on which there were still balances of unamortized deferred dry-docking charges which were included in determination of gains on sale and because the dry-dockings in 2007 mostly took place in the second half of the year.
Management fees
Management fees are the fixed fees per vessel the Company pays to Tsakos Energy Management Limited under a management agreement between the companies. During 2007, the Company paid to Tsakos Energy Management Limited fixed monthly fees per vessel under the management agreement. The monthly fee during 2007 was $20,000 and in 2006 was $18,000 for all vessels except the chartered-in vessels, where the fee was $15,000 and $12,500 per month respectively. The fee pays for services that cover both the management of the individual vessels and of the Company as a whole. Management fees totaled $9.8 million for 2007 compared to $7.1 million for 2006, an increase of 37.4%, due both to the increase in number of vessels in the fleet and the increase in monthly fees.
General and administrative expenses
General and administrative expenses consist primarily of professional fees, office supplies, advertising costs, directors’ liability insurance, directors’ fees and reimbursement of our directors’ and officers’ travel-related expenses. General and administrative expenses were $4.4 million during 2007 compared to $3.5 million during 2006, an increase of 24.8% due mainly to increases in audit fees.
Total general and administrative expenses plus management fees paid to Tsakos Energy Management Limited represent the overhead of the Company. On a per vessel basis, daily overhead costs were $930 in 2007 compared to $860 in 2006, mainly due to the increase in audit fees. If the incentive award and staff compensation expense described below are taken into account, the 2007 daily overhead cost per vessel is $1,565 compared to $1,162 for 2006.
Management incentive award
In accordance with the management agreement between the Company and Tsakos Energy Management Limited and as approved by the Board of Directors, $4.0 million is due as an award to Tsakos Energy Management Limited due to the success of the Company during 2007 for achieving a return of 24.2% on opening equity for 2007. In the previous year, an award of $3.5 million was achieved for exceeding the 25% target.
Stock compensation expense
In January 2007, officers and staff of the commercial and technical managers and of the vessels were informed that there would be an issuance of 580,000 restricted share units (RSUs), 50% of which would vest on December 31, 2008 and the remaining 50% on December 31, 2010. These units were issued on March 7, 2007. On June 1, 2006, 20,000 RSUs had been issued to be shared between the non-executive directors. These RSUs vested 100% on June 1, 2007. A further 4,650 RSUs were issued on June 1, 2007 to be shared between the non-executive directors which vest 100% on June 1, 2008. 1,000 RSUs were issued on June 1, 2007 to one non-executive director, vesting immediately. The compensation expense of $5.7 million represents the combined amortization. In 2006, an amount of $0.2 million was amortized and included in General and Administrative expenses. The 2006 amortization has been reclassified to be shown separately as Stock compensation expense.
Amortization of the deferred gain on the sale of vessels.
The Company sold two suezmaxes in a sale and leaseback transaction during 2003. The total gain of $15.8 million was deferred and is being amortized over the five year minimum charter period to late 2008. The amortization of this gain amounted to $3.2 million for both 2007 and 2006. In the fourth quarter of 2008, both vessels will be re-acquired by the Company in accordance with the related repurchase option which has been recently exercised.
Gain on sale of vessels
During 2007, the Company sold the aframax tankers Maria Tsakos and Athens 2004 to the same buyer for a total of $122.1 million, resulting in a combined gain of $61.8 million, and the panamax Bregen was also sold for $22.9 million resulting in a gain of $6.4 million. Further sundry capital gains amounted to $0.7 million. In 2006, the Company sold three operating tankers for gains totaling $38.0 million.

Operating income
Income from vessel operations was $249.7 million during 2007 versus $205.2 million during 2006, a 21.7% increase.
Gain on sale of shares in subsidiary
During the fourth quarter 2006, the Company sold to FLOPEC of Ecuador 49% of the shares of the holding company of the two vessel-owning companies which hold the panamax vessels Maya and Inca. The sale resulted in recognition of a gain of $25.3 million. There were no sales of shares in subsidiaries during 2007.
Interest and finance costs, net
Interest and finance costs net, were $77.4 million for 2007 compared to $42.5 million for 2006, an 82.1% increase. Loan interest increased to $82.5 million from $54.7 million, a 50.7% increase. Total weighted average bank loans outstanding were approximately $1,365 million for 2007 compared to $933 million for 2006. The average loan financing cost in 2007, considering the impact of swap interest, was 5.60% compared to 5.59% for 2007.
There was a net negative movement of $7.8 million in the fair value (mark-to-market) of the non-hedging interest rate swaps in 2007 compared to a positive $2.6 million for 2006.
Capitalized interest in 2007 was $8.9 million compared to $12.5 million in the previous year. The decline is due primarily to the decrease in the number of vessels under construction, nine newbuildings being delivered in 2007, leaving only eight to be delivered over the following two years.
Amortization of loan expenses was $0.9 million in 2007 and $1.5 million in 2006. Other loan charges, including commitment fees were $0.6 million in 2007 and $1.4 million in 2006.
Interest and investment income
Interest and investment income derived from bank deposits and investments, including the net positive changes in the market values of the investments and net gains on disposal of investments was $13.3 million for 2007 as compared to $7.2 million for 2006. The increase is mainly due to the increase in the value of investments and to the increase in the amount of cash balances.
Minority interest
The amount earned by the minority (49%) interest in the shareholding of the subsidiary which owns the owning companies of the vessels Maya and Inca was $3.4 million in 2007 compared to $0.2 million in 2006. The sale of the shares took place in mid-December 2006.
Net income
As a result of the foregoing, net income for 2007 was $183.2 million, or $4.79 per diluted share versus $196.4 million or $5.15 per diluted share for 2006.
YEAR ENDED DECEMBER 31, 2006 VERSUS YEAR ENDED DECEMBER 31, 2005
Voyage revenues
Revenue from vessels was $427.7 million during the year ended December 31, 2006 as compared to $295.6 million during the year ended December 31, 2005, a 44.7% increase partly resulting from an increase in the number of vessels from an average of 26.1 in 2005 to an average of 33.8 in 2006, and partly from the improvement in charter rates. The average time charter equivalent rate per vessel (voyage revenue less voyage expenses per operating day) achieved for the year 2006 was $30,154 per day compared to $28,645 for the previous year. During the course of 2006, one VLCC, two new ice-class suezmaxes, three new ice-class LR2 aframax product carriers, six new ice-class MR2 handymax product carriers, and three new handysize product carriers were acquired or newly-delivered. Three vessels were sold. The fleet had 97.4% employment compared to 96.5% in the previous year, mainly because dry-docking activity was slightly less in 2006.
Commissions
Commissions were $15.4 million, or 3.6% of revenue from vessels, during 2006, compared to $11.6 million, 3.9% of revenue from vessels, for 2005. The decrease was due to changes in employment of several vessels to charter arrangements where lower commission was charged. The newly acquired vessels were employed on similar charters.
ANNUAL REPORT AND ACCOUNTS 2007 30 .. 31

Voyage expenses
Voyage expenses include all our costs, other than vessel operating expenses and commissions, that are related to a voyage, including port charges, agents’ fees, canal dues and bunker (fuel) costs. Voyage expenses were $69.1 million during the year ended December 31, 2006 compared to $36.0 million during the prior year, a 92.0% increase. Although voyage expenses are highly dependent on the voyage patterns followed, much of the increase can be explained by the fact that the total operating days on spot charter and contract of affreightment increased from 3,503 days in 2005 to 5,559 days in 2006. In addition, the cost of bunkers (fuel) which accounts for 68% total voyage expenses in 2006 increased by 26% from 2005 to 2006 due to the significant increase in the price of oil during 2006.
Charter hire expense
Charter hire expense was $24.3 million for 2005 and $24.5 million for 2006, with the same three vessels chartered in throughout the entire year, Olympia, Cape Baker and Cape Balboa.
Vessel operating expenses
Vessel operating expenses include crew costs, maintenance, repairs, spares, stores, lubricants, insurance and sundry expenses such as tonnage tax, registration fees and communication costs. Total operating costs were $76.1 million during 2006 compared to $52.9 million during 2005, an increase of 43.7%. This increase is directly related to the increase in the size of the fleet.
Operating expenses per ship per day for the fleet increased from $6,534 for 2005 to $6,979 for 2006, a 6.8% increase. This increase primarily reflects increases in lubricant prices and insurance premiums.
Depreciation
Depreciation was $59.1 million during 2006 compared to $35.7 million during 2005, an increase of 65.4%, due to the addition of fifteen new, mostly high-value vessels offset by the sale of two small older vessels, Libra and Crux, and the panamax Aztec.
Amortization
We amortize the cost of dry-docking and special surveys over the period to the next dry-docking, and this amortization is included as part of the normal costs we incur in connection with the operation of our vessels. During 2006, amortization of deferred dry-docking charges was $4.9 million as compared to $6.6 million during 2005, a decrease of 26.2%. The decrease was partly due to the sale of two vessels in 2006 on which there were still balances of unamortized deferred dry-docking charges which is included in determination of gains on sale and the fact that only two vessels had completed dry-docking during 2006.
Management fees
Management fees are the fixed fees per vessel the Company pays to Tsakos Energy Management Limited under a management agreement between the companies. During 2006, the Company paid to Tsakos Energy Management Limited fixed monthly fees per vessel under the management agreement. The monthly fee during 2006 and 2005 was $18,000 for all vessels except the chartered-in vessels, where the fee was $12,500 per month. The fee pays for services that cover both the management of the individual vessels and of the Company as a whole. Management fees totaled $7.1 million for 2006 compared to $5.5 million for 2005, an increase of 30.1%, due to the increase in number of vessels in the fleet.
General and administrative expenses
General and administrative expenses consist primarily of professional fees, office supplies, advertising costs, directors’ liability insurance, directors’ fees and reimbursement of our directors’ and officers’ travel-related expenses. General and administrative expenses were $3.5 million during 2006 compared to $3.6 million during 2005.
Total general and administrative expenses plus management fees paid to Tsakos Energy Management Limited represents the overhead of the Company. On a per vessel basis, daily overhead costs decreased from $954 in 2005 to $860 in 2006, mainly due to an increase in professional fees. If the incentive award and stock compensation expense described below are taken into account, the 2006 daily overhead cost is $1,162 compared to $1,217 for 2005.

Management incentive award
In accordance with the management agreement between the Company and Tsakos Energy Management Limited, $3.5 million is due as an award to Tsakos Energy Management Limited due to the success of the Company during 2006 for exceeding a targeted return of 25% on opening equity for 2006. In the previous year, an award of $2.5 million was achieved for exceeding the 25% target.
Stock compensation expense
On June 1, 2006, 20,000 RSUs had been issued to be shared between the non-executive directors and vesting 100% on June 1, 2007. An amount of $216 was amortized and was included in General and Administrative expenses.
Amortization of the deferred gain on the sale of vessels
The Company sold two suezmaxes in a sale and leaseback transaction during 2003. The total gain of $15.8 million was deferred and is being amortized over the five year minimum charter period. The amortization of this gain amounted to $3.2 million for both 2005 and 2006.
Gain on sale of vessels
During 2006, the Company sold the handysize product carriers Libra and Crux to the same buyer for a total of $32.3 million, resulting in a gain of $13.3 million, and the panamax Aztec was also sold for $58.5 million resulting in a gain of $24.7 million. In 2005, the Company sold five operating tankers for gains totaling $34.5 million.
Operating income
Income from vessel operations was $205.2 million during 2006 versus $154.8 million during 2005, a 32.6% increase.
Gain on the sale of non-operating vessels
There were no sales of non-operating vessels during 2006. During 2005, one newbuilding hull was sold resulting in a gain of $10.8 million.
Gain on sale of shares in subsidiary
During the fourth quarter 2006, the Company completed its sale to FLOPEC of Ecuador 49% of the shares of the holding company of the two vessel-owning companies which hold the panamax vessels Maya and Inca. The sale resulted in recognition of a gain of $25.3 million. There were no sales of shares in subsidiaries during 2005.
Interest and finance costs, net
Interest and finance costs net, were $42.5 million for 2006 compared to $11.2 million for 2005, a 277.8% increase. Loan interest increased to $54.7 million from $19.1 million, a 186.4% increase. Total weighted average bank loans outstanding were approximately $933 million for 2006 compared to $416 million for 2005. The average loan financing cost in 2006, considering the impact of swap interest, was 5.59% compared to 4.40% for 2005.
There was a net positive movement of $2.6 million, including reclassification adjustments on undesignated cash flow hedges, in the fair value (mark-to-market) of the non-hedging interest rate swaps in 2006 compared to $3.2 million for 2005. During 2005 a deferred gain on the termination of an interest rate swap of $1.7 million was fully recognized in income on repayment of the related loan.
Capitalized interest in 2006 was $12.5 million compared to $5.3 million in the previous year, due to the additional number of vessels under construction during 2006, as well as the increase in interest rates.
Amortization of loan expenses was $1.5 million in 2006 and $1.0 million in 2005. Other loan charges, including commitment fees were $1.4 million in both 2006 and 2005.
Interest and investment income
Interest and investment income derived from bank deposits and investments, including the net positive changes in the market values of the investments, was $7.2 million for 2006 as compared to $7.4 million for 2005.
Net income
As a result of the foregoing, net income for 2006 was $196.4 million, or $5.15 per diluted share versus $161.8 million or $4.09 per diluted share for 2005, an increase of 25.9% per share.
ANNUAL REPORT AND ACCOUNTS 2007 32 .. 33

23.00 MANHATTAN-NEW YORK LIGHTING UP
01.00 LIGHTING UP THE ACROPOLIS, ATHENS-GREECE

LIQUIDITY AND CAPITAL RESOURCES
Our liquidity requirements relate to servicing our debt, funding the equity portion of investments in vessels, funding working capital and controlling fluctuations in cash flow. Net cash flow generated by operations is our main source of liquidity. Apart from the possibility of securing further equity, additional sources of cash include proceeds from asset sales and borrowings, although all borrowing arrangements to date have specifically related to the acquisition of vessels.
We believe that, unless there is a major and sustained downturn in market conditions, our financial resources are sufficient to meet our liquidity needs through January 1, 2010, taking into account both our existing capital commitments and the minimum debt service requirements as defined by our loan covenants.
Working capital (non-restricted net current assets) amounted to approximately $109.9 million at December 31, 2007 compared to $116.7 million as at December 31, 2006. Current assets increased from $222.5 million at December 31, 2006 to $276.1 million at December 31, 2007 mainly due to an increase in amounts receivable (trade accounts and insurance claims) and the inclusion of the net book value of the vessel Olympia the sale of which had been agreed in 2007 for delivery at the first mutually convenient point in 2008. There was also an increase in cash balances (including restricted cash) which, as at December 31, 2007, amounted to $188.3 million compared to $178.9 million a year previously. However, current liabilities also increased considerably from $101.4 million to $159.3 million at December 31, 2007 due mainly to increases in the current portion of long-term debt by approximately $21 million and trade payables and accrued loan interest, again related to the significant deliveries of new vessels and associated debt. More significantly, negative valuation on interest rate swaps increased by approximately $25 million as forward interests fell.
Net cash provided by operating activities was $190.6 million during 2007 compared to $215.0 million in the previous year, an 11.1% decrease. Despite increased revenue generated by the increase in fleet size, higher vessel operating expenses due to fleet size and higher costs and increased finance costs eroded much of the cash benefits from operations.
Expenditure for dry-dockings is deducted from cash generated by operating activities. Total expenditure during 2007 on dry-dockings amounted to $9.7 million compared to $4.9 million in 2006. In 2007, dry-docking work was performed on the Silia T, Triathlon, La Prudencia and La Madrina. In 2006, dry-dock work related to special surveys was completed on the Libra, Hesnes and Opal Queen.
Net cash used in investing activities was $375.6 million for the year 2007, compared to $829.3 million for 2006. In 2007, the Company took delivery of and paid the final instalments on the LNG carrier Neo Energy, the two ice-class suezmaxes Arctic and Antarctic, the two aframaxes Izumo Princess and Sakura Princess and the four product carriers Aegeas, Andromeda, Byzantion and Bosporos. Total payments, including the cost of upgrading the Vergina II to double-hull, amounted to $421.2 million. Instalments amounting to $111.1 million were also paid on the remaining vessels to be delivered, two panamaxes in the first quarter of 2008, two aframaxes in the last quarter of 2008, three further aframaxes in 2009 and the final aframax in early 2010. During 2006, the Company paid $813.2 million to acquire eight vessels, the contracts for the construction of five product carriers and to take delivery of two suezmaxes and two handysize product carrier newbuildings. A further $152.8 million was paid on instalments on the vessels still under construction at the end of 2006.
During 2007 the Company entered into contracts to construct another two aframaxes, bringing the total number of vessels on order at December 31, 2007 to eight.
The anticipated payment schedule on these vessels as of December 31, 2007, which is subject to change for delays or advanced work, is as follows (in $ millions):
ANNUAL REPORT AND ACCOUNTS 2007 34 .. 35

Contractual Obligations Prior to 2007 2007 2008 2009 2010 TOTAL
Quarter 1 23.6 42.4
Quarter 2 5.9
Quarter 3 0 60.2
Quarter 4 90.0 90.8
Total Year 57.2 101.1 119.5 151.0 42.4 471.2
In 2007, the Company sold the panamax Bregen and the aframaxes Maria Tsakos and Athens 2004, and net sale proceeds amounted to $142.4 million. Net sale proceeds in 2006 from the sale of the handymax product carriers Libra and Crux, and the panamax Aztec, amounted to $88.7 million. Also, during 2006, the Company sold 49% of the shares of the holding company of the two vessel-owning companies holding the panamax vessels Maya and Inca, for net proceeds of $25.3 million. In 2007, the Company acquired shares in a private U.S. company under development for an amount of $1.0 million and sold existing investments for $15.2 million. In 2006, the Company placed $5.0 million in a structured note, but later sold the same investment and other existing investments for $27.6 million.
Net cash derived from financing activities was $191.9 million in 2007 compared to $643.1 million cash in 2006. Proceeds from new bank loans in 2007 amounted to $342.3 million compared to $992.3 million in the previous year. Prepayments of debt amounted to $59.4 million and scheduled repayments to $26.6 million in 2007 compared to total loan reimbursements of $292.1 million in 2006. During 2007, 20,800 shares were repurchased as part of the share buy-back program at a cost of $1.3 million. During 2006, the Company purchased 143,200 shares at a cost of approximately $5.3 million. All the transactions were open market based through the New York Stock Exchange with a maximum price set by the Board of Directors. The shares were immediately deemed cancelled on purchase in accordance with the Company’s bye-laws and Bermudan legislation.
A cash dividend of $0.75 was paid in April 2007 representing the final dividend for the fiscal year 2006 and a $0.825 dividend was paid in October 2007 as the first dividend for the fiscal year 2007. In total, the two dividends amounted to $60 million. A final dividend of $0.90 per share for the fiscal year 2007 has been declared on March 14, 2008, to be paid on April 30, 2008. The dividend policy of the Company is to pay between 25% and 50% of the net income in any given year, payable in two installments, the first prior to the end of the year based on expected earnings and cash requirements, and the final portion in the early part of the following year based on final earnings and cash requirements. The payment and the amount is subject to the discretion of our board of directors and depends, among other things, on available cash balances, anticipated cash needs, our results of operations, our financial condition, and any loan agreement restrictions binding us or our subsidiaries, as well as other relevant factors.
INVESTMENT IN FLEET AND RELATED EXPENSES
We operate in a capital-intensive industry requiring extensive investment in revenue-producing assets. As discussed previously in the sections on Business Overview and Our Fleet we continue to have an active fleet development program resulting in a fleet of modern and young vessels with an average age of 5.6 years at March 31, 2008. We raise the funds for such investments in newbuildings mainly from borrowings and partly out of internally generated funds. Newbuilding contracts generally provide for multiple staged payments of 5% to 10%, with the balance of the vessel purchase price paid upon delivery. For the equity portion of an investment in a newbuilding or a second-hand vessel the Company usually pays from its own cash approximately 30% of the contract price. Repayment of the debt incurred to purchase the vessel is made from vessel operating cash flow, typically over eight to twelve years, compared to the vessel’s asset life of approximately 25 years (LNG carrier 40 years).
As of December 31, 2007, we were committed to eight newbuilding contracts totaling approximately $468.5 million, of which $158.2 million had been paid by December 31, 2007. Deliveries to date within 2008 include the panamaxes Selecao on February 12 and Socrates on March 14 (final delivery payments $24.3 million, loan drawn $25.3 million).

DEBT
As is customary in our industry, we anticipate financing the majority of our commitments on the newbuildings with bank debt. Usually we raise at least 70% of the vessel purchase price with bank debt for a period of between eight and twelve years (while the expected life of a tanker is 25 years and an LNG carrier is 40 years). As of December 31, 2007, we had available unused loan amounts totaling $274.5 million, of which $170.4 million has been arranged to finance the delivery installments of vessels under construction and due in 2008, and the remaining $104.1 million represents undrawn amounts on facilities arranged for the financing of vessels delivered prior to December 31, 2007.
Summary of Loan Movements Throughout 2007 (in $ millions):
Loan Vessel Balance at January 1, 2007 New LoanS Repaid Balance at December 31, 2007
12-year term loan OPAL QUEEN 22.7 0 1.8 20.9
Credit facility LA MADRINA, HESNES, VERGINA II, VICTORY III, SAKURA PRINCESS 162.2 41.8 67.2 136.8
Credit facility SILIA T, ANDES, DIDIMON, ANTARES, IZUMO PRINCESS, AEGEAS. 142.4 56.3 0 198.7
Credit facility MILLENNIUM, PARTHENON, MARATHON, TRIATHLON, EUROCHAMPION 2004, EURONIKE 234.8 0 0 234.8
Credit facility ARCHANGEL, ALASKA, ARCTIC, 73.6 70.8 7.6 136.8
Credit facility ANTARCTIC DELPHI, LA PRUDENCIA, 80.7 43.5 2.7 121.5
Credit facility BYZANTION, BOSPOROS ARTEMIS, AFRODITE, ARIADNE, AJAX, APOLLON, ARIS, PROTEAS 327.3 0 0 327.3
10-year term loan PROMITHEAS, PROPONTIS 25.0 0 1.6 23.4
Credit facility ARION 65.0 0 4.4 60.6
10-year term loan MAYA, INCA 0 25.0 0.8 24.2
Credit facility ANDROMEDA 0 104.9 0 104.9
Total NEO ENERGY 1,133.7 342.3 86.1 1,389.9
As a result of such financing activities, long-term debt increased in 2007 by a net amount of $256.2 million, compared to a net increase of $700.1 million in 2006. The average debt to capital ratio was 61.9% by December 31, 2007 or, in net terms, 58.6%. In terms of liabilities against assets at fair value, our leverage at December 31, 2007, was 38.7%, well below the loan covenant maximum of 70%. Interest payable is usually at a variable rate, based on six-month LIBOR plus a margin. Interest rate swap instruments currently cover approximately 61% of the outstanding debt, and further coverage is being arranged with major banks.
Contractual Obligations Total Less than 1 year 1-3 years 4-5 years More than 5 years
Long-Term Debt Obligations (excluding interest) 1,389.9 44.4 174.2 190.2 981.1
Operating Lease Obligations 13.9 13.9 0 0 0
Purchase Obligations (newbuildings) 312.9 119.5 193.4 0 0
Management Fees (based on existing fleet plus contracted future deliveries as at December 31, 2007)
126.6 12.9 26.6 27.1 60.0
Total 1,843.3 190.7 394.2 217.3 1,041.1
ANNUAL REPORT AND ACCOUNTS 2007 36 .. 37
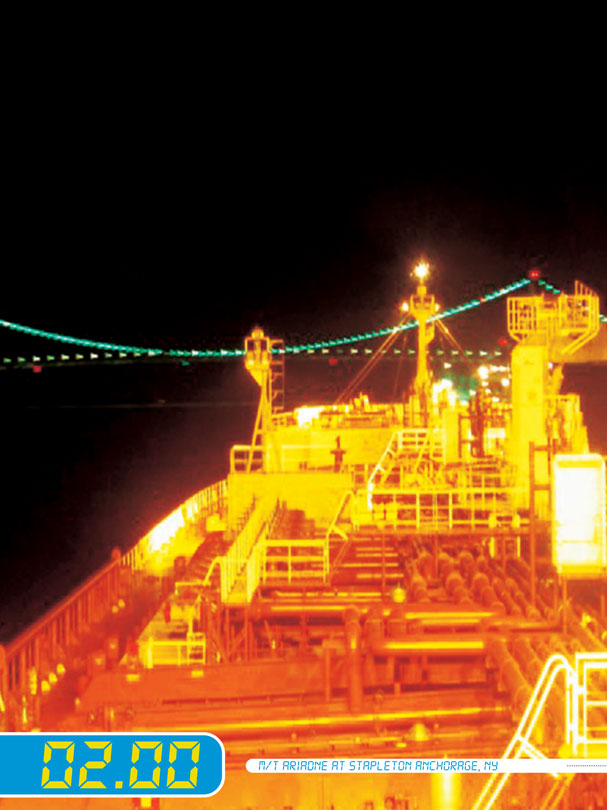
02.00 M/T ARIAONE AT STAPLETON ANCHORAGE, NY
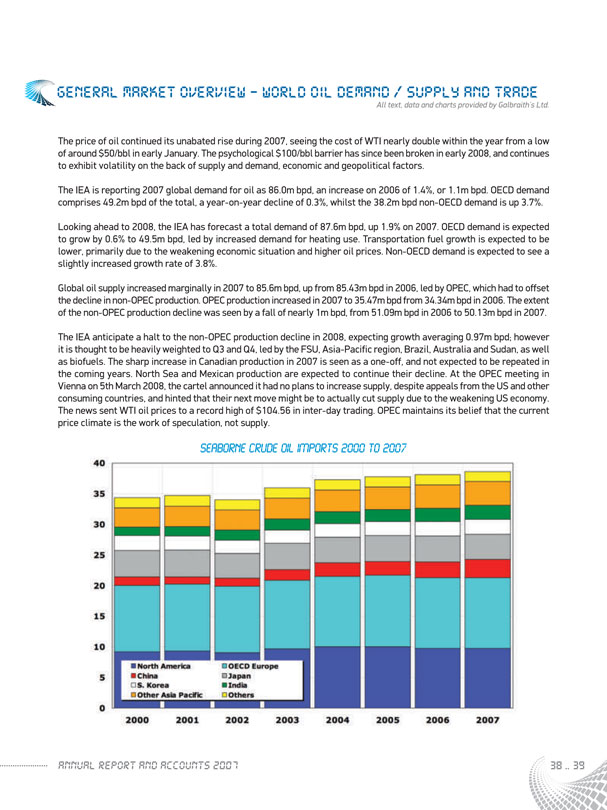
GENERAL MARKET OVERVIEW – WORLD OIL DEMAND / SUPPLY AND TRADE
All text, data and charts provided by Galbraith’s Ltd.
The price of oil continued its unabated rise during 2007, seeing the cost of WTI nearly double within the year from a low of around $50/bbl in early January. The psychological $100/bbl barrier has since been broken in early 2008, and continues to exhibit volatility on the back of supply and demand, economic and geopolitical factors.
The IEA is reporting 2007 global demand for oil as 86.0m bpd, an increase on 2006 of 1.4%, or 1.1m bpd. OECD demand comprises 49.2m bpd of the total, a year-on-year decline of 0.3%, whilst the 38.2m bpd non-OECD demand is up 3.7%.
Looking ahead to 2008, the IEA has forecast a total demand of 87.6m bpd, up 1.9% on 2007. OECD demand is expected to grow by 0.6% to 49.5m bpd, led by increased demand for heating use. Transportation fuel growth is expected to be lower, primarily due to the weakening economic situation and higher oil prices. Non-OECD demand is expected to see a slightly increased growth rate of 3.8%.
Global oil supply increased marginally in 2007 to 85.6m bpd, up from 85.43m bpd in 2006, led by OPEC, which had to offset the decline in non-OPEC production. OPEC production increased in 2007 to 35.47m bpd from 34.34m bpd in 2006. The extent of the non-OPEC production decline was seen by a fall of nearly 1m bpd, from 51.09m bpd in 2006 to 50.13m bpd in 2007.
The IEA anticipate a halt to the non-OPEC production decline in 2008, expecting growth averaging 0.97m bpd; however it is thought to be heavily weighted to Q3 and Q4, led by the FSU, Asia-Pacific region, Brazil, Australia and Sudan, as well as biofuels. The sharp increase in Canadian production in 2007 is seen as a one-off, and not expected to be repeated in the coming years. North Sea and Mexican production are expected to continue their decline. At the OPEC meeting in Vienna on 5th March 2008, the cartel announced it had no plans to increase supply, despite appeals from the US and other consuming countries, and hinted that their next move might be to actually cut supply due to the weakening US economy. The news sent WTI oil prices to a record high of $104.56 in inter-day trading. OPEC maintains its belief that the current price climate is the work of speculation, not supply.
SEABORNE CRUDE OIL IMPORTS 2000 TO 2007
40
35
30
25
20
15
10
5
0
North America OECD Europe
China Japan
S. Korea India
Other Asia Pacific Others
2000 2001 2002 2003 2004 2005 2006 2007
ANNUAL REPORT AND ACCOUNTS 2007 38 .. 39

Whilst a decrease in supply by OPEC would harm crude oil tanker markets, especially voyages AG/East-West, the continued increase by the FSU, Asia-Pacific region and Brazil will provide some welcome additional tonne-mile demand, especially if China can weather the current weakening economic conditions to maintain its impressive growth in oil demand. Production increases from the FSU have seen increased activity in all its major load regions; the Baltic, Mediterranean/Black Sea and the Russian Far East. The Baltic market is expected to increase further with the BPS-2 pipeline due to commence operations in 2009 or 2010, diverting as much as 0.7m bpd from the Druzhba pipeline to Primorsk.
Crude oil tanker demand growth was again driven by China, importing a total 2.94m bpd (seaborne) in 2007, an increase of 0.34m bpd on 2006, up slightly on the year before. North America and Japan imports were marginally down, 0.05m bpd and 0.05m bpd, respectively. OECD Europe saw an increase of 0.07m bpd, after a decline of 0.12m bpd in 2006. The only other notable increase was from Other Asia, primarily India, which imported 2.25m bpd, up 0.10m bpd on 2006.
The product tanker market continues to benefit from the geographical mismatch between refineries and end consumers. The US and Europe are the largest importers of oil products, both due to strong demand, whilst for the US also because of insufficient refining capacity, whereas in Europe there is a product mismatch between consumers demand and what the refineries produce.
With refining capacity fairly static in Europe and the US, or at least not keeping pace with demand growth, seaborne products imports into these regions have been steadily increasing to meet growing demand.
The Asia/Pacific region however has been the main source of refinery growth in recent years, explaining why seaborne products imports have not risen at a similar pace to the US and Europe. China, Taiwan and India are notable growing refining centres, as well as the Middle East region.
PLANNED ADDITIONS TO CRUDE DISTILLATION CAPACITY
ALGERIA
ANGOLA
BANGLADESH
BELARUS
BRAZIL
BULGARIA
CANADA
CHINA
ECUADOR
INDIA
INDONESIA
IRAN 2007
IRAQ 2008
IVORY COAST 2009
KUWAIT 2010
MEXICO 2011
MOROCCO 2012
NEW ZEALAND 2013
NIGERIA 2014
OMAN Unspecified
PERU
POLAND
QATAR
RUSSIA
SAUDI ARABIA
SPAIN
SOUTH KOREA
SUDAN
SYRIA
TAIWAN
THAILAND
TUNISIA
TURKEY
UAE
U.K.
UNITED STATES
VENEZUELA
VIETNAM
0.0 0.1 0.2 0.3 0.4 0.5 0.6 0.7 0.8 0.9 1.0 1.1 1.2 1.3 1.4 1.5 1.6 1.7 1.8 1.9 2.0
Million Bpd
One of the most important changes in refining capacity is happening in India, where Essar Oil recently announced that it will expand capacity at its Vadinar refinery to 34m tonnes p/a, or 680,000bpd, by 2010. This expansion is part of a wider trend of growth in India’s refining capacity. The new 580,000bpd Reliance 2 refinery at Jamnagar will increase its output to 1.24m bpd, making it the largest refining centre in the world. These refinery developments are expected to benefit the long-haul product tanker market, supplying both the East and West markets. As well as India, refineries in China, Kuwait and Saudi Arabia are expected to add capacity in the coming years, however many projects worldwide will be delayed or may not come to fruition.
World Tanker Fleet
As the 2010 IMO phase-out of non-double hull tankers approaches, 2007 saw record numbers of vessels scheduled for conversion, as owners baulked at the prospect of the non-economic demolition market. The charge was led by the single-hull VLCCs, with intensions joining the booming dry bulk market as VLOCs (Very Large Ore Carriers), capable of shipping the huge quantities of iron ore from Brazil to feed China’s seemingly insatiable demand. Since 1st January 2007, it is thought 45 VLCCs have been ear-marked for dry bulk conversion, with seven already removed from the oil trading fleet, and a further three due to leave imminently. A further eight vessels were listed for double-hull conversions, with half already completed and trading. Six VLCCs are being used as FSUs, and a further 13 are listed for conversion to FPSOs, seven of which are no longer trading. Two of the four remaining ULCCs have also recently been committed for FSO-use. If all the projects come to fruition, over 17 million deadweight will be removed from the VLCC trading fleet.
The conversion plans have not been limited to the VLCC sector, with owners also looking to convert some of their Suezmaxes and Aframaxes. Suezmaxes have followed a similar path to the VLCCs, with conversions to dry bulk, double-hull and FPSO/FSU, although there have also been a number of conversions to heavy-lift vessels, looking to join the lucrative offshore market. If all the Suezmax conversions go-ahead, over 4 million deadweight will be removed from the trading fleet. It is thought around 20 Aframax vessels are to be converted, almost exclusively to dry bulk, totalling around 1.8m deadweight.
These conversion plans have helped temper the impending phase-out of non-double hull tonnage. Whilst under the IMO phase-out regulations it is permitted for Port and Flag States to allow the continuation in trading of non-double hull tonnage under certain conditions, following the recent oil spill by the Hebei Spirit off South Korea, only a handful of countries East of Suez are prepared to do so, with the West of Suez market already almost exclusively double-hull. With a two-tier market already in place for double-hull and non-double hull tonnage, come 2010 the non-double hull tonnage will find trade increasingly restricted. Meaning whilst there will be fewer vessels to phase-out due to the conversion plans, the likelihood of vessels trading beyond 2010 has been reduced.
The tanker fleet (10,000dwt+) as of 1st January 2008 stood at 389.2m dwt, with 30.1m dwt delivered in 2007. The orderbook is currently 157.4m dwt, due to be delivered by 2013, of which 140.7m dwt is due to be delivered by end-2010, more than covering the non-double hull fleet which stands at 87.3m dwt due to be phased out by 2010. 2007 saw a slowdown in the ordering of tanker newbuildings, with 683 vessels (43.6m dwt) ordered in 2007 compared with 789 vessels (75.9m dwt) a year earlier. 3.0m dwt was scrapped in 2007, a similar level to 2006, which saw 2.9m dwt removed, primarily the smaller vessels in both cases.
The scrapping market has been very limited recently due to the strength of freight rates and the second-hand sale and purchase markets. Although under the MARPOL Annex 2 and IBC code, which came into effect on 1st January 2007, vegetable oils can no longer be carried in products carriers and now must be carried in IMO 2 chemical carriers or, where exemptions permit, double-hull IMO 3 chemical carriers. As a result of this change there was an increase in scrapping of MRs in 2007, as many of those non double hulled vessels that were past their IMO phase out date for mineral oils and were also no longer permitted to carry vegetable oils were sold for demolition.
The larger fleet sectors contain very little older tonnage, and with the demolition market having provided little economic sense, especially on the back of the wave of conversions, there were no real early candidates for scrapping. However in recent weeks reports of increasing $/ldt prices may tempt some of the older tonnage towards the Indian sub-continent for demolition.
ANNUAL REPORT AND ACCOUNTS 2007 40 .. 41
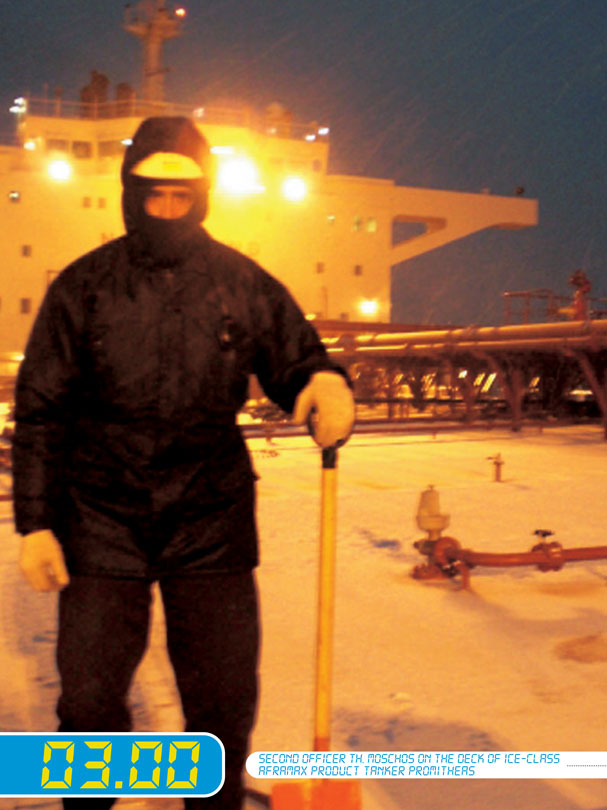
03.00 SECOND OFFICER TH. MOSCHOS ON THE DECK OF ICE-CLASS AFRAMAX PRODUCT TANKER PROMITHEAS

ASSET PRICES
Newbuildings
Tanker newbuilding prices continued to increase having reached a plateau towards the end of 2006. VLCC and Suezmax newbuilding prices have risen 13% since the start of 2007, Aframax prices have risen by 11% and 47,000 dwt MR by 12%. Whilst increasing steel prices have had some influence, shipbuilding yard space is proving the main driver. With so many more lucrative ships to be had on order for the shipyards, prices of newbuilding tankers have had to increase to give the shipyards an incentive to build these vessels. Orders have now been placed for as far out as 2013, whilst for the same period last year, orders only stretched to 2011, and with contracting down on 2006, this helps highlight the race for shipyard space. For example, 31 VLCCs were contracted in 2007, down from 100 in 2006, whilst the other sectors follow the same trend, they are not quite as extreme, with 56 Suezmaxes ordered in 2007, down from 72 the year before and 81 Aframaxes ordered in 2007, down from 132 in 2006.
One area which reverses the trend has been the smaller tankers (10,000-59,999 dwt), where contracting has risen from 436 vessels in 2006 to 475 vessels in 2007, although in deadweight terms, they have still declined in line with the larger sectors, from 15.66m dwt to 13.31m dwt, which implies there is an increased interest in the smaller end of this 10,000-59,999 dwt range.
NEWBUILDING TANKER PRICES AT JANUARY EACH YEAR
2002 2003 2004 2005 2006 2007 2008
VLCC $70m $66m $79m $118m $122m $130m $147m
Suezmax $47m $45m $53m $74m $73m $81m $91m
Aframax [Uncoated] $36m $36m $45m $62m $61m $66m $73m
47k dwt [Epoxy Coated] $26m $28m $34m $41m $44m $47m $53m
Second-Hand Market
Tanker second-hand prices increased to a greater extent than newbuilding prices, with 5-yearold VLCCs increasing 18% since the start of 2007, and 5-year-old Suezmaxes by 20%. The second-hand market has proved a little more volatile, with the price of 5-year-old VLCCs plunging by around $12m mid-2007, only to recover to previous levels by year-end and continue their rise. 5-year-old Aframaxes and MRs also increased over the period by 12% and 9% respectively.
The relatively strong freight market has meant promptly available tonnage is valued at a premium. Newbuilding re-sales and recently delivered vessels have continued to be purchased at values higher than their original cost.
5-YEAR-OLD TANKER PRICES AT JANUARY EACH YEAR
2002 2003 2004 2005 2006 2007 2008
VLCC $58m $60m $72m $110m $120m $117m $138m
Suezmax $39m $43m $50m $75m $76m $80m $96m
Aframax [Uncoated] $30m $34m $39m $59m $65m $65m $73m
47k dwt [Epoxy Coated] $21m $23m $30m $40m $47m $48m $52m
Earnings
Whilst the volatility has continued on a daily and weekly basis within the tanker markets, the annual trends have tended to follow the wider supply/demand picture. As the looming orderbook begins to deliver increasingly more new vessels, with few being removed from the fleet, and oil demand growth not keeping pace, a loosening of the supply/demand balance suggests rates should begin to trend downwards until more non-double hull vessels are removed from the fleet.
ANNUAL REPORT AND ACCOUNTS 2007 42 .. 43
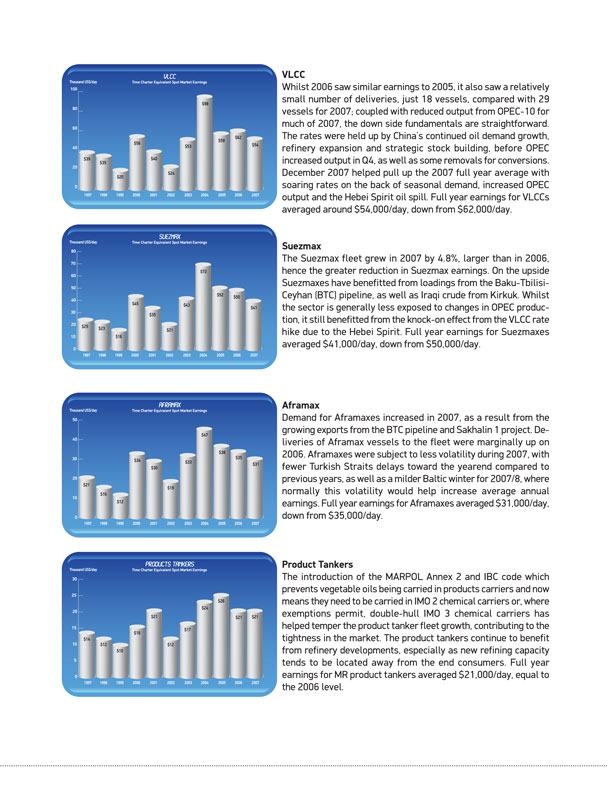
VLCC
Whilst 2006 saw similar earnings to 2005, it also saw a relatively small number of deliveries, just 18 vessels, compared with 29 vessels for 2007; coupled with reduced output from OPEC-10 for much of 2007, the down side fundamentals are straightforward. The rates were held up by China’s continued oil demand growth, refinery expansion and strategic stock building, before OPEC increased output in Q4, as well as some removals for conversions. December 2007 helped pull up the 2007 full year average with soaring rates on the back of seasonal demand, increased OPEC output and the Hebei Spirit oil spill. Full year earnings for VLCCs averaged around $54,000/day, down from $62,000/day.
Suezmax
The Suezmax fleet grew in 2007 by 4.8%, larger than in 2006, hence the greater reduction in Suezmax earnings. On the upside Suezmaxes have benefitted from loadings from the Baku-Tbilisi-Ceyhan (BTC) pipeline, as well as Iraqi crude from Kirkuk. Whilst the sector is generally less exposed to changes in OPEC production, it still benefitted from the knock-on effect from the VLCC rate hike due to the Hebei Spirit. Full year earnings for Suezmaxes averaged $41,000/day, down from $50,000/day.
Aframax
Demand for Aframaxes increased in 2007, as a result from the growing exports from the BTC pipeline and Sakhalin 1 project. Deliveries of Aframax vessels to the fleet were marginally up on 2006. Aframaxes were subject to less volatility during 2007, with fewer Turkish Straits delays toward the yearend compared to previous years, as well as a milder Baltic winter for 2007/8, where normally this volatility would help increase average annual earnings. Full year earnings for Aframaxes averaged $31,000/day, down from $35,000/day.
Product Tankers
The introduction of the MARPOL Annex 2 and IBC code which prevents vegetable oils being carried in products carriers and now means they need to be carried in IMO 2 chemical carriers or, where exemptions permit, double-hull IMO 3 chemical carriers has helped temper the product tanker fleet growth, contributing to the tightness in the market. The product tankers continue to benefit from refinery developments, especially as new refining capacity tends to be located away from the end consumers. Full year earnings for MR product tankers averaged $21,000/day, equal to the 2006 level.
MANAGEMENT’S REPORT ON FINANCIAL REPORTING CONTROLS
The management of Tsakos Energy Navigation Ltd. and its subsidiaries (the “Company”), according to Rule 13a-15(f) of the Securities Exchange Act of 1934, is responsible for the establishment and maintenance of adequate internal controls over financial reporting for the Company. Internal control over financial reporting is a process designed to provide reasonable assurance regarding the reliability of financial reporting and the preparation of the Company’s financial statements for external reporting purposes in accordance with U.S. generally accepted accounting principles. However, in any system of internal control there are inherent limitations and consequently internal control over financial reporting may not absolutely prevent or detect misstatements.
The Company’s system of internal control over financial reporting includes policies and procedures that:
(i) pertain to the maintenance of records that, in reasonable detail, accurately and fairly reflect the transactions and dispositions of the assets of the Company;
(ii) provide reasonable assurance that transactions are recorded as necessary to permit preparation of financial statements in accordance with U.S. generally accepted accounting principles, and that receipts and expenditures of the Company are being made only in accordance with authorizations of management and directors of the Company; and
(iii) provide reasonable assurance regarding prevention or timely detection of unauthorized acquisition, use, or disposition of the Company’s assets that could have a material effect on the financial statements.
Management has performed an assessment of the effectiveness of the Company’s internal control over financial reporting as of December 31, 2007, based on the criteria established within Internal Control-Integrated Framework issued by the Committee of Sponsoring Organizations of the Treadway Commission.
Based on our assessment, management has determined that the Company’s internal control over financial reporting as of December 31, 2007, is effective.
Nikolas P. Tsakos Paul Durham
President and Chief Executive Officer Chief Financial Officer
Date: April 18, 2008
ANNUAL REPORT AND ACCOUNTS 2007 44 .. 45

06.00 SUNRISE IN THE ATLANTIC OCEAN FROM THE BRIDGE OF M/T OPAL QUEEN

TSAKOS ENERGY NAVIGATION LIMITED AND SUBSIDIARIES
CONSOLIDATED FINANCIAL STATEMENTS
2007
TSAKOS ENERGY NAVIGATION LIMITED AND SUBSIDIARIES
INDEX TO CONSOLIDATED FINANCIAL STATEMENTS
| Page | ||
| Reports of Independent Registered Public Accounting Firm |
F-1 | |
| Consolidated Balance Sheets as of December 31, 2007 and 2006 |
F-3 | |
| Consolidated Statements of Income for the years ended December 31, 2007, 2006 and 2005 |
F-4 | |
| Consolidated Statements of Stockholders’ Equity for the years ended December 31, 2007, 2006 and 2005 |
F-5 | |
| Consolidated Statements of Cash Flows for the years ended December 31, 2007, 2006 and 2005 |
F-6 | |
| Notes to Consolidated Financial Statements |
F-7 | |
REPORT OF INDEPENDENT REGISTERED PUBLIC ACCOUNTING FIRM
To the Board of Directors and Shareholders of
TSAKOS ENERGY NAVIGATION LIMITED
We have audited the accompanying consolidated balance sheets of TSAKOS ENERGY NAVIGATION LIMITED and subsidiaries as of December 31, 2007 and 2006, and the related consolidated statements of income, stockholders’ equity, and cash flows for each of the three years in the period ended December 31, 2007. These financial statements are the responsibility of the Company’s management. Our responsibility is to express an opinion on these financial statements based on our audits.
We conducted our audits in accordance with the standards of the Public Company Accounting Oversight Board (United States). Those standards require that we plan and perform the audit to obtain reasonable assurance about whether the financial statements are free of material misstatement. An audit includes examining, on a test basis, evidence supporting the amounts and disclosures in the financial statements. An audit also includes assessing the accounting principles used and significant estimates made by management, as well as evaluating the overall financial statement presentation. We believe that our audits provide a reasonable basis for our opinion.
In our opinion, the financial statements referred to above present fairly, in all material respects, the consolidated financial position of TSAKOS ENERGY NAVIGATION LIMITED and subsidiaries at December 31, 2007 and 2006, and the consolidated results of its operations and its cash flows for each of the three years in the period ended December 31, 2007, in conformity with U.S. generally accepted accounting principles.
We also have audited, in accordance with the standards of the Public Company Accounting Oversight Board (United States), TSAKOS ENERGY NAVIGATION LIMITED and subsidiaries’ internal control over financial reporting as of December 31, 2007, based on criteria established in Internal Control-Integrated Framework issued by the Committee of Sponsoring Organizations of the Treadway Commission and our report dated April 18, 2008 expressed an unqualified opinion thereon.
ERNST & YOUNG (HELLAS) CERTIFIED AUDITORS – ACCOUNTANTS S.A.
Athens, Greece
April 18, 2008
F-1
REPORT OF INDEPENDENT REGISTERED PUBLIC ACCOUNTING FIRM
To the Board of Directors & Shareholders of
TSAKOS ENERGY NAVIGATION LIMITED
We have audited TSAKOS ENERGY NAVIGATION LIMITED and subsidiaries’ internal control over financial reporting as of December 31, 2007, based on criteria established in Internal Control—Integrated Framework issued by the Committee of Sponsoring Organizations of the Treadway Commission (the COSO criteria). TSAKOS ENERGY NAVIGATION LIMITED and subsidiaries’ management is responsible for maintaining effective internal control over financial reporting, and for its assessment of the effectiveness of internal control over financial reporting included in the accompanying Management’s Annual Report on Internal Control over Financial Reporting. Our responsibility is to express an opinion on the company’s internal control over financial reporting based on our audit.
We conducted our audit in accordance with the standards of the Public Company Accounting Oversight Board (United States). Those standards require that we plan and perform the audit to obtain reasonable assurance about whether effective internal control over financial reporting was maintained in all material respects. Our audit included obtaining an understanding of internal control over financial reporting, assessing the risk that a material weakness exists, testing and evaluating the design and operating effectiveness of internal control based on the assessed risk, and performing such other procedures as we considered necessary in the circumstances. We believe that our audit provides a reasonable basis for our opinion.
A company’s internal control over financial reporting is a process designed to provide reasonable assurance regarding the reliability of financial reporting and the preparation of financial statements for external purposes in accordance with generally accepted accounting principles. A company’s internal control over financial reporting includes those policies and procedures that (1) pertain to the maintenance of records that, in reasonable detail, accurately and fairly reflect the transactions and dispositions of the assets of the company; (2) provide reasonable assurance that transactions are recorded as necessary to permit preparation of financial statements in accordance with generally accepted accounting principles, and that receipts and expenditures of the company are being made only in accordance with authorizations of management and directors of the company; and (3) provide reasonable assurance regarding prevention or timely detection of unauthorized acquisition, use, or disposition of the company’s assets that could have a material effect on the financial statements.
Because of its inherent limitations, internal control over financial reporting may not prevent or detect misstatements. Also, projections of any evaluation of effectiveness to future periods are subject to the risk that controls may become inadequate because of changes in conditions, or that the degree of compliance with the policies or procedures may deteriorate.
In our opinion, TSAKOS ENERGY NAVIGATION LIMITED and subsidiaries maintained, in all material respects, effective internal control over financial reporting as of December 31, 2007, based on the COSO criteria.
We also have audited, in accordance with the standards of the Public Company Accounting Oversight Board (United States), the consolidated balance sheets of TSAKOS ENERGY NAVIGATION LIMITED and subsidiaries as of December 31, 2007 and 2006, and the related consolidated statements of income, stockholders’ equity, and cash flows for each of the three years in the period ended December 31, 2007 and our report dated April 18, 2008 expressed an unqualified opinion thereon.
Ernst & Young (Hellas) Certified Auditors Accountants S.A.
Athens, Greece,
April 18, 2008
F-2
TSAKOS ENERGY NAVIGATION LIMITED AND SUBSIDIARIES
CONSOLIDATED BALANCE SHEETS
DECEMBER 31, 2007 and DECEMBER 31, 2006
(Expressed in thousands of U.S. Dollars - except share data)
| 2007 | 2006 | |||||||
| ASSETS | ||||||||
| CURRENT ASSETS: |
||||||||
| Cash and cash equivalents |
$ | 181,447 | $ | 174,567 | ||||
| Restricted cash |
6,889 | 4,347 | ||||||
| Accounts receivable, net |
23,411 | 15,425 | ||||||
| Insurance claims |
13,120 | 1,865 | ||||||
| Due from related companies (Note 2) |
972 | — | ||||||
| Advances and other |
5,359 | 5,480 | ||||||
| Vessel held for sale |
27,535 | — | ||||||
| Inventories |
12,099 | 8,431 | ||||||
| Prepaid insurance and other |
4,030 | 3,020 | ||||||
| Financial instruments-Fair value (Note 9) |
1,191 | 9,358 | ||||||
| Total current assets |
276,053 | 222,493 | ||||||
| INVESTMENTS (Note 3) |
1,000 | 14,045 | ||||||
| FIXED ASSETS (Notes 2b, 4 and 8) |
||||||||
| Advances for vessels under construction |
169,739 | 261,242 | ||||||
| Vessels |
2,127,704 | 1,649,928 | ||||||
| Accumulated depreciation |
(227,521 | ) | (191,281 | ) | ||||
| Vessels’ Net Book Value |
1,900,183 | 1,458,647 | ||||||
| Total fixed assets |
2,069,922 | 1,719,889 | ||||||
| DEFERRED CHARGES, net (Note 5) |
15,801 | 13,448 | ||||||
| Total assets |
$ | 2,362,776 | $ | 1,969,875 | ||||
| LIABILITIES AND STOCKHOLDERS’ EQUITY | ||||||||
| CURRENT LIABILITIES: |
||||||||
| Current portion of long-term debt (Note 6) |
$ | 44,363 | $ | 23,117 | ||||
| Payables |
34,871 | 22,255 | ||||||
| Due to related companies (Note 2) |
2,428 | 2,414 | ||||||
| Accrued liabilities |
17,275 | 18,218 | ||||||
| Accrued bank interest |
16,952 | 13,705 | ||||||
| Unearned revenue |
11,939 | 12,075 | ||||||
| Deferred income, current portion (Note 7) |
2,626 | 5,821 | ||||||
| Financial instruments - Fair value (Note 9) |
28,811 | 3,825 | ||||||
| Total current liabilities |
159,265 | 101,430 | ||||||
| LONG-TERM DEBT, net of current portion (Note 6) |
1,345,580 | 1,110,544 | ||||||
| DEFERRED INCOME, net of current portion (Note 7) |
— | 2,626 | ||||||
| MINORITY INTEREST (Note 12) |
3,391 | 2 | ||||||
| STOCKHOLDERS’ EQUITY: |
||||||||
| Common stock, $ 1.00 par value; 100,000,000 shares authorized; 38,059,142 and 38,079,742 issued and outstanding at December 31, 2007 and December 31, 2006, respectively |
38,059 | 19,040 | ||||||
| Additional paid-in capital |
273,036 | 267,430 | ||||||
| Accumulated other comprehensive income / (loss) |
(23,775 | ) | 4,718 | |||||
| Retained earnings |
567,220 | 464,085 | ||||||
| Total stockholders’ equity |
854,540 | 755,273 | ||||||
| Total liabilities and stockholders’ equity |
$ | 2,362,776 | $ | 1,969,875 | ||||
The accompanying notes are an integral part of these consolidated financial statements.
F-3
TSAKOS ENERGY NAVIGATION LIMITED AND SUBSIDIARIES
CONSOLIDATED STATEMENTS OF INCOME
FOR THE YEARS ENDED DECEMBER 31, 2007, 2006 AND 2005
(Expressed in thousands of U.S. Dollars - except share and per share data)
| 2007 | 2006 | 2005 | ||||||||||
| VOYAGE REVENUES: |
$ | 500,617 | $ | 427,654 | $ | 295,623 | ||||||
| EXPENSES: |
||||||||||||
| Commissions |
17,976 | 15,441 | 11,604 | |||||||||
| Voyage expenses |
72,075 | 69,065 | 35,970 | |||||||||
| Charter hire expense |
15,330 | 24,461 | 24,317 | |||||||||
| Vessel operating expenses |
108,356 | 76,095 | 52,945 | |||||||||
| Depreciation |
81,567 | 59,058 | 35,697 | |||||||||
| Amortization of deferred dry-docking costs |
3,217 | 4,857 | 6,583 | |||||||||
| Provision for doubtful receivables |
— | — | 40 | |||||||||
| Management fees (Note 2) |
9,763 | 7,103 | 5,460 | |||||||||
| General and administrative expenses |
4,382 | 3,510 | 3,631 | |||||||||
| Management incentive award (Note 2) |
4,000 | 3,500 | 2,500 | |||||||||
| Stock compensation expense (Note 10) |
5,670 | 216 | — | |||||||||
| Foreign currency losses/(gains) |
691 | 279 | (181 | ) | ||||||||
| Amortization of deferred gain on sale of vessels (Note 7) |
(3,168 | ) | (3,168 | ) | (3,168 | ) | ||||||
| Gain on sale of vessels (Note 8) |
(68,944 | ) | (38,009 | ) | (34,540 | ) | ||||||
| Total expenses |
250,915 | 222,408 | 140,858 | |||||||||
| Operating income |
249,702 | 205,246 | 154,765 | |||||||||
| OTHER INCOME (EXPENSES): |
||||||||||||
| Gain on sale of non-operating vessels (Note 8) |
— | — | 10,765 | |||||||||
| Gain on sale of shares in subsidiary (Note 12) |
— | 25,323 | — | |||||||||
| Interest and finance costs, net (Note 9) |
(77,382 | ) | (42,486 | ) | (11,247 | ) | ||||||
| Interest and investment income |
13,316 | 7,164 | 7,360 | |||||||||
| Other, net |
924 | 1,159 | 112 | |||||||||
| Total other income (expenses), net |
(63,142 | ) | (8,840 | ) | 6,990 | |||||||
| MINORITY INTEREST |
(3,389 | ) | (2 | ) | — | |||||||
| Net Income |
$ | 183,171 | $ | 196,404 | $ | 161,755 | ||||||
| Earnings per share, basic (Note 11) |
$ | 4.81 | $ | 5.15 | $ | 4.09 | ||||||
| Earnings per share, diluted (Note 11) |
$ | 4.79 | $ | 5.15 | $ | 4.09 | ||||||
| Weighted average number of shares, basic |
38,075,859 | 38,127,692 | 39,544,540 | |||||||||
| Weighted average number of shares, diluted |
38,234,079 | 38,141,052 | 39,573,692 | |||||||||
The accompanying notes are an integral part of these consolidated financial statements.
F-4
TSAKOS ENERGY NAVIGATION LIMITED AND SUBSIDIARIES
CONSOLIDATED STATEMENTS OF STOCKHOLDERS’ EQUITY
FOR THE YEARS ENDED DECEMBER 31, 2007, 2006 AND 2005
(Expressed in thousands of U.S. Dollars - except share and per share data)
| Comprehensive Income (Loss) |
Common Stock |
Additional Paid-in Capital |
Accumulated Other Comprehensive Income (Loss) |
Retained Earnings |
Total Stock- Holders’ Equity |
|||||||||||||||||||
| BALANCE, December 31, 2004 |
$ | 20,176 | $ | 282,451 | $ | 1,136 | $ | 215,758 | $ | 519,521 | ||||||||||||||
| Net income |
161,755 | 161,755 | 161,755 | |||||||||||||||||||||
| - Exercise of stock options (Note 10) |
18 | 203 | 221 | |||||||||||||||||||||
| - Repurchase and cancellation of common stock (2,033,580 shares) |
(1,017 | ) | (13,417 | ) | (23,322 | ) | (37,756 | ) | ||||||||||||||||
| - Cash dividends declared and paid ($0.975 per share) |
(38,486 | ) | (38,486 | ) | ||||||||||||||||||||
| - Fair value of financial instruments |
4,265 | 4,265 | 4,265 | |||||||||||||||||||||
| - Reclassification of gains on undesignated cash flow hedges (Note 9) |
(2,334 | ) | (2,334 | ) | (2,334 | ) | ||||||||||||||||||
| Comprehensive income |
$ | 163,686 | ||||||||||||||||||||||
| BALANCE, December 31, 2005 |
$ | 19,177 | $ | 269,237 | $ | 3,067 | $ | 315,705 | $ | 607,186 | ||||||||||||||
| Net income |
196,404 | 196,404 | 196,404 | |||||||||||||||||||||
| - Exercise of stock options (Note 10) |
6 | 65 | 71 | |||||||||||||||||||||
| - Repurchase and cancellation of common stock (286,400 shares) |
(143 | ) | (1,872 | ) | (3,246 | ) | (5,261 | ) | ||||||||||||||||
| - Cash dividends declared and paid ($1.175 per share) |
(44,778 | ) | (44,778 | ) | ||||||||||||||||||||
| - Fair value of financial instruments |
3,666 | 3,666 | 3,666 | |||||||||||||||||||||
| - Fair value of investments (Note 3) |
3,072 | 3,072 | 3,072 | |||||||||||||||||||||
| - Reclassification of gains on undesignated cash flow hedges (Note 9) |
(5,087 | ) | (5,087 | ) | (5,087 | ) | ||||||||||||||||||
| Comprehensive income |
$ | 198,055 | ||||||||||||||||||||||
| BALANCE, December 31, 2006 |
$ | 19,040 | $ | 267,430 | $ | 4,718 | $ | 464,085 | $ | 755,273 | ||||||||||||||
| Net income |
183,171 | 183,171 | 183,171 | |||||||||||||||||||||
| - Repurchase and cancellation of common stock (41,600 shares) |
(21 | ) | (270 | ) | (1,047 | ) | (1,338 | ) | ||||||||||||||||
| - Issuance of 21,000 shares of restricted share units (Note 10) |
10 | (10 | ) | — | ||||||||||||||||||||
| - Cash dividends declared and paid ($1.575 per share) |
(59,959 | ) | (59,959 | ) | ||||||||||||||||||||
| - Two-for-one stock split (Note 10) |
19,030 | (19,030 | ) | — | ||||||||||||||||||||
| - Fair value of financial instruments |
(25,421 | ) | (25,421 | ) | (25,421 | ) | ||||||||||||||||||
| - Fair value of investments |
953 | 953 | 953 | |||||||||||||||||||||
| - Reclassification upon sale of investments |
(4,025 | ) | (4,025 | ) | (4,025 | ) | ||||||||||||||||||
| - Amortization of restricted share units (Note 10) |
5,886 | 5,886 | ||||||||||||||||||||||
| Comprehensive income |
$ | 154,678 | ||||||||||||||||||||||
| BALANCE, December 31, 2007 |
$ | 38,059 | $ | 273,036 | $ | (23,775 | ) | $ | 567,220 | $ | 854,540 | |||||||||||||
The accompanying notes are an integral part of these consolidated financial statements.
F-5
TSAKOS ENERGY NAVIGATION LIMITED AND SUBSIDIARIES
CONSOLIDATED STATEMENTS OF CASH FLOWS
FOR THE YEARS ENDED DECEMBER 31, 2007, 2006 AND 2005
(Expressed in thousands of U.S. Dollars)
| 2007 | 2006 | 2005 | ||||||||||
| Cash Flows from Operating Activities: |
||||||||||||
| Net income |
$ | 183,171 | $ | 196,404 | $ | 161,755 | ||||||
| Adjustments to reconcile net income to net cash provided by operating activities: |
||||||||||||
| Depreciation |
81,567 | 59,058 | 35,697 | |||||||||
| Amortization of deferred dry-docking costs |
3,217 | 4,857 | 6,583 | |||||||||
| Amortization of loan fees |
921 | 1,495 | 1,034 | |||||||||
| Amortization of deferred income |
(3,168 | ) | (3,168 | ) | (4,842 | ) | ||||||
| Amortization of restricted share units |
5,670 | 216 | — | |||||||||
| Change in fair value of derivative instruments |
7,733 | 556 | (2,584 | ) | ||||||||
| Change in fair value of investments |
— | (4,018 | ) | (2,122 | ) | |||||||
| . Gain on sale of vessels |
(68,944 | ) | (38,009 | ) | (45,305 | ) | ||||||
| Gain on sale of shares in subsidiary |
— | (25,323 | ) | — | ||||||||
| Minority interest |
3,389 | 2 | — | |||||||||
| Gain on sale of investments |
(4,230 | ) | (561 | ) | — | |||||||
| Payments for dry-docking |
(9,691 | ) | (4,903 | ) | (9,279 | ) | ||||||
| (Increase) Decrease in: |
||||||||||||
| Receivables |
(20,092 | ) | (12 | ) | 7,731 | |||||||
| Inventories |
(3,668 | ) | (3,025 | ) | (1,347 | ) | ||||||
| Prepaid insurance and other |
(1,010 | ) | (657 | ) | (16 | ) | ||||||
| Increase (Decrease) in: |
||||||||||||
| Accounts payable |
12,630 | 9,253 | (3,632 | ) | ||||||||
| Accrued liabilities |
3,252 | 16,090 | 4,333 | |||||||||
| Unearned revenue |
(136 | ) | 6,743 | (1,103 | ) | |||||||
| Net Cash provided by Operating Activities |
190,611 | 214,998 | 146,903 | |||||||||
| Cash Flows from Investing Activities: |
||||||||||||
| Advances for vessels under construction and acquisitions |
(111,090 | ) | (152,767 | ) | (70,705 | ) | ||||||
| Vessel acquisitions and/or improvements |
(421,187 | ) | (813,243 | ) | (175,429 | ) | ||||||
| Investments |
(1,000 | ) | (4,992 | ) | (19,999 | ) | ||||||
| Proceeds from sale of investments |
15,203 | 27,647 | — | |||||||||
| Proceeds from sale of shares in subsidiary |
— | 25,323 | — | |||||||||
| Proceeds from sale of vessels |
142,433 | 88,706 | 157,164 | |||||||||
| Net Cash used in Investing Activities |
(375,641 | ) | (829,326 | ) | (108,969 | ) | ||||||
| Cash Flows from Financing Activities: |
||||||||||||
| Proceeds from long-term debt |
342,345 | 992,282 | 330,685 | |||||||||
| Financing costs |
(533 | ) | (2,972 | ) | (2,603 | ) | ||||||
| Payments of long-term debt |
(86,063 | ) | (292,140 | ) | (262,330 | ) | ||||||
| Proceeds from exercise of stock options |
— | 71 | 221 | |||||||||
| (Increase)/decrease in restricted cash |
(2,542 | ) | (4,076 | ) | 1,182 | |||||||
| Repurchase and cancellation of common stock |
(1,338 | ) | (5,261 | ) | (37,756 | ) | ||||||
| Cash dividend |
(59,959 | ) | (44,778 | ) | (38,486 | ) | ||||||
| Net Cash provided by/(used in) Financing Activities |
191,910 | 643,126 | (9,087 | ) | ||||||||
| Net increase in cash and cash equivalents |
6,880 | 28,798 | 28,847 | |||||||||
| Cash and cash equivalents at beginning of year |
174,567 | 145,769 | 116,922 | |||||||||
| Cash and cash equivalents at end of year |
$ | 181,447 | $ | 174,567 | $ | 145,769 | ||||||
| Interest paid |
||||||||||||
| Cash paid for interest, net of amounts capitalized |
$ | 64,834 | $ | 33,964 | $ | 10,917 | ||||||
The accompanying notes are an integral part of these consolidated financial statements.
F-6
TSAKOS ENERGY NAVIGATION LIMITED
NOTES TO CONSOLIDATED FINANCIAL STATEMENTS
DECEMBER 31, 2007, 2006 AND 2005
(Expressed in thousands of U.S. Dollars, except for share and per share data, unless otherwise stated)
| 1. | Significant Accounting Policies |
| (a) | Basis of presentation and description of business: The accompanying consolidated financial statements have been prepared in accordance with U.S. generally accepted accounting principles (“U.S. GAAP”) and include the accounts of Tsakos Energy Navigation Limited (the “Holding Company”), and its wholly-owned and majority-owned subsidiaries (collectively, the “Company”). All intercompany balances and transactions have been eliminated upon consolidation. |
Certain amounts previously reported have been reclassified to conform to the current year’s presentation.
The Company has effected a two-for-one stock split paid November 14, 2007 to the stockholders of record at the close of business on November 9, 2007. All share and per share amounts disclosed in the Financial Statements give effect to this stock split retroactively.
The Company owns and operates a fleet of crude and product oil carriers and one LNG carrier providing worldwide marine transportation services under long, medium or short-term charters.
| (b) | Use of Estimates: The preparation of financial statements in conformity with U.S. GAAP requires management to make estimates and assumptions that affect the amounts of assets and liabilities reported in the consolidated financial statements and the accompanying notes. Actual results could differ from those estimates. |
| (c) | Foreign Currency Translation: The functional currency of the Company is the U.S. Dollar because the Company’s vessels operate in international shipping markets in which the U.S. Dollar is utilized to transact most business. The accounting books of the Company are also maintained in U.S. Dollars. Transactions involving other currencies during the year are converted into U.S. Dollars using the exchange rates in effect at the time of the transactions. At the balance sheet dates, monetary assets and liabilities, which are denominated in other currencies, are translated into U.S. Dollars at the year-end exchange rates. Resulting gains or losses are separately reflected in the accompanying Consolidated Statements of Income. |
| (d) | Cash and Cash Equivalents: The Company classifies highly liquid investments such as time deposits and certificates of deposit with original maturity of three months or less as cash and cash equivalents. Minimum cash deposits required to be maintained with banks for loan compliance purposes and deposits with certain banks that may only be used for the purpose of loan repayments are classified as Restricted cash. |
| (e) | Trade Accounts Receivable, Net: Trade accounts receivable, net at each balance sheet date includes estimated recoveries from charterers for hire, freight and demurrage billings and revenue earned but not yet billed, net of an allowance for doubtful accounts ($270 as of December 31, 2007 and 2006, respectively). Revenue earned but not yet billed amounted to $9,775 and $6,710 as of December 31, 2007 and 2006, respectively. |
| (f) | Inventories: Inventories consist of bunkers, lubricants, victualling and stores and are stated at the lower of cost or market value. The cost is determined primarily by the first-in, first-out method. |
F-7
TSAKOS ENERGY NAVIGATION LIMITED
NOTES TO CONSOLIDATED FINANCIAL STATEMENTS
DECEMBER 31, 2007, 2006 AND 2005
(Expressed in thousands of U.S. Dollars, except for share and per share data, unless otherwise stated)
| 1. | Significant Accounting Policies (continued) |
| (g) | Investments: All investments with original maturities greater than three months and with maturities less than one year from the balance sheet date are considered short-term investments. Investments with maturities greater than one year from the balance sheet date are considered long-term investments. For investments for which the embedded derivative can be bifurcated from the host contract, changes in the fair value of the non-derivative instrument are reported in Accumulated other comprehensive income, while changes in the fair value of the derivative instrument are reported in Interest and investment income. For investments for which the embedded derivative cannot be bifurcated, changes in the fair value of the entire investment are reported in Interest and investment income. |
| (h) | Fixed Assets: Fixed assets consist primarily of vessels. Vessels are stated at cost, less accumulated depreciation. The cost of vessels includes the contract price and pre-delivery costs incurred during the construction of new buildings, including capitalized interest, and expenses incurred upon acquisition of second-hand vessels. Subsequent expenditures for conversions and major improvements are capitalized when they appreciably extend the life, increase the earning capacity or improve the efficiency or safety of the vessels; otherwise they are charged to expense as incurred. Expenditures for routine maintenance and repairs are expensed as incurred. |
Depreciation is provided on the straight-line method based on the estimated remaining economic useful lives of the vessels, less an estimated residual value. Economic useful lives are estimated at 25 years for crude and product oil carriers and 40 years for the LNG carrier from the date of original delivery from the shipyard.
| (i) | Impairment of Vessels: The Company reviews vessels for impairment whenever events or changes in circumstances indicate that the carrying amount of a vessel may not be recoverable. Impairment for a vessel is recognized when the estimate of future undiscounted cash flows expected to be generated by the use of the vessel over its remaining useful life and its eventual disposition is less than its carrying amount. Measurement of the impairment is based on the excess of the carrying amount over the fair market value of the asset. No impairment loss was recorded in 2007, 2006 and 2005. |
| (j) | Accounting for Special Survey and Dry-docking Costs: The Company follows the deferral method of accounting for dry-docking and special survey costs whereby actual costs incurred are reported in Deferred charges and are amortized on a straight-line basis over the period through the date the next dry-docking is scheduled to become due. Costs incurred during the dry-docking period relating to routine repairs and maintenance are expensed. The unamortized portion of special survey and dry-docking costs for vessels that are sold is included as part of the carrying amount of the vessel in determining the gain on sale of the vessel. |
| (k) | Loan Costs: Costs incurred for obtaining new loans or refinancing existing loans are capitalized and included in deferred charges and amortized over the term of the respective loan, using the effective interest rate method. Any unamortized balance of costs relating to loans repaid or refinanced as debt extinguishments is expensed in the period the repayment or extinguishment is made. |
F-8
TSAKOS ENERGY NAVIGATION LIMITED
NOTES TO CONSOLIDATED FINANCIAL STATEMENTS
DECEMBER 31, 2007, 2006 AND 2005
(Expressed in thousands of U.S. Dollars, except for share and per share data, unless otherwise stated)
| 1. | Significant Accounting Policies (continued) |
| (l) | Accounting for Revenue and Expenses: Voyage revenues are generated from freight billings and time charter hire. Time charter revenue, including bare-boat hire, is recorded over the term of the charter as the service is provided. Revenues from voyage charters on the spot market or under contract of affreightment are recognized on a percentage of completion method using the discharge to discharge basis. Vessel voyage and operating expenses and charter hire expense are expensed when incurred. Unearned revenue represents cash received prior to the year end which relates to revenue applicable to periods after the year-end. The operating revenues and voyage expenses of vessels operating under a tanker pool are pooled and are allocated to the pool participants on a time charter equivalent basis, according to an agreed formula. Revenues from variable hire arrangements are recognized to the extent the amounts are fixed or determinable at the reporting date. |
Voyage revenues for 2007, 2006 and 2005, included revenues derived from significant charterers as follows (in percentages of total voyage revenues):
| Charterer |
2007 | 2006 | 2005 | |||
| A | 16% | 13% | 16% | |||
| B | 12% | Under 10% | 11% | |||
| C | 11% | Under 10% | 11% |
| (m) | Segment Reporting: The Company does not evaluate the operating results by type of vessel or by type of charter or by type of cargo. Although operating results may be identified by type of vessel, management, including the chief operating decision maker, reviews operating results primarily by revenue per day and operating results of the fleet. Thus the Company has determined that it operates in one reportable segment, the worldwide maritime transportation of crude and refined oil. In 2007, the Company acquired a liquefied natural gas (LNG) carrier. This is the only vessel of its kind that the Company currently operates and, as it does not meet the quantitative thresholds used to determine reportable segments, the LNG carrier segment is not a reportable segment. The Company’s vessels operate on many trade routes throughout the world and, therefore, the provision of geographic information is considered impracticable by management. |
| (n) | Derivative Financial Instruments: The Company regularly enters into interest rate swap contracts to manage its exposure to fluctuations of interest rates associated with its specific borrowings. Interest rate differentials paid or received under these swap agreements are recognized as part of interest expense related to the hedged debt. All derivatives are recognized in the consolidated financial statements at their fair value. On the inception date of the derivative contract, the Company designates the derivative as a hedge of a forecasted transaction or the variability of cash flow to be paid (“cash flow” hedge). Changes in the fair value of a derivative that is qualified, designated and highly effective as a cash flow hedge are recorded in other comprehensive income until earnings are affected by the forecasted transaction or the variability of cash flow and are then reported in current earnings. Changes in the fair value of undesignated derivative instruments and the ineffective portion of designated derivative instruments are reported in current earnings. |
The Company formally documents all relationships between hedging instruments and hedged items, as well as the risk-management objective and strategy for undertaking various hedge transactions. This process includes linking all derivatives that are designated as cash flow hedges to specific forecasted transactions or variability of cash flow.
F-9
TSAKOS ENERGY NAVIGATION LIMITED
NOTES TO CONSOLIDATED FINANCIAL STATEMENTS
DECEMBER 31, 2007, 2006 AND 2005
(Expressed in thousands of U.S. Dollars, except for share and per share data, unless otherwise stated)
| 1. | Significant Accounting Policies (continued) |
| (n) | Derivative Financial Instrument (continued): |
The Company also formally assesses, both at the hedge’s inception and on an ongoing basis, whether the derivatives that are used in hedging transactions are highly effective in offsetting changes in cash flow of hedged items. When it is determined that a derivative is not highly effective as a hedge or that it has ceased to be a highly effective hedge, the Company discontinues hedge accounting prospectively, in accordance with FASB Statement 133.
| (o) | Accounting for Leases: Leases of assets under which substantially all the risks and rewards of ownership are effectively retained by the lessor are classified as operating leases. Lease payments under an operating lease are recognized as an expense on a straight-line method over the lease term. |
| (p) | Stock Based Compensation: The Company has a share based incentive plan and, until July 2006, a stock option plan that covers directors and officers of the Company and employees of the related companies discussed in Note 2. The Company applies the fair-value-based method of accounting for share-based payments in accordance with FASB Statement 123(R). The Company adopted FASB Statement 123(R) under the modified prospective transition method on January 1, 2006. Adoption of FASB Statement 123(R) did not have any impact on the Company’s earnings and financial position because the Company had previously adopted FASB Statement 123. The Company recognized compensation expense for the grants of shares of restricted stock awarded in 2007 and 2006. The fair value of restricted stock issued to crew members, directors and officers of the Company at the grant date is equal to the closing stock price on that date and is amortized over the applicable vesting period using the straight-line method. The fair value of restricted stock issued to non-employees is equal to the closing stock price at the grant date adjusted by the closing stock price at each reporting date and is amortized over the applicable performance period in accordance with EITF 96-18 (See Note 10). |
| (q) | Reporting Assets held for sale: It is the Company’s policy to dispose of vessels and other fixed assets when suitable opportunities occur and not necessarily to keep them until the end of their useful life. The Company classifies assets and disposal groups as being held for sale in accordance with SFAS No. 144 “Accounting for the Impairment or the Disposal of Long-Lived Assets”, when the following criteria are met: (i) management possessing the necessary authority has committed to a plan to sell the asset (disposal group); (ii) the asset (disposal group) is immediately available for sale on an “as is” basis; (iii) an active program to find the buyer and other actions required to execute the plan to sell the asset (disposal group) have been initiated; (iv) the sale of the asset (disposal group) is probable, and transfer of the asset (disposal group) is expected to qualify for recognition as a completed sale within one year; and (v) the asset (disposal group) is being actively marketed for sale at a price that is reasonable in relation to its current fair value and actions required to complete the plan indicate that it is unlikely that significant changes to the plan will be made or that the plan will be withdrawn. Long-lived assets or disposal groups classified as held for sale are measured at the lower of their carrying amount or fair value less cost to sell. These assets are not depreciated once they meet the criteria to be held for sale. |
F-10
TSAKOS ENERGY NAVIGATION LIMITED
NOTES TO CONSOLIDATED FINANCIAL STATEMENTS
DECEMBER 31, 2007, 2006 AND 2005
(Expressed in thousands of U.S. Dollars, except for share and per share data, unless otherwise stated)
| 1. | Significant Accounting Policies (continued) |
| (r) | Recent Accounting Pronouncements: |
In September 2006, the FASB issued FASB Statement No. 157 “Fair Value Measurements”. The Statement provides guidance for using fair value to measure assets and liabilities. The Statement also responds to investors’ requests for expanded information about the extent to which, companies measure assets and liabilities at fair value, the information used to measure fair value, and the effect of fair value measurements on earnings. The Statement applies whenever other Statements require (or permit) assets or liabilities to be measured at fair value. The standard does not expand the use of fair value in any new circumstances. Under the Statement, fair value refers to the price that would be received to sell an asset or paid to transfer a liability in an orderly transaction between market participants in the market in which the reporting entity transacts. This Statement clarifies the principle that fair value should be based on the assumptions market participants would use when pricing the asset or liability. In support of this principle, the Statement establishes a fair value hierarchy that prioritizes the information used to develop those assumptions. The fair value hierarchy gives the highest priority to quoted prices in active markets and the lowest priority to unobservable data, for example, the reporting entity’s own data. Under the Statement fair value measurements would be separately disclosed by level within the fair value hierarchy. It is effective for financial statements issued for fiscal years beginning after November 15, 2007, and interim periods within those fiscal years. Early adoption is permitted. The Company will adopt this pronouncement beginning in fiscal year 2008. The Company does not believe that the adoption of Statement 157 will have a material impact on its earnings and financial position.
In February 2008, the FASB issued Staff Position FASB 157-1 which amends SFAS No. 157 to exclude SFAS No. 13 “Accounting for Leases” and other accounting pronouncements that address fair value measurements for purposes of lease classification or measurement under Statement 13. This scope exception does not apply to assets and liabilities assumed in a business combination that are required to be measured at fair value under SFAS No. 141, “Business Combinations”, or No. 141(R) “Business Combinations”, regardless of whether those assets or liabilities are related to leases. In addition, in February 2008, the FASB issued Staff Position FASB 157-2 which delays the effective date of SFAS No. 157 for non-financial assets and non-financial liabilities, except for items that are recognized or disclosed at fair value in the financial statements on a recurring basis (at least annually). The delay is intended to allow the Board and constituents additional time to consider the effect of various implementation issues that have arisen, or that may arise, from the application of SFAS No. 157. FASB Staff Position 157-2 defers the effective date of SFAS No. 157 to fiscal years beginning after November 15, 2008, and interim periods within those fiscal years for items within its scope. The Company does not believe that the adoption of Statement 157 for non-financial assets and non-financial liabilities will have a material impact on its earnings and financial position.
In February 2007, the FASB issued Statement 159, “The Fair Value Option for Financial Assets and Financial Liabilities”. This Statement permits entities to choose to measure many financial instruments and certain other items at fair value that are not currently required to be measured at fair value. The objective
of the Statement is to improve financial reporting by providing entities with the opportunity to mitigate volatility in reported earnings. It also establishes presentation and disclosure requirements designed to facilitate comparisons between entities. This Statement does not affect any existing accounting literature that requires certain assets and liabilities to be carried at fair value. It is effective for financial statements issued for fiscal years beginning after November 15, 2007. The Company does not believe that the adoption of Statement 159 will have a material impact on its earnings and financial position.
F-11
TSAKOS ENERGY NAVIGATION LIMITED
NOTES TO CONSOLIDATED FINANCIAL STATEMENTS
DECEMBER 31, 2007, 2006 AND 2005
(Expressed in thousands of U.S. Dollars, except for share and per share data, unless otherwise stated)
| 1. | Significant Accounting Policies (continued) |
| (r) | Recent Accounting Pronouncements (continued): |
On December 4, 2007, the FASB issued Statement 141(R), “Business Combinations” and Statement 160, “Non-controlling Interests in Consolidated Financial Statements—an amendment of Accounting Research Bulletin No. 51”. These new standards will significantly change the accounting for and reporting of business combination transactions and non-controlling (minority) interests in consolidated financial statements. Statement 141(R) and Statement 160 are required to be adopted simultaneously and are effective for the first annual reporting period beginning on or after December 15, 2008. Early adoption is prohibited. Statement 141(R) replaces Statement 141 “Business Combinations”, and establishes several new principles and requirements for how an acquirer recognizes and measures in its financial statements the identifiable assets acquired, the liabilities assumed any non-controlling interest in the acquiree and the goodwill acquired.
Statement 160 establishes new accounting and reporting standards for ownership interests in subsidiaries held by parties other than the parent, the amount of consolidated net income attributable to the parent and to the non-controlling interest, changes in a parent’s ownership interest and the valuation of retained non-controlling equity investments when a subsidiary is deconsolidated. The Statement also establishes disclosure requirements that clearly identify and distinguish between the interests of the parent and the interests of the non-controlling owners. It is effective for the Company beginning January 1, 2009, and is required to be applied prospectively as of the beginning of the fiscal year in which it initially applied, except for the presentation and disclosure requirements, which must be applied retrospectively for all periods presented. The Company is currently evaluating the impact of Statement 160 relative to the accounting for non-controlling (minority) interest.
In March 2008, the FASB issued Statement 161, “Disclosures about Derivative Instruments and Hedging Activities”. The Statement is intended to improve financial reporting about derivative instruments and hedging activities by
requiring enhanced disclosures to enable investors to better understand their effects on an entity’s financial position, financial performance, and cash flows. It is effective for financial statements issued for fiscal years and interim periods beginning after November 15, 2008, with early application encouraged. The Company is currently evaluating the potential impact of the adoption of Statement 161 on its consolidated financial statements and footnote disclosures.
F-12
TSAKOS ENERGY NAVIGATION LIMITED
NOTES TO CONSOLIDATED FINANCIAL STATEMENTS
DECEMBER 31, 2007, 2006 AND 2005
(Expressed in thousands of U.S. Dollars, except for share and per share data, unless otherwise stated)
| 2. | Transactions with Related Parties |
The following amounts were charged by related parties for services rendered:
| 2007 | 2006 | 2005 | ||||
| Tsakos Shipping and Trading S.A. (commissions) |
6,132 | 5,399 | 3,706 | |||
| Tsakos Energy Management Limited (management fees) |
9,763 | 7,103 | 5,460 | |||
| Argosy Insurance Company Limited |
9,331 | 8,609 | 5,705 | |||
| AirMania Travel S.A. |
1,630 | 1,333 | 1,741 | |||
| Total expenses with related parties | 26,856 | 22,444 | 16,612 | |||
Balances due from and to related parties are as follows:
| December 31, | ||||
| 2007 | 2006 | |||
| Due from related parties | ||||
| Tsakos Shipping and Trading S.A. |
972 | — | ||
| Total due from related parties | 972 | — | ||
| Due to related parties | ||||
| Tsakos Energy Management Limited |
44 | — | ||
| Tsakos Shipping and Trading S.A. |
— | 2,062 | ||
| Argosy Insurance Company Limited |
2,209 | 252 | ||
| AirMania Travel S.A. |
175 | 100 | ||
| Total due to related parties | 2,428 | 2,414 | ||
| (a) | Tsako\s Energy Management Limited: The Company has a Management Agreement (“Management Agreement”) with Tsakos Energy Management Limited (the “Management Company”), a Liberian corporation, to provide overall executive and commercial management of its affairs for a monthly fee of $20 per owned vessel and $15 per chartered-in vessel or chartered out on a bare-boat basis ($18 per owned vessel and $12.5 per chartered-in vessel in 2006 and 2005). Per the Management Agreement of March 8, 2007, effective from January 1, 2008, there is a prorated adjustment if at beginning of the year the Euro has appreciated by 10% or more against the U.S. Dollar since January 1, 2007. In addition, there is an increase each year by a percentage figure reflecting 12 month Euribor, if both parties agree. As a consequence, from January 1, 2008, monthly fees for operating vessels have been increased accordingly to $23 and, for chartered-in vessels to $17. |
In addition to the management fee, the Management Agreement provides for an incentive award to the Management Company, which is at the absolute discretion of the Company’s Board of Directors. The incentive award program is based on the Company’s annual return on equity (“ROE”), and an award scale for 2007, ranging from ROE greater than 15% corresponding to an award amount of $1,500 ($1,250 and $1,000 in 2006 and 2005 respectively) up to ROE greater than 25% with an award amount of $4,500 ($3,500 in 2006 and $2,500 in 2005). For 2007, the ROE was 24.2% and the Board of Directors approved an award of $4,000. For 2006 and 2005 the ROE was in excess of 25% and awards of $3,500 and $2,500, respectively were approved and the awards are expensed and recognized in accrued liabilities in the accompanying December 31, 2007, 2006 and 2005 Consolidated Financial Statements. On March 14, 2008, the Board of Directors approved, effective for the year 2008, an increase in the award amounts corresponding to the award scale, to $2,500 up to $5,500.
F-13
TSAKOS ENERGY NAVIGATION LIMITED
NOTES TO CONSOLIDATED FINANCIAL STATEMENTS
DECEMBER 31, 2007, 2006 AND 2005
(Expressed in thousands of U.S. Dollars, except for share and per share data, unless otherwise stated)
| 2. | Transactions with Related Parties (continued) |
The Company and Tsakos Energy Management Limited have certain officers and directors in common. The President, who is also the Chief Executive Officer and a Director of the Company, is also the sole stockholder of Tsakos Energy Management Limited. Tsakos Energy Management Limited may unilaterally terminate its Management Agreement with the Company at any time upon one year’s notice. In addition, if even one director was elected to the Company’s Board of Directors without having been recommended by the existing board, Tsakos Energy Management Limited would have the right to terminate the Management Agreement on ten days notice. If Tsakos Energy Management Limited terminates the agreement for this reason, the Company would be obligated to pay Tsakos Energy Management Limited the present value of all payments that would have otherwise become due under the Management Agreement until June 30 in the tenth year following the date of the termination plus the average of the incentive awards previously paid to Tsakos Energy Management Limited multiplied by ten. This would result in a total payment of approximately $119,000 as of December 31, 2007. Under the terms of the Management Agreement between the Company and Tsakos Energy Management Limited, the Company may terminate the agreement only under specific circumstances, such as breach of contract by the manager and change of control in the shareholding of the manager without the prior approval of the Company’s Board of Directors.
Estimated future management fees payable over the next ten years under the management agreement, exclusive of any incentive awards and based on existing vessels and known vessels scheduled for future delivery as at December 31, 2007, are:
| Year |
Amount | |
| 2008 |
12,876 | |
| 2009 |
13,050 | |
| 2010 |
13,416 | |
| 2011 |
13,452 | |
| 2012 to 2017 |
73,428 | |
| 126,222 | ||
Management fees for vessels are included in the accompanying Consolidated Statements of Income. Also, under the terms of the Management Agreement, Tsakos Energy Management Limited provides supervisory services for the construction of new vessels for a monthly fee of $15 per vessel in 2007 and $12.5 in 2006 and 2005 ($20 relating to the construction of an LNG carrier and $18 in 2006 and 2005). These fees in total amounted to $1,832, $2,033 and $1,962 during the years ended December 31, 2007, 2006 and 2005, respectively, and are either accounted for as part of construction costs for delivered vessels or are included in Advances for vessels under construction. Per the Management Agreement of March 8, 2007, such fees are adjusted to $17 to take account of the increase, as described above.
| (b) | Tsakos Shipping and Trading S.A. (“Tsakos”): Tsakos Energy Management Limited has appointed Tsakos to provide technical management to the Company’s vessels. Tsakos, at the consent of the Company, may subcontract all or part of the technical management of any vessel to an alternative unrelated technical manager. Certain members of the Tsakos family are involved in the decision-making processes of Tsakos and of Tsakos Energy Management Limited and are also shareholders of the Company. |
F-14
TSAKOS ENERGY NAVIGATION LIMITED
NOTES TO CONSOLIDATED FINANCIAL STATEMENTS
DECEMBER 31, 2007, 2006 AND 2005
(Expressed in thousands of U.S. Dollars, except for share and per share data, unless otherwise stated)
| 2. | Transactions with Related Parties (continued) |
Tsakos Energy Management Limited, at its own expense, pays technical management fees to Tsakos, and the Company bears and pays directly to Tsakos most of its operating expenses, including repairs and maintenance, provisioning and crewing of the Company’s vessels, as well as certain charges which are capitalized or deferred, including reimbursement of the costs of Tsakos personnel sent overseas to supervise repairs and perform inspections on Company vessels.
Tsakos also provides chartering services for the Company’s vessels by communicating with third party brokers to solicit research and propose charters. For this service, the Company pays to Tsakos a chartering commission of approximately 1.25% on all freights, hires and demurrages. Such commissions are included in Commissions. Commissions due to Tsakos by the Company are included in Due to related companies.
During 2006, the Company acquired through Tsakos two vessels from the Tsakos Group, La Prudencia and Delphi, plus two contracts for the construction in progress of two product carriers delivered in 2007, for a total consideration of $219,000 of which $166,331 was paid to Tsakos in 2006 and the remaining balance was paid directly to the construction yard in 2006 and 2007.
| (c) | Argosy Insurance Company Limited (“Argosy”): The Company places its hull and machinery insurance, increased value insurance and war risk insurance through Argosy, a captive insurance company affiliated with Tsakos. |
| (d) | AirMania Travel S.A. (“AirMania”): Apart from third-party agents, the Company also uses an affiliated company, AirMania, for travel services. |
| 3. | Long-term Investments |
As at December 31, the Company held the following long-term investments at fair value:
| 2007 | 2006 | |||
| Structured note |
— | 4,795 | ||
| Convertible bond |
— | 9,250 | ||
| Equity in private company |
1,000 | — | ||
| 1,000 | 14,045 | |||
In March 2007, the counter party exercised its option to call back the structured note and returned the amount of $5,000 on the original investment resulting in a gain of $205. During 2007, the Company converted the 8% interest bearing convertible bond into 456,050 common shares, and later sold the shares for proceeds of $10,202 resulting in a gain of $4,025 reclassified to Interest and investment income from Accumulated Other Comprehensive Income. In aggregate, the Company recorded gains from investments and changes in fair value of investments amounting to $4,230, $4,579 and $2,122 in 2007, 2006 and 2005 respectively, reported as Interest and investment income.
In October 2007, the Company acquired 125,000 common shares at a total cost of $1,000 in a private U.S. company which undertakes research into synthetic genomic processes which may have a beneficial environmental impact within the energy and maritime industries. A Director of the Company is an officer and shareholder of this U.S. private company.
F-15
TSAKOS ENERGY NAVIGATION LIMITED
NOTES TO CONSOLIDATED FINANCIAL STATEMENTS
DECEMBER 31, 2007, 2006 AND 2005
(Expressed in thousands of U.S. Dollars, except for share and per share data, unless otherwise stated)
| 4. | Acquisitions |
There were nine scheduled deliveries of newly constructed vessels within 2007 at a total cost of $581,718 of which $352,786 was paid in 2007. Also in January 2007, the Company repurchased the aframax tanker Olympia (See Note 7).
| 5. | Deferred Charges |
Deferred charges, consisted of dry-docking and special survey costs, net of accumulated amortization, amounted to $11,088 and $8,347 at December 31, 2007 and 2006, respectively, and loan fees, net of accumulated amortization, amounted to $4,713 and $5,101 at December 31, 2007 and 2006, respectively. Amortization of deferred dry-docking costs is separately reflected in the accompanying Consolidated Statements of Income, while amortization of loan fees is included in Interest and finance costs, net.
| 6. | Long-Term Debt |
| Facility |
2007 | 2006 | ||||
| (a) Credit Facilities |
1,321,412 | 1,086,036 | ||||
| (b) Term Bank Loans |
68,531 | 47,625 | ||||
| Total |
1,389,943 | 1,133,661 | ||||
| Less – current portion |
(44,363 | ) | (23,117 | ) | ||
| Long-term portion |
1,345,580 | 1,110,544 | ||||
| (a) | Credit facilities |
As at December 31, 2007, the Company had eight open reducing revolving credit facilities, all of which are reduced in semi-annual installments, and two open facilities which have both a reducing revolving credit component and a term bank loan component. The aggregate available unused amount under these facilities and the term debt portion of the facilities described below in items 1 and 7, at December 31, 2007 is $274,489. The details are as follows:
| 1. | A secured facility amounting to $179,384 originated in November 2004 for the partial financing of four new vessels. Part of the facility is in the form of term debt at fixed interest, and the remaining part is a credit facility at variable interest. In 2007, an amount of $70,810 was drawn relating to the delivery of two vessels and $6,247 was repaid. At December 31, 2007 and 2006, $136,774 and $73,647 was outstanding, of which $116,575 and $55,325, respectively, was from the facility at fixed interest. The unused balance at December 31, 2007 is $32,522. |
| 2. | A reducing revolving facility originated in 2005 for an amount of $250,000 to provide financing of the debt on seven existing vessels and partial financing for one newbuilding on future delivery. During 2007, $7,784 was repaid and $59,427 was prepaid following the sale of three of the vessels. An amount of $41,751 was drawn in 2007 on the delivery of the newbuilding. At December 31, 2007 and 2006, an amount of $136,820 and $162,281, respectively, was outstanding on this facility. There is no remaining unused balance at December 31, 2007. |
F-16
TSAKOS ENERGY NAVIGATION LIMITED
NOTES TO CONSOLIDATED FINANCIAL STATEMENTS
DECEMBER 31, 2007, 2006 AND 2005
(Expressed in thousands of U.S. Dollars, except for share and per share data, unless otherwise stated)
| 6. | Long-Term Debt (continued) |
| 3. | A reducing revolving facility originated in 2005 for an amount of $220,000 to provide financing of the debt on three existing vessels and partial financing of three newbuildings on future delivery. During 2007, $56,300 was drawn on delivery of two newbuildings. At December 31, 2007 and 2006, an amount of $198,688 and $142,388, respectively, was outstanding on this facility. The unused balance at December 31, 2007 is $1,212. |
| 4. | A reducing revolving facility originated in 2005 for an amount of $220,000 to provide financing of the debt on two existing vessels and financing for acquisitions in 2006 and two deliveries in 2007. During 2007, $43,500 was drawn and $2,700 repaid. At December 31, 2007 and 2006, an amount of $121,500 and $80,700, respectively, was outstanding on this facility. The unused balance at December 31, 2007 is $13,050. |
| 5. | A reducing revolving facility originated in April 2006 for an amount of $371,010 relating to the partial financing of the acquisition of six vessels and three construction contracts for three vessels that were delivered within 2006. An amount of $327,270 had been drawn on this facility in 2006, all of which remained outstanding at December 31, 2007, leaving an unused balance of $23,740 as at that date. |
| 6. | A reducing revolving facility originated in April 2006 for an amount of $275,000 relating to the financing of the debt on six existing vessels. An amount of $234,750 had been drawn on this facility in 2006 all of which remained outstanding at December 31, 2007, leaving an unused balance of $16,100 at that date. |
| 7. | A facility originated in October 2006 for an amount of $70,000 relating to the financing of the debt on two existing vessels. Part of this facility is in the form of a secured term loan and part in the form of a revolving credit facility. An amount of $65,000 had been drawn on this facility by December 31, 2006, of which $4,375 was repaid in 2007, leaving an amount outstanding at December 31, 2007 of $60,625. There was an unused balance of $5,000 at December 31, 2007. |
| 8. | A reducing revolving facility originated in January 2007 for an amount of $120,000 relating to the financing of the debt of one new delivery. An amount of $104,984 has been drawn on this facility in 2007 all of which remained outstanding at December 31, 2007, leaving an unused balance of $12,516 at that date. |
| 9. | A reducing revolving facility originated in February 2007 for an amount of $82,000 relating to the financing of the debt of two new deliveries expected in 2008. No amount had been drawn on this facility in 2007 and, consequently, the unused balance was $82,000 at December 31, 2007. |
| 10. | A reducing revolving facility originated in May 2007 for an amount of $88,350 relating to the financing of the debt of two new deliveries expected in 2008. No amount had been drawn on this facility in 2007 and, consequently, the unused balance was $88,350 at December 31, 2007. |
Interest is payable at a rate based on LIBOR plus a spread. At December 31, 2007, interest on these facilities ranged from 5.19% to 6.36%.
F-17
TSAKOS ENERGY NAVIGATION LIMITED
NOTES TO CONSOLIDATED FINANCIAL STATEMENTS
DECEMBER 31, 2007, 2006 AND 2005
(Expressed in thousands of U.S. Dollars, except for share and per share data, unless otherwise stated)
| 6. | Long-Term Debt (continued) |
| (b) | Term bank loans |
Term loan balances outstanding at December 31, 2007 amounted to $68,531 and relate to the vessels Opal Queen, Arion and Andromeda. These bank loans are payable in U.S. Dollars in semi-annual installments with balloon payments due at maturity in May 2014, October 2016 and March 2017 respectively. Interest rates on the outstanding loans as at December 31, 2007 are based on LIBOR plus a spread, which was 5.56%, 5.78% and 6.15% respectively. The bank loan relating to Opal Queen includes an option to convert the loan into Euro, Yen or Swiss Francs at the applicable spot rates of Exchange.
The weighted-average interest rates on the above executed loans for the applicable periods were:
| Year ended December 31, 2007 |
5.96 | % | |
| Year ended December 31, 2006 |
5.81 | % | |
| Year ended December 31, 2005 |
4.35 | % |
The above revolving credit facilities and term bank loans are secured by first priority mortgages on each of the respective vessels to which they relate, and to assignments of earnings and insurances of the respectively mortgaged vessels, and by corporate guarantees of the relevant ship-owning subsidiaries.
The loan agreements include, among other covenants, covenants requiring the Company to obtain the lenders’ prior consent in order to incur or issue any financial indebtedness, additional borrowings, pay dividends in an amount more than 50% of cumulative net income (as defined in the related agreements), sell vessels and assets, and change the beneficial ownership or management of the vessels. Also, the covenants require the Company to maintain a minimum liquidity, a minimum hull value in connection with the vessels’ outstanding loans, insurance coverage of the vessels against all customary risks and maintenance of operating bank accounts with minimum balances.
The annual principal payments required to be made after December 31, 2007, including balloon payments totaling $598,342 due through April 2019, are as follows:
| Year |
Amount | |
| 2008 |
44,364 | |
| 2009 |
81,685 | |
| 2010 |
92,559 | |
| 2011 |
95,075 | |
| 2012 and thereafter |
1,076,260 | |
| 1,389,943 | ||
F-18
TSAKOS ENERGY NAVIGATION LIMITED
NOTES TO CONSOLIDATED FINANCIAL STATEMENTS
DECEMBER 31, 2007, 2006 AND 2005
(Expressed in thousands of U.S. Dollars, except for share and per share data, unless otherwise stated)
| 7. | Deferred Income |
| 2007 | 2006 | |||||
| (a) Gain on Olympia sale-leaseback transaction |
— | 2,654 | ||||
| (b) Gain on Decathlon/Pentathlon sale-leaseback transactions |
2,626 | 5,793 | ||||
| Total |
2,626 | 8,447 | ||||
| Less - current portion |
(2,626 | ) | (5,821 | ) | ||
| Long-term portion |
— | 2,626 | ||||
| (a) | Gain on Olympia Sale-leaseback transaction: A capital gain of $2,654 from the sale of the Olympia in 1999 as part of a sale-leaseback transaction was deferred in full. During 2006, the Company exercised its option to re-purchase the vessel with delivery to take place at the first convenient port following the year-end. Consequently, the vessel was re-delivered to the Company in January 2007 for a price of $31,115. The deferred capital gain was netted against the purchase price. Lease payments relating to the time charter of the Olympia amounted to $360, $7,853, and $7,759 during the years ended December 31, 2007, 2006 and 2005, respectively, and are recorded in Charter hire expense. |
| (b) | Gain on Decathlon/Pentathlon Sale-leaseback transactions: In October and November 2003, respectively, the Company sold two suezmaxes and time-chartered the vessels (re-named Cape Baker and Cape Balboa respectively) back from the buyer for a minimum period of five years, with options to extend the charters for a further three years. In addition, at the end of the first five years, or until the end of the seventh year if the charter is extended, the Company has the option to buy the vessels at specified amounts. On March 14, 2008, the Board of Directors resolved that management should exercise the options to repurchase both vessels at $47,500 each. The options to repurchase the vessels were declared on April 7, 2008, with redelivery expected in October and November 2008, respectively. The charter back agreements are accounted for as operating leases and the gains on the sale of $8,340 and $7,497 respectively were deferred and are amortized in proportion to the gross rental charge to expense over the five year lease period. Lease payments relating to the time charters of the Cape Baker and Cape Balboa were $7,641 and $7,329 respectively in 2007 and $8,304 each in 2006, and $8,255 and $8,304 respectively in 2005, and are recorded in Charter hire expense. The Company’s future minimum lease payments on these vessels relate only to 2008 and amount to $6,552 for the Cape Baker and $7,303 for the Cape Balboa. |
| 8. | Vessel Sales |
During 2007, the Company sold three operating vessels for net proceeds of $142,433. The total gain from these three sales was $68,944, and is shown as Gain on sale of vessels. An agreement to sell the vessel Olympia was reached in October 2007 for delivery in early 2008 (See Note 16(a)). This vessel is treated as held for sale as at December 31, 2007, and the net book value of the vessel reclassified as a current asset. In 2006, the Company sold three operating vessels and recognized gains on sale of $38,009. In 2005, five operating vessels were sold and gains of $34,540 were recognized.
There were no sales on non-operating vessels in 2007 and 2006. In May 2005, the Company sold on delivery a newly constructed vessel for net proceeds of $70,015, and recognized a gain on sale of $10,765 which is shown as Gain on sale of non-operating vessels under Other income.
F-19
TSAKOS ENERGY NAVIGATION LIMITED
NOTES TO CONSOLIDATED FINANCIAL STATEMENTS
DECEMBER 31, 2007, 2006 AND 2005
(Expressed in thousands of U.S. Dollars, except for share and per share data, unless otherwise stated)
| 9. | Interest and Finance Costs, net |
| 2007 | 2006 | 2005 | |||||||
| Interest expense |
77,025 | 54,665 | 19,086 | ||||||
| Less: Interest capitalized |
(8,944 | ) | (12,474 | ) | (5,344 | ) | |||
| Interest expense, net |
68,081 | 42,191 | 13,742 | ||||||
| Amortization of loan fees |
921 | 1,495 | 1,034 | ||||||
| Bank charges |
611 | 1,352 | 1,360 | ||||||
| Sub-total |
69,613 | 45,038 | 16,136 | ||||||
| Amortization of deferred gain on termination of swap agreement |
— | — | (1,674 | ) | |||||
| Reclassification adjustments on undesignated cash flow hedges |
— | (5,087 | ) | (2,334 | ) | ||||
| Change in fair value of non-hedging financial instruments |
7,769 | 2,535 | (881 | ) | |||||
| Sub-total |
7,769 | (2,552 | ) | (4,889 | ) | ||||
| Net total |
77,382 | 42,486 | 11,247 | ||||||
As at December 31, 2007, the Company was committed to the following interest rate swap agreements for the purpose of managing risks associated with the variability of changing LIBOR related interest rates. In all cases the Company receives 6-month LIBOR, while payments are as described:
| Notional amount |
Maturity Date |
As at December 31, 2007 | ||||||||
| Company pays: | Company receives: | |||||||||
| i. | 20,000 | May 2008 | 4.50 | % | 4.84 | % | ||||
| ii. | 125,000 | March 2014 | 4.26 | % | 5.56 | % | ||||
| iii. | 87,750 | October 2011 | 5.22 | % | 5.22 | % | ||||
| iv. | 87,750 | October 2012 | 5.50 | % | 5.22 | % | ||||
| v. | 102,500 | August 2012 | 5.21 | % | 5.33 | % | ||||
| vi. | 75,300 | December 2012 | 5.50 | % | 4.72 | % | ||||
| vii. | 23,437 | October 2012 | 4.95 | % | 5.22 | % | ||||
| viii. | 24,219 | September 2012 | 4.95 | % | 5.57 | % | ||||
| ix. | 70,000 | September 2012 | 5.46 | % | 4.90 | % | ||||
| x. | 21,460 | July 2008 | 4.50 | % | 5.37 | % | ||||
| xi. | 22,600 | January 2015 | 4.41 | % | 5.38 | % | ||||
| xii. | 18,500 | September 2009 | 2.75 | % | 5.51 | % | ||||
| xiii. | 20,200 | September 2009 | 3.20 | % | 5.57 | % | ||||
| xiv. | 18,688 | November 2009 | 4.10 | % | 4.85 | % | ||||
| xv. | 24,000 | July 2008 | 3.93 | % | 5.38 | % | ||||
| xvi. | 35,990 | July 2008 | 4.00 | % | 5.38 | % | ||||
| xvii. | 71,925 | September 2012 | 4.50 | % | 5.14 | % | ||||
| xviii. | 87,750 | April 2016 | 4.81 | % | 5.22 | % | ||||
| 937,069 | ||||||||||
F-20
TSAKOS ENERGY NAVIGATION LIMITED
NOTES TO CONSOLIDATED FINANCIAL STATEMENTS
DECEMBER 31, 2007, 2006 AND 2005
(Expressed in thousands of U.S. Dollars, except for share and per share data, unless otherwise stated)
| 9. | Interest and Finance Costs, net (continued) |
During 2007, the Company entered into six new interest rate swap agreements (iv. to ix. above) that are accounted for as a hedge of the Company’s variable interest rate payments on bank loans. As at December 31, 2007 and 2006, respectively, the Company held nine and three (i. to ix. above) interest rate swap agreements in order to hedge its exposure to interest rate fluctuations associated with its debt. The fair value of such financial instruments as of December 31, 2007 and 2006 in aggregate amounted to $23,775(negative) and $1,646(positive), respectively, and are reflected directly in Accumulated other comprehensive income in Stockholders’ Equity.
At December 31, 2007, the Company held nine interest rate swaps (x. to xviii. above) that did not meet hedge accounting criteria. As such, the changes in their fair values during 2007, have been included in change in fair value of non-hedging financial instruments, in the table above.
| 10. | Stockholders’ Equity |
On November 14, 2007, the Company effected a two-for-one stock split relating to its common stock in the form of a share dividend.
Repurchases of stock for the years ended December 31, 2007 and 2006 amounted to $1,338 and $5,261, respectively. The transactions were open market based through the New York Stock Exchange. Repurchased shares are immediately considered as canceled in accordance with the Company’s bye-laws and Bermudan Company Law.
In September 2005, the Board of Directors of the Company adopted a shareholder rights plan that authorizes to existing shareholders substantial preferred share rights and additional common shares if any third party acquires 15% or more of the outstanding common shares or announces its intent to commence a tender offer for at least 15% of the common shares, in each case, in a transaction that the Board of Directors has not approved.
In 1998, the Company adopted a Stock Option Plan authorizing the issuance of up to 900,000 options to purchase common shares (the “1998 Plan”). All the options under the plan were granted to directors and officers of the Company and other persons who were judged capable of influencing the development of the Company’s business. In July 2006, the Plan ceased and any remaining unexercised options were deemed forfeited. Costs recognized for options issued under the 1998 Plan to the Directors of the Company and to employees of Tsakos and Tsakos Energy Management, using the fair value method, were nil for the years ended December 31, 2006 and 2005.
F-21
TSAKOS ENERGY NAVIGATION LIMITED
NOTES TO CONSOLIDATED FINANCIAL STATEMENTS
DECEMBER 31, 2007, 2006 AND 2005
(Expressed in thousands of U.S. Dollars, except for share and per share data, unless otherwise stated)
| 10. | Stockholders’ Equity (continued) |
A summary of the Company’s stock option activity relating to the 1998 Plan is as follows:
| 2006 | 2005 | |||||||||
| Number of Options |
Weighted- average exercise price |
Number of Options |
Weighted- average exercise price | |||||||
| U.S.$ | U.S. $ | |||||||||
| Outstanding at beginning of year |
25,276 | 6.00 | 62,174 | 6.00 | ||||||
| Exercised |
(9,752 | ) | 6.00 | (36,898 | ) | 6.00 | ||||
| Forfeited |
(15,524 | ) | 6.00 | — | — | |||||
| Outstanding and exercisable at end of year |
— | — | 25,276 | 6.00 | ||||||
Compensation costs recognized for options issued under the 1998 Plan to the Directors of the Company and to employees of Tsakos and Tsakos Energy Management, using the fair value method, were nil for the years ended December 31, 2006 and 2005.
In 2004, the shareholders approved a share-based incentive plan providing for the granting of up to 1,000,000 of stock options or other share-based awards to directors and officers of the Company, crew members and to employees of the related companies (the “2004 Plan”). In June 2006, the Company granted a total of 20,000 restricted share units (RSUs) to the non-executive directors, to vest after one year. The fair market value of the RSUs at the date of the award was $18.44 per unit. Accordingly, an amount of $369 was amortized to compensation expense over a one year period, $153 in 2007 and $216 in 2006.
In 2007, 186,000 restricted share units related to the 2004 Plan were issued to Company crew members, directors and officers and 394,000 to individuals employed by the related companies. The grants are scheduled to vest 50% on December 31, 2008 with the remaining 50% vesting on December 31, 2010. A further 4,650 RSUs were issued to non-executive directors in June 2007 to vest after one year and 1,000 RSUs were issued to a non-executive director in June 2007 vesting immediately. Total compensation expense recognized in 2007 relating to RSU’s issued in 2007 amounted to $5,670 consisting of $1,656 for employees and $4,014 for non-employees. Of the aggregate 605,650 RSUs awarded in 2007 and 2006, 1,000 had been vested and none forfeited as at December 31, 2007. As at December 31, 2007, the total compensation cost related to the non-vested RSUs not yet recognized is $10,598 and the weighted average remaining contractual life of outstanding grants is 2.0 years.
F-22
TSAKOS ENERGY NAVIGATION LIMITED
NOTES TO CONSOLIDATED FINANCIAL STATEMENTS
DECEMBER 31, 2007, 2006 AND 2005
(Expressed in thousands of U.S. Dollars, except for share and per share data, unless otherwise stated)
| 11. | Earnings per Common Share |
The computation of basic earnings per share is based on the weighted average number of common shares outstanding during the year. The computation of diluted earnings per share assumes the foregoing and the exercise of all stock options and grants of restricted stock (See Note 10) using the treasury stock method.
| 2007 | 2006 | 2005 | |||||||
| Net income available to common stockholders |
$ | 183,171 | $ | 196,404 | $ | 161,755 | |||
| Weighted average common shares outstanding |
38,075,859 | 38,127,692 | 39,544,540 | ||||||
| Dilutive effect of stock options |
— | 9,112 | 29,152 | ||||||
| Dilutive effect of RSUs |
158,220 | 4,248 | — | ||||||
| Weighted average common shares – diluted |
38,234,079 | 38,141,052 | 39,573,692 | ||||||
| Basic earnings per common share |
$ | 4.81 | $ | 5.15 | $ | 4.09 | |||
| Diluted earnings per common share |
$ | 4.79 | $ | 5.15 | $ | 4.09 | |||
For 2006 and 2005, there were no stock options or RSUs considered anti-dilutive which would have resulted in their exclusion from the computation of diluted earnings per common share. The 585,650 shares of restricted common stock granted in 2007 and 20,000 shares restricted common stock granted in 2006 were considered dilutive and are included in the computation.
| 12. | Minority Interest in Subsidiary |
In August 2006, the Company signed an agreement with Polaris Oil Shipping Inc. (Polaris), an affiliate of Flota Petrolera Ecuatoriana (Flopec), by which Polaris acquired 49% of Mare Success S.A., a previously wholly-owned subsidiary of the Company, for proceeds net of commissions and other related costs of $25,323. Mare Success S.A. is the holding-company of two Panamanian registered companies which own respectively the vessels Maya and Inca. The agreement became effective on November 30, 2006, and for the year ended December 31, 2006, the Company recognized a gain of $25,323. Mare Success S.A. is fully consolidated in the accompanying financial statements.
F-23
TSAKOS ENERGY NAVIGATION LIMITED
NOTES TO CONSOLIDATED FINANCIAL STATEMENTS
DECEMBER 31, 2007, 2006 AND 2005
(Expressed in thousands of U.S. Dollars, except for share and per share data, unless otherwise stated)
| 13. | Income Taxes |
Under the laws of the countries of the companies’ incorporation and/or vessels’ registration, the companies are not subject to tax on international shipping income. However, they are subject to registration and tonnage taxes, which have been included in Vessel operating expenses.
The Company believes that it and its subsidiaries are exempt from U.S. federal income tax at 4% on U.S. source shipping income, as each vessel-operating subsidiary is organized in a foreign country that grants an equivalent exemption to corporations organized in the United States and the Company’s stock is primarily and regularly traded on an established securities market in the United States, as defined by the Internal Revenue Code of the United States. Under the regulations, a Company’s stock will be considered to be regularly traded on an established securities market if (i) one or more classes of its stock representing 50% or more of its outstanding shares, by voting power and value, is listed on the market and is traded on the market, other than in minimal quantities, on at least 60 days during the taxable year; and (ii) the aggregate number of shares of stock traded during the taxable year is at least 10% of the average number of shares of the stock outstanding during the taxable year.
| 14. | Commitments and Contingencies |
As at December 31, 2007, the Company had under construction two panamax and six aframax tankers. The total contracted amount remaining to be paid for the eight vessels under construction, plus the extra costs agreed as at December 31, 2007 was $312,922. Scheduled payments as of December 31, 2007 are $119,538 in 2008, $150,978 in 2009 and $42,406 in 2010.
In the ordinary course of the shipping business various claims and losses may arise from disputes with charterers, agents and other suppliers relating to the operations of the Company’s vessels. Management believes that all such matters are either adequately covered by insurance or are not expected to have a material adverse effect on the Company’s results from operations or financial condition.
F-24
TSAKOS ENERGY NAVIGATION LIMITED
NOTES TO CONSOLIDATED FINANCIAL STATEMENTS
DECEMBER 31, 2007, 2006 AND 2005
(Expressed in thousands of U.S. Dollars, except for share and per share data, unless otherwise stated)
| 15. | Financial Instruments |
| (a) | Interest rate risk: The Company’s interest rates and loan repayment terms are described in Notes 6 and 9. |
| (b) | Bunker price risk: During 2007, the Company had two short-term arrangements in progress whereby it paid to the counterparty a fixed price per metric ton (MT) for a notional quantity of fuel oil and received from the counterparty a floating price dependent on a monthly average of daily market prices. As at December 31, 2007, there were no outstanding contracts. At December 31, 2006, the value of the contract was $36 net payable to the counterparty. |
| (c) | Concentration of credit risk: Financial Instruments consist principally of cash, trade accounts receivable, investments and derivatives. The Company places its temporary cash investments, consisting mostly of deposits, with high credit qualified financial institutions. Credit risk with respect to trade accounts receivable is mitigated due to the high quality of entities comprising the Company’s charterer base. The Company limits the exposure of non-performance by counterparties to derivative instruments by diversifying among counterparties with high credit ratings. |
| (d) | Fair value: The carrying amounts reflected in the accompanying Consolidated Balance Sheet of financial assets and accounts payable approximate their respective fair values due to the short maturity of these instruments. The fair value of long-term bank loans with variable interest rates approximate the recorded values, generally due to their variable interest rates. The present value of the future cash flows of the portion of one long-term bank loan with a fixed interest rate approximates the recorded value. The fair value of the investment discussed in Note 3 equates to the amounts that would be received by the Company in the event of sale of that investment. The fair value of the interest rate swap agreements discussed in Note 9 above equates to the amounts that would be paid by or received by the Company to cancel the swaps. |
| 16. | Subsequent Events |
| (a) | On February 4, 2008, the aframax tanker Olympia, recorded in the accompanying Consolidated Balance Sheet as held for sale, was delivered to its new owners for $63,104 resulting in a gain of approximately $34,335. |
| (b) | On February 12, 2008, the Company took delivery of the panamax product carrier Selecao and drew down $12,121 on a related credit facility for $82 million. On March 14, 2008, the Company took delivery of the panamax product carrier Socrates and drew down $12,175 on the same credit facility. |
| (c) | On March 14, 2008, the Board of Directors resolved that a dividend of $0.90 cents per share will be paid on April 30, 2008 to shareholders of record on April 24, 2008. |
F-25

TEN’S FLEET As of March 31, 2008
VESSEL DWT BUILT HULL DESIGN LOA MAX YARD CLASSIFICATION SOCIETY
BREADTH
CRUDE OIL
VLCC
1. MILLENNIUM 301,171 Sep-98 DH 331.00 m 58.00 m Hyundai Heavy Industries American Bureau of Shipping/Korean Register
2. LA MADRINA 299,700 Jan-94 DH 343.71 m 56.40 m Odense Lindoe Lloyd’s Register
3. LA PRUDENCIA 298,900 Jan-93 DH 343.71 m 56.40 m Odense Lindoe Lloyd’s Register
SUEZMAX
1. ARCTIC 163,216 Jan-07 DH 1A 274.12 m 50.00 m Hyundai Heavy Industries American Bureau of Shipping
2. ANTARCTIC 163,216 Apr-07 DH 1A 274.18 m 50.00 m Hyundai Heavy Industries American Bureau of Shipping
3. ARCHANGEL 163,216 Jan-06 DH 1A 274.12 m 50.00 m Hyundai Heavy Industries Lloyd’s Register
4. ALASKA 163,250 Feb-06 DH 1A 274.12 m 50.00 m Hyundai Heavy Industries Lloyds Register
5. EUROCHAMPION 2004 164,608 Apr-05 DH 1C 274.12 m 50.00 m Hyundai Heavy Industries Lloyd’s Register
6. EURONIKE 164,565 Sep-05 DH 1C 274.12 m 50.00 m Hyundai Heavy Industries Lloyd’s Register
7. SILIA T 164,286 Jun-02 DH 274.19 m 50.00 m Hyundai Samho American Bureau of Shipping
8. CAPE BAKER 164,274 Aug-02 DH 274.19 m 50.00 m Hyundai Samho Germansicher Lloyd
9. CAPE BALBOA 164,236 Oct-02 DH 274.19 m 50.00 m Hyundai Samho Germansicher Lloyd
10. TRIATHLON 164,445 Dec-02 DH 274.19 m 50.00 m Hyundai Samho American Bureau of Shipping
AFRAMAX
1. IZUMO PRINCESS 105,374 Mar-07 DH DNA 228.60 m 42.04 m Sumimoto Heavy Industries Lloyd’s Register
2. SAKURA PRINCESS 105,365 Jun-07 DH DNA 228.60 m 42.04 m Sumimoto Heavy Industries Lloyd’s Register
3. MARATHON 107,181 Jan-03 DH 246.80 m 42.32 m Imabari American Bureau of Shipping
4. PARTHENON 107,018 Jul-03 DH 246.80 m 42.32 m Imabari Det Norske Veritas
5. OPAL QUEEN 107,222 Mar-01 DH 246.80 m 42.32 m Imabari Nipon Kaiji Kyokai
6. VERGINA II 96,709 Apr-91 DH 247.20 m 41.63 m Gdynia American Bureau of Shipping
PRODUCT / CLEAN
AFRAMAX LR
1. PROTEAS 117,055 May-06 DH 1A 249.90 m 44.06 m Hyundai Heavy Industries Bureau Veritas
2. PROMITHEAS 117,055 Aug-06 DH 1A 249.90 m 44.06 m Hyundai Heavy Industries Bureau Veritas
3. PROPONTIS 117,055 Oct-06 DH 1A 250.00 m 44.06 m Hyundai Heavy Industries Bureau Veritas
PANAMAX
1. SELECAO 74,296 Feb-08 DH 228.00 m 32.20 m Sungdong Shipbuilding American Bureau of Shipping
2. SOCRATES 74,327 Mar-08 DH 228.00 m 32.20 m Sungdong Shipbuilding American Bureau of Shipping
3. MAYA 68,439 Jan-03 DH 228.54 m 32.20 m Koyo Dockyard Lloyd’s Register
4. INCA 68,439 Apr-03 DH 228.54 m 32.20 m Koyo Dockyard Lloyd’s Register
5. ANDES 68,439 Sep-03 DH 228.54 m 32.20 m Koyo Dockyard Lloyd’s Register
6. HESNES 68,157 Apr-90 DH 1C 242.80 m 32.20 m Zaliv Bureau Veritas
7. VICTORY III 68,157 Nov-90 DH 1C 242.80 m 32.20 m Zaliv Bureau Veritas

TEN’S FLEET As of March 31, 2008
VESSEL DWT BUILT HULL DESIGN LOA MAX YARD CLASSIFICATION SOCIETY
BREADTH
PRODUCT / CLEAN
HANDYMAX MR
1. AJAX 53,095 Mar-05 DH 1A 186.41 m 32.25 m Hyundai Mipo Dockyard Lloyd’s Register
2. ARIS 53,107 Apr-05 DH 1A 186.41 m 32.25 m Hyundai Mipo Dockyard Lloyd’s Register
3. APOLLON 53,149 May-05 DH 1A 186.41 m 32.25 m Hyundai Mipo Dockyard Lloyd’s Register
4. AFRODITE 53,082 Aug-05 DH 1A 186.41 m 32.25 m Hyundai Mipo Dockyard Lloyd’s Register
5. ARTEMIS 53,039 Aug-05 DH 1A 186.41 m 32.25 m Hyundai Mipo Dockyard Lloyd’s Register
6. ARIADNE 53,021 Nov-05 DH 1A 186.41 m 32.25 m Hyundai Mipo Dockyard Lloyd’s Register
HANDYSIZE MR
1. ANDROMEDA 37,061 Mar-07 DH 1A 182.55 m 27.34 m Hyundai Mipo Dockyard Det Norske Veritas
2. AEGEAS 37,061 Apr-07 DH 1A 182.55 m 27.34 m Hyundai Mipo Dockyard Det Norske Veritas
3. BYZANTION 37,275 May-07 DH 1B 182.55 m 27.34 m Hyundai Mipo Dockyard Det Norske Veritas
4. BOSPOROS 37,275 Aug-07 DH 1B 182.55 m 27.34 m Hyundai Mipo Dockyard Det Norske Veritas
5. ANTARES 37,061 May-06 DH 1A 182.55 m 27.34 m Hyundai Mipo Dockyard Det Norske Veritas
6. ARION 37,061 Oct-06 DH 1A 182.55 m 27.34 m Hyundai Mipo Dockyard Det Norske Veritas
7. DIDIMON 37,432 Jan-05 DH 175.97 m 31.00 m Hyundai Mipo Dockyard Lloyd’s Register
8. DELPHI 37,432 Sep-04 DH 175.97 m 31.00 m Hyundai Mipo Dockyard Lloyd’s Register
LNG
1. NEO ENERGY 85,602 Feb-07 DH 288.00 m 44.20 m Hyundai Heavy Industries Lloyd’s Register
TEN’S FLEET UNDER CONSTRUCTION As of March 31, 2008
VESSEL DWT BUILT HULL DESIGN LOA MAX YARD CLASSIFICATION SOCIETY
BREADTH
CRUDE OIL
AFRAMAX
1. Hull S-1342 105,000 Oct-08 DH DNA 228.60 m 42.00 m Sumimoto Heavy Industries Lloyd’s Register
2. Hull S-1344 105,000 Nov-08 DH DNA 228.60 m 42.00 m Sumimoto Heavy Industries Lloyd’s Register
3. Hull S-1349 105,000 3Q-2009 DH DNA 228.60 m 42.00 m Sumimoto Heavy Industries Lloyd’s Register
4. Hull S-1350 105,000 4Q-2009 DH DNA 228.60 m 42.00 m Sumimoto Heavy Industries Lloyd’s Register
5. Hull S-1356 105,000 4Q-2009 DH DNA 228.60 m 42.00 m Sumimoto Heavy Industries Lloyd’s Register
6. Hull S-1360 105,000 1Q-2010 DH DNA 228.60 m 42.00 m Sumimoto Heavy Industries Lloyd’s Register
DH: Double Hull DNA: Design New Aframax 1A,1B,1C denotes vessel’s ice class distinction
ANNUAL REPORT AND ACCOUNTS 2007 44 .. 45
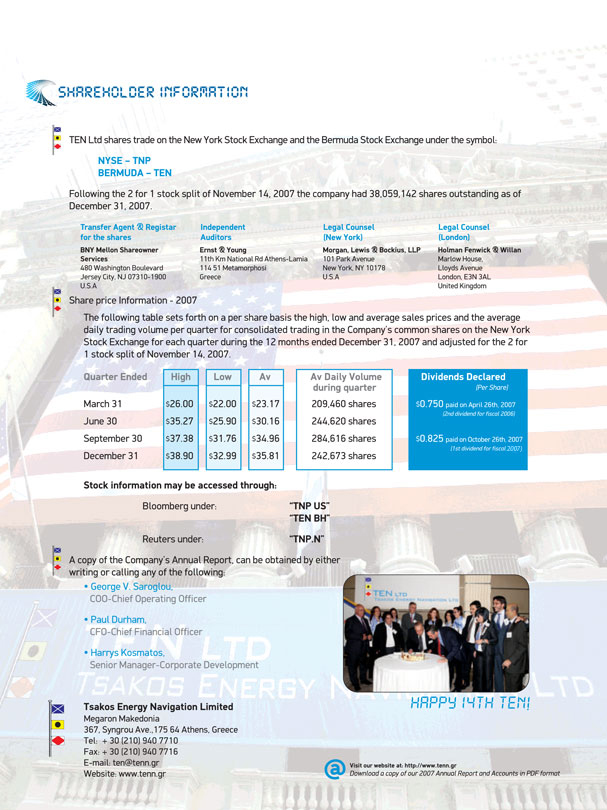
SHAREHOLDER INFORMATION
TEN Ltd shares trade on the New York Stock Exchange and the Bermuda Stock Exchange under the symbol:
NYSE – TNP
BERMUDA – TEN
Following the 2 for 1 stock split of November 14, 2007 the company had 38,059,142 shares outstanding as of December 31, 2007.
Transfer Agent & Registrar for the shares BNY Mellon Shareowner Services 480 Washington Boulevard Jersey City, NJ 07310-1900 U.S.A
Independent Auditors Ernst & Young 11th Km National Rd Athens-Lamia 11451 Metamorphosi Greece
Legal Counsel (New York) Morgan, Lewis & Bockius, LLP 101 Park Avenue New York, NY 10178 U.S.A
Legal Counsel (London) Holman Fenwick & Willan Marlow House, Lloyds Avenue London, E3N 3AL United Kingdom
Share price Information – 2007
The following table sets forth on a per share basis the high, low and average sales prices and the average daily trading volume per quarter for consolidated trading in the Company’s common shares on the New York Stock Exchange for each quarter during the 12 months ended December 31, 2007 and adjusted for the 2 for 1 stock split of November 14, 2007.
Quarter Ended High Low Av Av Daily Volume during quarter Dividends Declared (Per Share)
March 31 $26.00 $22.00 $23.17 209,460 shares $0.750 paid on April 26th, 2007 (2nd dividend for fiscal 2006)
June 30 $35.27 $25.90 $30.16 244,620 shares
September 30 $37.38 $31.76 $34.96 284,616 shares $0.825 paid on October 26th, 2007 (1st dividend for fiscal 2007)
December 31 $38.90 $32.99 $35.81 242,673 shares
Stock information may be accessed through:
Bloomberg under: “TNP US” “TENB H”
Reuters under: “TNP.N”
A copy of the Company’s Annual Report, can be obtained by either writing or calling any of the following:
George V. Saroglou, COO-Chief Operating Officer
Paul Durham, CFO-Chief Financial Officer
Harrys Kosmatos, Senior Manager-Corporate Development
HAPPY 14TH TEN!
Tsakos Energy Navigation Limited
Megaron Makedonia
367, Syngrou Ave.,175 64 Athens, Greece
Tel: + 30 (210) 940 7710
Fax: + 30 (210) 940 7716
E-mail: ten@tenn.gr
Website: www.tenn.gr
Visit our website at: http://www.tenn.gr
Download a copy of our 2007 Annual Report and Accounts in PDF format