UNITED STATES
SECURITIES AND EXCHANGE COMMISSION
Washington, D.C. 20549
FORM 10-K/A
(Amendment No. 1)
(Mark One) | |
x | ANNUAL REPORT PURSUANT TO SECTION 13 OR 15(d) OF THE SECURITIES EXCHANGE ACT OF 1934 |
For the fiscal year ended February 3, 2018
or
o | TRANSITION REPORT PURSUANT TO SECTION 13 OR 15(d) OF THE SECURITIES EXCHANGE ACT OF 1934 For the transition period from ______________ to ________________ |
Commission File Number: 001-15274

J. C. PENNEY COMPANY, INC. | ||||||
(Exact name of registrant as specified in its charter) | ||||||
Delaware | 26-0037077 | |||||
(State or other jurisdiction of incorporation or organization) | (I.R.S. Employer Identification No.) | |||||
6501 Legacy Drive, Plano, Texas 75024-3698 | ||||||
(Address of principal executive offices) | ||||||
(Zip Code) | ||||||
(972) 431-1000 | ||||||
(Registrant's telephone number, including area code) | ||||||
Securities registered pursuant to Section 12(b) of the Act: | ||||||
Title of each class | Name of each exchange on which registered | |||||
Common Stock of 50 cents par value | New York Stock Exchange | |||||
Preferred Stock Purchase Rights | New York Stock Exchange | |||||
Securities registered pursuant to Section 12(g) of the Act: | ||||||
None | ||||||
(Title of class) | ||||||
Indicate by check mark if the registrant is a well-known seasoned issuer, as defined in Rule 405 of the Securities Act. Yes x No o
Indicate by check mark if the registrant is not required to file reports pursuant to Section 13 or 15(d) of the Act. Yes o No x
Indicate by check mark whether the registrant (1) has filed all reports required to be filed by Section 13 or 15(d) of the Securities Exchange Act of 1934 during the preceding 12 months (or for such shorter period that the registrant was required to file such reports), and (2) has been subject to such filing requirements for the past 90 days. Yes x No o
Indicate by check mark whether the registrant has submitted electronically and posted on its corporate Website, if any, every Interactive Data File required to be submitted and posted pursuant to Rule 405 of Regulation S-T (§ 232.405 of this chapter) during the preceding 12 months (or for such shorter period that the registrant was required to submit and post such files). Yes x No o
Indicate by check mark if disclosure of delinquent filers pursuant to Item 405 of Regulation S-K (§ 229.405 of this chapter) is not contained herein, and will not be contained, to the best of registrant’s knowledge, in definitive proxy or information statements incorporated by reference in Part III of this Form 10-K or any amendment to this Form 10-K. x
Indicate by check mark whether the registrant is a large accelerated filer, an accelerated filer, a non-accelerated filer, a smaller reporting company, or emerging growth company. See the definitions of “large accelerated filer,” “accelerated filer,” “smaller reporting company,” and “emerging growth company” in Rule 12b-2 of the Exchange Act.
Large accelerated filer x | Accelerated filer o |
Non-accelerated filer o (Do not check if a smaller reporting company) | Smaller reporting company o |
Emerging growth company o | |
If an emerging growth company, indicate by check mark if the registrant has elected not to use the extended transition period for complying with any new or revised financial accounting standards provided pursuant to Section 13(a) of the Exchange Act. o
Indicate by check mark whether the registrant is a shell company (as defined in Rule 12b-2 of the Exchange Act). Yes o No x
State the aggregate market value of the voting and non-voting common equity held by non-affiliates computed by reference to the price at which the common equity was last sold, or the average bid and asked price of such common equity, as of the last business day of the registrant’s most recently completed second fiscal quarter (July 29, 2017). $1,716,555,230
Indicate the number of shares outstanding of each of the registrant's classes of common stock, as of the latest practicable date.
312,215,072 shares of Common Stock of 50 cents par value, as of March 16, 2018.
DOCUMENTS INCORPORATED BY REFERENCE | ||
Documents from which portions are incorporated by reference | Parts of the Form 10-K into which incorporated | |
J. C. Penney Company, Inc. 2018 Proxy Statement | Part III | |
Explanatory Note
This Amendment No. 1 to Annual Report on Form 10-K/A (“Amendment No. 1”) is being filed by J. C. Penney Company, Inc. (the “Company”) to amend the Company’s Annual Report on Form 10-K for the fiscal year ended February 3, 2018 filed with the Securities and Exchange Commission on March 19, 2018 (the “Original 10-K”).
This Amendment No. 1 is being filed at the request of KPMG LLP (“KPMG”) solely to provide a corrected version of KPMG’s report contained in Part II, Item 8 of the Original 10-K to include a paragraph that was inadvertently omitted from such report that confirms that KPMG, the Company’s independent registered accounting firm, audited the Company’s internal control over financial reporting for the fiscal year ended February 3, 2018. This change does not in any way change the conclusions expressed by KPMG in the original report included in the Original 10-K. This change also does not in any way change any other disclosure included in Part II, Item 8 of the Original 10-K, including, but not limited to, the Consolidated Financial Statements and notes thereto of the Company included in the Original 10-K.
In addition, the exhibit list included in Part IV, Item 15 of the Original 10-K has been amended to contain currently-dated certifications from the Company's Principal Executive Officer and Principal Financial Officer, as required by Rule 12b-15 under the Securities Exchange Act of 1934, as amended, as well as a currently-dated consent of KPMG.
For ease of reference, this Amendment No. 1 restates the Original 10-K in its entirety, making only the amendments described above. Except as described above, this Amendment No. 1 does not otherwise amend, update or change any other information or disclosure contained in the Original 10-K. This Amendment No. 1 speaks only as of the date of the Original 10-K and does not reflect any events that may have occurred subsequent to the date of the Original 10-K.
INDEX
Page | ||
2
PART I
Item 1. Business
Business Overview
J. C. Penney Company, Inc. is a holding company whose principal operating subsidiary is J. C. Penney Corporation, Inc. (JCP). JCP was incorporated in Delaware in 1924, and J. C. Penney Company, Inc. was incorporated in Delaware in 2002, when the holding company structure was implemented. The new holding company assumed the name J. C. Penney Company, Inc. (Company). The holding company has no independent assets or operations, and no direct subsidiaries other than JCP. Common stock of the Company is publicly traded under the symbol “JCP” on the New York Stock Exchange. The Company is a co-obligor (or guarantor, as appropriate) regarding the payment of principal and interest on JCP’s outstanding debt securities. The guarantee by the Company of certain of JCP’s outstanding debt securities is full and unconditional. The holding company and its consolidated subsidiaries, including JCP, are collectively referred to in this Annual Report on Form 10-K as “we,” “us,” “our,” “ourselves,” “Company” or “JCPenney.”
Since our founding by James Cash Penney in 1902, we have grown to be a major retailer, operating 872 department stores in 49 states and Puerto Rico as of February 3, 2018. Our fiscal year ends on the Saturday closest to January 31. Unless otherwise stated, references to years in this report relate to fiscal years, rather than to calendar years. Fiscal year 2017 ended on February 3, 2018; fiscal year 2016 ended on January 28, 2017; and fiscal year 2015 ended on January 30, 2016. Fiscal year 2017 consisted of 53 weeks and fiscal years 2016 and 2015 consisted of 52 weeks.
Our business consists of selling merchandise and services to consumers through our department stores and our website at jcpenney.com, which utilizes fully optimized applications for desktop, mobile and tablet devices. Our department stores and website generally serve the same type of customers, our website offers virtually the same mix of merchandise as our store assortment plus other extended categories that are not offered in store, and our department stores generally accept returns from sales made in stores and via our website. We fulfill online customer purchases by direct shipment to the customer from our distribution facilities and stores or from our suppliers' warehouses and by in store customer pick up. We primarily sell family apparel and footwear, accessories, fine and fashion jewelry, beauty products through Sephora inside JCPenney, home furnishings and large appliances. In addition, our department stores provide our customers with services such as styling salon, optical, portrait photography, custom decorating and home services.
Based on how we categorized our divisions in 2017, our merchandise mix of total net sales over the last three years was as follows:
2017 | 2016 | 2015 | |||||||
Women’s apparel | 22 | % | 23 | % | 25 | % | |||
Men’s apparel and accessories | 21 | % | 22 | % | 22 | % | |||
Home | 15 | % | 13 | % | 12 | % | |||
Women’s accessories, including Sephora | 13 | % | 13 | % | 12 | % | |||
Children’s apparel | 9 | % | 10 | % | 10 | % | |||
Footwear and handbags | 8 | % | 8 | % | 8 | % | |||
Jewelry | 6 | % | 6 | % | 6 | % | |||
Services and other | 6 | % | 5 | % | 5 | % | |||
100 | % | 100 | % | 100 | % | ||||
Operating Strategy
We have developed a strategic framework that focuses on the following three pillars:
•Private brands;
•Omnichannel; and
•Revenue per customer.
We believe these three pillars provide the foundation to increase loyalty with our customers and enable the organization to simplify its focus by ensuring that resources and capital investments are effectively allocated to drive these priorities.
3
Our first priority is private brands. To differentiate us with the consumer, we plan to leverage our sourcing and private brand infrastructure to increase our production of private brands with style, quality and value. With an established global network of sourcing offices, along with a team of in-house designers, we plan to grow private brand penetration to enhance our profitability.
Our second priority is to become a world-class omnichannel retailer. We have a rich heritage of being a catalog retailer and have much of our omnichannel infrastructure already in place. We are digitally connected with our customers via a mobile app and the Internet and have three large, strategically located dot-com distribution centers with approximately five million square feet of space for providing expanded assortment and order fulfillment. Additionally, our objective is to create a seamless connection between our digital and brick-and-mortar operations through initiatives such as a mobile app that is designed to be deeply integrated with the store experience and buy-online-pick-up-in-store (BOPIS).
Our final strategic priority is increasing revenue per customer. Within our new brand platform of "Style and value for all," it is our mission to help our customer find what she loves for less time, money and effort. To accomplish this mission, we see an increased opportunity to grow shopping frequency and the amount that customers spend on every transaction. We plan to address this opportunity by enhancing our cross-merchandising appeal with initiatives to continue the roll out of our Sephora inside JCPenney locations and to further promote our appliance and home merchandise categories.
Competition and Seasonality
The business of selling merchandise and services is highly competitive. We are one of the largest department store and e-commerce retailers in the United States, and we have numerous competitors, as further described in Item 1A, Risk Factors. Many factors enter into the competition for the consumer’s patronage, including merchandise assortment, advertising, price, quality, service, location, shipping times and cost, online and mobile user experience, reputation, credit availability, customer loyalty, availability of in-store services such as styling salon, optical, portrait photography and custom decorating, and the ability to offer personalized customer experiences. Our annual earnings depend to a great extent on the results of operations for the last quarter of the fiscal year, which includes the holiday season, when a significant portion of our sales and profits are recorded.
Trademarks
The JCPenney®, JCP®, Liz Claiborne®, Claiborne®, Okie Dokie®, Worthington®, a.n.a®, St. John’s Bay®, The Original Arizona Jean Company®, Ambrielle®, Decree®, Stafford®, J. Ferrar®, Xersion®, Belle + Sky®, Total Girl®, monet®, JCPenney Home®, Studio JCP Home™, Home Collection by JCPenney™, Made for Life™, The Boutique Plus™, Sleep Chic®, Home Expressions® and Cooks JCPenney Home® trademarks, as well as certain other trademarks, have been registered, or are the subject of pending trademark applications with the United States Patent and Trademark Office and with the registries of many foreign countries and/or are protected by common law. We consider our marks and the accompanying name recognition to be valuable to our business.
Website Availability
We maintain an Internet website at www.jcpenney.com and make available free of charge through this website our annual reports on Form 10-K, quarterly reports on Form 10-Q, current reports on Form 8-K and all related amendments to those reports, as soon as reasonably practicable after the materials are electronically filed with or furnished to the Securities and Exchange Commission. In addition, our website provides press releases, access to webcasts of management presentations and other materials useful in evaluating our Company.
Suppliers
We have a diversified supplier base, both domestic and foreign, and are not dependent to any significant degree on any single supplier. We purchase our merchandise from approximately 3,100 domestic and foreign suppliers, many of whom have done business with us for many years. In addition to our Plano, Texas home office, we, through our purchasing subsidiary, maintained buying and quality assurance offices in 9 foreign countries as of February 3, 2018.
4
Employment
The Company and its consolidated subsidiaries employed approximately 98,000 full-time and part-time employees as of February 3, 2018.
Environmental Matters
Environmental protection requirements did not have a material effect upon our operations during 2017. It is possible that compliance with such requirements (including any new requirements) would lengthen lead time in expansion or renovation plans and increase construction costs, and therefore operating costs, due in part to the expense and time required to conduct environmental and ecological studies and any required remediation.
As of February 3, 2018, we estimated our total potential environmental liabilities to be $20 million and recorded our estimate in Other accounts payable and accrued expenses and Other liabilities in the Consolidated Balance Sheet as of that date. This estimate covered potential liabilities primarily related to underground storage tanks, remediation of environmental conditions involving our former drugstore locations and asbestos removal in connection with approved plans to renovate or dispose of our facilities. We continue to assess required remediation and the adequacy of environmental reserves as new information becomes available and known conditions are further delineated. If we were to incur losses at the estimated amount, we do not believe that such losses would have a material effect on our financial condition, results of operations or liquidity.
Executive Officers of the Registrant
The following is a list, as of March 16, 2018, of the names and ages of the executive officers of J. C. Penney Company, Inc. and of the offices and other positions held by each such person with the Company. These officers hold identical positions with JCP. There is no family relationship between any of the named persons.
Name | Offices and Other Positions Held With the Company | Age | ||
Marvin R. Ellison | Chairman of the Board and Chief Executive Officer | 53 | ||
Jeffrey A. Davis | Executive Vice President and Chief Financial Officer | 55 | ||
Brynn L. Evanson | Executive Vice President, Human Resources | 48 | ||
Marci Grebstein | Executive Vice President, Chief Marketing Officer | 54 | ||
Joseph M. McFarland | Executive Vice President and Chief Customer Officer | 48 | ||
Therace M. Risch | Executive Vice President and Chief Information/Digital Officer | 45 | ||
Michael Robbins | Executive Vice President, Supply Chain | 52 | ||
Andrew S. Drexler | Senior Vice President, Chief Accounting Officer and Controller | 47 | ||
Brandy L. Treadway | Senior Vice President, General Counsel | 43 | ||
Mr. Ellison has served as Chairman of the Board since 2016, Chief Executive Officer since 2015, and as a director of the Company and a director of JCP since 2014. He previously served as President of the Company from 2014 to 2015. Prior to joining the Company, he served as Executive Vice President - U.S. Stores of The Home Depot, Inc. (home improvement supplies retailer) from 2008 to 2014. His prior roles with The Home Depot, Inc. included President - Northern Division from 2006 to 2008, Senior Vice President - Logistics from 2005 to 2006, Vice President - Logistics from 2004 to 2005, and Vice President - Loss Prevention from 2002 to 2004. Mr. Ellison began his career with Target Corporation (retailer) where he served in a variety of operational roles. Mr. Ellison currently serves as a director of FedEx Corporation (courier delivery services), the Retail Industry Leaders Association and the National Retail Federation.
Mr. Davis has served as Executive Vice President and Chief Financial Officer, and as a director of JCP, since July 2017. Prior to joining the Company, he served as Senior Vice President and Chief Financial Officer at Darden Restaurants, Inc. (food service industry) from 2015 to 2016. Mr. Davis also served as Executive Vice President and Chief Financial Officer for the Walmart U.S. segment at Walmart Inc. (retailer) from 2014 to 2015. His prior roles with Walmart Inc. included Treasurer from 2010 to 2014, Senior Vice President, Finance and Strategy for the Walmart U.S. segment from 2009 to 2010, and Vice President, Finance, US Stores Operations/Specialty Division from 2006 to 2009.
Ms. Evanson has served as Executive Vice President, Human Resources since 2013, and as a director of JCP since 2017. She previously served as Vice President, Compensation, Benefits and Talent Operations from 2010 to 2013 and Director of Compensation from 2009 to 2010. Prior to joining the Company, she worked at the Dayton Hudson Corporation (retailer) from
5
1991 to 2009 (renamed Target Corporation in 2000). Ms. Evanson began her career with Marshall Field’s (department store retailer) where she advanced through positions in stores, finance, human resources and merchandising and moved to the Target stores division in 2000, ultimately serving as Director of Executive Compensation and Retirement Plans.
Ms. Grebstein has served as Executive Vice President, Chief Marketing Officer since June 2017. Prior to joining the Company, she served as Chief Marketing Officer of Lowe's Companies, Inc. (home improvement supplies retailer) from 2015 to 2017. Ms. Grebstein also served as Vice President, Advertising of Lowe's Companies, Inc. from June 2015 to November 2015. Prior to that, she served as Vice President, Marketing and Brand Strategy of Food Lion, LLC (grocery retailer) from 2012 to 2015 and in positions of increasing responsibility with Staples, Inc. (office supply retailer) from 1996 to 2012, including Vice President, Business-to-Business Marketing and eCommerce from 2006 to 2012 and Vice President, Media and Consumer Marketing from 1998 to 2006. From 1992 to 1996, Ms. Grebstein served in positions of increasing responsibility with CVS Health Corporation (retail pharmacy and healthcare), including Director of Advertising and Broadcast Advertising Manager.
Mr. McFarland has served as Executive Vice President and Chief Customer Officer since March 2018. Prior to that, he served as Executive Vice President, Stores from 2016 to March 2018. From 2007 to 2015, Mr. McFarland served as President, Northern and Western Divisions of The Home Depot, Inc. (home improvement supplies retailer), with which he served in positions of increasing responsibility since 1993. Prior to The Home Depot, he spent six years serving in the United States Marine Corps and is a veteran of Operation Desert Storm.
Ms. Risch has served as Executive Vice President and Chief Information/Digital Officer since March 2018. Prior to that, she served as Executive Vice President and Chief Information Officer from 2015 to March 2018. Prior to joining the Company, Ms. Risch served as Executive Vice President and Chief Information Officer of Country Financial (insurance and investment services) from 2014 to 2015. Prior to that, she spent 10 years at Target Corporation (retailer) in a variety of technology roles of increasing responsibility, including Vice President of Technology Delivery Services from 2012 to 2014 and Vice President, Business Technology Team from 2009 to 2012.
Mr. Robbins has served as Executive Vice President, Supply Chain since 2016. Prior to that, he served as Senior Vice President, Supply Chain from 2015 to 2016. From 2012 to 2015, Mr. Robbins served as Senior Vice President, Global Supply Chain at Target Corporation (retailer), with which he served in positions of increasing responsibility since 2001, including Senior Vice President of Distribution Operations from 2010 to 2012, Vice President of Pharmacy from 2008 to 2010 and Regional Vice President of West Coast Distribution from 2006 to 2008.
Mr. Drexler has served as Senior Vice President, Chief Accounting Officer and Controller since 2015. Prior to joining the Company, he served as Senior Vice President and Chief Financial Officer of Giant Eagle, Inc. (grocery retailer) from 2014 to 2015. He also served as Senior Vice President, Finance, and Corporate Controller for GNC Holdings, Inc. (health and nutrition retailer) from 2011 to 2014. Prior to that, Mr. Drexler spent 11 years at Walmart Inc. in roles of increasing responsibility, including Vice President of Finance for the information systems division from 2010 to 2011. Earlier in his career, he held a variety of roles with PricewaterhouseCoopers, LLP (accounting firm). Mr. Drexler is a certified public accountant.
Ms. Treadway has served as Senior Vice President, General Counsel since August 2017. She previously served as Vice President, interim General Counsel from June 2017 to August 2017, Vice President, Associate General Counsel from 2016 to June 2017, Assistant General Counsel from 2014 to 2016, Senior Managing Counsel from 2012 to 2014, and Senior Counsel from 2011 to 2012. Prior to joining the Company, Ms. Treadway was an associate at Weil, Gotshal & Manges, LLP (law firm) from 2002 to 2011.
Item 1A. Risk Factors
The following risk factors should be read carefully in connection with evaluating our business and the forward-looking information contained in this Annual Report on Form 10-K. Any of the following risks could materially adversely affect our business, operating results, financial condition and the actual outcome of matters as to which forward-looking statements are made in this Annual Report on Form 10-K.
Our ability to sustain profitable growth is subject to both the risks affecting our business generally and the inherent difficulties associated with implementing our strategic plan.
As we position the Company for long-term growth, it may take longer than expected to achieve our objectives, and actual results may be materially less than planned. Our ability to improve our operating results depends upon a significant number of factors, some of which are beyond our control, including:
6
• | customer response to our marketing and merchandise strategies; |
• | our ability to achieve profitable sales and to make adjustments in response to changing conditions; |
• | our ability to respond to competitive pressures in our industry; |
• | our ability to effectively manage inventory; |
• | the success of our omnichannel strategy; |
• | our ability to gather accurate and relevant data and effectively utilize that data in our strategic planning and decision making; |
• | our ability to benefit from capital improvements made to our store environment; |
• | our ability to respond to any unanticipated changes in expected cash flows, liquidity and cash needs, including our ability to obtain any additional financing or other liquidity enhancing transactions, if and when needed; |
• | our ability to achieve positive cash flow; |
• | our ability to access an adequate and uninterrupted supply of merchandise from suppliers at expected levels and on acceptable terms; |
• | changes to the regulatory environment in which our business operates; and |
• | general economic conditions. |
There is no assurance that our marketing, merchandising and omnichannel strategies, or any future adjustments to our strategies, will improve our operating results.
We operate in a highly competitive industry, which could adversely impact our sales and profitability.
The retail industry is highly competitive, with few barriers to entry. We compete with many other local, regional and national retailers for customers, employees, locations, merchandise, services and other important aspects of our business. Those competitors include other department stores, discounters, home furnishing stores, large appliance retailers, specialty retailers, wholesale clubs, direct-to-consumer businesses, including those on the Internet, providers of home improvement services and other forms of retail commerce. Some competitors are larger than JCPenney, and/or have greater financial resources available to them, and, as a result, may be able to devote greater resources to sourcing, promoting, selling their products, updating their store environment and updating their technology. Competition is characterized by many factors, including merchandise assortment, advertising, price, quality, service, location, reputation, shipping times and cost, online and mobile user experience, credit availability, customer loyalty, availability of in-store services, such as styling salon, optical, portrait photography and custom decorating, and the ability to offer personalized customer experiences. We have experienced, and anticipate that we will continue to experience for at least the foreseeable future, significant competition from our competitors. The performance of competitors as well as changes in their pricing and promotional policies, marketing activities, customer loyalty programs, availability of in-store services, new store openings, store renovations, launches of Internet websites or mobile platforms, brand launches and other merchandise and operational strategies could cause us to have lower sales, lower merchandise margin and/or higher operating expenses such as marketing costs and other selling, general and administrative expenses, which in turn could have an adverse impact on our profitability.
Our sales and operating results depend on our ability to develop merchandise offerings that resonate with our existing customers and help to attract new customers.
Our sales and operating results depend in part on our ability to predict and respond to changes in fashion trends and customer preferences in a timely manner by consistently offering stylish, quality merchandise assortments at competitive prices. We continuously assess emerging styles and trends and focus on developing a merchandise assortment to meet customer preferences. There is no assurance that these efforts will be successful or that we will be able to satisfy constantly changing customer demands. To the extent our decisions regarding our merchandise differ from our customers’ preferences, we may be
7
faced with reduced sales and excess inventories for some products and/or missed opportunities for others. Any sustained failure to identify and respond to emerging trends in lifestyle and customer preferences and buying trends could have an adverse impact on our business. In addition, merchandise misjudgments may adversely impact the perception or reputation of our Company, which could result in declines in customer loyalty and vendor relationship issues, and ultimately have a material adverse effect on our business, financial condition and results of operations.
We may also seek to expand into new lines of business from time to time, such as offering large appliances for sale and offering home improvement products and installation services through third-parties. There is no assurance that these efforts will be successful. As we devote time and resources to new lines of business, management’s attention and resources may be diverted from existing business activities. Further, if new lines of business are not as successful as we planned, then we risk damaging our overall business results. In addition, we may seek to expand our merchandise offerings into new product categories. Moving into new lines of business and expanding our merchandise offerings may carry new or additional risks beyond those typically associated with our traditional apparel and home furnishings businesses, including potential reputational harm resulting from actions by unaffiliated third-parties that we may use to assist us in providing goods or services. We may not be able to develop new lines of business in a manner that improves our operating results or address or mitigate the risks associated with new product categories and new lines of business, and may therefore be forced to close the new lines of business or reduce our expanded merchandise offerings, which may damage our reputation and negatively impact our operating results.
Our results may be negatively impacted if customers do not maintain their favorable perception of our Company and our private brand merchandise.
Maintaining and continually enhancing the value of our Company and our private brand merchandise is important to the success of our business. The value of our private brands is based in large part on the degree to which customers perceive and react to them. The value of our private brands could diminish significantly due to a number of factors, including customer perception that we have acted in an irresponsible manner in sourcing our private brand merchandise, adverse publicity about our private brand merchandise, our failure to maintain the quality of our private brand products, the failure of our private brand merchandise to deliver consistently good value to the customer, or the failure to protect the image associated with our private brands. The growing use of social and digital media by customers, us, and third parties increases the speed and extent that information or misinformation and opinions can be shared. Negative posts or comments about us, our private brands, or any of our merchandise on social or digital media could seriously damage our reputation. If we do not maintain the favorable perception of our Company and our private brand merchandise or we experience a reduction in the level of private brand sales, our business results could be negatively impacted.
Our ability to increase sales and store productivity is largely dependent upon our ability to increase customer traffic and conversion.
Customer traffic depends upon our ability to successfully market compelling merchandise assortments, present an appealing shopping environment and experience to customers, and attract customers to our stores through omnichannel initiatives such as pickup-in-store programs. Our strategies focus on increasing customer traffic and improving conversion in our stores and online; however, there can be no assurance that our efforts will be successful or will result in increased sales or margins. Further, costs to drive online traffic may be higher than anticipated, which could result in lower margins, and actions to drive online traffic may not deliver anticipated results. In addition, external events outside of our control, including store closings by our competitors, pandemics, terrorist threats, domestic conflicts and civil unrest, may influence customers' decisions to visit malls or might otherwise cause customers to avoid public places. There is no assurance that we will be able to reverse any decline in traffic or that increases in Internet sales will offset any decline in store traffic. We may need to respond to any declines in customer traffic or conversion rates by increasing markdowns or promotions to attract customers, which could adversely impact our operating results and cash flows from operating activities. In addition, the challenge of declining store traffic along with the growth of digital shopping channels and its diversion of sales from brick-and-mortar stores could lead to store closures and/or asset impairment charges, which could adversely impact our operating results, financial position and cash flows.
If we are unable to manage our inventory effectively, our merchandise margins could be adversely affected.
Our profitability depends upon our ability to manage appropriate inventory levels and respond quickly to shifts in consumer demand patterns. We must properly execute our inventory management strategies by appropriately allocating merchandise among our stores and online, timely and efficiently distributing inventory to stores, maintaining an appropriate mix and level of inventory in stores and online, adjusting our merchandise mix between our private and exclusive brands and national brands, appropriately changing the allocation of floor space of stores among product categories to respond to customer demand and
8
effectively managing pricing and markdowns. If we overestimate customer demand for our merchandise, we will likely need to record inventory markdowns and sell the excess inventory at clearance prices which would negatively impact our merchandise margins and operating results. If we underestimate customer demand for our merchandise, we may experience inventory shortages which may result in missed sales opportunities and have a negative impact on customer loyalty. In addition, although we have various processes and systems to help protect against loss or theft of our inventory, higher than expected levels of lost or stolen inventory (called “shrinkage”) could result in write-offs and lost sales, which could adversely impact our profitability.
We must protect against security breaches or other unauthorized disclosures of confidential data about our customers as well as about our employees and other third parties.
As part of our normal operations, we and third-party service providers with whom we contract receive and maintain information about our customers (including credit/debit card information), our employees and other third parties. Confidential data must at all times be protected against security breaches or other unauthorized disclosure. We have, and require our third-party service providers to have, administrative, physical and technical safeguards and procedures in place to protect the security, confidentiality, integrity and availability of such information and to protect such information against unauthorized access, disclosure or acquisition. Despite our safeguards and security processes and procedures, there is no assurance that all of our systems and processes, or those of our third-party service providers, are free from vulnerability to security breaches, inadvertent data disclosure or acquisition by third parties. Further, because the methods used to obtain unauthorized access change frequently and may not be immediately detected, we may be unable to anticipate these methods or promptly implement safeguards. Any failure to protect confidential data about our business or our customers, employees or other third parties could materially damage our brand and reputation as well as result in significant expenses and disruptions to our operations, and loss of customer confidence, any of which could have a material adverse impact on our business and results of operations. We could also be subject to government enforcement actions and private litigation as a result of any such failure.
The failure to retain, attract and motivate our employees, including employees in key positions, could have an adverse impact on our results of operations.
Our results depend on the contributions of our employees, including our senior management team and other key employees. This depends to a great extent on our ability to retain, attract and motivate talented employees throughout the organization, many of whom, particularly in the stores, are in entry level or part-time positions, which have historically had high rates of turnover. We currently operate with significantly fewer individuals than we have in the past who have assumed additional duties and responsibilities, which could have an adverse impact on our operating performance and efficiency. Negative media reports regarding the Company or the retail industry in general, as well as uncertainty due to announced store closings, could also have an adverse impact on our ability to attract, retain and motivate our employees. If we are unable to retain, attract and motivate talented employees with the appropriate skill sets, we may not achieve our objectives and our results of operations could be adversely impacted. Our ability to meet our changing labor needs while controlling our costs is also subject to external factors such as unemployment levels, competing wages, potential union organizing efforts and government regulation. An inability to provide wages and/or benefits that are competitive within the markets in which we operate could adversely affect our ability to retain and attract employees. In addition, the loss of one or more of our key personnel or the inability to effectively identify a suitable successor to a key role in our senior management could have a material adverse effect on our business.
If we are unable to successfully develop and maintain a relevant and reliable omnichannel experience for our customers, our sales, results of operations and reputation could be adversely affected.
One of the pillars of our strategic framework is to deliver a superior omnichannel shopping experience for our customers through the integration of our store and digital shopping channels. Omnichannel retailing is rapidly evolving and we must anticipate and meet changing customer expectations. Our omnichannel strategies include our ship-from-store and pickup-in-store programs and expansion of our SKU count online. In addition, we continue to explore ways to enhance our customers’ omnichannel shopping experience, including through investments in IT systems, operational changes and developing a more customer-friendly user experience. Our competitors are also investing in omnichannel initiatives, some of which may be more successful than our initiatives. For example, online and other competitors have placed an emphasis on delivery services, with customers increasingly seeking faster, guaranteed delivery times and low-price or free shipping. There is no assurance that we will be able to maintain an ability to be competitive on delivery times and delivery costs, which is dependent on many factors. If the implementation of our omnichannel strategies is not successful or does not meet customer expectations, or we do not realize a return on our omnichannel investments, our reputation and operating results may be adversely affected.
9
Disruptions in our Internet website or mobile applications, or our inability to successfully execute our online strategies, could have an adverse impact on our sales and results of operations.
We sell merchandise over the Internet through our website, www.jcpenney.com, and through mobile applications for smart phones and tablets. Our Internet operations are subject to numerous risks, including rapid technological change and the implementation of new systems and platforms; liability for online and mobile content; violations of state or federal laws, including those relating to online and mobile privacy and intellectual property rights; credit card fraud; problems associated with the operation, security and availability of our website, mobile applications and related support systems; computer malware; telecommunications failures; electronic break-ins and similar disruptions; and the allocation of inventory between our online operations and department stores. The failure of our website or mobile applications to perform as expected could result in disruptions and costs to our operations and make it more difficult for customers to purchase merchandise online. In addition, our inability to successfully develop and maintain the necessary technological interfaces for our customers to purchase merchandise through our website and mobile applications, including user friendly software applications for smart phones and tablets, could result in the loss of Internet sales and have an adverse impact on our results of operations.
Our operations are dependent on information technology systems; disruptions in those systems or increased costs relating to their implementation could have an adverse impact on our results of operations.
Our operations are dependent upon the integrity, security and consistent operation of various systems and data centers, including the point-of-sale systems in the stores, our Internet website and mobile applications, data centers that process transactions, communication systems and various software applications used throughout our Company to track inventory flow, process transactions, generate performance and financial reports and administer payroll and benefit plans.
We have implemented several applications and systems from third party vendors, providers and licensors to simplify our processes and reduce our use of customized existing legacy systems and expect to place additional applications and systems into operation in the future. Any continued reliance on existing legacy systems may result in extended system outages due to the difficulty in recovering those systems as well as inefficiencies in our business workflow due to the complexity and high levels of customization inherent in such systems. Implementing new applications and systems carries substantial risk, including implementation delays, cost overruns, disruption of operations, potential loss of data or information, lower customer satisfaction resulting in lost customers or sales, inability to deliver merchandise to our stores or our customers, the potential inability to meet reporting requirements and unintentional security vulnerabilities. There can be no assurances that we will successfully launch the new applications and systems as planned, that the new applications and systems will perform as expected or that the new applications and systems will be implemented without disruptions to our operations, any of which may cause critical information upon which we rely to be delayed, unreliable, corrupted, insufficient or inaccessible.
We also outsource various information technology functions to third party service providers and may outsource other functions in the future. We rely on those third party service providers to provide services on a timely and effective basis and their failure to perform as expected or as required by contract could result in disruptions and costs to our operations.
Our vendors are also highly dependent on the use of information technology systems. Major disruptions in their information technology systems could result in their inability to communicate with us or otherwise to process our transactions or information, their inability to perform required functions, or in the loss or corruption of our information, any and all of which could result in disruptions to our operations. Our vendors are responsible for having safeguards and procedures in place to protect the confidentiality, integrity and security of our information, and to protect our information and systems against unauthorized access, disclosure or acquisition. Any failure in their systems to operate or in their ability to protect our information or systems could have a material adverse impact on our business and results of operations.
10
We have insourced, and may continue to insource, certain business functions from third party vendors and may seek to relocate certain business functions to international locations in an attempt to achieve additional efficiencies, both of which subject us to risks, including disruptions in our business.
We have recently insourced certain business functions and may also need to continue to insource other aspects of our business in the future in order to effectively manage our costs and stay competitive. We may also seek from time to time to relocate certain business functions to countries other than the United States to access highly skilled labor markets and further control costs. There is no assurance that these efforts will be successful. In addition, future regulatory developments could hinder our ability to fully realize the anticipated benefits of these actions. These actions may also cause disruptions that negatively impact our business. If we are ultimately unable to perform insourced functions better than, or at least as well as, third party providers, or otherwise fully realize the anticipated benefits of these actions, our operating results could be adversely impacted.
Changes in our credit ratings may limit our access to capital markets and adversely affect our liquidity.
The credit rating agencies periodically review our capital structure and the quality and stability of our earnings. Any downgrades to our long-term credit ratings could result in reduced access to the credit and capital markets and higher interest costs on future financings. The future availability of financing will depend on a variety of factors such as economic and market conditions, the availability of credit and our credit ratings, as well as the possibility that lenders could develop a negative perception of us. There is no assurance that we will be able to obtain additional financing on favorable terms or at all.
Our profitability depends on our ability to source merchandise and deliver it to our customers in a timely and cost-effective manner.
Our merchandise is sourced from a wide variety of suppliers, and our business depends on being able to find qualified suppliers and access products in a timely and efficient manner. Inflationary pressures on commodity prices and other input costs could increase our cost of goods, and an inability to pass such cost increases on to our customers or a change in our merchandise mix as a result of such cost increases could have an adverse impact on our profitability. Additionally, the impact of economic conditions on our suppliers cannot be predicted and our suppliers may be unable to access financing or become insolvent and thus become unable to supply us with products. Developments in tax policy, such as the disallowance of tax deductions for imported merchandise, or the imposition of tariffs on imported merchandise, could further have a material adverse effect on our results of operations and liquidity.
Our arrangements with our suppliers and vendors may be impacted by our financial results or financial position.
Substantially all of our merchandise suppliers and vendors sell to us on open account purchase terms. There is a risk that our key suppliers and vendors could respond to any actual or apparent decrease in or any concern with our financial results or liquidity by requiring or conditioning their sale of merchandise to us on more stringent or more costly payment terms, such as by requiring standby letters of credit, earlier or advance payment of invoices, payment upon delivery or other assurances or credit support or by choosing not to sell merchandise to us on a timely basis or at all. Our arrangements with our suppliers and vendors may also be impacted by media reports regarding our financial position. Our need for additional liquidity could significantly increase and our supply of merchandise could be materially disrupted if a significant portion of our key suppliers and vendors took one or more of the actions described above, which could have a material adverse effect on our sales, customer satisfaction, cash flows, liquidity and financial position.
Our senior secured real estate term loan credit facility and senior secured notes are secured by certain of our real property and substantially all of our personal property, and such property may be subject to foreclosure or other remedies in the event of our default. In addition, the real estate term loan credit facility and the indenture governing the senior secured notes contain provisions that could restrict our operations and our ability to obtain additional financing.
We are (i) party to a $1.688 billion senior secured term loan credit facility and (ii) the issuer of $500 million aggregate principal amount of senior secured notes that are secured by mortgages on certain real property of the Company, in addition to liens on substantially all personal property of the Company, subject to certain exclusions set forth in the security documents relating to the term loan credit facility and the senior secured notes. The real property subject to mortgages under the term loan credit facility and the indenture governing the senior secured notes includes our distribution centers and certain of our stores.
The credit and guaranty agreement governing the term loan credit facility and the indenture governing the senior secured notes contain operating restrictions which may impact our future alternatives by limiting, without lender consent, our ability to borrow additional funds, execute certain equity financings or enter into dispositions or other liquidity enhancing or strategic
11
transactions regarding certain of our assets, including our real property. Our ability to obtain additional or other financing or to dispose of certain assets could also be negatively impacted because a substantial portion of our owned assets have been pledged as collateral for repayment of our indebtedness under the term loan credit facility and the senior secured notes.
If an event of default occurs and is continuing, our outstanding obligations under the term loan credit facility and the senior secured notes could be declared immediately due and payable or the lenders could foreclose on or exercise other remedies with respect to the assets securing the term loan credit facility and the senior secured notes, including our distribution centers and certain of our stores. If an event of default occurs, there is no assurance that we would have the cash resources available to repay such accelerated obligations or refinance such indebtedness on commercially reasonable terms, or at all. The occurrence of any one of these events could have a material adverse effect on our business, financial condition, results of operations and liquidity.
Our senior secured asset-based revolving credit facility limits our borrowing capacity to the value of certain of our assets. In addition, our senior secured asset-based revolving credit facility is secured by certain of our personal property, and lenders may exercise remedies against the collateral in the event of our default.
We are party to a $2.35 billion senior secured asset-based revolving credit facility. Our borrowing capacity under our revolving credit facility varies according to the Company’s inventory levels, accounts receivable and credit card receivables, net of certain reserves. In the event of any material decrease in the amount of or appraised value of these assets, our borrowing capacity would similarly decrease, which could adversely impact our business and liquidity.
Our revolving credit facility contains customary affirmative and negative covenants and certain restrictions on operations become applicable if our availability falls below certain thresholds. These covenants could impose significant operating and financial limitations and restrictions on us, including restrictions on our ability to enter into particular transactions and to engage in other actions that we may believe are advisable or necessary for our business.
Our obligations under the revolving credit facility are secured by liens with respect to inventory, accounts receivable, deposit accounts and certain related collateral. In the event of a default that is not cured or waived within any applicable cure periods, the lenders’ commitment to extend further credit under our revolving credit facility could be terminated, our outstanding obligations could become immediately due and payable, outstanding letters of credit may be required to be cash collateralized and remedies may be exercised against the collateral, which generally consists of the Company’s inventory, accounts receivable and deposit accounts and cash credited thereto. If we are unable to borrow under our revolving credit facility, we may not have the necessary cash resources for our operations and, if any event of default occurs, there is no assurance that we would have the cash resources available to repay such accelerated obligations, refinance such indebtedness on commercially reasonable terms, or at all, or cash collateralize our letters of credit, which would have a material adverse effect on our business, financial condition, results of operations and liquidity.
Our level of indebtedness may adversely affect our business and results of operations and may require the use of our available cash resources to meet repayment obligations, which could reduce the cash available for other purposes.
As of February 3, 2018, we have $4.232 billion in total indebtedness and we are highly leveraged. Our level of indebtedness may limit our ability to obtain additional financing, if needed, to fund additional projects, working capital requirements, capital expenditures, debt service, and other general corporate or other obligations, as well as increase the risks to our business associated with general adverse economic and industry conditions. Our level of indebtedness may also place us at a competitive disadvantage to our competitors that are not as highly leveraged. In addition, any future limitations on tax deductions for interest paid on outstanding indebtedness as a result of the Tax Cuts and Jobs Act enacted in December 2017 (the “Tax Act”) could have a material adverse effect on our results of operations and liquidity.
We are required to make quarterly repayments in a principal amount equal to $10.55 million during the seven-year term of the real estate term loan credit facility, subject to certain reductions for mandatory and optional prepayments. In addition, we are required to make prepayments of the real estate term loan credit facility with the proceeds of certain asset sales, insurance proceeds and excess cash flow, which could reduce the cash available for other purposes, including capital expenditures for store improvements, and could impact our ability to reinvest in other areas of our business.
12
There is no assurance that our internal and external sources of liquidity will at all times be sufficient for our cash requirements.
We must have sufficient sources of liquidity to fund our working capital requirements, capital improvement plans, service our outstanding indebtedness and finance investment opportunities. The principal sources of our liquidity are funds generated from operating activities, available cash and cash equivalents, borrowings under our credit facilities, other debt financings, equity financings and sales of non-operating assets. We expect our ability to generate cash through the sale of non-operating assets to diminish as our portfolio of non-operating assets decreases. In addition, our recent operating losses have limited our capital resources. Our ability to achieve our business and cash flow plans is based on a number of assumptions which involve significant judgments and estimates of future performance, borrowing capacity and credit availability, which cannot at all times be assured. Accordingly, there is no assurance that cash flows from operations and other internal and external sources of liquidity will at all times be sufficient for our cash requirements. If necessary, we may need to consider actions and steps to improve our cash position and mitigate any potential liquidity shortfall, such as modifying our business plan, pursuing additional financing to the extent available, reducing capital expenditures, pursuing and evaluating other alternatives and opportunities to obtain additional sources of liquidity and other potential actions to reduce costs. There can be no assurance that any of these actions would be successful, sufficient or available on favorable terms. Any inability to generate or obtain sufficient levels of liquidity to meet our cash requirements at the level and times needed could have a material adverse impact on our business and financial position.
Our ability to obtain any additional financing or any refinancing of our debt, if needed at any time, depends upon many factors, including our existing level of indebtedness and restrictions in our debt facilities, historical business performance, financial projections, prospects and creditworthiness and external economic conditions and general liquidity in the credit and capital markets. Any additional debt, equity or equity-linked financing may require modification of our existing debt agreements, which there is no assurance would be obtainable. Any additional financing or refinancing could also be extended only at higher costs and require us to satisfy more restrictive covenants, which could further limit or restrict our business and results of operations, or be dilutive to our stockholders.
Our use of interest rate hedging transactions could expose us to risks and financial losses that may adversely affect our financial condition, liquidity and results of operations.
To reduce our exposure to interest rate fluctuations, we have entered into, and in the future may enter into, interest rate swaps with various financial counterparties. The interest rate swap agreements effectively convert a portion of our variable rate interest payments to a fixed price. There can be no assurances, however, that our hedging activity will be effective in insulating us from the risks associated with changes in interest rates. In addition, our hedging transactions may expose us to certain risks and financial losses, including, among other things:
• | counterparty credit risk; |
• | the risk that the duration or amount of the hedge may not match the duration or amount of the related liability; |
• | the hedging transactions may be adjusted from time to time in accordance with accounting rules to reflect changes in fair values, downward adjustments or “mark-to-market losses,” which would affect our stockholders’ equity; and |
• | the risk that we may not be able to meet the terms and conditions of the hedging instruments, in which case we may be required to settle the instruments prior to maturity with cash payments that could significantly affect our liquidity. |
Further, we have designated the swaps as cash flow hedges in accordance with Accounting Standards Codification Topic 815, Derivatives and Hedging. However, in the future, we may fail to qualify for hedge accounting treatment under these standards for a number of reasons, including if we fail to satisfy hedge documentation and hedge effectiveness assessment requirements or if the swaps are not highly effective. If we fail to qualify for hedge accounting treatment, losses on the swaps caused by the change in their fair value will be recognized as part of net income, rather than being recognized as part of other comprehensive income.
Operating results and cash flows may cause us to incur asset impairment charges.
Long-lived assets, primarily property and equipment, are reviewed at the store level at least annually for impairment, or whenever changes in circumstances indicate that a full recovery of net asset values through future cash flows is in question. We also assess the recoverability of indefinite-lived intangible assets at least annually or whenever events or changes in
13
circumstances indicate that the carrying amount may not be fully recoverable. Our impairment review requires us to make estimates and projections regarding, but not limited to, sales, operating profit and future cash flows. If our operating performance reflects a sustained decline, we may be exposed to significant asset impairment charges in future periods, which could be material to our results of operations.
Reductions in income and cash flow from our marketing and servicing arrangement related to our private label and co-branded credit cards could adversely affect our operating results and cash flows.
Synchrony Financial (“Synchrony”) owns and services our private label credit card and co-branded MasterCard® programs. Our agreement with Synchrony provides for certain payments to be made by Synchrony to the Company, including a share of revenues from the performance of the credit card portfolios. The income and cash flow that the Company receives from Synchrony is dependent upon a number of factors including the level of sales on private label and co-branded accounts, the percentage of sales on private label and co-branded accounts relative to the Company’s total sales, the level of balances carried on the accounts, payment rates on the accounts, finance charge rates and other fees on the accounts, the level of credit losses for the accounts, Synchrony’s ability to extend credit to our customers as well as the cost of customer rewards programs. All of these factors can vary based on changes in federal and state credit card, banking and consumer protection laws, which could also materially limit the availability of credit to consumers or increase the cost of credit to our cardholders. The factors affecting the income and cash flow that the Company receives from Synchrony can also vary based on a variety of economic, legal, social and other factors that we cannot control. If the income or cash flow that the Company receives from our consumer credit card program agreement with Synchrony decreases, our operating results and cash flows could be adversely affected.
We are subject to risks associated with importing merchandise from foreign countries.
A substantial portion of our merchandise is sourced by our vendors and by us outside of the United States. All of our vendors must comply with our supplier legal compliance program and applicable laws, including consumer and product safety laws. Although we diversify our sourcing and production by country and supplier, the failure of a supplier to produce and deliver our goods on time, to meet our quality standards and adhere to our product safety requirements or to meet the requirements of our supplier compliance program or applicable laws, or our inability to flow merchandise to our stores or through the Internet channel in the right quantities at the right time, could adversely affect our profitability and could result in damage to our reputation.
Although we have implemented policies and procedures designed to facilitate compliance with laws and regulations relating to doing business in foreign markets and importing merchandise from abroad, there can be no assurance that suppliers and other third parties with whom we do business will not violate such laws and regulations or our policies, which could subject us to liability and could adversely affect our results of operations.
We are subject to the various risks of importing merchandise from abroad and purchasing product made in foreign countries, such as:
• | potential disruptions in manufacturing, logistics and supply; |
• | changes in duties, tariffs, quotas and voluntary export restrictions on imported merchandise; |
• | strikes and other events affecting delivery; |
• | consumer perceptions of the safety of imported merchandise; |
• | product compliance with laws and regulations of the destination country; |
• | product liability claims from customers or penalties from government agencies relating to products that are recalled, defective or otherwise noncompliant or alleged to be harmful; |
• | concerns about human rights, working conditions and other labor rights and conditions and environmental impact in foreign countries where merchandise is produced and raw materials or components are sourced, and changing labor, environmental and other laws in these countries; |
• | local business practice and political issues that may result in adverse publicity or threatened or actual adverse consumer actions, including boycotts; |
14
• | compliance with laws and regulations concerning ethical business practices, such as the U.S. Foreign Corrupt Practices Act; and |
• | economic, political or other problems in countries from or through which merchandise is imported. |
Political or financial instability, trade restrictions, tariffs, currency exchange rates, labor conditions, congestion and labor issues at major ports, transport capacity and costs, systems issues, problems in third party distribution and warehousing and other interruptions of the supply chain, compliance with U.S. and foreign laws and regulations and other factors relating to international trade and imported merchandise beyond our control could affect the availability and the price of our inventory. These risks and other factors relating to foreign trade could subject us to liability or hinder our ability to access suitable merchandise on acceptable terms, which could adversely impact our results of operations. In addition, developments in tax policy, such as the disallowance of tax deductions for imported merchandise, or the imposition of tariffs on imported merchandise, could have a material adverse effect on our results of operations and liquidity.
Disruptions and congestion at ports through which we import merchandise may increase our costs and/or delay the receipt of goods in our stores, which could adversely impact our profitability, financial position and cash flows.
We ship the majority of our private brand merchandise by ocean to ports in the United States. Our national brand suppliers also ship merchandise by ocean. Disruptions in the operations of ports through which we import our merchandise, including but not limited to labor disputes involving work slowdowns, lockouts or strikes, could require us and/or our vendors to ship merchandise by air freight or to alternative ports in the United States. Shipping by air is significantly more expensive than shipping by ocean which could adversely affect our profitability. Similarly, shipping to alternative ports in the United States could result in increased lead times and transportation costs. Disruptions at ports through which we import our goods could also result in unanticipated inventory shortages, which could adversely impact our reputation and our results of operations.
Our Company’s growth and profitability depend on the levels of consumer confidence and spending.
Our results of operations are sensitive to changes in overall economic and political conditions that impact consumer spending, including discretionary spending. Many economic factors outside of our control, including the housing market, interest rates, recession, inflation and deflation, energy costs and availability, consumer credit availability and terms, consumer debt levels, tax rates and policy, and unemployment trends influence consumer confidence and spending. The domestic and international political situation and actions also affect consumer confidence and spending. Additional events that could impact our performance include pandemics, terrorist threats and activities, worldwide military and domestic disturbances and conflicts, political instability and civil unrest. Declines in the level of consumer spending could adversely affect our growth and profitability.
Our business is seasonal, which impacts our results of operations.
Our annual earnings and cash flows depend to a great extent on the results of operations for the last quarter of our fiscal year, which includes the holiday season. Our fiscal fourth-quarter results may fluctuate significantly, based on many factors, including holiday spending patterns and weather conditions. This seasonality causes our operating results to vary considerably from quarter to quarter.
Our profitability may be impacted by weather conditions.
Our merchandise assortments reflect assumptions regarding expected weather patterns and our profitability depends on our ability to timely deliver seasonally appropriate inventory. Unseasonable or unexpected weather conditions such as warm temperatures during the winter season or prolonged or extreme periods of warm or cold temperatures could render a portion of our inventory incompatible with consumer needs. Extreme weather or natural disasters could also severely hinder our ability to timely deliver seasonally appropriate merchandise, preclude customers from traveling to our stores, delay capital improvements or cause us to close stores. A reduction in the demand for or supply of our seasonal merchandise could have an adverse effect on our inventory levels and results of operations.
15
Changes in federal, state or local laws and regulations could increase our expenses and adversely affect our results of operations.
Our business is subject to a wide array of laws and regulations. Government intervention and activism and/or regulatory reform may result in substantial new regulations and disclosure obligations and/or changes in the interpretation of existing laws and regulations, which may lead to additional compliance costs as well as the diversion of our management’s time and attention from strategic initiatives. If we fail to comply with applicable laws and regulations we could be subject to legal risk, including government enforcement action and class action civil litigation that could disrupt our operations and increase our costs of doing business. Changes in the regulatory environment regarding topics such as privacy and information security, tax policy, product safety, environmental protection, including regulations in response to concerns regarding climate change, collective bargaining activities, minimum wage, wage and hour, and health care mandates, among others, as well as changes to applicable accounting rules and regulations, such as changes to lease accounting standards, could also cause our compliance costs to increase and adversely affect our business, financial condition and results of operations.
Legal and regulatory proceedings could have an adverse impact on our results of operations.
Our Company is subject to various legal and regulatory proceedings relating to our business, certain of which may involve jurisdictions with reputations for aggressive application of laws and procedures against corporate defendants. We are impacted by trends in litigation, including class action litigation brought under various consumer protection, employment, and privacy and information security laws. In addition, litigation risks related to claims that technologies we use infringe intellectual property rights of third parties have been amplified by the increase in third parties whose primary business is to assert such claims. Reserves are established based on our best estimates of our potential liability. However, we cannot accurately predict the ultimate outcome of any such proceedings due to the inherent uncertainties of litigation. Regardless of the outcome or whether the claims are meritorious, legal and regulatory proceedings may require that we devote substantial time and expense to defend our Company. Unfavorable rulings could result in a material adverse impact on our business, financial condition or results of operations.
Significant changes in discount rates, actual investment return on pension assets, and other factors could affect our earnings, equity, and pension contributions in future periods.
Our earnings may be positively or negatively impacted by the amount of income or expense recorded for our qualified pension plan. Generally accepted accounting principles in the United States of America (GAAP) require that income or expense for the plan be calculated at the annual measurement date using actuarial assumptions and calculations. The most significant assumptions relate to the capital markets, interest rates and other economic conditions. Changes in key economic indicators can change the assumptions. Two critical assumptions used to estimate pension income or expense for the year are the expected long-term rate of return on plan assets and the discount rate. In addition, at the measurement date, we must also reflect the funded status of the plan (assets and liabilities) on the balance sheet, which may result in a significant change to equity through a reduction or increase to other comprehensive income. We may also experience volatility in the amount of the annual actuarial gains or losses recognized as income or expense because we have elected to recognize pension expense using mark-to-market accounting. Although GAAP expense and pension contributions are not directly related, the key economic factors that affect GAAP expense would also likely affect the amount of cash we could be required to contribute to the pension plan. Potential pension contributions include both mandatory amounts required under federal law and discretionary contributions to improve a plan’s funded status.
Our stock price has been and may continue to be volatile.
The market price of our common stock has fluctuated substantially and may continue to fluctuate significantly. Future announcements or disclosures concerning us or any of our competitors, our strategic initiatives, our sales and profitability, our financial condition, any quarterly variations in actual or anticipated operating results or comparable sales, any failure to meet analysts’ expectations and sales of large blocks of our common stock, among other factors, could cause the market price of our common stock to fluctuate substantially. In addition, the stock market has experienced price and volume fluctuations that have affected the market price of many retail and other stocks that have often been unrelated or disproportionate to the operating performance of these companies. This volatility could affect the price at which you could sell shares of our common stock.
Securities class action litigation has often been instituted against companies following periods of volatility in the overall market and in the market price of a company’s securities. The Company and certain of our former members of the Board of Directors and executives were defendants in a consolidated class action lawsuit and continue to be defendants in two related stockholder derivative actions that were filed following our announcement of an issuance of common stock on September 26, 2013. Such
16
litigation could result in substantial costs, divert our management’s attention and resources and have an adverse effect on our business, results of operations and financial condition.
The Company’s ability to use net operating loss carryforwards to offset future taxable income for U.S. federal income tax purposes may be limited.
The Company has a federal net operating loss (NOL) of $2.1 billion as of February 3, 2018. These NOL carryforwards (expiring in 2032 through 2034) arose prior to December 31, 2017 and are available to offset future taxable income. The Company may recognize additional NOLs in the future which, under the Tax Act, would not expire but would only be available to offset up to 80% of the Company’s future taxable income.
Section 382 of the Internal Revenue Code of 1986, as amended (the Code), imposes an annual limitation on the amount of taxable income that may be offset by a corporation's NOLs if the corporation experiences an “ownership change” as defined in Section 382 of the Code. An ownership change occurs when the Company’s “five-percent shareholders” (as defined in Section 382 of the Code) collectively increase their ownership in the Company by more than 50 percentage points (by value) over a rolling three-year period. Additionally, various states have similar limitations on the use of state NOLs following an ownership change.
If an ownership change occurs, the amount of the taxable income for any post-change year that may be offset by a pre-change loss is subject to an annual limitation that is cumulative to the extent it is not all utilized in a year. This limitation is derived by multiplying the fair market value of the Company stock as of the ownership change by the applicable federal long-term tax-exempt rate, which was 1.97% at February 3, 2018. To the extent that a company has a net unrealized built-in gain at the time of an ownership change, which is realized or deemed recognized during the five-year period following the ownership change, there is an increase in the annual limitation for each of the first five-years that is cumulative to the extent it is not all utilized in a year.
The Company has an ongoing study of the rolling three-year testing periods. Based upon the elections the Company has made and the information that has been filed with the Securities and Exchange Commission through February 3, 2018, the Company has not had a Section 382 ownership change through February 3, 2018.
If an ownership change should occur in the future, the Company’s ability to use the NOL to offset future taxable income will be subject to an annual limitation and will depend on the amount of taxable income generated by the Company in future periods. There is no assurance that the Company will be able to fully utilize the NOL and the Company could be required to record an additional valuation allowance related to the amount of the NOL that may not be realized, which could impact the Company’s result of operations.
We believe that these NOL carryforwards are a valuable asset for us. Consequently, we have a stockholder rights plan in place, which was approved by the Company’s stockholders, to protect our NOLs during the effective period of the rights plan. Although the rights plan is intended to reduce the likelihood of an “ownership change” that could adversely affect us, there is no assurance that the restrictions on transferability in the rights plan will prevent all transfers that could result in such an “ownership change”.
The rights plan could make it more difficult for a third party to acquire, or could discourage a third party from acquiring, our Company or a large block of our common stock. A third party that acquires 4.9% or more of our common stock could suffer substantial dilution of its ownership interest under the terms of the rights plan through the issuance of common stock or common stock equivalents to all stockholders other than the acquiring person.
The foregoing provisions may adversely affect the marketability of our common stock by discouraging potential investors from acquiring our stock. In addition, these provisions could delay or frustrate the removal of incumbent directors and could make more difficult a merger, tender offer or proxy contest involving us, or impede an attempt to acquire a significant or controlling interest in us, even if such events might be beneficial to us and our stockholders.
Item 1B. Unresolved Staff Comments
None.
17
Item 2. Properties
At February 3, 2018, we operated 872 department stores throughout the continental United States, Alaska and Puerto Rico, of which 404 were owned, including 113 stores located on ground leases. The following table lists the number of stores operating by state as of February 3, 2018:
Alabama | 15 | Maine | 5 | Oklahoma | 15 | |||||
Alaska | 1 | Maryland | 16 | Oregon | 8 | |||||
Arizona | 21 | Massachusetts | 9 | Pennsylvania | 27 | |||||
Arkansas | 14 | Michigan | 34 | Rhode Island | 2 | |||||
California | 76 | Minnesota | 16 | South Carolina | 14 | |||||
Colorado | 17 | Mississippi | 10 | South Dakota | 3 | |||||
Connecticut | 7 | Missouri | 24 | Tennessee | 21 | |||||
Delaware | 3 | Montana | 5 | Texas | 82 | |||||
Florida | 53 | Nebraska | 8 | Utah | 8 | |||||
Georgia | 22 | Nevada | 6 | Vermont | 4 | |||||
Idaho | 8 | New Hampshire | 9 | Virginia | 22 | |||||
Illinois | 30 | New Jersey | 13 | Washington | 21 | |||||
Indiana | 22 | New Mexico | 10 | West Virginia | 8 | |||||
Iowa | 11 | New York | 38 | Wisconsin | 10 | |||||
Kansas | 14 | North Carolina | 23 | Wyoming | 3 | |||||
Kentucky | 22 | North Dakota | 5 | Puerto Rico | 6 | |||||
Louisiana | 13 | Ohio | 38 | |||||||
Total square feet | 95.6 million | |||||||||
We are party to a $1.688 billion senior secured term loan credit facility and the issuer of $500 million aggregate principal amount of senior secured notes that are secured by mortgages on certain real property of the Company, in addition to liens on substantially all personal property of the Company, subject to certain exclusions set forth in the security documents relating to the term loan credit facility and the senior secured notes. The real property subject to mortgages under the term loan credit facility and the indenture governing the senior secured notes includes our distribution centers and certain of our stores.
18
At February 3, 2018, our supply chain network operated 13 facilities with multiple types of distribution activities, including store merchandise distribution centers (stores), regional warehouses (regional) and jcpenney.com fulfillment centers (direct to customers) as indicated in the following table:
Square Footage | |||||||
Location | Leased/Owned | Primary Function(s) | (in thousands) | ||||
Manchester, Connecticut | Owned | stores | 1,956 | ||||
Lenexa, Kansas | Owned | stores, direct to customers | 1,944 | ||||
Columbus, Ohio | Owned | stores, direct to customers | 1,941 | ||||
Milwaukee, Wisconsin | Owned | stores | 1,921 | ||||
Atlanta, Georgia | Owned | stores, regional, direct to customers | 2,026 | ||||
Reno, Nevada | Owned | stores, direct to customers | 1,660 | ||||
Alliance, Texas | Owned | regional | 920 | ||||
Statesville, North Carolina | Owned | stores, regional | 595 | ||||
Lathrop, California | Leased | regional | 436 | ||||
Cedar Hill, Texas | Leased | stores | 420 | ||||
Spanish Fork, Utah | Leased | stores | 412 | ||||
Buena Park, California (1) | Leased | stores, regional | 1,034 | ||||
San Bernardino, California (1) | Leased | stores | 625 | ||||
Total supply chain network | 15,890 | ||||||
(1) | The Company sold the Buena Park location during 2017 and is leasing it back until it transfers certain operations to the San Bernardino location during 2018. |
Item 3. Legal Proceedings
The matters under the caption "Litigation" in Note 21 of the Notes to Consolidated Financial Statements included in this Form 10-K are incorporated herein by reference.
Item 4. Mine Safety Disclosures
Not applicable.
19
PART II
Item 5. Market for Registrant’s Common Equity, Related Stockholder Matters and Issuer Purchases of Equity Securities
Market for Registrant’s Common Equity
Our common stock is traded principally on the New York Stock Exchange (NYSE) under the symbol “JCP.” The number of stockholders of record at March 16, 2018, was 21,995. In addition to common stock, we have authorized 25 million shares of preferred stock, of which no shares were issued and outstanding at February 3, 2018.
The table below sets forth the quoted high and low intraday sale prices of our common stock on the NYSE for each quarterly period indicated and the quarter-end closing market price of our common stock:
Fiscal Year 2017 | First Quarter | Second Quarter | Third Quarter | Fourth Quarter | ||||||||||||
Market price: | ||||||||||||||||
High | $ | 7.42 | $ | 5.73 | $ | 5.63 | $ | 4.24 | ||||||||
Low | $ | 5.32 | $ | 4.17 | $ | 2.76 | $ | 2.35 | ||||||||
Close | $ | 5.38 | $ | 5.56 | $ | 3.12 | $ | 3.54 | ||||||||
Fiscal Year 2016 | First Quarter | Second Quarter | Third Quarter | Fourth Quarter | ||||||||||||
Market price: | ||||||||||||||||
High | $ | 11.99 | $ | 9.82 | $ | 11.30 | $ | 10.74 | ||||||||
Low | $ | 6.88 | $ | 7.10 | $ | 8.25 | $ | 6.38 | ||||||||
Close | $ | 9.28 | $ | 9.66 | $ | 8.48 | $ | 6.45 | ||||||||
Since May 2012, the Company has not paid a dividend. Under our senior secured term loan credit facility and senior secured asset-based credit facility, we are subject to restrictive covenants regarding our ability to pay cash dividends.
Additional information relating to the common stock and preferred stock is included in this Annual Report on Form 10-K in the Consolidated Statements of Stockholders’ Equity and in Note 13 to the Consolidated Financial Statements.
Issuer Purchases of Securities
No repurchases of common stock were made during the fourth quarter of 2017 and no amounts are authorized for share repurchases as of February 3, 2018.
20
Five-Year Total Stockholder Return Comparison
The following presentation compares our cumulative stockholder returns for the past five fiscal years with the returns of the S&P 500 Stock Index and the S&P 500 Retail Index for Department Stores over the same period. A list of these companies follows the graph below. The graph assumes $100 invested at the closing price of our common stock on the NYSE and each index as of the last trading day of our fiscal year 2012 and assumes that all dividends were reinvested on the date paid. The points on the graph represent fiscal year-end amounts based on the last trading day of each fiscal year. The following graph and related information shall not be deemed “soliciting material” or to be “filed” with the Securities and Exchange Commission, nor shall such information be incorporated by reference into any filing under the Securities Act of 1933 or Securities Exchange Act of 1934, each as amended, except to the extent that we specifically incorporate it by reference into such filing.
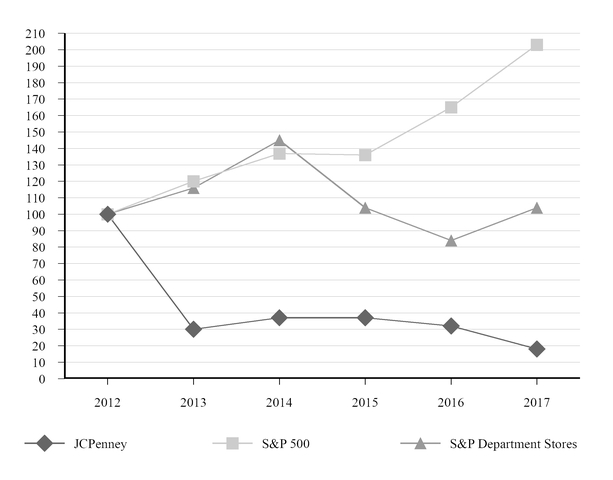
S&P Department Stores: Macy’s, Kohl’s, Nordstrom |
2012 | 2013 | 2014 | 2015 | 2016 | 2017 | |||||||
JCPenney | $100 | $30 | $37 | $37 | $32 | $18 | ||||||
S&P 500 | 100 | 120 | 137 | 136 | 165 | 203 | ||||||
S&P Department Stores | 100 | 116 | 145 | 104 | 84 | 104 | ||||||
The stockholder returns shown are neither determinative nor indicative of future performance.
21
Item 6. Selected Financial Data
Five-Year Financial Summary
($ in millions, except per share data) | 2017 | 2016 | 2015 | 2014 | 2013 | |||||||||||||||
Results for the year | ||||||||||||||||||||
Total net sales | $ | 12,506 | $ | 12,547 | $ | 12,625 | $ | 12,257 | $ | 11,859 | ||||||||||
Sales percent increase/(decrease): | ||||||||||||||||||||
Total net sales | (0.3 | )% | (1) | (0.6 | )% | 3.0 | % | 3.4 | % | (8.7 | )% | (1) | ||||||||
Comparable store sales (2) | 0.1 | % | 0.0 | % | 4.5 | % | 4.4 | % | (7.4 | )% | ||||||||||
Operating income/(loss) | 116 | 395 | (89 | ) | (254 | ) | (1,242 | ) | ||||||||||||
As a percent of sales | 0.9 | % | 3.1 | % | (0.7 | )% | (2.1 | )% | (10.5 | )% | ||||||||||
Net income/(loss) from continuing operations | (116 | ) | 1 | (513 | ) | (717 | ) | (1,278 | ) | |||||||||||
Adjusted EBITDA (non-GAAP) (3) | 972 | 1,009 | 715 | 292 | (612 | ) | ||||||||||||||
Adjusted net income/(loss) from continuing operations (non-GAAP) (3) | 68 | 24 | (315 | ) | (766 | ) | (1,407 | ) | ||||||||||||
Per common share | ||||||||||||||||||||
Earnings/(loss) per share from continuing operations, diluted | $ | (0.37 | ) | $ | 0.00 | $ | (1.68 | ) | $ | (2.35 | ) | $ | (5.13 | ) | ||||||
Adjusted earnings/(loss) per share from continuing operations, diluted (non-GAAP) (3) | $ | 0.22 | $ | 0.08 | $ | (1.03 | ) | $ | (2.51 | ) | $ | (5.64 | ) | |||||||
Financial position and cash flow | ||||||||||||||||||||
Total assets | $ | 8,413 | $ | 9,118 | $ | 9,211 | $ | 10,137 | $ | 11,517 | ||||||||||
Cash and cash equivalents | 458 | 887 | 900 | 1,318 | 1,515 | |||||||||||||||
Total debt (4) | 4,232 | 4,836 | 4,805 | 5,321 | 5,510 | |||||||||||||||
Free cash flow (non-GAAP) (3) | 213 | 3 | 131 | 57 | (2,746 | ) | ||||||||||||||
(1) | Includes the effect of the 53rd week in 2017 and 2012. Excluding sales of $147 million and $163 million for the 53rd week in 2017 and 2012, respectively, total net sales decreased 1.5% and 7.5% in 2017 and 2013, respectively. |
(2) | Comparable store sales are presented on a 52-week basis and include sales from all stores, including sales from services and commissions earned from our in-store licensed departments, that have been open for 12 consecutive full fiscal months and Internet sales. Stores closed for an extended period are not included in comparable store sales calculations, while stores remodeled and minor expansions not requiring store closure remain in the calculations. Certain items, such as sales return estimates and store liquidation sales, are excluded from the Company's calculation. Our definition and calculation of comparable store sales may differ from other companies in the retail industry. |
(3) | See Non-GAAP Financial Measures herein for additional information and reconciliation to the most directly comparable GAAP financial measure. |
(4) | Total debt includes long-term debt, net of unamortized debt issuance costs, including current maturities, capital leases, financing obligation, note payable and any borrowings under our revolving credit facility. |
22
Five-Year Operations Summary
2017 | 2016 | 2015 | 2014 | 2013 | ||||||||||||||||
Number of department stores: | ||||||||||||||||||||
Beginning of year | 1,013 | 1,021 | 1,062 | 1,094 | 1,104 | |||||||||||||||
Openings | — | 1 | — | 1 | — | |||||||||||||||
Closings | (141 | ) | (9 | ) | (41 | ) | (33 | ) | (10 | ) | ||||||||||
End of year | 872 | 1,013 | 1,021 | 1,062 | 1,094 | |||||||||||||||
Gross selling space (square feet in millions) | 95.6 | 103.3 | 104.7 | 107.9 | 110.6 | |||||||||||||||
Sales per gross square foot (1) | $ | 127 | $ | 121 | $ | 120 | $ | 113 | $ | 107 | ||||||||||
Sales per net selling square foot (1) | $ | 177 | $ | 166 | $ | 165 | $ | 155 | $ | 147 | ||||||||||
Number of the Foundry Big and Tall Supply Co. stores (2) | — | — | — | — | 10 | |||||||||||||||
(1) | Calculation includes the sales, including commission revenue, and square footage of department stores, including selling space allocated to services and licensed departments, that were open for the full fiscal year, as well as Internet sales. |
(2) | All stores opened during 2011 and closed during 2014. Gross selling space was 51 thousand square feet as of the end of 2013. |
23
Item 7. Management’s Discussion and Analysis of Financial Condition and Results of Operations
The following discussion, which presents our results, should be read in conjunction with the accompanying Consolidated Financial Statements and notes thereto, along with the Five-Year Financial and Operations Summaries, the risk factors and the cautionary statement regarding forward-looking information. Unless otherwise indicated, all references in this Management’s Discussion and Analysis (MD&A) related to earnings/(loss) per share (EPS) are on a diluted basis and all references to years relate to fiscal years rather than to calendar years.
Growth Initiatives
Our revenue growth strategy for 2018 will continue to focus on the following four initiatives:
• | Beauty; |
• | Home refresh; |
• | Women's apparel business; and |
• | Omnichannel. |
First, we will have a continued focus in our beauty categories of Sephora, The Salon by InStyle and Fine Jewelry. In 2017, we opened 70 additional Sephora locations, bringing our total number of locations to 642, and had a successful launch of Fenty Beauty by Rihanna in the fall. We plan to add approximately 30 new Sephora locations and will continue to roll out and launch new brands in 2018. We are also continuing to rebrand our salons to The Salon by InStyle and will modernize and rebrand another 100 salons in 2018. Finally, we will continue to enhance our Fine Jewelry offerings to better provide the customer with a total beauty solution. Magnifying the importance of physical stores, we see Sephora, Salon and Fine Jewelry as differentiators to help drive traffic and increase the frequency of visits to our stores.
Second, we will continue to enhance the strong results of our home refresh initiative. We have established appliance showrooms in over 600 stores and plan to add new brand partners to our showrooms throughout the year. Additionally, we have increased our mattress offering to approximately 500 in-store showrooms, have added televisions to our Home category and continue to develop our home services offering. We see our home refresh initiative as an opportunity for us to increase our revenue per customer.
Third, we will continue to focus on improving our women's apparel offering by strategically adjusting our assortment to better align with customer preferences. We plan to enhance our women's apparel with our strategy to improve speed and offer great fashion at a value across several categories. Along with our partnership with Nike, we continue to expand the breadth of our Adidas assortment by increasing the number of stores that carry the brand and by upgrading the store experience with Adidas shops. In addition, we are taking steps in women's apparel to simplify the floor, better balance our career and casual offerings and create a stronger value statement with pricing.
Lastly, we remain committed to becoming a world-class omnichannel retailer. Our online business remains strong, delivering double-digit growth in 2017. We plan to continue to drive increased online revenue in 2018 by increasing our online SKU assortment, continuing to improve site functionality, enhancing ship-from-store capabilities and developing additional enhancements to our improved mobile app.
We believe these growth initiatives will not only serve the needs of our value-oriented customer, they will differentiate us from our traditional competitors.
24
2017 Overview
▪ | Sales were $12,506 million, a decrease of 0.3% as compared to 2016, and comparable store sales increased 0.1% for the year. Excluding sales of $147 million for the 53rd week in 2017, total net sales decreased 1.5% in 2017. |
▪ | Cost of goods sold, which excludes depreciation and amortization, as a percentage of sales was 65.4% compared to 64.3% last year. This increase was primarily driven by the liquidation of both closed store and slow-moving inventory, the continued growth in certain lower margin merchandise categories such as major appliances and higher shrinkage rates. |
▪ | Selling, general and administrative (SG&A) expenses decreased $70 million, or 2.0%, as compared to 2016. These savings were primarily driven by reductions in store controllable costs and marketing efficiencies, which were partially offset by lower credit income and higher incentive compensation. |
▪ | Net loss was $116 million, or $0.37 per share, compared to net income of $1 million, or $0.00 per share, in 2016. Results for 2017 included the following amounts that are not directly related to our ongoing core business operations: |
▪ | $303 million, or $(0.97) per share, of restructuring and management transition charges most of which encompassed the closure of 138 stores and the costs related to a Voluntary Early Retirement Program (VERP) for approximately 2,800 eligible associates; |
▪ | $11 million, or $0.04 per share, for Primary Pension Plan income; |
▪ | $25 million, or $(0.08) per share, for the mark-to-market (MTM) adjustment for supplemental retirement plans; |
▪ | $33 million, or $(0.11) per share, for the loss on extinguishment of debt; |
▪ | $31 million, or $0.10 per share, for our proportional share of net income from our joint venture formed to develop the excess property adjacent to our home office facility in Plano, Texas (Home Office Land Joint Venture); |
▪ | $60 million, or $0.19 per share, for the tax impact resulting from other comprehensive income allocation; and |
▪ | $75 million, or $0.24 per share, for the impact of tax reform. |
▪ | Adjusted net income was $68 million, or $0.22 per share, compared to adjusted net income of $24 million, or $0.08 per share, in 2016. See the reconciliation of net income/(loss) and diluted EPS, the most directly comparable GAAP financial measures, to adjusted net income/(loss) and adjusted diluted EPS on page 36. |
▪ | Adjusted EBITDA was $972 million for 2017 compared to adjusted EBITDA of $1,009 million in 2016. See the reconciliation of net income/(loss), the most directly comparable GAAP financial measure, to adjusted EBITDA on page 35. |
▪ | We completed the sale of our Buena Park, California distribution facility in March for a net sales price of $131 million |
and recorded a net gain of $111 million.
▪ | During the second quarter, we amended and restated our $2.35 billion senior secured asset-based revolving credit facility to, among other things, extend the maturity date to June 20, 2022 and to lower the interest rate spread by 75 basis points. |
▪ | During the year, we reduced our outstanding debt position by approximately $600 million. |
25
Results of Operations
Three-Year Comparison of Operating Performance
(in millions, except per share data) | 2017 | 2016 | 2015 | |||||||||
Total net sales | $ | 12,506 | $ | 12,547 | $ | 12,625 | ||||||
Percent increase/(decrease) from prior year | (0.3 | )% | (1) | (0.6 | )% | 3.0 | % | |||||
Comparable store sales increase/(decrease) (2) | 0.1 | % | 0.0 | % | 4.5 | % | ||||||
Costs and expenses/(income): | ||||||||||||
Cost of goods sold (exclusive of depreciation and amortization shown separately below) | 8,174 | 8,071 | 8,074 | |||||||||
Selling, general and administrative | 3,468 | 3,538 | 3,775 | |||||||||
Pension | 21 | 19 | 162 | |||||||||
Depreciation and amortization | 570 | 609 | 616 | |||||||||
Real estate and other, net | (146 | ) | (111 | ) | 3 | |||||||
Restructuring and management transition | 303 | 26 | 84 | |||||||||
Total costs and expenses | 12,390 | 12,152 | 12,714 | |||||||||
Operating income/(loss) | 116 | 395 | (89 | ) | ||||||||
As a percent of sales | 0.9 | % | 3.1 | % | (0.7 | )% | ||||||
Loss on extinguishment of debt | 33 | 30 | 10 | |||||||||
Net interest expense | 325 | 363 | 405 | |||||||||
Income/(loss) before income taxes | (242 | ) | 2 | (504 | ) | |||||||
Income tax (benefit)/expense | (126 | ) | 1 | 9 | ||||||||
Net income/(loss) | $ | (116 | ) | $ | 1 | $ | (513 | ) | ||||
Adjusted EBITDA (3) | $ | 972 | $ | 1,009 | $ | 715 | ||||||
Adjusted net income/(loss) (non-GAAP) (3) | $ | 68 | $ | 24 | $ | (315 | ) | |||||
Diluted EPS | $ | (0.37 | ) | $ | 0.00 | $ | (1.68 | ) | ||||
Adjusted diluted EPS (non-GAAP) (3) | $ | 0.22 | $ | 0.08 | $ | (1.03 | ) | |||||
Weighted average shares used for diluted EPS | 311.1 | 313.0 | 305.9 | |||||||||
(1) | Includes the effect of the 53rd week in 2017. Excluding sales of $147 million for the 53rd week in 2017, total net sales decreased 1.5% in 2017. |
(2) | Comparable store sales are presented on a 52-week basis and include sales from all stores, including sales from services and commissions earned from our in-store licensed departments, that have been open for 12 consecutive full fiscal months and Internet sales. Stores closed for an extended period are not included in comparable store sales calculations, while stores remodeled and minor expansions not requiring store closure remain in the calculations. Certain items, such as sales return estimates and store liquidation sales, are excluded from the Company's calculation. Our definition and calculation of comparable store sales may differ from other companies in the retail industry. |
(3) | See discussion herein of this non-GAAP financial measure and reconciliation to its most directly comparable GAAP financial measure. |
2017 Compared to 2016
Total Net Sales
Our year-to-year change in total net sales is comprised of (a) sales from new stores net of closings and relocations, referred to as non-comparable store sales, (b) sales of stores opened in both years as well as Internet sales, referred to as comparable store sales and (c) other revenue adjustments such as sales return estimates and store liquidation sales. We consider comparable store sales to be a key indicator of our current performance measuring the growth in sales and sales productivity of existing stores. Positive comparable store sales contribute to greater leveraging of operating costs, particularly payroll and occupancy costs, while negative comparable store sales contribute to de-leveraging of costs. Comparable store sales also have a direct impact on our total net sales and the level of cash flow.
26
2017 | 2016 | ||||||
Total net sales (in millions) | $ | 12,506 | $ | 12,547 | |||
Sales percent increase/(decrease) | |||||||
Total net sales | (0.3 | )% | (1) | (0.6 | )% | ||
Comparable store sales (2) | 0.1 | % | — | % | |||
Sales per gross square foot (3) | $ | 127 | $ | 121 | |||
(1) | Includes the effect of the 53rd week in 2017. Excluding sales of $147 million for the 53rd week in 2017, total net sales decreased 1.5% in 2017. |
(2) | Comparable store sales are presented on a 52-week basis and include sales from all stores, including sales from services and commissions earned from our in-store licensed departments, that have been open for 12 consecutive full fiscal months and Internet sales. Stores closed for an extended period are not included in comparable store sales calculations, while stores remodeled and minor expansions not requiring store closure remain in the calculations. Certain items, such as sales return estimates and store liquidation sales, are excluded from the Company's calculation. Our definition and calculation of comparable store sales may differ from other companies in the retail industry. |
(3) | Calculation includes the sales, including commission revenue, and square footage of department stores, including selling space allocated to services and licensed departments, that were open for the full fiscal year, as well as Internet sales. |
Total net sales decreased $41 million in 2017 compared to 2016. The following table provides the components of the net sales decrease:
($ in millions) | 2017 | ||
Comparable store sales increase/(decrease) | $ | 12 | |
Sales related to new and closed stores, net | (205 | ) | |
Other revenues and sales adjustments (1) | 152 | ||
Total net sales increase/(decrease) | $ | (41 | ) |
(1) | Includes sales of $147 million for the 53rd week in 2017. |
As our omnichannel strategy continues to mature, it is increasingly difficult to distinguish between a store sale and an Internet sale. Because we no longer have a clear distinction between store sales and Internet sales, we do not separately report Internet sales. Below is a list of some of our omnichannel activities:
• | Stores increase Internet sales by providing customers opportunities to view, touch and/or try on physical merchandise before ordering online. |
• | Our website increases store sales as in-store customers have often pre-shopped online before shopping in the store, including verification of which stores have online merchandise in stock. |
• | Most Internet purchases are easily returned in our stores. |
• | JCPenney Rewards can be earned and redeemed online or in stores. |
• | In-store customers can order from our website with the assistance of associates in our stores or they can shop our website from the JCPenney app while inside the store. |
• | Customers who utilize our mobile application can receive mobile coupons to use when they check out both online or in our stores. |
• | Internet orders can be shipped from a dedicated jcpenney.com fulfillment center, a store, a store merchandise distribution center, a regional warehouse, directly from vendors or any combination of the above. |
• | Certain categories of store inventory can be accessed and purchased by jcpenney.com customers and shipped directly to the customer's home from the store. |
• | Internet orders can be shipped to stores for customer pick up. |
• | "Buy online and pick up in store" is now available in all of our stores. |
For 2017, units per transaction increased and average unit retail increased, while transaction counts decreased as compared to the prior year. On a geographic basis, all regions experienced comparable store sales decreases for 2017 compared to the prior year. During 2017, our Home, Jewelry, Sephora and Footwear and Handbags merchandise divisions experienced sales
27
increases. Home, which reflected the addition of 100 new appliance showrooms and 500 mattress showrooms, experienced the highest sales increase.
During 2017, private brand merchandise comprised 46% of total merchandise sales, as compared to 44% in 2016. During 2017 and 2016, exclusive brand merchandise comprised 7% and 8%, respectively, of total merchandise sales.
Cost of Goods Sold
Cost of goods sold, exclusive of depreciation and amortization, increased to 65.4% of sales in 2017, or 110 basis points, compared to 2016. On a dollar basis, cost of goods sold increased $103 million, or 1.3%, to $8,174 million in 2017 compared to $8,071 million in the prior year. The net 110 basis point increase was primarily driven by the liquidation of both closed store and slow-moving inventory, higher shrinkage rates and the continued growth in certain lower margin merchandise categories such as major appliances.
SG&A Expenses
SG&A expenses declined $70 million to $3,468 million in 2017 compared to $3,538 million in 2016, primarily due to the closing of 138 stores. As a percent of sales, SG&A expenses were 27.7% compared to 28.2% in the prior year. The net 50 basis point improvement was primarily driven by reductions in store controllable costs and marketing efficiencies, which were partially offset by lower credit income and higher incentive compensation.
Our private label credit card and co-branded MasterCard® programs are owned and serviced by Synchrony Financial (Synchrony). Under our agreement with Synchrony, we receive cash payments from Synchrony based upon the performance of the credit card portfolio. We participate in the programs by providing marketing promotions designed to increase the use of each card, including enhanced marketing offers for cardholders. Additionally, we accept payments in our stores from cardholders who prefer to pay in person when they are shopping in our locations. The income we earn under our agreement with Synchrony is included as an offset to SG&A expenses. For 2017 and 2016, we recognized income of $319 million and $347 million, respectively, pursuant to our agreement with Synchrony.
Pension
($ in millions) | 2017 | 2016 | ||||||
Primary pension plan expense/(income) | $ | (11 | ) | $ | 1 | |||
Supplemental pension plans expense/(income) | 32 | 18 | ||||||
Total pension expense/(income) | $ | 21 | $ | 19 | ||||
Total pension expense/(income) increased slightly from 2016. Primary pension plan expense/(income) was income of $11 million in 2017 as a result of the expected return on the plan assets exceeding the service and interest cost components and $13 million in settlement expense. Supplemental pension plans expense/(income) increased primarily due to the increase of the MTM adjustment from $11 million in 2016 to $25 million in 2017.
Depreciation and Amortization Expenses
Depreciation and amortization expense in 2017 decreased $39 million to $570 million, or 6.4%, compared to $609 million in 2016. This decrease is primarily a result of closing 141 store locations in 2017.
Real Estate and Other, Net
Real estate and other consists of ongoing operating income from our real estate subsidiaries. Real estate and other also includes net gains from the sale of facilities and equipment that are no longer used in operations, asset impairments, accruals for certain litigation and other non-operating charges and credits. In addition, during the first quarter of 2014, we entered into the Home Office Land Joint Venture in which we contributed approximately 220 acres of excess property adjacent to our home office facility in Plano, Texas. The joint venture was formed to develop the contributed property and our proportional share of the joint venture's activities is recorded in Real estate and other, net.
28
The composition of real estate and other, net was as follows:
($ in millions) | 2017 | 2016 | ||||||
Net gain from sale of non-operating assets | $ | — | $ | (5 | ) | |||
Investment income from Home Office Land Joint Venture | (31 | ) | (28 | ) | ||||
Net gain from sale of operating assets | (119 | ) | (73 | ) | ||||
Other | 4 | (5 | ) | |||||
Total expense/(income) | $ | (146 | ) | $ | (111 | ) | ||
In 2016, we sold several non-operating assets for a net gain of $5 million. Investment income from the Home Office Land Joint Venture represents our proportional share of net income of the joint venture.
In 2017, the net gain from the sale of operating assets primarily related to the sale of our Buena Park, California distribution facility for a net sale price of $131 million and a net gain of $111 million and the sale of excess property.
In 2016, the net gain from the sale of operating assets related to the sale of land surrounding our home office and the sale of excess property.
Restructuring and Management Transition
The composition of restructuring and management transition charges was as follows:
($ in millions) | 2017 | 2016 | ||||||
VERP | $ | 122 | $ | — | ||||
Home office and stores | 176 | 8 | ||||||
Management transition | — | 3 | ||||||
Other | 5 | 15 | ||||||
Total | $ | 303 | $ | 26 | ||||
In February 2017, we announced a Voluntary Early Retirement Program (VERP), which was offered to approximately 6,000 eligible associates. In the first quarter of 2017, we recorded a total charge of $122 million related to the VERP. Charges included $112 million related to enhanced retirement benefits for the approximately 2,800 associates who accepted the VERP, $8 million related to curtailment charges for our Primary Pension Plan and Supplemental Pension Plans as a result of the reduction in the expected years of future service related to these plans and $2 million in other related costs.
In 2017 and 2016, we recorded $176 million and $8 million, respectively, of costs to reduce our store and home office expenses. Costs during 2017, primarily related to the closure of 138 stores, include store closing asset impairments of $77 million, employee termination benefits of $29 million and store related closing costs of $75 million. For 2016, the costs relate to employee termination benefits, lease termination costs and impairment charges associated with the closure of 7 department stores.
We also implemented several changes within our management leadership team during 2016 that resulted in management transition costs of $3 million, for both incoming and outgoing members of management. Other miscellaneous restructuring charges of $15 million, primarily related to contract termination and other costs associated with our previous shops strategy, were recorded during 2016.
Operating Income/(Loss)
For 2017, we reported operating income of $116 million compared to an operating income of $395 million in 2016, which is a decline of $279 million.
(Gain)/Loss on Extinguishment of Debt
During the second quarter of 2017, we settled cash tender offers with respect to portions of our outstanding 5.75% Senior Notes
due 2018 (2018 Notes) and 8.125% Senior Notes due 2019 (2019 Notes), resulting in a loss on extinguishment of debt of $34
million, and amended and restated our $2.35 billion senior secured asset-based revolving credit facility (Revolving Credit Facility), which resulted in a loss on extinguishment of debt of $1 million.
During the fourth quarter of 2017, we repurchased and retired $40 million aggregate principal amount of our outstanding 5.65% Senior Notes due 2020 (2020 Notes) resulting in a gain on extinguishment of debt of $2 million.
29
During the first quarter of 2016, we repurchased and retired $60 million aggregate principal amount of our outstanding debt resulting in a gain on extinguishment of debt of $4 million.
During the second quarter of 2016, we completed the refinancing of our 2013 Senior Secured Term Loan Facility and the issuance of the Senior Secured Notes, resulting in a loss on extinguishment of debt of $34 million.
Net Interest Expense
Net interest expense consists principally of interest expense on long-term debt, net of interest income earned on cash and cash equivalents. In 2017, Net interest expense was $325 million, a decrease of $38 million, or 10.5%, from $363 million in 2016. The reduction in net interest expense is due to lower debt levels in 2017 compared to 2016.
Income Taxes
Our deferred tax assets, which include the future tax benefits of our net operating loss carryforwards, are subject to a valuation allowance. At February 3, 2018, the federal and state valuation allowances were $535 million and $232 million, respectively. Our deferred tax assets include the impact of re-measurement on U. S. deferred taxes at the lower enacted corporate tax rate resulting from U. S. tax reform enacted in December 2017. Future book pre-tax losses will require additional valuation allowances to offset the deferred tax assets created. Until such time that we achieve sufficient profitability to allow removal of most of our valuation allowance, utilization of our loss carryforwards will result in a corresponding decrease in the valuation allowance and offset our tax provision dollar for dollar.
Each period we are required to allocate our income tax expense or benefit to continuing operations and other items such as other comprehensive income and stockholder’s equity. In accordance with these rules, when we have a loss in continuing operations and a gain in other comprehensive income, as arose in 2013, we are required to recognize a tax benefit in continuing operations up to the amount of tax expense that we are required to report in other comprehensive income. In 2017, we experienced a loss in continuing operations and income in other comprehensive income. Under the allocation rules, we are only required to recognize the valuation allowance allocable to the tax benefit attributable to losses in each component of comprehensive income. Accordingly, there is no valuation allowance offsetting a deferred tax benefit attributable to other comprehensive income included in the total valuation allowance of $767 million noted above.
For 2017, we recorded a net tax benefit of $126 million. The net tax expense included $7 million related to the amortization of certain indefinite-lived intangible assets, $6 million for state and foreign jurisdictions where loss carryforwards are limited or unavailable offset by net tax benefits of $3 million to adjust the valuation allowance, $1 million for state audit settlements and $60 million related to other comprehensive income. The 2017 net tax benefit includes an income tax benefit of $75 million related to the re-measurement of the U. S. net deferred tax liabilities from 35% to 21% tax rate.
For 2016, we recorded a net tax expense of $1 million. The net tax expense included $7 million related to the amortization of certain indefinite-lived intangible assets, $9 million for state and foreign jurisdictions where loss carryforwards are limited or unavailable offset by net tax benefits of $1 million to adjust the valuation allowance, $2 million for state audit settlements and $12 million related to other comprehensive income.
Net Income/(Loss) and Adjusted Net Income/(Loss) (non-GAAP)
In 2017, we reported a loss of $116 million, or $0.37 per share, compared with income of $1 million, or $0.00 per share, last year. Excluding the impact of restructuring and management transition charges, the impact of our Primary Pension Plan expense, the mark-to-market adjustment for supplemental retirement plans, the loss on extinguishment of debt, the net gain on sale of non-operating assets, the proportional share of net income from joint venture, the tax impact resulting from other comprehensive income allocation, and the impact of tax reform, adjusted net income/(loss) (non-GAAP) was income of $68 million, or $0.22 per share, in 2017 compared to income of $24 million, or $0.08 per share, in 2016.
The reduction in net income/(loss) in 2017 was driven primarily by restructuring charges associated with the 2017 store closures and the VERP.
Adjusted EBITDA (non-GAAP)
In 2017, adjusted EBITDA was $972 million, a decline of $37 million for 2017 compared to adjusted EBITDA of $1,009 million for the prior year.
30
2016 Compared to 2015
Total Net Sales
2016 | 2015 | ||||||
Total net sales (in millions) | $ | 12,547 | $ | 12,625 | |||
Sales percent increase/(decrease) | |||||||
Total net sales(1) | (0.6 | )% | 3.0 | % | |||
Comparable store sales(2) | — | % | 4.5 | % | |||
Sales per gross square foot(3) | $ | 121 | $ | 120 | |||
(1) | Comparable store sales are presented on a 52-week basis and include sales from all stores, including sales from services and commissions earned from our in-store licensed departments, that have been open for 12 consecutive full fiscal months and Internet sales. Stores closed for an extended period are not included in comparable store sales calculations, while stores remodeled and minor expansions not requiring store closure remain in the calculations. Certain items, such as sales return estimates and store liquidation sales, are excluded from the Company's calculation. Our definition and calculation of comparable store sales may differ from other companies in the retail industry. |
(2) | Calculation includes the sales, including commission revenue, and square footage of department stores, including selling space allocated to services and licensed departments, that were open for the full fiscal year, as well as Internet sales. |
Total net sales decreased $78 million in 2016 compared to 2015. The following table provides the components of the net sales decrease:
($ in millions) | 2016 | ||
Comparable store sales increase/(decrease) | $ | 2 | |
Sales related to new and closed stores, net | (76 | ) | |
Other revenues and sales adjustments | (4 | ) | |
Total net sales increase/(decrease) | $ | (78 | ) |
For 2016, conversion, units per transaction and average unit retail increased, while transaction counts decreased as compared to the prior year. On a geographic basis, all regions experienced comparable store sales decreases for 2016 compared to the prior year. During 2016, our Sephora, Home and Footwear and Handbags merchandise divisions experienced sales increases. Sephora, which reflected the addition of 60 Sephora inside JCPenney locations, experienced the highest sales increase.
During both 2016 and 2015, private brand merchandise comprised 44% and exclusive brand merchandise comprised 8% of total merchandise sales.
Cost of Goods Sold
Cost of goods sold, exclusive of depreciation and amortization, increased to 64.3% of sales in 2016, or 30 basis points, compared to 2015. On a dollar basis, cost of goods sold decreased $3 million to $8,071 million in 2016 compared to $8,074 million in the prior year. The net 30 basis point decrease resulted primarily from the addition of lower margin appliances to our assortment and increased sales of merchandise in certain lower margin categories.
SG&A Expenses
SG&A expenses declined $237 million to $3,538 million in 2016 compared to $3,775 million in 2015. As a percent of sales, SG&A expenses were 28.2% compared to 29.9% in the prior year. The net 170 basis point decrease was primarily driven by lower incentive compensation, store controllable costs, corporate overhead and more efficient advertising spend.
Our private label credit card and co-branded MasterCard® programs are owned and serviced by Synchrony Financial (Synchrony). Under our agreement with Synchrony, we receive cash payments from Synchrony based upon the performance of the credit card portfolio. We participate in the programs by providing marketing promotions designed to increase the use of each card, including enhanced marketing offers for cardholders. Additionally, we accept payments in our stores from cardholders who prefer to pay in person when they are shopping in our locations. The income we earn under our agreement with Synchrony is included as an offset to SG&A expenses. For 2016 and 2015, we recognized income of $347 million and $367 million, respectively, pursuant to our agreement with Synchrony.
31
Pension Expense
($ in millions) | 2016 | 2015 | ||||||
Primary pension plan expense/(income) | $ | 1 | $ | 154 | ||||
Supplemental pension plans expense/(income) | 18 | 8 | ||||||
Total pension expense/(income) | $ | 19 | $ | 162 | ||||
Total pension expense, which consists of our Primary Pension Plan expense and our supplemental pension plans expense, decreased primarily due to the $180 million settlement charge of unrecognized actuarial losses that occurred in 2015. The settlement charge related to the total transfer of approximately $1.5 billion in Primary Pension Plan assets to settle a portion of the Primary Pension Plan obligation. Additionally, the MTM adjustment was expense of $11 million and $52 million in 2016 and 2015, respectively.
Depreciation and Amortization Expense
Depreciation and amortization expense in 2016 decreased $7 million to $609 million, or 1.1%, compared to $616 million in 2015. This decrease is primarily a result of closing 50 store locations since the beginning of 2015.
Real Estate and Other, Net
The composition of real estate and other, net was as follows:
($ in millions) | 2016 | 2015 | ||||||
Net gain from sale of non-operating assets | $ | (5 | ) | $ | (9 | ) | ||
Investment income from Home Office Land Joint Venture | (28 | ) | (41 | ) | ||||
Net gain from sale of operating assets | (73 | ) | (9 | ) | ||||
Asset impairments | — | 20 | ||||||
Other | (5 | ) | 42 | |||||
Total expense/(income) | $ | (111 | ) | $ | 3 | |||
In 2016 and 2015, we sold several non-operating assets for a net gain of $5 million and $9 million, respectively.
In 2016, the net gain from the sale of operating assets related to the sale of land surrounding our home office and the sale of excess property. In 2015, the net gain from the sale of operating assets related to the sale of a former furniture store location, payments received from landlords to terminate two leases prior to the original expiration date and the sale of excess property.
In 2015, we incurred an impairment charge related to the write-down of internal use software products.
Included in the other category in 2015 is a $50 million accrual for the proposed settlement related to a pricing class action lawsuit. Pursuant to the settlement, the Company paid $25 million in cash to certain class members and issued $25 million of store credit to the remainder of the class members.
See "Restructuring and Management Transition" below for additional impairments related to stores closed in 2015.
Restructuring and Management Transition
The composition of restructuring and management transition charges was as follows:
($ in millions) | 2016 | 2015 | ||||||
Home office and stores | $ | 8 | $ | 42 | ||||
Management transition | 3 | 28 | ||||||
Other | 15 | 14 | ||||||
Total | $ | 26 | $ | 84 | ||||
In 2016 and 2015, we recorded $8 million and $42 million, respectively, of costs to reduce our store and home office expenses. The costs relate to employee termination benefits, lease termination costs and impairment charges associated with the closure of 7 underperforming department stores in 2016. Additionally, the costs include employee termination benefits in connection with the elimination of approximately 300 positions in our home office in 2015.
32
We also implemented several changes within our management leadership team during 2016 and 2015 that resulted in management transition costs of $3 million and $28 million, respectively, for both incoming and outgoing members of management. Other miscellaneous restructuring charges of $15 million and $14 million, primarily related to contract termination and other costs associated with our previous shops strategy, were recorded during 2016 and 2015, respectively.
Operating Income/(Loss)
For 2016, we reported an operating income of $395 million compared to an operating loss of $89 million in 2015, which was an improvement of $484 million.
(Gain)/Loss on Extinguishment of Debt
During the first quarter of 2016, we repurchased and retired $60 million aggregate principal amount of our outstanding debt resulting in a gain on extinguishment of debt of $4 million.
During the second quarter of 2016, we completed the refinancing of the 2013 Term Loan Facility and the issuance of the Senior Secured Notes, resulting in a loss on extinguishment of debt of $34 million.
In December 2015, we prepaid and retired the outstanding $494 million principal amount of the term loan under our $2,350 million asset-based senior credit facility (2014 Credit Facility) and recognized a loss on extinguishment of debt of $10 million for the write off of the related unamortized debt issuance costs.
Net Interest Expense
In 2016, Net interest expense was $363 million, a decrease of $42 million, or 10.4%, from $405 million in 2015. The reduction in net interest expense is primarily due to refinancing the 2013 Term Loan Facility.
Income Taxes
Our net deferred tax assets, which include the future tax benefits of our net operating loss carryforwards, are subject to a valuation allowance. At January 28, 2017, the federal and state valuation allowances were $765 million and $228 million, respectively. Future book pre-tax losses will require additional valuation allowances to offset the deferred tax assets created. Until such time that we achieve sufficient profitability to allow removal of most of our valuation allowance, utilization of our loss carryforwards will result in a corresponding decrease in the valuation allowance and offset our tax provision dollar for dollar.
Each period we are required to allocate our income tax expense or benefit to continuing operations and other items such as other comprehensive income and stockholder’s equity. In accordance with these rules when we have a loss in continuing operations and a gain in other comprehensive income, as arose in 2013, we are required to recognize a tax benefit in continuing operations up to the amount of tax expense that we are required to report in other comprehensive income. In 2016, we experienced income in both continuing operations and other comprehensive income. Under the allocation rules we are required to recognize the valuation allowance allocable to the tax benefit attributable to these losses in each component of comprehensive income. Accordingly, there is no valuation allowance offsetting a deferred tax benefit attributable to other comprehensive income included in the total valuation allowance of $993 million noted above.
For 2016, we recorded a net tax expense of $1 million. The net tax expense included $7 million related to the amortization of certain indefinite-lived intangible assets, $9 million for state and foreign jurisdictions where loss carryforwards are limited or unavailable offset by net tax benefits of $1 million to adjust the valuation allowance, $2 million for state audit settlements and $12 million related to other comprehensive income.
For 2015, we recorded a net tax expense of $9 million. The net tax expense included $7 million related to the amortization of certain indefinite-lived intangible assets, $12 million for state and foreign jurisdictions where loss carryforwards are limited or unavailable offset by net tax benefits of $2 million for state audit settlements and $8 million to adjust the valuation allowance.
Net Income/(Loss) and Adjusted Net Income/(Loss)
In 2016, we reported income of $1 million, or $0.00 per share, compared with a loss of $513 million, or $1.68 per share, in 2015. Excluding the impact of restructuring and management transition charges, the impact of our Primary Pension Plan expense, the mark-to-market adjustment for supplemental retirement plans, the loss on extinguishment of debt, the net gain on sale of non-operating assets, the proportional share of net income from joint venture and the tax impact resulting from other comprehensive income allocation, adjusted net income/(loss) (non-GAAP) went from a loss of $315 million, or $1.03 per share, in 2015 to income of $24 million, or $0.08, in 2016.
33
Overall, net income/(loss) and adjusted net income/(loss) improved significantly in 2016 as compared to the corresponding prior year periods as we were able to reduce our operating costs.
Adjusted EBITDA (non-GAAP)
In 2016, adjusted EBITDA was $1,009 million, improving $294 million for 2016 compared to adjusted EBITDA of $715 million for the prior year corresponding period.
Non-GAAP Financial Measures
We report our financial information in accordance with generally accepted accounting principles in the United States (GAAP). However, we present certain financial measures and ratios identified as non-GAAP under the rules of the Securities and Exchange Commission (SEC) to assess our results. We believe the presentation of these non-GAAP financial measures and ratios is useful in order to better understand our financial performance as well as to facilitate the comparison of our results to the results of our peer companies. In addition, management uses these non-GAAP financial measures and ratios to assess the results of our operations. It is important to view non-GAAP financial measures in addition to, rather than as a substitute for, those measures and ratios prepared in accordance with GAAP. We have provided reconciliations of the most directly comparable GAAP measures to our non-GAAP financial measures presented.
The following non-GAAP financial measures are adjusted to exclude the impact of restructuring and management transition charges, the impact of our qualified defined benefit pension plan (Primary Pension Plan), the mark-to-market (MTM) adjustment for supplemental retirement plans, the loss on extinguishment of debt, the net gain on the sale of non-operating assets, certain net gains, the proportional share of net income from our joint venture formed to develop the excess property adjacent to our home office facility in Plano, Texas (Home Office Land Joint Venture), the tax impact for the allocation of income taxes to other comprehensive income items related to our Primary Pension Plan and interest rate swaps and the impact of tax reform. Unlike other operating expenses, the impact of restructuring and management transition charges, the loss on extinguishment of debt, the net gain on the sale of non-operating assets, certain net gains, the proportional share of net income from the Home Office Land Joint Venture, the tax impact for the allocation of income taxes to other comprehensive income items related to our Primary Pension Plan and interest rate swaps and the impact of tax reform are not directly related to our ongoing core business operations. Primary Pension Plan expense/(income) and the mark-to-market adjustment for supplemental retirement plans are determined using numerous complex assumptions about changes in pension assets and liabilities that are subject to factors beyond our control, such as market volatility. Accordingly, we eliminate our Primary Pension Plan expense/(income) in its entirety as we view all components of net periodic benefit expense/(income) as a single, net amount, consistent with its presentation in our Consolidated Financial Statements. We believe it is useful for investors to understand the impact of restructuring and management transition charges, Primary Pension Plan expense/(income), the mark-to-market adjustment for supplemental retirement plans, the loss on extinguishment of debt, the net gain on the sale of non-operating assets, certain net gains, the proportional share of net income from the Home Office Land Joint Venture, the tax impact for the allocation of income taxes to other comprehensive income items related to our Primary Pension Plan and interest rate swaps and the impact of tax reform on our financial results and therefore are presenting the following non-GAAP financial measures: (1) adjusted EBITDA; (2) adjusted net income/(loss); and (3) adjusted earnings/(loss) per share-diluted.
34
Adjusted EBITDA. The following table reconciles net income/(loss), the most directly comparable GAAP measure, to adjusted EBITDA, which are non-GAAP financial measures:
($ in millions) | 2017 | 2016 | 2015 | 2014 | 2013 | ||||||||||||||
Net income/(loss) from continuing operations | $ | (116 | ) | $ | 1 | $ | (513 | ) | $ | (717 | ) | $ | (1,278 | ) | |||||
Add: Net interest expense | 325 | 363 | 405 | 406 | 352 | ||||||||||||||
Add: Loss on extinguishment of debt | 33 | 30 | 10 | 34 | 114 | ||||||||||||||
Add: Income tax expense/(benefit) | (126 | ) | 1 | 9 | 23 | (430 | ) | ||||||||||||
Add: Depreciation and amortization | 570 | 609 | 616 | 631 | 601 | ||||||||||||||
Add: Restructuring and management transition charges | 303 | 26 | 84 | 87 | 215 | ||||||||||||||
Add: Primary pension plan expense/(income) | (11 | ) | 1 | 154 | (1) | (18 | ) | (52 | ) | ||||||||||
Add: Mark-to-market adjustment for supplemental retirement plans | 25 | 11 | — | 12 | (2 | ) | |||||||||||||
Less: Net gain on the sale of non-operating assets | — | (5 | ) | (9 | ) | (25 | ) | (132 | ) | ||||||||||
Less: Proportional share of net income from home office land joint venture | (31 | ) | (28 | ) | (41 | ) | (53 | ) | — | ||||||||||
Less: Certain net gains | — | — | — | (88 | ) | (2) | — | ||||||||||||
Adjusted EBITDA (non-GAAP) | $ | 972 | $ | 1,009 | $ | 715 | $ | 292 | $ | (612 | ) | ||||||||
(1) | Includes $52 million mark-to-market adjustment. |
(2) | Represents the net gain on the sale of one department store location and the net gain recognized on a payment received from a landlord to terminate an existing lease prior to its original expiration date. |
35
Adjusted Net Income/(Loss) and Adjusted Diluted EPS from Continuing Operations. The following table reconciles net income/(loss) and diluted EPS from continuing operations, the most directly comparable GAAP financial measures, to adjusted net income/(loss) and adjusted diluted EPS from continuing operations, non-GAAP financial measures:
($ in millions, except per share data) | 2017 | 2016 | 2015 | 2014 | 2013 | |||||||||||||||
Net income/(loss) (GAAP) from continuing operations | $ | (116 | ) | $ | 1 | $ | (513 | ) | $ | (717 | ) | $ | (1,278 | ) | ||||||
Diluted EPS (GAAP) from continuing operations | $ | (0.37 | ) | $ | — | $ | (1.68 | ) | $ | (2.35 | ) | $ | (5.13 | ) | ||||||
Add: restructuring and management transition charges | 303 | 26 | 84 | 87 | 215 | |||||||||||||||
Add/(deduct): primary pension plan expense/(income) | (11 | ) | 1 | 154 | (1) | (18 | ) | (52 | ) | |||||||||||
Add: Mark-to-market adjustment for supplemental retirement plans | 25 | 11 | — | 12 | (2 | ) | ||||||||||||||
Add: Loss on extinguishment of debt | 33 | 30 | 10 | 34 | 114 | |||||||||||||||
Less: Net gain on sale or redemption of non-operating assets | — | (5 | ) | (9 | ) | (25 | ) | (132 | ) | |||||||||||
Less: Proportional share of net income from home office land joint venture | (31 | ) | (28 | ) | (41 | ) | (53 | ) | — | |||||||||||
Less: Certain net gains | — | — | — | (88 | ) | (2) | — | |||||||||||||
Less: Aggregate tax impact related to the above adjustments | — | (3) | — | (3) | — | (3) | 2 | (4) | (22 | ) | (5) | |||||||||
Less: Tax impact resulting from other comprehensive income allocation | (60 | ) | (6) | (12 | ) | (6) | — | — | (250 | ) | (6) | |||||||||
Less: Impact of tax reform | (75 | ) | — | — | — | — | ||||||||||||||
Adjusted net income/(loss) (non-GAAP) from continuing operations | $ | 68 | $ | 24 | $ | (315 | ) | $ | (766 | ) | $ | (1,407 | ) | |||||||
Adjusted diluted EPS (non-GAAP) from continuing operations | $ | 0.22 | $ | 0.08 | $ | (1.03 | ) | $ | (2.51 | ) | $ | (5.64 | ) | |||||||
(1) | Includes $52 million mark-to-market adjustment. |
(2) | Represents the net gain on the sale of one department store location and the net gain recognized on a payment received from a landlord to terminate an existing lease prior to its original expiration date. |
(3) | Reflects no tax effect due to the impact of the Company's tax valuation allowance. |
(4) | Tax effect represents state taxes payable in separately filing states related to the sale of assets. |
(5) | Tax effect for the three months ended May 4, 2013 was calculated using the Company's statutory rate of 38.82% and includes state taxes payable in separately filing states related to the sale of assets. The last nine months of 2013 reflects no tax effect due to the impact of the Company's tax valuation allowance. |
(6) | Represents the tax benefits related to the allocation of tax expense to other comprehensive income items, including the amortization of actuarial losses and prior service costs related to the Primary Pension Plan and the results of our annual remeasurement of our pension plans. |
Financial Condition and Liquidity
Overview
Our primary sources of liquidity are cash generated from operations, available cash and cash equivalents and access to our revolving credit facility. During 2017, we executed the following transactions:
• | Sold our Buena Park, California distribution facility for a net sale price of $131 million and recorded a net gain of $111 million. |
• | We paid $334 million to settle cash tender offers with respect to portions of our outstanding 5.75% Senior Notes due 2018 (2018 Notes) and 8.125% Senior Notes due 2019 (2019 Notes) and amended and restated our $2.35 billion senior secured asset-based revolving credit facility (Revolving Credit Facility) to extend the maturity date to June 20, 2022 and to lower the interest rate spread by 75 basis points. |
We ended the year with $458 million of cash and cash equivalents, a decrease of $429 million from the prior year. As of the end of 2017, based on our borrowing base and amounts reserved for outstanding standby and import letters of credit, we had $1,884 million available for future borrowings under the Revolving Facility, providing a total available liquidity of approximately $2.3 billion.
36
The following table provides a summary of our key components and ratios of financial condition and liquidity:
($ in millions) | 2017 | 2016 | 2015 | ||||||||
Cash and cash equivalents | $ | 458 | $ | 887 | $ | 900 | |||||
Merchandise inventory | 2,762 | 2,854 | 2,721 | ||||||||
Property and equipment, net | 4,281 | 4,599 | 4,816 | ||||||||
Total debt and other financing obligations (1) | 4,232 | 4,836 | 4,805 | ||||||||
Stockholders’ equity | 1,379 | 1,354 | 1,309 | ||||||||
Total capital | 5,611 | 6,190 | 6,114 | ||||||||
Maximum capacity under our Revolving Credit Facility | 2,350 | 2,350 | 2,350 | ||||||||
Cash flow from operating activities | 454 | 334 | 440 | ||||||||
Free cash flow (non-GAAP) (2) | 213 | 3 | 131 | ||||||||
Capital expenditures | 395 | 427 | 320 | ||||||||
Ratios: | |||||||||||
Debt-to-total capital (3) | 75.4 | % | 78.1 | % | 78.6 | % | |||||
Cash-to-debt (4) | 10.8 | % | 18.3 | % | 18.7 | % | |||||
(1) | Includes long-term debt, net of unamortized debt issuance costs, including current maturities, capital leases, financing obligation, note payable and any borrowings under our revolving credit facility. |
(2) | See below for a discussion of this non-GAAP financial measure and reconciliation to its most directly comparable GAAP financial measure. |
(3) | Total debt and other financing obligations divided by total capital. |
(4) | Cash and cash equivalents divided by total debt. |
Free Cash Flow (Non-GAAP)
Free cash flow is a key financial measure of our ability to generate additional cash from operating our business. We define free cash flow as cash flow from operating activities, less capital expenditures and dividends paid, plus the proceeds from the sale of operating assets. Free cash flow is a relevant indicator of our ability to repay maturing debt, revise our dividend policy or fund other uses of capital that we believe will enhance stockholder value. Free cash flow is considered a non-GAAP financial measure under the rules of the SEC. Free cash flow is limited and does not represent remaining cash flow available for discretionary expenditures due to the fact that the measure does not deduct payments required for debt maturities, payments made for business acquisitions or required pension contributions, if any. Therefore, it is important to view free cash flow in addition to, rather than as a substitute for, our entire statement of cash flows and those measures prepared in accordance with GAAP.
The following table reconciles net cash provided by/(used in) operating activities, the most directly comparable GAAP measure, to free cash flow, a non-GAAP financial measure, as well as information regarding net cash provided by/(used in) investing activities and net cash provided by/(used in) financing activities.
($ in millions) | 2017 | 2016 | 2015 | 2014 | 2013 | ||||||||||||||
Net cash provided by/(used in) operating activities (GAAP) | $ | 454 | $ | 334 | $ | 440 | $ | 239 | $ | (1,814 | ) | ||||||||
Less: | |||||||||||||||||||
Capital expenditures | (395 | ) | (427 | ) | (320 | ) | (252 | ) | (951 | ) | |||||||||
Plus: | |||||||||||||||||||
Proceeds from sale of operating assets | 154 | 96 | 11 | 70 | 19 | ||||||||||||||
Free cash flow (non-GAAP) | $ | 213 | $ | 3 | $ | 131 | $ | 57 | $ | (2,746 | ) | ||||||||
Net cash provided by/(used in) investing activities (1) | $ | (229 | ) | $ | (316 | ) | $ | (296 | ) | $ | (142 | ) | $ | (789 | ) | ||||
Net cash provided by/(used in) financing activities | $ | (654 | ) | $ | (31 | ) | $ | (562 | ) | $ | (294 | ) | $ | 3,188 | |||||
(1) | Net cash provided by/(used in) investing activities includes capital expenditures and proceeds from sale of operating assets, which are also included in our computation of free cash flow. |
37
During 2017, free cash flow increased $210 million to an inflow of $213 million compared to an inflow of $3 million in 2016. Free cash flow improved due to increased cash from operations, lower capital expenditures and higher proceeds from the sale of operating assets in 2017 when compared to 2016.
Operating Activities
While a significant portion of our sales, profit and operating cash flows have historically been realized in the fourth quarter, our quarterly results of operations may fluctuate significantly as a result of many factors, including seasonal fluctuations in customer demand, product offerings, inventory levels and the impact of our strategy to return to profitable growth.
In 2017, cash flow from operating activities was an inflow of $454 million, an increase of $120 million compared to an inflow of $334 million during the same period last year. Our net loss as of the end of 2017 of $116 million included significant charges and credits that did not impact operating cash flow, including depreciation and amortization, certain restructuring charges, loss on extinguishment of debt, benefit plans, the sale of operating and non-operating assets and stock-based compensation. Overall, the increase in cash from operations was driven primarily by our improved inventory position. In addition, during 2017 we received an aggregate cash distribution of $40 million from the Home Office Land Joint Venture of which $31 million was included in operating activities and $9 million was classified as investing activities as it was considered a return of investment as the aggregate cash distribution exceeded our proportional share of the cumulative earnings of the joint venture by this amount. Cash flows from operating activities also included construction allowances from landlords of $20 million, which provided additional cash that was used to fund a portion of our capital expenditures in investing activities.
Merchandise inventory decreased $92 million to $2,762 million, or 3.2%, as of the end of 2017 compared to $2,854 million as of the end of last year. Inventory turns for 2017, 2016 and 2015 were 2.76, 2.59 and 2.65 respectively. Merchandise accounts payable decreased $4 million at the end of 2017 compared to 2016.
In 2016, cash flow from operating activities was an inflow of $334 million, a decrease of $106 million compared to an inflow of $440 million during the prior year. Our net income as of the end of 2016 of $1 million included significant charges and credits that did not impact operating cash flow, including depreciation and amortization, certain restructuring and management transition charges, loss on extinguishment of debt, benefit plans, the sale of operating and non-operating assets and stock-based compensation. Overall, the decrease in cash from operations was driven primarily by the payment of incentive compensation and other expenses in 2016 where such incurred expenses did not accrue at the sames levels as had occurred in 2015. In addition, during 2016 we received an aggregate cash distribution of $44 million from the Home Office Land Joint Venture. Cash flows from operating activities also included construction allowances from landlords of $43 million, which provided additional cash that was used to fund a portion of our capital expenditures in investing activities.
Investing Activities
In 2017, investing activities was a cash outflow of $229 million compared to an outflow of $316 million for 2016. The decrease in the cash outflow from investing activities was primarily a result lower capital expenditures and the increase in proceeds from the sale of operating assets.
For 2017, capital expenditures were $395 million. At the end of the year, we also had an additional $58 million of accrued capital expenditures, which will be paid in subsequent periods. The capital expenditures for 2017 related primarily to investments in our store environment and store facility improvements, including investments in 70 new and 32 expanded Sephora inside JCPenney stores, the roll out of 100 new appliance showrooms and investments in information technology in both our home office and stores. We received construction allowances from landlords of $20 million in 2017, which are classified as operating activities, to fund a portion of the capital expenditures related to store leasehold improvements. These funds have been recorded as deferred rent credits in the Consolidated Balance Sheets and are amortized as an offset to rent expense. Additionally, we received net cash proceeds of $131 million for the sale of our Buena Park, California distribution facility.
In 2016, investing activities was a cash outflow of $316 million compared to an outflow of $296 million for 2015. The increase in the cash outflow from investing activities was primarily a result of an increase in capital expenditures offset by the increase in proceeds from the sale of operating assets.
For 2016, capital expenditures were $427 million. At the end of the year, we also had an additional $33 million of accrued capital expenditures, which were paid in 2017. The capital expenditures for 2016 related primarily to the roll out of over 500 appliance showrooms, the roll out of our center core concept in 350 locations, the opening of 60 Sephora inside JCPenney stores, other investments in our store environment and store facility improvements and investments in information technology
38
in both our home office and stores. We also received construction allowances from landlords of $43 million in 2016. Additionally, we received $80 million in cash proceeds for the sale of land near our home office.
The following provides a breakdown of capital expenditures:
($ in millions) | 2017 | 2016 | 2015 | ||||||||
Store renewals and updates | $ | 178 | $ | 240 | $ | 170 | |||||
Capitalized software | 123 | 100 | 93 | ||||||||
New and relocated stores | 5 | 17 | — | ||||||||
Technology and other | 89 | 70 | 57 | ||||||||
Total | $ | 395 | $ | 427 | $ | 320 | |||||
We expect our investment in capital expenditures for 2018 to be approximately $375 million, net of construction allowances from landlords, which will relate primarily to our store environment, investments in information technology and the continued roll-out of approximately 30 new Sephora inside JCPenney locations and the conversion of approximately 100 of our salons to The Salon by InStyle format. Our plan is to fund these expenditures with cash flow from operations and existing cash and cash equivalents.
Financing Activities
In 2017, cash flows from financing activities were an outflow of $654 million compared to an outflow of $31 million for the same period last year.
During 2017, we paid $334 million to settle cash tender offers with respect to portions of our outstanding 2018 Notes and 2019 Notes. Additionally, we repurchased and retired $40 million aggregate principal amount of our 2020 Notes, repaid $220 million of debt at maturity and repaid $16 million on our capital leases and note payable.
During 2016, we completed the refinancing of our Senior Secured Term Loan Facility with our amended and restated $1.688 billion 2016 Term Loan Facility and the issuance of $500 million aggregate principal amount of 5.875% Senior Secured Notes due 2023. We also received net cash proceeds of $216 million for the sale-leaseback of our home office. Additionally, we repurchased and retired $60 million aggregate principal amount of our debt, repaid $78 million of debt at maturity and repaid $29 million on our capital leases and note payable.
Cash Flow and Financing Outlook
Our primary sources of liquidity are cash generated from operations, available cash and cash equivalents and access to our Revolving Credit Facility. Our cash flows may be impacted by many factors including the economic environment, consumer confidence, competitive conditions in the retail industry and the success of our strategies. For 2018, we believe that our existing liquidity will be adequate to fund our capital expenditures and working capital needs; however, in accordance with our long-term financing strategy, we may access the capital markets opportunistically.
2017 Credit Facility
The Company has a $2,350 million senior secured asset-based revolving credit facility . As of the end of 2017, we had no borrowings outstanding under the Revolving Credit Facility. In addition, as of the end of 2017, based on our borrowing base, we had $2,019 million available for borrowing under the facility, of which $135 million was reserved for outstanding standby and import letters of credit, none of which have been drawn on, leaving $1,884 million for future borrowings. The applicable rate for standby and import letters of credit were 2.50% and 1.25%, respectively, while the commitment fee was 0.375% for the unused portion of the Revolving Credit Facility.
Credit Ratings
Our credit ratings and outlook as of March 16, 2018 were as follows:
Corporate | Outlook | ||
Fitch Ratings | B+ | Stable | |
Moody’s Investors Service, Inc. | B1 | Stable | |
Standard & Poor’s Ratings Services | B+ | Negative | |
Credit rating agencies periodically review our capital structure and the quality and stability of our earnings. Rating agencies consider, among other things, changes in operating performance, comparable store sales, the economic environment, conditions
39
in the retail industry, financial leverage and changes in our business strategy in their rating decisions. Downgrades to our long-term credit ratings could result in reduced access to the credit and capital markets and higher interest costs on future financings.
Contractual Obligations and Commitments
Aggregated information about our obligations and commitments to make future contractual payments, such as debt and lease agreements, and contingent commitments as of February 3, 2018 is presented in the following table.
($ in millions) | Total | Less Than 1 Year | 1 - 3 Years | 3 - 5 Years | More Than 5 Years | ||||||||||||||
Recorded contractual obligations: | |||||||||||||||||||
Total debt, excluding unamortized debt issuance costs, capital leases, financing obligation and note payable | $ | 4,063 | $ | 232 | $ | 619 | $ | 84 | $ | 3,128 | |||||||||
Capital leases, financing obligation and note payable | 285 | 21 | 40 | 38 | 186 | ||||||||||||||
Unrecognized tax benefits (1) | 35 | 2 | — | — | 33 | ||||||||||||||
Contributions to non-qualified supplemental retirement plans (2) | 156 | 29 | 54 | 29 | 44 | ||||||||||||||
$ | 4,539 | $ | 284 | $ | 713 | $ | 151 | $ | 3,391 | ||||||||||
Unrecorded contractual obligations: | |||||||||||||||||||
Interest payments on long-term debt (3) | $ | 4,653 | $ | 242 | (4) | $ | 442 | $ | 389 | $ | 3,580 | ||||||||
Operating leases (5) | 2,535 | 211 | 356 | 282 | 1,686 | ||||||||||||||
Standby and import letters of credit (6) | 135 | 135 | — | — | — | ||||||||||||||
Surety bonds (7) | 68 | 68 | — | — | — | ||||||||||||||
Contractual obligations (8) | 114 | 74 | 39 | 1 | — | ||||||||||||||
Purchase orders (9) | 1,847 | 1,847 | — | — | — | ||||||||||||||
$ | 9,352 | $ | 2,577 | $ | 837 | $ | 672 | $ | 5,266 | ||||||||||
Total | $ | 13,891 | $ | 2,861 | $ | 1,550 | $ | 823 | $ | 8,657 | |||||||||
(1) | Represents management’s best estimate of the payments related to tax reserves for uncertain income tax positions. Based on the nature of these liabilities, the actual payments in any given year could vary significantly from these amounts. See Note 19 to the Consolidated Financial Statements. |
(2) | Represents expected cash payments through 2027. |
(3) | Includes interest expense related to our 2016 Term Loan Facility of $450 million that was calculated using its interest rate as of February 3, 2018 for the anticipated amount outstanding each period, which assumes the required principal payments for the loan remain the same each quarter. |
(4) | Includes $67 million of accrued interest that is included in our Consolidated Balance Sheet at February 3, 2018. |
(5) | Represents future minimum lease payments for non-cancelable operating leases, including renewals determined to be reasonably assured. Future minimum lease payments have not been reduced for sublease income. |
(6) | Standby letters of credit, which totaled $135 million, are issued as collateral to a third-party administrator for self-insured workers’ compensation and general liability claims and to support our merchandise initiatives. There were no outstanding import letters of credit at February 3, 2018. |
(7) | Surety bonds are primarily for previously incurred and expensed obligations related to workers’ compensation and general liability claims. |
(8) | Consists primarily of (a) minimum purchase requirements for exclusive merchandise and fixtures; (b) royalty obligations; and (c) minimum obligations for professional services, energy services, software maintenance and network services. |
(9) | Amounts committed under open purchase orders for merchandise inventory of which a significant portion are cancelable without penalty prior to a date that precedes the vendor’s scheduled shipment date. |
Off-Balance Sheet Arrangements
Management considers all on- and off-balance sheet debt in evaluating our overall liquidity position and capital structure. Other than operating leases, which are included in the Contractual Obligations and Commitments table, we do not have any material off-balance sheet financing. See detailed disclosure regarding operating leases in Note 15 to the Consolidated Financial Statements.
We do not have any additional arrangements or relationships with entities that are not consolidated into the financial statements.
40
Impact of Inflation, Deflation and Changing Prices
We have experienced inflation and deflation related to our purchase of certain commodity products. We do not believe that changing prices for commodities have had a material effect on our Net Sales or results of operations. Although we cannot precisely determine the overall effect of inflation and deflation on operations, we do not believe inflation and deflation have had
a material effect on our financial condition or results of operations.
Critical Accounting Policies
The preparation of our financial statements in conformity with accounting principles generally accepted in the United States requires that we make estimates and use assumptions that in some instances may materially affect amounts reported in the accompanying Consolidated Financial Statements. In preparing these financial statements, we have made our best estimates and judgments based on history and current trends, as well as other factors that we believe are relevant at the time of the preparation of our Consolidated Financial Statements. Historically, actual results have not differed materially from estimates; however, future events and their effects cannot be determined with certainty and as a result, actual results could differ from our assumptions and estimates.
See Note 2 to the Consolidated Financial Statements for a description of our significant accounting policies.
Inventory Valuation under the Retail Method
Inventories are valued at the lower of cost (using the first-in, first-out or “FIFO” method) or market, determined under the Retail Inventory Method (RIM). Under RIM, retail values of merchandise groups are converted to a cost basis by applying the specific average cost-to-retail ratio related to each merchandise grouping. RIM inherently requires management judgment and certain estimates that may significantly impact the ending inventory valuation at cost, as well as our Cost of goods sold. The most significant estimates are permanent reductions to retail prices (markdowns) and permanent devaluation of inventory (markdown accruals) used primarily to clear seasonal merchandise or otherwise slow-moving inventory and inventory shortage (shrinkage).
Permanent markdowns and markdown accruals are designated for clearance activity and are recorded at the point of decision, when the utility of inventory has diminished, versus the point of sale. Factors considered in the determination of permanent markdowns and markdown accruals include current and anticipated demand, customer preferences, age of the merchandise and style trends. Under RIM, permanent markdowns and markdown accruals result in the devaluation of inventory and the corresponding increase to cost of goods sold is recognized in the period the decision to execute the markdown is made. Shrinkage accruals are estimated as a percent of sales for a given period based on physical inventories or cycle count activities. Physical inventory counts for stores are are taken at least annually and cycle count activities for distribution centers and regional warehouses are executed on a daily basis. Inventory records and shrinkage accruals are adjusted appropriately based on the actual results from physical inventories and cycle counts. The shrinkage rate from the most recent physical inventory and cycle count activity, in combination with current events and historical experience, is used as the standard for the shrinkage accrual rate for the next inventory cycle or cycle count activity. Historically, our actual physical inventory and cycle counts results have shown our estimates to be reliable. Based on prior experience, we do not believe that the actual results will differ significantly from the assumptions used in these estimates.
Valuation of Long-Lived and Indefinite-Lived Assets
Long-Lived Assets
We evaluate recoverability of long-lived assets, such as property and equipment, whenever events or changes in circumstances indicate that the carrying value may not be recoverable, such as historical operating losses or plans to close stores and dispose of or sell long-lived assets before the end of their previously estimated useful lives. Additionally, annual operating performance of individual stores are periodically analyzed to identify potential underperforming stores which may require further evaluation of the recoverability of the carrying amounts. If our further evaluations of underperforming stores, performed on an undiscounted cash flow basis, indicate that the carrying amount of the asset may not be recoverable, the potential impairment is measured as the excess of carrying value over the fair value of the impaired asset. The impairment calculation requires us to apply estimates for future cash flows and use judgments for qualitative factors such as local market conditions, operating environment, mall performance and other trends. We estimate fair value based on either a projected discounted cash flow method using a discount rate that is considered commensurate with the risk inherent in our current business model or a appraised value method, as appropriate.
We recognize impairment losses in the earliest period that it is determined a loss has occurred. The carrying value is adjusted to the new carrying value and any subsequent increases in fair value are not recorded. If it is determined that the estimated remaining useful life of the asset should be decreased, the periodic depreciation expense is adjusted based on the new carrying
41
value of the asset. Impairment losses totaling $77 million in 2017 that related to Company's closure of 138 stores were recorded in the Consolidated Statement of Operations in the line item Restructuring and management transition.
While we do not believe there is a reasonable likelihood that there will be a material change in our estimates or assumptions used to calculate long-lived asset impairments, if actual results are not consistent with our current estimates and assumptions, we may be exposed to additional impairment charges, which could be material to our results of operations.
Indefinite-Lived Assets
We assess the recoverability of indefinite-lived intangible assets at least annually during the fourth quarter of our fiscal year or whenever events or changes in circumstances indicate that the carrying amount of the indefinite-lived intangible asset may not be fully recoverable. Examples of a change in events or circumstances include, but are not limited to, a decrease in the market price of the asset, a history of cash flow losses related to the use of the asset or a significant adverse change in the extent or manner in which an asset is being used. For our 2017 annual impairment test, we tested our indefinite-lived intangible assets utilizing the relief from royalty method to determine the estimated fair value for each indefinite-lived intangible asset. The relief from royalty method estimates our theoretical royalty savings from ownership of the intangible asset. Key assumptions used in this model include discount rates, royalty rates, growth rates, sales projections and terminal value rates. Discount rates, royalty rates, growth rates and sales projections are the assumptions most sensitive and susceptible to change as they require significant management judgment. Discount rates used are similar to the rates estimated by the weighted average cost of capital considering any differences in company-specific risk factors. Royalty rates are established by management based on comparable trademark licensing agreements in the market. Operational management, considering industry and company-specific historical and projected data, develops growth rates and sales projections associated with each indefinite-lived intangible asset. Terminal value rate determination follows common methodology of capturing the present value of perpetual sales estimates beyond the last projected period assuming a constant weighted average cost of capital and long-term growth rates.
While we do not believe there is a reasonable likelihood that there will be a material change in our estimates or assumptions used to calculate indefinite-lived asset impairments, if actual results are not consistent with our current estimates and assumptions, we may be exposed to additional impairment charges, which could be material to our results of operations.
Valuation of Deferred Tax Assets
We account for income taxes using the asset and liability method. Deferred tax assets and liabilities are recognized for the future tax consequences attributable to differences between the financial statement carrying amounts of existing assets and liabilities and their respective tax bases and operating loss and tax credit carryforwards. Deferred tax assets and liabilities are measured using enacted tax rates expected to apply to taxable income in the years in which those temporary differences are expected to be recovered or settled. The effect on deferred tax assets and liabilities of a change in tax rates is recognized in income in the period that includes the enactment date. A valuation allowance is recorded to reduce the carrying amounts of deferred tax assets unless it is more likely than not such assets will be realized.
In assessing the need for a valuation allowance, we consider both positive and negative evidence related to the likelihood of the realization of the deferred tax assets based on future events. Our accounting for deferred tax consequences represents our best estimate of those future events. If based on the weight of available evidence, it is more likely than not (defined as a likelihood of more than 50%) the deferred tax assets will not be realized, we record a valuation allowance. The weight given to both positive and negative evidence is commensurate with the extent to which the evidence may be objectively verified. As such, it is generally difficult for positive evidence regarding projected future taxable income, exclusive of reversing taxable temporary differences, to outweigh objective negative evidence of recent losses. Cumulative losses in recent years are a significant piece of negative evidence that is difficult to overcome in determining that a valuation allowance is not needed against deferred tax assets.
This assessment is completed on a taxing jurisdiction basis and takes into account several types of evidence, including the following:
• | Nature, frequency, and severity of current and cumulative financial reporting losses. A pattern of recent losses is heavily weighted as a source of negative evidence. In certain circumstances, historical information may not be as relevant due to a change in circumstances. |
• | Sources of future taxable income. Future reversals of existing temporary differences are heavily weighted sources of objectively verifiable positive evidence. Projections of future taxable income, exclusive of reversing temporary differences, are a source of positive evidence only when the projections are combined with a history of recent profits |
42
and can be reasonably estimated. Otherwise, these projections are considered inherently subjective and generally will not be sufficient to overcome negative evidence that includes cumulative losses in recent years, particularly if the projected future taxable income is dependent on an anticipated turnaround to profitability that has not yet been achieved. In such cases, we generally give these projections of future taxable income no weight for the purposes of our valuation allowance assessment.
• | Tax planning strategies. If necessary and available, tax-planning strategies would be implemented to accelerate taxable amounts to utilize expiring net operating loss carryforwards. These strategies would be a source of additional positive evidence and, depending on their nature, could be heavily weighted. |
In the second quarter of 2013, our net deferred tax position, exclusive of any valuation allowance, changed from a net deferred tax liability to a net deferred tax asset. In our assessment of the need for a valuation allowance, we heavily weighted the negative evidence of cumulative losses in recent periods and the positive evidence of future reversals of existing temporary differences. Although a sizable portion of our losses in recent years were the result of charges incurred for restructuring and other special items, even without these charges we still would have incurred significant losses. Accordingly, we considered our pattern of recent losses to be relevant to our analysis. Considering this pattern of recent losses and the uncertainties associated with projected future taxable income exclusive of reversing temporary differences, we gave no weight to projections showing future U.S. taxable income for purposes of assessing the need for a valuation allowance. As a result of our assessment, we concluded that, beginning in the second quarter of 2013, our estimate of the realization of deferred tax assets would be based solely on future reversals of existing taxable temporary differences and tax planning strategies that we would make use of to accelerate taxable income to utilize expiring carryforwards.
Future book pre-tax losses will require additional valuation allowances to offset the deferred tax assets created. A sustained period of profitability is required before we would change our need for a valuation allowance against our net deferred tax assets. Additionally, under the U.S. Tax Cuts and Jobs Act, additional NOLs that the Company may recognize in the future would not expire but would only be available to offset up to 80% of the Company’s future taxable income.
See Note 19 to the Consolidated Financial Statements for more information regarding income taxes and also Risk Factors, Item 1A.
Pension
Pension Accounting
We maintain a qualified funded defined benefit pension plan (Primary Pension Plan) and smaller non-qualified unfunded supplemental defined benefit plans. The determination of pension expense is the result of actuarial calculations that are based on important assumptions about pension assets and liabilities. The most important of these are the expected rate of return on assets and the discount rate assumptions. These assumptions require significant judgment and a change in any one of them could have a material impact on pension expense reported in our Consolidated Statements of Operations and Consolidated Statements of Comprehensive Income/(Loss), as well as in the assets, liability and equity sections of the Consolidated Balance Sheets.
The following table reflects our expected rate of return and discount rate assumptions:
2017 | 2016 | 2015 | |||||||
Expected return on plan assets | 6.50 | % | 6.75 | % | 6.75 | % | |||
Discount rate for pension expense | 4.40 | % | 4.73 | % | 3.87 | % | |||
Discount rate for pension obligation | 3.98 | % | 4.40 | % | 4.73 | % | |||
Return on Plan Assets and Impact on Earnings
For the Primary Pension Plan, we apply our expected return on plan assets using fair market value as of the annual measurement date. The fair market value method results in greater volatility to our pension expense than the more commonly used calculated value method (referred to as smoothing of assets). Our Primary Pension Plan asset base consists of a mix of equities (U.S., non-U.S. and private), fixed income (investment-grade and high-yield), real estate (private and public) and alternative asset classes.
The expected return on plan assets is based on the plan’s long-term asset allocation policy, historical returns for plan assets and overall capital market returns, taking into account current and expected market conditions. The expected return assumption for 2017 at 6.50% is slightly lower than 2016 given our current asset allocation targets and updated expected capital market return assumptions.
43
Discount Rate
The discount rate used to measure pension expense each year is the rate as of the beginning of the year (i.e., the prior measurement date). The discount rate, as determined by the plan actuary, is based on a hypothetical AA yield curve represented by a series of bonds maturing over the next 30 years, designed to match the corresponding pension benefit cash payments to retirees.
For 2017, the discount rate to measure pension expense was 4.40% compared to 4.73% in 2016. The discount rate to measure the pension obligations decreased to 3.98% as of February 3, 2018 from 4.40% as of January 28, 2017.
Sensitivity
The sensitivity of pension expense to a plus or minus one-half of one percent of expected return on assets is a decrease or increase in pension expense of approximately $17 million. An increase in the discount rate of one-half of one percent would increase the 2018 pension expense by approximately $5 million and a decrease in the discount rate of one-half of one percent would decrease pension expense by approximately $6 million.
Pension Funding
Funding requirements for our Primary Pension Plan are determined under Employee Retirement Income Security Act of 1974 (ERISA) rules, as amended by the Pension Protection Act of 2006. As a result of the funded status of the Primary Pension Plan, we are not required to make cash contributions in 2018.
Recent Accounting Pronouncements
In fiscal 2018, we will adopt ASC Topic 606 (ASC 606), Revenue from Contracts with Customers, a replacement of Revenue Recognition (Topic 605) using the full retrospective approach. The new revenue recognition standard provides a five-step analysis of transactions to determine when and how revenue is recognized. The core principle of the guidance is that a Company should recognize revenue to depict the transfer of promised goods or services to customers in an amount that reflects the consideration to which the entity expects to be entitled in exchange for those goods or services. Based on the new standard our revenue recognition policies related to gift card breakage, customer loyalty programs, credit card income and principal versus agent considerations will change.
We currently recognize gift card breakage (net of required escheatment) 60 months after the gift card is issued.In the future we will recognize gift card breakage (net of required escheatment) over the redemption pattern of gift cards. The change in policy will require us to record new gift card breakage amounts in a given period and to present such amounts in Net sales as opposed to our current reduction of SG&A classification.
Whereas we utilize the incremental cost method to account for our customer loyalty programs with a charge to Cost of goods sold, we will in the future account for our customer loyalty programs as Net sales which will require us to defer a portion of our Net sales to loyalty rewards to be earned by reward members for a future discount on a future sale.
We will also change the classification of profit sharing income earned in connection with our private label credit card and co-branded MasterCard® programs owned and serviced by Synchrony Financial (Synchrony). Under our agreement with Synchrony, we receive cash payments from Synchrony based upon the performance of the credit card portfolios. Currently the income we earn under our agreement with Synchrony is included as an offset to SG&A expenses. In connection with the adoption of the new standard, we plan to change our presentation to include such income in a separate line item described as Credit card income and other.
Whereas we currently consider ourselves to be the principal (report gross sales) or the agent (report net sales) based on our risk and rewards in a sales transaction, we will in the future assess principal versus agent considerations depending on our control of the good or service before it is transferred to the customer. The changes required by our new principal versus agent considerations will require us to reclassify the cost components of such transactions from a reduction of Net sales to a charge of Cost of goods sold.
In fiscal 2018, we will also adopt ASU 2017-07, Compensation - Retirement Benefits (Topic 715): Improving the Presentation of Net Periodic Pension Cost and Net Periodic Postretirement Benefit Cost on a retrospective basis. This new standard will require us to change the presentation of the service cost component and the other components of net periodic pension cost in the Consolidated Statement of Operations. The service cost component will be presented in SG&A along with other compensation costs and all the other pension cost components will be included in a new separate line item described as Other components of net periodic pension cost/(income).
44
Upon our retrospective adoption of ASC 606 and ASU 2017-07 on February 4, 2018, our Consolidated Statement of Operations for fiscal 2017 and 2016 will be impacted as shown in the table below:
(Unaudited) | 2017 | 2016 | |||||||||||||||||||||
($ in millions, except per share data) | As Reported | Adjustment | As Adjusted | As Reported | Adjustment | As Adjusted | |||||||||||||||||
Total net sales | $ | 12,506 | $ | 48 | $ | 12,554 | $ | 12,547 | $ | 24 | $ | 12,571 | |||||||||||
Credit income and other | — | 319 | 319 | — | 347 | 347 | |||||||||||||||||
Total revenues | $ | 12,506 | $ | 367 | $ | 12,873 | $ | 12,547 | $ | 371 | $ | 12,918 | |||||||||||
Costs and expenses/(income): | |||||||||||||||||||||||
Cost of goods sold (exclusive of depreciation and amortization shown separately below) | 8,174 | 34 | 8,208 | 8,071 | 26 | 8,097 | |||||||||||||||||
Selling, general and administrative (SG&A) | 3,468 | 377 | 3,845 | 3,538 | 418 | 3,956 | |||||||||||||||||
Pension | 21 | (21 | ) | — | 19 | (19 | ) | — | |||||||||||||||
Depreciation and amortization | 570 | — | 570 | 609 | — | 609 | |||||||||||||||||
Real estate and other, net | (146 | ) | — | (146 | ) | (111 | ) | — | (111 | ) | |||||||||||||
Restructuring and management transition | 303 | (119 | ) | 184 | 26 | — | 26 | ||||||||||||||||
Total costs and expenses | 12,390 | 271 | 12,661 | 12,152 | 425 | 12,577 | |||||||||||||||||
Operating income/(loss) | 116 | 96 | 212 | 395 | (54 | ) | 341 | ||||||||||||||||
Other components of net periodic pension cost/(income) | — | 98 | 98 | — | (36 | ) | (36 | ) | |||||||||||||||
Loss on extinguishment of debt | 33 | — | 33 | 30 | — | 30 | |||||||||||||||||
Net interest expense | 325 | — | 325 | 363 | — | 363 | |||||||||||||||||
Income/(loss) before income taxes | (242 | ) | (2 | ) | (244 | ) | 2 | (18 | ) | (16 | ) | ||||||||||||
Income tax expense/(benefit) | (126 | ) | — | (126 | ) | 1 | — | 1 | |||||||||||||||
Net income/(loss) | $ | (116 | ) | $ | (2 | ) | $ | (118 | ) | $ | 1 | $ | (18 | ) | $ | (17 | ) | ||||||
Earnings/(loss) per share: | |||||||||||||||||||||||
Basic | $ | (0.37 | ) | $ | (0.38 | ) | $ | — | $ | (0.06 | ) | ||||||||||||
Diluted | $ | (0.37 | ) | $ | (0.38 | ) | $ | — | $ | (0.06 | ) | ||||||||||||
Weighted average shares – basic | 311.1 | 311.1 | 308.1 | 308.1 | |||||||||||||||||||
Weighted average shares – diluted | 311.1 | 311.1 | 313.0 | 308.1 | |||||||||||||||||||
Refer to Note 4 to the Consolidated Financial Statements for discussion of other recent accounting pronouncements.
Cautionary Statement Regarding Forward-Looking Information
This Annual Report on Form 10-K contains forward-looking statements within the meaning of the Private Securities Litigation Reform Act of 1995, which reflect our current view of future events and financial performance. Words such as "expect" and similar expressions identify forward-looking statements, which include, but are not limited to, statements regarding sales, cost of goods sold, selling, general and administrative expenses, earnings, cash flows and liquidity. Forward-looking statements are based only on the Company's current assumptions and views of future events and financial performance. They are subject to known and unknown risks and uncertainties, many of which are outside of the Company's control, that may cause the Company's actual results to be materially different from planned or expected results. Those risks and uncertainties include, but are not limited to, general economic conditions, including inflation, recession, unemployment levels, consumer confidence and spending patterns, credit availability and debt levels, changes in store traffic trends, the cost of goods, more stringent or costly payment terms and/or the decision by a significant number of vendors not to sell us merchandise on a timely basis or at all, trade restrictions, the ability to monetize assets on acceptable terms, the ability to implement our strategic plan including our omnichannel initiatives, customer acceptance of our strategies, our ability to attract, motivate and retain key executives and
45
other associates, the impact of cost reduction initiatives, our ability to generate or maintain liquidity, implementation of new systems and platforms, changes in tariff, freight and shipping rates, changes in the cost of fuel and other energy and transportation costs, disruptions and congestion at ports through which we import goods, increases in wage and benefit costs, competition and retail industry consolidations, interest rate fluctuations, dollar and other currency valuations, the impact of weather conditions, risks associated with war, an act of terrorism or pandemic, the ability of the federal government to fund and conduct its operations, a systems failure and/or security breach that results in the theft, transfer or unauthorized disclosure of customer, employee or Company information, legal and regulatory proceedings and the Company's ability to access the debt or equity markets on favorable terms or at all. There can be no assurances that the Company will achieve expected results, and actual results may be materially less than expectations. While we believe that our assumptions are reasonable, we caution that it is impossible to predict the degree to which any such factors could cause actual results to differ materially from predicted results. For additional discussion on risks and uncertainties, see Part I, Item 1A, Risk Factors, above. We intend the forward-looking statements in this Annual Report on Form 10-K to speak only as of the date of this report and do not undertake to update or revise these projections as more information becomes available.
Item 7A. Quantitative and Qualitative Disclosures about Market Risk
All of our outstanding notes and debentures as of February 3, 2018 are at fixed interest rates and would not be affected by interest rate changes. The Revolving Facility borrowings under the 2017 Credit Facility are affected by interest rate changes. As of February 3, 2018, we had no borrowings outstanding under the Revolving Facility.
The Company's 2016 Term Loan Facility bears interest at a variable rate of LIBOR plus 4.25%. To manage the fluctuation of interest, the Company entered into interest rate swap agreements with notional amounts totaling $1,250 million to fix a portion of our variable LIBOR-based interest payments. The interest rate swap agreements, which were effective May 7, 2015, have a weighted-average fixed rate of 2.04%, mature on May 7, 2020 and have been designated as cash flow hedges. Accordingly, a 100 basis point increase in LIBOR interest rates would result in additional annual interest expense of $16 million under the 2016 Term Loan Facility and $13 million in less annual interest expense under the interest rate swap agreements.
The effects of changes in the U.S. equity and bond markets serve to increase or decrease the value of assets in our Primary Pension Plan. We seek to manage exposure to adverse equity and bond returns by maintaining diversified investment portfolios and utilizing professional investment managers.
Item 8. Financial Statements and Supplementary Data
See the Index to Consolidated Financial Statements on page 60.
Item 9. Changes in and Disagreements with Accountants on Accounting and Financial Disclosure
None.
Item 9A. Controls and Procedures
Conclusion Regarding the Effectiveness of Disclosure Controls and Procedures
The management of our Company, under the supervision and with the participation of our principal executive officer and principal financial officer, conducted an evaluation of the effectiveness of the design and operation of our disclosure controls and procedures (as defined in Rules 13a-15(e) and 15d-15(e) under the Securities Exchange Act of 1934 (the Exchange Act)) as of the end of the period covered by this Annual Report on Form 10-K. Based on this evaluation, our principal executive officer and principal financial officer concluded that our disclosure controls and procedures are effective to ensure that information required to be disclosed by us in the reports that we file or submit under the Exchange Act (i) is recorded, processed, summarized and reported within the time periods specified in the Securities and Exchange Commission’s rules and forms and (ii) is accumulated and communicated to management, including our principal executive officer and principal financial officer, as appropriate to allow timely decisions regarding required disclosure.
46
Management’s Report on Internal Control over Financial Reporting
The management of our Company is responsible for establishing and maintaining adequate internal control over financial reporting (as defined in Rules 13a-15(f) and 15d-15(f) under the Exchange Act). The management of our Company has assessed the effectiveness of our Company’s internal control over financial reporting as of February 3, 2018. In making this assessment, management used criteria set forth by the Committee of Sponsoring Organizations of the Treadway Commission (COSO) in Internal Control–Integrated Framework (2013). Based on its assessment, the management of our Company believes that, as of February 3, 2018, our Company’s internal control over financial reporting is effective based on those criteria.
The Company’s independent registered public accounting firm, KPMG LLP, has audited the financial statements included in this Annual Report on Form 10-K and has issued an attestation report on the effectiveness of our Company’s internal control over financial reporting. Their report follows.
Changes in Internal Control over Financial Reporting
There were no changes in our Company’s internal control over financial reporting during the fourth quarter ended February 3, 2018, that have materially affected, or are reasonably likely to materially affect, our Company’s internal control over financial reporting.
47
Report of Independent Registered Public Accounting Firm
To the Stockholders and Board of Directors
J. C. Penney Company, Inc.:
Opinion on Internal Control Over Financial Reporting
We have audited J. C. Penney Company, Inc. and subsidiaries’ (the Company) internal control over financial reporting as of February 03, 2018, based on criteria established in Internal Control - Integrated Framework (2013) issued by the Committee of Sponsoring Organizations of the Treadway Commission. In our opinion, the Company maintained, in all material respects, effective internal control over financial reporting as of February 03, 2018, based on criteria established in Internal Control - Integrated Framework (2013) issued by the Committee of Sponsoring Organizations of the Treadway Commission.
We also have audited, in accordance with the standards of the Public Company Accounting Oversight Board (United States) (PCAOB), the consolidated balance sheets of the Company as of February 03, 2018 and January 28, 2017, the related consolidated statements of operations, comprehensive income/(loss), stockholders’ equity, and cash flows for each of the years in the three-year period ended February 03, 2018, and the related notes (collectively, the consolidated financial statements), and our report dated March 19, 2018 expressed an unqualified opinion on those consolidated financial statements.
Basis for Opinion
The Company’s management is responsible for maintaining effective internal control over financial reporting and for its assessment of the effectiveness of internal control over financial reporting, included in the accompanying “Management’s Report on Internal Control Over Financial Reporting.” Our responsibility is to express an opinion on the Company’s internal control over financial reporting based on our audit. We are a public accounting firm registered with the PCAOB and are required to be independent with respect to the Company in accordance with the U.S. federal securities laws and the applicable rules and regulations of the Securities and Exchange Commission and the PCAOB.
We conducted our audit in accordance with the standards of the PCAOB. Those standards require that we plan and perform the audit to obtain reasonable assurance about whether effective internal control over financial reporting was maintained in all material respects. Our audit of internal control over financial reporting included obtaining an understanding of internal control over financial reporting, assessing the risk that a material weakness exists, and testing and evaluating the design and operating effectiveness of internal control based on the assessed risk. Our audit also included performing such other procedures as we considered necessary in the circumstances. We believe that our audit provides a reasonable basis for our opinion.
Definition and Limitations of Internal Control Over Financial Reporting
A company’s internal control over financial reporting is a process designed to provide reasonable assurance regarding the reliability of financial reporting and the preparation of financial statements for external purposes in accordance with generally accepted accounting principles. A company’s internal control over financial reporting includes those policies and procedures that (1) pertain to the maintenance of records that, in reasonable detail, accurately and fairly reflect the transactions and dispositions of the assets of the company; (2) provide reasonable assurance that transactions are recorded as necessary to permit preparation of financial statements in accordance with generally accepted accounting principles, and that receipts and expenditures of the company are being made only in accordance with authorizations of management and directors of the company; and (3) provide reasonable assurance regarding prevention or timely detection of unauthorized acquisition, use, or disposition of the company’s assets that could have a material effect on the financial statements.
Because of its inherent limitations, internal control over financial reporting may not prevent or detect misstatements. Also, projections of any evaluation of effectiveness to future periods are subject to the risk that controls may become inadequate because of changes in conditions, or that the degree of compliance with the policies or procedures may deteriorate.
/s/ KPMG LLP
Dallas, Texas
March 19, 2018
48
Item 9B. Other Information
None.
PART III
Item 10. Directors, Executive Officers and Corporate Governance
The information required by Item 10 with respect to executive officers is included within Item 1 in Part I of this Annual Report on Form 10-K under the caption “Executive Officers of the Registrant.”
The information required by Item 10 with respect to directors, audit committee, audit committee financial experts and Section 16(a) beneficial ownership reporting compliance is included under the captions “Board Committees–Audit Committee,” “Section 16(a) Beneficial Ownership Reporting Compliance” and “Proposal 1 - Election of Directors” in our definitive proxy statement for 2018, which will be filed with the Securities and Exchange Commission pursuant to Regulation 14A and is incorporated herein by reference.
Code of Ethics and Corporate Governance Guidelines
We have adopted a code of ethics for officers and employees, which applies to, among others, our principal executive officer, principal financial officer and principal accounting officer, and which is known as the “Statement of Business Ethics.” We have also adopted certain ethical principles and policies for our directors, which are set forth in Article V of our Corporate Governance Guidelines. The Statement of Business Ethics and Corporate Governance Guidelines are available on our website at www.jcpenney.com. Additionally, we will provide copies of these documents without charge upon request made to:
J. C. Penney Company, Inc.
Office of Investor Relations
6501 Legacy Drive
Plano, Texas 75024
(Telephone 972-431-5500)
Our Company intends to satisfy the disclosure requirement under Item 5.05 of Form 8-K regarding an amendment to or waiver of any provision of the Statement of Business Ethics that applies to any officer of the Company by posting such information on our website at www.jcpenney.com.
Item 11. Executive Compensation
The information required by Item 11 is included under the captions “Compensation Committee Interlocks and Insider Participation,” “Compensation Discussion and Analysis,” “Report of the Human Resources and Compensation Committee,” “Summary Compensation Table,” “Grants of Plan-Based Awards for Fiscal 2017,” “Outstanding Equity Awards at Fiscal Year-End 2017,” “Option Exercises and Stock Vested for Fiscal 2017,” “Nonqualified Deferred Compensation for Fiscal 2017,” “Potential Payments and Benefits on Termination of Employment,” “Director Compensation for Fiscal 2017,” and “CEO Pay Ratio” in our Company’s definitive proxy statement for 2018, which will be filed with the Securities and Exchange Commission pursuant to Regulation 14A and is incorporated herein by reference.
Item 12. Security Ownership of Certain Beneficial Owners and Management and Related Stockholder Matters
The information required by Item 12 with respect to beneficial ownership of our Company’s common stock is included under the caption “Beneficial Ownership of Common Stock” and with respect to equity compensation plans is included under the caption "Equity Compensation Plan(s) Information" in our Company’s definitive proxy statement for 2018, which will be filed with the Securities and Exchange Commission pursuant to Regulation 14A and is incorporated herein by reference.
Item 13. Certain Relationships and Related Transactions, and Director Independence
The information required by Item 13 is included under the captions “Policies and Procedures with Respect to Related Person Transactions” and “Board Independence” in our Company’s definitive proxy statement for 2018, which will be filed with the Securities and Exchange Commission pursuant to Regulation 14A and is incorporated herein by reference.
49
Item 14. Principal Accounting Fees and Services
The information required by Item 14 is included under the captions “Audit and Other Fees” and “Audit Committee’s Pre-Approval Policies and Procedures” in our Company’s definitive proxy statement for 2018, which will be filed with the Securities and Exchange Commission pursuant to Regulation 14A and is incorporated herein by reference.
PART IV
Item 15. Exhibits, Financial Statement Schedules
(a) Documents filed as part of this report:
1. Consolidated Financial Statements:
The Consolidated Financial Statements of J. C. Penney Company, Inc. and subsidiaries are listed in the accompanying "Index to Consolidated Financial Statements" on page 60.
2. Financial Statement Schedules:
Schedules have been omitted as they are inapplicable or not required under the rules, or the information has been submitted in the Consolidated Financial Statements and related financial information contained otherwise in this Annual Report on Form 10-K.
3. Exhibits:
Each management contract or compensatory plan or arrangement required to be filed as an exhibit to this Annual Report on Form 10-K is specifically identified in the Exhibit Index below and filed with or incorporated by reference in this report.
50
Exhibit Index
Incorporated by Reference | ||||||||||||
Filed | ||||||||||||
SEC | Filing | Herewith (†) | ||||||||||
Exhibit No. | Exhibit Description | Form | File No. | Exhibit | Date | (as indicated) | ||||||
2.1 | 8-K | 001-15274 | 2 | 1/28/2002 | ||||||||
3.1 | 10-Q | 001-15274 | 3.1 | 6/8/2011 | ||||||||
3.2 | 8-K | 001-15274 | 3.1 | 7/21/2016 | ||||||||
3.3 | 8-K | 001-15274 | 3.1 | 8/22/2013 | ||||||||
4.1 | 10-K | 001-00777 | 4(a) | 4/19/1994 | ||||||||
4.2 | 10-K | 001-00777 | 4(b) | 4/19/1994 | ||||||||
4.3 | 10-K | 001-00777 | 4(c) | 4/19/1994 | ||||||||
4.4 | † | |||||||||||
4.5 | Fourth Supplemental Indenture, dated as of June 7, 1991, between JCP and U.S. Bank National Association, Trustee (formerly First Trust of California, National Association, as Successor Trustee to Bank of America National Trust and Savings Association) | S-3 | 033-41186 | 4(e) | 6/13/1991 | |||||||
4.6 | 10-K | 001-15274 | 4(o) | 4/25/2002 | ||||||||
4.7 | 8-K | 001-15274 | 4.1 | 5/24/2013 | ||||||||
4.8 | S-3 | 033-53275 | 4(a) | 4/26/1994 | ||||||||
4.9 | 10-K | 001-15274 | 4(p) | 4/25/2002 | ||||||||
Other instruments evidencing long-term debt have not been filed as exhibits hereto because none of the debt authorized under any such instrument exceeds 10% of the total assets of the Registrant and its consolidated subsidiaries. The Registrant agrees to furnish a copy of any of its long-term debt instruments to the Securities and Exchange Commission upon request.
51
Incorporated by Reference | ||||||||||||
Filed | ||||||||||||
SEC | Filing | Herewith (†) | ||||||||||
Exhibit No. | Exhibit Description | Form | File No. | Exhibit | Date | (as indicated) | ||||||
4.10 | 10-Q | 001-15274 | 4 | 9/6/2002 | ||||||||
4.11 | 8-K | 001-15274 | 4.1 | 9/15/2014 | ||||||||
4.12 | 8-K | 001-15274 | 4.2 | 9/15/2014 | ||||||||
4.13 | 8-K | 001-15274 | 4.1 | 6/24/2016 | ||||||||
4.14 | 8-K | 001-15274 | 4.1 | 6/14/2011 | ||||||||
4.15 | 8-K | 001-15274 | 4.2 | 6/14/2011 | ||||||||
4.16 | 8-K | 001-15274 | 4.1 | 1/28/2014 | ||||||||
4.17 | 8-K | 001-15274 | 4.1 | 1/23/2017 | ||||||||
10.1 | 8-K | 001-15274 | 10.1 | 6/23/2014 | ||||||||
10.2 | 8-K | 001-15274 | 10.1 | 12/11/2015 | ||||||||
10.3 | 8-K | 001-15274 | 10.1 | 6/21/2017 | ||||||||
10.4 | 8-K | 001-15274 | 10.2 | 6/23/2014 | ||||||||
10.5 | 8-K | 001-15274 | 10.1 | 6/24/2016 | ||||||||
10.6 | 8-K | 001-15274 | 10.2 | 6/24/2016 | ||||||||
52
Incorporated by Reference | ||||||||||||
Filed | ||||||||||||
SEC | Filing | Herewith (†) | ||||||||||
Exhibit No. | Exhibit Description | Form | File No. | Exhibit | Date | (as indicated) | ||||||
10.7 | 8-K | 001-15274 | 10.3 | 6/24/2016 | ||||||||
10.8 | 8-K | 001-15274 | 10.4 | 6/24/2016 | ||||||||
10.9 | 8-K | 001-15274 | 10.1 | 11/6/2009 | ||||||||
10.10 | 8-K | 001-15274 | 10.1 | 10/29/2010 | ||||||||
10.11 | 8-K | 001-15274 | 10.1 | 2/4/2013 | ||||||||
10.12 | 8-K | 001-15274 | 10.1 | 10/15/2013 | ||||||||
10.13 | 10-Q | 001-15274 | 10.1 | 6/3/2014 | ||||||||
10.14 | 10-Q | 001-15274 | 10.1 | 6/4/2015 | ||||||||
10.15 | 10-K | 001-15274 | 10.14 | 3/16/2016 | ||||||||
10.16 | 10-Q | 001-15274 | 10.2 | 11/30/2016 | ||||||||
53
Incorporated by Reference | ||||||||||||
Filed | ||||||||||||
SEC | Filing | Herewith (†) | ||||||||||
Exhibit No. | Exhibit Description | Form | File No. | Exhibit | Date | (as indicated) | ||||||
10.17 | 10-K | 001-15274 | 10.16 | 3/24/2017 | ||||||||
10.18 | 10-Q | 001-15274 | 10.2 | 8/30/2017 | ||||||||
10.19** | J. C. Penney Company, Inc. Directors’ Equity Program Tandem Restricted Stock Award/Stock Option Plan | 10-K | 001-00777 | 10(k) | 4/24/1989 | |||||||
10.20** | J. C. Penney Company, Inc. 1993 Non-Associate Directors’ Equity Plan | Def. Proxy Stmt. | 001-00777 | B | 4/20/1993 | |||||||
10.21** | 10-K | 001-00777 | 10(ii)(m) | 4/18/1995 | ||||||||
10.22** | Directors’ Charitable Award Program | 10-K | 001-00777 | 10(r) | 4/25/1990 | |||||||
10.23** | Def. Proxy Stmt. | 001-00777 | A | 4/11/1997 | ||||||||
10.24** | Def. Proxy Stmt. | 001-00777 | B | 4/11/2001 | ||||||||
10.25** | 10-K | 001-15274 | 10.65 | 3/31/2009 | ||||||||
10.26** | Def. Proxy Stmt. | 001-15274 | Annex A | 3/31/2009 | ||||||||
10.27** | Def. Proxy Stmt. | 001-15274 | Annex A | 3/28/2012 | ||||||||
10.28** | Def. Proxy Stmt. | 001-15274 | Annex A | 3/21/2014 | ||||||||
10.29** | Def. Proxy Stmt. | 001-15274 | Annex A | 3/23/2016 | ||||||||
10.30** | 10-Q | 001-15274 | 10.1 | 9/12/2007 | ||||||||
10.31** | 8-K | 001-15274 | 10.5 | 2/15/2005 | ||||||||
10.32** | 8-K | 001-15274 | 10.1 | 5/24/2005 | ||||||||
10.33** | 8-K | 001-15274 | 10.1 | 11/18/2005 | ||||||||
10.34** | 8-K | 001-15274 | 10.1 | 9/26/2007 | ||||||||
10.35** | 10-Q | 001-15274 | 10.3 | 12/5/2013 | ||||||||
54
Incorporated by Reference | ||||||||||||
Filed | ||||||||||||
SEC | Filing | Herewith (†) | ||||||||||
Exhibit No. | Exhibit Description | Form | File No. | Exhibit | Date | (as indicated) | ||||||
10.36** | 8-K | 001-15274 | 10.2 | 5/21/2015 | ||||||||
10.37** | 10-K | 001-15274 | 10.33 | 3/16/2016 | ||||||||
10.38** | 8-K | 001-15274 | 10.1 | 5/19/2006 | ||||||||
10.39** | 8-K | 001-15274 | 10.2 | 5/19/2006 | ||||||||
10.40** | 8-K | 001-15274 | 10.8 | 2/15/2005 | ||||||||
10.41** | 8-K | 001-15274 | 10.3 | 5/19/2006 | ||||||||
10.42** | 8-K | 001-15274 | 10.4 | 5/19/2006 | ||||||||
10.43** | 8-K | 001-15274 | 10.1 | 3/15/2007 | ||||||||
10.44** | 8-K | 001-15274 | 10.1 | 3/7/2008 | ||||||||
10.45** | 10-K | 001-15274 | 10.60 | 3/31/2009 | ||||||||
10.46** | 8-K | 001-15274 | 10.1 | 6/14/2011 | ||||||||
10.47** | † | |||||||||||
10.48** | 10-K | 001-15274 | 10.53 | 3/31/2009 | ||||||||
10.49** | 10-Q | 001-15274 | 10.2 | 9/10/2008 | ||||||||
10.50** | 10-Q | 001-15274 | 10.1 | 11/30/2016 | ||||||||
10.51** | 10-K | 001-15274 | 10(ii)(ab) | 4/25/2002 | ||||||||
10.52** | 10-K | 001-15274 | 10.56 | 3/31/2009 | ||||||||
10.53** | 10-K | 001-15274 | 10.61 | 3/31/2009 | ||||||||
10.54** | 10-K | 001-15274 | 10.62 | 3/31/2009 | ||||||||
10.55** | 10-Q | 001-15274 | 10.2 | 9/9/2009 | ||||||||
10.56** | 10-Q | 001-15274 | 10.4 | 9/9/2009 | ||||||||
10.57** | 10-K | 001-15274 | 10.55 | 3/24/2017 | ||||||||
10.58** | 8-K | 001-15274 | 10.2 | 10/14/2014 | ||||||||
10.59** | 10-K | 001-15274 | 10.80 | 3/20/2013 | ||||||||
55
Incorporated by Reference | ||||||||||||
Filed | ||||||||||||
SEC | Filing | Herewith (†) | ||||||||||
Exhibit No. | Exhibit Description | Form | File No. | Exhibit | Date | (as indicated) | ||||||
10.60** | 10-K | 001-15274 | 10.82 | 3/20/2013 | ||||||||
10.61** | 8-K | 001-15274 | 10.1 | 3/24/2014 | ||||||||
10.62** | 8-K | 001-15274 | 10.2 | 3/24/2014 | ||||||||
10.63** | 10-Q | 001-15274 | 10.3 | 6/4/2015 | ||||||||
10.64** | 10-Q | 001-15274 | 10.4 | 6/4/2015 | ||||||||
10.65** | 10-Q | 001-15274 | 10.5 | 6/4/2015 | ||||||||
10.66** | 10-Q | 001-15274 | 10.6 | 6/4/2015 | ||||||||
10.67** | 10-K | 001-15274 | 10.71 | 3/16/2016 | ||||||||
10.68** | 10-K | 001-15274 | 10.72 | 3/16/2016 | ||||||||
10.69** | 10-K | 001-15274 | 10.73 | 3/16/2016 | ||||||||
10.70** | 10-K | 001-15274 | 10.74 | 3/16/2016 | ||||||||
10.71** | 10-Q | 001-15274 | 10.1 | 5/31/2016 | ||||||||
10.72** | 10-Q | 001-15274 | 10.2 | 8/30/2016 | ||||||||
10.73** | 10-Q | 001-15274 | 10.1 | 06/7/2017 | ||||||||
10.74** | 10-Q | 001-15274 | 10.2 | 06/7/2017 | ||||||||
10.75** | 10-Q | 001-15274 | 10.3 | 06/7/2017 | ||||||||
10.76** | 8-K | 001-15274 | 10.1 | 7/24/2017 | ||||||||
12 | † | |||||||||||
21 | † | |||||||||||
23 | † | |||||||||||
24 | † | |||||||||||
31.1 | † | |||||||||||
31.2 | † | |||||||||||
32.1 | † | |||||||||||
32.2 | † | |||||||||||
101.INS | XBRL Instance Document | † | ||||||||||
101.SCH | XBRL Taxonomy Extension Schema Document | † | ||||||||||
101.CAL | XBRL Taxonomy Extension Calculation Linkbase Document | † | ||||||||||
101.DEF | XBRL Taxonomy Extension Definition Linkbase Document | † | ||||||||||
56
Incorporated by Reference | ||||||||||||
Filed | ||||||||||||
SEC | Filing | Herewith (†) | ||||||||||
Exhibit No. | Exhibit Description | Form | File No. | Exhibit | Date | (as indicated) | ||||||
101.LAB | XBRL Taxonomy Extension Label Linkbase Document | † | ||||||||||
101.PRE | XBRL Taxonomy Extension Presentation Linkbase Document | † | ||||||||||
** Indicates a management contract or compensatory plan or arrangement.
(b) See Exhibit Index above.
(c) Other Financial Statement Schedules. None.
Item 16. Form 10-K Summary
None.
57
SIGNATURES
Pursuant to the requirements of Section 13 or 15(d) of the Securities Exchange Act of 1934, the registrant has duly caused this report to be signed on its behalf by the undersigned, thereunto duly authorized.
J. C. PENNEY COMPANY, INC. | ||
(Registrant) | ||
By /s/ Andrew S. Drexler | ||
Andrew S. Drexler | ||
Senior Vice President, Chief Accounting Officer and Controller (principal accounting officer) | ||
Date: | May 30, 2018 | |
Pursuant to the requirements of the Securities Exchange Act of 1934, this report has been signed below by the following persons on behalf of the registrant and in the capacities and on the dates indicated.
Signatures | Title | Date | ||
Marvin R. Ellison* | Chief Executive Officer; Director (principal executive officer) | May 30, 2018 | ||
Marvin R. Ellison | ||||
Jeffrey A. Davis* | Executive Vice President and Chief Financial Officer (principal financial officer) | May 30, 2018 | ||
Jeffrey A. Davis | ||||
/s/ Andrew S. Drexler | Senior Vice President, Chief Accounting Officer and Controller (principal accounting officer) | May 30, 2018 | ||
Andrew S. Drexler | ||||
Paul J. Brown* | Director | May 30, 2018 | ||
Paul J. Brown | ||||
Amanda Ginsberg* | Director | May 30, 2018 | ||
Amanda Ginsberg | ||||
Wonya Y. Lucas* | Director | May 30, 2018 | ||
Wonya Y. Lucas | ||||
B. Craig Owens* | Director | May 30, 2018 | ||
Craig Owens | ||||
Lisa A. Payne* | Director | May 30, 2018 | ||
Lisa A. Payne | ||||
Debora A. Plunkett* | Director | May 30, 2018 | ||
Debora A. Plunkett | ||||
58
Signatures | Title | Date | ||
Leonard H. Roberts* | Director | May 30, 2018 | ||
Leonard H. Roberts | ||||
Javier G. Teruel* | Director | May 30, 2018 | ||
Javier G. Teruel | ||||
R. Gerald Turner* | Director | May 30, 2018 | ||
R. Gerald Turner | ||||
Ronald W. Tysoe* | Chairman of the Board; Director | May 30, 2018 | ||
Ronald W. Tysoe | ||||
*By: | /s/ Andrew S. Drexler | |
Andrew S. Drexler | ||
Attorney-in-fact | ||
59
J. C. PENNEY COMPANY, INC.
INDEX TO CONSOLIDATED FINANCIAL STATEMENTS
Page | |
60
REPORT OF INDEPENDENT REGISTERED PUBLIC ACCOUNTING FIRM
To the Stockholders and Board of Directors
J. C. Penney Company, Inc.:
Opinion on the Consolidated Financial Statements
We have audited the accompanying consolidated balance sheets of J. C. Penney Company, Inc. and subsidiaries (the Company) as of February 03, 2018 and January 28, 2017, the related consolidated statements of operations, comprehensive income/(loss), stockholders’ equity, and cash flows for each of the years in the three-year period ended February 03, 2018, and the related notes (collectively, the consolidated financial statements). In our opinion, the consolidated financial statements present fairly, in all material respects, the financial position of the Company as of February 03, 2018 and January 28, 2017, and the results of its operations and its cash flows for each of the years in the three-year period ended February 03, 2018, in conformity with U.S. generally accepted accounting principles.
We also have audited, in accordance with the standards of the Public Company Accounting Oversight Board (United States) (PCAOB), the Company’s internal control over financial reporting as of February 3, 2018, based on criteria established in Internal Control - Integrated Framework (2013) issued by the Committee of Sponsoring Organizations of the Treadway Commission, and our report dated March 19, 2018, expressed an unqualified opinion on the effectiveness of the Company’s internal control over financial reporting.
Change in Accounting Principle
As discussed in Note 3 to the consolidated financial statements, the Company has elected to change its method of accounting for merchandise inventories for its Internet operations from the lower of standard cost (representing average vendor cost) or net realizable value to the lower of cost or market determined by the retail inventory method in 2017.
Basis for Opinion
These consolidated financial statements are the responsibility of the Company’s management. Our responsibility is to express an opinion on these consolidated financial statements based on our audits. We are a public accounting firm registered with the Public Company Accounting Oversight Board (United States) (PCAOB) and are required to be independent with respect to the Company in accordance with the U.S. federal securities laws and the applicable rules and regulations of the Securities and Exchange Commission and the PCAOB.
We conducted our audits in accordance with the standards of the PCAOB. Those standards require that we plan and perform the audit to obtain reasonable assurance about whether the consolidated financial statements are free of material misstatement, whether due to error or fraud. Our audits included performing procedures to assess the risks of material misstatement of the consolidated financial statements, whether due to error or fraud, and performing procedures that respond to those risks. Such procedures included examining, on a test basis, evidence regarding the amounts and disclosures in the consolidated financial statements. Our audits also included evaluating the accounting principles used and significant estimates made by management, as well as evaluating the overall presentation of the consolidated financial statements. We believe that our audits provide a reasonable basis for our opinion.
/s/ KPMG LLP
We have served as the Company’s auditor since 1916.
Dallas, Texas
March 19, 2018
61
CONSOLIDATED STATEMENTS OF OPERATIONS
(In millions, except per share data) | 2017 | 2016 | 2015 | |||||||||
Total net sales | $ | 12,506 | $ | 12,547 | $ | 12,625 | ||||||
Costs and expenses/(income): | ||||||||||||
Cost of goods sold (exclusive of depreciation and amortization shown separately below) | 8,174 | 8,071 | 8,074 | |||||||||
Selling, general and administrative (SG&A) | 3,468 | 3,538 | 3,775 | |||||||||
Pension | 21 | 19 | 162 | |||||||||
Depreciation and amortization | 570 | 609 | 616 | |||||||||
Real estate and other, net | (146 | ) | (111 | ) | 3 | |||||||
Restructuring and management transition | 303 | 26 | 84 | |||||||||
Total costs and expenses | 12,390 | 12,152 | 12,714 | |||||||||
Operating income/(loss) | 116 | 395 | (89 | ) | ||||||||
Loss on extinguishment of debt | 33 | 30 | 10 | |||||||||
Net interest expense | 325 | 363 | 405 | |||||||||
Income/(loss) before income taxes | (242 | ) | 2 | (504 | ) | |||||||
Income tax expense/(benefit) | (126 | ) | 1 | 9 | ||||||||
Net income/(loss) | $ | (116 | ) | $ | 1 | $ | (513 | ) | ||||
Earnings/(loss) per share: | ||||||||||||
Basic | $ | (0.37 | ) | $ | — | $ | (1.68 | ) | ||||
Diluted | (0.37 | ) | — | (1.68 | ) | |||||||
Weighted average shares – basic | 311.1 | 308.1 | 305.9 | |||||||||
Weighted average shares – diluted | 311.1 | 313.0 | 305.9 | |||||||||
See the accompanying notes to the Consolidated Financial Statements.
62
CONSOLIDATED STATEMENTS OF COMPREHENSIVE INCOME/(LOSS)
($ in millions) | 2017 | 2016 | 2015 | |||||||||
Net income/(loss) | $ | (116 | ) | $ | 1 | $ | (513 | ) | ||||
Other comprehensive income/(loss), net of tax: | ||||||||||||
Retirement benefit plans | ||||||||||||
Net actuarial gain/(loss) arising during the period (1) | 67 | 1 | (213 | ) | ||||||||
Prior service credit/(cost) arising during the period (2) | — | 5 | — | |||||||||
Reclassification of net actuarial (gain)/loss from a settlement (3) | 8 | — | 110 | |||||||||
Reclassification for net actuarial (gain)/loss (4) | 16 | 1 | 31 | |||||||||
Reclassification for amortization of prior service (credit)/cost (5) | 4 | — | 2 | |||||||||
Reclassification of prior service (credit)/cost from a curtailment (6) | 3 | — | — | |||||||||
Cash flow hedges | ||||||||||||
Gain/(loss) on interest rate swaps (7) | 6 | 3 | (23 | ) | ||||||||
Reclassification for periodic settlements (8) | 7 | 8 | 6 | |||||||||
Foreign currency translation | ||||||||||||
Unrealized gain/(loss) | 2 | — | — | |||||||||
Deferred tax valuation allowance | — | — | (54 | ) | ||||||||
Total other comprehensive income/(loss), net of tax | 113 | 18 | (141 | ) | ||||||||
Total comprehensive income/(loss), net of tax | $ | (3 | ) | $ | 19 | $ | (654 | ) | ||||
See the accompanying notes to the Consolidated Financial Statements.
(1) | Net of $(36) million in tax in 2017, $(1) million in tax in 2016 and $136 million in tax in 2015. For 2017, the amount includes a |
$27 million pre-tax gain related to curtailment.
(2) | Net of $0 million in tax in 2017, $(3) million in tax in 2016 and $0 million in tax in 2015. |
(3) | Net of $(5) million and $(70) million in tax in 2017 and 2015, respectively. Pre-tax amounts of $13 million and $180 million were recognized in Pension in the Consolidated Statement of Operations in 2017 and 2015, respectively. |
(4) | Net of $(9) million in tax in 2017, $(1) million in tax in 2016 and $(22) million in tax in 2015. Pre-tax amounts of $25 million in 2017, $11 million in 2016 and $53 million in 2015 were recognized in Pension in the Consolidated Statement of Operations. Pre-tax amount of $(9) million in 2016 was recognized in SG&A in the Consolidated Statement of Operations. |
(5) | Net of $(3) million of tax in 2017, $0 million of tax in 2016 and $(1) million of tax in 2015. Pre-tax amounts of $7 million in 2017, $8 million in 2016 and $8 million in 2015 were recognized in Pension in the Consolidated Statement of Operations. Pre-tax amounts of $(8) million in 2016 and $(7) million in 2015 were recognized in SG&A in the Consolidated Statement of Operations. |
(6) | Net of $(1) million in tax in 2017. Pre-tax prior service cost of $5 million related to the curtailment is included in Restructuring and management transition in the Consolidated Statements of Operations in 2017. |
(7) | Net of $(3) million, $(2) million and $15 million of tax in 2017, 2016 and 2015, respectively. |
(8) | Net of $(3) million, $(5) million and $(4) million of tax in 2017, 2016 and 2015, respectively. Pre-tax amounts of $10 million in 2017, $13 million in 2016 and $10 million in 2015 were recognized in Net interest expense in the Consolidated Statement of Operations. |
63
CONSOLIDATED BALANCE SHEETS
(In millions, except per share data) | 2017 | 2016 | ||||||
Assets | ||||||||
Current assets: | ||||||||
Cash in banks and in transit | $ | 116 | $ | 125 | ||||
Cash short-term investments | 342 | 762 | ||||||
Cash and cash equivalents | 458 | 887 | ||||||
Merchandise inventory | 2,762 | 2,854 | ||||||
Prepaid expenses and other | 190 | 160 | ||||||
Total current assets | 3,410 | 3,901 | ||||||
Property and equipment | 4,281 | 4,599 | ||||||
Prepaid pension | 61 | — | ||||||
Other assets | 661 | 618 | ||||||
Total Assets | $ | 8,413 | $ | 9,118 | ||||
Liabilities and Stockholders’ Equity | ||||||||
Current liabilities: | ||||||||
Merchandise accounts payable | $ | 973 | $ | 977 | ||||
Other accounts payable and accrued expenses | 1,119 | 1,164 | ||||||
Current portion of capital leases, financing obligation and note payable | 8 | 15 | ||||||
Current maturities of long-term debt | 232 | 263 | ||||||
Total current liabilities | 2,332 | 2,419 | ||||||
Long-term capital leases, financing obligation and note payable | 212 | 219 | ||||||
Long-term debt | 3,780 | 4,339 | ||||||
Deferred taxes | 143 | 204 | ||||||
Other liabilities | 567 | 583 | ||||||
Total Liabilities | 7,034 | 7,764 | ||||||
Stockholders' Equity | ||||||||
Common stock (1) | 156 | 154 | ||||||
Additional paid-in capital | 4,705 | 4,679 | ||||||
Reinvested earnings/(accumulated deficit) | (3,122 | ) | (3,006 | ) | ||||
Accumulated other comprehensive income/(loss) | (360 | ) | (473 | ) | ||||
Total Stockholders’ Equity | 1,379 | 1,354 | ||||||
Total Liabilities and Stockholders’ Equity | $ | 8,413 | $ | 9,118 | ||||
(1) | 1,250 million shares of common stock are authorized with a par value of $0.50 per share. The total shares issued and outstanding were 312.0 million and 308.3 million as of February 3, 2018 and January 28, 2017, respectively. |
See the accompanying notes to the Consolidated Financial Statements.
64
CONSOLIDATED STATEMENTS OF STOCKHOLDERS’ EQUITY
(in millions) | Number of Common Shares | Common Stock | Additional Paid-in Capital | Reinvested Earnings/ (Accumulated Deficit) | Accumulated Other Comprehensive Income/(Loss) | Total Stockholders' Equity | |||||||||||||||||
January 31, 2015 | 304.9 | $ | 152 | $ | 4,606 | $ | (2,494 | ) | $ | (350 | ) | $ | 1,914 | ||||||||||
Net income/(loss) | — | — | — | (513 | ) | — | (513 | ) | |||||||||||||||
Other comprehensive income/(loss) | — | — | — | — | (141 | ) | (141 | ) | |||||||||||||||
Stock-based compensation | 1.2 | 1 | 48 | — | — | 49 | |||||||||||||||||
January 30, 2016 | 306.1 | $ | 153 | $ | 4,654 | $ | (3,007 | ) | $ | (491 | ) | $ | 1,309 | ||||||||||
Net income/(loss) | — | — | — | 1 | — | 1 | |||||||||||||||||
Other comprehensive income/(loss) | — | — | — | — | 18 | 18 | |||||||||||||||||
Stock-based compensation | 2.2 | 1 | 25 | — | — | 26 | |||||||||||||||||
January 28, 2017 | 308.3 | $ | 154 | $ | 4,679 | $ | (3,006 | ) | $ | (473 | ) | $ | 1,354 | ||||||||||
Net income/(loss) | — | — | — | (116 | ) | — | (116 | ) | |||||||||||||||
Other comprehensive income/(loss) | — | — | — | — | 113 | 113 | |||||||||||||||||
Stock-based compensation and other | 3.7 | 2 | 26 | — | — | 28 | |||||||||||||||||
February 3, 2018 | 312.0 | $ | 156 | $ | 4,705 | $ | (3,122 | ) | $ | (360 | ) | $ | 1,379 | ||||||||||
See the accompanying notes to the Consolidated Financial Statements.
65
CONSOLIDATED STATEMENTS OF CASH FLOWS
($ in millions) | 2017 | 2016 | 2015 | ||||||||
Cash flows from operating activities | |||||||||||
Net income/(loss) | $ | (116 | ) | $ | 1 | $ | (513 | ) | |||
Adjustments to reconcile net income/(loss) to net cash provided by/(used in) operating activities: | |||||||||||
Restructuring and management transition | 74 | (1 | ) | 10 | |||||||
Asset impairments and other charges | 6 | 3 | 25 | ||||||||
Net gain on sale of non-operating assets | — | (5 | ) | (9 | ) | ||||||
Net gain on sale of operating assets | (119 | ) | (73 | ) | (9 | ) | |||||
Loss on extinguishment of debt | 33 | 30 | 10 | ||||||||
Depreciation and amortization | 570 | 609 | 616 | ||||||||
Benefit plans | 106 | (39 | ) | 127 | |||||||
Stock-based compensation | 25 | 35 | 44 | ||||||||
Other comprehensive income tax benefits | (60 | ) | (12 | ) | — | ||||||
Deferred taxes | (63 | ) | 9 | — | |||||||
Change in cash from: | |||||||||||
Inventory | 92 | (133 | ) | (69 | ) | ||||||
Prepaid expenses and other assets | (15 | ) | 11 | 19 | |||||||
Merchandise accounts payable | (4 | ) | 52 | (72 | ) | ||||||
Income taxes | (12 | ) | (6 | ) | 4 | ||||||
Accrued expenses and other | (63 | ) | (147 | ) | 257 | ||||||
Net cash provided by/(used in) operating activities | 454 | 334 | 440 | ||||||||
Cash flows from investing activities | |||||||||||
Capital expenditures | (395 | ) | (427 | ) | (320 | ) | |||||
Proceeds from sale of non-operating assets | — | 2 | 13 | ||||||||
Proceeds from sale of operating assets | 154 | 96 | 11 | ||||||||
Joint venture return of investment | 9 | 13 | — | ||||||||
Insurance proceeds received for damage to property and equipment | 3 | — | — | ||||||||
Net cash provided by/(used in) investing activities | (229 | ) | (316 | ) | (296 | ) | |||||
Cash flows from financing activities | |||||||||||
Proceeds from issuance of long-term debt | — | 2,188 | — | ||||||||
Proceeds from borrowings under the credit facility | 804 | 667 | — | ||||||||
Payments of borrowings under the credit facility | (804 | ) | (667 | ) | — | ||||||
Net proceeds from financing obligation | — | 216 | — | ||||||||
Premium on early retirement of debt | (30 | ) | — | — | |||||||
Payments of capital leases, financing obligation and note payable | (16 | ) | (29 | ) | (33 | ) | |||||
Payments of long-term debt | (599 | ) | (2,349 | ) | (520 | ) | |||||
Financing costs | (9 | ) | (49 | ) | (4 | ) | |||||
Proceeds from stock issued under stock plans | 5 | 2 | — | ||||||||
Tax withholding payments for vested restricted stock | (5 | ) | (10 | ) | (5 | ) | |||||
Net cash provided by/(used in) financing activities | (654 | ) | (31 | ) | (562 | ) | |||||
Net increase/(decrease) in cash and cash equivalents | (429 | ) | (13 | ) | (418 | ) | |||||
Cash and cash equivalents at beginning of period | 887 | 900 | 1,318 | ||||||||
Cash and cash equivalents at end of period | $ | 458 | $ | 887 | $ | 900 | |||||
See the accompanying notes to the Consolidated Financial Statements.
66
NOTES TO CONSOLIDATED FINANCIAL STATEMENTS
1. Basis of Presentation and Consolidation
Nature of Operations
Our Company was founded by James Cash Penney in 1902 and has grown to be a major national retailer, operating 872 department stores in 49 states and Puerto Rico, as well as through our Internet website at jcpenney.com. We sell family apparel and footwear, accessories, fine and fashion jewelry, beauty products through Sephora inside JCPenney, and home furnishings. In addition, our department stores provide services, such as styling salon, optical, portrait photography and custom decorating, to customers.
Basis of Presentation and Consolidation
The Consolidated Financial Statements present the results of J. C. Penney Company, Inc. and our subsidiaries (the Company or JCPenney). All significant inter-company transactions and balances have been eliminated in consolidation.
We are a holding company whose principal operating subsidiary is J. C. Penney Corporation, Inc. (JCP). JCP was incorporated in Delaware in 1924, and J. C. Penney Company, Inc. was incorporated in Delaware in 2002, when the holding company structure was implemented. The holding company has no direct subsidiaries other than JCP, and has no independent assets or operations.
The Company is a co-obligor (or guarantor, as appropriate) regarding the payment of principal and interest on JCP’s outstanding debt securities. We guarantee certain of JCP’s outstanding debt securities fully and unconditionally.
Fiscal Year
Our fiscal year ends on the Saturday closest to January 31. Unless otherwise stated, references to years in this report relate to fiscal years rather than to calendar years.
Fiscal Year | Ended | Weeks | ||
2017 | February 3, 2018 | 53 | ||
2016 | January 28, 2017 | 52 | ||
2015 | January 30, 2016 | 52 | ||
Use of Estimates and Assumptions
The preparation of financial statements, in conformity with generally accepted accounting principles in the United States of America (GAAP), requires us to make assumptions and use estimates that affect the reported amounts of assets and liabilities and disclosure of contingent liabilities at the date of the financial statements and the reported amounts of revenues and expenses during the reporting period. Such estimates and assumptions are subject to inherent uncertainties, which may result in actual amounts differing from reported amounts.
2. Significant Accounting Policies
Merchandise and Services Revenue Recognition
Total net sales, which exclude sales taxes and are net of estimated returns, are generally recorded when payment is received and the customer takes possession of the merchandise. Service revenue is recorded at the time the customer receives the benefit of the service, such as salon, portrait, optical or custom decorating. Commissions earned on sales generated by licensed departments are included as a component of total net sales. Shipping and handling fees charged to customers are also included in total net sales with corresponding costs recorded as cost of goods sold. We provide for estimated future returns based primarily on historical return rates and sales levels.
67
Based on how we categorized our divisions in 2017, our merchandise mix of total net sales over the last three years was as follows:
2017 | 2016 | 2015 | |||||||
Women’s apparel | 22 | % | 23 | % | 25 | % | |||
Men’s apparel and accessories | 21 | % | 22 | % | 22 | % | |||
Home | 15 | % | 13 | % | 12 | % | |||
Women’s accessories, including Sephora | 13 | % | 13 | % | 12 | % | |||
Children’s apparel | 9 | % | 10 | % | 10 | % | |||
Footwear and handbags | 8 | % | 8 | % | 8 | % | |||
Jewelry | 6 | % | 6 | % | 6 | % | |||
Services and other | 6 | % | 5 | % | 5 | % | |||
100 | % | 100 | % | 100 | % | ||||
Gift Card Revenue Recognition
At the time gift cards are sold, no revenue is recognized; rather, a liability is established for the face amount of the card. The liability is relieved and revenue is recognized when gift cards are redeemed for merchandise or services. We escheat a portion of unredeemed gift cards according to Delaware escheatment requirements that govern remittance of the cost of the merchandise portion of unredeemed gift cards over five years old. After reflecting the amount escheated, any remaining liability (referred to as breakage) is relieved and recognized as a reduction of SG&A expenses as an offset to the costs of administering the gift card program. Though our gift cards do not expire, it is our historical experience that the likelihood of redemption after 60 months is remote. The liability for gift cards is recorded in other accounts payable and accrued expenses on the Consolidated Balance Sheets.
Customer Loyalty Program
Customers who spend a certain amount with us using our private label card or registered third party credit cards receive JCP Rewards® certificates, redeemable for merchandise or services in our stores the following two months. In accordance with the incremental cost method, we estimate the net cost of the rewards that will be redeemed and record this as cost of goods sold as rewards points are accumulated. Other administrative costs of the loyalty program are recorded in SG&A expenses as incurred.
Cost of Goods Sold (Exclusive of Depreciation and Amortization)
Cost of goods sold includes costs directly related to bringing merchandise to its final selling destination. These costs include the cost of the merchandise (net of discounts or allowances earned), sourcing and procurement costs, buying and brand development costs, including buyers’ salaries and related expenses, royalties and design fees, freight costs, warehouse operating expenses, merchandise examination, inspection and testing, store merchandise distribution center expenses, including rent, and shipping and handling costs incurred on sales via the Internet.
Vendor Allowances
We receive vendor support in the form of cash payments or allowances for a variety of reimbursements such as cooperative advertising, markdowns, vendor shipping and packaging compliance, defective merchandise and the purchase of vendor specific fixtures. We have agreements in place with each vendor setting forth the specific conditions for each allowance or payment. Depending on the arrangement, we either recognize the allowance as a reduction of current costs or defer the payment over the period the related merchandise is sold. If the payment is a reimbursement for costs incurred, it is generally offset against those related costs; otherwise, it is treated as a reduction to the cost of merchandise.
Markdown reimbursements related to merchandise that has been sold are negotiated and documented by our buying teams and are credited directly to cost of goods sold in the period received. Vendor allowances received prior to merchandise being sold are deferred and recognized as a reduction of inventory and credited to cost of goods sold based on an inventory turnover rate.
Vendor compliance credits reimburse us for incremental merchandise handling expenses incurred due to a vendor’s failure to comply with our established shipping or merchandise preparation requirements. Vendor compliance credits are recorded as a reduction of merchandise handling costs.
Selling, General and Administrative Expenses
SG&A expenses include the following costs, except as related to merchandise buying, sourcing, warehousing or distribution activities: salaries, marketing costs, occupancy and rent expense, utilities and maintenance, pre-opening expenses, costs related
68
to information technology, administrative costs related to our home office and district and regional operations, real and personal property and other taxes (excluding income taxes) and credit/debit card fees (net of income earned on our private label credit card and co-branded MasterCard® programs).
Advertising
Advertising costs, which include newspaper, television, Internet search marketing, radio and other media advertising, are expensed either as incurred or the first time the advertisement occurs. For cooperative advertising programs offered by national brands that require proof of advertising to be provided to the vendor to support the reimbursement of the incurred cost, we offset the allowances against the related advertising expense. Programs that do not require proof of advertising are monitored to ensure that the allowance provided by each vendor is a reimbursement of costs incurred to advertise for that particular vendor’s label. Total advertising costs, net of cooperative advertising vendor reimbursements of $27 million, $26 million and $32 million for 2017, 2016 and 2015, respectively, were $714 million, $769 million and $792 million, respectively.
Income Taxes
We account for income taxes using the asset and liability method. Deferred tax assets and liabilities are recognized for the future tax consequences attributable to differences between the financial statement carrying amounts of existing assets and liabilities and their respective tax bases and operating loss and tax credit carryforwards. Deferred tax assets and liabilities are measured using enacted tax rates expected to apply to taxable income in the years in which those temporary differences are expected to be recovered or settled. The effect on deferred tax assets and liabilities of a change in tax rates is recognized in income in the period that includes the enactment date. A valuation allowance is recorded to reduce the carrying amounts of deferred tax assets unless it is more likely than not such assets will be realized. We recognize accrued interest and penalties related to unrecognized tax benefits in income tax expense in our Consolidated Statements of Operations.
Earnings/(Loss) per Share
Basic earnings/(loss) per share (EPS) is computed by dividing net income/(loss) by the weighted-average number of common shares outstanding during the period. Diluted EPS is computed by dividing net income/(loss) by the weighted-average number of common shares outstanding during the period plus the number of additional common shares that would have been outstanding if the potentially dilutive shares had been issued. Potentially dilutive shares include stock options, unvested restricted stock units and awards and a warrant outstanding during the period, using the treasury stock method. Potentially dilutive shares are excluded from the computations of diluted EPS if their effect would be anti-dilutive.
Cash and Cash Equivalents
Cash and cash equivalents include cash short-term investments that are highly liquid investments with original maturities of three months or less. Cash short-term investments consist primarily of short-term U.S. Treasury money market funds and a portfolio of highly rated bank deposits and are stated at cost, which approximates fair market value due to the short-term maturity. Cash in banks and in transit also include credit card sales transactions that are settled early in the following period.
Merchandise Inventory
Inventories are valued at the lower of cost (using the first-in, first-out or “FIFO” method) or market using the retail method (RIM). Under RIM, retail values of merchandise groups are converted to a cost basis by applying the specific average cost-to-retail ratio related to each merchandise grouping.
Shrinkage accruals are estimated as a percent of sales for a given period based on physical inventories or cycle count activities. Physical inventory counts for stores are are taken at least annually and cycle count activities for distribution centers and regional warehouses are executed on a daily basis. Inventory records and shrinkage accruals are adjusted appropriately based on the actual results from physical inventories and cycle counts. The shrinkage rate from the most recent physical inventory and cycle count activity, in combination with current events and historical experience, is used as the standard for the shrinkage accrual rate for the next inventory cycle or cycle count activity. Historically, our actual physical inventory and cycle counts results have shown our estimates to be reliable. See Note 3 for the discussion of the accounting change related to our merchandise inventory.
69
Property and Equipment, Net
Estimated Useful Lives | ||||||||||
($ in millions) | (Years) | 2017 | 2016 | |||||||
Land | N/A | $ | 245 | $ | 249 | |||||
Buildings | 50 | 4,750 | 4,859 | |||||||
Furniture and equipment | 3-20 | 1,603 | 1,963 | |||||||
Leasehold improvements (1) | 1,068 | 1,254 | ||||||||
Capital leases (equipment) | 3-5 | 115 | 116 | |||||||
Accumulated depreciation | (3,500 | ) | (3,842 | ) | ||||||
Property and equipment, net | $ | 4,281 | $ | 4,599 | ||||||
(1) | Leasehold improvements are depreciated over the shorter of the estimated useful lives of the improvements or the term of the lease, including renewals determined to be reasonably assured. |
Property and equipment is stated at cost less accumulated depreciation. Depreciation is computed primarily by using the straight-line method over the estimated useful lives of the related assets.
We expense routine maintenance and repairs when incurred. We capitalize major replacements and improvements. We remove the cost of assets sold or retired and the related accumulated depreciation or amortization from the accounts and include any resulting gain or loss in net income/(loss).
We recognize a liability for the fair value of our conditional asset retirement obligations, which are primarily related to asbestos removal, when probable and if the liability’s fair value can be reasonably estimated.
Capitalized Software Costs
We capitalize costs associated with the acquisition or development of major software for internal use in other assets in our Consolidated Balance Sheets and amortize the asset over the expected useful life of the software, generally between three and seven years. We only capitalize subsequent additions, modifications or upgrades to internal-use software to the extent that such changes allow the software to perform a task it previously did not perform. We expense software maintenance and training costs as incurred.
Cloud computing arrangements are evaluated to determine whether the arrangement includes a software license or is a service contract. If determined to be a software license, then the arrangement is capitalized as an other asset and amortized over the expected life of software, generally between three to seven years. If determined to be a service contract, then the cost of the arrangement is expensed as the services are provided.
Impairment of Long-Lived and Indefinite-Lived Assets
We evaluate long-lived assets such as store property and equipment and other corporate assets for impairment whenever events or changes in circumstances indicate that the carrying amount of those assets may not be recoverable. Factors considered important that could trigger an impairment review include, but are not limited to, significant underperformance relative to historical or projected future operating results and significant changes in the manner of use of the assets or our overall business strategies. Assets or asset groups that trigger an impairment review are tested for recoverability by comparing the estimated undiscounted cash flows expected to result from the use of the asset plus any net proceeds expected from disposition of the asset to the carrying value of the asset. If the asset or asset group is not recoverable on a undiscounted cash flow basis, the amount of the impairment loss is measured by comparing the carrying value of the asset or asset group to its fair value and and depending on the transaction any loss is included in Restructuring and management transition or Real estate and other,net in the Consolidated Statements of Operations. We estimate fair value based on either a projected discounted cash flow method using a discount rate that is considered commensurate with the risk inherent in our current business model or appraised value, as appropriate. We also take other factors into consideration in estimating the fair value of our stores, such as local market conditions, operating environment, mall performance and other trends.
We assess the recoverability of indefinite-lived intangible assets at least annually during the fourth quarter of our fiscal year or whenever events or changes in circumstances indicate that the carrying amount of the indefinite-lived intangible asset may not be fully recoverable. Examples of a change in events or circumstances include, but are not limited to, a decrease in the market price of the asset, a history of cash flow losses related to the use of the asset or a significant adverse change in the extent or
70
manner in which an asset is being used. We test our indefinite-lived intangible assets utilizing the relief from royalty method to determine the estimated fair value for each indefinite-lived intangible asset. The relief from royalty method estimates our theoretical royalty savings from ownership of the intangible asset. Key assumptions used in this model include discount rates, royalty rates, growth rates, sales projections and terminal value rates.
Leases
We use a consistent lease term when calculating amortization of leasehold improvements, determining straight-line rent expense under an operating lease and determining classification of leases as either operating or capital. For purposes of recognizing incentives, premiums, rent holidays and minimum rental expenses on a straight-line basis over the terms of operating leases, we use the date of initial possession to begin amortization, which is generally when we take control of the property. Renewal options determined to be reasonably assured are also included in the lease term. Some leases require additional payments based on sales and the related contingent rent is recorded as rent expense when the payment is probable.
Some of our lease agreements contain developer/tenant allowances. Upon receipt of such allowances, we record a deferred rent liability in other liabilities on the Consolidated Balance Sheets. The allowances are then amortized on a straight-line basis over the remaining terms of the corresponding leases as a reduction of rent expense.
Capital leases are recorded as an asset and an obligation at an amount equal to the present value of the minimum lease payments during the lease term. Assets subject to an operating lease and the related lease payments are not recorded on our balance sheet. Rent expense related to an operating lease is recognized on a straight-line basis over the lease term resulting in periodic deferred rent balances to adjust the cash rent paid.
Sale-leasebacks are transactions through which we sell assets and subsequently lease them back. The resulting leases that qualify for sale-leaseback accounting are evaluated and accounted for as operating leases or capital leases. A transaction that does not qualify for sale-leaseback accounting as a result of a prohibited form of continuing involvement is accounted for as a financing. For a financing transaction, we retain the "sold" assets within property and equipment and record a financing obligation equal to the amount of cash proceeds received. Rental payments under such transactions are recognized as a reduction of the financing obligation and as interest expense using an effective interest method.
Exit or Disposal Activity Costs
Costs associated with exit or disposal activities are recorded at their fair values when a liability has been incurred. Reserves for operating leases are established at the time of closure for the present value of any remaining operating lease obligations (PVOL), net of estimated sublease income. Severance is recorded over the service period required to be rendered in order to receive the termination benefits or, if employees will not be retained to render future service, a reserve is established when communication has occurred to the affected employees. Other exit costs are accrued when incurred.
Retirement-Related Benefits
We recognize the funded status – the difference between the fair value of plan assets and the plan’s benefit obligation – of our defined benefit pension and postretirement plans directly on the Consolidated Balance Sheet. Each overfunded plan is recognized as an asset and each underfunded plan is recognized as a liability. We adjust other comprehensive income/(loss) to reflect prior service cost or credits and actuarial gain or loss amounts arising during the period and reclassification adjustments for amounts being recognized as components of net periodic pension/postretirement cost, net of tax. Prior service cost or credits are amortized to net income/(loss) over the average remaining service period, a period of about eight years for the primary plan. Pension related actuarial gains or losses in excess of 10% of the greater of the fair value of plan assets or the plan's projected benefit obligation (the corridor) are recognized annually in the fourth quarter each year (Mark-to-market (MTM) adjustment), and, if applicable, in any interim period in which an interim remeasurement is triggered.
We measure the plan assets and obligations annually at the adopted measurement date of January 31 to determine pension expense for the subsequent year. The factors and assumptions affecting the measurement are the characteristics of the population and salary increases, with the most important being the expected return on plan assets and the discount rate for the pension obligation. We use actuarial calculations for the assumptions, which require significant judgment.
Stock-Based Compensation
Stock options are valued primarily using the binomial lattice option pricing model and are granted with an exercise price equal to the closing price of our common stock on the grant date. Time-based and performance-based restricted stock awards are valued using the closing price of our common stock on the grant date. For awards that have market conditions, such as attaining a specified stock price or based on total shareholder return, we use a Monte Carlo simulation model to determine the value of the award. Our
71
current plan does not permit awarding stock options below grant-date market value nor does it allow any repricing subsequent to the date of grant.
Stock options are valued using the following assumptions:
• | Valuation Method. We estimate the fair value of stock option awards on the date of grant using primarily the binomial lattice model. |
• | Expected Term. Our expected option term represents the average period that we expect stock options to be outstanding and is determined based on our historical experience, giving consideration to contractual terms, vesting schedules, anticipated stock prices and expected future behavior of option holders. |
• | Expected Volatility. Our expected volatility is based on a blend of the historical volatility of JCPenney stock combined with an estimate of the implied volatility derived from exchange traded options. |
• | Risk-Free Interest Rate. Our risk-free interest rate is based on zero-coupon U.S. Treasury yields in effect at the date of grant with the same period as the expected option life. |
• | Expected Dividend Yield. The dividend assumption is based on our current expectations about our dividend policy. |
Employee stock options and time-based and performance-based restricted stock awards typically vest over periods ranging from one to three years and employee stock options have a maximum term of 10 years. Estimates of forfeitures are incorporated at the grant date and are adjusted if actual results are different from initial estimates. For awards that have performance conditions, the probability of achieving the performance condition is evaluated each reporting period, and if the performance condition is expected to be achieved, the related compensation expense is recorded over the remaining service period. In addition, certain performance-based restricted stock awards may be granted where the number of shares may be increased to the maximum or reduced to the minimum threshold based on the results of the performance metrics in accordance with the terms established at the time of the award. In the event that performance conditions are not achieved and the awards do not vest, compensation expense is reversed. For market based awards, we record expense over the service period, regardless of whether or not the market condition is achieved.
Awards with graded vesting that only have a time vesting requirement and awards that vest entirely at the end of the vesting requirement are expensed on a straight-line basis for the entire award. Expense for awards with graded vesting that incorporate a market or performance requirement is attributed separately based on the vesting for each tranche.
3. Change in Accounting for Merchandise Inventories
During the third quarter of fiscal 2017, the Company retired certain legacy systems and implemented a new module of its enterprise resource planning system to account for its merchandise inventories. Along with this implementation, the Company changed its method of accounting for merchandise inventories for its Internet operations from the lower of standard cost (representing average vendor costs) or net realizable value to the lower of cost or market using the retail inventory method (RIM).
The change in inventory valuation method with respect to the Company's Internet operations allows the Company to better account for inventory on an enterprise-wide basis and to be more consistent with its omnichannel focus of physical and digital interaction with its customers. The Company believes this will result in greater uniformed costing of inventories and a more consistent matching of cost of goods sold with net sales generated. The effect of the change on the Inventory and Reinvested Earnings/(Accumulated Deficit) balances was not material. The Company could not determine the impact of the change to the retail method for its inventory related to its Internet operations for periods prior to fiscal 2017 and therefore could not retroactively apply the change to periods prior to fiscal 2017.
4. Effect of New Accounting Standards
In November 2015, the Financial Accounting Standards Board (FASB) issued Accounting Standards Update (ASU) 2015-17, Income Taxes (Topic 740), Balance Sheet Classification of Deferred Taxes, which requires all deferred tax assets and liabilities to be classified as noncurrent on the balance sheet instead of separating deferred taxes into current and noncurrent amounts. The new standard no longer requires allocating valuation allowances between current and noncurrent deferred tax assets because those allowances are classified as noncurrent. The Company adopted ASU 2015-17 retrospectively at the beginning of
72
2017. As a result of the retrospective adoption, the Company reclassified deferred tax assets of $196 million as of January 28, 2017 from Deferred taxes (a component of current assets) to a reduction in Deferred taxes (a component of long-term liabilities) on the Consolidated Balance Sheets.
In July 2015, the FASB issued ASU 2015-11, Inventory (Topic 330), Simplifying the Measurement of Inventory, which simplifies the subsequent measurement of inventory by requiring inventory to be measured at the lower of cost and net realizable value. Under previous guidance, net realizable value is one of several calculations an entity needs to make to measure inventory at the lower of cost or market. However, companies will continue to apply their existing impairment models to inventories that are accounted for using last-in first-out (LIFO) and the RIM. The Company adopted ASU 2015-11 at the beginning of 2017. The adoption of this standard did not have a material impact on our financial condition, results of operations or cash flows as substantially all of our inventory was measured by the RIM impairment model at that time which is considered a continued acceptable method under the new standard.
In March 2016, the FASB issued ASU 2016-09, Compensation - Stock Compensation (Topic 718): Improvements to Employee Share-Based Payment Accounting. ASU 2016-09 changes how companies account for certain aspects of share-based payments to employees. Entities are required to recognize the income tax effects of awards (windfalls or shortfalls) in the statement of operations when the awards vest or are settled (i.e., additional paid-in capital or APIC pools will be eliminated). The guidance on employers’ accounting for an employee’s use of shares to satisfy the employer’s statutory income tax withholding obligation and for forfeitures also changed. The ASU also provides a practical expedient for public companies that allows the use of a simplified method to estimate the expected term for certain awards. The Company adopted ASU 2016-09 at the beginning of 2017.
As a result of ASU 2016-09 requiring all windfalls and shortfalls to be recognized when they arise, excess tax benefits that were not previously recognized because the related tax deduction had not reduced current taxes payable have been recorded on a modified retrospective basis through a cumulative effect adjustment to retained earnings as of January 29, 2017. Additionally, the deferred tax assets recognized as a result of this transition guidance have been assessed for realizability and a valuation allowance has been recognized as part of the cumulative effect adjustment to retained earnings also as a result of this transition guidance. Considering these aspects of transitioning to the new guidance, there was no impact to retained earnings as a result of a valuation allowance being recorded against the related deferred tax asset recorded as the cumulative adjustment.
In March 2016, the FASB issued ASU 2016-05, Derivatives and Hedging (Topic 815): Effect of Derivative Contract Novations on Existing Hedge Accounting Relationships (a consensus of the FASB Emerging Issues Task Force) (ASU 2016-05). Under the ASU, the novation of a derivative contract (i.e., a change in the counterparty) in a hedge accounting relationship does not, in and of itself, require dedesignation of that hedge accounting relationship. The hedge accounting relationship could continue uninterrupted if all of the other hedge accounting criteria are met, including the expectation that the hedge will be highly effective when the creditworthiness of the new counterparty to the derivative contract is considered. The Company adopted ASU 2016-05 at the beginning of 2017 and the new guidance did not have any impact as the Company had no transactions involving the novation of a derivative.
In May 2014, the FASB issued ASC Topic 606 (ASC 606), Revenue from Contracts with Customers, a replacement of Revenue Recognition (Topic 605). The new revenue recognition standard provides a five-step analysis of transactions to determine when and how revenue is recognized. The core principle of the guidance is that a Company should recognize revenue to depict the transfer of promised goods or services to customers in an amount that reflects the consideration to which the entity expects to be entitled in exchange for those goods or services. This standard is effective for us beginning in fiscal 2018 and we plan to adopt the new standard using the full retrospective approach. We have analyzed the impact of the new standard on our current accounting policies and internal controls and the software changes required to implement the new standard. Our revenue recognition policies related to gift card breakage, customer loyalty programs, credit card income and principal versus agent considerations will change. Whereas we currently recognize gift card breakage, net of required escheatment, 60 months after the gift card is issued, we will in the future recognize gift card breakage, net of required escheatment, over the redemption pattern of gift cards. Additionally, whereas we utilize the incremental cost method to account for our customer loyalty programs, we will in the future account for our customer loyalty programs as revenue which will require us to defer a portion of our sales to loyalty rewards to be earned by reward members for a future discount on a future sale.
We have also evaluated the classification of profit sharing income earned in connection with our private label credit card and co-branded MasterCard® programs owned and serviced by Synchrony Financial (Synchrony). Under our agreement with Synchrony, we receive cash payments from Synchrony based upon the performance of the credit card portfolios. Currently the income we earn under our agreement with Synchrony is included as an offset to SG&A expenses. In connection with the adoption of the new standard, we plan to change our presentation to include such income in a separate line item described as Credit card income and other. Further, we evaluated certain contracts for principal versus agent considerations and where we
73
currently consider ourselves to be the principal (report gross sales) or the agent (report net sales) based on our risk and rewards in a sales transaction, we will in the future assess principal versus agent considerations depending on our control of the good or service before it is transferred to the customer.
Upon our retrospective adoption of ASC 606 on February 4, 2018, we recorded a $4 million transition adjustment that increased our Retained earnings/(accumulated deficit) and on a retrospective basis our Net sales increased by $48 million in 2017 and by $24 million in 2016 and our Net income/(loss) decreased by a loss of $2 million in 2017 and $18 million in 2016.
In March 2017, the FASB issued ASU 2017-07, Compensation - Retirement Benefits (Topic 715): Improving the Presentation of Net Periodic Pension Cost and Net Periodic Postretirement Benefit Cost. ASU 2017-07 requires companies to present the service cost component of net benefit cost in the same line items in which they report compensation cost. Companies will present all other components of net benefit cost outside of operating income, if this subtotal is presented. This guidance is effective for fiscal years beginning after December 15, 2017, and interim periods therein. Early adoption is permitted as of the beginning of an annual period for which financial statements have not been issued or made available for issuance. Entities should apply this guidance retrospectively for the presentation of the service cost component and the other components of net periodic pension cost in the income statement and prospectively, on and after the effective date, for any capitalization of the service cost component of net periodic pension cost in assets. Upon our retrospective adoption of ASU 2017-07 on February 4, 2018, we changed the presentation of our Consolidated Statement of Operations to exclude the Pension line item and to reflect the service cost component of our pension expense/(income) in SG&A and to reflect all other cost components as in a new separate line item below operating income/(loss) described as Other components of net periodic pension cost/(income).
In February 2018, the FASB issued ASU 2018-02, Income Statement-Reporting Comprehensive Income (Topic 220): Reclassification of Certain Tax Effects from Accumulated Other Comprehensive Income. This standard focuses on a targeted improvement to reclassify stranded tax effects resulting from the Tax Cuts and Jobs Act (the “Tax Act”) enacted on December 22, 2017 from Accumulated other comprehensive income/(loss) to Retained earnings/accumulated deficit. The amount of the reclassification would be the difference between the amount initially charged or credited directly to other comprehensive income at the previously enacted U.S. federal corporate income tax rate that remains in Accumulated other comprehensive income/(loss) and the amount that would have been charged or credited directly to Other comprehensive income/(loss) using the newly enacted U.S. federal corporate income tax rate, excluding the effect of any valuation allowance previously charged to Net income/(loss). ASU 2018-02 is effective for interim and annual periods beginning after December 15, 2018, and early adoption is permitted. We are currently evaluating the effect that the new accounting guidance will have on our Consolidated Balance Sheet.
In February 2016, the FASB issued ASC Topic 842, Leases (Topic 842), a replacement of Leases (Topic 840), which will require lessees to recognize most leases on their balance sheets as lease liabilities with corresponding right-of-use assets. While many aspects of lessor accounting would remain the same, the new standard would make some changes, such as eliminating today’s real estate-specific guidance. As a globally converged standard, lessees and lessors would be required to classify most leases using a principle generally consistent with that of International Accounting Standards. The standard also would change what would be considered the initial direct costs of a lease. The standard would be effective for annual periods beginning after December 15, 2018 and interim periods within that year and must be adopted on a modified retrospective method, with elective reliefs, which requires application of the new guidance for all periods presented. We have developed a project team to analyze the impacts of the new standard on our current accounting policies and internal controls and the changes required to be made by our leasing software provider. With almost 70% of our store locations involved in an operating lease, the new standard will have a significant impact on our financial statements due to the recognition of lease liabilities and right-of-use assets that were not required by the current accounting requirements for operating leases. Given the magnitude of the project to implement the new standard, we are still evaluating the effect that the new accounting guidance will have on our financial condition, results of operations and cash flows.
In August 2016, the FASB issued ASU 2016-15, Statement of Cash Flows (Topic 230): Classification of Certain Cash Receipts and Cash Payments (a consensus of the FASB Emerging Issues Task Force) (ASU 2016-15). ASU 2016-15 clarifies how entities should classify certain cash receipts and cash payments on the statement of cash flows. The guidance also clarifies how the predominance principle should be applied when cash receipts and cash payments have aspects of more than one class of cash flows. The guidance is effective for fiscal years beginning after December 15, 2017, and interim periods therein. Early adoption is permitted. Entities should apply the guidance retrospectively, but if it is impracticable to do so for an issue, the amendments related to that issue may be applied prospectively. We are currently evaluating the effect that adopting this new accounting guidance will have on our Consolidated Statements of Cash Flows.
74
5. Earnings/(Loss) per Share
Net income/(loss) and shares used to compute basic and diluted EPS are reconciled below:
(in millions, except per share data) | 2017 | 2016 | 2015 | |||||||||
Earnings/(loss) | ||||||||||||
Net income/(loss) | $ | (116 | ) | $ | 1 | $ | (513 | ) | ||||
Shares | ||||||||||||
Weighted average common shares outstanding (basic shares) | 311.1 | 308.1 | 305.9 | |||||||||
Adjustment for assumed dilution: | ||||||||||||
Stock options and restricted stock awards | — | 4.9 | — | |||||||||
Weighted average shares assuming dilution (diluted shares) | 311.1 | 313.0 | 305.9 | |||||||||
EPS | ||||||||||||
Basic | $ | (0.37 | ) | $ | — | $ | (1.68 | ) | ||||
Diluted | $ | (0.37 | ) | $ | — | $ | (1.68 | ) | ||||
The following average potential shares of common stock were excluded from the diluted EPS calculation because their effect would have been anti-dilutive:
(Shares in millions) | 2017 | 2016 | 2015 | ||||||
Stock options, restricted stock awards and a warrant | 31.5 | 17.8 | 34.1 | ||||||
6. Other Assets
($ in millions) | 2017 | 2016 | |||||
Capitalized software, net | $ | 300 | $ | 265 | |||
Indefinite-lived intangible assets, net (1) | 275 | 275 | |||||
Revolving credit facility unamortized costs, net | 28 | 30 | |||||
Interest rate swaps (Notes 9 and 10) | 9 | — | |||||
Realty investments (Note 18) | 5 | 13 | |||||
Other | 44 | 35 | |||||
Total | $ | 661 | $ | 618 | |||
(1) Amounts are net of an accumulated impairment loss of $9 million.
Our indefinite-lived intangible assets consists of our worldwide rights for the Liz Claiborne® family of trademarks and related intellectual property and our ownership of the U.S. and Puerto Rico rights of the monet® trademarks and related intellectual property. In connection with our annual indefinite-lived intangible assets impairment tests performed during the fourth quarter of 2017, we did not record an impairment for our indefinite-lived intangible assets as the estimated fair values exceeded the carrying values of the underlying assets.
75
7. Other Accounts Payable and Accrued Expenses
($ in millions) | 2017 | 2016 | ||||||
Accrued salaries, vacation and bonus | $ | 193 | $ | 204 | ||||
Customer gift cards | 203 | 215 | ||||||
Taxes other than income taxes | 102 | 127 | ||||||
Occupancy and rent-related | 28 | 35 | ||||||
Interest | 67 | 78 | ||||||
Advertising | 77 | 82 | ||||||
Current portion of workers’ compensation and general liability self-insurance | 44 | 47 | ||||||
Restructuring and management transition (Note 17) | 26 | 29 | ||||||
Current portion of retirement plan liabilities (Note 16) | 29 | 26 | ||||||
Capital expenditures | 58 | 33 | ||||||
Other | 292 | 288 | ||||||
Total | $ | 1,119 | $ | 1,164 | ||||
8. Other Liabilities
($ in millions) | 2017 | 2016 | ||||||
Supplemental pension and other postretirement benefit plan liabilities (Note 16) | $ | 153 | $ | 126 | ||||
Long-term portion of workers’ compensation and general liability insurance | 121 | 131 | ||||||
Deferred developer/tenant allowances | 139 | 143 | ||||||
Deferred rent liability | 97 | 97 | ||||||
Primary pension plan (Note 16) | — | 18 | ||||||
Interest rate swaps (Notes 9 and 10) | — | 10 | ||||||
Restructuring and management transition (Note 17) | 15 | 2 | ||||||
Other | 42 | 56 | ||||||
Total | $ | 567 | $ | 583 | ||||
9. Derivative Financial Instruments
We use derivative financial instruments for hedging and non-trading purposes to manage our exposure to changes in interest rates. Use of derivative financial instruments in hedging programs subjects us to certain risks, such as market and credit risks. Market risk represents the possibility that the value of the derivative instrument will change. In a hedging relationship, the change in the value of the derivative is offset to a great extent by the change in the value of the underlying hedged item. Credit risk related to derivatives represents the possibility that the counterparty will not fulfill the terms of the contract. The notional, or contractual amount of our derivative financial instruments is used to measure interest to be paid or received and does not represent our exposure due to credit risk. Credit risk is monitored through established approval procedures, including setting concentration limits by counterparty, reviewing credit ratings and requiring collateral (generally cash) from the counterparty when appropriate.
When we use derivative financial instruments for the purpose of hedging our exposure to interest rates, the contract terms of a hedged instrument closely mirror those of the hedged item, providing a high degree of risk reduction and correlation. Contracts that are effective at meeting the risk reduction and correlation criteria are recorded using hedge accounting. If a derivative instrument is a hedge, depending on the nature of the hedge, changes in the fair value of the instrument will either be offset against the change in fair value of the hedged assets, liabilities or firm commitments through earnings or be recognized in Accumulated other comprehensive income/(loss) until the hedged item is recognized in earnings. The ineffective portion of an instrument’s change in fair value will be immediately recognized in earnings during the period. Instruments that do not meet the criteria for hedge accounting, or contracts for which we have not elected hedge accounting, are valued at fair value with unrealized gains or losses reported in earnings during the period of change.
76
Effective May 7, 2015, we entered into interest rate swap agreements with notional amounts totaling $1,250 million to fix a portion of our variable LIBOR-based interest payments. The interest rate swap agreements have a weighted-average fixed rate of 2.04%, mature on May 7, 2020 and have been designated as cash flow hedges.
The fair value of our interest rate swaps are recorded in the Consolidated Balance Sheets as an asset or a liability (see Note 10). The effective portion of the interest rate swaps' changes in fair values is reported in Accumulated other comprehensive income/(loss) (see Note 13), and the ineffective portion is reported in Net income/(loss). Amounts in Accumulated other comprehensive income/(loss) are reclassified into Net income/(loss) when the related interest payments affect earnings. For the periods presented, all of the interest rate swaps were 100% effective.
Information regarding the pre-tax changes in the fair value of our interest rate swaps is as follows:
($ in millions) | 2017 | 2016 | Line Item in the Financial Statements | ||||||
Gain/(loss) recognized in other comprehensive income/(loss) | $ | 9 | $ | 5 | Accumulated other comprehensive income | ||||
Gain/(loss) recognized in net income/(loss) | (10 | ) | (13 | ) | Interest expense | ||||
Information regarding the gross amounts of our derivative instruments in the Consolidated Balance Sheets is as follows:
Asset Derivatives at Fair Value | Liability Derivatives at Fair Value | |||||||||||||||||
($ in millions) | Balance Sheet Location | 2017 | 2016 | Balance Sheet Location | 2017 | 2016 | ||||||||||||
Derivatives designated as hedging instruments: | ||||||||||||||||||
Interest rate swaps | N/A | $ | — | $ | — | Other accounts payable and accrued expenses | $ | 1 | $ | 2 | ||||||||
Interest rate swaps | Other assets | 9 | — | Other liabilities | — | 10 | ||||||||||||
Total derivatives designated as hedging instruments | $ | 9 | $ | — | $ | 1 | $ | 12 | ||||||||||
10. Fair Value Disclosures
In determining fair value, the accounting standards establish a three level hierarchy for inputs used in measuring fair value, as follows:
• | Level 1 — Quoted prices in active markets for identical assets or liabilities. |
• | Level 2 — Significant observable inputs other than quoted prices in active markets for similar assets and liabilities, such as quoted prices for identical or similar assets or liabilities in markets that are not active; or other inputs that are observable or can be corroborated by observable market data. |
• | Level 3 — Significant unobservable inputs reflecting our own assumptions, consistent with reasonably available assumptions made by other market participants. |
Cash Flow Hedges Measured on a Recurring Basis
The $9 million fair value of our cash flow hedges are valued in the market using discounted cash flow techniques which use quoted market interest rates in discounted cash flow calculations which consider the instrument's term, notional amount, discount rate and credit risk. Significant inputs to the derivative valuation for interest rate swaps are observable in the active markets and are classified as Level 2 in the fair value measurement hierarchy.
77
Other Non-Financial Assets Measured on a non-Recurring Basis
In connection with the Company announcing its plan to close underperforming department stores in 2017, long-lived assets held and used with a carrying value of $86 million were written down to their fair value of $9 million, resulting in asset impairment charges of $77 million in 2017. The fair value was determined based on comparable market values of similar properties or on a rental income approach and the significant inputs related to valuing the store related assets are classified as Level 2 in the fair value measurement hierarchy.
Other Financial Instruments
Carrying values and fair values of financial instruments that are not carried at fair value in the Consolidated Balance Sheets are as follows:
As of February 3, 2018 | As of January 28, 2017 | |||||||||||||||
($ in millions) | Carrying Amount | Fair Value | Carrying Amount | Fair Value | ||||||||||||
Total debt, excluding unamortized debt issuance costs, capital leases, financing obligation and notes payable | $ | 4,063 | $ | 3,607 | $ | 4,665 | $ | 4,495 | ||||||||
The fair value of long-term debt is estimated by obtaining quotes from brokers or is based on current rates offered for similar debt. As of February 3, 2018 and January 28, 2017, the fair values of cash and cash equivalents, accounts payable and short-term borrowings approximate their carrying values due to the short-term nature of these instruments.
Concentrations of Credit Risk
We have no significant concentrations of credit risk.
11. Credit Facility
The Company has a $2,350 million senior secured asset-based credit facility (2017 Credit Facility), comprised of a $2,350 million revolving line of credit (Revolving Facility). During the second quarter of 2017, we amended the 2015 Credit Facility to, among other things, extend the maturity date to June 20, 2022 and to lower the interest rate spread by 75 basis points. All borrowings under the 2017 Credit Facility accrue interest at a rate equal to, at the Company's option, a base rate or an adjusted LIBOR rate plus a spread.
The 2017 Credit Facility is secured by a perfected first-priority security interest in substantially all of our eligible credit card receivables, accounts receivable and inventory. The Revolving Facility is available for general corporate purposes, including the issuance of letters of credit. Pricing under the Revolving Facility is tiered based on our utilization under the line of credit. JCP’s obligations under the 2017 Credit Facility are guaranteed by J. C. Penney Company, Inc.
The borrowing base under the Revolving Facility is limited to a maximum of 85% of eligible accounts receivable, plus 90% of eligible credit card receivables, plus 90% of the liquidation value of our inventory, net of certain reserves. Letters of credit reduce the amount available to borrow by their face value. In addition, the maximum availability is limited by a minimum excess availability threshold which is the lesser of 10% of the borrowing base or $200 million, subject to a minimum threshold requirement of $150 million.
As of the end of 2017, we had no borrowings outstanding under the Revolving Facility. In addition, as of the end of 2017, we had $2,019 million available for borrowing, of which $135 million was reserved for outstanding standby and import letters of credit, none of which have been drawn on, leaving $1,884 million for future borrowings. The applicable rate for standby and import letters of credit was 1.75% and 0.875%, respectively, while the required commitment fee was 0.375% for the unused portion of the Revolving Facility.
78
12. Long-Term Debt
($ in millions) | 2017 | 2016 | ||||||
Issue: | ||||||||
7.95% Debentures Due 2017 | $ | — | $ | 220 | ||||
5.75% Senior Notes Due 2018 (1) | 190 | 265 | ||||||
8.125% Senior Notes Due 2019 | 175 | 400 | ||||||
5.65% Senior Notes Due 2020 (1) | 360 | 400 | ||||||
2016 Term Loan Facility (Matures in 2023) | 1,625 | 1,667 | ||||||
5.875% Senior Secured Notes Due 2023 (1) | 500 | 500 | ||||||
7.125% Debentures Due 2023 | 10 | 10 | ||||||
6.9% Notes Due 2026 | 2 | 2 | ||||||
6.375% Senior Notes Due 2036 (1) | 388 | 388 | ||||||
7.4% Debentures Due 2037 | 313 | 313 | ||||||
7.625% Notes Due 2097 | 500 | 500 | ||||||
Total debt | 4,063 | 4,665 | ||||||
Unamortized debt issuance costs | (51 | ) | (63 | ) | ||||
Less: current maturities | (232 | ) | (263 | ) | ||||
Total long-term debt | $ | 3,780 | $ | 4,339 | ||||
Weighted-average interest rate at year end | 6.1 | % | 6.3 | % | ||||
Weighted-average maturity (in years) | 16 years | |||||||
(1) | These debt issuances contain a change of control provision that would obligate us, at the holders’ option, to repurchase the debt at a price of 101%. These provisions trigger if there were a beneficial ownership change of 50% or more of our common stock. |
During the second quarter of 2017, we settled cash tender offers with respect to portions of our outstanding 5.75% Senior Notes due 2018 (2018 Notes) and 8.125% Senior Notes due 2019 (2019 Notes), resulting in a loss on extinguishment of debt of
$34 million, and amended our $2.35 billion senior secured asset-based revolving credit facility (Revolving Credit Facility), which resulted in a loss on extinguishment of debt of $1 million.
During the fourth quarter of 2017, we repurchased and retired $40 million aggregate principal amount of our outstanding debt resulting in a gain on extinguishment of debt of $2 million.
During the first quarter of 2016, we repurchased and retired $60 million aggregate principal amount of our outstanding debt resulting in a gain on extinguishment of debt of $4 million.
During the second quarter of 2016, we completed the refinancing of our $2.25 billion five-year senior secured term loan facility entered into in 2013 (2013 Term Loan Facility) with an amended and restated $1.688 billion seven-year senior secured term loan credit facility (2016 Term Loan Facility) and the issuance of $500 million of 5.875% Senior Secured Notes due 2023 (Senior Secured Notes), resulting in a loss on extinguishment of debt of $34 million.
The 2016 Term Loan Facility bears interest at a rate of LIBOR (subject to a 1% floor) plus 4.25% and matures on June 23, 2023. We are required to make quarterly repayments in a principal amount equal to $10.55 million during the seven-year term, subject to certain reductions for mandatory and optional prepayments. Proceeds from the 2016 Term Loan Facility and the Senior Secured Notes were used to repay the entire outstanding principal balance of the 2013 Term Loan Facility. The 2016 Term Loan Facility and the Senior Secured Notes are guaranteed by the Company and certain subsidiaries of JCP and are secured by mortgages on certain real estate of JCP and the guarantors.
79
Scheduled Annual Principal Payments on Long-Term Debt, Excluding Capital Leases Financing Obligation and Note Payable
($ in millions) | |||
2018 | $ | 232 | |
2019 | 217 | ||
2020 | 402 | ||
2021 | 42 | ||
2022 | 42 | ||
Thereafter | 3,128 | ||
Total | $ | 4,063 | |
13. Stockholders’ Equity
Accumulated Other Comprehensive Income/(Loss)
The following table shows the changes in accumulated other comprehensive income/(loss) balances for 2017 and 2016:
($ in millions) | Net Actuarial Gain/(Loss) | Prior Service Credit/(Cost) | Foreign Currency Translation | Gain/(Loss) on Cash Flow Hedges | Accumulated Other Comprehensive Income/(Loss) | |||||||||||||||
January 30, 2016 | $ | (423 | ) | $ | (38 | ) | $ | (2 | ) | $ | (28 | ) | $ | (491 | ) | |||||
Current period change | 2 | 5 | — | 11 | 18 | |||||||||||||||
January 28, 2017 | $ | (421 | ) | $ | (33 | ) | $ | (2 | ) | $ | (17 | ) | $ | (473 | ) | |||||
Current period change | 91 | 7 | 2 | 13 | 113 | |||||||||||||||
February 3, 2018 | $ | (330 | ) | $ | (26 | ) | $ | — | $ | (4 | ) | $ | (360 | ) | ||||||
Common Stock
On a combined basis, our 401(k) savings plan, including our employee stock ownership plan (ESOP), held approximately 13 million shares, or approximately 4.3% of outstanding Company common stock, at February 3, 2018. Under our 2016 senior secured term loan, we are subject to restrictive covenants regarding our ability to pay cash dividends.
Preferred Stock
We have authorized 25 million shares of preferred stock; no shares of preferred stock were issued and outstanding as of February 3, 2018 or January 28, 2017.
Stock Warrant
On June 13, 2011, prior to his employment, we entered into a warrant purchase agreement with Ronald B. Johnson pursuant to which Mr. Johnson made a personal investment in the Company by purchasing a warrant to acquire approximately 7.3 million shares of J. C. Penney Company, Inc. common stock for a purchase price of approximately $50 million at a mutually determined fair value of $6.89 per share. The warrant has an exercise price of $29.92 per share, subject to customary adjustments resulting from a stock split, reverse stock split, or other extraordinary distribution with respect to J. C. Penney Company, Inc. common stock. The warrant has a term of seven and one-half years and was initially exercisable after the sixth anniversary, or June 13, 2017; however, the warrant became immediately exercisable upon the termination of Mr. Johnson’s employment with us in April 2013. The warrant is also subject to transfer restrictions. The proceeds from the sale of the warrant were recorded as additional paid-in capital.
Stockholders' Rights Agreement
As authorized by our Company’s Board of Directors (the Board), on January 27, 2014, the Company entered into an Amended and Restated Rights Agreement (Amended Rights Agreement) with Computershare Inc., as Rights Agent (Rights Agent), amending, restating and replacing the Rights Agreement, dated as of August 22, 2013 (Original Rights Agreement), between the Company and the Rights Agent. Pursuant to the terms of the Original Rights Agreement, one preferred stock purchase right (a Right) was attached to each outstanding share of Common Stock of $0.50 par value of the Company (Common Stock) held by holders of record as of the close of business on September 3, 2013. The Company has issued one Right in respect of each new share of Common Stock issued since the record date. The Rights, registered on August 23, 2013, trade with and are inseparable from our Common Stock and will not be evidenced by separate certificates unless they become exercisable.
80
The purpose of the Amended Rights Agreement is to diminish the risk that the Company's ability to use its net operating losses and other tax assets to reduce potential future federal income tax obligations would become subject to limitations by reason of the Company's experiencing an "ownership change" as defined under Section 382 of the Internal Revenue Code of 1986, as amended (the Code). Ownership changes under Section 382 generally relate to the cumulative change in ownership among stockholders with an ownership interest of 5% or more (as determined under Section 382's rules) over a rolling three year period. The Amended Rights Agreement is intended to reduce the likelihood of an ownership change under Section 382 by deterring any person or group from acquiring beneficial ownership of 4.9% or more of the outstanding Common Stock. After various amendments to the Original Rights Agreement, expiration date of the Rights were extended to January 26, 2020 and certain other provisions were amended including the definition of "beneficial ownership" to include terms appropriate for the purpose of preserving tax benefits.
Each Right entitles its holder to purchase from the Company 1/1000th of a share of a newly authorized series of participating preferred stock at an exercise price of $55.00, subject to adjustment in accordance with the terms of the Amended Rights Agreement, once the Rights become exercisable. In general terms, under the Amended Rights Agreement, the Rights become exercisable if any person or group acquires 4.9% or more of the Common Stock or, in the case of any person or group that owned 4.9% or more of the Common Stock as of January 27, 2014, upon the acquisition of any additional shares by such person or group. In addition, the Company, its subsidiaries, employee benefit plans of the Company or any of its subsidiaries, and any entity holding Common Stock for or pursuant to the terms of any such plan, are excepted. Upon exercise of the Right in accordance with the Amended Rights Agreement, the holder would be able to purchase a number of shares of Common Stock from the Company having an aggregate market value (as defined in the Amended Rights Agreement) equal to twice the then-current exercise price for an amount in cash equal to the then-current exercise price. The Rights will not prevent an ownership change from occurring under Section 382 of the Code or a takeover of the Company, but may cause substantial dilution to a person that acquires 4.9% or more of our Common Stock.
14. Stock-Based Compensation
We grant stock-based compensation awards to employees and non-employee directors under our equity compensation plan. On May 20, 2016, our stockholders approved the J. C. Penney Company, Inc. 2016 Long-Term Incentive Plan (2016 Plan), which has a fungible share design in which each stock option will count as one share issued and each stock award will count as 1.6 shares issued, except for stock awards issued from January 30, 2016 to May 20, 2016, the effective date of the 2016 Plan, in which each stock award counted as two shares issued. The 2016 Plan reserved 12.25 million shares of common stock or 19.6 million options for future grants and will terminate on May 30, 2021. In addition, shares underlying any outstanding stock award or stock option grant canceled prior to vesting or exercise become available for use under the 2016 Plan. Under the terms of the 2016 Plan, all grants made after January 30, 2016 reduce the shares available for grant under the 2016 Plan. As of February 3, 2018, a maximum of 12.7 million options were available for future grant under the 2016 Plan.
Our stock option and restricted stock award grants have averaged about 2.5% of outstanding stock over the past three years. Authorized shares of the Company's common stock are used to settle the exercise of stock options, granting of restricted shares and vesting of restricted stock units.
Stock-based Compensation Cost
The components of total stock-based compensation costs are as follows:
($ in millions) | 2017 | 2016 | 2015 | ||||||||
Stock awards | $ | 18 | $ | 27 | $ | 32 | |||||
Stock options | 7 | 8 | 12 | ||||||||
Total stock-based compensation (1) | $ | 25 | $ | 35 | $ | 44 | |||||
Total income tax benefit recognized for stock-based compensation arrangements | $ | — | $ | — | $ | — | |||||
(1) | Excludes $2 million, $0 million and $9 million for 2017, 2016 and 2015, respectively, of stock-based compensation costs reported in restructuring and management transition charges (Note 17). |
81
Stock Options
The following table summarizes stock option activity during the year ended February 3, 2018:
Shares (in thousands) | Weighted - Average Exercise Price Per Share | Weighted - Average Remaining Contractual Term (in years) | Aggregate Intrinsic Value ($ in millions) (1) | ||||||||||
Outstanding at January 28, 2017 | 14,418 | $ | 18 | ||||||||||
Granted | 3,318 | 6 | |||||||||||
Exercised | — | — | |||||||||||
Forfeited/canceled | (3,461 | ) | 24 | ||||||||||
Outstanding at February 3, 2018 | 14,275 | 14 | 5.5 | $ | — | ||||||||
Exercisable at February 3, 2018 | 7,446 | 19 | 3.6 | $ | — | ||||||||
(1) | The intrinsic value of a stock option is the amount by which the market value of the underlying stock exceeds the exercise price of the option at year end. |
Cash proceeds, tax benefits and intrinsic value related to total stock options exercised are provided in the following table:
($ in millions) | 2017 | 2016 | 2015 | |||||||||
Proceeds from stock options exercised | $ | — | $ | 2 | $ | — | ||||||
Intrinsic value of stock options exercised | — | — | — | |||||||||
Tax benefit related to stock-based compensation | — | — | — | |||||||||
Excess tax benefits realized on stock-based compensation | — | — | — | |||||||||
As of February 3, 2018, we had $9 million of unrecognized compensation expense, net of estimated forfeitures, for stock options not yet vested, which will be recognized as expense over the remaining weighted-average vesting period of approximately two years.
Our weighted-average fair value of stock options at grant date was $2.91 in 2017, $4.89 in 2016 and $3.48 in 2015. We primarily used the binomial lattice valuation model to determine the fair value of the stock options granted using the following assumptions:
2017 | 2016 | 2015 | ||||
Weighted-average expected option term | 4.6 years | 4.7 years | 4.6 years | |||
Weighted-average expected volatility | 57.90% | 54.22% | 51.46% | |||
Weighted-average risk-free interest rate | 2.02% | 1.38% | 1.50% | |||
Weighted-average expected dividend yield (1) | —% | —% | —% | |||
Expected dividend yield range (1) | —% | —% | —% | |||
(1) Following the May 1, 2012 payment, we discontinued paying dividends.
82
Stock Awards
The following table summarizes our non-vested stock awards activity during the year ended February 3, 2018:
Time-Based Stock Awards | Performance-Based Stock Awards | ||||||||||||
(shares in thousands) | Number of Units | Weighted-Average Grant Date Fair Value | Number of Units | Weighted-Average Grant Date Fair Value | |||||||||
Non-vested at January 28, 2017 | 5,818 | $ | 9 | 3,128 | $ | 8 | |||||||
Granted | 2,859 | 6 | 1,727 | 6 | |||||||||
Vested | (3,218 | ) | 8 | (262 | ) | 6 | |||||||
Forfeited/canceled | (1,011 | ) | 8 | (659 | ) | 8 | |||||||
Non-vested at February 3, 2018 | 4,448 | 7 | 3,934 | 7 | |||||||||
As of February 3, 2018, we had $22 million of unrecognized compensation expense related to unearned employee stock awards, which will be recognized over the remaining weighted-average vesting period of approximately two years. The aggregate market value of shares vested during 2017, 2016 and 2015 was $17 million, $30 million and $16 million, respectively, compared to an aggregate grant date fair value of $27 million, $28 million and $27 million, respectively. Stock awards granted include approximately 362,000 fully vested RSUs to directors during 2017 with a fair value of $4.57 per RSU award.
In addition to the grants above, on March 6, 2017, we granted approximately 3.3 million phantom units as part of our management incentive compensation plan, which are similar to RSUs in that the number of units granted was based on the price of our stock, but the units will be settled in cash based on the value of our stock on the vesting date, limited to $11.92 per phantom unit. The fair value of the awards is remeasured at each reporting period and was $3.54 per share as of February 3, 2018. Compensation expense, which is variable, is recognized over the vesting period with a corresponding liability, which is recorded in Other accounts payable and accrued expenses and Other liabilities in our Consolidated Balance Sheets. The phantom units have a liability of $11 million as of February 3, 2018. No cash was paid during 2017 for previously granted phantom units.
15. Leases, Financing Obligation and Note Payable
We conduct a major part of our operations from leased premises that include retail stores, store distribution centers, warehouses, offices and other facilities. Almost all leases will expire during the next 20 years; however, most leases will be renewed, primarily through an option exercise, or replaced by leases on other premises. We also lease data processing equipment and other personal property under operating leases of primarily three to five years. Rent expense, net of sublease income, was as follows:
($ in millions) | 2017 | 2016 | 2015 | |||||||||
Real property base rent and straight-lined step rent expense | $ | 177 | $ | 214 | $ | 221 | ||||||
Real property contingent rent expense (based on sales) | 8 | 7 | 7 | |||||||||
Personal property rent expense | 29 | 31 | 39 | |||||||||
Total rent expense | $ | 214 | $ | 252 | $ | 267 | ||||||
Less: sublease income (1) | (11 | ) | (11 | ) | (11 | ) | ||||||
Net rent expense | $ | 203 | $ | 241 | $ | 256 | ||||||
(1) | Sublease income is reported in Real estate and other, net. |
83
As of February 3, 2018, future minimum lease payments for non-cancelable operating leases, including lease renewals determined to be reasonably assured and capital leases, including our note payable, were as follows:
($ in millions) | |||
2018 | $ | 211 | |
2019 | 187 | ||
2020 | 169 | ||
2021 | 150 | ||
2022 | 132 | ||
Thereafter | 1,686 | ||
Less: sublease income | (51 | ) | |
Total minimum lease payments | $ | 2,484 | |
On December 29, 2016, the Company executed a sale-leaseback transaction for its Home Office where the related real estate was sold for $273 million and the Company leased back approximately 65% of the building for an initial term of 15 years and three options to renew the lease for five-year increments. The sale price of the building encompassed net cash proceeds of $216 million, after the payment of $7 million in related closing costs, and seller-financing of $50 million, that is due to the Company in four years along with interest at an annual rate of 5%. The seller-financing portion of the transaction created a form of continuing involvement which precludes sale-leaseback accounting until the related note is paid in full. Accordingly, the Company accounted for the sale-leaseback as a financing transaction with the Home Office remaining on our books at its then carrying value, the net cash proceeds received being reflected as a financing obligation, and the future rental payments to the landlord being treated as debt service and applied to interest and principal over the initial 15 year term.
As of February 3, 2018, future minimum lease payments for capital leases and payments related to our financing obligation and note payable were as follows:
($ in millions) | |||
2018 | $ | 21 | |
2019 | 21 | ||
2020 | 19 | ||
2021 | 19 | ||
2022 | 19 | ||
Thereafter | 186 | ||
Total payments | 285 | ||
Plus: amount representing residual asset balance | 77 | ||
Less: amounts representing interest | (142 | ) | |
Present value of net minimum lease obligations, financing obligation and note payable | $ | 220 | |
84
16. Retirement Benefit Plans
We provide retirement pension benefits, postretirement health and welfare benefits, as well as 401(k) savings, profit-sharing and stock ownership plan benefits to various segments of our workforce. Retirement benefits are an important part of our total compensation and benefits program designed to retain and attract qualified, talented employees. Pension benefits are provided through defined benefit pension plans consisting of a non-contributory qualified pension plan (Primary Pension Plan) and, for certain management employees, non-contributory supplemental retirement plans, including a 1997 voluntary early retirement plan. Retirement and other benefits include:
Defined Benefit Pension Plans |
Primary Pension Plan – funded |
Supplemental retirement plans – unfunded |
Other Benefit Plans |
Postretirement benefits – medical and dental |
Defined contribution plans: |
401(k) savings, profit-sharing and stock ownership plan |
Deferred compensation plan |
Defined Benefit Pension Plans
Primary Pension Plan — Funded
The Primary Pension Plan is a funded non-contributory qualified pension plan, initiated in 1966 and closed to new entrants on January 1, 2007. The plan is funded by Company contributions to a trust fund, which are held for the sole benefit of participants and beneficiaries.
Supplemental Retirement Plans — Unfunded
We have unfunded supplemental retirement plans, which provide retirement benefits to certain management employees. We pay ongoing benefits from operating cash flow and cash investments. The plans are a Supplemental Retirement Program and a Benefit Restoration Plan. Participation in the Supplemental Retirement Program is limited to employees who were annual incentive-eligible management employees as of December 31, 1995. Benefits for these plans are based on length of service and final average compensation. The Benefit Restoration Plan is intended to make up benefits that could not be paid by the Primary Pension Plan due to governmental limits on the amount of benefits and the level of pay considered in the calculation of benefits. The Supplemental Retirement Program is a non-qualified plan that was designed to allow eligible management employees to retire at age 60 with retirement income comparable to the age 65 benefit provided under the Primary Pension Plan and Benefit Restoration Plan. In addition, the Supplemental Retirement Program offers participants who leave between ages 60 and 62 benefits equal to the estimated social security benefits payable at age 62. The Supplemental Retirement Program also continues Company-paid term life insurance at a declining rate until it is phased out at age 70. Employee-paid term life insurance through age 65 is continued under a separate plan (Supplemental Term Life Insurance Plan for Management Profit-Sharing Employees).
Voluntary Early Retirement Program
In 2017, the Company initiated a Voluntary Early Retirement Program (VERP) for approximately 6,000 eligible associates. Eligibility for the VERP included home office, stores and supply chain personnel who met certain criteria related to age and years of service as of January 31, 2017. The consideration period for eligible associates to accept the VERP ended on March 31, 2017. Based on the approximately 2,800 associates who elected to accept the VERP, we incurred a total charge of
$112 million for enhanced retirement benefits. The enhanced retirement benefits increased the projected benefit obligation (PBO) of the Primary Pension Plan and the Supplemental Pension Plans by $88 million and $24 million, respectively. In addition, we incurred curtailment charges of $6 million related to our Primary Pension Plan and $2 million related to Supplemental Pension Plans as a result of the reduction in the expected years of future service related to these plans. Additionally, we recognized settlement expense of $13 million in 2017 due to higher lump-sum payment activity to retirees primarily as a result of the VERP executed earlier in the year.
Primary Pension Plan Lump-Sum Payment Offer and Annuity Contract Purchase
In August 2015, as a result of a plan amendment, we offered approximately 31,000 retirees and beneficiaries in the Primary Pension Plan who commenced their benefit between January 1, 2000 and August 31, 2012 the option to receive a lump-sum settlement payment. In addition, we offered approximately 8,000 participants in the Primary Pension Plan who separated from service and had a deferred vested benefit as of August 31, 2012 the option to receive a lump-sum settlement payment.
85
Approximately 12,000 retirees and beneficiaries elected to receive voluntary lump-sum payments to settle the Primary Pension Plan's obligation to them. In addition, approximately 1,900 former employees having deferred vested benefits elected to receive lump-sums. The lump-sum settlement payments totaling $717 million were made by the Company on November 5, 2015 using assets from the Primary Pension Plan.
On December 7, 2015, the Company completed the purchase of a group annuity contract that transferred to The Prudential Insurance Company of America the pension benefit obligation of approximately 18,000 retirees totaling $838 million.
Actuarial loss of $180 million was recognized as settlement expense as a result of the lump-sum offer payment and the purchase of the group annuity contract.
Pension Expense/(Income) for Defined Benefit Pension Plans
The components of net periodic benefit expense/(income) for our Primary Pension Plan and our non-contributory supplemental pension plans are as follows:
($ in millions) | ||||||||||||
Primary Pension Plan | 2017 | 2016 | 2015 | |||||||||
Service cost | $ | 42 | $ | 55 | $ | 69 | ||||||
Interest cost | 143 | 153 | 196 | |||||||||
Expected return on plan assets | (216 | ) | (215 | ) | (357 | ) | ||||||
Actuarial loss/(gain) | — | — | 52 | |||||||||
Amortization of prior service cost/(credit) | 7 | 8 | 8 | |||||||||
Settlement expense | 13 | — | 180 | |||||||||
Other | — | — | 6 | |||||||||
Net periodic benefit expense/(income) | $ | (11 | ) | $ | 1 | $ | 154 | |||||
Supplemental Pension Plans | ||||||||||||
Service cost | $ | — | $ | — | $ | — | ||||||
Interest cost | 7 | 7 | 7 | |||||||||
Actuarial loss/(gain) | 25 | 11 | 1 | |||||||||
Amortization of prior service cost/(credit) | — | — | — | |||||||||
Net periodic benefit expense/(income) | $ | 32 | $ | 18 | $ | 8 | ||||||
Primary and Supplemental Pension Plans Total | ||||||||||||
Service cost | $ | 42 | $ | 55 | $ | 69 | ||||||
Interest cost | 150 | 160 | 203 | |||||||||
Expected return on plan assets | (216 | ) | (215 | ) | (357 | ) | ||||||
Actuarial loss/(gain) | 25 | 11 | 53 | |||||||||
Amortization of prior service cost/(credit) | 7 | 8 | 8 | |||||||||
Settlement expense | 13 | — | 180 | |||||||||
Other | — | — | 6 | |||||||||
Net periodic benefit expense/(income) | $ | 21 | $ | 19 | $ | 162 | ||||||
The defined benefit plan pension expense shown in the above table is included as a separate line item in the Consolidated Statements of Operations.
Assumptions
The weighted-average actuarial assumptions used to determine expense were as follows:
2017 | 2016 | 2015 | |||||||
Expected return on plan assets | 6.50 | % | 6.75 | % | 6.75 | % | |||
Discount rate | 4.40 | % | (1) | 4.73 | % | 3.87 | % | ||
Salary increase | 3.9 | % | 3.9 | % | 3.5 | % | |||
86
(1) | As of January 31, 2017. The Primary Pension Plan was remeasured as of March 31, 2017 using a discount rate of 4.34% and as of October 31, 2017 using a discount rate of 3.94%. |
The expected return on plan assets is based on the plan’s long-term asset allocation policy, historical returns for plan assets and overall capital market returns, taking into account current and expected market conditions.
The discount rate used to measure pension expense each year is the rate as of the beginning of the year (i.e., the prior
measurement date). The discount rate used, determined by the plan actuary, was based on a hypothetical AA yield curve represented by a series of bonds maturing over the next 30 years, designed to match the corresponding pension benefit cash payments to retirees.
The salary progression rate to measure pension expense was based on age ranges and projected forward.
Funded Status
As of the end of 2017, the funded status of the Primary Pension Plan was 102%. The Primary Benefit Obligation (PBO) is the present value of benefits earned to date by plan participants, including the effect of assumed future salary increases. Under the Employee Retirement Income Security Act of 1974 (ERISA), the funded status of the plan exceeded 100% as of December 31, 2017 and 2016, the qualified pension plan’s year end.
The following table provides a reconciliation of benefit obligations, plan assets and the funded status of the Primary Pension Plan and supplemental pension plans:
Primary Pension Plan | Supplemental Plans | |||||||||||||||
($ in millions) | 2017 | 2016 | 2017 | 2016 | ||||||||||||
Change in PBO | ||||||||||||||||
Beginning balance | $ | 3,473 | $ | 3,327 | $ | 152 | $ | 176 | ||||||||
Service cost | 42 | 55 | — | — | ||||||||||||
Interest cost | 143 | 153 | 7 | 7 | ||||||||||||
Special termination benefits (1) | 88 | — | 24 | — | ||||||||||||
Settlements | (217 | ) | — | — | — | |||||||||||
Curtailments | (27 | ) | — | 3 | — | |||||||||||
Actuarial loss/(gain) | 126 | 151 | 31 | 10 | ||||||||||||
Benefits (paid) | (161 | ) | (213 | ) | (35 | ) | (41 | ) | ||||||||
Balance at measurement date | $ | 3,467 | $ | 3,473 | $ | 182 | $ | 152 | ||||||||
Change in fair value of plan assets | ||||||||||||||||
Beginning balance | $ | 3,455 | $ | 3,287 | $ | — | $ | — | ||||||||
Company contributions | — | — | 35 | 41 | ||||||||||||
Actual return on assets (2) | 451 | 381 | — | — | ||||||||||||
Settlements | (217 | ) | — | — | — | |||||||||||
Benefits (paid) | (161 | ) | (213 | ) | (35 | ) | (41 | ) | ||||||||
Balance at measurement date | $ | 3,528 | $ | 3,455 | $ | — | $ | — | ||||||||
Funded status of the plan | $ | 61 | (3) | $ | (18 | ) | (3) | $ | (182 | ) | (4) | $ | (152 | ) | (4) | |
(1) | See Note 17 for VERP charges classified in Restructuring and management transition. |
(2) | Includes plan administrative expenses. |
(3) | $61 million in 2017 was included in Prepaid pension and $18 million in 2016 was included in Other liabilities in the Consolidated Balance Sheets. |
(4) | $29 million in 2017 and $26 million in 2016 were included in Other accounts payable and accrued expenses on the Consolidated Balance Sheets, and the remaining amounts were included in Other liabilities. |
In 2017, the funded status of the Primary Pension Plan increased by $79 million primarily due to the performance of plan assets. The actual one-year return on pension plan assets at the measurement date was 14.1% in 2017, bringing the annualized return since inception of the plan to 9.0%.
87
The following pre-tax amounts were recognized in Accumulated other comprehensive income/(loss) in the Consolidated Balance Sheets as of the end of 2017 and 2016:
Primary Pension Plan | Supplemental Plans | ||||||||||||||
($ in millions) | 2017 | 2016 | 2017 | 2016 | |||||||||||
Net actuarial loss/(gain) | $ | 169 | $ | 318 | $ | 18 | $ | 12 | |||||||
Prior service cost/(credit) | 37 | 49 | (3 | ) | (4 | ) | |||||||||
Total | $ | 206 | (1) | $ | 367 | $ | 15 | $ | 8 | ||||||
(1) | In 2018, approximately $7 million for the Primary Pension Plan is expected to be amortized from Accumulated other comprehensive income/(loss) and into the Consolidated Statement of Operations. |
Assumptions to Determine Obligations
The weighted-average actuarial assumptions used to determine benefit obligations for each of the years below were as follows:
2017 | 2016 | 2015 | |||||||
Discount rate | 3.98 | % | 4.40 | % | 4.73 | % | |||
Salary progression rate | 3.8 | % | 3.9 | % | 3.9 | % | |||
Accumulated Benefit Obligation (ABO)
The ABO is the present value of benefits earned to date, assuming no future salary growth. The ABO for our Primary Pension Plan was $3.2 billion as of the end of both 2017 and 2016. At the end of 2017, plan assets of $3.5 billion for the Primary Pension Plan were above the ABO. The ABO for our unfunded supplemental pension plans was $167 million and $133 million as of the end of 2017 and 2016, respectively.
Primary Pension Plan Asset Allocation
The target allocation ranges for each asset class as of the end of 2017 and the fair value of each asset class as a percent of the total fair value of pension plan assets were as follows:
2017 Target | Plan Assets | |||||||
Asset Class | Allocation Ranges | 2017 | 2016 | |||||
Equity | 15% - 35% | 23 | % | 22 | % | |||
Fixed income | 55% - 70% | 62 | % | 60 | % | |||
Real estate, cash and other investments | 10% - 20% | 15 | % | 18 | % | |||
Total | 100 | % | 100 | % | ||||
Asset Allocation Strategy
In 2009, we began implementing a liability-driven investment (LDI) strategy to lower the plan’s volatility risk and minimize the impact of interest rate changes on the plan funded status. The implementation of the LDI strategy is phased in over time by reallocating the plan’s assets more towards fixed income investments (i.e., debt securities) that are more closely matched in terms of duration to the plan liability.
The plan’s asset portfolio is actively managed and primarily invested in fixed income balanced with investments in equity securities and other asset classes to maintain an efficient risk/return diversification profile. The risk of loss in the plan’s equity portfolio is mitigated by investing in a broad range of equity securities across different sectors and countries. Investment types, including high-yield debt securities, illiquid assets such as real estate, the use of derivatives and Company securities are set forth in written guidelines established for each investment manager and monitored by the plan’s management team. The plan’s asset allocation policy is designed to meet the plan’s future pension benefit obligations. Under the policy, asset classes are periodically reviewed and rebalanced as necessary, to ensure that the mix continues to be appropriate relative to established targets and ranges.
We have an internal Benefit Plans Investment Committee (BPIC), which consists of senior executives who have established a review process of asset allocation and investment strategies and oversee risk management practices associated with the management of the plan’s assets. Key risk management practices include having an established and broad decision-making framework in place, focused on long-term plan objectives. This framework consists of the BPIC and various third parties, including investment managers, an investment consultant, an actuary and a trustee/custodian. The funded status of the plan is monitored on a continuous basis, including quarterly reviews with updated market and liability information. Actual asset
88
allocations are monitored monthly and rebalancing actions are executed at least quarterly, if needed. To manage the risk associated with an actively managed portfolio, the plan’s management team reviews each manager’s portfolio on a quarterly basis and has written manager guidelines in place, which are adjusted as necessary to ensure appropriate diversification levels. Finally, to minimize operational risk, we utilize a master custodian for all plan assets, and each investment manager reconciles its account with the custodian at least quarterly.
Fair Value of Primary Pension Plan Assets
The tables below provide the fair values of the Primary Pension Plan’s assets as of the end of 2017 and 2016, by major class of asset.
Investments at Fair Value at February 3, 2018 | ||||||||||||||||
($ in millions) | Level 1 (1) | Level 2 (1) | Level 3 | Total | ||||||||||||
Assets | ||||||||||||||||
Cash | $ | 18 | $ | — | $ | — | $ | 18 | ||||||||
Common collective trusts | — | 100 | — | 100 | ||||||||||||
Cash and cash equivalents total | 18 | 100 | — | 118 | ||||||||||||
Common collective trusts – international | — | 155 | — | 155 | ||||||||||||
Equity securities – domestic | 426 | — | — | 426 | ||||||||||||
Equity securities – international | 160 | — | — | 160 | ||||||||||||
Equity securities total | 586 | 155 | — | 741 | ||||||||||||
Common collective trusts | — | 904 | — | 904 | ||||||||||||
Corporate bonds | — | 982 | 10 | 992 | ||||||||||||
Swaps | — | 848 | — | 848 | ||||||||||||
Government securities | — | 187 | — | 187 | ||||||||||||
Mortgage backed securities | — | 6 | — | 6 | ||||||||||||
Other fixed income | — | 143 | 4 | 147 | ||||||||||||
Fixed income total | — | 3,070 | 14 | 3,084 | ||||||||||||
Public REITs | 38 | — | — | 38 | ||||||||||||
Real estate total | 38 | — | — | 38 | ||||||||||||
Total investment assets at fair value | $ | 642 | $ | 3,325 | $ | 14 | $ | 3,981 | ||||||||
Liabilities | ||||||||||||||||
Swaps | $ | — | $ | (837 | ) | $ | — | $ | (837 | ) | ||||||
Other fixed income | — | (5 | ) | — | (5 | ) | ||||||||||
Fixed income total | — | (842 | ) | — | (842 | ) | ||||||||||
Total liabilities at fair value | $ | — | $ | (842 | ) | $ | — | $ | (842 | ) | ||||||
Accounts payable, net | (47 | ) | ||||||||||||||
Investments at Net Asset Value (NAV) (2) | ||||||||||||||||
Private equity | $ | 191 | ||||||||||||||
Private real estate | 62 | |||||||||||||||
Hedge funds | 183 | |||||||||||||||
Total investments at NAV | $ | 436 | ||||||||||||||
Total net assets | $ | 3,528 | ||||||||||||||
(1) | There were no significant transfers in or out of level 1 or 2 investments. |
(2) | Certain investments that are measured at fair value using the net asset value per share (or its equivalent) practical expedient have not been classified in the fair value hierarchy. The fair value amounts presented in this table are intended to permit reconciliation of the fair value hierarchy to the amounts presented in the Consolidated Balance Sheet. |
89
Investments at Fair Value at January 28, 2017 | ||||||||||||||||
($ in millions) | Level 1 (1) | Level 2 (1) | Level 3 | Total | ||||||||||||
Assets | ||||||||||||||||
Cash | $ | 2 | $ | — | $ | — | $ | 2 | ||||||||
Common collective trusts | — | 88 | — | 88 | ||||||||||||
Cash and cash equivalents total | 2 | 88 | — | 90 | ||||||||||||
Common collective trusts – international | — | 148 | — | 148 | ||||||||||||
Equity securities – domestic | 421 | — | — | 421 | ||||||||||||
Equity securities – international | 113 | — | — | 113 | ||||||||||||
Equity securities total | 534 | 148 | — | 682 | ||||||||||||
Common collective trusts | — | 864 | — | 864 | ||||||||||||
Corporate bonds | — | 919 | 7 | 926 | ||||||||||||
Swaps | — | 934 | — | 934 | ||||||||||||
Government securities | — | 185 | — | 185 | ||||||||||||
Mortgage backed securities | — | 4 | — | 4 | ||||||||||||
Other fixed income | — | 149 | — | 149 | ||||||||||||
Fixed income total | — | 3,055 | 7 | 3,062 | ||||||||||||
Public REITs | 37 | — | — | 37 | ||||||||||||
Private real estate | — | 15 | — | 15 | ||||||||||||
Real estate total | 37 | 15 | — | 52 | ||||||||||||
Total investment assets at fair value | $ | 573 | $ | 3,306 | $ | 7 | $ | 3,886 | ||||||||
Liabilities | ||||||||||||||||
Swaps | $ | — | $ | (928 | ) | $ | — | $ | (928 | ) | ||||||
Other fixed income | — | (6 | ) | — | (6 | ) | ||||||||||
Fixed income total | — | (934 | ) | — | (934 | ) | ||||||||||
Total liabilities at fair value | $ | — | $ | (934 | ) | $ | — | $ | (934 | ) | ||||||
Accounts payable, net | (76 | ) | ||||||||||||||
Investments at Net Asset Value (NAV) (2) | ||||||||||||||||
Private equity | $ | 220 | ||||||||||||||
Private real estate | 135 | |||||||||||||||
Hedge funds | 224 | |||||||||||||||
Total investments at NAV | $ | 579 | ||||||||||||||
Total net assets | $ | 3,455 | ||||||||||||||
(1) | There were no significant transfers in or out of level 1 or 2 investments. |
(2) | Certain investments that are measured at fair value using the net asset value per share (or its equivalent) practical expedient have not been classified in the fair value hierarchy. The fair value amounts presented in this table are intended to permit reconciliation of the fair value hierarchy to the amounts presented in the Consolidated Balance Sheet. |
Following is a description of the valuation methodologies used for Primary Pension Plan assets measured at fair value.
Cash – Cash is valued at cost which approximates fair value, and is classified as level 1 of the fair value hierarchy.
Common Collective Trusts – Common collective trusts are pools of investments within cash equivalents, equity and fixed income that are benchmarked relative to a comparable index. They are valued on the basis of the relative interest of each participating investor in the fair value of the underlying assets. The investments are are valued at net asset value (NAV) as fair value and are classified as level 2 of the fair value hierarchy.
Equity Securities – Equity securities are common stocks and preferred stocks valued based on the price of the security as listed on an open active exchange and classified as level 1 of the fair value hierarchy, as well as warrants and preferred stock that are
90
valued at a price, which is based on a broker quote in an over-the-counter market, and are classified as level 2 of the fair value hierarchy.
Private Equity – Private equity is composed of interests in private equity funds valued on the basis of the relative interest of each participating investor in the fair value of the underlying assets and/or common stock of privately held companies. There are no observable market values for private equity funds. The valuations for the funds are derived using a combination of different methodologies including (1) the market approach, which consists of analyzing market transactions for comparable assets, (2) the income approach using the discounted cash flow model, or (3) cost method. Private equity funds also provide audited financial statements. Private equity investments are valued at NAV as a practical expedient.
Corporate Bonds – Corporate bonds and Corporate loans are valued at a price which is based on observable market information in primary markets or a broker quote in an over-the-counter market, and are classified as level 2 or level 3 of the fair value hierarchy.
Swaps – swap contracts are based on broker quotes in an over-the-counter market and are classified as level 2 of the fair value hierarchy.
Government, Municipal Bonds and Mortgaged Backed Securities – Government and municipal securities are valued at a price based on a broker quote in an over-the-counter market and classified as level 2 of the fair value hierarchy. Mortgage backed securities are valued at a price based on observable market information or a broker quote in an over-the-counter market and classified as level 2 of the fair value hierarchy.
Other Fixed Income – non-mortgage asset backed securities, collateral held in short-term investments for derivative contract and derivatives composed of futures contracts, option contracts and other fixed income derivatives valued at a price based on observable market information or a broker quote in an over-the-counter market and classified as level 2 of the fair value hierarchy.
Real Estate – Real estate is comprised of public and private real estate investments. Real estate investments through registered investment companies that trade on an exchange are classified as level 1 of the fair value hierarchy. Investments through open end private real estate funds, depending on the type of investment, are valued at the reported NAV as fair value or are classified as level 2 of the fair value hierarchy. Private real estate investments through partnership interests that are valued based on different methodologies including discounted cash flow, direct capitalization and market comparable analysis are valued at NAV as a practical expedient.
Hedge Fund – Hedge funds exposure is through fund of funds, which are made up of over 30 different hedge fund managers diversified over different hedge strategies. The fair value of the hedge fund is determined by the fund's administrator using valuation provided by the third party administrator for each of the underlying funds. Hedge fund investments are valued at NAV as a practical expedient.
91
The following tables set forth a summary of changes in the fair value of the Primary Pension Plan’s level 3 investment assets:
2017 | |||||||
($ in millions) | Corporate Loans | Corporate Bonds | |||||
Balance, beginning of year | $ | — | $ | 7 | |||
Transfers, net | — | — | |||||
Realized gains/(loss) | — | (7 | ) | ||||
Unrealized (losses)/gains | — | 6 | |||||
Purchases and issuances | 4 | 6 | |||||
Sales, maturities and settlements | — | (2 | ) | ||||
Balance, end of year | $ | 4 | $ | 10 | |||
2016 | |||||||
($ in millions) | Corporate Loans | Corporate Bonds | |||||
Balance, beginning of year | $ | 3 | $ | 5 | |||
Realized gains/(loss) | — | 3 | |||||
Unrealized (losses)/gains | — | (4 | ) | ||||
Purchases and issuances | — | 15 | |||||
Sales, maturities and settlements | (3 | ) | (12 | ) | |||
Balance, end of year | $ | — | $ | 7 | |||
Contributions
Our policy with respect to funding the Primary Pension Plan is to fund at least the minimum required by ERISA rules, as amended by the Pension Protection Act of 2006, and not more than the maximum amount deductible for tax purposes. Due to our past funding of the pension plan and overall positive growth in plan assets since plan inception, there will not be any required cash contribution for funding of plan assets in 2018 under ERISA, as amended by the Pension Protection Act of 2006.
Our contributions to the unfunded non-qualified supplemental retirement plans are equal to the amount of benefit payments made to retirees throughout the year and for 2018 are anticipated to be approximately $29 million. Benefits are paid in the form of five equal annual installments to participants and no election as to the form of benefit is provided for in the unfunded plans. The following sets forth our estimated future benefit payments:
($ in millions) | Primary Plan Benefits | Supplemental Plan Benefits | ||||||
2018 | $ | 195 | $ | 29 | ||||
2019 | 196 | 28 | ||||||
2020 | 199 | 26 | ||||||
2021 | 202 | 21 | ||||||
2022 | 206 | 8 | ||||||
2023-2027 | 1,080 | 44 | ||||||
Other Benefit Plans
Postretirement Benefits — Medical and Dental
We provide medical and dental benefits to retirees through a contributory medical and dental plan based on age and years of service. We provide a defined dollar commitment toward retiree medical premiums.
Effective June 7, 2005, we amended the medical plan to reduce our subsidy to post-age 65 retirees and spouses by 45% beginning January 1, 2006, and then fully eliminated the subsidy after December 31, 2006. As disclosed previously, the postretirement benefit plan was amended in 2001 to reduce and cap the per capita dollar amount of the benefit costs that would
92
be paid by the plan. Thus, changes in the assumed or actual health care cost trend rates do not materially affect the accumulated postretirement benefit obligation or our annual expense.
The net periodic postretirement benefit income of $17 million in 2016 and $7 million in 2015 is included in SG&A expenses in the Consolidated Statements of Operations. The postretirement medical and dental plan was terminated effective December 31, 2016. At the end of 2015, the postretirement medical and dental plan had no assets and an accumulated postretirement benefit obligation (APBO) of $8 million.
Defined Contribution Plans
The Savings, Profit-Sharing and Stock Ownership Plan (Savings Plan) is a qualified defined contribution plan, a 401(k) plan, available to all eligible employees. Effective January 1, 2007, all employees who are age 21 or older are immediately eligible to participate in and contribute a percentage of their pay to the Savings Plan. Eligible employees, who have completed one year and at least 1,000 hours of service within an eligibility period, are offered a fixed matching contribution each pay period equal to 50% of up to 6% of pay contributed by the employee. Matching contributions are credited to employees’ accounts in accordance with their investment elections and fully vest after three years. We may make additional discretionary matching contributions.
The Savings Plan includes a non-contributory retirement account. Participants who are hired or rehired on or after January 1, 2007 and who have completed at least 1,000 hours of service within an eligibility period receive a Company contribution in an amount equal to 2% of the participants’ annual pay. This Company contribution is in lieu of the primary pension benefit that was closed to employees hired or rehired on or after that date. Participating employees are fully vested after three years.
Effective January 1, 2017, the Company added a Safe Harbor 401(k) Plan that was made available for active employees hired on or after January 1, 2007. The Company matching contributions under the Safe Harbor Plan are equal to 100% of up to 5% of pay contributed by the employee. Matching contributions are credited to employees' accounts in accordance with their investment elections and fully vest immediately. The Safe Harbor Plan replaces the non-contributory retirement account.
In addition to the Savings Plan, we sponsor the Mirror Savings Plan, which is a non-qualified contributory unfunded defined contribution plan offered to certain management employees. This plan supplements retirement savings under the Savings Plan for eligible management employees who choose to participate in it. The plan’s investment options generally mirror the traditional Savings Plan investment options. Similar to the supplemental retirement plans, the Mirror Savings Plan benefits are paid from our operating cash flow and cash investments.
The expense for these plans, which was predominantly included in SG&A expenses in the Consolidated Statements of Operations, was $46 million in 2017, $49 million in 2016 and $56 million in 2015.
17. Restructuring and Management Transition
On March 17, 2017, the Company finalized its plans to close 138 stores to help align the Company's brick-and-mortar presence with its omnichannel network, thereby redirecting capital resources to invest in locations and initiatives that offer the greatest revenue potential. The store closures resulted in a $77 million asset impairment charge for store assets with limited future use and a $14 million severance charge for the expected displacement of store associates. During 2017, $52 million in store related closing and other costs such as certain lease obligations were recorded as a result of each respective store ceasing operations.
The components of Restructuring and management transition include:
• | VERP -- charges for enhanced retirement benefits, curtailment and other expenses related to the VERP (See Note 16); |
• | Home office and stores -- charges for actions to reduce our store and home office expenses including employee termination benefits, store lease termination and impairment charges; |
• | Management transition -- charges related to implementing changes within our management leadership team for both incoming and outgoing members of management; and |
• | Other -- charges related primarily to contract termination costs and other costs associated with our previous shops strategy and costs related to the closure of certain supply chain locations. |
93
The composition of restructuring and management transition charges was as follows:
Cumulative Amount From Program Inception Through | ||||||||||||||||
($ in millions) | 2017 | 2016 | 2015 | 2017 | ||||||||||||
VERP | $ | 122 | $ | — | $ | — | $ | 122 | ||||||||
Home office and stores | 176 | 8 | 42 | 473 | ||||||||||||
Management transition | — | 3 | 28 | 255 | ||||||||||||
Other | 5 | 15 | 14 | 183 | ||||||||||||
Total | $ | 303 | $ | 26 | $ | 84 | $ | 1,033 | ||||||||
Activity for the restructuring and management transition liability for 2017 and 2016 was as follows:
($ in millions) | Home Office and Stores | Management Transition | Other | Total | ||||||||||||
January 30, 2016 | $ | 18 | $ | 10 | $ | 23 | $ | 51 | ||||||||
Charges | 9 | 3 | 15 | 27 | ||||||||||||
Cash payments | (23 | ) | (13 | ) | (11 | ) | (47 | ) | ||||||||
January 28, 2017 | 4 | — | 27 | 31 | ||||||||||||
Charges | 102 | — | 5 | 107 | ||||||||||||
Cash payments | (72 | ) | — | (25 | ) | (97 | ) | |||||||||
February 3, 2018 | $ | 34 | $ | — | $ | 7 | $ | 41 | ||||||||
18. Real Estate and Other, Net
Real estate and other consists of ongoing operating income from our real estate subsidiaries. Real estate and other also includes net gains from the sale of facilities and equipment that are no longer used in operations, asset impairments, accruals for certain litigation and other non-operating charges and credits. In addition, during the first quarter of 2014, we formed a joint venture to develop the excess property adjacent to our home office facility in Plano, Texas (Home Office Land Joint Venture) in which we contributed approximately 220 acres of excess property adjacent to our home office facility in Plano, Texas. The joint venture was formed to develop the contributed property and our proportional share of the joint venture's activities will be recorded in Real estate and other, net.
The composition of real estate and other, net was as follows:
($ in millions) | 2017 | 2016 | 2015 | |||||||||
Net gain from sale of non-operating assets | $ | — | $ | (5 | ) | $ | (9 | ) | ||||
Investment income from Home Office Land Joint Venture | (31 | ) | (28 | ) | (41 | ) | ||||||
Net gain from sale of operating assets | (119 | ) | (73 | ) | (9 | ) | ||||||
Store and other asset impairments | — | — | 20 | |||||||||
Other | 4 | (5 | ) | 42 | ||||||||
Total expense/(income) | $ | (146 | ) | $ | (111 | ) | $ | 3 | ||||
Investment Income from Joint Ventures
In 2017, the Company had $31 million in income related to its proportional share of the net income in the Home Office Land Joint Venture and received an aggregate cash distribution of $40 million. In 2016, the Company had $28 million in income related to its proportional share of the net income in the Home Office Land Joint Venture and received an aggregate cash distribution of $44 million.
94
Net Gain from Sale of Operating Assets
In 2017, we completed the sale of our Buena Park, California distribution facility for a net sale price of $131 million and recorded a net gain of $111 million. In 2016, the Company sold excess land adjacent to its home office for approximately $80 million and recognized an approximate $62 million gain.
Other - Settlement of Class Action Lawsuit
During 2015, the Company accrued $50 million for the proposed settlement related to a pricing class action lawsuit. Pursuant to the settlement, the Company paid $25 million in cash to certain class members and issued $25 million of store credit to the remainder of the class members.
19. Income Taxes
The components of our income tax expense/(benefit) were as follows:
($ in millions) | 2017 | 2016 | 2015 | |||||||||
Current | ||||||||||||
Federal and foreign | $ | (64 | ) | $ | (12 | ) | $ | 5 | ||||
State and local | 22 | 4 | 6 | |||||||||
Total current | (42 | ) | (8 | ) | 11 | |||||||
Deferred | ||||||||||||
Federal and foreign | (59 | ) | 9 | (1 | ) | |||||||
State and local | (25 | ) | — | (1 | ) | |||||||
Total deferred | (84 | ) | 9 | (2 | ) | |||||||
Total income tax expense/(benefit) | $ | (126 | ) | $ | 1 | $ | 9 | |||||
The following table summarizes a reconciliation of income tax expense/(benefit) compared with the amounts at the U.S. federal statutory income tax rate:
($ in millions) | 2017 | 2016 | 2015 | |||||||||
Federal income tax at statutory rate | $ | (82 | ) | $ | 1 | $ | (176 | ) | ||||
State and local income tax, less federal income tax benefit | (12 | ) | (2 | ) | (21 | ) | ||||||
Increase/(decrease) in valuation allowance | 33 | (1 | ) | 185 | ||||||||
Effect of U.S. tax reform | (75 | ) | — | — | ||||||||
Other, including permanent differences and credits | 10 | 3 | 21 | |||||||||
Total income tax expense/(benefit) | $ | (126 | ) | $ | 1 | $ | 9 | |||||
95
Our deferred tax assets and liabilities were as follows:
($ in millions) | 2017 | 2016 | ||||||
Assets | ||||||||
Merchandise inventory | $ | 10 | $ | 27 | ||||
Accrued vacation pay | 8 | 17 | ||||||
Gift cards | 57 | 98 | ||||||
Stock-based compensation | 30 | 58 | ||||||
State taxes | 5 | 12 | ||||||
Workers’ compensation/general liability | 44 | 74 | ||||||
Accrued rent | 26 | 39 | ||||||
Litigation exposure | 3 | 16 | ||||||
Mirror savings plan | 8 | 13 | ||||||
Pension and other retiree obligations | 34 | 76 | ||||||
Net operating loss and tax credit carryforwards | 719 | 931 | ||||||
Other | 48 | 77 | ||||||
Total deferred tax assets | 992 | 1,438 | ||||||
Valuation allowance | (767 | ) | (993 | ) | ||||
Total net deferred tax assets | 225 | 445 | ||||||
Liabilities | ||||||||
Depreciation and amortization | (310 | ) | (561 | ) | ||||
Tax benefit transfers | (31 | ) | (53 | ) | ||||
Long-lived intangible assets | (27 | ) | (35 | ) | ||||
Total deferred tax liabilities | (368 | ) | (649 | ) | ||||
Total net deferred tax liabilities | $ | (143 | ) | $ | (204 | ) | ||
The U.S. Tax Cuts and Jobs Act, enacted in December 2017, significantly changed the U.S. corporate income tax laws. In connection with the enactment, we recorded a net benefit of $75 million during the fourth quarter of 2017, which is primarily due to the revaluation of net deferred tax liabilities based on the new lower corporate income tax rate.
As of February 3, 2018, a valuation allowance of $767 million has been recorded against our deferred tax assets. In assessing the need for the valuation allowance, we considered both positive and negative evidence related to the likelihood of realization of the deferred tax assets. As a result of our assessment, we concluded that, beginning in the second quarter of 2013, our estimate of the realization of deferred tax assets would be based solely on the future reversals of existing taxable temporary differences and tax planning strategies that we would make use of to accelerate taxable income to utilize expiring net operating loss (NOL) and tax credit carryforwards.
We are required to allocate a portion of our tax provision between operating losses and Accumulated other comprehensive income/(loss). In 2017, we experienced a loss in continuing operations and income in other comprehensive income. Under the allocation rules we are only required to recognize the valuation allowance allocable to the tax benefit attributable to losses in each component of comprehensive income. Accordingly, there is no valuation allowance offsetting a deferred tax benefit attributable to other comprehensive income included in the total valuation allowance of $767 million noted above.
The Company has a federal net operating loss (NOL) of $2.1 billion and $58 million of tax credit carryforwards as of February 3, 2018. These NOL carryforwards (expiring in 2032 through 2034) arose prior to December 31, 2017 and are available to offset future taxable income. The Company may recognize additional NOLs in the future which, under the Tax Act, would not expire but would only be available to offset up to 80% of the Company’s future taxable income.
These carryforwards have a potential to be used to offset future taxable income and reduce future cash tax liabilities by approximately $719 million. The Company’s ability to utilize these carryforwards will depend upon the availability of future taxable income during the carryforward period and, as such, there is no assurance the Company will be able to realize such tax savings.
96
The Company’s ability to utilize NOL carryforwards could be further limited if it were to experience an “ownership change,” as defined in Section 382 of the Code and similar state provisions. An ownership change can occur whenever there is a cumulative shift in the ownership of a company by more than 50 percentage points by one or more “5% stockholders” within a three-year period. The occurrence of such a change generally limits the amount of NOL carryforwards a company could utilize in a given year to the aggregate fair market value of the company’s common stock immediately prior to the ownership change, multiplied by the long-term tax-exempt interest rate in effect for the month of the ownership change.
As discussed in Note 13, on January 27, 2014, the Board adopted the Amended Rights Agreement to help prevent acquisitions of the Company’s common stock that could result in an ownership change under Section 382 which helps preserve the Company’s ability to use its NOL and tax credit carryforwards. The Amended Rights Agreement was ratified by the shareholder vote on May 16, 2014. On May 19, 2017, stockholders approved the extension of the term of the agreement to January 26, 2020.
The Amended Rights Agreement is designed to prevent acquisitions of the Company’s common stock that would result in a stockholder owning 4.9% or more of the Company’s common stock (as calculated under Section 382), or any existing holder of 4.9% or more of the Company’s common stock acquiring additional shares, by substantially diluting the ownership interest of any such stockholder unless the stockholder obtains an exemption from the Board.
A reconciliation of unrecognized tax benefits is as follows:
($ in millions) | 2017 | 2016 | 2015 | |||||||||
Beginning balance | $ | 79 | $ | 91 | $ | 62 | ||||||
Additions for tax positions of prior years | 4 | 16 | 40 | |||||||||
Reductions for tax positions of prior years | (45 | ) | (24 | ) | — | |||||||
Settlements and effective settlements with tax authorities | (3 | ) | (4 | ) | (10 | ) | ||||||
Expirations of statute | — | — | (1 | ) | ||||||||
Balance at end of year | $ | 35 | $ | 79 | $ | 91 | ||||||
Unrecognized tax benefits included in our Consolidated Balance Sheets were as follows:
($ in millions) | 2017 | 2016 | ||||||
Deferred taxes (noncurrent liability) | $ | 32 | $ | 75 | ||||
Accounts payable and accrued expenses (Note 7) | 2 | 3 | ||||||
Other liabilities (Note 8) | 1 | 1 | ||||||
Total | $ | 35 | $ | 79 | ||||
As of the end of 2017, 2016 and 2015, the unrecognized tax benefits balance included $32 million, $32 million and $33 million, respectively, that, if recognized, would be a benefit in the income tax provision after giving consideration to the offsetting effect of $7 million, $11 million and $12 million, respectively, related to the federal tax deduction of state taxes. The remaining amounts reflect tax positions for which the ultimate deductibility is highly certain, but for which there is uncertainty about the timing. Accrued interest and penalties related to unrecognized tax benefits included in income tax expense as of the end of 2017, 2016 and 2015 were $1 million, $2 million and $3 million, respectively.
We file income tax returns in U.S. federal and state jurisdictions and certain foreign jurisdictions. Our U.S. federal returns have been examined through 2015. We are audited by the taxing authorities of many states and certain foreign countries and are subject to examination by these taxing jurisdictions for years generally after 2008. The tax authorities may have the right to examine prior periods where federal and state NOL and tax credit carryforwards were generated, and make adjustments up to the amount of the NOL and credit carryforward amounts.
97
20. Supplemental Cash Flow Information
($ in millions) | 2017 | 2016 | 2015 | |||||||||
Supplemental cash flow information | ||||||||||||
Income taxes received/(paid), net | $ | (9 | ) | $ | (10 | ) | $ | (5 | ) | |||
Interest received/(paid), net | (302 | ) | (344 | ) | (369 | ) | ||||||
Supplemental non-cash investing and financing activity | ||||||||||||
Increase/(decrease) in other accounts payable related to purchases of property and equipment and software | 25 | 20 | 1 | |||||||||
Purchase of property and equipment and software through capital leases and a note payable | — | 1 | 1 | |||||||||
21. Litigation and Other Contingencies
Litigation
Class Action Securities Litigation
The Company, Myron E. Ullman, III and Kenneth H. Hannah are parties to the Marcus consolidated purported class action lawsuit in the U.S. District Court, Eastern District of Texas, Tyler Division. The Marcus consolidated complaint is purportedly brought on behalf of persons who acquired our common stock during the period from August 20, 2013 through September 26, 2013, and alleges claims for violations of Sections 10(b) and 20(a) of the Securities Exchange Act of 1934 and Rule 10b-5 promulgated thereunder. Plaintiff claims that the defendants made false and misleading statements and/or omissions regarding the Company’s financial condition and business prospects that caused our common stock to trade at artificially inflated prices. The consolidated complaint seeks class certification, unspecified compensatory damages, including interest, reasonable costs and expenses, and other relief as the court may deem just and proper. Defendants filed a motion to dismiss the consolidated complaint which was denied by the court on September 29, 2015. Defendants filed an answer to the consolidated complaint on November 12, 2015. Plaintiff filed a motion for class certification on January 25, 2016, and on August 29, 2016, a magistrate judge issued a report and recommendation that the motion for class certification be granted. The district court adopted this report and recommendation granting class certification on March 8, 2017.
Also, on August 26, 2014, plaintiff Nathan Johnson filed a purported class action lawsuit against the Company, Myron E. Ullman, III and Kenneth H. Hannah in the U.S. District Court, Eastern District of Texas, Tyler Division. The suit is purportedly brought on behalf of persons who acquired our securities other than common stock during the period from August 20, 2013 through September 26, 2013, generally mirrors the allegations contained in the Marcus lawsuit discussed above, and seeks similar relief. On June 8, 2015, plaintiff in the Marcus lawsuit amended the consolidated complaint to include the members of the purported class in the Johnson lawsuit, and on June 10, 2015, the Johnson lawsuit was consolidated into the Marcus lawsuit.
The parties have reached an agreement to settle the consolidated securities class action for $97.5 million, which will be funded by insurance. The court granted final approval of the settlement on January 4, 2018.
Shareholder Derivative Litigation
In October 2013, two purported shareholder derivative actions were filed against certain present and former members of the Company’s Board of Directors and executives by the following parties in the U.S. District Court, Eastern District of Texas, Sherman Division: Weitzman (filed October 2, 2013) and Zauderer (filed October 3, 2013). The Company is named as a nominal defendant in both suits. The lawsuits assert claims for breaches of fiduciary duties and unjust enrichment based upon alleged false and misleading statements and/or omissions regarding the Company’s financial condition. The lawsuits seek unspecified compensatory damages, restitution, disgorgement by the defendants of all profits, benefits and other compensation, equitable relief to reform the Company’s corporate governance and internal procedures, reasonable costs and expenses, and other relief as the court may deem just and proper. On October 28, 2013, the Court consolidated the two cases into the Weitzman lawsuit. On January 15, 2014, the Court entered an order staying the derivative suits pending certain events in the class action securities litigation described above. On January 24, 2018, the Court issued an order reopening the suits.
Also, in March 2016, plaintiff Frank Lipsius filed a purported shareholder derivative action against certain present and former members of the Company's Board of Directors and executives in the District Court of Collin County in the State of Texas. The Company is named as a nominal defendant in the suit. The suit generally mirrors the allegations contained in the Weitzman and Zauderer suits discussed above, and seeks similar relief. On May 18, 2017, plaintiff in the Lipsius suit voluntarily dismissed the Collin County action, and on May 19, 2017, refiled the action in the District Court of Dallas County, Texas.
98
On June 8, 2017, the Company’s Board of Directors received a demand from a purported shareholder of the Company, Douglas Carlson, to conduct an investigation regarding potential claims that certain present and former members of the Board of Directors and executives violated federal securities law and/or breached their fiduciary duties to the Company based upon allegations similar to those in the Marcus class action securities litigation and the related shareholder derivative litigation. The Board of Directors appointed a committee of independent directors (the "Demand Review Committee") to review the demand and make a recommendation to the Board of Directors regarding a response to the demand. In November 2017, the Demand Review Committee completed its review and recommended that the demand be denied, which recommendation was adopted by the Board of Directors.
While no assurance can be given as to the ultimate outcome of these matters, we believe that the final resolution of these actions will not have a material adverse effect on our results of operations, financial position, liquidity or capital resources.
ERISA Class Action Litigation
JCP and certain present and former members of JCP's Board of Directors have been sued in a purported class action complaint by plaintiffs Roberto Ramirez and Thomas Ihle, individually and on behalf of all others similarly situated, which was filed on July 8, 2014 in the U.S. District Court, Eastern District of Texas, Tyler Division. The suit alleges that the defendants violated Section 502 of the Employee Retirement Income Security Act (ERISA) by breaching fiduciary duties relating to the J. C. Penney Corporation, Inc. Savings, Profit-Sharing and Stock Ownership Plan (the Plan). The class period is alleged to be between November 1, 2011 and September 27, 2013. Plaintiffs allege that they and others who invested in or held Company stock in the Plan during this period were injured because defendants allegedly made false and misleading statements and/or omissions regarding the Company’s financial condition and business prospects that caused the Company’s common stock to trade at artificially inflated prices. The complaint seeks class certification, declaratory relief, a constructive trust, reimbursement of alleged losses to the Plan, actual damages, attorneys’ fees and costs, and other relief. Defendants filed a motion to dismiss the complaint which was granted in part and denied in part by the court on September 29, 2015. The parties reached a settlement agreement pursuant to which JCP will make available $4.5 million to settle class members’ claims, and the court granted final approval of the settlement on December 18, 2017.
Employment Class Action Litigation
JCP is a defendant in a class action proceeding entitled Tschudy v. JCPenney Corporation filed on April 15, 2011 in the U.S.
District Court, Southern District of California. The lawsuit alleges that JCP violated the California Labor Code in connection with the alleged forfeiture of accrued and vested vacation time under its “My Time Off” policy. The class consists of all JCP employees who worked in California from April 5, 2007 to the present. Plaintiffs amended the complaint to assert additional claims under the Illinois Wage Payment and Collection Act on behalf of all JCP employees who worked in Illinois from January 1, 2004 to the present. After the court granted JCP’s motion to transfer the Illinois claims, those claims are now pending in a separate action in the U.S. District Court, Northern District of Illinois, entitled Garcia v. JCPenney Corporation. The lawsuits seek compensatory damages, penalties, interest, disgorgement, declaratory and injunctive relief, and attorney’s fees and costs. Plaintiffs in both lawsuits filed motions, which the Company opposed, to certify these actions on behalf of all employees in California and Illinois based on the specific claims at issue. On December 17, 2014, the California court granted plaintiffs’ motion for class certification. Pursuant to a motion by the Company, the California court decertified the class on December 9, 2015. On March 30, 2016, the California court granted JCP’s motion for summary judgment. On April 26, 2016, the California plaintiffs filed a notice of appeal. On May 4, 2016, the California court entered judgment for JCP on all plaintiffs’ claims. The Illinois court denied without prejudice plaintiffs' motion for class certification pending the filing of an amended complaint. Plaintiffs filed their amended complaint in the Illinois lawsuit on April 14, 2015 and the Company answered. On July 2, 2015, the Illinois plaintiffs renewed their motion for class certification, which the Illinois court granted on March 8, 2016. The parties have reached a settlement agreement, subject to final court approval, to resolve the California action for $1.75 million. The California court granted final approval of the settlement on November 3, 2017. The parties have also reached a settlement agreement to resolve the Illinois action for $5 million. The Illinois court granted final approval of the settlement on August 9, 2017.
Other Legal Proceedings
We are subject to various other legal and governmental proceedings involving routine litigation incidental to our business. Accruals have been established based on our best estimates of our potential liability in certain of these matters, including certain matters discussed above, all of which we believe aggregate to an amount that is not material to the Consolidated Financial Statements. These estimates were developed in consultation with in-house and outside counsel. While no assurance can be given as to the ultimate outcome of these matters, we currently believe that the final resolution of these actions, individually or in the aggregate, will not have a material adverse effect on our results of operations, financial position, liquidity or capital resources.
99
Contingencies
As of February 3, 2018, we have an estimated accrual of $20 million related to potential environmental liabilities that is recorded in Other accounts payable and accrued expenses and Other liabilities in the Consolidated Balance Sheet. This estimate covered potential liabilities primarily related to underground storage tanks, remediation of environmental conditions involving our former drugstore locations and asbestos removal in connection with approved plans to renovate or dispose of our facilities. We continue to assess required remediation and the adequacy of environmental reserves as new information becomes available and known conditions are further delineated. If we were to incur losses at the estimated amount, we do not believe that such losses would have a material effect on our financial condition, results of operations or liquidity.
As a result of Hurricanes Harvey, Irma and Maria in 2017, the Company incurred varying property damage and inventory losses in all of its Puerto Rico stores, in one store in Texas and in one store in Florida. Costs related to the property damage and inventory losses are recoverable (net of deductibles) from property insurance maintained by the Company and from certain landlords per the store leases. We have recorded $16 million in losses related to the cost of any property damage and inventory losses and have collected $15 million in loss recoveries from our insurance provider and have a receivable of $1 million for future expected recoveries.
22. Subsequent Events
On March 12, 2018, JCP issued $400 million of senior secured second priority notes with a 8.625% rate (the "Notes"). The Notes are guaranteed, jointly and severally, by the Company and certain domestic subsidiaries of JCP that guarantee the Company's senior secured term loan facility and existing senior secured notes. The net proceeds from the Notes are expected to be used for the tender consideration for the Company's contemporaneous cash tender offers for approximately $95 million in principal of its 8.125% Senior Notes Due 2019 and approximately $225 million in principal of its 5.65% Senior Notes Due 2020.
100
23. Quarterly Results of Operations (Unaudited)
The following is a summary of our quarterly unaudited consolidated results of operations for 2017 and 2016:
2017 | ||||||||||||||||
($ in millions, except EPS) | First Quarter | Second Quarter | Third Quarter | Fourth Quarter | ||||||||||||
Total net sales | $ | 2,706 | $ | 2,962 | $ | 2,807 | $ | 4,031 | ||||||||
Cost of goods sold (exclusive of depreciation and amortization) | 1,723 | 1,923 | 1,852 | 2,676 | ||||||||||||
SG&A expenses | 843 | 842 | 840 | 943 | ||||||||||||
Restructuring and management transition (1) | 220 | 23 | 52 | 8 | ||||||||||||
Net income/(loss) | (180 | ) | (62 | ) | (128 | ) | 254 | |||||||||
Diluted earnings/(loss) per share (2) | $ | (0.58 | ) | $ | (0.20 | ) | $ | (0.41 | ) | $ | 0.81 | |||||
2016 | ||||||||||||||||
($ in millions, except EPS) | First Quarter | Second Quarter | Third Quarter | Fourth Quarter | ||||||||||||
Total net sales | $ | 2,811 | $ | 2,918 | $ | 2,857 | $ | 3,961 | ||||||||
Cost of goods sold (exclusive of depreciation and amortization) | 1,793 | 1,834 | 1,795 | 2,649 | ||||||||||||
SG&A expenses | 872 | 853 | 888 | 925 | ||||||||||||
Restructuring and management transition (3) | 6 | 9 | 2 | 9 | ||||||||||||
Net income/(loss) | (68 | ) | (56 | ) | (67 | ) | 192 | |||||||||
Diluted earnings/(loss) per share (2) | $ | (0.22 | ) | $ | (0.18 | ) | $ | (0.22 | ) | $ | 0.61 | |||||
(1) | Restructuring and management transition charges (Note 17) by quarter for 2017 consisted of the following: |
($ in million) | First Quarter | Second Quarter | Third Quarter | Fourth Quarter | |||||||||||
VERP | $ | 122 | $ | — | $ | — | $ | — | |||||||
Home office and stores | 98 | 23 | 52 | 3 | |||||||||||
Management transition | — | — | — | — | |||||||||||
Other | — | — | — | 5 | |||||||||||
Total | $ | 220 | $ | 23 | $ | 52 | $ | 8 | |||||||
(2) | EPS is computed independently for each of the quarters presented. The sum of the quarters may not equal the total year amount due to the impact of changes in average quarterly shares outstanding. |
(3) | Restructuring and management transition charges (Note 17) by quarter for 2016 consisted of the following: |
($ in millions) | First Quarter | Second Quarter | Third Quarter | Fourth Quarter | |||||||||||
Home office and stores | $ | 4 | $ | — | $ | 2 | $ | 2 | |||||||
Management transition | 2 | 1 | — | — | |||||||||||
Other | — | 8 | — | 7 | |||||||||||
Total | $ | 6 | $ | 9 | $ | 2 | $ | 9 | |||||||
101