Exhibit 99.1

|
MarkWest Energy Partners, L.P. |
|
Contact: |
|
Frank Semple, Chairman, President & CEO |
|
1515 Arapahoe Street |
|
|
|
Nancy Buese, Executive VP and CFO |
|
Tower 1, Suite 1600 |
|
|
|
Josh Hallenbeck, VP of Finance & Treasurer |
|
Denver, Colorado 80202 |
|
Phone: |
|
(866) 858-0482 |
|
|
|
E-mail: |
|
investorrelations@markwest.com |
MarkWest Energy Partners Reports Fourth Quarter and Full Year Financial Results
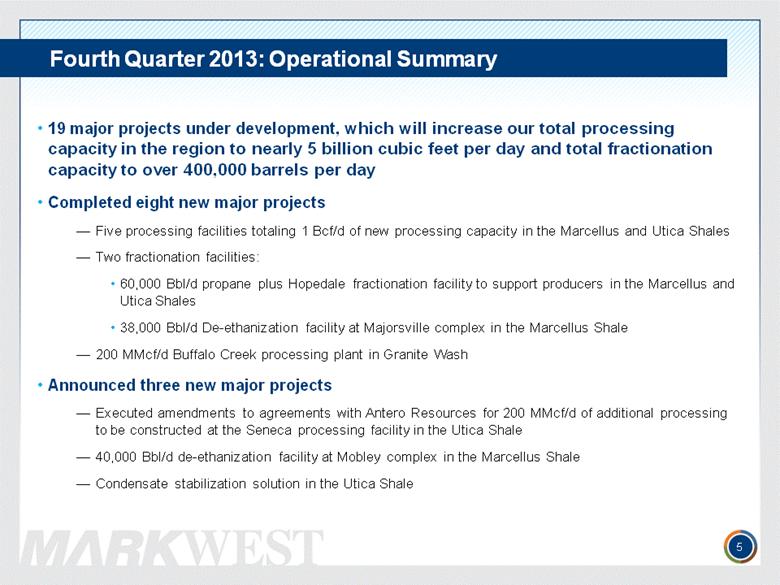
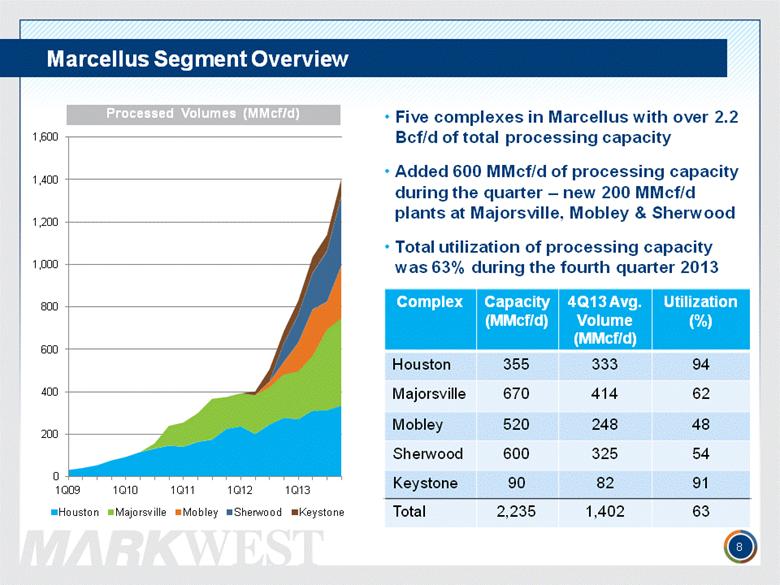
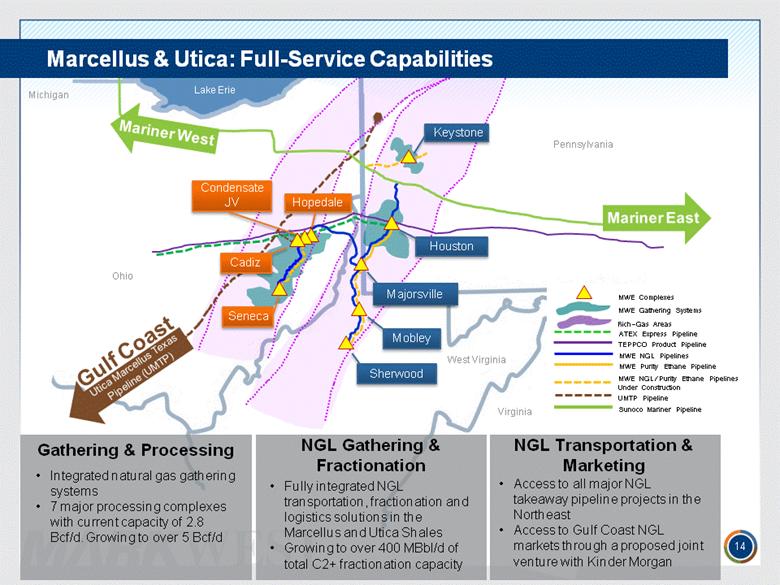
· Increased total processing capacity in the Marcellus and Utica Shales to over 2.8 Bcf/d with the completion of five major gas processing facilities totaling 1 Bcf/d in the past five months
· Placed into service the Hopedale fractionation and marketing complex in the Utica Shale, increasing current fractionation capacity for propane and heavier purity products in the Northeast to over 140,000 Bbl/d
· Announced the development of 200 MMcf/d of additional processing capacity at the Seneca complex in the Utica Shale to support Antero Resources
· Placed into service the Buffalo Creek processing plant, a 200 MMcf/d cryogenic processing facility in the Anadarko Basin, that is supported by long-term fee-based agreements with Chesapeake Energy
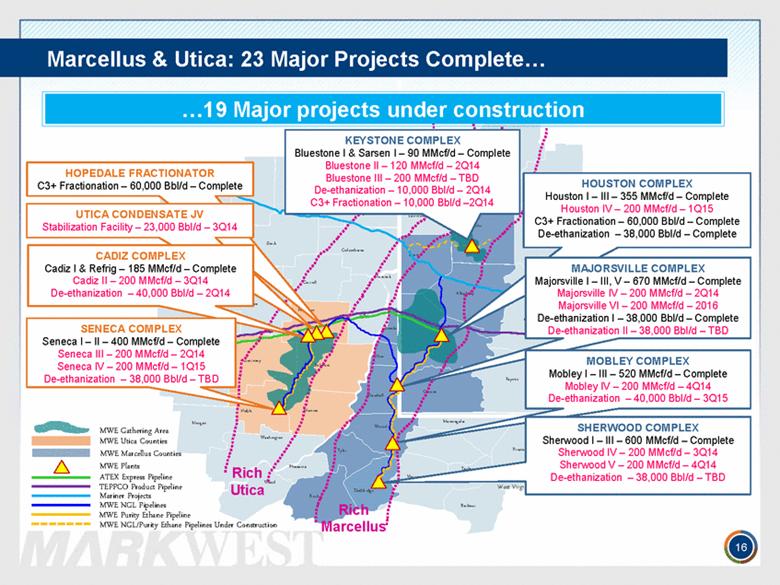
· The Partnership has 19 major processing and fractionation facilities under construction in the Northeast
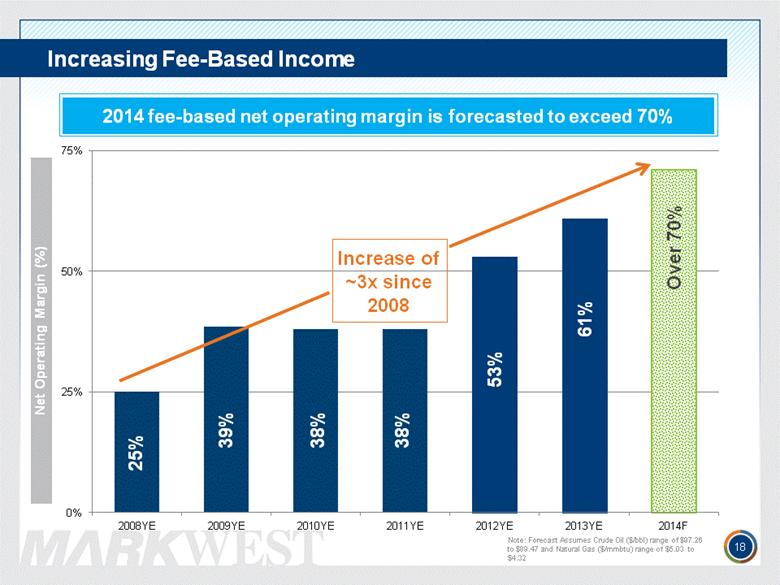
· Fee-based net operating margin increased from 53 percent to 65 percent when compared to the fourth quarter of 2012
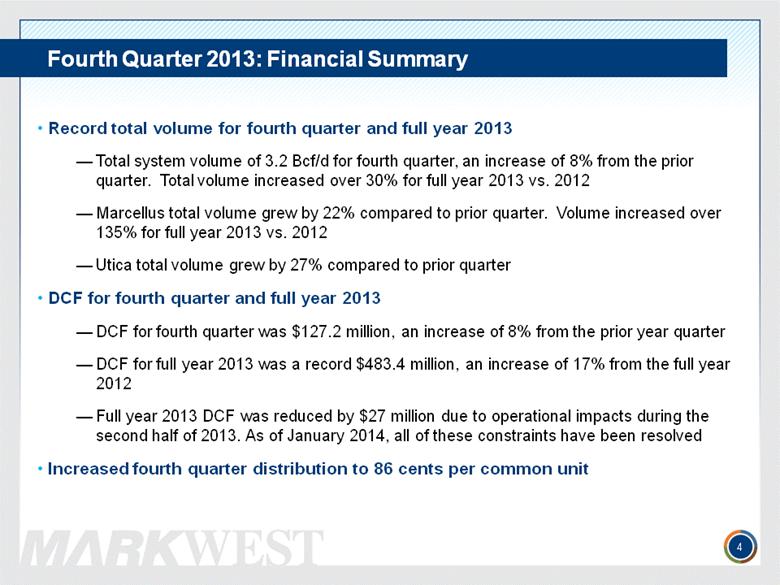
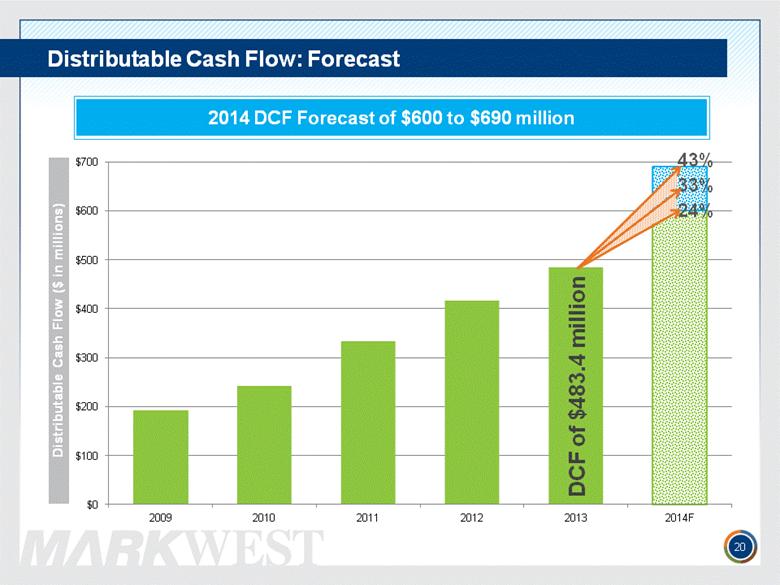
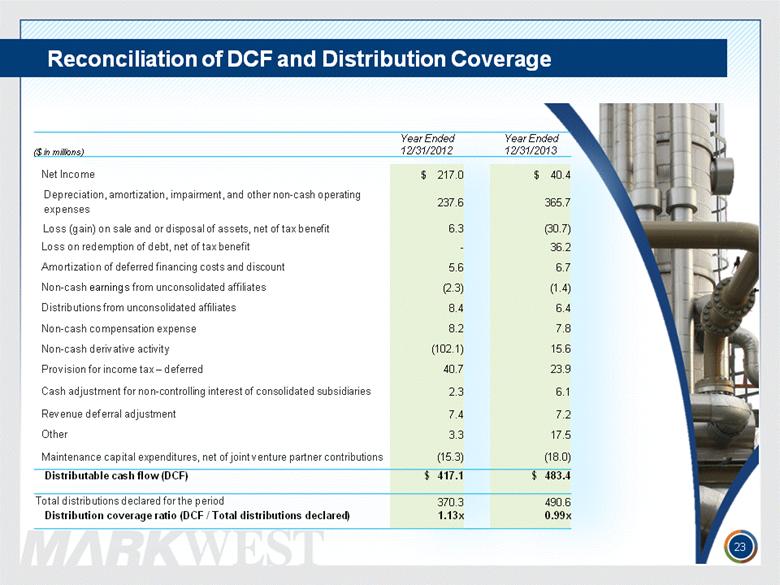
DENVER—February 26, 2014—MarkWest Energy Partners, L.P. (NYSE: MWE) (the Partnership) today reported quarterly cash available for distribution to common unitholders, or distributable cash flow (DCF), of $127.2 million for the three months ended December 31, 2013, and $483.4 million for the year ended December 31, 2013. DCF for the three months and year ended December 31, 2013 represents distribution coverage of 94 percent and 99 percent, respectively. The fourth quarter distribution of $135.9 million, or $0.86 per common unit, was paid to unitholders on February 14, 2014. The fourth quarter 2013 distribution represents an increase of $0.01 per common unit or 1.2 percent over the third quarter 2013 distribution and an increase of $0.04 per common unit or 4.9 percent compared to the fourth quarter 2012 distribution. As a Master Limited Partnership, cash distributions to common unitholders are largely determined based on DCF. A reconciliation of DCF to net income, the most directly comparable GAAP financial measure, is provided within the financial tables of this press release.
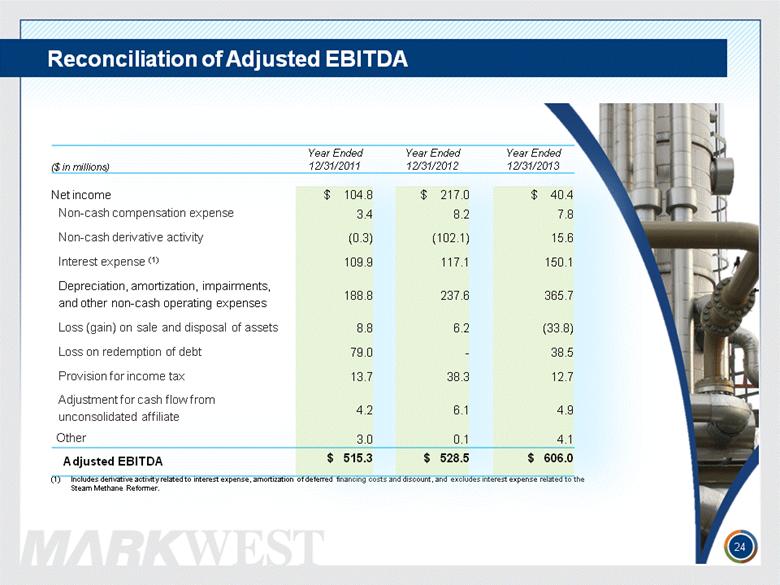
The Partnership reported Adjusted EBITDA of $155.5 million for the three months ended December 31, 2013 and $606.0M for the year ended December 31, 2013, as compared to $138.0 million and $528.5 million for the three months and year ended December 31, 2012. The Partnership believes the presentation of Adjusted EBITDA provides useful information because it is commonly used by investors in Master Limited Partnerships to assess financial performance and operating results of ongoing business operations. A reconciliation of Adjusted EBITDA to net income, the most
directly comparable GAAP financial measure, is provided within the financial tables of this press release.
The Partnership reported (loss) income before provision for income tax for the three months and year ended December 31, 2013, of $(3.8) million and $53.1 million, respectively. (Loss) income before provision for income tax includes non-cash loss associated with the change in fair value of derivative instruments of $14.4 million and $15.6 million for the respective three months and year ended December 31, 2013, a gain of $0.8 million and $39.7 million related to the divestiture of gathering assets in the Marcellus Shale for the respective three months and year ended December 31, 2013, and a loss associated with the redemption of debt of $38.5 million for the year ended December 31, 2013. Excluding these items, income before provision for income tax for the three months and year ended December 31, 2013 would have been $9.8 million and $67.5 million, respectively.
“We are very pleased to close 2013 with the completion of major infrastructure projects that are critical to the development of the Marcellus and Utica Shales,” stated Frank Semple, Chairman, President and Chief Executive Officer. “Our producers’ ongoing success and expanding development plans continue to provide us with exceptional future growth opportunities. We are committed to delivering another year of strong financial results, operational excellence and best of class customer service in many of America’s most exciting resource plays.”
![]() BUSINESS HIGHLIGHTS
BUSINESS HIGHLIGHTS
Marcellus:
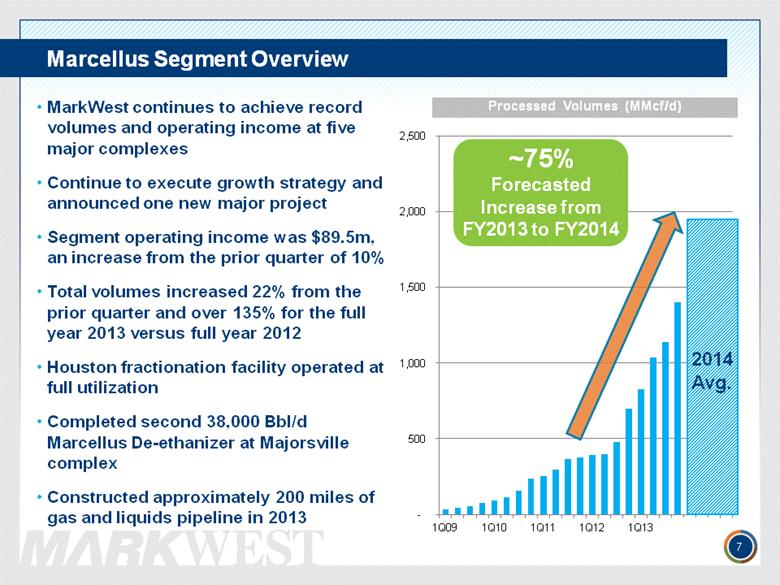
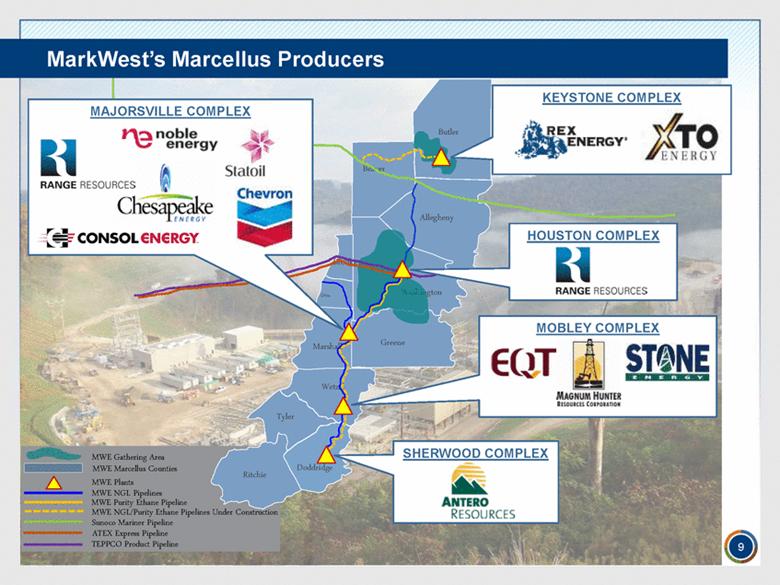
· In November 2013, the Partnership announced an expansion of the Sherwood complex in Doddridge County, West Virginia to support Antero Resources Corporation’s (NYSE: AR) highly prospective rich-gas Marcellus Shale acreage. The Partnership will construct Sherwood V, a new 200 million cubic feet per day (MMcf/d) processing facility that is scheduled to begin operations in the third quarter of 2014.
· In November 2013, the Partnership completed Majorsville V, a 200 MMcf/d processing plant at the Majorsville complex in Marshall County, West Virginia. Majorsville V supports growing rich-gas production from Chesapeake Energy Corporation (NYSE: CHK), and Statoil ASA (NYSE: STO) and increases the total processing capacity of the complex to 670 MMcf/d.
· In November 2013, the Partnership completed Sherwood III, a 200 MMcf/d processing plant at the Sherwood complex. Sherwood III supports Antero Resources Corporation and increases the total processing capacity of the complex to 600 MMcf/d.
· In December 2013, the Partnership completed Mobley III, a 200 MMcf/d processing plant at the Mobley complex in Wetzel County, West Virginia. Mobley III supports rapidly growing rich-gas production from EQT Corporation (NYSE: EQT) and Magnum Hunter Resources Corporation (NYSE: MHR) and increases the total processing capacity of the complex to 520 MMcf/d.
· In December 2013, the Partnership completed the 38,000 barrels per day (Bbl/d) de-ethanization unit at the Majorsville complex. The new de-ethanizer doubles the Partnership’s total purity ethane production capacity in the Marcellus Shale to 76,000 Bbl/d and provides producers with the ability to consistently meet residue gas quality specifications and deliver downstream ethane pipeline commitments.
· In December 2013, the Partnership completed the Liberty Ethane Pipeline. The Liberty Ethane Pipeline transports purity ethane produced at the Majorsville complex to the Houston complex in Washington County, Pennsylvania. Once delivered to the Houston complex, the purity ethane has direct access to multiple, major ethane takeaway projects including, Mariner West and ATEX, which began operations in December, and Mariner East, which is scheduled to come online for ethane service in 2015.
· In February 2014, the Partnership announced the development of a 40,000 Bbl/d de-ethanization facility at the Mobley complex. The Mobley de-ethanizer will support purity ethane production for EQT Corporation, Magnum Hunter Resources Corporation and other producers. The new facility is scheduled to begin operations during the third quarter of 2015.
Utica:
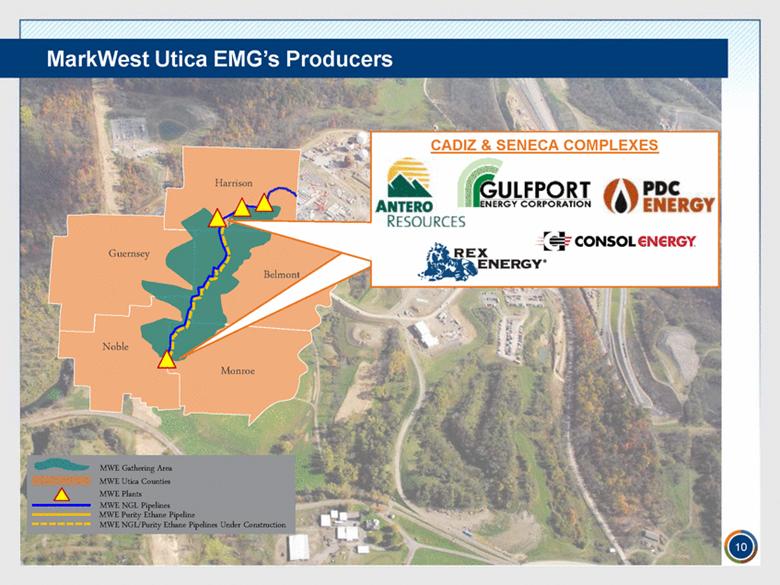
· In November 2013, MarkWest Utica EMG commenced operations at the Seneca complex in Noble County, Ohio. The Seneca complex currently consists of two cryogenic processing plants totaling 400 MMcf/d of capacity and is supported by long-term fee-based agreements with Antero Resources Corporation, Gulfport Energy Corporation (NASDAQ: GPOR), Rex Energy Corporation (NASDAQ: REXX), PDC Energy (NASDAQ: PDCE) and others.
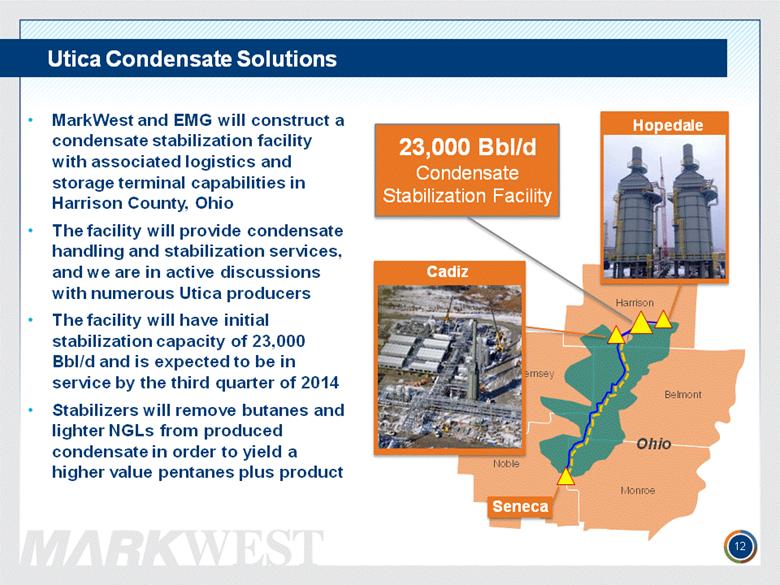
· In December 2013, the Partnership and The Energy & Minerals Group (EMG) executed definitive agreements with Gulfport Energy Corporation to provide condensate stabilization and logistics services in eastern Ohio. As part of these agreements, the Partnership and EMG formed Ohio Condensate Company, LLC, a new Joint Venture (JV) related to the development of industry-leading facilities and services to support the rapid growth of condensate production occurring in the Utica Shale. The JV will initially develop a 23,000 Bbl/d condensate stabilization facility in Harrison County, Ohio. The new facility is scheduled to commence operations in the third quarter of 2014 and will be co-located with condensate storage and logistics terminal, which will be constructed and operated by a subsidiary of Toledo International, Inc., Ohio-based Midwest Terminals.
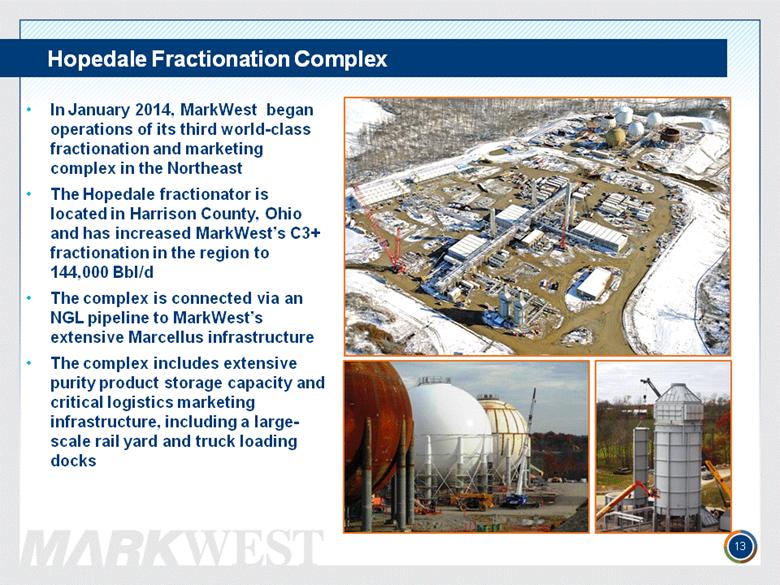
· In January 2014, MarkWest Utica EMG and the Partnership completed construction and commenced operations of the jointly-owned Hopedale fractionation and marketing complex (Hopedale complex) in Harrison County, Ohio. The Hopedale complex consists of a 60,000 Bbl/d propane and heavier purity products (C3+) fractionator, over 230,000 barrels of purity product storage, a 24-bay rail car loading facility with slots to accommodate 200 rail cars, and truck loading and off loading facilities. The Hopedale complex is connected by NGL pipeline to MarkWest Utica EMG’s Cadiz processing complex in Harrison County, Ohio, to the Seneca processing complex in Noble County, Ohio and to its extensive NGL gathering network in the Marcellus Shale.
· In January 2014, the Partnership commenced operations of a NGL pipeline connecting the Hopedale fractionation and marketing complex to the Partnership’s industry-leading NGL infrastructure in the Marcellus Shale. By integrating two industry-leading midstream systems, the Partnership has expanded the fractionation capacity for its Marcellus producers.
· Today, MarkWest Utica EMG is announcing the expansion of the Seneca complex with a new 200 million cubic feet per day (MMcf/d) processing plant. The plant is anchored by a new agreement with Antero Resources Corporation supporting its expanding Utica development plans. The Seneca IV plant is scheduled to commence operations in the first quarter of 2015 and will expand total processing capacity of the complex to 800 MMcf/d.
Southwest:
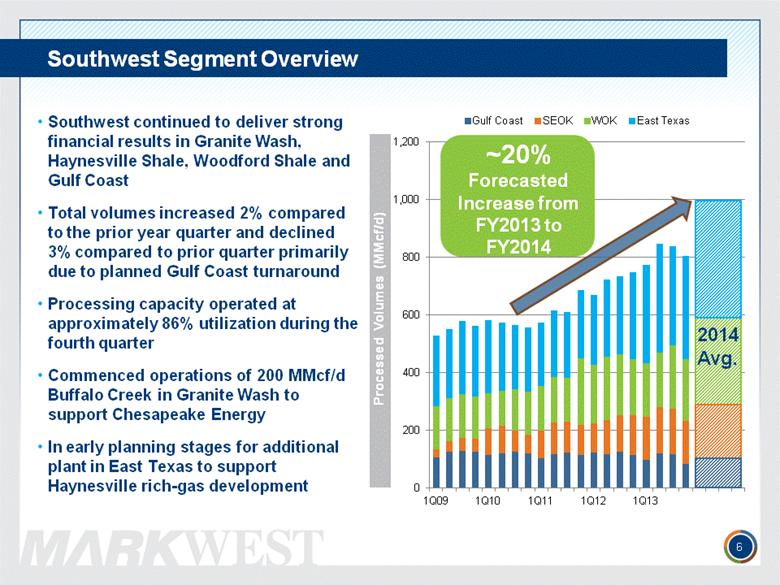
· In February 2014, the Partnership announced the commencement of the 200 MMcf/d Buffalo Creek processing facility in Beckham County, Oklahoma, and associated gas gathering and compression assets in the Granite Wash. The new facility is supported by long-term fee-based agreements with Chesapeake Energy Corporation, which include a 130,000 acre dedication throughout the area. The completion of the Buffalo Creek plant increases the Partnership’s total processing capacity in the Anadarko Basin to 435 MMcf/d at two major complexes.
Capital Markets
· During the fourth quarter of 2013, the Partnership offered 10.0 million units and received net proceeds of approximately $658.2 million under the $1 billion continuous offering program launched in the third quarter of 2013.
FINANCIAL RESULTS
Balance Sheet
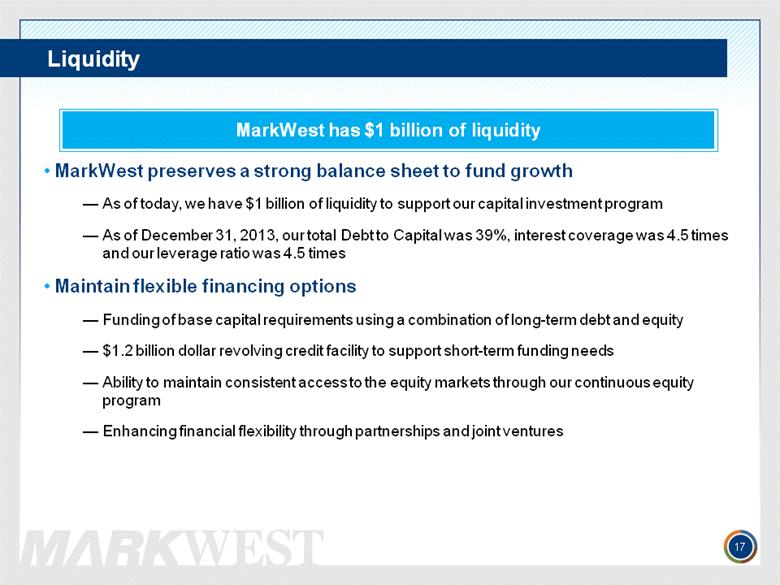
· As of December 31, 2013, the Partnership had $80.0 million of cash and cash equivalents in wholly owned subsidiaries and $1.19 billion of remaining capacity under its $1.2 billion revolving credit facility after consideration of $11.3 million of outstanding letters of credit.
Operating Results
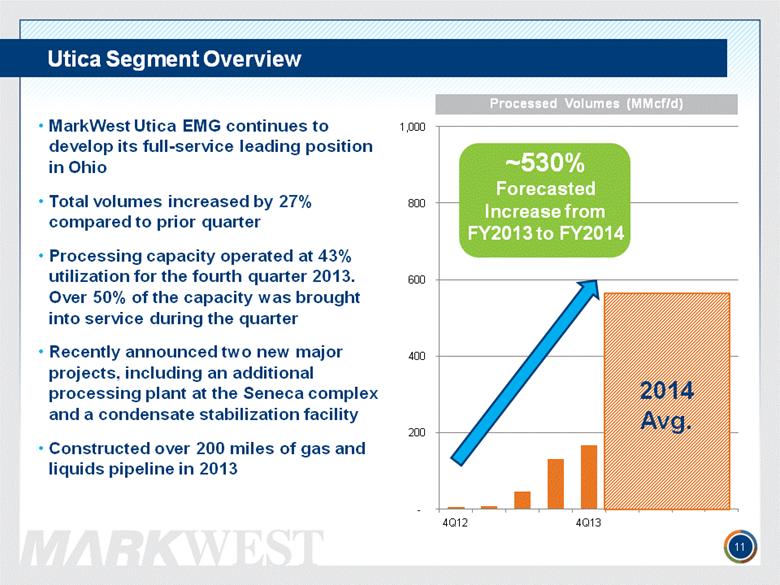
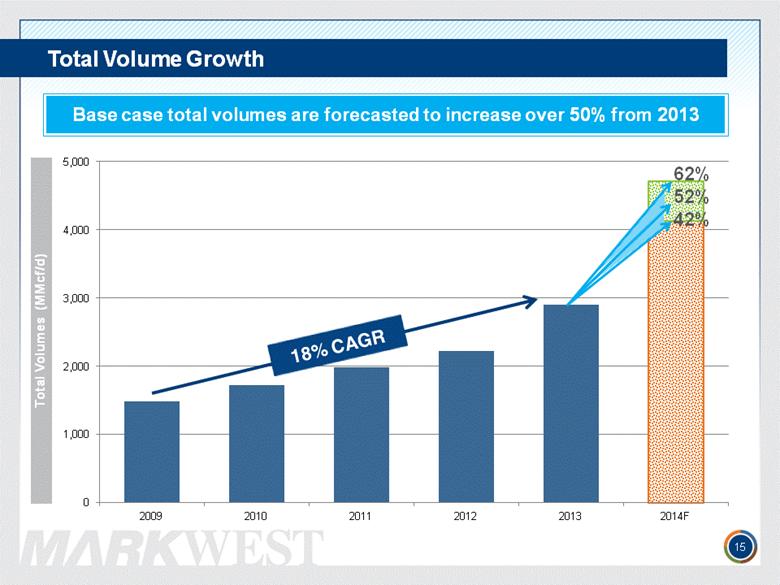
· Operating income before items not allocated to segments for the three months ended December 31, 2013, was $185.1 million, an increase of $23.1 million when compared to segment operating income of $162.0 million over the same period in 2012. This increase was primarily attributable to higher processing volumes. Processed volumes continued to increase in the fourth quarter of 2013, growing approximately 51 percent when compared to the fourth quarter of 2012, primarily due to the Partnership’s Marcellus and Southwest segments. While the Partnership continued to increase its operating income and volumes, it experienced several operational constraints during the second half of 2013. Due to these considerations, operating income was approximately $12.0 million lower than expected for the three months ended December 31, 2013, and approximately $24.1 million for the year ended December 31, 2013. The operational constraints included increased costs related to the transportation of producer natural gas liquids in excess of our fractionation capacity to third party fractionation facilities, delays related to the completion of Sunoco Logistics Partners’, L.P. (NYSE: SXL) Mariner West purity ethane pipeline and an NGL line break that took the Partnership’s Mobley complex offline and curtailed processing volumes at the Partnership’s Sherwood complex for approximately two months. As of January 2014, all operational constraints have been resolved.
A reconciliation of operating income before items not allocated to segments to income before provision for income tax, the most directly comparable GAAP financial measure, is provided within the financial tables of this press release.
· Operating income before items not allocated to segments does not include losses on commodity derivative instruments. Realized losses on commodity derivative instruments were $8.7 million in the fourth quarter of 2013 and $2.1 million in the fourth quarter of 2012.
Capital Expenditures
· For the three months ended December 31, 2013, the Partnership’s portion of capital expenditures was $870.2 million.
2014 DCF AND GROWTH CAPITAL EXPENDITURE FORECAST
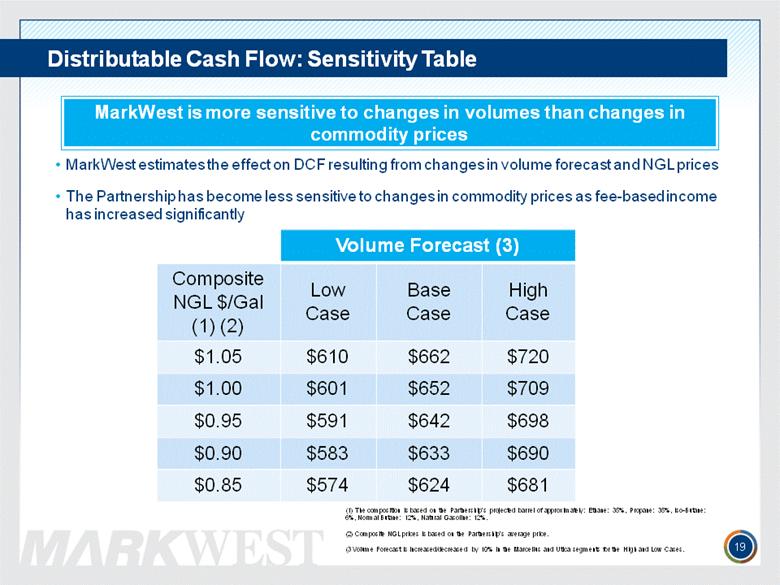
For 2014, the Partnership forecasts DCF in a range of $600 million to $690 million based on its current forecast of operational volumes and prices for crude oil, natural gas, natural gas liquids and derivative instruments currently outstanding. The Partnership has become less sensitive to changes in commodity prices as a result of fee-based income increasing significantly. For the full year 2014, the Partnership estimates that operating income will be over 70 percent fee-based. In addition, the Partnership has hedged approximately 60 percent of its forecasted 2014 NGL exposure on a volumetric basis, 90 percent of these with direct product hedges. An updated sensitivity analysis for forecasted 2014 DCF based on changes in composite NGL prices and changes in volume assumptions is provided within the tables of this press release.
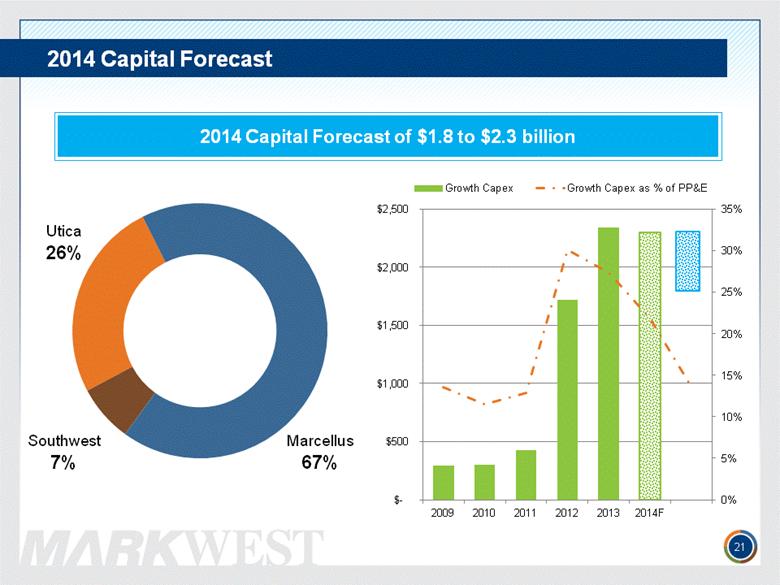
The Partnership’s portion of growth capital expenditures for 2014 is forecasted in a range of $1.8 billion to $2.3 billion. Maintenance capital is forecasted at approximately $25 million.
CONFERENCE CALL
The Partnership will host a conference call on Thursday, February 27, 2014, at 12:00 p.m. Eastern Time to review its fourth quarter and full year 2013 financial results. Interested parties can participate in the call by dialing (800) 475-0218 (passcode “MarkWest”) approximately ten minutes prior to the scheduled start time. Prior to the conference call, the Partnership will post a fourth quarter earnings call presentation to its website. To access the conference call and presentation, please visit the Investor Relations section of the Partnership’s website at www.markwest.com. A replay of the conference call will be available on the Partnership’s website or by dialing (866) 448-4799 (no passcode required).
###
MarkWest Energy Partners, L.P. is a master limited partnership engaged in the gathering, processing and transportation of natural gas; the gathering, transportation, fractionation, storage and marketing of natural gas liquids; and the gathering and transportation of crude oil. MarkWest has a leading presence in many unconventional gas plays including the Marcellus Shale, Utica Shale, Huron/Berea Shale, Haynesville Shale, Woodford Shale and Granite Wash formation.
This press release includes “forward-looking statements.” All statements other than statements of historical facts included or incorporated herein may constitute forward-looking statements. Actual results could vary significantly from those expressed or implied in such statements and are subject to a number of risks and uncertainties. Although MarkWest believes that the expectations reflected in the forward-looking statements are reasonable, MarkWest can give no assurance that such expectations will prove to be correct. The forward-looking statements involve risks and uncertainties that affect operations, financial performance, and other factors as discussed in filings with the Securities and Exchange Commission (SEC). Among the factors that could cause results to differ materially are those risks discussed in the periodic reports filed with the SEC, including MarkWest’s Annual Report on Form 10-K for the year ended December 31, 2013. You are urged to carefully review and consider the cautionary statements and other disclosures made in those filings, specifically those under the heading “Risk Factors.” MarkWest does not undertake any duty to update any forward-looking statement except as required by law.
MarkWest Energy Partners, L.P.
Financial Statistics
(unaudited, in thousands, except per unit data)
|
|
|
Three months ended December 31, |
|
Twelve months ended December 31, |
| ||||||||
|
Statement of Operations Data |
|
2013 |
|
2012 |
|
2013 |
|
2012 |
| ||||
|
Revenue: |
|
|
|
|
|
|
|
|
| ||||
|
Revenue |
|
$ |
467,372 |
|
$ |
363,570 |
|
$ |
1,687,085 |
|
$ |
1,383,279 |
|
|
Derivative (loss) gain |
|
(13,834 |
) |
5,583 |
|
(24,638 |
) |
56,535 |
| ||||
|
Total revenue |
|
453,538 |
|
369,153 |
|
1,662,447 |
|
1,439,814 |
| ||||
|
|
|
|
|
|
|
|
|
|
| ||||
|
Operating expenses: |
|
|
|
|
|
|
|
|
| ||||
|
Purchased product costs |
|
191,577 |
|
143,673 |
|
691,165 |
|
530,328 |
| ||||
|
Derivative loss (gain) related to purchased product costs |
|
9,165 |
|
7,174 |
|
(1,737 |
) |
(13,962 |
) | ||||
|
Facility expenses |
|
91,220 |
|
57,422 |
|
291,069 |
|
206,861 |
| ||||
|
Derivative loss related to facility expenses |
|
69 |
|
235 |
|
2,869 |
|
1,371 |
| ||||
|
Selling, general and administrative expenses |
|
24,161 |
|
24,973 |
|
101,549 |
|
93,444 |
| ||||
|
Depreciation |
|
83,982 |
|
55,778 |
|
299,884 |
|
183,250 |
| ||||
|
Amortization of intangible assets |
|
16,719 |
|
15,040 |
|
64,644 |
|
53,320 |
| ||||
|
Loss (gain) on sale or disposal of property, plant and equipment |
|
1,995 |
|
3,271 |
|
(33,763 |
) |
6,254 |
| ||||
|
Accretion of asset retirement obligations |
|
155 |
|
137 |
|
824 |
|
672 |
| ||||
|
Total operating expenses |
|
419,043 |
|
307,703 |
|
1,416,504 |
|
1,061,538 |
| ||||
|
|
|
|
|
|
|
|
|
|
| ||||
|
Income from operations |
|
34,495 |
|
61,450 |
|
245,943 |
|
378,276 |
| ||||
|
|
|
|
|
|
|
|
|
|
| ||||
|
Other (expense) income: |
|
|
|
|
|
|
|
|
| ||||
|
(Loss) earnings from unconsolidated affiliates |
|
(139 |
) |
74 |
|
1,422 |
|
2,328 |
| ||||
|
Interest income |
|
24 |
|
124 |
|
262 |
|
419 |
| ||||
|
Interest expense |
|
(37,671 |
) |
(33,336 |
) |
(151,851 |
) |
(120,191 |
) | ||||
|
Amortization of deferred financing costs and discount (a component of interest expense) |
|
(1,528 |
) |
(1,658 |
) |
(6,726 |
) |
(5,601 |
) | ||||
|
Loss on redemption of debt |
|
— |
|
— |
|
(38,455 |
) |
— |
| ||||
|
Miscellaneous income (expense), net |
|
1,009 |
|
(1 |
) |
2,519 |
|
62 |
| ||||
|
(Loss) income before provision for income tax |
|
(3,810 |
) |
26,653 |
|
53,114 |
|
255,293 |
| ||||
|
|
|
|
|
|
|
|
|
|
| ||||
|
Provision for income tax (benefit) expense: |
|
|
|
|
|
|
|
|
| ||||
|
Current |
|
(705 |
) |
(4,568 |
) |
(11,208 |
) |
(2,366 |
) | ||||
|
Deferred |
|
790 |
|
1,298 |
|
23,877 |
|
40,694 |
| ||||
|
Total provision for income tax |
|
85 |
|
(3,270 |
) |
12,669 |
|
38,328 |
| ||||
|
|
|
|
|
|
|
|
|
|
| ||||
|
Net (loss) income |
|
(3,895 |
) |
29,923 |
|
40,445 |
|
216,965 |
| ||||
|
|
|
|
|
|
|
|
|
|
| ||||
|
Net (loss) income attributable to non-controlling interest |
|
(2,665 |
) |
1,891 |
|
(2,368 |
) |
3,437 |
| ||||
|
|
|
|
|
|
|
|
|
|
| ||||
|
Net (loss) income attributable to the Partnership’s unitholders |
|
$ |
(6,560 |
) |
$ |
31,814 |
|
$ |
38,077 |
|
$ |
220,402 |
|
|
|
|
|
|
|
|
|
|
|
| ||||
|
Net (loss) income attributable to the Partnership’s common unitholders per common unit: |
|
|
|
|
|
|
|
|
| ||||
|
Basic |
|
$ |
(0.05 |
) |
$ |
0.26 |
|
$ |
0.26 |
|
$ |
1.98 |
|
|
Diluted |
|
$ |
(0.05 |
) |
$ |
0.22 |
|
$ |
0.24 |
|
$ |
1.69 |
|
|
|
|
|
|
|
|
|
|
|
| ||||
|
Weighted average number of outstanding common units: |
|
|
|
|
|
|
|
|
| ||||
|
Basic |
|
151,153 |
|
122,079 |
|
138,409 |
|
109,979 |
| ||||
|
Diluted |
|
151,153 |
|
142,720 |
|
160,443 |
|
130,648 |
| ||||
|
|
|
|
|
|
|
|
|
|
| ||||
|
Cash Flow Data |
|
|
|
|
|
|
|
|
| ||||
|
Net cash flow provided by (used in): |
|
|
|
|
|
|
|
|
| ||||
|
Operating activities |
|
$ |
104,991 |
|
$ |
106,229 |
|
$ |
435,650 |
|
$ |
492,013 |
|
|
Investing activities |
|
$ |
(876,255 |
) |
$ |
(726,339 |
) |
$ |
(3,062,562 |
) |
$ |
(2,472,088 |
) |
|
Financing activities |
|
$ |
528,416 |
|
$ |
553,513 |
|
$ |
2,366,461 |
|
$ |
2,211,499 |
|
|
|
|
|
|
|
|
|
|
|
| ||||
|
Other Financial Data |
|
|
|
|
|
|
|
|
| ||||
|
Distributable cash flow |
|
$ |
127,242 |
|
$ |
111,774 |
|
$ |
483,355 |
|
$ |
417,086 |
|
|
Adjusted EBITDA |
|
$ |
155,512 |
|
$ |
137,952 |
|
$ |
605,989 |
|
$ |
528,467 |
|
|
Balance Sheet Data |
|
December 31, 2013 |
|
December 31, 2012 |
|
|
|
|
| ||
|
Working capital |
|
$ |
(353,273 |
) |
$ |
(84,512 |
) |
|
|
|
|
|
Total assets |
|
$ |
9,396,423 |
|
$ |
6,728,362 |
|
|
|
|
|
|
Total debt |
|
$ |
3,023,071 |
|
$ |
2,523,051 |
|
|
|
|
|
|
Total equity |
|
$ |
4,798,133 |
|
$ |
3,111,398 |
|
|
|
|
|
MarkWest Energy Partners, L.P.
Operating Statistics
|
|
|
Three months ended December 31, |
|
Twelve months ended December 31, |
| ||||
|
|
|
2013 |
|
2012 |
|
2013 |
|
2012 |
|
|
Marcellus |
|
|
|
|
|
|
|
|
|
|
Gathering system throughput (Mcf/d) (1) |
|
580,700 |
|
587,600 |
|
549,500 |
|
425,000 |
|
|
Natural gas processed (Mcf/d) |
|
1,401,700 |
|
696,000 |
|
1,101,900 |
|
496,400 |
|
|
NGLs fractionated (Bbl/d) (2) |
|
56,700 |
|
31,100 |
|
47,600 |
|
24,900 |
|
|
NGL sales (gallons, in thousands) (3) |
|
284,300 |
|
129,400 |
|
820,400 |
|
393,600 |
|
|
|
|
|
|
|
|
|
|
|
|
|
Utica (4) |
|
|
|
|
|
|
|
|
|
|
Gathering system throughput (Mcf/d) |
|
107,800 |
|
6,400 |
|
62,400 |
|
5,000 |
|
|
Natural gas processed (Mcf/d) |
|
166,200 |
|
5,000 |
|
88,400 |
|
4,200 |
|
|
|
|
|
|
|
|
|
|
|
|
|
Northeast (5) |
|
|
|
|
|
|
|
|
|
|
Natural gas processed (Mcf/d) |
|
287,500 |
|
313,700 |
|
296,100 |
|
320,500 |
|
|
NGLs fractionated (Bbl/d) (6) |
|
23,900 |
|
18,900 |
|
20,200 |
|
17,300 |
|
|
|
|
|
|
|
|
|
|
|
|
|
Keep-whole sales (gallons, in thousands) |
|
24,900 |
|
35,100 |
|
117,500 |
|
131,600 |
|
|
Percent-of-proceeds sales (gallons, in thousands) |
|
32,600 |
|
36,200 |
|
134,300 |
|
139,700 |
|
|
Total NGL sales (gallons, in thousands) (7) |
|
57,500 |
|
71,300 |
|
251,800 |
|
271,300 |
|
|
|
|
|
|
|
|
|
|
|
|
|
Crude oil transported for a fee (Bbl/d) |
|
9,500 |
|
9,900 |
|
9,700 |
|
9,300 |
|
|
|
|
|
|
|
|
|
|
|
|
|
Southwest |
|
|
|
|
|
|
|
|
|
|
East Texas gathering systems throughput (Mcf/d) |
|
501,100 |
|
477,600 |
|
504,000 |
|
450,000 |
|
|
East Texas natural gas processed (Mcf/d) |
|
357,700 |
|
302,000 |
|
355,100 |
|
270,800 |
|
|
East Texas NGL sales (gallons, in thousands) (8) |
|
85,100 |
|
76,500 |
|
334,400 |
|
275,800 |
|
|
|
|
|
|
|
|
|
|
|
|
|
Western Oklahoma gathering system throughput (Mcf/d) (9) |
|
268,800 |
|
200,800 |
|
238,600 |
|
235,600 |
|
|
Western Oklahoma natural gas processed (Mcf/d) |
|
215,000 |
|
193,800 |
|
202,600 |
|
206,500 |
|
|
Western Oklahoma NGL sales (gallons, in thousands) |
|
77,000 |
|
44,500 |
|
239,200 |
|
214,400 |
|
|
|
|
|
|
|
|
|
|
|
|
|
Southeast Oklahoma gathering system throughput (Mcf/d) |
|
405,100 |
|
463,100 |
|
443,700 |
|
487,900 |
|
|
Southeast Oklahoma natural gas processed (Mcf/d) (10) |
|
146,700 |
|
137,000 |
|
153,800 |
|
121,800 |
|
|
Southeast Oklahoma NGL sales (gallons, in thousands) |
|
22,300 |
|
42,400 |
|
159,600 |
|
163,300 |
|
|
|
|
|
|
|
|
|
|
|
|
|
Other Southwest gathering system throughput (Mcf/d) (11) |
|
46,500 |
|
22,300 |
|
35,000 |
|
24,300 |
|
|
|
|
|
|
|
|
|
|
|
|
|
Gulf Coast refinery off-gas processed (Mcf/d) |
|
83,400 |
|
113,600 |
|
103,400 |
|
118,400 |
|
|
Gulf Coast liquids fractionated (Bbl/d) |
|
14,600 |
|
21,000 |
|
18,800 |
|
22,500 |
|
|
Gulf Coast NGL sales (gallons excluding hydrogen, in thousands) |
|
56,300 |
|
81,000 |
|
288,800 |
|
345,300 |
|
(1) The 2013 volumes exclude Sherwood gathering as this system was sold to Summit Midstream in June 2013.
(2) Amount includes all NGLs that were produced at the Marcellus processing facilities and fractionated into purity products at our Marcellus fractionation facility. Excludes 7,300 and 0 barrels per day of ethane fractionated for the three months ended December 31, 2013 and 2012, respectively, and 300 and 0 barrels per day of ethane fractionated for the twelve months ended December 31, 2013 and 2012, respectively.
(3) Includes sale of all purity products fractionated at the Marcellus facilities and sale of all unfractionated NGLs. Also includes the sale of purity products fractionated and sold at the Siloam facilities on behalf of Marcellus customers.
(4) Utica operations began in August 2012. The volumes reported for 2012 are the average daily rate for the days of operation.
(5) Includes throughput from the Kenova, Cobb, Boldman and Langley processing plants.
(6) Amount includes 8,200 and 1,400 barrels per day fractionated for the three months ended December 31, 2013 and 2012, respectively, and 5,200 and 400 barrels per day fractionated on behalf of Marcellus for the twelve months ended December 31, 2013 and 2012, respectively.
(7) Represents sales at the Siloam fractionator. The total sales exclude approximately 31,800,000 and 5,500,000 gallons sold by the Northeast on behalf of Marcellus for the three months ended December 31, 2013 and 2012, respectively, and approximately 59,700,000 and 6,500,000 gallons sold for the twelve months ended December 31, 2013 and 2012, respectively. These volumes are included as part of NGLs sold at Marcellus.
(8) Includes approximately 14,420,000 gallons produced in conjunction with take in kind contracts for the year ended December 31, 2013.
(9) Includes natural gas gathered in Western Oklahoma and from the Granite Wash formation in the Texas Panhandle as management considers this one integrated area of operations.
(10) The natural gas processing in Southeast Oklahoma is outsourced to Centrahoma or other third party processors.
(11) Excludes lateral pipelines where revenue is not based on throughput.
MarkWest Energy Partners, L.P.
Reconciliation of GAAP Financial Measure to Non-GAAP Financial Measure
Operating Income before Items not Allocated to Segments
(unaudited, in thousands)
|
Three months ended December 31, 2013 |
|
Marcellus |
|
Utica |
|
Northeast |
|
Southwest |
|
Total |
| |||||
|
Segment revenue |
|
$ |
151,229 |
|
$ |
13,852 |
|
$ |
52,796 |
|
$ |
251,333 |
|
$ |
469,210 |
|
|
|
|
|
|
|
|
|
|
|
|
|
| |||||
|
Operating expenses: |
|
|
|
|
|
|
|
|
|
|
| |||||
|
Purchased product costs |
|
27,481 |
|
— |
|
15,074 |
|
149,022 |
|
191,577 |
| |||||
|
Facility expenses |
|
34,252 |
|
14,849 |
|
7,887 |
|
36,085 |
|
93,073 |
| |||||
|
Total operating expenses before items not allocated to segments |
|
61,733 |
|
14,849 |
|
22,961 |
|
185,107 |
|
284,650 |
| |||||
|
|
|
|
|
|
|
|
|
|
|
|
| |||||
|
Portion of operating loss attributable to non-controlling interests |
|
— |
|
(418 |
) |
— |
|
(136 |
) |
(554 |
) | |||||
|
Operating income (loss) before items not allocated to segments |
|
$ |
89,496 |
|
$ |
(579 |
) |
$ |
29,835 |
|
$ |
66,362 |
|
$ |
185,114 |
|
|
Three months ended December 31, 2012 |
|
Marcellus |
|
Utica |
|
Northeast |
|
Southwest |
|
Total |
| |||||
|
Segment revenue |
|
$ |
106,106 |
|
$ |
426 |
|
$ |
56,862 |
|
$ |
201,637 |
|
$ |
365,031 |
|
|
|
|
|
|
|
|
|
|
|
|
|
| |||||
|
Operating expenses: |
|
|
|
|
|
|
|
|
|
|
| |||||
|
Purchased product costs |
|
25,168 |
|
— |
|
18,740 |
|
99,765 |
|
143,673 |
| |||||
|
Facility expenses |
|
21,281 |
|
2,377 |
|
6,529 |
|
29,727 |
|
59,914 |
| |||||
|
Total operating expenses before items not allocated to segments |
|
46,449 |
|
2,377 |
|
25,269 |
|
129,492 |
|
203,587 |
| |||||
|
|
|
|
|
|
|
|
|
|
|
|
| |||||
|
Portion of operating (loss) income attributable to non-controlling interests |
|
— |
|
(619 |
) |
— |
|
78 |
|
(541 |
) | |||||
|
Operating income (loss) before items not allocated to segments |
|
$ |
59,657 |
|
$ |
(1,332 |
) |
$ |
31,593 |
|
$ |
72,067 |
|
$ |
161,985 |
|
|
|
|
Three months ended December 31, |
| ||||
|
|
|
2013 |
|
2012 |
| ||
|
|
|
|
|
|
| ||
|
Operating income before items not allocated to segments |
|
$ |
185,114 |
|
$ |
161,985 |
|
|
Portion of operating loss attributable to non-controlling interests |
|
(554 |
) |
(541 |
) | ||
|
Derivative loss not allocated to segments |
|
(23,068 |
) |
(1,826 |
) | ||
|
Revenue deferral adjustment and other |
|
(1,838 |
) |
(1,461 |
) | ||
|
Compensation expense included in facility expenses not allocated to segments |
|
(834 |
) |
(196 |
) | ||
|
Facility expenses adjustments |
|
2,687 |
|
2,687 |
| ||
|
Selling, general and administrative expenses |
|
(24,161 |
) |
(24,973 |
) | ||
|
Depreciation |
|
(83,982 |
) |
(55,778 |
) | ||
|
Amortization of intangible assets |
|
(16,719 |
) |
(15,040 |
) | ||
|
Loss on disposal of property, plant and equipment |
|
(1,995 |
) |
(3,271 |
) | ||
|
Accretion of asset retirement obligations |
|
(155 |
) |
(136 |
) | ||
|
Income from operations |
|
34,495 |
|
61,450 |
| ||
|
Other (expense) income: |
|
|
|
|
| ||
|
(Loss) earnings from unconsolidated affiliates |
|
(139 |
) |
74 |
| ||
|
Interest income |
|
24 |
|
124 |
| ||
|
Interest expense |
|
(37,671 |
) |
(33,336 |
) | ||
|
Amortization of deferred financing costs and discount (a component of interest expense) |
|
(1,528 |
) |
(1,658 |
) | ||
|
Miscellaneous income (expense), net |
|
1,009 |
|
(1 |
) | ||
|
(Loss) income before provision for income tax |
|
$ |
(3,810 |
) |
$ |
26,653 |
|
MarkWest Energy Partners, L.P.
Reconciliation of GAAP Financial Measure to Non-GAAP Financial Measure
Operating Income before Items not Allocated to Segments
(unaudited, in thousands)
|
Twelve months ended December 31, 2013 |
|
Marcellus |
|
Utica |
|
Northeast |
|
Southwest |
|
Total |
| |||||
|
Segment revenue |
|
$ |
527,073 |
|
$ |
26,442 |
|
$ |
204,326 |
|
$ |
935,426 |
|
$ |
1,693,267 |
|
|
|
|
|
|
|
|
|
|
|
|
|
| |||||
|
Operating expenses: |
|
|
|
|
|
|
|
|
|
|
| |||||
|
Purchased product costs |
|
100,262 |
|
— |
|
65,192 |
|
525,711 |
|
691,165 |
| |||||
|
Facility expenses |
|
108,781 |
|
35,081 |
|
28,425 |
|
127,112 |
|
299,399 |
| |||||
|
Total operating expenses before items not allocated to segments |
|
209,043 |
|
35,081 |
|
93,617 |
|
652,823 |
|
990,564 |
| |||||
|
|
|
|
|
|
|
|
|
|
|
|
| |||||
|
Portion of operating (loss) income attributable to non-controlling interests |
|
— |
|
(3,499 |
) |
— |
|
21 |
|
(3,478 |
) | |||||
|
Operating income (loss) before items not allocated to segments |
|
$ |
318,030 |
|
$ |
(5,140 |
) |
$ |
110,709 |
|
$ |
282,582 |
|
$ |
706,181 |
|
|
Twelve months ended December 31, 2012 |
|
Marcellus |
|
Utica |
|
Northeast |
|
Southwest |
|
Total |
| |||||
|
Segment revenue |
|
$ |
319,867 |
|
$ |
571 |
|
$ |
225,818 |
|
$ |
842,958 |
|
$ |
1,389,214 |
|
|
|
|
|
|
|
|
|
|
|
|
|
| |||||
|
Operating expenses: |
|
|
|
|
|
|
|
|
|
|
| |||||
|
Purchased product costs |
|
74,024 |
|
— |
|
68,402 |
|
387,902 |
|
530,328 |
| |||||
|
Facility expenses |
|
65,825 |
|
3,968 |
|
24,106 |
|
122,691 |
|
216,590 |
| |||||
|
Total operating expenses before items not allocated to segments |
|
139,849 |
|
3,968 |
|
92,508 |
|
510,593 |
|
746,918 |
| |||||
|
|
|
|
|
|
|
|
|
|
|
|
| |||||
|
Portion of operating (loss) income attributable to non-controlling interests |
|
— |
|
(1,359 |
) |
— |
|
176 |
|
(1,183 |
) | |||||
|
Operating income (loss) before items not allocated to segments |
|
$ |
180,018 |
|
$ |
(2,038 |
) |
$ |
133,310 |
|
$ |
332,189 |
|
$ |
643,479 |
|
|
|
|
Twelve months ended December 31, |
| ||||
|
|
|
2013 |
|
2012 |
| ||
|
|
|
|
|
|
| ||
|
Operating income before items not allocated to segments |
|
$ |
706,181 |
|
$ |
643,479 |
|
|
Portion of operating loss attributable to non-controlling interests |
|
(3,478 |
) |
(1,183 |
) | ||
|
Derivative (loss) gain not allocated to segments |
|
(25,770 |
) |
69,126 |
| ||
|
Revenue deferral adjustment and other |
|
(6,182 |
) |
(5,935 |
) | ||
|
Compensation expense included in facility expenses not allocated to segments |
|
(2,421 |
) |
(1,022 |
) | ||
|
Facility expenses adjustments |
|
10,751 |
|
10,751 |
| ||
|
Selling, general and administrative expenses |
|
(101,549 |
) |
(93,444 |
) | ||
|
Depreciation |
|
(299,884 |
) |
(183,250 |
) | ||
|
Amortization of intangible assets |
|
(64,644 |
) |
(53,320 |
) | ||
|
Gain (loss) on disposal of property, plant and equipment |
|
33,763 |
|
(6,254 |
) | ||
|
Accretion of asset retirement obligations |
|
(824 |
) |
(672 |
) | ||
|
Income from operations |
|
245,943 |
|
378,276 |
| ||
|
Other income (expense): |
|
|
|
|
| ||
|
Earnings from unconsolidated affiliates |
|
1,422 |
|
2,328 |
| ||
|
Interest income |
|
262 |
|
419 |
| ||
|
Interest expense |
|
(151,851 |
) |
(120,191 |
) | ||
|
Amortization of deferred financing costs and discount (a component of interest expense) |
|
(6,726 |
) |
(5,601 |
) | ||
|
Loss on redemption of debt |
|
(38,455 |
) |
— |
| ||
|
Miscellaneous income, net |
|
2,519 |
|
62 |
| ||
|
Income before provision for income tax |
|
$ |
53,114 |
|
$ |
255,293 |
|
Reconciliation of GAAP Financial Measure to Non-GAAP Financial Measure
Distributable Cash Flow
(unaudited, in thousands)
|
|
|
Three months ended December 31, |
|
Twelve months ended December 31, |
| ||||||||
|
|
|
2013 |
|
2012 |
|
2013 |
|
2012 |
| ||||
|
Net (loss) income |
|
$ |
(3,895 |
) |
$ |
29,923 |
|
$ |
40,445 |
|
$ |
216,965 |
|
|
Depreciation, amortization and other non-cash operating expenses |
|
100,934 |
|
71,032 |
|
365,664 |
|
237,554 |
| ||||
|
Loss (gain) on sale and or disposal of assets, net of tax |
|
2,051 |
|
3,271 |
|
(30,660 |
) |
6,254 |
| ||||
|
Loss on redemption of debt, net of tax benefit |
|
— |
|
— |
|
36,178 |
|
— |
| ||||
|
Amortization of deferred financing costs and discount |
|
1,528 |
|
1,658 |
|
6,726 |
|
5,601 |
| ||||
|
Non-cash loss (earnings) from unconsolidated affiliates |
|
139 |
|
(74 |
) |
(1,422 |
) |
(2,328 |
) | ||||
|
Distributions from unconsolidated affiliates |
|
1,418 |
|
1,792 |
|
6,370 |
|
8,416 |
| ||||
|
Non-cash compensation expense |
|
2,358 |
|
1,977 |
|
7,822 |
|
8,247 |
| ||||
|
Non-cash derivative activity |
|
14,380 |
|
(312 |
) |
15,602 |
|
(102,127 |
) | ||||
|
Provision for income tax - deferred |
|
790 |
|
1,298 |
|
23,877 |
|
40,694 |
| ||||
|
Cash adjustment for non-controlling interest of consolidated subsidiaries |
|
1,449 |
|
908 |
|
6,121 |
# |
2,299 |
| ||||
|
Revenue deferral adjustment |
|
2,049 |
|
1,837 |
|
7,213 |
|
7,441 |
| ||||
|
Other |
|
9,666 |
|
(58 |
) |
17,419 |
|
3,372 |
| ||||
|
Maintenance capital expenditures (1) |
|
(5,625 |
) |
(1,478 |
) |
(18,000 |
) |
(15,302 |
) | ||||
|
Distributable cash flow |
|
$ |
127,242 |
|
$ |
111,774 |
|
$ |
483,355 |
|
$ |
417,086 |
|
|
|
|
|
|
|
|
|
|
|
| ||||
|
Maintenance capital expenditures (1) |
|
$ |
5,625 |
|
$ |
1,478 |
|
$ |
18,000 |
|
$ |
15,302 |
|
|
Growth capital expenditures |
|
864,612 |
|
709,141 |
|
3,028,956 |
|
1,935,022 |
| ||||
|
Total capital expenditures |
|
870,237 |
|
710,619 |
|
3,046,956 |
|
1,950,324 |
| ||||
|
Acquisitions, net of cash acquired (2) |
|
(2,322 |
) |
— |
|
222,888 |
|
506,797 |
| ||||
|
Total capital expenditures and acquisitions |
|
867,915 |
|
710,619 |
|
3,269,844 |
|
2,457,121 |
| ||||
|
Joint venture partner contributions |
|
— |
|
(178,018 |
) |
(716,982 |
) |
(233,018 |
) | ||||
|
Total capital expenditures and acquisitions, net |
|
$ |
867,915 |
|
$ |
532,601 |
|
$ |
2,552,862 |
|
$ |
2,224,103 |
|
|
|
|
|
|
|
|
|
|
|
| ||||
|
Distributable cash flow |
|
$ |
127,242 |
|
$ |
111,774 |
|
$ |
483,355 |
|
$ |
417,086 |
|
|
Maintenance capital expenditures (1) |
|
5,625 |
|
1,478 |
|
18,000 |
|
15,302 |
| ||||
|
Changes in receivables and other assets |
|
(59,131 |
) |
(1,655 |
) |
(133,601 |
) |
24,641 |
| ||||
|
Changes in accounts payable, accrued liabilities and other long-term liabilities |
|
42,458 |
|
(3,740 |
) |
91,015 |
|
41,728 |
| ||||
|
Derivative instrument premium payments, net of amortization |
|
— |
|
— |
|
— |
|
— |
| ||||
|
Cash adjustment for non-controlling interest of consolidated subsidiaries |
|
(1,449 |
) |
(908 |
) |
(6,121 |
) |
(2,299 |
) | ||||
|
Other |
|
(9,754 |
) |
(720 |
) |
(16,998 |
) |
(4,445 |
) | ||||
|
Net cash provided by operating activities |
|
$ |
104,991 |
|
$ |
106,229 |
|
$ |
435,650 |
|
$ |
492,013 |
|
(1) Net of joint venture partner contributions and proceeds from trade-in of property plant and equipment.
(2) On May 29, 2012, the Partnership acquired natural gas gathering and processing assets from Keystone, during the three months ended December 2013, we received $2.3 million related to a working capital adjustment.
MarkWest Energy Partners, L.P.
Reconciliation of GAAP Financial Measure to Non-GAAP Financial Measure
Adjusted EBITDA
(unaudited, in thousands)
|
|
|
Three months ended December 31, |
|
Twelve months ended December 31, |
| ||||||||
|
|
|
2013 |
|
2012 |
|
2013 |
|
2012 |
| ||||
|
|
|
|
|
|
|
|
|
|
| ||||
|
Net (loss) income |
|
$ |
(3,895 |
) |
$ |
29,923 |
|
$ |
40,445 |
|
$ |
216,965 |
|
|
Non-cash compensation expense |
|
2,358 |
|
1,977 |
|
7,822 |
|
8,247 |
| ||||
|
Non-cash derivative activity |
|
14,380 |
|
(312 |
) |
15,602 |
|
(102,127 |
) | ||||
|
Interest expense (1) |
|
37,096 |
|
32,838 |
|
150,084 |
|
117,098 |
| ||||
|
Depreciation, amortization and other non-cash operating expenses |
|
100,934 |
|
71,032 |
|
365,664 |
|
237,554 |
| ||||
|
Loss (gain) on sale and or disposal of assets |
|
1,995 |
|
3,271 |
|
(33,763 |
) |
6,254 |
| ||||
|
Loss on redemption of debt |
|
— |
|
— |
|
38,455 |
|
— |
| ||||
|
Provision for income tax |
|
85 |
|
(3,270 |
) |
12,669 |
|
38,328 |
| ||||
|
Adjustment for cash flow from unconsolidated affiliates |
|
1,557 |
|
1,718 |
|
4,948 |
|
6,088 |
| ||||
|
Other |
|
1,002 |
|
775 |
|
4,063 |
|
60 |
| ||||
|
Adjusted EBITDA |
|
$ |
155,512 |
|
$ |
137,952 |
|
$ |
605,989 |
|
$ |
528,467 |
|
(1) Includes amortization of deferred financing costs and discount, and excludes interest expense related to the Steam Methane Reformer.
MarkWest Energy Partners, L.P.
Distributable Cash Flow Sensitivity Analysis
(unaudited, in millions)
The Partnership periodically estimates the effect on DCF resulting from changes in its volume forecast and NGL prices. The Partnership has become less sensitive to changes in commodity prices because fee-based income has increased significantly. For the full year 2014, the Partnership estimates that operating income will be over 70 percent fee-based. In addition, the Partnership has hedged approximately 60 percent of its forecasted 2014 NGL exposure on a volumetric basis, 90 percent of these with direct product hedges.
The analysis further assumes derivative instruments outstanding as of February 26, 2014, and production volumes estimated through December 31, 2014. The range of stated hypothetical changes in commodity prices considers current and historic market performance.
Estimated Range of 2014 DCF
|
NGL $/Gal |
|
Volume Forecast (3) |
| ||||||||
|
(1) (2) |
|
Low Case |
|
Base Case |
|
High Case |
| ||||
|
$ |
1.05 |
|
$ |
610 |
|
$ |
662 |
|
$ |
720 |
|
|
$ |
1.00 |
|
$ |
601 |
|
$ |
652 |
|
$ |
709 |
|
|
$ |
0.95 |
|
$ |
591 |
|
$ |
642 |
|
$ |
698 |
|
|
$ |
0.90 |
|
$ |
583 |
|
$ |
633 |
|
$ |
690 |
|
|
$ |
0.85 |
|
$ |
574 |
|
$ |
624 |
|
$ |
681 |
|
(1) The composition is based on the Partnership’s projected barrel of approximately: Ethane: 35%, Propane: 35%, Iso-Butane: 6%, Normal Butane: 12%, Natural Gasoline: 12%.
(2) Composite NGL prices is based on the Partnership’s average price.
(3) Volume Forecast is increased/decreased by 10% in the Marcellus and Utica segments for the High and Low Cases.
The table is based on current information, expectations, and beliefs concerning future developments and their potential effects, and does not consider actions the Partnership’s management may take to mitigate exposure to changes. Nor does the table consider the effects that such hypothetical adverse changes may have on overall economic activity. Historical volumes, prices and correlations do not guarantee future results.
Although the Partnership believes the expectations reflected in this analysis are reasonable, the Partnership can give no assurance that such expectations will prove to be correct and readers are cautioned that projected performance, results, or distributions may not be achieved. Actual changes in market prices, market conditions and constraints, production, NGL composition, infrastructure availability, market participants, and ratios between product prices, may differ from the assumptions utilized in the analysis. Actual results, performance, distributions, volumes, events, or transactions could vary significantly from those expressed, considered, or implied in this analysis. All results, performance, distributions, volumes, events, or transactions are subject to a number of uncertainties and risks. Those uncertainties and risks may not be factored into or accounted for in this analysis. Readers are urged to carefully review and consider the cautionary statements and disclosures made in the Partnership’s periodic reports filed with the SEC, specifically those under the heading “Risk Factors.”