false00011601062023FYUnited KingdomP3YP3YP5YP3YP3YP3Y33P2YP5YP5YP4YP4YP4Y0.7500011601062023-01-012023-12-310001160106dei:BusinessContactMember2023-01-012023-12-310001160106exch:XNYSlyg:AmericanDepositorySharesMember2023-01-012023-12-310001160106exch:XNYSlyg:A15000000004344SubordinatedSecuritiesDueIn2048Member2023-01-012023-12-310001160106exch:XNYSlyg:A11751760003369SubordinatedNotesDue2046Member2023-01-012023-12-310001160106exch:XNYSlyg:A82403300053SubordinatedSecuritiesDue2045Member2023-01-012023-12-310001160106exch:XNYSlyg:A10000000007953FixedRateResetSubordinatedDebtSecuritiesDue2033Member2023-01-012023-12-310001160106exch:XNYSlyg:A12500000004976SeniorCallableFixedToFixedRateNotesDue2033Member2023-01-012023-12-310001160106exch:XNYSlyg:A5000000001985SubordinatedNotesDue2031Member2023-01-012023-12-310001160106exch:XNYSlyg:A12500000005871SeniorCallableFixedToFixedRateNotesDue2029Member2023-01-012023-12-310001160106exch:XNYSlyg:A10000000003750SeniorCallableFixedToFixedRateNotesDue2028Member2023-01-012023-12-310001160106exch:XNYSlyg:A1250000000455SeniorNotesDue2028Member2023-01-012023-12-310001160106exch:XNYSlyg:A15000000004375SeniorNotesDue2028Member2023-01-012023-12-310001160106exch:XNYSlyg:A17500000003574SeniorNotesDueIn2028CallableIn2027Member2023-01-012023-12-310001160106exch:XNYSlyg:A500000000SeniorCallableFloatingRateNotesDue2027Member2023-01-012023-12-310001160106exch:XNYSlyg:A15000000005985SeniorCallableFixedToFixedRateNotesDue2027Member2023-01-012023-12-310001160106exch:XNYSlyg:A10000000001627SeniorNotesDue2027Member2023-01-012023-12-310001160106exch:XNYSlyg:A1250000000375SeniorNotesDue2027Member2023-01-012023-12-310001160106exch:XNYSlyg:A12500000004716SeniorCallableFixedToFixedRateNotesDue2026Member2023-01-012023-12-310001160106exch:XNYSlyg:A10000000003511SeniorCallableFixedToFixedRateNotesDue2026Member2023-01-012023-12-310001160106exch:XNYSlyg:A100000000027SeniorNotesDue2020Member2023-01-012023-12-310001160106exch:XNYSlyg:A1500000000465SubordinatedSecuritiesDue2026Member2023-01-012023-12-310001160106exch:XNYSlyg:A1500000000387SeniorNotesDue2025Member2023-01-012023-12-310001160106exch:XNYSlyg:A1500000000445SeniorNotesDue2025Member2023-01-012023-12-310001160106exch:XNYSlyg:A13276850004582SubordinatedSecuritiesDue2025Member2023-01-012023-12-310001160106exch:XNYSlyg:A125000000035SeniorNotesDue2025Member2023-01-012023-12-310001160106exch:XNYSlyg:A1000000000390SeniorNotesDue2024Member2023-01-012023-12-310001160106exch:XNYSlyg:A100000000045SubordinatedSecuritiesDue2024Member2023-01-012023-12-310001160106ifrs-full:OrdinarySharesMember2023-12-31xbrli:shares0001160106lyg:PreferenceSharesNominalValue25PenceEachMember2023-12-310001160106lyg:PreferenceSharesNominalValue25CentsEachMember2023-12-310001160106lyg:PreferenceSharesNominalValue25EuroCentsEachMember2023-12-31iso4217:GBP00011601062022-01-012022-12-3100011601062021-01-012021-12-31iso4217:GBPxbrli:shares00011601062023-12-3100011601062022-12-3100011601062021-12-310001160106lyg:ShareCapitalAndPremiumMembersrt:ScenarioPreviouslyReportedMember2022-12-310001160106srt:ScenarioPreviouslyReportedMemberifrs-full:OtherReservesMember2022-12-310001160106ifrs-full:RetainedEarningsMembersrt:ScenarioPreviouslyReportedMember2022-12-310001160106lyg:EquityAttributableToOrdinaryShareholdersMembersrt:ScenarioPreviouslyReportedMember2022-12-310001160106ifrs-full:OtherEquityInterestMembersrt:ScenarioPreviouslyReportedMember2022-12-310001160106ifrs-full:NoncontrollingInterestsMembersrt:ScenarioPreviouslyReportedMember2022-12-310001160106srt:ScenarioPreviouslyReportedMember2022-12-310001160106ifrs-full:IncreaseDecreaseDueToChangesInAccountingPolicyRequiredByIFRSsMemberifrs-full:OtherReservesMember2022-12-310001160106ifrs-full:RetainedEarningsMemberifrs-full:IncreaseDecreaseDueToChangesInAccountingPolicyRequiredByIFRSsMember2022-12-310001160106ifrs-full:IncreaseDecreaseDueToChangesInAccountingPolicyRequiredByIFRSsMemberlyg:EquityAttributableToOrdinaryShareholdersMember2022-12-310001160106ifrs-full:IncreaseDecreaseDueToChangesInAccountingPolicyRequiredByIFRSsMember2022-12-310001160106lyg:ShareCapitalAndPremiumMember2022-12-310001160106ifrs-full:OtherReservesMember2022-12-310001160106ifrs-full:RetainedEarningsMember2022-12-310001160106lyg:EquityAttributableToOrdinaryShareholdersMember2022-12-310001160106ifrs-full:OtherEquityInterestMember2022-12-310001160106ifrs-full:NoncontrollingInterestsMember2022-12-310001160106ifrs-full:RetainedEarningsMember2023-01-012023-12-310001160106lyg:EquityAttributableToOrdinaryShareholdersMember2023-01-012023-12-310001160106ifrs-full:OtherEquityInterestMember2023-01-012023-12-310001160106ifrs-full:NoncontrollingInterestsMember2023-01-012023-12-310001160106ifrs-full:OtherReservesMember2023-01-012023-12-310001160106lyg:ShareCapitalAndPremiumMember2023-01-012023-12-310001160106lyg:ShareCapitalAndPremiumMember2023-12-310001160106ifrs-full:OtherReservesMember2023-12-310001160106ifrs-full:RetainedEarningsMember2023-12-310001160106lyg:EquityAttributableToOrdinaryShareholdersMember2023-12-310001160106ifrs-full:OtherEquityInterestMember2023-12-310001160106ifrs-full:NoncontrollingInterestsMember2023-12-310001160106lyg:ShareCapitalAndPremiumMembersrt:ScenarioPreviouslyReportedMember2021-12-310001160106srt:ScenarioPreviouslyReportedMemberifrs-full:OtherReservesMember2021-12-310001160106ifrs-full:RetainedEarningsMembersrt:ScenarioPreviouslyReportedMember2021-12-310001160106lyg:EquityAttributableToOrdinaryShareholdersMembersrt:ScenarioPreviouslyReportedMember2021-12-310001160106ifrs-full:OtherEquityInterestMembersrt:ScenarioPreviouslyReportedMember2021-12-310001160106ifrs-full:NoncontrollingInterestsMembersrt:ScenarioPreviouslyReportedMember2021-12-310001160106srt:ScenarioPreviouslyReportedMember2021-12-310001160106ifrs-full:IncreaseDecreaseDueToChangesInAccountingPolicyRequiredByIFRSsMemberifrs-full:OtherReservesMember2021-12-310001160106ifrs-full:RetainedEarningsMemberifrs-full:IncreaseDecreaseDueToChangesInAccountingPolicyRequiredByIFRSsMember2021-12-310001160106ifrs-full:IncreaseDecreaseDueToChangesInAccountingPolicyRequiredByIFRSsMemberlyg:EquityAttributableToOrdinaryShareholdersMember2021-12-310001160106ifrs-full:IncreaseDecreaseDueToChangesInAccountingPolicyRequiredByIFRSsMember2021-12-310001160106lyg:ShareCapitalAndPremiumMember2021-12-310001160106ifrs-full:OtherReservesMember2021-12-310001160106ifrs-full:RetainedEarningsMember2021-12-310001160106lyg:EquityAttributableToOrdinaryShareholdersMember2021-12-310001160106ifrs-full:OtherEquityInterestMember2021-12-310001160106ifrs-full:NoncontrollingInterestsMember2021-12-310001160106ifrs-full:RetainedEarningsMember2022-01-012022-12-310001160106lyg:EquityAttributableToOrdinaryShareholdersMember2022-01-012022-12-310001160106ifrs-full:OtherEquityInterestMember2022-01-012022-12-310001160106ifrs-full:NoncontrollingInterestsMember2022-01-012022-12-310001160106ifrs-full:OtherReservesMember2022-01-012022-12-310001160106lyg:ShareCapitalAndPremiumMember2022-01-012022-12-310001160106lyg:ShareCapitalAndPremiumMember2020-12-310001160106ifrs-full:OtherReservesMember2020-12-310001160106ifrs-full:RetainedEarningsMember2020-12-310001160106lyg:EquityAttributableToOrdinaryShareholdersMember2020-12-310001160106ifrs-full:OtherEquityInterestMember2020-12-310001160106ifrs-full:NoncontrollingInterestsMember2020-12-3100011601062020-12-310001160106ifrs-full:RetainedEarningsMember2021-01-012021-12-310001160106lyg:EquityAttributableToOrdinaryShareholdersMember2021-01-012021-12-310001160106ifrs-full:OtherEquityInterestMember2021-01-012021-12-310001160106ifrs-full:NoncontrollingInterestsMember2021-01-012021-12-310001160106ifrs-full:OtherReservesMember2021-01-012021-12-310001160106lyg:ShareCapitalAndPremiumMember2021-01-012021-12-310001160106ifrs-full:IncreaseDecreaseDueToChangesInAccountingPolicyRequiredByIFRSsMemberlyg:ValueInForceAssetMember2021-12-310001160106ifrs-full:IncreaseDecreaseDueToChangesInAccountingPolicyRequiredByIFRSsMemberlyg:ProbabilityWeightedEstimateMember2021-12-310001160106ifrs-full:IncreaseDecreaseDueToChangesInAccountingPolicyRequiredByIFRSsMemberifrs-full:ContractualServiceMarginMember2021-12-310001160106ifrs-full:RiskAdjustmentForNonfinancialRiskMemberifrs-full:IncreaseDecreaseDueToChangesInAccountingPolicyRequiredByIFRSsMember2021-12-310001160106ifrs-full:ContractualServiceMarginRelatedToContractsThatExistedAtTransitionDateToWhichFairValueApproachHasBeenAppliedMember2021-12-31xbrli:pure0001160106ifrs-full:ContractualServiceMarginRelatedToContractsThatExistedAtTransitionDateToWhichModifiedRetrospectiveApproachHasBeenAppliedMember2021-12-310001160106lyg:ContractualServiceMarginNetOfReinsuranceMember2021-12-310001160106lyg:IncreaseDecreaseDueToRestatementOfIncomeStatementRelatedToChangesInAccountingPolicyRequiredByIFRSMemberifrs-full:RetainedEarningsMember2022-12-310001160106ifrs-full:IncreaseDecreaseDueToChangesInAccountingPolicyRequiredByIFRSsMemberifrs-full:ReserveOfExchangeDifferencesOnTranslationMember2022-12-310001160106ifrs-full:IncreaseDecreaseDueToChangesInAccountingPolicyRequiredByIFRSsMember2022-01-012022-12-310001160106ifrs-full:ComputerSoftwareMemberifrs-full:TopOfRangeMember2023-01-012023-12-310001160106ifrs-full:BrandNamesMemberifrs-full:BottomOfRangeMember2023-01-012023-12-310001160106ifrs-full:BrandNamesMemberifrs-full:TopOfRangeMember2023-01-012023-12-310001160106lyg:FreeholdlongAndShortLeaseholdPremisesMemberifrs-full:TopOfRangeMember2023-01-012023-12-310001160106ifrs-full:LeaseholdImprovementsMemberifrs-full:TopOfRangeMember2023-01-012023-12-310001160106lyg:FixturesAndFurnishingsMemberifrs-full:BottomOfRangeMember2023-01-012023-12-310001160106lyg:FixturesAndFurnishingsMemberifrs-full:TopOfRangeMember2023-01-012023-12-310001160106lyg:EquipmentAndMotorVehiclesMemberifrs-full:BottomOfRangeMember2023-01-012023-12-310001160106lyg:EquipmentAndMotorVehiclesMemberifrs-full:TopOfRangeMember2023-01-012023-12-31lyg:segment0001160106lyg:RetailSegmentMemberlyg:UnderlyingBasisMember2023-01-012023-12-310001160106lyg:CommercialBankingMemberlyg:UnderlyingBasisMember2023-01-012023-12-310001160106lyg:UnderlyingBasisMemberlyg:InsurancePensionsAndInvestmentsMember2023-01-012023-12-310001160106lyg:UnderlyingBasisMemberlyg:OtherIncome1Member2023-01-012023-12-310001160106lyg:UnderlyingBasisMember2023-01-012023-12-310001160106lyg:RetailSegmentMemberlyg:UnderlyingBasisMember2023-12-310001160106lyg:CommercialBankingMemberlyg:UnderlyingBasisMember2023-12-310001160106lyg:UnderlyingBasisMemberlyg:InsurancePensionsAndInvestmentsMember2023-12-310001160106lyg:UnderlyingBasisMemberlyg:OtherIncome1Member2023-12-310001160106lyg:UnderlyingBasisMember2023-12-310001160106lyg:RetailSegmentMember2023-01-012023-12-310001160106lyg:CommercialBankingMember2023-01-012023-12-310001160106lyg:InsurancePensionsAndInvestmentsMember2023-01-012023-12-310001160106lyg:OtherIncome1Member2023-01-012023-12-310001160106lyg:RetailSegmentMemberlyg:UnderlyingBasisMember2022-01-012022-12-310001160106lyg:CommercialBankingMemberlyg:UnderlyingBasisMember2022-01-012022-12-310001160106lyg:UnderlyingBasisMemberlyg:InsurancePensionsAndInvestmentsMember2022-01-012022-12-310001160106lyg:UnderlyingBasisMemberlyg:OtherIncome1Member2022-01-012022-12-310001160106lyg:UnderlyingBasisMember2022-01-012022-12-310001160106lyg:RetailSegmentMemberlyg:UnderlyingBasisMember2022-12-310001160106lyg:CommercialBankingMemberlyg:UnderlyingBasisMember2022-12-310001160106lyg:UnderlyingBasisMemberlyg:InsurancePensionsAndInvestmentsMember2022-12-310001160106lyg:UnderlyingBasisMemberlyg:OtherIncome1Member2022-12-310001160106lyg:UnderlyingBasisMember2022-12-310001160106lyg:RetailSegmentMember2022-01-012022-12-310001160106lyg:CommercialBankingMember2022-01-012022-12-310001160106lyg:InsurancePensionsAndInvestmentsMember2022-01-012022-12-310001160106lyg:OtherIncome1Member2022-01-012022-12-310001160106lyg:RetailSegmentMemberlyg:UnderlyingBasisMember2021-01-012021-12-310001160106lyg:CommercialBankingMemberlyg:UnderlyingBasisMember2021-01-012021-12-310001160106lyg:UnderlyingBasisMemberlyg:InsurancePensionsAndInvestmentsMember2021-01-012021-12-310001160106lyg:UnderlyingBasisMemberlyg:OtherIncome1Member2021-01-012021-12-310001160106lyg:UnderlyingBasisMember2021-01-012021-12-310001160106lyg:RetailSegmentMemberlyg:UnderlyingBasisMember2021-12-310001160106lyg:CommercialBankingMemberlyg:UnderlyingBasisMember2021-12-310001160106lyg:UnderlyingBasisMemberlyg:InsurancePensionsAndInvestmentsMember2021-12-310001160106lyg:UnderlyingBasisMemberlyg:OtherIncome1Member2021-12-310001160106lyg:UnderlyingBasisMember2021-12-310001160106lyg:RetailSegmentMember2021-01-012021-12-310001160106lyg:CommercialBankingMember2021-01-012021-12-310001160106lyg:InsurancePensionsAndInvestmentsMember2021-01-012021-12-310001160106lyg:OtherIncome1Member2021-01-012021-12-310001160106lyg:VolatilityAndOtherItemsMember2023-01-012023-12-310001160106lyg:InsuranceGrossUpMember2023-01-012023-12-310001160106lyg:UnderlyingBasisMember2023-01-012023-12-310001160106lyg:VolatilityAndOtherItemsMember2022-01-012022-12-310001160106lyg:InsuranceGrossUpMember2022-01-012022-12-310001160106lyg:UnderlyingBasisMember2022-01-012022-12-310001160106lyg:VolatilityAndOtherItemsMember2021-01-012021-12-310001160106lyg:InsuranceGrossUpMember2021-01-012021-12-310001160106lyg:UnderlyingBasisMember2021-01-012021-12-310001160106lyg:InterestIncome1Member2023-01-012023-12-310001160106lyg:InterestIncome1Member2022-01-012022-12-310001160106lyg:InterestIncome1Member2021-01-012021-12-310001160106lyg:InterestExpense1Member2023-01-012023-12-310001160106lyg:InterestExpense1Member2022-01-012022-12-310001160106lyg:InterestExpense1Member2021-01-012021-12-310001160106lyg:FinanceLeasesMember2023-01-012023-12-310001160106lyg:FinanceLeasesMember2022-01-012022-12-310001160106lyg:FinanceLeasesMember2021-01-012021-12-310001160106lyg:RetailSegmentMemberlyg:CurrentAccountsMember2023-01-012023-12-310001160106lyg:CommercialBankingMemberlyg:CurrentAccountsMember2023-01-012023-12-310001160106lyg:InsurancePensionsAndInvestmentsMemberlyg:CurrentAccountsMember2023-01-012023-12-310001160106lyg:OtherIncome1Memberlyg:CurrentAccountsMember2023-01-012023-12-310001160106lyg:CurrentAccountsMember2023-01-012023-12-310001160106lyg:RetailSegmentMemberlyg:CreditAndDebitCardFeesMember2023-01-012023-12-310001160106lyg:CommercialBankingMemberlyg:CreditAndDebitCardFeesMember2023-01-012023-12-310001160106lyg:InsurancePensionsAndInvestmentsMemberlyg:CreditAndDebitCardFeesMember2023-01-012023-12-310001160106lyg:OtherIncome1Memberlyg:CreditAndDebitCardFeesMember2023-01-012023-12-310001160106lyg:CreditAndDebitCardFeesMember2023-01-012023-12-310001160106lyg:RetailSegmentMemberlyg:CommercialBankingAndTreasuryFeesMember2023-01-012023-12-310001160106lyg:CommercialBankingMemberlyg:CommercialBankingAndTreasuryFeesMember2023-01-012023-12-310001160106lyg:InsurancePensionsAndInvestmentsMemberlyg:CommercialBankingAndTreasuryFeesMember2023-01-012023-12-310001160106lyg:OtherIncome1Memberlyg:CommercialBankingAndTreasuryFeesMember2023-01-012023-12-310001160106lyg:CommercialBankingAndTreasuryFeesMember2023-01-012023-12-310001160106lyg:RetailSegmentMemberlyg:UnitTrustAndInsuranceBrokingMember2023-01-012023-12-310001160106lyg:CommercialBankingMemberlyg:UnitTrustAndInsuranceBrokingMember2023-01-012023-12-310001160106lyg:InsurancePensionsAndInvestmentsMemberlyg:UnitTrustAndInsuranceBrokingMember2023-01-012023-12-310001160106lyg:OtherIncome1Memberlyg:UnitTrustAndInsuranceBrokingMember2023-01-012023-12-310001160106lyg:UnitTrustAndInsuranceBrokingMember2023-01-012023-12-310001160106lyg:RetailSegmentMemberlyg:FactoringMember2023-01-012023-12-310001160106lyg:CommercialBankingMemberlyg:FactoringMember2023-01-012023-12-310001160106lyg:InsurancePensionsAndInvestmentsMemberlyg:FactoringMember2023-01-012023-12-310001160106lyg:OtherIncome1Memberlyg:FactoringMember2023-01-012023-12-310001160106lyg:FactoringMember2023-01-012023-12-310001160106lyg:OtherFeesAndCommissionsMemberlyg:RetailSegmentMember2023-01-012023-12-310001160106lyg:OtherFeesAndCommissionsMemberlyg:CommercialBankingMember2023-01-012023-12-310001160106lyg:OtherFeesAndCommissionsMemberlyg:InsurancePensionsAndInvestmentsMember2023-01-012023-12-310001160106lyg:OtherFeesAndCommissionsMemberlyg:OtherIncome1Member2023-01-012023-12-310001160106lyg:OtherFeesAndCommissionsMember2023-01-012023-12-310001160106lyg:RetailSegmentMemberlyg:CurrentAccountsMember2022-01-012022-12-310001160106lyg:CommercialBankingMemberlyg:CurrentAccountsMember2022-01-012022-12-310001160106lyg:InsurancePensionsAndInvestmentsMemberlyg:CurrentAccountsMember2022-01-012022-12-310001160106lyg:OtherIncome1Memberlyg:CurrentAccountsMember2022-01-012022-12-310001160106lyg:CurrentAccountsMember2022-01-012022-12-310001160106lyg:RetailSegmentMemberlyg:CreditAndDebitCardFeesMember2022-01-012022-12-310001160106lyg:CommercialBankingMemberlyg:CreditAndDebitCardFeesMember2022-01-012022-12-310001160106lyg:InsurancePensionsAndInvestmentsMemberlyg:CreditAndDebitCardFeesMember2022-01-012022-12-310001160106lyg:OtherIncome1Memberlyg:CreditAndDebitCardFeesMember2022-01-012022-12-310001160106lyg:CreditAndDebitCardFeesMember2022-01-012022-12-310001160106lyg:RetailSegmentMemberlyg:CommercialBankingAndTreasuryFeesMember2022-01-012022-12-310001160106lyg:CommercialBankingMemberlyg:CommercialBankingAndTreasuryFeesMember2022-01-012022-12-310001160106lyg:InsurancePensionsAndInvestmentsMemberlyg:CommercialBankingAndTreasuryFeesMember2022-01-012022-12-310001160106lyg:OtherIncome1Memberlyg:CommercialBankingAndTreasuryFeesMember2022-01-012022-12-310001160106lyg:CommercialBankingAndTreasuryFeesMember2022-01-012022-12-310001160106lyg:RetailSegmentMemberlyg:UnitTrustAndInsuranceBrokingMember2022-01-012022-12-310001160106lyg:CommercialBankingMemberlyg:UnitTrustAndInsuranceBrokingMember2022-01-012022-12-310001160106lyg:InsurancePensionsAndInvestmentsMemberlyg:UnitTrustAndInsuranceBrokingMember2022-01-012022-12-310001160106lyg:OtherIncome1Memberlyg:UnitTrustAndInsuranceBrokingMember2022-01-012022-12-310001160106lyg:UnitTrustAndInsuranceBrokingMember2022-01-012022-12-310001160106lyg:RetailSegmentMemberlyg:FactoringMember2022-01-012022-12-310001160106lyg:CommercialBankingMemberlyg:FactoringMember2022-01-012022-12-310001160106lyg:InsurancePensionsAndInvestmentsMemberlyg:FactoringMember2022-01-012022-12-310001160106lyg:OtherIncome1Memberlyg:FactoringMember2022-01-012022-12-310001160106lyg:FactoringMember2022-01-012022-12-310001160106lyg:OtherFeesAndCommissionsMemberlyg:RetailSegmentMember2022-01-012022-12-310001160106lyg:OtherFeesAndCommissionsMemberlyg:CommercialBankingMember2022-01-012022-12-310001160106lyg:OtherFeesAndCommissionsMemberlyg:InsurancePensionsAndInvestmentsMember2022-01-012022-12-310001160106lyg:OtherFeesAndCommissionsMemberlyg:OtherIncome1Member2022-01-012022-12-310001160106lyg:OtherFeesAndCommissionsMember2022-01-012022-12-310001160106lyg:RetailSegmentMemberlyg:CurrentAccountsMember2021-01-012021-12-310001160106lyg:CommercialBankingMemberlyg:CurrentAccountsMember2021-01-012021-12-310001160106lyg:InsurancePensionsAndInvestmentsMemberlyg:CurrentAccountsMember2021-01-012021-12-310001160106lyg:OtherIncome1Memberlyg:CurrentAccountsMember2021-01-012021-12-310001160106lyg:CurrentAccountsMember2021-01-012021-12-310001160106lyg:RetailSegmentMemberlyg:CreditAndDebitCardFeesMember2021-01-012021-12-310001160106lyg:CommercialBankingMemberlyg:CreditAndDebitCardFeesMember2021-01-012021-12-310001160106lyg:InsurancePensionsAndInvestmentsMemberlyg:CreditAndDebitCardFeesMember2021-01-012021-12-310001160106lyg:OtherIncome1Memberlyg:CreditAndDebitCardFeesMember2021-01-012021-12-310001160106lyg:CreditAndDebitCardFeesMember2021-01-012021-12-310001160106lyg:RetailSegmentMemberlyg:CommercialBankingAndTreasuryFeesMember2021-01-012021-12-310001160106lyg:CommercialBankingMemberlyg:CommercialBankingAndTreasuryFeesMember2021-01-012021-12-310001160106lyg:InsurancePensionsAndInvestmentsMemberlyg:CommercialBankingAndTreasuryFeesMember2021-01-012021-12-310001160106lyg:OtherIncome1Memberlyg:CommercialBankingAndTreasuryFeesMember2021-01-012021-12-310001160106lyg:CommercialBankingAndTreasuryFeesMember2021-01-012021-12-310001160106lyg:RetailSegmentMemberlyg:UnitTrustAndInsuranceBrokingMember2021-01-012021-12-310001160106lyg:CommercialBankingMemberlyg:UnitTrustAndInsuranceBrokingMember2021-01-012021-12-310001160106lyg:InsurancePensionsAndInvestmentsMemberlyg:UnitTrustAndInsuranceBrokingMember2021-01-012021-12-310001160106lyg:OtherIncome1Memberlyg:UnitTrustAndInsuranceBrokingMember2021-01-012021-12-310001160106lyg:UnitTrustAndInsuranceBrokingMember2021-01-012021-12-310001160106lyg:RetailSegmentMemberlyg:FactoringMember2021-01-012021-12-310001160106lyg:CommercialBankingMemberlyg:FactoringMember2021-01-012021-12-310001160106lyg:InsurancePensionsAndInvestmentsMemberlyg:FactoringMember2021-01-012021-12-310001160106lyg:OtherIncome1Memberlyg:FactoringMember2021-01-012021-12-310001160106lyg:FactoringMember2021-01-012021-12-310001160106lyg:OtherFeesAndCommissionsMemberlyg:RetailSegmentMember2021-01-012021-12-310001160106lyg:OtherFeesAndCommissionsMemberlyg:CommercialBankingMember2021-01-012021-12-310001160106lyg:OtherFeesAndCommissionsMemberlyg:InsurancePensionsAndInvestmentsMember2021-01-012021-12-310001160106lyg:OtherFeesAndCommissionsMemberlyg:OtherIncome1Member2021-01-012021-12-310001160106lyg:OtherFeesAndCommissionsMember2021-01-012021-12-310001160106lyg:ServicesProvidedAfterBalanceSheetDateMember2023-12-310001160106lyg:ServicesProvidedAfterBalanceSheetDateMember2022-12-310001160106ifrs-full:FairValueHedgesMember2023-01-012023-12-310001160106ifrs-full:FairValueHedgesMember2022-01-012022-12-310001160106ifrs-full:FairValueHedgesMember2021-01-012021-12-310001160106ifrs-full:CashFlowHedgesMember2023-01-012023-12-310001160106ifrs-full:CashFlowHedgesMember2022-01-012022-12-310001160106ifrs-full:CashFlowHedgesMember2021-01-012021-12-310001160106lyg:LifeInsuranceContractsMemberlyg:LifeAndPensionsMember2021-01-012021-12-310001160106lyg:LifeInsuranceContractsMemberlyg:AnnuitiesMember2021-01-012021-12-310001160106lyg:LifeInsuranceContractsMember2021-01-012021-12-310001160106lyg:CededReinsurancePremiumsMember2021-01-012021-12-310001160106lyg:NonLifeInsuranceContractsMember2021-01-012021-12-310001160106ifrs-full:InsuranceContractsOtherThanThoseToWhichPremiumAllocationApproachHasBeenAppliedMember2023-01-012023-12-310001160106ifrs-full:InsuranceContractsOtherThanThoseToWhichPremiumAllocationApproachHasBeenAppliedMember2022-01-012022-12-310001160106ifrs-full:InsuranceContractsToWhichPremiumAllocationApproachHasBeenAppliedMember2023-01-012023-12-310001160106ifrs-full:InsuranceContractsToWhichPremiumAllocationApproachHasBeenAppliedMember2022-01-012022-12-310001160106lyg:WeatherRelatedClaimsMember2023-01-012023-12-310001160106lyg:WeatherRelatedClaimsMember2022-01-012022-12-310001160106lyg:SevereWeatherRelatedClaimsMember2023-01-012023-12-310001160106lyg:SevereWeatherRelatedClaimsMember2022-01-012022-12-310001160106ifrs-full:InsuranceContractsOtherThanThoseToWhichPremiumAllocationApproachHasBeenAppliedMemberlyg:IncludesDrawdownFeatureMember2022-01-012022-12-310001160106ifrs-full:ContractualServiceMarginRelatedToContractsThatExistedAtTransitionDateToWhichModifiedRetrospectiveApproachHasBeenAppliedMember2022-01-012022-12-310001160106ifrs-full:ContractualServiceMarginRelatedToContractsThatExistedAtTransitionDateToWhichModifiedRetrospectiveApproachHasBeenAppliedMember2022-12-310001160106ifrs-full:ContractualServiceMarginRelatedToContractsThatExistedAtTransitionDateToWhichModifiedRetrospectiveApproachHasBeenAppliedMemberlyg:IncludesDrawdownFeatureMember2022-12-310001160106lyg:OperatingIncomeLoss1Member2023-01-012023-12-310001160106lyg:OperatingIncomeLoss1Member2022-01-012022-12-310001160106lyg:OperatingIncomeLoss1Member2021-01-012021-12-310001160106lyg:DeathsMemberlyg:InsuranceClaims2Member2021-01-012021-12-310001160106lyg:InsuranceClaims2Memberlyg:MaturitiesMember2021-01-012021-12-310001160106lyg:InsuranceClaims2Memberlyg:AnnuitiesMember2021-01-012021-12-310001160106lyg:OtherMemberlyg:InsuranceClaims2Member2021-01-012021-12-310001160106lyg:InsuranceClaims2Member2021-01-012021-12-310001160106lyg:ParticipatingInvestmentContractsMemberlyg:InsuranceClaims2Member2021-01-012021-12-310001160106lyg:InsuranceClaims2Memberlyg:NonparticipatingInvestmentContractsMember2021-01-012021-12-310001160106lyg:InsuranceClaims2Memberlyg:LifeInsuranceAndParticipatingInvestmentContractsMember2021-01-012021-12-310001160106lyg:NonlifeInsuranceNetOfReinsurranceMemberlyg:InsuranceClaims2Member2021-01-012021-12-310001160106ifrs-full:FinancialAssetsAtFairValueThroughProfitOrLossCategoryMemberlyg:InsuranceClaims2Member2021-01-012021-12-310001160106lyg:InsuranceClaims2Memberifrs-full:OtherAssetsMember2021-01-012021-12-310001160106lyg:NonlifeInsuranceNetOfReinsurranceMemberlyg:WeatherRelatedClaimsMemberlyg:InsuranceClaims2Member2021-01-012021-12-310001160106lyg:NonlifeInsuranceNetOfReinsurranceMemberlyg:InsuranceClaims2Memberlyg:SevereWeatherRelatedClaimsMember2021-01-012021-12-310001160106ifrs-full:InsuranceContractsOtherThanThoseToWhichPremiumAllocationApproachHasBeenAppliedMemberifrs-full:InsuranceContractsIssuedMember2023-01-012023-12-310001160106ifrs-full:InsuranceContractsIssuedMemberifrs-full:InsuranceContractsToWhichPremiumAllocationApproachHasBeenAppliedMember2023-01-012023-12-310001160106ifrs-full:InsuranceContractsIssuedMember2023-01-012023-12-310001160106ifrs-full:InsuranceContractsOtherThanThoseToWhichPremiumAllocationApproachHasBeenAppliedMemberifrs-full:InsuranceContractsIssuedMember2022-01-012022-12-310001160106ifrs-full:InsuranceContractsIssuedMemberifrs-full:InsuranceContractsToWhichPremiumAllocationApproachHasBeenAppliedMember2022-01-012022-12-310001160106ifrs-full:InsuranceContractsIssuedMember2022-01-012022-12-310001160106ifrs-full:InsuranceContractsOtherThanThoseToWhichPremiumAllocationApproachHasBeenAppliedMemberifrs-full:ReinsuranceContractsHeldMember2023-01-012023-12-310001160106ifrs-full:ReinsuranceContractsHeldMemberifrs-full:InsuranceContractsToWhichPremiumAllocationApproachHasBeenAppliedMember2023-01-012023-12-310001160106ifrs-full:ReinsuranceContractsHeldMember2023-01-012023-12-310001160106ifrs-full:InsuranceContractsOtherThanThoseToWhichPremiumAllocationApproachHasBeenAppliedMemberifrs-full:ReinsuranceContractsHeldMember2022-01-012022-12-310001160106ifrs-full:ReinsuranceContractsHeldMemberifrs-full:InsuranceContractsToWhichPremiumAllocationApproachHasBeenAppliedMember2022-01-012022-12-310001160106ifrs-full:ReinsuranceContractsHeldMember2022-01-012022-12-310001160106ifrs-full:AccumulatedDepreciationAmortisationAndImpairmentMemberifrs-full:BuildingsMember2023-01-012023-12-310001160106ifrs-full:AccumulatedDepreciationAmortisationAndImpairmentMemberifrs-full:BuildingsMember2022-01-012022-12-310001160106ifrs-full:AccumulatedDepreciationAmortisationAndImpairmentMemberifrs-full:BuildingsMember2021-01-012021-12-310001160106ifrs-full:OtherPropertyPlantAndEquipmentMemberifrs-full:AccumulatedDepreciationAmortisationAndImpairmentMember2023-01-012023-12-310001160106ifrs-full:OtherPropertyPlantAndEquipmentMemberifrs-full:AccumulatedDepreciationAmortisationAndImpairmentMember2022-01-012022-12-310001160106ifrs-full:OtherPropertyPlantAndEquipmentMemberifrs-full:AccumulatedDepreciationAmortisationAndImpairmentMember2021-01-012021-12-310001160106ifrs-full:PropertyPlantAndEquipmentSubjectToOperatingLeasesMemberifrs-full:AccumulatedDepreciationAmortisationAndImpairmentMember2023-01-012023-12-310001160106ifrs-full:PropertyPlantAndEquipmentSubjectToOperatingLeasesMemberifrs-full:AccumulatedDepreciationAmortisationAndImpairmentMember2022-01-012022-12-310001160106ifrs-full:PropertyPlantAndEquipmentSubjectToOperatingLeasesMemberifrs-full:AccumulatedDepreciationAmortisationAndImpairmentMember2021-01-012021-12-310001160106ifrs-full:RightofuseAssetsMemberifrs-full:AccumulatedDepreciationAmortisationAndImpairmentMember2023-01-012023-12-310001160106ifrs-full:RightofuseAssetsMemberifrs-full:AccumulatedDepreciationAmortisationAndImpairmentMember2022-01-012022-12-310001160106ifrs-full:RightofuseAssetsMemberifrs-full:AccumulatedDepreciationAmortisationAndImpairmentMember2021-01-012021-12-310001160106ifrs-full:CountryOfDomicileMember2023-01-012023-12-310001160106ifrs-full:CountryOfDomicileMember2022-01-012022-12-310001160106ifrs-full:CountryOfDomicileMember2021-01-012021-12-310001160106ifrs-full:ForeignCountriesMember2023-01-012023-12-310001160106ifrs-full:ForeignCountriesMember2022-01-012022-12-310001160106ifrs-full:ForeignCountriesMember2021-01-012021-12-310001160106lyg:CurrentYearMemberlyg:PerformancebasedCompensationExpenseMember2023-01-012023-12-310001160106lyg:CurrentYearMemberlyg:PerformancebasedCompensationExpenseMember2022-01-012022-12-310001160106lyg:CurrentYearMemberlyg:PerformancebasedCompensationExpenseMember2021-01-012021-12-310001160106lyg:CurrentYearMemberlyg:PerformanceBasedCompensationExpenseDeferredUntilLaterYearsMember2023-01-012023-12-310001160106lyg:CurrentYearMemberlyg:PerformanceBasedCompensationExpenseDeferredUntilLaterYearsMember2022-01-012022-12-310001160106lyg:CurrentYearMemberlyg:PerformanceBasedCompensationExpenseDeferredUntilLaterYearsMember2021-01-012021-12-310001160106lyg:PerformancebasedCompensationExpenseMemberlyg:PriorYearMember2023-01-012023-12-310001160106lyg:PerformancebasedCompensationExpenseMemberlyg:PriorYearMember2022-01-012022-12-310001160106lyg:PerformancebasedCompensationExpenseMemberlyg:PriorYearMember2021-01-012021-12-310001160106lyg:PriorYearMemberlyg:PerformanceBasedCompensationExpenseDeferredUntilLaterYearsMember2023-01-012023-12-310001160106lyg:PriorYearMemberlyg:PerformanceBasedCompensationExpenseDeferredUntilLaterYearsMember2022-01-012022-12-310001160106lyg:PriorYearMemberlyg:PerformanceBasedCompensationExpenseDeferredUntilLaterYearsMember2021-01-012021-12-310001160106lyg:PerformancebasedCompensationExpenseMember2023-01-012023-12-310001160106lyg:PerformancebasedCompensationExpenseMember2022-01-012022-12-310001160106lyg:PerformancebasedCompensationExpenseMember2021-01-012021-12-310001160106lyg:PerformanceBasedCompensationExpenseDeferredUntilLaterYearsMember2023-01-012023-12-310001160106lyg:PerformanceBasedCompensationExpenseDeferredUntilLaterYearsMember2022-01-012022-12-310001160106lyg:PerformanceBasedCompensationExpenseDeferredUntilLaterYearsMember2021-01-012021-12-310001160106lyg:GrantedInCurrentYearMember2023-01-012023-12-310001160106lyg:GrantedInCurrentYearMember2022-01-012022-12-310001160106lyg:GrantedInCurrentYearMember2021-01-012021-12-310001160106lyg:GrantedInPriorYearsMember2023-01-012023-12-310001160106lyg:GrantedInPriorYearsMember2022-01-012022-12-310001160106lyg:GrantedInPriorYearsMember2021-01-012021-12-310001160106lyg:SaveAsYouEarnMember2023-01-012023-12-310001160106lyg:SaveAsYouEarnMemberlyg:SaveAsYouEarnMember2022-12-310001160106lyg:SaveAsYouEarnMemberlyg:SaveAsYouEarnMember2021-12-310001160106lyg:SaveAsYouEarnMemberlyg:SaveAsYouEarnMember2023-01-012023-12-310001160106lyg:SaveAsYouEarnMemberlyg:SaveAsYouEarnMember2022-01-012022-12-310001160106lyg:SaveAsYouEarnMemberlyg:SaveAsYouEarnMember2023-12-310001160106lyg:SaveAsYouEarnMember2022-01-012022-12-310001160106lyg:SaveAsYouEarnMember2023-12-310001160106lyg:SaveAsYouEarnMember2022-12-310001160106lyg:LloydsBankingGroupExecutiveSharePlan2003Memberlyg:LloydsBankingGroupExecutiveSharePlan2003Member2022-12-310001160106lyg:LloydsBankingGroupExecutiveSharePlan2003Memberlyg:LloydsBankingGroupExecutiveSharePlan2003Member2021-12-310001160106lyg:LloydsBankingGroupExecutiveSharePlan2003Memberlyg:LloydsBankingGroupExecutiveSharePlan2003Member2023-01-012023-12-310001160106lyg:LloydsBankingGroupExecutiveSharePlan2003Memberlyg:LloydsBankingGroupExecutiveSharePlan2003Member2022-01-012022-12-310001160106lyg:LloydsBankingGroupExecutiveSharePlan2003Memberlyg:LloydsBankingGroupExecutiveSharePlan2003Member2023-12-310001160106lyg:LloydsBankingGroupExecutiveSharePlan2003Member2023-12-310001160106lyg:LloydsBankingGroupExecutiveSharePlan2003Member2022-12-310001160106lyg:LloydsBankingGroupExecutiveSharePlan2003Member2023-01-012023-12-310001160106lyg:LloydsBankingGroupExecutiveSharePlan2003Member2022-01-012022-12-310001160106lyg:CFOBuyoutMember2019-08-012019-08-010001160106lyg:CFOBuyoutMember2022-12-310001160106lyg:CFOBuyoutMember2021-12-310001160106lyg:CFOBuyoutMember2023-01-012023-12-310001160106lyg:CFOBuyoutMember2022-01-012022-12-310001160106lyg:CFOBuyoutMember2023-12-310001160106lyg:GroupChiefExecutiveBuyoutMember2021-01-012021-12-310001160106lyg:GroupChiefExecutiveBuyoutMember2022-12-310001160106lyg:GroupChiefExecutiveBuyoutMember2021-12-310001160106lyg:GroupChiefExecutiveBuyoutMember2023-01-012023-12-310001160106lyg:GroupChiefExecutiveBuyoutMember2022-01-012022-12-310001160106lyg:GroupChiefExecutiveBuyoutMember2023-12-310001160106lyg:LloydsBankingGroupLongTermIncentivePlanMember2023-01-012023-12-310001160106lyg:LloydsBankingGroupLongTermIncentivePlanMemberlyg:Performance2019Member2023-01-012023-12-310001160106lyg:LloydsBankingGroupExecutiveSharePlan2006Member2022-12-310001160106lyg:LloydsBankingGroupExecutiveSharePlan2006Member2021-12-310001160106lyg:LloydsBankingGroupExecutiveSharePlan2006Member2023-01-012023-12-310001160106lyg:LloydsBankingGroupExecutiveSharePlan2006Member2022-01-012022-12-310001160106lyg:LloydsBankingGroupExecutiveSharePlan2006Member2023-12-310001160106lyg:LloydsBankingGroupLongTermIncentivePlanMemberlyg:A2021Member2023-01-012023-12-310001160106lyg:LloydsBankingGroupLongTermSharePlanMember2022-12-310001160106lyg:LloydsBankingGroupLongTermSharePlanMember2021-12-310001160106lyg:LloydsBankingGroupLongTermSharePlanMember2023-01-012023-12-310001160106lyg:LloydsBankingGroupLongTermSharePlanMember2022-01-012022-12-310001160106lyg:LloydsBankingGroupLongTermSharePlanMember2023-12-310001160106lyg:SaveAsYouEarnMember2023-01-012023-12-310001160106lyg:ExecutiveSharePlan2003Member2023-01-012023-12-310001160106lyg:LTIPMember2023-01-012023-12-310001160106lyg:MatchingSharesMember2023-01-012023-12-310001160106lyg:SaveAsYouEarnMemberifrs-full:BottomOfRangeMember2023-01-012023-12-310001160106lyg:MatchingSharesMember2022-01-012022-12-310001160106lyg:FixedShareAwardsMember2014-01-012020-06-300001160106lyg:FixedShareAwardsMember2023-01-012023-12-310001160106lyg:FixedShareAwardsMember2022-01-012022-12-310001160106lyg:FixedShareAwardsMember2023-01-012023-12-310001160106lyg:FixedShareAwardsMember2022-01-012022-12-310001160106lyg:FreeShareAwardsMember2023-01-012023-12-310001160106lyg:FreeShareAwardsMemberifrs-full:BottomOfRangeMember2023-01-012023-12-310001160106lyg:DefinedBenefitPensionSchemesMember2023-12-310001160106lyg:DefinedBenefitPensionSchemesMember2022-12-310001160106lyg:DefinedBenefitPensionSchemesMember2023-01-012023-12-310001160106lyg:DefinedBenefitPensionSchemesMember2022-01-012022-12-310001160106lyg:DefinedBenefitPensionSchemesMember2021-01-012021-12-310001160106lyg:OtherPostretirementBenefitSchemesMember2023-01-012023-12-310001160106lyg:OtherPostretirementBenefitSchemesMember2022-01-012022-12-310001160106lyg:OtherPostretirementBenefitSchemesMember2021-01-012021-12-310001160106lyg:DefinedBenefitSchemesMember2023-01-012023-12-310001160106lyg:DefinedBenefitSchemesMember2022-01-012022-12-310001160106lyg:DefinedBenefitSchemesMember2021-01-012021-12-310001160106lyg:DefinedContributionPensionSchemesMember2023-01-012023-12-310001160106lyg:DefinedContributionPensionSchemesMember2022-01-012022-12-310001160106lyg:DefinedContributionPensionSchemesMember2021-01-012021-12-310001160106lyg:AmountRecognizedMember2023-12-310001160106lyg:AmountRecognizedMember2022-12-310001160106lyg:DefinedBenefitPensionSchemesMemberlyg:AmountRecognizedMember2023-12-310001160106lyg:DefinedBenefitPensionSchemesMemberlyg:AmountRecognizedMember2022-12-310001160106lyg:OtherPostretirementBenefitSchemesMemberlyg:AmountRecognizedMember2023-12-310001160106lyg:OtherPostretirementBenefitSchemesMemberlyg:AmountRecognizedMember2022-12-310001160106lyg:TheGroupsThreeMainSchemesMember2023-01-012023-12-310001160106lyg:TheGroupsThreeMainSchemesMember2022-01-012022-12-310001160106lyg:TheGroupsThreeMainSchemesMembersrt:MinimumMember2023-01-012023-12-310001160106lyg:TheGroupsThreeMainSchemesMemberlyg:ContractualRightToRetireEarlierMembersrt:MinimumMember2023-01-012023-12-310001160106ifrs-full:AggregatedMeasurementMember2023-06-300001160106ifrs-full:AggregatedMeasurementMember2023-12-3100011601062024-01-012024-12-310001160106lyg:LLoydsBankPensionSchemeNo1AndNo2Memberlyg:LimitedLiabilityPartnershipsMemberlyg:DefinedBenefitPensionSchemesMember2023-12-310001160106lyg:LimitedLiabilityPartnershipsMemberlyg:HBOsFinalSalaryPensionSchemeMemberlyg:DefinedBenefitPensionSchemesMember2023-12-310001160106lyg:GuaranteedMinimumPensionBenefitsMember2018-01-012018-12-310001160106lyg:GuaranteedMinimumPensionBenefitsMember2019-01-012019-12-310001160106lyg:NetAmountsPresentedInTheBalanceSheetMember2023-12-310001160106lyg:NetAmountsPresentedInTheBalanceSheetMember2022-12-310001160106lyg:DefinedBenefitPensionSchemesMemberlyg:AmountRecognizedMember2021-12-310001160106lyg:DefinedBenefitPensionSchemesMemberlyg:AmountRecognizedMember2023-01-012023-12-310001160106lyg:DefinedBenefitPensionSchemesMemberlyg:AmountRecognizedMember2022-01-012022-12-310001160106lyg:MovementsInTheDefinedBenefitObligationMember2022-12-310001160106lyg:MovementsInTheDefinedBenefitObligationMember2021-12-310001160106lyg:MovementsInTheDefinedBenefitObligationMember2023-01-012023-12-310001160106lyg:MovementsInTheDefinedBenefitObligationMember2022-01-012022-12-310001160106lyg:MovementsInTheDefinedBenefitObligationMember2023-12-310001160106lyg:ActiveMembersMember2023-12-310001160106lyg:ActiveMembersMember2022-12-310001160106lyg:DeferredMembersMember2023-12-310001160106lyg:DeferredMembersMember2022-12-310001160106lyg:DependantsMember2023-12-310001160106lyg:DependantsMember2022-12-310001160106lyg:PensionersMember2023-12-310001160106lyg:PensionersMember2022-12-310001160106lyg:PostEmploymentRetirementBenefits1Member2022-12-310001160106lyg:PostEmploymentRetirementBenefits1Member2021-12-310001160106lyg:PostEmploymentRetirementBenefits1Member2023-01-012023-12-310001160106lyg:PostEmploymentRetirementBenefits1Member2022-01-012022-12-310001160106lyg:PostEmploymentRetirementBenefits1Member2023-12-310001160106lyg:RetirementSchemeAssetsMemberlyg:QuotedMember2023-12-310001160106lyg:UnquotedMemberlyg:RetirementSchemeAssetsMember2023-12-310001160106lyg:RetirementSchemeAssetsMember2023-12-310001160106lyg:RetirementSchemeAssetsMemberlyg:QuotedMember2022-12-310001160106lyg:UnquotedMemberlyg:RetirementSchemeAssetsMember2022-12-310001160106lyg:RetirementSchemeAssetsMember2022-12-310001160106lyg:InvestmentGradeMember2023-12-310001160106lyg:InvestmentGradeMember2022-12-310001160106lyg:AlternativeCreditFundsMember2023-12-310001160106lyg:AlternativeCreditFundsMember2022-12-310001160106lyg:BondAndDebtFundsMember2023-12-310001160106lyg:BondAndDebtFundsMember2022-12-310001160106lyg:EquityFund1Member2023-12-310001160106lyg:EquityFund1Member2022-12-310001160106lyg:HedgeAndMutualFundsMember2023-12-310001160106lyg:HedgeAndMutualFundsMember2022-12-310001160106lyg:InfrastructureFundsMember2023-12-310001160106lyg:InfrastructureFundsMember2022-12-310001160106lyg:LiquidityFundsMember2023-12-310001160106lyg:LiquidityFundsMember2022-12-310001160106lyg:PropertyFundsMember2023-12-310001160106lyg:PropertyFundsMember2022-12-310001160106lyg:OtherMember2023-12-310001160106lyg:OtherMember2022-12-310001160106lyg:RPIMember2023-12-310001160106lyg:RPIMember2022-12-310001160106lyg:CPIMember2023-12-310001160106lyg:CPIMember2022-12-3100011601062020-11-252024-12-310001160106srt:ScenarioForecastMember2025-01-012025-12-310001160106srt:ScenarioForecastMember2026-01-012026-12-310001160106srt:ScenarioForecastMember2027-01-012030-12-310001160106srt:ScenarioForecastMember2032-01-012032-12-310001160106lyg:OnValuationDateMemberlyg:MenMember2023-01-012023-12-310001160106lyg:OnValuationDateMemberlyg:MenMember2022-01-012022-12-310001160106lyg:OnValuationDateMemberlyg:WomenMember2023-01-012023-12-310001160106lyg:OnValuationDateMemberlyg:WomenMember2022-01-012022-12-310001160106lyg:FifteenYearsAfterValuationDateMemberlyg:MenMember2023-01-012023-12-310001160106lyg:FifteenYearsAfterValuationDateMemberlyg:MenMember2022-01-012022-12-310001160106lyg:FifteenYearsAfterValuationDateMemberlyg:WomenMember2023-01-012023-12-310001160106lyg:FifteenYearsAfterValuationDateMemberlyg:WomenMember2022-01-012022-12-310001160106lyg:IncreaseOf01PercentMemberifrs-full:ActuarialAssumptionOfExpectedRatesOfInflationMember2023-01-012023-12-310001160106lyg:IncreaseOf01PercentMemberifrs-full:ActuarialAssumptionOfExpectedRatesOfInflationMember2022-01-012022-12-310001160106lyg:IncreaseOf01PercentMemberifrs-full:ActuarialAssumptionOfExpectedRatesOfInflationMember2023-12-310001160106lyg:IncreaseOf01PercentMemberifrs-full:ActuarialAssumptionOfExpectedRatesOfInflationMember2022-12-310001160106lyg:DecreaseOfOnePercentInDiscountRateMemberifrs-full:ActuarialAssumptionOfExpectedRatesOfInflationMember2023-01-012023-12-310001160106lyg:DecreaseOfOnePercentInDiscountRateMemberifrs-full:ActuarialAssumptionOfExpectedRatesOfInflationMember2022-01-012022-12-310001160106lyg:DecreaseOfOnePercentInDiscountRateMemberifrs-full:ActuarialAssumptionOfExpectedRatesOfInflationMember2023-12-310001160106lyg:DecreaseOfOnePercentInDiscountRateMemberifrs-full:ActuarialAssumptionOfExpectedRatesOfInflationMember2022-12-310001160106lyg:IncreaseOf01PercentMemberifrs-full:ActuarialAssumptionOfDiscountRatesMember2023-01-012023-12-310001160106lyg:IncreaseOf01PercentMemberifrs-full:ActuarialAssumptionOfDiscountRatesMember2022-01-012022-12-310001160106lyg:IncreaseOf01PercentMemberifrs-full:ActuarialAssumptionOfDiscountRatesMember2023-12-310001160106lyg:IncreaseOf01PercentMemberifrs-full:ActuarialAssumptionOfDiscountRatesMember2022-12-310001160106lyg:DecreaseOfOnePercentInDiscountRateMemberifrs-full:ActuarialAssumptionOfDiscountRatesMember2023-01-012023-12-310001160106lyg:DecreaseOfOnePercentInDiscountRateMemberifrs-full:ActuarialAssumptionOfDiscountRatesMember2022-01-012022-12-310001160106lyg:DecreaseOfOnePercentInDiscountRateMemberifrs-full:ActuarialAssumptionOfDiscountRatesMember2023-12-310001160106lyg:DecreaseOfOnePercentInDiscountRateMemberifrs-full:ActuarialAssumptionOfDiscountRatesMember2022-12-310001160106lyg:ActuarialAssumptionOfExpectedLifeExpectancyOfMembersMemberlyg:IncreaseOfOneYearMember2023-01-012023-12-310001160106lyg:ActuarialAssumptionOfExpectedLifeExpectancyOfMembersMemberlyg:IncreaseOfOneYearMember2022-01-012022-12-310001160106lyg:ActuarialAssumptionOfExpectedLifeExpectancyOfMembersMemberlyg:IncreaseOfOneYearMember2023-12-310001160106lyg:ActuarialAssumptionOfExpectedLifeExpectancyOfMembersMemberlyg:IncreaseOfOneYearMember2022-12-310001160106lyg:DecreaseOfOneYearMemberlyg:ActuarialAssumptionOfExpectedLifeExpectancyOfMembersMember2023-01-012023-12-310001160106lyg:DecreaseOfOneYearMemberlyg:ActuarialAssumptionOfExpectedLifeExpectancyOfMembersMember2022-01-012022-12-310001160106lyg:DecreaseOfOneYearMemberlyg:ActuarialAssumptionOfExpectedLifeExpectancyOfMembersMember2023-12-310001160106lyg:DecreaseOfOneYearMemberlyg:ActuarialAssumptionOfExpectedLifeExpectancyOfMembersMember2022-12-310001160106lyg:LongevityInsuranceArrangementMember2020-01-280001160106lyg:LongevityInsuranceArrangementMember2022-01-280001160106ifrs-full:SwapContractMemberlyg:TheGroupsThreeMainSchemesMember2023-12-310001160106lyg:PaidWithin12MonthsMember2023-01-012023-12-310001160106lyg:PaidWithin12MonthsMember2022-01-012022-12-310001160106lyg:PaidBetween1And2YearsMember2023-01-012023-12-310001160106lyg:PaidBetween1And2YearsMember2022-01-012022-12-310001160106lyg:PaidBetween2And5YearsMember2023-01-012023-12-310001160106lyg:PaidBetween2And5YearsMember2022-01-012022-12-310001160106lyg:PaidBetween5And10YearsMember2023-01-012023-12-310001160106lyg:PaidBetween5And10YearsMember2022-01-012022-12-310001160106lyg:PaidBetween10And15YearsMember2023-01-012023-12-310001160106lyg:PaidBetween10And15YearsMember2022-01-012022-12-310001160106lyg:PaidBetween15And25YearsMember2023-01-012023-12-310001160106lyg:PaidBetween15And25YearsMember2022-01-012022-12-310001160106lyg:PaidBetween25And35YearsMember2023-01-012023-12-310001160106lyg:PaidBetween25And35YearsMember2022-01-012022-12-310001160106lyg:PaidBetween35And45YearsMember2023-01-012023-12-310001160106lyg:PaidBetween35And45YearsMember2022-01-012022-12-310001160106lyg:PaidInMoreThan45YearsMember2023-01-012023-12-310001160106lyg:PaidInMoreThan45YearsMember2022-01-012022-12-310001160106lyg:HealthcarePremiumsMember2023-12-310001160106lyg:HealthcarePremiumsMember2022-12-310001160106lyg:OtherPostretirementBenefitsPlan1Member2022-12-310001160106lyg:OtherPostretirementBenefitsPlan1Member2021-12-310001160106lyg:OtherPostretirementBenefitsPlan1Member2023-01-012023-12-310001160106lyg:OtherPostretirementBenefitsPlan1Member2022-01-012022-12-310001160106lyg:OtherPostretirementBenefitsPlan1Member2023-12-310001160106lyg:AuditOfTheCompanysCurrentYearAnnualReportMember2023-01-012023-12-310001160106lyg:AuditOfTheCompanysCurrentYearAnnualReportMember2022-01-012022-12-310001160106lyg:AuditOfTheCompanysCurrentYearAnnualReportMember2021-01-012021-12-310001160106lyg:AuditOfTheCompanysSubsidiariesPursuantToLegislationMember2023-01-012023-12-310001160106lyg:AuditOfTheCompanysSubsidiariesPursuantToLegislationMember2022-01-012022-12-310001160106lyg:AuditOfTheCompanysSubsidiariesPursuantToLegislationMember2021-01-012021-12-310001160106lyg:AuditFeesStatutoryAuditOfGroupEntitiesMember2023-01-012023-12-310001160106lyg:AuditFeesStatutoryAuditOfGroupEntitiesMember2022-01-012022-12-310001160106lyg:AuditFeesStatutoryAuditOfGroupEntitiesMember2021-01-012021-12-310001160106lyg:OtherServicesSuppliedPursuantToLegislationMember2023-01-012023-12-310001160106lyg:OtherServicesSuppliedPursuantToLegislationMember2022-01-012022-12-310001160106lyg:OtherServicesSuppliedPursuantToLegislationMember2021-01-012021-12-310001160106lyg:TotalAuditFeesMember2023-01-012023-12-310001160106lyg:TotalAuditFeesMember2022-01-012022-12-310001160106lyg:TotalAuditFeesMember2021-01-012021-12-310001160106lyg:OtherServicesAuditRelatedFeesMember2023-01-012023-12-310001160106lyg:OtherServicesAuditRelatedFeesMember2022-01-012022-12-310001160106lyg:OtherServicesAuditRelatedFeesMember2021-01-012021-12-310001160106lyg:OtherServicesMember2023-01-012023-12-310001160106lyg:OtherServicesMember2022-01-012022-12-310001160106lyg:OtherServicesMember2021-01-012021-12-310001160106lyg:StatutoryAuditOfGroupEntitiesMember2023-01-012023-12-310001160106lyg:StatutoryAuditOfGroupEntitiesMember2022-01-012022-12-310001160106lyg:StatutoryAuditOfGroupEntitiesMember2021-01-012021-12-310001160106lyg:AuditsOfGroupPensionSchemesMember2023-01-012023-12-310001160106lyg:AuditsOfGroupPensionSchemesMember2022-01-012022-12-310001160106lyg:AuditsOfGroupPensionSchemesMember2021-01-012021-12-310001160106lyg:AuditsOfTheUnconsolidatedOpenEndedInvestmentCompaniesManagedByTheGroupMember2023-01-012023-12-310001160106lyg:AuditsOfTheUnconsolidatedOpenEndedInvestmentCompaniesManagedByTheGroupMember2022-01-012022-12-310001160106lyg:AuditsOfTheUnconsolidatedOpenEndedInvestmentCompaniesManagedByTheGroupMember2021-01-012021-12-310001160106lyg:ReviewsOfTheFinancialPositionOfCorporateAndOtherBorrowersMember2023-01-012023-12-310001160106lyg:ReviewsOfTheFinancialPositionOfCorporateAndOtherBorrowersMember2022-01-012022-12-310001160106lyg:ReviewsOfTheFinancialPositionOfCorporateAndOtherBorrowersMember2021-01-012021-12-310001160106lyg:LoansAndAdvancesToBanksMemberlyg:Stage1Member2023-01-012023-12-310001160106lyg:Stage2Memberlyg:LoansAndAdvancesToBanksMember2023-01-012023-12-310001160106lyg:Stage3Memberlyg:LoansAndAdvancesToBanksMember2023-01-012023-12-310001160106lyg:LoansAndAdvancesToBanksMemberlyg:PurchasedOrOriginatedCreditimpairedMember2023-01-012023-12-310001160106lyg:LoansAndAdvancesToBanksMember2023-01-012023-12-310001160106lyg:LoansAndAdvancesToCustomersMemberlyg:Stage1Member2023-01-012023-12-310001160106lyg:Stage2Memberlyg:LoansAndAdvancesToCustomersMember2023-01-012023-12-310001160106lyg:Stage3Memberlyg:LoansAndAdvancesToCustomersMember2023-01-012023-12-310001160106lyg:LoansAndAdvancesToCustomersMemberlyg:PurchasedOrOriginatedCreditimpairedMember2023-01-012023-12-310001160106lyg:LoansAndAdvancesToCustomersMember2023-01-012023-12-310001160106ifrs-full:FinancialAssetsAtAmortisedCostCategoryMemberifrs-full:DebtSecuritiesMemberlyg:Stage1Member2023-01-012023-12-310001160106lyg:Stage2Memberifrs-full:FinancialAssetsAtAmortisedCostCategoryMemberifrs-full:DebtSecuritiesMember2023-01-012023-12-310001160106lyg:Stage3Memberifrs-full:FinancialAssetsAtAmortisedCostCategoryMemberifrs-full:DebtSecuritiesMember2023-01-012023-12-310001160106ifrs-full:FinancialAssetsAtAmortisedCostCategoryMemberifrs-full:DebtSecuritiesMemberlyg:PurchasedOrOriginatedCreditimpairedMember2023-01-012023-12-310001160106ifrs-full:FinancialAssetsAtAmortisedCostCategoryMemberifrs-full:DebtSecuritiesMember2023-01-012023-12-310001160106ifrs-full:FinancialAssetsAtAmortisedCostCategoryMemberlyg:Stage1Member2023-01-012023-12-310001160106lyg:Stage2Memberifrs-full:FinancialAssetsAtAmortisedCostCategoryMember2023-01-012023-12-310001160106lyg:Stage3Memberifrs-full:FinancialAssetsAtAmortisedCostCategoryMember2023-01-012023-12-310001160106ifrs-full:FinancialAssetsAtAmortisedCostCategoryMemberlyg:PurchasedOrOriginatedCreditimpairedMember2023-01-012023-12-310001160106ifrs-full:FinancialAssetsAtAmortisedCostCategoryMember2023-01-012023-12-310001160106lyg:Stage1Member2023-01-012023-12-310001160106lyg:Stage2Member2023-01-012023-12-310001160106lyg:Stage3Member2023-01-012023-12-310001160106lyg:PurchasedOrOriginatedCreditimpairedMember2023-01-012023-12-310001160106lyg:Stage1Member2023-12-310001160106lyg:Stage2Member2023-12-310001160106lyg:Stage3Member2023-12-310001160106lyg:PurchasedOrOriginatedCreditimpairedMember2023-12-310001160106lyg:LoansAndAdvancesToBanksMemberlyg:Stage1Member2022-01-012022-12-310001160106lyg:Stage2Memberlyg:LoansAndAdvancesToBanksMember2022-01-012022-12-310001160106lyg:Stage3Memberlyg:LoansAndAdvancesToBanksMember2022-01-012022-12-310001160106lyg:LoansAndAdvancesToBanksMemberlyg:PurchasedOrOriginatedCreditimpairedMember2022-01-012022-12-310001160106lyg:LoansAndAdvancesToBanksMember2022-01-012022-12-310001160106lyg:LoansAndAdvancesToCustomersMemberlyg:Stage1Member2022-01-012022-12-310001160106lyg:Stage2Memberlyg:LoansAndAdvancesToCustomersMember2022-01-012022-12-310001160106lyg:Stage3Memberlyg:LoansAndAdvancesToCustomersMember2022-01-012022-12-310001160106lyg:LoansAndAdvancesToCustomersMemberlyg:PurchasedOrOriginatedCreditimpairedMember2022-01-012022-12-310001160106lyg:LoansAndAdvancesToCustomersMember2022-01-012022-12-310001160106ifrs-full:FinancialAssetsAtAmortisedCostCategoryMemberifrs-full:DebtSecuritiesMemberlyg:Stage1Member2022-01-012022-12-310001160106lyg:Stage2Memberifrs-full:FinancialAssetsAtAmortisedCostCategoryMemberifrs-full:DebtSecuritiesMember2022-01-012022-12-310001160106lyg:Stage3Memberifrs-full:FinancialAssetsAtAmortisedCostCategoryMemberifrs-full:DebtSecuritiesMember2022-01-012022-12-310001160106ifrs-full:FinancialAssetsAtAmortisedCostCategoryMemberifrs-full:DebtSecuritiesMemberlyg:PurchasedOrOriginatedCreditimpairedMember2022-01-012022-12-310001160106ifrs-full:FinancialAssetsAtAmortisedCostCategoryMemberifrs-full:DebtSecuritiesMember2022-01-012022-12-310001160106ifrs-full:FinancialAssetsAtAmortisedCostCategoryMemberlyg:Stage1Member2022-01-012022-12-310001160106lyg:Stage2Memberifrs-full:FinancialAssetsAtAmortisedCostCategoryMember2022-01-012022-12-310001160106lyg:Stage3Memberifrs-full:FinancialAssetsAtAmortisedCostCategoryMember2022-01-012022-12-310001160106ifrs-full:FinancialAssetsAtAmortisedCostCategoryMemberlyg:PurchasedOrOriginatedCreditimpairedMember2022-01-012022-12-310001160106ifrs-full:FinancialAssetsAtAmortisedCostCategoryMember2022-01-012022-12-310001160106lyg:Stage1Member2022-01-012022-12-310001160106lyg:Stage2Member2022-01-012022-12-310001160106lyg:Stage3Member2022-01-012022-12-310001160106lyg:PurchasedOrOriginatedCreditimpairedMember2022-01-012022-12-310001160106lyg:Stage1Member2022-12-310001160106lyg:Stage2Member2022-12-310001160106lyg:Stage3Member2022-12-310001160106lyg:PurchasedOrOriginatedCreditimpairedMember2022-12-310001160106lyg:LoansAndAdvancesToBanksMemberlyg:Stage1Member2021-01-012021-12-310001160106lyg:Stage2Memberlyg:LoansAndAdvancesToBanksMember2021-01-012021-12-310001160106lyg:Stage3Memberlyg:LoansAndAdvancesToBanksMember2021-01-012021-12-310001160106lyg:LoansAndAdvancesToBanksMemberlyg:PurchasedOrOriginatedCreditimpairedMember2021-01-012021-12-310001160106lyg:LoansAndAdvancesToBanksMember2021-01-012021-12-310001160106lyg:LoansAndAdvancesToCustomersMemberlyg:Stage1Member2021-01-012021-12-310001160106lyg:Stage2Memberlyg:LoansAndAdvancesToCustomersMember2021-01-012021-12-310001160106lyg:Stage3Memberlyg:LoansAndAdvancesToCustomersMember2021-01-012021-12-310001160106lyg:LoansAndAdvancesToCustomersMemberlyg:PurchasedOrOriginatedCreditimpairedMember2021-01-012021-12-310001160106lyg:LoansAndAdvancesToCustomersMember2021-01-012021-12-310001160106ifrs-full:FinancialAssetsAtAmortisedCostCategoryMemberifrs-full:DebtSecuritiesMemberlyg:Stage1Member2021-01-012021-12-310001160106lyg:Stage2Memberifrs-full:FinancialAssetsAtAmortisedCostCategoryMemberifrs-full:DebtSecuritiesMember2021-01-012021-12-310001160106lyg:Stage3Memberifrs-full:FinancialAssetsAtAmortisedCostCategoryMemberifrs-full:DebtSecuritiesMember2021-01-012021-12-310001160106ifrs-full:FinancialAssetsAtAmortisedCostCategoryMemberifrs-full:DebtSecuritiesMemberlyg:PurchasedOrOriginatedCreditimpairedMember2021-01-012021-12-310001160106ifrs-full:FinancialAssetsAtAmortisedCostCategoryMemberifrs-full:DebtSecuritiesMember2021-01-012021-12-310001160106ifrs-full:FinancialAssetsAtAmortisedCostCategoryMemberlyg:Stage1Member2021-01-012021-12-310001160106lyg:Stage2Memberifrs-full:FinancialAssetsAtAmortisedCostCategoryMember2021-01-012021-12-310001160106lyg:Stage3Memberifrs-full:FinancialAssetsAtAmortisedCostCategoryMember2021-01-012021-12-310001160106ifrs-full:FinancialAssetsAtAmortisedCostCategoryMemberlyg:PurchasedOrOriginatedCreditimpairedMember2021-01-012021-12-310001160106ifrs-full:FinancialAssetsAtAmortisedCostCategoryMember2021-01-012021-12-310001160106lyg:Stage1Member2021-01-012021-12-310001160106lyg:Stage2Member2021-01-012021-12-310001160106lyg:Stage3Member2021-01-012021-12-310001160106lyg:PurchasedOrOriginatedCreditimpairedMember2021-01-012021-12-310001160106lyg:Stage1Member2021-12-310001160106lyg:Stage2Member2021-12-310001160106lyg:Stage3Member2021-12-310001160106lyg:PurchasedOrOriginatedCreditimpairedMember2021-12-310001160106lyg:UKCorporationTaxMember2023-01-012023-12-310001160106lyg:UKCorporationTaxMember2022-01-012022-12-310001160106lyg:UKCorporationTaxMember2021-01-012021-12-310001160106lyg:ForeignTaxMember2023-01-012023-12-310001160106lyg:ForeignTaxMember2022-01-012022-12-310001160106lyg:ForeignTaxMember2021-01-012021-12-310001160106lyg:DeferredTaxMember2023-01-012023-12-310001160106lyg:DeferredTaxMember2022-01-012022-12-310001160106lyg:DeferredTaxMember2021-01-012021-12-310001160106lyg:UKCorporationTaxMember2023-01-012023-12-310001160106lyg:UKCorporationTaxMember2022-01-012022-12-310001160106lyg:UKCorporationTaxMember2021-01-012021-12-310001160106srt:ScenarioForecastMember2024-01-012024-12-310001160106lyg:StatutoryPositionMember2023-12-310001160106lyg:StatutoryPositionMember2022-12-310001160106lyg:TaxDisclosureMember2023-12-310001160106lyg:TaxDisclosureMember2022-12-310001160106lyg:PriorToOffsettingOfBalancesWithinSameTaxingJurisdictionMemberlyg:TaxLossesMember2021-12-310001160106ifrs-full:PropertyPlantAndEquipmentMemberlyg:PriorToOffsettingOfBalancesWithinSameTaxingJurisdictionMember2021-12-310001160106ifrs-full:OtherProvisionsMemberlyg:PriorToOffsettingOfBalancesWithinSameTaxingJurisdictionMember2021-12-310001160106lyg:LongtermAssuranceBusinessAdjustmentMemberlyg:PriorToOffsettingOfBalancesWithinSameTaxingJurisdictionMember2021-12-310001160106lyg:PriorToOffsettingOfBalancesWithinSameTaxingJurisdictionMemberifrs-full:SharebasedPaymentArrangementsMember2021-12-310001160106ifrs-full:PensionDefinedBenefitPlansMemberlyg:PriorToOffsettingOfBalancesWithinSameTaxingJurisdictionMember2021-12-310001160106ifrs-full:DerivativesMemberlyg:PriorToOffsettingOfBalancesWithinSameTaxingJurisdictionMember2021-12-310001160106lyg:PriorToOffsettingOfBalancesWithinSameTaxingJurisdictionMemberlyg:RevaluationOfAssets2Member2021-12-310001160106ifrs-full:OtherTemporaryDifferencesMemberlyg:PriorToOffsettingOfBalancesWithinSameTaxingJurisdictionMember2021-12-310001160106lyg:PriorToOffsettingOfBalancesWithinSameTaxingJurisdictionMember2021-12-310001160106lyg:PriorToOffsettingOfBalancesWithinSameTaxingJurisdictionMemberlyg:TaxLossesMember2022-01-012022-12-310001160106ifrs-full:PropertyPlantAndEquipmentMemberlyg:PriorToOffsettingOfBalancesWithinSameTaxingJurisdictionMember2022-01-012022-12-310001160106ifrs-full:OtherProvisionsMemberlyg:PriorToOffsettingOfBalancesWithinSameTaxingJurisdictionMember2022-01-012022-12-310001160106lyg:LongtermAssuranceBusinessAdjustmentMemberlyg:PriorToOffsettingOfBalancesWithinSameTaxingJurisdictionMember2022-01-012022-12-310001160106lyg:PriorToOffsettingOfBalancesWithinSameTaxingJurisdictionMemberifrs-full:SharebasedPaymentArrangementsMember2022-01-012022-12-310001160106ifrs-full:PensionDefinedBenefitPlansMemberlyg:PriorToOffsettingOfBalancesWithinSameTaxingJurisdictionMember2022-01-012022-12-310001160106ifrs-full:DerivativesMemberlyg:PriorToOffsettingOfBalancesWithinSameTaxingJurisdictionMember2022-01-012022-12-310001160106lyg:PriorToOffsettingOfBalancesWithinSameTaxingJurisdictionMemberlyg:RevaluationOfAssets2Member2022-01-012022-12-310001160106ifrs-full:OtherTemporaryDifferencesMemberlyg:PriorToOffsettingOfBalancesWithinSameTaxingJurisdictionMember2022-01-012022-12-310001160106lyg:PriorToOffsettingOfBalancesWithinSameTaxingJurisdictionMember2022-01-012022-12-310001160106lyg:PriorToOffsettingOfBalancesWithinSameTaxingJurisdictionMemberlyg:TaxLossesMember2022-12-310001160106ifrs-full:PropertyPlantAndEquipmentMemberlyg:PriorToOffsettingOfBalancesWithinSameTaxingJurisdictionMember2022-12-310001160106ifrs-full:OtherProvisionsMemberlyg:PriorToOffsettingOfBalancesWithinSameTaxingJurisdictionMember2022-12-310001160106lyg:LongtermAssuranceBusinessAdjustmentMemberlyg:PriorToOffsettingOfBalancesWithinSameTaxingJurisdictionMember2022-12-310001160106lyg:PriorToOffsettingOfBalancesWithinSameTaxingJurisdictionMemberifrs-full:SharebasedPaymentArrangementsMember2022-12-310001160106ifrs-full:PensionDefinedBenefitPlansMemberlyg:PriorToOffsettingOfBalancesWithinSameTaxingJurisdictionMember2022-12-310001160106ifrs-full:DerivativesMemberlyg:PriorToOffsettingOfBalancesWithinSameTaxingJurisdictionMember2022-12-310001160106lyg:PriorToOffsettingOfBalancesWithinSameTaxingJurisdictionMemberlyg:RevaluationOfAssets2Member2022-12-310001160106ifrs-full:OtherTemporaryDifferencesMemberlyg:PriorToOffsettingOfBalancesWithinSameTaxingJurisdictionMember2022-12-310001160106lyg:PriorToOffsettingOfBalancesWithinSameTaxingJurisdictionMember2022-12-310001160106lyg:PriorToOffsettingOfBalancesWithinSameTaxingJurisdictionMemberlyg:TaxLossesMember2023-01-012023-12-310001160106ifrs-full:PropertyPlantAndEquipmentMemberlyg:PriorToOffsettingOfBalancesWithinSameTaxingJurisdictionMember2023-01-012023-12-310001160106ifrs-full:OtherProvisionsMemberlyg:PriorToOffsettingOfBalancesWithinSameTaxingJurisdictionMember2023-01-012023-12-310001160106lyg:LongtermAssuranceBusinessAdjustmentMemberlyg:PriorToOffsettingOfBalancesWithinSameTaxingJurisdictionMember2023-01-012023-12-310001160106lyg:PriorToOffsettingOfBalancesWithinSameTaxingJurisdictionMemberifrs-full:SharebasedPaymentArrangementsMember2023-01-012023-12-310001160106ifrs-full:PensionDefinedBenefitPlansMemberlyg:PriorToOffsettingOfBalancesWithinSameTaxingJurisdictionMember2023-01-012023-12-310001160106ifrs-full:DerivativesMemberlyg:PriorToOffsettingOfBalancesWithinSameTaxingJurisdictionMember2023-01-012023-12-310001160106lyg:PriorToOffsettingOfBalancesWithinSameTaxingJurisdictionMemberlyg:RevaluationOfAssets2Member2023-01-012023-12-310001160106ifrs-full:OtherTemporaryDifferencesMemberlyg:PriorToOffsettingOfBalancesWithinSameTaxingJurisdictionMember2023-01-012023-12-310001160106lyg:PriorToOffsettingOfBalancesWithinSameTaxingJurisdictionMember2023-01-012023-12-310001160106lyg:PriorToOffsettingOfBalancesWithinSameTaxingJurisdictionMemberlyg:TaxLossesMember2023-12-310001160106ifrs-full:PropertyPlantAndEquipmentMemberlyg:PriorToOffsettingOfBalancesWithinSameTaxingJurisdictionMember2023-12-310001160106ifrs-full:OtherProvisionsMemberlyg:PriorToOffsettingOfBalancesWithinSameTaxingJurisdictionMember2023-12-310001160106lyg:LongtermAssuranceBusinessAdjustmentMemberlyg:PriorToOffsettingOfBalancesWithinSameTaxingJurisdictionMember2023-12-310001160106lyg:PriorToOffsettingOfBalancesWithinSameTaxingJurisdictionMemberifrs-full:SharebasedPaymentArrangementsMember2023-12-310001160106ifrs-full:PensionDefinedBenefitPlansMemberlyg:PriorToOffsettingOfBalancesWithinSameTaxingJurisdictionMember2023-12-310001160106ifrs-full:DerivativesMemberlyg:PriorToOffsettingOfBalancesWithinSameTaxingJurisdictionMember2023-12-310001160106lyg:PriorToOffsettingOfBalancesWithinSameTaxingJurisdictionMemberlyg:RevaluationOfAssets2Member2023-12-310001160106ifrs-full:OtherTemporaryDifferencesMemberlyg:PriorToOffsettingOfBalancesWithinSameTaxingJurisdictionMember2023-12-310001160106lyg:PriorToOffsettingOfBalancesWithinSameTaxingJurisdictionMember2023-12-310001160106ifrs-full:ComputerSoftwareMemberlyg:PriorToOffsettingOfBalancesWithinSameTaxingJurisdictionMemberifrs-full:PreviouslyStatedMember2021-12-310001160106lyg:LongtermAssuranceBusinessAdjustmentMemberlyg:PriorToOffsettingOfBalancesWithinSameTaxingJurisdictionMemberifrs-full:PreviouslyStatedMember2021-12-310001160106lyg:AcquisitionFairValueMemberlyg:PriorToOffsettingOfBalancesWithinSameTaxingJurisdictionMemberifrs-full:PreviouslyStatedMember2021-12-310001160106lyg:PensionAssetsMemberlyg:PriorToOffsettingOfBalancesWithinSameTaxingJurisdictionMemberifrs-full:PreviouslyStatedMember2021-12-310001160106ifrs-full:DerivativesMemberlyg:PriorToOffsettingOfBalancesWithinSameTaxingJurisdictionMemberifrs-full:PreviouslyStatedMember2021-12-310001160106lyg:PriorToOffsettingOfBalancesWithinSameTaxingJurisdictionMemberlyg:RevaluationOfAssets2Memberifrs-full:PreviouslyStatedMember2021-12-310001160106ifrs-full:OtherTemporaryDifferencesMemberlyg:PriorToOffsettingOfBalancesWithinSameTaxingJurisdictionMemberifrs-full:PreviouslyStatedMember2021-12-310001160106lyg:PriorToOffsettingOfBalancesWithinSameTaxingJurisdictionMemberifrs-full:PreviouslyStatedMember2021-12-310001160106ifrs-full:ComputerSoftwareMemberifrs-full:IncreaseDecreaseDueToChangesInAccountingPolicyRequiredByIFRSsMemberlyg:PriorToOffsettingOfBalancesWithinSameTaxingJurisdictionMember2021-12-310001160106lyg:LongtermAssuranceBusinessAdjustmentMemberifrs-full:IncreaseDecreaseDueToChangesInAccountingPolicyRequiredByIFRSsMemberlyg:PriorToOffsettingOfBalancesWithinSameTaxingJurisdictionMember2021-12-310001160106lyg:AcquisitionFairValueMemberifrs-full:IncreaseDecreaseDueToChangesInAccountingPolicyRequiredByIFRSsMemberlyg:PriorToOffsettingOfBalancesWithinSameTaxingJurisdictionMember2021-12-310001160106lyg:PensionAssetsMemberifrs-full:IncreaseDecreaseDueToChangesInAccountingPolicyRequiredByIFRSsMemberlyg:PriorToOffsettingOfBalancesWithinSameTaxingJurisdictionMember2021-12-310001160106ifrs-full:DerivativesMemberifrs-full:IncreaseDecreaseDueToChangesInAccountingPolicyRequiredByIFRSsMemberlyg:PriorToOffsettingOfBalancesWithinSameTaxingJurisdictionMember2021-12-310001160106ifrs-full:IncreaseDecreaseDueToChangesInAccountingPolicyRequiredByIFRSsMemberlyg:PriorToOffsettingOfBalancesWithinSameTaxingJurisdictionMemberlyg:RevaluationOfAssets2Member2021-12-310001160106ifrs-full:OtherTemporaryDifferencesMemberifrs-full:IncreaseDecreaseDueToChangesInAccountingPolicyRequiredByIFRSsMemberlyg:PriorToOffsettingOfBalancesWithinSameTaxingJurisdictionMember2021-12-310001160106ifrs-full:IncreaseDecreaseDueToChangesInAccountingPolicyRequiredByIFRSsMemberlyg:PriorToOffsettingOfBalancesWithinSameTaxingJurisdictionMember2021-12-310001160106ifrs-full:ComputerSoftwareMemberlyg:PriorToOffsettingOfBalancesWithinSameTaxingJurisdictionMember2021-12-310001160106lyg:AcquisitionFairValueMemberlyg:PriorToOffsettingOfBalancesWithinSameTaxingJurisdictionMember2021-12-310001160106lyg:PensionAssetsMemberlyg:PriorToOffsettingOfBalancesWithinSameTaxingJurisdictionMember2021-12-310001160106ifrs-full:ComputerSoftwareMemberlyg:PriorToOffsettingOfBalancesWithinSameTaxingJurisdictionMember2022-01-012022-12-310001160106lyg:AcquisitionFairValueMemberlyg:PriorToOffsettingOfBalancesWithinSameTaxingJurisdictionMember2022-01-012022-12-310001160106lyg:PensionAssetsMemberlyg:PriorToOffsettingOfBalancesWithinSameTaxingJurisdictionMember2022-01-012022-12-310001160106ifrs-full:ComputerSoftwareMemberlyg:PriorToOffsettingOfBalancesWithinSameTaxingJurisdictionMember2022-12-310001160106lyg:AcquisitionFairValueMemberlyg:PriorToOffsettingOfBalancesWithinSameTaxingJurisdictionMember2022-12-310001160106lyg:PensionAssetsMemberlyg:PriorToOffsettingOfBalancesWithinSameTaxingJurisdictionMember2022-12-310001160106ifrs-full:ComputerSoftwareMemberlyg:PriorToOffsettingOfBalancesWithinSameTaxingJurisdictionMember2023-01-012023-12-310001160106lyg:AcquisitionFairValueMemberlyg:PriorToOffsettingOfBalancesWithinSameTaxingJurisdictionMember2023-01-012023-12-310001160106lyg:PensionAssetsMemberlyg:PriorToOffsettingOfBalancesWithinSameTaxingJurisdictionMember2023-01-012023-12-310001160106ifrs-full:OtherTemporaryDifferencesMember2023-01-012023-12-310001160106ifrs-full:ComputerSoftwareMemberlyg:PriorToOffsettingOfBalancesWithinSameTaxingJurisdictionMember2023-12-310001160106lyg:AcquisitionFairValueMemberlyg:PriorToOffsettingOfBalancesWithinSameTaxingJurisdictionMember2023-12-310001160106lyg:PensionAssetsMemberlyg:PriorToOffsettingOfBalancesWithinSameTaxingJurisdictionMember2023-12-310001160106lyg:RecognisedInRespectOfFutureTaxBenefitMember2023-12-310001160106lyg:RecognisedInRespectOfFutureTaxBenefitMember2022-12-310001160106lyg:LifeAssuranceMember2023-12-310001160106lyg:LifeAssuranceMember2022-12-310001160106lyg:UKMember2023-12-310001160106lyg:UKMember2022-12-310001160106lyg:UKMember2023-01-012023-12-310001160106lyg:TradingLossesMemberlyg:Duration20YearsMember2023-12-310001160106lyg:TradingLossesMemberlyg:Duration20YearsMember2022-12-310001160106lyg:TradingLossesMemberlyg:Duration20YearsMember2023-01-012023-12-310001160106lyg:TradingLossesMemberlyg:TradingLossesMember2023-12-310001160106lyg:TradingLossesMemberlyg:TradingLossesMember2022-12-310001160106ifrs-full:LegalProceedingsContingentLiabilityMember2023-01-012023-12-310001160106lyg:HeldAtAmortisedCostMember2023-12-310001160106lyg:MandatorilyHeldAtFairValueThroughProfitOrLossMemberlyg:HeldForTradingAtFairValueThroughProfitOrLossMember2023-12-310001160106lyg:MandatorilyHeldAtFairValueThroughProfitOrLossMemberlyg:OtherMember2023-12-310001160106lyg:DerivativesDesignatedAsHedgingInstrumentsMember2023-12-310001160106lyg:AtFairValueThroughOtherComprehensiveIncomeMember2023-12-310001160106ifrs-full:InsuranceContractsMember20172023-12-310001160106lyg:DesignatedAtFairValueThroughProfitOrLossMember2023-12-310001160106lyg:HeldAtAmortisedCostMember2022-12-310001160106lyg:MandatorilyHeldAtFairValueThroughProfitOrLossMemberlyg:HeldForTradingAtFairValueThroughProfitOrLossMember2022-12-310001160106lyg:MandatorilyHeldAtFairValueThroughProfitOrLossMemberlyg:OtherMember2022-12-310001160106lyg:DerivativesDesignatedAsHedgingInstrumentsMember2022-12-310001160106lyg:AtFairValueThroughOtherComprehensiveIncomeMember2022-12-310001160106ifrs-full:InsuranceContractsMember20172022-12-310001160106lyg:DesignatedAtFairValueThroughProfitOrLossMember2022-12-310001160106lyg:FinancialAssetsExcludingDerivativesMember2023-12-310001160106lyg:FinancialAssetsExcludingDerivativesMember2022-12-310001160106ifrs-full:Level1OfFairValueHierarchyMemberifrs-full:FinancialAssetsAtFairValueThroughProfitOrLossClassifiedAsHeldForTradingCategoryMember2023-12-310001160106ifrs-full:FinancialAssetsAtFairValueThroughProfitOrLossClassifiedAsHeldForTradingCategoryMemberifrs-full:Level2OfFairValueHierarchyMember2023-12-310001160106ifrs-full:Level3OfFairValueHierarchyMemberifrs-full:FinancialAssetsAtFairValueThroughProfitOrLossClassifiedAsHeldForTradingCategoryMember2023-12-310001160106ifrs-full:FinancialAssetsAtFairValueThroughProfitOrLossClassifiedAsHeldForTradingCategoryMember2023-12-310001160106ifrs-full:Level1OfFairValueHierarchyMember2023-12-310001160106ifrs-full:Level2OfFairValueHierarchyMember2023-12-310001160106ifrs-full:Level3OfFairValueHierarchyMember2023-12-310001160106ifrs-full:FinancialAssetsAtFairValueThroughProfitOrLossMandatorilyMeasuredAtFairValueCategoryMemberifrs-full:Level1OfFairValueHierarchyMember2023-12-310001160106ifrs-full:FinancialAssetsAtFairValueThroughProfitOrLossMandatorilyMeasuredAtFairValueCategoryMemberifrs-full:Level2OfFairValueHierarchyMember2023-12-310001160106ifrs-full:FinancialAssetsAtFairValueThroughProfitOrLossMandatorilyMeasuredAtFairValueCategoryMemberifrs-full:Level3OfFairValueHierarchyMember2023-12-310001160106ifrs-full:FinancialAssetsAtFairValueThroughProfitOrLossMandatorilyMeasuredAtFairValueCategoryMember2023-12-310001160106ifrs-full:Level1OfFairValueHierarchyMemberifrs-full:FinancialAssetsAtFairValueThroughOtherComprehensiveIncomeCategoryMember2023-12-310001160106ifrs-full:FinancialAssetsAtFairValueThroughOtherComprehensiveIncomeCategoryMemberifrs-full:Level2OfFairValueHierarchyMember2023-12-310001160106ifrs-full:Level3OfFairValueHierarchyMemberifrs-full:FinancialAssetsAtFairValueThroughOtherComprehensiveIncomeCategoryMember2023-12-310001160106ifrs-full:FinancialAssetsAtFairValueThroughOtherComprehensiveIncomeCategoryMember2023-12-310001160106ifrs-full:Level1OfFairValueHierarchyMemberlyg:FinancialAssetsExcludingDerivativesMember2023-12-310001160106lyg:FinancialAssetsExcludingDerivativesMemberifrs-full:Level2OfFairValueHierarchyMember2023-12-310001160106ifrs-full:Level3OfFairValueHierarchyMemberlyg:FinancialAssetsExcludingDerivativesMember2023-12-310001160106ifrs-full:InsuranceContractsIssuedMember2023-12-310001160106lyg:CollectiveInvestmentVehiclesAndLimitedPartnershipsMember2023-01-012023-12-310001160106ifrs-full:Level1OfFairValueHierarchyMemberifrs-full:FinancialAssetsAtFairValueThroughProfitOrLossClassifiedAsHeldForTradingCategoryMember2022-12-310001160106ifrs-full:FinancialAssetsAtFairValueThroughProfitOrLossClassifiedAsHeldForTradingCategoryMemberifrs-full:Level2OfFairValueHierarchyMember2022-12-310001160106ifrs-full:Level3OfFairValueHierarchyMemberifrs-full:FinancialAssetsAtFairValueThroughProfitOrLossClassifiedAsHeldForTradingCategoryMember2022-12-310001160106ifrs-full:FinancialAssetsAtFairValueThroughProfitOrLossClassifiedAsHeldForTradingCategoryMember2022-12-310001160106ifrs-full:FinancialAssetsAtFairValueThroughProfitOrLossCategoryMemberifrs-full:Level1OfFairValueHierarchyMember2022-12-310001160106ifrs-full:FinancialAssetsAtFairValueThroughProfitOrLossCategoryMemberifrs-full:Level2OfFairValueHierarchyMember2022-12-310001160106ifrs-full:FinancialAssetsAtFairValueThroughProfitOrLossCategoryMemberifrs-full:Level3OfFairValueHierarchyMember2022-12-310001160106ifrs-full:FinancialAssetsAtFairValueThroughProfitOrLossMandatorilyMeasuredAtFairValueCategoryMemberifrs-full:Level1OfFairValueHierarchyMember2022-12-310001160106ifrs-full:FinancialAssetsAtFairValueThroughProfitOrLossMandatorilyMeasuredAtFairValueCategoryMemberifrs-full:Level2OfFairValueHierarchyMember2022-12-310001160106ifrs-full:FinancialAssetsAtFairValueThroughProfitOrLossMandatorilyMeasuredAtFairValueCategoryMemberifrs-full:Level3OfFairValueHierarchyMember2022-12-310001160106ifrs-full:FinancialAssetsAtFairValueThroughProfitOrLossMandatorilyMeasuredAtFairValueCategoryMember2022-12-310001160106ifrs-full:Level1OfFairValueHierarchyMember2022-12-310001160106ifrs-full:Level2OfFairValueHierarchyMember2022-12-310001160106ifrs-full:Level3OfFairValueHierarchyMember2022-12-310001160106ifrs-full:Level1OfFairValueHierarchyMemberifrs-full:FinancialAssetsAtFairValueThroughOtherComprehensiveIncomeCategoryMember2022-12-310001160106ifrs-full:FinancialAssetsAtFairValueThroughOtherComprehensiveIncomeCategoryMemberifrs-full:Level2OfFairValueHierarchyMember2022-12-310001160106ifrs-full:Level3OfFairValueHierarchyMemberifrs-full:FinancialAssetsAtFairValueThroughOtherComprehensiveIncomeCategoryMember2022-12-310001160106ifrs-full:FinancialAssetsAtFairValueThroughOtherComprehensiveIncomeCategoryMember2022-12-310001160106ifrs-full:Level1OfFairValueHierarchyMemberlyg:FinancialAssetsExcludingDerivativesMember2022-12-310001160106lyg:FinancialAssetsExcludingDerivativesMemberifrs-full:Level2OfFairValueHierarchyMember2022-12-310001160106ifrs-full:Level3OfFairValueHierarchyMemberlyg:FinancialAssetsExcludingDerivativesMember2022-12-310001160106ifrs-full:InsuranceContractsIssuedMember2022-12-310001160106lyg:CollectiveInvestmentVehiclesAndLimitedPartnershipsMember2022-01-012022-12-310001160106ifrs-full:FinancialAssetsAtFairValueThroughProfitOrLossCategoryMemberifrs-full:Level3OfFairValueHierarchyMember2021-12-310001160106ifrs-full:Level3OfFairValueHierarchyMemberifrs-full:FinancialAssetsAtFairValueThroughOtherComprehensiveIncomeCategoryMember2021-12-310001160106ifrs-full:Level3OfFairValueHierarchyMemberlyg:FinancialAssetsExcludingDerivativesMember2021-12-310001160106ifrs-full:FinancialAssetsAtFairValueThroughProfitOrLossCategoryMemberifrs-full:Level3OfFairValueHierarchyMember2023-01-012023-12-310001160106ifrs-full:Level3OfFairValueHierarchyMemberifrs-full:FinancialAssetsAtFairValueThroughOtherComprehensiveIncomeCategoryMember2023-01-012023-12-310001160106ifrs-full:Level3OfFairValueHierarchyMemberlyg:FinancialAssetsExcludingDerivativesMember2023-01-012023-12-310001160106ifrs-full:FinancialAssetsAtFairValueThroughProfitOrLossCategoryMemberifrs-full:Level3OfFairValueHierarchyMember2022-01-012022-12-310001160106ifrs-full:Level3OfFairValueHierarchyMemberifrs-full:FinancialAssetsAtFairValueThroughOtherComprehensiveIncomeCategoryMember2022-01-012022-12-310001160106ifrs-full:Level3OfFairValueHierarchyMemberlyg:FinancialAssetsExcludingDerivativesMember2022-01-012022-12-310001160106ifrs-full:FinancialAssetsAtFairValueThroughProfitOrLossCategoryMemberifrs-full:Level3OfFairValueHierarchyMember2023-12-310001160106ifrs-full:Level1OfFairValueHierarchyMemberlyg:SecuritiesSoldUnderAgreementsToRepurchase1Member2023-12-310001160106ifrs-full:Level2OfFairValueHierarchyMemberlyg:SecuritiesSoldUnderAgreementsToRepurchase1Member2023-12-310001160106ifrs-full:Level3OfFairValueHierarchyMemberlyg:SecuritiesSoldUnderAgreementsToRepurchase1Member2023-12-310001160106lyg:SecuritiesSoldUnderAgreementsToRepurchase1Member2023-12-310001160106ifrs-full:Level1OfFairValueHierarchyMemberlyg:ShortPositionsInSecurities1Member2023-12-310001160106ifrs-full:Level2OfFairValueHierarchyMemberlyg:ShortPositionsInSecurities1Member2023-12-310001160106ifrs-full:Level3OfFairValueHierarchyMemberlyg:ShortPositionsInSecurities1Member2023-12-310001160106lyg:ShortPositionsInSecurities1Member2023-12-310001160106ifrs-full:Level1OfFairValueHierarchyMemberifrs-full:DebtSecuritiesMember2023-12-310001160106ifrs-full:Level2OfFairValueHierarchyMemberifrs-full:DebtSecuritiesMember2023-12-310001160106ifrs-full:Level3OfFairValueHierarchyMemberifrs-full:DebtSecuritiesMember2023-12-310001160106ifrs-full:DebtSecuritiesMember2023-12-310001160106lyg:OtherFinancialLiabilitiesMemberifrs-full:Level1OfFairValueHierarchyMember2023-12-310001160106lyg:OtherFinancialLiabilitiesMemberifrs-full:Level2OfFairValueHierarchyMember2023-12-310001160106lyg:OtherFinancialLiabilitiesMemberifrs-full:Level3OfFairValueHierarchyMember2023-12-310001160106lyg:OtherFinancialLiabilitiesMember2023-12-310001160106ifrs-full:Level1OfFairValueHierarchyMemberlyg:SecuritiesSoldUnderAgreementsToRepurchase1Member2022-12-310001160106ifrs-full:Level2OfFairValueHierarchyMemberlyg:SecuritiesSoldUnderAgreementsToRepurchase1Member2022-12-310001160106ifrs-full:Level3OfFairValueHierarchyMemberlyg:SecuritiesSoldUnderAgreementsToRepurchase1Member2022-12-310001160106lyg:SecuritiesSoldUnderAgreementsToRepurchase1Member2022-12-310001160106ifrs-full:Level1OfFairValueHierarchyMemberlyg:ShortPositionsInSecurities1Member2022-12-310001160106ifrs-full:Level2OfFairValueHierarchyMemberlyg:ShortPositionsInSecurities1Member2022-12-310001160106ifrs-full:Level3OfFairValueHierarchyMemberlyg:ShortPositionsInSecurities1Member2022-12-310001160106lyg:ShortPositionsInSecurities1Member2022-12-310001160106ifrs-full:Level1OfFairValueHierarchyMemberifrs-full:DebtSecuritiesMember2022-12-310001160106ifrs-full:Level2OfFairValueHierarchyMemberifrs-full:DebtSecuritiesMember2022-12-310001160106ifrs-full:Level3OfFairValueHierarchyMemberifrs-full:DebtSecuritiesMember2022-12-310001160106ifrs-full:DebtSecuritiesMember2022-12-310001160106lyg:OtherFinancialLiabilitiesMemberifrs-full:Level1OfFairValueHierarchyMember2022-12-310001160106lyg:OtherFinancialLiabilitiesMemberifrs-full:Level2OfFairValueHierarchyMember2022-12-310001160106lyg:OtherFinancialLiabilitiesMemberifrs-full:Level3OfFairValueHierarchyMember2022-12-310001160106lyg:OtherFinancialLiabilitiesMember2022-12-310001160106ifrs-full:Level3OfFairValueHierarchyMemberlyg:ExcludingDerivativesMember2022-12-310001160106ifrs-full:Level3OfFairValueHierarchyMemberlyg:ExcludingDerivativesMember2021-12-310001160106ifrs-full:Level3OfFairValueHierarchyMemberlyg:ExcludingDerivativesMember2023-01-012023-12-310001160106ifrs-full:Level3OfFairValueHierarchyMemberlyg:ExcludingDerivativesMember2022-01-012022-12-310001160106ifrs-full:Level3OfFairValueHierarchyMemberlyg:ExcludingDerivativesMember2023-12-310001160106ifrs-full:Level3OfFairValueHierarchyMemberlyg:DerivativeAssetsMember2022-12-310001160106ifrs-full:Level3OfFairValueHierarchyMemberlyg:DerivativeLiabilitiesMember2022-12-310001160106ifrs-full:Level3OfFairValueHierarchyMemberlyg:DerivativeAssetsMember2021-12-310001160106ifrs-full:Level3OfFairValueHierarchyMemberlyg:DerivativeLiabilitiesMember2021-12-310001160106ifrs-full:Level3OfFairValueHierarchyMemberlyg:DerivativeAssetsMember2023-01-012023-12-310001160106ifrs-full:Level3OfFairValueHierarchyMemberlyg:DerivativeLiabilitiesMember2023-01-012023-12-310001160106ifrs-full:Level3OfFairValueHierarchyMemberlyg:DerivativeAssetsMember2022-01-012022-12-310001160106ifrs-full:Level3OfFairValueHierarchyMemberlyg:DerivativeLiabilitiesMember2022-01-012022-12-310001160106ifrs-full:Level3OfFairValueHierarchyMemberlyg:DerivativeAssetsMember2023-12-310001160106ifrs-full:Level3OfFairValueHierarchyMemberlyg:DerivativeLiabilitiesMember2023-12-310001160106ifrs-full:Level3OfFairValueHierarchyMemberlyg:OtherIncome1Memberlyg:DerivativeAssetsMember2023-01-012023-12-310001160106ifrs-full:Level3OfFairValueHierarchyMemberlyg:OtherIncome1Memberlyg:DerivativeLiabilitiesMember2023-01-012023-12-310001160106ifrs-full:Level3OfFairValueHierarchyMemberlyg:OtherIncome1Memberlyg:DerivativeAssetsMember2022-01-012022-12-310001160106ifrs-full:Level3OfFairValueHierarchyMemberlyg:OtherIncome1Memberlyg:DerivativeLiabilitiesMember2022-01-012022-12-310001160106lyg:CreditValuationAdjustmentMember2023-12-310001160106lyg:CreditValuationAdjustmentMember2022-12-310001160106lyg:DebitValuationAdjustmentMember2023-12-310001160106lyg:DebitValuationAdjustmentMember2022-12-310001160106lyg:FundingValuationAdjustmentMember2023-12-310001160106lyg:FundingValuationAdjustmentMember2022-12-310001160106lyg:CVAMember2023-01-012023-12-310001160106lyg:DVAMemberifrs-full:BottomOfRangeMember2023-01-012023-12-310001160106ifrs-full:BottomOfRangeMember2023-01-012023-12-310001160106ifrs-full:TopOfRangeMember2023-01-012023-12-310001160106lyg:FundingValuationAdjustmentMember2023-01-012023-12-310001160106ifrs-full:FinancialAssetsAtFairValueThroughProfitOrLossCategoryMemberlyg:InterestRateSpreadsMembersrt:MinimumMember2023-12-310001160106ifrs-full:FinancialAssetsAtFairValueThroughProfitOrLossCategoryMemberlyg:InterestRateSpreadsMembersrt:MaximumMember2023-12-310001160106ifrs-full:FinancialAssetsAtFairValueThroughProfitOrLossCategoryMemberifrs-full:GrossCarryingAmountMember2023-12-310001160106ifrs-full:FinancialAssetsAtFairValueThroughProfitOrLossCategoryMemberlyg:FavourableChangesMember2023-12-310001160106ifrs-full:FinancialAssetsAtFairValueThroughProfitOrLossCategoryMemberlyg:UnfavourableChangesMember2023-12-310001160106ifrs-full:FinancialAssetsAtFairValueThroughProfitOrLossCategoryMemberifrs-full:GrossCarryingAmountMember2022-12-310001160106ifrs-full:FinancialAssetsAtFairValueThroughProfitOrLossCategoryMemberlyg:FavourableChangesMember2022-12-310001160106ifrs-full:FinancialAssetsAtFairValueThroughProfitOrLossCategoryMemberlyg:UnfavourableChangesMember2022-12-310001160106ifrs-full:FinancialAssetsAtFairValueThroughProfitOrLossCategoryMembersrt:MaximumMemberlyg:CreditSpreadsMember2023-12-310001160106ifrs-full:FinancialAssetsAtFairValueThroughProfitOrLossCategoryMemberifrs-full:DiscountedCashFlowMemberifrs-full:GrossCarryingAmountMemberlyg:CreditSpreadsMember2023-12-310001160106ifrs-full:FinancialAssetsAtFairValueThroughProfitOrLossCategoryMemberlyg:FavourableChangesMemberifrs-full:DiscountedCashFlowMemberlyg:CreditSpreadsMember2023-12-310001160106ifrs-full:FinancialAssetsAtFairValueThroughProfitOrLossCategoryMemberifrs-full:DiscountedCashFlowMemberlyg:UnfavourableChangesMemberlyg:CreditSpreadsMember2023-12-310001160106ifrs-full:FinancialAssetsAtFairValueThroughProfitOrLossCategoryMemberifrs-full:DiscountedCashFlowMemberifrs-full:GrossCarryingAmountMemberlyg:CreditSpreadsMember2022-12-310001160106ifrs-full:FinancialAssetsAtFairValueThroughProfitOrLossCategoryMemberlyg:FavourableChangesMemberifrs-full:DiscountedCashFlowMemberlyg:CreditSpreadsMember2022-12-310001160106ifrs-full:FinancialAssetsAtFairValueThroughProfitOrLossCategoryMemberifrs-full:DiscountedCashFlowMemberlyg:UnfavourableChangesMemberlyg:CreditSpreadsMember2022-12-310001160106ifrs-full:FinancialAssetsAtFairValueThroughProfitOrLossCategoryMembersrt:MinimumMemberlyg:EarningsMultipleMember2023-12-310001160106ifrs-full:FinancialAssetsAtFairValueThroughProfitOrLossCategoryMembersrt:MaximumMemberlyg:EarningsMultipleMember2023-12-310001160106ifrs-full:FinancialAssetsAtFairValueThroughProfitOrLossCategoryMemberifrs-full:MarketApproachMemberifrs-full:GrossCarryingAmountMemberlyg:EarningsMultipleMember2023-12-310001160106ifrs-full:FinancialAssetsAtFairValueThroughProfitOrLossCategoryMemberlyg:FavourableChangesMemberifrs-full:MarketApproachMemberlyg:EarningsMultipleMember2023-12-310001160106ifrs-full:FinancialAssetsAtFairValueThroughProfitOrLossCategoryMemberifrs-full:MarketApproachMemberlyg:UnfavourableChangesMemberlyg:EarningsMultipleMember2023-12-310001160106ifrs-full:FinancialAssetsAtFairValueThroughProfitOrLossCategoryMemberifrs-full:MarketApproachMemberifrs-full:GrossCarryingAmountMemberlyg:EarningsMultipleMember2022-12-310001160106ifrs-full:FinancialAssetsAtFairValueThroughProfitOrLossCategoryMemberlyg:FavourableChangesMemberifrs-full:MarketApproachMemberlyg:EarningsMultipleMember2022-12-310001160106ifrs-full:FinancialAssetsAtFairValueThroughProfitOrLossCategoryMemberifrs-full:MarketApproachMemberlyg:UnfavourableChangesMemberlyg:EarningsMultipleMember2022-12-310001160106ifrs-full:FinancialAssetsAtFairValueThroughProfitOrLossCategoryMemberifrs-full:GrossCarryingAmountMemberlyg:UnderlyingAssetnetAssetValueinclPropertyPricesMember2023-12-310001160106ifrs-full:FinancialAssetsAtFairValueThroughProfitOrLossCategoryMemberlyg:FavourableChangesMemberlyg:UnderlyingAssetnetAssetValueinclPropertyPricesMember2023-12-310001160106ifrs-full:FinancialAssetsAtFairValueThroughProfitOrLossCategoryMemberlyg:UnfavourableChangesMemberlyg:UnderlyingAssetnetAssetValueinclPropertyPricesMember2023-12-310001160106ifrs-full:FinancialAssetsAtFairValueThroughProfitOrLossCategoryMemberifrs-full:GrossCarryingAmountMemberlyg:UnderlyingAssetnetAssetValueinclPropertyPricesMember2022-12-310001160106ifrs-full:FinancialAssetsAtFairValueThroughProfitOrLossCategoryMemberlyg:FavourableChangesMemberlyg:UnderlyingAssetnetAssetValueinclPropertyPricesMember2022-12-310001160106ifrs-full:FinancialAssetsAtFairValueThroughProfitOrLossCategoryMemberlyg:UnfavourableChangesMemberlyg:UnderlyingAssetnetAssetValueinclPropertyPricesMember2022-12-310001160106ifrs-full:FinancialAssetsAtFairValueThroughProfitOrLossCategoryMemberifrs-full:GrossCarryingAmountMemberlyg:BrokerQuotesMemberifrs-full:DiscountedCashFlowMemberlyg:UnderlyingAssetnetAssetValueinclPropertyPricesMember2023-12-310001160106ifrs-full:FinancialAssetsAtFairValueThroughProfitOrLossCategoryMemberlyg:FavourableChangesMemberlyg:BrokerQuotesMemberifrs-full:DiscountedCashFlowMemberlyg:UnderlyingAssetnetAssetValueinclPropertyPricesMember2023-12-310001160106ifrs-full:FinancialAssetsAtFairValueThroughProfitOrLossCategoryMemberlyg:UnfavourableChangesMemberlyg:BrokerQuotesMemberifrs-full:DiscountedCashFlowMemberlyg:UnderlyingAssetnetAssetValueinclPropertyPricesMember2023-12-310001160106ifrs-full:FinancialAssetsAtFairValueThroughProfitOrLossCategoryMemberifrs-full:GrossCarryingAmountMemberlyg:BrokerQuotesMemberifrs-full:DiscountedCashFlowMemberlyg:UnderlyingAssetnetAssetValueinclPropertyPricesMember2022-12-310001160106ifrs-full:FinancialAssetsAtFairValueThroughProfitOrLossCategoryMemberlyg:FavourableChangesMemberlyg:BrokerQuotesMemberifrs-full:DiscountedCashFlowMemberlyg:UnderlyingAssetnetAssetValueinclPropertyPricesMember2022-12-310001160106ifrs-full:FinancialAssetsAtFairValueThroughProfitOrLossCategoryMemberlyg:UnfavourableChangesMemberlyg:BrokerQuotesMemberifrs-full:DiscountedCashFlowMemberlyg:UnderlyingAssetnetAssetValueinclPropertyPricesMember2022-12-310001160106ifrs-full:FinancialAssetsAvailableforsaleCategoryMemberlyg:LeadManagerMemberifrs-full:GrossCarryingAmountMemberlyg:BrokerQuotesMemberifrs-full:ConsensusPricingMember2023-12-310001160106ifrs-full:FinancialAssetsAvailableforsaleCategoryMemberlyg:FavourableChangesMemberlyg:LeadManagerMemberlyg:BrokerQuotesMemberifrs-full:ConsensusPricingMember2023-12-310001160106ifrs-full:FinancialAssetsAvailableforsaleCategoryMemberlyg:LeadManagerMemberlyg:UnfavourableChangesMemberlyg:BrokerQuotesMemberifrs-full:ConsensusPricingMember2023-12-310001160106ifrs-full:FinancialAssetsAvailableforsaleCategoryMemberlyg:LeadManagerMemberifrs-full:GrossCarryingAmountMemberlyg:BrokerQuotesMemberifrs-full:ConsensusPricingMember2022-12-310001160106ifrs-full:FinancialAssetsAvailableforsaleCategoryMemberlyg:FavourableChangesMemberlyg:LeadManagerMemberlyg:BrokerQuotesMemberifrs-full:ConsensusPricingMember2022-12-310001160106ifrs-full:FinancialAssetsAvailableforsaleCategoryMemberlyg:LeadManagerMemberlyg:UnfavourableChangesMemberlyg:BrokerQuotesMemberifrs-full:ConsensusPricingMember2022-12-310001160106ifrs-full:FinancialAssetsAvailableforsaleCategoryMemberifrs-full:GrossCarryingAmountMemberlyg:UnderlyingAssetnetAssetValueinclPropertyPricesMember2023-12-310001160106ifrs-full:FinancialAssetsAvailableforsaleCategoryMemberlyg:FavourableChangesMemberlyg:UnderlyingAssetnetAssetValueinclPropertyPricesMember2023-12-310001160106ifrs-full:FinancialAssetsAvailableforsaleCategoryMemberlyg:UnfavourableChangesMemberlyg:UnderlyingAssetnetAssetValueinclPropertyPricesMember2023-12-310001160106ifrs-full:FinancialAssetsAvailableforsaleCategoryMemberifrs-full:GrossCarryingAmountMemberlyg:UnderlyingAssetnetAssetValueinclPropertyPricesMember2022-12-310001160106ifrs-full:FinancialAssetsAvailableforsaleCategoryMemberlyg:FavourableChangesMemberlyg:UnderlyingAssetnetAssetValueinclPropertyPricesMember2022-12-310001160106ifrs-full:FinancialAssetsAvailableforsaleCategoryMemberlyg:UnfavourableChangesMemberlyg:UnderlyingAssetnetAssetValueinclPropertyPricesMember2022-12-310001160106ifrs-full:FinancialAssetsAvailableforsaleCategoryMemberifrs-full:GrossCarryingAmountMember2023-12-310001160106ifrs-full:FinancialAssetsAvailableforsaleCategoryMemberifrs-full:GrossCarryingAmountMember2022-12-310001160106lyg:InterestRateVolatilityMemberlyg:DerivativeLiabilitiesMembersrt:MinimumMember2023-12-310001160106lyg:InterestRateVolatilityMemberlyg:DerivativeLiabilitiesMembersrt:MaximumMember2023-12-310001160106lyg:InterestRateVolatilityMemberifrs-full:GrossCarryingAmountMemberifrs-full:OptionPricingModelMemberlyg:DerivativeAssetsMember2023-12-310001160106lyg:FavourableChangesMemberlyg:InterestRateVolatilityMemberifrs-full:OptionPricingModelMemberlyg:DerivativeAssetsMember2023-12-310001160106lyg:InterestRateVolatilityMemberlyg:UnfavourableChangesMemberifrs-full:OptionPricingModelMemberlyg:DerivativeAssetsMember2023-12-310001160106lyg:InterestRateVolatilityMemberifrs-full:GrossCarryingAmountMemberifrs-full:OptionPricingModelMemberlyg:DerivativeAssetsMember2022-12-310001160106lyg:FavourableChangesMemberlyg:InterestRateVolatilityMemberifrs-full:OptionPricingModelMemberlyg:DerivativeAssetsMember2022-12-310001160106lyg:InterestRateVolatilityMemberlyg:UnfavourableChangesMemberifrs-full:OptionPricingModelMemberlyg:DerivativeAssetsMember2022-12-310001160106ifrs-full:Level3OfFairValueHierarchyMemberifrs-full:GrossCarryingAmountMemberifrs-full:FinancialAssetsAtFairValueMember2023-12-310001160106ifrs-full:Level3OfFairValueHierarchyMemberifrs-full:GrossCarryingAmountMemberifrs-full:FinancialAssetsAtFairValueMember2022-12-310001160106lyg:InterestRateSpreadsMembersrt:MaximumMemberifrs-full:FinancialLiabilitiesAtFairValueThroughProfitOrLossCategoryMember2023-12-310001160106lyg:InterestRateSpreadsMembersrt:MinimumMemberifrs-full:FinancialLiabilitiesAtFairValueThroughProfitOrLossCategoryMember2023-12-310001160106ifrs-full:GrossCarryingAmountMemberifrs-full:FinancialLiabilitiesAtFairValueThroughProfitOrLossCategoryMember2023-12-310001160106lyg:FavourableChangesMemberifrs-full:FinancialLiabilitiesAtFairValueThroughProfitOrLossCategoryMember2023-12-310001160106lyg:UnfavourableChangesMemberifrs-full:FinancialLiabilitiesAtFairValueThroughProfitOrLossCategoryMember2023-12-310001160106ifrs-full:GrossCarryingAmountMemberifrs-full:FinancialLiabilitiesAtFairValueThroughProfitOrLossCategoryMember2022-12-310001160106lyg:FavourableChangesMemberifrs-full:FinancialLiabilitiesAtFairValueThroughProfitOrLossCategoryMember2022-12-310001160106lyg:UnfavourableChangesMemberifrs-full:FinancialLiabilitiesAtFairValueThroughProfitOrLossCategoryMember2022-12-310001160106lyg:InterestRateVolatilityMemberlyg:DerivativeLiabilitiesMemberifrs-full:GrossCarryingAmountMemberifrs-full:OptionPricingModelMember2023-12-310001160106lyg:FavourableChangesMemberlyg:InterestRateVolatilityMemberlyg:DerivativeLiabilitiesMemberifrs-full:GrossCarryingAmountMemberifrs-full:OptionPricingModelMember2023-12-310001160106lyg:InterestRateVolatilityMemberlyg:DerivativeLiabilitiesMemberlyg:UnfavourableChangesMemberifrs-full:GrossCarryingAmountMemberifrs-full:OptionPricingModelMember2023-12-310001160106lyg:InterestRateVolatilityMemberlyg:DerivativeLiabilitiesMemberifrs-full:GrossCarryingAmountMemberifrs-full:OptionPricingModelMember2022-12-310001160106lyg:FavourableChangesMemberlyg:InterestRateVolatilityMemberlyg:DerivativeLiabilitiesMemberifrs-full:GrossCarryingAmountMemberifrs-full:OptionPricingModelMember2022-12-310001160106lyg:InterestRateVolatilityMemberlyg:DerivativeLiabilitiesMemberlyg:UnfavourableChangesMemberifrs-full:GrossCarryingAmountMemberifrs-full:OptionPricingModelMember2022-12-310001160106ifrs-full:Level3OfFairValueHierarchyMemberifrs-full:GrossCarryingAmountMemberifrs-full:FinancialLiabilitiesAtFairValueMember2023-12-310001160106ifrs-full:Level3OfFairValueHierarchyMemberifrs-full:GrossCarryingAmountMemberifrs-full:FinancialLiabilitiesAtFairValueMember2022-12-310001160106ifrs-full:FinancialAssetsAtFairValueThroughProfitOrLossCategoryMemberlyg:InterestRateSpreadsMembersrt:MinimumMember2022-12-310001160106ifrs-full:FinancialAssetsAtFairValueThroughProfitOrLossCategoryMemberlyg:InterestRateSpreadsMembersrt:MaximumMember2022-12-310001160106ifrs-full:FinancialAssetsAtFairValueThroughProfitOrLossCategoryMembersrt:MaximumMemberlyg:CreditSpreadsMember2022-12-310001160106ifrs-full:FinancialAssetsAtFairValueThroughProfitOrLossCategoryMembersrt:MinimumMemberlyg:EarningsMultipleMember2022-12-310001160106ifrs-full:FinancialAssetsAtFairValueThroughProfitOrLossCategoryMembersrt:MaximumMemberlyg:EarningsMultipleMember2022-12-310001160106lyg:InterestRateVolatilityMembersrt:MinimumMemberlyg:DerivativeAssetsMember2022-12-310001160106lyg:InterestRateVolatilityMemberlyg:DerivativeLiabilitiesMembersrt:MinimumMember2022-12-310001160106lyg:InterestRateVolatilityMemberlyg:DerivativeLiabilitiesMembersrt:MaximumMember2022-12-310001160106lyg:InterestRateVolatilityMembersrt:MaximumMemberlyg:DerivativeAssetsMember2022-12-310001160106lyg:InterestRateSpreadsMembersrt:MaximumMemberifrs-full:FinancialLiabilitiesAtFairValueThroughProfitOrLossCategoryMember2022-12-310001160106lyg:InterestRateSpreadsMembersrt:MinimumMemberifrs-full:FinancialLiabilitiesAtFairValueThroughProfitOrLossCategoryMember2022-12-310001160106ifrs-full:BottomOfRangeMember2022-01-012022-12-310001160106ifrs-full:TopOfRangeMember2022-01-012022-12-310001160106ifrs-full:GrossCarryingAmountMember2023-12-310001160106ifrs-full:AtFairValueMember2023-12-310001160106ifrs-full:GrossCarryingAmountMember2022-12-310001160106ifrs-full:AtFairValueMember2022-12-310001160106lyg:ResidentialMortgageBackedSecurities1Memberifrs-full:BottomOfRangeMember2023-01-012023-12-310001160106lyg:ResidentialMortgageBackedSecurities1Memberifrs-full:TopOfRangeMember2023-01-012023-12-310001160106lyg:TradingAndOtherMemberlyg:ExchangeRateContractsMember2023-12-310001160106lyg:TradingAndOtherMemberlyg:ExchangeRateContractsMember2022-12-310001160106lyg:TradingAndOtherMemberlyg:InterestRateContract1Member2023-12-310001160106lyg:TradingAndOtherMemberlyg:InterestRateContract1Member2022-12-310001160106lyg:CreditDerivativesMemberlyg:TradingAndOtherMember2023-12-310001160106lyg:CreditDerivativesMemberlyg:TradingAndOtherMember2022-12-310001160106lyg:TradingAndOtherMemberlyg:EquityCommodityAndOtherContractsMember2023-12-310001160106lyg:TradingAndOtherMemberlyg:EquityCommodityAndOtherContractsMember2022-12-310001160106lyg:TradingAndOtherMember2023-12-310001160106lyg:TradingAndOtherMember2022-12-310001160106ifrs-full:HedgingInstrumentsMemberifrs-full:FairValueHedgesMember2023-12-310001160106ifrs-full:HedgingInstrumentsMemberifrs-full:FairValueHedgesMember2022-12-310001160106ifrs-full:HedgingInstrumentsMemberifrs-full:CashFlowHedgesMember2023-12-310001160106ifrs-full:HedgingInstrumentsMemberifrs-full:CashFlowHedgesMember2022-12-310001160106ifrs-full:HedgingInstrumentsMember2023-12-310001160106ifrs-full:HedgingInstrumentsMember2022-12-310001160106ifrs-full:FairValueHedgesMemberifrs-full:CurrencySwapContractMemberifrs-full:NotLaterThanOneMonthMember2023-12-310001160106ifrs-full:LaterThanOneMonthAndNotLaterThanThreeMonthsMemberifrs-full:FairValueHedgesMemberifrs-full:CurrencySwapContractMember2023-12-310001160106ifrs-full:LaterThanThreeMonthsAndNotLaterThanOneYearMemberifrs-full:FairValueHedgesMemberifrs-full:CurrencySwapContractMember2023-12-310001160106ifrs-full:LaterThanOneYearAndNotLaterThanFiveYearsMemberifrs-full:FairValueHedgesMemberifrs-full:CurrencySwapContractMember2023-12-310001160106ifrs-full:LaterThanFiveYearsMemberifrs-full:FairValueHedgesMemberifrs-full:CurrencySwapContractMember2023-12-310001160106ifrs-full:FairValueHedgesMemberifrs-full:CurrencySwapContractMember2023-12-310001160106lyg:EuroToGBPMemberifrs-full:FairValueHedgesMemberifrs-full:CurrencySwapContractMemberifrs-full:NotLaterThanOneMonthMember2023-12-310001160106lyg:EuroToGBPMemberifrs-full:LaterThanOneMonthAndNotLaterThanThreeMonthsMemberifrs-full:FairValueHedgesMemberifrs-full:CurrencySwapContractMember2023-12-310001160106lyg:EuroToGBPMemberifrs-full:LaterThanThreeMonthsAndNotLaterThanOneYearMemberifrs-full:FairValueHedgesMemberifrs-full:CurrencySwapContractMember2023-12-310001160106lyg:EuroToGBPMemberifrs-full:LaterThanOneYearAndNotLaterThanFiveYearsMemberifrs-full:FairValueHedgesMemberifrs-full:CurrencySwapContractMember2023-12-310001160106lyg:EuroToGBPMemberifrs-full:LaterThanFiveYearsMemberifrs-full:FairValueHedgesMemberifrs-full:CurrencySwapContractMember2023-12-310001160106ifrs-full:FairValueHedgesMemberifrs-full:InterestRateSwapContractMemberifrs-full:NotLaterThanOneMonthMember2023-12-310001160106ifrs-full:LaterThanOneMonthAndNotLaterThanThreeMonthsMemberifrs-full:FairValueHedgesMemberifrs-full:InterestRateSwapContractMember2023-12-310001160106ifrs-full:LaterThanThreeMonthsAndNotLaterThanOneYearMemberifrs-full:FairValueHedgesMemberifrs-full:InterestRateSwapContractMember2023-12-310001160106ifrs-full:LaterThanOneYearAndNotLaterThanFiveYearsMemberifrs-full:FairValueHedgesMemberifrs-full:InterestRateSwapContractMember2023-12-310001160106ifrs-full:LaterThanFiveYearsMemberifrs-full:FairValueHedgesMemberifrs-full:InterestRateSwapContractMember2023-12-310001160106ifrs-full:FairValueHedgesMemberifrs-full:InterestRateSwapContractMember2023-12-310001160106ifrs-full:CashFlowHedgesMemberifrs-full:CurrencySwapContractMemberifrs-full:NotLaterThanOneMonthMember2023-12-310001160106ifrs-full:LaterThanOneMonthAndNotLaterThanThreeMonthsMemberifrs-full:CashFlowHedgesMemberifrs-full:CurrencySwapContractMember2023-12-310001160106ifrs-full:LaterThanThreeMonthsAndNotLaterThanOneYearMemberifrs-full:CashFlowHedgesMemberifrs-full:CurrencySwapContractMember2023-12-310001160106ifrs-full:CashFlowHedgesMemberifrs-full:LaterThanOneYearAndNotLaterThanFiveYearsMemberifrs-full:CurrencySwapContractMember2023-12-310001160106ifrs-full:LaterThanFiveYearsMemberifrs-full:CashFlowHedgesMemberifrs-full:CurrencySwapContractMember2023-12-310001160106ifrs-full:CashFlowHedgesMemberifrs-full:CurrencySwapContractMember2023-12-310001160106lyg:EuroToGBPMemberifrs-full:CashFlowHedgesMemberifrs-full:CurrencySwapContractMemberifrs-full:NotLaterThanOneMonthMember2023-12-310001160106lyg:EuroToGBPMemberifrs-full:LaterThanOneMonthAndNotLaterThanThreeMonthsMemberifrs-full:CashFlowHedgesMemberifrs-full:CurrencySwapContractMember2023-12-310001160106lyg:EuroToGBPMemberifrs-full:LaterThanThreeMonthsAndNotLaterThanOneYearMemberifrs-full:CashFlowHedgesMemberifrs-full:CurrencySwapContractMember2023-12-310001160106lyg:EuroToGBPMemberifrs-full:CashFlowHedgesMemberifrs-full:LaterThanOneYearAndNotLaterThanFiveYearsMemberifrs-full:CurrencySwapContractMember2023-12-310001160106lyg:EuroToGBPMemberifrs-full:LaterThanFiveYearsMemberifrs-full:CashFlowHedgesMemberifrs-full:CurrencySwapContractMember2023-12-310001160106ifrs-full:CashFlowHedgesMemberlyg:USDToGBPMemberifrs-full:CurrencySwapContractMemberifrs-full:NotLaterThanOneMonthMember2023-12-310001160106ifrs-full:LaterThanOneMonthAndNotLaterThanThreeMonthsMemberifrs-full:CashFlowHedgesMemberlyg:USDToGBPMemberifrs-full:CurrencySwapContractMember2023-12-310001160106ifrs-full:LaterThanThreeMonthsAndNotLaterThanOneYearMemberifrs-full:CashFlowHedgesMemberlyg:USDToGBPMemberifrs-full:CurrencySwapContractMember2023-12-310001160106ifrs-full:CashFlowHedgesMemberifrs-full:LaterThanOneYearAndNotLaterThanFiveYearsMemberlyg:USDToGBPMemberifrs-full:CurrencySwapContractMember2023-12-310001160106ifrs-full:LaterThanFiveYearsMemberifrs-full:CashFlowHedgesMemberlyg:USDToGBPMemberifrs-full:CurrencySwapContractMember2023-12-310001160106ifrs-full:CashFlowHedgesMemberifrs-full:NotLaterThanOneMonthMember2023-12-310001160106ifrs-full:LaterThanOneMonthAndNotLaterThanThreeMonthsMemberifrs-full:CashFlowHedgesMember2023-12-310001160106ifrs-full:LaterThanThreeMonthsAndNotLaterThanOneYearMemberifrs-full:CashFlowHedgesMember2023-12-310001160106ifrs-full:CashFlowHedgesMemberifrs-full:LaterThanOneYearAndNotLaterThanFiveYearsMember2023-12-310001160106ifrs-full:LaterThanFiveYearsMemberifrs-full:CashFlowHedgesMember2023-12-310001160106ifrs-full:CashFlowHedgesMember2023-12-310001160106ifrs-full:FairValueHedgesMemberifrs-full:CurrencySwapContractMemberifrs-full:NotLaterThanOneMonthMember2022-12-310001160106ifrs-full:LaterThanOneMonthAndNotLaterThanThreeMonthsMemberifrs-full:FairValueHedgesMemberifrs-full:CurrencySwapContractMember2022-12-310001160106ifrs-full:LaterThanThreeMonthsAndNotLaterThanOneYearMemberifrs-full:FairValueHedgesMemberifrs-full:CurrencySwapContractMember2022-12-310001160106ifrs-full:LaterThanOneYearAndNotLaterThanFiveYearsMemberifrs-full:FairValueHedgesMemberifrs-full:CurrencySwapContractMember2022-12-310001160106ifrs-full:LaterThanFiveYearsMemberifrs-full:FairValueHedgesMemberifrs-full:CurrencySwapContractMember2022-12-310001160106ifrs-full:FairValueHedgesMemberifrs-full:CurrencySwapContractMember2022-12-310001160106lyg:EuroToGBPMemberifrs-full:FairValueHedgesMemberifrs-full:CurrencySwapContractMemberifrs-full:NotLaterThanOneMonthMember2022-12-310001160106lyg:EuroToGBPMemberifrs-full:LaterThanOneMonthAndNotLaterThanThreeMonthsMemberifrs-full:FairValueHedgesMemberifrs-full:CurrencySwapContractMember2022-12-310001160106lyg:EuroToGBPMemberifrs-full:LaterThanThreeMonthsAndNotLaterThanOneYearMemberifrs-full:FairValueHedgesMemberifrs-full:CurrencySwapContractMember2022-12-310001160106lyg:EuroToGBPMemberifrs-full:LaterThanOneYearAndNotLaterThanFiveYearsMemberifrs-full:FairValueHedgesMemberifrs-full:CurrencySwapContractMember2022-12-310001160106lyg:EuroToGBPMemberifrs-full:LaterThanFiveYearsMemberifrs-full:FairValueHedgesMemberifrs-full:CurrencySwapContractMember2022-12-310001160106ifrs-full:FairValueHedgesMemberifrs-full:InterestRateSwapContractMemberifrs-full:NotLaterThanOneMonthMember2022-12-310001160106ifrs-full:LaterThanOneMonthAndNotLaterThanThreeMonthsMemberifrs-full:FairValueHedgesMemberifrs-full:InterestRateSwapContractMember2022-12-310001160106ifrs-full:LaterThanThreeMonthsAndNotLaterThanOneYearMemberifrs-full:FairValueHedgesMemberifrs-full:InterestRateSwapContractMember2022-12-310001160106ifrs-full:LaterThanOneYearAndNotLaterThanFiveYearsMemberifrs-full:FairValueHedgesMemberifrs-full:InterestRateSwapContractMember2022-12-310001160106ifrs-full:LaterThanFiveYearsMemberifrs-full:FairValueHedgesMemberifrs-full:InterestRateSwapContractMember2022-12-310001160106ifrs-full:FairValueHedgesMemberifrs-full:InterestRateSwapContractMember2022-12-310001160106ifrs-full:CashFlowHedgesMemberifrs-full:CurrencySwapContractMemberifrs-full:NotLaterThanOneMonthMember2022-12-310001160106ifrs-full:LaterThanOneMonthAndNotLaterThanThreeMonthsMemberifrs-full:CashFlowHedgesMemberifrs-full:CurrencySwapContractMember2022-12-310001160106ifrs-full:LaterThanThreeMonthsAndNotLaterThanOneYearMemberifrs-full:CashFlowHedgesMemberifrs-full:CurrencySwapContractMember2022-12-310001160106ifrs-full:CashFlowHedgesMemberifrs-full:LaterThanOneYearAndNotLaterThanFiveYearsMemberifrs-full:CurrencySwapContractMember2022-12-310001160106ifrs-full:LaterThanFiveYearsMemberifrs-full:CashFlowHedgesMemberifrs-full:CurrencySwapContractMember2022-12-310001160106ifrs-full:CashFlowHedgesMemberifrs-full:CurrencySwapContractMember2022-12-310001160106lyg:EuroToGBPMemberifrs-full:CashFlowHedgesMemberifrs-full:CurrencySwapContractMemberifrs-full:NotLaterThanOneMonthMember2022-12-310001160106lyg:EuroToGBPMemberifrs-full:LaterThanOneMonthAndNotLaterThanThreeMonthsMemberifrs-full:CashFlowHedgesMemberifrs-full:CurrencySwapContractMember2022-12-310001160106lyg:EuroToGBPMemberifrs-full:LaterThanThreeMonthsAndNotLaterThanOneYearMemberifrs-full:CashFlowHedgesMemberifrs-full:CurrencySwapContractMember2022-12-310001160106lyg:EuroToGBPMemberifrs-full:CashFlowHedgesMemberifrs-full:LaterThanOneYearAndNotLaterThanFiveYearsMemberifrs-full:CurrencySwapContractMember2022-12-310001160106lyg:EuroToGBPMemberifrs-full:LaterThanFiveYearsMemberifrs-full:CashFlowHedgesMemberifrs-full:CurrencySwapContractMember2022-12-310001160106ifrs-full:CashFlowHedgesMemberlyg:USDToGBPMemberifrs-full:CurrencySwapContractMemberifrs-full:NotLaterThanOneMonthMember2022-12-310001160106ifrs-full:LaterThanOneMonthAndNotLaterThanThreeMonthsMemberifrs-full:CashFlowHedgesMemberlyg:USDToGBPMemberifrs-full:CurrencySwapContractMember2022-12-310001160106ifrs-full:LaterThanThreeMonthsAndNotLaterThanOneYearMemberifrs-full:CashFlowHedgesMemberlyg:USDToGBPMemberifrs-full:CurrencySwapContractMember2022-12-310001160106ifrs-full:CashFlowHedgesMemberifrs-full:LaterThanOneYearAndNotLaterThanFiveYearsMemberlyg:USDToGBPMemberifrs-full:CurrencySwapContractMember2022-12-310001160106ifrs-full:LaterThanFiveYearsMemberifrs-full:CashFlowHedgesMemberlyg:USDToGBPMemberifrs-full:CurrencySwapContractMember2022-12-310001160106ifrs-full:CashFlowHedgesMemberifrs-full:NotLaterThanOneMonthMember2022-12-310001160106ifrs-full:LaterThanOneMonthAndNotLaterThanThreeMonthsMemberifrs-full:CashFlowHedgesMember2022-12-310001160106ifrs-full:LaterThanThreeMonthsAndNotLaterThanOneYearMemberifrs-full:CashFlowHedgesMember2022-12-310001160106ifrs-full:CashFlowHedgesMemberifrs-full:LaterThanOneYearAndNotLaterThanFiveYearsMember2022-12-310001160106ifrs-full:LaterThanFiveYearsMemberifrs-full:CashFlowHedgesMember2022-12-310001160106ifrs-full:CashFlowHedgesMember2022-12-310001160106ifrs-full:FairValueHedgesMemberifrs-full:CurrencySwapContractMember2023-12-310001160106ifrs-full:HedgingInstrumentsMemberifrs-full:FairValueHedgesMemberifrs-full:CurrencySwapContractMember2023-12-310001160106ifrs-full:FairValueHedgesMemberifrs-full:CurrencySwapContractMemberifrs-full:CurrencySwapContractMember2023-01-012023-12-310001160106ifrs-full:FairValueHedgesMemberifrs-full:InterestRateSwapContractMember2023-12-310001160106ifrs-full:HedgingInstrumentsMemberifrs-full:FairValueHedgesMemberifrs-full:InterestRateSwapContractMember2023-12-310001160106ifrs-full:FairValueHedgesMemberifrs-full:InterestRateSwapContractMemberifrs-full:InterestRateSwapContractMember2023-01-012023-12-310001160106ifrs-full:CashFlowHedgesMemberifrs-full:CurrencySwapContractMember2023-12-310001160106ifrs-full:HedgingInstrumentsMemberifrs-full:CashFlowHedgesMemberifrs-full:CurrencySwapContractMember2023-12-310001160106ifrs-full:CashFlowHedgesMemberifrs-full:CurrencySwapContractMemberifrs-full:CurrencySwapContractMember2023-01-012023-12-310001160106ifrs-full:CashFlowHedgesMemberifrs-full:InterestRateSwapContractMember2023-12-310001160106ifrs-full:HedgingInstrumentsMemberifrs-full:CashFlowHedgesMemberifrs-full:InterestRateSwapContractMember2023-12-310001160106ifrs-full:CashFlowHedgesMemberifrs-full:InterestRateSwapContractMemberifrs-full:InterestRateSwapContractMember2023-01-012023-12-310001160106ifrs-full:FairValueHedgesMemberifrs-full:CurrencySwapContractMember2022-12-310001160106ifrs-full:HedgingInstrumentsMemberifrs-full:FairValueHedgesMemberifrs-full:CurrencySwapContractMember2022-12-310001160106ifrs-full:FairValueHedgesMemberifrs-full:CurrencySwapContractMemberifrs-full:CurrencySwapContractMember2022-01-012022-12-310001160106ifrs-full:FairValueHedgesMemberifrs-full:InterestRateSwapContractMember2022-12-310001160106ifrs-full:HedgingInstrumentsMemberifrs-full:FairValueHedgesMemberifrs-full:InterestRateSwapContractMember2022-12-310001160106ifrs-full:FairValueHedgesMemberifrs-full:InterestRateSwapContractMemberifrs-full:InterestRateSwapContractMember2022-01-012022-12-310001160106ifrs-full:CashFlowHedgesMemberifrs-full:CurrencySwapContractMember2022-12-310001160106ifrs-full:HedgingInstrumentsMemberifrs-full:CashFlowHedgesMemberifrs-full:CurrencySwapContractMember2022-12-310001160106ifrs-full:CashFlowHedgesMemberifrs-full:CurrencySwapContractMemberifrs-full:CurrencySwapContractMember2022-01-012022-12-310001160106ifrs-full:CashFlowHedgesMemberifrs-full:InterestRateSwapContractMember2022-12-310001160106ifrs-full:HedgingInstrumentsMemberifrs-full:CashFlowHedgesMemberifrs-full:InterestRateSwapContractMember2022-12-310001160106ifrs-full:CashFlowHedgesMemberifrs-full:InterestRateSwapContractMemberifrs-full:InterestRateSwapContractMember2022-01-012022-12-310001160106lyg:FixedRateMortgagesMemberifrs-full:FairValueHedgesMember2023-12-310001160106lyg:FixedRateMortgagesMemberifrs-full:FairValueHedgesMember2023-01-012023-12-310001160106ifrs-full:FairValueHedgesMemberlyg:FixedRateIssuanceMember2023-12-310001160106ifrs-full:FairValueHedgesMemberlyg:FixedRateIssuanceMember2023-01-012023-12-310001160106lyg:FixedRateBondsMemberifrs-full:FairValueHedgesMember2023-12-310001160106lyg:FixedRateBondsMemberifrs-full:FairValueHedgesMember2023-01-012023-12-310001160106lyg:ForeignCurrencyIssuanceMemberifrs-full:CashFlowHedgesMember2023-01-012023-12-310001160106lyg:ForeignCurrencyIssuanceMemberifrs-full:CashFlowHedgesMember2023-12-310001160106ifrs-full:CashFlowHedgesMemberlyg:DepositsFromCustomersMemberlyg:ForeignExchange1Member2023-01-012023-12-310001160106ifrs-full:CashFlowHedgesMemberlyg:DepositsFromCustomersMemberlyg:ForeignExchange1Member2023-12-310001160106ifrs-full:CashFlowHedgesMemberlyg:CustomerLoansMember2023-01-012023-12-310001160106ifrs-full:CashFlowHedgesMemberlyg:CustomerLoansMember2023-12-310001160106ifrs-full:CashFlowHedgesMemberlyg:CentralBankBalancesMember2023-01-012023-12-310001160106ifrs-full:CashFlowHedgesMemberlyg:CentralBankBalancesMember2023-12-310001160106ifrs-full:CashFlowHedgesMemberlyg:DepositsFromCustomersMember2023-01-012023-12-310001160106ifrs-full:CashFlowHedgesMemberlyg:DepositsFromCustomersMember2023-12-310001160106lyg:FixedRateMortgagesMemberifrs-full:FairValueHedgesMember2022-12-310001160106lyg:FixedRateMortgagesMemberifrs-full:FairValueHedgesMember2022-01-012022-12-310001160106ifrs-full:FairValueHedgesMemberlyg:FixedRateIssuanceMember2022-12-310001160106ifrs-full:FairValueHedgesMemberlyg:FixedRateIssuanceMember2022-01-012022-12-310001160106lyg:FixedRateBondsMemberifrs-full:FairValueHedgesMember2022-12-310001160106lyg:FixedRateBondsMemberifrs-full:FairValueHedgesMember2022-01-012022-12-310001160106lyg:ForeignCurrencyIssuanceMemberifrs-full:CashFlowHedgesMember2022-01-012022-12-310001160106lyg:ForeignCurrencyIssuanceMemberifrs-full:CashFlowHedgesMember2022-12-310001160106ifrs-full:CashFlowHedgesMemberlyg:DepositsFromCustomersMemberlyg:ForeignExchange1Member2022-01-012022-12-310001160106ifrs-full:CashFlowHedgesMemberlyg:DepositsFromCustomersMemberlyg:ForeignExchange1Member2022-12-310001160106ifrs-full:CashFlowHedgesMemberlyg:CustomerLoansMember2022-01-012022-12-310001160106ifrs-full:CashFlowHedgesMemberlyg:CustomerLoansMember2022-12-310001160106ifrs-full:CashFlowHedgesMemberlyg:CentralBankBalancesMember2022-01-012022-12-310001160106ifrs-full:CashFlowHedgesMemberlyg:CentralBankBalancesMember2022-12-310001160106ifrs-full:CashFlowHedgesMemberlyg:DepositsFromCustomersMember2022-01-012022-12-310001160106ifrs-full:CashFlowHedgesMemberlyg:DepositsFromCustomersMember2022-12-310001160106lyg:InterestRateMemberlyg:FixedRateMortgagesMemberifrs-full:FairValueHedgesMember2023-01-012023-12-310001160106lyg:InterestRateMemberifrs-full:FairValueHedgesMemberlyg:FixedRateIssuanceMember2023-01-012023-12-310001160106lyg:FixedRateBondsMemberlyg:InterestRateMemberifrs-full:FairValueHedgesMember2023-01-012023-12-310001160106lyg:ForeignExchange1Memberlyg:ForeignCurrencyIssuanceMemberifrs-full:CashFlowHedgesMemberlyg:ForeignCurrencyIssuanceMember2023-01-012023-12-310001160106lyg:ForeignExchange1Memberlyg:ForeignCurrencyIssuanceMemberifrs-full:CashFlowHedgesMemberlyg:ForeignCurrencyIssuanceMember2022-01-012022-12-310001160106lyg:ForeignExchange1Memberlyg:DepositsFromCustomersMemberifrs-full:CashFlowHedgesMemberlyg:DepositsFromCustomersMember2023-01-012023-12-310001160106lyg:InterestRateMemberifrs-full:CashFlowHedgesMemberlyg:CustomerLoansMember2023-01-012023-12-310001160106lyg:InterestRateMemberifrs-full:CashFlowHedgesMemberlyg:CentralBankBalancesMember2023-01-012023-12-310001160106lyg:InterestRateMemberifrs-full:CashFlowHedgesMemberlyg:DepositsFromCustomersMember2023-01-012023-12-310001160106lyg:InterestRateMemberlyg:FixedRateMortgagesMemberifrs-full:FairValueHedgesMember2022-01-012022-12-310001160106lyg:InterestRateMemberifrs-full:FairValueHedgesMemberlyg:FixedRateIssuanceMember2022-01-012022-12-310001160106lyg:FixedRateBondsMemberlyg:InterestRateMemberifrs-full:FairValueHedgesMember2022-01-012022-12-310001160106lyg:ForeignExchange1Memberifrs-full:CashFlowHedgesMemberlyg:ForeignCurrencyIssuanceMember2022-01-012022-12-310001160106lyg:ForeignExchange1Memberlyg:DepositsFromCustomersMemberifrs-full:CashFlowHedgesMemberlyg:DepositsFromCustomersMember2022-01-012022-12-310001160106lyg:InterestRateMemberifrs-full:CashFlowHedgesMemberlyg:CustomerLoansMember2022-01-012022-12-310001160106lyg:InterestRateMemberifrs-full:CashFlowHedgesMemberlyg:CentralBankBalancesMember2022-01-012022-12-310001160106lyg:InterestRateMemberifrs-full:CashFlowHedgesMemberlyg:DepositsFromCustomersMember2022-01-012022-12-310001160106lyg:LoansAndAdvancesToCustomersMemberlyg:Stage1Member2022-12-310001160106lyg:Stage2Memberlyg:LoansAndAdvancesToCustomersMember2022-12-310001160106lyg:Stage3Memberlyg:LoansAndAdvancesToCustomersMember2022-12-310001160106lyg:LoansAndAdvancesToCustomersMemberlyg:PurchasedOrOriginatedCreditimpairedMember2022-12-310001160106lyg:LoansAndAdvancesToCustomersMember2022-12-310001160106lyg:Stage1Memberlyg:LoansAndAdvancesToCustomersMember2022-12-310001160106lyg:Stage2Memberlyg:LoansAndAdvancesToCustomersMember2022-12-310001160106lyg:Stage3Memberlyg:LoansAndAdvancesToCustomersMember2022-12-310001160106lyg:PurchasedOrOriginatedCreditimpairedMemberlyg:LoansAndAdvancesToCustomersMember2022-12-310001160106lyg:LoansAndAdvancesToCustomersMember2022-12-310001160106lyg:LoansAndAdvancesToCustomersMemberlyg:Stage1Member2023-01-012023-12-310001160106lyg:Stage2Memberlyg:LoansAndAdvancesToCustomersMember2023-01-012023-12-310001160106lyg:Stage3Memberlyg:LoansAndAdvancesToCustomersMember2023-01-012023-12-310001160106lyg:LoansAndAdvancesToCustomersMemberlyg:PurchasedOrOriginatedCreditimpairedMember2023-01-012023-12-310001160106lyg:LoansAndAdvancesToCustomersMember2023-01-012023-12-310001160106lyg:Stage1Memberlyg:LoansAndAdvancesToCustomersMember2023-01-012023-12-310001160106lyg:Stage2Memberlyg:LoansAndAdvancesToCustomersMember2023-01-012023-12-310001160106lyg:Stage3Memberlyg:LoansAndAdvancesToCustomersMember2023-01-012023-12-310001160106lyg:PurchasedOrOriginatedCreditimpairedMemberlyg:LoansAndAdvancesToCustomersMember2023-01-012023-12-310001160106lyg:LoansAndAdvancesToCustomersMember2023-01-012023-12-310001160106lyg:Stage1Memberlyg:LoansAndAdvancesToCustomersMemberlyg:Stage1Member2023-01-012023-12-310001160106lyg:Stage2Memberlyg:Stage1Memberlyg:LoansAndAdvancesToCustomersMember2023-01-012023-12-310001160106lyg:Stage1Memberlyg:Stage3Memberlyg:LoansAndAdvancesToCustomersMember2023-01-012023-12-310001160106lyg:Stage1Memberlyg:LoansAndAdvancesToCustomersMember2023-01-012023-12-310001160106lyg:Stage1Memberlyg:Stage1Memberlyg:LoansAndAdvancesToCustomersMember2023-01-012023-12-310001160106lyg:Stage1Memberlyg:Stage2Memberlyg:LoansAndAdvancesToCustomersMember2023-01-012023-12-310001160106lyg:Stage1Memberlyg:Stage3Memberlyg:LoansAndAdvancesToCustomersMember2023-01-012023-12-310001160106lyg:Stage1Memberlyg:LoansAndAdvancesToCustomersMember2023-01-012023-12-310001160106lyg:Stage2Memberlyg:LoansAndAdvancesToCustomersMemberlyg:Stage1Member2023-01-012023-12-310001160106lyg:Stage2Memberlyg:Stage2Memberlyg:LoansAndAdvancesToCustomersMember2023-01-012023-12-310001160106lyg:Stage2Memberlyg:Stage3Memberlyg:LoansAndAdvancesToCustomersMember2023-01-012023-12-310001160106lyg:Stage2Memberlyg:LoansAndAdvancesToCustomersMember2023-01-012023-12-310001160106lyg:Stage1Memberlyg:Stage2Memberlyg:LoansAndAdvancesToCustomersMember2023-01-012023-12-310001160106lyg:Stage2Memberlyg:Stage2Memberlyg:LoansAndAdvancesToCustomersMember2023-01-012023-12-310001160106lyg:Stage3Memberlyg:Stage2Memberlyg:LoansAndAdvancesToCustomersMember2023-01-012023-12-310001160106lyg:Stage2Memberlyg:LoansAndAdvancesToCustomersMember2023-01-012023-12-310001160106lyg:Stage3Memberlyg:LoansAndAdvancesToCustomersMemberlyg:Stage1Member2023-01-012023-12-310001160106lyg:Stage3Memberlyg:Stage2Memberlyg:LoansAndAdvancesToCustomersMember2023-01-012023-12-310001160106lyg:Stage3Memberlyg:Stage3Memberlyg:LoansAndAdvancesToCustomersMember2023-01-012023-12-310001160106lyg:Stage3Memberlyg:LoansAndAdvancesToCustomersMember2023-01-012023-12-310001160106lyg:Stage3Memberlyg:Stage1Memberlyg:LoansAndAdvancesToCustomersMember2023-01-012023-12-310001160106lyg:Stage3Memberlyg:Stage2Memberlyg:LoansAndAdvancesToCustomersMember2023-01-012023-12-310001160106lyg:Stage3Memberlyg:Stage3Memberlyg:LoansAndAdvancesToCustomersMember2023-01-012023-12-310001160106lyg:Stage3Memberlyg:LoansAndAdvancesToCustomersMember2023-01-012023-12-310001160106lyg:ImpactOfTransfersBetweenStagesMemberlyg:Stage1Memberlyg:LoansAndAdvancesToCustomersMember2023-01-012023-12-310001160106lyg:ImpactOfTransfersBetweenStagesMemberlyg:Stage2Memberlyg:LoansAndAdvancesToCustomersMember2023-01-012023-12-310001160106lyg:ImpactOfTransfersBetweenStagesMemberlyg:Stage3Memberlyg:LoansAndAdvancesToCustomersMember2023-01-012023-12-310001160106lyg:ImpactOfTransfersBetweenStagesMemberlyg:LoansAndAdvancesToCustomersMember2023-01-012023-12-310001160106lyg:LoansAndAdvancesToCustomersMemberlyg:Stage1Member2023-12-310001160106lyg:Stage2Memberlyg:LoansAndAdvancesToCustomersMember2023-12-310001160106lyg:Stage3Memberlyg:LoansAndAdvancesToCustomersMember2023-12-310001160106lyg:LoansAndAdvancesToCustomersMemberlyg:PurchasedOrOriginatedCreditimpairedMember2023-12-310001160106lyg:LoansAndAdvancesToCustomersMember2023-12-310001160106lyg:Stage1Memberlyg:LoansAndAdvancesToCustomersMember2023-12-310001160106lyg:Stage2Memberlyg:LoansAndAdvancesToCustomersMember2023-12-310001160106lyg:Stage3Memberlyg:LoansAndAdvancesToCustomersMember2023-12-310001160106lyg:PurchasedOrOriginatedCreditimpairedMemberlyg:LoansAndAdvancesToCustomersMember2023-12-310001160106lyg:LoansAndAdvancesToCustomersMember2023-12-310001160106lyg:LoansAndAdvancesToCustomersMemberlyg:Stage1Memberlyg:LoansAndAdvancesToCustomersMember2023-12-310001160106lyg:Stage2Memberlyg:LoansAndAdvancesToCustomersMemberlyg:LoansAndAdvancesToCustomersMember2023-12-310001160106lyg:Stage3Memberlyg:LoansAndAdvancesToCustomersMemberlyg:LoansAndAdvancesToCustomersMember2023-12-310001160106lyg:LoansAndAdvancesToCustomersMemberlyg:PurchasedOrOriginatedCreditimpairedMemberlyg:LoansAndAdvancesToCustomersMember2023-12-310001160106lyg:LoansAndAdvancesToCustomersMemberlyg:LoansAndAdvancesToCustomersMember2023-12-310001160106lyg:LoansAndAdvancesToCustomersMemberlyg:Stage1Member2023-01-012023-12-310001160106lyg:Stage2Memberlyg:LoansAndAdvancesToCustomersMember2023-01-012023-12-310001160106lyg:Stage3Memberlyg:LoansAndAdvancesToCustomersMember2023-01-012023-12-310001160106lyg:LoansAndAdvancesToCustomersMemberlyg:PurchasedOrOriginatedCreditimpairedMember2023-01-012023-12-310001160106lyg:ResidualValueAndVoluntaryTerminationsMember2023-12-310001160106lyg:ResidualValueAndVoluntaryTerminationsMember2022-12-310001160106lyg:RetailMortgagesMemberlyg:Stage1Member2022-12-310001160106lyg:RetailMortgagesMemberlyg:Stage2Member2022-12-310001160106lyg:RetailMortgagesMemberlyg:Stage3Member2022-12-310001160106lyg:RetailMortgagesMemberlyg:PurchasedOrOriginatedCreditimpairedMember2022-12-310001160106lyg:RetailMortgagesMember2022-12-310001160106lyg:RetailMortgagesMemberlyg:Stage1Member2022-12-310001160106lyg:RetailMortgagesMemberlyg:Stage2Member2022-12-310001160106lyg:Stage3Memberlyg:RetailMortgagesMember2022-12-310001160106lyg:PurchasedOrOriginatedCreditimpairedMemberlyg:RetailMortgagesMember2022-12-310001160106lyg:RetailMortgagesMember2022-12-310001160106lyg:RetailMortgagesMemberlyg:Stage1Member2023-01-012023-12-310001160106lyg:RetailMortgagesMemberlyg:Stage2Member2023-01-012023-12-310001160106lyg:RetailMortgagesMemberlyg:Stage3Member2023-01-012023-12-310001160106lyg:RetailMortgagesMemberlyg:PurchasedOrOriginatedCreditimpairedMember2023-01-012023-12-310001160106lyg:RetailMortgagesMember2023-01-012023-12-310001160106lyg:RetailMortgagesMemberlyg:Stage1Member2023-01-012023-12-310001160106lyg:RetailMortgagesMemberlyg:Stage2Member2023-01-012023-12-310001160106lyg:Stage3Memberlyg:RetailMortgagesMember2023-01-012023-12-310001160106lyg:PurchasedOrOriginatedCreditimpairedMemberlyg:RetailMortgagesMember2023-01-012023-12-310001160106lyg:RetailMortgagesMember2023-01-012023-12-310001160106lyg:RetailMortgagesMemberlyg:Stage1Memberlyg:Stage1Member2023-01-012023-12-310001160106lyg:RetailMortgagesMemberlyg:Stage2Memberlyg:Stage1Member2023-01-012023-12-310001160106lyg:RetailMortgagesMemberlyg:Stage1Memberlyg:Stage3Member2023-01-012023-12-310001160106lyg:RetailMortgagesMemberlyg:Stage1Member2023-01-012023-12-310001160106lyg:Stage1Memberlyg:RetailMortgagesMemberlyg:Stage1Member2023-01-012023-12-310001160106lyg:Stage1Memberlyg:RetailMortgagesMemberlyg:Stage2Member2023-01-012023-12-310001160106lyg:Stage1Memberlyg:Stage3Memberlyg:RetailMortgagesMember2023-01-012023-12-310001160106lyg:Stage1Memberlyg:RetailMortgagesMember2023-01-012023-12-310001160106lyg:Stage2Memberlyg:RetailMortgagesMemberlyg:Stage1Member2023-01-012023-12-310001160106lyg:Stage2Memberlyg:RetailMortgagesMemberlyg:Stage2Member2023-01-012023-12-310001160106lyg:Stage2Memberlyg:RetailMortgagesMemberlyg:Stage3Member2023-01-012023-12-310001160106lyg:Stage2Memberlyg:RetailMortgagesMember2023-01-012023-12-310001160106lyg:RetailMortgagesMemberlyg:Stage1Memberlyg:Stage2Member2023-01-012023-12-310001160106lyg:RetailMortgagesMemberlyg:Stage2Memberlyg:Stage2Member2023-01-012023-12-310001160106lyg:Stage3Memberlyg:RetailMortgagesMemberlyg:Stage2Member2023-01-012023-12-310001160106lyg:RetailMortgagesMemberlyg:Stage2Member2023-01-012023-12-310001160106lyg:RetailMortgagesMemberlyg:Stage3Memberlyg:Stage1Member2023-01-012023-12-310001160106lyg:RetailMortgagesMemberlyg:Stage3Memberlyg:Stage2Member2023-01-012023-12-310001160106lyg:RetailMortgagesMemberlyg:Stage3Memberlyg:Stage3Member2023-01-012023-12-310001160106lyg:Stage3Memberlyg:RetailMortgagesMember2023-01-012023-12-310001160106lyg:Stage3Memberlyg:RetailMortgagesMemberlyg:Stage1Member2023-01-012023-12-310001160106lyg:Stage3Memberlyg:RetailMortgagesMemberlyg:Stage2Member2023-01-012023-12-310001160106lyg:Stage3Memberlyg:Stage3Memberlyg:RetailMortgagesMember2023-01-012023-12-310001160106lyg:Stage3Memberlyg:RetailMortgagesMember2023-01-012023-12-310001160106lyg:RetailMortgagesMember2023-01-012023-12-310001160106lyg:ImpactOfTransfersBetweenStagesMemberlyg:RetailMortgagesMemberlyg:Stage1Member2023-01-012023-12-310001160106lyg:ImpactOfTransfersBetweenStagesMemberlyg:RetailMortgagesMemberlyg:Stage2Member2023-01-012023-12-310001160106lyg:ImpactOfTransfersBetweenStagesMemberlyg:Stage3Memberlyg:RetailMortgagesMember2023-01-012023-12-310001160106lyg:ImpactOfTransfersBetweenStagesMemberlyg:RetailMortgagesMember2023-01-012023-12-310001160106lyg:RetailMortgagesMemberlyg:Stage1Member2023-01-012023-12-310001160106lyg:RetailMortgagesMemberlyg:Stage2Member2023-01-012023-12-310001160106lyg:RetailMortgagesMemberlyg:Stage3Member2023-01-012023-12-310001160106lyg:RetailMortgagesMemberlyg:PurchasedOrOriginatedCreditimpairedMember2023-01-012023-12-310001160106lyg:RetailMortgagesMemberlyg:Stage1Member2023-12-310001160106lyg:RetailMortgagesMemberlyg:Stage2Member2023-12-310001160106lyg:RetailMortgagesMemberlyg:Stage3Member2023-12-310001160106lyg:RetailMortgagesMemberlyg:PurchasedOrOriginatedCreditimpairedMember2023-12-310001160106lyg:RetailMortgagesMember2023-12-310001160106lyg:RetailMortgagesMemberlyg:Stage1Member2023-12-310001160106lyg:RetailMortgagesMemberlyg:Stage2Member2023-12-310001160106lyg:Stage3Memberlyg:RetailMortgagesMember2023-12-310001160106lyg:PurchasedOrOriginatedCreditimpairedMemberlyg:RetailMortgagesMember2023-12-310001160106lyg:RetailMortgagesMember2023-12-310001160106lyg:RetailMortgagesMemberlyg:RetailMortgagesMemberlyg:Stage1Member2023-12-310001160106lyg:RetailMortgagesMemberlyg:Stage2Memberlyg:RetailMortgagesMember2023-12-310001160106lyg:RetailMortgagesMemberlyg:RetailMortgagesMemberlyg:Stage3Member2023-12-310001160106lyg:RetailMortgagesMemberlyg:RetailMortgagesMemberlyg:PurchasedOrOriginatedCreditimpairedMember2023-12-310001160106lyg:RetailMortgagesMemberlyg:RetailMortgagesMember2023-12-310001160106lyg:RetailMortgagesMember2023-01-012023-12-310001160106lyg:RetailCreditCardsMemberlyg:Stage1Member2022-12-310001160106lyg:RetailCreditCardsMemberlyg:Stage2Member2022-12-310001160106lyg:RetailCreditCardsMemberlyg:Stage3Member2022-12-310001160106lyg:RetailCreditCardsMember2022-12-310001160106lyg:RetailCreditCardsMemberlyg:Stage1Member2022-12-310001160106lyg:RetailCreditCardsMemberlyg:Stage2Member2022-12-310001160106lyg:RetailCreditCardsMemberlyg:Stage3Member2022-12-310001160106lyg:RetailCreditCardsMember2022-12-310001160106lyg:RetailCreditCardsMemberlyg:Stage1Member2023-01-012023-12-310001160106lyg:RetailCreditCardsMemberlyg:Stage2Member2023-01-012023-12-310001160106lyg:RetailCreditCardsMemberlyg:Stage3Member2023-01-012023-12-310001160106lyg:RetailCreditCardsMember2023-01-012023-12-310001160106lyg:RetailCreditCardsMemberlyg:Stage1Member2023-01-012023-12-310001160106lyg:RetailCreditCardsMemberlyg:Stage2Member2023-01-012023-12-310001160106lyg:RetailCreditCardsMemberlyg:Stage3Member2023-01-012023-12-310001160106lyg:RetailCreditCardsMember2023-01-012023-12-310001160106lyg:RetailCreditCardsMemberlyg:Stage1Memberlyg:Stage1Member2023-01-012023-12-310001160106lyg:RetailCreditCardsMemberlyg:Stage2Memberlyg:Stage1Member2023-01-012023-12-310001160106lyg:RetailCreditCardsMemberlyg:Stage1Memberlyg:Stage3Member2023-01-012023-12-310001160106lyg:RetailCreditCardsMemberlyg:Stage1Member2023-01-012023-12-310001160106lyg:RetailCreditCardsMemberlyg:Stage1Memberlyg:Stage1Member2023-01-012023-12-310001160106lyg:RetailCreditCardsMemberlyg:Stage1Memberlyg:Stage2Member2023-01-012023-12-310001160106lyg:RetailCreditCardsMemberlyg:Stage1Memberlyg:Stage3Member2023-01-012023-12-310001160106lyg:RetailCreditCardsMemberlyg:Stage1Member2023-01-012023-12-310001160106lyg:Stage2Memberlyg:RetailCreditCardsMemberlyg:Stage1Member2023-01-012023-12-310001160106lyg:Stage2Memberlyg:RetailCreditCardsMemberlyg:Stage2Member2023-01-012023-12-310001160106lyg:Stage2Memberlyg:RetailCreditCardsMemberlyg:Stage3Member2023-01-012023-12-310001160106lyg:Stage2Memberlyg:RetailCreditCardsMember2023-01-012023-12-310001160106lyg:RetailCreditCardsMemberlyg:Stage1Memberlyg:Stage2Member2023-01-012023-12-310001160106lyg:RetailCreditCardsMemberlyg:Stage2Memberlyg:Stage2Member2023-01-012023-12-310001160106lyg:RetailCreditCardsMemberlyg:Stage3Memberlyg:Stage2Member2023-01-012023-12-310001160106lyg:RetailCreditCardsMemberlyg:Stage2Member2023-01-012023-12-310001160106lyg:RetailCreditCardsMemberlyg:Stage3Memberlyg:Stage1Member2023-01-012023-12-310001160106lyg:RetailCreditCardsMemberlyg:Stage3Memberlyg:Stage2Member2023-01-012023-12-310001160106lyg:RetailCreditCardsMemberlyg:Stage3Memberlyg:Stage3Member2023-01-012023-12-310001160106lyg:Stage3Memberlyg:RetailCreditCardsMember2023-01-012023-12-310001160106lyg:RetailCreditCardsMemberlyg:Stage3Memberlyg:Stage1Member2023-01-012023-12-310001160106lyg:RetailCreditCardsMemberlyg:Stage3Memberlyg:Stage2Member2023-01-012023-12-310001160106lyg:RetailCreditCardsMemberlyg:Stage3Memberlyg:Stage3Member2023-01-012023-12-310001160106lyg:RetailCreditCardsMemberlyg:Stage3Member2023-01-012023-12-310001160106lyg:RetailCreditCardsMember2023-01-012023-12-310001160106lyg:RetailCreditCardsMemberlyg:ImpactOfTransfersBetweenStagesMemberlyg:Stage1Member2023-01-012023-12-310001160106lyg:RetailCreditCardsMemberlyg:ImpactOfTransfersBetweenStagesMemberlyg:Stage2Member2023-01-012023-12-310001160106lyg:RetailCreditCardsMemberlyg:ImpactOfTransfersBetweenStagesMemberlyg:Stage3Member2023-01-012023-12-310001160106lyg:RetailCreditCardsMemberlyg:ImpactOfTransfersBetweenStagesMember2023-01-012023-12-310001160106lyg:RetailCreditCardsMemberlyg:Stage1Member2023-12-310001160106lyg:RetailCreditCardsMemberlyg:Stage2Member2023-12-310001160106lyg:RetailCreditCardsMemberlyg:Stage3Member2023-12-310001160106lyg:RetailCreditCardsMember2023-12-310001160106lyg:RetailCreditCardsMemberlyg:Stage1Member2023-12-310001160106lyg:RetailCreditCardsMemberlyg:Stage2Member2023-12-310001160106lyg:RetailCreditCardsMemberlyg:Stage3Member2023-12-310001160106lyg:RetailCreditCardsMember2023-12-310001160106lyg:RetailCreditCardsMemberlyg:Stage1Member2023-01-012023-12-310001160106lyg:RetailCreditCardsMemberlyg:Stage2Member2023-01-012023-12-310001160106lyg:RetailCreditCardsMemberlyg:Stage3Member2023-01-012023-12-310001160106lyg:CommercialBankingMemberlyg:Stage1Member2022-12-310001160106lyg:Stage2Memberlyg:CommercialBankingMember2022-12-310001160106lyg:CommercialBankingMemberlyg:Stage3Member2022-12-310001160106lyg:CommercialBankingMember2022-12-310001160106lyg:CommercialBankingMemberlyg:Stage1Member2022-12-310001160106lyg:CommercialBankingMemberlyg:Stage2Member2022-12-310001160106lyg:Stage3Memberlyg:CommercialBankingMember2022-12-310001160106lyg:CommercialBankingMember2022-12-310001160106lyg:CommercialBankingMemberlyg:Stage1Member2023-01-012023-12-310001160106lyg:Stage2Memberlyg:CommercialBankingMember2023-01-012023-12-310001160106lyg:CommercialBankingMemberlyg:Stage3Member2023-01-012023-12-310001160106lyg:CommercialBankingMember2023-01-012023-12-310001160106lyg:CommercialBankingMemberlyg:Stage1Member2023-01-012023-12-310001160106lyg:CommercialBankingMemberlyg:Stage2Member2023-01-012023-12-310001160106lyg:Stage3Memberlyg:CommercialBankingMember2023-01-012023-12-310001160106lyg:CommercialBankingMember2023-01-012023-12-310001160106lyg:CommercialBankingMemberlyg:Stage1Memberlyg:Stage1Member2023-01-012023-12-310001160106lyg:Stage2Memberlyg:CommercialBankingMemberlyg:Stage1Member2023-01-012023-12-310001160106lyg:CommercialBankingMemberlyg:Stage1Memberlyg:Stage3Member2023-01-012023-12-310001160106lyg:CommercialBankingMemberlyg:Stage1Member2023-01-012023-12-310001160106lyg:Stage1Memberlyg:CommercialBankingMemberlyg:Stage1Member2023-01-012023-12-310001160106lyg:Stage1Memberlyg:CommercialBankingMemberlyg:Stage2Member2023-01-012023-12-310001160106lyg:Stage1Memberlyg:Stage3Memberlyg:CommercialBankingMember2023-01-012023-12-310001160106lyg:Stage1Memberlyg:CommercialBankingMember2023-01-012023-12-310001160106lyg:Stage2Memberlyg:CommercialBankingMemberlyg:Stage1Member2023-01-012023-12-310001160106lyg:Stage2Memberlyg:Stage2Memberlyg:CommercialBankingMember2023-01-012023-12-310001160106lyg:Stage2Memberlyg:CommercialBankingMemberlyg:Stage3Member2023-01-012023-12-310001160106lyg:Stage2Memberlyg:CommercialBankingMember2023-01-012023-12-310001160106lyg:CommercialBankingMemberlyg:Stage1Memberlyg:Stage2Member2023-01-012023-12-310001160106lyg:CommercialBankingMemberlyg:Stage2Memberlyg:Stage2Member2023-01-012023-12-310001160106lyg:Stage3Memberlyg:CommercialBankingMemberlyg:Stage2Member2023-01-012023-12-310001160106lyg:CommercialBankingMemberlyg:Stage2Member2023-01-012023-12-310001160106lyg:Stage3Memberlyg:CommercialBankingMemberlyg:Stage1Member2023-01-012023-12-310001160106lyg:Stage3Memberlyg:Stage2Memberlyg:CommercialBankingMember2023-01-012023-12-310001160106lyg:Stage3Memberlyg:CommercialBankingMemberlyg:Stage3Member2023-01-012023-12-310001160106lyg:Stage3Memberlyg:CommercialBankingMember2023-01-012023-12-310001160106lyg:Stage3Memberlyg:CommercialBankingMemberlyg:Stage1Member2023-01-012023-12-310001160106lyg:Stage3Memberlyg:CommercialBankingMemberlyg:Stage2Member2023-01-012023-12-310001160106lyg:Stage3Memberlyg:Stage3Memberlyg:CommercialBankingMember2023-01-012023-12-310001160106lyg:Stage3Memberlyg:CommercialBankingMember2023-01-012023-12-310001160106lyg:ImpactOfTransfersBetweenStagesMemberlyg:CommercialBankingMemberlyg:Stage1Member2023-01-012023-12-310001160106lyg:ImpactOfTransfersBetweenStagesMemberlyg:CommercialBankingMemberlyg:Stage2Member2023-01-012023-12-310001160106lyg:ImpactOfTransfersBetweenStagesMemberlyg:Stage3Memberlyg:CommercialBankingMember2023-01-012023-12-310001160106lyg:ImpactOfTransfersBetweenStagesMemberlyg:CommercialBankingMember2023-01-012023-12-310001160106lyg:CommercialBankingMemberlyg:Stage1Member2023-12-310001160106lyg:Stage2Memberlyg:CommercialBankingMember2023-12-310001160106lyg:CommercialBankingMemberlyg:Stage3Member2023-12-310001160106lyg:CommercialBankingMember2023-12-310001160106lyg:CommercialBankingMemberlyg:Stage1Member2023-12-310001160106lyg:CommercialBankingMemberlyg:Stage2Member2023-12-310001160106lyg:Stage3Memberlyg:CommercialBankingMember2023-12-310001160106lyg:CommercialBankingMember2023-12-310001160106lyg:CommercialBankingMemberlyg:CommercialBankingMemberlyg:Stage1Member2023-12-310001160106lyg:Stage2Memberlyg:CommercialBankingMemberlyg:CommercialBankingMember2023-12-310001160106lyg:CommercialBankingMemberlyg:CommercialBankingMemberlyg:Stage3Member2023-12-310001160106lyg:CommercialBankingMemberlyg:CommercialBankingMember2023-12-310001160106lyg:LoansAndAdvancesToCustomersMemberlyg:Stage1Member2021-12-310001160106lyg:Stage2Memberlyg:LoansAndAdvancesToCustomersMember2021-12-310001160106lyg:Stage3Memberlyg:LoansAndAdvancesToCustomersMember2021-12-310001160106lyg:LoansAndAdvancesToCustomersMemberlyg:PurchasedOrOriginatedCreditimpairedMember2021-12-310001160106lyg:LoansAndAdvancesToCustomersMember2021-12-310001160106lyg:Stage1Memberlyg:LoansAndAdvancesToCustomersMember2021-12-310001160106lyg:Stage2Memberlyg:LoansAndAdvancesToCustomersMember2021-12-310001160106lyg:Stage3Memberlyg:LoansAndAdvancesToCustomersMember2021-12-310001160106lyg:PurchasedOrOriginatedCreditimpairedMemberlyg:LoansAndAdvancesToCustomersMember2021-12-310001160106lyg:LoansAndAdvancesToCustomersMember2021-12-310001160106lyg:LoansAndAdvancesToCustomersMemberlyg:Stage1Member2022-01-012022-12-310001160106lyg:Stage2Memberlyg:LoansAndAdvancesToCustomersMember2022-01-012022-12-310001160106lyg:Stage3Memberlyg:LoansAndAdvancesToCustomersMember2022-01-012022-12-310001160106lyg:LoansAndAdvancesToCustomersMemberlyg:PurchasedOrOriginatedCreditimpairedMember2022-01-012022-12-310001160106lyg:LoansAndAdvancesToCustomersMember2022-01-012022-12-310001160106lyg:Stage1Memberlyg:LoansAndAdvancesToCustomersMember2022-01-012022-12-310001160106lyg:Stage2Memberlyg:LoansAndAdvancesToCustomersMember2022-01-012022-12-310001160106lyg:Stage3Memberlyg:LoansAndAdvancesToCustomersMember2022-01-012022-12-310001160106lyg:PurchasedOrOriginatedCreditimpairedMemberlyg:LoansAndAdvancesToCustomersMember2022-01-012022-12-310001160106lyg:LoansAndAdvancesToCustomersMember2022-01-012022-12-310001160106lyg:Stage1Memberlyg:LoansAndAdvancesToCustomersMemberlyg:Stage1Member2022-01-012022-12-310001160106lyg:Stage2Memberlyg:Stage1Memberlyg:LoansAndAdvancesToCustomersMember2022-01-012022-12-310001160106lyg:Stage1Memberlyg:Stage3Memberlyg:LoansAndAdvancesToCustomersMember2022-01-012022-12-310001160106lyg:Stage1Memberlyg:LoansAndAdvancesToCustomersMember2022-01-012022-12-310001160106lyg:Stage1Memberlyg:Stage1Memberlyg:LoansAndAdvancesToCustomersMember2022-01-012022-12-310001160106lyg:Stage1Memberlyg:Stage2Memberlyg:LoansAndAdvancesToCustomersMember2022-01-012022-12-310001160106lyg:Stage1Memberlyg:Stage3Memberlyg:LoansAndAdvancesToCustomersMember2022-01-012022-12-310001160106lyg:Stage1Memberlyg:LoansAndAdvancesToCustomersMember2022-01-012022-12-310001160106lyg:Stage2Memberlyg:LoansAndAdvancesToCustomersMemberlyg:Stage1Member2022-01-012022-12-310001160106lyg:Stage2Memberlyg:Stage2Memberlyg:LoansAndAdvancesToCustomersMember2022-01-012022-12-310001160106lyg:Stage2Memberlyg:Stage3Memberlyg:LoansAndAdvancesToCustomersMember2022-01-012022-12-310001160106lyg:Stage2Memberlyg:LoansAndAdvancesToCustomersMember2022-01-012022-12-310001160106lyg:Stage1Memberlyg:Stage2Memberlyg:LoansAndAdvancesToCustomersMember2022-01-012022-12-310001160106lyg:Stage2Memberlyg:Stage2Memberlyg:LoansAndAdvancesToCustomersMember2022-01-012022-12-310001160106lyg:Stage3Memberlyg:Stage2Memberlyg:LoansAndAdvancesToCustomersMember2022-01-012022-12-310001160106lyg:Stage2Memberlyg:LoansAndAdvancesToCustomersMember2022-01-012022-12-310001160106lyg:Stage3Memberlyg:LoansAndAdvancesToCustomersMemberlyg:Stage1Member2022-01-012022-12-310001160106lyg:Stage3Memberlyg:Stage2Memberlyg:LoansAndAdvancesToCustomersMember2022-01-012022-12-310001160106lyg:Stage3Memberlyg:Stage3Memberlyg:LoansAndAdvancesToCustomersMember2022-01-012022-12-310001160106lyg:Stage3Memberlyg:LoansAndAdvancesToCustomersMember2022-01-012022-12-310001160106lyg:Stage3Memberlyg:Stage1Memberlyg:LoansAndAdvancesToCustomersMember2022-01-012022-12-310001160106lyg:Stage3Memberlyg:Stage2Memberlyg:LoansAndAdvancesToCustomersMember2022-01-012022-12-310001160106lyg:Stage3Memberlyg:Stage3Memberlyg:LoansAndAdvancesToCustomersMember2022-01-012022-12-310001160106lyg:Stage3Memberlyg:LoansAndAdvancesToCustomersMember2022-01-012022-12-310001160106lyg:ImpactOfTransfersBetweenStagesMemberlyg:Stage1Memberlyg:LoansAndAdvancesToCustomersMember2022-01-012022-12-310001160106lyg:ImpactOfTransfersBetweenStagesMemberlyg:Stage2Memberlyg:LoansAndAdvancesToCustomersMember2022-01-012022-12-310001160106lyg:ImpactOfTransfersBetweenStagesMemberlyg:Stage3Memberlyg:LoansAndAdvancesToCustomersMember2022-01-012022-12-310001160106lyg:ImpactOfTransfersBetweenStagesMemberlyg:LoansAndAdvancesToCustomersMember2022-01-012022-12-310001160106lyg:LoansAndAdvancesToCustomersMemberlyg:Stage1Memberlyg:LoansAndAdvancesToCustomersMember2022-12-310001160106lyg:Stage2Memberlyg:LoansAndAdvancesToCustomersMemberlyg:LoansAndAdvancesToCustomersMember2022-12-310001160106lyg:Stage3Memberlyg:LoansAndAdvancesToCustomersMemberlyg:LoansAndAdvancesToCustomersMember2022-12-310001160106lyg:LoansAndAdvancesToCustomersMemberlyg:PurchasedOrOriginatedCreditimpairedMemberlyg:LoansAndAdvancesToCustomersMember2022-12-310001160106lyg:LoansAndAdvancesToCustomersMemberlyg:LoansAndAdvancesToCustomersMember2022-12-310001160106lyg:LoansAndAdvancesToCustomersMemberlyg:Stage1Member2022-01-012022-12-310001160106lyg:Stage2Memberlyg:LoansAndAdvancesToCustomersMember2022-01-012022-12-310001160106lyg:Stage3Memberlyg:LoansAndAdvancesToCustomersMember2022-01-012022-12-310001160106lyg:LoansAndAdvancesToCustomersMemberlyg:PurchasedOrOriginatedCreditimpairedMember2022-01-012022-12-310001160106lyg:RetailMortgagesMemberlyg:Stage1Member2021-12-310001160106lyg:RetailMortgagesMemberlyg:Stage2Member2021-12-310001160106lyg:RetailMortgagesMemberlyg:Stage3Member2021-12-310001160106lyg:RetailMortgagesMemberlyg:PurchasedOrOriginatedCreditimpairedMember2021-12-310001160106lyg:RetailMortgagesMember2021-12-310001160106lyg:RetailMortgagesMemberlyg:Stage1Member2021-12-310001160106lyg:RetailMortgagesMemberlyg:Stage2Member2021-12-310001160106lyg:Stage3Memberlyg:RetailMortgagesMember2021-12-310001160106lyg:PurchasedOrOriginatedCreditimpairedMemberlyg:RetailMortgagesMember2021-12-310001160106lyg:RetailMortgagesMember2021-12-310001160106lyg:RetailMortgagesMemberlyg:Stage1Member2022-01-012022-12-310001160106lyg:RetailMortgagesMemberlyg:Stage2Member2022-01-012022-12-310001160106lyg:RetailMortgagesMemberlyg:Stage3Member2022-01-012022-12-310001160106lyg:RetailMortgagesMemberlyg:PurchasedOrOriginatedCreditimpairedMember2022-01-012022-12-310001160106lyg:RetailMortgagesMember2022-01-012022-12-310001160106lyg:RetailMortgagesMemberlyg:Stage1Member2022-01-012022-12-310001160106lyg:RetailMortgagesMemberlyg:Stage2Member2022-01-012022-12-310001160106lyg:Stage3Memberlyg:RetailMortgagesMember2022-01-012022-12-310001160106lyg:PurchasedOrOriginatedCreditimpairedMemberlyg:RetailMortgagesMember2022-01-012022-12-310001160106lyg:RetailMortgagesMember2022-01-012022-12-310001160106lyg:RetailMortgagesMemberlyg:Stage1Memberlyg:Stage1Member2022-01-012022-12-310001160106lyg:RetailMortgagesMemberlyg:Stage2Memberlyg:Stage1Member2022-01-012022-12-310001160106lyg:RetailMortgagesMemberlyg:Stage1Memberlyg:Stage3Member2022-01-012022-12-310001160106lyg:RetailMortgagesMemberlyg:Stage1Member2022-01-012022-12-310001160106lyg:Stage1Memberlyg:RetailMortgagesMemberlyg:Stage1Member2022-01-012022-12-310001160106lyg:Stage1Memberlyg:RetailMortgagesMemberlyg:Stage2Member2022-01-012022-12-310001160106lyg:Stage1Memberlyg:Stage3Memberlyg:RetailMortgagesMember2022-01-012022-12-310001160106lyg:Stage1Memberlyg:RetailMortgagesMember2022-01-012022-12-310001160106lyg:Stage2Memberlyg:RetailMortgagesMemberlyg:Stage1Member2022-01-012022-12-310001160106lyg:Stage2Memberlyg:RetailMortgagesMemberlyg:Stage2Member2022-01-012022-12-310001160106lyg:Stage2Memberlyg:RetailMortgagesMemberlyg:Stage3Member2022-01-012022-12-310001160106lyg:Stage2Memberlyg:RetailMortgagesMember2022-01-012022-12-310001160106lyg:RetailMortgagesMemberlyg:Stage1Memberlyg:Stage2Member2022-01-012022-12-310001160106lyg:RetailMortgagesMemberlyg:Stage2Memberlyg:Stage2Member2022-01-012022-12-310001160106lyg:Stage3Memberlyg:RetailMortgagesMemberlyg:Stage2Member2022-01-012022-12-310001160106lyg:RetailMortgagesMemberlyg:Stage2Member2022-01-012022-12-310001160106lyg:RetailMortgagesMemberlyg:Stage3Memberlyg:Stage1Member2022-01-012022-12-310001160106lyg:RetailMortgagesMemberlyg:Stage3Memberlyg:Stage2Member2022-01-012022-12-310001160106lyg:RetailMortgagesMemberlyg:Stage3Memberlyg:Stage3Member2022-01-012022-12-310001160106lyg:RetailMortgagesMemberlyg:Stage3Member2022-01-012022-12-310001160106lyg:Stage3Memberlyg:RetailMortgagesMemberlyg:Stage1Member2022-01-012022-12-310001160106lyg:Stage3Memberlyg:RetailMortgagesMemberlyg:Stage2Member2022-01-012022-12-310001160106lyg:Stage3Memberlyg:Stage3Memberlyg:RetailMortgagesMember2022-01-012022-12-310001160106lyg:Stage3Memberlyg:RetailMortgagesMember2022-01-012022-12-310001160106lyg:RetailMortgagesMember2022-01-012022-12-310001160106lyg:ImpactOfTransfersBetweenStagesMemberlyg:RetailMortgagesMemberlyg:Stage1Member2022-01-012022-12-310001160106lyg:ImpactOfTransfersBetweenStagesMemberlyg:RetailMortgagesMemberlyg:Stage2Member2022-01-012022-12-310001160106lyg:ImpactOfTransfersBetweenStagesMemberlyg:Stage3Memberlyg:RetailMortgagesMember2022-01-012022-12-310001160106lyg:ImpactOfTransfersBetweenStagesMemberlyg:RetailMortgagesMember2022-01-012022-12-310001160106lyg:RetailMortgagesMemberlyg:RetailMortgagesMemberlyg:Stage1Member2022-12-310001160106lyg:RetailMortgagesMemberlyg:Stage2Memberlyg:RetailMortgagesMember2022-12-310001160106lyg:RetailMortgagesMemberlyg:RetailMortgagesMemberlyg:Stage3Member2022-12-310001160106lyg:RetailMortgagesMemberlyg:RetailMortgagesMemberlyg:PurchasedOrOriginatedCreditimpairedMember2022-12-310001160106lyg:RetailMortgagesMemberlyg:RetailMortgagesMember2022-12-310001160106lyg:RetailCreditCardsMemberlyg:Stage1Member2021-12-310001160106lyg:RetailCreditCardsMemberlyg:Stage2Member2021-12-310001160106lyg:RetailCreditCardsMemberlyg:Stage3Member2021-12-310001160106lyg:RetailCreditCardsMember2021-12-310001160106lyg:RetailCreditCardsMemberlyg:Stage1Member2021-12-310001160106lyg:RetailCreditCardsMemberlyg:Stage2Member2021-12-310001160106lyg:RetailCreditCardsMemberlyg:Stage3Member2021-12-310001160106lyg:RetailCreditCardsMember2021-12-310001160106lyg:RetailCreditCardsMemberlyg:Stage1Member2022-01-012022-12-310001160106lyg:RetailCreditCardsMemberlyg:Stage2Member2022-01-012022-12-310001160106lyg:RetailCreditCardsMemberlyg:Stage3Member2022-01-012022-12-310001160106lyg:RetailCreditCardsMember2022-01-012022-12-310001160106lyg:RetailCreditCardsMemberlyg:Stage1Member2022-01-012022-12-310001160106lyg:RetailCreditCardsMemberlyg:Stage2Member2022-01-012022-12-310001160106lyg:RetailCreditCardsMemberlyg:Stage3Member2022-01-012022-12-310001160106lyg:RetailCreditCardsMember2022-01-012022-12-310001160106lyg:RetailCreditCardsMemberlyg:Stage1Memberlyg:Stage1Member2022-01-012022-12-310001160106lyg:RetailCreditCardsMemberlyg:Stage2Memberlyg:Stage1Member2022-01-012022-12-310001160106lyg:RetailCreditCardsMemberlyg:Stage1Memberlyg:Stage3Member2022-01-012022-12-310001160106lyg:RetailCreditCardsMemberlyg:Stage1Member2022-01-012022-12-310001160106lyg:RetailCreditCardsMemberlyg:Stage1Memberlyg:Stage1Member2022-01-012022-12-310001160106lyg:RetailCreditCardsMemberlyg:Stage1Memberlyg:Stage2Member2022-01-012022-12-310001160106lyg:RetailCreditCardsMemberlyg:Stage1Memberlyg:Stage3Member2022-01-012022-12-310001160106lyg:RetailCreditCardsMemberlyg:Stage1Member2022-01-012022-12-310001160106lyg:Stage2Memberlyg:RetailCreditCardsMemberlyg:Stage1Member2022-01-012022-12-310001160106lyg:Stage2Memberlyg:RetailCreditCardsMemberlyg:Stage2Member2022-01-012022-12-310001160106lyg:Stage2Memberlyg:RetailCreditCardsMemberlyg:Stage3Member2022-01-012022-12-310001160106lyg:Stage2Memberlyg:RetailCreditCardsMember2022-01-012022-12-310001160106lyg:RetailCreditCardsMemberlyg:Stage1Memberlyg:Stage2Member2022-01-012022-12-310001160106lyg:RetailCreditCardsMemberlyg:Stage2Memberlyg:Stage2Member2022-01-012022-12-310001160106lyg:RetailCreditCardsMemberlyg:Stage3Memberlyg:Stage2Member2022-01-012022-12-310001160106lyg:RetailCreditCardsMemberlyg:Stage2Member2022-01-012022-12-310001160106lyg:RetailCreditCardsMemberlyg:Stage3Memberlyg:Stage1Member2022-01-012022-12-310001160106lyg:RetailCreditCardsMemberlyg:Stage3Memberlyg:Stage2Member2022-01-012022-12-310001160106lyg:RetailCreditCardsMemberlyg:Stage3Memberlyg:Stage3Member2022-01-012022-12-310001160106lyg:Stage3Memberlyg:RetailCreditCardsMember2022-01-012022-12-310001160106lyg:RetailCreditCardsMemberlyg:Stage3Memberlyg:Stage1Member2022-01-012022-12-310001160106lyg:RetailCreditCardsMemberlyg:Stage3Memberlyg:Stage2Member2022-01-012022-12-310001160106lyg:RetailCreditCardsMemberlyg:Stage3Memberlyg:Stage3Member2022-01-012022-12-310001160106lyg:RetailCreditCardsMemberlyg:Stage3Member2022-01-012022-12-310001160106lyg:RetailCreditCardsMember2022-01-012022-12-310001160106lyg:RetailCreditCardsMemberlyg:ImpactOfTransfersBetweenStagesMemberlyg:Stage1Member2022-01-012022-12-310001160106lyg:RetailCreditCardsMemberlyg:ImpactOfTransfersBetweenStagesMemberlyg:Stage2Member2022-01-012022-12-310001160106lyg:RetailCreditCardsMemberlyg:ImpactOfTransfersBetweenStagesMemberlyg:Stage3Member2022-01-012022-12-310001160106lyg:RetailCreditCardsMemberlyg:ImpactOfTransfersBetweenStagesMember2022-01-012022-12-310001160106lyg:RetailCreditCardsMemberlyg:RetailCreditCardsMemberlyg:Stage1Member2022-12-310001160106lyg:RetailCreditCardsMemberlyg:RetailCreditCardsMemberlyg:Stage2Member2022-12-310001160106lyg:RetailCreditCardsMemberlyg:RetailCreditCardsMemberlyg:Stage3Member2022-12-310001160106lyg:RetailCreditCardsMemberlyg:RetailCreditCardsMember2022-12-310001160106lyg:RetailCreditCardsMemberlyg:Stage1Member2022-01-012022-12-310001160106lyg:RetailCreditCardsMemberlyg:Stage2Member2022-01-012022-12-310001160106lyg:RetailCreditCardsMemberlyg:Stage3Member2022-01-012022-12-310001160106lyg:CommercialBankingMemberlyg:Stage1Member2021-12-310001160106lyg:Stage2Memberlyg:CommercialBankingMember2021-12-310001160106lyg:CommercialBankingMemberlyg:Stage3Member2021-12-310001160106lyg:CommercialBankingMember2021-12-310001160106lyg:CommercialBankingMemberlyg:Stage1Member2021-12-310001160106lyg:CommercialBankingMemberlyg:Stage2Member2021-12-310001160106lyg:Stage3Memberlyg:CommercialBankingMember2021-12-310001160106lyg:CommercialBankingMember2021-12-310001160106lyg:CommercialBankingMemberlyg:Stage1Member2022-01-012022-12-310001160106lyg:Stage2Memberlyg:CommercialBankingMember2022-01-012022-12-310001160106lyg:CommercialBankingMemberlyg:Stage3Member2022-01-012022-12-310001160106lyg:CommercialBankingMember2022-01-012022-12-310001160106lyg:CommercialBankingMemberlyg:Stage1Member2022-01-012022-12-310001160106lyg:CommercialBankingMemberlyg:Stage2Member2022-01-012022-12-310001160106lyg:Stage3Memberlyg:CommercialBankingMember2022-01-012022-12-310001160106lyg:CommercialBankingMember2022-01-012022-12-310001160106lyg:CommercialBankingMemberlyg:Stage1Memberlyg:Stage1Member2022-01-012022-12-310001160106lyg:Stage2Memberlyg:CommercialBankingMemberlyg:Stage1Member2022-01-012022-12-310001160106lyg:CommercialBankingMemberlyg:Stage1Memberlyg:Stage3Member2022-01-012022-12-310001160106lyg:CommercialBankingMemberlyg:Stage1Member2022-01-012022-12-310001160106lyg:Stage1Memberlyg:CommercialBankingMemberlyg:Stage1Member2022-01-012022-12-310001160106lyg:Stage1Memberlyg:CommercialBankingMemberlyg:Stage2Member2022-01-012022-12-310001160106lyg:Stage1Memberlyg:Stage3Memberlyg:CommercialBankingMember2022-01-012022-12-310001160106lyg:Stage1Memberlyg:CommercialBankingMember2022-01-012022-12-310001160106lyg:Stage2Memberlyg:CommercialBankingMemberlyg:Stage1Member2022-01-012022-12-310001160106lyg:Stage2Memberlyg:Stage2Memberlyg:CommercialBankingMember2022-01-012022-12-310001160106lyg:Stage2Memberlyg:CommercialBankingMemberlyg:Stage3Member2022-01-012022-12-310001160106lyg:Stage2Memberlyg:CommercialBankingMember2022-01-012022-12-310001160106lyg:CommercialBankingMemberlyg:Stage1Memberlyg:Stage2Member2022-01-012022-12-310001160106lyg:CommercialBankingMemberlyg:Stage2Memberlyg:Stage2Member2022-01-012022-12-310001160106lyg:Stage3Memberlyg:CommercialBankingMemberlyg:Stage2Member2022-01-012022-12-310001160106lyg:CommercialBankingMemberlyg:Stage2Member2022-01-012022-12-310001160106lyg:Stage3Memberlyg:CommercialBankingMemberlyg:Stage1Member2022-01-012022-12-310001160106lyg:Stage3Memberlyg:Stage2Memberlyg:CommercialBankingMember2022-01-012022-12-310001160106lyg:Stage3Memberlyg:CommercialBankingMemberlyg:Stage3Member2022-01-012022-12-310001160106lyg:Stage3Memberlyg:CommercialBankingMember2022-01-012022-12-310001160106lyg:Stage3Memberlyg:CommercialBankingMemberlyg:Stage1Member2022-01-012022-12-310001160106lyg:Stage3Memberlyg:CommercialBankingMemberlyg:Stage2Member2022-01-012022-12-310001160106lyg:Stage3Memberlyg:Stage3Memberlyg:CommercialBankingMember2022-01-012022-12-310001160106lyg:Stage3Memberlyg:CommercialBankingMember2022-01-012022-12-310001160106lyg:ImpactOfTransfersBetweenStagesMemberlyg:CommercialBankingMemberlyg:Stage1Member2022-01-012022-12-310001160106lyg:ImpactOfTransfersBetweenStagesMemberlyg:CommercialBankingMemberlyg:Stage2Member2022-01-012022-12-310001160106lyg:ImpactOfTransfersBetweenStagesMemberlyg:Stage3Memberlyg:CommercialBankingMember2022-01-012022-12-310001160106lyg:ImpactOfTransfersBetweenStagesMemberlyg:CommercialBankingMember2022-01-012022-12-310001160106lyg:CommercialBankingMemberlyg:CommercialBankingMemberlyg:Stage1Member2022-12-310001160106lyg:Stage2Memberlyg:CommercialBankingMemberlyg:CommercialBankingMember2022-12-310001160106lyg:CommercialBankingMemberlyg:CommercialBankingMemberlyg:Stage3Member2022-12-310001160106lyg:CommercialBankingMemberlyg:CommercialBankingMember2022-12-310001160106lyg:CommercialBankingMemberlyg:Stage1Member2022-01-012022-12-310001160106lyg:Stage2Memberlyg:CommercialBankingMember2022-01-012022-12-310001160106lyg:CommercialBankingMemberlyg:Stage3Member2022-01-012022-12-310001160106lyg:DrawnBalanceMember2023-12-310001160106lyg:DrawnBalanceMember2022-12-310001160106lyg:Stage1Memberlyg:LoansAndAdvancesToBanksAndReverseRepurchaseAgreementsMember2023-12-310001160106lyg:Stage2Memberlyg:LoansAndAdvancesToBanksAndReverseRepurchaseAgreementsMember2023-12-310001160106lyg:Stage3Memberlyg:LoansAndAdvancesToBanksAndReverseRepurchaseAgreementsMember2023-12-310001160106lyg:PurchasedOrOriginatedCreditimpairedMemberlyg:LoansAndAdvancesToBanksAndReverseRepurchaseAgreementsMember2023-12-310001160106lyg:LoansAndAdvancesToBanksAndReverseRepurchaseAgreementsMember2023-12-310001160106lyg:Stage1Memberlyg:RetailMortgagesMember2023-12-310001160106lyg:RetailMortgagesMemberlyg:Stage2Member2023-12-310001160106lyg:Stage3Memberlyg:RetailMortgagesMember2023-12-310001160106lyg:PurchasedOrOriginatedCreditimpairedMemberlyg:RetailMortgagesMember2023-12-310001160106lyg:RetailMortgagesMember2023-12-310001160106lyg:RetailCreditCardsMemberlyg:Stage1Member2023-12-310001160106lyg:RetailCreditCardsMemberlyg:Stage2Member2023-12-310001160106lyg:RetailCreditCardsMemberlyg:Stage3Member2023-12-310001160106lyg:PurchasedOrOriginatedCreditimpairedMemberlyg:RetailCreditCardsMember2023-12-310001160106lyg:RetailCreditCardsMember2023-12-310001160106lyg:RetailOtherMemberlyg:Stage1Member2023-12-310001160106lyg:RetailOtherMemberlyg:Stage2Member2023-12-310001160106lyg:RetailOtherMemberlyg:Stage3Member2023-12-310001160106lyg:PurchasedOrOriginatedCreditimpairedMemberlyg:RetailOtherMember2023-12-310001160106lyg:RetailOtherMember2023-12-310001160106lyg:Stage1Memberlyg:RetailSegmentMember2023-12-310001160106lyg:RetailSegmentMemberlyg:Stage2Member2023-12-310001160106lyg:Stage3Memberlyg:RetailSegmentMember2023-12-310001160106lyg:PurchasedOrOriginatedCreditimpairedMemberlyg:RetailSegmentMember2023-12-310001160106lyg:RetailSegmentMember2023-12-310001160106lyg:Stage1Memberlyg:CommercialBankingMember2023-12-310001160106lyg:CommercialBankingMemberlyg:Stage2Member2023-12-310001160106lyg:Stage3Memberlyg:CommercialBankingMember2023-12-310001160106lyg:PurchasedOrOriginatedCreditimpairedMemberlyg:CommercialBankingMember2023-12-310001160106lyg:CommercialBankingMember2023-12-310001160106lyg:Stage1Memberlyg:OtherMember2023-12-310001160106lyg:OtherMemberlyg:Stage2Member2023-12-310001160106lyg:Stage3Memberlyg:OtherMember2023-12-310001160106lyg:PurchasedOrOriginatedCreditimpairedMemberlyg:OtherMember2023-12-310001160106lyg:OtherMember2023-12-310001160106lyg:LoansAndAdvancesToCustomersMemberlyg:Stage1Member2023-12-310001160106lyg:LoansAndAdvancesToCustomersMemberlyg:Stage2Member2023-12-310001160106lyg:LoansAndAdvancesToCustomersMemberlyg:Stage3Member2023-12-310001160106lyg:PurchasedOrOriginatedCreditimpairedMemberlyg:LoansAndAdvancesToCustomersMember2023-12-310001160106lyg:LoansAndAdvancesToCustomersMember2023-12-310001160106lyg:Stage1Memberifrs-full:DebtSecuritiesMember2023-12-310001160106ifrs-full:DebtSecuritiesMemberlyg:Stage2Member2023-12-310001160106lyg:Stage3Memberifrs-full:DebtSecuritiesMember2023-12-310001160106lyg:PurchasedOrOriginatedCreditimpairedMemberifrs-full:DebtSecuritiesMember2023-12-310001160106ifrs-full:DebtSecuritiesMember2023-12-310001160106ifrs-full:FinancialAssetsAtAmortisedCostMemberlyg:Stage1Member2023-12-310001160106ifrs-full:FinancialAssetsAtAmortisedCostMemberlyg:Stage2Member2023-12-310001160106ifrs-full:FinancialAssetsAtAmortisedCostMemberlyg:Stage3Member2023-12-310001160106ifrs-full:FinancialAssetsAtAmortisedCostMemberlyg:PurchasedOrOriginatedCreditimpairedMember2023-12-310001160106ifrs-full:FinancialAssetsAtAmortisedCostMember2023-12-310001160106lyg:Stage1Memberifrs-full:OtherAssetsMember2023-12-310001160106ifrs-full:OtherAssetsMemberlyg:Stage2Member2023-12-310001160106lyg:Stage3Memberifrs-full:OtherAssetsMember2023-12-310001160106lyg:PurchasedOrOriginatedCreditimpairedMemberifrs-full:OtherAssetsMember2023-12-310001160106ifrs-full:OtherAssetsMember2023-12-310001160106lyg:LoanCommitmentsAndFinancialGuaranteesMemberlyg:Stage1Member2023-12-310001160106lyg:LoanCommitmentsAndFinancialGuaranteesMemberlyg:Stage2Member2023-12-310001160106lyg:LoanCommitmentsAndFinancialGuaranteesMemberlyg:Stage3Member2023-12-310001160106lyg:PurchasedOrOriginatedCreditimpairedMemberlyg:LoanCommitmentsAndFinancialGuaranteesMember2023-12-310001160106lyg:LoanCommitmentsAndFinancialGuaranteesMember2023-12-310001160106lyg:Stage1Member2023-12-310001160106lyg:Stage2Member2023-12-310001160106lyg:Stage3Member2023-12-310001160106lyg:PurchasedOrOriginatedCreditimpairedMember2023-12-310001160106lyg:Stage1Member2023-01-012023-12-310001160106lyg:Stage2Member2023-01-012023-12-310001160106lyg:Stage3Member2023-01-012023-12-310001160106lyg:PurchasedOrOriginatedCreditimpairedMember2023-01-012023-12-310001160106lyg:Stage1Memberlyg:LoansAndAdvancesToBanksAndReverseRepurchaseAgreementsMember2022-12-310001160106lyg:Stage2Memberlyg:LoansAndAdvancesToBanksAndReverseRepurchaseAgreementsMember2022-12-310001160106lyg:Stage3Memberlyg:LoansAndAdvancesToBanksAndReverseRepurchaseAgreementsMember2022-12-310001160106lyg:PurchasedOrOriginatedCreditimpairedMemberlyg:LoansAndAdvancesToBanksAndReverseRepurchaseAgreementsMember2022-12-310001160106lyg:LoansAndAdvancesToBanksAndReverseRepurchaseAgreementsMember2022-12-310001160106lyg:Stage1Memberlyg:RetailMortgagesMember2022-12-310001160106lyg:RetailMortgagesMemberlyg:Stage2Member2022-12-310001160106lyg:Stage3Memberlyg:RetailMortgagesMember2022-12-310001160106lyg:PurchasedOrOriginatedCreditimpairedMemberlyg:RetailMortgagesMember2022-12-310001160106lyg:RetailMortgagesMember2022-12-310001160106lyg:RetailCreditCardsMemberlyg:Stage1Member2022-12-310001160106lyg:RetailCreditCardsMemberlyg:Stage2Member2022-12-310001160106lyg:RetailCreditCardsMemberlyg:Stage3Member2022-12-310001160106lyg:PurchasedOrOriginatedCreditimpairedMemberlyg:RetailCreditCardsMember2022-12-310001160106lyg:RetailCreditCardsMember2022-12-310001160106lyg:RetailOtherMemberlyg:Stage1Member2022-12-310001160106lyg:RetailOtherMemberlyg:Stage2Member2022-12-310001160106lyg:RetailOtherMemberlyg:Stage3Member2022-12-310001160106lyg:PurchasedOrOriginatedCreditimpairedMemberlyg:RetailOtherMember2022-12-310001160106lyg:RetailOtherMember2022-12-310001160106lyg:Stage1Memberlyg:RetailSegmentMember2022-12-310001160106lyg:RetailSegmentMemberlyg:Stage2Member2022-12-310001160106lyg:Stage3Memberlyg:RetailSegmentMember2022-12-310001160106lyg:PurchasedOrOriginatedCreditimpairedMemberlyg:RetailSegmentMember2022-12-310001160106lyg:RetailSegmentMember2022-12-310001160106lyg:Stage1Memberlyg:CommercialBankingMember2022-12-310001160106lyg:CommercialBankingMemberlyg:Stage2Member2022-12-310001160106lyg:Stage3Memberlyg:CommercialBankingMember2022-12-310001160106lyg:PurchasedOrOriginatedCreditimpairedMemberlyg:CommercialBankingMember2022-12-310001160106lyg:CommercialBankingMember2022-12-310001160106lyg:Stage1Memberlyg:OtherMember2022-12-310001160106lyg:OtherMemberlyg:Stage2Member2022-12-310001160106lyg:Stage3Memberlyg:OtherMember2022-12-310001160106lyg:PurchasedOrOriginatedCreditimpairedMemberlyg:OtherMember2022-12-310001160106lyg:OtherMember2022-12-310001160106lyg:LoansAndAdvancesToCustomersMemberlyg:Stage1Member2022-12-310001160106lyg:LoansAndAdvancesToCustomersMemberlyg:Stage2Member2022-12-310001160106lyg:LoansAndAdvancesToCustomersMemberlyg:Stage3Member2022-12-310001160106lyg:PurchasedOrOriginatedCreditimpairedMemberlyg:LoansAndAdvancesToCustomersMember2022-12-310001160106lyg:LoansAndAdvancesToCustomersMember2022-12-310001160106lyg:Stage1Memberifrs-full:DebtSecuritiesMember2022-12-310001160106ifrs-full:DebtSecuritiesMemberlyg:Stage2Member2022-12-310001160106lyg:Stage3Memberifrs-full:DebtSecuritiesMember2022-12-310001160106lyg:PurchasedOrOriginatedCreditimpairedMemberifrs-full:DebtSecuritiesMember2022-12-310001160106ifrs-full:DebtSecuritiesMember2022-12-310001160106ifrs-full:FinancialAssetsAtAmortisedCostMemberlyg:Stage1Member2022-12-310001160106ifrs-full:FinancialAssetsAtAmortisedCostMemberlyg:Stage2Member2022-12-310001160106ifrs-full:FinancialAssetsAtAmortisedCostMemberlyg:Stage3Member2022-12-310001160106ifrs-full:FinancialAssetsAtAmortisedCostMemberlyg:PurchasedOrOriginatedCreditimpairedMember2022-12-310001160106ifrs-full:FinancialAssetsAtAmortisedCostMember2022-12-310001160106lyg:Stage1Memberifrs-full:OtherAssetsMember2022-12-310001160106ifrs-full:OtherAssetsMemberlyg:Stage2Member2022-12-310001160106lyg:Stage3Memberifrs-full:OtherAssetsMember2022-12-310001160106lyg:PurchasedOrOriginatedCreditimpairedMemberifrs-full:OtherAssetsMember2022-12-310001160106ifrs-full:OtherAssetsMember2022-12-310001160106lyg:LoanCommitmentsAndFinancialGuaranteesMemberlyg:Stage1Member2022-12-310001160106lyg:LoanCommitmentsAndFinancialGuaranteesMemberlyg:Stage2Member2022-12-310001160106lyg:LoanCommitmentsAndFinancialGuaranteesMemberlyg:Stage3Member2022-12-310001160106lyg:PurchasedOrOriginatedCreditimpairedMemberlyg:LoanCommitmentsAndFinancialGuaranteesMember2022-12-310001160106lyg:LoanCommitmentsAndFinancialGuaranteesMember2022-12-310001160106lyg:Stage1Member2022-12-310001160106lyg:Stage2Member2022-12-310001160106lyg:Stage3Member2022-12-310001160106lyg:PurchasedOrOriginatedCreditimpairedMember2022-12-310001160106lyg:Stage1Member2022-01-012022-12-310001160106lyg:Stage2Member2022-01-012022-12-310001160106lyg:Stage3Member2022-01-012022-12-310001160106lyg:PurchasedOrOriginatedCreditimpairedMember2022-01-012022-12-310001160106lyg:Grade1Memberlyg:RetailMortgagesMember2023-01-012023-12-31lyg:grade0001160106lyg:RetailMortgagesMemberlyg:Grade2Member2023-01-012023-12-310001160106lyg:Grade3Memberlyg:RetailMortgagesMember2023-01-012023-12-310001160106lyg:Grade4Memberlyg:RetailMortgagesMember2023-01-012023-12-310001160106lyg:RetailMortgagesMemberlyg:Grade5Member2023-01-012023-12-310001160106lyg:RetailMortgagesMemberlyg:Grade6Member2023-01-012023-12-310001160106lyg:RetailMortgagesMemberlyg:Grade7Member2023-01-012023-12-310001160106lyg:Grade1Memberlyg:RetailCreditCardsMember2023-01-012023-12-310001160106lyg:RetailCreditCardsMemberlyg:Grade2Member2023-01-012023-12-310001160106lyg:Grade3Memberlyg:RetailCreditCardsMember2023-01-012023-12-310001160106lyg:Grade4Memberlyg:RetailCreditCardsMember2023-01-012023-12-310001160106lyg:Grade5Memberlyg:RetailCreditCardsMember2023-01-012023-12-310001160106lyg:RetailCreditCardsMemberlyg:Grade6Member2023-01-012023-12-310001160106lyg:RetailCreditCardsMemberlyg:Grade7Member2023-01-012023-12-310001160106lyg:RMSGrade1Member2023-12-310001160106lyg:RMSGrade2Member2023-12-310001160106lyg:RMSGrade3Member2023-12-310001160106lyg:RMSGrade4Member2023-12-310001160106lyg:RMSGrade5Member2023-12-310001160106lyg:RMSGrade6Member2023-12-310001160106lyg:RMSGrade7Member2023-12-310001160106lyg:RMSGrade8Member2023-12-310001160106lyg:RMSGrade9Member2023-12-310001160106lyg:RMSGrade10Member2023-12-310001160106lyg:RMSGrade11Member2023-12-310001160106lyg:RMSGrade12Member2023-12-310001160106lyg:RMSGrade13Member2023-12-310001160106lyg:RMSGrade14Member2023-12-310001160106lyg:ModelledECLMemberlyg:UKMortgagesMember2023-12-310001160106lyg:IndividuallyAssessedMemberlyg:UKMortgagesMember2023-12-310001160106lyg:UKMortgagesMemberlyg:InflationaryAndInterestRateRiskMember2023-12-310001160106lyg:UKMortgagesMemberlyg:OtherJudgementsNettingMember2023-12-310001160106lyg:UKMortgagesMember2023-12-310001160106lyg:ModelledECLMemberlyg:CreditCardsMember2023-12-310001160106lyg:IndividuallyAssessedMemberlyg:CreditCardsMember2023-12-310001160106lyg:InflationaryAndInterestRateRiskMemberlyg:CreditCardsMember2023-12-310001160106lyg:OtherJudgementsNettingMemberlyg:CreditCardsMember2023-12-310001160106lyg:CreditCardsMember2023-12-310001160106lyg:RetailExcludingUKMortgagesMemberlyg:ModelledECLMember2023-12-310001160106lyg:RetailExcludingUKMortgagesMemberlyg:IndividuallyAssessedMember2023-12-310001160106lyg:RetailExcludingUKMortgagesMemberlyg:InflationaryAndInterestRateRiskMember2023-12-310001160106lyg:RetailExcludingUKMortgagesMemberlyg:OtherJudgementsNettingMember2023-12-310001160106lyg:RetailExcludingUKMortgagesMember2023-12-310001160106lyg:CommercialBankingMemberlyg:ModelledECLMember2023-12-310001160106lyg:CommercialBankingMemberlyg:IndividuallyAssessedMember2023-12-310001160106lyg:CommercialBankingMemberlyg:InflationaryAndInterestRateRiskMember2023-12-310001160106lyg:CommercialBankingMemberlyg:OtherJudgementsNettingMember2023-12-310001160106lyg:CommercialBankingMember2023-12-310001160106lyg:ModelledECLMemberlyg:OtherMember2023-12-310001160106lyg:IndividuallyAssessedMemberlyg:OtherMember2023-12-310001160106lyg:InflationaryAndInterestRateRiskMemberlyg:OtherMember2023-12-310001160106lyg:OtherJudgementsNettingMemberlyg:OtherMember2023-12-310001160106lyg:OtherMember2023-12-310001160106lyg:ModelledECLMember2023-12-310001160106lyg:IndividuallyAssessedMember2023-12-310001160106lyg:InflationaryAndInterestRateRiskMember2023-12-310001160106lyg:OtherJudgementsNettingMember2023-12-310001160106lyg:ModelledECLMemberlyg:UKMortgagesMember2022-12-310001160106lyg:IndividuallyAssessedMemberlyg:UKMortgagesMember2022-12-310001160106lyg:UKMortgagesMemberlyg:InflationaryAndInterestRateRiskMember2022-12-310001160106lyg:UKMortgagesMemberlyg:OtherJudgementsNettingMember2022-12-310001160106lyg:UKMortgagesMember2022-12-310001160106lyg:ModelledECLMemberlyg:CreditCardsMember2022-12-310001160106lyg:IndividuallyAssessedMemberlyg:CreditCardsMember2022-12-310001160106lyg:InflationaryAndInterestRateRiskMemberlyg:CreditCardsMember2022-12-310001160106lyg:OtherJudgementsNettingMemberlyg:CreditCardsMember2022-12-310001160106lyg:CreditCardsMember2022-12-310001160106lyg:RetailExcludingUKMortgagesMemberlyg:ModelledECLMember2022-12-310001160106lyg:RetailExcludingUKMortgagesMemberlyg:IndividuallyAssessedMember2022-12-310001160106lyg:RetailExcludingUKMortgagesMemberlyg:InflationaryAndInterestRateRiskMember2022-12-310001160106lyg:RetailExcludingUKMortgagesMemberlyg:OtherJudgementsNettingMember2022-12-310001160106lyg:RetailExcludingUKMortgagesMember2022-12-310001160106lyg:CommercialBankingMemberlyg:ModelledECLMember2022-12-310001160106lyg:CommercialBankingMemberlyg:IndividuallyAssessedMember2022-12-310001160106lyg:CommercialBankingMemberlyg:InflationaryAndInterestRateRiskMember2022-12-310001160106lyg:CommercialBankingMemberlyg:OtherJudgementsNettingMember2022-12-310001160106lyg:CommercialBankingMember2022-12-310001160106lyg:ModelledECLMemberlyg:OtherMember2022-12-310001160106lyg:IndividuallyAssessedMemberlyg:OtherMember2022-12-310001160106lyg:InflationaryAndInterestRateRiskMemberlyg:OtherMember2022-12-310001160106lyg:OtherJudgementsNettingMemberlyg:OtherMember2022-12-310001160106lyg:OtherMember2022-12-310001160106lyg:ModelledECLMember2022-12-310001160106lyg:IndividuallyAssessedMember2022-12-310001160106lyg:InflationaryAndInterestRateRiskMember2022-12-310001160106lyg:OtherJudgementsNettingMember2022-12-310001160106lyg:JudgementsDueToCOVID19Member2022-12-310001160106lyg:CommercialBankingMemberlyg:IndividuallyAssessedMembersrt:MinimumMember2023-12-310001160106lyg:CommercialBankingMemberlyg:IndividuallyAssessedMembersrt:MaximumMember2023-12-310001160106lyg:CommercialBankingMemberlyg:IndividuallyAssessedMembersrt:MinimumMember2022-12-310001160106lyg:CommercialBankingMemberlyg:IndividuallyAssessedMembersrt:MaximumMember2022-12-310001160106lyg:ManagementAdjustmentsMember2023-01-012023-12-310001160106lyg:ManagementAdjustmentsMember2022-01-012022-12-310001160106lyg:MortgageAccountsInLongTermDefaultMemberlyg:OtherJudgementsMemberlyg:UKMortgagesMember2023-01-012023-12-310001160106lyg:MortgageAccountsInLongTermDefaultMemberlyg:OtherJudgementsMemberlyg:UKMortgagesMember2022-01-012022-12-310001160106lyg:AssetRecoveryValuesMemberlyg:OtherJudgementsMemberlyg:UKMortgagesMember2023-01-012023-12-310001160106lyg:AssetRecoveryValuesMemberlyg:OtherJudgementsMemberlyg:UKMortgagesMember2022-01-012022-12-310001160106lyg:AdjustmentForSpecificSegmentMemberlyg:OtherJudgementsMemberlyg:UKMortgagesMember2023-01-012023-12-310001160106lyg:AdjustmentForSpecificSegmentMemberlyg:OtherJudgementsMemberlyg:UKMortgagesMember2022-01-012022-12-310001160106lyg:Stage2OversensitivityMemberlyg:OtherJudgementsMemberlyg:UKMortgagesMember2023-01-012023-12-310001160106lyg:Stage2OversensitivityMemberlyg:OtherJudgementsMemberlyg:UKMortgagesMember2022-01-012022-12-310001160106lyg:OtherJudgementsMemberlyg:Stage2OversensitivityAssetsMovedBackToStage1Memberlyg:UKMortgagesMember2023-01-012023-12-310001160106lyg:OtherJudgementsMemberlyg:ExtensionOfModelledLifetimeOnRetailRevolvingProductsMemberlyg:CreditCardsMember2023-01-012023-12-310001160106lyg:OtherJudgementsMemberlyg:ExtensionOfModelledLifetimeOnRetailRevolvingProductsMemberlyg:CreditCardsMember2022-01-012022-12-310001160106lyg:RetailExcludingUKMortgagesMemberlyg:OtherJudgementsMemberlyg:ExtensionOfModelledLifetimeOnRetailRevolvingProductsMember2023-01-012023-12-310001160106lyg:RetailExcludingUKMortgagesMemberlyg:OtherJudgementsMemberlyg:ExtensionOfModelledLifetimeOnRetailRevolvingProductsMember2022-01-012022-12-310001160106lyg:OtherJudgementsMemberlyg:CreditCardLossGivenDefaultAlignmentMemberlyg:CreditCardsMember2023-01-012023-12-310001160106lyg:OtherJudgementsMemberlyg:CreditCardLossGivenDefaultAlignmentMemberlyg:CreditCardsMember2022-01-012022-12-310001160106lyg:RetailExcludingUKMortgagesMemberlyg:OtherJudgementsMemberlyg:CreditCardLossGivenDefaultAlignmentMember2023-01-012023-12-310001160106lyg:RetailExcludingUKMortgagesMemberlyg:OtherJudgementsMemberlyg:CreditCardLossGivenDefaultAlignmentMember2022-01-012022-12-310001160106lyg:CommercialBankingMemberlyg:OtherJudgementsMemberlyg:CorporateInsolvencyRatesMember2023-01-012023-12-310001160106lyg:CommercialBankingMemberlyg:OtherJudgementsMemberlyg:CorporateInsolvencyRatesMember2022-01-012022-12-310001160106lyg:CommercialBankingMemberlyg:LossGivenDefaultAlignmentLGDMemberlyg:OtherJudgementsMember2023-01-012023-12-310001160106lyg:CommercialBankingMemberlyg:LossGivenDefaultAlignmentLGDMemberlyg:OtherJudgementsMember2022-01-012022-12-310001160106lyg:CommercialBankingMemberlyg:OtherJudgementsMemberlyg:CommercialRealEstatePriceReductionMember2023-01-012023-12-310001160106lyg:CommercialBankingMemberlyg:OtherJudgementsMemberlyg:CommercialRealEstatePriceReductionMember2022-01-012022-12-310001160106lyg:BaseCaseMember2023-12-310001160106lyg:UpsideMember2022-12-310001160106lyg:DownsideMember2023-12-310001160106lyg:UpsideMember2023-12-310001160106lyg:BaseCaseMember2022-12-310001160106lyg:DownsideMember2022-12-310001160106lyg:SevereDownsideMember2023-12-310001160106lyg:SevereDownsideMember2022-12-310001160106lyg:CurrentReportingYearMemberlyg:UpsideMember2023-12-310001160106lyg:OneYearAfterReportingYearMemberlyg:UpsideMember2023-12-310001160106lyg:TwoYearsAfterReportingYearMemberlyg:UpsideMember2023-12-310001160106lyg:ThreeYearsAfterReportingYearMemberlyg:UpsideMember2023-12-310001160106lyg:FourYearsAfterReportingYearMemberlyg:UpsideMember2023-12-310001160106lyg:StartToPeakMemberlyg:UpsideMember2023-12-310001160106lyg:StartToTroughMemberlyg:UpsideMember2023-12-310001160106lyg:CurrentReportingYearMemberlyg:BaseCaseMember2023-12-310001160106lyg:OneYearAfterReportingYearMemberlyg:BaseCaseMember2023-12-310001160106lyg:TwoYearsAfterReportingYearMemberlyg:BaseCaseMember2023-12-310001160106lyg:ThreeYearsAfterReportingYearMemberlyg:BaseCaseMember2023-12-310001160106lyg:FourYearsAfterReportingYearMemberlyg:BaseCaseMember2023-12-310001160106lyg:StartToPeakMemberlyg:BaseCaseMember2023-12-310001160106lyg:StartToTroughMemberlyg:BaseCaseMember2023-12-310001160106lyg:CurrentReportingYearMemberlyg:DownsideMember2023-12-310001160106lyg:DownsideMemberlyg:OneYearAfterReportingYearMember2023-12-310001160106lyg:DownsideMemberlyg:TwoYearsAfterReportingYearMember2023-12-310001160106lyg:DownsideMemberlyg:ThreeYearsAfterReportingYearMember2023-12-310001160106lyg:DownsideMemberlyg:FourYearsAfterReportingYearMember2023-12-310001160106lyg:DownsideMemberlyg:StartToPeakMember2023-12-310001160106lyg:DownsideMemberlyg:StartToTroughMember2023-12-310001160106lyg:CurrentReportingYearMemberlyg:SevereDownsideMember2023-12-310001160106lyg:SevereDownsideMemberlyg:OneYearAfterReportingYearMember2023-12-310001160106lyg:SevereDownsideMemberlyg:TwoYearsAfterReportingYearMember2023-12-310001160106lyg:SevereDownsideMemberlyg:ThreeYearsAfterReportingYearMember2023-12-310001160106lyg:SevereDownsideMemberlyg:FourYearsAfterReportingYearMember2023-12-310001160106lyg:SevereDownsideMemberlyg:StartToPeakMember2023-12-310001160106lyg:SevereDownsideMemberlyg:StartToTroughMember2023-12-310001160106lyg:CurrentReportingYearMemberlyg:ProbabilityWeightedMember2023-12-310001160106lyg:OneYearAfterReportingYearMemberlyg:ProbabilityWeightedMember2023-12-310001160106lyg:TwoYearsAfterReportingYearMemberlyg:ProbabilityWeightedMember2023-12-310001160106lyg:ThreeYearsAfterReportingYearMemberlyg:ProbabilityWeightedMember2023-12-310001160106lyg:FourYearsAfterReportingYearMemberlyg:ProbabilityWeightedMember2023-12-310001160106lyg:ProbabilityWeightedMember2023-12-310001160106lyg:ProbabilityWeightedMemberlyg:StartToPeakMember2023-12-310001160106lyg:ProbabilityWeightedMemberlyg:StartToTroughMember2023-12-310001160106lyg:CurrentYearQuarterOneMemberlyg:BaseCaseMember2023-12-310001160106lyg:CurrentYearQuarterTwoMemberlyg:BaseCaseMember2023-12-310001160106lyg:CurrentYearQuarterThreeMemberlyg:BaseCaseMember2023-12-310001160106lyg:CurrentYearQuarterFourMemberlyg:BaseCaseMember2023-12-310001160106lyg:OneYearAfterReportingYearQuarterOneMemberlyg:BaseCaseMember2023-12-310001160106lyg:OneYearAfterReportingYearQuarterTwoMemberlyg:BaseCaseMember2023-12-310001160106lyg:OneYearAfterReportingYearQuarterThreeMemberlyg:BaseCaseMember2023-12-310001160106lyg:OneYearAfterReportingYearQuarterFourMemberlyg:BaseCaseMember2023-12-310001160106lyg:CurrentReportingYearMemberlyg:UpsideMember2022-12-310001160106lyg:OneYearAfterReportingYearMemberlyg:UpsideMember2022-12-310001160106lyg:TwoYearsAfterReportingYearMemberlyg:UpsideMember2022-12-310001160106lyg:ThreeYearsAfterReportingYearMemberlyg:UpsideMember2022-12-310001160106lyg:FourYearsAfterReportingYearMemberlyg:UpsideMember2022-12-310001160106lyg:StartToPeakMemberlyg:UpsideMember2022-12-310001160106lyg:StartToTroughMemberlyg:UpsideMember2022-12-310001160106lyg:CurrentReportingYearMemberlyg:BaseCaseMember2022-12-310001160106lyg:OneYearAfterReportingYearMemberlyg:BaseCaseMember2022-12-310001160106lyg:TwoYearsAfterReportingYearMemberlyg:BaseCaseMember2022-12-310001160106lyg:ThreeYearsAfterReportingYearMemberlyg:BaseCaseMember2022-12-310001160106lyg:FourYearsAfterReportingYearMemberlyg:BaseCaseMember2022-12-310001160106lyg:StartToPeakMemberlyg:BaseCaseMember2022-12-310001160106lyg:StartToTroughMemberlyg:BaseCaseMember2022-12-310001160106lyg:CurrentReportingYearMemberlyg:DownsideMember2022-12-310001160106lyg:DownsideMemberlyg:OneYearAfterReportingYearMember2022-12-310001160106lyg:DownsideMemberlyg:TwoYearsAfterReportingYearMember2022-12-310001160106lyg:DownsideMemberlyg:ThreeYearsAfterReportingYearMember2022-12-310001160106lyg:DownsideMemberlyg:FourYearsAfterReportingYearMember2022-12-310001160106lyg:DownsideMemberlyg:StartToPeakMember2022-12-310001160106lyg:DownsideMemberlyg:StartToTroughMember2022-12-310001160106lyg:CurrentReportingYearMemberlyg:SevereDownsideMember2022-12-310001160106lyg:SevereDownsideMemberlyg:OneYearAfterReportingYearMember2022-12-310001160106lyg:SevereDownsideMemberlyg:TwoYearsAfterReportingYearMember2022-12-310001160106lyg:SevereDownsideMemberlyg:ThreeYearsAfterReportingYearMember2022-12-310001160106lyg:SevereDownsideMemberlyg:FourYearsAfterReportingYearMember2022-12-310001160106lyg:SevereDownsideMemberlyg:StartToPeakMember2022-12-310001160106lyg:SevereDownsideMemberlyg:StartToTroughMember2022-12-310001160106lyg:CurrentReportingYearMemberlyg:ProbabilityWeightedMember2022-12-310001160106lyg:OneYearAfterReportingYearMemberlyg:ProbabilityWeightedMember2022-12-310001160106lyg:TwoYearsAfterReportingYearMemberlyg:ProbabilityWeightedMember2022-12-310001160106lyg:ThreeYearsAfterReportingYearMemberlyg:ProbabilityWeightedMember2022-12-310001160106lyg:FourYearsAfterReportingYearMemberlyg:ProbabilityWeightedMember2022-12-310001160106lyg:ProbabilityWeightedMember2022-12-310001160106lyg:ProbabilityWeightedMemberlyg:StartToPeakMember2022-12-310001160106lyg:ProbabilityWeightedMemberlyg:StartToTroughMember2022-12-310001160106lyg:CurrentYearQuarterOneMemberlyg:BaseCaseMember2022-12-310001160106lyg:CurrentYearQuarterTwoMemberlyg:BaseCaseMember2022-12-310001160106lyg:CurrentYearQuarterThreeMemberlyg:BaseCaseMember2022-12-310001160106lyg:CurrentYearQuarterFourMemberlyg:BaseCaseMember2022-12-310001160106lyg:OneYearAfterReportingYearQuarterOneMemberlyg:BaseCaseMember2022-12-310001160106lyg:OneYearAfterReportingYearQuarterTwoMemberlyg:BaseCaseMember2022-12-310001160106lyg:OneYearAfterReportingYearQuarterThreeMemberlyg:BaseCaseMember2022-12-310001160106lyg:OneYearAfterReportingYearQuarterFourMemberlyg:BaseCaseMember2022-12-310001160106lyg:ProbabilityWeightedMember2023-01-012023-12-310001160106lyg:ProbabilityWeightedMember2022-01-012022-12-310001160106lyg:UKMortgagesMemberlyg:ProbabilityWeightedMember2023-12-310001160106lyg:UKMortgagesMemberlyg:UpsideMember2023-12-310001160106lyg:UKMortgagesMemberlyg:BaseCaseMember2023-12-310001160106lyg:UKMortgagesMemberlyg:DownsideMember2023-12-310001160106lyg:SevereDownsideMemberlyg:UKMortgagesMember2023-12-310001160106lyg:UKMortgagesMemberlyg:ProbabilityWeightedMember2022-12-310001160106lyg:UKMortgagesMemberlyg:UpsideMember2022-12-310001160106lyg:UKMortgagesMemberlyg:BaseCaseMember2022-12-310001160106lyg:UKMortgagesMemberlyg:DownsideMember2022-12-310001160106lyg:SevereDownsideMemberlyg:UKMortgagesMember2022-12-310001160106lyg:ProbabilityWeightedMemberlyg:CreditCardsMember2023-12-310001160106lyg:UpsideMemberlyg:CreditCardsMember2023-12-310001160106lyg:BaseCaseMemberlyg:CreditCardsMember2023-12-310001160106lyg:DownsideMemberlyg:CreditCardsMember2023-12-310001160106lyg:SevereDownsideMemberlyg:CreditCardsMember2023-12-310001160106lyg:ProbabilityWeightedMemberlyg:CreditCardsMember2022-12-310001160106lyg:UpsideMemberlyg:CreditCardsMember2022-12-310001160106lyg:BaseCaseMemberlyg:CreditCardsMember2022-12-310001160106lyg:DownsideMemberlyg:CreditCardsMember2022-12-310001160106lyg:SevereDownsideMemberlyg:CreditCardsMember2022-12-310001160106lyg:RetailExcludingUKMortgagesMemberlyg:ProbabilityWeightedMember2023-12-310001160106lyg:RetailExcludingUKMortgagesMemberlyg:UpsideMember2023-12-310001160106lyg:RetailExcludingUKMortgagesMemberlyg:BaseCaseMember2023-12-310001160106lyg:RetailExcludingUKMortgagesMemberlyg:DownsideMember2023-12-310001160106lyg:RetailExcludingUKMortgagesMemberlyg:SevereDownsideMember2023-12-310001160106lyg:RetailExcludingUKMortgagesMemberlyg:ProbabilityWeightedMember2022-12-310001160106lyg:RetailExcludingUKMortgagesMemberlyg:UpsideMember2022-12-310001160106lyg:RetailExcludingUKMortgagesMemberlyg:BaseCaseMember2022-12-310001160106lyg:RetailExcludingUKMortgagesMemberlyg:DownsideMember2022-12-310001160106lyg:RetailExcludingUKMortgagesMemberlyg:SevereDownsideMember2022-12-310001160106lyg:CommercialBankingMemberlyg:ProbabilityWeightedMember2023-12-310001160106lyg:CommercialBankingMemberlyg:UpsideMember2023-12-310001160106lyg:CommercialBankingMemberlyg:BaseCaseMember2023-12-310001160106lyg:CommercialBankingMemberlyg:DownsideMember2023-12-310001160106lyg:CommercialBankingMemberlyg:SevereDownsideMember2023-12-310001160106lyg:CommercialBankingMemberlyg:ProbabilityWeightedMember2022-12-310001160106lyg:CommercialBankingMemberlyg:UpsideMember2022-12-310001160106lyg:CommercialBankingMemberlyg:BaseCaseMember2022-12-310001160106lyg:CommercialBankingMemberlyg:DownsideMember2022-12-310001160106lyg:CommercialBankingMemberlyg:SevereDownsideMember2022-12-310001160106lyg:ProbabilityWeightedMemberlyg:OtherMember2023-12-310001160106lyg:UpsideMemberlyg:OtherMember2023-12-310001160106lyg:BaseCaseMemberlyg:OtherMember2023-12-310001160106lyg:DownsideMemberlyg:OtherMember2023-12-310001160106lyg:SevereDownsideMemberlyg:OtherMember2023-12-310001160106lyg:ProbabilityWeightedMemberlyg:OtherMember2022-12-310001160106lyg:UpsideMemberlyg:OtherMember2022-12-310001160106lyg:BaseCaseMemberlyg:OtherMember2022-12-310001160106lyg:DownsideMemberlyg:OtherMember2022-12-310001160106lyg:SevereDownsideMemberlyg:OtherMember2022-12-310001160106lyg:UKMortgagesMemberlyg:UnemploymentIncrease1ppMember2023-12-310001160106lyg:UKMortgagesMemberlyg:UnemploymentDecrease1ppMember2023-12-310001160106lyg:UKMortgagesMemberlyg:UnemploymentIncrease1ppMember2022-12-310001160106lyg:UKMortgagesMemberlyg:UnemploymentDecrease1ppMember2022-12-310001160106lyg:UnemploymentIncrease1ppMemberlyg:CreditCardsMember2023-12-310001160106lyg:CreditCardsMemberlyg:UnemploymentDecrease1ppMember2023-12-310001160106lyg:UnemploymentIncrease1ppMemberlyg:CreditCardsMember2022-12-310001160106lyg:CreditCardsMemberlyg:UnemploymentDecrease1ppMember2022-12-310001160106lyg:RetailExcludingUKMortgagesMemberlyg:UnemploymentIncrease1ppMember2023-12-310001160106lyg:RetailExcludingUKMortgagesMemberlyg:UnemploymentDecrease1ppMember2023-12-310001160106lyg:RetailExcludingUKMortgagesMemberlyg:UnemploymentIncrease1ppMember2022-12-310001160106lyg:RetailExcludingUKMortgagesMemberlyg:UnemploymentDecrease1ppMember2022-12-310001160106lyg:CommercialBankingMemberlyg:UnemploymentIncrease1ppMember2023-12-310001160106lyg:CommercialBankingMemberlyg:UnemploymentDecrease1ppMember2023-12-310001160106lyg:CommercialBankingMemberlyg:UnemploymentIncrease1ppMember2022-12-310001160106lyg:CommercialBankingMemberlyg:UnemploymentDecrease1ppMember2022-12-310001160106lyg:UnemploymentIncrease1ppMember2023-12-310001160106lyg:UnemploymentDecrease1ppMember2023-12-310001160106lyg:UnemploymentIncrease1ppMember2022-12-310001160106lyg:UnemploymentDecrease1ppMember2022-12-310001160106lyg:HPI10ppIncreaseMember2023-12-310001160106lyg:HPI10ppDecreaseMember2023-12-310001160106lyg:HPI10ppIncreaseMember2022-12-310001160106lyg:HPI10ppDecreaseMember2022-12-310001160106lyg:BaseCaseMember2023-12-310001160106lyg:BaseCaseMember2022-12-310001160106lyg:Stage1Memberlyg:RetailMortgagesMemberlyg:UpsideMember2023-12-310001160106lyg:Stage1Memberlyg:RetailMortgagesMemberlyg:BaseCaseMember2023-12-310001160106lyg:DownsideMemberlyg:Stage1Memberlyg:RetailMortgagesMember2023-12-310001160106lyg:SevereDownsideMemberlyg:Stage1Memberlyg:RetailMortgagesMember2023-12-310001160106lyg:RetailCreditCardsMemberlyg:Stage1Memberlyg:UpsideMember2023-12-310001160106lyg:RetailCreditCardsMemberlyg:Stage1Memberlyg:BaseCaseMember2023-12-310001160106lyg:DownsideMemberlyg:RetailCreditCardsMemberlyg:Stage1Member2023-12-310001160106lyg:SevereDownsideMemberlyg:RetailCreditCardsMemberlyg:Stage1Member2023-12-310001160106lyg:RetailOtherMemberlyg:Stage1Memberlyg:UpsideMember2023-12-310001160106lyg:RetailOtherMemberlyg:Stage1Memberlyg:BaseCaseMember2023-12-310001160106lyg:DownsideMemberlyg:RetailOtherMemberlyg:Stage1Member2023-12-310001160106lyg:SevereDownsideMemberlyg:RetailOtherMemberlyg:Stage1Member2023-12-310001160106lyg:Stage1Memberlyg:CommercialBankingMemberlyg:UpsideMember2023-12-310001160106lyg:Stage1Memberlyg:BaseCaseMemberlyg:CommercialBankingMember2023-12-310001160106lyg:DownsideMemberlyg:Stage1Memberlyg:CommercialBankingMember2023-12-310001160106lyg:SevereDownsideMemberlyg:Stage1Memberlyg:CommercialBankingMember2023-12-310001160106lyg:Stage1Memberlyg:OtherMemberlyg:UpsideMember2023-12-310001160106lyg:Stage1Memberlyg:OtherMemberlyg:BaseCaseMember2023-12-310001160106lyg:DownsideMemberlyg:Stage1Memberlyg:OtherMember2023-12-310001160106lyg:SevereDownsideMemberlyg:Stage1Memberlyg:OtherMember2023-12-310001160106lyg:Stage1Memberlyg:UpsideMember2023-12-310001160106lyg:Stage1Memberlyg:BaseCaseMember2023-12-310001160106lyg:DownsideMemberlyg:Stage1Member2023-12-310001160106lyg:SevereDownsideMemberlyg:Stage1Member2023-12-310001160106lyg:RetailMortgagesMemberlyg:Stage2Memberlyg:UpsideMember2023-12-310001160106lyg:RetailMortgagesMemberlyg:BaseCaseMemberlyg:Stage2Member2023-12-310001160106lyg:DownsideMemberlyg:RetailMortgagesMemberlyg:Stage2Member2023-12-310001160106lyg:SevereDownsideMemberlyg:RetailMortgagesMemberlyg:Stage2Member2023-12-310001160106lyg:RetailCreditCardsMemberlyg:Stage2Memberlyg:UpsideMember2023-12-310001160106lyg:RetailCreditCardsMemberlyg:BaseCaseMemberlyg:Stage2Member2023-12-310001160106lyg:DownsideMemberlyg:RetailCreditCardsMemberlyg:Stage2Member2023-12-310001160106lyg:SevereDownsideMemberlyg:RetailCreditCardsMemberlyg:Stage2Member2023-12-310001160106lyg:RetailOtherMemberlyg:Stage2Memberlyg:UpsideMember2023-12-310001160106lyg:RetailOtherMemberlyg:BaseCaseMemberlyg:Stage2Member2023-12-310001160106lyg:DownsideMemberlyg:RetailOtherMemberlyg:Stage2Member2023-12-310001160106lyg:SevereDownsideMemberlyg:RetailOtherMemberlyg:Stage2Member2023-12-310001160106lyg:CommercialBankingMemberlyg:Stage2Memberlyg:UpsideMember2023-12-310001160106lyg:BaseCaseMemberlyg:CommercialBankingMemberlyg:Stage2Member2023-12-310001160106lyg:DownsideMemberlyg:CommercialBankingMemberlyg:Stage2Member2023-12-310001160106lyg:SevereDownsideMemberlyg:CommercialBankingMemberlyg:Stage2Member2023-12-310001160106lyg:OtherMemberlyg:Stage2Memberlyg:UpsideMember2023-12-310001160106lyg:OtherMemberlyg:BaseCaseMemberlyg:Stage2Member2023-12-310001160106lyg:DownsideMemberlyg:OtherMemberlyg:Stage2Member2023-12-310001160106lyg:SevereDownsideMemberlyg:OtherMemberlyg:Stage2Member2023-12-310001160106lyg:Stage2Memberlyg:UpsideMember2023-12-310001160106lyg:BaseCaseMemberlyg:Stage2Member2023-12-310001160106lyg:DownsideMemberlyg:Stage2Member2023-12-310001160106lyg:SevereDownsideMemberlyg:Stage2Member2023-12-310001160106lyg:Stage3Memberlyg:RetailMortgagesMemberlyg:UpsideMember2023-12-310001160106lyg:Stage3Memberlyg:RetailMortgagesMemberlyg:BaseCaseMember2023-12-310001160106lyg:DownsideMemberlyg:Stage3Memberlyg:RetailMortgagesMember2023-12-310001160106lyg:SevereDownsideMemberlyg:Stage3Memberlyg:RetailMortgagesMember2023-12-310001160106lyg:RetailCreditCardsMemberlyg:Stage3Memberlyg:UpsideMember2023-12-310001160106lyg:RetailCreditCardsMemberlyg:Stage3Memberlyg:BaseCaseMember2023-12-310001160106lyg:DownsideMemberlyg:RetailCreditCardsMemberlyg:Stage3Member2023-12-310001160106lyg:SevereDownsideMemberlyg:RetailCreditCardsMemberlyg:Stage3Member2023-12-310001160106lyg:RetailOtherMemberlyg:Stage3Memberlyg:UpsideMember2023-12-310001160106lyg:RetailOtherMemberlyg:Stage3Memberlyg:BaseCaseMember2023-12-310001160106lyg:DownsideMemberlyg:RetailOtherMemberlyg:Stage3Member2023-12-310001160106lyg:SevereDownsideMemberlyg:RetailOtherMemberlyg:Stage3Member2023-12-310001160106lyg:Stage3Memberlyg:CommercialBankingMemberlyg:UpsideMember2023-12-310001160106lyg:Stage3Memberlyg:BaseCaseMemberlyg:CommercialBankingMember2023-12-310001160106lyg:DownsideMemberlyg:Stage3Memberlyg:CommercialBankingMember2023-12-310001160106lyg:SevereDownsideMemberlyg:Stage3Memberlyg:CommercialBankingMember2023-12-310001160106lyg:Stage3Memberlyg:OtherMemberlyg:UpsideMember2023-12-310001160106lyg:Stage3Memberlyg:OtherMemberlyg:BaseCaseMember2023-12-310001160106lyg:DownsideMemberlyg:Stage3Memberlyg:OtherMember2023-12-310001160106lyg:SevereDownsideMemberlyg:Stage3Memberlyg:OtherMember2023-12-310001160106lyg:Stage3Memberlyg:UpsideMember2023-12-310001160106lyg:Stage3Memberlyg:BaseCaseMember2023-12-310001160106lyg:DownsideMemberlyg:Stage3Member2023-12-310001160106lyg:SevereDownsideMemberlyg:Stage3Member2023-12-310001160106lyg:RetailMortgagesMemberlyg:PurchasedOrOriginatedCreditImpairedMemberlyg:UpsideMember2023-12-310001160106lyg:RetailMortgagesMemberlyg:PurchasedOrOriginatedCreditImpairedMemberlyg:BaseCaseMember2023-12-310001160106lyg:DownsideMemberlyg:RetailMortgagesMemberlyg:PurchasedOrOriginatedCreditImpairedMember2023-12-310001160106lyg:SevereDownsideMemberlyg:RetailMortgagesMemberlyg:PurchasedOrOriginatedCreditImpairedMember2023-12-310001160106lyg:RetailMortgagesMemberlyg:UpsideMember2023-12-310001160106lyg:RetailMortgagesMemberlyg:BaseCaseMember2023-12-310001160106lyg:DownsideMemberlyg:RetailMortgagesMember2023-12-310001160106lyg:SevereDownsideMemberlyg:RetailMortgagesMember2023-12-310001160106lyg:RetailCreditCardsMemberlyg:UpsideMember2023-12-310001160106lyg:RetailCreditCardsMemberlyg:BaseCaseMember2023-12-310001160106lyg:DownsideMemberlyg:RetailCreditCardsMember2023-12-310001160106lyg:SevereDownsideMemberlyg:RetailCreditCardsMember2023-12-310001160106lyg:RetailOtherMemberlyg:UpsideMember2023-12-310001160106lyg:RetailOtherMemberlyg:BaseCaseMember2023-12-310001160106lyg:DownsideMemberlyg:RetailOtherMember2023-12-310001160106lyg:SevereDownsideMemberlyg:RetailOtherMember2023-12-310001160106lyg:CommercialBankingMemberlyg:UpsideMember2023-12-310001160106lyg:CommercialBankingMemberlyg:BaseCaseMember2023-12-310001160106lyg:DownsideMemberlyg:CommercialBankingMember2023-12-310001160106lyg:SevereDownsideMemberlyg:CommercialBankingMember2023-12-310001160106lyg:OtherMemberlyg:UpsideMember2023-12-310001160106lyg:OtherMemberlyg:BaseCaseMember2023-12-310001160106lyg:DownsideMemberlyg:OtherMember2023-12-310001160106lyg:SevereDownsideMemberlyg:OtherMember2023-12-310001160106lyg:UpsideMember2023-12-310001160106lyg:DownsideMember2023-12-310001160106lyg:SevereDownsideMember2023-12-310001160106lyg:Stage1Memberlyg:RetailMortgagesMemberlyg:UpsideMember2022-12-310001160106lyg:Stage1Memberlyg:RetailMortgagesMemberlyg:BaseCaseMember2022-12-310001160106lyg:DownsideMemberlyg:Stage1Memberlyg:RetailMortgagesMember2022-12-310001160106lyg:SevereDownsideMemberlyg:Stage1Memberlyg:RetailMortgagesMember2022-12-310001160106lyg:RetailCreditCardsMemberlyg:Stage1Memberlyg:UpsideMember2022-12-310001160106lyg:RetailCreditCardsMemberlyg:Stage1Memberlyg:BaseCaseMember2022-12-310001160106lyg:DownsideMemberlyg:RetailCreditCardsMemberlyg:Stage1Member2022-12-310001160106lyg:SevereDownsideMemberlyg:RetailCreditCardsMemberlyg:Stage1Member2022-12-310001160106lyg:RetailOtherMemberlyg:Stage1Memberlyg:UpsideMember2022-12-310001160106lyg:RetailOtherMemberlyg:Stage1Memberlyg:BaseCaseMember2022-12-310001160106lyg:DownsideMemberlyg:RetailOtherMemberlyg:Stage1Member2022-12-310001160106lyg:SevereDownsideMemberlyg:RetailOtherMemberlyg:Stage1Member2022-12-310001160106lyg:Stage1Memberlyg:CommercialBankingMemberlyg:UpsideMember2022-12-310001160106lyg:Stage1Memberlyg:BaseCaseMemberlyg:CommercialBankingMember2022-12-310001160106lyg:DownsideMemberlyg:Stage1Memberlyg:CommercialBankingMember2022-12-310001160106lyg:SevereDownsideMemberlyg:Stage1Memberlyg:CommercialBankingMember2022-12-310001160106lyg:Stage1Memberlyg:OtherMemberlyg:UpsideMember2022-12-310001160106lyg:Stage1Memberlyg:OtherMemberlyg:BaseCaseMember2022-12-310001160106lyg:DownsideMemberlyg:Stage1Memberlyg:OtherMember2022-12-310001160106lyg:SevereDownsideMemberlyg:Stage1Memberlyg:OtherMember2022-12-310001160106lyg:Stage1Memberlyg:UpsideMember2022-12-310001160106lyg:Stage1Memberlyg:BaseCaseMember2022-12-310001160106lyg:DownsideMemberlyg:Stage1Member2022-12-310001160106lyg:SevereDownsideMemberlyg:Stage1Member2022-12-310001160106lyg:RetailMortgagesMemberlyg:Stage2Memberlyg:UpsideMember2022-12-310001160106lyg:RetailMortgagesMemberlyg:BaseCaseMemberlyg:Stage2Member2022-12-310001160106lyg:DownsideMemberlyg:RetailMortgagesMemberlyg:Stage2Member2022-12-310001160106lyg:SevereDownsideMemberlyg:RetailMortgagesMemberlyg:Stage2Member2022-12-310001160106lyg:RetailCreditCardsMemberlyg:Stage2Memberlyg:UpsideMember2022-12-310001160106lyg:RetailCreditCardsMemberlyg:BaseCaseMemberlyg:Stage2Member2022-12-310001160106lyg:DownsideMemberlyg:RetailCreditCardsMemberlyg:Stage2Member2022-12-310001160106lyg:SevereDownsideMemberlyg:RetailCreditCardsMemberlyg:Stage2Member2022-12-310001160106lyg:RetailOtherMemberlyg:Stage2Memberlyg:UpsideMember2022-12-310001160106lyg:RetailOtherMemberlyg:BaseCaseMemberlyg:Stage2Member2022-12-310001160106lyg:DownsideMemberlyg:RetailOtherMemberlyg:Stage2Member2022-12-310001160106lyg:SevereDownsideMemberlyg:RetailOtherMemberlyg:Stage2Member2022-12-310001160106lyg:CommercialBankingMemberlyg:Stage2Memberlyg:UpsideMember2022-12-310001160106lyg:BaseCaseMemberlyg:CommercialBankingMemberlyg:Stage2Member2022-12-310001160106lyg:DownsideMemberlyg:CommercialBankingMemberlyg:Stage2Member2022-12-310001160106lyg:SevereDownsideMemberlyg:CommercialBankingMemberlyg:Stage2Member2022-12-310001160106lyg:OtherMemberlyg:Stage2Memberlyg:UpsideMember2022-12-310001160106lyg:OtherMemberlyg:BaseCaseMemberlyg:Stage2Member2022-12-310001160106lyg:DownsideMemberlyg:OtherMemberlyg:Stage2Member2022-12-310001160106lyg:SevereDownsideMemberlyg:OtherMemberlyg:Stage2Member2022-12-310001160106lyg:Stage2Memberlyg:UpsideMember2022-12-310001160106lyg:BaseCaseMemberlyg:Stage2Member2022-12-310001160106lyg:DownsideMemberlyg:Stage2Member2022-12-310001160106lyg:SevereDownsideMemberlyg:Stage2Member2022-12-310001160106lyg:Stage3Memberlyg:RetailMortgagesMemberlyg:UpsideMember2022-12-310001160106lyg:Stage3Memberlyg:RetailMortgagesMemberlyg:BaseCaseMember2022-12-310001160106lyg:DownsideMemberlyg:Stage3Memberlyg:RetailMortgagesMember2022-12-310001160106lyg:SevereDownsideMemberlyg:Stage3Memberlyg:RetailMortgagesMember2022-12-310001160106lyg:RetailCreditCardsMemberlyg:Stage3Memberlyg:UpsideMember2022-12-310001160106lyg:RetailCreditCardsMemberlyg:Stage3Memberlyg:BaseCaseMember2022-12-310001160106lyg:DownsideMemberlyg:RetailCreditCardsMemberlyg:Stage3Member2022-12-310001160106lyg:SevereDownsideMemberlyg:RetailCreditCardsMemberlyg:Stage3Member2022-12-310001160106lyg:RetailOtherMemberlyg:Stage3Memberlyg:UpsideMember2022-12-310001160106lyg:RetailOtherMemberlyg:Stage3Memberlyg:BaseCaseMember2022-12-310001160106lyg:DownsideMemberlyg:RetailOtherMemberlyg:Stage3Member2022-12-310001160106lyg:SevereDownsideMemberlyg:RetailOtherMemberlyg:Stage3Member2022-12-310001160106lyg:Stage3Memberlyg:CommercialBankingMemberlyg:UpsideMember2022-12-310001160106lyg:Stage3Memberlyg:BaseCaseMemberlyg:CommercialBankingMember2022-12-310001160106lyg:DownsideMemberlyg:Stage3Memberlyg:CommercialBankingMember2022-12-310001160106lyg:SevereDownsideMemberlyg:Stage3Memberlyg:CommercialBankingMember2022-12-310001160106lyg:Stage3Memberlyg:OtherMemberlyg:UpsideMember2022-12-310001160106lyg:Stage3Memberlyg:OtherMemberlyg:BaseCaseMember2022-12-310001160106lyg:DownsideMemberlyg:Stage3Memberlyg:OtherMember2022-12-310001160106lyg:SevereDownsideMemberlyg:Stage3Memberlyg:OtherMember2022-12-310001160106lyg:Stage3Memberlyg:UpsideMember2022-12-310001160106lyg:Stage3Memberlyg:BaseCaseMember2022-12-310001160106lyg:DownsideMemberlyg:Stage3Member2022-12-310001160106lyg:SevereDownsideMemberlyg:Stage3Member2022-12-310001160106lyg:RetailMortgagesMemberlyg:PurchasedOrOriginatedCreditImpairedMemberlyg:UpsideMember2022-12-310001160106lyg:RetailMortgagesMemberlyg:PurchasedOrOriginatedCreditImpairedMemberlyg:BaseCaseMember2022-12-310001160106lyg:DownsideMemberlyg:RetailMortgagesMemberlyg:PurchasedOrOriginatedCreditImpairedMember2022-12-310001160106lyg:SevereDownsideMemberlyg:RetailMortgagesMemberlyg:PurchasedOrOriginatedCreditImpairedMember2022-12-310001160106lyg:RetailMortgagesMemberlyg:UpsideMember2022-12-310001160106lyg:RetailMortgagesMemberlyg:BaseCaseMember2022-12-310001160106lyg:DownsideMemberlyg:RetailMortgagesMember2022-12-310001160106lyg:SevereDownsideMemberlyg:RetailMortgagesMember2022-12-310001160106lyg:RetailCreditCardsMemberlyg:UpsideMember2022-12-310001160106lyg:RetailCreditCardsMemberlyg:BaseCaseMember2022-12-310001160106lyg:DownsideMemberlyg:RetailCreditCardsMember2022-12-310001160106lyg:SevereDownsideMemberlyg:RetailCreditCardsMember2022-12-310001160106lyg:RetailOtherMemberlyg:UpsideMember2022-12-310001160106lyg:RetailOtherMemberlyg:BaseCaseMember2022-12-310001160106lyg:DownsideMemberlyg:RetailOtherMember2022-12-310001160106lyg:SevereDownsideMemberlyg:RetailOtherMember2022-12-310001160106lyg:CommercialBankingMemberlyg:UpsideMember2022-12-310001160106lyg:CommercialBankingMemberlyg:BaseCaseMember2022-12-310001160106lyg:DownsideMemberlyg:CommercialBankingMember2022-12-310001160106lyg:SevereDownsideMemberlyg:CommercialBankingMember2022-12-310001160106lyg:OtherMemberlyg:UpsideMember2022-12-310001160106lyg:OtherMemberlyg:BaseCaseMember2022-12-310001160106lyg:DownsideMemberlyg:OtherMember2022-12-310001160106lyg:SevereDownsideMemberlyg:OtherMember2022-12-310001160106lyg:UpsideMember2022-12-310001160106lyg:DownsideMember2022-12-310001160106lyg:SevereDownsideMember2022-12-310001160106lyg:MESDownsideAndSevereDownsideMember2023-12-310001160106srt:MaximumMemberlyg:TransitionRiskMemberlyg:UKMortgagesBuyToLetMember2023-12-310001160106lyg:PhysicalRiskMember2023-12-310001160106lyg:ScenarioRiskMacroLevelMembersrt:MaximumMemberlyg:Retail1Member2023-12-310001160106lyg:CommercialBankingMembersrt:MaximumMemberlyg:ScenarioRiskSectorLevelMember2023-12-310001160106lyg:UKMortgagesMembersrt:MaximumMemberlyg:PhysicalRiskMember2023-12-310001160106ifrs-full:NotLaterThanOneYearMember2023-12-310001160106ifrs-full:NotLaterThanOneYearMember2022-12-310001160106ifrs-full:LaterThanOneYearAndNotLaterThanTwoYearsMember2023-12-310001160106ifrs-full:LaterThanOneYearAndNotLaterThanTwoYearsMember2022-12-310001160106ifrs-full:LaterThanTwoYearsAndNotLaterThanThreeYearsMember2023-12-310001160106ifrs-full:LaterThanTwoYearsAndNotLaterThanThreeYearsMember2022-12-310001160106ifrs-full:LaterThanThreeYearsAndNotLaterThanFourYearsMember2023-12-310001160106ifrs-full:LaterThanThreeYearsAndNotLaterThanFourYearsMember2022-12-310001160106ifrs-full:LaterThanFourYearsAndNotLaterThanFiveYearsMember2023-12-310001160106ifrs-full:LaterThanFourYearsAndNotLaterThanFiveYearsMember2022-12-310001160106ifrs-full:LaterThanFiveYearsMember2023-12-310001160106ifrs-full:LaterThanFiveYearsMember2022-12-310001160106lyg:ElectricVehiclesMember2023-12-310001160106lyg:ElectricVehiclesMember2022-12-310001160106lyg:InternalCombustionEngineVehiclesMember2023-12-310001160106lyg:InternalCombustionEngineVehiclesMember2022-12-310001160106lyg:HybridVehiclesMember2023-12-310001160106lyg:HybridVehiclesMember2022-12-310001160106lyg:OtherLeasedAssetsMember2023-12-310001160106lyg:OtherLeasedAssetsMember2022-12-310001160106ifrs-full:GoodwillMemberifrs-full:GrossCarryingAmountMember2021-12-310001160106ifrs-full:ValueOfBusinessAcquiredMemberifrs-full:GrossCarryingAmountMember2021-12-310001160106ifrs-full:BrandNamesMemberifrs-full:GrossCarryingAmountMember2021-12-310001160106ifrs-full:GrossCarryingAmountMemberlyg:PurchasedCreditCardRelationshipsMember2021-12-310001160106ifrs-full:CustomerrelatedIntangibleAssetsMemberifrs-full:GrossCarryingAmountMember2021-12-310001160106ifrs-full:ComputerSoftwareMemberifrs-full:GrossCarryingAmountMember2021-12-310001160106ifrs-full:GrossCarryingAmountMember2021-12-310001160106ifrs-full:GoodwillMemberifrs-full:GrossCarryingAmountMember2022-01-012022-12-310001160106ifrs-full:ValueOfBusinessAcquiredMemberifrs-full:GrossCarryingAmountMember2022-01-012022-12-310001160106ifrs-full:BrandNamesMemberifrs-full:GrossCarryingAmountMember2022-01-012022-12-310001160106ifrs-full:GrossCarryingAmountMemberlyg:PurchasedCreditCardRelationshipsMember2022-01-012022-12-310001160106ifrs-full:CustomerrelatedIntangibleAssetsMemberifrs-full:GrossCarryingAmountMember2022-01-012022-12-310001160106ifrs-full:ComputerSoftwareMemberifrs-full:GrossCarryingAmountMember2022-01-012022-12-310001160106ifrs-full:GrossCarryingAmountMember2022-01-012022-12-310001160106ifrs-full:GoodwillMemberifrs-full:GrossCarryingAmountMember2022-12-310001160106ifrs-full:ValueOfBusinessAcquiredMemberifrs-full:GrossCarryingAmountMember2022-12-310001160106ifrs-full:BrandNamesMemberifrs-full:GrossCarryingAmountMember2022-12-310001160106ifrs-full:GrossCarryingAmountMemberlyg:PurchasedCreditCardRelationshipsMember2022-12-310001160106ifrs-full:CustomerrelatedIntangibleAssetsMemberifrs-full:GrossCarryingAmountMember2022-12-310001160106ifrs-full:ComputerSoftwareMemberifrs-full:GrossCarryingAmountMember2022-12-310001160106ifrs-full:GrossCarryingAmountMember2022-12-310001160106ifrs-full:GoodwillMemberifrs-full:GrossCarryingAmountMember2023-01-012023-12-310001160106ifrs-full:ValueOfBusinessAcquiredMemberifrs-full:GrossCarryingAmountMember2023-01-012023-12-310001160106ifrs-full:BrandNamesMemberifrs-full:GrossCarryingAmountMember2023-01-012023-12-310001160106ifrs-full:GrossCarryingAmountMemberlyg:PurchasedCreditCardRelationshipsMember2023-01-012023-12-310001160106ifrs-full:CustomerrelatedIntangibleAssetsMemberifrs-full:GrossCarryingAmountMember2023-01-012023-12-310001160106ifrs-full:ComputerSoftwareMemberifrs-full:GrossCarryingAmountMember2023-01-012023-12-310001160106ifrs-full:GrossCarryingAmountMember2023-01-012023-12-310001160106ifrs-full:GoodwillMemberifrs-full:GrossCarryingAmountMember2023-12-310001160106ifrs-full:ValueOfBusinessAcquiredMemberifrs-full:GrossCarryingAmountMember2023-12-310001160106ifrs-full:BrandNamesMemberifrs-full:GrossCarryingAmountMember2023-12-310001160106ifrs-full:GrossCarryingAmountMemberlyg:PurchasedCreditCardRelationshipsMember2023-12-310001160106ifrs-full:CustomerrelatedIntangibleAssetsMemberifrs-full:GrossCarryingAmountMember2023-12-310001160106ifrs-full:ComputerSoftwareMemberifrs-full:GrossCarryingAmountMember2023-12-310001160106ifrs-full:GrossCarryingAmountMember2023-12-310001160106ifrs-full:GoodwillMemberifrs-full:AccumulatedImpairmentMember2021-12-310001160106ifrs-full:ValueOfBusinessAcquiredMemberifrs-full:AccumulatedImpairmentMember2021-12-310001160106ifrs-full:BrandNamesMemberifrs-full:AccumulatedImpairmentMember2021-12-310001160106ifrs-full:AccumulatedImpairmentMemberlyg:PurchasedCreditCardRelationshipsMember2021-12-310001160106ifrs-full:AccumulatedImpairmentMemberifrs-full:CustomerrelatedIntangibleAssetsMember2021-12-310001160106ifrs-full:ComputerSoftwareMemberifrs-full:AccumulatedImpairmentMember2021-12-310001160106ifrs-full:AccumulatedImpairmentMember2021-12-310001160106ifrs-full:GoodwillMemberifrs-full:AccumulatedImpairmentMember2022-01-012022-12-310001160106ifrs-full:ValueOfBusinessAcquiredMemberifrs-full:AccumulatedImpairmentMember2022-01-012022-12-310001160106ifrs-full:BrandNamesMemberifrs-full:AccumulatedImpairmentMember2022-01-012022-12-310001160106ifrs-full:AccumulatedImpairmentMemberlyg:PurchasedCreditCardRelationshipsMember2022-01-012022-12-310001160106ifrs-full:AccumulatedImpairmentMemberifrs-full:CustomerrelatedIntangibleAssetsMember2022-01-012022-12-310001160106ifrs-full:ComputerSoftwareMemberifrs-full:AccumulatedImpairmentMember2022-01-012022-12-310001160106ifrs-full:AccumulatedImpairmentMember2022-01-012022-12-310001160106ifrs-full:GoodwillMemberifrs-full:AccumulatedImpairmentMember2022-12-310001160106ifrs-full:ValueOfBusinessAcquiredMemberifrs-full:AccumulatedImpairmentMember2022-12-310001160106ifrs-full:BrandNamesMemberifrs-full:AccumulatedImpairmentMember2022-12-310001160106ifrs-full:AccumulatedImpairmentMemberlyg:PurchasedCreditCardRelationshipsMember2022-12-310001160106ifrs-full:AccumulatedImpairmentMemberifrs-full:CustomerrelatedIntangibleAssetsMember2022-12-310001160106ifrs-full:ComputerSoftwareMemberifrs-full:AccumulatedImpairmentMember2022-12-310001160106ifrs-full:AccumulatedImpairmentMember2022-12-310001160106ifrs-full:GoodwillMemberifrs-full:AccumulatedImpairmentMember2023-01-012023-12-310001160106ifrs-full:ValueOfBusinessAcquiredMemberifrs-full:AccumulatedImpairmentMember2023-01-012023-12-310001160106ifrs-full:BrandNamesMemberifrs-full:AccumulatedImpairmentMember2023-01-012023-12-310001160106ifrs-full:AccumulatedImpairmentMemberlyg:PurchasedCreditCardRelationshipsMember2023-01-012023-12-310001160106ifrs-full:AccumulatedImpairmentMemberifrs-full:CustomerrelatedIntangibleAssetsMember2023-01-012023-12-310001160106ifrs-full:ComputerSoftwareMemberifrs-full:AccumulatedImpairmentMember2023-01-012023-12-310001160106ifrs-full:AccumulatedImpairmentMember2023-01-012023-12-310001160106ifrs-full:GoodwillMemberifrs-full:AccumulatedImpairmentMember2023-12-310001160106ifrs-full:ValueOfBusinessAcquiredMemberifrs-full:AccumulatedImpairmentMember2023-12-310001160106ifrs-full:BrandNamesMemberifrs-full:AccumulatedImpairmentMember2023-12-310001160106ifrs-full:AccumulatedImpairmentMemberlyg:PurchasedCreditCardRelationshipsMember2023-12-310001160106ifrs-full:AccumulatedImpairmentMemberifrs-full:CustomerrelatedIntangibleAssetsMember2023-12-310001160106ifrs-full:ComputerSoftwareMemberifrs-full:AccumulatedImpairmentMember2023-12-310001160106ifrs-full:AccumulatedImpairmentMember2023-12-310001160106ifrs-full:GoodwillMember2023-12-310001160106ifrs-full:ValueOfBusinessAcquiredMember2023-12-310001160106ifrs-full:BrandNamesMember2023-12-310001160106lyg:PurchasedCreditCardRelationshipsMember2023-12-310001160106ifrs-full:CustomerrelatedIntangibleAssetsMember2023-12-310001160106ifrs-full:ComputerSoftwareMember2023-12-310001160106ifrs-full:GoodwillMember2022-12-310001160106ifrs-full:ValueOfBusinessAcquiredMember2022-12-310001160106ifrs-full:BrandNamesMember2022-12-310001160106lyg:PurchasedCreditCardRelationshipsMember2022-12-310001160106ifrs-full:CustomerrelatedIntangibleAssetsMember2022-12-310001160106ifrs-full:ComputerSoftwareMember2022-12-310001160106lyg:CoreDepositIntangibleMember2022-12-310001160106lyg:CoreDepositIntangibleMember2023-12-310001160106lyg:CoreDepositIntangibleMemberifrs-full:GrossCarryingAmountMember2023-12-310001160106lyg:CoreDepositIntangibleMemberifrs-full:GrossCarryingAmountMember2022-12-310001160106lyg:CoreDepositIntangibleMemberifrs-full:AccumulatedImpairmentMember2023-12-310001160106lyg:CoreDepositIntangibleMemberifrs-full:AccumulatedImpairmentMember2022-12-310001160106lyg:Hamsard3352LimitedTuskerMember2023-02-210001160106lyg:Hamsard3352LimitedTuskerMember2023-01-012023-12-310001160106lyg:Hamsard3352LimitedTuskerMember2023-02-212023-12-310001160106lyg:LifeAndPensionsMember2023-12-310001160106lyg:LifeAndPensionsMember2023-01-012023-12-310001160106lyg:LifeAndPensionsMember2022-12-310001160106lyg:LifeAndPensionsMember2022-01-012022-12-310001160106lyg:CreditCardCashGeneratingUnitMember2023-12-310001160106lyg:CreditCardCashGeneratingUnitMember2023-01-012023-12-310001160106lyg:CreditCardCashGeneratingUnitMember2022-12-310001160106lyg:CreditCardCashGeneratingUnitMember2022-01-012022-12-310001160106lyg:MotorBusinessCashGeneratingUnitMember2023-12-310001160106lyg:MotorBusinessCashGeneratingUnitMember2023-01-012023-12-310001160106lyg:MotorBusinessCashGeneratingUnitMember2022-12-310001160106lyg:MotorBusinessCashGeneratingUnitMember2022-01-012022-12-310001160106lyg:ScottishWidowsMember2023-12-310001160106lyg:MotorFinanceMember2023-12-310001160106lyg:MotorFinanceMember2023-01-012023-12-310001160106lyg:CardsMember2023-12-310001160106lyg:OEICMember2023-01-012023-12-310001160106lyg:OEICMember2022-01-012022-12-310001160106ifrs-full:BrandNamesMemberlyg:BankOfScotlandPlcMember2023-12-310001160106ifrs-full:BrandNamesMemberlyg:BankOfScotlandPlcMember2022-12-310001160106ifrs-full:InvestmentPropertyMember2023-12-310001160106ifrs-full:InvestmentPropertyMember2022-12-310001160106ifrs-full:BuildingsMember2023-12-310001160106ifrs-full:BuildingsMember2022-12-310001160106ifrs-full:OtherPropertyPlantAndEquipmentMember2023-12-310001160106ifrs-full:OtherPropertyPlantAndEquipmentMember2022-12-310001160106ifrs-full:PropertyPlantAndEquipmentSubjectToOperatingLeasesMember2023-12-310001160106ifrs-full:PropertyPlantAndEquipmentSubjectToOperatingLeasesMember2022-12-310001160106ifrs-full:RightofuseAssetsMember2023-12-310001160106ifrs-full:RightofuseAssetsMember2022-12-310001160106ifrs-full:InvestmentPropertyMemberifrs-full:GrossCarryingAmountMember2022-12-310001160106ifrs-full:InvestmentPropertyMemberifrs-full:GrossCarryingAmountMember2021-12-310001160106ifrs-full:InvestmentPropertyMemberifrs-full:GrossCarryingAmountMember2023-01-012023-12-310001160106ifrs-full:InvestmentPropertyMemberifrs-full:GrossCarryingAmountMember2022-01-012022-12-310001160106ifrs-full:InvestmentPropertyMemberifrs-full:GrossCarryingAmountMember2023-12-310001160106lyg:ElectricVehiclesMemberifrs-full:PropertyPlantAndEquipmentSubjectToOperatingLeasesMember2023-12-310001160106lyg:ElectricVehiclesMemberifrs-full:PropertyPlantAndEquipmentSubjectToOperatingLeasesMember2022-12-310001160106ifrs-full:PropertyPlantAndEquipmentSubjectToOperatingLeasesMemberlyg:InternalCombustionEngineVehiclesMember2023-12-310001160106ifrs-full:PropertyPlantAndEquipmentSubjectToOperatingLeasesMemberlyg:InternalCombustionEngineVehiclesMember2022-12-310001160106ifrs-full:PropertyPlantAndEquipmentSubjectToOperatingLeasesMemberlyg:HybridVehiclesMember2023-12-310001160106ifrs-full:PropertyPlantAndEquipmentSubjectToOperatingLeasesMemberlyg:HybridVehiclesMember2022-12-310001160106ifrs-full:PropertyPlantAndEquipmentSubjectToOperatingLeasesMemberlyg:OtherLeasedAssetsMember2023-12-310001160106ifrs-full:PropertyPlantAndEquipmentSubjectToOperatingLeasesMemberlyg:OtherLeasedAssetsMember2022-12-310001160106ifrs-full:FinancialLiabilitiesAtFairValueThroughProfitOrLossCategoryMember2023-12-310001160106ifrs-full:FinancialLiabilitiesAtAmortisedCostCategoryMember2023-12-310001160106ifrs-full:FinancialLiabilitiesAtFairValueThroughProfitOrLossCategoryMember2022-12-310001160106ifrs-full:FinancialLiabilitiesAtAmortisedCostCategoryMember2022-12-310001160106lyg:NetCoveredBondProgrammesMemberifrs-full:SecuritiesLendingMemberlyg:CoveredBondProgrammeMember2023-12-310001160106lyg:NetCoveredBondProgrammesMemberifrs-full:SecuritiesLendingMemberlyg:CoveredBondProgrammeMember2022-12-31lyg:programme0001160106lyg:SecuritisationProgrammeMemberifrs-full:SecuritiesLendingMember2023-12-310001160106lyg:SecuritisationProgrammeMemberifrs-full:SecuritiesLendingMember2022-12-310001160106lyg:SecuritisationProgrammeMember2023-12-310001160106lyg:SecuritisationProgrammeMember2022-12-310001160106ifrs-full:InsuranceContractsOtherThanThoseToWhichPremiumAllocationApproachHasBeenAppliedMember2023-12-310001160106ifrs-full:InsuranceContractsToWhichPremiumAllocationApproachHasBeenAppliedMember2023-12-310001160106ifrs-full:InsuranceContractsOtherThanThoseToWhichPremiumAllocationApproachHasBeenAppliedMember2022-12-310001160106ifrs-full:InsuranceContractsToWhichPremiumAllocationApproachHasBeenAppliedMember2022-12-310001160106lyg:OneYearMember2023-12-310001160106lyg:FiveYearsMember2023-12-310001160106lyg:TenYearsMember2023-12-310001160106lyg:TwentyYearsMember2023-12-310001160106lyg:ThirtyYearsMember2023-12-310001160106lyg:OneYearMember2022-12-310001160106lyg:FiveYearsMember2022-12-310001160106lyg:TenYearsMember2022-12-310001160106lyg:TwentyYearsMember2022-12-310001160106lyg:ThirtyYearsMember2022-12-310001160106srt:MinimumMember2023-01-012023-12-310001160106srt:MaximumMember2023-01-012023-12-310001160106srt:MinimumMember2022-01-012022-12-310001160106srt:MaximumMember2022-01-012022-12-310001160106ifrs-full:InsuranceContractsOtherThanThoseToWhichPremiumAllocationApproachHasBeenAppliedMemberifrs-full:NetLiabilitiesOrAssetsForRemainingCoverageExcludingLossComponentMember2022-12-310001160106ifrs-full:InsuranceContractsOtherThanThoseToWhichPremiumAllocationApproachHasBeenAppliedMemberifrs-full:LossComponentMember2022-12-310001160106ifrs-full:InsuranceContractsOtherThanThoseToWhichPremiumAllocationApproachHasBeenAppliedMemberifrs-full:LiabilitiesForIncurredClaimsMember2022-12-310001160106ifrs-full:InsuranceContractsOtherThanThoseToWhichPremiumAllocationApproachHasBeenAppliedMemberifrs-full:NetLiabilitiesOrAssetsForRemainingCoverageExcludingLossComponentMember2021-12-310001160106ifrs-full:InsuranceContractsOtherThanThoseToWhichPremiumAllocationApproachHasBeenAppliedMemberifrs-full:LossComponentMember2021-12-310001160106ifrs-full:InsuranceContractsOtherThanThoseToWhichPremiumAllocationApproachHasBeenAppliedMemberifrs-full:LiabilitiesForIncurredClaimsMember2021-12-310001160106ifrs-full:InsuranceContractsOtherThanThoseToWhichPremiumAllocationApproachHasBeenAppliedMember2021-12-310001160106ifrs-full:InsuranceContractsOtherThanThoseToWhichPremiumAllocationApproachHasBeenAppliedMemberifrs-full:NetLiabilitiesOrAssetsForRemainingCoverageExcludingLossComponentMember2023-01-012023-12-310001160106ifrs-full:InsuranceContractsOtherThanThoseToWhichPremiumAllocationApproachHasBeenAppliedMemberifrs-full:LossComponentMember2023-01-012023-12-310001160106ifrs-full:InsuranceContractsOtherThanThoseToWhichPremiumAllocationApproachHasBeenAppliedMemberifrs-full:LiabilitiesForIncurredClaimsMember2023-01-012023-12-310001160106ifrs-full:InsuranceContractsOtherThanThoseToWhichPremiumAllocationApproachHasBeenAppliedMemberifrs-full:NetLiabilitiesOrAssetsForRemainingCoverageExcludingLossComponentMember2022-01-012022-12-310001160106ifrs-full:InsuranceContractsOtherThanThoseToWhichPremiumAllocationApproachHasBeenAppliedMemberifrs-full:LossComponentMember2022-01-012022-12-310001160106ifrs-full:InsuranceContractsOtherThanThoseToWhichPremiumAllocationApproachHasBeenAppliedMemberifrs-full:LiabilitiesForIncurredClaimsMember2022-01-012022-12-310001160106ifrs-full:InsuranceContractsOtherThanThoseToWhichPremiumAllocationApproachHasBeenAppliedMemberifrs-full:NetLiabilitiesOrAssetsForRemainingCoverageExcludingLossComponentMember2023-12-310001160106ifrs-full:InsuranceContractsOtherThanThoseToWhichPremiumAllocationApproachHasBeenAppliedMemberifrs-full:LossComponentMember2023-12-310001160106ifrs-full:InsuranceContractsOtherThanThoseToWhichPremiumAllocationApproachHasBeenAppliedMemberifrs-full:LiabilitiesForIncurredClaimsMember2023-12-310001160106ifrs-full:InsuranceContractsToWhichPremiumAllocationApproachHasBeenAppliedMemberifrs-full:NetLiabilitiesOrAssetsForRemainingCoverageExcludingLossComponentMember2022-12-310001160106ifrs-full:LossComponentMemberifrs-full:InsuranceContractsToWhichPremiumAllocationApproachHasBeenAppliedMember2022-12-310001160106ifrs-full:LiabilitiesForIncurredClaimsMemberifrs-full:InsuranceContractsToWhichPremiumAllocationApproachHasBeenAppliedMember2022-12-310001160106ifrs-full:InsuranceContractsToWhichPremiumAllocationApproachHasBeenAppliedMemberifrs-full:NetLiabilitiesOrAssetsForRemainingCoverageExcludingLossComponentMember2021-12-310001160106ifrs-full:LossComponentMemberifrs-full:InsuranceContractsToWhichPremiumAllocationApproachHasBeenAppliedMember2021-12-310001160106ifrs-full:LiabilitiesForIncurredClaimsMemberifrs-full:InsuranceContractsToWhichPremiumAllocationApproachHasBeenAppliedMember2021-12-310001160106ifrs-full:InsuranceContractsToWhichPremiumAllocationApproachHasBeenAppliedMember2021-12-310001160106ifrs-full:InsuranceContractsToWhichPremiumAllocationApproachHasBeenAppliedMemberifrs-full:NetLiabilitiesOrAssetsForRemainingCoverageExcludingLossComponentMember2023-01-012023-12-310001160106ifrs-full:LossComponentMemberifrs-full:InsuranceContractsToWhichPremiumAllocationApproachHasBeenAppliedMember2023-01-012023-12-310001160106ifrs-full:LiabilitiesForIncurredClaimsMemberifrs-full:InsuranceContractsToWhichPremiumAllocationApproachHasBeenAppliedMember2023-01-012023-12-310001160106ifrs-full:InsuranceContractsToWhichPremiumAllocationApproachHasBeenAppliedMemberifrs-full:NetLiabilitiesOrAssetsForRemainingCoverageExcludingLossComponentMember2022-01-012022-12-310001160106ifrs-full:LossComponentMemberifrs-full:InsuranceContractsToWhichPremiumAllocationApproachHasBeenAppliedMember2022-01-012022-12-310001160106ifrs-full:LiabilitiesForIncurredClaimsMemberifrs-full:InsuranceContractsToWhichPremiumAllocationApproachHasBeenAppliedMember2022-01-012022-12-310001160106ifrs-full:InsuranceContractsToWhichPremiumAllocationApproachHasBeenAppliedMemberifrs-full:NetLiabilitiesOrAssetsForRemainingCoverageExcludingLossComponentMember2023-12-310001160106ifrs-full:LossComponentMemberifrs-full:InsuranceContractsToWhichPremiumAllocationApproachHasBeenAppliedMember2023-12-310001160106ifrs-full:LiabilitiesForIncurredClaimsMemberifrs-full:InsuranceContractsToWhichPremiumAllocationApproachHasBeenAppliedMember2023-12-310001160106ifrs-full:InsuranceContractsOtherThanThoseToWhichPremiumAllocationApproachHasBeenAppliedMemberifrs-full:EstimatesOfPresentValueOfFutureCashFlowsMember2022-12-310001160106ifrs-full:InsuranceContractsOtherThanThoseToWhichPremiumAllocationApproachHasBeenAppliedMemberifrs-full:RiskAdjustmentForNonfinancialRiskMember2022-12-310001160106ifrs-full:InsuranceContractsOtherThanThoseToWhichPremiumAllocationApproachHasBeenAppliedMemberifrs-full:ContractualServiceMarginRelatedToContractsThatExistedAtTransitionDateToWhichModifiedRetrospectiveApproachHasBeenAppliedMember2022-12-310001160106ifrs-full:InsuranceContractsOtherThanThoseToWhichPremiumAllocationApproachHasBeenAppliedMemberifrs-full:ContractualServiceMarginRelatedToContractsThatExistedAtTransitionDateToWhichFairValueApproachHasBeenAppliedMember2022-12-310001160106ifrs-full:InsuranceContractsOtherThanThoseToWhichPremiumAllocationApproachHasBeenAppliedMemberifrs-full:ContractualServiceMarginNotRelatedToContractsThatExistedAtTransitionDateToWhichModifiedRetrospectiveApproachOrFairValueApproachHasBeenAppliedMember2022-12-310001160106ifrs-full:InsuranceContractsOtherThanThoseToWhichPremiumAllocationApproachHasBeenAppliedMemberifrs-full:ContractualServiceMarginMember2022-12-310001160106ifrs-full:InsuranceContractsOtherThanThoseToWhichPremiumAllocationApproachHasBeenAppliedMemberifrs-full:EstimatesOfPresentValueOfFutureCashFlowsMember2023-01-012023-12-310001160106ifrs-full:InsuranceContractsOtherThanThoseToWhichPremiumAllocationApproachHasBeenAppliedMemberifrs-full:RiskAdjustmentForNonfinancialRiskMember2023-01-012023-12-310001160106ifrs-full:InsuranceContractsOtherThanThoseToWhichPremiumAllocationApproachHasBeenAppliedMemberifrs-full:ContractualServiceMarginRelatedToContractsThatExistedAtTransitionDateToWhichModifiedRetrospectiveApproachHasBeenAppliedMember2023-01-012023-12-310001160106ifrs-full:InsuranceContractsOtherThanThoseToWhichPremiumAllocationApproachHasBeenAppliedMemberifrs-full:ContractualServiceMarginRelatedToContractsThatExistedAtTransitionDateToWhichFairValueApproachHasBeenAppliedMember2023-01-012023-12-310001160106ifrs-full:InsuranceContractsOtherThanThoseToWhichPremiumAllocationApproachHasBeenAppliedMemberifrs-full:ContractualServiceMarginNotRelatedToContractsThatExistedAtTransitionDateToWhichModifiedRetrospectiveApproachOrFairValueApproachHasBeenAppliedMember2023-01-012023-12-310001160106ifrs-full:InsuranceContractsOtherThanThoseToWhichPremiumAllocationApproachHasBeenAppliedMemberifrs-full:ContractualServiceMarginMember2023-01-012023-12-310001160106ifrs-full:InsuranceContractsOtherThanThoseToWhichPremiumAllocationApproachHasBeenAppliedMemberifrs-full:EstimatesOfPresentValueOfFutureCashFlowsMember2023-12-310001160106ifrs-full:InsuranceContractsOtherThanThoseToWhichPremiumAllocationApproachHasBeenAppliedMemberifrs-full:RiskAdjustmentForNonfinancialRiskMember2023-12-310001160106ifrs-full:InsuranceContractsOtherThanThoseToWhichPremiumAllocationApproachHasBeenAppliedMemberifrs-full:ContractualServiceMarginRelatedToContractsThatExistedAtTransitionDateToWhichModifiedRetrospectiveApproachHasBeenAppliedMember2023-12-310001160106ifrs-full:InsuranceContractsOtherThanThoseToWhichPremiumAllocationApproachHasBeenAppliedMemberifrs-full:ContractualServiceMarginRelatedToContractsThatExistedAtTransitionDateToWhichFairValueApproachHasBeenAppliedMember2023-12-310001160106ifrs-full:InsuranceContractsOtherThanThoseToWhichPremiumAllocationApproachHasBeenAppliedMemberifrs-full:ContractualServiceMarginNotRelatedToContractsThatExistedAtTransitionDateToWhichModifiedRetrospectiveApproachOrFairValueApproachHasBeenAppliedMember2023-12-310001160106ifrs-full:InsuranceContractsOtherThanThoseToWhichPremiumAllocationApproachHasBeenAppliedMemberifrs-full:ContractualServiceMarginMember2023-12-310001160106ifrs-full:InsuranceContractsOtherThanThoseToWhichPremiumAllocationApproachHasBeenAppliedMemberifrs-full:EstimatesOfPresentValueOfFutureCashFlowsMember2021-12-310001160106ifrs-full:InsuranceContractsOtherThanThoseToWhichPremiumAllocationApproachHasBeenAppliedMemberifrs-full:RiskAdjustmentForNonfinancialRiskMember2021-12-310001160106ifrs-full:InsuranceContractsOtherThanThoseToWhichPremiumAllocationApproachHasBeenAppliedMemberifrs-full:ContractualServiceMarginRelatedToContractsThatExistedAtTransitionDateToWhichModifiedRetrospectiveApproachHasBeenAppliedMember2021-12-310001160106ifrs-full:InsuranceContractsOtherThanThoseToWhichPremiumAllocationApproachHasBeenAppliedMemberifrs-full:ContractualServiceMarginRelatedToContractsThatExistedAtTransitionDateToWhichFairValueApproachHasBeenAppliedMember2021-12-310001160106ifrs-full:InsuranceContractsOtherThanThoseToWhichPremiumAllocationApproachHasBeenAppliedMemberifrs-full:ContractualServiceMarginNotRelatedToContractsThatExistedAtTransitionDateToWhichModifiedRetrospectiveApproachOrFairValueApproachHasBeenAppliedMember2021-12-310001160106ifrs-full:InsuranceContractsOtherThanThoseToWhichPremiumAllocationApproachHasBeenAppliedMemberifrs-full:ContractualServiceMarginMember2021-12-310001160106ifrs-full:InsuranceContractsOtherThanThoseToWhichPremiumAllocationApproachHasBeenAppliedMemberifrs-full:EstimatesOfPresentValueOfFutureCashFlowsMember2022-01-012022-12-310001160106ifrs-full:InsuranceContractsOtherThanThoseToWhichPremiumAllocationApproachHasBeenAppliedMemberifrs-full:RiskAdjustmentForNonfinancialRiskMember2022-01-012022-12-310001160106ifrs-full:InsuranceContractsOtherThanThoseToWhichPremiumAllocationApproachHasBeenAppliedMemberifrs-full:ContractualServiceMarginRelatedToContractsThatExistedAtTransitionDateToWhichModifiedRetrospectiveApproachHasBeenAppliedMember2022-01-012022-12-310001160106ifrs-full:InsuranceContractsOtherThanThoseToWhichPremiumAllocationApproachHasBeenAppliedMemberifrs-full:ContractualServiceMarginRelatedToContractsThatExistedAtTransitionDateToWhichFairValueApproachHasBeenAppliedMember2022-01-012022-12-310001160106ifrs-full:InsuranceContractsOtherThanThoseToWhichPremiumAllocationApproachHasBeenAppliedMemberifrs-full:ContractualServiceMarginNotRelatedToContractsThatExistedAtTransitionDateToWhichModifiedRetrospectiveApproachOrFairValueApproachHasBeenAppliedMember2022-01-012022-12-310001160106ifrs-full:InsuranceContractsOtherThanThoseToWhichPremiumAllocationApproachHasBeenAppliedMemberifrs-full:ContractualServiceMarginMember2022-01-012022-12-310001160106ifrs-full:InsuranceContractsOtherThanThoseToWhichPremiumAllocationApproachHasBeenAppliedMemberifrs-full:EstimatesOfPresentValueOfFutureCashFlowsMemberlyg:IncludesDrawdownFeatureMember2022-01-012022-12-310001160106ifrs-full:InsuranceContractsOtherThanThoseToWhichPremiumAllocationApproachHasBeenAppliedMemberifrs-full:RiskAdjustmentForNonfinancialRiskMemberlyg:IncludesDrawdownFeatureMember2022-01-012022-12-310001160106ifrs-full:InsuranceContractsOtherThanThoseToWhichPremiumAllocationApproachHasBeenAppliedMemberifrs-full:ContractualServiceMarginMemberlyg:IncludesDrawdownFeatureMember2022-01-012022-12-310001160106ifrs-full:InsuranceContractsIssuedMember2023-12-310001160106ifrs-full:InsuranceContractsIssuedMember2022-12-310001160106ifrs-full:EstimatesOfPresentValueOfInsuranceAcquisitionCashFlowsMember2023-01-012023-12-310001160106ifrs-full:EstimatesOfPresentValueOfInsuranceAcquisitionCashFlowsMember2022-01-012022-12-310001160106ifrs-full:EstimatesOfPresentValueOfFutureCashOutflowsOtherThanInsuranceAcquisitionCashFlowsMember2023-01-012023-12-310001160106ifrs-full:EstimatesOfPresentValueOfFutureCashOutflowsOtherThanInsuranceAcquisitionCashFlowsMember2022-01-012022-12-310001160106ifrs-full:EstimatesOfPresentValueOfFutureCashOutflowsMember2023-01-012023-12-310001160106ifrs-full:EstimatesOfPresentValueOfFutureCashOutflowsMember2022-01-012022-12-310001160106ifrs-full:EstimatesOfPresentValueOfFutureCashInflowsMember2023-01-012023-12-310001160106ifrs-full:EstimatesOfPresentValueOfFutureCashInflowsMember2022-01-012022-12-310001160106ifrs-full:RiskAdjustmentForNonfinancialRiskMember2023-01-012023-12-310001160106ifrs-full:RiskAdjustmentForNonfinancialRiskMember2022-01-012022-12-310001160106ifrs-full:ContractualServiceMarginMember2023-01-012023-12-310001160106ifrs-full:ContractualServiceMarginMember2022-01-012022-12-310001160106lyg:CashAndCashEquivalents1Member2023-12-310001160106lyg:CashAndCashEquivalents1Member2022-12-310001160106ifrs-full:FinancialAssetsAtFairValueThroughProfitOrLossCategoryMember2023-12-310001160106ifrs-full:FinancialAssetsAtFairValueThroughProfitOrLossCategoryMember2022-12-310001160106ifrs-full:OtherAssetsMember2023-12-310001160106ifrs-full:OtherAssetsMember2022-12-310001160106lyg:DerivativeFinancialInstrumentsMember2023-12-310001160106lyg:DerivativeFinancialInstrumentsMember2022-12-310001160106lyg:OtherLiabilities1Member2023-12-310001160106lyg:OtherLiabilities1Member2022-12-310001160106lyg:AnnuitiesMemberifrs-full:NotLaterThanOneYearMember2023-12-310001160106lyg:AnnuitiesMemberifrs-full:LaterThanOneYearAndNotLaterThanTwoYearsMember2023-12-310001160106ifrs-full:LaterThanTwoYearsAndNotLaterThanThreeYearsMemberlyg:AnnuitiesMember2023-12-310001160106ifrs-full:LaterThanThreeYearsAndNotLaterThanFourYearsMemberlyg:AnnuitiesMember2023-12-310001160106ifrs-full:LaterThanFourYearsAndNotLaterThanFiveYearsMemberlyg:AnnuitiesMember2023-12-310001160106lyg:AnnuitiesMemberifrs-full:LaterThanFiveYearsAndNotLaterThanTenYearsMember2023-12-310001160106ifrs-full:LaterThanTenYearsMemberlyg:AnnuitiesMember2023-12-310001160106lyg:AnnuitiesMember2023-12-310001160106lyg:PensionsAndInvestmentsMemberifrs-full:NotLaterThanOneYearMember2023-12-310001160106lyg:PensionsAndInvestmentsMemberifrs-full:LaterThanOneYearAndNotLaterThanTwoYearsMember2023-12-310001160106ifrs-full:LaterThanTwoYearsAndNotLaterThanThreeYearsMemberlyg:PensionsAndInvestmentsMember2023-12-310001160106lyg:PensionsAndInvestmentsMemberifrs-full:LaterThanThreeYearsAndNotLaterThanFourYearsMember2023-12-310001160106ifrs-full:LaterThanFourYearsAndNotLaterThanFiveYearsMemberlyg:PensionsAndInvestmentsMember2023-12-310001160106lyg:PensionsAndInvestmentsMemberifrs-full:LaterThanFiveYearsAndNotLaterThanTenYearsMember2023-12-310001160106lyg:PensionsAndInvestmentsMemberifrs-full:LaterThanTenYearsMember2023-12-310001160106lyg:PensionsAndInvestmentsMember2023-12-310001160106lyg:ProtectionAndOtherMemberifrs-full:NotLaterThanOneYearMember2023-12-310001160106lyg:ProtectionAndOtherMemberifrs-full:LaterThanOneYearAndNotLaterThanTwoYearsMember2023-12-310001160106ifrs-full:LaterThanTwoYearsAndNotLaterThanThreeYearsMemberlyg:ProtectionAndOtherMember2023-12-310001160106ifrs-full:LaterThanThreeYearsAndNotLaterThanFourYearsMemberlyg:ProtectionAndOtherMember2023-12-310001160106ifrs-full:LaterThanFourYearsAndNotLaterThanFiveYearsMemberlyg:ProtectionAndOtherMember2023-12-310001160106lyg:ProtectionAndOtherMemberifrs-full:LaterThanFiveYearsAndNotLaterThanTenYearsMember2023-12-310001160106ifrs-full:LaterThanTenYearsMemberlyg:ProtectionAndOtherMember2023-12-310001160106lyg:ProtectionAndOtherMember2023-12-310001160106ifrs-full:InsuranceContractsIssuedMemberifrs-full:NotLaterThanOneYearMember2023-12-310001160106ifrs-full:InsuranceContractsIssuedMemberifrs-full:LaterThanOneYearAndNotLaterThanTwoYearsMember2023-12-310001160106ifrs-full:LaterThanTwoYearsAndNotLaterThanThreeYearsMemberifrs-full:InsuranceContractsIssuedMember2023-12-310001160106ifrs-full:LaterThanThreeYearsAndNotLaterThanFourYearsMemberifrs-full:InsuranceContractsIssuedMember2023-12-310001160106ifrs-full:LaterThanFourYearsAndNotLaterThanFiveYearsMemberifrs-full:InsuranceContractsIssuedMember2023-12-310001160106ifrs-full:InsuranceContractsIssuedMemberifrs-full:LaterThanFiveYearsAndNotLaterThanTenYearsMember2023-12-310001160106ifrs-full:LaterThanTenYearsMemberifrs-full:InsuranceContractsIssuedMember2023-12-310001160106ifrs-full:ReinsuranceContractsHeldMemberifrs-full:NotLaterThanOneYearMember2023-12-310001160106ifrs-full:ReinsuranceContractsHeldMemberifrs-full:LaterThanOneYearAndNotLaterThanTwoYearsMember2023-12-310001160106ifrs-full:LaterThanTwoYearsAndNotLaterThanThreeYearsMemberifrs-full:ReinsuranceContractsHeldMember2023-12-310001160106ifrs-full:LaterThanThreeYearsAndNotLaterThanFourYearsMemberifrs-full:ReinsuranceContractsHeldMember2023-12-310001160106ifrs-full:LaterThanFourYearsAndNotLaterThanFiveYearsMemberifrs-full:ReinsuranceContractsHeldMember2023-12-310001160106ifrs-full:ReinsuranceContractsHeldMemberifrs-full:LaterThanFiveYearsAndNotLaterThanTenYearsMember2023-12-310001160106ifrs-full:LaterThanTenYearsMemberifrs-full:ReinsuranceContractsHeldMember2023-12-310001160106ifrs-full:ReinsuranceContractsHeldMember2023-12-310001160106ifrs-full:LaterThanFiveYearsAndNotLaterThanTenYearsMember2023-12-310001160106ifrs-full:LaterThanTenYearsMember2023-12-310001160106lyg:AnnuitiesMemberifrs-full:NotLaterThanOneYearMember2022-12-310001160106lyg:AnnuitiesMemberifrs-full:LaterThanOneYearAndNotLaterThanTwoYearsMember2022-12-310001160106ifrs-full:LaterThanTwoYearsAndNotLaterThanThreeYearsMemberlyg:AnnuitiesMember2022-12-310001160106ifrs-full:LaterThanThreeYearsAndNotLaterThanFourYearsMemberlyg:AnnuitiesMember2022-12-310001160106ifrs-full:LaterThanFourYearsAndNotLaterThanFiveYearsMemberlyg:AnnuitiesMember2022-12-310001160106lyg:AnnuitiesMemberifrs-full:LaterThanFiveYearsAndNotLaterThanTenYearsMember2022-12-310001160106ifrs-full:LaterThanTenYearsMemberlyg:AnnuitiesMember2022-12-310001160106lyg:AnnuitiesMember2022-12-310001160106lyg:PensionsAndInvestmentsMemberifrs-full:NotLaterThanOneYearMember2022-12-310001160106lyg:PensionsAndInvestmentsMemberifrs-full:LaterThanOneYearAndNotLaterThanTwoYearsMember2022-12-310001160106ifrs-full:LaterThanTwoYearsAndNotLaterThanThreeYearsMemberlyg:PensionsAndInvestmentsMember2022-12-310001160106lyg:PensionsAndInvestmentsMemberifrs-full:LaterThanThreeYearsAndNotLaterThanFourYearsMember2022-12-310001160106ifrs-full:LaterThanFourYearsAndNotLaterThanFiveYearsMemberlyg:PensionsAndInvestmentsMember2022-12-310001160106lyg:PensionsAndInvestmentsMemberifrs-full:LaterThanFiveYearsAndNotLaterThanTenYearsMember2022-12-310001160106lyg:PensionsAndInvestmentsMemberifrs-full:LaterThanTenYearsMember2022-12-310001160106lyg:PensionsAndInvestmentsMember2022-12-310001160106lyg:ProtectionAndOtherMemberifrs-full:NotLaterThanOneYearMember2022-12-310001160106lyg:ProtectionAndOtherMemberifrs-full:LaterThanOneYearAndNotLaterThanTwoYearsMember2022-12-310001160106ifrs-full:LaterThanTwoYearsAndNotLaterThanThreeYearsMemberlyg:ProtectionAndOtherMember2022-12-310001160106ifrs-full:LaterThanThreeYearsAndNotLaterThanFourYearsMemberlyg:ProtectionAndOtherMember2022-12-310001160106ifrs-full:LaterThanFourYearsAndNotLaterThanFiveYearsMemberlyg:ProtectionAndOtherMember2022-12-310001160106lyg:ProtectionAndOtherMemberifrs-full:LaterThanFiveYearsAndNotLaterThanTenYearsMember2022-12-310001160106ifrs-full:LaterThanTenYearsMemberlyg:ProtectionAndOtherMember2022-12-310001160106lyg:ProtectionAndOtherMember2022-12-310001160106ifrs-full:InsuranceContractsIssuedMemberifrs-full:NotLaterThanOneYearMember2022-12-310001160106ifrs-full:InsuranceContractsIssuedMemberifrs-full:LaterThanOneYearAndNotLaterThanTwoYearsMember2022-12-310001160106ifrs-full:LaterThanTwoYearsAndNotLaterThanThreeYearsMemberifrs-full:InsuranceContractsIssuedMember2022-12-310001160106ifrs-full:LaterThanThreeYearsAndNotLaterThanFourYearsMemberifrs-full:InsuranceContractsIssuedMember2022-12-310001160106ifrs-full:LaterThanFourYearsAndNotLaterThanFiveYearsMemberifrs-full:InsuranceContractsIssuedMember2022-12-310001160106ifrs-full:InsuranceContractsIssuedMemberifrs-full:LaterThanFiveYearsAndNotLaterThanTenYearsMember2022-12-310001160106ifrs-full:LaterThanTenYearsMemberifrs-full:InsuranceContractsIssuedMember2022-12-310001160106ifrs-full:ReinsuranceContractsHeldMemberifrs-full:NotLaterThanOneYearMember2022-12-310001160106ifrs-full:ReinsuranceContractsHeldMemberifrs-full:LaterThanOneYearAndNotLaterThanTwoYearsMember2022-12-310001160106ifrs-full:LaterThanTwoYearsAndNotLaterThanThreeYearsMemberifrs-full:ReinsuranceContractsHeldMember2022-12-310001160106ifrs-full:LaterThanThreeYearsAndNotLaterThanFourYearsMemberifrs-full:ReinsuranceContractsHeldMember2022-12-310001160106ifrs-full:LaterThanFourYearsAndNotLaterThanFiveYearsMemberifrs-full:ReinsuranceContractsHeldMember2022-12-310001160106ifrs-full:ReinsuranceContractsHeldMemberifrs-full:LaterThanFiveYearsAndNotLaterThanTenYearsMember2022-12-310001160106ifrs-full:LaterThanTenYearsMemberifrs-full:ReinsuranceContractsHeldMember2022-12-310001160106ifrs-full:ReinsuranceContractsHeldMember2022-12-310001160106ifrs-full:LaterThanFiveYearsAndNotLaterThanTenYearsMember2022-12-310001160106ifrs-full:LaterThanTenYearsMember2022-12-310001160106lyg:PercentageReductionInRateMemberlyg:AnnuitantMortalityMember2023-01-012023-12-310001160106lyg:AnnuitantMortalityMemberlyg:ReductionInProfitBeforeTaxMember2023-01-012023-12-310001160106lyg:AnnuitantMortalityMemberlyg:ReductionInEquityMember2023-01-012023-12-310001160106lyg:AnnuitantMortalityMemberlyg:ReductionInProfitBeforeTaxMember2022-01-012022-12-310001160106lyg:AnnuitantMortalityMemberlyg:ReductionInEquityMember2022-01-012022-12-310001160106lyg:AnnuitantMortalityMemberlyg:PercentageIncreaseInRateMember2023-01-012023-12-310001160106lyg:IncreaseInProfitBeforeTaxMemberlyg:AnnuitantMortalityMember2023-01-012023-12-310001160106lyg:IncreaseInEquityMemberlyg:AnnuitantMortalityMember2023-01-012023-12-310001160106lyg:IncreaseInProfitBeforeTaxMemberlyg:AnnuitantMortalityMember2022-01-012022-12-310001160106lyg:IncreaseInEquityMemberlyg:AnnuitantMortalityMember2022-01-012022-12-310001160106lyg:PercentageReductionInRateMemberlyg:FutureMaintenanceAndInvestmentExpensesMember2023-01-012023-12-310001160106lyg:FutureMaintenanceAndInvestmentExpensesMemberlyg:ReductionInProfitBeforeTaxMember2023-01-012023-12-310001160106lyg:FutureMaintenanceAndInvestmentExpensesMemberlyg:ReductionInEquityMember2023-01-012023-12-310001160106lyg:FutureMaintenanceAndInvestmentExpensesMemberlyg:ReductionInProfitBeforeTaxMember2022-01-012022-12-310001160106lyg:FutureMaintenanceAndInvestmentExpensesMemberlyg:ReductionInEquityMember2022-01-012022-12-310001160106lyg:FutureMaintenanceAndInvestmentExpensesMemberlyg:PercentageIncreaseInRateMember2023-01-012023-12-310001160106lyg:FutureMaintenanceAndInvestmentExpensesMemberlyg:IncreaseInProfitBeforeTaxMember2023-01-012023-12-310001160106lyg:FutureMaintenanceAndInvestmentExpensesMemberlyg:IncreaseInEquityMember2023-01-012023-12-310001160106lyg:FutureMaintenanceAndInvestmentExpensesMemberlyg:IncreaseInProfitBeforeTaxMember2022-01-012022-12-310001160106lyg:FutureMaintenanceAndInvestmentExpensesMemberlyg:IncreaseInEquityMember2022-01-012022-12-310001160106lyg:PercentageReductionInRateMemberlyg:IncreaseInIlliquidityPremiaMember2023-01-012023-12-310001160106lyg:ReductionInProfitBeforeTaxMemberlyg:IncreaseInIlliquidityPremiaMember2023-01-012023-12-310001160106lyg:ReductionInEquityMemberlyg:IncreaseInIlliquidityPremiaMember2023-01-012023-12-310001160106lyg:ReductionInProfitBeforeTaxMemberlyg:IncreaseInIlliquidityPremiaMember2022-01-012022-12-310001160106lyg:ReductionInEquityMemberlyg:IncreaseInIlliquidityPremiaMember2022-01-012022-12-310001160106lyg:PercentageIncreaseInRateMemberlyg:IncreaseInIlliquidityPremiaMember2023-01-012023-12-310001160106lyg:IncreaseInProfitBeforeTaxMemberlyg:IncreaseInIlliquidityPremiaMember2023-01-012023-12-310001160106lyg:IncreaseInEquityMemberlyg:IncreaseInIlliquidityPremiaMember2023-01-012023-12-310001160106lyg:IncreaseInProfitBeforeTaxMemberlyg:IncreaseInIlliquidityPremiaMember2022-01-012022-12-310001160106lyg:IncreaseInEquityMemberlyg:IncreaseInIlliquidityPremiaMember2022-01-012022-12-310001160106lyg:WideningOfCreditDefaultSpreadsOnCorporateBondsMemberlyg:PercentageIncreaseInRateMember2023-01-012023-12-310001160106lyg:WideningOfCreditDefaultSpreadsOnCorporateBondsMemberlyg:IncreaseInProfitBeforeTaxMember2023-01-012023-12-310001160106lyg:WideningOfCreditDefaultSpreadsOnCorporateBondsMemberlyg:IncreaseInEquityMember2023-01-012023-12-310001160106lyg:WideningOfCreditDefaultSpreadsOnCorporateBondsMemberlyg:IncreaseInProfitBeforeTaxMember2022-01-012022-12-310001160106lyg:WideningOfCreditDefaultSpreadsOnCorporateBondsMemberlyg:IncreaseInEquityMember2022-01-012022-12-310001160106lyg:PercentageReductionInRateMemberlyg:NonannuitantMortalityAndMorbidityMember2023-01-012023-12-310001160106lyg:NonannuitantMortalityAndMorbidityMemberlyg:ReductionInProfitBeforeTaxMember2023-01-012023-12-310001160106lyg:NonannuitantMortalityAndMorbidityMemberlyg:ReductionInEquityMember2023-01-012023-12-310001160106lyg:NonannuitantMortalityAndMorbidityMemberlyg:ReductionInProfitBeforeTaxMember2022-01-012022-12-310001160106lyg:NonannuitantMortalityAndMorbidityMemberlyg:ReductionInEquityMember2022-01-012022-12-310001160106lyg:NonannuitantMortalityAndMorbidityMemberlyg:PercentageIncreaseInRateMember2023-01-012023-12-310001160106lyg:IncreaseInProfitBeforeTaxMemberlyg:NonannuitantMortalityAndMorbidityMember2023-01-012023-12-310001160106lyg:NonannuitantMortalityAndMorbidityMemberlyg:IncreaseInEquityMember2023-01-012023-12-310001160106lyg:IncreaseInProfitBeforeTaxMemberlyg:NonannuitantMortalityAndMorbidityMember2022-01-012022-12-310001160106lyg:NonannuitantMortalityAndMorbidityMemberlyg:IncreaseInEquityMember2022-01-012022-12-310001160106lyg:PercentageReductionInRateMemberlyg:LapseRatesMember2023-01-012023-12-310001160106lyg:LapseRatesMemberlyg:ReductionInProfitBeforeTaxMember2023-01-012023-12-310001160106lyg:LapseRatesMemberlyg:ReductionInEquityMember2023-01-012023-12-310001160106lyg:LapseRatesMemberlyg:ReductionInProfitBeforeTaxMember2022-01-012022-12-310001160106lyg:LapseRatesMemberlyg:ReductionInEquityMember2022-01-012022-12-310001160106lyg:LapseRatesMemberlyg:PercentageIncreaseInRateMember2023-01-012023-12-310001160106lyg:IncreaseInProfitBeforeTaxMemberlyg:LapseRatesMember2023-01-012023-12-310001160106lyg:IncreaseInEquityMemberlyg:LapseRatesMember2023-01-012023-12-310001160106lyg:IncreaseInProfitBeforeTaxMemberlyg:LapseRatesMember2022-01-012022-12-310001160106lyg:IncreaseInEquityMemberlyg:LapseRatesMember2022-01-012022-12-310001160106lyg:PercentageReductionInRateMemberlyg:AnnuitantMortalityMember2023-12-310001160106lyg:AnnuitantMortalityMemberlyg:PercentageIncreaseInRateMember2023-12-310001160106lyg:PercentageReductionInRateMember2023-12-310001160106lyg:PercentageIncreaseInRateMember2023-12-310001160106lyg:SettlementBalancesMember2023-12-310001160106lyg:SettlementBalancesMember2022-12-310001160106lyg:UnitholdersInterestInOpenEndedInvestmentCompaniesMember2023-12-310001160106lyg:UnitholdersInterestInOpenEndedInvestmentCompaniesMember2022-12-310001160106lyg:OtherCreditorsAndAccrualsMember2023-12-310001160106lyg:OtherCreditorsAndAccrualsMember2022-12-310001160106ifrs-full:ProvisionForCreditCommitmentsMember2022-12-310001160106lyg:OtherRegulatoryAndLegalProvisionsMember2022-12-310001160106lyg:OtherMember2022-12-310001160106ifrs-full:MiscellaneousOtherProvisionsMember2022-12-310001160106ifrs-full:ProvisionForCreditCommitmentsMember2023-01-012023-12-310001160106lyg:OtherRegulatoryAndLegalProvisionsMember2023-01-012023-12-310001160106lyg:OtherMember2023-01-012023-12-310001160106ifrs-full:MiscellaneousOtherProvisionsMember2023-01-012023-12-310001160106ifrs-full:ProvisionForCreditCommitmentsMember2023-12-310001160106lyg:OtherRegulatoryAndLegalProvisionsMember2023-12-310001160106lyg:OtherMember2023-12-310001160106ifrs-full:MiscellaneousOtherProvisionsMember2023-12-310001160106lyg:MotorCommissionReviewMember2023-12-310001160106lyg:HBOSMember2023-12-310001160106lyg:PaymentProtectionInsuranceExcludingMBNAMemberlyg:PaymentProtectionInsuranceRemediationMember2023-01-012023-12-310001160106lyg:CustomerClaimsInRelationToInsuranceBranchBusinessInGermanyMember2023-12-310001160106lyg:CustomerClaimsInRelationToInsuranceBranchBusinessInGermanyMember2022-12-310001160106lyg:CustomerClaimsInRelationToInsuranceBranchBusinessInGermanyMember2023-01-012023-12-310001160106lyg:DilapidationsRentReviewsAndOtherPropertyRelatedMattersMember2023-12-310001160106lyg:DilapidationsRentReviewsAndOtherPropertyRelatedMattersMember2022-12-310001160106lyg:IndemnitiesAndOtherMattersRelatingToLegacyBusinessDisposalsMember2023-12-310001160106lyg:IndemnitiesAndOtherMattersRelatingToLegacyBusinessDisposalsMember2022-12-310001160106ifrs-full:PreferenceSharesMember2021-12-310001160106lyg:PreferredSecuritiesMember2021-12-310001160106lyg:UndatedSubordinatedLiabilitiesMember2021-12-310001160106lyg:DatedSubordinatedLiabilitiesMember2021-12-310001160106lyg:A7953FixedRateResetDatedSubordinatedNotesDue2033Memberifrs-full:FixedInterestRateMember2023-12-310001160106lyg:A7953FixedRateResetDatedSubordinatedNotesDue2033Member2023-12-31iso4217:USD0001160106ifrs-full:PreferenceSharesMemberlyg:A7953FixedRateResetDatedSubordinatedNotesDue2033Member2022-01-012022-12-310001160106lyg:PreferredSecuritiesMemberlyg:A7953FixedRateResetDatedSubordinatedNotesDue2033Member2022-01-012022-12-310001160106lyg:A7953FixedRateResetDatedSubordinatedNotesDue2033Memberlyg:UndatedSubordinatedLiabilitiesMember2022-01-012022-12-310001160106lyg:DatedSubordinatedLiabilitiesMemberlyg:A7953FixedRateResetDatedSubordinatedNotesDue2033Member2022-01-012022-12-310001160106lyg:A7953FixedRateResetDatedSubordinatedNotesDue2033Member2022-01-012022-12-310001160106ifrs-full:PreferenceSharesMember2022-01-012022-12-310001160106lyg:PreferredSecuritiesMember2022-01-012022-12-310001160106lyg:UndatedSubordinatedLiabilitiesMember2022-01-012022-12-310001160106lyg:DatedSubordinatedLiabilitiesMember2022-01-012022-12-310001160106lyg:A12FixedToFloatingRatePerpetualTier1CapitalSecuritiesCallable2024Member2023-12-310001160106ifrs-full:PreferenceSharesMemberlyg:A12FixedToFloatingRatePerpetualTier1CapitalSecuritiesCallable2024Member2022-01-012022-12-310001160106lyg:PreferredSecuritiesMemberlyg:A12FixedToFloatingRatePerpetualTier1CapitalSecuritiesCallable2024Member2022-01-012022-12-310001160106lyg:A12FixedToFloatingRatePerpetualTier1CapitalSecuritiesCallable2024Memberlyg:UndatedSubordinatedLiabilitiesMember2022-01-012022-12-310001160106lyg:DatedSubordinatedLiabilitiesMemberlyg:A12FixedToFloatingRatePerpetualTier1CapitalSecuritiesCallable2024Member2022-01-012022-12-310001160106lyg:A12FixedToFloatingRatePerpetualTier1CapitalSecuritiesCallable2024Member2022-01-012022-12-310001160106lyg:A13SterlingStepUpPerpetualCapitalSecuritiesSecuritiesCallable2029Member2023-12-310001160106ifrs-full:PreferenceSharesMemberlyg:A13SterlingStepUpPerpetualCapitalSecuritiesSecuritiesCallable2029Member2022-01-012022-12-310001160106lyg:PreferredSecuritiesMemberlyg:A13SterlingStepUpPerpetualCapitalSecuritiesSecuritiesCallable2029Member2022-01-012022-12-310001160106lyg:UndatedSubordinatedLiabilitiesMemberlyg:A13SterlingStepUpPerpetualCapitalSecuritiesSecuritiesCallable2029Member2022-01-012022-12-310001160106lyg:DatedSubordinatedLiabilitiesMemberlyg:A13SterlingStepUpPerpetualCapitalSecuritiesSecuritiesCallable2029Member2022-01-012022-12-310001160106lyg:A13SterlingStepUpPerpetualCapitalSecuritiesSecuritiesCallable2029Member2022-01-012022-12-310001160106lyg:A7281PerpetualRegulatoryTierOneSecuritiesSeriesBMember2023-12-310001160106ifrs-full:PreferenceSharesMemberlyg:A7281PerpetualRegulatoryTierOneSecuritiesSeriesBMember2022-01-012022-12-310001160106lyg:PreferredSecuritiesMemberlyg:A7281PerpetualRegulatoryTierOneSecuritiesSeriesBMember2022-01-012022-12-310001160106lyg:UndatedSubordinatedLiabilitiesMemberlyg:A7281PerpetualRegulatoryTierOneSecuritiesSeriesBMember2022-01-012022-12-310001160106lyg:DatedSubordinatedLiabilitiesMemberlyg:A7281PerpetualRegulatoryTierOneSecuritiesSeriesBMember2022-01-012022-12-310001160106lyg:A7281PerpetualRegulatoryTierOneSecuritiesSeriesBMember2022-01-012022-12-310001160106lyg:A7881GuaranteedNonVotingNonCumulativePreferredSecuritiesMember2023-12-310001160106lyg:A7881GuaranteedNonVotingNonCumulativePreferredSecuritiesMemberifrs-full:PreferenceSharesMember2022-01-012022-12-310001160106lyg:A7881GuaranteedNonVotingNonCumulativePreferredSecuritiesMemberlyg:PreferredSecuritiesMember2022-01-012022-12-310001160106lyg:A7881GuaranteedNonVotingNonCumulativePreferredSecuritiesMemberlyg:UndatedSubordinatedLiabilitiesMember2022-01-012022-12-310001160106lyg:A7881GuaranteedNonVotingNonCumulativePreferredSecuritiesMemberlyg:DatedSubordinatedLiabilitiesMember2022-01-012022-12-310001160106lyg:A7881GuaranteedNonVotingNonCumulativePreferredSecuritiesMember2022-01-012022-12-310001160106lyg:A12PerpetualSubordinatedBondsMember2023-12-310001160106ifrs-full:PreferenceSharesMemberlyg:A12PerpetualSubordinatedBondsMember2022-01-012022-12-310001160106lyg:A12PerpetualSubordinatedBondsMemberlyg:PreferredSecuritiesMember2022-01-012022-12-310001160106lyg:A12PerpetualSubordinatedBondsMemberlyg:UndatedSubordinatedLiabilitiesMember2022-01-012022-12-310001160106lyg:A12PerpetualSubordinatedBondsMemberlyg:DatedSubordinatedLiabilitiesMember2022-01-012022-12-310001160106lyg:A12PerpetualSubordinatedBondsMember2022-01-012022-12-310001160106lyg:A575UndatedSubordinatedStepUpNotesMember2023-12-310001160106lyg:A575UndatedSubordinatedStepUpNotesMemberifrs-full:PreferenceSharesMember2022-01-012022-12-310001160106lyg:A575UndatedSubordinatedStepUpNotesMemberlyg:PreferredSecuritiesMember2022-01-012022-12-310001160106lyg:A575UndatedSubordinatedStepUpNotesMemberlyg:UndatedSubordinatedLiabilitiesMember2022-01-012022-12-310001160106lyg:A575UndatedSubordinatedStepUpNotesMemberlyg:DatedSubordinatedLiabilitiesMember2022-01-012022-12-310001160106lyg:A575UndatedSubordinatedStepUpNotesMember2022-01-012022-12-310001160106lyg:A7625DatedSubordinatedNotes2025Member2023-12-310001160106ifrs-full:PreferenceSharesMemberlyg:A7625DatedSubordinatedNotes2025Member2022-01-012022-12-310001160106lyg:PreferredSecuritiesMemberlyg:A7625DatedSubordinatedNotes2025Member2022-01-012022-12-310001160106lyg:UndatedSubordinatedLiabilitiesMemberlyg:A7625DatedSubordinatedNotes2025Member2022-01-012022-12-310001160106lyg:DatedSubordinatedLiabilitiesMemberlyg:A7625DatedSubordinatedNotes2025Member2022-01-012022-12-310001160106lyg:A7625DatedSubordinatedNotes2025Member2022-01-012022-12-310001160106ifrs-full:PreferenceSharesMember2022-12-310001160106lyg:PreferredSecuritiesMember2022-12-310001160106lyg:UndatedSubordinatedLiabilitiesMember2022-12-310001160106lyg:DatedSubordinatedLiabilitiesMember2022-12-310001160106lyg:A6.625FixedRateResetDatedSubordinatedNotesDue2033Memberifrs-full:FixedInterestRateMember2023-12-310001160106lyg:A6.625FixedRateResetDatedSubordinatedNotesDue2033Member2023-12-310001160106ifrs-full:PreferenceSharesMemberlyg:A6.625FixedRateResetDatedSubordinatedNotesDue2033Member2023-01-012023-12-310001160106lyg:PreferredSecuritiesMemberlyg:A6.625FixedRateResetDatedSubordinatedNotesDue2033Member2023-01-012023-12-310001160106lyg:A6.625FixedRateResetDatedSubordinatedNotesDue2033Memberlyg:UndatedSubordinatedLiabilitiesMember2023-01-012023-12-310001160106lyg:DatedSubordinatedLiabilitiesMemberlyg:A6.625FixedRateResetDatedSubordinatedNotesDue2033Member2023-01-012023-12-310001160106lyg:A6.625FixedRateResetDatedSubordinatedNotesDue2033Member2023-01-012023-12-310001160106lyg:A5.25FixedRateResetDatedSubordinatedNotes2033Memberifrs-full:FixedInterestRateMember2023-12-310001160106lyg:A5.25FixedRateResetDatedSubordinatedNotes2033Member2023-12-31iso4217:SGD0001160106ifrs-full:PreferenceSharesMemberlyg:A5.25FixedRateResetDatedSubordinatedNotes2033Member2023-01-012023-12-310001160106lyg:PreferredSecuritiesMemberlyg:A5.25FixedRateResetDatedSubordinatedNotes2033Member2023-01-012023-12-310001160106lyg:A5.25FixedRateResetDatedSubordinatedNotes2033Memberlyg:UndatedSubordinatedLiabilitiesMember2023-01-012023-12-310001160106lyg:DatedSubordinatedLiabilitiesMemberlyg:A5.25FixedRateResetDatedSubordinatedNotes2033Member2023-01-012023-12-310001160106lyg:A5.25FixedRateResetDatedSubordinatedNotes2033Member2023-01-012023-12-310001160106lyg:FixedToFloatingRateDatedSubordinatedNotes2033Member2023-12-31iso4217:AUD0001160106lyg:FixedToFloatingRateDatedSubordinatedNotes2033Memberifrs-full:PreferenceSharesMember2023-01-012023-12-310001160106lyg:FixedToFloatingRateDatedSubordinatedNotes2033Memberlyg:PreferredSecuritiesMember2023-01-012023-12-310001160106lyg:FixedToFloatingRateDatedSubordinatedNotes2033Memberlyg:UndatedSubordinatedLiabilitiesMember2023-01-012023-12-310001160106lyg:FixedToFloatingRateDatedSubordinatedNotes2033Memberlyg:DatedSubordinatedLiabilitiesMember2023-01-012023-12-310001160106lyg:FixedToFloatingRateDatedSubordinatedNotes2033Member2023-01-012023-12-310001160106ifrs-full:PreferenceSharesMember2023-01-012023-12-310001160106lyg:PreferredSecuritiesMember2023-01-012023-12-310001160106lyg:UndatedSubordinatedLiabilitiesMember2023-01-012023-12-310001160106lyg:DatedSubordinatedLiabilitiesMember2023-01-012023-12-310001160106lyg:A9625SubordinatedBonds2023Member2023-12-310001160106lyg:A9625SubordinatedBonds2023Memberifrs-full:PreferenceSharesMember2023-01-012023-12-310001160106lyg:A9625SubordinatedBonds2023Memberlyg:PreferredSecuritiesMember2023-01-012023-12-310001160106lyg:A9625SubordinatedBonds2023Memberlyg:UndatedSubordinatedLiabilitiesMember2023-01-012023-12-310001160106lyg:A9625SubordinatedBonds2023Memberlyg:DatedSubordinatedLiabilitiesMember2023-01-012023-12-310001160106lyg:A9625SubordinatedBonds2023Member2023-01-012023-12-310001160106lyg:A707SubordinatedFixedRateNotes2023Member2023-12-31iso4217:EUR0001160106ifrs-full:PreferenceSharesMemberlyg:A707SubordinatedFixedRateNotes2023Member2023-01-012023-12-310001160106lyg:A707SubordinatedFixedRateNotes2023Memberlyg:PreferredSecuritiesMember2023-01-012023-12-310001160106lyg:A707SubordinatedFixedRateNotes2023Memberlyg:UndatedSubordinatedLiabilitiesMember2023-01-012023-12-310001160106lyg:A707SubordinatedFixedRateNotes2023Memberlyg:DatedSubordinatedLiabilitiesMember2023-01-012023-12-310001160106lyg:A707SubordinatedFixedRateNotes2023Member2023-01-012023-12-310001160106lyg:A55DatedSubordinatedNotes2023Member2023-12-310001160106ifrs-full:PreferenceSharesMemberlyg:A55DatedSubordinatedNotes2023Member2023-01-012023-12-310001160106lyg:PreferredSecuritiesMemberlyg:A55DatedSubordinatedNotes2023Member2023-01-012023-12-310001160106lyg:UndatedSubordinatedLiabilitiesMemberlyg:A55DatedSubordinatedNotes2023Member2023-01-012023-12-310001160106lyg:DatedSubordinatedLiabilitiesMemberlyg:A55DatedSubordinatedNotes2023Member2023-01-012023-12-310001160106lyg:A55DatedSubordinatedNotes2023Member2023-01-012023-12-310001160106lyg:DatedSubordinatedFixedRateResetNotes2028Member2023-12-310001160106ifrs-full:PreferenceSharesMemberlyg:DatedSubordinatedFixedRateResetNotes2028Member2023-01-012023-12-310001160106lyg:PreferredSecuritiesMemberlyg:DatedSubordinatedFixedRateResetNotes2028Member2023-01-012023-12-310001160106lyg:UndatedSubordinatedLiabilitiesMemberlyg:DatedSubordinatedFixedRateResetNotes2028Member2023-01-012023-12-310001160106lyg:DatedSubordinatedLiabilitiesMemberlyg:DatedSubordinatedFixedRateResetNotes2028Member2023-01-012023-12-310001160106lyg:DatedSubordinatedFixedRateResetNotes2028Member2023-01-012023-12-310001160106lyg:A8.75PerpetualSubordinatedBondsMember2023-12-310001160106ifrs-full:PreferenceSharesMemberlyg:A8.75PerpetualSubordinatedBondsMember2023-01-012023-12-310001160106lyg:PreferredSecuritiesMemberlyg:A8.75PerpetualSubordinatedBondsMember2023-01-012023-12-310001160106lyg:UndatedSubordinatedLiabilitiesMemberlyg:A8.75PerpetualSubordinatedBondsMember2023-01-012023-12-310001160106lyg:DatedSubordinatedLiabilitiesMemberlyg:A8.75PerpetualSubordinatedBondsMember2023-01-012023-12-310001160106lyg:A8.75PerpetualSubordinatedBondsMember2023-01-012023-12-310001160106lyg:A7.375SubordinatedUndatedInstrumentsMember2023-12-310001160106ifrs-full:PreferenceSharesMemberlyg:A7.375SubordinatedUndatedInstrumentsMember2023-01-012023-12-310001160106lyg:PreferredSecuritiesMemberlyg:A7.375SubordinatedUndatedInstrumentsMember2023-01-012023-12-310001160106lyg:A7.375SubordinatedUndatedInstrumentsMemberlyg:UndatedSubordinatedLiabilitiesMember2023-01-012023-12-310001160106lyg:DatedSubordinatedLiabilitiesMemberlyg:A7.375SubordinatedUndatedInstrumentsMember2023-01-012023-12-310001160106lyg:A7.375SubordinatedUndatedInstrumentsMember2023-01-012023-12-310001160106lyg:A8UndatedSubordinatedStepUpNotes2023Member2023-12-310001160106ifrs-full:PreferenceSharesMemberlyg:A8UndatedSubordinatedStepUpNotes2023Member2023-01-012023-12-310001160106lyg:A8UndatedSubordinatedStepUpNotes2023Memberlyg:PreferredSecuritiesMember2023-01-012023-12-310001160106lyg:A8UndatedSubordinatedStepUpNotes2023Memberlyg:UndatedSubordinatedLiabilitiesMember2023-01-012023-12-310001160106lyg:A8UndatedSubordinatedStepUpNotes2023Memberlyg:DatedSubordinatedLiabilitiesMember2023-01-012023-12-310001160106lyg:A8UndatedSubordinatedStepUpNotes2023Member2023-01-012023-12-310001160106ifrs-full:PreferenceSharesMember2023-12-310001160106lyg:PreferredSecuritiesMember2023-12-310001160106lyg:UndatedSubordinatedLiabilitiesMember2023-12-310001160106lyg:DatedSubordinatedLiabilitiesMember2023-12-310001160106ifrs-full:PreferenceSharesMemberlyg:A6NonCumulativeRedeemablePreferenceSharesMember2023-12-310001160106ifrs-full:PreferenceSharesMemberlyg:A6NonCumulativeRedeemablePreferenceSharesMember2022-12-310001160106ifrs-full:PreferenceSharesMemberlyg:A6NonCumulativeRedeemablePreferenceSharesMember2021-12-310001160106ifrs-full:PreferenceSharesMemberlyg:A6475NonCumulativePreferenceSharesMember2023-12-310001160106ifrs-full:PreferenceSharesMemberlyg:A6475NonCumulativePreferenceSharesMember2022-12-310001160106ifrs-full:PreferenceSharesMemberlyg:A6475NonCumulativePreferenceSharesMember2021-12-310001160106ifrs-full:PreferenceSharesMemberlyg:A925NonCumulativeIrredeemablePreferenceSharesMember2023-12-310001160106ifrs-full:PreferenceSharesMemberlyg:A925NonCumulativeIrredeemablePreferenceSharesMember2022-12-310001160106ifrs-full:PreferenceSharesMemberlyg:A925NonCumulativeIrredeemablePreferenceSharesMember2021-12-310001160106ifrs-full:PreferenceSharesMemberlyg:A975NonCumulativeIrredeemablePreferenceSharesMember2023-12-310001160106ifrs-full:PreferenceSharesMemberlyg:A975NonCumulativeIrredeemablePreferenceSharesMember2022-12-310001160106ifrs-full:PreferenceSharesMemberlyg:A975NonCumulativeIrredeemablePreferenceSharesMember2021-12-310001160106lyg:A6413NonCumulativeFixedToFloatingRatePreferenceSharesCallable2035Memberifrs-full:PreferenceSharesMember2023-12-31iso4217:USDxbrli:shares0001160106lyg:A6413NonCumulativeFixedToFloatingRatePreferenceSharesCallable2035Memberifrs-full:PreferenceSharesMember2022-12-310001160106lyg:A6413NonCumulativeFixedToFloatingRatePreferenceSharesCallable2035Memberifrs-full:PreferenceSharesMember2021-12-310001160106lyg:A6657NonCumulativeFixedToFloatingRatePreferenceSharesCallable2037Memberifrs-full:PreferenceSharesMember2023-12-310001160106lyg:A6657NonCumulativeFixedToFloatingRatePreferenceSharesCallable2037Memberifrs-full:PreferenceSharesMember2022-12-310001160106lyg:A6657NonCumulativeFixedToFloatingRatePreferenceSharesCallable2037Memberifrs-full:PreferenceSharesMember2021-12-310001160106ifrs-full:OrdinarySharesMember2009-11-250001160106ifrs-full:OrdinarySharesMember2022-12-310001160106ifrs-full:OrdinarySharesMember2021-12-310001160106ifrs-full:OrdinarySharesMember2020-12-310001160106ifrs-full:OrdinarySharesMember2023-01-012023-12-310001160106ifrs-full:OrdinarySharesMember2022-01-012022-12-310001160106ifrs-full:OrdinarySharesMember2021-01-012021-12-31lyg:vote0001160106ifrs-full:CapitalRedemptionReserveMember2021-01-012021-12-310001160106ifrs-full:OtherReservesMemberifrs-full:DebtSecuritiesMember2023-12-310001160106ifrs-full:OtherReservesMemberifrs-full:DebtSecuritiesMember2022-12-310001160106ifrs-full:OtherReservesMemberifrs-full:DebtSecuritiesMember2021-12-310001160106ifrs-full:OtherEquitySecuritiesMemberifrs-full:OtherReservesMember2023-12-310001160106ifrs-full:OtherEquitySecuritiesMemberifrs-full:OtherReservesMember2022-12-310001160106ifrs-full:OtherEquitySecuritiesMemberifrs-full:OtherReservesMember2021-12-310001160106ifrs-full:HedgesOfNetInvestmentInForeignOperationsMember2022-12-310001160106ifrs-full:HedgesOfNetInvestmentInForeignOperationsMember2021-12-310001160106ifrs-full:HedgesOfNetInvestmentInForeignOperationsMember2020-12-310001160106ifrs-full:HedgesOfNetInvestmentInForeignOperationsMember2023-01-012023-12-310001160106ifrs-full:HedgesOfNetInvestmentInForeignOperationsMember2022-01-012022-12-310001160106ifrs-full:HedgesOfNetInvestmentInForeignOperationsMember2021-01-012021-12-310001160106ifrs-full:HedgesOfNetInvestmentInForeignOperationsMember2023-12-310001160106ifrs-full:CapitalRedemptionReserveMember2022-12-310001160106ifrs-full:CapitalRedemptionReserveMember2021-12-310001160106ifrs-full:CapitalRedemptionReserveMember2020-12-310001160106ifrs-full:CapitalRedemptionReserveMember2023-01-012023-12-310001160106ifrs-full:CapitalRedemptionReserveMember2022-01-012022-12-310001160106ifrs-full:CapitalRedemptionReserveMember2023-12-310001160106ifrs-full:ReserveOfGainsAndLossesOnFinancialAssetsMeasuredAtFairValueThroughOtherComprehensiveIncomeMemberifrs-full:DebtSecuritiesMember2022-12-310001160106ifrs-full:ReserveOfGainsAndLossesOnFinancialAssetsMeasuredAtFairValueThroughOtherComprehensiveIncomeMemberifrs-full:DebtSecuritiesMember2021-12-310001160106ifrs-full:ReserveOfGainsAndLossesOnFinancialAssetsMeasuredAtFairValueThroughOtherComprehensiveIncomeMemberifrs-full:DebtSecuritiesMember2020-12-310001160106ifrs-full:ReserveOfGainsAndLossesOnFinancialAssetsMeasuredAtFairValueThroughOtherComprehensiveIncomeMemberifrs-full:DebtSecuritiesMember2023-01-012023-12-310001160106ifrs-full:ReserveOfGainsAndLossesOnFinancialAssetsMeasuredAtFairValueThroughOtherComprehensiveIncomeMemberifrs-full:DebtSecuritiesMember2022-01-012022-12-310001160106ifrs-full:ReserveOfGainsAndLossesOnFinancialAssetsMeasuredAtFairValueThroughOtherComprehensiveIncomeMemberifrs-full:DebtSecuritiesMember2021-01-012021-12-310001160106ifrs-full:ReserveOfGainsAndLossesOnFinancialAssetsMeasuredAtFairValueThroughOtherComprehensiveIncomeMemberifrs-full:DebtSecuritiesMember2023-12-310001160106ifrs-full:ReserveOfGainsAndLossesOnFinancialAssetsMeasuredAtFairValueThroughOtherComprehensiveIncomeMemberlyg:EquitySharesMember2022-12-310001160106ifrs-full:ReserveOfGainsAndLossesOnFinancialAssetsMeasuredAtFairValueThroughOtherComprehensiveIncomeMemberlyg:EquitySharesMember2021-12-310001160106ifrs-full:ReserveOfGainsAndLossesOnFinancialAssetsMeasuredAtFairValueThroughOtherComprehensiveIncomeMemberlyg:EquitySharesMember2020-12-310001160106ifrs-full:ReserveOfGainsAndLossesOnFinancialAssetsMeasuredAtFairValueThroughOtherComprehensiveIncomeMemberlyg:EquitySharesMember2023-01-012023-12-310001160106ifrs-full:ReserveOfGainsAndLossesOnFinancialAssetsMeasuredAtFairValueThroughOtherComprehensiveIncomeMemberlyg:EquitySharesMember2022-01-012022-12-310001160106ifrs-full:ReserveOfGainsAndLossesOnFinancialAssetsMeasuredAtFairValueThroughOtherComprehensiveIncomeMemberlyg:EquitySharesMember2021-01-012021-12-310001160106ifrs-full:ReserveOfGainsAndLossesOnFinancialAssetsMeasuredAtFairValueThroughOtherComprehensiveIncomeMemberlyg:EquitySharesMemberifrs-full:RetainedEarningsMember2023-01-012023-12-310001160106ifrs-full:ReserveOfGainsAndLossesOnFinancialAssetsMeasuredAtFairValueThroughOtherComprehensiveIncomeMemberlyg:EquitySharesMemberifrs-full:RetainedEarningsMember2022-01-012022-12-310001160106ifrs-full:ReserveOfGainsAndLossesOnFinancialAssetsMeasuredAtFairValueThroughOtherComprehensiveIncomeMemberlyg:EquitySharesMemberifrs-full:RetainedEarningsMember2021-01-012021-12-310001160106ifrs-full:ReserveOfGainsAndLossesOnFinancialAssetsMeasuredAtFairValueThroughOtherComprehensiveIncomeMemberlyg:EquitySharesMember2023-12-310001160106ifrs-full:ReserveOfCashFlowHedgesMember2022-12-310001160106ifrs-full:ReserveOfCashFlowHedgesMember2021-12-310001160106ifrs-full:ReserveOfCashFlowHedgesMember2020-12-310001160106lyg:PreTaxMemberifrs-full:ReserveOfCashFlowHedgesMember2023-01-012023-12-310001160106lyg:PreTaxMemberifrs-full:ReserveOfCashFlowHedgesMember2022-01-012022-12-310001160106lyg:PreTaxMemberifrs-full:ReserveOfCashFlowHedgesMember2021-01-012021-12-310001160106lyg:DeferredIncomeTaxCharges1Memberifrs-full:ReserveOfCashFlowHedgesMember2023-01-012023-12-310001160106lyg:DeferredIncomeTaxCharges1Memberifrs-full:ReserveOfCashFlowHedgesMember2022-01-012022-12-310001160106lyg:DeferredIncomeTaxCharges1Memberifrs-full:ReserveOfCashFlowHedgesMember2021-01-012021-12-310001160106ifrs-full:ReserveOfCashFlowHedgesMember2023-01-012023-12-310001160106ifrs-full:ReserveOfCashFlowHedgesMember2022-01-012022-12-310001160106ifrs-full:ReserveOfCashFlowHedgesMember2021-01-012021-12-310001160106ifrs-full:ReserveOfCashFlowHedgesMember2023-12-310001160106ifrs-full:ReserveOfChangeInValueOfForeignCurrencyBasisSpreadsMemberifrs-full:PreviouslyStatedMember2021-12-310001160106ifrs-full:IncreaseDecreaseDueToChangesInAccountingPolicyRequiredByIFRSsMemberifrs-full:ReserveOfChangeInValueOfForeignCurrencyBasisSpreadsMember2021-12-310001160106ifrs-full:ReserveOfChangeInValueOfForeignCurrencyBasisSpreadsMember2022-12-310001160106ifrs-full:ReserveOfChangeInValueOfForeignCurrencyBasisSpreadsMember2021-12-310001160106ifrs-full:ReserveOfChangeInValueOfForeignCurrencyBasisSpreadsMember2020-12-310001160106ifrs-full:ReserveOfChangeInValueOfForeignCurrencyBasisSpreadsMember2023-01-012023-12-310001160106ifrs-full:ReserveOfChangeInValueOfForeignCurrencyBasisSpreadsMember2022-01-012022-12-310001160106ifrs-full:ReserveOfChangeInValueOfForeignCurrencyBasisSpreadsMember2021-01-012021-12-310001160106ifrs-full:ReserveOfChangeInValueOfForeignCurrencyBasisSpreadsMemberlyg:PreTaxMember2023-01-012023-12-310001160106ifrs-full:ReserveOfChangeInValueOfForeignCurrencyBasisSpreadsMemberlyg:PreTaxMember2022-01-012022-12-310001160106ifrs-full:ReserveOfChangeInValueOfForeignCurrencyBasisSpreadsMemberlyg:PreTaxMember2021-01-012021-12-310001160106ifrs-full:ReserveOfChangeInValueOfForeignCurrencyBasisSpreadsMember2023-12-310001160106ifrs-full:RetainedEarningsMemberifrs-full:PreviouslyStatedMember2021-12-310001160106lyg:A8ConvertibleSecuritiesCallable2029Memberlyg:OtherEquityInstrumentsMember2023-12-310001160106lyg:A8ConvertibleSecuritiesCallable2029Memberlyg:OtherEquityInstrumentsMember2023-01-012023-12-310001160106lyg:A8ConvertibleSecuritiesCallable2029Memberlyg:OtherEquityInstrumentsMember2022-01-012022-12-310001160106lyg:A8ConvertibleSecuritiesCallable2029Memberlyg:OtherEquityInstrumentsMember2021-01-012021-12-310001160106lyg:A8.5ConvertibleSecuritiesCallable2028Memberlyg:OtherEquityInstrumentsMember2023-12-310001160106lyg:A8.5ConvertibleSecuritiesCallable2028Memberlyg:OtherEquityInstrumentsMember2023-01-012023-12-310001160106lyg:A8.5ConvertibleSecuritiesCallable2028Memberlyg:OtherEquityInstrumentsMember2022-01-012022-12-310001160106lyg:A8.5ConvertibleSecuritiesCallable2028Memberlyg:OtherEquityInstrumentsMember2021-01-012021-12-310001160106lyg:A85ConvertibleSecuritiesCallable2027Memberlyg:OtherEquityInstrumentsMember2023-12-310001160106lyg:A85ConvertibleSecuritiesCallable2027Memberlyg:OtherEquityInstrumentsMember2023-01-012023-12-310001160106lyg:A85ConvertibleSecuritiesCallable2027Memberlyg:OtherEquityInstrumentsMember2022-01-012022-12-310001160106lyg:A85ConvertibleSecuritiesCallable2027Memberlyg:OtherEquityInstrumentsMember2021-01-012021-12-310001160106lyg:OtherEquityInstrumentsMember2023-01-012023-12-310001160106lyg:OtherEquityInstrumentsMember2022-01-012022-12-310001160106lyg:OtherEquityInstrumentsMember2021-01-012021-12-310001160106lyg:A7625ConvertibleSecuritiesCallable2023Memberlyg:OtherEquityInstrumentsMember2023-12-310001160106lyg:A7625ConvertibleSecuritiesCallable2023Memberlyg:OtherEquityInstrumentsMember2023-01-012023-12-310001160106lyg:A7625ConvertibleSecuritiesCallable2023Memberlyg:OtherEquityInstrumentsMember2022-01-012022-12-310001160106lyg:A7625ConvertibleSecuritiesCallable2023Memberlyg:OtherEquityInstrumentsMember2021-01-012021-12-310001160106lyg:FinalDividendMember2023-01-012023-12-310001160106lyg:FinalDividendMember2022-01-012022-12-310001160106lyg:FinalDividendMember2022-01-012022-12-310001160106lyg:FinalDividendMember2023-01-012023-12-310001160106lyg:FinalDividendMember2021-01-012021-12-310001160106lyg:InterimDividendMember2023-01-012023-12-310001160106lyg:InterimDividendMember2022-01-012022-12-310001160106lyg:InterimDividendMember2021-01-012021-12-310001160106lyg:WaivedMemberlyg:LloydsBankingGroupShareIncentivePlanMember2023-12-310001160106lyg:WaivedMemberlyg:LloydsBankingGroupShareIncentivePlanMember2022-12-310001160106lyg:WaivedMemberlyg:LloydsBankingGroupEmployeeShareOwnernshipTrustMember2023-12-310001160106lyg:WaivedMemberlyg:LloydsBankingGroupEmployeeShareOwnernshipTrustMember2022-12-310001160106ifrs-full:KeyManagementPersonnelOfEntityOrParentMember2023-01-012023-12-310001160106ifrs-full:KeyManagementPersonnelOfEntityOrParentMember2022-01-012022-12-310001160106ifrs-full:KeyManagementPersonnelOfEntityOrParentMember2021-01-012021-12-310001160106ifrs-full:KeyManagementPersonnelOfEntityOrParentMemberlyg:ShareOptionPlansMember2022-12-310001160106ifrs-full:KeyManagementPersonnelOfEntityOrParentMemberlyg:ShareOptionPlansMember2021-12-310001160106ifrs-full:KeyManagementPersonnelOfEntityOrParentMemberlyg:ShareOptionPlansMember2020-12-310001160106ifrs-full:KeyManagementPersonnelOfEntityOrParentMemberlyg:SharePlansMember2022-12-310001160106ifrs-full:KeyManagementPersonnelOfEntityOrParentMemberlyg:SharePlansMember2021-12-310001160106ifrs-full:KeyManagementPersonnelOfEntityOrParentMemberlyg:SharePlansMember2020-12-310001160106ifrs-full:KeyManagementPersonnelOfEntityOrParentMemberlyg:ShareOptionPlansMember2023-01-012023-12-310001160106ifrs-full:KeyManagementPersonnelOfEntityOrParentMemberlyg:ShareOptionPlansMember2022-01-012022-12-310001160106ifrs-full:KeyManagementPersonnelOfEntityOrParentMemberlyg:ShareOptionPlansMember2021-01-012021-12-310001160106ifrs-full:KeyManagementPersonnelOfEntityOrParentMemberlyg:SharePlansMember2023-01-012023-12-310001160106ifrs-full:KeyManagementPersonnelOfEntityOrParentMemberlyg:SharePlansMember2022-01-012022-12-310001160106ifrs-full:KeyManagementPersonnelOfEntityOrParentMemberlyg:SharePlansMember2021-01-012021-12-310001160106ifrs-full:KeyManagementPersonnelOfEntityOrParentMemberlyg:ShareOptionPlansMember2023-12-310001160106ifrs-full:KeyManagementPersonnelOfEntityOrParentMemberlyg:SharePlansMember2023-12-310001160106ifrs-full:KeyManagementPersonnelOfEntityOrParentMember2022-12-310001160106ifrs-full:KeyManagementPersonnelOfEntityOrParentMember2021-12-310001160106ifrs-full:KeyManagementPersonnelOfEntityOrParentMember2020-12-310001160106ifrs-full:KeyManagementPersonnelOfEntityOrParentMember2023-12-310001160106ifrs-full:KeyManagementPersonnelOfEntityOrParentMemberifrs-full:BottomOfRangeMember2023-12-310001160106ifrs-full:KeyManagementPersonnelOfEntityOrParentMemberifrs-full:TopOfRangeMember2023-12-310001160106ifrs-full:KeyManagementPersonnelOfEntityOrParentMemberifrs-full:BottomOfRangeMember2022-12-310001160106ifrs-full:KeyManagementPersonnelOfEntityOrParentMemberifrs-full:TopOfRangeMember2022-12-310001160106ifrs-full:KeyManagementPersonnelOfEntityOrParentMemberifrs-full:BottomOfRangeMember2021-12-310001160106ifrs-full:KeyManagementPersonnelOfEntityOrParentMemberifrs-full:TopOfRangeMember2021-12-310001160106ifrs-full:KeyManagementPersonnelOfEntityOrParentMemberlyg:LoansToKeyManagementPersonnelMember2023-12-310001160106ifrs-full:KeyManagementPersonnelOfEntityOrParentMemberlyg:LoansToKeyManagementPersonnelMember2022-12-310001160106ifrs-full:KeyManagementPersonnelOfEntityOrParentMemberlyg:LoansToKeyManagementPersonnelMember2021-12-310001160106lyg:DirectorsAndConnectedPersonsMember2023-12-310001160106srt:DirectorMember2023-01-012023-12-31lyg:director0001160106lyg:ConnectedPersonsMember2023-01-012023-12-31lyg:connectedPerson0001160106lyg:DirectorsAndConnectedPersonsMember2022-12-310001160106srt:DirectorMember2022-01-012022-12-310001160106lyg:ConnectedPersonsMember2022-01-012022-12-310001160106lyg:DirectorsAndConnectedPersonsMember2021-12-310001160106srt:DirectorMember2021-01-012021-12-310001160106lyg:ConnectedPersonsMember2021-01-012021-12-310001160106naics:ZZ5251102023-12-310001160106naics:ZZ5251102022-12-310001160106ifrs-full:ConsolidatedMember2023-01-012023-12-310001160106ifrs-full:ConsolidatedMember2022-01-012022-12-310001160106lyg:UnconsolidatedMember2023-12-310001160106lyg:UnconsolidatedMember2022-12-310001160106lyg:UnconsolidatedMember2023-01-012023-12-310001160106lyg:UnconsolidatedMember2022-01-012022-12-310001160106lyg:OutstandingMember2023-12-310001160106lyg:OutstandingMember2022-12-310001160106lyg:SchroderWealthHoldingsLimitedMember2023-01-012023-12-310001160106lyg:SchroderWealthHoldingsLimitedMember2022-01-012022-12-310001160106lyg:OperatingMarginGuaranteeMember2023-01-012023-12-310001160106lyg:OperatingMarginGuaranteeMember2022-01-012022-12-310001160106lyg:OtherAssociatesFairValueThroughProfitAndLossMember2023-12-310001160106lyg:OtherAssociatesFairValueThroughProfitAndLossMember2022-12-310001160106lyg:OtherAssociatesFairValueThroughProfitAndLossMember2023-01-012023-12-310001160106lyg:OtherAssociatesFairValueThroughProfitAndLossMember2022-01-012022-12-310001160106lyg:MaximumExposureMember2023-12-310001160106lyg:MaximumExposureMember2022-12-31lyg:classAction0001160106lyg:CancaraMember2023-12-310001160106lyg:CancaraMember2022-12-310001160106ifrs-full:FinancialAssetsAtFairValueThroughProfitOrLossCategoryMemberlyg:CancaraMember2023-12-310001160106ifrs-full:FinancialAssetsAtFairValueThroughProfitOrLossCategoryMemberlyg:CancaraMember2022-12-310001160106lyg:CollectiveInvestmentVehiclesAndLimitedPartnershipsMember2023-12-310001160106lyg:CollectiveInvestmentVehiclesAndLimitedPartnershipsMember2022-12-310001160106ifrs-full:SecuritisationVehiclesMember2023-12-310001160106ifrs-full:SecuritisationVehiclesMember2022-12-310001160106ifrs-full:SecuritisationVehiclesMember2023-01-012023-12-310001160106ifrs-full:SecuritisationVehiclesMember2022-01-012022-12-310001160106lyg:InterestRateDerivativesSecuritisationVehiclesMember2023-01-012023-12-310001160106lyg:InterestRateDerivativesSecuritisationVehiclesMember2022-01-012022-12-310001160106lyg:RepurchaseAgreementStockLendingMemberlyg:CarryingValueOfTransferredAssetsMember2023-12-310001160106lyg:RepurchaseAgreementStockLendingMemberlyg:CarryingValueOfAssociatedLiabilitiesMember2023-12-310001160106lyg:RepurchaseAgreementStockLendingMemberlyg:CarryingValueOfTransferredAssetsMember2022-12-310001160106lyg:RepurchaseAgreementStockLendingMemberlyg:CarryingValueOfAssociatedLiabilitiesMember2022-12-310001160106lyg:SecuritisationProgrammeMemberlyg:CarryingValueOfTransferredAssetsMember2023-12-310001160106lyg:SecuritisationProgrammeMemberlyg:CarryingValueOfAssociatedLiabilitiesMember2023-12-310001160106lyg:SecuritisationProgrammeMemberlyg:CarryingValueOfTransferredAssetsMember2022-12-310001160106lyg:SecuritisationProgrammeMemberlyg:CarryingValueOfAssociatedLiabilitiesMember2022-12-310001160106lyg:LessHeldByTheGroupMemberlyg:NotesInIssueMemberlyg:SecuritisationProgrammeMember2023-12-310001160106lyg:LessHeldByTheGroupMemberlyg:NotesInIssueMemberlyg:SecuritisationProgrammeMember2022-12-310001160106ifrs-full:FinancialAssetsAtFairValueThroughProfitOrLossCategoryMemberlyg:ExcludingReverseRepurchaseAgreementMemberlyg:GrossAssetsAndLiabilitiesMember2023-12-310001160106ifrs-full:FinancialAssetsAtFairValueThroughProfitOrLossCategoryMemberlyg:ExcludingReverseRepurchaseAgreementMemberlyg:OffsetMember2023-12-310001160106ifrs-full:FinancialAssetsAtFairValueThroughProfitOrLossCategoryMemberlyg:ExcludingReverseRepurchaseAgreementMemberlyg:NetAmountsPresentedInTheBalanceSheetMember2023-12-310001160106ifrs-full:FinancialAssetsAtFairValueThroughProfitOrLossCategoryMemberlyg:CashCollateralReceivedPledgedNettingMemberlyg:ExcludingReverseRepurchaseAgreementMember2023-12-310001160106ifrs-full:FinancialAssetsAtFairValueThroughProfitOrLossCategoryMemberlyg:NoncashCollateralReceivedpledgedMemberlyg:ExcludingReverseRepurchaseAgreementMember2023-12-310001160106ifrs-full:FinancialAssetsAtFairValueThroughProfitOrLossCategoryMemberlyg:PotentialNetAmountsIfOffsetOfRelatedAmountsPermittedMemberlyg:ExcludingReverseRepurchaseAgreementMember2023-12-310001160106ifrs-full:FinancialAssetsAtFairValueThroughProfitOrLossCategoryMemberlyg:ReverseRepurchaseAgreementMemberlyg:GrossAssetsAndLiabilitiesMember2023-12-310001160106ifrs-full:FinancialAssetsAtFairValueThroughProfitOrLossCategoryMemberlyg:OffsetMemberlyg:ReverseRepurchaseAgreementMember2023-12-310001160106ifrs-full:FinancialAssetsAtFairValueThroughProfitOrLossCategoryMemberlyg:NetAmountsPresentedInTheBalanceSheetMemberlyg:ReverseRepurchaseAgreementMember2023-12-310001160106ifrs-full:FinancialAssetsAtFairValueThroughProfitOrLossCategoryMemberlyg:CashCollateralReceivedPledgedNettingMemberlyg:ReverseRepurchaseAgreementMember2023-12-310001160106ifrs-full:FinancialAssetsAtFairValueThroughProfitOrLossCategoryMemberlyg:NoncashCollateralReceivedpledgedMemberlyg:ReverseRepurchaseAgreementMember2023-12-310001160106ifrs-full:FinancialAssetsAtFairValueThroughProfitOrLossCategoryMemberlyg:PotentialNetAmountsIfOffsetOfRelatedAmountsPermittedMemberlyg:ReverseRepurchaseAgreementMember2023-12-310001160106ifrs-full:FinancialAssetsAtFairValueThroughProfitOrLossCategoryMemberlyg:GrossAssetsAndLiabilitiesMember2023-12-310001160106ifrs-full:FinancialAssetsAtFairValueThroughProfitOrLossCategoryMemberlyg:OffsetMember2023-12-310001160106ifrs-full:FinancialAssetsAtFairValueThroughProfitOrLossCategoryMemberlyg:NetAmountsPresentedInTheBalanceSheetMember2023-12-310001160106lyg:CashCollateralReceivedPledgedNettingMemberifrs-full:FinancialAssetsAtFairValueThroughProfitOrLossCategoryMember2023-12-310001160106ifrs-full:FinancialAssetsAtFairValueThroughProfitOrLossCategoryMemberlyg:NoncashCollateralReceivedpledgedMember2023-12-310001160106ifrs-full:FinancialAssetsAtFairValueThroughProfitOrLossCategoryMemberlyg:PotentialNetAmountsIfOffsetOfRelatedAmountsPermittedMember2023-12-310001160106lyg:DerivativeAssetsMemberlyg:GrossAssetsAndLiabilitiesMember2023-12-310001160106lyg:OffsetMemberlyg:DerivativeAssetsMember2023-12-310001160106lyg:NetAmountsPresentedInTheBalanceSheetMemberlyg:DerivativeAssetsMember2023-12-310001160106lyg:CashCollateralReceivedPledgedNettingMemberlyg:DerivativeAssetsMember2023-12-310001160106lyg:NoncashCollateralReceivedpledgedMemberlyg:DerivativeAssetsMember2023-12-310001160106lyg:PotentialNetAmountsIfOffsetOfRelatedAmountsPermittedMemberlyg:DerivativeAssetsMember2023-12-310001160106lyg:LoansAndAdvancesToBanksMemberlyg:GrossAssetsAndLiabilitiesMember2023-12-310001160106lyg:LoansAndAdvancesToBanksMemberlyg:OffsetMember2023-12-310001160106lyg:LoansAndAdvancesToBanksMemberlyg:NetAmountsPresentedInTheBalanceSheetMember2023-12-310001160106lyg:CashCollateralReceivedPledgedNettingMemberlyg:LoansAndAdvancesToBanksMember2023-12-310001160106lyg:NoncashCollateralReceivedpledgedMemberlyg:LoansAndAdvancesToBanksMember2023-12-310001160106lyg:PotentialNetAmountsIfOffsetOfRelatedAmountsPermittedMemberlyg:LoansAndAdvancesToBanksMember2023-12-310001160106lyg:LoansAndAdvancesToCustomersMemberlyg:GrossAssetsAndLiabilitiesMember2023-12-310001160106lyg:LoansAndAdvancesToCustomersMemberlyg:OffsetMember2023-12-310001160106lyg:LoansAndAdvancesToCustomersMemberlyg:NetAmountsPresentedInTheBalanceSheetMember2023-12-310001160106lyg:CashCollateralReceivedPledgedNettingMemberlyg:LoansAndAdvancesToCustomersMember2023-12-310001160106lyg:LoansAndAdvancesToCustomersMemberlyg:NoncashCollateralReceivedpledgedMember2023-12-310001160106lyg:PotentialNetAmountsIfOffsetOfRelatedAmountsPermittedMemberlyg:LoansAndAdvancesToCustomersMember2023-12-310001160106lyg:ReverseRepurchaseAgreementsMemberlyg:NetAmountsPresentedInTheBalanceSheetMember2023-12-310001160106ifrs-full:DebtSecuritiesMemberlyg:GrossAssetsAndLiabilitiesMember2023-12-310001160106lyg:OffsetMemberifrs-full:DebtSecuritiesMember2023-12-310001160106lyg:NetAmountsPresentedInTheBalanceSheetMemberifrs-full:DebtSecuritiesMember2023-12-310001160106lyg:CashCollateralReceivedPledgedNettingMemberifrs-full:DebtSecuritiesMember2023-12-310001160106lyg:NoncashCollateralReceivedpledgedMemberifrs-full:DebtSecuritiesMember2023-12-310001160106lyg:PotentialNetAmountsIfOffsetOfRelatedAmountsPermittedMemberifrs-full:DebtSecuritiesMember2023-12-310001160106lyg:GrossAssetsAndLiabilitiesMember2023-12-310001160106lyg:OffsetMember2023-12-310001160106lyg:CashCollateralReceivedPledgedNettingMember2023-12-310001160106lyg:NoncashCollateralReceivedpledgedMember2023-12-310001160106lyg:PotentialNetAmountsIfOffsetOfRelatedAmountsPermittedMember2023-12-310001160106lyg:DepositsFromBanksMemberlyg:GrossAssetsAndLiabilitiesMember2023-12-310001160106lyg:OffsetMemberlyg:DepositsFromCustomersMember2023-12-310001160106lyg:DepositsFromBanksMemberlyg:NetAmountsPresentedInTheBalanceSheetMember2023-12-310001160106lyg:CashCollateralReceivedPledgedNettingMemberlyg:DepositsFromBanksMember2023-12-310001160106lyg:NoncashCollateralReceivedpledgedMemberlyg:DepositsFromBanksMember2023-12-310001160106lyg:PotentialNetAmountsIfOffsetOfRelatedAmountsPermittedMemberlyg:DepositsFromBanksMember2023-12-310001160106lyg:DepositsFromCustomersMemberlyg:GrossAssetsAndLiabilitiesMember2023-12-310001160106lyg:NetAmountsPresentedInTheBalanceSheetMemberlyg:DepositsFromCustomersMember2023-12-310001160106lyg:CashCollateralReceivedPledgedNettingMemberlyg:DepositsFromCustomersMember2023-12-310001160106lyg:NoncashCollateralReceivedpledgedMemberlyg:DepositsFromCustomersMember2023-12-310001160106lyg:PotentialNetAmountsIfOffsetOfRelatedAmountsPermittedMemberlyg:DepositsFromCustomersMember2023-12-310001160106ifrs-full:FinancialLiabilitiesAtAmortisedCostCategoryMemberlyg:RepurchaseAgreementMemberlyg:GrossAssetsAndLiabilitiesMember2023-12-310001160106ifrs-full:FinancialLiabilitiesAtAmortisedCostCategoryMemberlyg:RepurchaseAgreementMemberlyg:OffsetMember2023-12-310001160106ifrs-full:FinancialLiabilitiesAtAmortisedCostCategoryMemberlyg:RepurchaseAgreementMemberlyg:NetAmountsPresentedInTheBalanceSheetMember2023-12-310001160106ifrs-full:FinancialLiabilitiesAtAmortisedCostCategoryMemberlyg:CashCollateralReceivedPledgedNettingMemberlyg:RepurchaseAgreementMember2023-12-310001160106ifrs-full:FinancialLiabilitiesAtAmortisedCostCategoryMemberlyg:RepurchaseAgreementMemberlyg:NoncashCollateralReceivedpledgedMember2023-12-310001160106ifrs-full:FinancialLiabilitiesAtAmortisedCostCategoryMemberlyg:RepurchaseAgreementMemberlyg:PotentialNetAmountsIfOffsetOfRelatedAmountsPermittedMember2023-12-310001160106lyg:ExcludingRepurchaseAgreementMemberifrs-full:FinancialLiabilitiesAtFairValueThroughProfitOrLossCategoryMemberlyg:GrossAssetsAndLiabilitiesMember2023-12-310001160106lyg:ExcludingRepurchaseAgreementMemberlyg:OffsetMemberifrs-full:FinancialLiabilitiesAtFairValueThroughProfitOrLossCategoryMember2023-12-310001160106lyg:ExcludingRepurchaseAgreementMemberlyg:NetAmountsPresentedInTheBalanceSheetMemberifrs-full:FinancialLiabilitiesAtFairValueThroughProfitOrLossCategoryMember2023-12-310001160106lyg:CashCollateralReceivedPledgedNettingMemberlyg:ExcludingRepurchaseAgreementMemberifrs-full:FinancialLiabilitiesAtFairValueThroughProfitOrLossCategoryMember2023-12-310001160106lyg:ExcludingRepurchaseAgreementMemberlyg:NoncashCollateralReceivedpledgedMemberifrs-full:FinancialLiabilitiesAtFairValueThroughProfitOrLossCategoryMember2023-12-310001160106lyg:PotentialNetAmountsIfOffsetOfRelatedAmountsPermittedMemberlyg:ExcludingRepurchaseAgreementMemberifrs-full:FinancialLiabilitiesAtFairValueThroughProfitOrLossCategoryMember2023-12-310001160106lyg:RepurchaseAgreementMemberifrs-full:FinancialLiabilitiesAtFairValueThroughProfitOrLossCategoryMemberlyg:GrossAssetsAndLiabilitiesMember2023-12-310001160106lyg:RepurchaseAgreementMemberlyg:OffsetMemberifrs-full:FinancialLiabilitiesAtFairValueThroughProfitOrLossCategoryMember2023-12-310001160106lyg:RepurchaseAgreementMemberlyg:NetAmountsPresentedInTheBalanceSheetMemberifrs-full:FinancialLiabilitiesAtFairValueThroughProfitOrLossCategoryMember2023-12-310001160106lyg:CashCollateralReceivedPledgedNettingMemberlyg:RepurchaseAgreementMemberifrs-full:FinancialLiabilitiesAtFairValueThroughProfitOrLossCategoryMember2023-12-310001160106lyg:RepurchaseAgreementMemberlyg:NoncashCollateralReceivedpledgedMemberifrs-full:FinancialLiabilitiesAtFairValueThroughProfitOrLossCategoryMember2023-12-310001160106lyg:RepurchaseAgreementMemberlyg:PotentialNetAmountsIfOffsetOfRelatedAmountsPermittedMemberifrs-full:FinancialLiabilitiesAtFairValueThroughProfitOrLossCategoryMember2023-12-310001160106ifrs-full:FinancialLiabilitiesAtFairValueThroughProfitOrLossCategoryMemberlyg:GrossAssetsAndLiabilitiesMember2023-12-310001160106lyg:OffsetMemberifrs-full:FinancialLiabilitiesAtFairValueThroughProfitOrLossCategoryMember2023-12-310001160106lyg:NetAmountsPresentedInTheBalanceSheetMemberifrs-full:FinancialLiabilitiesAtFairValueThroughProfitOrLossCategoryMember2023-12-310001160106lyg:CashCollateralReceivedPledgedNettingMemberifrs-full:FinancialLiabilitiesAtFairValueThroughProfitOrLossCategoryMember2023-12-310001160106lyg:NoncashCollateralReceivedpledgedMemberifrs-full:FinancialLiabilitiesAtFairValueThroughProfitOrLossCategoryMember2023-12-310001160106lyg:PotentialNetAmountsIfOffsetOfRelatedAmountsPermittedMemberifrs-full:FinancialLiabilitiesAtFairValueThroughProfitOrLossCategoryMember2023-12-310001160106lyg:DerivativeLiabilitiesMemberlyg:GrossAssetsAndLiabilitiesMember2023-12-310001160106lyg:DerivativeLiabilitiesMemberlyg:OffsetMember2023-12-310001160106lyg:DerivativeLiabilitiesMemberlyg:NetAmountsPresentedInTheBalanceSheetMember2023-12-310001160106lyg:CashCollateralReceivedPledgedNettingMemberlyg:DerivativeLiabilitiesMember2023-12-310001160106lyg:NoncashCollateralReceivedpledgedMemberlyg:DerivativeLiabilitiesMember2023-12-310001160106lyg:PotentialNetAmountsIfOffsetOfRelatedAmountsPermittedMemberlyg:DerivativeLiabilitiesMember2023-12-310001160106ifrs-full:FinancialAssetsAtFairValueThroughProfitOrLossCategoryMemberlyg:ExcludingReverseRepurchaseAgreementMemberlyg:GrossAssetsAndLiabilitiesMember2022-12-310001160106ifrs-full:FinancialAssetsAtFairValueThroughProfitOrLossCategoryMemberlyg:ExcludingReverseRepurchaseAgreementMemberlyg:OffsetMember2022-12-310001160106ifrs-full:FinancialAssetsAtFairValueThroughProfitOrLossCategoryMemberlyg:ExcludingReverseRepurchaseAgreementMemberlyg:NetAmountsPresentedInTheBalanceSheetMember2022-12-310001160106ifrs-full:FinancialAssetsAtFairValueThroughProfitOrLossCategoryMemberlyg:CashCollateralReceivedPledgedNettingMemberlyg:ExcludingReverseRepurchaseAgreementMember2022-12-310001160106ifrs-full:FinancialAssetsAtFairValueThroughProfitOrLossCategoryMemberlyg:NoncashCollateralReceivedpledgedMemberlyg:ExcludingReverseRepurchaseAgreementMember2022-12-310001160106ifrs-full:FinancialAssetsAtFairValueThroughProfitOrLossCategoryMemberlyg:PotentialNetAmountsIfOffsetOfRelatedAmountsPermittedMemberlyg:ExcludingReverseRepurchaseAgreementMember2022-12-310001160106ifrs-full:FinancialAssetsAtFairValueThroughProfitOrLossCategoryMemberlyg:ReverseRepurchaseAgreementMemberlyg:GrossAssetsAndLiabilitiesMember2022-12-310001160106ifrs-full:FinancialAssetsAtFairValueThroughProfitOrLossCategoryMemberlyg:OffsetMemberlyg:ReverseRepurchaseAgreementMember2022-12-310001160106ifrs-full:FinancialAssetsAtFairValueThroughProfitOrLossCategoryMemberlyg:NetAmountsPresentedInTheBalanceSheetMemberlyg:ReverseRepurchaseAgreementMember2022-12-310001160106ifrs-full:FinancialAssetsAtFairValueThroughProfitOrLossCategoryMemberlyg:CashCollateralReceivedPledgedNettingMemberlyg:ReverseRepurchaseAgreementMember2022-12-310001160106ifrs-full:FinancialAssetsAtFairValueThroughProfitOrLossCategoryMemberlyg:NoncashCollateralReceivedpledgedMemberlyg:ReverseRepurchaseAgreementMember2022-12-310001160106ifrs-full:FinancialAssetsAtFairValueThroughProfitOrLossCategoryMemberlyg:PotentialNetAmountsIfOffsetOfRelatedAmountsPermittedMemberlyg:ReverseRepurchaseAgreementMember2022-12-310001160106ifrs-full:FinancialAssetsAtFairValueThroughProfitOrLossCategoryMemberlyg:GrossAssetsAndLiabilitiesMember2022-12-310001160106ifrs-full:FinancialAssetsAtFairValueThroughProfitOrLossCategoryMemberlyg:OffsetMember2022-12-310001160106ifrs-full:FinancialAssetsAtFairValueThroughProfitOrLossCategoryMemberlyg:NetAmountsPresentedInTheBalanceSheetMember2022-12-310001160106lyg:CashCollateralReceivedPledgedNettingMemberifrs-full:FinancialAssetsAtFairValueThroughProfitOrLossCategoryMember2022-12-310001160106ifrs-full:FinancialAssetsAtFairValueThroughProfitOrLossCategoryMemberlyg:NoncashCollateralReceivedpledgedMember2022-12-310001160106ifrs-full:FinancialAssetsAtFairValueThroughProfitOrLossCategoryMemberlyg:PotentialNetAmountsIfOffsetOfRelatedAmountsPermittedMember2022-12-310001160106lyg:DerivativeAssetsMemberlyg:GrossAssetsAndLiabilitiesMember2022-12-310001160106lyg:OffsetMemberlyg:DerivativeAssetsMember2022-12-310001160106lyg:NetAmountsPresentedInTheBalanceSheetMemberlyg:DerivativeAssetsMember2022-12-310001160106lyg:CashCollateralReceivedPledgedNettingMemberlyg:DerivativeAssetsMember2022-12-310001160106lyg:NoncashCollateralReceivedpledgedMemberlyg:DerivativeAssetsMember2022-12-310001160106lyg:PotentialNetAmountsIfOffsetOfRelatedAmountsPermittedMemberlyg:DerivativeAssetsMember2022-12-310001160106lyg:LoansAndAdvancesToBanksMemberlyg:GrossAssetsAndLiabilitiesMember2022-12-310001160106lyg:LoansAndAdvancesToBanksMemberlyg:OffsetMember2022-12-310001160106lyg:LoansAndAdvancesToBanksMemberlyg:NetAmountsPresentedInTheBalanceSheetMember2022-12-310001160106lyg:CashCollateralReceivedPledgedNettingMemberlyg:LoansAndAdvancesToBanksMember2022-12-310001160106lyg:NoncashCollateralReceivedpledgedMemberlyg:LoansAndAdvancesToBanksMember2022-12-310001160106lyg:PotentialNetAmountsIfOffsetOfRelatedAmountsPermittedMemberlyg:LoansAndAdvancesToBanksMember2022-12-310001160106lyg:LoansAndAdvancesToCustomersMemberlyg:GrossAssetsAndLiabilitiesMember2022-12-310001160106lyg:LoansAndAdvancesToCustomersMemberlyg:OffsetMember2022-12-310001160106lyg:LoansAndAdvancesToCustomersMemberlyg:NetAmountsPresentedInTheBalanceSheetMember2022-12-310001160106lyg:CashCollateralReceivedPledgedNettingMemberlyg:LoansAndAdvancesToCustomersMember2022-12-310001160106lyg:LoansAndAdvancesToCustomersMemberlyg:NoncashCollateralReceivedpledgedMember2022-12-310001160106lyg:PotentialNetAmountsIfOffsetOfRelatedAmountsPermittedMemberlyg:LoansAndAdvancesToCustomersMember2022-12-310001160106lyg:ReverseRepurchaseAgreementsMemberlyg:GrossAssetsAndLiabilitiesMember2022-12-310001160106lyg:ReverseRepurchaseAgreementsMemberlyg:OffsetMember2022-12-310001160106lyg:ReverseRepurchaseAgreementsMemberlyg:NetAmountsPresentedInTheBalanceSheetMember2022-12-310001160106lyg:ReverseRepurchaseAgreementsMemberlyg:CashCollateralReceivedPledgedNettingMember2022-12-310001160106lyg:ReverseRepurchaseAgreementsMemberlyg:NoncashCollateralReceivedpledgedMember2022-12-310001160106lyg:ReverseRepurchaseAgreementsMemberlyg:PotentialNetAmountsIfOffsetOfRelatedAmountsPermittedMember2022-12-310001160106ifrs-full:DebtSecuritiesMemberlyg:GrossAssetsAndLiabilitiesMember2022-12-310001160106lyg:OffsetMemberifrs-full:DebtSecuritiesMember2022-12-310001160106lyg:NetAmountsPresentedInTheBalanceSheetMemberifrs-full:DebtSecuritiesMember2022-12-310001160106lyg:CashCollateralReceivedPledgedNettingMemberifrs-full:DebtSecuritiesMember2022-12-310001160106lyg:NoncashCollateralReceivedpledgedMemberifrs-full:DebtSecuritiesMember2022-12-310001160106lyg:PotentialNetAmountsIfOffsetOfRelatedAmountsPermittedMemberifrs-full:DebtSecuritiesMember2022-12-310001160106lyg:GrossAssetsAndLiabilitiesMember2022-12-310001160106lyg:OffsetMember2022-12-310001160106lyg:CashCollateralReceivedPledgedNettingMember2022-12-310001160106lyg:NoncashCollateralReceivedpledgedMember2022-12-310001160106lyg:PotentialNetAmountsIfOffsetOfRelatedAmountsPermittedMember2022-12-310001160106lyg:DepositsFromBanksMemberlyg:GrossAssetsAndLiabilitiesMember2022-12-310001160106lyg:DepositsFromBanksMemberlyg:OffsetMember2022-12-310001160106lyg:DepositsFromBanksMemberlyg:NetAmountsPresentedInTheBalanceSheetMember2022-12-310001160106lyg:CashCollateralReceivedPledgedNettingMemberlyg:DepositsFromBanksMember2022-12-310001160106lyg:NoncashCollateralReceivedpledgedMemberlyg:DepositsFromBanksMember2022-12-310001160106lyg:PotentialNetAmountsIfOffsetOfRelatedAmountsPermittedMemberlyg:DepositsFromBanksMember2022-12-310001160106lyg:DepositsFromCustomersMemberlyg:GrossAssetsAndLiabilitiesMember2022-12-310001160106lyg:OffsetMemberlyg:DepositsFromCustomersMember2022-12-310001160106lyg:NetAmountsPresentedInTheBalanceSheetMemberlyg:DepositsFromCustomersMember2022-12-310001160106lyg:CashCollateralReceivedPledgedNettingMemberlyg:DepositsFromCustomersMember2022-12-310001160106lyg:NoncashCollateralReceivedpledgedMemberlyg:DepositsFromCustomersMember2022-12-310001160106lyg:PotentialNetAmountsIfOffsetOfRelatedAmountsPermittedMemberlyg:DepositsFromCustomersMember2022-12-310001160106ifrs-full:FinancialLiabilitiesAtAmortisedCostCategoryMemberlyg:GrossAssetsAndLiabilitiesMember2022-12-310001160106ifrs-full:FinancialLiabilitiesAtAmortisedCostCategoryMemberlyg:OffsetMember2022-12-310001160106ifrs-full:FinancialLiabilitiesAtAmortisedCostCategoryMemberlyg:NetAmountsPresentedInTheBalanceSheetMember2022-12-310001160106ifrs-full:FinancialLiabilitiesAtAmortisedCostCategoryMemberlyg:CashCollateralReceivedPledgedNettingMember2022-12-310001160106ifrs-full:FinancialLiabilitiesAtAmortisedCostCategoryMemberlyg:NoncashCollateralReceivedpledgedMember2022-12-310001160106ifrs-full:FinancialLiabilitiesAtAmortisedCostCategoryMemberlyg:PotentialNetAmountsIfOffsetOfRelatedAmountsPermittedMember2022-12-310001160106lyg:ExcludingRepurchaseAgreementMemberifrs-full:FinancialLiabilitiesAtFairValueThroughProfitOrLossCategoryMemberlyg:GrossAssetsAndLiabilitiesMember2022-12-310001160106lyg:ExcludingRepurchaseAgreementMemberlyg:OffsetMemberifrs-full:FinancialLiabilitiesAtFairValueThroughProfitOrLossCategoryMember2022-12-310001160106lyg:ExcludingRepurchaseAgreementMemberlyg:NetAmountsPresentedInTheBalanceSheetMemberifrs-full:FinancialLiabilitiesAtFairValueThroughProfitOrLossCategoryMember2022-12-310001160106lyg:CashCollateralReceivedPledgedNettingMemberlyg:ExcludingRepurchaseAgreementMemberifrs-full:FinancialLiabilitiesAtFairValueThroughProfitOrLossCategoryMember2022-12-310001160106lyg:ExcludingRepurchaseAgreementMemberlyg:NoncashCollateralReceivedpledgedMemberifrs-full:FinancialLiabilitiesAtFairValueThroughProfitOrLossCategoryMember2022-12-310001160106lyg:PotentialNetAmountsIfOffsetOfRelatedAmountsPermittedMemberlyg:ExcludingRepurchaseAgreementMemberifrs-full:FinancialLiabilitiesAtFairValueThroughProfitOrLossCategoryMember2022-12-310001160106lyg:RepurchaseAgreementMemberifrs-full:FinancialLiabilitiesAtFairValueThroughProfitOrLossCategoryMemberlyg:GrossAssetsAndLiabilitiesMember2022-12-310001160106lyg:RepurchaseAgreementMemberlyg:OffsetMemberifrs-full:FinancialLiabilitiesAtFairValueThroughProfitOrLossCategoryMember2022-12-310001160106lyg:RepurchaseAgreementMemberlyg:NetAmountsPresentedInTheBalanceSheetMemberifrs-full:FinancialLiabilitiesAtFairValueThroughProfitOrLossCategoryMember2022-12-310001160106lyg:CashCollateralReceivedPledgedNettingMemberlyg:RepurchaseAgreementMemberifrs-full:FinancialLiabilitiesAtFairValueThroughProfitOrLossCategoryMember2022-12-310001160106lyg:RepurchaseAgreementMemberlyg:NoncashCollateralReceivedpledgedMemberifrs-full:FinancialLiabilitiesAtFairValueThroughProfitOrLossCategoryMember2022-12-310001160106lyg:RepurchaseAgreementMemberlyg:PotentialNetAmountsIfOffsetOfRelatedAmountsPermittedMemberifrs-full:FinancialLiabilitiesAtFairValueThroughProfitOrLossCategoryMember2022-12-310001160106ifrs-full:FinancialLiabilitiesAtFairValueThroughProfitOrLossCategoryMemberlyg:GrossAssetsAndLiabilitiesMember2022-12-310001160106lyg:OffsetMemberifrs-full:FinancialLiabilitiesAtFairValueThroughProfitOrLossCategoryMember2022-12-310001160106lyg:NetAmountsPresentedInTheBalanceSheetMemberifrs-full:FinancialLiabilitiesAtFairValueThroughProfitOrLossCategoryMember2022-12-310001160106lyg:CashCollateralReceivedPledgedNettingMemberifrs-full:FinancialLiabilitiesAtFairValueThroughProfitOrLossCategoryMember2022-12-310001160106lyg:NoncashCollateralReceivedpledgedMemberifrs-full:FinancialLiabilitiesAtFairValueThroughProfitOrLossCategoryMember2022-12-310001160106lyg:PotentialNetAmountsIfOffsetOfRelatedAmountsPermittedMemberifrs-full:FinancialLiabilitiesAtFairValueThroughProfitOrLossCategoryMember2022-12-310001160106lyg:DerivativeLiabilitiesMemberlyg:GrossAssetsAndLiabilitiesMember2022-12-310001160106lyg:DerivativeLiabilitiesMemberlyg:OffsetMember2022-12-310001160106lyg:DerivativeLiabilitiesMemberlyg:NetAmountsPresentedInTheBalanceSheetMember2022-12-310001160106lyg:CashCollateralReceivedPledgedNettingMemberlyg:DerivativeLiabilitiesMember2022-12-310001160106lyg:NoncashCollateralReceivedpledgedMemberlyg:DerivativeLiabilitiesMember2022-12-310001160106lyg:PotentialNetAmountsIfOffsetOfRelatedAmountsPermittedMemberlyg:DerivativeLiabilitiesMember2022-12-310001160106ifrs-full:FairValueHedgesMember2023-12-310001160106ifrs-full:FairValueHedgesMember2022-12-310001160106currency:EUR2023-12-310001160106currency:USD2023-12-310001160106lyg:OtherNonSterlingMember2023-12-310001160106currency:EUR2022-12-310001160106currency:USD2022-12-310001160106lyg:OtherNonSterlingMember2022-12-310001160106lyg:OffsetMember2023-12-310001160106lyg:NetExposureMember2023-12-310001160106lyg:OffsetMember2022-12-310001160106lyg:NetExposureMember2022-12-310001160106sic:Z0000toZ09992023-12-310001160106sic:Z0000toZ09992022-12-310001160106naics:ZZ232023-12-310001160106naics:ZZ232022-12-310001160106lyg:EnergyAndWaterSupplyMember2023-12-310001160106lyg:EnergyAndWaterSupplyMember2022-12-310001160106lyg:FinancialBusinessAndOtherServicesMember2023-12-310001160106lyg:FinancialBusinessAndOtherServicesMember2022-12-310001160106lyg:GrossAndLeaseFinancingMember2023-12-310001160106lyg:GrossAndLeaseFinancingMember2022-12-310001160106sic:Z2000toZ39992023-12-310001160106sic:Z2000toZ39992022-12-310001160106ifrs-full:MortgagesMember2023-12-310001160106ifrs-full:MortgagesMember2022-12-310001160106lyg:OtherMember2023-12-310001160106lyg:OtherMember2022-12-310001160106lyg:PostalAndTelecommunicationsMember2023-12-310001160106lyg:PostalAndTelecommunicationsMember2022-12-310001160106lyg:PropertyCompaniesMember2023-12-310001160106lyg:PropertyCompaniesMember2022-12-310001160106lyg:TransportDistributionAndHotelsMember2023-12-310001160106lyg:TransportDistributionAndHotelsMember2022-12-310001160106lyg:BeforeAllowanceForImpairmentLossesMember2023-12-310001160106lyg:BeforeAllowanceForImpairmentLossesMember2022-12-310001160106ifrs-full:AllowanceForCreditLossesMember2023-12-310001160106ifrs-full:AllowanceForCreditLossesMember2022-12-310001160106lyg:DebtSecuritiesTreasuryAndOtherBillsAtFairValueThroughProfitOrLossMemberlyg:InvestmentGradeMemberifrs-full:TreasurySharesMember2023-12-310001160106lyg:DebtSecuritiesTreasuryAndOtherBillsAtFairValueThroughProfitOrLossMemberlyg:OtherMemberifrs-full:TreasurySharesMember2023-12-310001160106lyg:DebtSecuritiesTreasuryAndOtherBillsAtFairValueThroughProfitOrLossMemberifrs-full:TreasurySharesMember2023-12-310001160106lyg:DebtSecuritiesTreasuryAndOtherBillsAtFairValueThroughProfitOrLossMemberlyg:InvestmentGradeMemberifrs-full:TreasurySharesMember2022-12-310001160106lyg:DebtSecuritiesTreasuryAndOtherBillsAtFairValueThroughProfitOrLossMemberlyg:OtherMemberifrs-full:TreasurySharesMember2022-12-310001160106lyg:DebtSecuritiesTreasuryAndOtherBillsAtFairValueThroughProfitOrLossMemberifrs-full:TreasurySharesMember2022-12-310001160106lyg:OtherAssetsHeldAtFairValueThroughProfitOrLossMemberlyg:InvestmentGradeMemberifrs-full:TreasurySharesMember2023-12-310001160106lyg:OtherAssetsHeldAtFairValueThroughProfitOrLossMemberlyg:OtherMemberifrs-full:TreasurySharesMember2023-12-310001160106lyg:OtherAssetsHeldAtFairValueThroughProfitOrLossMemberifrs-full:TreasurySharesMember2023-12-310001160106lyg:OtherAssetsHeldAtFairValueThroughProfitOrLossMemberlyg:InvestmentGradeMemberifrs-full:TreasurySharesMember2022-12-310001160106lyg:OtherAssetsHeldAtFairValueThroughProfitOrLossMemberlyg:OtherMemberifrs-full:TreasurySharesMember2022-12-310001160106lyg:OtherAssetsHeldAtFairValueThroughProfitOrLossMemberifrs-full:TreasurySharesMember2022-12-310001160106lyg:InvestmentGradeMemberifrs-full:TreasurySharesMember2023-12-310001160106lyg:OtherMemberifrs-full:TreasurySharesMember2023-12-310001160106ifrs-full:TreasurySharesMember2023-12-310001160106lyg:InvestmentGradeMemberifrs-full:TreasurySharesMember2022-12-310001160106lyg:OtherMemberifrs-full:TreasurySharesMember2022-12-310001160106ifrs-full:TreasurySharesMember2022-12-310001160106lyg:SubInvestmentGradeMemberlyg:OtherMember2023-12-310001160106lyg:SubInvestmentGradeMemberlyg:OtherMember2022-12-310001160106lyg:NotRatedMemberlyg:OtherMember2023-12-310001160106lyg:NotRatedMemberlyg:OtherMember2022-12-310001160106lyg:RMS13Memberifrs-full:BottomOfRangeMemberlyg:Retail1Member2023-01-012023-12-310001160106lyg:RMS13Memberlyg:Retail1Memberifrs-full:TopOfRangeMember2023-01-012023-12-310001160106lyg:CMS15Memberlyg:CommercialMemberifrs-full:BottomOfRangeMember2023-01-012023-12-310001160106lyg:CMS15Memberlyg:CommercialMemberifrs-full:TopOfRangeMember2023-01-012023-12-310001160106lyg:RMS46Memberifrs-full:BottomOfRangeMemberlyg:Retail1Member2023-01-012023-12-310001160106lyg:RMS46Memberlyg:Retail1Memberifrs-full:TopOfRangeMember2023-01-012023-12-310001160106lyg:CMS610Memberlyg:CommercialMemberifrs-full:BottomOfRangeMember2023-01-012023-12-310001160106lyg:CMS610Memberlyg:CommercialMemberifrs-full:TopOfRangeMember2023-01-012023-12-310001160106lyg:RMS79Memberifrs-full:BottomOfRangeMemberlyg:Retail1Member2023-01-012023-12-310001160106lyg:RMS79Memberlyg:Retail1Memberifrs-full:TopOfRangeMember2023-01-012023-12-310001160106lyg:CMS1114Memberlyg:CommercialMemberifrs-full:BottomOfRangeMember2023-01-012023-12-310001160106lyg:CMS1114Memberlyg:CommercialMemberifrs-full:TopOfRangeMember2023-01-012023-12-310001160106lyg:RMS10Memberifrs-full:BottomOfRangeMemberlyg:Retail1Member2023-01-012023-12-310001160106lyg:RMS10Memberlyg:Retail1Memberifrs-full:TopOfRangeMember2023-01-012023-12-310001160106lyg:CMS1518Memberlyg:CommercialMemberifrs-full:BottomOfRangeMember2023-01-012023-12-310001160106lyg:CMS1518Memberlyg:CommercialMemberifrs-full:TopOfRangeMember2023-01-012023-12-310001160106lyg:RMS1113Memberifrs-full:BottomOfRangeMemberlyg:Retail1Member2023-01-012023-12-310001160106lyg:RMS1113Memberlyg:Retail1Memberifrs-full:TopOfRangeMember2023-01-012023-12-310001160106lyg:CMS19Memberlyg:CommercialMemberifrs-full:BottomOfRangeMember2023-01-012023-12-310001160106lyg:CMS19Memberlyg:CommercialMemberifrs-full:TopOfRangeMember2023-01-012023-12-310001160106lyg:RMS14Memberlyg:Retail1Member2023-01-012023-12-310001160106lyg:CMS2023Memberlyg:CommercialMember2023-01-012023-12-310001160106lyg:Stage3Memberlyg:PartialWriteOffMember2023-12-310001160106lyg:Stage3Memberlyg:PartialWriteOffMember2022-12-310001160106lyg:ModifiedMemberlyg:Stage2AndStage3Member2023-12-310001160106lyg:ModifiedMemberlyg:Stage2AndStage3Member2022-12-310001160106lyg:ModifiedMemberlyg:Stage1Member2023-12-310001160106lyg:ModifiedMemberlyg:Stage1Member2022-12-310001160106lyg:RMS13Memberlyg:RetailMortgagesMemberlyg:GrossDrawnExposuresMemberlyg:Stage1Member2023-12-310001160106lyg:RMS13Memberlyg:RetailMortgagesMemberlyg:GrossDrawnExposuresMemberlyg:Stage2Member2023-12-310001160106lyg:RMS13Memberlyg:RetailMortgagesMemberlyg:GrossDrawnExposuresMemberlyg:Stage3Member2023-12-310001160106lyg:RMS13Memberlyg:PurchasedOrOriginatedCreditimpairedMemberlyg:RetailMortgagesMemberlyg:GrossDrawnExposuresMember2023-12-310001160106lyg:RMS13Memberlyg:RetailMortgagesMemberlyg:GrossDrawnExposuresMember2023-12-310001160106lyg:RMS13Memberlyg:RetailMortgagesMemberlyg:Stage1Memberlyg:ExpectedCreditLossesInRespectOfDrawnExposuresMember2023-12-310001160106lyg:RMS13Memberlyg:RetailMortgagesMemberlyg:Stage2Memberlyg:ExpectedCreditLossesInRespectOfDrawnExposuresMember2023-12-310001160106lyg:RMS13Memberlyg:RetailMortgagesMemberlyg:Stage3Memberlyg:ExpectedCreditLossesInRespectOfDrawnExposuresMember2023-12-310001160106lyg:RMS13Memberlyg:PurchasedOrOriginatedCreditimpairedMemberlyg:RetailMortgagesMemberlyg:ExpectedCreditLossesInRespectOfDrawnExposuresMember2023-12-310001160106lyg:RMS13Memberlyg:RetailMortgagesMemberlyg:ExpectedCreditLossesInRespectOfDrawnExposuresMember2023-12-310001160106lyg:RMS46Memberlyg:RetailMortgagesMemberlyg:GrossDrawnExposuresMemberlyg:Stage1Member2023-12-310001160106lyg:RMS46Memberlyg:RetailMortgagesMemberlyg:GrossDrawnExposuresMemberlyg:Stage2Member2023-12-310001160106lyg:RMS46Memberlyg:RetailMortgagesMemberlyg:GrossDrawnExposuresMemberlyg:Stage3Member2023-12-310001160106lyg:RMS46Memberlyg:PurchasedOrOriginatedCreditimpairedMemberlyg:RetailMortgagesMemberlyg:GrossDrawnExposuresMember2023-12-310001160106lyg:RMS46Memberlyg:RetailMortgagesMemberlyg:GrossDrawnExposuresMember2023-12-310001160106lyg:RMS46Memberlyg:RetailMortgagesMemberlyg:Stage1Memberlyg:ExpectedCreditLossesInRespectOfDrawnExposuresMember2023-12-310001160106lyg:RMS46Memberlyg:RetailMortgagesMemberlyg:Stage2Memberlyg:ExpectedCreditLossesInRespectOfDrawnExposuresMember2023-12-310001160106lyg:RMS46Memberlyg:RetailMortgagesMemberlyg:Stage3Memberlyg:ExpectedCreditLossesInRespectOfDrawnExposuresMember2023-12-310001160106lyg:RMS46Memberlyg:PurchasedOrOriginatedCreditimpairedMemberlyg:RetailMortgagesMemberlyg:ExpectedCreditLossesInRespectOfDrawnExposuresMember2023-12-310001160106lyg:RMS46Memberlyg:RetailMortgagesMemberlyg:ExpectedCreditLossesInRespectOfDrawnExposuresMember2023-12-310001160106lyg:RetailMortgagesMemberlyg:GrossDrawnExposuresMemberlyg:Stage1Memberlyg:RMS79Member2023-12-310001160106lyg:RetailMortgagesMemberlyg:GrossDrawnExposuresMemberlyg:RMS79Memberlyg:Stage2Member2023-12-310001160106lyg:RetailMortgagesMemberlyg:GrossDrawnExposuresMemberlyg:Stage3Memberlyg:RMS79Member2023-12-310001160106lyg:PurchasedOrOriginatedCreditimpairedMemberlyg:RetailMortgagesMemberlyg:GrossDrawnExposuresMemberlyg:RMS79Member2023-12-310001160106lyg:RetailMortgagesMemberlyg:GrossDrawnExposuresMemberlyg:RMS79Member2023-12-310001160106lyg:RetailMortgagesMemberlyg:Stage1Memberlyg:RMS79Memberlyg:ExpectedCreditLossesInRespectOfDrawnExposuresMember2023-12-310001160106lyg:RetailMortgagesMemberlyg:RMS79Memberlyg:Stage2Memberlyg:ExpectedCreditLossesInRespectOfDrawnExposuresMember2023-12-310001160106lyg:RetailMortgagesMemberlyg:Stage3Memberlyg:RMS79Memberlyg:ExpectedCreditLossesInRespectOfDrawnExposuresMember2023-12-310001160106lyg:PurchasedOrOriginatedCreditimpairedMemberlyg:RetailMortgagesMemberlyg:RMS79Memberlyg:ExpectedCreditLossesInRespectOfDrawnExposuresMember2023-12-310001160106lyg:RetailMortgagesMemberlyg:RMS79Memberlyg:ExpectedCreditLossesInRespectOfDrawnExposuresMember2023-12-310001160106lyg:RetailMortgagesMemberlyg:GrossDrawnExposuresMemberlyg:Stage1Memberlyg:RMS10Member2023-12-310001160106lyg:RetailMortgagesMemberlyg:GrossDrawnExposuresMemberlyg:RMS10Memberlyg:Stage2Member2023-12-310001160106lyg:RetailMortgagesMemberlyg:GrossDrawnExposuresMemberlyg:Stage3Memberlyg:RMS10Member2023-12-310001160106lyg:PurchasedOrOriginatedCreditimpairedMemberlyg:RetailMortgagesMemberlyg:GrossDrawnExposuresMemberlyg:RMS10Member2023-12-310001160106lyg:RetailMortgagesMemberlyg:GrossDrawnExposuresMemberlyg:RMS10Member2023-12-310001160106lyg:RetailMortgagesMemberlyg:Stage1Memberlyg:RMS10Memberlyg:ExpectedCreditLossesInRespectOfDrawnExposuresMember2023-12-310001160106lyg:RetailMortgagesMemberlyg:RMS10Memberlyg:Stage2Memberlyg:ExpectedCreditLossesInRespectOfDrawnExposuresMember2023-12-310001160106lyg:RetailMortgagesMemberlyg:Stage3Memberlyg:RMS10Memberlyg:ExpectedCreditLossesInRespectOfDrawnExposuresMember2023-12-310001160106lyg:PurchasedOrOriginatedCreditimpairedMemberlyg:RetailMortgagesMemberlyg:RMS10Memberlyg:ExpectedCreditLossesInRespectOfDrawnExposuresMember2023-12-310001160106lyg:RetailMortgagesMemberlyg:RMS10Memberlyg:ExpectedCreditLossesInRespectOfDrawnExposuresMember2023-12-310001160106lyg:RetailMortgagesMemberlyg:GrossDrawnExposuresMemberlyg:RMS1113Memberlyg:Stage1Member2023-12-310001160106lyg:RetailMortgagesMemberlyg:GrossDrawnExposuresMemberlyg:RMS1113Memberlyg:Stage2Member2023-12-310001160106lyg:RetailMortgagesMemberlyg:GrossDrawnExposuresMemberlyg:RMS1113Memberlyg:Stage3Member2023-12-310001160106lyg:PurchasedOrOriginatedCreditimpairedMemberlyg:RetailMortgagesMemberlyg:GrossDrawnExposuresMemberlyg:RMS1113Member2023-12-310001160106lyg:RetailMortgagesMemberlyg:GrossDrawnExposuresMemberlyg:RMS1113Member2023-12-310001160106lyg:RetailMortgagesMemberlyg:RMS1113Memberlyg:Stage1Memberlyg:ExpectedCreditLossesInRespectOfDrawnExposuresMember2023-12-310001160106lyg:RetailMortgagesMemberlyg:RMS1113Memberlyg:Stage2Memberlyg:ExpectedCreditLossesInRespectOfDrawnExposuresMember2023-12-310001160106lyg:RetailMortgagesMemberlyg:RMS1113Memberlyg:Stage3Memberlyg:ExpectedCreditLossesInRespectOfDrawnExposuresMember2023-12-310001160106lyg:PurchasedOrOriginatedCreditimpairedMemberlyg:RetailMortgagesMemberlyg:RMS1113Memberlyg:ExpectedCreditLossesInRespectOfDrawnExposuresMember2023-12-310001160106lyg:RetailMortgagesMemberlyg:RMS1113Memberlyg:ExpectedCreditLossesInRespectOfDrawnExposuresMember2023-12-310001160106lyg:RetailMortgagesMemberlyg:GrossDrawnExposuresMemberlyg:Stage1Memberlyg:RMS14Member2023-12-310001160106lyg:RetailMortgagesMemberlyg:GrossDrawnExposuresMemberlyg:RMS14Memberlyg:Stage2Member2023-12-310001160106lyg:RetailMortgagesMemberlyg:GrossDrawnExposuresMemberlyg:Stage3Memberlyg:RMS14Member2023-12-310001160106lyg:PurchasedOrOriginatedCreditimpairedMemberlyg:RetailMortgagesMemberlyg:GrossDrawnExposuresMemberlyg:RMS14Member2023-12-310001160106lyg:RetailMortgagesMemberlyg:GrossDrawnExposuresMemberlyg:RMS14Member2023-12-310001160106lyg:RetailMortgagesMemberlyg:Stage1Memberlyg:RMS14Memberlyg:ExpectedCreditLossesInRespectOfDrawnExposuresMember2023-12-310001160106lyg:RetailMortgagesMemberlyg:RMS14Memberlyg:Stage2Memberlyg:ExpectedCreditLossesInRespectOfDrawnExposuresMember2023-12-310001160106lyg:RetailMortgagesMemberlyg:Stage3Memberlyg:RMS14Memberlyg:ExpectedCreditLossesInRespectOfDrawnExposuresMember2023-12-310001160106lyg:PurchasedOrOriginatedCreditimpairedMemberlyg:RetailMortgagesMemberlyg:RMS14Memberlyg:ExpectedCreditLossesInRespectOfDrawnExposuresMember2023-12-310001160106lyg:RetailMortgagesMemberlyg:RMS14Memberlyg:ExpectedCreditLossesInRespectOfDrawnExposuresMember2023-12-310001160106lyg:RetailMortgagesMemberlyg:GrossDrawnExposuresMemberlyg:Stage1Member2023-12-310001160106lyg:RetailMortgagesMemberlyg:GrossDrawnExposuresMemberlyg:Stage2Member2023-12-310001160106lyg:RetailMortgagesMemberlyg:GrossDrawnExposuresMemberlyg:Stage3Member2023-12-310001160106lyg:PurchasedOrOriginatedCreditimpairedMemberlyg:RetailMortgagesMemberlyg:GrossDrawnExposuresMember2023-12-310001160106lyg:RetailMortgagesMemberlyg:GrossDrawnExposuresMember2023-12-310001160106lyg:RetailMortgagesMemberlyg:Stage1Memberlyg:ExpectedCreditLossesInRespectOfDrawnExposuresMember2023-12-310001160106lyg:RetailMortgagesMemberlyg:Stage2Memberlyg:ExpectedCreditLossesInRespectOfDrawnExposuresMember2023-12-310001160106lyg:RetailMortgagesMemberlyg:Stage3Memberlyg:ExpectedCreditLossesInRespectOfDrawnExposuresMember2023-12-310001160106lyg:PurchasedOrOriginatedCreditimpairedMemberlyg:RetailMortgagesMemberlyg:ExpectedCreditLossesInRespectOfDrawnExposuresMember2023-12-310001160106lyg:RetailMortgagesMemberlyg:ExpectedCreditLossesInRespectOfDrawnExposuresMember2023-12-310001160106lyg:RMS13Memberlyg:RetailCreditCardsMemberlyg:GrossDrawnExposuresMemberlyg:Stage1Member2023-12-310001160106lyg:RMS13Memberlyg:RetailCreditCardsMemberlyg:GrossDrawnExposuresMemberlyg:Stage2Member2023-12-310001160106lyg:RMS13Memberlyg:RetailCreditCardsMemberlyg:GrossDrawnExposuresMemberlyg:Stage3Member2023-12-310001160106lyg:RMS13Memberlyg:PurchasedOrOriginatedCreditimpairedMemberlyg:RetailCreditCardsMemberlyg:GrossDrawnExposuresMember2023-12-310001160106lyg:RMS13Memberlyg:RetailCreditCardsMemberlyg:GrossDrawnExposuresMember2023-12-310001160106lyg:RMS13Memberlyg:RetailCreditCardsMemberlyg:Stage1Memberlyg:ExpectedCreditLossesInRespectOfDrawnExposuresMember2023-12-310001160106lyg:RMS13Memberlyg:RetailCreditCardsMemberlyg:Stage2Memberlyg:ExpectedCreditLossesInRespectOfDrawnExposuresMember2023-12-310001160106lyg:RMS13Memberlyg:RetailCreditCardsMemberlyg:Stage3Memberlyg:ExpectedCreditLossesInRespectOfDrawnExposuresMember2023-12-310001160106lyg:RMS13Memberlyg:PurchasedOrOriginatedCreditimpairedMemberlyg:RetailCreditCardsMemberlyg:ExpectedCreditLossesInRespectOfDrawnExposuresMember2023-12-310001160106lyg:RMS13Memberlyg:RetailCreditCardsMemberlyg:ExpectedCreditLossesInRespectOfDrawnExposuresMember2023-12-310001160106lyg:RMS46Memberlyg:RetailCreditCardsMemberlyg:GrossDrawnExposuresMemberlyg:Stage1Member2023-12-310001160106lyg:RMS46Memberlyg:RetailCreditCardsMemberlyg:GrossDrawnExposuresMemberlyg:Stage2Member2023-12-310001160106lyg:RMS46Memberlyg:RetailCreditCardsMemberlyg:GrossDrawnExposuresMemberlyg:Stage3Member2023-12-310001160106lyg:RMS46Memberlyg:PurchasedOrOriginatedCreditimpairedMemberlyg:RetailCreditCardsMemberlyg:GrossDrawnExposuresMember2023-12-310001160106lyg:RMS46Memberlyg:RetailCreditCardsMemberlyg:GrossDrawnExposuresMember2023-12-310001160106lyg:RMS46Memberlyg:RetailCreditCardsMemberlyg:Stage1Memberlyg:ExpectedCreditLossesInRespectOfDrawnExposuresMember2023-12-310001160106lyg:RMS46Memberlyg:RetailCreditCardsMemberlyg:Stage2Memberlyg:ExpectedCreditLossesInRespectOfDrawnExposuresMember2023-12-310001160106lyg:RMS46Memberlyg:RetailCreditCardsMemberlyg:Stage3Memberlyg:ExpectedCreditLossesInRespectOfDrawnExposuresMember2023-12-310001160106lyg:RMS46Memberlyg:PurchasedOrOriginatedCreditimpairedMemberlyg:RetailCreditCardsMemberlyg:ExpectedCreditLossesInRespectOfDrawnExposuresMember2023-12-310001160106lyg:RMS46Memberlyg:RetailCreditCardsMemberlyg:ExpectedCreditLossesInRespectOfDrawnExposuresMember2023-12-310001160106lyg:RetailCreditCardsMemberlyg:GrossDrawnExposuresMemberlyg:Stage1Memberlyg:RMS79Member2023-12-310001160106lyg:RetailCreditCardsMemberlyg:GrossDrawnExposuresMemberlyg:RMS79Memberlyg:Stage2Member2023-12-310001160106lyg:RetailCreditCardsMemberlyg:GrossDrawnExposuresMemberlyg:Stage3Memberlyg:RMS79Member2023-12-310001160106lyg:PurchasedOrOriginatedCreditimpairedMemberlyg:RetailCreditCardsMemberlyg:GrossDrawnExposuresMemberlyg:RMS79Member2023-12-310001160106lyg:RetailCreditCardsMemberlyg:GrossDrawnExposuresMemberlyg:RMS79Member2023-12-310001160106lyg:RetailCreditCardsMemberlyg:Stage1Memberlyg:RMS79Memberlyg:ExpectedCreditLossesInRespectOfDrawnExposuresMember2023-12-310001160106lyg:RetailCreditCardsMemberlyg:RMS79Memberlyg:Stage2Memberlyg:ExpectedCreditLossesInRespectOfDrawnExposuresMember2023-12-310001160106lyg:RetailCreditCardsMemberlyg:Stage3Memberlyg:RMS79Memberlyg:ExpectedCreditLossesInRespectOfDrawnExposuresMember2023-12-310001160106lyg:PurchasedOrOriginatedCreditimpairedMemberlyg:RetailCreditCardsMemberlyg:RMS79Memberlyg:ExpectedCreditLossesInRespectOfDrawnExposuresMember2023-12-310001160106lyg:RetailCreditCardsMemberlyg:RMS79Memberlyg:ExpectedCreditLossesInRespectOfDrawnExposuresMember2023-12-310001160106lyg:RetailCreditCardsMemberlyg:GrossDrawnExposuresMemberlyg:Stage1Memberlyg:RMS10Member2023-12-310001160106lyg:RetailCreditCardsMemberlyg:GrossDrawnExposuresMemberlyg:RMS10Memberlyg:Stage2Member2023-12-310001160106lyg:RetailCreditCardsMemberlyg:GrossDrawnExposuresMemberlyg:Stage3Memberlyg:RMS10Member2023-12-310001160106lyg:PurchasedOrOriginatedCreditimpairedMemberlyg:RetailCreditCardsMemberlyg:GrossDrawnExposuresMemberlyg:RMS10Member2023-12-310001160106lyg:RetailCreditCardsMemberlyg:GrossDrawnExposuresMemberlyg:RMS10Member2023-12-310001160106lyg:RetailCreditCardsMemberlyg:Stage1Memberlyg:RMS10Memberlyg:ExpectedCreditLossesInRespectOfDrawnExposuresMember2023-12-310001160106lyg:RetailCreditCardsMemberlyg:RMS10Memberlyg:Stage2Memberlyg:ExpectedCreditLossesInRespectOfDrawnExposuresMember2023-12-310001160106lyg:RetailCreditCardsMemberlyg:Stage3Memberlyg:RMS10Memberlyg:ExpectedCreditLossesInRespectOfDrawnExposuresMember2023-12-310001160106lyg:PurchasedOrOriginatedCreditimpairedMemberlyg:RetailCreditCardsMemberlyg:RMS10Memberlyg:ExpectedCreditLossesInRespectOfDrawnExposuresMember2023-12-310001160106lyg:RetailCreditCardsMemberlyg:RMS10Memberlyg:ExpectedCreditLossesInRespectOfDrawnExposuresMember2023-12-310001160106lyg:RetailCreditCardsMemberlyg:GrossDrawnExposuresMemberlyg:RMS1113Memberlyg:Stage1Member2023-12-310001160106lyg:RetailCreditCardsMemberlyg:GrossDrawnExposuresMemberlyg:RMS1113Memberlyg:Stage2Member2023-12-310001160106lyg:RetailCreditCardsMemberlyg:GrossDrawnExposuresMemberlyg:RMS1113Memberlyg:Stage3Member2023-12-310001160106lyg:PurchasedOrOriginatedCreditimpairedMemberlyg:RetailCreditCardsMemberlyg:GrossDrawnExposuresMemberlyg:RMS1113Member2023-12-310001160106lyg:RetailCreditCardsMemberlyg:GrossDrawnExposuresMemberlyg:RMS1113Member2023-12-310001160106lyg:RetailCreditCardsMemberlyg:RMS1113Memberlyg:Stage1Memberlyg:ExpectedCreditLossesInRespectOfDrawnExposuresMember2023-12-310001160106lyg:RetailCreditCardsMemberlyg:RMS1113Memberlyg:Stage2Memberlyg:ExpectedCreditLossesInRespectOfDrawnExposuresMember2023-12-310001160106lyg:RetailCreditCardsMemberlyg:RMS1113Memberlyg:Stage3Memberlyg:ExpectedCreditLossesInRespectOfDrawnExposuresMember2023-12-310001160106lyg:PurchasedOrOriginatedCreditimpairedMemberlyg:RetailCreditCardsMemberlyg:RMS1113Memberlyg:ExpectedCreditLossesInRespectOfDrawnExposuresMember2023-12-310001160106lyg:RetailCreditCardsMemberlyg:RMS1113Memberlyg:ExpectedCreditLossesInRespectOfDrawnExposuresMember2023-12-310001160106lyg:RetailCreditCardsMemberlyg:GrossDrawnExposuresMemberlyg:Stage1Memberlyg:RMS14Member2023-12-310001160106lyg:RetailCreditCardsMemberlyg:GrossDrawnExposuresMemberlyg:RMS14Memberlyg:Stage2Member2023-12-310001160106lyg:RetailCreditCardsMemberlyg:GrossDrawnExposuresMemberlyg:Stage3Memberlyg:RMS14Member2023-12-310001160106lyg:PurchasedOrOriginatedCreditimpairedMemberlyg:RetailCreditCardsMemberlyg:GrossDrawnExposuresMemberlyg:RMS14Member2023-12-310001160106lyg:RetailCreditCardsMemberlyg:GrossDrawnExposuresMemberlyg:RMS14Member2023-12-310001160106lyg:RetailCreditCardsMemberlyg:Stage1Memberlyg:RMS14Memberlyg:ExpectedCreditLossesInRespectOfDrawnExposuresMember2023-12-310001160106lyg:RetailCreditCardsMemberlyg:RMS14Memberlyg:Stage2Memberlyg:ExpectedCreditLossesInRespectOfDrawnExposuresMember2023-12-310001160106lyg:RetailCreditCardsMemberlyg:Stage3Memberlyg:RMS14Memberlyg:ExpectedCreditLossesInRespectOfDrawnExposuresMember2023-12-310001160106lyg:PurchasedOrOriginatedCreditimpairedMemberlyg:RetailCreditCardsMemberlyg:RMS14Memberlyg:ExpectedCreditLossesInRespectOfDrawnExposuresMember2023-12-310001160106lyg:RetailCreditCardsMemberlyg:RMS14Memberlyg:ExpectedCreditLossesInRespectOfDrawnExposuresMember2023-12-310001160106lyg:RetailCreditCardsMemberlyg:GrossDrawnExposuresMemberlyg:Stage1Member2023-12-310001160106lyg:RetailCreditCardsMemberlyg:GrossDrawnExposuresMemberlyg:Stage2Member2023-12-310001160106lyg:RetailCreditCardsMemberlyg:GrossDrawnExposuresMemberlyg:Stage3Member2023-12-310001160106lyg:PurchasedOrOriginatedCreditimpairedMemberlyg:RetailCreditCardsMemberlyg:GrossDrawnExposuresMember2023-12-310001160106lyg:RetailCreditCardsMemberlyg:GrossDrawnExposuresMember2023-12-310001160106lyg:RetailCreditCardsMemberlyg:Stage1Memberlyg:ExpectedCreditLossesInRespectOfDrawnExposuresMember2023-12-310001160106lyg:RetailCreditCardsMemberlyg:Stage2Memberlyg:ExpectedCreditLossesInRespectOfDrawnExposuresMember2023-12-310001160106lyg:RetailCreditCardsMemberlyg:Stage3Memberlyg:ExpectedCreditLossesInRespectOfDrawnExposuresMember2023-12-310001160106lyg:PurchasedOrOriginatedCreditimpairedMemberlyg:RetailCreditCardsMemberlyg:ExpectedCreditLossesInRespectOfDrawnExposuresMember2023-12-310001160106lyg:RetailCreditCardsMemberlyg:ExpectedCreditLossesInRespectOfDrawnExposuresMember2023-12-310001160106lyg:RetailLoansAndOverdraftsMemberlyg:RMS13Memberlyg:GrossDrawnExposuresMemberlyg:Stage1Member2023-12-310001160106lyg:RetailLoansAndOverdraftsMemberlyg:RMS13Memberlyg:GrossDrawnExposuresMemberlyg:Stage2Member2023-12-310001160106lyg:RetailLoansAndOverdraftsMemberlyg:RMS13Memberlyg:GrossDrawnExposuresMemberlyg:Stage3Member2023-12-310001160106lyg:RetailLoansAndOverdraftsMemberlyg:RMS13Memberlyg:PurchasedOrOriginatedCreditimpairedMemberlyg:GrossDrawnExposuresMember2023-12-310001160106lyg:RetailLoansAndOverdraftsMemberlyg:RMS13Memberlyg:GrossDrawnExposuresMember2023-12-310001160106lyg:RetailLoansAndOverdraftsMemberlyg:RMS13Memberlyg:Stage1Memberlyg:ExpectedCreditLossesInRespectOfDrawnExposuresMember2023-12-310001160106lyg:RetailLoansAndOverdraftsMemberlyg:RMS13Memberlyg:Stage2Memberlyg:ExpectedCreditLossesInRespectOfDrawnExposuresMember2023-12-310001160106lyg:RetailLoansAndOverdraftsMemberlyg:RMS13Memberlyg:Stage3Memberlyg:ExpectedCreditLossesInRespectOfDrawnExposuresMember2023-12-310001160106lyg:RetailLoansAndOverdraftsMemberlyg:RMS13Memberlyg:PurchasedOrOriginatedCreditimpairedMemberlyg:ExpectedCreditLossesInRespectOfDrawnExposuresMember2023-12-310001160106lyg:RetailLoansAndOverdraftsMemberlyg:RMS13Memberlyg:ExpectedCreditLossesInRespectOfDrawnExposuresMember2023-12-310001160106lyg:RetailLoansAndOverdraftsMemberlyg:RMS46Memberlyg:GrossDrawnExposuresMemberlyg:Stage1Member2023-12-310001160106lyg:RetailLoansAndOverdraftsMemberlyg:RMS46Memberlyg:GrossDrawnExposuresMemberlyg:Stage2Member2023-12-310001160106lyg:RetailLoansAndOverdraftsMemberlyg:RMS46Memberlyg:GrossDrawnExposuresMemberlyg:Stage3Member2023-12-310001160106lyg:RetailLoansAndOverdraftsMemberlyg:RMS46Memberlyg:PurchasedOrOriginatedCreditimpairedMemberlyg:GrossDrawnExposuresMember2023-12-310001160106lyg:RetailLoansAndOverdraftsMemberlyg:RMS46Memberlyg:GrossDrawnExposuresMember2023-12-310001160106lyg:RetailLoansAndOverdraftsMemberlyg:RMS46Memberlyg:Stage1Memberlyg:ExpectedCreditLossesInRespectOfDrawnExposuresMember2023-12-310001160106lyg:RetailLoansAndOverdraftsMemberlyg:RMS46Memberlyg:Stage2Memberlyg:ExpectedCreditLossesInRespectOfDrawnExposuresMember2023-12-310001160106lyg:RetailLoansAndOverdraftsMemberlyg:RMS46Memberlyg:Stage3Memberlyg:ExpectedCreditLossesInRespectOfDrawnExposuresMember2023-12-310001160106lyg:RetailLoansAndOverdraftsMemberlyg:RMS46Memberlyg:PurchasedOrOriginatedCreditimpairedMemberlyg:ExpectedCreditLossesInRespectOfDrawnExposuresMember2023-12-310001160106lyg:RetailLoansAndOverdraftsMemberlyg:RMS46Memberlyg:ExpectedCreditLossesInRespectOfDrawnExposuresMember2023-12-310001160106lyg:RetailLoansAndOverdraftsMemberlyg:GrossDrawnExposuresMemberlyg:Stage1Memberlyg:RMS79Member2023-12-310001160106lyg:RetailLoansAndOverdraftsMemberlyg:GrossDrawnExposuresMemberlyg:RMS79Memberlyg:Stage2Member2023-12-310001160106lyg:RetailLoansAndOverdraftsMemberlyg:GrossDrawnExposuresMemberlyg:Stage3Memberlyg:RMS79Member2023-12-310001160106lyg:RetailLoansAndOverdraftsMemberlyg:PurchasedOrOriginatedCreditimpairedMemberlyg:GrossDrawnExposuresMemberlyg:RMS79Member2023-12-310001160106lyg:RetailLoansAndOverdraftsMemberlyg:GrossDrawnExposuresMemberlyg:RMS79Member2023-12-310001160106lyg:RetailLoansAndOverdraftsMemberlyg:Stage1Memberlyg:RMS79Memberlyg:ExpectedCreditLossesInRespectOfDrawnExposuresMember2023-12-310001160106lyg:RetailLoansAndOverdraftsMemberlyg:RMS79Memberlyg:Stage2Memberlyg:ExpectedCreditLossesInRespectOfDrawnExposuresMember2023-12-310001160106lyg:RetailLoansAndOverdraftsMemberlyg:Stage3Memberlyg:RMS79Memberlyg:ExpectedCreditLossesInRespectOfDrawnExposuresMember2023-12-310001160106lyg:RetailLoansAndOverdraftsMemberlyg:PurchasedOrOriginatedCreditimpairedMemberlyg:RMS79Memberlyg:ExpectedCreditLossesInRespectOfDrawnExposuresMember2023-12-310001160106lyg:RetailLoansAndOverdraftsMemberlyg:RMS79Memberlyg:ExpectedCreditLossesInRespectOfDrawnExposuresMember2023-12-310001160106lyg:RetailLoansAndOverdraftsMemberlyg:GrossDrawnExposuresMemberlyg:Stage1Memberlyg:RMS10Member2023-12-310001160106lyg:RetailLoansAndOverdraftsMemberlyg:GrossDrawnExposuresMemberlyg:RMS10Memberlyg:Stage2Member2023-12-310001160106lyg:RetailLoansAndOverdraftsMemberlyg:GrossDrawnExposuresMemberlyg:Stage3Memberlyg:RMS10Member2023-12-310001160106lyg:RetailLoansAndOverdraftsMemberlyg:PurchasedOrOriginatedCreditimpairedMemberlyg:GrossDrawnExposuresMemberlyg:RMS10Member2023-12-310001160106lyg:RetailLoansAndOverdraftsMemberlyg:GrossDrawnExposuresMemberlyg:RMS10Member2023-12-310001160106lyg:RetailLoansAndOverdraftsMemberlyg:Stage1Memberlyg:RMS10Memberlyg:ExpectedCreditLossesInRespectOfDrawnExposuresMember2023-12-310001160106lyg:RetailLoansAndOverdraftsMemberlyg:RMS10Memberlyg:Stage2Memberlyg:ExpectedCreditLossesInRespectOfDrawnExposuresMember2023-12-310001160106lyg:RetailLoansAndOverdraftsMemberlyg:Stage3Memberlyg:RMS10Memberlyg:ExpectedCreditLossesInRespectOfDrawnExposuresMember2023-12-310001160106lyg:RetailLoansAndOverdraftsMemberlyg:PurchasedOrOriginatedCreditimpairedMemberlyg:RMS10Memberlyg:ExpectedCreditLossesInRespectOfDrawnExposuresMember2023-12-310001160106lyg:RetailLoansAndOverdraftsMemberlyg:RMS10Memberlyg:ExpectedCreditLossesInRespectOfDrawnExposuresMember2023-12-310001160106lyg:RetailLoansAndOverdraftsMemberlyg:GrossDrawnExposuresMemberlyg:RMS1113Memberlyg:Stage1Member2023-12-310001160106lyg:RetailLoansAndOverdraftsMemberlyg:GrossDrawnExposuresMemberlyg:RMS1113Memberlyg:Stage2Member2023-12-310001160106lyg:RetailLoansAndOverdraftsMemberlyg:GrossDrawnExposuresMemberlyg:RMS1113Memberlyg:Stage3Member2023-12-310001160106lyg:RetailLoansAndOverdraftsMemberlyg:PurchasedOrOriginatedCreditimpairedMemberlyg:GrossDrawnExposuresMemberlyg:RMS1113Member2023-12-310001160106lyg:RetailLoansAndOverdraftsMemberlyg:GrossDrawnExposuresMemberlyg:RMS1113Member2023-12-310001160106lyg:RetailLoansAndOverdraftsMemberlyg:RMS1113Memberlyg:Stage1Memberlyg:ExpectedCreditLossesInRespectOfDrawnExposuresMember2023-12-310001160106lyg:RetailLoansAndOverdraftsMemberlyg:RMS1113Memberlyg:Stage2Memberlyg:ExpectedCreditLossesInRespectOfDrawnExposuresMember2023-12-310001160106lyg:RetailLoansAndOverdraftsMemberlyg:RMS1113Memberlyg:Stage3Memberlyg:ExpectedCreditLossesInRespectOfDrawnExposuresMember2023-12-310001160106lyg:RetailLoansAndOverdraftsMemberlyg:PurchasedOrOriginatedCreditimpairedMemberlyg:RMS1113Memberlyg:ExpectedCreditLossesInRespectOfDrawnExposuresMember2023-12-310001160106lyg:RetailLoansAndOverdraftsMemberlyg:RMS1113Memberlyg:ExpectedCreditLossesInRespectOfDrawnExposuresMember2023-12-310001160106lyg:RetailLoansAndOverdraftsMemberlyg:GrossDrawnExposuresMemberlyg:Stage1Memberlyg:RMS14Member2023-12-310001160106lyg:RetailLoansAndOverdraftsMemberlyg:GrossDrawnExposuresMemberlyg:RMS14Memberlyg:Stage2Member2023-12-310001160106lyg:RetailLoansAndOverdraftsMemberlyg:GrossDrawnExposuresMemberlyg:Stage3Memberlyg:RMS14Member2023-12-310001160106lyg:RetailLoansAndOverdraftsMemberlyg:PurchasedOrOriginatedCreditimpairedMemberlyg:GrossDrawnExposuresMemberlyg:RMS14Member2023-12-310001160106lyg:RetailLoansAndOverdraftsMemberlyg:GrossDrawnExposuresMemberlyg:RMS14Member2023-12-310001160106lyg:RetailLoansAndOverdraftsMemberlyg:Stage1Memberlyg:RMS14Memberlyg:ExpectedCreditLossesInRespectOfDrawnExposuresMember2023-12-310001160106lyg:RetailLoansAndOverdraftsMemberlyg:RMS14Memberlyg:Stage2Memberlyg:ExpectedCreditLossesInRespectOfDrawnExposuresMember2023-12-310001160106lyg:RetailLoansAndOverdraftsMemberlyg:Stage3Memberlyg:RMS14Memberlyg:ExpectedCreditLossesInRespectOfDrawnExposuresMember2023-12-310001160106lyg:RetailLoansAndOverdraftsMemberlyg:PurchasedOrOriginatedCreditimpairedMemberlyg:RMS14Memberlyg:ExpectedCreditLossesInRespectOfDrawnExposuresMember2023-12-310001160106lyg:RetailLoansAndOverdraftsMemberlyg:RMS14Memberlyg:ExpectedCreditLossesInRespectOfDrawnExposuresMember2023-12-310001160106lyg:RetailLoansAndOverdraftsMemberlyg:GrossDrawnExposuresMemberlyg:Stage1Member2023-12-310001160106lyg:RetailLoansAndOverdraftsMemberlyg:GrossDrawnExposuresMemberlyg:Stage2Member2023-12-310001160106lyg:RetailLoansAndOverdraftsMemberlyg:GrossDrawnExposuresMemberlyg:Stage3Member2023-12-310001160106lyg:RetailLoansAndOverdraftsMemberlyg:PurchasedOrOriginatedCreditimpairedMemberlyg:GrossDrawnExposuresMember2023-12-310001160106lyg:RetailLoansAndOverdraftsMemberlyg:GrossDrawnExposuresMember2023-12-310001160106lyg:RetailLoansAndOverdraftsMemberlyg:Stage1Memberlyg:ExpectedCreditLossesInRespectOfDrawnExposuresMember2023-12-310001160106lyg:RetailLoansAndOverdraftsMemberlyg:Stage2Memberlyg:ExpectedCreditLossesInRespectOfDrawnExposuresMember2023-12-310001160106lyg:RetailLoansAndOverdraftsMemberlyg:Stage3Memberlyg:ExpectedCreditLossesInRespectOfDrawnExposuresMember2023-12-310001160106lyg:RetailLoansAndOverdraftsMemberlyg:PurchasedOrOriginatedCreditimpairedMemberlyg:ExpectedCreditLossesInRespectOfDrawnExposuresMember2023-12-310001160106lyg:RetailLoansAndOverdraftsMemberlyg:ExpectedCreditLossesInRespectOfDrawnExposuresMember2023-12-310001160106lyg:RMS13Memberlyg:GrossDrawnExposuresMemberlyg:RetailUKMotorFinanceMemberlyg:Stage1Member2023-12-310001160106lyg:RMS13Memberlyg:GrossDrawnExposuresMemberlyg:RetailUKMotorFinanceMemberlyg:Stage2Member2023-12-310001160106lyg:RMS13Memberlyg:GrossDrawnExposuresMemberlyg:RetailUKMotorFinanceMemberlyg:Stage3Member2023-12-310001160106lyg:RMS13Memberlyg:PurchasedOrOriginatedCreditimpairedMemberlyg:GrossDrawnExposuresMemberlyg:RetailUKMotorFinanceMember2023-12-310001160106lyg:RMS13Memberlyg:GrossDrawnExposuresMemberlyg:RetailUKMotorFinanceMember2023-12-310001160106lyg:RMS13Memberlyg:RetailUKMotorFinanceMemberlyg:Stage1Memberlyg:ExpectedCreditLossesInRespectOfDrawnExposuresMember2023-12-310001160106lyg:RMS13Memberlyg:RetailUKMotorFinanceMemberlyg:Stage2Memberlyg:ExpectedCreditLossesInRespectOfDrawnExposuresMember2023-12-310001160106lyg:RMS13Memberlyg:RetailUKMotorFinanceMemberlyg:Stage3Memberlyg:ExpectedCreditLossesInRespectOfDrawnExposuresMember2023-12-310001160106lyg:RMS13Memberlyg:PurchasedOrOriginatedCreditimpairedMemberlyg:RetailUKMotorFinanceMemberlyg:ExpectedCreditLossesInRespectOfDrawnExposuresMember2023-12-310001160106lyg:RMS13Memberlyg:RetailUKMotorFinanceMemberlyg:ExpectedCreditLossesInRespectOfDrawnExposuresMember2023-12-310001160106lyg:RMS46Memberlyg:GrossDrawnExposuresMemberlyg:RetailUKMotorFinanceMemberlyg:Stage1Member2023-12-310001160106lyg:RMS46Memberlyg:GrossDrawnExposuresMemberlyg:RetailUKMotorFinanceMemberlyg:Stage2Member2023-12-310001160106lyg:RMS46Memberlyg:GrossDrawnExposuresMemberlyg:RetailUKMotorFinanceMemberlyg:Stage3Member2023-12-310001160106lyg:RMS46Memberlyg:PurchasedOrOriginatedCreditimpairedMemberlyg:GrossDrawnExposuresMemberlyg:RetailUKMotorFinanceMember2023-12-310001160106lyg:RMS46Memberlyg:GrossDrawnExposuresMemberlyg:RetailUKMotorFinanceMember2023-12-310001160106lyg:RMS46Memberlyg:RetailUKMotorFinanceMemberlyg:Stage1Memberlyg:ExpectedCreditLossesInRespectOfDrawnExposuresMember2023-12-310001160106lyg:RMS46Memberlyg:RetailUKMotorFinanceMemberlyg:Stage2Memberlyg:ExpectedCreditLossesInRespectOfDrawnExposuresMember2023-12-310001160106lyg:RMS46Memberlyg:RetailUKMotorFinanceMemberlyg:Stage3Memberlyg:ExpectedCreditLossesInRespectOfDrawnExposuresMember2023-12-310001160106lyg:RMS46Memberlyg:PurchasedOrOriginatedCreditimpairedMemberlyg:RetailUKMotorFinanceMemberlyg:ExpectedCreditLossesInRespectOfDrawnExposuresMember2023-12-310001160106lyg:RMS46Memberlyg:RetailUKMotorFinanceMemberlyg:ExpectedCreditLossesInRespectOfDrawnExposuresMember2023-12-310001160106lyg:GrossDrawnExposuresMemberlyg:RetailUKMotorFinanceMemberlyg:Stage1Memberlyg:RMS79Member2023-12-310001160106lyg:GrossDrawnExposuresMemberlyg:RetailUKMotorFinanceMemberlyg:RMS79Memberlyg:Stage2Member2023-12-310001160106lyg:GrossDrawnExposuresMemberlyg:RetailUKMotorFinanceMemberlyg:Stage3Memberlyg:RMS79Member2023-12-310001160106lyg:PurchasedOrOriginatedCreditimpairedMemberlyg:GrossDrawnExposuresMemberlyg:RetailUKMotorFinanceMemberlyg:RMS79Member2023-12-310001160106lyg:GrossDrawnExposuresMemberlyg:RetailUKMotorFinanceMemberlyg:RMS79Member2023-12-310001160106lyg:RetailUKMotorFinanceMemberlyg:Stage1Memberlyg:RMS79Memberlyg:ExpectedCreditLossesInRespectOfDrawnExposuresMember2023-12-310001160106lyg:RetailUKMotorFinanceMemberlyg:RMS79Memberlyg:Stage2Memberlyg:ExpectedCreditLossesInRespectOfDrawnExposuresMember2023-12-310001160106lyg:RetailUKMotorFinanceMemberlyg:Stage3Memberlyg:RMS79Memberlyg:ExpectedCreditLossesInRespectOfDrawnExposuresMember2023-12-310001160106lyg:PurchasedOrOriginatedCreditimpairedMemberlyg:RetailUKMotorFinanceMemberlyg:RMS79Memberlyg:ExpectedCreditLossesInRespectOfDrawnExposuresMember2023-12-310001160106lyg:RetailUKMotorFinanceMemberlyg:RMS79Memberlyg:ExpectedCreditLossesInRespectOfDrawnExposuresMember2023-12-310001160106lyg:GrossDrawnExposuresMemberlyg:RetailUKMotorFinanceMemberlyg:Stage1Memberlyg:RMS10Member2023-12-310001160106lyg:GrossDrawnExposuresMemberlyg:RetailUKMotorFinanceMemberlyg:RMS10Memberlyg:Stage2Member2023-12-310001160106lyg:GrossDrawnExposuresMemberlyg:RetailUKMotorFinanceMemberlyg:Stage3Memberlyg:RMS10Member2023-12-310001160106lyg:PurchasedOrOriginatedCreditimpairedMemberlyg:GrossDrawnExposuresMemberlyg:RetailUKMotorFinanceMemberlyg:RMS10Member2023-12-310001160106lyg:GrossDrawnExposuresMemberlyg:RetailUKMotorFinanceMemberlyg:RMS10Member2023-12-310001160106lyg:RetailUKMotorFinanceMemberlyg:Stage1Memberlyg:RMS10Memberlyg:ExpectedCreditLossesInRespectOfDrawnExposuresMember2023-12-310001160106lyg:RetailUKMotorFinanceMemberlyg:RMS10Memberlyg:Stage2Memberlyg:ExpectedCreditLossesInRespectOfDrawnExposuresMember2023-12-310001160106lyg:RetailUKMotorFinanceMemberlyg:Stage3Memberlyg:RMS10Memberlyg:ExpectedCreditLossesInRespectOfDrawnExposuresMember2023-12-310001160106lyg:PurchasedOrOriginatedCreditimpairedMemberlyg:RetailUKMotorFinanceMemberlyg:RMS10Memberlyg:ExpectedCreditLossesInRespectOfDrawnExposuresMember2023-12-310001160106lyg:RetailUKMotorFinanceMemberlyg:RMS10Memberlyg:ExpectedCreditLossesInRespectOfDrawnExposuresMember2023-12-310001160106lyg:GrossDrawnExposuresMemberlyg:RetailUKMotorFinanceMemberlyg:RMS1113Memberlyg:Stage1Member2023-12-310001160106lyg:GrossDrawnExposuresMemberlyg:RetailUKMotorFinanceMemberlyg:RMS1113Memberlyg:Stage2Member2023-12-310001160106lyg:GrossDrawnExposuresMemberlyg:RetailUKMotorFinanceMemberlyg:RMS1113Memberlyg:Stage3Member2023-12-310001160106lyg:PurchasedOrOriginatedCreditimpairedMemberlyg:GrossDrawnExposuresMemberlyg:RetailUKMotorFinanceMemberlyg:RMS1113Member2023-12-310001160106lyg:GrossDrawnExposuresMemberlyg:RetailUKMotorFinanceMemberlyg:RMS1113Member2023-12-310001160106lyg:RetailUKMotorFinanceMemberlyg:RMS1113Memberlyg:Stage1Memberlyg:ExpectedCreditLossesInRespectOfDrawnExposuresMember2023-12-310001160106lyg:RetailUKMotorFinanceMemberlyg:RMS1113Memberlyg:Stage2Memberlyg:ExpectedCreditLossesInRespectOfDrawnExposuresMember2023-12-310001160106lyg:RetailUKMotorFinanceMemberlyg:RMS1113Memberlyg:Stage3Memberlyg:ExpectedCreditLossesInRespectOfDrawnExposuresMember2023-12-310001160106lyg:PurchasedOrOriginatedCreditimpairedMemberlyg:RetailUKMotorFinanceMemberlyg:RMS1113Memberlyg:ExpectedCreditLossesInRespectOfDrawnExposuresMember2023-12-310001160106lyg:RetailUKMotorFinanceMemberlyg:RMS1113Memberlyg:ExpectedCreditLossesInRespectOfDrawnExposuresMember2023-12-310001160106lyg:GrossDrawnExposuresMemberlyg:RetailUKMotorFinanceMemberlyg:Stage1Memberlyg:RMS14Member2023-12-310001160106lyg:GrossDrawnExposuresMemberlyg:RetailUKMotorFinanceMemberlyg:RMS14Memberlyg:Stage2Member2023-12-310001160106lyg:GrossDrawnExposuresMemberlyg:RetailUKMotorFinanceMemberlyg:Stage3Memberlyg:RMS14Member2023-12-310001160106lyg:PurchasedOrOriginatedCreditimpairedMemberlyg:GrossDrawnExposuresMemberlyg:RetailUKMotorFinanceMemberlyg:RMS14Member2023-12-310001160106lyg:GrossDrawnExposuresMemberlyg:RetailUKMotorFinanceMemberlyg:RMS14Member2023-12-310001160106lyg:RetailUKMotorFinanceMemberlyg:Stage1Memberlyg:RMS14Memberlyg:ExpectedCreditLossesInRespectOfDrawnExposuresMember2023-12-310001160106lyg:RetailUKMotorFinanceMemberlyg:RMS14Memberlyg:Stage2Memberlyg:ExpectedCreditLossesInRespectOfDrawnExposuresMember2023-12-310001160106lyg:RetailUKMotorFinanceMemberlyg:Stage3Memberlyg:RMS14Memberlyg:ExpectedCreditLossesInRespectOfDrawnExposuresMember2023-12-310001160106lyg:PurchasedOrOriginatedCreditimpairedMemberlyg:RetailUKMotorFinanceMemberlyg:RMS14Memberlyg:ExpectedCreditLossesInRespectOfDrawnExposuresMember2023-12-310001160106lyg:RetailUKMotorFinanceMemberlyg:RMS14Memberlyg:ExpectedCreditLossesInRespectOfDrawnExposuresMember2023-12-310001160106lyg:GrossDrawnExposuresMemberlyg:RetailUKMotorFinanceMemberlyg:Stage1Member2023-12-310001160106lyg:GrossDrawnExposuresMemberlyg:RetailUKMotorFinanceMemberlyg:Stage2Member2023-12-310001160106lyg:GrossDrawnExposuresMemberlyg:RetailUKMotorFinanceMemberlyg:Stage3Member2023-12-310001160106lyg:PurchasedOrOriginatedCreditimpairedMemberlyg:GrossDrawnExposuresMemberlyg:RetailUKMotorFinanceMember2023-12-310001160106lyg:GrossDrawnExposuresMemberlyg:RetailUKMotorFinanceMember2023-12-310001160106lyg:RetailUKMotorFinanceMemberlyg:Stage1Memberlyg:ExpectedCreditLossesInRespectOfDrawnExposuresMember2023-12-310001160106lyg:RetailUKMotorFinanceMemberlyg:Stage2Memberlyg:ExpectedCreditLossesInRespectOfDrawnExposuresMember2023-12-310001160106lyg:RetailUKMotorFinanceMemberlyg:Stage3Memberlyg:ExpectedCreditLossesInRespectOfDrawnExposuresMember2023-12-310001160106lyg:PurchasedOrOriginatedCreditimpairedMemberlyg:RetailUKMotorFinanceMemberlyg:ExpectedCreditLossesInRespectOfDrawnExposuresMember2023-12-310001160106lyg:RetailUKMotorFinanceMemberlyg:ExpectedCreditLossesInRespectOfDrawnExposuresMember2023-12-310001160106lyg:RMS13Memberlyg:RetailOtherMemberlyg:GrossDrawnExposuresMemberlyg:Stage1Member2023-12-310001160106lyg:RMS13Memberlyg:RetailOtherMemberlyg:GrossDrawnExposuresMemberlyg:Stage2Member2023-12-310001160106lyg:RMS13Memberlyg:RetailOtherMemberlyg:GrossDrawnExposuresMemberlyg:Stage3Member2023-12-310001160106lyg:RMS13Memberlyg:PurchasedOrOriginatedCreditimpairedMemberlyg:RetailOtherMemberlyg:GrossDrawnExposuresMember2023-12-310001160106lyg:RMS13Memberlyg:RetailOtherMemberlyg:GrossDrawnExposuresMember2023-12-310001160106lyg:RMS13Memberlyg:RetailOtherMemberlyg:Stage1Memberlyg:ExpectedCreditLossesInRespectOfDrawnExposuresMember2023-12-310001160106lyg:RMS13Memberlyg:RetailOtherMemberlyg:Stage2Memberlyg:ExpectedCreditLossesInRespectOfDrawnExposuresMember2023-12-310001160106lyg:RMS13Memberlyg:RetailOtherMemberlyg:Stage3Memberlyg:ExpectedCreditLossesInRespectOfDrawnExposuresMember2023-12-310001160106lyg:RMS13Memberlyg:PurchasedOrOriginatedCreditimpairedMemberlyg:RetailOtherMemberlyg:ExpectedCreditLossesInRespectOfDrawnExposuresMember2023-12-310001160106lyg:RMS13Memberlyg:RetailOtherMemberlyg:ExpectedCreditLossesInRespectOfDrawnExposuresMember2023-12-310001160106lyg:RMS46Memberlyg:RetailOtherMemberlyg:GrossDrawnExposuresMemberlyg:Stage1Member2023-12-310001160106lyg:RMS46Memberlyg:RetailOtherMemberlyg:GrossDrawnExposuresMemberlyg:Stage2Member2023-12-310001160106lyg:RMS46Memberlyg:RetailOtherMemberlyg:GrossDrawnExposuresMemberlyg:Stage3Member2023-12-310001160106lyg:RMS46Memberlyg:PurchasedOrOriginatedCreditimpairedMemberlyg:RetailOtherMemberlyg:GrossDrawnExposuresMember2023-12-310001160106lyg:RMS46Memberlyg:RetailOtherMemberlyg:GrossDrawnExposuresMember2023-12-310001160106lyg:RMS46Memberlyg:RetailOtherMemberlyg:Stage1Memberlyg:ExpectedCreditLossesInRespectOfDrawnExposuresMember2023-12-310001160106lyg:RMS46Memberlyg:RetailOtherMemberlyg:Stage2Memberlyg:ExpectedCreditLossesInRespectOfDrawnExposuresMember2023-12-310001160106lyg:RMS46Memberlyg:RetailOtherMemberlyg:Stage3Memberlyg:ExpectedCreditLossesInRespectOfDrawnExposuresMember2023-12-310001160106lyg:RMS46Memberlyg:PurchasedOrOriginatedCreditimpairedMemberlyg:RetailOtherMemberlyg:ExpectedCreditLossesInRespectOfDrawnExposuresMember2023-12-310001160106lyg:RMS46Memberlyg:RetailOtherMemberlyg:ExpectedCreditLossesInRespectOfDrawnExposuresMember2023-12-310001160106lyg:RetailOtherMemberlyg:GrossDrawnExposuresMemberlyg:Stage1Memberlyg:RMS79Member2023-12-310001160106lyg:RetailOtherMemberlyg:GrossDrawnExposuresMemberlyg:RMS79Memberlyg:Stage2Member2023-12-310001160106lyg:RetailOtherMemberlyg:GrossDrawnExposuresMemberlyg:Stage3Memberlyg:RMS79Member2023-12-310001160106lyg:PurchasedOrOriginatedCreditimpairedMemberlyg:RetailOtherMemberlyg:GrossDrawnExposuresMemberlyg:RMS79Member2023-12-310001160106lyg:RetailOtherMemberlyg:GrossDrawnExposuresMemberlyg:RMS79Member2023-12-310001160106lyg:RetailOtherMemberlyg:Stage1Memberlyg:RMS79Memberlyg:ExpectedCreditLossesInRespectOfDrawnExposuresMember2023-12-310001160106lyg:RetailOtherMemberlyg:RMS79Memberlyg:Stage2Memberlyg:ExpectedCreditLossesInRespectOfDrawnExposuresMember2023-12-310001160106lyg:RetailOtherMemberlyg:Stage3Memberlyg:RMS79Memberlyg:ExpectedCreditLossesInRespectOfDrawnExposuresMember2023-12-310001160106lyg:PurchasedOrOriginatedCreditimpairedMemberlyg:RetailOtherMemberlyg:RMS79Memberlyg:ExpectedCreditLossesInRespectOfDrawnExposuresMember2023-12-310001160106lyg:RetailOtherMemberlyg:RMS79Memberlyg:ExpectedCreditLossesInRespectOfDrawnExposuresMember2023-12-310001160106lyg:RetailOtherMemberlyg:GrossDrawnExposuresMemberlyg:Stage1Memberlyg:RMS10Member2023-12-310001160106lyg:RetailOtherMemberlyg:GrossDrawnExposuresMemberlyg:RMS10Memberlyg:Stage2Member2023-12-310001160106lyg:RetailOtherMemberlyg:GrossDrawnExposuresMemberlyg:Stage3Memberlyg:RMS10Member2023-12-310001160106lyg:PurchasedOrOriginatedCreditimpairedMemberlyg:RetailOtherMemberlyg:GrossDrawnExposuresMemberlyg:RMS10Member2023-12-310001160106lyg:RetailOtherMemberlyg:GrossDrawnExposuresMemberlyg:RMS10Member2023-12-310001160106lyg:RetailOtherMemberlyg:Stage1Memberlyg:RMS10Memberlyg:ExpectedCreditLossesInRespectOfDrawnExposuresMember2023-12-310001160106lyg:RetailOtherMemberlyg:RMS10Memberlyg:Stage2Memberlyg:ExpectedCreditLossesInRespectOfDrawnExposuresMember2023-12-310001160106lyg:RetailOtherMemberlyg:Stage3Memberlyg:RMS10Memberlyg:ExpectedCreditLossesInRespectOfDrawnExposuresMember2023-12-310001160106lyg:PurchasedOrOriginatedCreditimpairedMemberlyg:RetailOtherMemberlyg:RMS10Memberlyg:ExpectedCreditLossesInRespectOfDrawnExposuresMember2023-12-310001160106lyg:RetailOtherMemberlyg:RMS10Memberlyg:ExpectedCreditLossesInRespectOfDrawnExposuresMember2023-12-310001160106lyg:RetailOtherMemberlyg:GrossDrawnExposuresMemberlyg:RMS1113Memberlyg:Stage1Member2023-12-310001160106lyg:RetailOtherMemberlyg:GrossDrawnExposuresMemberlyg:RMS1113Memberlyg:Stage2Member2023-12-310001160106lyg:RetailOtherMemberlyg:GrossDrawnExposuresMemberlyg:RMS1113Memberlyg:Stage3Member2023-12-310001160106lyg:PurchasedOrOriginatedCreditimpairedMemberlyg:RetailOtherMemberlyg:GrossDrawnExposuresMemberlyg:RMS1113Member2023-12-310001160106lyg:RetailOtherMemberlyg:GrossDrawnExposuresMemberlyg:RMS1113Member2023-12-310001160106lyg:RetailOtherMemberlyg:RMS1113Memberlyg:Stage1Memberlyg:ExpectedCreditLossesInRespectOfDrawnExposuresMember2023-12-310001160106lyg:RetailOtherMemberlyg:RMS1113Memberlyg:Stage2Memberlyg:ExpectedCreditLossesInRespectOfDrawnExposuresMember2023-12-310001160106lyg:RetailOtherMemberlyg:RMS1113Memberlyg:Stage3Memberlyg:ExpectedCreditLossesInRespectOfDrawnExposuresMember2023-12-310001160106lyg:PurchasedOrOriginatedCreditimpairedMemberlyg:RetailOtherMemberlyg:RMS1113Memberlyg:ExpectedCreditLossesInRespectOfDrawnExposuresMember2023-12-310001160106lyg:RetailOtherMemberlyg:RMS1113Memberlyg:ExpectedCreditLossesInRespectOfDrawnExposuresMember2023-12-310001160106lyg:RetailOtherMemberlyg:GrossDrawnExposuresMemberlyg:Stage1Memberlyg:RMS14Member2023-12-310001160106lyg:RetailOtherMemberlyg:GrossDrawnExposuresMemberlyg:RMS14Memberlyg:Stage2Member2023-12-310001160106lyg:RetailOtherMemberlyg:GrossDrawnExposuresMemberlyg:Stage3Memberlyg:RMS14Member2023-12-310001160106lyg:PurchasedOrOriginatedCreditimpairedMemberlyg:RetailOtherMemberlyg:GrossDrawnExposuresMemberlyg:RMS14Member2023-12-310001160106lyg:RetailOtherMemberlyg:GrossDrawnExposuresMemberlyg:RMS14Member2023-12-310001160106lyg:RetailOtherMemberlyg:Stage1Memberlyg:RMS14Memberlyg:ExpectedCreditLossesInRespectOfDrawnExposuresMember2023-12-310001160106lyg:RetailOtherMemberlyg:RMS14Memberlyg:Stage2Memberlyg:ExpectedCreditLossesInRespectOfDrawnExposuresMember2023-12-310001160106lyg:RetailOtherMemberlyg:Stage3Memberlyg:RMS14Memberlyg:ExpectedCreditLossesInRespectOfDrawnExposuresMember2023-12-310001160106lyg:PurchasedOrOriginatedCreditimpairedMemberlyg:RetailOtherMemberlyg:RMS14Memberlyg:ExpectedCreditLossesInRespectOfDrawnExposuresMember2023-12-310001160106lyg:RetailOtherMemberlyg:RMS14Memberlyg:ExpectedCreditLossesInRespectOfDrawnExposuresMember2023-12-310001160106lyg:RetailOtherMemberlyg:GrossDrawnExposuresMemberlyg:Stage1Member2023-12-310001160106lyg:RetailOtherMemberlyg:GrossDrawnExposuresMemberlyg:Stage2Member2023-12-310001160106lyg:RetailOtherMemberlyg:GrossDrawnExposuresMemberlyg:Stage3Member2023-12-310001160106lyg:PurchasedOrOriginatedCreditimpairedMemberlyg:RetailOtherMemberlyg:GrossDrawnExposuresMember2023-12-310001160106lyg:RetailOtherMemberlyg:GrossDrawnExposuresMember2023-12-310001160106lyg:RetailOtherMemberlyg:Stage1Memberlyg:ExpectedCreditLossesInRespectOfDrawnExposuresMember2023-12-310001160106lyg:RetailOtherMemberlyg:Stage2Memberlyg:ExpectedCreditLossesInRespectOfDrawnExposuresMember2023-12-310001160106lyg:RetailOtherMemberlyg:Stage3Memberlyg:ExpectedCreditLossesInRespectOfDrawnExposuresMember2023-12-310001160106lyg:PurchasedOrOriginatedCreditimpairedMemberlyg:RetailOtherMemberlyg:ExpectedCreditLossesInRespectOfDrawnExposuresMember2023-12-310001160106lyg:RetailOtherMemberlyg:ExpectedCreditLossesInRespectOfDrawnExposuresMember2023-12-310001160106lyg:GrossDrawnExposuresMemberlyg:Stage1Memberlyg:Retail1Member2023-12-310001160106lyg:GrossDrawnExposuresMemberlyg:Stage2Memberlyg:Retail1Member2023-12-310001160106lyg:GrossDrawnExposuresMemberlyg:Stage3Memberlyg:Retail1Member2023-12-310001160106lyg:PurchasedOrOriginatedCreditimpairedMemberlyg:GrossDrawnExposuresMemberlyg:Retail1Member2023-12-310001160106lyg:GrossDrawnExposuresMemberlyg:Retail1Member2023-12-310001160106lyg:Stage1Memberlyg:ExpectedCreditLossesInRespectOfDrawnExposuresMemberlyg:Retail1Member2023-12-310001160106lyg:Stage2Memberlyg:ExpectedCreditLossesInRespectOfDrawnExposuresMemberlyg:Retail1Member2023-12-310001160106lyg:Stage3Memberlyg:ExpectedCreditLossesInRespectOfDrawnExposuresMemberlyg:Retail1Member2023-12-310001160106lyg:PurchasedOrOriginatedCreditimpairedMemberlyg:ExpectedCreditLossesInRespectOfDrawnExposuresMemberlyg:Retail1Member2023-12-310001160106lyg:ExpectedCreditLossesInRespectOfDrawnExposuresMemberlyg:Retail1Member2023-12-310001160106lyg:GrossDrawnExposuresMemberlyg:CMS15Memberlyg:Stage1Memberlyg:CommercialMember2023-12-310001160106lyg:GrossDrawnExposuresMemberlyg:CMS15Memberlyg:CommercialMemberlyg:Stage2Member2023-12-310001160106lyg:GrossDrawnExposuresMemberlyg:Stage3Memberlyg:CMS15Memberlyg:CommercialMember2023-12-310001160106lyg:PurchasedOrOriginatedCreditimpairedMemberlyg:GrossDrawnExposuresMemberlyg:CMS15Memberlyg:CommercialMember2023-12-310001160106lyg:GrossDrawnExposuresMemberlyg:CMS15Memberlyg:CommercialMember2023-12-310001160106lyg:CMS15Memberlyg:Stage1Memberlyg:CommercialMemberlyg:ExpectedCreditLossesInRespectOfDrawnExposuresMember2023-12-310001160106lyg:CMS15Memberlyg:CommercialMemberlyg:Stage2Memberlyg:ExpectedCreditLossesInRespectOfDrawnExposuresMember2023-12-310001160106lyg:Stage3Memberlyg:CMS15Memberlyg:CommercialMemberlyg:ExpectedCreditLossesInRespectOfDrawnExposuresMember2023-12-310001160106lyg:PurchasedOrOriginatedCreditimpairedMemberlyg:CMS15Memberlyg:CommercialMemberlyg:ExpectedCreditLossesInRespectOfDrawnExposuresMember2023-12-310001160106lyg:CMS15Memberlyg:CommercialMemberlyg:ExpectedCreditLossesInRespectOfDrawnExposuresMember2023-12-310001160106lyg:GrossDrawnExposuresMemberlyg:CMS610Memberlyg:Stage1Memberlyg:CommercialMember2023-12-310001160106lyg:GrossDrawnExposuresMemberlyg:CMS610Memberlyg:CommercialMemberlyg:Stage2Member2023-12-310001160106lyg:GrossDrawnExposuresMemberlyg:Stage3Memberlyg:CMS610Memberlyg:CommercialMember2023-12-310001160106lyg:PurchasedOrOriginatedCreditimpairedMemberlyg:GrossDrawnExposuresMemberlyg:CMS610Memberlyg:CommercialMember2023-12-310001160106lyg:GrossDrawnExposuresMemberlyg:CMS610Memberlyg:CommercialMember2023-12-310001160106lyg:CMS610Memberlyg:Stage1Memberlyg:CommercialMemberlyg:ExpectedCreditLossesInRespectOfDrawnExposuresMember2023-12-310001160106lyg:CMS610Memberlyg:CommercialMemberlyg:Stage2Memberlyg:ExpectedCreditLossesInRespectOfDrawnExposuresMember2023-12-310001160106lyg:Stage3Memberlyg:CMS610Memberlyg:CommercialMemberlyg:ExpectedCreditLossesInRespectOfDrawnExposuresMember2023-12-310001160106lyg:PurchasedOrOriginatedCreditimpairedMemberlyg:CMS610Memberlyg:CommercialMemberlyg:ExpectedCreditLossesInRespectOfDrawnExposuresMember2023-12-310001160106lyg:CMS610Memberlyg:CommercialMemberlyg:ExpectedCreditLossesInRespectOfDrawnExposuresMember2023-12-310001160106lyg:GrossDrawnExposuresMemberlyg:Stage1Memberlyg:CMS1114Memberlyg:CommercialMember2023-12-310001160106lyg:GrossDrawnExposuresMemberlyg:CMS1114Memberlyg:CommercialMemberlyg:Stage2Member2023-12-310001160106lyg:GrossDrawnExposuresMemberlyg:Stage3Memberlyg:CMS1114Memberlyg:CommercialMember2023-12-310001160106lyg:PurchasedOrOriginatedCreditimpairedMemberlyg:GrossDrawnExposuresMemberlyg:CMS1114Memberlyg:CommercialMember2023-12-310001160106lyg:GrossDrawnExposuresMemberlyg:CMS1114Memberlyg:CommercialMember2023-12-310001160106lyg:Stage1Memberlyg:CMS1114Memberlyg:CommercialMemberlyg:ExpectedCreditLossesInRespectOfDrawnExposuresMember2023-12-310001160106lyg:CMS1114Memberlyg:CommercialMemberlyg:Stage2Memberlyg:ExpectedCreditLossesInRespectOfDrawnExposuresMember2023-12-310001160106lyg:Stage3Memberlyg:CMS1114Memberlyg:CommercialMemberlyg:ExpectedCreditLossesInRespectOfDrawnExposuresMember2023-12-310001160106lyg:PurchasedOrOriginatedCreditimpairedMemberlyg:CMS1114Memberlyg:CommercialMemberlyg:ExpectedCreditLossesInRespectOfDrawnExposuresMember2023-12-310001160106lyg:CMS1114Memberlyg:CommercialMemberlyg:ExpectedCreditLossesInRespectOfDrawnExposuresMember2023-12-310001160106lyg:CMS1518Memberlyg:GrossDrawnExposuresMemberlyg:Stage1Memberlyg:CommercialMember2023-12-310001160106lyg:CMS1518Memberlyg:GrossDrawnExposuresMemberlyg:CommercialMemberlyg:Stage2Member2023-12-310001160106lyg:CMS1518Memberlyg:GrossDrawnExposuresMemberlyg:Stage3Memberlyg:CommercialMember2023-12-310001160106lyg:CMS1518Memberlyg:PurchasedOrOriginatedCreditimpairedMemberlyg:GrossDrawnExposuresMemberlyg:CommercialMember2023-12-310001160106lyg:CMS1518Memberlyg:GrossDrawnExposuresMemberlyg:CommercialMember2023-12-310001160106lyg:CMS1518Memberlyg:Stage1Memberlyg:CommercialMemberlyg:ExpectedCreditLossesInRespectOfDrawnExposuresMember2023-12-310001160106lyg:CMS1518Memberlyg:CommercialMemberlyg:Stage2Memberlyg:ExpectedCreditLossesInRespectOfDrawnExposuresMember2023-12-310001160106lyg:CMS1518Memberlyg:Stage3Memberlyg:CommercialMemberlyg:ExpectedCreditLossesInRespectOfDrawnExposuresMember2023-12-310001160106lyg:CMS1518Memberlyg:PurchasedOrOriginatedCreditimpairedMemberlyg:CommercialMemberlyg:ExpectedCreditLossesInRespectOfDrawnExposuresMember2023-12-310001160106lyg:CMS1518Memberlyg:CommercialMemberlyg:ExpectedCreditLossesInRespectOfDrawnExposuresMember2023-12-310001160106lyg:GrossDrawnExposuresMemberlyg:CMS19Memberlyg:Stage1Memberlyg:CommercialMember2023-12-310001160106lyg:GrossDrawnExposuresMemberlyg:CMS19Memberlyg:CommercialMemberlyg:Stage2Member2023-12-310001160106lyg:GrossDrawnExposuresMemberlyg:Stage3Memberlyg:CMS19Memberlyg:CommercialMember2023-12-310001160106lyg:PurchasedOrOriginatedCreditimpairedMemberlyg:GrossDrawnExposuresMemberlyg:CMS19Memberlyg:CommercialMember2023-12-310001160106lyg:GrossDrawnExposuresMemberlyg:CMS19Memberlyg:CommercialMember2023-12-310001160106lyg:CMS19Memberlyg:Stage1Memberlyg:CommercialMemberlyg:ExpectedCreditLossesInRespectOfDrawnExposuresMember2023-12-310001160106lyg:CMS19Memberlyg:CommercialMemberlyg:Stage2Memberlyg:ExpectedCreditLossesInRespectOfDrawnExposuresMember2023-12-310001160106lyg:Stage3Memberlyg:CMS19Memberlyg:CommercialMemberlyg:ExpectedCreditLossesInRespectOfDrawnExposuresMember2023-12-310001160106lyg:PurchasedOrOriginatedCreditimpairedMemberlyg:CMS19Memberlyg:CommercialMemberlyg:ExpectedCreditLossesInRespectOfDrawnExposuresMember2023-12-310001160106lyg:CMS19Memberlyg:CommercialMemberlyg:ExpectedCreditLossesInRespectOfDrawnExposuresMember2023-12-310001160106lyg:GrossDrawnExposuresMemberlyg:Stage1Memberlyg:CMS2023Memberlyg:CommercialMember2023-12-310001160106lyg:GrossDrawnExposuresMemberlyg:CMS2023Memberlyg:CommercialMemberlyg:Stage2Member2023-12-310001160106lyg:GrossDrawnExposuresMemberlyg:Stage3Memberlyg:CMS2023Memberlyg:CommercialMember2023-12-310001160106lyg:PurchasedOrOriginatedCreditimpairedMemberlyg:GrossDrawnExposuresMemberlyg:CMS2023Memberlyg:CommercialMember2023-12-310001160106lyg:GrossDrawnExposuresMemberlyg:CMS2023Memberlyg:CommercialMember2023-12-310001160106lyg:Stage1Memberlyg:CMS2023Memberlyg:CommercialMemberlyg:ExpectedCreditLossesInRespectOfDrawnExposuresMember2023-12-310001160106lyg:CMS2023Memberlyg:CommercialMemberlyg:Stage2Memberlyg:ExpectedCreditLossesInRespectOfDrawnExposuresMember2023-12-310001160106lyg:Stage3Memberlyg:CMS2023Memberlyg:CommercialMemberlyg:ExpectedCreditLossesInRespectOfDrawnExposuresMember2023-12-310001160106lyg:PurchasedOrOriginatedCreditimpairedMemberlyg:CMS2023Memberlyg:CommercialMemberlyg:ExpectedCreditLossesInRespectOfDrawnExposuresMember2023-12-310001160106lyg:CMS2023Memberlyg:CommercialMemberlyg:ExpectedCreditLossesInRespectOfDrawnExposuresMember2023-12-310001160106lyg:GrossDrawnExposuresMemberlyg:Stage1Memberlyg:CommercialMember2023-12-310001160106lyg:GrossDrawnExposuresMemberlyg:CommercialMemberlyg:Stage2Member2023-12-310001160106lyg:GrossDrawnExposuresMemberlyg:Stage3Memberlyg:CommercialMember2023-12-310001160106lyg:PurchasedOrOriginatedCreditimpairedMemberlyg:GrossDrawnExposuresMemberlyg:CommercialMember2023-12-310001160106lyg:GrossDrawnExposuresMemberlyg:CommercialMember2023-12-310001160106lyg:Stage1Memberlyg:CommercialMemberlyg:ExpectedCreditLossesInRespectOfDrawnExposuresMember2023-12-310001160106lyg:CommercialMemberlyg:Stage2Memberlyg:ExpectedCreditLossesInRespectOfDrawnExposuresMember2023-12-310001160106lyg:Stage3Memberlyg:CommercialMemberlyg:ExpectedCreditLossesInRespectOfDrawnExposuresMember2023-12-310001160106lyg:PurchasedOrOriginatedCreditimpairedMemberlyg:CommercialMemberlyg:ExpectedCreditLossesInRespectOfDrawnExposuresMember2023-12-310001160106lyg:CommercialMemberlyg:ExpectedCreditLossesInRespectOfDrawnExposuresMember2023-12-310001160106lyg:GrossDrawnExposuresMemberlyg:Stage1Memberlyg:OtherMember2023-12-310001160106lyg:GrossDrawnExposuresMemberlyg:OtherMemberlyg:Stage2Member2023-12-310001160106lyg:GrossDrawnExposuresMemberlyg:Stage3Memberlyg:OtherMember2023-12-310001160106lyg:PurchasedOrOriginatedCreditimpairedMemberlyg:GrossDrawnExposuresMemberlyg:OtherMember2023-12-310001160106lyg:GrossDrawnExposuresMemberlyg:OtherMember2023-12-310001160106lyg:Stage1Memberlyg:OtherMemberlyg:ExpectedCreditLossesInRespectOfDrawnExposuresMember2023-12-310001160106lyg:OtherMemberlyg:Stage2Memberlyg:ExpectedCreditLossesInRespectOfDrawnExposuresMember2023-12-310001160106lyg:Stage3Memberlyg:OtherMemberlyg:ExpectedCreditLossesInRespectOfDrawnExposuresMember2023-12-310001160106lyg:PurchasedOrOriginatedCreditimpairedMemberlyg:OtherMemberlyg:ExpectedCreditLossesInRespectOfDrawnExposuresMember2023-12-310001160106lyg:OtherMemberlyg:ExpectedCreditLossesInRespectOfDrawnExposuresMember2023-12-310001160106lyg:GrossDrawnExposuresMemberlyg:Stage1Member2023-12-310001160106lyg:GrossDrawnExposuresMemberlyg:Stage2Member2023-12-310001160106lyg:GrossDrawnExposuresMemberlyg:Stage3Member2023-12-310001160106lyg:PurchasedOrOriginatedCreditimpairedMemberlyg:GrossDrawnExposuresMember2023-12-310001160106lyg:GrossDrawnExposuresMember2023-12-310001160106lyg:Stage1Memberlyg:ExpectedCreditLossesInRespectOfDrawnExposuresMember2023-12-310001160106lyg:Stage2Memberlyg:ExpectedCreditLossesInRespectOfDrawnExposuresMember2023-12-310001160106lyg:Stage3Memberlyg:ExpectedCreditLossesInRespectOfDrawnExposuresMember2023-12-310001160106lyg:PurchasedOrOriginatedCreditimpairedMemberlyg:ExpectedCreditLossesInRespectOfDrawnExposuresMember2023-12-310001160106lyg:ExpectedCreditLossesInRespectOfDrawnExposuresMember2023-12-310001160106lyg:RMS13Memberlyg:RetailMortgagesMemberlyg:GrossDrawnExposuresMemberlyg:Stage1Member2022-12-310001160106lyg:RMS13Memberlyg:RetailMortgagesMemberlyg:GrossDrawnExposuresMemberlyg:Stage2Member2022-12-310001160106lyg:RMS13Memberlyg:RetailMortgagesMemberlyg:GrossDrawnExposuresMemberlyg:Stage3Member2022-12-310001160106lyg:RMS13Memberlyg:PurchasedOrOriginatedCreditimpairedMemberlyg:RetailMortgagesMemberlyg:GrossDrawnExposuresMember2022-12-310001160106lyg:RMS13Memberlyg:RetailMortgagesMemberlyg:GrossDrawnExposuresMember2022-12-310001160106lyg:RMS13Memberlyg:RetailMortgagesMemberlyg:Stage1Memberlyg:ExpectedCreditLossesInRespectOfDrawnExposuresMember2022-12-310001160106lyg:RMS13Memberlyg:RetailMortgagesMemberlyg:Stage2Memberlyg:ExpectedCreditLossesInRespectOfDrawnExposuresMember2022-12-310001160106lyg:RMS13Memberlyg:RetailMortgagesMemberlyg:Stage3Memberlyg:ExpectedCreditLossesInRespectOfDrawnExposuresMember2022-12-310001160106lyg:RMS13Memberlyg:PurchasedOrOriginatedCreditimpairedMemberlyg:RetailMortgagesMemberlyg:ExpectedCreditLossesInRespectOfDrawnExposuresMember2022-12-310001160106lyg:RMS13Memberlyg:RetailMortgagesMemberlyg:ExpectedCreditLossesInRespectOfDrawnExposuresMember2022-12-310001160106lyg:RMS46Memberlyg:RetailMortgagesMemberlyg:GrossDrawnExposuresMemberlyg:Stage1Member2022-12-310001160106lyg:RMS46Memberlyg:RetailMortgagesMemberlyg:GrossDrawnExposuresMemberlyg:Stage2Member2022-12-310001160106lyg:RMS46Memberlyg:RetailMortgagesMemberlyg:GrossDrawnExposuresMemberlyg:Stage3Member2022-12-310001160106lyg:RMS46Memberlyg:PurchasedOrOriginatedCreditimpairedMemberlyg:RetailMortgagesMemberlyg:GrossDrawnExposuresMember2022-12-310001160106lyg:RMS46Memberlyg:RetailMortgagesMemberlyg:GrossDrawnExposuresMember2022-12-310001160106lyg:RMS46Memberlyg:RetailMortgagesMemberlyg:Stage1Memberlyg:ExpectedCreditLossesInRespectOfDrawnExposuresMember2022-12-310001160106lyg:RMS46Memberlyg:RetailMortgagesMemberlyg:Stage2Memberlyg:ExpectedCreditLossesInRespectOfDrawnExposuresMember2022-12-310001160106lyg:RMS46Memberlyg:RetailMortgagesMemberlyg:Stage3Memberlyg:ExpectedCreditLossesInRespectOfDrawnExposuresMember2022-12-310001160106lyg:RMS46Memberlyg:PurchasedOrOriginatedCreditimpairedMemberlyg:RetailMortgagesMemberlyg:ExpectedCreditLossesInRespectOfDrawnExposuresMember2022-12-310001160106lyg:RMS46Memberlyg:RetailMortgagesMemberlyg:ExpectedCreditLossesInRespectOfDrawnExposuresMember2022-12-310001160106lyg:RetailMortgagesMemberlyg:GrossDrawnExposuresMemberlyg:Stage1Memberlyg:RMS79Member2022-12-310001160106lyg:RetailMortgagesMemberlyg:GrossDrawnExposuresMemberlyg:RMS79Memberlyg:Stage2Member2022-12-310001160106lyg:RetailMortgagesMemberlyg:GrossDrawnExposuresMemberlyg:Stage3Memberlyg:RMS79Member2022-12-310001160106lyg:PurchasedOrOriginatedCreditimpairedMemberlyg:RetailMortgagesMemberlyg:GrossDrawnExposuresMemberlyg:RMS79Member2022-12-310001160106lyg:RetailMortgagesMemberlyg:GrossDrawnExposuresMemberlyg:RMS79Member2022-12-310001160106lyg:RetailMortgagesMemberlyg:Stage1Memberlyg:RMS79Memberlyg:ExpectedCreditLossesInRespectOfDrawnExposuresMember2022-12-310001160106lyg:RetailMortgagesMemberlyg:RMS79Memberlyg:Stage2Memberlyg:ExpectedCreditLossesInRespectOfDrawnExposuresMember2022-12-310001160106lyg:RetailMortgagesMemberlyg:Stage3Memberlyg:RMS79Memberlyg:ExpectedCreditLossesInRespectOfDrawnExposuresMember2022-12-310001160106lyg:PurchasedOrOriginatedCreditimpairedMemberlyg:RetailMortgagesMemberlyg:RMS79Memberlyg:ExpectedCreditLossesInRespectOfDrawnExposuresMember2022-12-310001160106lyg:RetailMortgagesMemberlyg:RMS79Memberlyg:ExpectedCreditLossesInRespectOfDrawnExposuresMember2022-12-310001160106lyg:RetailMortgagesMemberlyg:GrossDrawnExposuresMemberlyg:Stage1Memberlyg:RMS10Member2022-12-310001160106lyg:RetailMortgagesMemberlyg:GrossDrawnExposuresMemberlyg:RMS10Memberlyg:Stage2Member2022-12-310001160106lyg:RetailMortgagesMemberlyg:GrossDrawnExposuresMemberlyg:Stage3Memberlyg:RMS10Member2022-12-310001160106lyg:PurchasedOrOriginatedCreditimpairedMemberlyg:RetailMortgagesMemberlyg:GrossDrawnExposuresMemberlyg:RMS10Member2022-12-310001160106lyg:RetailMortgagesMemberlyg:GrossDrawnExposuresMemberlyg:RMS10Member2022-12-310001160106lyg:RetailMortgagesMemberlyg:Stage1Memberlyg:RMS10Memberlyg:ExpectedCreditLossesInRespectOfDrawnExposuresMember2022-12-310001160106lyg:RetailMortgagesMemberlyg:RMS10Memberlyg:Stage2Memberlyg:ExpectedCreditLossesInRespectOfDrawnExposuresMember2022-12-310001160106lyg:RetailMortgagesMemberlyg:Stage3Memberlyg:RMS10Memberlyg:ExpectedCreditLossesInRespectOfDrawnExposuresMember2022-12-310001160106lyg:PurchasedOrOriginatedCreditimpairedMemberlyg:RetailMortgagesMemberlyg:RMS10Memberlyg:ExpectedCreditLossesInRespectOfDrawnExposuresMember2022-12-310001160106lyg:RetailMortgagesMemberlyg:RMS10Memberlyg:ExpectedCreditLossesInRespectOfDrawnExposuresMember2022-12-310001160106lyg:RetailMortgagesMemberlyg:GrossDrawnExposuresMemberlyg:RMS1113Memberlyg:Stage1Member2022-12-310001160106lyg:RetailMortgagesMemberlyg:GrossDrawnExposuresMemberlyg:RMS1113Memberlyg:Stage2Member2022-12-310001160106lyg:RetailMortgagesMemberlyg:GrossDrawnExposuresMemberlyg:RMS1113Memberlyg:Stage3Member2022-12-310001160106lyg:PurchasedOrOriginatedCreditimpairedMemberlyg:RetailMortgagesMemberlyg:GrossDrawnExposuresMemberlyg:RMS1113Member2022-12-310001160106lyg:RetailMortgagesMemberlyg:GrossDrawnExposuresMemberlyg:RMS1113Member2022-12-310001160106lyg:RetailMortgagesMemberlyg:RMS1113Memberlyg:Stage1Memberlyg:ExpectedCreditLossesInRespectOfDrawnExposuresMember2022-12-310001160106lyg:RetailMortgagesMemberlyg:RMS1113Memberlyg:Stage2Memberlyg:ExpectedCreditLossesInRespectOfDrawnExposuresMember2022-12-310001160106lyg:RetailMortgagesMemberlyg:RMS1113Memberlyg:Stage3Memberlyg:ExpectedCreditLossesInRespectOfDrawnExposuresMember2022-12-310001160106lyg:PurchasedOrOriginatedCreditimpairedMemberlyg:RetailMortgagesMemberlyg:RMS1113Memberlyg:ExpectedCreditLossesInRespectOfDrawnExposuresMember2022-12-310001160106lyg:RetailMortgagesMemberlyg:RMS1113Memberlyg:ExpectedCreditLossesInRespectOfDrawnExposuresMember2022-12-310001160106lyg:RetailMortgagesMemberlyg:GrossDrawnExposuresMemberlyg:Stage1Memberlyg:RMS14Member2022-12-310001160106lyg:RetailMortgagesMemberlyg:GrossDrawnExposuresMemberlyg:RMS14Memberlyg:Stage2Member2022-12-310001160106lyg:RetailMortgagesMemberlyg:GrossDrawnExposuresMemberlyg:Stage3Memberlyg:RMS14Member2022-12-310001160106lyg:PurchasedOrOriginatedCreditimpairedMemberlyg:RetailMortgagesMemberlyg:GrossDrawnExposuresMemberlyg:RMS14Member2022-12-310001160106lyg:RetailMortgagesMemberlyg:GrossDrawnExposuresMemberlyg:RMS14Member2022-12-310001160106lyg:RetailMortgagesMemberlyg:Stage1Memberlyg:RMS14Memberlyg:ExpectedCreditLossesInRespectOfDrawnExposuresMember2022-12-310001160106lyg:RetailMortgagesMemberlyg:RMS14Memberlyg:Stage2Memberlyg:ExpectedCreditLossesInRespectOfDrawnExposuresMember2022-12-310001160106lyg:RetailMortgagesMemberlyg:Stage3Memberlyg:RMS14Memberlyg:ExpectedCreditLossesInRespectOfDrawnExposuresMember2022-12-310001160106lyg:PurchasedOrOriginatedCreditimpairedMemberlyg:RetailMortgagesMemberlyg:RMS14Memberlyg:ExpectedCreditLossesInRespectOfDrawnExposuresMember2022-12-310001160106lyg:RetailMortgagesMemberlyg:RMS14Memberlyg:ExpectedCreditLossesInRespectOfDrawnExposuresMember2022-12-310001160106lyg:RetailMortgagesMemberlyg:GrossDrawnExposuresMemberlyg:Stage1Member2022-12-310001160106lyg:RetailMortgagesMemberlyg:GrossDrawnExposuresMemberlyg:Stage2Member2022-12-310001160106lyg:RetailMortgagesMemberlyg:GrossDrawnExposuresMemberlyg:Stage3Member2022-12-310001160106lyg:PurchasedOrOriginatedCreditimpairedMemberlyg:RetailMortgagesMemberlyg:GrossDrawnExposuresMember2022-12-310001160106lyg:RetailMortgagesMemberlyg:GrossDrawnExposuresMember2022-12-310001160106lyg:RetailMortgagesMemberlyg:Stage1Memberlyg:ExpectedCreditLossesInRespectOfDrawnExposuresMember2022-12-310001160106lyg:RetailMortgagesMemberlyg:Stage2Memberlyg:ExpectedCreditLossesInRespectOfDrawnExposuresMember2022-12-310001160106lyg:RetailMortgagesMemberlyg:Stage3Memberlyg:ExpectedCreditLossesInRespectOfDrawnExposuresMember2022-12-310001160106lyg:PurchasedOrOriginatedCreditimpairedMemberlyg:RetailMortgagesMemberlyg:ExpectedCreditLossesInRespectOfDrawnExposuresMember2022-12-310001160106lyg:RetailMortgagesMemberlyg:ExpectedCreditLossesInRespectOfDrawnExposuresMember2022-12-310001160106lyg:RMS13Memberlyg:RetailCreditCardsMemberlyg:GrossDrawnExposuresMemberlyg:Stage1Member2022-12-310001160106lyg:RMS13Memberlyg:RetailCreditCardsMemberlyg:GrossDrawnExposuresMemberlyg:Stage2Member2022-12-310001160106lyg:RMS13Memberlyg:RetailCreditCardsMemberlyg:GrossDrawnExposuresMemberlyg:Stage3Member2022-12-310001160106lyg:RMS13Memberlyg:PurchasedOrOriginatedCreditimpairedMemberlyg:RetailCreditCardsMemberlyg:GrossDrawnExposuresMember2022-12-310001160106lyg:RMS13Memberlyg:RetailCreditCardsMemberlyg:GrossDrawnExposuresMember2022-12-310001160106lyg:RMS13Memberlyg:RetailCreditCardsMemberlyg:Stage1Memberlyg:ExpectedCreditLossesInRespectOfDrawnExposuresMember2022-12-310001160106lyg:RMS13Memberlyg:RetailCreditCardsMemberlyg:Stage2Memberlyg:ExpectedCreditLossesInRespectOfDrawnExposuresMember2022-12-310001160106lyg:RMS13Memberlyg:RetailCreditCardsMemberlyg:Stage3Memberlyg:ExpectedCreditLossesInRespectOfDrawnExposuresMember2022-12-310001160106lyg:RMS13Memberlyg:PurchasedOrOriginatedCreditimpairedMemberlyg:RetailCreditCardsMemberlyg:ExpectedCreditLossesInRespectOfDrawnExposuresMember2022-12-310001160106lyg:RMS13Memberlyg:RetailCreditCardsMemberlyg:ExpectedCreditLossesInRespectOfDrawnExposuresMember2022-12-310001160106lyg:RMS46Memberlyg:RetailCreditCardsMemberlyg:GrossDrawnExposuresMemberlyg:Stage1Member2022-12-310001160106lyg:RMS46Memberlyg:RetailCreditCardsMemberlyg:GrossDrawnExposuresMemberlyg:Stage2Member2022-12-310001160106lyg:RMS46Memberlyg:RetailCreditCardsMemberlyg:GrossDrawnExposuresMemberlyg:Stage3Member2022-12-310001160106lyg:RMS46Memberlyg:PurchasedOrOriginatedCreditimpairedMemberlyg:RetailCreditCardsMemberlyg:GrossDrawnExposuresMember2022-12-310001160106lyg:RMS46Memberlyg:RetailCreditCardsMemberlyg:GrossDrawnExposuresMember2022-12-310001160106lyg:RMS46Memberlyg:RetailCreditCardsMemberlyg:Stage1Memberlyg:ExpectedCreditLossesInRespectOfDrawnExposuresMember2022-12-310001160106lyg:RMS46Memberlyg:RetailCreditCardsMemberlyg:Stage2Memberlyg:ExpectedCreditLossesInRespectOfDrawnExposuresMember2022-12-310001160106lyg:RMS46Memberlyg:RetailCreditCardsMemberlyg:Stage3Memberlyg:ExpectedCreditLossesInRespectOfDrawnExposuresMember2022-12-310001160106lyg:RMS46Memberlyg:PurchasedOrOriginatedCreditimpairedMemberlyg:RetailCreditCardsMemberlyg:ExpectedCreditLossesInRespectOfDrawnExposuresMember2022-12-310001160106lyg:RMS46Memberlyg:RetailCreditCardsMemberlyg:ExpectedCreditLossesInRespectOfDrawnExposuresMember2022-12-310001160106lyg:RetailCreditCardsMemberlyg:GrossDrawnExposuresMemberlyg:Stage1Memberlyg:RMS79Member2022-12-310001160106lyg:RetailCreditCardsMemberlyg:GrossDrawnExposuresMemberlyg:RMS79Memberlyg:Stage2Member2022-12-310001160106lyg:RetailCreditCardsMemberlyg:GrossDrawnExposuresMemberlyg:Stage3Memberlyg:RMS79Member2022-12-310001160106lyg:PurchasedOrOriginatedCreditimpairedMemberlyg:RetailCreditCardsMemberlyg:GrossDrawnExposuresMemberlyg:RMS79Member2022-12-310001160106lyg:RetailCreditCardsMemberlyg:GrossDrawnExposuresMemberlyg:RMS79Member2022-12-310001160106lyg:RetailCreditCardsMemberlyg:Stage1Memberlyg:RMS79Memberlyg:ExpectedCreditLossesInRespectOfDrawnExposuresMember2022-12-310001160106lyg:RetailCreditCardsMemberlyg:RMS79Memberlyg:Stage2Memberlyg:ExpectedCreditLossesInRespectOfDrawnExposuresMember2022-12-310001160106lyg:RetailCreditCardsMemberlyg:Stage3Memberlyg:RMS79Memberlyg:ExpectedCreditLossesInRespectOfDrawnExposuresMember2022-12-310001160106lyg:PurchasedOrOriginatedCreditimpairedMemberlyg:RetailCreditCardsMemberlyg:RMS79Memberlyg:ExpectedCreditLossesInRespectOfDrawnExposuresMember2022-12-310001160106lyg:RetailCreditCardsMemberlyg:RMS79Memberlyg:ExpectedCreditLossesInRespectOfDrawnExposuresMember2022-12-310001160106lyg:RetailCreditCardsMemberlyg:GrossDrawnExposuresMemberlyg:Stage1Memberlyg:RMS10Member2022-12-310001160106lyg:RetailCreditCardsMemberlyg:GrossDrawnExposuresMemberlyg:RMS10Memberlyg:Stage2Member2022-12-310001160106lyg:RetailCreditCardsMemberlyg:GrossDrawnExposuresMemberlyg:Stage3Memberlyg:RMS10Member2022-12-310001160106lyg:PurchasedOrOriginatedCreditimpairedMemberlyg:RetailCreditCardsMemberlyg:GrossDrawnExposuresMemberlyg:RMS10Member2022-12-310001160106lyg:RetailCreditCardsMemberlyg:GrossDrawnExposuresMemberlyg:RMS10Member2022-12-310001160106lyg:RetailCreditCardsMemberlyg:Stage1Memberlyg:RMS10Memberlyg:ExpectedCreditLossesInRespectOfDrawnExposuresMember2022-12-310001160106lyg:RetailCreditCardsMemberlyg:RMS10Memberlyg:Stage2Memberlyg:ExpectedCreditLossesInRespectOfDrawnExposuresMember2022-12-310001160106lyg:RetailCreditCardsMemberlyg:Stage3Memberlyg:RMS10Memberlyg:ExpectedCreditLossesInRespectOfDrawnExposuresMember2022-12-310001160106lyg:PurchasedOrOriginatedCreditimpairedMemberlyg:RetailCreditCardsMemberlyg:RMS10Memberlyg:ExpectedCreditLossesInRespectOfDrawnExposuresMember2022-12-310001160106lyg:RetailCreditCardsMemberlyg:RMS10Memberlyg:ExpectedCreditLossesInRespectOfDrawnExposuresMember2022-12-310001160106lyg:RetailCreditCardsMemberlyg:GrossDrawnExposuresMemberlyg:RMS1113Memberlyg:Stage1Member2022-12-310001160106lyg:RetailCreditCardsMemberlyg:GrossDrawnExposuresMemberlyg:RMS1113Memberlyg:Stage2Member2022-12-310001160106lyg:RetailCreditCardsMemberlyg:GrossDrawnExposuresMemberlyg:RMS1113Memberlyg:Stage3Member2022-12-310001160106lyg:PurchasedOrOriginatedCreditimpairedMemberlyg:RetailCreditCardsMemberlyg:GrossDrawnExposuresMemberlyg:RMS1113Member2022-12-310001160106lyg:RetailCreditCardsMemberlyg:GrossDrawnExposuresMemberlyg:RMS1113Member2022-12-310001160106lyg:RetailCreditCardsMemberlyg:RMS1113Memberlyg:Stage1Memberlyg:ExpectedCreditLossesInRespectOfDrawnExposuresMember2022-12-310001160106lyg:RetailCreditCardsMemberlyg:RMS1113Memberlyg:Stage2Memberlyg:ExpectedCreditLossesInRespectOfDrawnExposuresMember2022-12-310001160106lyg:RetailCreditCardsMemberlyg:RMS1113Memberlyg:Stage3Memberlyg:ExpectedCreditLossesInRespectOfDrawnExposuresMember2022-12-310001160106lyg:PurchasedOrOriginatedCreditimpairedMemberlyg:RetailCreditCardsMemberlyg:RMS1113Memberlyg:ExpectedCreditLossesInRespectOfDrawnExposuresMember2022-12-310001160106lyg:RetailCreditCardsMemberlyg:RMS1113Memberlyg:ExpectedCreditLossesInRespectOfDrawnExposuresMember2022-12-310001160106lyg:RetailCreditCardsMemberlyg:GrossDrawnExposuresMemberlyg:Stage1Memberlyg:RMS14Member2022-12-310001160106lyg:RetailCreditCardsMemberlyg:GrossDrawnExposuresMemberlyg:RMS14Memberlyg:Stage2Member2022-12-310001160106lyg:RetailCreditCardsMemberlyg:GrossDrawnExposuresMemberlyg:Stage3Memberlyg:RMS14Member2022-12-310001160106lyg:PurchasedOrOriginatedCreditimpairedMemberlyg:RetailCreditCardsMemberlyg:GrossDrawnExposuresMemberlyg:RMS14Member2022-12-310001160106lyg:RetailCreditCardsMemberlyg:GrossDrawnExposuresMemberlyg:RMS14Member2022-12-310001160106lyg:RetailCreditCardsMemberlyg:Stage1Memberlyg:RMS14Memberlyg:ExpectedCreditLossesInRespectOfDrawnExposuresMember2022-12-310001160106lyg:RetailCreditCardsMemberlyg:RMS14Memberlyg:Stage2Memberlyg:ExpectedCreditLossesInRespectOfDrawnExposuresMember2022-12-310001160106lyg:RetailCreditCardsMemberlyg:Stage3Memberlyg:RMS14Memberlyg:ExpectedCreditLossesInRespectOfDrawnExposuresMember2022-12-310001160106lyg:PurchasedOrOriginatedCreditimpairedMemberlyg:RetailCreditCardsMemberlyg:RMS14Memberlyg:ExpectedCreditLossesInRespectOfDrawnExposuresMember2022-12-310001160106lyg:RetailCreditCardsMemberlyg:RMS14Memberlyg:ExpectedCreditLossesInRespectOfDrawnExposuresMember2022-12-310001160106lyg:RetailCreditCardsMemberlyg:GrossDrawnExposuresMemberlyg:Stage1Member2022-12-310001160106lyg:RetailCreditCardsMemberlyg:GrossDrawnExposuresMemberlyg:Stage2Member2022-12-310001160106lyg:RetailCreditCardsMemberlyg:GrossDrawnExposuresMemberlyg:Stage3Member2022-12-310001160106lyg:PurchasedOrOriginatedCreditimpairedMemberlyg:RetailCreditCardsMemberlyg:GrossDrawnExposuresMember2022-12-310001160106lyg:RetailCreditCardsMemberlyg:GrossDrawnExposuresMember2022-12-310001160106lyg:RetailCreditCardsMemberlyg:Stage1Memberlyg:ExpectedCreditLossesInRespectOfDrawnExposuresMember2022-12-310001160106lyg:RetailCreditCardsMemberlyg:Stage2Memberlyg:ExpectedCreditLossesInRespectOfDrawnExposuresMember2022-12-310001160106lyg:RetailCreditCardsMemberlyg:Stage3Memberlyg:ExpectedCreditLossesInRespectOfDrawnExposuresMember2022-12-310001160106lyg:PurchasedOrOriginatedCreditimpairedMemberlyg:RetailCreditCardsMemberlyg:ExpectedCreditLossesInRespectOfDrawnExposuresMember2022-12-310001160106lyg:RetailCreditCardsMemberlyg:ExpectedCreditLossesInRespectOfDrawnExposuresMember2022-12-310001160106lyg:RetailLoansAndOverdraftsMemberlyg:RMS13Memberlyg:GrossDrawnExposuresMemberlyg:Stage1Member2022-12-310001160106lyg:RetailLoansAndOverdraftsMemberlyg:RMS13Memberlyg:GrossDrawnExposuresMemberlyg:Stage2Member2022-12-310001160106lyg:RetailLoansAndOverdraftsMemberlyg:RMS13Memberlyg:GrossDrawnExposuresMemberlyg:Stage3Member2022-12-310001160106lyg:RetailLoansAndOverdraftsMemberlyg:RMS13Memberlyg:PurchasedOrOriginatedCreditimpairedMemberlyg:GrossDrawnExposuresMember2022-12-310001160106lyg:RetailLoansAndOverdraftsMemberlyg:RMS13Memberlyg:GrossDrawnExposuresMember2022-12-310001160106lyg:RetailLoansAndOverdraftsMemberlyg:RMS13Memberlyg:Stage1Memberlyg:ExpectedCreditLossesInRespectOfDrawnExposuresMember2022-12-310001160106lyg:RetailLoansAndOverdraftsMemberlyg:RMS13Memberlyg:Stage2Memberlyg:ExpectedCreditLossesInRespectOfDrawnExposuresMember2022-12-310001160106lyg:RetailLoansAndOverdraftsMemberlyg:RMS13Memberlyg:Stage3Memberlyg:ExpectedCreditLossesInRespectOfDrawnExposuresMember2022-12-310001160106lyg:RetailLoansAndOverdraftsMemberlyg:RMS13Memberlyg:PurchasedOrOriginatedCreditimpairedMemberlyg:ExpectedCreditLossesInRespectOfDrawnExposuresMember2022-12-310001160106lyg:RetailLoansAndOverdraftsMemberlyg:RMS13Memberlyg:ExpectedCreditLossesInRespectOfDrawnExposuresMember2022-12-310001160106lyg:RetailLoansAndOverdraftsMemberlyg:RMS46Memberlyg:GrossDrawnExposuresMemberlyg:Stage1Member2022-12-310001160106lyg:RetailLoansAndOverdraftsMemberlyg:RMS46Memberlyg:GrossDrawnExposuresMemberlyg:Stage2Member2022-12-310001160106lyg:RetailLoansAndOverdraftsMemberlyg:RMS46Memberlyg:GrossDrawnExposuresMemberlyg:Stage3Member2022-12-310001160106lyg:RetailLoansAndOverdraftsMemberlyg:RMS46Memberlyg:PurchasedOrOriginatedCreditimpairedMemberlyg:GrossDrawnExposuresMember2022-12-310001160106lyg:RetailLoansAndOverdraftsMemberlyg:RMS46Memberlyg:GrossDrawnExposuresMember2022-12-310001160106lyg:RetailLoansAndOverdraftsMemberlyg:RMS46Memberlyg:Stage1Memberlyg:ExpectedCreditLossesInRespectOfDrawnExposuresMember2022-12-310001160106lyg:RetailLoansAndOverdraftsMemberlyg:RMS46Memberlyg:Stage2Memberlyg:ExpectedCreditLossesInRespectOfDrawnExposuresMember2022-12-310001160106lyg:RetailLoansAndOverdraftsMemberlyg:RMS46Memberlyg:Stage3Memberlyg:ExpectedCreditLossesInRespectOfDrawnExposuresMember2022-12-310001160106lyg:RetailLoansAndOverdraftsMemberlyg:RMS46Memberlyg:PurchasedOrOriginatedCreditimpairedMemberlyg:ExpectedCreditLossesInRespectOfDrawnExposuresMember2022-12-310001160106lyg:RetailLoansAndOverdraftsMemberlyg:RMS46Memberlyg:ExpectedCreditLossesInRespectOfDrawnExposuresMember2022-12-310001160106lyg:RetailLoansAndOverdraftsMemberlyg:GrossDrawnExposuresMemberlyg:Stage1Memberlyg:RMS79Member2022-12-310001160106lyg:RetailLoansAndOverdraftsMemberlyg:GrossDrawnExposuresMemberlyg:RMS79Memberlyg:Stage2Member2022-12-310001160106lyg:RetailLoansAndOverdraftsMemberlyg:GrossDrawnExposuresMemberlyg:Stage3Memberlyg:RMS79Member2022-12-310001160106lyg:RetailLoansAndOverdraftsMemberlyg:PurchasedOrOriginatedCreditimpairedMemberlyg:GrossDrawnExposuresMemberlyg:RMS79Member2022-12-310001160106lyg:RetailLoansAndOverdraftsMemberlyg:GrossDrawnExposuresMemberlyg:RMS79Member2022-12-310001160106lyg:RetailLoansAndOverdraftsMemberlyg:Stage1Memberlyg:RMS79Memberlyg:ExpectedCreditLossesInRespectOfDrawnExposuresMember2022-12-310001160106lyg:RetailLoansAndOverdraftsMemberlyg:RMS79Memberlyg:Stage2Memberlyg:ExpectedCreditLossesInRespectOfDrawnExposuresMember2022-12-310001160106lyg:RetailLoansAndOverdraftsMemberlyg:Stage3Memberlyg:RMS79Memberlyg:ExpectedCreditLossesInRespectOfDrawnExposuresMember2022-12-310001160106lyg:RetailLoansAndOverdraftsMemberlyg:PurchasedOrOriginatedCreditimpairedMemberlyg:RMS79Memberlyg:ExpectedCreditLossesInRespectOfDrawnExposuresMember2022-12-310001160106lyg:RetailLoansAndOverdraftsMemberlyg:RMS79Memberlyg:ExpectedCreditLossesInRespectOfDrawnExposuresMember2022-12-310001160106lyg:RetailLoansAndOverdraftsMemberlyg:GrossDrawnExposuresMemberlyg:Stage1Memberlyg:RMS10Member2022-12-310001160106lyg:RetailLoansAndOverdraftsMemberlyg:GrossDrawnExposuresMemberlyg:RMS10Memberlyg:Stage2Member2022-12-310001160106lyg:RetailLoansAndOverdraftsMemberlyg:GrossDrawnExposuresMemberlyg:Stage3Memberlyg:RMS10Member2022-12-310001160106lyg:RetailLoansAndOverdraftsMemberlyg:PurchasedOrOriginatedCreditimpairedMemberlyg:GrossDrawnExposuresMemberlyg:RMS10Member2022-12-310001160106lyg:RetailLoansAndOverdraftsMemberlyg:GrossDrawnExposuresMemberlyg:RMS10Member2022-12-310001160106lyg:RetailLoansAndOverdraftsMemberlyg:Stage1Memberlyg:RMS10Memberlyg:ExpectedCreditLossesInRespectOfDrawnExposuresMember2022-12-310001160106lyg:RetailLoansAndOverdraftsMemberlyg:RMS10Memberlyg:Stage2Memberlyg:ExpectedCreditLossesInRespectOfDrawnExposuresMember2022-12-310001160106lyg:RetailLoansAndOverdraftsMemberlyg:Stage3Memberlyg:RMS10Memberlyg:ExpectedCreditLossesInRespectOfDrawnExposuresMember2022-12-310001160106lyg:RetailLoansAndOverdraftsMemberlyg:PurchasedOrOriginatedCreditimpairedMemberlyg:RMS10Memberlyg:ExpectedCreditLossesInRespectOfDrawnExposuresMember2022-12-310001160106lyg:RetailLoansAndOverdraftsMemberlyg:RMS10Memberlyg:ExpectedCreditLossesInRespectOfDrawnExposuresMember2022-12-310001160106lyg:RetailLoansAndOverdraftsMemberlyg:GrossDrawnExposuresMemberlyg:RMS1113Memberlyg:Stage1Member2022-12-310001160106lyg:RetailLoansAndOverdraftsMemberlyg:GrossDrawnExposuresMemberlyg:RMS1113Memberlyg:Stage2Member2022-12-310001160106lyg:RetailLoansAndOverdraftsMemberlyg:GrossDrawnExposuresMemberlyg:RMS1113Memberlyg:Stage3Member2022-12-310001160106lyg:RetailLoansAndOverdraftsMemberlyg:PurchasedOrOriginatedCreditimpairedMemberlyg:GrossDrawnExposuresMemberlyg:RMS1113Member2022-12-310001160106lyg:RetailLoansAndOverdraftsMemberlyg:GrossDrawnExposuresMemberlyg:RMS1113Member2022-12-310001160106lyg:RetailLoansAndOverdraftsMemberlyg:RMS1113Memberlyg:Stage1Memberlyg:ExpectedCreditLossesInRespectOfDrawnExposuresMember2022-12-310001160106lyg:RetailLoansAndOverdraftsMemberlyg:RMS1113Memberlyg:Stage2Memberlyg:ExpectedCreditLossesInRespectOfDrawnExposuresMember2022-12-310001160106lyg:RetailLoansAndOverdraftsMemberlyg:RMS1113Memberlyg:Stage3Memberlyg:ExpectedCreditLossesInRespectOfDrawnExposuresMember2022-12-310001160106lyg:RetailLoansAndOverdraftsMemberlyg:PurchasedOrOriginatedCreditimpairedMemberlyg:RMS1113Memberlyg:ExpectedCreditLossesInRespectOfDrawnExposuresMember2022-12-310001160106lyg:RetailLoansAndOverdraftsMemberlyg:RMS1113Memberlyg:ExpectedCreditLossesInRespectOfDrawnExposuresMember2022-12-310001160106lyg:RetailLoansAndOverdraftsMemberlyg:GrossDrawnExposuresMemberlyg:Stage1Memberlyg:RMS14Member2022-12-310001160106lyg:RetailLoansAndOverdraftsMemberlyg:GrossDrawnExposuresMemberlyg:RMS14Memberlyg:Stage2Member2022-12-310001160106lyg:RetailLoansAndOverdraftsMemberlyg:GrossDrawnExposuresMemberlyg:Stage3Memberlyg:RMS14Member2022-12-310001160106lyg:RetailLoansAndOverdraftsMemberlyg:PurchasedOrOriginatedCreditimpairedMemberlyg:GrossDrawnExposuresMemberlyg:RMS14Member2022-12-310001160106lyg:RetailLoansAndOverdraftsMemberlyg:GrossDrawnExposuresMemberlyg:RMS14Member2022-12-310001160106lyg:RetailLoansAndOverdraftsMemberlyg:Stage1Memberlyg:RMS14Memberlyg:ExpectedCreditLossesInRespectOfDrawnExposuresMember2022-12-310001160106lyg:RetailLoansAndOverdraftsMemberlyg:RMS14Memberlyg:Stage2Memberlyg:ExpectedCreditLossesInRespectOfDrawnExposuresMember2022-12-310001160106lyg:RetailLoansAndOverdraftsMemberlyg:Stage3Memberlyg:RMS14Memberlyg:ExpectedCreditLossesInRespectOfDrawnExposuresMember2022-12-310001160106lyg:RetailLoansAndOverdraftsMemberlyg:PurchasedOrOriginatedCreditimpairedMemberlyg:RMS14Memberlyg:ExpectedCreditLossesInRespectOfDrawnExposuresMember2022-12-310001160106lyg:RetailLoansAndOverdraftsMemberlyg:RMS14Memberlyg:ExpectedCreditLossesInRespectOfDrawnExposuresMember2022-12-310001160106lyg:RetailLoansAndOverdraftsMemberlyg:GrossDrawnExposuresMemberlyg:Stage1Member2022-12-310001160106lyg:RetailLoansAndOverdraftsMemberlyg:GrossDrawnExposuresMemberlyg:Stage2Member2022-12-310001160106lyg:RetailLoansAndOverdraftsMemberlyg:GrossDrawnExposuresMemberlyg:Stage3Member2022-12-310001160106lyg:RetailLoansAndOverdraftsMemberlyg:PurchasedOrOriginatedCreditimpairedMemberlyg:GrossDrawnExposuresMember2022-12-310001160106lyg:RetailLoansAndOverdraftsMemberlyg:GrossDrawnExposuresMember2022-12-310001160106lyg:RetailLoansAndOverdraftsMemberlyg:Stage1Memberlyg:ExpectedCreditLossesInRespectOfDrawnExposuresMember2022-12-310001160106lyg:RetailLoansAndOverdraftsMemberlyg:Stage2Memberlyg:ExpectedCreditLossesInRespectOfDrawnExposuresMember2022-12-310001160106lyg:RetailLoansAndOverdraftsMemberlyg:Stage3Memberlyg:ExpectedCreditLossesInRespectOfDrawnExposuresMember2022-12-310001160106lyg:RetailLoansAndOverdraftsMemberlyg:PurchasedOrOriginatedCreditimpairedMemberlyg:ExpectedCreditLossesInRespectOfDrawnExposuresMember2022-12-310001160106lyg:RetailLoansAndOverdraftsMemberlyg:ExpectedCreditLossesInRespectOfDrawnExposuresMember2022-12-310001160106lyg:RMS13Memberlyg:GrossDrawnExposuresMemberlyg:RetailUKMotorFinanceMemberlyg:Stage1Member2022-12-310001160106lyg:RMS13Memberlyg:GrossDrawnExposuresMemberlyg:RetailUKMotorFinanceMemberlyg:Stage2Member2022-12-310001160106lyg:RMS13Memberlyg:GrossDrawnExposuresMemberlyg:RetailUKMotorFinanceMemberlyg:Stage3Member2022-12-310001160106lyg:RMS13Memberlyg:PurchasedOrOriginatedCreditimpairedMemberlyg:GrossDrawnExposuresMemberlyg:RetailUKMotorFinanceMember2022-12-310001160106lyg:RMS13Memberlyg:GrossDrawnExposuresMemberlyg:RetailUKMotorFinanceMember2022-12-310001160106lyg:RMS13Memberlyg:RetailUKMotorFinanceMemberlyg:Stage1Memberlyg:ExpectedCreditLossesInRespectOfDrawnExposuresMember2022-12-310001160106lyg:RMS13Memberlyg:RetailUKMotorFinanceMemberlyg:Stage2Memberlyg:ExpectedCreditLossesInRespectOfDrawnExposuresMember2022-12-310001160106lyg:RMS13Memberlyg:RetailUKMotorFinanceMemberlyg:Stage3Memberlyg:ExpectedCreditLossesInRespectOfDrawnExposuresMember2022-12-310001160106lyg:RMS13Memberlyg:PurchasedOrOriginatedCreditimpairedMemberlyg:RetailUKMotorFinanceMemberlyg:ExpectedCreditLossesInRespectOfDrawnExposuresMember2022-12-310001160106lyg:RMS13Memberlyg:RetailUKMotorFinanceMemberlyg:ExpectedCreditLossesInRespectOfDrawnExposuresMember2022-12-310001160106lyg:RMS46Memberlyg:GrossDrawnExposuresMemberlyg:RetailUKMotorFinanceMemberlyg:Stage1Member2022-12-310001160106lyg:RMS46Memberlyg:GrossDrawnExposuresMemberlyg:RetailUKMotorFinanceMemberlyg:Stage2Member2022-12-310001160106lyg:RMS46Memberlyg:GrossDrawnExposuresMemberlyg:RetailUKMotorFinanceMemberlyg:Stage3Member2022-12-310001160106lyg:RMS46Memberlyg:PurchasedOrOriginatedCreditimpairedMemberlyg:GrossDrawnExposuresMemberlyg:RetailUKMotorFinanceMember2022-12-310001160106lyg:RMS46Memberlyg:GrossDrawnExposuresMemberlyg:RetailUKMotorFinanceMember2022-12-310001160106lyg:RMS46Memberlyg:RetailUKMotorFinanceMemberlyg:Stage1Memberlyg:ExpectedCreditLossesInRespectOfDrawnExposuresMember2022-12-310001160106lyg:RMS46Memberlyg:RetailUKMotorFinanceMemberlyg:Stage2Memberlyg:ExpectedCreditLossesInRespectOfDrawnExposuresMember2022-12-310001160106lyg:RMS46Memberlyg:RetailUKMotorFinanceMemberlyg:Stage3Memberlyg:ExpectedCreditLossesInRespectOfDrawnExposuresMember2022-12-310001160106lyg:RMS46Memberlyg:PurchasedOrOriginatedCreditimpairedMemberlyg:RetailUKMotorFinanceMemberlyg:ExpectedCreditLossesInRespectOfDrawnExposuresMember2022-12-310001160106lyg:RMS46Memberlyg:RetailUKMotorFinanceMemberlyg:ExpectedCreditLossesInRespectOfDrawnExposuresMember2022-12-310001160106lyg:GrossDrawnExposuresMemberlyg:RetailUKMotorFinanceMemberlyg:Stage1Memberlyg:RMS79Member2022-12-310001160106lyg:GrossDrawnExposuresMemberlyg:RetailUKMotorFinanceMemberlyg:RMS79Memberlyg:Stage2Member2022-12-310001160106lyg:GrossDrawnExposuresMemberlyg:RetailUKMotorFinanceMemberlyg:Stage3Memberlyg:RMS79Member2022-12-310001160106lyg:PurchasedOrOriginatedCreditimpairedMemberlyg:GrossDrawnExposuresMemberlyg:RetailUKMotorFinanceMemberlyg:RMS79Member2022-12-310001160106lyg:GrossDrawnExposuresMemberlyg:RetailUKMotorFinanceMemberlyg:RMS79Member2022-12-310001160106lyg:RetailUKMotorFinanceMemberlyg:Stage1Memberlyg:RMS79Memberlyg:ExpectedCreditLossesInRespectOfDrawnExposuresMember2022-12-310001160106lyg:RetailUKMotorFinanceMemberlyg:RMS79Memberlyg:Stage2Memberlyg:ExpectedCreditLossesInRespectOfDrawnExposuresMember2022-12-310001160106lyg:RetailUKMotorFinanceMemberlyg:Stage3Memberlyg:RMS79Memberlyg:ExpectedCreditLossesInRespectOfDrawnExposuresMember2022-12-310001160106lyg:PurchasedOrOriginatedCreditimpairedMemberlyg:RetailUKMotorFinanceMemberlyg:RMS79Memberlyg:ExpectedCreditLossesInRespectOfDrawnExposuresMember2022-12-310001160106lyg:RetailUKMotorFinanceMemberlyg:RMS79Memberlyg:ExpectedCreditLossesInRespectOfDrawnExposuresMember2022-12-310001160106lyg:GrossDrawnExposuresMemberlyg:RetailUKMotorFinanceMemberlyg:Stage1Memberlyg:RMS10Member2022-12-310001160106lyg:GrossDrawnExposuresMemberlyg:RetailUKMotorFinanceMemberlyg:RMS10Memberlyg:Stage2Member2022-12-310001160106lyg:GrossDrawnExposuresMemberlyg:RetailUKMotorFinanceMemberlyg:Stage3Memberlyg:RMS10Member2022-12-310001160106lyg:PurchasedOrOriginatedCreditimpairedMemberlyg:GrossDrawnExposuresMemberlyg:RetailUKMotorFinanceMemberlyg:RMS10Member2022-12-310001160106lyg:GrossDrawnExposuresMemberlyg:RetailUKMotorFinanceMemberlyg:RMS10Member2022-12-310001160106lyg:RetailUKMotorFinanceMemberlyg:Stage1Memberlyg:RMS10Memberlyg:ExpectedCreditLossesInRespectOfDrawnExposuresMember2022-12-310001160106lyg:RetailUKMotorFinanceMemberlyg:RMS10Memberlyg:Stage2Memberlyg:ExpectedCreditLossesInRespectOfDrawnExposuresMember2022-12-310001160106lyg:RetailUKMotorFinanceMemberlyg:Stage3Memberlyg:RMS10Memberlyg:ExpectedCreditLossesInRespectOfDrawnExposuresMember2022-12-310001160106lyg:PurchasedOrOriginatedCreditimpairedMemberlyg:RetailUKMotorFinanceMemberlyg:RMS10Memberlyg:ExpectedCreditLossesInRespectOfDrawnExposuresMember2022-12-310001160106lyg:RetailUKMotorFinanceMemberlyg:RMS10Memberlyg:ExpectedCreditLossesInRespectOfDrawnExposuresMember2022-12-310001160106lyg:GrossDrawnExposuresMemberlyg:RetailUKMotorFinanceMemberlyg:RMS1113Memberlyg:Stage1Member2022-12-310001160106lyg:GrossDrawnExposuresMemberlyg:RetailUKMotorFinanceMemberlyg:RMS1113Memberlyg:Stage2Member2022-12-310001160106lyg:GrossDrawnExposuresMemberlyg:RetailUKMotorFinanceMemberlyg:RMS1113Memberlyg:Stage3Member2022-12-310001160106lyg:PurchasedOrOriginatedCreditimpairedMemberlyg:GrossDrawnExposuresMemberlyg:RetailUKMotorFinanceMemberlyg:RMS1113Member2022-12-310001160106lyg:GrossDrawnExposuresMemberlyg:RetailUKMotorFinanceMemberlyg:RMS1113Member2022-12-310001160106lyg:RetailUKMotorFinanceMemberlyg:RMS1113Memberlyg:Stage1Memberlyg:ExpectedCreditLossesInRespectOfDrawnExposuresMember2022-12-310001160106lyg:RetailUKMotorFinanceMemberlyg:RMS1113Memberlyg:Stage2Memberlyg:ExpectedCreditLossesInRespectOfDrawnExposuresMember2022-12-310001160106lyg:RetailUKMotorFinanceMemberlyg:RMS1113Memberlyg:Stage3Memberlyg:ExpectedCreditLossesInRespectOfDrawnExposuresMember2022-12-310001160106lyg:PurchasedOrOriginatedCreditimpairedMemberlyg:RetailUKMotorFinanceMemberlyg:RMS1113Memberlyg:ExpectedCreditLossesInRespectOfDrawnExposuresMember2022-12-310001160106lyg:RetailUKMotorFinanceMemberlyg:RMS1113Memberlyg:ExpectedCreditLossesInRespectOfDrawnExposuresMember2022-12-310001160106lyg:GrossDrawnExposuresMemberlyg:RetailUKMotorFinanceMemberlyg:Stage1Memberlyg:RMS14Member2022-12-310001160106lyg:GrossDrawnExposuresMemberlyg:RetailUKMotorFinanceMemberlyg:RMS14Memberlyg:Stage2Member2022-12-310001160106lyg:GrossDrawnExposuresMemberlyg:RetailUKMotorFinanceMemberlyg:Stage3Memberlyg:RMS14Member2022-12-310001160106lyg:PurchasedOrOriginatedCreditimpairedMemberlyg:GrossDrawnExposuresMemberlyg:RetailUKMotorFinanceMemberlyg:RMS14Member2022-12-310001160106lyg:GrossDrawnExposuresMemberlyg:RetailUKMotorFinanceMemberlyg:RMS14Member2022-12-310001160106lyg:RetailUKMotorFinanceMemberlyg:Stage1Memberlyg:RMS14Memberlyg:ExpectedCreditLossesInRespectOfDrawnExposuresMember2022-12-310001160106lyg:RetailUKMotorFinanceMemberlyg:RMS14Memberlyg:Stage2Memberlyg:ExpectedCreditLossesInRespectOfDrawnExposuresMember2022-12-310001160106lyg:RetailUKMotorFinanceMemberlyg:Stage3Memberlyg:RMS14Memberlyg:ExpectedCreditLossesInRespectOfDrawnExposuresMember2022-12-310001160106lyg:PurchasedOrOriginatedCreditimpairedMemberlyg:RetailUKMotorFinanceMemberlyg:RMS14Memberlyg:ExpectedCreditLossesInRespectOfDrawnExposuresMember2022-12-310001160106lyg:RetailUKMotorFinanceMemberlyg:RMS14Memberlyg:ExpectedCreditLossesInRespectOfDrawnExposuresMember2022-12-310001160106lyg:GrossDrawnExposuresMemberlyg:RetailUKMotorFinanceMemberlyg:Stage1Member2022-12-310001160106lyg:GrossDrawnExposuresMemberlyg:RetailUKMotorFinanceMemberlyg:Stage2Member2022-12-310001160106lyg:GrossDrawnExposuresMemberlyg:RetailUKMotorFinanceMemberlyg:Stage3Member2022-12-310001160106lyg:PurchasedOrOriginatedCreditimpairedMemberlyg:GrossDrawnExposuresMemberlyg:RetailUKMotorFinanceMember2022-12-310001160106lyg:GrossDrawnExposuresMemberlyg:RetailUKMotorFinanceMember2022-12-310001160106lyg:RetailUKMotorFinanceMemberlyg:Stage1Memberlyg:ExpectedCreditLossesInRespectOfDrawnExposuresMember2022-12-310001160106lyg:RetailUKMotorFinanceMemberlyg:Stage2Memberlyg:ExpectedCreditLossesInRespectOfDrawnExposuresMember2022-12-310001160106lyg:RetailUKMotorFinanceMemberlyg:Stage3Memberlyg:ExpectedCreditLossesInRespectOfDrawnExposuresMember2022-12-310001160106lyg:PurchasedOrOriginatedCreditimpairedMemberlyg:RetailUKMotorFinanceMemberlyg:ExpectedCreditLossesInRespectOfDrawnExposuresMember2022-12-310001160106lyg:RetailUKMotorFinanceMemberlyg:ExpectedCreditLossesInRespectOfDrawnExposuresMember2022-12-310001160106lyg:RMS13Memberlyg:RetailOtherMemberlyg:GrossDrawnExposuresMemberlyg:Stage1Member2022-12-310001160106lyg:RMS13Memberlyg:RetailOtherMemberlyg:GrossDrawnExposuresMemberlyg:Stage2Member2022-12-310001160106lyg:RMS13Memberlyg:RetailOtherMemberlyg:GrossDrawnExposuresMemberlyg:Stage3Member2022-12-310001160106lyg:RMS13Memberlyg:PurchasedOrOriginatedCreditimpairedMemberlyg:RetailOtherMemberlyg:GrossDrawnExposuresMember2022-12-310001160106lyg:RMS13Memberlyg:RetailOtherMemberlyg:GrossDrawnExposuresMember2022-12-310001160106lyg:RMS13Memberlyg:RetailOtherMemberlyg:Stage1Memberlyg:ExpectedCreditLossesInRespectOfDrawnExposuresMember2022-12-310001160106lyg:RMS13Memberlyg:RetailOtherMemberlyg:Stage2Memberlyg:ExpectedCreditLossesInRespectOfDrawnExposuresMember2022-12-310001160106lyg:RMS13Memberlyg:RetailOtherMemberlyg:Stage3Memberlyg:ExpectedCreditLossesInRespectOfDrawnExposuresMember2022-12-310001160106lyg:RMS13Memberlyg:PurchasedOrOriginatedCreditimpairedMemberlyg:RetailOtherMemberlyg:ExpectedCreditLossesInRespectOfDrawnExposuresMember2022-12-310001160106lyg:RMS13Memberlyg:RetailOtherMemberlyg:ExpectedCreditLossesInRespectOfDrawnExposuresMember2022-12-310001160106lyg:RMS46Memberlyg:RetailOtherMemberlyg:GrossDrawnExposuresMemberlyg:Stage1Member2022-12-310001160106lyg:RMS46Memberlyg:RetailOtherMemberlyg:GrossDrawnExposuresMemberlyg:Stage2Member2022-12-310001160106lyg:RMS46Memberlyg:RetailOtherMemberlyg:GrossDrawnExposuresMemberlyg:Stage3Member2022-12-310001160106lyg:RMS46Memberlyg:PurchasedOrOriginatedCreditimpairedMemberlyg:RetailOtherMemberlyg:GrossDrawnExposuresMember2022-12-310001160106lyg:RMS46Memberlyg:RetailOtherMemberlyg:GrossDrawnExposuresMember2022-12-310001160106lyg:RMS46Memberlyg:RetailOtherMemberlyg:Stage1Memberlyg:ExpectedCreditLossesInRespectOfDrawnExposuresMember2022-12-310001160106lyg:RMS46Memberlyg:RetailOtherMemberlyg:Stage2Memberlyg:ExpectedCreditLossesInRespectOfDrawnExposuresMember2022-12-310001160106lyg:RMS46Memberlyg:RetailOtherMemberlyg:Stage3Memberlyg:ExpectedCreditLossesInRespectOfDrawnExposuresMember2022-12-310001160106lyg:RMS46Memberlyg:PurchasedOrOriginatedCreditimpairedMemberlyg:RetailOtherMemberlyg:ExpectedCreditLossesInRespectOfDrawnExposuresMember2022-12-310001160106lyg:RMS46Memberlyg:RetailOtherMemberlyg:ExpectedCreditLossesInRespectOfDrawnExposuresMember2022-12-310001160106lyg:RetailOtherMemberlyg:GrossDrawnExposuresMemberlyg:Stage1Memberlyg:RMS79Member2022-12-310001160106lyg:RetailOtherMemberlyg:GrossDrawnExposuresMemberlyg:RMS79Memberlyg:Stage2Member2022-12-310001160106lyg:RetailOtherMemberlyg:GrossDrawnExposuresMemberlyg:Stage3Memberlyg:RMS79Member2022-12-310001160106lyg:PurchasedOrOriginatedCreditimpairedMemberlyg:RetailOtherMemberlyg:GrossDrawnExposuresMemberlyg:RMS79Member2022-12-310001160106lyg:RetailOtherMemberlyg:GrossDrawnExposuresMemberlyg:RMS79Member2022-12-310001160106lyg:RetailOtherMemberlyg:Stage1Memberlyg:RMS79Memberlyg:ExpectedCreditLossesInRespectOfDrawnExposuresMember2022-12-310001160106lyg:RetailOtherMemberlyg:RMS79Memberlyg:Stage2Memberlyg:ExpectedCreditLossesInRespectOfDrawnExposuresMember2022-12-310001160106lyg:RetailOtherMemberlyg:Stage3Memberlyg:RMS79Memberlyg:ExpectedCreditLossesInRespectOfDrawnExposuresMember2022-12-310001160106lyg:PurchasedOrOriginatedCreditimpairedMemberlyg:RetailOtherMemberlyg:RMS79Memberlyg:ExpectedCreditLossesInRespectOfDrawnExposuresMember2022-12-310001160106lyg:RetailOtherMemberlyg:RMS79Memberlyg:ExpectedCreditLossesInRespectOfDrawnExposuresMember2022-12-310001160106lyg:RetailOtherMemberlyg:GrossDrawnExposuresMemberlyg:Stage1Memberlyg:RMS10Member2022-12-310001160106lyg:RetailOtherMemberlyg:GrossDrawnExposuresMemberlyg:RMS10Memberlyg:Stage2Member2022-12-310001160106lyg:RetailOtherMemberlyg:GrossDrawnExposuresMemberlyg:Stage3Memberlyg:RMS10Member2022-12-310001160106lyg:PurchasedOrOriginatedCreditimpairedMemberlyg:RetailOtherMemberlyg:GrossDrawnExposuresMemberlyg:RMS10Member2022-12-310001160106lyg:RetailOtherMemberlyg:GrossDrawnExposuresMemberlyg:RMS10Member2022-12-310001160106lyg:RetailOtherMemberlyg:Stage1Memberlyg:RMS10Memberlyg:ExpectedCreditLossesInRespectOfDrawnExposuresMember2022-12-310001160106lyg:RetailOtherMemberlyg:RMS10Memberlyg:Stage2Memberlyg:ExpectedCreditLossesInRespectOfDrawnExposuresMember2022-12-310001160106lyg:RetailOtherMemberlyg:Stage3Memberlyg:RMS10Memberlyg:ExpectedCreditLossesInRespectOfDrawnExposuresMember2022-12-310001160106lyg:PurchasedOrOriginatedCreditimpairedMemberlyg:RetailOtherMemberlyg:RMS10Memberlyg:ExpectedCreditLossesInRespectOfDrawnExposuresMember2022-12-310001160106lyg:RetailOtherMemberlyg:RMS10Memberlyg:ExpectedCreditLossesInRespectOfDrawnExposuresMember2022-12-310001160106lyg:RetailOtherMemberlyg:GrossDrawnExposuresMemberlyg:RMS1113Memberlyg:Stage1Member2022-12-310001160106lyg:RetailOtherMemberlyg:GrossDrawnExposuresMemberlyg:RMS1113Memberlyg:Stage2Member2022-12-310001160106lyg:RetailOtherMemberlyg:GrossDrawnExposuresMemberlyg:RMS1113Memberlyg:Stage3Member2022-12-310001160106lyg:PurchasedOrOriginatedCreditimpairedMemberlyg:RetailOtherMemberlyg:GrossDrawnExposuresMemberlyg:RMS1113Member2022-12-310001160106lyg:RetailOtherMemberlyg:GrossDrawnExposuresMemberlyg:RMS1113Member2022-12-310001160106lyg:RetailOtherMemberlyg:RMS1113Memberlyg:Stage1Memberlyg:ExpectedCreditLossesInRespectOfDrawnExposuresMember2022-12-310001160106lyg:RetailOtherMemberlyg:RMS1113Memberlyg:Stage2Memberlyg:ExpectedCreditLossesInRespectOfDrawnExposuresMember2022-12-310001160106lyg:RetailOtherMemberlyg:RMS1113Memberlyg:Stage3Memberlyg:ExpectedCreditLossesInRespectOfDrawnExposuresMember2022-12-310001160106lyg:PurchasedOrOriginatedCreditimpairedMemberlyg:RetailOtherMemberlyg:RMS1113Memberlyg:ExpectedCreditLossesInRespectOfDrawnExposuresMember2022-12-310001160106lyg:RetailOtherMemberlyg:RMS1113Memberlyg:ExpectedCreditLossesInRespectOfDrawnExposuresMember2022-12-310001160106lyg:RetailOtherMemberlyg:GrossDrawnExposuresMemberlyg:Stage1Memberlyg:RMS14Member2022-12-310001160106lyg:RetailOtherMemberlyg:GrossDrawnExposuresMemberlyg:RMS14Memberlyg:Stage2Member2022-12-310001160106lyg:RetailOtherMemberlyg:GrossDrawnExposuresMemberlyg:Stage3Memberlyg:RMS14Member2022-12-310001160106lyg:PurchasedOrOriginatedCreditimpairedMemberlyg:RetailOtherMemberlyg:GrossDrawnExposuresMemberlyg:RMS14Member2022-12-310001160106lyg:RetailOtherMemberlyg:GrossDrawnExposuresMemberlyg:RMS14Member2022-12-310001160106lyg:RetailOtherMemberlyg:Stage1Memberlyg:RMS14Memberlyg:ExpectedCreditLossesInRespectOfDrawnExposuresMember2022-12-310001160106lyg:RetailOtherMemberlyg:RMS14Memberlyg:Stage2Memberlyg:ExpectedCreditLossesInRespectOfDrawnExposuresMember2022-12-310001160106lyg:RetailOtherMemberlyg:Stage3Memberlyg:RMS14Memberlyg:ExpectedCreditLossesInRespectOfDrawnExposuresMember2022-12-310001160106lyg:PurchasedOrOriginatedCreditimpairedMemberlyg:RetailOtherMemberlyg:RMS14Memberlyg:ExpectedCreditLossesInRespectOfDrawnExposuresMember2022-12-310001160106lyg:RetailOtherMemberlyg:RMS14Memberlyg:ExpectedCreditLossesInRespectOfDrawnExposuresMember2022-12-310001160106lyg:RetailOtherMemberlyg:GrossDrawnExposuresMemberlyg:Stage1Member2022-12-310001160106lyg:RetailOtherMemberlyg:GrossDrawnExposuresMemberlyg:Stage2Member2022-12-310001160106lyg:RetailOtherMemberlyg:GrossDrawnExposuresMemberlyg:Stage3Member2022-12-310001160106lyg:PurchasedOrOriginatedCreditimpairedMemberlyg:RetailOtherMemberlyg:GrossDrawnExposuresMember2022-12-310001160106lyg:RetailOtherMemberlyg:GrossDrawnExposuresMember2022-12-310001160106lyg:RetailOtherMemberlyg:Stage1Memberlyg:ExpectedCreditLossesInRespectOfDrawnExposuresMember2022-12-310001160106lyg:RetailOtherMemberlyg:Stage2Memberlyg:ExpectedCreditLossesInRespectOfDrawnExposuresMember2022-12-310001160106lyg:RetailOtherMemberlyg:Stage3Memberlyg:ExpectedCreditLossesInRespectOfDrawnExposuresMember2022-12-310001160106lyg:PurchasedOrOriginatedCreditimpairedMemberlyg:RetailOtherMemberlyg:ExpectedCreditLossesInRespectOfDrawnExposuresMember2022-12-310001160106lyg:RetailOtherMemberlyg:ExpectedCreditLossesInRespectOfDrawnExposuresMember2022-12-310001160106lyg:GrossDrawnExposuresMemberlyg:Stage1Memberlyg:Retail1Member2022-12-310001160106lyg:GrossDrawnExposuresMemberlyg:Stage2Memberlyg:Retail1Member2022-12-310001160106lyg:GrossDrawnExposuresMemberlyg:Stage3Memberlyg:Retail1Member2022-12-310001160106lyg:PurchasedOrOriginatedCreditimpairedMemberlyg:GrossDrawnExposuresMemberlyg:Retail1Member2022-12-310001160106lyg:GrossDrawnExposuresMemberlyg:Retail1Member2022-12-310001160106lyg:Stage1Memberlyg:ExpectedCreditLossesInRespectOfDrawnExposuresMemberlyg:Retail1Member2022-12-310001160106lyg:Stage2Memberlyg:ExpectedCreditLossesInRespectOfDrawnExposuresMemberlyg:Retail1Member2022-12-310001160106lyg:Stage3Memberlyg:ExpectedCreditLossesInRespectOfDrawnExposuresMemberlyg:Retail1Member2022-12-310001160106lyg:PurchasedOrOriginatedCreditimpairedMemberlyg:ExpectedCreditLossesInRespectOfDrawnExposuresMemberlyg:Retail1Member2022-12-310001160106lyg:ExpectedCreditLossesInRespectOfDrawnExposuresMemberlyg:Retail1Member2022-12-310001160106lyg:GrossDrawnExposuresMemberlyg:CMS15Memberlyg:Stage1Memberlyg:CommercialMember2022-12-310001160106lyg:GrossDrawnExposuresMemberlyg:CMS15Memberlyg:CommercialMemberlyg:Stage2Member2022-12-310001160106lyg:GrossDrawnExposuresMemberlyg:Stage3Memberlyg:CMS15Memberlyg:CommercialMember2022-12-310001160106lyg:PurchasedOrOriginatedCreditimpairedMemberlyg:GrossDrawnExposuresMemberlyg:CMS15Memberlyg:CommercialMember2022-12-310001160106lyg:GrossDrawnExposuresMemberlyg:CMS15Memberlyg:CommercialMember2022-12-310001160106lyg:CMS15Memberlyg:Stage1Memberlyg:CommercialMemberlyg:ExpectedCreditLossesInRespectOfDrawnExposuresMember2022-12-310001160106lyg:CMS15Memberlyg:CommercialMemberlyg:Stage2Memberlyg:ExpectedCreditLossesInRespectOfDrawnExposuresMember2022-12-310001160106lyg:Stage3Memberlyg:CMS15Memberlyg:CommercialMemberlyg:ExpectedCreditLossesInRespectOfDrawnExposuresMember2022-12-310001160106lyg:PurchasedOrOriginatedCreditimpairedMemberlyg:CMS15Memberlyg:CommercialMemberlyg:ExpectedCreditLossesInRespectOfDrawnExposuresMember2022-12-310001160106lyg:CMS15Memberlyg:CommercialMemberlyg:ExpectedCreditLossesInRespectOfDrawnExposuresMember2022-12-310001160106lyg:GrossDrawnExposuresMemberlyg:CMS610Memberlyg:Stage1Memberlyg:CommercialMember2022-12-310001160106lyg:GrossDrawnExposuresMemberlyg:CMS610Memberlyg:CommercialMemberlyg:Stage2Member2022-12-310001160106lyg:GrossDrawnExposuresMemberlyg:Stage3Memberlyg:CMS610Memberlyg:CommercialMember2022-12-310001160106lyg:PurchasedOrOriginatedCreditimpairedMemberlyg:GrossDrawnExposuresMemberlyg:CMS610Memberlyg:CommercialMember2022-12-310001160106lyg:GrossDrawnExposuresMemberlyg:CMS610Memberlyg:CommercialMember2022-12-310001160106lyg:CMS610Memberlyg:Stage1Memberlyg:CommercialMemberlyg:ExpectedCreditLossesInRespectOfDrawnExposuresMember2022-12-310001160106lyg:CMS610Memberlyg:CommercialMemberlyg:Stage2Memberlyg:ExpectedCreditLossesInRespectOfDrawnExposuresMember2022-12-310001160106lyg:Stage3Memberlyg:CMS610Memberlyg:CommercialMemberlyg:ExpectedCreditLossesInRespectOfDrawnExposuresMember2022-12-310001160106lyg:PurchasedOrOriginatedCreditimpairedMemberlyg:CMS610Memberlyg:CommercialMemberlyg:ExpectedCreditLossesInRespectOfDrawnExposuresMember2022-12-310001160106lyg:CMS610Memberlyg:CommercialMemberlyg:ExpectedCreditLossesInRespectOfDrawnExposuresMember2022-12-310001160106lyg:GrossDrawnExposuresMemberlyg:Stage1Memberlyg:CMS1114Memberlyg:CommercialMember2022-12-310001160106lyg:GrossDrawnExposuresMemberlyg:CMS1114Memberlyg:CommercialMemberlyg:Stage2Member2022-12-310001160106lyg:GrossDrawnExposuresMemberlyg:Stage3Memberlyg:CMS1114Memberlyg:CommercialMember2022-12-310001160106lyg:PurchasedOrOriginatedCreditimpairedMemberlyg:GrossDrawnExposuresMemberlyg:CMS1114Memberlyg:CommercialMember2022-12-310001160106lyg:GrossDrawnExposuresMemberlyg:CMS1114Memberlyg:CommercialMember2022-12-310001160106lyg:Stage1Memberlyg:CMS1114Memberlyg:CommercialMemberlyg:ExpectedCreditLossesInRespectOfDrawnExposuresMember2022-12-310001160106lyg:CMS1114Memberlyg:CommercialMemberlyg:Stage2Memberlyg:ExpectedCreditLossesInRespectOfDrawnExposuresMember2022-12-310001160106lyg:Stage3Memberlyg:CMS1114Memberlyg:CommercialMemberlyg:ExpectedCreditLossesInRespectOfDrawnExposuresMember2022-12-310001160106lyg:PurchasedOrOriginatedCreditimpairedMemberlyg:CMS1114Memberlyg:CommercialMemberlyg:ExpectedCreditLossesInRespectOfDrawnExposuresMember2022-12-310001160106lyg:CMS1114Memberlyg:CommercialMemberlyg:ExpectedCreditLossesInRespectOfDrawnExposuresMember2022-12-310001160106lyg:CMS1518Memberlyg:GrossDrawnExposuresMemberlyg:Stage1Memberlyg:CommercialMember2022-12-310001160106lyg:CMS1518Memberlyg:GrossDrawnExposuresMemberlyg:CommercialMemberlyg:Stage2Member2022-12-310001160106lyg:CMS1518Memberlyg:GrossDrawnExposuresMemberlyg:Stage3Memberlyg:CommercialMember2022-12-310001160106lyg:CMS1518Memberlyg:PurchasedOrOriginatedCreditimpairedMemberlyg:GrossDrawnExposuresMemberlyg:CommercialMember2022-12-310001160106lyg:CMS1518Memberlyg:GrossDrawnExposuresMemberlyg:CommercialMember2022-12-310001160106lyg:CMS1518Memberlyg:Stage1Memberlyg:CommercialMemberlyg:ExpectedCreditLossesInRespectOfDrawnExposuresMember2022-12-310001160106lyg:CMS1518Memberlyg:CommercialMemberlyg:Stage2Memberlyg:ExpectedCreditLossesInRespectOfDrawnExposuresMember2022-12-310001160106lyg:CMS1518Memberlyg:Stage3Memberlyg:CommercialMemberlyg:ExpectedCreditLossesInRespectOfDrawnExposuresMember2022-12-310001160106lyg:CMS1518Memberlyg:PurchasedOrOriginatedCreditimpairedMemberlyg:CommercialMemberlyg:ExpectedCreditLossesInRespectOfDrawnExposuresMember2022-12-310001160106lyg:CMS1518Memberlyg:CommercialMemberlyg:ExpectedCreditLossesInRespectOfDrawnExposuresMember2022-12-310001160106lyg:GrossDrawnExposuresMemberlyg:CMS19Memberlyg:Stage1Memberlyg:CommercialMember2022-12-310001160106lyg:GrossDrawnExposuresMemberlyg:CMS19Memberlyg:CommercialMemberlyg:Stage2Member2022-12-310001160106lyg:GrossDrawnExposuresMemberlyg:Stage3Memberlyg:CMS19Memberlyg:CommercialMember2022-12-310001160106lyg:PurchasedOrOriginatedCreditimpairedMemberlyg:GrossDrawnExposuresMemberlyg:CMS19Memberlyg:CommercialMember2022-12-310001160106lyg:GrossDrawnExposuresMemberlyg:CMS19Memberlyg:CommercialMember2022-12-310001160106lyg:CMS19Memberlyg:Stage1Memberlyg:CommercialMemberlyg:ExpectedCreditLossesInRespectOfDrawnExposuresMember2022-12-310001160106lyg:CMS19Memberlyg:CommercialMemberlyg:Stage2Memberlyg:ExpectedCreditLossesInRespectOfDrawnExposuresMember2022-12-310001160106lyg:Stage3Memberlyg:CMS19Memberlyg:CommercialMemberlyg:ExpectedCreditLossesInRespectOfDrawnExposuresMember2022-12-310001160106lyg:PurchasedOrOriginatedCreditimpairedMemberlyg:CMS19Memberlyg:CommercialMemberlyg:ExpectedCreditLossesInRespectOfDrawnExposuresMember2022-12-310001160106lyg:CMS19Memberlyg:CommercialMemberlyg:ExpectedCreditLossesInRespectOfDrawnExposuresMember2022-12-310001160106lyg:GrossDrawnExposuresMemberlyg:Stage1Memberlyg:CMS2023Memberlyg:CommercialMember2022-12-310001160106lyg:GrossDrawnExposuresMemberlyg:CMS2023Memberlyg:CommercialMemberlyg:Stage2Member2022-12-310001160106lyg:GrossDrawnExposuresMemberlyg:Stage3Memberlyg:CMS2023Memberlyg:CommercialMember2022-12-310001160106lyg:PurchasedOrOriginatedCreditimpairedMemberlyg:GrossDrawnExposuresMemberlyg:CMS2023Memberlyg:CommercialMember2022-12-310001160106lyg:GrossDrawnExposuresMemberlyg:CMS2023Memberlyg:CommercialMember2022-12-310001160106lyg:Stage1Memberlyg:CMS2023Memberlyg:CommercialMemberlyg:ExpectedCreditLossesInRespectOfDrawnExposuresMember2022-12-310001160106lyg:CMS2023Memberlyg:CommercialMemberlyg:Stage2Memberlyg:ExpectedCreditLossesInRespectOfDrawnExposuresMember2022-12-310001160106lyg:Stage3Memberlyg:CMS2023Memberlyg:CommercialMemberlyg:ExpectedCreditLossesInRespectOfDrawnExposuresMember2022-12-310001160106lyg:PurchasedOrOriginatedCreditimpairedMemberlyg:CMS2023Memberlyg:CommercialMemberlyg:ExpectedCreditLossesInRespectOfDrawnExposuresMember2022-12-310001160106lyg:CMS2023Memberlyg:CommercialMemberlyg:ExpectedCreditLossesInRespectOfDrawnExposuresMember2022-12-310001160106lyg:GrossDrawnExposuresMemberlyg:Stage1Memberlyg:CommercialMember2022-12-310001160106lyg:GrossDrawnExposuresMemberlyg:CommercialMemberlyg:Stage2Member2022-12-310001160106lyg:GrossDrawnExposuresMemberlyg:Stage3Memberlyg:CommercialMember2022-12-310001160106lyg:PurchasedOrOriginatedCreditimpairedMemberlyg:GrossDrawnExposuresMemberlyg:CommercialMember2022-12-310001160106lyg:GrossDrawnExposuresMemberlyg:CommercialMember2022-12-310001160106lyg:Stage1Memberlyg:CommercialMemberlyg:ExpectedCreditLossesInRespectOfDrawnExposuresMember2022-12-310001160106lyg:CommercialMemberlyg:Stage2Memberlyg:ExpectedCreditLossesInRespectOfDrawnExposuresMember2022-12-310001160106lyg:Stage3Memberlyg:CommercialMemberlyg:ExpectedCreditLossesInRespectOfDrawnExposuresMember2022-12-310001160106lyg:PurchasedOrOriginatedCreditimpairedMemberlyg:CommercialMemberlyg:ExpectedCreditLossesInRespectOfDrawnExposuresMember2022-12-310001160106lyg:CommercialMemberlyg:ExpectedCreditLossesInRespectOfDrawnExposuresMember2022-12-310001160106lyg:GrossDrawnExposuresMemberlyg:Stage1Memberlyg:OtherMember2022-12-310001160106lyg:GrossDrawnExposuresMemberlyg:OtherMemberlyg:Stage2Member2022-12-310001160106lyg:GrossDrawnExposuresMemberlyg:Stage3Memberlyg:OtherMember2022-12-310001160106lyg:PurchasedOrOriginatedCreditimpairedMemberlyg:GrossDrawnExposuresMemberlyg:OtherMember2022-12-310001160106lyg:GrossDrawnExposuresMemberlyg:OtherMember2022-12-310001160106lyg:Stage1Memberlyg:OtherMemberlyg:ExpectedCreditLossesInRespectOfDrawnExposuresMember2022-12-310001160106lyg:OtherMemberlyg:Stage2Memberlyg:ExpectedCreditLossesInRespectOfDrawnExposuresMember2022-12-310001160106lyg:Stage3Memberlyg:OtherMemberlyg:ExpectedCreditLossesInRespectOfDrawnExposuresMember2022-12-310001160106lyg:PurchasedOrOriginatedCreditimpairedMemberlyg:OtherMemberlyg:ExpectedCreditLossesInRespectOfDrawnExposuresMember2022-12-310001160106lyg:OtherMemberlyg:ExpectedCreditLossesInRespectOfDrawnExposuresMember2022-12-310001160106lyg:GrossDrawnExposuresMemberlyg:Stage1Member2022-12-310001160106lyg:GrossDrawnExposuresMemberlyg:Stage2Member2022-12-310001160106lyg:GrossDrawnExposuresMemberlyg:Stage3Member2022-12-310001160106lyg:PurchasedOrOriginatedCreditimpairedMemberlyg:GrossDrawnExposuresMember2022-12-310001160106lyg:GrossDrawnExposuresMember2022-12-310001160106lyg:Stage1Memberlyg:ExpectedCreditLossesInRespectOfDrawnExposuresMember2022-12-310001160106lyg:Stage2Memberlyg:ExpectedCreditLossesInRespectOfDrawnExposuresMember2022-12-310001160106lyg:Stage3Memberlyg:ExpectedCreditLossesInRespectOfDrawnExposuresMember2022-12-310001160106lyg:PurchasedOrOriginatedCreditimpairedMemberlyg:ExpectedCreditLossesInRespectOfDrawnExposuresMember2022-12-310001160106lyg:ExpectedCreditLossesInRespectOfDrawnExposuresMember2022-12-310001160106lyg:RetailMortgagesMemberlyg:Stage1Member2023-01-012023-12-310001160106lyg:RetailMortgagesMemberlyg:Stage2Member2023-01-012023-12-310001160106lyg:RetailMortgagesMemberlyg:Stage1Member2022-01-012022-12-310001160106lyg:RetailMortgagesMemberlyg:Stage2Member2022-01-012022-12-310001160106lyg:RetailCreditCardsMemberlyg:Stage1Member2023-01-012023-12-310001160106lyg:RetailCreditCardsMemberlyg:Stage2Member2023-01-012023-12-310001160106lyg:RetailCreditCardsMemberlyg:Stage1Member2022-01-012022-12-310001160106lyg:RetailCreditCardsMemberlyg:Stage2Member2022-01-012022-12-310001160106lyg:RetailLoansAndOverdraftsMemberlyg:Stage1Member2023-01-012023-12-310001160106lyg:RetailLoansAndOverdraftsMemberlyg:Stage2Member2023-01-012023-12-310001160106lyg:RetailLoansAndOverdraftsMemberlyg:Stage1Member2022-01-012022-12-310001160106lyg:RetailLoansAndOverdraftsMemberlyg:Stage2Member2022-01-012022-12-310001160106lyg:RetailUKMotorFinanceMemberlyg:Stage1Member2023-01-012023-12-310001160106lyg:RetailUKMotorFinanceMemberlyg:Stage2Member2023-01-012023-12-310001160106lyg:RetailUKMotorFinanceMemberlyg:Stage1Member2022-01-012022-12-310001160106lyg:RetailUKMotorFinanceMemberlyg:Stage2Member2022-01-012022-12-310001160106lyg:Stage1Memberlyg:CommercialMember2023-01-012023-12-310001160106lyg:CommercialMemberlyg:Stage2Member2023-01-012023-12-310001160106lyg:Stage1Memberlyg:CommercialMember2022-01-012022-12-310001160106lyg:CommercialMemberlyg:Stage2Member2022-01-012022-12-310001160106lyg:InvestmentGradeMember2023-12-310001160106lyg:InvestmentGradeMember2022-12-310001160106lyg:SubInvestmentGradeMember2023-12-310001160106lyg:SubInvestmentGradeMember2022-12-310001160106lyg:NotRatedMember2023-12-310001160106lyg:NotRatedMember2022-12-310001160106ifrs-full:FinancialAssetsAvailableforsaleCategoryMemberlyg:ExcludingEquityShareMember2023-12-310001160106ifrs-full:FinancialAssetsAvailableforsaleCategoryMemberlyg:ExcludingEquityShareMember2022-12-310001160106lyg:InvestmentGradeMemberlyg:TradingAndOtherMember2023-12-310001160106lyg:OtherMemberlyg:TradingAndOtherMember2023-12-310001160106lyg:TradingAndOtherMember2023-12-310001160106lyg:InvestmentGradeMemberlyg:TradingAndOtherMember2022-12-310001160106lyg:OtherMemberlyg:TradingAndOtherMember2022-12-310001160106lyg:TradingAndOtherMember2022-12-310001160106lyg:InvestmentGradeMemberlyg:HedgingMember2023-12-310001160106lyg:OtherMemberlyg:HedgingMember2023-12-310001160106lyg:HedgingMember2023-12-310001160106lyg:InvestmentGradeMemberlyg:HedgingMember2022-12-310001160106lyg:OtherMemberlyg:HedgingMember2022-12-310001160106lyg:HedgingMember2022-12-310001160106lyg:OtherMember2023-12-310001160106lyg:OtherMember2022-12-310001160106lyg:GrossUndrawnExposuresMemberlyg:RMS13Memberlyg:RetailMortgagesMemberlyg:Stage1Member2023-12-310001160106lyg:GrossUndrawnExposuresMemberlyg:RMS13Memberlyg:RetailMortgagesMemberlyg:Stage2Member2023-12-310001160106lyg:GrossUndrawnExposuresMemberlyg:RMS13Memberlyg:RetailMortgagesMemberlyg:Stage3Member2023-12-310001160106lyg:GrossUndrawnExposuresMemberlyg:RMS13Memberlyg:PurchasedOrOriginatedCreditimpairedMemberlyg:RetailMortgagesMember2023-12-310001160106lyg:GrossUndrawnExposuresMemberlyg:RMS13Memberlyg:RetailMortgagesMember2023-12-310001160106lyg:RMS13Memberlyg:RetailMortgagesMemberlyg:Stage1Memberlyg:ExpectedCreditLossesInRespectOfUndrawnExposuresMember2023-12-310001160106lyg:RMS13Memberlyg:RetailMortgagesMemberlyg:ExpectedCreditLossesInRespectOfUndrawnExposuresMemberlyg:Stage2Member2023-12-310001160106lyg:RMS13Memberlyg:RetailMortgagesMemberlyg:Stage3Memberlyg:ExpectedCreditLossesInRespectOfUndrawnExposuresMember2023-12-310001160106lyg:RMS13Memberlyg:PurchasedOrOriginatedCreditimpairedMemberlyg:RetailMortgagesMemberlyg:ExpectedCreditLossesInRespectOfUndrawnExposuresMember2023-12-310001160106lyg:RMS13Memberlyg:RetailMortgagesMemberlyg:ExpectedCreditLossesInRespectOfUndrawnExposuresMember2023-12-310001160106lyg:GrossUndrawnExposuresMemberlyg:RMS46Memberlyg:RetailMortgagesMemberlyg:Stage1Member2023-12-310001160106lyg:GrossUndrawnExposuresMemberlyg:RMS46Memberlyg:RetailMortgagesMemberlyg:Stage2Member2023-12-310001160106lyg:GrossUndrawnExposuresMemberlyg:RMS46Memberlyg:RetailMortgagesMemberlyg:Stage3Member2023-12-310001160106lyg:GrossUndrawnExposuresMemberlyg:RMS46Memberlyg:PurchasedOrOriginatedCreditimpairedMemberlyg:RetailMortgagesMember2023-12-310001160106lyg:GrossUndrawnExposuresMemberlyg:RMS46Memberlyg:RetailMortgagesMember2023-12-310001160106lyg:RMS46Memberlyg:RetailMortgagesMemberlyg:Stage1Memberlyg:ExpectedCreditLossesInRespectOfUndrawnExposuresMember2023-12-310001160106lyg:RMS46Memberlyg:RetailMortgagesMemberlyg:ExpectedCreditLossesInRespectOfUndrawnExposuresMemberlyg:Stage2Member2023-12-310001160106lyg:RMS46Memberlyg:RetailMortgagesMemberlyg:Stage3Memberlyg:ExpectedCreditLossesInRespectOfUndrawnExposuresMember2023-12-310001160106lyg:RMS46Memberlyg:PurchasedOrOriginatedCreditimpairedMemberlyg:RetailMortgagesMemberlyg:ExpectedCreditLossesInRespectOfUndrawnExposuresMember2023-12-310001160106lyg:RMS46Memberlyg:RetailMortgagesMemberlyg:ExpectedCreditLossesInRespectOfUndrawnExposuresMember2023-12-310001160106lyg:GrossUndrawnExposuresMemberlyg:RetailMortgagesMemberlyg:Stage1Memberlyg:RMS79Member2023-12-310001160106lyg:GrossUndrawnExposuresMemberlyg:RetailMortgagesMemberlyg:RMS79Memberlyg:Stage2Member2023-12-310001160106lyg:GrossUndrawnExposuresMemberlyg:RetailMortgagesMemberlyg:Stage3Memberlyg:RMS79Member2023-12-310001160106lyg:GrossUndrawnExposuresMemberlyg:PurchasedOrOriginatedCreditimpairedMemberlyg:RetailMortgagesMemberlyg:RMS79Member2023-12-310001160106lyg:GrossUndrawnExposuresMemberlyg:RetailMortgagesMemberlyg:RMS79Member2023-12-310001160106lyg:RetailMortgagesMemberlyg:Stage1Memberlyg:RMS79Memberlyg:ExpectedCreditLossesInRespectOfUndrawnExposuresMember2023-12-310001160106lyg:RetailMortgagesMemberlyg:RMS79Memberlyg:ExpectedCreditLossesInRespectOfUndrawnExposuresMemberlyg:Stage2Member2023-12-310001160106lyg:RetailMortgagesMemberlyg:Stage3Memberlyg:RMS79Memberlyg:ExpectedCreditLossesInRespectOfUndrawnExposuresMember2023-12-310001160106lyg:PurchasedOrOriginatedCreditimpairedMemberlyg:RetailMortgagesMemberlyg:RMS79Memberlyg:ExpectedCreditLossesInRespectOfUndrawnExposuresMember2023-12-310001160106lyg:RetailMortgagesMemberlyg:RMS79Memberlyg:ExpectedCreditLossesInRespectOfUndrawnExposuresMember2023-12-310001160106lyg:GrossUndrawnExposuresMemberlyg:RetailMortgagesMemberlyg:Stage1Memberlyg:RMS10Member2023-12-310001160106lyg:GrossUndrawnExposuresMemberlyg:RetailMortgagesMemberlyg:RMS10Memberlyg:Stage2Member2023-12-310001160106lyg:GrossUndrawnExposuresMemberlyg:RetailMortgagesMemberlyg:Stage3Memberlyg:RMS10Member2023-12-310001160106lyg:GrossUndrawnExposuresMemberlyg:PurchasedOrOriginatedCreditimpairedMemberlyg:RetailMortgagesMemberlyg:RMS10Member2023-12-310001160106lyg:GrossUndrawnExposuresMemberlyg:RetailMortgagesMemberlyg:RMS10Member2023-12-310001160106lyg:RetailMortgagesMemberlyg:Stage1Memberlyg:ExpectedCreditLossesInRespectOfUndrawnExposuresMemberlyg:RMS10Member2023-12-310001160106lyg:RetailMortgagesMemberlyg:ExpectedCreditLossesInRespectOfUndrawnExposuresMemberlyg:RMS10Memberlyg:Stage2Member2023-12-310001160106lyg:RetailMortgagesMemberlyg:Stage3Memberlyg:ExpectedCreditLossesInRespectOfUndrawnExposuresMemberlyg:RMS10Member2023-12-310001160106lyg:PurchasedOrOriginatedCreditimpairedMemberlyg:RetailMortgagesMemberlyg:ExpectedCreditLossesInRespectOfUndrawnExposuresMemberlyg:RMS10Member2023-12-310001160106lyg:RetailMortgagesMemberlyg:ExpectedCreditLossesInRespectOfUndrawnExposuresMemberlyg:RMS10Member2023-12-310001160106lyg:GrossUndrawnExposuresMemberlyg:RetailMortgagesMemberlyg:RMS1113Memberlyg:Stage1Member2023-12-310001160106lyg:GrossUndrawnExposuresMemberlyg:RetailMortgagesMemberlyg:RMS1113Memberlyg:Stage2Member2023-12-310001160106lyg:GrossUndrawnExposuresMemberlyg:RetailMortgagesMemberlyg:RMS1113Memberlyg:Stage3Member2023-12-310001160106lyg:GrossUndrawnExposuresMemberlyg:PurchasedOrOriginatedCreditimpairedMemberlyg:RetailMortgagesMemberlyg:RMS1113Member2023-12-310001160106lyg:GrossUndrawnExposuresMemberlyg:RetailMortgagesMemberlyg:RMS1113Member2023-12-310001160106lyg:RetailMortgagesMemberlyg:RMS1113Memberlyg:Stage1Memberlyg:ExpectedCreditLossesInRespectOfUndrawnExposuresMember2023-12-310001160106lyg:RetailMortgagesMemberlyg:RMS1113Memberlyg:ExpectedCreditLossesInRespectOfUndrawnExposuresMemberlyg:Stage2Member2023-12-310001160106lyg:RetailMortgagesMemberlyg:RMS1113Memberlyg:Stage3Memberlyg:ExpectedCreditLossesInRespectOfUndrawnExposuresMember2023-12-310001160106lyg:PurchasedOrOriginatedCreditimpairedMemberlyg:RetailMortgagesMemberlyg:RMS1113Memberlyg:ExpectedCreditLossesInRespectOfUndrawnExposuresMember2023-12-310001160106lyg:RetailMortgagesMemberlyg:RMS1113Memberlyg:ExpectedCreditLossesInRespectOfUndrawnExposuresMember2023-12-310001160106lyg:GrossUndrawnExposuresMemberlyg:RetailMortgagesMemberlyg:Stage1Memberlyg:RMS14Member2023-12-310001160106lyg:GrossUndrawnExposuresMemberlyg:RetailMortgagesMemberlyg:RMS14Memberlyg:Stage2Member2023-12-310001160106lyg:GrossUndrawnExposuresMemberlyg:RetailMortgagesMemberlyg:Stage3Memberlyg:RMS14Member2023-12-310001160106lyg:GrossUndrawnExposuresMemberlyg:PurchasedOrOriginatedCreditimpairedMemberlyg:RetailMortgagesMemberlyg:RMS14Member2023-12-310001160106lyg:GrossUndrawnExposuresMemberlyg:RetailMortgagesMemberlyg:RMS14Member2023-12-310001160106lyg:RetailMortgagesMemberlyg:Stage1Memberlyg:RMS14Memberlyg:ExpectedCreditLossesInRespectOfUndrawnExposuresMember2023-12-310001160106lyg:RetailMortgagesMemberlyg:RMS14Memberlyg:ExpectedCreditLossesInRespectOfUndrawnExposuresMemberlyg:Stage2Member2023-12-310001160106lyg:RetailMortgagesMemberlyg:Stage3Memberlyg:RMS14Memberlyg:ExpectedCreditLossesInRespectOfUndrawnExposuresMember2023-12-310001160106lyg:PurchasedOrOriginatedCreditimpairedMemberlyg:RetailMortgagesMemberlyg:RMS14Memberlyg:ExpectedCreditLossesInRespectOfUndrawnExposuresMember2023-12-310001160106lyg:RetailMortgagesMemberlyg:RMS14Memberlyg:ExpectedCreditLossesInRespectOfUndrawnExposuresMember2023-12-310001160106lyg:GrossUndrawnExposuresMemberlyg:RetailMortgagesMemberlyg:Stage1Member2023-12-310001160106lyg:GrossUndrawnExposuresMemberlyg:RetailMortgagesMemberlyg:Stage2Member2023-12-310001160106lyg:GrossUndrawnExposuresMemberlyg:RetailMortgagesMemberlyg:Stage3Member2023-12-310001160106lyg:GrossUndrawnExposuresMemberlyg:PurchasedOrOriginatedCreditimpairedMemberlyg:RetailMortgagesMember2023-12-310001160106lyg:GrossUndrawnExposuresMemberlyg:RetailMortgagesMember2023-12-310001160106lyg:RetailMortgagesMemberlyg:Stage1Memberlyg:ExpectedCreditLossesInRespectOfUndrawnExposuresMember2023-12-310001160106lyg:RetailMortgagesMemberlyg:ExpectedCreditLossesInRespectOfUndrawnExposuresMemberlyg:Stage2Member2023-12-310001160106lyg:RetailMortgagesMemberlyg:Stage3Memberlyg:ExpectedCreditLossesInRespectOfUndrawnExposuresMember2023-12-310001160106lyg:PurchasedOrOriginatedCreditimpairedMemberlyg:RetailMortgagesMemberlyg:ExpectedCreditLossesInRespectOfUndrawnExposuresMember2023-12-310001160106lyg:RetailMortgagesMemberlyg:ExpectedCreditLossesInRespectOfUndrawnExposuresMember2023-12-310001160106lyg:GrossUndrawnExposuresMemberlyg:RMS13Memberlyg:RetailCreditCardsMemberlyg:Stage1Member2023-12-310001160106lyg:GrossUndrawnExposuresMemberlyg:RMS13Memberlyg:RetailCreditCardsMemberlyg:Stage2Member2023-12-310001160106lyg:GrossUndrawnExposuresMemberlyg:RMS13Memberlyg:RetailCreditCardsMemberlyg:Stage3Member2023-12-310001160106lyg:GrossUndrawnExposuresMemberlyg:RMS13Memberlyg:PurchasedOrOriginatedCreditimpairedMemberlyg:RetailCreditCardsMember2023-12-310001160106lyg:GrossUndrawnExposuresMemberlyg:RMS13Memberlyg:RetailCreditCardsMember2023-12-310001160106lyg:RMS13Memberlyg:RetailCreditCardsMemberlyg:Stage1Memberlyg:ExpectedCreditLossesInRespectOfUndrawnExposuresMember2023-12-310001160106lyg:RMS13Memberlyg:RetailCreditCardsMemberlyg:ExpectedCreditLossesInRespectOfUndrawnExposuresMemberlyg:Stage2Member2023-12-310001160106lyg:RMS13Memberlyg:RetailCreditCardsMemberlyg:Stage3Memberlyg:ExpectedCreditLossesInRespectOfUndrawnExposuresMember2023-12-310001160106lyg:RMS13Memberlyg:PurchasedOrOriginatedCreditimpairedMemberlyg:RetailCreditCardsMemberlyg:ExpectedCreditLossesInRespectOfUndrawnExposuresMember2023-12-310001160106lyg:RMS13Memberlyg:RetailCreditCardsMemberlyg:ExpectedCreditLossesInRespectOfUndrawnExposuresMember2023-12-310001160106lyg:GrossUndrawnExposuresMemberlyg:RMS46Memberlyg:RetailCreditCardsMemberlyg:Stage1Member2023-12-310001160106lyg:GrossUndrawnExposuresMemberlyg:RMS46Memberlyg:RetailCreditCardsMemberlyg:Stage2Member2023-12-310001160106lyg:GrossUndrawnExposuresMemberlyg:RMS46Memberlyg:RetailCreditCardsMemberlyg:Stage3Member2023-12-310001160106lyg:GrossUndrawnExposuresMemberlyg:RMS46Memberlyg:PurchasedOrOriginatedCreditimpairedMemberlyg:RetailCreditCardsMember2023-12-310001160106lyg:GrossUndrawnExposuresMemberlyg:RMS46Memberlyg:RetailCreditCardsMember2023-12-310001160106lyg:RMS46Memberlyg:RetailCreditCardsMemberlyg:Stage1Memberlyg:ExpectedCreditLossesInRespectOfUndrawnExposuresMember2023-12-310001160106lyg:RMS46Memberlyg:RetailCreditCardsMemberlyg:ExpectedCreditLossesInRespectOfUndrawnExposuresMemberlyg:Stage2Member2023-12-310001160106lyg:RMS46Memberlyg:RetailCreditCardsMemberlyg:Stage3Memberlyg:ExpectedCreditLossesInRespectOfUndrawnExposuresMember2023-12-310001160106lyg:RMS46Memberlyg:PurchasedOrOriginatedCreditimpairedMemberlyg:RetailCreditCardsMemberlyg:ExpectedCreditLossesInRespectOfUndrawnExposuresMember2023-12-310001160106lyg:RMS46Memberlyg:RetailCreditCardsMemberlyg:ExpectedCreditLossesInRespectOfUndrawnExposuresMember2023-12-310001160106lyg:GrossUndrawnExposuresMemberlyg:RetailCreditCardsMemberlyg:Stage1Memberlyg:RMS79Member2023-12-310001160106lyg:GrossUndrawnExposuresMemberlyg:RetailCreditCardsMemberlyg:RMS79Memberlyg:Stage2Member2023-12-310001160106lyg:GrossUndrawnExposuresMemberlyg:RetailCreditCardsMemberlyg:Stage3Memberlyg:RMS79Member2023-12-310001160106lyg:GrossUndrawnExposuresMemberlyg:PurchasedOrOriginatedCreditimpairedMemberlyg:RetailCreditCardsMemberlyg:RMS79Member2023-12-310001160106lyg:GrossUndrawnExposuresMemberlyg:RetailCreditCardsMemberlyg:RMS79Member2023-12-310001160106lyg:RetailCreditCardsMemberlyg:Stage1Memberlyg:RMS79Memberlyg:ExpectedCreditLossesInRespectOfUndrawnExposuresMember2023-12-310001160106lyg:RetailCreditCardsMemberlyg:RMS79Memberlyg:ExpectedCreditLossesInRespectOfUndrawnExposuresMemberlyg:Stage2Member2023-12-310001160106lyg:RetailCreditCardsMemberlyg:Stage3Memberlyg:RMS79Memberlyg:ExpectedCreditLossesInRespectOfUndrawnExposuresMember2023-12-310001160106lyg:PurchasedOrOriginatedCreditimpairedMemberlyg:RetailCreditCardsMemberlyg:RMS79Memberlyg:ExpectedCreditLossesInRespectOfUndrawnExposuresMember2023-12-310001160106lyg:RetailCreditCardsMemberlyg:RMS79Memberlyg:ExpectedCreditLossesInRespectOfUndrawnExposuresMember2023-12-310001160106lyg:GrossUndrawnExposuresMemberlyg:RetailCreditCardsMemberlyg:Stage1Memberlyg:RMS10Member2023-12-310001160106lyg:GrossUndrawnExposuresMemberlyg:RetailCreditCardsMemberlyg:RMS10Memberlyg:Stage2Member2023-12-310001160106lyg:GrossUndrawnExposuresMemberlyg:RetailCreditCardsMemberlyg:Stage3Memberlyg:RMS10Member2023-12-310001160106lyg:GrossUndrawnExposuresMemberlyg:PurchasedOrOriginatedCreditimpairedMemberlyg:RetailCreditCardsMemberlyg:RMS10Member2023-12-310001160106lyg:GrossUndrawnExposuresMemberlyg:RetailCreditCardsMemberlyg:RMS10Member2023-12-310001160106lyg:RetailCreditCardsMemberlyg:Stage1Memberlyg:ExpectedCreditLossesInRespectOfUndrawnExposuresMemberlyg:RMS10Member2023-12-310001160106lyg:RetailCreditCardsMemberlyg:ExpectedCreditLossesInRespectOfUndrawnExposuresMemberlyg:RMS10Memberlyg:Stage2Member2023-12-310001160106lyg:RetailCreditCardsMemberlyg:Stage3Memberlyg:ExpectedCreditLossesInRespectOfUndrawnExposuresMemberlyg:RMS10Member2023-12-310001160106lyg:PurchasedOrOriginatedCreditimpairedMemberlyg:RetailCreditCardsMemberlyg:ExpectedCreditLossesInRespectOfUndrawnExposuresMemberlyg:RMS10Member2023-12-310001160106lyg:RetailCreditCardsMemberlyg:ExpectedCreditLossesInRespectOfUndrawnExposuresMemberlyg:RMS10Member2023-12-310001160106lyg:GrossUndrawnExposuresMemberlyg:RetailCreditCardsMemberlyg:RMS1113Memberlyg:Stage1Member2023-12-310001160106lyg:GrossUndrawnExposuresMemberlyg:RetailCreditCardsMemberlyg:RMS1113Memberlyg:Stage2Member2023-12-310001160106lyg:GrossUndrawnExposuresMemberlyg:RetailCreditCardsMemberlyg:RMS1113Memberlyg:Stage3Member2023-12-310001160106lyg:GrossUndrawnExposuresMemberlyg:PurchasedOrOriginatedCreditimpairedMemberlyg:RetailCreditCardsMemberlyg:RMS1113Member2023-12-310001160106lyg:GrossUndrawnExposuresMemberlyg:RetailCreditCardsMemberlyg:RMS1113Member2023-12-310001160106lyg:RetailCreditCardsMemberlyg:RMS1113Memberlyg:Stage1Memberlyg:ExpectedCreditLossesInRespectOfUndrawnExposuresMember2023-12-310001160106lyg:RetailCreditCardsMemberlyg:RMS1113Memberlyg:ExpectedCreditLossesInRespectOfUndrawnExposuresMemberlyg:Stage2Member2023-12-310001160106lyg:RetailCreditCardsMemberlyg:RMS1113Memberlyg:Stage3Memberlyg:ExpectedCreditLossesInRespectOfUndrawnExposuresMember2023-12-310001160106lyg:PurchasedOrOriginatedCreditimpairedMemberlyg:RetailCreditCardsMemberlyg:RMS1113Memberlyg:ExpectedCreditLossesInRespectOfUndrawnExposuresMember2023-12-310001160106lyg:RetailCreditCardsMemberlyg:RMS1113Memberlyg:ExpectedCreditLossesInRespectOfUndrawnExposuresMember2023-12-310001160106lyg:GrossUndrawnExposuresMemberlyg:RetailCreditCardsMemberlyg:Stage1Memberlyg:RMS14Member2023-12-310001160106lyg:GrossUndrawnExposuresMemberlyg:RetailCreditCardsMemberlyg:RMS14Memberlyg:Stage2Member2023-12-310001160106lyg:GrossUndrawnExposuresMemberlyg:RetailCreditCardsMemberlyg:Stage3Memberlyg:RMS14Member2023-12-310001160106lyg:GrossUndrawnExposuresMemberlyg:PurchasedOrOriginatedCreditimpairedMemberlyg:RetailCreditCardsMemberlyg:RMS14Member2023-12-310001160106lyg:GrossUndrawnExposuresMemberlyg:RetailCreditCardsMemberlyg:RMS14Member2023-12-310001160106lyg:RetailCreditCardsMemberlyg:Stage1Memberlyg:RMS14Memberlyg:ExpectedCreditLossesInRespectOfUndrawnExposuresMember2023-12-310001160106lyg:RetailCreditCardsMemberlyg:RMS14Memberlyg:ExpectedCreditLossesInRespectOfUndrawnExposuresMemberlyg:Stage2Member2023-12-310001160106lyg:RetailCreditCardsMemberlyg:Stage3Memberlyg:RMS14Memberlyg:ExpectedCreditLossesInRespectOfUndrawnExposuresMember2023-12-310001160106lyg:PurchasedOrOriginatedCreditimpairedMemberlyg:RetailCreditCardsMemberlyg:RMS14Memberlyg:ExpectedCreditLossesInRespectOfUndrawnExposuresMember2023-12-310001160106lyg:RetailCreditCardsMemberlyg:RMS14Memberlyg:ExpectedCreditLossesInRespectOfUndrawnExposuresMember2023-12-310001160106lyg:GrossUndrawnExposuresMemberlyg:RetailCreditCardsMemberlyg:Stage1Member2023-12-310001160106lyg:GrossUndrawnExposuresMemberlyg:RetailCreditCardsMemberlyg:Stage2Member2023-12-310001160106lyg:GrossUndrawnExposuresMemberlyg:RetailCreditCardsMemberlyg:Stage3Member2023-12-310001160106lyg:GrossUndrawnExposuresMemberlyg:PurchasedOrOriginatedCreditimpairedMemberlyg:RetailCreditCardsMember2023-12-310001160106lyg:GrossUndrawnExposuresMemberlyg:RetailCreditCardsMember2023-12-310001160106lyg:RetailCreditCardsMemberlyg:Stage1Memberlyg:ExpectedCreditLossesInRespectOfUndrawnExposuresMember2023-12-310001160106lyg:RetailCreditCardsMemberlyg:ExpectedCreditLossesInRespectOfUndrawnExposuresMemberlyg:Stage2Member2023-12-310001160106lyg:RetailCreditCardsMemberlyg:Stage3Memberlyg:ExpectedCreditLossesInRespectOfUndrawnExposuresMember2023-12-310001160106lyg:PurchasedOrOriginatedCreditimpairedMemberlyg:RetailCreditCardsMemberlyg:ExpectedCreditLossesInRespectOfUndrawnExposuresMember2023-12-310001160106lyg:RetailCreditCardsMemberlyg:ExpectedCreditLossesInRespectOfUndrawnExposuresMember2023-12-310001160106lyg:GrossUndrawnExposuresMemberlyg:RetailLoansAndOverdraftsMemberlyg:RMS13Memberlyg:Stage1Member2023-12-310001160106lyg:GrossUndrawnExposuresMemberlyg:RetailLoansAndOverdraftsMemberlyg:RMS13Memberlyg:Stage2Member2023-12-310001160106lyg:GrossUndrawnExposuresMemberlyg:RetailLoansAndOverdraftsMemberlyg:RMS13Memberlyg:Stage3Member2023-12-310001160106lyg:GrossUndrawnExposuresMemberlyg:RetailLoansAndOverdraftsMemberlyg:RMS13Memberlyg:PurchasedOrOriginatedCreditimpairedMember2023-12-310001160106lyg:GrossUndrawnExposuresMemberlyg:RetailLoansAndOverdraftsMemberlyg:RMS13Member2023-12-310001160106lyg:RetailLoansAndOverdraftsMemberlyg:RMS13Memberlyg:Stage1Memberlyg:ExpectedCreditLossesInRespectOfUndrawnExposuresMember2023-12-310001160106lyg:RetailLoansAndOverdraftsMemberlyg:RMS13Memberlyg:ExpectedCreditLossesInRespectOfUndrawnExposuresMemberlyg:Stage2Member2023-12-310001160106lyg:RetailLoansAndOverdraftsMemberlyg:RMS13Memberlyg:Stage3Memberlyg:ExpectedCreditLossesInRespectOfUndrawnExposuresMember2023-12-310001160106lyg:RetailLoansAndOverdraftsMemberlyg:RMS13Memberlyg:PurchasedOrOriginatedCreditimpairedMemberlyg:ExpectedCreditLossesInRespectOfUndrawnExposuresMember2023-12-310001160106lyg:RetailLoansAndOverdraftsMemberlyg:RMS13Memberlyg:ExpectedCreditLossesInRespectOfUndrawnExposuresMember2023-12-310001160106lyg:GrossUndrawnExposuresMemberlyg:RetailLoansAndOverdraftsMemberlyg:RMS46Memberlyg:Stage1Member2023-12-310001160106lyg:GrossUndrawnExposuresMemberlyg:RetailLoansAndOverdraftsMemberlyg:RMS46Memberlyg:Stage2Member2023-12-310001160106lyg:GrossUndrawnExposuresMemberlyg:RetailLoansAndOverdraftsMemberlyg:RMS46Memberlyg:Stage3Member2023-12-310001160106lyg:GrossUndrawnExposuresMemberlyg:RetailLoansAndOverdraftsMemberlyg:RMS46Memberlyg:PurchasedOrOriginatedCreditimpairedMember2023-12-310001160106lyg:GrossUndrawnExposuresMemberlyg:RetailLoansAndOverdraftsMemberlyg:RMS46Member2023-12-310001160106lyg:RetailLoansAndOverdraftsMemberlyg:RMS46Memberlyg:Stage1Memberlyg:ExpectedCreditLossesInRespectOfUndrawnExposuresMember2023-12-310001160106lyg:RetailLoansAndOverdraftsMemberlyg:RMS46Memberlyg:ExpectedCreditLossesInRespectOfUndrawnExposuresMemberlyg:Stage2Member2023-12-310001160106lyg:RetailLoansAndOverdraftsMemberlyg:RMS46Memberlyg:Stage3Memberlyg:ExpectedCreditLossesInRespectOfUndrawnExposuresMember2023-12-310001160106lyg:RetailLoansAndOverdraftsMemberlyg:RMS46Memberlyg:PurchasedOrOriginatedCreditimpairedMemberlyg:ExpectedCreditLossesInRespectOfUndrawnExposuresMember2023-12-310001160106lyg:RetailLoansAndOverdraftsMemberlyg:RMS46Memberlyg:ExpectedCreditLossesInRespectOfUndrawnExposuresMember2023-12-310001160106lyg:GrossUndrawnExposuresMemberlyg:RetailLoansAndOverdraftsMemberlyg:Stage1Memberlyg:RMS79Member2023-12-310001160106lyg:GrossUndrawnExposuresMemberlyg:RetailLoansAndOverdraftsMemberlyg:RMS79Memberlyg:Stage2Member2023-12-310001160106lyg:GrossUndrawnExposuresMemberlyg:RetailLoansAndOverdraftsMemberlyg:Stage3Memberlyg:RMS79Member2023-12-310001160106lyg:GrossUndrawnExposuresMemberlyg:RetailLoansAndOverdraftsMemberlyg:PurchasedOrOriginatedCreditimpairedMemberlyg:RMS79Member2023-12-310001160106lyg:GrossUndrawnExposuresMemberlyg:RetailLoansAndOverdraftsMemberlyg:RMS79Member2023-12-310001160106lyg:RetailLoansAndOverdraftsMemberlyg:Stage1Memberlyg:RMS79Memberlyg:ExpectedCreditLossesInRespectOfUndrawnExposuresMember2023-12-310001160106lyg:RetailLoansAndOverdraftsMemberlyg:RMS79Memberlyg:ExpectedCreditLossesInRespectOfUndrawnExposuresMemberlyg:Stage2Member2023-12-310001160106lyg:RetailLoansAndOverdraftsMemberlyg:Stage3Memberlyg:RMS79Memberlyg:ExpectedCreditLossesInRespectOfUndrawnExposuresMember2023-12-310001160106lyg:RetailLoansAndOverdraftsMemberlyg:PurchasedOrOriginatedCreditimpairedMemberlyg:RMS79Memberlyg:ExpectedCreditLossesInRespectOfUndrawnExposuresMember2023-12-310001160106lyg:RetailLoansAndOverdraftsMemberlyg:RMS79Memberlyg:ExpectedCreditLossesInRespectOfUndrawnExposuresMember2023-12-310001160106lyg:GrossUndrawnExposuresMemberlyg:RetailLoansAndOverdraftsMemberlyg:Stage1Memberlyg:RMS10Member2023-12-310001160106lyg:GrossUndrawnExposuresMemberlyg:RetailLoansAndOverdraftsMemberlyg:RMS10Memberlyg:Stage2Member2023-12-310001160106lyg:GrossUndrawnExposuresMemberlyg:RetailLoansAndOverdraftsMemberlyg:Stage3Memberlyg:RMS10Member2023-12-310001160106lyg:GrossUndrawnExposuresMemberlyg:RetailLoansAndOverdraftsMemberlyg:PurchasedOrOriginatedCreditimpairedMemberlyg:RMS10Member2023-12-310001160106lyg:GrossUndrawnExposuresMemberlyg:RetailLoansAndOverdraftsMemberlyg:RMS10Member2023-12-310001160106lyg:RetailLoansAndOverdraftsMemberlyg:Stage1Memberlyg:ExpectedCreditLossesInRespectOfUndrawnExposuresMemberlyg:RMS10Member2023-12-310001160106lyg:RetailLoansAndOverdraftsMemberlyg:ExpectedCreditLossesInRespectOfUndrawnExposuresMemberlyg:RMS10Memberlyg:Stage2Member2023-12-310001160106lyg:RetailLoansAndOverdraftsMemberlyg:Stage3Memberlyg:ExpectedCreditLossesInRespectOfUndrawnExposuresMemberlyg:RMS10Member2023-12-310001160106lyg:RetailLoansAndOverdraftsMemberlyg:PurchasedOrOriginatedCreditimpairedMemberlyg:ExpectedCreditLossesInRespectOfUndrawnExposuresMemberlyg:RMS10Member2023-12-310001160106lyg:RetailLoansAndOverdraftsMemberlyg:ExpectedCreditLossesInRespectOfUndrawnExposuresMemberlyg:RMS10Member2023-12-310001160106lyg:GrossUndrawnExposuresMemberlyg:RetailLoansAndOverdraftsMemberlyg:RMS1113Memberlyg:Stage1Member2023-12-310001160106lyg:GrossUndrawnExposuresMemberlyg:RetailLoansAndOverdraftsMemberlyg:RMS1113Memberlyg:Stage2Member2023-12-310001160106lyg:GrossUndrawnExposuresMemberlyg:RetailLoansAndOverdraftsMemberlyg:RMS1113Memberlyg:Stage3Member2023-12-310001160106lyg:GrossUndrawnExposuresMemberlyg:RetailLoansAndOverdraftsMemberlyg:PurchasedOrOriginatedCreditimpairedMemberlyg:RMS1113Member2023-12-310001160106lyg:GrossUndrawnExposuresMemberlyg:RetailLoansAndOverdraftsMemberlyg:RMS1113Member2023-12-310001160106lyg:RetailLoansAndOverdraftsMemberlyg:RMS1113Memberlyg:Stage1Memberlyg:ExpectedCreditLossesInRespectOfUndrawnExposuresMember2023-12-310001160106lyg:RetailLoansAndOverdraftsMemberlyg:RMS1113Memberlyg:ExpectedCreditLossesInRespectOfUndrawnExposuresMemberlyg:Stage2Member2023-12-310001160106lyg:RetailLoansAndOverdraftsMemberlyg:RMS1113Memberlyg:Stage3Memberlyg:ExpectedCreditLossesInRespectOfUndrawnExposuresMember2023-12-310001160106lyg:RetailLoansAndOverdraftsMemberlyg:PurchasedOrOriginatedCreditimpairedMemberlyg:RMS1113Memberlyg:ExpectedCreditLossesInRespectOfUndrawnExposuresMember2023-12-310001160106lyg:RetailLoansAndOverdraftsMemberlyg:RMS1113Memberlyg:ExpectedCreditLossesInRespectOfUndrawnExposuresMember2023-12-310001160106lyg:GrossUndrawnExposuresMemberlyg:RetailLoansAndOverdraftsMemberlyg:Stage1Memberlyg:RMS14Member2023-12-310001160106lyg:GrossUndrawnExposuresMemberlyg:RetailLoansAndOverdraftsMemberlyg:RMS14Memberlyg:Stage2Member2023-12-310001160106lyg:GrossUndrawnExposuresMemberlyg:RetailLoansAndOverdraftsMemberlyg:Stage3Memberlyg:RMS14Member2023-12-310001160106lyg:GrossUndrawnExposuresMemberlyg:RetailLoansAndOverdraftsMemberlyg:PurchasedOrOriginatedCreditimpairedMemberlyg:RMS14Member2023-12-310001160106lyg:GrossUndrawnExposuresMemberlyg:RetailLoansAndOverdraftsMemberlyg:RMS14Member2023-12-310001160106lyg:RetailLoansAndOverdraftsMemberlyg:Stage1Memberlyg:RMS14Memberlyg:ExpectedCreditLossesInRespectOfUndrawnExposuresMember2023-12-310001160106lyg:RetailLoansAndOverdraftsMemberlyg:RMS14Memberlyg:ExpectedCreditLossesInRespectOfUndrawnExposuresMemberlyg:Stage2Member2023-12-310001160106lyg:RetailLoansAndOverdraftsMemberlyg:Stage3Memberlyg:RMS14Memberlyg:ExpectedCreditLossesInRespectOfUndrawnExposuresMember2023-12-310001160106lyg:RetailLoansAndOverdraftsMemberlyg:PurchasedOrOriginatedCreditimpairedMemberlyg:RMS14Memberlyg:ExpectedCreditLossesInRespectOfUndrawnExposuresMember2023-12-310001160106lyg:RetailLoansAndOverdraftsMemberlyg:RMS14Memberlyg:ExpectedCreditLossesInRespectOfUndrawnExposuresMember2023-12-310001160106lyg:GrossUndrawnExposuresMemberlyg:RetailLoansAndOverdraftsMemberlyg:Stage1Member2023-12-310001160106lyg:GrossUndrawnExposuresMemberlyg:RetailLoansAndOverdraftsMemberlyg:Stage2Member2023-12-310001160106lyg:GrossUndrawnExposuresMemberlyg:RetailLoansAndOverdraftsMemberlyg:Stage3Member2023-12-310001160106lyg:GrossUndrawnExposuresMemberlyg:RetailLoansAndOverdraftsMemberlyg:PurchasedOrOriginatedCreditimpairedMember2023-12-310001160106lyg:GrossUndrawnExposuresMemberlyg:RetailLoansAndOverdraftsMember2023-12-310001160106lyg:RetailLoansAndOverdraftsMemberlyg:Stage1Memberlyg:ExpectedCreditLossesInRespectOfUndrawnExposuresMember2023-12-310001160106lyg:RetailLoansAndOverdraftsMemberlyg:ExpectedCreditLossesInRespectOfUndrawnExposuresMemberlyg:Stage2Member2023-12-310001160106lyg:RetailLoansAndOverdraftsMemberlyg:Stage3Memberlyg:ExpectedCreditLossesInRespectOfUndrawnExposuresMember2023-12-310001160106lyg:RetailLoansAndOverdraftsMemberlyg:PurchasedOrOriginatedCreditimpairedMemberlyg:ExpectedCreditLossesInRespectOfUndrawnExposuresMember2023-12-310001160106lyg:RetailLoansAndOverdraftsMemberlyg:ExpectedCreditLossesInRespectOfUndrawnExposuresMember2023-12-310001160106lyg:GrossUndrawnExposuresMemberlyg:RMS13Memberlyg:RetailUKMotorFinanceMemberlyg:Stage1Member2023-12-310001160106lyg:GrossUndrawnExposuresMemberlyg:RMS13Memberlyg:RetailUKMotorFinanceMemberlyg:Stage2Member2023-12-310001160106lyg:GrossUndrawnExposuresMemberlyg:RMS13Memberlyg:RetailUKMotorFinanceMemberlyg:Stage3Member2023-12-310001160106lyg:GrossUndrawnExposuresMemberlyg:RMS13Memberlyg:PurchasedOrOriginatedCreditimpairedMemberlyg:RetailUKMotorFinanceMember2023-12-310001160106lyg:GrossUndrawnExposuresMemberlyg:RMS13Memberlyg:RetailUKMotorFinanceMember2023-12-310001160106lyg:RMS13Memberlyg:RetailUKMotorFinanceMemberlyg:Stage1Memberlyg:ExpectedCreditLossesInRespectOfUndrawnExposuresMember2023-12-310001160106lyg:RMS13Memberlyg:RetailUKMotorFinanceMemberlyg:ExpectedCreditLossesInRespectOfUndrawnExposuresMemberlyg:Stage2Member2023-12-310001160106lyg:RMS13Memberlyg:RetailUKMotorFinanceMemberlyg:Stage3Memberlyg:ExpectedCreditLossesInRespectOfUndrawnExposuresMember2023-12-310001160106lyg:RMS13Memberlyg:PurchasedOrOriginatedCreditimpairedMemberlyg:RetailUKMotorFinanceMemberlyg:ExpectedCreditLossesInRespectOfUndrawnExposuresMember2023-12-310001160106lyg:RMS13Memberlyg:RetailUKMotorFinanceMemberlyg:ExpectedCreditLossesInRespectOfUndrawnExposuresMember2023-12-310001160106lyg:GrossUndrawnExposuresMemberlyg:RMS46Memberlyg:RetailUKMotorFinanceMemberlyg:Stage1Member2023-12-310001160106lyg:GrossUndrawnExposuresMemberlyg:RMS46Memberlyg:RetailUKMotorFinanceMemberlyg:Stage2Member2023-12-310001160106lyg:GrossUndrawnExposuresMemberlyg:RMS46Memberlyg:RetailUKMotorFinanceMemberlyg:Stage3Member2023-12-310001160106lyg:GrossUndrawnExposuresMemberlyg:RMS46Memberlyg:PurchasedOrOriginatedCreditimpairedMemberlyg:RetailUKMotorFinanceMember2023-12-310001160106lyg:GrossUndrawnExposuresMemberlyg:RMS46Memberlyg:RetailUKMotorFinanceMember2023-12-310001160106lyg:RMS46Memberlyg:RetailUKMotorFinanceMemberlyg:Stage1Memberlyg:ExpectedCreditLossesInRespectOfUndrawnExposuresMember2023-12-310001160106lyg:RMS46Memberlyg:RetailUKMotorFinanceMemberlyg:ExpectedCreditLossesInRespectOfUndrawnExposuresMemberlyg:Stage2Member2023-12-310001160106lyg:RMS46Memberlyg:RetailUKMotorFinanceMemberlyg:Stage3Memberlyg:ExpectedCreditLossesInRespectOfUndrawnExposuresMember2023-12-310001160106lyg:RMS46Memberlyg:PurchasedOrOriginatedCreditimpairedMemberlyg:RetailUKMotorFinanceMemberlyg:ExpectedCreditLossesInRespectOfUndrawnExposuresMember2023-12-310001160106lyg:RMS46Memberlyg:RetailUKMotorFinanceMemberlyg:ExpectedCreditLossesInRespectOfUndrawnExposuresMember2023-12-310001160106lyg:GrossUndrawnExposuresMemberlyg:RetailUKMotorFinanceMemberlyg:Stage1Memberlyg:RMS79Member2023-12-310001160106lyg:GrossUndrawnExposuresMemberlyg:RetailUKMotorFinanceMemberlyg:RMS79Memberlyg:Stage2Member2023-12-310001160106lyg:GrossUndrawnExposuresMemberlyg:RetailUKMotorFinanceMemberlyg:Stage3Memberlyg:RMS79Member2023-12-310001160106lyg:GrossUndrawnExposuresMemberlyg:PurchasedOrOriginatedCreditimpairedMemberlyg:RetailUKMotorFinanceMemberlyg:RMS79Member2023-12-310001160106lyg:GrossUndrawnExposuresMemberlyg:RetailUKMotorFinanceMemberlyg:RMS79Member2023-12-310001160106lyg:RetailUKMotorFinanceMemberlyg:RMS79Memberlyg:ExpectedCreditLossesInRespectOfUndrawnExposuresMemberlyg:Stage2Member2023-12-310001160106lyg:RetailUKMotorFinanceMemberlyg:Stage3Memberlyg:RMS79Memberlyg:ExpectedCreditLossesInRespectOfUndrawnExposuresMember2023-12-310001160106lyg:PurchasedOrOriginatedCreditimpairedMemberlyg:RetailUKMotorFinanceMemberlyg:RMS79Memberlyg:ExpectedCreditLossesInRespectOfUndrawnExposuresMember2023-12-310001160106lyg:RetailUKMotorFinanceMemberlyg:RMS79Memberlyg:ExpectedCreditLossesInRespectOfUndrawnExposuresMember2023-12-310001160106lyg:GrossUndrawnExposuresMemberlyg:RetailUKMotorFinanceMemberlyg:Stage1Memberlyg:RMS10Member2023-12-310001160106lyg:GrossUndrawnExposuresMemberlyg:RetailUKMotorFinanceMemberlyg:RMS10Memberlyg:Stage2Member2023-12-310001160106lyg:GrossUndrawnExposuresMemberlyg:RetailUKMotorFinanceMemberlyg:Stage3Memberlyg:RMS10Member2023-12-310001160106lyg:GrossUndrawnExposuresMemberlyg:PurchasedOrOriginatedCreditimpairedMemberlyg:RetailUKMotorFinanceMemberlyg:RMS10Member2023-12-310001160106lyg:GrossUndrawnExposuresMemberlyg:RetailUKMotorFinanceMemberlyg:RMS10Member2023-12-310001160106lyg:RetailUKMotorFinanceMemberlyg:Stage1Memberlyg:ExpectedCreditLossesInRespectOfUndrawnExposuresMemberlyg:RMS10Member2023-12-310001160106lyg:RetailUKMotorFinanceMemberlyg:ExpectedCreditLossesInRespectOfUndrawnExposuresMemberlyg:RMS10Memberlyg:Stage2Member2023-12-310001160106lyg:RetailUKMotorFinanceMemberlyg:Stage3Memberlyg:ExpectedCreditLossesInRespectOfUndrawnExposuresMemberlyg:RMS10Member2023-12-310001160106lyg:PurchasedOrOriginatedCreditimpairedMemberlyg:RetailUKMotorFinanceMemberlyg:ExpectedCreditLossesInRespectOfUndrawnExposuresMemberlyg:RMS10Member2023-12-310001160106lyg:RetailUKMotorFinanceMemberlyg:ExpectedCreditLossesInRespectOfUndrawnExposuresMemberlyg:RMS10Member2023-12-310001160106lyg:GrossUndrawnExposuresMemberlyg:RetailUKMotorFinanceMemberlyg:RMS1113Memberlyg:Stage1Member2023-12-310001160106lyg:GrossUndrawnExposuresMemberlyg:RetailUKMotorFinanceMemberlyg:RMS1113Memberlyg:Stage2Member2023-12-310001160106lyg:GrossUndrawnExposuresMemberlyg:RetailUKMotorFinanceMemberlyg:RMS1113Memberlyg:Stage3Member2023-12-310001160106lyg:GrossUndrawnExposuresMemberlyg:PurchasedOrOriginatedCreditimpairedMemberlyg:RetailUKMotorFinanceMemberlyg:RMS1113Member2023-12-310001160106lyg:GrossUndrawnExposuresMemberlyg:RetailUKMotorFinanceMemberlyg:RMS1113Member2023-12-310001160106lyg:RetailUKMotorFinanceMemberlyg:RMS1113Memberlyg:Stage1Memberlyg:ExpectedCreditLossesInRespectOfUndrawnExposuresMember2023-12-310001160106lyg:RetailUKMotorFinanceMemberlyg:RMS1113Memberlyg:ExpectedCreditLossesInRespectOfUndrawnExposuresMemberlyg:Stage2Member2023-12-310001160106lyg:RetailUKMotorFinanceMemberlyg:RMS1113Memberlyg:Stage3Memberlyg:ExpectedCreditLossesInRespectOfUndrawnExposuresMember2023-12-310001160106lyg:PurchasedOrOriginatedCreditimpairedMemberlyg:RetailUKMotorFinanceMemberlyg:RMS1113Memberlyg:ExpectedCreditLossesInRespectOfUndrawnExposuresMember2023-12-310001160106lyg:RetailUKMotorFinanceMemberlyg:RMS1113Memberlyg:ExpectedCreditLossesInRespectOfUndrawnExposuresMember2023-12-310001160106lyg:GrossUndrawnExposuresMemberlyg:RetailUKMotorFinanceMemberlyg:Stage1Memberlyg:RMS14Member2023-12-310001160106lyg:GrossUndrawnExposuresMemberlyg:RetailUKMotorFinanceMemberlyg:RMS14Memberlyg:Stage2Member2023-12-310001160106lyg:GrossUndrawnExposuresMemberlyg:RetailUKMotorFinanceMemberlyg:Stage3Memberlyg:RMS14Member2023-12-310001160106lyg:GrossUndrawnExposuresMemberlyg:PurchasedOrOriginatedCreditimpairedMemberlyg:RetailUKMotorFinanceMemberlyg:RMS14Member2023-12-310001160106lyg:GrossUndrawnExposuresMemberlyg:RetailUKMotorFinanceMemberlyg:RMS14Member2023-12-310001160106lyg:RetailUKMotorFinanceMemberlyg:Stage1Memberlyg:RMS14Memberlyg:ExpectedCreditLossesInRespectOfUndrawnExposuresMember2023-12-310001160106lyg:RetailUKMotorFinanceMemberlyg:RMS14Memberlyg:ExpectedCreditLossesInRespectOfUndrawnExposuresMemberlyg:Stage2Member2023-12-310001160106lyg:RetailUKMotorFinanceMemberlyg:Stage3Memberlyg:RMS14Memberlyg:ExpectedCreditLossesInRespectOfUndrawnExposuresMember2023-12-310001160106lyg:PurchasedOrOriginatedCreditimpairedMemberlyg:RetailUKMotorFinanceMemberlyg:RMS14Memberlyg:ExpectedCreditLossesInRespectOfUndrawnExposuresMember2023-12-310001160106lyg:RetailUKMotorFinanceMemberlyg:RMS14Memberlyg:ExpectedCreditLossesInRespectOfUndrawnExposuresMember2023-12-310001160106lyg:GrossUndrawnExposuresMemberlyg:RetailUKMotorFinanceMemberlyg:Stage1Member2023-12-310001160106lyg:GrossUndrawnExposuresMemberlyg:RetailUKMotorFinanceMemberlyg:Stage2Member2023-12-310001160106lyg:GrossUndrawnExposuresMemberlyg:RetailUKMotorFinanceMemberlyg:Stage3Member2023-12-310001160106lyg:GrossUndrawnExposuresMemberlyg:PurchasedOrOriginatedCreditimpairedMemberlyg:RetailUKMotorFinanceMember2023-12-310001160106lyg:GrossUndrawnExposuresMemberlyg:RetailUKMotorFinanceMember2023-12-310001160106lyg:RetailUKMotorFinanceMemberlyg:Stage1Memberlyg:ExpectedCreditLossesInRespectOfUndrawnExposuresMember2023-12-310001160106lyg:RetailUKMotorFinanceMemberlyg:ExpectedCreditLossesInRespectOfUndrawnExposuresMemberlyg:Stage2Member2023-12-310001160106lyg:RetailUKMotorFinanceMemberlyg:Stage3Memberlyg:ExpectedCreditLossesInRespectOfUndrawnExposuresMember2023-12-310001160106lyg:PurchasedOrOriginatedCreditimpairedMemberlyg:RetailUKMotorFinanceMemberlyg:ExpectedCreditLossesInRespectOfUndrawnExposuresMember2023-12-310001160106lyg:RetailUKMotorFinanceMemberlyg:ExpectedCreditLossesInRespectOfUndrawnExposuresMember2023-12-310001160106lyg:GrossUndrawnExposuresMemberlyg:RMS13Memberlyg:RetailOtherMemberlyg:Stage1Member2023-12-310001160106lyg:GrossUndrawnExposuresMemberlyg:RMS13Memberlyg:RetailOtherMemberlyg:Stage2Member2023-12-310001160106lyg:GrossUndrawnExposuresMemberlyg:RMS13Memberlyg:RetailOtherMemberlyg:Stage3Member2023-12-310001160106lyg:GrossUndrawnExposuresMemberlyg:RMS13Memberlyg:PurchasedOrOriginatedCreditimpairedMemberlyg:RetailOtherMember2023-12-310001160106lyg:GrossUndrawnExposuresMemberlyg:RMS13Memberlyg:RetailOtherMember2023-12-310001160106lyg:RMS13Memberlyg:RetailOtherMemberlyg:Stage1Memberlyg:ExpectedCreditLossesInRespectOfUndrawnExposuresMember2023-12-310001160106lyg:RMS13Memberlyg:RetailOtherMemberlyg:ExpectedCreditLossesInRespectOfUndrawnExposuresMemberlyg:Stage2Member2023-12-310001160106lyg:RMS13Memberlyg:RetailOtherMemberlyg:Stage3Memberlyg:ExpectedCreditLossesInRespectOfUndrawnExposuresMember2023-12-310001160106lyg:RMS13Memberlyg:PurchasedOrOriginatedCreditimpairedMemberlyg:RetailOtherMemberlyg:ExpectedCreditLossesInRespectOfUndrawnExposuresMember2023-12-310001160106lyg:RMS13Memberlyg:RetailOtherMemberlyg:ExpectedCreditLossesInRespectOfUndrawnExposuresMember2023-12-310001160106lyg:GrossUndrawnExposuresMemberlyg:RMS46Memberlyg:RetailOtherMemberlyg:Stage1Member2023-12-310001160106lyg:GrossUndrawnExposuresMemberlyg:RMS46Memberlyg:RetailOtherMemberlyg:Stage2Member2023-12-310001160106lyg:GrossUndrawnExposuresMemberlyg:RMS46Memberlyg:RetailOtherMemberlyg:Stage3Member2023-12-310001160106lyg:GrossUndrawnExposuresMemberlyg:RMS46Memberlyg:PurchasedOrOriginatedCreditimpairedMemberlyg:RetailOtherMember2023-12-310001160106lyg:GrossUndrawnExposuresMemberlyg:RMS46Memberlyg:RetailOtherMember2023-12-310001160106lyg:RMS46Memberlyg:RetailOtherMemberlyg:Stage1Memberlyg:ExpectedCreditLossesInRespectOfUndrawnExposuresMember2023-12-310001160106lyg:RMS46Memberlyg:RetailOtherMemberlyg:ExpectedCreditLossesInRespectOfUndrawnExposuresMemberlyg:Stage2Member2023-12-310001160106lyg:RMS46Memberlyg:RetailOtherMemberlyg:Stage3Memberlyg:ExpectedCreditLossesInRespectOfUndrawnExposuresMember2023-12-310001160106lyg:RMS46Memberlyg:PurchasedOrOriginatedCreditimpairedMemberlyg:RetailOtherMemberlyg:ExpectedCreditLossesInRespectOfUndrawnExposuresMember2023-12-310001160106lyg:RMS46Memberlyg:RetailOtherMemberlyg:ExpectedCreditLossesInRespectOfUndrawnExposuresMember2023-12-310001160106lyg:GrossUndrawnExposuresMemberlyg:RetailOtherMemberlyg:Stage1Memberlyg:RMS79Member2023-12-310001160106lyg:GrossUndrawnExposuresMemberlyg:RetailOtherMemberlyg:RMS79Memberlyg:Stage2Member2023-12-310001160106lyg:GrossUndrawnExposuresMemberlyg:RetailOtherMemberlyg:Stage3Memberlyg:RMS79Member2023-12-310001160106lyg:GrossUndrawnExposuresMemberlyg:PurchasedOrOriginatedCreditimpairedMemberlyg:RetailOtherMemberlyg:RMS79Member2023-12-310001160106lyg:GrossUndrawnExposuresMemberlyg:RetailOtherMemberlyg:RMS79Member2023-12-310001160106lyg:RetailOtherMemberlyg:Stage1Memberlyg:RMS79Memberlyg:ExpectedCreditLossesInRespectOfUndrawnExposuresMember2023-12-310001160106lyg:RetailOtherMemberlyg:RMS79Memberlyg:ExpectedCreditLossesInRespectOfUndrawnExposuresMemberlyg:Stage2Member2023-12-310001160106lyg:RetailOtherMemberlyg:Stage3Memberlyg:RMS79Memberlyg:ExpectedCreditLossesInRespectOfUndrawnExposuresMember2023-12-310001160106lyg:PurchasedOrOriginatedCreditimpairedMemberlyg:RetailOtherMemberlyg:RMS79Memberlyg:ExpectedCreditLossesInRespectOfUndrawnExposuresMember2023-12-310001160106lyg:RetailOtherMemberlyg:RMS79Memberlyg:ExpectedCreditLossesInRespectOfUndrawnExposuresMember2023-12-310001160106lyg:GrossUndrawnExposuresMemberlyg:RetailOtherMemberlyg:Stage1Memberlyg:RMS10Member2023-12-310001160106lyg:GrossUndrawnExposuresMemberlyg:RetailOtherMemberlyg:RMS10Memberlyg:Stage2Member2023-12-310001160106lyg:GrossUndrawnExposuresMemberlyg:RetailOtherMemberlyg:Stage3Memberlyg:RMS10Member2023-12-310001160106lyg:GrossUndrawnExposuresMemberlyg:PurchasedOrOriginatedCreditimpairedMemberlyg:RetailOtherMemberlyg:RMS10Member2023-12-310001160106lyg:GrossUndrawnExposuresMemberlyg:RetailOtherMemberlyg:RMS10Member2023-12-310001160106lyg:RetailOtherMemberlyg:Stage1Memberlyg:ExpectedCreditLossesInRespectOfUndrawnExposuresMemberlyg:RMS10Member2023-12-310001160106lyg:RetailOtherMemberlyg:ExpectedCreditLossesInRespectOfUndrawnExposuresMemberlyg:RMS10Memberlyg:Stage2Member2023-12-310001160106lyg:RetailOtherMemberlyg:Stage3Memberlyg:ExpectedCreditLossesInRespectOfUndrawnExposuresMemberlyg:RMS10Member2023-12-310001160106lyg:PurchasedOrOriginatedCreditimpairedMemberlyg:RetailOtherMemberlyg:ExpectedCreditLossesInRespectOfUndrawnExposuresMemberlyg:RMS10Member2023-12-310001160106lyg:RetailOtherMemberlyg:ExpectedCreditLossesInRespectOfUndrawnExposuresMemberlyg:RMS10Member2023-12-310001160106lyg:GrossUndrawnExposuresMemberlyg:RetailOtherMemberlyg:RMS1113Memberlyg:Stage1Member2023-12-310001160106lyg:GrossUndrawnExposuresMemberlyg:RetailOtherMemberlyg:RMS1113Memberlyg:Stage2Member2023-12-310001160106lyg:GrossUndrawnExposuresMemberlyg:RetailOtherMemberlyg:RMS1113Memberlyg:Stage3Member2023-12-310001160106lyg:GrossUndrawnExposuresMemberlyg:PurchasedOrOriginatedCreditimpairedMemberlyg:RetailOtherMemberlyg:RMS1113Member2023-12-310001160106lyg:GrossUndrawnExposuresMemberlyg:RetailOtherMemberlyg:RMS1113Member2023-12-310001160106lyg:RetailOtherMemberlyg:RMS1113Memberlyg:Stage1Memberlyg:ExpectedCreditLossesInRespectOfUndrawnExposuresMember2023-12-310001160106lyg:RetailOtherMemberlyg:RMS1113Memberlyg:ExpectedCreditLossesInRespectOfUndrawnExposuresMemberlyg:Stage2Member2023-12-310001160106lyg:RetailOtherMemberlyg:RMS1113Memberlyg:Stage3Memberlyg:ExpectedCreditLossesInRespectOfUndrawnExposuresMember2023-12-310001160106lyg:PurchasedOrOriginatedCreditimpairedMemberlyg:RetailOtherMemberlyg:RMS1113Memberlyg:ExpectedCreditLossesInRespectOfUndrawnExposuresMember2023-12-310001160106lyg:RetailOtherMemberlyg:RMS1113Memberlyg:ExpectedCreditLossesInRespectOfUndrawnExposuresMember2023-12-310001160106lyg:GrossUndrawnExposuresMemberlyg:RetailOtherMemberlyg:Stage1Memberlyg:RMS14Member2023-12-310001160106lyg:GrossUndrawnExposuresMemberlyg:RetailOtherMemberlyg:RMS14Memberlyg:Stage2Member2023-12-310001160106lyg:GrossUndrawnExposuresMemberlyg:RetailOtherMemberlyg:Stage3Memberlyg:RMS14Member2023-12-310001160106lyg:GrossUndrawnExposuresMemberlyg:PurchasedOrOriginatedCreditimpairedMemberlyg:RetailOtherMemberlyg:RMS14Member2023-12-310001160106lyg:GrossUndrawnExposuresMemberlyg:RetailOtherMemberlyg:RMS14Member2023-12-310001160106lyg:RetailOtherMemberlyg:Stage1Memberlyg:RMS14Memberlyg:ExpectedCreditLossesInRespectOfUndrawnExposuresMember2023-12-310001160106lyg:RetailOtherMemberlyg:RMS14Memberlyg:ExpectedCreditLossesInRespectOfUndrawnExposuresMemberlyg:Stage2Member2023-12-310001160106lyg:RetailOtherMemberlyg:Stage3Memberlyg:RMS14Memberlyg:ExpectedCreditLossesInRespectOfUndrawnExposuresMember2023-12-310001160106lyg:PurchasedOrOriginatedCreditimpairedMemberlyg:RetailOtherMemberlyg:RMS14Memberlyg:ExpectedCreditLossesInRespectOfUndrawnExposuresMember2023-12-310001160106lyg:RetailOtherMemberlyg:RMS14Memberlyg:ExpectedCreditLossesInRespectOfUndrawnExposuresMember2023-12-310001160106lyg:GrossUndrawnExposuresMemberlyg:RetailOtherMemberlyg:Stage1Member2023-12-310001160106lyg:GrossUndrawnExposuresMemberlyg:RetailOtherMemberlyg:Stage2Member2023-12-310001160106lyg:GrossUndrawnExposuresMemberlyg:RetailOtherMemberlyg:Stage3Member2023-12-310001160106lyg:GrossUndrawnExposuresMemberlyg:PurchasedOrOriginatedCreditimpairedMemberlyg:RetailOtherMember2023-12-310001160106lyg:GrossUndrawnExposuresMemberlyg:RetailOtherMember2023-12-310001160106lyg:RetailOtherMemberlyg:Stage1Memberlyg:ExpectedCreditLossesInRespectOfUndrawnExposuresMember2023-12-310001160106lyg:RetailOtherMemberlyg:ExpectedCreditLossesInRespectOfUndrawnExposuresMemberlyg:Stage2Member2023-12-310001160106lyg:RetailOtherMemberlyg:Stage3Memberlyg:ExpectedCreditLossesInRespectOfUndrawnExposuresMember2023-12-310001160106lyg:PurchasedOrOriginatedCreditimpairedMemberlyg:RetailOtherMemberlyg:ExpectedCreditLossesInRespectOfUndrawnExposuresMember2023-12-310001160106lyg:RetailOtherMemberlyg:ExpectedCreditLossesInRespectOfUndrawnExposuresMember2023-12-310001160106lyg:GrossUndrawnExposuresMemberlyg:Stage1Memberlyg:Retail1Member2023-12-310001160106lyg:GrossUndrawnExposuresMemberlyg:Stage2Memberlyg:Retail1Member2023-12-310001160106lyg:GrossUndrawnExposuresMemberlyg:Stage3Memberlyg:Retail1Member2023-12-310001160106lyg:GrossUndrawnExposuresMemberlyg:PurchasedOrOriginatedCreditimpairedMemberlyg:Retail1Member2023-12-310001160106lyg:GrossUndrawnExposuresMemberlyg:Retail1Member2023-12-310001160106lyg:Stage1Memberlyg:ExpectedCreditLossesInRespectOfUndrawnExposuresMemberlyg:Retail1Member2023-12-310001160106lyg:ExpectedCreditLossesInRespectOfUndrawnExposuresMemberlyg:Stage2Memberlyg:Retail1Member2023-12-310001160106lyg:Stage3Memberlyg:ExpectedCreditLossesInRespectOfUndrawnExposuresMemberlyg:Retail1Member2023-12-310001160106lyg:PurchasedOrOriginatedCreditimpairedMemberlyg:ExpectedCreditLossesInRespectOfUndrawnExposuresMemberlyg:Retail1Member2023-12-310001160106lyg:ExpectedCreditLossesInRespectOfUndrawnExposuresMemberlyg:Retail1Member2023-12-310001160106lyg:GrossUndrawnExposuresMemberlyg:CMS15Memberlyg:Stage1Memberlyg:CommercialMember2023-12-310001160106lyg:GrossUndrawnExposuresMemberlyg:CMS15Memberlyg:CommercialMemberlyg:Stage2Member2023-12-310001160106lyg:GrossUndrawnExposuresMemberlyg:Stage3Memberlyg:CMS15Memberlyg:CommercialMember2023-12-310001160106lyg:GrossUndrawnExposuresMemberlyg:PurchasedOrOriginatedCreditimpairedMemberlyg:CMS15Memberlyg:CommercialMember2023-12-310001160106lyg:GrossUndrawnExposuresMemberlyg:CMS15Memberlyg:CommercialMember2023-12-310001160106lyg:CMS15Memberlyg:Stage1Memberlyg:ExpectedCreditLossesInRespectOfUndrawnExposuresMemberlyg:CommercialMember2023-12-310001160106lyg:CMS15Memberlyg:ExpectedCreditLossesInRespectOfUndrawnExposuresMemberlyg:CommercialMemberlyg:Stage2Member2023-12-310001160106lyg:Stage3Memberlyg:CMS15Memberlyg:ExpectedCreditLossesInRespectOfUndrawnExposuresMemberlyg:CommercialMember2023-12-310001160106lyg:PurchasedOrOriginatedCreditimpairedMemberlyg:CMS15Memberlyg:ExpectedCreditLossesInRespectOfUndrawnExposuresMemberlyg:CommercialMember2023-12-310001160106lyg:CMS15Memberlyg:ExpectedCreditLossesInRespectOfUndrawnExposuresMemberlyg:CommercialMember2023-12-310001160106lyg:GrossUndrawnExposuresMemberlyg:CMS610Memberlyg:Stage1Memberlyg:CommercialMember2023-12-310001160106lyg:GrossUndrawnExposuresMemberlyg:CMS610Memberlyg:CommercialMemberlyg:Stage2Member2023-12-310001160106lyg:GrossUndrawnExposuresMemberlyg:Stage3Memberlyg:CMS610Memberlyg:CommercialMember2023-12-310001160106lyg:GrossUndrawnExposuresMemberlyg:PurchasedOrOriginatedCreditimpairedMemberlyg:CMS610Memberlyg:CommercialMember2023-12-310001160106lyg:GrossUndrawnExposuresMemberlyg:CMS610Memberlyg:CommercialMember2023-12-310001160106lyg:CMS610Memberlyg:Stage1Memberlyg:ExpectedCreditLossesInRespectOfUndrawnExposuresMemberlyg:CommercialMember2023-12-310001160106lyg:CMS610Memberlyg:ExpectedCreditLossesInRespectOfUndrawnExposuresMemberlyg:CommercialMemberlyg:Stage2Member2023-12-310001160106lyg:Stage3Memberlyg:CMS610Memberlyg:ExpectedCreditLossesInRespectOfUndrawnExposuresMemberlyg:CommercialMember2023-12-310001160106lyg:PurchasedOrOriginatedCreditimpairedMemberlyg:CMS610Memberlyg:ExpectedCreditLossesInRespectOfUndrawnExposuresMemberlyg:CommercialMember2023-12-310001160106lyg:CMS610Memberlyg:ExpectedCreditLossesInRespectOfUndrawnExposuresMemberlyg:CommercialMember2023-12-310001160106lyg:GrossUndrawnExposuresMemberlyg:Stage1Memberlyg:CMS1114Memberlyg:CommercialMember2023-12-310001160106lyg:GrossUndrawnExposuresMemberlyg:CMS1114Memberlyg:CommercialMemberlyg:Stage2Member2023-12-310001160106lyg:GrossUndrawnExposuresMemberlyg:Stage3Memberlyg:CMS1114Memberlyg:CommercialMember2023-12-310001160106lyg:GrossUndrawnExposuresMemberlyg:PurchasedOrOriginatedCreditimpairedMemberlyg:CMS1114Memberlyg:CommercialMember2023-12-310001160106lyg:GrossUndrawnExposuresMemberlyg:CMS1114Memberlyg:CommercialMember2023-12-310001160106lyg:Stage1Memberlyg:CMS1114Memberlyg:ExpectedCreditLossesInRespectOfUndrawnExposuresMemberlyg:CommercialMember2023-12-310001160106lyg:CMS1114Memberlyg:ExpectedCreditLossesInRespectOfUndrawnExposuresMemberlyg:CommercialMemberlyg:Stage2Member2023-12-310001160106lyg:Stage3Memberlyg:CMS1114Memberlyg:ExpectedCreditLossesInRespectOfUndrawnExposuresMemberlyg:CommercialMember2023-12-310001160106lyg:PurchasedOrOriginatedCreditimpairedMemberlyg:CMS1114Memberlyg:ExpectedCreditLossesInRespectOfUndrawnExposuresMemberlyg:CommercialMember2023-12-310001160106lyg:CMS1114Memberlyg:ExpectedCreditLossesInRespectOfUndrawnExposuresMemberlyg:CommercialMember2023-12-310001160106lyg:CMS1518Memberlyg:GrossUndrawnExposuresMemberlyg:Stage1Memberlyg:CommercialMember2023-12-310001160106lyg:CMS1518Memberlyg:GrossUndrawnExposuresMemberlyg:CommercialMemberlyg:Stage2Member2023-12-310001160106lyg:CMS1518Memberlyg:GrossUndrawnExposuresMemberlyg:Stage3Memberlyg:CommercialMember2023-12-310001160106lyg:CMS1518Memberlyg:GrossUndrawnExposuresMemberlyg:PurchasedOrOriginatedCreditimpairedMemberlyg:CommercialMember2023-12-310001160106lyg:CMS1518Memberlyg:GrossUndrawnExposuresMemberlyg:CommercialMember2023-12-310001160106lyg:CMS1518Memberlyg:Stage1Memberlyg:ExpectedCreditLossesInRespectOfUndrawnExposuresMemberlyg:CommercialMember2023-12-310001160106lyg:CMS1518Memberlyg:ExpectedCreditLossesInRespectOfUndrawnExposuresMemberlyg:CommercialMemberlyg:Stage2Member2023-12-310001160106lyg:CMS1518Memberlyg:Stage3Memberlyg:ExpectedCreditLossesInRespectOfUndrawnExposuresMemberlyg:CommercialMember2023-12-310001160106lyg:CMS1518Memberlyg:PurchasedOrOriginatedCreditimpairedMemberlyg:ExpectedCreditLossesInRespectOfUndrawnExposuresMemberlyg:CommercialMember2023-12-310001160106lyg:CMS1518Memberlyg:ExpectedCreditLossesInRespectOfUndrawnExposuresMemberlyg:CommercialMember2023-12-310001160106lyg:GrossUndrawnExposuresMemberlyg:CMS19Memberlyg:Stage1Memberlyg:CommercialMember2023-12-310001160106lyg:GrossUndrawnExposuresMemberlyg:CMS19Memberlyg:CommercialMemberlyg:Stage2Member2023-12-310001160106lyg:GrossUndrawnExposuresMemberlyg:Stage3Memberlyg:CMS19Memberlyg:CommercialMember2023-12-310001160106lyg:GrossUndrawnExposuresMemberlyg:PurchasedOrOriginatedCreditimpairedMemberlyg:CMS19Memberlyg:CommercialMember2023-12-310001160106lyg:GrossUndrawnExposuresMemberlyg:CMS19Memberlyg:CommercialMember2023-12-310001160106lyg:CMS19Memberlyg:Stage1Memberlyg:ExpectedCreditLossesInRespectOfUndrawnExposuresMemberlyg:CommercialMember2023-12-310001160106lyg:CMS19Memberlyg:ExpectedCreditLossesInRespectOfUndrawnExposuresMemberlyg:CommercialMemberlyg:Stage2Member2023-12-310001160106lyg:Stage3Memberlyg:CMS19Memberlyg:ExpectedCreditLossesInRespectOfUndrawnExposuresMemberlyg:CommercialMember2023-12-310001160106lyg:PurchasedOrOriginatedCreditimpairedMemberlyg:CMS19Memberlyg:ExpectedCreditLossesInRespectOfUndrawnExposuresMemberlyg:CommercialMember2023-12-310001160106lyg:CMS19Memberlyg:ExpectedCreditLossesInRespectOfUndrawnExposuresMemberlyg:CommercialMember2023-12-310001160106lyg:GrossUndrawnExposuresMemberlyg:Stage1Memberlyg:CMS2023Memberlyg:CommercialMember2023-12-310001160106lyg:GrossUndrawnExposuresMemberlyg:CMS2023Memberlyg:CommercialMemberlyg:Stage2Member2023-12-310001160106lyg:GrossUndrawnExposuresMemberlyg:Stage3Memberlyg:CMS2023Memberlyg:CommercialMember2023-12-310001160106lyg:GrossUndrawnExposuresMemberlyg:PurchasedOrOriginatedCreditimpairedMemberlyg:CMS2023Memberlyg:CommercialMember2023-12-310001160106lyg:GrossUndrawnExposuresMemberlyg:CMS2023Memberlyg:CommercialMember2023-12-310001160106lyg:Stage1Memberlyg:CMS2023Memberlyg:ExpectedCreditLossesInRespectOfUndrawnExposuresMemberlyg:CommercialMember2023-12-310001160106lyg:CMS2023Memberlyg:ExpectedCreditLossesInRespectOfUndrawnExposuresMemberlyg:CommercialMemberlyg:Stage2Member2023-12-310001160106lyg:Stage3Memberlyg:CMS2023Memberlyg:ExpectedCreditLossesInRespectOfUndrawnExposuresMemberlyg:CommercialMember2023-12-310001160106lyg:PurchasedOrOriginatedCreditimpairedMemberlyg:CMS2023Memberlyg:ExpectedCreditLossesInRespectOfUndrawnExposuresMemberlyg:CommercialMember2023-12-310001160106lyg:CMS2023Memberlyg:ExpectedCreditLossesInRespectOfUndrawnExposuresMemberlyg:CommercialMember2023-12-310001160106lyg:GrossUndrawnExposuresMemberlyg:Stage1Memberlyg:CommercialMember2023-12-310001160106lyg:GrossUndrawnExposuresMemberlyg:CommercialMemberlyg:Stage2Member2023-12-310001160106lyg:GrossUndrawnExposuresMemberlyg:Stage3Memberlyg:CommercialMember2023-12-310001160106lyg:GrossUndrawnExposuresMemberlyg:PurchasedOrOriginatedCreditimpairedMemberlyg:CommercialMember2023-12-310001160106lyg:GrossUndrawnExposuresMemberlyg:CommercialMember2023-12-310001160106lyg:Stage1Memberlyg:ExpectedCreditLossesInRespectOfUndrawnExposuresMemberlyg:CommercialMember2023-12-310001160106lyg:ExpectedCreditLossesInRespectOfUndrawnExposuresMemberlyg:CommercialMemberlyg:Stage2Member2023-12-310001160106lyg:Stage3Memberlyg:ExpectedCreditLossesInRespectOfUndrawnExposuresMemberlyg:CommercialMember2023-12-310001160106lyg:PurchasedOrOriginatedCreditimpairedMemberlyg:ExpectedCreditLossesInRespectOfUndrawnExposuresMemberlyg:CommercialMember2023-12-310001160106lyg:ExpectedCreditLossesInRespectOfUndrawnExposuresMemberlyg:CommercialMember2023-12-310001160106lyg:CMSMemberlyg:GrossUndrawnExposuresMemberlyg:Stage1Memberlyg:OtherMember2023-12-310001160106lyg:CMSMemberlyg:GrossUndrawnExposuresMemberlyg:OtherMemberlyg:Stage2Member2023-12-310001160106lyg:CMSMemberlyg:GrossUndrawnExposuresMemberlyg:Stage3Memberlyg:OtherMember2023-12-310001160106lyg:CMSMemberlyg:GrossUndrawnExposuresMemberlyg:PurchasedOrOriginatedCreditimpairedMemberlyg:OtherMember2023-12-310001160106lyg:CMSMemberlyg:GrossUndrawnExposuresMemberlyg:OtherMember2023-12-310001160106lyg:CMSMemberlyg:Stage1Memberlyg:ExpectedCreditLossesInRespectOfUndrawnExposuresMemberlyg:OtherMember2023-12-310001160106lyg:CMSMemberlyg:ExpectedCreditLossesInRespectOfUndrawnExposuresMemberlyg:OtherMemberlyg:Stage2Member2023-12-310001160106lyg:CMSMemberlyg:Stage3Memberlyg:ExpectedCreditLossesInRespectOfUndrawnExposuresMemberlyg:OtherMember2023-12-310001160106lyg:CMSMemberlyg:PurchasedOrOriginatedCreditimpairedMemberlyg:ExpectedCreditLossesInRespectOfUndrawnExposuresMemberlyg:OtherMember2023-12-310001160106lyg:CMSMemberlyg:ExpectedCreditLossesInRespectOfUndrawnExposuresMemberlyg:OtherMember2023-12-310001160106lyg:GrossUndrawnExposuresMemberlyg:Stage1Member2023-12-310001160106lyg:GrossUndrawnExposuresMemberlyg:Stage2Member2023-12-310001160106lyg:GrossUndrawnExposuresMemberlyg:Stage3Member2023-12-310001160106lyg:GrossUndrawnExposuresMemberlyg:PurchasedOrOriginatedCreditimpairedMember2023-12-310001160106lyg:GrossUndrawnExposuresMember2023-12-310001160106lyg:Stage1Memberlyg:ExpectedCreditLossesInRespectOfUndrawnExposuresMember2023-12-310001160106lyg:ExpectedCreditLossesInRespectOfUndrawnExposuresMemberlyg:Stage2Member2023-12-310001160106lyg:Stage3Memberlyg:ExpectedCreditLossesInRespectOfUndrawnExposuresMember2023-12-310001160106lyg:PurchasedOrOriginatedCreditimpairedMemberlyg:ExpectedCreditLossesInRespectOfUndrawnExposuresMember2023-12-310001160106lyg:ExpectedCreditLossesInRespectOfUndrawnExposuresMember2023-12-310001160106lyg:GrossUndrawnExposuresMemberlyg:RMS13Memberlyg:RetailMortgagesMemberlyg:Stage1Member2022-12-310001160106lyg:GrossUndrawnExposuresMemberlyg:RMS13Memberlyg:RetailMortgagesMemberlyg:Stage2Member2022-12-310001160106lyg:GrossUndrawnExposuresMemberlyg:RMS13Memberlyg:RetailMortgagesMemberlyg:Stage3Member2022-12-310001160106lyg:GrossUndrawnExposuresMemberlyg:RMS13Memberlyg:PurchasedOrOriginatedCreditimpairedMemberlyg:RetailMortgagesMember2022-12-310001160106lyg:GrossUndrawnExposuresMemberlyg:RMS13Memberlyg:RetailMortgagesMember2022-12-310001160106lyg:RMS13Memberlyg:RetailMortgagesMemberlyg:Stage1Memberlyg:ExpectedCreditLossesInRespectOfUndrawnExposuresMember2022-12-310001160106lyg:RMS13Memberlyg:RetailMortgagesMemberlyg:ExpectedCreditLossesInRespectOfUndrawnExposuresMemberlyg:Stage2Member2022-12-310001160106lyg:RMS13Memberlyg:RetailMortgagesMemberlyg:Stage3Memberlyg:ExpectedCreditLossesInRespectOfUndrawnExposuresMember2022-12-310001160106lyg:RMS13Memberlyg:PurchasedOrOriginatedCreditimpairedMemberlyg:RetailMortgagesMemberlyg:ExpectedCreditLossesInRespectOfUndrawnExposuresMember2022-12-310001160106lyg:RMS13Memberlyg:RetailMortgagesMemberlyg:ExpectedCreditLossesInRespectOfUndrawnExposuresMember2022-12-310001160106lyg:GrossUndrawnExposuresMemberlyg:RMS46Memberlyg:RetailMortgagesMemberlyg:Stage1Member2022-12-310001160106lyg:GrossUndrawnExposuresMemberlyg:RMS46Memberlyg:RetailMortgagesMemberlyg:Stage2Member2022-12-310001160106lyg:GrossUndrawnExposuresMemberlyg:RMS46Memberlyg:RetailMortgagesMemberlyg:Stage3Member2022-12-310001160106lyg:GrossUndrawnExposuresMemberlyg:RMS46Memberlyg:PurchasedOrOriginatedCreditimpairedMemberlyg:RetailMortgagesMember2022-12-310001160106lyg:GrossUndrawnExposuresMemberlyg:RMS46Memberlyg:RetailMortgagesMember2022-12-310001160106lyg:RMS46Memberlyg:RetailMortgagesMemberlyg:Stage1Memberlyg:ExpectedCreditLossesInRespectOfUndrawnExposuresMember2022-12-310001160106lyg:RMS46Memberlyg:RetailMortgagesMemberlyg:ExpectedCreditLossesInRespectOfUndrawnExposuresMemberlyg:Stage2Member2022-12-310001160106lyg:RMS46Memberlyg:RetailMortgagesMemberlyg:Stage3Memberlyg:ExpectedCreditLossesInRespectOfUndrawnExposuresMember2022-12-310001160106lyg:RMS46Memberlyg:PurchasedOrOriginatedCreditimpairedMemberlyg:RetailMortgagesMemberlyg:ExpectedCreditLossesInRespectOfUndrawnExposuresMember2022-12-310001160106lyg:RMS46Memberlyg:RetailMortgagesMemberlyg:ExpectedCreditLossesInRespectOfUndrawnExposuresMember2022-12-310001160106lyg:GrossUndrawnExposuresMemberlyg:RetailMortgagesMemberlyg:Stage1Memberlyg:RMS79Member2022-12-310001160106lyg:GrossUndrawnExposuresMemberlyg:RetailMortgagesMemberlyg:RMS79Memberlyg:Stage2Member2022-12-310001160106lyg:GrossUndrawnExposuresMemberlyg:RetailMortgagesMemberlyg:Stage3Memberlyg:RMS79Member2022-12-310001160106lyg:GrossUndrawnExposuresMemberlyg:PurchasedOrOriginatedCreditimpairedMemberlyg:RetailMortgagesMemberlyg:RMS79Member2022-12-310001160106lyg:GrossUndrawnExposuresMemberlyg:RetailMortgagesMemberlyg:RMS79Member2022-12-310001160106lyg:RetailMortgagesMemberlyg:Stage1Memberlyg:RMS79Memberlyg:ExpectedCreditLossesInRespectOfUndrawnExposuresMember2022-12-310001160106lyg:RetailMortgagesMemberlyg:RMS79Memberlyg:ExpectedCreditLossesInRespectOfUndrawnExposuresMemberlyg:Stage2Member2022-12-310001160106lyg:RetailMortgagesMemberlyg:Stage3Memberlyg:RMS79Memberlyg:ExpectedCreditLossesInRespectOfUndrawnExposuresMember2022-12-310001160106lyg:PurchasedOrOriginatedCreditimpairedMemberlyg:RetailMortgagesMemberlyg:RMS79Memberlyg:ExpectedCreditLossesInRespectOfUndrawnExposuresMember2022-12-310001160106lyg:RetailMortgagesMemberlyg:RMS79Memberlyg:ExpectedCreditLossesInRespectOfUndrawnExposuresMember2022-12-310001160106lyg:GrossUndrawnExposuresMemberlyg:RetailMortgagesMemberlyg:Stage1Memberlyg:RMS10Member2022-12-310001160106lyg:GrossUndrawnExposuresMemberlyg:RetailMortgagesMemberlyg:RMS10Memberlyg:Stage2Member2022-12-310001160106lyg:GrossUndrawnExposuresMemberlyg:RetailMortgagesMemberlyg:Stage3Memberlyg:RMS10Member2022-12-310001160106lyg:GrossUndrawnExposuresMemberlyg:PurchasedOrOriginatedCreditimpairedMemberlyg:RetailMortgagesMemberlyg:RMS10Member2022-12-310001160106lyg:GrossUndrawnExposuresMemberlyg:RetailMortgagesMemberlyg:RMS10Member2022-12-310001160106lyg:RetailMortgagesMemberlyg:Stage1Memberlyg:ExpectedCreditLossesInRespectOfUndrawnExposuresMemberlyg:RMS10Member2022-12-310001160106lyg:RetailMortgagesMemberlyg:ExpectedCreditLossesInRespectOfUndrawnExposuresMemberlyg:RMS10Memberlyg:Stage2Member2022-12-310001160106lyg:RetailMortgagesMemberlyg:Stage3Memberlyg:ExpectedCreditLossesInRespectOfUndrawnExposuresMemberlyg:RMS10Member2022-12-310001160106lyg:PurchasedOrOriginatedCreditimpairedMemberlyg:RetailMortgagesMemberlyg:ExpectedCreditLossesInRespectOfUndrawnExposuresMemberlyg:RMS10Member2022-12-310001160106lyg:RetailMortgagesMemberlyg:ExpectedCreditLossesInRespectOfUndrawnExposuresMemberlyg:RMS10Member2022-12-310001160106lyg:GrossUndrawnExposuresMemberlyg:RetailMortgagesMemberlyg:RMS1113Memberlyg:Stage1Member2022-12-310001160106lyg:GrossUndrawnExposuresMemberlyg:RetailMortgagesMemberlyg:RMS1113Memberlyg:Stage2Member2022-12-310001160106lyg:GrossUndrawnExposuresMemberlyg:RetailMortgagesMemberlyg:RMS1113Memberlyg:Stage3Member2022-12-310001160106lyg:GrossUndrawnExposuresMemberlyg:PurchasedOrOriginatedCreditimpairedMemberlyg:RetailMortgagesMemberlyg:RMS1113Member2022-12-310001160106lyg:GrossUndrawnExposuresMemberlyg:RetailMortgagesMemberlyg:RMS1113Member2022-12-310001160106lyg:RetailMortgagesMemberlyg:RMS1113Memberlyg:Stage1Memberlyg:ExpectedCreditLossesInRespectOfUndrawnExposuresMember2022-12-310001160106lyg:RetailMortgagesMemberlyg:RMS1113Memberlyg:ExpectedCreditLossesInRespectOfUndrawnExposuresMemberlyg:Stage2Member2022-12-310001160106lyg:RetailMortgagesMemberlyg:RMS1113Memberlyg:Stage3Memberlyg:ExpectedCreditLossesInRespectOfUndrawnExposuresMember2022-12-310001160106lyg:PurchasedOrOriginatedCreditimpairedMemberlyg:RetailMortgagesMemberlyg:RMS1113Memberlyg:ExpectedCreditLossesInRespectOfUndrawnExposuresMember2022-12-310001160106lyg:RetailMortgagesMemberlyg:RMS1113Memberlyg:ExpectedCreditLossesInRespectOfUndrawnExposuresMember2022-12-310001160106lyg:GrossUndrawnExposuresMemberlyg:RetailMortgagesMemberlyg:Stage1Memberlyg:RMS14Member2022-12-310001160106lyg:GrossUndrawnExposuresMemberlyg:RetailMortgagesMemberlyg:RMS14Memberlyg:Stage2Member2022-12-310001160106lyg:GrossUndrawnExposuresMemberlyg:RetailMortgagesMemberlyg:Stage3Memberlyg:RMS14Member2022-12-310001160106lyg:GrossUndrawnExposuresMemberlyg:PurchasedOrOriginatedCreditimpairedMemberlyg:RetailMortgagesMemberlyg:RMS14Member2022-12-310001160106lyg:GrossUndrawnExposuresMemberlyg:RetailMortgagesMemberlyg:RMS14Member2022-12-310001160106lyg:RetailMortgagesMemberlyg:Stage1Memberlyg:RMS14Memberlyg:ExpectedCreditLossesInRespectOfUndrawnExposuresMember2022-12-310001160106lyg:RetailMortgagesMemberlyg:RMS14Memberlyg:ExpectedCreditLossesInRespectOfUndrawnExposuresMemberlyg:Stage2Member2022-12-310001160106lyg:RetailMortgagesMemberlyg:Stage3Memberlyg:RMS14Memberlyg:ExpectedCreditLossesInRespectOfUndrawnExposuresMember2022-12-310001160106lyg:PurchasedOrOriginatedCreditimpairedMemberlyg:RetailMortgagesMemberlyg:RMS14Memberlyg:ExpectedCreditLossesInRespectOfUndrawnExposuresMember2022-12-310001160106lyg:RetailMortgagesMemberlyg:RMS14Memberlyg:ExpectedCreditLossesInRespectOfUndrawnExposuresMember2022-12-310001160106lyg:GrossUndrawnExposuresMemberlyg:RetailMortgagesMemberlyg:Stage1Member2022-12-310001160106lyg:GrossUndrawnExposuresMemberlyg:RetailMortgagesMemberlyg:Stage2Member2022-12-310001160106lyg:GrossUndrawnExposuresMemberlyg:RetailMortgagesMemberlyg:Stage3Member2022-12-310001160106lyg:GrossUndrawnExposuresMemberlyg:PurchasedOrOriginatedCreditimpairedMemberlyg:RetailMortgagesMember2022-12-310001160106lyg:GrossUndrawnExposuresMemberlyg:RetailMortgagesMember2022-12-310001160106lyg:RetailMortgagesMemberlyg:Stage1Memberlyg:ExpectedCreditLossesInRespectOfUndrawnExposuresMember2022-12-310001160106lyg:RetailMortgagesMemberlyg:ExpectedCreditLossesInRespectOfUndrawnExposuresMemberlyg:Stage2Member2022-12-310001160106lyg:RetailMortgagesMemberlyg:Stage3Memberlyg:ExpectedCreditLossesInRespectOfUndrawnExposuresMember2022-12-310001160106lyg:PurchasedOrOriginatedCreditimpairedMemberlyg:RetailMortgagesMemberlyg:ExpectedCreditLossesInRespectOfUndrawnExposuresMember2022-12-310001160106lyg:RetailMortgagesMemberlyg:ExpectedCreditLossesInRespectOfUndrawnExposuresMember2022-12-310001160106lyg:GrossUndrawnExposuresMemberlyg:RMS13Memberlyg:RetailCreditCardsMemberlyg:Stage1Member2022-12-310001160106lyg:GrossUndrawnExposuresMemberlyg:RMS13Memberlyg:RetailCreditCardsMemberlyg:Stage2Member2022-12-310001160106lyg:GrossUndrawnExposuresMemberlyg:RMS13Memberlyg:RetailCreditCardsMemberlyg:Stage3Member2022-12-310001160106lyg:GrossUndrawnExposuresMemberlyg:RMS13Memberlyg:PurchasedOrOriginatedCreditimpairedMemberlyg:RetailCreditCardsMember2022-12-310001160106lyg:GrossUndrawnExposuresMemberlyg:RMS13Memberlyg:RetailCreditCardsMember2022-12-310001160106lyg:RMS13Memberlyg:RetailCreditCardsMemberlyg:Stage1Memberlyg:ExpectedCreditLossesInRespectOfUndrawnExposuresMember2022-12-310001160106lyg:RMS13Memberlyg:RetailCreditCardsMemberlyg:ExpectedCreditLossesInRespectOfUndrawnExposuresMemberlyg:Stage2Member2022-12-310001160106lyg:RMS13Memberlyg:RetailCreditCardsMemberlyg:Stage3Memberlyg:ExpectedCreditLossesInRespectOfUndrawnExposuresMember2022-12-310001160106lyg:RMS13Memberlyg:PurchasedOrOriginatedCreditimpairedMemberlyg:RetailCreditCardsMemberlyg:ExpectedCreditLossesInRespectOfUndrawnExposuresMember2022-12-310001160106lyg:RMS13Memberlyg:RetailCreditCardsMemberlyg:ExpectedCreditLossesInRespectOfUndrawnExposuresMember2022-12-310001160106lyg:GrossUndrawnExposuresMemberlyg:RMS46Memberlyg:RetailCreditCardsMemberlyg:Stage1Member2022-12-310001160106lyg:GrossUndrawnExposuresMemberlyg:RMS46Memberlyg:RetailCreditCardsMemberlyg:Stage2Member2022-12-310001160106lyg:GrossUndrawnExposuresMemberlyg:RMS46Memberlyg:RetailCreditCardsMemberlyg:Stage3Member2022-12-310001160106lyg:GrossUndrawnExposuresMemberlyg:RMS46Memberlyg:PurchasedOrOriginatedCreditimpairedMemberlyg:RetailCreditCardsMember2022-12-310001160106lyg:GrossUndrawnExposuresMemberlyg:RMS46Memberlyg:RetailCreditCardsMember2022-12-310001160106lyg:RMS46Memberlyg:RetailCreditCardsMemberlyg:Stage1Memberlyg:ExpectedCreditLossesInRespectOfUndrawnExposuresMember2022-12-310001160106lyg:RMS46Memberlyg:RetailCreditCardsMemberlyg:ExpectedCreditLossesInRespectOfUndrawnExposuresMemberlyg:Stage2Member2022-12-310001160106lyg:RMS46Memberlyg:RetailCreditCardsMemberlyg:Stage3Memberlyg:ExpectedCreditLossesInRespectOfUndrawnExposuresMember2022-12-310001160106lyg:RMS46Memberlyg:PurchasedOrOriginatedCreditimpairedMemberlyg:RetailCreditCardsMemberlyg:ExpectedCreditLossesInRespectOfUndrawnExposuresMember2022-12-310001160106lyg:RMS46Memberlyg:RetailCreditCardsMemberlyg:ExpectedCreditLossesInRespectOfUndrawnExposuresMember2022-12-310001160106lyg:GrossUndrawnExposuresMemberlyg:RetailCreditCardsMemberlyg:Stage1Memberlyg:RMS79Member2022-12-310001160106lyg:GrossUndrawnExposuresMemberlyg:RetailCreditCardsMemberlyg:RMS79Memberlyg:Stage2Member2022-12-310001160106lyg:GrossUndrawnExposuresMemberlyg:RetailCreditCardsMemberlyg:Stage3Memberlyg:RMS79Member2022-12-310001160106lyg:GrossUndrawnExposuresMemberlyg:PurchasedOrOriginatedCreditimpairedMemberlyg:RetailCreditCardsMemberlyg:RMS79Member2022-12-310001160106lyg:GrossUndrawnExposuresMemberlyg:RetailCreditCardsMemberlyg:RMS79Member2022-12-310001160106lyg:RetailCreditCardsMemberlyg:Stage1Memberlyg:RMS79Memberlyg:ExpectedCreditLossesInRespectOfUndrawnExposuresMember2022-12-310001160106lyg:RetailCreditCardsMemberlyg:RMS79Memberlyg:ExpectedCreditLossesInRespectOfUndrawnExposuresMemberlyg:Stage2Member2022-12-310001160106lyg:RetailCreditCardsMemberlyg:Stage3Memberlyg:RMS79Memberlyg:ExpectedCreditLossesInRespectOfUndrawnExposuresMember2022-12-310001160106lyg:PurchasedOrOriginatedCreditimpairedMemberlyg:RetailCreditCardsMemberlyg:RMS79Memberlyg:ExpectedCreditLossesInRespectOfUndrawnExposuresMember2022-12-310001160106lyg:RetailCreditCardsMemberlyg:RMS79Memberlyg:ExpectedCreditLossesInRespectOfUndrawnExposuresMember2022-12-310001160106lyg:GrossUndrawnExposuresMemberlyg:RetailCreditCardsMemberlyg:Stage1Memberlyg:RMS10Member2022-12-310001160106lyg:GrossUndrawnExposuresMemberlyg:RetailCreditCardsMemberlyg:RMS10Memberlyg:Stage2Member2022-12-310001160106lyg:GrossUndrawnExposuresMemberlyg:RetailCreditCardsMemberlyg:Stage3Memberlyg:RMS10Member2022-12-310001160106lyg:GrossUndrawnExposuresMemberlyg:PurchasedOrOriginatedCreditimpairedMemberlyg:RetailCreditCardsMemberlyg:RMS10Member2022-12-310001160106lyg:GrossUndrawnExposuresMemberlyg:RetailCreditCardsMemberlyg:RMS10Member2022-12-310001160106lyg:RetailCreditCardsMemberlyg:Stage1Memberlyg:ExpectedCreditLossesInRespectOfUndrawnExposuresMemberlyg:RMS10Member2022-12-310001160106lyg:RetailCreditCardsMemberlyg:ExpectedCreditLossesInRespectOfUndrawnExposuresMemberlyg:RMS10Memberlyg:Stage2Member2022-12-310001160106lyg:RetailCreditCardsMemberlyg:Stage3Memberlyg:ExpectedCreditLossesInRespectOfUndrawnExposuresMemberlyg:RMS10Member2022-12-310001160106lyg:PurchasedOrOriginatedCreditimpairedMemberlyg:RetailCreditCardsMemberlyg:ExpectedCreditLossesInRespectOfUndrawnExposuresMemberlyg:RMS10Member2022-12-310001160106lyg:RetailCreditCardsMemberlyg:ExpectedCreditLossesInRespectOfUndrawnExposuresMemberlyg:RMS10Member2022-12-310001160106lyg:GrossUndrawnExposuresMemberlyg:RetailCreditCardsMemberlyg:RMS1113Memberlyg:Stage1Member2022-12-310001160106lyg:GrossUndrawnExposuresMemberlyg:RetailCreditCardsMemberlyg:RMS1113Memberlyg:Stage2Member2022-12-310001160106lyg:GrossUndrawnExposuresMemberlyg:RetailCreditCardsMemberlyg:RMS1113Memberlyg:Stage3Member2022-12-310001160106lyg:GrossUndrawnExposuresMemberlyg:PurchasedOrOriginatedCreditimpairedMemberlyg:RetailCreditCardsMemberlyg:RMS1113Member2022-12-310001160106lyg:GrossUndrawnExposuresMemberlyg:RetailCreditCardsMemberlyg:RMS1113Member2022-12-310001160106lyg:RetailCreditCardsMemberlyg:RMS1113Memberlyg:Stage1Memberlyg:ExpectedCreditLossesInRespectOfUndrawnExposuresMember2022-12-310001160106lyg:RetailCreditCardsMemberlyg:RMS1113Memberlyg:ExpectedCreditLossesInRespectOfUndrawnExposuresMemberlyg:Stage2Member2022-12-310001160106lyg:RetailCreditCardsMemberlyg:RMS1113Memberlyg:Stage3Memberlyg:ExpectedCreditLossesInRespectOfUndrawnExposuresMember2022-12-310001160106lyg:PurchasedOrOriginatedCreditimpairedMemberlyg:RetailCreditCardsMemberlyg:RMS1113Memberlyg:ExpectedCreditLossesInRespectOfUndrawnExposuresMember2022-12-310001160106lyg:RetailCreditCardsMemberlyg:RMS1113Memberlyg:ExpectedCreditLossesInRespectOfUndrawnExposuresMember2022-12-310001160106lyg:GrossUndrawnExposuresMemberlyg:RetailCreditCardsMemberlyg:Stage1Memberlyg:RMS14Member2022-12-310001160106lyg:GrossUndrawnExposuresMemberlyg:RetailCreditCardsMemberlyg:RMS14Memberlyg:Stage2Member2022-12-310001160106lyg:GrossUndrawnExposuresMemberlyg:RetailCreditCardsMemberlyg:Stage3Memberlyg:RMS14Member2022-12-310001160106lyg:GrossUndrawnExposuresMemberlyg:PurchasedOrOriginatedCreditimpairedMemberlyg:RetailCreditCardsMemberlyg:RMS14Member2022-12-310001160106lyg:GrossUndrawnExposuresMemberlyg:RetailCreditCardsMemberlyg:RMS14Member2022-12-310001160106lyg:RetailCreditCardsMemberlyg:Stage1Memberlyg:RMS14Memberlyg:ExpectedCreditLossesInRespectOfUndrawnExposuresMember2022-12-310001160106lyg:RetailCreditCardsMemberlyg:RMS14Memberlyg:ExpectedCreditLossesInRespectOfUndrawnExposuresMemberlyg:Stage2Member2022-12-310001160106lyg:RetailCreditCardsMemberlyg:Stage3Memberlyg:RMS14Memberlyg:ExpectedCreditLossesInRespectOfUndrawnExposuresMember2022-12-310001160106lyg:PurchasedOrOriginatedCreditimpairedMemberlyg:RetailCreditCardsMemberlyg:RMS14Memberlyg:ExpectedCreditLossesInRespectOfUndrawnExposuresMember2022-12-310001160106lyg:RetailCreditCardsMemberlyg:RMS14Memberlyg:ExpectedCreditLossesInRespectOfUndrawnExposuresMember2022-12-310001160106lyg:GrossUndrawnExposuresMemberlyg:RetailCreditCardsMemberlyg:Stage1Member2022-12-310001160106lyg:GrossUndrawnExposuresMemberlyg:RetailCreditCardsMemberlyg:Stage2Member2022-12-310001160106lyg:GrossUndrawnExposuresMemberlyg:RetailCreditCardsMemberlyg:Stage3Member2022-12-310001160106lyg:GrossUndrawnExposuresMemberlyg:PurchasedOrOriginatedCreditimpairedMemberlyg:RetailCreditCardsMember2022-12-310001160106lyg:GrossUndrawnExposuresMemberlyg:RetailCreditCardsMember2022-12-310001160106lyg:RetailCreditCardsMemberlyg:Stage1Memberlyg:ExpectedCreditLossesInRespectOfUndrawnExposuresMember2022-12-310001160106lyg:RetailCreditCardsMemberlyg:ExpectedCreditLossesInRespectOfUndrawnExposuresMemberlyg:Stage2Member2022-12-310001160106lyg:RetailCreditCardsMemberlyg:Stage3Memberlyg:ExpectedCreditLossesInRespectOfUndrawnExposuresMember2022-12-310001160106lyg:PurchasedOrOriginatedCreditimpairedMemberlyg:RetailCreditCardsMemberlyg:ExpectedCreditLossesInRespectOfUndrawnExposuresMember2022-12-310001160106lyg:RetailCreditCardsMemberlyg:ExpectedCreditLossesInRespectOfUndrawnExposuresMember2022-12-310001160106lyg:GrossUndrawnExposuresMemberlyg:RetailLoansAndOverdraftsMemberlyg:RMS13Memberlyg:Stage1Member2022-12-310001160106lyg:GrossUndrawnExposuresMemberlyg:RetailLoansAndOverdraftsMemberlyg:RMS13Memberlyg:Stage2Member2022-12-310001160106lyg:GrossUndrawnExposuresMemberlyg:RetailLoansAndOverdraftsMemberlyg:RMS13Memberlyg:Stage3Member2022-12-310001160106lyg:GrossUndrawnExposuresMemberlyg:RetailLoansAndOverdraftsMemberlyg:RMS13Memberlyg:PurchasedOrOriginatedCreditimpairedMember2022-12-310001160106lyg:GrossUndrawnExposuresMemberlyg:RetailLoansAndOverdraftsMemberlyg:RMS13Member2022-12-310001160106lyg:RetailLoansAndOverdraftsMemberlyg:RMS13Memberlyg:Stage1Memberlyg:ExpectedCreditLossesInRespectOfUndrawnExposuresMember2022-12-310001160106lyg:RetailLoansAndOverdraftsMemberlyg:RMS13Memberlyg:ExpectedCreditLossesInRespectOfUndrawnExposuresMemberlyg:Stage2Member2022-12-310001160106lyg:RetailLoansAndOverdraftsMemberlyg:RMS13Memberlyg:Stage3Memberlyg:ExpectedCreditLossesInRespectOfUndrawnExposuresMember2022-12-310001160106lyg:RetailLoansAndOverdraftsMemberlyg:RMS13Memberlyg:PurchasedOrOriginatedCreditimpairedMemberlyg:ExpectedCreditLossesInRespectOfUndrawnExposuresMember2022-12-310001160106lyg:RetailLoansAndOverdraftsMemberlyg:RMS13Memberlyg:ExpectedCreditLossesInRespectOfUndrawnExposuresMember2022-12-310001160106lyg:GrossUndrawnExposuresMemberlyg:RetailLoansAndOverdraftsMemberlyg:RMS46Memberlyg:Stage1Member2022-12-310001160106lyg:GrossUndrawnExposuresMemberlyg:RetailLoansAndOverdraftsMemberlyg:RMS46Memberlyg:Stage2Member2022-12-310001160106lyg:GrossUndrawnExposuresMemberlyg:RetailLoansAndOverdraftsMemberlyg:RMS46Memberlyg:Stage3Member2022-12-310001160106lyg:GrossUndrawnExposuresMemberlyg:RetailLoansAndOverdraftsMemberlyg:RMS46Memberlyg:PurchasedOrOriginatedCreditimpairedMember2022-12-310001160106lyg:GrossUndrawnExposuresMemberlyg:RetailLoansAndOverdraftsMemberlyg:RMS46Member2022-12-310001160106lyg:RetailLoansAndOverdraftsMemberlyg:RMS46Memberlyg:Stage1Memberlyg:ExpectedCreditLossesInRespectOfUndrawnExposuresMember2022-12-310001160106lyg:RetailLoansAndOverdraftsMemberlyg:RMS46Memberlyg:ExpectedCreditLossesInRespectOfUndrawnExposuresMemberlyg:Stage2Member2022-12-310001160106lyg:RetailLoansAndOverdraftsMemberlyg:RMS46Memberlyg:Stage3Memberlyg:ExpectedCreditLossesInRespectOfUndrawnExposuresMember2022-12-310001160106lyg:RetailLoansAndOverdraftsMemberlyg:RMS46Memberlyg:PurchasedOrOriginatedCreditimpairedMemberlyg:ExpectedCreditLossesInRespectOfUndrawnExposuresMember2022-12-310001160106lyg:RetailLoansAndOverdraftsMemberlyg:RMS46Memberlyg:ExpectedCreditLossesInRespectOfUndrawnExposuresMember2022-12-310001160106lyg:GrossUndrawnExposuresMemberlyg:RetailLoansAndOverdraftsMemberlyg:Stage1Memberlyg:RMS79Member2022-12-310001160106lyg:GrossUndrawnExposuresMemberlyg:RetailLoansAndOverdraftsMemberlyg:RMS79Memberlyg:Stage2Member2022-12-310001160106lyg:GrossUndrawnExposuresMemberlyg:RetailLoansAndOverdraftsMemberlyg:Stage3Memberlyg:RMS79Member2022-12-310001160106lyg:GrossUndrawnExposuresMemberlyg:RetailLoansAndOverdraftsMemberlyg:PurchasedOrOriginatedCreditimpairedMemberlyg:RMS79Member2022-12-310001160106lyg:GrossUndrawnExposuresMemberlyg:RetailLoansAndOverdraftsMemberlyg:RMS79Member2022-12-310001160106lyg:RetailLoansAndOverdraftsMemberlyg:Stage1Memberlyg:RMS79Memberlyg:ExpectedCreditLossesInRespectOfUndrawnExposuresMember2022-12-310001160106lyg:RetailLoansAndOverdraftsMemberlyg:RMS79Memberlyg:ExpectedCreditLossesInRespectOfUndrawnExposuresMemberlyg:Stage2Member2022-12-310001160106lyg:RetailLoansAndOverdraftsMemberlyg:Stage3Memberlyg:RMS79Memberlyg:ExpectedCreditLossesInRespectOfUndrawnExposuresMember2022-12-310001160106lyg:RetailLoansAndOverdraftsMemberlyg:PurchasedOrOriginatedCreditimpairedMemberlyg:RMS79Memberlyg:ExpectedCreditLossesInRespectOfUndrawnExposuresMember2022-12-310001160106lyg:RetailLoansAndOverdraftsMemberlyg:RMS79Memberlyg:ExpectedCreditLossesInRespectOfUndrawnExposuresMember2022-12-310001160106lyg:GrossUndrawnExposuresMemberlyg:RetailLoansAndOverdraftsMemberlyg:Stage1Memberlyg:RMS10Member2022-12-310001160106lyg:GrossUndrawnExposuresMemberlyg:RetailLoansAndOverdraftsMemberlyg:RMS10Memberlyg:Stage2Member2022-12-310001160106lyg:GrossUndrawnExposuresMemberlyg:RetailLoansAndOverdraftsMemberlyg:Stage3Memberlyg:RMS10Member2022-12-310001160106lyg:GrossUndrawnExposuresMemberlyg:RetailLoansAndOverdraftsMemberlyg:PurchasedOrOriginatedCreditimpairedMemberlyg:RMS10Member2022-12-310001160106lyg:GrossUndrawnExposuresMemberlyg:RetailLoansAndOverdraftsMemberlyg:RMS10Member2022-12-310001160106lyg:RetailLoansAndOverdraftsMemberlyg:Stage1Memberlyg:ExpectedCreditLossesInRespectOfUndrawnExposuresMemberlyg:RMS10Member2022-12-310001160106lyg:RetailLoansAndOverdraftsMemberlyg:ExpectedCreditLossesInRespectOfUndrawnExposuresMemberlyg:RMS10Memberlyg:Stage2Member2022-12-310001160106lyg:RetailLoansAndOverdraftsMemberlyg:Stage3Memberlyg:ExpectedCreditLossesInRespectOfUndrawnExposuresMemberlyg:RMS10Member2022-12-310001160106lyg:RetailLoansAndOverdraftsMemberlyg:PurchasedOrOriginatedCreditimpairedMemberlyg:ExpectedCreditLossesInRespectOfUndrawnExposuresMemberlyg:RMS10Member2022-12-310001160106lyg:RetailLoansAndOverdraftsMemberlyg:ExpectedCreditLossesInRespectOfUndrawnExposuresMemberlyg:RMS10Member2022-12-310001160106lyg:GrossUndrawnExposuresMemberlyg:RetailLoansAndOverdraftsMemberlyg:RMS1113Memberlyg:Stage1Member2022-12-310001160106lyg:GrossUndrawnExposuresMemberlyg:RetailLoansAndOverdraftsMemberlyg:RMS1113Memberlyg:Stage2Member2022-12-310001160106lyg:GrossUndrawnExposuresMemberlyg:RetailLoansAndOverdraftsMemberlyg:RMS1113Memberlyg:Stage3Member2022-12-310001160106lyg:GrossUndrawnExposuresMemberlyg:RetailLoansAndOverdraftsMemberlyg:PurchasedOrOriginatedCreditimpairedMemberlyg:RMS1113Member2022-12-310001160106lyg:GrossUndrawnExposuresMemberlyg:RetailLoansAndOverdraftsMemberlyg:RMS1113Member2022-12-310001160106lyg:RetailLoansAndOverdraftsMemberlyg:RMS1113Memberlyg:Stage1Memberlyg:ExpectedCreditLossesInRespectOfUndrawnExposuresMember2022-12-310001160106lyg:RetailLoansAndOverdraftsMemberlyg:RMS1113Memberlyg:ExpectedCreditLossesInRespectOfUndrawnExposuresMemberlyg:Stage2Member2022-12-310001160106lyg:RetailLoansAndOverdraftsMemberlyg:RMS1113Memberlyg:Stage3Memberlyg:ExpectedCreditLossesInRespectOfUndrawnExposuresMember2022-12-310001160106lyg:RetailLoansAndOverdraftsMemberlyg:PurchasedOrOriginatedCreditimpairedMemberlyg:RMS1113Memberlyg:ExpectedCreditLossesInRespectOfUndrawnExposuresMember2022-12-310001160106lyg:RetailLoansAndOverdraftsMemberlyg:RMS1113Memberlyg:ExpectedCreditLossesInRespectOfUndrawnExposuresMember2022-12-310001160106lyg:GrossUndrawnExposuresMemberlyg:RetailLoansAndOverdraftsMemberlyg:Stage1Memberlyg:RMS14Member2022-12-310001160106lyg:GrossUndrawnExposuresMemberlyg:RetailLoansAndOverdraftsMemberlyg:RMS14Memberlyg:Stage2Member2022-12-310001160106lyg:GrossUndrawnExposuresMemberlyg:RetailLoansAndOverdraftsMemberlyg:Stage3Memberlyg:RMS14Member2022-12-310001160106lyg:GrossUndrawnExposuresMemberlyg:RetailLoansAndOverdraftsMemberlyg:PurchasedOrOriginatedCreditimpairedMemberlyg:RMS14Member2022-12-310001160106lyg:GrossUndrawnExposuresMemberlyg:RetailLoansAndOverdraftsMemberlyg:RMS14Member2022-12-310001160106lyg:RetailLoansAndOverdraftsMemberlyg:Stage1Memberlyg:RMS14Memberlyg:ExpectedCreditLossesInRespectOfUndrawnExposuresMember2022-12-310001160106lyg:RetailLoansAndOverdraftsMemberlyg:RMS14Memberlyg:ExpectedCreditLossesInRespectOfUndrawnExposuresMemberlyg:Stage2Member2022-12-310001160106lyg:RetailLoansAndOverdraftsMemberlyg:Stage3Memberlyg:RMS14Memberlyg:ExpectedCreditLossesInRespectOfUndrawnExposuresMember2022-12-310001160106lyg:RetailLoansAndOverdraftsMemberlyg:PurchasedOrOriginatedCreditimpairedMemberlyg:RMS14Memberlyg:ExpectedCreditLossesInRespectOfUndrawnExposuresMember2022-12-310001160106lyg:RetailLoansAndOverdraftsMemberlyg:RMS14Memberlyg:ExpectedCreditLossesInRespectOfUndrawnExposuresMember2022-12-310001160106lyg:GrossUndrawnExposuresMemberlyg:RetailLoansAndOverdraftsMemberlyg:Stage1Member2022-12-310001160106lyg:GrossUndrawnExposuresMemberlyg:RetailLoansAndOverdraftsMemberlyg:Stage2Member2022-12-310001160106lyg:GrossUndrawnExposuresMemberlyg:RetailLoansAndOverdraftsMemberlyg:Stage3Member2022-12-310001160106lyg:GrossUndrawnExposuresMemberlyg:RetailLoansAndOverdraftsMemberlyg:PurchasedOrOriginatedCreditimpairedMember2022-12-310001160106lyg:GrossUndrawnExposuresMemberlyg:RetailLoansAndOverdraftsMember2022-12-310001160106lyg:RetailLoansAndOverdraftsMemberlyg:Stage1Memberlyg:ExpectedCreditLossesInRespectOfUndrawnExposuresMember2022-12-310001160106lyg:RetailLoansAndOverdraftsMemberlyg:ExpectedCreditLossesInRespectOfUndrawnExposuresMemberlyg:Stage2Member2022-12-310001160106lyg:RetailLoansAndOverdraftsMemberlyg:Stage3Memberlyg:ExpectedCreditLossesInRespectOfUndrawnExposuresMember2022-12-310001160106lyg:RetailLoansAndOverdraftsMemberlyg:PurchasedOrOriginatedCreditimpairedMemberlyg:ExpectedCreditLossesInRespectOfUndrawnExposuresMember2022-12-310001160106lyg:RetailLoansAndOverdraftsMemberlyg:ExpectedCreditLossesInRespectOfUndrawnExposuresMember2022-12-310001160106lyg:GrossUndrawnExposuresMemberlyg:RMS13Memberlyg:RetailUKMotorFinanceMemberlyg:Stage1Member2022-12-310001160106lyg:GrossUndrawnExposuresMemberlyg:RMS13Memberlyg:RetailUKMotorFinanceMemberlyg:Stage2Member2022-12-310001160106lyg:GrossUndrawnExposuresMemberlyg:RMS13Memberlyg:RetailUKMotorFinanceMemberlyg:Stage3Member2022-12-310001160106lyg:GrossUndrawnExposuresMemberlyg:RMS13Memberlyg:PurchasedOrOriginatedCreditimpairedMemberlyg:RetailUKMotorFinanceMember2022-12-310001160106lyg:GrossUndrawnExposuresMemberlyg:RMS13Memberlyg:RetailUKMotorFinanceMember2022-12-310001160106lyg:RMS13Memberlyg:RetailUKMotorFinanceMemberlyg:Stage1Memberlyg:ExpectedCreditLossesInRespectOfUndrawnExposuresMember2022-12-310001160106lyg:RMS13Memberlyg:RetailUKMotorFinanceMemberlyg:ExpectedCreditLossesInRespectOfUndrawnExposuresMemberlyg:Stage2Member2022-12-310001160106lyg:RMS13Memberlyg:RetailUKMotorFinanceMemberlyg:Stage3Memberlyg:ExpectedCreditLossesInRespectOfUndrawnExposuresMember2022-12-310001160106lyg:RMS13Memberlyg:PurchasedOrOriginatedCreditimpairedMemberlyg:RetailUKMotorFinanceMemberlyg:ExpectedCreditLossesInRespectOfUndrawnExposuresMember2022-12-310001160106lyg:RMS13Memberlyg:RetailUKMotorFinanceMemberlyg:ExpectedCreditLossesInRespectOfUndrawnExposuresMember2022-12-310001160106lyg:GrossUndrawnExposuresMemberlyg:RMS46Memberlyg:RetailUKMotorFinanceMemberlyg:Stage1Member2022-12-310001160106lyg:GrossUndrawnExposuresMemberlyg:RMS46Memberlyg:RetailUKMotorFinanceMemberlyg:Stage2Member2022-12-310001160106lyg:GrossUndrawnExposuresMemberlyg:RMS46Memberlyg:RetailUKMotorFinanceMemberlyg:Stage3Member2022-12-310001160106lyg:GrossUndrawnExposuresMemberlyg:RMS46Memberlyg:PurchasedOrOriginatedCreditimpairedMemberlyg:RetailUKMotorFinanceMember2022-12-310001160106lyg:GrossUndrawnExposuresMemberlyg:RMS46Memberlyg:RetailUKMotorFinanceMember2022-12-310001160106lyg:RMS46Memberlyg:RetailUKMotorFinanceMemberlyg:Stage1Memberlyg:ExpectedCreditLossesInRespectOfUndrawnExposuresMember2022-12-310001160106lyg:RMS46Memberlyg:RetailUKMotorFinanceMemberlyg:ExpectedCreditLossesInRespectOfUndrawnExposuresMemberlyg:Stage2Member2022-12-310001160106lyg:RMS46Memberlyg:RetailUKMotorFinanceMemberlyg:Stage3Memberlyg:ExpectedCreditLossesInRespectOfUndrawnExposuresMember2022-12-310001160106lyg:RMS46Memberlyg:PurchasedOrOriginatedCreditimpairedMemberlyg:RetailUKMotorFinanceMemberlyg:ExpectedCreditLossesInRespectOfUndrawnExposuresMember2022-12-310001160106lyg:RMS46Memberlyg:RetailUKMotorFinanceMemberlyg:ExpectedCreditLossesInRespectOfUndrawnExposuresMember2022-12-310001160106lyg:GrossUndrawnExposuresMemberlyg:RetailUKMotorFinanceMemberlyg:Stage1Memberlyg:RMS79Member2022-12-310001160106lyg:GrossUndrawnExposuresMemberlyg:RetailUKMotorFinanceMemberlyg:RMS79Memberlyg:Stage2Member2022-12-310001160106lyg:GrossUndrawnExposuresMemberlyg:RetailUKMotorFinanceMemberlyg:Stage3Memberlyg:RMS79Member2022-12-310001160106lyg:GrossUndrawnExposuresMemberlyg:PurchasedOrOriginatedCreditimpairedMemberlyg:RetailUKMotorFinanceMemberlyg:RMS79Member2022-12-310001160106lyg:GrossUndrawnExposuresMemberlyg:RetailUKMotorFinanceMemberlyg:RMS79Member2022-12-310001160106lyg:RetailUKMotorFinanceMemberlyg:Stage1Memberlyg:RMS79Memberlyg:ExpectedCreditLossesInRespectOfUndrawnExposuresMember2022-12-310001160106lyg:RetailUKMotorFinanceMemberlyg:RMS79Memberlyg:ExpectedCreditLossesInRespectOfUndrawnExposuresMemberlyg:Stage2Member2022-12-310001160106lyg:RetailUKMotorFinanceMemberlyg:Stage3Memberlyg:RMS79Memberlyg:ExpectedCreditLossesInRespectOfUndrawnExposuresMember2022-12-310001160106lyg:PurchasedOrOriginatedCreditimpairedMemberlyg:RetailUKMotorFinanceMemberlyg:RMS79Memberlyg:ExpectedCreditLossesInRespectOfUndrawnExposuresMember2022-12-310001160106lyg:RetailUKMotorFinanceMemberlyg:RMS79Memberlyg:ExpectedCreditLossesInRespectOfUndrawnExposuresMember2022-12-310001160106lyg:GrossUndrawnExposuresMemberlyg:RetailUKMotorFinanceMemberlyg:Stage1Memberlyg:RMS10Member2022-12-310001160106lyg:GrossUndrawnExposuresMemberlyg:RetailUKMotorFinanceMemberlyg:RMS10Memberlyg:Stage2Member2022-12-310001160106lyg:GrossUndrawnExposuresMemberlyg:RetailUKMotorFinanceMemberlyg:Stage3Memberlyg:RMS10Member2022-12-310001160106lyg:GrossUndrawnExposuresMemberlyg:PurchasedOrOriginatedCreditimpairedMemberlyg:RetailUKMotorFinanceMemberlyg:RMS10Member2022-12-310001160106lyg:GrossUndrawnExposuresMemberlyg:RetailUKMotorFinanceMemberlyg:RMS10Member2022-12-310001160106lyg:RetailUKMotorFinanceMemberlyg:Stage1Memberlyg:ExpectedCreditLossesInRespectOfUndrawnExposuresMemberlyg:RMS10Member2022-12-310001160106lyg:RetailUKMotorFinanceMemberlyg:ExpectedCreditLossesInRespectOfUndrawnExposuresMemberlyg:RMS10Memberlyg:Stage2Member2022-12-310001160106lyg:RetailUKMotorFinanceMemberlyg:Stage3Memberlyg:ExpectedCreditLossesInRespectOfUndrawnExposuresMemberlyg:RMS10Member2022-12-310001160106lyg:PurchasedOrOriginatedCreditimpairedMemberlyg:RetailUKMotorFinanceMemberlyg:ExpectedCreditLossesInRespectOfUndrawnExposuresMemberlyg:RMS10Member2022-12-310001160106lyg:RetailUKMotorFinanceMemberlyg:ExpectedCreditLossesInRespectOfUndrawnExposuresMemberlyg:RMS10Member2022-12-310001160106lyg:GrossUndrawnExposuresMemberlyg:RetailUKMotorFinanceMemberlyg:RMS1113Memberlyg:Stage1Member2022-12-310001160106lyg:GrossUndrawnExposuresMemberlyg:RetailUKMotorFinanceMemberlyg:RMS1113Memberlyg:Stage2Member2022-12-310001160106lyg:GrossUndrawnExposuresMemberlyg:RetailUKMotorFinanceMemberlyg:RMS1113Memberlyg:Stage3Member2022-12-310001160106lyg:GrossUndrawnExposuresMemberlyg:PurchasedOrOriginatedCreditimpairedMemberlyg:RetailUKMotorFinanceMemberlyg:RMS1113Member2022-12-310001160106lyg:GrossUndrawnExposuresMemberlyg:RetailUKMotorFinanceMemberlyg:RMS1113Member2022-12-310001160106lyg:RetailUKMotorFinanceMemberlyg:RMS1113Memberlyg:Stage1Memberlyg:ExpectedCreditLossesInRespectOfUndrawnExposuresMember2022-12-310001160106lyg:RetailUKMotorFinanceMemberlyg:RMS1113Memberlyg:ExpectedCreditLossesInRespectOfUndrawnExposuresMemberlyg:Stage2Member2022-12-310001160106lyg:RetailUKMotorFinanceMemberlyg:RMS1113Memberlyg:Stage3Memberlyg:ExpectedCreditLossesInRespectOfUndrawnExposuresMember2022-12-310001160106lyg:PurchasedOrOriginatedCreditimpairedMemberlyg:RetailUKMotorFinanceMemberlyg:RMS1113Memberlyg:ExpectedCreditLossesInRespectOfUndrawnExposuresMember2022-12-310001160106lyg:RetailUKMotorFinanceMemberlyg:RMS1113Memberlyg:ExpectedCreditLossesInRespectOfUndrawnExposuresMember2022-12-310001160106lyg:GrossUndrawnExposuresMemberlyg:RetailUKMotorFinanceMemberlyg:Stage1Memberlyg:RMS14Member2022-12-310001160106lyg:GrossUndrawnExposuresMemberlyg:RetailUKMotorFinanceMemberlyg:RMS14Memberlyg:Stage2Member2022-12-310001160106lyg:GrossUndrawnExposuresMemberlyg:RetailUKMotorFinanceMemberlyg:Stage3Memberlyg:RMS14Member2022-12-310001160106lyg:GrossUndrawnExposuresMemberlyg:PurchasedOrOriginatedCreditimpairedMemberlyg:RetailUKMotorFinanceMemberlyg:RMS14Member2022-12-310001160106lyg:GrossUndrawnExposuresMemberlyg:RetailUKMotorFinanceMemberlyg:RMS14Member2022-12-310001160106lyg:RetailUKMotorFinanceMemberlyg:Stage1Memberlyg:RMS14Memberlyg:ExpectedCreditLossesInRespectOfUndrawnExposuresMember2022-12-310001160106lyg:RetailUKMotorFinanceMemberlyg:RMS14Memberlyg:ExpectedCreditLossesInRespectOfUndrawnExposuresMemberlyg:Stage2Member2022-12-310001160106lyg:RetailUKMotorFinanceMemberlyg:Stage3Memberlyg:RMS14Memberlyg:ExpectedCreditLossesInRespectOfUndrawnExposuresMember2022-12-310001160106lyg:PurchasedOrOriginatedCreditimpairedMemberlyg:RetailUKMotorFinanceMemberlyg:RMS14Memberlyg:ExpectedCreditLossesInRespectOfUndrawnExposuresMember2022-12-310001160106lyg:RetailUKMotorFinanceMemberlyg:RMS14Memberlyg:ExpectedCreditLossesInRespectOfUndrawnExposuresMember2022-12-310001160106lyg:GrossUndrawnExposuresMemberlyg:RetailUKMotorFinanceMemberlyg:Stage1Member2022-12-310001160106lyg:GrossUndrawnExposuresMemberlyg:RetailUKMotorFinanceMemberlyg:Stage2Member2022-12-310001160106lyg:GrossUndrawnExposuresMemberlyg:RetailUKMotorFinanceMemberlyg:Stage3Member2022-12-310001160106lyg:GrossUndrawnExposuresMemberlyg:PurchasedOrOriginatedCreditimpairedMemberlyg:RetailUKMotorFinanceMember2022-12-310001160106lyg:GrossUndrawnExposuresMemberlyg:RetailUKMotorFinanceMember2022-12-310001160106lyg:RetailUKMotorFinanceMemberlyg:Stage1Memberlyg:ExpectedCreditLossesInRespectOfUndrawnExposuresMember2022-12-310001160106lyg:RetailUKMotorFinanceMemberlyg:ExpectedCreditLossesInRespectOfUndrawnExposuresMemberlyg:Stage2Member2022-12-310001160106lyg:RetailUKMotorFinanceMemberlyg:Stage3Memberlyg:ExpectedCreditLossesInRespectOfUndrawnExposuresMember2022-12-310001160106lyg:PurchasedOrOriginatedCreditimpairedMemberlyg:RetailUKMotorFinanceMemberlyg:ExpectedCreditLossesInRespectOfUndrawnExposuresMember2022-12-310001160106lyg:RetailUKMotorFinanceMemberlyg:ExpectedCreditLossesInRespectOfUndrawnExposuresMember2022-12-310001160106lyg:GrossUndrawnExposuresMemberlyg:RMS13Memberlyg:RetailOtherMemberlyg:Stage1Member2022-12-310001160106lyg:GrossUndrawnExposuresMemberlyg:RMS13Memberlyg:RetailOtherMemberlyg:Stage2Member2022-12-310001160106lyg:GrossUndrawnExposuresMemberlyg:RMS13Memberlyg:RetailOtherMemberlyg:Stage3Member2022-12-310001160106lyg:GrossUndrawnExposuresMemberlyg:RMS13Memberlyg:PurchasedOrOriginatedCreditimpairedMemberlyg:RetailOtherMember2022-12-310001160106lyg:GrossUndrawnExposuresMemberlyg:RMS13Memberlyg:RetailOtherMember2022-12-310001160106lyg:RMS13Memberlyg:RetailOtherMemberlyg:Stage1Memberlyg:ExpectedCreditLossesInRespectOfUndrawnExposuresMember2022-12-310001160106lyg:RMS13Memberlyg:RetailOtherMemberlyg:ExpectedCreditLossesInRespectOfUndrawnExposuresMemberlyg:Stage2Member2022-12-310001160106lyg:RMS13Memberlyg:RetailOtherMemberlyg:Stage3Memberlyg:ExpectedCreditLossesInRespectOfUndrawnExposuresMember2022-12-310001160106lyg:RMS13Memberlyg:PurchasedOrOriginatedCreditimpairedMemberlyg:RetailOtherMemberlyg:ExpectedCreditLossesInRespectOfUndrawnExposuresMember2022-12-310001160106lyg:RMS13Memberlyg:RetailOtherMemberlyg:ExpectedCreditLossesInRespectOfUndrawnExposuresMember2022-12-310001160106lyg:GrossUndrawnExposuresMemberlyg:RMS46Memberlyg:RetailOtherMemberlyg:Stage1Member2022-12-310001160106lyg:GrossUndrawnExposuresMemberlyg:RMS46Memberlyg:RetailOtherMemberlyg:Stage2Member2022-12-310001160106lyg:GrossUndrawnExposuresMemberlyg:RMS46Memberlyg:RetailOtherMemberlyg:Stage3Member2022-12-310001160106lyg:GrossUndrawnExposuresMemberlyg:RMS46Memberlyg:PurchasedOrOriginatedCreditimpairedMemberlyg:RetailOtherMember2022-12-310001160106lyg:GrossUndrawnExposuresMemberlyg:RMS46Memberlyg:RetailOtherMember2022-12-310001160106lyg:RMS46Memberlyg:RetailOtherMemberlyg:Stage1Memberlyg:ExpectedCreditLossesInRespectOfUndrawnExposuresMember2022-12-310001160106lyg:RMS46Memberlyg:RetailOtherMemberlyg:ExpectedCreditLossesInRespectOfUndrawnExposuresMemberlyg:Stage2Member2022-12-310001160106lyg:RMS46Memberlyg:RetailOtherMemberlyg:Stage3Memberlyg:ExpectedCreditLossesInRespectOfUndrawnExposuresMember2022-12-310001160106lyg:RMS46Memberlyg:PurchasedOrOriginatedCreditimpairedMemberlyg:RetailOtherMemberlyg:ExpectedCreditLossesInRespectOfUndrawnExposuresMember2022-12-310001160106lyg:RMS46Memberlyg:RetailOtherMemberlyg:ExpectedCreditLossesInRespectOfUndrawnExposuresMember2022-12-310001160106lyg:GrossUndrawnExposuresMemberlyg:RetailOtherMemberlyg:Stage1Memberlyg:RMS79Member2022-12-310001160106lyg:GrossUndrawnExposuresMemberlyg:RetailOtherMemberlyg:RMS79Memberlyg:Stage2Member2022-12-310001160106lyg:GrossUndrawnExposuresMemberlyg:RetailOtherMemberlyg:Stage3Memberlyg:RMS79Member2022-12-310001160106lyg:GrossUndrawnExposuresMemberlyg:PurchasedOrOriginatedCreditimpairedMemberlyg:RetailOtherMemberlyg:RMS79Member2022-12-310001160106lyg:GrossUndrawnExposuresMemberlyg:RetailOtherMemberlyg:RMS79Member2022-12-310001160106lyg:RetailOtherMemberlyg:Stage1Memberlyg:RMS79Memberlyg:ExpectedCreditLossesInRespectOfUndrawnExposuresMember2022-12-310001160106lyg:RetailOtherMemberlyg:RMS79Memberlyg:ExpectedCreditLossesInRespectOfUndrawnExposuresMemberlyg:Stage2Member2022-12-310001160106lyg:RetailOtherMemberlyg:Stage3Memberlyg:RMS79Memberlyg:ExpectedCreditLossesInRespectOfUndrawnExposuresMember2022-12-310001160106lyg:PurchasedOrOriginatedCreditimpairedMemberlyg:RetailOtherMemberlyg:RMS79Memberlyg:ExpectedCreditLossesInRespectOfUndrawnExposuresMember2022-12-310001160106lyg:RetailOtherMemberlyg:RMS79Memberlyg:ExpectedCreditLossesInRespectOfUndrawnExposuresMember2022-12-310001160106lyg:GrossUndrawnExposuresMemberlyg:RetailOtherMemberlyg:Stage1Memberlyg:RMS10Member2022-12-310001160106lyg:GrossUndrawnExposuresMemberlyg:RetailOtherMemberlyg:RMS10Memberlyg:Stage2Member2022-12-310001160106lyg:GrossUndrawnExposuresMemberlyg:RetailOtherMemberlyg:Stage3Memberlyg:RMS10Member2022-12-310001160106lyg:GrossUndrawnExposuresMemberlyg:PurchasedOrOriginatedCreditimpairedMemberlyg:RetailOtherMemberlyg:RMS10Member2022-12-310001160106lyg:GrossUndrawnExposuresMemberlyg:RetailOtherMemberlyg:RMS10Member2022-12-310001160106lyg:RetailOtherMemberlyg:Stage1Memberlyg:ExpectedCreditLossesInRespectOfUndrawnExposuresMemberlyg:RMS10Member2022-12-310001160106lyg:RetailOtherMemberlyg:ExpectedCreditLossesInRespectOfUndrawnExposuresMemberlyg:RMS10Memberlyg:Stage2Member2022-12-310001160106lyg:RetailOtherMemberlyg:Stage3Memberlyg:ExpectedCreditLossesInRespectOfUndrawnExposuresMemberlyg:RMS10Member2022-12-310001160106lyg:PurchasedOrOriginatedCreditimpairedMemberlyg:RetailOtherMemberlyg:ExpectedCreditLossesInRespectOfUndrawnExposuresMemberlyg:RMS10Member2022-12-310001160106lyg:RetailOtherMemberlyg:ExpectedCreditLossesInRespectOfUndrawnExposuresMemberlyg:RMS10Member2022-12-310001160106lyg:GrossUndrawnExposuresMemberlyg:RetailOtherMemberlyg:RMS1113Memberlyg:Stage1Member2022-12-310001160106lyg:GrossUndrawnExposuresMemberlyg:RetailOtherMemberlyg:RMS1113Memberlyg:Stage2Member2022-12-310001160106lyg:GrossUndrawnExposuresMemberlyg:RetailOtherMemberlyg:RMS1113Memberlyg:Stage3Member2022-12-310001160106lyg:GrossUndrawnExposuresMemberlyg:PurchasedOrOriginatedCreditimpairedMemberlyg:RetailOtherMemberlyg:RMS1113Member2022-12-310001160106lyg:GrossUndrawnExposuresMemberlyg:RetailOtherMemberlyg:RMS1113Member2022-12-310001160106lyg:RetailOtherMemberlyg:RMS1113Memberlyg:Stage1Memberlyg:ExpectedCreditLossesInRespectOfUndrawnExposuresMember2022-12-310001160106lyg:RetailOtherMemberlyg:RMS1113Memberlyg:ExpectedCreditLossesInRespectOfUndrawnExposuresMemberlyg:Stage2Member2022-12-310001160106lyg:RetailOtherMemberlyg:RMS1113Memberlyg:Stage3Memberlyg:ExpectedCreditLossesInRespectOfUndrawnExposuresMember2022-12-310001160106lyg:PurchasedOrOriginatedCreditimpairedMemberlyg:RetailOtherMemberlyg:RMS1113Memberlyg:ExpectedCreditLossesInRespectOfUndrawnExposuresMember2022-12-310001160106lyg:RetailOtherMemberlyg:RMS1113Memberlyg:ExpectedCreditLossesInRespectOfUndrawnExposuresMember2022-12-310001160106lyg:GrossUndrawnExposuresMemberlyg:RetailOtherMemberlyg:Stage1Memberlyg:RMS14Member2022-12-310001160106lyg:GrossUndrawnExposuresMemberlyg:RetailOtherMemberlyg:RMS14Memberlyg:Stage2Member2022-12-310001160106lyg:GrossUndrawnExposuresMemberlyg:RetailOtherMemberlyg:Stage3Memberlyg:RMS14Member2022-12-310001160106lyg:GrossUndrawnExposuresMemberlyg:PurchasedOrOriginatedCreditimpairedMemberlyg:RetailOtherMemberlyg:RMS14Member2022-12-310001160106lyg:GrossUndrawnExposuresMemberlyg:RetailOtherMemberlyg:RMS14Member2022-12-310001160106lyg:RetailOtherMemberlyg:Stage1Memberlyg:RMS14Memberlyg:ExpectedCreditLossesInRespectOfUndrawnExposuresMember2022-12-310001160106lyg:RetailOtherMemberlyg:RMS14Memberlyg:ExpectedCreditLossesInRespectOfUndrawnExposuresMemberlyg:Stage2Member2022-12-310001160106lyg:RetailOtherMemberlyg:Stage3Memberlyg:RMS14Memberlyg:ExpectedCreditLossesInRespectOfUndrawnExposuresMember2022-12-310001160106lyg:PurchasedOrOriginatedCreditimpairedMemberlyg:RetailOtherMemberlyg:RMS14Memberlyg:ExpectedCreditLossesInRespectOfUndrawnExposuresMember2022-12-310001160106lyg:RetailOtherMemberlyg:RMS14Memberlyg:ExpectedCreditLossesInRespectOfUndrawnExposuresMember2022-12-310001160106lyg:GrossUndrawnExposuresMemberlyg:RetailOtherMemberlyg:Stage1Member2022-12-310001160106lyg:GrossUndrawnExposuresMemberlyg:RetailOtherMemberlyg:Stage2Member2022-12-310001160106lyg:GrossUndrawnExposuresMemberlyg:RetailOtherMemberlyg:Stage3Member2022-12-310001160106lyg:GrossUndrawnExposuresMemberlyg:PurchasedOrOriginatedCreditimpairedMemberlyg:RetailOtherMember2022-12-310001160106lyg:GrossUndrawnExposuresMemberlyg:RetailOtherMember2022-12-310001160106lyg:RetailOtherMemberlyg:Stage1Memberlyg:ExpectedCreditLossesInRespectOfUndrawnExposuresMember2022-12-310001160106lyg:RetailOtherMemberlyg:ExpectedCreditLossesInRespectOfUndrawnExposuresMemberlyg:Stage2Member2022-12-310001160106lyg:RetailOtherMemberlyg:Stage3Memberlyg:ExpectedCreditLossesInRespectOfUndrawnExposuresMember2022-12-310001160106lyg:PurchasedOrOriginatedCreditimpairedMemberlyg:RetailOtherMemberlyg:ExpectedCreditLossesInRespectOfUndrawnExposuresMember2022-12-310001160106lyg:RetailOtherMemberlyg:ExpectedCreditLossesInRespectOfUndrawnExposuresMember2022-12-310001160106lyg:GrossUndrawnExposuresMemberlyg:Stage1Memberlyg:Retail1Member2022-12-310001160106lyg:GrossUndrawnExposuresMemberlyg:Stage2Memberlyg:Retail1Member2022-12-310001160106lyg:GrossUndrawnExposuresMemberlyg:Stage3Memberlyg:Retail1Member2022-12-310001160106lyg:GrossUndrawnExposuresMemberlyg:PurchasedOrOriginatedCreditimpairedMemberlyg:Retail1Member2022-12-310001160106lyg:GrossUndrawnExposuresMemberlyg:Retail1Member2022-12-310001160106lyg:Stage1Memberlyg:ExpectedCreditLossesInRespectOfUndrawnExposuresMemberlyg:Retail1Member2022-12-310001160106lyg:ExpectedCreditLossesInRespectOfUndrawnExposuresMemberlyg:Stage2Memberlyg:Retail1Member2022-12-310001160106lyg:Stage3Memberlyg:ExpectedCreditLossesInRespectOfUndrawnExposuresMemberlyg:Retail1Member2022-12-310001160106lyg:PurchasedOrOriginatedCreditimpairedMemberlyg:ExpectedCreditLossesInRespectOfUndrawnExposuresMemberlyg:Retail1Member2022-12-310001160106lyg:ExpectedCreditLossesInRespectOfUndrawnExposuresMemberlyg:Retail1Member2022-12-310001160106lyg:GrossUndrawnExposuresMemberlyg:CMS15Memberlyg:Stage1Memberlyg:CommercialMember2022-12-310001160106lyg:GrossUndrawnExposuresMemberlyg:CMS15Memberlyg:CommercialMemberlyg:Stage2Member2022-12-310001160106lyg:GrossUndrawnExposuresMemberlyg:Stage3Memberlyg:CMS15Memberlyg:CommercialMember2022-12-310001160106lyg:GrossUndrawnExposuresMemberlyg:PurchasedOrOriginatedCreditimpairedMemberlyg:CMS15Memberlyg:CommercialMember2022-12-310001160106lyg:GrossUndrawnExposuresMemberlyg:CMS15Memberlyg:CommercialMember2022-12-310001160106lyg:CMS15Memberlyg:Stage1Memberlyg:ExpectedCreditLossesInRespectOfUndrawnExposuresMemberlyg:CommercialMember2022-12-310001160106lyg:CMS15Memberlyg:ExpectedCreditLossesInRespectOfUndrawnExposuresMemberlyg:CommercialMemberlyg:Stage2Member2022-12-310001160106lyg:Stage3Memberlyg:CMS15Memberlyg:ExpectedCreditLossesInRespectOfUndrawnExposuresMemberlyg:CommercialMember2022-12-310001160106lyg:PurchasedOrOriginatedCreditimpairedMemberlyg:CMS15Memberlyg:ExpectedCreditLossesInRespectOfUndrawnExposuresMemberlyg:CommercialMember2022-12-310001160106lyg:CMS15Memberlyg:ExpectedCreditLossesInRespectOfUndrawnExposuresMemberlyg:CommercialMember2022-12-310001160106lyg:GrossUndrawnExposuresMemberlyg:CMS610Memberlyg:Stage1Memberlyg:CommercialMember2022-12-310001160106lyg:GrossUndrawnExposuresMemberlyg:CMS610Memberlyg:CommercialMemberlyg:Stage2Member2022-12-310001160106lyg:GrossUndrawnExposuresMemberlyg:Stage3Memberlyg:CMS610Memberlyg:CommercialMember2022-12-310001160106lyg:GrossUndrawnExposuresMemberlyg:PurchasedOrOriginatedCreditimpairedMemberlyg:CMS610Memberlyg:CommercialMember2022-12-310001160106lyg:GrossUndrawnExposuresMemberlyg:CMS610Memberlyg:CommercialMember2022-12-310001160106lyg:CMS610Memberlyg:Stage1Memberlyg:ExpectedCreditLossesInRespectOfUndrawnExposuresMemberlyg:CommercialMember2022-12-310001160106lyg:CMS610Memberlyg:ExpectedCreditLossesInRespectOfUndrawnExposuresMemberlyg:CommercialMemberlyg:Stage2Member2022-12-310001160106lyg:Stage3Memberlyg:CMS610Memberlyg:ExpectedCreditLossesInRespectOfUndrawnExposuresMemberlyg:CommercialMember2022-12-310001160106lyg:PurchasedOrOriginatedCreditimpairedMemberlyg:CMS610Memberlyg:ExpectedCreditLossesInRespectOfUndrawnExposuresMemberlyg:CommercialMember2022-12-310001160106lyg:CMS610Memberlyg:ExpectedCreditLossesInRespectOfUndrawnExposuresMemberlyg:CommercialMember2022-12-310001160106lyg:GrossUndrawnExposuresMemberlyg:Stage1Memberlyg:CMS1114Memberlyg:CommercialMember2022-12-310001160106lyg:GrossUndrawnExposuresMemberlyg:CMS1114Memberlyg:CommercialMemberlyg:Stage2Member2022-12-310001160106lyg:GrossUndrawnExposuresMemberlyg:Stage3Memberlyg:CMS1114Memberlyg:CommercialMember2022-12-310001160106lyg:GrossUndrawnExposuresMemberlyg:PurchasedOrOriginatedCreditimpairedMemberlyg:CMS1114Memberlyg:CommercialMember2022-12-310001160106lyg:GrossUndrawnExposuresMemberlyg:CMS1114Memberlyg:CommercialMember2022-12-310001160106lyg:Stage1Memberlyg:CMS1114Memberlyg:ExpectedCreditLossesInRespectOfUndrawnExposuresMemberlyg:CommercialMember2022-12-310001160106lyg:CMS1114Memberlyg:ExpectedCreditLossesInRespectOfUndrawnExposuresMemberlyg:CommercialMemberlyg:Stage2Member2022-12-310001160106lyg:Stage3Memberlyg:CMS1114Memberlyg:ExpectedCreditLossesInRespectOfUndrawnExposuresMemberlyg:CommercialMember2022-12-310001160106lyg:PurchasedOrOriginatedCreditimpairedMemberlyg:CMS1114Memberlyg:ExpectedCreditLossesInRespectOfUndrawnExposuresMemberlyg:CommercialMember2022-12-310001160106lyg:CMS1114Memberlyg:ExpectedCreditLossesInRespectOfUndrawnExposuresMemberlyg:CommercialMember2022-12-310001160106lyg:CMS1518Memberlyg:GrossUndrawnExposuresMemberlyg:Stage1Memberlyg:CommercialMember2022-12-310001160106lyg:CMS1518Memberlyg:GrossUndrawnExposuresMemberlyg:CommercialMemberlyg:Stage2Member2022-12-310001160106lyg:CMS1518Memberlyg:GrossUndrawnExposuresMemberlyg:Stage3Memberlyg:CommercialMember2022-12-310001160106lyg:CMS1518Memberlyg:GrossUndrawnExposuresMemberlyg:PurchasedOrOriginatedCreditimpairedMemberlyg:CommercialMember2022-12-310001160106lyg:CMS1518Memberlyg:GrossUndrawnExposuresMemberlyg:CommercialMember2022-12-310001160106lyg:CMS1518Memberlyg:Stage1Memberlyg:ExpectedCreditLossesInRespectOfUndrawnExposuresMemberlyg:CommercialMember2022-12-310001160106lyg:CMS1518Memberlyg:ExpectedCreditLossesInRespectOfUndrawnExposuresMemberlyg:CommercialMemberlyg:Stage2Member2022-12-310001160106lyg:CMS1518Memberlyg:Stage3Memberlyg:ExpectedCreditLossesInRespectOfUndrawnExposuresMemberlyg:CommercialMember2022-12-310001160106lyg:CMS1518Memberlyg:PurchasedOrOriginatedCreditimpairedMemberlyg:ExpectedCreditLossesInRespectOfUndrawnExposuresMemberlyg:CommercialMember2022-12-310001160106lyg:CMS1518Memberlyg:ExpectedCreditLossesInRespectOfUndrawnExposuresMemberlyg:CommercialMember2022-12-310001160106lyg:GrossUndrawnExposuresMemberlyg:CMS19Memberlyg:Stage1Memberlyg:CommercialMember2022-12-310001160106lyg:GrossUndrawnExposuresMemberlyg:CMS19Memberlyg:CommercialMemberlyg:Stage2Member2022-12-310001160106lyg:GrossUndrawnExposuresMemberlyg:Stage3Memberlyg:CMS19Memberlyg:CommercialMember2022-12-310001160106lyg:GrossUndrawnExposuresMemberlyg:PurchasedOrOriginatedCreditimpairedMemberlyg:CMS19Memberlyg:CommercialMember2022-12-310001160106lyg:GrossUndrawnExposuresMemberlyg:CMS19Memberlyg:CommercialMember2022-12-310001160106lyg:CMS19Memberlyg:Stage1Memberlyg:ExpectedCreditLossesInRespectOfUndrawnExposuresMemberlyg:CommercialMember2022-12-310001160106lyg:CMS19Memberlyg:ExpectedCreditLossesInRespectOfUndrawnExposuresMemberlyg:CommercialMemberlyg:Stage2Member2022-12-310001160106lyg:Stage3Memberlyg:CMS19Memberlyg:ExpectedCreditLossesInRespectOfUndrawnExposuresMemberlyg:CommercialMember2022-12-310001160106lyg:PurchasedOrOriginatedCreditimpairedMemberlyg:CMS19Memberlyg:ExpectedCreditLossesInRespectOfUndrawnExposuresMemberlyg:CommercialMember2022-12-310001160106lyg:CMS19Memberlyg:ExpectedCreditLossesInRespectOfUndrawnExposuresMemberlyg:CommercialMember2022-12-310001160106lyg:GrossUndrawnExposuresMemberlyg:Stage1Memberlyg:CMS2023Memberlyg:CommercialMember2022-12-310001160106lyg:GrossUndrawnExposuresMemberlyg:CMS2023Memberlyg:CommercialMemberlyg:Stage2Member2022-12-310001160106lyg:GrossUndrawnExposuresMemberlyg:Stage3Memberlyg:CMS2023Memberlyg:CommercialMember2022-12-310001160106lyg:GrossUndrawnExposuresMemberlyg:PurchasedOrOriginatedCreditimpairedMemberlyg:CMS2023Memberlyg:CommercialMember2022-12-310001160106lyg:GrossUndrawnExposuresMemberlyg:CMS2023Memberlyg:CommercialMember2022-12-310001160106lyg:Stage1Memberlyg:CMS2023Memberlyg:ExpectedCreditLossesInRespectOfUndrawnExposuresMemberlyg:CommercialMember2022-12-310001160106lyg:CMS2023Memberlyg:ExpectedCreditLossesInRespectOfUndrawnExposuresMemberlyg:CommercialMemberlyg:Stage2Member2022-12-310001160106lyg:Stage3Memberlyg:CMS2023Memberlyg:ExpectedCreditLossesInRespectOfUndrawnExposuresMemberlyg:CommercialMember2022-12-310001160106lyg:PurchasedOrOriginatedCreditimpairedMemberlyg:CMS2023Memberlyg:ExpectedCreditLossesInRespectOfUndrawnExposuresMemberlyg:CommercialMember2022-12-310001160106lyg:CMS2023Memberlyg:ExpectedCreditLossesInRespectOfUndrawnExposuresMemberlyg:CommercialMember2022-12-310001160106lyg:GrossUndrawnExposuresMemberlyg:Stage1Memberlyg:CommercialMember2022-12-310001160106lyg:GrossUndrawnExposuresMemberlyg:CommercialMemberlyg:Stage2Member2022-12-310001160106lyg:GrossUndrawnExposuresMemberlyg:Stage3Memberlyg:CommercialMember2022-12-310001160106lyg:GrossUndrawnExposuresMemberlyg:PurchasedOrOriginatedCreditimpairedMemberlyg:CommercialMember2022-12-310001160106lyg:GrossUndrawnExposuresMemberlyg:CommercialMember2022-12-310001160106lyg:Stage1Memberlyg:ExpectedCreditLossesInRespectOfUndrawnExposuresMemberlyg:CommercialMember2022-12-310001160106lyg:ExpectedCreditLossesInRespectOfUndrawnExposuresMemberlyg:CommercialMemberlyg:Stage2Member2022-12-310001160106lyg:Stage3Memberlyg:ExpectedCreditLossesInRespectOfUndrawnExposuresMemberlyg:CommercialMember2022-12-310001160106lyg:PurchasedOrOriginatedCreditimpairedMemberlyg:ExpectedCreditLossesInRespectOfUndrawnExposuresMemberlyg:CommercialMember2022-12-310001160106lyg:ExpectedCreditLossesInRespectOfUndrawnExposuresMemberlyg:CommercialMember2022-12-310001160106lyg:CMSMemberlyg:GrossUndrawnExposuresMemberlyg:Stage1Memberlyg:OtherMember2022-12-310001160106lyg:CMSMemberlyg:GrossUndrawnExposuresMemberlyg:OtherMemberlyg:Stage2Member2022-12-310001160106lyg:CMSMemberlyg:GrossUndrawnExposuresMemberlyg:Stage3Memberlyg:OtherMember2022-12-310001160106lyg:CMSMemberlyg:GrossUndrawnExposuresMemberlyg:PurchasedOrOriginatedCreditimpairedMemberlyg:OtherMember2022-12-310001160106lyg:CMSMemberlyg:GrossUndrawnExposuresMemberlyg:OtherMember2022-12-310001160106lyg:CMSMemberlyg:Stage1Memberlyg:ExpectedCreditLossesInRespectOfUndrawnExposuresMemberlyg:OtherMember2022-12-310001160106lyg:CMSMemberlyg:ExpectedCreditLossesInRespectOfUndrawnExposuresMemberlyg:OtherMemberlyg:Stage2Member2022-12-310001160106lyg:CMSMemberlyg:Stage3Memberlyg:ExpectedCreditLossesInRespectOfUndrawnExposuresMemberlyg:OtherMember2022-12-310001160106lyg:CMSMemberlyg:PurchasedOrOriginatedCreditimpairedMemberlyg:ExpectedCreditLossesInRespectOfUndrawnExposuresMemberlyg:OtherMember2022-12-310001160106lyg:CMSMemberlyg:ExpectedCreditLossesInRespectOfUndrawnExposuresMemberlyg:OtherMember2022-12-310001160106lyg:GrossUndrawnExposuresMemberlyg:Stage1Member2022-12-310001160106lyg:GrossUndrawnExposuresMemberlyg:Stage2Member2022-12-310001160106lyg:GrossUndrawnExposuresMemberlyg:Stage3Member2022-12-310001160106lyg:GrossUndrawnExposuresMemberlyg:PurchasedOrOriginatedCreditimpairedMember2022-12-310001160106lyg:GrossUndrawnExposuresMember2022-12-310001160106lyg:Stage1Memberlyg:ExpectedCreditLossesInRespectOfUndrawnExposuresMember2022-12-310001160106lyg:ExpectedCreditLossesInRespectOfUndrawnExposuresMemberlyg:Stage2Member2022-12-310001160106lyg:Stage3Memberlyg:ExpectedCreditLossesInRespectOfUndrawnExposuresMember2022-12-310001160106lyg:PurchasedOrOriginatedCreditimpairedMemberlyg:ExpectedCreditLossesInRespectOfUndrawnExposuresMember2022-12-310001160106lyg:ExpectedCreditLossesInRespectOfUndrawnExposuresMember2022-12-310001160106lyg:DrawnBalanceMemberifrs-full:MortgagesMemberlyg:Stage1Memberlyg:LessThanSeventyPercentMember2023-12-310001160106lyg:Stage2Memberlyg:DrawnBalanceMemberifrs-full:MortgagesMemberlyg:LessThanSeventyPercentMember2023-12-310001160106lyg:Stage3Memberlyg:DrawnBalanceMemberifrs-full:MortgagesMemberlyg:LessThanSeventyPercentMember2023-12-310001160106lyg:DrawnBalanceMemberifrs-full:MortgagesMemberlyg:PurchasedOrOriginatedCreditimpairedMemberlyg:LessThanSeventyPercentMember2023-12-310001160106lyg:DrawnBalanceMemberifrs-full:MortgagesMemberlyg:LessThanSeventyPercentMember2023-12-310001160106lyg:ExpectedCreditLossesOnDrawnBalancesMemberifrs-full:MortgagesMemberlyg:Stage1Memberlyg:LessThanSeventyPercentMember2023-12-310001160106lyg:ExpectedCreditLossesOnDrawnBalancesMemberlyg:Stage2Memberifrs-full:MortgagesMemberlyg:LessThanSeventyPercentMember2023-12-310001160106lyg:Stage3Memberlyg:ExpectedCreditLossesOnDrawnBalancesMemberifrs-full:MortgagesMemberlyg:LessThanSeventyPercentMember2023-12-310001160106lyg:ExpectedCreditLossesOnDrawnBalancesMemberifrs-full:MortgagesMemberlyg:PurchasedOrOriginatedCreditimpairedMemberlyg:LessThanSeventyPercentMember2023-12-310001160106lyg:ExpectedCreditLossesOnDrawnBalancesMemberifrs-full:MortgagesMemberlyg:LessThanSeventyPercentMember2023-12-310001160106lyg:SeventyPercentToEightyPercentMemberlyg:DrawnBalanceMemberifrs-full:MortgagesMemberlyg:Stage1Member2023-12-310001160106lyg:SeventyPercentToEightyPercentMemberlyg:Stage2Memberlyg:DrawnBalanceMemberifrs-full:MortgagesMember2023-12-310001160106lyg:SeventyPercentToEightyPercentMemberlyg:Stage3Memberlyg:DrawnBalanceMemberifrs-full:MortgagesMember2023-12-310001160106lyg:SeventyPercentToEightyPercentMemberlyg:DrawnBalanceMemberifrs-full:MortgagesMemberlyg:PurchasedOrOriginatedCreditimpairedMember2023-12-310001160106lyg:SeventyPercentToEightyPercentMemberlyg:DrawnBalanceMemberifrs-full:MortgagesMember2023-12-310001160106lyg:SeventyPercentToEightyPercentMemberlyg:ExpectedCreditLossesOnDrawnBalancesMemberifrs-full:MortgagesMemberlyg:Stage1Member2023-12-310001160106lyg:SeventyPercentToEightyPercentMemberlyg:ExpectedCreditLossesOnDrawnBalancesMemberlyg:Stage2Memberifrs-full:MortgagesMember2023-12-310001160106lyg:SeventyPercentToEightyPercentMemberlyg:Stage3Memberlyg:ExpectedCreditLossesOnDrawnBalancesMemberifrs-full:MortgagesMember2023-12-310001160106lyg:SeventyPercentToEightyPercentMemberlyg:ExpectedCreditLossesOnDrawnBalancesMemberifrs-full:MortgagesMemberlyg:PurchasedOrOriginatedCreditimpairedMember2023-12-310001160106lyg:SeventyPercentToEightyPercentMemberlyg:ExpectedCreditLossesOnDrawnBalancesMemberifrs-full:MortgagesMember2023-12-310001160106lyg:DrawnBalanceMemberifrs-full:MortgagesMemberlyg:Stage1Memberlyg:EightyPercentToNinetyPercentMember2023-12-310001160106lyg:Stage2Memberlyg:DrawnBalanceMemberifrs-full:MortgagesMemberlyg:EightyPercentToNinetyPercentMember2023-12-310001160106lyg:Stage3Memberlyg:DrawnBalanceMemberifrs-full:MortgagesMemberlyg:EightyPercentToNinetyPercentMember2023-12-310001160106lyg:DrawnBalanceMemberifrs-full:MortgagesMemberlyg:PurchasedOrOriginatedCreditimpairedMemberlyg:EightyPercentToNinetyPercentMember2023-12-310001160106lyg:DrawnBalanceMemberifrs-full:MortgagesMemberlyg:EightyPercentToNinetyPercentMember2023-12-310001160106lyg:ExpectedCreditLossesOnDrawnBalancesMemberifrs-full:MortgagesMemberlyg:Stage1Memberlyg:EightyPercentToNinetyPercentMember2023-12-310001160106lyg:ExpectedCreditLossesOnDrawnBalancesMemberlyg:Stage2Memberifrs-full:MortgagesMemberlyg:EightyPercentToNinetyPercentMember2023-12-310001160106lyg:Stage3Memberlyg:ExpectedCreditLossesOnDrawnBalancesMemberifrs-full:MortgagesMemberlyg:EightyPercentToNinetyPercentMember2023-12-310001160106lyg:ExpectedCreditLossesOnDrawnBalancesMemberifrs-full:MortgagesMemberlyg:PurchasedOrOriginatedCreditimpairedMemberlyg:EightyPercentToNinetyPercentMember2023-12-310001160106lyg:ExpectedCreditLossesOnDrawnBalancesMemberifrs-full:MortgagesMemberlyg:EightyPercentToNinetyPercentMember2023-12-310001160106lyg:NinetyPercentToOneHundredPercentMemberlyg:DrawnBalanceMemberifrs-full:MortgagesMemberlyg:Stage1Member2023-12-310001160106lyg:NinetyPercentToOneHundredPercentMemberlyg:Stage2Memberlyg:DrawnBalanceMemberifrs-full:MortgagesMember2023-12-310001160106lyg:NinetyPercentToOneHundredPercentMemberlyg:Stage3Memberlyg:DrawnBalanceMemberifrs-full:MortgagesMember2023-12-310001160106lyg:NinetyPercentToOneHundredPercentMemberlyg:DrawnBalanceMemberifrs-full:MortgagesMemberlyg:PurchasedOrOriginatedCreditimpairedMember2023-12-310001160106lyg:NinetyPercentToOneHundredPercentMemberlyg:DrawnBalanceMemberifrs-full:MortgagesMember2023-12-310001160106lyg:NinetyPercentToOneHundredPercentMemberlyg:ExpectedCreditLossesOnDrawnBalancesMemberifrs-full:MortgagesMemberlyg:Stage1Member2023-12-310001160106lyg:NinetyPercentToOneHundredPercentMemberlyg:ExpectedCreditLossesOnDrawnBalancesMemberlyg:Stage2Memberifrs-full:MortgagesMember2023-12-310001160106lyg:NinetyPercentToOneHundredPercentMemberlyg:Stage3Memberlyg:ExpectedCreditLossesOnDrawnBalancesMemberifrs-full:MortgagesMember2023-12-310001160106lyg:NinetyPercentToOneHundredPercentMemberlyg:ExpectedCreditLossesOnDrawnBalancesMemberifrs-full:MortgagesMemberlyg:PurchasedOrOriginatedCreditimpairedMember2023-12-310001160106lyg:NinetyPercentToOneHundredPercentMemberlyg:ExpectedCreditLossesOnDrawnBalancesMemberifrs-full:MortgagesMember2023-12-310001160106lyg:GreaterThanOneHundredPercentMemberlyg:DrawnBalanceMemberifrs-full:MortgagesMemberlyg:Stage1Member2023-12-310001160106lyg:GreaterThanOneHundredPercentMemberlyg:Stage2Memberlyg:DrawnBalanceMemberifrs-full:MortgagesMember2023-12-310001160106lyg:Stage3Memberlyg:GreaterThanOneHundredPercentMemberlyg:DrawnBalanceMemberifrs-full:MortgagesMember2023-12-310001160106lyg:GreaterThanOneHundredPercentMemberlyg:DrawnBalanceMemberifrs-full:MortgagesMemberlyg:PurchasedOrOriginatedCreditimpairedMember2023-12-310001160106lyg:GreaterThanOneHundredPercentMemberlyg:DrawnBalanceMemberifrs-full:MortgagesMember2023-12-310001160106lyg:ExpectedCreditLossesOnDrawnBalancesMemberlyg:GreaterThanOneHundredPercentMemberifrs-full:MortgagesMemberlyg:Stage1Member2023-12-310001160106lyg:ExpectedCreditLossesOnDrawnBalancesMemberlyg:GreaterThanOneHundredPercentMemberlyg:Stage2Memberifrs-full:MortgagesMember2023-12-310001160106lyg:Stage3Memberlyg:ExpectedCreditLossesOnDrawnBalancesMemberlyg:GreaterThanOneHundredPercentMemberifrs-full:MortgagesMember2023-12-310001160106lyg:ExpectedCreditLossesOnDrawnBalancesMemberlyg:GreaterThanOneHundredPercentMemberifrs-full:MortgagesMemberlyg:PurchasedOrOriginatedCreditimpairedMember2023-12-310001160106lyg:ExpectedCreditLossesOnDrawnBalancesMemberlyg:GreaterThanOneHundredPercentMemberifrs-full:MortgagesMember2023-12-310001160106lyg:DrawnBalanceMemberifrs-full:MortgagesMemberlyg:Stage1Member2023-12-310001160106lyg:Stage2Memberlyg:DrawnBalanceMemberifrs-full:MortgagesMember2023-12-310001160106lyg:Stage3Memberlyg:DrawnBalanceMemberifrs-full:MortgagesMember2023-12-310001160106lyg:DrawnBalanceMemberifrs-full:MortgagesMemberlyg:PurchasedOrOriginatedCreditimpairedMember2023-12-310001160106lyg:DrawnBalanceMemberifrs-full:MortgagesMember2023-12-310001160106lyg:ExpectedCreditLossesOnDrawnBalancesMemberifrs-full:MortgagesMemberlyg:Stage1Member2023-12-310001160106lyg:ExpectedCreditLossesOnDrawnBalancesMemberlyg:Stage2Memberifrs-full:MortgagesMember2023-12-310001160106lyg:Stage3Memberlyg:ExpectedCreditLossesOnDrawnBalancesMemberifrs-full:MortgagesMember2023-12-310001160106lyg:ExpectedCreditLossesOnDrawnBalancesMemberifrs-full:MortgagesMemberlyg:PurchasedOrOriginatedCreditimpairedMember2023-12-310001160106lyg:ExpectedCreditLossesOnDrawnBalancesMemberifrs-full:MortgagesMember2023-12-310001160106lyg:DrawnBalanceMemberifrs-full:MortgagesMemberlyg:Stage1Memberlyg:LessThanSeventyPercentMember2022-12-310001160106lyg:Stage2Memberlyg:DrawnBalanceMemberifrs-full:MortgagesMemberlyg:LessThanSeventyPercentMember2022-12-310001160106lyg:Stage3Memberlyg:DrawnBalanceMemberifrs-full:MortgagesMemberlyg:LessThanSeventyPercentMember2022-12-310001160106lyg:DrawnBalanceMemberifrs-full:MortgagesMemberlyg:PurchasedOrOriginatedCreditimpairedMemberlyg:LessThanSeventyPercentMember2022-12-310001160106lyg:DrawnBalanceMemberifrs-full:MortgagesMemberlyg:LessThanSeventyPercentMember2022-12-310001160106lyg:ExpectedCreditLossesOnDrawnBalancesMemberifrs-full:MortgagesMemberlyg:Stage1Memberlyg:LessThanSeventyPercentMember2022-12-310001160106lyg:ExpectedCreditLossesOnDrawnBalancesMemberlyg:Stage2Memberifrs-full:MortgagesMemberlyg:LessThanSeventyPercentMember2022-12-310001160106lyg:Stage3Memberlyg:ExpectedCreditLossesOnDrawnBalancesMemberifrs-full:MortgagesMemberlyg:LessThanSeventyPercentMember2022-12-310001160106lyg:ExpectedCreditLossesOnDrawnBalancesMemberifrs-full:MortgagesMemberlyg:PurchasedOrOriginatedCreditimpairedMemberlyg:LessThanSeventyPercentMember2022-12-310001160106lyg:ExpectedCreditLossesOnDrawnBalancesMemberifrs-full:MortgagesMemberlyg:LessThanSeventyPercentMember2022-12-310001160106lyg:SeventyPercentToEightyPercentMemberlyg:DrawnBalanceMemberifrs-full:MortgagesMemberlyg:Stage1Member2022-12-310001160106lyg:SeventyPercentToEightyPercentMemberlyg:Stage2Memberlyg:DrawnBalanceMemberifrs-full:MortgagesMember2022-12-310001160106lyg:SeventyPercentToEightyPercentMemberlyg:Stage3Memberlyg:DrawnBalanceMemberifrs-full:MortgagesMember2022-12-310001160106lyg:SeventyPercentToEightyPercentMemberlyg:DrawnBalanceMemberifrs-full:MortgagesMemberlyg:PurchasedOrOriginatedCreditimpairedMember2022-12-310001160106lyg:SeventyPercentToEightyPercentMemberlyg:DrawnBalanceMemberifrs-full:MortgagesMember2022-12-310001160106lyg:SeventyPercentToEightyPercentMemberlyg:ExpectedCreditLossesOnDrawnBalancesMemberifrs-full:MortgagesMemberlyg:Stage1Member2022-12-310001160106lyg:SeventyPercentToEightyPercentMemberlyg:ExpectedCreditLossesOnDrawnBalancesMemberlyg:Stage2Memberifrs-full:MortgagesMember2022-12-310001160106lyg:SeventyPercentToEightyPercentMemberlyg:Stage3Memberlyg:ExpectedCreditLossesOnDrawnBalancesMemberifrs-full:MortgagesMember2022-12-310001160106lyg:SeventyPercentToEightyPercentMemberlyg:ExpectedCreditLossesOnDrawnBalancesMemberifrs-full:MortgagesMemberlyg:PurchasedOrOriginatedCreditimpairedMember2022-12-310001160106lyg:SeventyPercentToEightyPercentMemberlyg:ExpectedCreditLossesOnDrawnBalancesMemberifrs-full:MortgagesMember2022-12-310001160106lyg:DrawnBalanceMemberifrs-full:MortgagesMemberlyg:Stage1Memberlyg:EightyPercentToNinetyPercentMember2022-12-310001160106lyg:Stage2Memberlyg:DrawnBalanceMemberifrs-full:MortgagesMemberlyg:EightyPercentToNinetyPercentMember2022-12-310001160106lyg:Stage3Memberlyg:DrawnBalanceMemberifrs-full:MortgagesMemberlyg:EightyPercentToNinetyPercentMember2022-12-310001160106lyg:DrawnBalanceMemberifrs-full:MortgagesMemberlyg:PurchasedOrOriginatedCreditimpairedMemberlyg:EightyPercentToNinetyPercentMember2022-12-310001160106lyg:DrawnBalanceMemberifrs-full:MortgagesMemberlyg:EightyPercentToNinetyPercentMember2022-12-310001160106lyg:ExpectedCreditLossesOnDrawnBalancesMemberifrs-full:MortgagesMemberlyg:Stage1Memberlyg:EightyPercentToNinetyPercentMember2022-12-310001160106lyg:ExpectedCreditLossesOnDrawnBalancesMemberlyg:Stage2Memberifrs-full:MortgagesMemberlyg:EightyPercentToNinetyPercentMember2022-12-310001160106lyg:Stage3Memberlyg:ExpectedCreditLossesOnDrawnBalancesMemberifrs-full:MortgagesMemberlyg:EightyPercentToNinetyPercentMember2022-12-310001160106lyg:ExpectedCreditLossesOnDrawnBalancesMemberifrs-full:MortgagesMemberlyg:PurchasedOrOriginatedCreditimpairedMemberlyg:EightyPercentToNinetyPercentMember2022-12-310001160106lyg:ExpectedCreditLossesOnDrawnBalancesMemberifrs-full:MortgagesMemberlyg:EightyPercentToNinetyPercentMember2022-12-310001160106lyg:NinetyPercentToOneHundredPercentMemberlyg:DrawnBalanceMemberifrs-full:MortgagesMemberlyg:Stage1Member2022-12-310001160106lyg:NinetyPercentToOneHundredPercentMemberlyg:Stage2Memberlyg:DrawnBalanceMemberifrs-full:MortgagesMember2022-12-310001160106lyg:NinetyPercentToOneHundredPercentMemberlyg:Stage3Memberlyg:DrawnBalanceMemberifrs-full:MortgagesMember2022-12-310001160106lyg:NinetyPercentToOneHundredPercentMemberlyg:DrawnBalanceMemberifrs-full:MortgagesMemberlyg:PurchasedOrOriginatedCreditimpairedMember2022-12-310001160106lyg:NinetyPercentToOneHundredPercentMemberlyg:DrawnBalanceMemberifrs-full:MortgagesMember2022-12-310001160106lyg:NinetyPercentToOneHundredPercentMemberlyg:ExpectedCreditLossesOnDrawnBalancesMemberifrs-full:MortgagesMemberlyg:Stage1Member2022-12-310001160106lyg:NinetyPercentToOneHundredPercentMemberlyg:ExpectedCreditLossesOnDrawnBalancesMemberlyg:Stage2Memberifrs-full:MortgagesMember2022-12-310001160106lyg:NinetyPercentToOneHundredPercentMemberlyg:Stage3Memberlyg:ExpectedCreditLossesOnDrawnBalancesMemberifrs-full:MortgagesMember2022-12-310001160106lyg:NinetyPercentToOneHundredPercentMemberlyg:ExpectedCreditLossesOnDrawnBalancesMemberifrs-full:MortgagesMemberlyg:PurchasedOrOriginatedCreditimpairedMember2022-12-310001160106lyg:NinetyPercentToOneHundredPercentMemberlyg:ExpectedCreditLossesOnDrawnBalancesMemberifrs-full:MortgagesMember2022-12-310001160106lyg:GreaterThanOneHundredPercentMemberlyg:DrawnBalanceMemberifrs-full:MortgagesMemberlyg:Stage1Member2022-12-310001160106lyg:GreaterThanOneHundredPercentMemberlyg:Stage2Memberlyg:DrawnBalanceMemberifrs-full:MortgagesMember2022-12-310001160106lyg:Stage3Memberlyg:GreaterThanOneHundredPercentMemberlyg:DrawnBalanceMemberifrs-full:MortgagesMember2022-12-310001160106lyg:GreaterThanOneHundredPercentMemberlyg:DrawnBalanceMemberifrs-full:MortgagesMemberlyg:PurchasedOrOriginatedCreditimpairedMember2022-12-310001160106lyg:GreaterThanOneHundredPercentMemberlyg:DrawnBalanceMemberifrs-full:MortgagesMember2022-12-310001160106lyg:ExpectedCreditLossesOnDrawnBalancesMemberlyg:GreaterThanOneHundredPercentMemberifrs-full:MortgagesMemberlyg:Stage1Member2022-12-310001160106lyg:ExpectedCreditLossesOnDrawnBalancesMemberlyg:GreaterThanOneHundredPercentMemberlyg:Stage2Memberifrs-full:MortgagesMember2022-12-310001160106lyg:Stage3Memberlyg:ExpectedCreditLossesOnDrawnBalancesMemberlyg:GreaterThanOneHundredPercentMemberifrs-full:MortgagesMember2022-12-310001160106lyg:ExpectedCreditLossesOnDrawnBalancesMemberlyg:GreaterThanOneHundredPercentMemberifrs-full:MortgagesMemberlyg:PurchasedOrOriginatedCreditimpairedMember2022-12-310001160106lyg:ExpectedCreditLossesOnDrawnBalancesMemberlyg:GreaterThanOneHundredPercentMemberifrs-full:MortgagesMember2022-12-310001160106lyg:DrawnBalanceMemberifrs-full:MortgagesMemberlyg:Stage1Member2022-12-310001160106lyg:Stage2Memberlyg:DrawnBalanceMemberifrs-full:MortgagesMember2022-12-310001160106lyg:Stage3Memberlyg:DrawnBalanceMemberifrs-full:MortgagesMember2022-12-310001160106lyg:DrawnBalanceMemberifrs-full:MortgagesMemberlyg:PurchasedOrOriginatedCreditimpairedMember2022-12-310001160106lyg:DrawnBalanceMemberifrs-full:MortgagesMember2022-12-310001160106lyg:ExpectedCreditLossesOnDrawnBalancesMemberifrs-full:MortgagesMemberlyg:Stage1Member2022-12-310001160106lyg:ExpectedCreditLossesOnDrawnBalancesMemberlyg:Stage2Memberifrs-full:MortgagesMember2022-12-310001160106lyg:Stage3Memberlyg:ExpectedCreditLossesOnDrawnBalancesMemberifrs-full:MortgagesMember2022-12-310001160106lyg:ExpectedCreditLossesOnDrawnBalancesMemberifrs-full:MortgagesMemberlyg:PurchasedOrOriginatedCreditimpairedMember2022-12-310001160106lyg:ExpectedCreditLossesOnDrawnBalancesMemberifrs-full:MortgagesMember2022-12-310001160106lyg:DrawnBalanceMemberlyg:EnergyPerformanceCertificateProfileAMemberifrs-full:MortgagesMember2023-12-310001160106lyg:DrawnBalanceMemberlyg:EnergyPerformanceCertificateProfileBMemberifrs-full:MortgagesMember2023-12-310001160106lyg:DrawnBalanceMemberifrs-full:MortgagesMemberlyg:EnergyPerformanceCertificateProfileCMember2023-12-310001160106lyg:DrawnBalanceMemberlyg:EnergyPerformanceCertificateProfileDMemberifrs-full:MortgagesMember2023-12-310001160106lyg:EnergyPerformanceCertificateProfileEMemberlyg:DrawnBalanceMemberifrs-full:MortgagesMember2023-12-310001160106lyg:DrawnBalanceMemberlyg:EnergyPerformanceCertificateProfileFMemberifrs-full:MortgagesMember2023-12-310001160106lyg:DrawnBalanceMemberifrs-full:MortgagesMemberlyg:EnergyPerformanceCertificateProfileGMember2023-12-310001160106lyg:EnergyPerformanceCertificateProfileUnratedPropertiesMemberlyg:DrawnBalanceMemberifrs-full:MortgagesMember2023-12-310001160106lyg:DrawnBalanceMemberlyg:EnergyPerformanceCertificateProfileAMemberifrs-full:MortgagesMember2022-12-310001160106lyg:DrawnBalanceMemberlyg:EnergyPerformanceCertificateProfileBMemberifrs-full:MortgagesMember2022-12-310001160106lyg:DrawnBalanceMemberifrs-full:MortgagesMemberlyg:EnergyPerformanceCertificateProfileCMember2022-12-310001160106lyg:DrawnBalanceMemberlyg:EnergyPerformanceCertificateProfileDMemberifrs-full:MortgagesMember2022-12-310001160106lyg:EnergyPerformanceCertificateProfileEMemberlyg:DrawnBalanceMemberifrs-full:MortgagesMember2022-12-310001160106lyg:DrawnBalanceMemberlyg:EnergyPerformanceCertificateProfileFMemberifrs-full:MortgagesMember2022-12-310001160106lyg:DrawnBalanceMemberifrs-full:MortgagesMemberlyg:EnergyPerformanceCertificateProfileGMember2022-12-310001160106lyg:EnergyPerformanceCertificateProfileUnratedPropertiesMemberlyg:DrawnBalanceMemberifrs-full:MortgagesMember2022-12-310001160106lyg:Stage3Memberlyg:RetailNonMortgageMember2023-12-310001160106lyg:Stage3Memberlyg:RetailNonMortgageMember2022-12-310001160106lyg:Stage1AndStage2Memberlyg:RetailNonMortgageMember2023-12-310001160106lyg:Stage1AndStage2Memberlyg:RetailNonMortgageMember2022-12-310001160106lyg:Stage3Memberlyg:CommercialLoansMember2023-12-310001160106lyg:Stage3Memberlyg:CommercialLoansMember2022-12-310001160106lyg:Stage3Memberifrs-full:AccumulatedImpairmentMemberlyg:CommercialLoansMember2023-12-310001160106lyg:Stage3Memberifrs-full:AccumulatedImpairmentMemberlyg:CommercialLoansMember2022-12-310001160106lyg:TradingOtherFinancialAssetsAtFairValueThroughProfitOrLossMember2023-12-310001160106lyg:TradingOtherFinancialAssetsAtFairValueThroughProfitOrLossMember2022-12-310001160106lyg:StockBorrowingMemberlyg:TradingOtherFinancialAssetsAtFairValueThroughProfitOrLossMember2023-12-310001160106lyg:StockBorrowingMemberlyg:TradingOtherFinancialAssetsAtFairValueThroughProfitOrLossMember2022-12-310001160106lyg:IrrevocableLoanCommitmentsAndContingenciesMember2023-12-310001160106lyg:IrrevocableLoanCommitmentsAndContingenciesMember2022-12-310001160106ifrs-full:FinancialLiabilitiesAtAmortisedCostCategoryMemberlyg:RepurchaseAgreementMemberlyg:NetAmountsPresentedInTheBalanceSheetMember2022-12-310001160106ifrs-full:SecuritiesLendingMember2023-12-310001160106ifrs-full:SecuritiesLendingMember2022-12-310001160106lyg:BalanceSheetMaturityLegalBasisMemberifrs-full:NotLaterThanOneMonthMember2023-12-310001160106ifrs-full:LaterThanOneMonthAndNotLaterThanThreeMonthsMemberlyg:BalanceSheetMaturityLegalBasisMember2023-12-310001160106ifrs-full:LaterThanThreeMonthsAndNotLaterThanSixMonthsMemberlyg:BalanceSheetMaturityLegalBasisMember2023-12-310001160106lyg:LaterThanSixMonthsAndNotLaterThanNineMonthsMemberlyg:BalanceSheetMaturityLegalBasisMember2023-12-310001160106lyg:LaterThanNineMonthsAndNotLaterThanTwelveMonthsMemberlyg:BalanceSheetMaturityLegalBasisMember2023-12-310001160106lyg:BalanceSheetMaturityLegalBasisMemberifrs-full:LaterThanOneYearAndNotLaterThanTwoYearsMember2023-12-310001160106ifrs-full:LaterThanTwoYearsAndNotLaterThanFiveYearsMemberlyg:BalanceSheetMaturityLegalBasisMember2023-12-310001160106ifrs-full:LaterThanFiveYearsMemberlyg:BalanceSheetMaturityLegalBasisMember2023-12-310001160106lyg:BalanceSheetMaturityLegalBasisMember2023-12-310001160106lyg:BalanceSheetMaturityLegalBasisMemberifrs-full:NotLaterThanOneMonthMember2022-12-310001160106ifrs-full:LaterThanOneMonthAndNotLaterThanThreeMonthsMemberlyg:BalanceSheetMaturityLegalBasisMember2022-12-310001160106ifrs-full:LaterThanThreeMonthsAndNotLaterThanSixMonthsMemberlyg:BalanceSheetMaturityLegalBasisMember2022-12-310001160106lyg:LaterThanSixMonthsAndNotLaterThanNineMonthsMemberlyg:BalanceSheetMaturityLegalBasisMember2022-12-310001160106lyg:LaterThanNineMonthsAndNotLaterThanTwelveMonthsMemberlyg:BalanceSheetMaturityLegalBasisMember2022-12-310001160106lyg:BalanceSheetMaturityLegalBasisMemberifrs-full:LaterThanOneYearAndNotLaterThanTwoYearsMember2022-12-310001160106ifrs-full:LaterThanTwoYearsAndNotLaterThanFiveYearsMemberlyg:BalanceSheetMaturityLegalBasisMember2022-12-310001160106ifrs-full:LaterThanFiveYearsMemberlyg:BalanceSheetMaturityLegalBasisMember2022-12-310001160106lyg:BalanceSheetMaturityLegalBasisMember2022-12-310001160106lyg:UndiscountedFutureCashFlowBasisMemberifrs-full:NotLaterThanOneMonthMember2023-12-310001160106ifrs-full:LaterThanOneMonthAndNotLaterThanThreeMonthsMemberlyg:UndiscountedFutureCashFlowBasisMember2023-12-310001160106lyg:LaterThanThreeMonthsAndNotLaterThanTwelveMonthsMemberlyg:UndiscountedFutureCashFlowBasisMember2023-12-310001160106ifrs-full:LaterThanOneYearAndNotLaterThanFiveYearsMemberlyg:UndiscountedFutureCashFlowBasisMember2023-12-310001160106ifrs-full:LaterThanFiveYearsMemberlyg:UndiscountedFutureCashFlowBasisMember2023-12-310001160106lyg:UndiscountedFutureCashFlowBasisMember2023-12-310001160106lyg:OutflowsMemberlyg:UndiscountedFutureCashFlowBasisMemberifrs-full:NotLaterThanOneMonthMember2023-12-310001160106lyg:OutflowsMemberifrs-full:LaterThanOneMonthAndNotLaterThanThreeMonthsMemberlyg:UndiscountedFutureCashFlowBasisMember2023-12-310001160106lyg:OutflowsMemberlyg:LaterThanThreeMonthsAndNotLaterThanTwelveMonthsMemberlyg:UndiscountedFutureCashFlowBasisMember2023-12-310001160106lyg:OutflowsMemberifrs-full:LaterThanOneYearAndNotLaterThanFiveYearsMemberlyg:UndiscountedFutureCashFlowBasisMember2023-12-310001160106lyg:OutflowsMemberifrs-full:LaterThanFiveYearsMemberlyg:UndiscountedFutureCashFlowBasisMember2023-12-310001160106lyg:OutflowsMemberlyg:UndiscountedFutureCashFlowBasisMember2023-12-310001160106lyg:UndiscountedFutureCashFlowBasisMemberlyg:InflowsMemberifrs-full:NotLaterThanOneMonthMember2023-12-310001160106ifrs-full:LaterThanOneMonthAndNotLaterThanThreeMonthsMemberlyg:UndiscountedFutureCashFlowBasisMemberlyg:InflowsMember2023-12-310001160106lyg:LaterThanThreeMonthsAndNotLaterThanTwelveMonthsMemberlyg:UndiscountedFutureCashFlowBasisMemberlyg:InflowsMember2023-12-310001160106ifrs-full:LaterThanOneYearAndNotLaterThanFiveYearsMemberlyg:UndiscountedFutureCashFlowBasisMemberlyg:InflowsMember2023-12-310001160106ifrs-full:LaterThanFiveYearsMemberlyg:UndiscountedFutureCashFlowBasisMemberlyg:InflowsMember2023-12-310001160106lyg:UndiscountedFutureCashFlowBasisMemberlyg:InflowsMember2023-12-310001160106lyg:NetFlowsMemberlyg:UndiscountedFutureCashFlowBasisMemberifrs-full:NotLaterThanOneMonthMember2023-12-310001160106ifrs-full:LaterThanOneMonthAndNotLaterThanThreeMonthsMemberlyg:NetFlowsMemberlyg:UndiscountedFutureCashFlowBasisMember2023-12-310001160106lyg:NetFlowsMemberlyg:LaterThanThreeMonthsAndNotLaterThanTwelveMonthsMemberlyg:UndiscountedFutureCashFlowBasisMember2023-12-310001160106ifrs-full:LaterThanOneYearAndNotLaterThanFiveYearsMemberlyg:NetFlowsMemberlyg:UndiscountedFutureCashFlowBasisMember2023-12-310001160106ifrs-full:LaterThanFiveYearsMemberlyg:NetFlowsMemberlyg:UndiscountedFutureCashFlowBasisMember2023-12-310001160106lyg:NetFlowsMemberlyg:UndiscountedFutureCashFlowBasisMember2023-12-310001160106lyg:UndiscountedFutureCashFlowBasisMemberifrs-full:NotLaterThanOneMonthMember2022-12-310001160106ifrs-full:LaterThanOneMonthAndNotLaterThanThreeMonthsMemberlyg:UndiscountedFutureCashFlowBasisMember2022-12-310001160106lyg:LaterThanThreeMonthsAndNotLaterThanTwelveMonthsMemberlyg:UndiscountedFutureCashFlowBasisMember2022-12-310001160106ifrs-full:LaterThanOneYearAndNotLaterThanFiveYearsMemberlyg:UndiscountedFutureCashFlowBasisMember2022-12-310001160106ifrs-full:LaterThanFiveYearsMemberlyg:UndiscountedFutureCashFlowBasisMember2022-12-310001160106lyg:UndiscountedFutureCashFlowBasisMember2022-12-310001160106lyg:OutflowsMemberlyg:UndiscountedFutureCashFlowBasisMemberifrs-full:NotLaterThanOneMonthMember2022-12-310001160106lyg:OutflowsMemberifrs-full:LaterThanOneMonthAndNotLaterThanThreeMonthsMemberlyg:UndiscountedFutureCashFlowBasisMember2022-12-310001160106lyg:OutflowsMemberlyg:LaterThanThreeMonthsAndNotLaterThanTwelveMonthsMemberlyg:UndiscountedFutureCashFlowBasisMember2022-12-310001160106lyg:OutflowsMemberifrs-full:LaterThanOneYearAndNotLaterThanFiveYearsMemberlyg:UndiscountedFutureCashFlowBasisMember2022-12-310001160106lyg:OutflowsMemberifrs-full:LaterThanFiveYearsMemberlyg:UndiscountedFutureCashFlowBasisMember2022-12-310001160106lyg:OutflowsMemberlyg:UndiscountedFutureCashFlowBasisMember2022-12-310001160106lyg:UndiscountedFutureCashFlowBasisMemberlyg:InflowsMemberifrs-full:NotLaterThanOneMonthMember2022-12-310001160106ifrs-full:LaterThanOneMonthAndNotLaterThanThreeMonthsMemberlyg:UndiscountedFutureCashFlowBasisMemberlyg:InflowsMember2022-12-310001160106lyg:LaterThanThreeMonthsAndNotLaterThanTwelveMonthsMemberlyg:UndiscountedFutureCashFlowBasisMemberlyg:InflowsMember2022-12-310001160106ifrs-full:LaterThanOneYearAndNotLaterThanFiveYearsMemberlyg:UndiscountedFutureCashFlowBasisMemberlyg:InflowsMember2022-12-310001160106ifrs-full:LaterThanFiveYearsMemberlyg:UndiscountedFutureCashFlowBasisMemberlyg:InflowsMember2022-12-310001160106lyg:UndiscountedFutureCashFlowBasisMemberlyg:InflowsMember2022-12-310001160106lyg:NetFlowsMemberlyg:UndiscountedFutureCashFlowBasisMemberifrs-full:NotLaterThanOneMonthMember2022-12-310001160106ifrs-full:LaterThanOneMonthAndNotLaterThanThreeMonthsMemberlyg:NetFlowsMemberlyg:UndiscountedFutureCashFlowBasisMember2022-12-310001160106lyg:NetFlowsMemberlyg:LaterThanThreeMonthsAndNotLaterThanTwelveMonthsMemberlyg:UndiscountedFutureCashFlowBasisMember2022-12-310001160106ifrs-full:LaterThanOneYearAndNotLaterThanFiveYearsMemberlyg:NetFlowsMemberlyg:UndiscountedFutureCashFlowBasisMember2022-12-310001160106ifrs-full:LaterThanFiveYearsMemberlyg:NetFlowsMemberlyg:UndiscountedFutureCashFlowBasisMember2022-12-310001160106lyg:NetFlowsMemberlyg:UndiscountedFutureCashFlowBasisMember2022-12-310001160106ifrs-full:LaterThanFiveYearsMemberifrs-full:InsuranceContractsIssuedMember2023-12-310001160106ifrs-full:LaterThanFiveYearsMemberifrs-full:ReinsuranceContractsHeldMember2023-12-310001160106ifrs-full:LaterThanFiveYearsMemberifrs-full:InsuranceContractsIssuedMember2022-12-310001160106ifrs-full:LaterThanFiveYearsMemberifrs-full:ReinsuranceContractsHeldMember2022-12-310001160106ifrs-full:InsuranceContractsOtherThanThoseToWhichPremiumAllocationApproachHasBeenAppliedMemberifrs-full:CarryingAmountMember2023-12-310001160106ifrs-full:InsuranceContractsOtherThanThoseToWhichPremiumAllocationApproachHasBeenAppliedMemberifrs-full:CarryingAmountMember2022-12-310001160106ifrs-full:CarryingAmountMemberifrs-full:InsuranceContractsToWhichPremiumAllocationApproachHasBeenAppliedMember2023-12-310001160106ifrs-full:CarryingAmountMemberifrs-full:InsuranceContractsToWhichPremiumAllocationApproachHasBeenAppliedMember2022-12-310001160106ifrs-full:CarryingAmountMember2023-12-310001160106ifrs-full:CarryingAmountMember2022-12-310001160106lyg:AcceptancesAndEndorsementsMemberifrs-full:NotLaterThanOneMonthMember2023-12-310001160106ifrs-full:LaterThanOneMonthAndNotLaterThanThreeMonthsMemberlyg:AcceptancesAndEndorsementsMember2023-12-310001160106ifrs-full:LaterThanThreeMonthsAndNotLaterThanSixMonthsMemberlyg:AcceptancesAndEndorsementsMember2023-12-310001160106lyg:AcceptancesAndEndorsementsMemberlyg:LaterThanSixMonthsAndNotLaterThanNineMonthsMember2023-12-310001160106lyg:AcceptancesAndEndorsementsMemberlyg:LaterThanNineMonthsAndNotLaterThanTwelveMonthsMember2023-12-310001160106ifrs-full:LaterThanOneYearAndNotLaterThanThreeYearsMemberlyg:AcceptancesAndEndorsementsMember2023-12-310001160106lyg:AcceptancesAndEndorsementsMemberifrs-full:LaterThanThreeYearsAndNotLaterThanFiveYearsMember2023-12-310001160106ifrs-full:LaterThanFiveYearsMemberlyg:AcceptancesAndEndorsementsMember2023-12-310001160106lyg:AcceptancesAndEndorsementsMember2023-12-310001160106ifrs-full:OtherContingentLiabilitiesMemberifrs-full:NotLaterThanOneMonthMember2023-12-310001160106ifrs-full:OtherContingentLiabilitiesMemberifrs-full:LaterThanOneMonthAndNotLaterThanThreeMonthsMember2023-12-310001160106ifrs-full:LaterThanThreeMonthsAndNotLaterThanSixMonthsMemberifrs-full:OtherContingentLiabilitiesMember2023-12-310001160106ifrs-full:OtherContingentLiabilitiesMemberlyg:LaterThanSixMonthsAndNotLaterThanNineMonthsMember2023-12-310001160106ifrs-full:OtherContingentLiabilitiesMemberlyg:LaterThanNineMonthsAndNotLaterThanTwelveMonthsMember2023-12-310001160106ifrs-full:LaterThanOneYearAndNotLaterThanThreeYearsMemberifrs-full:OtherContingentLiabilitiesMember2023-12-310001160106ifrs-full:OtherContingentLiabilitiesMemberifrs-full:LaterThanThreeYearsAndNotLaterThanFiveYearsMember2023-12-310001160106ifrs-full:LaterThanFiveYearsMemberifrs-full:OtherContingentLiabilitiesMember2023-12-310001160106ifrs-full:OtherContingentLiabilitiesMember2023-12-310001160106ifrs-full:NotLaterThanOneMonthMember2023-12-310001160106ifrs-full:LaterThanOneMonthAndNotLaterThanThreeMonthsMember2023-12-310001160106ifrs-full:LaterThanThreeMonthsAndNotLaterThanSixMonthsMember2023-12-310001160106lyg:LaterThanSixMonthsAndNotLaterThanNineMonthsMember2023-12-310001160106lyg:LaterThanNineMonthsAndNotLaterThanTwelveMonthsMember2023-12-310001160106ifrs-full:LaterThanOneYearAndNotLaterThanThreeYearsMember2023-12-310001160106ifrs-full:LaterThanThreeYearsAndNotLaterThanFiveYearsMember2023-12-310001160106lyg:LendingCommitmentsMemberifrs-full:NotLaterThanOneMonthMember2023-12-310001160106lyg:LendingCommitmentsMemberifrs-full:LaterThanOneMonthAndNotLaterThanThreeMonthsMember2023-12-310001160106ifrs-full:LaterThanThreeMonthsAndNotLaterThanSixMonthsMemberlyg:LendingCommitmentsMember2023-12-310001160106lyg:LendingCommitmentsMemberlyg:LaterThanSixMonthsAndNotLaterThanNineMonthsMember2023-12-310001160106lyg:LendingCommitmentsMemberlyg:LaterThanNineMonthsAndNotLaterThanTwelveMonthsMember2023-12-310001160106lyg:LendingCommitmentsMemberifrs-full:LaterThanOneYearAndNotLaterThanThreeYearsMember2023-12-310001160106lyg:LendingCommitmentsMemberifrs-full:LaterThanThreeYearsAndNotLaterThanFiveYearsMember2023-12-310001160106lyg:LendingCommitmentsMemberifrs-full:LaterThanFiveYearsMember2023-12-310001160106lyg:LendingCommitmentsMember2023-12-310001160106lyg:OtherCommitmentsMemberifrs-full:NotLaterThanOneMonthMember2023-12-310001160106ifrs-full:LaterThanOneMonthAndNotLaterThanThreeMonthsMemberlyg:OtherCommitmentsMember2023-12-310001160106ifrs-full:LaterThanThreeMonthsAndNotLaterThanSixMonthsMemberlyg:OtherCommitmentsMember2023-12-310001160106lyg:LaterThanSixMonthsAndNotLaterThanNineMonthsMemberlyg:OtherCommitmentsMember2023-12-310001160106lyg:LaterThanNineMonthsAndNotLaterThanTwelveMonthsMemberlyg:OtherCommitmentsMember2023-12-310001160106ifrs-full:LaterThanOneYearAndNotLaterThanThreeYearsMemberlyg:OtherCommitmentsMember2023-12-310001160106lyg:OtherCommitmentsMemberifrs-full:LaterThanThreeYearsAndNotLaterThanFiveYearsMember2023-12-310001160106ifrs-full:LaterThanFiveYearsMemberlyg:OtherCommitmentsMember2023-12-310001160106lyg:OtherCommitmentsMember2023-12-310001160106lyg:AcceptancesAndEndorsementsMemberifrs-full:NotLaterThanOneMonthMember2022-12-310001160106ifrs-full:LaterThanOneMonthAndNotLaterThanThreeMonthsMemberlyg:AcceptancesAndEndorsementsMember2022-12-310001160106ifrs-full:LaterThanThreeMonthsAndNotLaterThanSixMonthsMemberlyg:AcceptancesAndEndorsementsMember2022-12-310001160106lyg:AcceptancesAndEndorsementsMemberlyg:LaterThanSixMonthsAndNotLaterThanNineMonthsMember2022-12-310001160106lyg:AcceptancesAndEndorsementsMemberlyg:LaterThanNineMonthsAndNotLaterThanTwelveMonthsMember2022-12-310001160106ifrs-full:LaterThanOneYearAndNotLaterThanThreeYearsMemberlyg:AcceptancesAndEndorsementsMember2022-12-310001160106lyg:AcceptancesAndEndorsementsMemberifrs-full:LaterThanThreeYearsAndNotLaterThanFiveYearsMember2022-12-310001160106ifrs-full:LaterThanFiveYearsMemberlyg:AcceptancesAndEndorsementsMember2022-12-310001160106lyg:AcceptancesAndEndorsementsMember2022-12-310001160106ifrs-full:OtherContingentLiabilitiesMemberifrs-full:NotLaterThanOneMonthMember2022-12-310001160106ifrs-full:OtherContingentLiabilitiesMemberifrs-full:LaterThanOneMonthAndNotLaterThanThreeMonthsMember2022-12-310001160106ifrs-full:LaterThanThreeMonthsAndNotLaterThanSixMonthsMemberifrs-full:OtherContingentLiabilitiesMember2022-12-310001160106ifrs-full:OtherContingentLiabilitiesMemberlyg:LaterThanSixMonthsAndNotLaterThanNineMonthsMember2022-12-310001160106ifrs-full:OtherContingentLiabilitiesMemberlyg:LaterThanNineMonthsAndNotLaterThanTwelveMonthsMember2022-12-310001160106ifrs-full:LaterThanOneYearAndNotLaterThanThreeYearsMemberifrs-full:OtherContingentLiabilitiesMember2022-12-310001160106ifrs-full:OtherContingentLiabilitiesMemberifrs-full:LaterThanThreeYearsAndNotLaterThanFiveYearsMember2022-12-310001160106ifrs-full:LaterThanFiveYearsMemberifrs-full:OtherContingentLiabilitiesMember2022-12-310001160106ifrs-full:OtherContingentLiabilitiesMember2022-12-310001160106ifrs-full:NotLaterThanOneMonthMember2022-12-310001160106ifrs-full:LaterThanOneMonthAndNotLaterThanThreeMonthsMember2022-12-310001160106ifrs-full:LaterThanThreeMonthsAndNotLaterThanSixMonthsMember2022-12-310001160106lyg:LaterThanSixMonthsAndNotLaterThanNineMonthsMember2022-12-310001160106lyg:LaterThanNineMonthsAndNotLaterThanTwelveMonthsMember2022-12-310001160106ifrs-full:LaterThanOneYearAndNotLaterThanThreeYearsMember2022-12-310001160106ifrs-full:LaterThanThreeYearsAndNotLaterThanFiveYearsMember2022-12-310001160106lyg:LendingCommitmentsMemberifrs-full:NotLaterThanOneMonthMember2022-12-310001160106lyg:LendingCommitmentsMemberifrs-full:LaterThanOneMonthAndNotLaterThanThreeMonthsMember2022-12-310001160106ifrs-full:LaterThanThreeMonthsAndNotLaterThanSixMonthsMemberlyg:LendingCommitmentsMember2022-12-310001160106lyg:LendingCommitmentsMemberlyg:LaterThanSixMonthsAndNotLaterThanNineMonthsMember2022-12-310001160106lyg:LendingCommitmentsMemberlyg:LaterThanNineMonthsAndNotLaterThanTwelveMonthsMember2022-12-310001160106lyg:LendingCommitmentsMemberifrs-full:LaterThanOneYearAndNotLaterThanThreeYearsMember2022-12-310001160106lyg:LendingCommitmentsMemberifrs-full:LaterThanThreeYearsAndNotLaterThanFiveYearsMember2022-12-310001160106lyg:LendingCommitmentsMemberifrs-full:LaterThanFiveYearsMember2022-12-310001160106lyg:LendingCommitmentsMember2022-12-310001160106lyg:OtherCommitmentsMemberifrs-full:NotLaterThanOneMonthMember2022-12-310001160106ifrs-full:LaterThanOneMonthAndNotLaterThanThreeMonthsMemberlyg:OtherCommitmentsMember2022-12-310001160106ifrs-full:LaterThanThreeMonthsAndNotLaterThanSixMonthsMemberlyg:OtherCommitmentsMember2022-12-310001160106lyg:LaterThanSixMonthsAndNotLaterThanNineMonthsMemberlyg:OtherCommitmentsMember2022-12-310001160106lyg:LaterThanNineMonthsAndNotLaterThanTwelveMonthsMemberlyg:OtherCommitmentsMember2022-12-310001160106ifrs-full:LaterThanOneYearAndNotLaterThanThreeYearsMemberlyg:OtherCommitmentsMember2022-12-310001160106lyg:OtherCommitmentsMemberifrs-full:LaterThanThreeYearsAndNotLaterThanFiveYearsMember2022-12-310001160106ifrs-full:LaterThanFiveYearsMemberlyg:OtherCommitmentsMember2022-12-310001160106lyg:OtherCommitmentsMember2022-12-310001160106lyg:DisposalOfTangibleFixedAssetsMember2023-01-012023-12-310001160106lyg:DisposalOfTangibleFixedAssetsMember2022-01-012022-12-310001160106lyg:DisposalOfTangibleFixedAssetsMember2021-01-012021-12-310001160106lyg:RegulatoryAndLegalProvisionsMember2023-01-012023-12-310001160106lyg:RegulatoryAndLegalProvisionsMember2022-01-012022-12-310001160106lyg:RegulatoryAndLegalProvisionsMember2021-01-012021-12-310001160106lyg:LoansAndReceivablesMember2023-01-012023-12-310001160106lyg:LoansAndReceivablesMember2022-01-012022-12-310001160106lyg:LoansAndReceivablesMember2021-01-012021-12-310001160106ifrs-full:FinancialAssetsAvailableforsaleCategoryMember2023-01-012023-12-310001160106ifrs-full:FinancialAssetsAvailableforsaleCategoryMember2022-01-012022-12-310001160106ifrs-full:FinancialAssetsAvailableforsaleCategoryMember2021-01-012021-12-310001160106ifrs-full:BusinessCombinationsMember2023-12-310001160106ifrs-full:BusinessCombinationsMember2022-12-310001160106ifrs-full:BusinessCombinationsMember2021-12-310001160106ifrs-full:BusinessCombinationsMember2023-01-012023-12-310001160106ifrs-full:BusinessCombinationsMember2022-01-012022-12-310001160106ifrs-full:BusinessCombinationsMember2021-01-012021-12-310001160106ifrs-full:PreviouslyStatedMember2022-01-012022-12-310001160106lyg:OtherChangesMember2022-01-012022-12-310001160106ifrs-full:PreviouslyStatedMember2022-12-310001160106lyg:IncreaseDecreaseDueToChangesInAccountingPolicyRequiredByIFRS17Member2022-12-310001160106lyg:OtherChangesMember2022-12-310001160106lyg:IFRS17MovementsNettingMember2022-12-310001160106ifrs-full:PreviouslyStatedMember2021-12-310001160106lyg:OtherChangesMember2021-12-310001160106ifrs-full:MajorOrdinaryShareTransactionsMember2024-02-220001160106srt:ParentCompanyMember2023-01-012023-12-310001160106srt:ParentCompanyMember2022-01-012022-12-310001160106srt:ParentCompanyMember2021-01-012021-12-310001160106srt:ParentCompanyMember2023-12-310001160106srt:ParentCompanyMember2022-12-310001160106ifrs-full:IssuedCapitalMembersrt:ParentCompanyMember2020-12-310001160106srt:ParentCompanyMemberifrs-full:MergerReserveMember2020-12-310001160106srt:ParentCompanyMemberifrs-full:CapitalRedemptionReserveMember2020-12-310001160106ifrs-full:RetainedEarningsMembersrt:ParentCompanyMember2020-12-310001160106ifrs-full:EquityAttributableToOwnersOfParentMembersrt:ParentCompanyMember2020-12-310001160106ifrs-full:OtherEquityInterestMembersrt:ParentCompanyMember2020-12-310001160106srt:ParentCompanyMember2020-12-310001160106ifrs-full:RetainedEarningsMembersrt:ParentCompanyMember2021-01-012021-12-310001160106ifrs-full:EquityAttributableToOwnersOfParentMembersrt:ParentCompanyMember2021-01-012021-12-310001160106ifrs-full:OtherEquityInterestMembersrt:ParentCompanyMember2021-01-012021-12-310001160106ifrs-full:IssuedCapitalMembersrt:ParentCompanyMember2021-01-012021-12-310001160106srt:ParentCompanyMemberifrs-full:MergerReserveMember2021-01-012021-12-310001160106srt:ParentCompanyMemberifrs-full:CapitalRedemptionReserveMember2021-01-012021-12-310001160106ifrs-full:IssuedCapitalMembersrt:ParentCompanyMember2021-12-310001160106srt:ParentCompanyMemberifrs-full:MergerReserveMember2021-12-310001160106srt:ParentCompanyMemberifrs-full:CapitalRedemptionReserveMember2021-12-310001160106ifrs-full:RetainedEarningsMembersrt:ParentCompanyMember2021-12-310001160106ifrs-full:EquityAttributableToOwnersOfParentMembersrt:ParentCompanyMember2021-12-310001160106ifrs-full:OtherEquityInterestMembersrt:ParentCompanyMember2021-12-310001160106srt:ParentCompanyMember2021-12-310001160106ifrs-full:RetainedEarningsMembersrt:ParentCompanyMember2022-01-012022-12-310001160106ifrs-full:EquityAttributableToOwnersOfParentMembersrt:ParentCompanyMember2022-01-012022-12-310001160106ifrs-full:OtherEquityInterestMembersrt:ParentCompanyMember2022-01-012022-12-310001160106ifrs-full:IssuedCapitalMembersrt:ParentCompanyMember2022-01-012022-12-310001160106srt:ParentCompanyMemberifrs-full:MergerReserveMember2022-01-012022-12-310001160106srt:ParentCompanyMemberifrs-full:CapitalRedemptionReserveMember2022-01-012022-12-310001160106ifrs-full:IssuedCapitalMembersrt:ParentCompanyMember2022-12-310001160106srt:ParentCompanyMemberifrs-full:MergerReserveMember2022-12-310001160106srt:ParentCompanyMemberifrs-full:CapitalRedemptionReserveMember2022-12-310001160106ifrs-full:RetainedEarningsMembersrt:ParentCompanyMember2022-12-310001160106ifrs-full:EquityAttributableToOwnersOfParentMembersrt:ParentCompanyMember2022-12-310001160106ifrs-full:OtherEquityInterestMembersrt:ParentCompanyMember2022-12-310001160106ifrs-full:RetainedEarningsMembersrt:ParentCompanyMember2023-01-012023-12-310001160106ifrs-full:EquityAttributableToOwnersOfParentMembersrt:ParentCompanyMember2023-01-012023-12-310001160106ifrs-full:OtherEquityInterestMembersrt:ParentCompanyMember2023-01-012023-12-310001160106ifrs-full:IssuedCapitalMembersrt:ParentCompanyMember2023-01-012023-12-310001160106srt:ParentCompanyMemberifrs-full:CapitalRedemptionReserveMember2023-01-012023-12-310001160106srt:ParentCompanyMemberifrs-full:MergerReserveMember2023-01-012023-12-310001160106ifrs-full:IssuedCapitalMembersrt:ParentCompanyMember2023-12-310001160106srt:ParentCompanyMemberifrs-full:MergerReserveMember2023-12-310001160106srt:ParentCompanyMemberifrs-full:CapitalRedemptionReserveMember2023-12-310001160106ifrs-full:RetainedEarningsMembersrt:ParentCompanyMember2023-12-310001160106ifrs-full:EquityAttributableToOwnersOfParentMembersrt:ParentCompanyMember2023-12-310001160106ifrs-full:OtherEquityInterestMembersrt:ParentCompanyMember2023-12-310001160106lyg:BankingAndFinancialServicesMemberlyg:LloydsBankPlcMember2023-01-012023-12-310001160106lyg:ScottishWidowsLimitedMemberlyg:LifeAssuranceMember2023-01-012023-12-310001160106lyg:HoldingCompanyMemberlyg:HBOSPlcMember2023-01-012023-12-310001160106lyg:BankingAndFinancialServicesMemberlyg:BankOfScotlandPlcMember2023-01-012023-12-310001160106lyg:LloydsBankCorporateMarketsPlcMemberlyg:BankingAndFinancialServicesMember2023-01-012023-12-310001160106lyg:BankingAndFinancialServicesMemberlyg:LBGEquityInvestmentsLimitedMember2023-01-012023-12-31
As filed with the Securities and Exchange Commission on 22 February 2024
UNITED STATES
SECURITIES AND EXCHANGE COMMISSION
WASHINGTON, D.C. 20549
Form 20-F
☐ REGISTRATION STATEMENT PURSUANT TO SECTION 12(b) OR 12(g) OF THE SECURITIES EXCHANGE ACT OF 1934
OR
☒ ANNUAL REPORT PURSUANT TO SECTION 13 OR 15(d) OF THE SECURITIES EXCHANGE ACT OF 1934
For the fiscal year ended 31 December 2023
OR
☐ TRANSITION REPORT PURSUANT TO SECTION 13 OR 15(d) OF THE SECURITIES EXCHANGE ACT OF 1934
OR
☐ SHELL COMPANY REPORT PURSUANT TO SECTION 13 OR 15(d) OF THE SECURITIES EXCHANGE ACT OF 1934
Commission file number 001-15246
Lloyds Banking Group plc
(previously Lloyds TSB Group plc)
(Exact name of Registrant as specified in its charter)
Scotland
(Jurisdiction of incorporation or organization)
25 Gresham Street
London EC2V 7HN
United Kingdom
(Address of principal executive offices)
Kate Cheetham, Company Secretary
Tel +44 (0) 20 7356 2104, Fax +44 (0) 20 7356 1808
25 Gresham Street
London EC2V 7HN
United Kingdom
(Name, Telephone, E-mail and/or Facsimile number and Address of Company Contact Person)
Securities registered or to be registered pursuant to Section 12(b) of the Act:
| | | | | | | | |
| Title of each class | Trading symbol(s) | Name of each exchange on which registered |
| Ordinary shares of nominal value 10 pence each, represented by American Depositary Shares | | The New York Stock Exchange |
| $1,500,000,000 4.344% Subordinated Securities due in 2048 | LYG48A | The New York Stock Exchange |
| $1,175,176,000 3.369% Subordinated Notes due 2046 | LYG46 | The New York Stock Exchange |
| $824,033,000 5.300% Subordinated Securities due 2045. | LYG45 | The New York Stock Exchange |
| $1,000,000.000 7.953% Fixed Rate Reset Subordinated Debt Securities due 2033 | LYG33A | The New York Stock Exchange |
| $1,250,000,000 4.976% Senior Callable Fixed-to-Fixed Rate Notes due 2033 | LYG33 | The New York Stock Exchange |
| £500,000,000 1.985% Subordinated Notes due 2031 | LYG31 | The New York Stock Exchange |
| $1,250,000,000 5.871% Senior Callable Fixed-to-Fixed Rate Notes due 2029 | LYG29 | The New York Stock Exchange |
| $1,000,000,000 3.750% Senior Callable Fixed-to-Fixed Rate Notes due 2028 | LYG28D | The New York Stock Exchange |
| $1,250,000,000 4.550% Senior Notes due 2028 | LYG28C | The New York Stock Exchange |
| $1,500,000,000 4.375% Senior Notes due 2028 | LYG28B | The New York Stock Exchange |
| $1,750,000,000 3.574% Senior Notes due in 2028 (callable in 2027) | LYG28A | The New York Stock Exchange |
| $500,000,000 Senior Callable Floating Rate Notes due 2027 | LYB27C | The New York Stock Exchange |
| $1,500,000,000 5.985% Senior Callable Fixed-to-Fixed Rate Notes due 2027 | LYG27B | The New York Stock Exchange |
| $1,000,000,000 1.627% Senior Notes due 2027 | LYG27A | The New York Stock Exchange |
| $1,250,000,000 3.750% Senior Notes due 2027 | LYG27 | The New York Stock Exchange |
| $1,250,000,000 4.716% Senior Callable Fixed-to-Fixed Rate Notes due 2026 | LYG26C | The New York Stock Exchange |
| $1,000,000,000 3.511% Senior Callable Fixed-to-Fixed Rate Notes due 2026 | LYG26B | The New York Stock Exchange |
| $1,000,000,000 2.438% Senior Notes due 2026 | LYG26A | The New York Stock Exchange |
| $1,500,000,000 4.650% Subordinated Securities due 2026. | LYG26 | The New York Stock Exchange |
| $1,500,000,000 3.870% Senior Notes due 2025 | LYG25B | The New York Stock Exchange |
| $1,500,000,000 4.450% Senior Notes due 2025 | LYG25A | The New York Stock Exchange |
| $1,327,685,000 4.582% Subordinated Securities due 2025 | LYG25 | The New York Stock Exchange |
| $1,250,000,000 3.500% Senior Notes due 2025 | LYG/25 | The New York Stock Exchange |
| $1,000,000,000 3.900% Senior Notes due 2024 | LYG24A | The New York Stock Exchange |
| $1,000,000,000 4.500% Subordinated Securities due 2024 | LYG24 | The New York Stock Exchange |
Securities registered or to be registered pursuant to Section 12(g) of the Act:
None
Securities for which there is a reporting obligation pursuant to Section 15(d) of the Act:
8.000% Fixed Rate Reset Additional Tier 1 Perpetual Subordinated Contingent Convertible Securities (Callable September 27, 2029 and on any day until the First Reset Date on March 27, 2030 and on any day in the period six months before any subsequent Reset Date)
8.500% Fixed Rate Reset Additional Tier 1 Perpetual Subordinated Contingent Convertible Securities (Callable March 27, 2028 and on any day until the First Reset Date on September 27, 2028 and on any day in the period six months before any subsequent Reset Date)
8.500% Fixed Rate Reset Additional Tier 1 Perpetual Subordinated Contingent Convertible Securities (Callable September 27, 2027 and on any day until the First Reset Date on March 27, 2028 and on any day in the period six months before any subsequent Reset Date)
7.500% Fixed Rate Reset Additional Tier 1 Perpetual Subordinated Contingent Convertible Securities
6.750% Callable Fixed Rate Reset Additional Tier 1 Perpetual Subordinated Contingent Convertible Securities
5.125% Callable Fixed Rate Reset Additional Tier 1 Perpetual Subordinated Contingent Convertible Securities
The number of outstanding shares of each of Lloyds Banking Group plc’s classes of capital or common stock as of 31 December 2023 was:
| | | | | |
| Ordinary shares, nominal value 10 pence each | 63,569,225,662 |
| Preference shares, nominal value 25 pence each | 343,414,648 |
| Preference shares, nominal value 25 cents each | 86,617 |
| Preference shares, nominal value 25 Euro cents each | Nil |
Indicate by check mark if the registrant is a well-known seasoned issuer, as defined in Rule 405 of the Securities Act. Yes ☒ No ☐
If this report is an annual or transition report, indicate by check mark if the registrant is not required to file reports pursuant to Section 13 or 15(d) of the Securities Exchange Act of 1934. Yes ☐ No ☒
Indicate by check mark whether the registrant: (1) has filed all reports required to be filed by Section 13 or 15(d) of the Securities Exchange Act of 1934 during the preceding 12 months (or for such shorter period that the registrant was required to file such reports) and (2) has been subject to such filing requirements for the past 90 days. Yes ☒ No ☐
Indicate by check mark whether the registrant has submitted electronically and posted on its corporate Website, if any, every Interactive Data File required to be submitted and posted pursuant to Rule 405 of Regulation S-T (§232.405 of this chapter) during the preceding 12 months (or for such shorter period that the registrant was required to submit and post such files). Yes ☒ No ☐
Indicate by check mark whether the registrant is a large accelerated filer, an accelerated filer, a non-accelerated filer, or an emerging growth company. See the definitions of “large accelerated filer”, “accelerated filer”, and “emerging growth company” in Rule 12b-2 of the Exchange Act. (Check one): Large accelerated filer ☒ Accelerated filer ☐ Non-Accelerated filer ☐ Emerging Growth Company ☐
If an emerging growth company that prepares its financial statements in accordance with U.S. GAAP, indicate by check mark if the registrant has elected not to use the extended transition period for complying with any new or revised financial accounting standards† provided pursuant to Section 13(a) of the Exchange Act. ☐
Indicate by check mark whether the registrant has filed a report on and attestation to its management’s assessment of the effectiveness of its internal control over financial reporting under Section 404(b) of the Sarbanes-Oxley Act (15 U.S.C. 7262(b)) by the registered public accounting firm that prepared or issued its audit report. ☒
If securities are registered pursuant to Section 12(b) of the Act, indicate by check mark whether the financial statements of the registrant included in the filing reflect the correction of an error to previously issued financial statements ☐
Indicate by check mark whether any of those error corrections are restatements that required a recovery analysis of incentive based compensation received by any of the registrant’s executive officers during the relevant recovery period pursuant to §240.10D-1(b) ☐
Indicate by check mark which basis of accounting the registrant has used to prepare the financial statements included in this filing:
U.S. GAAP ☐ International Financial Reporting Standards as issued by the International Accounting Standards Board ☒ Other ☐
If ‘Other’ has been checked in response to the previous question, indicate by check mark which financial statement item the registrant has elected to follow: Item 17 ☐ Item 18 ☐
If this is an annual report, indicate by check mark whether the registrant is a shell company (as defined in Rule 12b-2 of the Exchange Act). Yes ☐ No ☒
† The term “new or revised financial accounting standard” refers to any update issued by the Financial Accounting Standards Board to its Accounting Standards Codification after April 5, 2012.
| | | | | |
Presentation of information | |
| |
| |
| |
| |
| |
| |
| |
| |
| |
| |
| |
| |
| |
| |
| |
| |
| |
| |
| |
| |
| |
| |
| |
| |
Presentation of information
In this annual report, references to the ‘Company’ are to Lloyds Banking Group plc; references to ‘Lloyds Banking Group’, ‘Lloyds’ or the ‘Group’ are to Lloyds Banking Group plc and its subsidiary and associated undertakings; references to ‘Lloyds Bank’ are to Lloyds Bank plc; and references to the ‘consolidated financial statements’ or ‘financial statements’ are to Lloyds Banking Group’s consolidated financial statements included in this annual report. References to the ‘Financial Conduct Authority’ or ‘FCA’ and to the ‘Prudential Regulation Authority’ or ‘PRA’ are to the United Kingdom (the UK) Financial Conduct Authority and the UK Prudential Regulation Authority. References to the ‘Financial Services Authority’ or ‘FSA’ are to their predecessor organisation, the UK Financial Services Authority.
The consolidated financial statements have been prepared in accordance with International Financial Reporting Standards as issued by the International Accounting Standards Board (IASB). Certain disclosures required by IFRS have been included in sections highlighted as ‘Audited’ within the Operating and financial review and prospects section of this Annual Report on Form 20-F on pages 15 to 95. Disclosures marked as audited indicate that they are within the scope of the audit of the financial statements taken as a whole; these disclosures are not subject to a separate opinion. In this annual report, amounts described as ‘statutory’ refer to amounts included within the Group’s consolidated financial statements.
Lloyds Banking Group publishes its consolidated financial statements expressed in British pounds (‘pounds Sterling’, ‘Sterling’ or ‘£’), the lawful currency of the UK. In this annual report, references to ‘pence’ and ‘p’ are to one-hundredth of one pound Sterling; references to ‘US Dollars’, ‘US$’ or ‘$’ are to the lawful currency of the United States (the US); references to ‘cent’ or ‘c’ are to one-hundredth of one US Dollar; references to ‘Euro’ or ‘€’ are to the lawful currency of the member states of the European Union (EU) that have adopted a single currency in accordance with the Treaty establishing the European Communities, as amended by the Treaty of European Union; references to ‘Euro cent’ are to one-hundredth of one Euro; references to ‘Australian Dollar’, ‘Australian $’ or ‘A$’ are to the lawful currency of Australia; references to ‘Singapore Dollar ’, ‘Singapore $’ or ‘S$’ are to the lawful currency of Singapore; and references to ‘Japanese Yen’, ‘Japanese ¥’ or ‘¥’ are to the lawful currency of Japan. Solely for the convenience of the reader, this annual report contains translations of certain pounds Sterling amounts into US Dollars at specified rates. These translations should not be construed as representations by Lloyds Banking Group that the pounds Sterling amounts actually represent such US Dollar amounts or could be converted into US Dollars at the rate indicated or at any other rate. Unless otherwise stated, the translations of pounds Sterling into US Dollars have been made at the Noon Buying Rate in New York City for cable transfers in pounds Sterling as certified for customs purposes by the Federal Reserve Bank of New York (the Noon Buying Rate) in effect on 31 December 2023. The Noon Buying Rate on 31 December 2023 differs from certain of the actual rates used in the preparation of the consolidated financial statements, which are expressed in pounds Sterling, and therefore US Dollar amounts appearing in this annual report may differ significantly from actual US Dollar amounts which were translated into pounds Sterling in the preparation of the consolidated financial statements in accordance with IFRS.
| | | | | | | | |
1 | Lloyds Banking Group plc Annual Report on Form 20-F 2023 | |
Lloyds Banking Group is a leading provider of financial services to individual and business customers in the UK. At 31 December 2023, Lloyds Banking Group’s total assets were £881,453 million and Lloyds Banking Group had 62,569 employees (on a full-time equivalent basis). Lloyds Banking Group plc’s market capitalisation at that date was £30,329 million. The Group reported a profit before tax for the year ended 31 December 2023 of £7,503 million, and its capital ratios at that date were 14.6 per cent for common equity tier 1 capital, 17.2 per cent for tier 1 capital and 19.8 per cent for total capital.
Set out below is the Group’s summarised income statement for each of the last two years:
| | | | | | | | |
| 2023 £m | 20221,2 £m |
| Net interest income | 13,298 | | 12,922 | |
| Other income | 22,107 | | (18,268) | |
| Total income | 35,405 | | (5,346) | |
| Net finance (expense) income in respect of insurance and investment contracts | (16,776) | | 20,887 | |
| Total income, after net finance (expense) income in respect of insurance and investment contracts | 18,629 | | 15,541 | |
| Operating expenses | (10,823) | | (9,237) | |
| Impairment | (303) | | (1,522) | |
| Profit before tax | 7,503 | | 4,782 | |
1 Restated for the adoption of IFRS 17; see notes 1 and 54 to the consolidated financial statements.
2 Restated for presentational changes; see note 1
Lloyds Banking Group’s main business activities are retail and commercial banking and long-term savings, protection and investment and it operates primarily in the UK. Services are offered through a number of well recognised brands including Lloyds Bank, Halifax, Bank of Scotland and Scottish Widows, and through a range of distribution channels including the largest branch network and digital bank in the UK.
At 31 December 2023, the Group’s three primary operating divisions, which are also its financial reporting segments, were: Retail; Commercial Banking; and Insurance, Pensions and Investments. Retail offers a broad range of financial services products to personal customers, including current accounts, savings, mortgages, credit cards, unsecured loans, motor finance and leasing solutions. Commercial Banking serves small and medium businesses and corporate and institutional clients, providing lending, transactional banking, working capital management, debt financing and risk management services. Insurance, Pensions and Investments offers insurance, investment and pension management products and services.
Profit before tax is analysed on pages 17 to 22 on a statutory basis and, for the Group’s segments, on pages 23 to 28 on an underlying basis. The key principles adopted in the preparation of this basis of reporting are described on page 23. The Group Executive Committee, which is the chief operating decision maker for the Group, reviews the Group’s internal reporting based around these segments (which reflect the Group’s organisational and management structures) in order to assess performance and allocate resources; this reporting is on an underlying basis. IFRS 8 Operating Segments requires that the Group presents its segmental profit before tax on the basis reviewed by the chief operating decision maker that is most consistent with the measurement principles used in measuring the Group’s statutory profit before tax. Accordingly, the Group presents its segmental underlying profit before tax in note 4 to the financial statements in compliance with IFRS 8. The table below shows the results of Lloyds Banking Group’s segments in the last two years, and their aggregation. Further information on non-GAAP measures and the reconciliations required by the Securities and Exchange Commission’s Regulation G are set out on pages 23 to 24 and further information on segmental performance is presented on pages F-27 to F-31. | | | | | | | | |
| 2023 £m | 20221 £m |
| Retail | 4,043 | | 4,497 | |
| Commercial Banking | 3,219 | | 1,861 | |
| Insurance, Pensions and Investments | 190 | | (62) | |
| Other | 357 | | 732 | |
| Underlying profit before tax | 7,809 | | 7,028 | |
1 Restated for the adoption of IFRS 17; see notes 1 and 54 to the consolidated financial statements.
| | | | | | | | |
2 | Lloyds Banking Group plc Annual Report on Form 20-F 2023 | |
History and development of Lloyds Banking Group
Lloyds Banking Group plc was incorporated as a public limited company and registered in Scotland under the UK Companies Act 1985 on 21 October 1985 with the registered number SC095000. Lloyds Banking Group plc’s registered office is The Mound, Edinburgh EH1 1YZ, Scotland, and its principal executive offices in the UK are located at 25 Gresham Street, London EC2V 7HN, telephone number +44 (0)20 7626 1500.
The history of the Group can be traced back to the 18th century when the banking partnership of Taylors and Lloyds was established in Birmingham, England. Lloyds Bank Plc was incorporated in 1865 and during the late 19th and early 20th centuries entered into a number of acquisitions and mergers, significantly increasing the number of banking offices in the UK. In 1995, it continued to expand with the acquisition of the Cheltenham and Gloucester Building Society.
TSB Group plc became operational in 1986 when, following UK Government legislation, the operations of four Trustee Savings Banks and other related companies were transferred to TSB Group plc and its new banking subsidiaries. By 1995, the TSB Group had, either through organic growth or acquisition, developed life and general insurance operations, investment management activities, and a motor vehicle hire purchase and leasing operation to supplement its retail banking activities.
In 1995, TSB Group plc merged with Lloyds Bank Plc. Under the terms of the merger, the TSB and Lloyds Bank groups were combined under TSB Group plc, which was re-named Lloyds TSB Group plc, with Lloyds Bank Plc, which was subsequently re-named Lloyds TSB Bank plc, the principal subsidiary. In 1999, the businesses, assets and liabilities of TSB Bank plc, the principal banking subsidiary of the TSB Group prior to the merger, and its subsidiary Hill Samuel Bank Limited were vested in Lloyds TSB Bank plc, and in 2000, Lloyds TSB Group acquired Scottish Widows. In addition to already being one of the leading providers of banking services in the UK, the acquisition of Scottish Widows also positioned Lloyds TSB Group as one of the leading suppliers of long-term savings and protection products in the UK.
The HBOS Group had been formed in September 2001 by the merger of Halifax plc and Bank of Scotland. The Halifax business began with the establishment of the Halifax Permanent Benefit Building Society in 1852; the society grew through a number of mergers and acquisitions including the merger with Leeds Permanent Building Society in 1995 and the acquisition of Clerical Medical in 1996. In 1997 the Halifax converted to plc status and floated on the London stock market. Bank of Scotland was founded in July 1695, making it Scotland’s first and oldest bank.
On 18 September 2008, with the support of the UK Government, the boards of Lloyds TSB Group plc and HBOS plc announced that they had reached agreement on the terms of a recommended acquisition by Lloyds TSB Group plc of HBOS plc. The shareholders of Lloyds TSB Group plc approved the acquisition at the Company’s general meeting on 19 November 2008. On 16 January 2009, the acquisition was completed and Lloyds TSB Group plc changed its name to Lloyds Banking Group plc.
Pursuant to two placing and open offers which were completed by the Company in January and June 2009 and the Rights Issue completed in December 2009, the UK Government acquired 43.4 per cent of the Company’s issued ordinary share capital. Following sales of shares in September 2013 and March 2014 and the completion of trading plans, the UK Government completed the sale of its shares in May 2017, returning the Group to full private ownership.
Pursuant to its decision approving state aid to the Group, the European Commission required the Group to dispose of a retail banking business meeting minimum requirements for the number of branches, share of the UK personal current accounts market and proportion of the Group’s mortgage assets. Following disposals in 2014, the Group sold its remaining interest in TSB to Banco de Sabadell (Sabadell) in 2015, and all EC state aid requirements were met by 30 June 2017.
On 1 June 2017, following the receipt of competition and regulatory approval, the Group acquired 100 per cent of the ordinary share capital of MBNA Limited, which together with its subsidiaries operates a UK consumer credit card business, from FIA Jersey Holdings Limited, a wholly-owned subsidiary of Bank of America.
The Group successfully launched its non ring-fenced bank, Lloyds Bank Corporate Markets plc in 2018, transferring in the non ring-fenced business from the rest of the Group, thereby meeting its legal requirements under ring-fencing legislation.
On 23 October 2018, the Group announced a partnership with Schroders plc to create a market-leading wealth management proposition. The three key components of the partnership are: (i) the establishment of a new financial planning joint venture; (ii) the Group taking a 19.9 per cent stake in Schroders high net worth UK wealth management business; and (iii) the appointment of Schroders as the active investment manager of approximately £80 billion of the Group’s insurance and wealth related assets. The joint venture, Schroders Personal Wealth, was launched to the market in the third quarter of 2019. The Group’s interest in the joint venture is 50.1 per cent.
On 1 February 2022, the Group announced that it had completed the acquisition of Embark Group, a fast growing investment and retirement platform business. Embark is a part of the Group’s Wealth proposition, alongside Schroders Personal Wealth and the Group’s investment in Cazenove Capital.
On 22 February 2023, the Group announced that it had acquired 100 per cent of the ordinary share capital of Hamsard 3352 Limited (“Tusker”) which, together with its subsidiaries, operates a vehicle management and leasing business. The acquisition has enabled the Group to expand its salary sacrifice proposition within motor finance.
Strategy of Lloyds Banking Group
Lloyds Banking Group is the largest bank and sole integrated provider of banking, insurance and wealth propositions in the UK. The Group’s strong foundations have created distinctive competitive strengths. It has leading customer franchises with trusted brands, significant data assets and leading market shares. Alongside this, the Group has a strong balance sheet, disciplined risk management and an efficient business model, operating at scale with strong cost discipline.
The Group’s purpose of Helping Britain Prosper drives its business model and strategic participation choices. The Group’s strategy has a clear vision to be a UK-customer focused digital leader and integrated financial services provider, capitalising on new opportunities, at scale. This strategy is purpose-driven, with a clear focus on areas where the Group can profitably grow and make the greatest impact on environmental transition and helping build a society that represents people and businesses across the UK.
Through its strategy, Lloyds Banking Group aims to transform its business, creating greater, more sustainable value for all stakeholders. The Group expects to drive revenue growth and diversification across all its main businesses, with a particular focus on deepening and innovating in Consumer Relationships, creating a new Mass Affluent offering, digitising and diversifying the SME business and targeting its Corporate and Institutional offering. The Group is also focusing on strengthening cost and capital efficiency, together built off a powerful enabling platform maximising the potential of people, technology and data to support the business ambitions. The strategy will enable the Group to deliver higher, more sustainable returns and capital generation.
This section contains forward looking statements, please refer to forward looking statements on page 183. | | | | | | | | |
3 | Lloyds Banking Group plc Annual Report on Form 20-F 2023 | |
Business and activities of Lloyds Banking Group
The Group’s activities are organised into three financial reporting segments: Retail; Commercial Banking; and Insurance, Pensions and Investments.
Further information on the Group’s financial reporting segments is set out on pages 25 to 27 and in note 4 to the financial statements. Material contracts
The Company and its subsidiaries are party to various contracts in the ordinary course of business.
Environmental matters
Creating a sustainable future is core to our purpose of Helping Britain Prosper. Guided by our Group strategy, we are focusing on areas where we can have an impact, supporting the UK’s transition through our lending, investments, products and services.
Our environmental sustainability strategy aligns with the Group’s strategic priorities of Grow, Focus, Change, with sustainability embedded into how we as a Group operate. In developing targets, our first transition plan and assessing the Group’s risks and related opportunities to support our customers, the need to move from a sector focus to a system led approach has become clear. The Group sees climate strategy as both an opportunity for the business to grow in support of our customers and a means of risk management in pursuit of our strategy.
We have four systems where we believe we can leverage our scale, reach in the market and the different financial services we offer to consider climate and environmental issues across and between each system. These systems are focused on where we live through greening the built environment, how we move through low carbon transport, how we farm with a more sustainable farming and food system, and through the energy we use with an energy transition fundamental to broader decarbonisation. The delivery of our strategy and oversight of the related risks and opportunities is governed through our Board and executive committees; further details of our sustainability governance structure can be found on page 136. We continue to evolve how we identify, assess and manage climate-related risks and opportunities. While we are progressing on all ambitions to date, there are significant challenges and external dependencies in many of our sectors and systems that will need to be addressed for us to achieve our targets and our overall ambition to reduce the emissions we finance by more than 50 per cent by 2030.
Climate resilience
We have undertaken scenario analysis to assess the resilience of the Group’s strategy, building on the lessons learnt from the Bank of England’s 2021 Climate Biennial Exploratory Scenario (CBES). This included an initial assessment of the sectors most exposed to climate-related risks. This exercise has demonstrated that the Group has relatively low commercial lending exposure to some of the main sectors most negatively impacted by climate change. Similar analysis has also been undertaken on the Group’s investments portfolio. This assessment has supported the focus for the Group’s environmental sustainability strategy and emission reductions targets. This analysis has also informed consideration of climate risk in the Group’s calculation of expected credit losses. This has included a top-down sector-level assessment for our commercial clients, as well as assessment of flood risk and affordability impacts relating to retrofitting costs based on energy performance certificates (EPCs) for our Homes portfolio. These estimated impacts are below the Group’s materiality thresholds; therefore, no adjustments have been made to the expected credit losses measured as at 31 December 2023. On this basis, the Group’s business model is also considered to be resilient against the risks from climate change.
Further details on this analysis can be found in the Climate Risk Scenario Analysis update in Risk Management pages 54 to 56. Our sustainability objectives
| | | | | | | | | | | |
| Group strategic priorities | Grow Drive revenue growth and diversification | Focus Strengthen cost and capital efficiency | Change Maximise the potential of people, technology and data |
| Core business environmental sustainability objectives | •Capitalising on sustainable financing and investment opportunities •Improving access to quality housing | •Reducing emissions and monitoring our sustainability-related risks to manage costs and mitigate against future losses | •Embedding sustainability in all that we do •Supporting and engaging with our colleagues |
| Environmental ambitions and targets | •2030 and 2050 ambition and targets: bank financed emissions, including 10 bank sector 2030 emission reduction targets •2030 and 2050 ambition: Scottish Widows financed emissions •2030 and 2050 targets: for our own operations and supply chain emissions •2024 and 2026 targets: for bank sustainable finance •2025 target: for Scottish Widows investments in climate-aware strategies |
Climate risks and opportunities
Climate risk is a key area of focus for the Group, specifically the risk of experiencing losses and/or reputational damage, either from the impacts of climate change and the transition to net zero or as a result of the Group’s response to tackling climate change.
We consider this risk to arise through two channels, physical or transition risks:
•Physical risks arising from changes in climate or weather patterns. These can either be acute (event driven such as floods or storms), or chronic (longer-term shifts such as rising sea levels or droughts)
•Transition risks due to the changes associated with moving towards a low carbon economy, including changes to policy, legislation and regulation, technology and market, or legal risks from failing to manage the transition
The impacts from climate risk largely manifest through other principal risks that the Group faces, therefore consideration of climate-related risk is integrated into some of our wider risk management processes. Further information on climate-related risks and how we identify, assess and manage them can be found on pages 53 to 56 in Risk management. | | | | | | | | |
4 | Lloyds Banking Group plc Annual Report on Form 20-F 2023 | |
How we identify, assess and manage opportunities
One of the main risks facing the Group is the failure to adequately support the transition to net zero. We have the responsibility to manage our own operational emissions and the opportunity to support our colleagues and customers to transition, noting our biggest opportunities are in relation to the areas where we have the largest lending including residential mortgages and real estate sector. The identification, assessment and management of these opportunities is undertaken on a regular basis by our functional-level and divisional teams, and approval of new initiatives governed in line with our sustainability governance structure.
The time frames applied for considering the impact of climate-related opportunities is aligned with those used for business planning: short term: 0-1 year, medium term: 1-5 years, long term: 5+ years. We note that the timing is partly dependent on external factors such as UK government policy and regulation, technology developments, as well as our customers’ response. The following is an indicative list of the climate-related opportunities that we have incorporated or will aim to incorporate in the medium to long term across the Group.
Opportunities
| | | | | | | | |
| Opportunity | Driver | Time horizon |
| Increasing consumer preference for sustainable products including in relation to our pension offering, sustainability-linked loans, financing of EVs and home improvements | Transition (Technology, Market) | Short, medium, long |
| Providing finance to support investment in climate-related technology | Transition (Technology, Market) | Medium, long |
| Develop products to promote climate resilience such as the Build Back Better scheme for home insurance | Physical Transition (Technology, Market) | Short, medium, long |
| Reducing the emissions from our direct operations | Transition (Reputation, Technology, Market) | Short, medium, long |
| Develop industry partnerships to help drive energy-efficient solutions for our customers and build knowledge on how we can further support our customers and suppliers to transition | Transition (Technology, Market, Policy, Reputation) | Short, medium, long |
We have identified opportunities to:
1.Respond to increasing customer preference for sustainable products. We recognise the growing sentiment for sustainability-linked products as a key opportunity and are progressing against our sustainable financing and investment targets to deliver against our identified opportunities.
2.Support investment in climate-related technology, mobilising our net zero origination programme to monitor and identify the most significant transition technologies.
3.Develop products to promote climate resilience, engaging in this opportunity though the Build Back Better scheme for home insurance and our efforts in greening the built environment through our products and services.
4.Embrace the opportunity to reduce emissions from our own operations; we remain focused on removing all use of natural gas from our estate, replacing gas boilers with low-carbon heating technologies and creating more sustainable branches in communities across the UK.
5.Develop industry partnerships, such as with the Soil Association Exchange and Octopus Energy, which help build knowledge on how we can further support our customers and suppliers to transition.
| | | | | | | | |
5 | Lloyds Banking Group plc Annual Report on Form 20-F 2023 | |
Metrics and targets
A breakdown of our lending portfolio showing our exposure to sectors at increased climate risk is detailed below.
Bank lending to customers in sectors with increased climate risk
Our lending portfolio means our biggest exposure to sectors at increased climate risk is in relation to our residential mortgages and our real estate sector.
1 Based on the standard European nomenclature of productive activities (NACE codes) as presented within notes to the consolidated financial statements (note 52: Financial Risk Management, (B) Concentrations of Exposure).
2 Based on standard industrial classification (SIC) codes.
3 Lending is based on total loans and advances to customers before allowance for impairment losses.
4 Off-BS (Off Balance Sheet) includes total commitments, guarantees and contingent liabilities.
5 Agriculture includes Scottish Widows loans held via securitisation.
6 Real estate includes social housing and loans held via securitisation.
| | | | | | | | |
6 | Lloyds Banking Group plc Annual Report on Form 20-F 2023 | |
Analysis by IFRS 9 expected credit loss stage and maturity for lending made to sectors classified as being at increased climate risk.
1 Residential (mortgages and other) includes POCI (purchased or originated credit-impaired, £1.8 billion Stage 1, £3.3 billion Stage 2 and £2.8 billion Stage 3).
We have calculated financed emissions for 97.3 per cent of our assets in scope of PCAF methodology.
Based on 2022 total Group assets of £877.8 billion, approximately £544.7 billion of assets (excluding pension and investment balances) are in scope of Partnership for Carbon Accounting Financials (PCAF) methodology. We have calculated emissions for 97.3 per cent of our Bank assets in-scope of PCAF, including cash.
Cash is represented in our coverage as zero emissions, noting the PCAF standard does not have a methodology for cash. The table below shows the proportion of lending that is covered by Net Zero Banking Alliance (NZBA) Financed Emissions sector targets:
1 Relates to financial lines that are not in scope of PCAF.
2 Mainly relates to exclusion of pensions and Investment balances which are covered through our Scottish Widows financed emissions ambition.
3 Relates to zero-emission balances, mainly cash.
4 Relates to lending portfolios where emissions are yet to be calculated.
| | | | | | | | |
7 | Lloyds Banking Group plc Annual Report on Form 20-F 2023 | |
The scale of our emissions varies across different areas of the business. A breakdown of our Group’s absolute emissions is shown below. Our emissions footprint has guided our approach to assessing the risks and opportunities and where we have the biggest role to play. We calculate our emissions in line with the Greenhouse Gas Protocol.
| | | | | | | | |
| Area of the Group | Absolute emission (MtCO2e)1,2 |
Bank financed emissions
(2022) | 22 | |
Scottish Widows financed emissions
(2022) | 10.2 | |
Supply chain emissions
(2022/23) | 0.8 | √ |
Own operation emissions
(2022/23) | 0.1 | √ |
1 Based on 2022 data available for bank and Scottish Widows financed emissions Scope 1 and 2 emissions only. 2022/23 period end data for supply chain emissions. 2022/23 period end data for own operations includes Scope 1, 2 and 3 categories and is reported on a market basis.
2 √ Indicator is subject to limited ISAE 3000 (revised) assurance by Deloitte LLP.
We have set several ambitions across our own operations, supply chain and lending and investments to support the decarbonisation of our business in line with limiting global warming to 1.5°C.
Our emissions and financing targets drive the delivery of our environmental strategy. With these targets supporting management of our climate-related risks and opportunities, notably the risk “failure to support the transition to net zero”. Our 2023 balanced scorecard applies a meaningful 10 per cent weighting to environmental measures, having key performance measured by assessing the progress against our targets and sustainable financing and investments. From 2024 the Long Term Incentive Plan (LTIP) will include a weighting of 15 per cent against environment measures, reflecting that the transition to a low carbon economy is core to the Group strategy. Further details on the balanced scorecard and LTIP process can be found on page 105 and 116.
Our emissions targets
Bank ambition
Work with customers, government and the market to help reduce the carbon emissions we finance by more than 50 per cent by 2030 on the path to net zero by 2050 or sooner.
Our overall bank emissions reduction ambition is supported by 10 sector-specific targets covering our highest emitting sectors. These targets are supported by sector-specific transition plans which detail how we are supporting our customers and clients to transition in these areas.
Our NZBA targets and sector lending coverage
5 There are rounding differences between target baseline, percentage reduction and 2030 target. Targets cover on-balance sheet assets.
6 √ Indicator is subject to limited ISAE 3000 (revised) assurance by Deloitte LLP. Deloitte’s 2023 assurance statement and the 2023 consolidated reporting criteria are available online at our download centre.
7 Shows divergence between 2022 actual and 2022 reference pathway emission intensity. Arrow up – performance for 2022 ahead of reference pathway. Arrow down – performance for 2022 behind reference pathway.
8 Data availability has resulted in physical emissions for 2022 C&RRE being held flat, and instead employing the 2021 position. This follows PCAF guidance to use most recent available when presented with a lag in available emissions-related data. We will look to enhance methodology in 2024.
9 Retail motor cars and vans divergence, is based on divergence from scenario pathway as no reference pathway is available.
| | | | | | | | |
8 | Lloyds Banking Group plc Annual Report on Form 20-F 2023 | |
Our Bank financed emissions
The table shows the Bank’s absolute financed emissions and the physical and economic intensity along with PCAF data quality scores.
Our Scope 3 financed emissions are calculated from the Scope 1 and 2 emissions generated from our investments or lending. Scope 3 (value chain) emissions are also calculated and reported separately for certain sectors, aligning to the PCAF standard phased approach. We continue to refine our estimates of financed emissions as we enhance our understanding, calculation methodologies and data.
We recognise our role in the UK economy, and the opportunities it creates to support the transition of our most carbon-intensive sectors in order to meet our net zero ambitions. In supporting the transition of these sectors, through direct financing, our financed emissions may increase on a temporary basis. In the long term we expect that supporting the transition of our high carbon sector clients will reduce our financed emissions.
1 Our 2018 baseline year has been restated from 28.6 MtCO2e to 29.6 MtCO2e (3.5 per cent increase) due to methodology changes and improved data for motor and commercial banking portfolios.
2 The Bank’s scope 3 emissions are made up of the Scope 1, 2 and 3 emissions of the customers we lend to. PCAF allows for a phasing in of disclosure for customers’ Scope 3 emissions. Within Commercial Banking without NZBA targets our Scope 3 disclosures cover sectors across transportation, construction, buildings, material and industrial activities in line with PCAF guidance. An estimated range has been provided due to both the limited availability and variability of published Scope 3 data.
3 √ Indicator is subject to limited ISAE 3000 (revised) assurance by Deloitte LLP.
4 Data availability has resulted in calculation of 2022 C&RRE absolute emissions using 2021 emissions data. This follows PCAF guidance to use most recent available when presented with a lag in available emissions-related data. We will look to enhance methodology in 2024.
5 2018 Consumer lending without NZBA targets relates to UK mortgages balances, prior to setting a NZBA target.
| | | | | | | | |
9 | Lloyds Banking Group plc Annual Report on Form 20-F 2023 | |
Scottish Widows
1 Carbon footprint is a measure of carbon intensity calculated as absolute value of emissions applicable to an investment divided by the value of investment. The carbon footprint measured, where data is available, for the year-end 2022 was 77.4 tCO2e/£m √ against a 2019 baseline of 116.1 tCO2e/£m √
2 √ Indicator is subject to limited ISAE 3000 (revised) assurance by Deloitte LLP.
Supply chain
Scope 3 supply chain emissions (tCO2e)
| | | | | | | | | | | | | | |
| Restated baseline year 2021/22 | Current year 2022/23 |
Scope 3 emission GHG protocol Categories1,2,4 | 679,326 | √ | 785,237 | √ |
Reduce the carbon emissions we generate through our supply chain by 50 per cent by 2030 on the path to net zero by 2050 or sooner.1,2,3
1 From a 2021/22 baseline.
2 √ Indicator is subject to limited ISAE 3000 (revised) assurance by Deloitte LLP.
3 We refined our methodology and approach to calculating our supply chain emissions in 2023 and have recalculated our baseline emissions for the period October 2021 to September 2022. A key refinement was the exclusion of VAT from our spend data used to calculate supplier emissions.
One year on from announcing our supply chain ambition to reduce our emissions by 50 per cent by 2030 on our path to net zero by 2050, or sooner, we have seen an increase of 16 per cent in our disclosed supply chain emissions. This increase has been driven by business growth and investment that has resulted in a 21 per cent increase in spend with suppliers from £4.0 billion to £4.9 billion compared to our baseline year.
This highlights the limitations of a spend based methodology which relies on average carbon emission factors per £1 of spend and supports our objective of moving towards supplier-specific carbon emissions data. This will allow us to more readily assess the progress of our suppliers against our ambition by decoupling spend from emissions, reflecting the actions taken by suppliers to decarbonise their business activities.
Own operations
Demonstrating our commitment to managing our own operations emissions, this year, we have also reviewed and redefined our operational net zero target for 2030. We have increased our commitment to reduce operational Scope 1 and 2 carbon emissions from 75 per cent to at least 90 per cent by 2030, based on our 2018/19 baseline. We recognise that there is more that we can do to minimise the environmental impact of our direct operations, and have introduced a new pledge for nature across our operations.
1 Scope 1 and 2 emissions, market-based approach for electricity Scope 2. Emissions reduction is shown for the period 1 October 2022 to 30 September 2023.
Balanced scorecard KPI1,2,3
1 Scope 1 and 2 emissions, market-based approach for electricity Scope 2. Emissions reduction is shown for the period 1 October 2022 to 30 September 2023.
2 Restated all prior periods data to improve the accuracy of reporting using actual data to replace estimates, historical emissions associated with Embark Group’s properties, and improved escaped refrigerant related emissions.
3 Includes Scope 1, 2 emissions and Scope 3 categories 3, 5, 6 and 7. Scope 3 categories 1, 2, 4 and 15 are excluded.
4 √ Indicator is subject to limited ISAE 3000 (revised) assurance by Deloitte LLP.
In 2022/23, our overall market-based carbon emissions were 123,499 tonnes CO2e, 30.2 per cent lower since 2018/19 and a 5.0 per cent increase since 2021/22, mainly driven by higher business travel and commuting related carbon emissions.
| | | | | | | | |
10 | Lloyds Banking Group plc Annual Report on Form 20-F 2023 | |
Our sustainable financing and investment targets
In 2022 we set sustainable finance targets through to 2024 totalling £33 billion across the bank and for up to £25 billion of investments in climate aware strategies for our Scottish Widows business from 2020 through to 2025. We have made great progress against these targets and have already reached our Commercial Banking target for our corporate and institutional customers.
We have built on our existing targets across the Group with a new 2024 to 2026 target for Commercial Banking which is in addition to our existing targets set out below.
Our sustainable financing and investment targets1
| | | | | |
| 2023 progress |
| Commercial Banking √ | £15.8bn - target achieved |
£15 billion sustainable finance for corporate and institutional customers1 by 2024 |
| Motor √ | £5.7bn |
£8 billion financing for EV and plug-in hybrid electric vehicles by 20242 |
| EPC A/B mortgage lending √ | £7.5bn4 |
£10 billion of mortgage lending for EPC A and B rated properties by 20243 |
| Scottish Widows √ | £21.7bn |
£20–£25 billion discretionary investment in climate-aware5 strategies by 2025 |
| Our new target from 2024 | £30bn |
Commercial Banking 2024 to 20266 |
1 Corporate and institutional customers (customers with a turnover >£100 million). £7.9 billion achieved in 2023.
2 £3.6 billion achieved in 2023.
3 The target includes remortgages but excludes further advances.
4 £7.5 billion covers the period from January 2022 to September 2023 With £2.8 billion achieved from 1 January 2023 to 30 September 2023.
5 We are working with our strategic fund management partners BlackRock and Schroders to develop and refine a range of funds that have a bias towards investing in companies that are adapting their businesses to be less carbon intensive and/or developing climate solutions.
6 New 2024 lending target for Commercial Banking.
7 √ Indicator is subject to limited ISAE 3000 (revised) assurance by Deloitte LLP.
Financial planning and controls
How climate is factored into our internal reporting and planning process
Climate considerations form part of our planning and forecasting activities. We consider climate effects in our base case economic scenario and forecast financed emissions alongside climate risks and opportunities within the Group’s four-year financial plan, primarily conducted across three key areas.
Our financial planning process acknowledges the dependencies on both external factors such as policies, technology developments and customer behaviour. We continue to monitor the impact of these external factors on our Group ambitions and targets alongside working in partnership with our customers and other stakeholders to achieve our common goal of achieving net zero by 2050.
How Finance is supporting the Bank’s reporting of climate-related matters
1.Forecasting our Bank financed emissions to 2030 for our high-carbon-intensive sectors, along with our supply chain and own operations.
2.Building the capability to report our financed emissions and sustainable lending and investments progress on a quarterly basis, to support balance scorecard tracking. With this process aligned to Board Risk Appetite metrics.
3.Implementing a number of climate-related controls in relation to the calculation and reporting of financed emissions and related regulatory disclosures.
4.Continuing to develop the Group’s investment planning capabilities to progress our climate ambitions and targets: reducing the emissions we finance, reducing the emissions from our suppliers and supporting our net zero own operations footprint
Financial statement preparation includes consideration of the impact of climate change on the Group’s financial position. While the effects of climate change represent a source of uncertainty, the Group does not consider there to be a material short-term impact on its estimates for climate-related risks.
An assessment was performed of the Group’s internally generated economic scenarios used in the measurement of expected credit losses against external scenarios published by the NGFS. For further details of how scenario analysis was used to support our impairment assessments in 2023 (see our Climate risk section page 53). There is no material impact assessed on the Group’s financial position or performance as at 31 December 2023.
We are continuing to increase the scope of our emissions forecasting to cover more of our balance sheet, leveraging our forecasting process and capabilities to track progress against our published sector targets.
We regularly track sustainability-related investment across key climate, nature and social initiatives through direct engagement with business unit teams ensuring alignment and prioritisation with our strategic objectives. As part of this, the Group has dedicated investment of c.£40 million to support our customers’ transition in 2024, in addition to the day-to-day activities integrated into business-as-usual. Regular monitoring of our sustainability-related investment across the Group aligns our financial goals with our purpose, supporting the ability to measure progress and delivery.
Task Force on Climate-related Financial Disclosures (TCFD) recommendations
We comply with the FCA’s Listing Rule 9.8.6R(8). Set out in the following table are our climate-related financial disclosures which are consistent with the 2021 TCFD recommendations and recommended disclosures across all four of the TCFD pillars: strategy; governance; risk management; and metrics and targets.
We will continue to assess and develop our disclosures against the TCFD recommendations and recommended disclosures, considering relevant TCFD guidance and materials along with new disclosure requirements such as International Sustainability Standards Board: IFRS S1 “General requirements” IFRS S2 “Climate-related disclosures”.
| | | | | | | | |
11 | Lloyds Banking Group plc Annual Report on Form 20-F 2023 | |
Progress against TCFD recommendations
| | | | | |
| TCFD pillar | Strategy |
| Recommendation | Disclose the actual and potential impacts of climate-related risks and opportunities on the organisation’s business, strategy and financial planning where such information is material. |
| | | | | | | | | | | |
| TCFD recommended disclosures | Reference | Summary of progress |
| A: | Describe the climate-related risks and opportunities the organisation has identified over the short, medium, and long term. | Environmental matters page 5 | •Defined the key climate-related risks and opportunities across the Group and identified the potential time horizons (aligned with Group financial planning) over which they may arise •Disclosures made on the cross-cutting nature of climate risks and how this can impact a broad range of principal risks |
| B: | Describe the impact of climate-related risks and opportunities on the organisation’s business, strategy and financial planning. | Environmental matters page 11 | •The Group’s financial statements consider the impact of climate-related risks on our financial position and performance, including expanded consideration of the impact on expected credit losses in 2023 •Continued to embed climate risk into our financial planning process with financed emissions ambitions considered as part of the forecasting process •Embedded monitoring of sector targets, as reported in our Group climate transition plan, into the internal reporting process with the aim to support climate considerations forming part of the Group’s regular decision making |
| C: | Describe the resilience of the organisation’s strategy, taking into consideration different climate-related scenarios, including a 2°C or lower scenario. | Environmental matters page 4 Risk management pages 54 to 56 | •We have assessed the resilience of our lending and investment portfolio to climate risk based on sector exposure, building on lessons learnt from the 2021 CBES •We have noted that our commercial lending exposure to sectors with increased impacts from climate risk is relatively low •Over the medium to long term, transition risk on our pensions and investment portfolio is significant but an orderly transition to net zero would provide an opportunity for better customer outcomes |
| | | | | |
| TCFD pillar | Governance |
| Recommendation | Disclose the organisation’s governance around climate-related risks and opportunities. |
| | | | | | | | | | | |
| TCFD recommended disclosures | Reference | Summary of progress |
| A: | Describe the Board’s oversight of climate-related risks and opportunities. | | •Our governance structure provides clear oversight and ownership of the Group’s environmental sustainability strategy and management of risks and opportunities at the Board and executive levels •The Board is engaged through different committees on at least a least quarterly basis on our sustainability agenda including our nature strategy and the monitoring of our progress against targets and ambitions |
| B: | Describe management’s role in assessing and managing climate-related risks and opportunities. | | •The Group Net Zero Committee provides direction and oversight of the Group’s environmental sustainability strategy including opportunities, supported by divisional governance •The Group Risk Committee provides oversight of climate risk •Key Committee oversight in 2023 included development of sector targets for three new sectors and the evolution of our environmental strategy |
| | | | | | | | |
12 | Lloyds Banking Group plc Annual Report on Form 20-F 2023 | |
| | | | | |
| TCFD pillar | Risk management |
| Recommendation | Disclose how the organisation identifies, assesses, and manages climate-related risks. |
| | | | | | | | | | | |
| TCFD recommended disclosures | Reference | Summary of progress |
| A: | Describe the organisation’s processes for identifying and assessing climate-related risks. | Risk management pages 53 to 56 | •Key climate-related risks have been identified at Group level across five themes: net zero; greenwashing; external disclosures; inbound physical and transition risks; and regulatory compliance •The materiality of these risks has been assessed based on their potential impact on the Group, with scenario analysis outputs used to inform this in key areas |
| B: | Describe the organisation’s processes for managing climate-related risks. | Risk management pages 53 to 56 | •We are continuing to embed consideration of climate risk within our existing risk management processes to mitigate the cross-cutting impacts of climate risk •We have developed some initial controls for managing these risks, although we expect to continue to enhance these as our understanding evolves |
| C: | Describe how processes for identifying, assessing, and managing climate-related risks are integrated into the organisation’s overall risk management. | Risk management pages 53 to 56 | •Climate risk is embedded into our Enterprise Risk Management Framework, through consideration of climate risk as its own principal risk, and integration into other principal risks materially impacted •The Group climate risk policy provides an overarching framework for the management of climate risks across the Group |
| | | | | |
| TCFD pillar | Metrics and targets document |
| Recommendation | Disclose the metrics and targets used to assess and manage relevant climate-related risks and opportunities where such information is material. |
| | | | | | | | | | | |
| TCFD recommended disclosures | Reference | Summary of progress |
| A: | Disclose the metrics used by the organisation to assess climate-related risks and opportunities in line with its strategy and risk management process. | Environmental matters pages 6 to 11 | •Our exposure to sectors with increased climate risk has been analysed, and used to set our bank emission ambition and NZBA sector targets •We monitor progress against our net zero ambitions, including measures related to our financed emissions, own operations emissions, supply chain emissions and sustainable finance and investment. We also monitor our progress in relation to our 10 NZBA sector targets |
| B: | Disclose Scope 1, Scope 2, and, if appropriate, Scope 3 greenhouse gas (GHG) emissions, and the related risks. | Environmental matters pages 8 to 10
| •We have disclosed our Scope 1, 2 and 3 emissions for our own operations and supply chain, and continue to develop our approach to calculating financed emissions, now updated to period ended 2022 •We calculate our emissions in line with GHG protocol and have released our first Scope 3 basis of reporting. This document includes details on our approach to all 15 categories of Scope 3 GHG reporting •In June 2023 Scottish Widows published product level TCFD reporting in compliance with FCA ESG Sourcebook (set out via FCA PS21/24), with an update to be published by June 2024 |
| C: | Describe the targets used by the organisation to manage climate-related risks and opportunities and performance against targets. | Environmental matters pages 8 to 11 | •We have defined sustainable financing and investment targets for our core business areas. Along with our emissions ambitions these make up the key metrics we use in the Group to monitor our progress against our strategy •To support our overall bank ambitions we have released 10 sector-specific 2030 NZBA targets. These are a mix of physical intensity and absolute emissions based targets |
| | | | | | | | |
13 | Lloyds Banking Group plc Annual Report on Form 20-F 2023 | |
Legal actions and regulatory matters
During the ordinary course of business the Group is subject to threatened or actual legal proceedings and regulatory reviews and investigations both in the UK and overseas. Further discussion on the Group’s regulatory and legal provisions is set out in note 38 to the financial statements and on its contingent liabilities relating to other legal actions and regulatory matters is set out in note 48 to the financial statements.
Competitive environment
Market context
•The Group operates in evolving, competitive markets across our business units
•The interest rate environment is changing competitive dynamics
•New peers are broadening propositions and expanding across geographies
The UK financial services sector is highly competitive. Regulation, new technologies and customer adoption of digital has supported the development of new competitors and business models in recent years. Competition with traditional incumbent banks remains high. Higher interest rates has spurred significant competition in deposits and current account switching as customers and clients seek better returns, and mortgages competition remains elevated given the smaller market.
New and increasingly profitable neo banks, serving both retail and small business clients, continue to broaden their propositions and scale across markets, including international banks growing their UK presence.
The growth in digital platforms presents new opportunities for accessing customers outside of the traditional financial services journeys, spanning both consumer and business segments. Regulations such as Open Banking are enabling new providers, including the Big Tech firms, to integrate financial services into their own digital services, providing customers with convenience and new distribution channels.
The Group’s response
The Group continues to invest to deepen and innovate in Consumer, with 21.5 million digitally active users and strong participation in intermediary led markets. The Group’s strong foundations of customer relationships, combined with innovation, enable it to meet a broader range of customer needs, in particular growing in higher value segments by creating a new mass affluent offering. For example, during the year the Group launched ready-made investments through Embark, offering customers simple and affordable investments. It has evolved its products and pricing in deposits, resulting in more customers trusting the Group with their savings and balances increasing in the year.
In the SME business, the Group is focused on diversifying and digitising its business front-to-back. For example, the Group has launched a mobile-first onboarding journey for sole traders and limited companies that has reduced account opening time by up to 15 times. Furthermore, new payments solutions have supported more than 20 per cent growth in new merchant services clients.
Disciplined sector focus and enhancements to the Corporate and Institutional business’ Lending, Transaction Banking and Markets propositions have strengthened the Group’s competitive positioning and it has grown underlying other income by more than 20 per cent since full year 2021. The Group is focused on connecting its clients to wider Group solutions, such as workplace pensions and transport. For example, the acquisition of Tusker has allowed the Group to extend its salary sacrifice car schemes to its clients.
Recent developments
The Board has announced its intention to implement an ordinary share buyback of up to £2.0 billion. This represents the return to shareholders of capital, surplus to that required to provide capacity to grow the business, meet current and future regulatory requirements and cover uncertainties. The share buyback programme will commence as soon as is practicable and is expected to be completed, subject to continued authority from the PRA, by 31 December 2024.
| | | | | | | | |
14 | Lloyds Banking Group plc Annual Report on Form 20-F 2023 | |
Operating and financial review and prospects
The results discussed below are not necessarily indicative of Lloyds Banking Group’s results in future periods. The following information contains certain forward looking statements. For a discussion of certain cautionary statements relating to forward looking statements, see Forward looking statements.
The following discussion is based on and should be read in conjunction with the consolidated financial statements and the related notes thereto included elsewhere in this annual report. For a discussion of the accounting policies used in the preparation of the consolidated financial statements, see Accounting policies in note 2 to the financial statements.
Table of contents
| | | | | | | | |
15 | Lloyds Banking Group plc Annual Report on Form 20-F 2023 | |
Operating and financial review and prospects continued
Overview and trend information
Economy
Given our focus on UK customers, the Group’s prospects are closely linked to developments in the UK economy
Market context
The UK economy saw modest but resilient performance in 2023, with initial estimates indicating growth of 0.1 per cent. This was despite a large increase in interest rates intended to prevent elevated inflation becoming an entrenched problem after the surge in global energy and food prices caused in large part by Russia’s invasion of Ukraine. Two elements were key to this resilience – government support to households, via an energy price cap, credits to energy accounts and ‘cost of living’ payments to lower-income households; and an unusually tight labour market after the pandemic, which enabled pay growth to accelerate to broadly match inflation.
Although inflation fell rapidly in the second half of 2023, the cost of living squeeze is still ongoing. Energy prices are still around 50 per cent higher than 2021, and food prices broadly 30 per cent higher. As the UK imports a significant proportion of both, these cost increases reduce UK spending power by around 3 per cent. Government support protected households from some of the impact across 2022 and 2023, but this is not planned to continue through 2024. The reduction in living standards has been spread out to make it more manageable but with further impact to come. Also, interest rate rises to date have not yet had their full impact, with many households yet to refinance fixed-rate mortgages at higher rates.
The UK economy in 2024 is thus expected to echo its 2023 growth performance. GDP growth is likely to remain subdued, the unemployment rate is likely to continue drifting upwards by around 1 percentage point, and house prices are expected to edge downwards by around 2 per cent. Inflation should continue to fall, returning much closer to its target level of 2 per cent than its 7 per cent average of 2023, allowing the Bank of England to start reducing Bank Rate during the year. There are, of course, significant risks to this view, not least via consequences of any escalation of wars in Ukraine or the Middle East.
Weak economic growth and high interest rates in 2023 translated into subdued growth in our key markets. Housing transactions were around 14 per cent lower than normal levels, and mortgage and household deposit balances broadly flat. Consumer credit balances have only partially recovered their fall during the pandemic. SMEs continued to pay down debt after the large increase under the government-guarantee schemes during the pandemic, so non-financial companies’ deposits declined for a second year. Financial companies’ deposits also declined, as they purchased gilts sold by the Bank of England as it reverses ‘quantitative easing’ undertaken during the pandemic. Growth in our markets in 2024 is expected to follow these trends, albeit slightly improved.
Our response
Given our UK focus, the Group’s prospects are closely linked to the performance of the UK economy. Despite this, our business model and strategy, in particular the strength and resilience of our customer franchise, balance sheet and prudent approach to risk, position us well.
In line with our purpose of Helping Britain Prosper and a clear customer focus, we are helping people and businesses finance their ambitions and growth whilst proactively providing support to those most affected by changes to the economic environment.
In addition to revenue benefits from higher interest rates, our strategy and transformation will deliver growth and diversification, even in a more challenging macroeconomic environment, improving the sustainability of returns. At the same time, we are accelerating efficiency measures to offset inflationary pressures on our cost base, consistent with our ongoing discipline in this area.
Critical accounting judgements and key sources of estimation uncertainty
Critical accounting judgements and key sources of estimation uncertainty are discussed in note 3 to the financial statements.
Future accounting developments
Future developments in relation to the Group’s IFRS reporting are discussed in note 1 to the financial statements.
| | | | | | | | |
16 | Lloyds Banking Group plc Annual Report on Form 20-F 2023 | |
Operating and financial review and prospects continued
Results of operations – 2023 and 2022
Summary
The Group's condensed consolidated income statement and condensed consolidated balance sheet are as follows.
| | | | | | | | |
| 2023 £m | 20221,2 £m |
| Net interest income | 13,298 | | 12,922 | |
| Other income | 22,107 | | (18,268) | |
| Total income | 35,405 | | (5,346) | |
| Net finance (expense) income in respect of insurance and investment contracts | (16,776) | | 20,887 | |
| Total income, after net finance (expense) income in respect of insurance and investment contracts | 18,629 | | 15,541 | |
| Operating expenses | (10,823) | | (9,237) | |
| Impairment | (303) | | (1,522) | |
| Profit before tax | 7,503 | | 4,782 | |
| Tax expense | (1,985) | | (859) | |
| Profit for the year | 5,518 | | 3,923 | |
| | |
| Profit attributable to ordinary shareholders | 4,933 | | 3,389 | |
| Profit attributable to other equity holders | 527 | | 438 | |
| Profit attributable to equity holders | 5,460 | | 3,827 | |
| Profit attributable to non-controlling interests | 58 | | 96 | |
| Profit for the year | 5,518 | | 3,923 | |
1 Restated for the adoption of IFRS 17; see notes 1 and 54 to the consolidated financial statements.
2 Restated for presentational changes; see note 1 to the consolidated financial statements.
| | | | | | | | | | | |
| 2023 £m | | 20221 £m |
| Assets | | | |
| Cash and balances at central banks | 78,110 | | | 91,388 | |
Financial assets at fair value through profit or loss | 203,318 | | | 180,769 | |
| Derivative financial instruments | 22,356 | | | 24,753 | |
Loans and advances to banks | 10,764 | | | 10,632 | |
Loans and advances to customers | 449,745 | | | 454,899 | |
Reverse repurchase agreements | 38,771 | | | 44,865 | |
| Debt securities | 15,355 | | | 9,926 | |
| Financial assets at amortised cost | 514,635 | | | 520,322 | |
| Financial assets at fair value through other comprehensive income | 27,592 | | | 23,154 | |
Other assets | 35,442 | | | 33,008 | |
| Total assets | 881,453 | | | 873,394 | |
| Liabilities | | | |
Deposits from banks | 6,153 | | | 7,266 | |
Customer deposits | 471,396 | | | 475,331 | |
Repurchase agreements at amortised cost | 37,703 | | | 48,596 | |
| Financial liabilities at fair value through profit or loss | 24,914 | | | 17,755 | |
| Derivative financial instruments | 20,149 | | | 24,042 | |
| Debt securities in issue at amortised cost | 75,592 | | | 73,819 | |
| Liabilities arising from insurance and participating investment contracts | 120,123 | | | 110,278 | |
| Liabilities arising from non-participating investment contracts | 44,978 | | | 39,476 | |
| Other liabilities | 22,827 | | | 22,190 | |
| Subordinated liabilities | 10,253 | | | 10,730 | |
| Total liabilities | 834,088 | | | 829,483 | |
| Equity | | | |
| Ordinary shareholders’ equity | 40,224 | | | 38,370 | |
| Other equity instruments | 6,940 | | | 5,297 | |
| Non-controlling interests | 201 | | | 244 | |
| Total equity | 47,365 | | | 43,911 | |
| Total equity and liabilities | 881,453 | | | 873,394 | |
1 Restated for presentational changes and for the adoption of IFRS 17; see notes 1 and 54 to the consolidated financial statements.
| | | | | | | | |
17 | Lloyds Banking Group plc Annual Report on Form 20-F 2023 | |
Operating and financial review and prospects continued
Results of operations – 2023 and 2022 continued
Summary continued
The Group’s profit before tax for 2023 was £7,503 million, with the increase on the prior year materially driven by the restatement of earnings for the IFRS 17 accounting change in 2022. In addition, 2023 has benefited from higher total income, after net finance expense in respect of insurance and investment contracts and a significantly lower impairment charge, partly offset by increased operating expenses as expected. Profit for the year was £5,518 million and earnings per share was 7.6 pence (2022: £3,923 million and 4.9 pence respectively).
The Group’s statutory income statement includes income and expenses attributable to the policyholders of the Group’s long-term assurance funds, investors in the Group's non-participating investment contracts and third party interests in consolidated funds. These items materially offset in arriving at profit before tax but can, depending on market movements, lead to significant variances on a statutory basis between total income and net finance income in respect of insurance and investment contracts from one period to the next. In 2023, due to market conditions, the Group recognised net gains on policyholder investments within total income, which were materially offset by the corresponding net finance expense in respect of insurance and investment contracts.
Total income, after net finance income in respect of insurance and investment contracts for the year was £18,629 million, an increase of 20 per cent on 2022, largely reflecting an exceptional charge in the prior year under IFRS 17 from contract modifications in Insurance, Pensions and Investments. Net interest income of £13,298 million was up 3 per cent on the prior year, driven by stronger margins. Average interest-earning assets decreased by £13,279 million to £629,283 million in 2023 compared to £642,562 million in 2022, primarily driven by a reduction in reverse repurchase agreements in the year.
Other income amounted to a gain of £22,107 million in 2023, compared to a loss of £18,268 million in 2022. The prior year included an exceptional charge under IFRS 17 from contract modifications in Insurance, Pensions and Investments, predominantly in the second half, following the addition of a drawdown feature to existing longstanding and workplace pensions as a significant customer enhancement. Net trading income within the Group’s insurance activities was a gain of £16,630 million in 2023 compared to a loss of £21,067 million in 2022, an increase of £37,697 million reflecting improved equity and debt markets. This movement was materially offset by the related £37,663 million reduction in net financial income in respect of insurance and investment contracts.
The Group maintained its focus on cost management, whilst increasing strategic investment as planned. Total operating expenses of £10,823 million were 17 per cent higher than in the prior year. This reflects higher planned strategic investment, severance charges, new business costs and inflationary effects. In 2023 the Group recognised remediation costs of £675 million (2022: £255 million) relating to pre-existing programmes and a provision for the potential impact of the recently announced FCA review into historical motor finance commission arrangements. The higher operating lease depreciation charge reflected the declines in used car prices (notably in the fourth quarter), impacting portfolio valuations and gains on disposals, the depreciation cost of higher value vehicles and the Tusker acquisition in the first quarter and its subsequent growth.
Impairment was a net charge of £303 million in 2023 (2022: £1,522 million). The decrease includes a significant write-back following the full repayment of debt from a single name client, in addition to a credit from modest revisions to the Group’s economic outlook compared to the deterioration in the economic outlook captured last year. This decrease was partly offset by higher charges reflecting modest deterioration from a low base, primarily in legacy variable rate UK mortgage portfolios. It also includes the impact of higher discount rates on recoveries, as well as the expected credit loss (ECL) allowance build from Stage 1 loans rolling forward into a deteriorating economic outlook. Asset quality remains strong with credit performance across portfolios relatively stable and remaining broadly at, or favourable to pre-pandemic experience.
The Group recognised a tax expense of £1,985 million in the year, compared to £859 million in 2022, reflecting increased profits. The prior year included a £222 million benefit in relation to tax deductibility of provisions made in 2021.
Total assets were £8,059 million, or 1 per cent, higher at £881,453 million at 31 December 2023 compared to £873,394 million at 31 December 2022. Cash and balances at central banks decreased by £13,278 million to £78,110 million reflecting decreased liquidity holdings. Financial assets at amortised cost were £5,687 million lower at £514,635 million compared to £520,322 million at 31 December 2022 with increases in debt securities of £5,429 million and loans and advances to banks of £132 million, more than offset by a reduction in reverse repurchase agreements of £6,094 million and loans and advances to customers of £5,154 million to £449,745 million.
The reduction in loans and advances to customers was a result of securitisations of £5.2 billion, including £2.5 billion of legacy Retail mortgages (£2.1 billion in the closed mortgage book) and £2.7 billion of Retail unsecured loans. Excluding these movements, loans and advances to customers were stable.
Financial assets held at fair value through profit or loss increased by £22,549 million overall, with holdings within the Insurance business higher by £14,697 million as a result of market gains on equity and debt investments whilst holdings in the banking business were £7,852 million higher due to an increase in reverse repurchase agreements. Financial assets at fair value through other comprehensive income increased £4,438 million as a result of an increase in holdings of government bonds and other debt securities. Other assets were £2,434 million higher, reflecting higher capitalised software enhancements, in line with the Group’s planned strategic investment, higher operating lease assets following the Tusker acquisition and a reduction in deferred tax assets of £1,237 million due to changes in the value of the cash flow hedge reserve and utilisation of tax losses in the year. There was a decrease in derivative financial instruments of £2,397 million driven by movements in the yield curve on interest rate swaps and currency movements.
Total liabilities were £4,605 million higher at £834,088 million compared to £829,483 million at 31 December 2022. Customer deposits at £471,396 million decreased by £3,935 million since the end of 2022. This includes a decrease in Retail current account balances of £11.3 billion as a result of higher spend and a more competitive savings market, including the Group’s own savings offers. In Retail savings and Wealth, balances have increased by a combined £8.9 billion, with a significant proportion transferred from the Group’s current account customer base given attractive customer offers. Commercial Banking deposits were down £1.0 billion during 2023, reflecting targeted growth in Corporate and Institutional Banking offset by a reduction in Small and Medium Businesses. In addition, repurchase agreements at £37,703 million have decreased by £10,893 million since the end of 2022.
The reduction in liabilities outlined above were more than offset by increased financial liabilities at fair value through profit or loss at £24,914 million as compared to £17,755 million in the prior year, liabilities arising from insurance and investment contracts increased by £15,347 million which materially reflect the increase in policyholder investments and debt securities in issue at amortised cost increased by £1,773 million as a result of securitisation notes issued in the year.
| | | | | | | | |
18 | Lloyds Banking Group plc Annual Report on Form 20-F 2023 | |
Operating and financial review and prospects continued
Results of operations – 2023 and 2022 continued
Summary continued
Total equity of £47,365 million at 31 December 2023 increased from £43,911 million at 31 December 2022. The movement reflected attributable profit for the year, movements in the cash flow hedge reserve and the issuance of other equity instruments, partially offset by market movements impacting pensions, alongside dividends paid and the impact of the share buyback programme. The share buyback programme in respect of 2022 completed on 25 August 2023, with 4,386 million ordinary shares repurchased.
The Group’s CET1 capital ratio reduced from 15.1 per cent at 31 December 2022 to 14.6 per cent at 31 December 2023. Banking business profits for the year, the dividend received from the Group’s Insurance business in February 2023 and other increases through reserves were more than offset by capital reductions and an increase in risk-weighted assets. The reductions predominantly reflected pension deficit contributions made to the defined benefit pension schemes, an increased deduction for goodwill and other intangible assets (in part reflecting the acquisition of Tusker), the interim ordinary dividend paid in September 2023, the accrual for the final 2023 ordinary dividend, distributions on other equity instruments and the impact of the ordinary share buyback programme that completed during the year.
Risk-weighted assets have increased by 8,271 million during the year to £219,130 million at 31 December 2023 (31 December 2022: £210,859 million). This includes the impact of Retail secured CRD IV model updates of £5 billion. Excluding this, lending, operational and market risk increases, a modest uplift from credit and model calibrations and other movements were partly offset by optimisation, including capital efficient securitisation activity within the balance sheet. In relation to the Retail secured CRD IV models, it is estimated that a further £5 billion increase will be required over 2024 to 2026, noting that this will be subject to final model outcomes.
The Group’s total capital ratio increased to 19.8 per cent at 31 December 2023 (31 December 2022: 19.7 per cent) primarily reflecting AT1 and Tier 2 issuance. This was largely offset by the increase in risk-weighted assets and other movements in Tier 2 capital instruments, which included the impact of a call and regulatory amortisation.
The minimum requirement for own funds and eligible liabilities (MREL) ratio increased to 31.9 per cent at 31 December 2023 (31 December 2022: 31.7 per cent) reflecting the increase in both total capital resources and other eligible liabilities, largely offset by the increase in risk-weighted assets. The increase in other eligible liabilities was primarily driven by new issuances, partially offset by a call and the exclusion of instruments maturing in 2024.
The Group’s UK leverage ratio increased to 5.8 per cent (31 December 2022: 5.6 per cent) reflecting the increase in the total tier 1 capital position. This was partially offset by the increase in the leverage exposure measure following increases in financial and other assets (excluding central bank claims), net of reductions in off-balance sheet items and the measure for securities financing transactions.
The Group has a progressive and sustainable ordinary dividend policy whilst maintaining the flexibility to return further surplus capital through buybacks or special dividends.
The Board has recommended a final ordinary dividend of 1.84 pence per share, which, together with the interim ordinary dividend of 0.92 pence per share totals 2.76 pence per share, an increase of 15 per cent compared to 2022, in line with the Board’s commitment to capital returns. The Board has also announced its intention to implement an ordinary share buyback of up to £2.0 billion which will commence as soon as is practicable and is expected to be completed by 31 December 2024.
Net interest income
| | | | | | | | |
| 2023 | 20221 |
| Net interest income (£m) | 13,298 | | 12,922 | |
| Average interest-earning assets (£m) | 629,283 | | 642,562 | |
| Average rates: | | |
Gross yield on average interest-earning assets2 (%) | 4.46 | | 2.75 | |
Interest spread3 (%) | 1.45 | | 1.78 | |
Net interest margin4 (%) | 2.11 | | 2.01 | |
1 Restated for presentational changes; see note 1 to the consolidated financial statements.
2 Gross yield is the rate of interest earned on average interest-earning assets.
3 Interest spread is the difference between the rate of interest earned on average interest-earning assets and the rate of interest paid on average interest-bearing liabilities.
4 The net interest margin represents the interest spread together with the contribution of interest-free liabilities. It is calculated by expressing net interest income as a percentage of average interest-earning assets.
Net interest income in the year of £13,298 million was up 3 per cent, compared to £12,922 million in 2022.
Average interest-earning assets were £13,279 million lower at £629,283 million in 2023 compared to £642,562 million in 2022 primarily driven by reduction in reverse repurchase agreements in the year. Average interest-earning assets in Retail were £3,663 million, or 1 per cent, higher at £365,632 million in 2023 compared to £361,969 million in 2022 and average relationship lending and similar average interest-earning assets in Commercial Banking were £3,244 million, or 4 per cent, lower at £86,797 million in 2023 compared to £90,041 million in 2022.
The net interest margin was 10 basis points higher at 2.11 per cent in 2023 compared to 2.01 per cent in 2022. Margins benefited from UK Bank Rate increases and higher structural hedge earnings from the rising rate environment, partly offset by expected headwinds due to deposit mix effects and asset margin compression, particularly in the mortgage book.
| | | | | | | | |
19 | Lloyds Banking Group plc Annual Report on Form 20-F 2023 | |
Operating and financial review and prospects continued
Results of operations – 2023 and 2022 continued
Other income
| | | | | | | | | | | |
| 2023 £m | | 20221 £m |
| Fee and commission income: | | | |
| Current accounts | 624 | | | 646 | |
| Credit and debit card fees | 1,264 | | | 1,195 | |
| Commercial banking and treasury fees | 334 | | | 311 | |
| Unit trust and insurance broking | 69 | | | 78 | |
| | | |
| Factoring | 75 | | | 79 | |
| Other fees and commissions | 560 | | | 481 | |
| Total fee and commission income | 2,926 | | | 2,790 | |
| Fee and commission expense | (1,095) | | | (1,070) | |
| Net fee and commission income | 1,831 | | | 1,720 | |
| Net trading income (losses) | 18,049 | | | (19,987) | |
| Insurance revenue | 3,008 | | | 2,461 | |
| Insurance service expense | (2,414) | | | (3,863) | |
| Net income from reinsurance contracts held | 2 | | | 62 | |
| Insurance service result | 596 | | | (1,340) | |
| Operating lease rental income | 1,383 | | | 1,077 | |
| Net gains (losses) on disposal of financial assets at fair value through other comprehensive income | 122 | | | 92 | |
| Other | 126 | | | 170 | |
| Other operating income | 1,631 | | | 1,339 | |
| Total other income | 22,107 | | | (18,268) | |
1 Restated for the adoption of IFRS 17; see notes 1 and 54 to the consolidated financial statements.
Total other income was £40,375 million higher at a gain of £22,107 million in 2023 compared to a loss of £18,268 million in 2022.
Fee and commission income was £136 million, or 5 per cent, higher at £2,926 million in 2023 compared with £2,790 million in 2022. There was an increase of £69 million, or 6 per cent, in credit and debit card fees from £1,195 million in 2022 to £1,264 million in 2023 reflecting higher customer activity. Commercial banking fees were £23 million, or 7 per cent, higher at £334 million in 2023 compared to £311 million in 2022 reflecting improved performance in capital markets. Other fees and commissions were £79 million, or 16 per cent, higher at £560 million in 2023 compared to £481 million in 2022.
Fee and commission expense was £25 million, or 2 per cent, higher at £1,095 million in 2023 compared to £1,070 million in 2022 reflecting increases in interchange and other fees payable in line with increased customer activity.
Net trading income was £38,036 million higher with a gain of £18,049 million in 2023 compared with a loss of £19,987 million in 2022. Net trading income within the insurance businesses was £37,697 million higher due to a gain of £16,630 million in 2023 compared to a loss of £21,067 million in 2022. There were significant increases in the value of policyholder investments as a result of stronger equity and debt market performance. Net trading income in the insurance businesses is largely offset by net finance (expense) income from insurance, participating investment and reinsurance contracts and the movement in the third party interests in consolidated funds. Net trading income within the Group’s banking activities was £339 million, or 31 per cent, higher at £1,419 million in 2023 compared to £1,080 million in 2022.
The insurance service result was £1,936 million higher at income of £596 million, compared to a charge of £1,340 million in 2022. This was the result of the exceptional charge under IFRS 17 from contract modifications in Insurance, Pensions and Investments following the addition of a drawdown feature to existing longstanding and workplace pensions as a significant customer enhancement.
Other operating income was £292 million, or 22 per cent, higher at £1,631 million in 2023 compared to £1,339 million in 2022 due to higher operating lease rental income following the completion of the acquisition of Tusker during 2023, the increased motor vehicle fleet size and increased gains from the disposal of financial assets at fair value through other comprehensive income.
| | | | | | | | |
20 | Lloyds Banking Group plc Annual Report on Form 20-F 2023 | |
Operating and financial review and prospects continued
Results of operations – 2023 and 2022 continued
Operating expenses
| | | | | | | | | | | |
| 2023 £m | | 2022 £m |
| Staff costs: | | | |
| Salaries and social security costs | 3,651 | | | 3,310 | |
| Pensions and other retirement benefit schemes | 355 | | | 455 | |
| Restructuring and other staff costs | 487 | | | 307 | |
| 4,493 | | | 4,072 | |
| Premises and equipment costs | 449 | | | 332 | |
| Depreciation and amortisation | 2,905 | | | 2,396 | |
| Other expenses: | | | |
| UK bank levy | 150 | | | 148 | |
| Regulatory and legal provisions | 675 | | | 255 | |
| Other | 2,720 | | | 2,556 | |
| 3,545 | | | 2,959 | |
| Operating expenses before adjustment for: | 11,392 | | | 9,759 | |
| Amounts attributable to the acquisition of insurance and participating investment contracts | (183) | | | (168) | |
| Amounts reported within insurance service expenses | (386) | | | (354) | |
| Total operating expenses | 10,823 | | | 9,237 | |
Cost:income ratio1 (%) | 58.1 | | | 59.4 | |
1 Total operating expenses of £10,823 million (2022: £9,237 million) divided by total income, after net finance (expense) income in respect of insurance and investment contracts, of £18,629 million (2022: £15,541 million).
Total operating expenses increased by £1,586 million, or 17 per cent, to £10,823 million in 2023 compared with £9,237 million in 2022, as a result of higher operating lease depreciation, planned strategic investment, severance charges, new business costs and inflationary impacts, partially mitigated by continued cost efficiency.
Staff costs were £421 million, or 10 per cent, higher in 2023 at £4,493 million compared to £4,072 million in 2022. On a full-time equivalent basis, the Group had 62,569 employees at the end of 2023, an increase of 3,215 from 59,354 employees at 31 December 2022. Salaries and social security costs were £341 million, or 10 per cent, higher at £3,651 million in 2023 compared with £3,310 million in 2022 due to new business costs and inflationary pressures. Salaries and social security costs included the consolidation of a proportion of variable reward into base salary. Pension costs were £100 million, or 22 per cent, lower at £355 million in 2023 compared to £455 million in 2022 as a result of a lower defined benefit service charge in the year. Restructuring and other staff costs were £180 million, or 59 per cent, higher at £487 million in 2023 compared with £307 million in 2022 due to an increase in agency costs and severance charges.
Premises and equipment costs were £117 million, or 35 per cent, higher at £449 million in 2023 compared to £332 million in 2022 due to lower gains on operating lease disposals, reflecting lower used car prices.
Depreciation and amortisation costs were £509 million, or 21 per cent, higher at £2,905 million in 2023 compared with £2,396 million in 2022 due to new business costs and operating lease depreciation, reflecting the higher depreciation cost of higher value vehicles and fleet size. Charges for the depreciation of tangible fixed assets were £306 million, or 21 per cent, higher at £1,777 million in 2023 compared to £1,471 million in 2022 and the charge for the amortisation of intangible assets was £203 million, or 22 per cent, higher at £1,128 million in 2023 compared to £925 million in 2022, as a result of higher planned strategic investment.
Other expenses were £586 million, or 20 per cent, higher at £3,545 million in 2023 compared with £2,959 million in 2022, principally due to a £420 million increase in the regulatory and legal provisions charge. There was a £450 million charge in relation to the potential impact of the recently announced FCA review into historical motor finance commission arrangements. There have been no further charges relating to HBOS Reading and the provision held continues to reflect the Group’s best estimate of its full liability, albeit uncertainties remain.
| | | | | | | | |
21 | Lloyds Banking Group plc Annual Report on Form 20-F 2023 | |
Operating and financial review and prospects continued
Results of operations – 2023 and 2022 continued
Impairment
| | | | | | | | | | | |
| 2023 £m | | 2022 £m |
| In respect of: | | | |
| Loans and advances to banks | (7) | | | 14 | |
| Loans and advances to customers | 321 | | | 1,351 | |
| Debt securities | 1 | | | 7 | |
| Other assets | (10) | | | 22 | |
| Impairment on drawn balances | 305 | | | 1,394 | |
| Financial assets at fair value through other comprehensive income | (2) | | | 6 | |
| Loan commitments and financial guarantees | – | | | 122 | |
| Total impairment charged to the income statement | 303 | | | 1,522 | |
Impairment was a net charge of £303 million in 2023 (2022: £1,522 million). The decrease includes a significant write-back following the full repayment of debt from a single name client, in addition to a credit from modest revisions to the Group’s economic outlook compared to the deterioration in the economic outlook captured last year.
The ECL allowance of £4,084 million (31 December 2022: £4,903 million) continues to reflect a probability-weighted view of economic scenarios built out from the base case and its associated conditioning assumptions. Consistent with prior years, a 30 per cent weighting is applied to the base case, upside and downside scenarios and a 10 per cent weighting to the severe downside. GDP growth remained subdued at 0.5 per cent in 2023 and expected to remain low in future years with unemployment expected to rise modestly to 5.2 per cent by the end of 2024. House prices proved more resilient in the second half of the year than previously assumed and as a result the latest base case assumes a more modest peak to trough fall of 5 per cent.
Overall, the net value of judgemental adjustments to ECL has reduced in the year. Notably, reductions from adjustments now captured within the models and the impact of taking a larger negative adjustment reducing ECL to reflect resilient corporate insolvency rates within the portfolio. Key judgemental adjustments remain in place to cover continued risks from higher base rate and inflationary pressures in the Retail portfolios as well as risks from current valuations in certain Commercial Real Estate segments.
Taxation
| | | | | | | | | | | |
| 2023 £m | | 20221 £m |
| UK corporation tax: | | | |
| Current tax on profit for the year | (1,301) | | | (1,152) | |
| Adjustments in respect of prior years | 51 | | | 31 | |
| (1,250) | | | (1,121) | |
| Foreign tax: | | | |
| Current tax on profit for the year | (101) | | | (74) | |
| Adjustments in respect of prior years | 3 | | | (9) | |
| (98) | | | (83) | |
| Current tax expense | (1,348) | | | (1,204) | |
| Deferred tax (expense) credit | (637) | | | 345 | |
| Tax expense | (1,985) | | | (859) | |
1 Restated for the adoption of IFRS 17; see notes 1 and 54 to the consolidated financial statements.
The Group recognised a tax expense of £1,985 million in the year (2022: £859 million) reflecting the increased profits. The prior year included a £222 million benefit in relation to tax deductibility of provisions made in 2021.
The Group expects a medium-term effective tax rate of around 27 per cent, which includes the impact of the reduction in the rate of banking surcharge and the increase in the corporation tax rate from 19 per cent to 25 per cent, both of which came into effect on 1 April 2023. An explanation of the relationship between the tax expense and the Group’s accounting profit for the year is set out on page F-48. | | | | | | | | |
22 | Lloyds Banking Group plc Annual Report on Form 20-F 2023 | |
Operating and financial review and prospects continued
Divisional information
The requirements for IFRS segmental reporting are set out in IFRS 8 Operating Segments which mandates that an entity’s segmental reporting should reflect the way in which its operations are viewed and judged by its chief operating decision maker. As a consequence, the Group’s statutory segmental reporting follows the underlying basis as explained below (see also note 4 to the financial statements).
The Group Executive Committee, which is the chief operating decision maker for the Group, reviews the Group’s internal reporting based around these segments (which reflect the Group’s organisational and management structures) in order to assess performance and allocate resources. The segments are differentiated by the type of products provided and by whether the customers are individuals or corporate entities and the performance assessment includes a consideration of each segment’s net interest revenue; consequently the total interest income and expense for all reportable segments is presented on a net basis. The internal reporting is on an underlying profit before tax basis. The Group Executive Committee believes that this basis better represents the underlying performance of the Group. IFRS 8 requires that the Group presents its segmental profit before tax on the basis reviewed by the chief operating decision maker that is most consistent with the measurement principles used in measuring the Group’s statutory profit before tax. Accordingly, the Group presents its segmental underlying basis profit before tax in note 4 to the financial statements.
The aggregate total of the underlying basis segmental results constitutes a non-GAAP measure as defined in the United States Securities and Exchange Commission’s Regulation G. Management uses aggregate underlying profit before tax, a non-GAAP measure, as a measure of performance and believes that it provides important information for investors because it is a comparable representation of the Group’s performance. Profit before tax is the comparable GAAP measure to aggregate underlying profit before tax. The table below sets out the reconciliation of this non-GAAP measure to its comparable GAAP measure.
The Group has three financial reporting segments: Retail; Commercial Banking; and Insurance, Pensions and Investments.
Comparisons of results on a historical consolidated statutory basis are impacted by a number of items. In order to provide more meaningful and relevant comparatives, the results of the Group and divisions are presented on an ‘underlying’ basis. The effects of the following are excluded in arriving at underlying profit:
•Restructuring costs relating to merger, acquisition and integration activities
•Volatility and other items, which includes the effects of certain asset sales, the volatility relating to the Group’s hedging arrangements and that arising in the insurance businesses, the unwind of acquisition-related fair value adjustments and the amortisation of purchased intangible assets
•Losses from insurance and participating investment contract modifications relating to the enhancement to the Group’s longstanding and workplace pension business through the addition of a drawdown feature
The results of the businesses are set out below on the underlying basis:
| | | | | | | | |
| 2023 £m | 20221 £m |
| Retail | 4,043 | | 4,497 | |
| Commercial Banking | 3,219 | | 1,861 | |
| Insurance, Pensions and Investments | 190 | | (62) | |
| Other | 357 | | 732 | |
| Underlying profit before tax | 7,809 | | 7,028 | |
1 2022 comparatives have been restated to reflect the impact of IFRS 17. See page F-27. Reconciliation of statutory profit to underlying profit before tax for the year
| | | | | | | | | | | | | | |
| Note | 2023 £m | | 20221 £m |
| Statutory profit before tax | | 7,503 | | | 4,782 | |
Restructuring costs | 1 | 154 | | | 80 | |
| Market volatility and asset sales | | (35) | | | 1,978 | |
| Amortisation of purchased intangibles | | 80 | | | 70 | |
| Fair value unwind | | 107 | | | 118 | |
| 2 | 152 | | | 2,166 | |
| Underlying profit before tax | | 7,809 | | | 7,028 | |
1 2022 comparatives have been restated to reflect the impact of IFRS 17. See page F-27. 1. Restructuring costs
Restructuring costs were £154 million (2022: £80 million) and include costs relating to the integration of Embark and Tusker, as well as one-off costs to ensure the continuity of some customer communication services following the administration of a key supplier.
2. Volatility and other items
Volatility and other items were a net loss of £152 million for the year (2022: net loss of £2,166 million). This comprised £35 million positive market volatility and asset sales, £80 million for the amortisation of purchased intangibles (2022: £70 million) and £107 million relating to fair value unwind (2022: £118 million). Market volatility and asset sales included positive banking volatility, partly offset by negative impacts from insurance volatility. Volatility and other items in 2022 included an exceptional charge under IFRS 17 from contract modifications in Insurance, Pensions and Investments, predominantly in the second half, following the addition of a drawdown feature to existing longstanding and workplace pensions as a significant customer enhancement.
| | | | | | | | |
23 | Lloyds Banking Group plc Annual Report on Form 20-F 2023 | |
Operating and financial review and prospects continued
Divisional information continued
Market volatility and assets sales
Market volatility and asset sales of £35 million included negative insurance volatility of £108 million driven by increases to equity market levels which resulted in profit from application of the risk mitigation option which was more than offset by losses from hedging arrangements and positive banking volatility of £159 million. This compares to losses during 2022 of £1,978 million, which included an exceptional charge under IFRS 17 from contract modifications in Insurance, Pensions and Investments, negative insurance volatility of £676 million due to rising interest rates and wider bonds spreads partially offset by inflation (net of hedging) and negative banking volatility of £46 million.
Management believes that excluding volatility from underlying profit before tax provides useful information for investors on the performance of the business because it allows for a comparable representation of the Group’s performance by removing the impact of items caused by market movements outside the control of management.
Insurance and policyholder interests volatility comprises the following:
| | | | | | | | |
| 2023 £m | 20221 £m |
| Insurance volatility | 198 | | (822) | |
| Policyholder interests volatility | 116 | | (205) | |
| Total volatility | 314 | | (1,027) | |
| Insurance hedging arrangements | (422) | | 351 | |
| Total | (108) | | (676) | |
1 2022 comparatives have been restated to reflect the impact of IFRS 17. See page F-27. The most significant limitation associated with excluding insurance volatility from the underlying basis results is that insurance volatility requires assumptions to be made for the normalised return on equities and other investments. Management compensates for this limitation by monitoring closely the assumptions used to calculate the normalised return used within the calculation of insurance volatility; these assumptions are disclosed below.
Insurance volatility
The Group’s insurance business has policyholder liabilities that are supported by substantial holdings of investments. IFRS requires that the changes in both the value of the liabilities and investments are reflected within the income statement. The value of the liabilities does not move exactly in line with changes in the value of the investments. As the investments are substantial, movements in their value can have a significant impact on the profitability of the Group. Management believes that it is appropriate to disclose the division’s results on the basis of an expected return. The impact of the actual return on these investments differing from the expected return is included within insurance volatility.
The expected gross investment returns used to determine the underlying profit of the business are based on prevailing market rates and published research into historical investment return differentials for the range of assets held. The basis for calculating these expected returns reflects an average of the 15 year swap rate over the preceding 12 months updated throughout the year to reflect changing market conditions.
Policyholder interests volatility
The application of accounting standards results in the introduction of other sources of significant volatility into the pre-tax profits of the life, pensions and investments business. In order to provide a clearer representation of the performance of the business, and consistent with the way in which it is managed, adjustments are made to remove this volatility from underlying profits. The effect of these adjustments is separately disclosed as policyholder interests volatility.
Accounting standards require that tax on policyholder investment returns relating to life products should be included in the Group’s tax charge rather than being offset against the related income. The result is, therefore, to either increase or decrease profit before tax with a related change in the tax charge. Timing and measurement differences exist between provisions for tax and charges made to policyholders. Consistent with the expected approach taken in respect of insurance volatility, differences in the expected levels of the policyholder tax provision and policyholder charges are adjusted through policyholder interests volatility. In 2023, the statutory results before tax included a credit to other income which relates to policyholder interests volatility totalling £116 million.
Insurance hedging arrangements
Although the Group manages its exposures to equity, interest rate, foreign currency exchange rate, inflation and market movements within the Insurance division, it does so by balancing the importance of managing the impacts on both capital and earnings volatility, though the extent to which these bases are hedged needs to be balanced. For example, equity market movements are hedged within Insurance on a Solvency II capital basis and whilst this also reduces the IFRS earnings exposure to equity market movements, the hedge works to a lesser extent from an IFRS earnings perspective.
Amortisation of purchased intangibles
The Group incurred a charge for the amortisation of intangible assets, largely recognised on the acquisition of MBNA, of £80 million (2022: £70 million).
Fair value unwind
The statutory results include the impact of the acquisition-related fair value adjustments, arising from the acquisitions of HBOS and MBNA. In 2023 the principal financial effect of the fair value unwind is to reflect the effective interest rates applicable at the date of acquisition, on liabilities that were acquired at values that differed from their original book value.
| | | | | | | | |
24 | Lloyds Banking Group plc Annual Report on Form 20-F 2023 | |
Operating and financial review and prospects continued
Divisional results
Retail
Retail offers a broad range of financial services products to personal customers, including current accounts, savings, mortgages, credit cards, unsecured loans, motor finance and leasing solutions. Its aim is to build enduring relationships that meet more of its customers’ financial needs and improve their financial resilience throughout their lifetime, with personalised products and services. Retail operates the largest digital bank and branch network in the UK and continues to improve service levels and reduce conduct risk, whilst working within a prudent risk appetite. Through strategic investment, alongside increased use of data, Retail will deepen existing consumer relationships and broaden its intermediary offering, to improve customer experience, operational efficiency and increasingly tailor propositions.
| | | | | | | | | | | |
| 2023 £m | | 2022 £m |
Underlying net interest income | 9,647 | | | 9,774 | |
| Underlying other income | 2,159 | | | 1,731 | |
| Operating lease depreciation | (948) | | | (368) | |
| Underlying income, net of operating lease depreciation | 10,858 | | | 11,137 | |
| Underlying operating costs | (5,469) | | | (5,175) | |
| Remediation | (515) | | | (92) | |
| Total underlying costs | (5,984) | | | (5,267) | |
| Underlying impairment | (831) | | | (1,373) | |
| Underlying profit before tax | 4,043 | | | 4,497 | |
Underlying profit before tax reduced by £454 million to £4,043 million in 2023 compared to £4,497 million in 2022.
Underlying net interest income reduced by £127 million to £9,647 million in 2023 compared to £9,774 million in 2022, driven by mortgage and unsecured lending margin compression, partly offset by the rising rate environment and higher unsecured lending average balances.
Underlying other income increased £428 million to £2,159 million in 2023 compared to £1,731 million in 2022, driven by increased current account and credit card activity, improved performance in Lex Autolease Limited and growth from the acquisition of Tusker.
Operating lease depreciation increased £580 million to £948 million in 2023 compared to £368 million in 2022, reflecting declines in used car prices impacting portfolio valuations and gains on disposals, depreciation cost of higher value vehicles and the Tusker acquisition and its subsequent growth.
Underlying operating costs increased by £294 million to £5,469 million in 2023 compared to £5,175 million in 2022, reflecting planned strategic investment costs, severance charges, inflationary effects and the Tusker acquisition, partly offset by efficiency initiatives.
Remediation increased by £423 million to £515 million in 2023 compared to £92 million in 2022, driven by a £450 million provision for the potential impact of the recently announced FCA review into historical motor finance commission arrangements.
Underlying impairment decreased by £542 million to £831 million in 2023 compared to a charge of £1,373 million in 2022, driven by an updated economic scenario credit compared to a charge in the prior year, partly offset by increases observed in the level of UK mortgage new to arrears and flows to default, primarily legacy variable rate customers, whilst unsecured performance remained stable.
| | | | | | | | |
25 | Lloyds Banking Group plc Annual Report on Form 20-F 2023 | |
Operating and financial review and prospects continued
Divisional results continued
Commercial Banking
Commercial Banking serves small and medium businesses and corporate and institutional clients, providing lending, transactional banking, working capital management, debt financing and risk management services. Through investment in digital capability and product development, Commercial Banking will deliver an enhanced customer experience via a digital-first model in Small and Medium Businesses and an expanded client proposition across Commercial Banking, generating diversified capital efficient growth and supporting customers in their transition to net zero.
| | | | | | | | | | | |
| 2023 £m | | 2022 £m |
Underlying net interest income | 3,799 | | | 3,447 | |
| Underlying other income | 1,691 | | | 1,565 | |
| Operating lease depreciation | (8) | | | (5) | |
| Underlying income, net of operating lease depreciation | 5,482 | | | 5,007 | |
| Underlying operating costs | (2,647) | | | (2,496) | |
| Remediation | (127) | | | (133) | |
| Total underlying costs | (2,774) | | | (2,629) | |
| Underlying impairment credit (charge) | 511 | | | (517) | |
| Underlying profit before tax | 3,219 | | | 1,861 | |
Commercial Banking underlying profit before tax increased by £1,358 million to £3,219 million in 2023 compared to £1,861 million in 2022.
Underlying net interest income increased by £352 million to £3,799 million in 2023 compared to £3,447 million in 2022, driven by a stronger net interest margin reflecting the higher rate environment and strong portfolio management.
Underlying other income increased by £126 million to £1,691 million in 2023 compared to £1,565 million in 2022 reflecting improved performance in capital markets financing and trading.
Underlying operating costs increased by £151 million to £2,647 million in 2023 compared to £2,496 million in 2022 due to higher planned strategic investment, severance charges and inflationary effects, partly offset by the continued benefit from efficiency initiatives.
Remediation decreased by £6 million to £127 million in 2023 compared to £133 million in 2022.
Underlying impairment credit of £511 million in 2023 compared to a charge of £517 million in 2022, driven by a significant write-back in the fourth quarter and a credit from updated macroeconomic scenarios. Portfolio credit quality remains resilient with limited deterioration.
| | | | | | | | |
26 | Lloyds Banking Group plc Annual Report on Form 20-F 2023 | |
Operating and financial review and prospects continued
Divisional results continued
Insurance, Pensions and Investments
Insurance, Pensions and Investments supports over 10 million customers with Assets under Administration (AuA) of £213 billion (excluding Wealth) and annualised annuity payments of over £1.2 billion. It has seen significant change in 2023, with a refreshed management team and a refocused strategy. This has been supported by the Groups significant investment in the development of the business, including the investment propositions to support the Group’s mass affluent strategy, innovating intermediary propositions through the Embark and Cavendish Online acquisitions and accelerating the transition to a low carbon economy.
| | | | | | | | | | | |
| 2023 £m | | 20221 £m |
Underlying net interest income | (132) | | | (101) | |
| Underlying other income | 1,209 | | | 960 | |
| Underlying income | 1,077 | | | 859 | |
| Underlying operating costs | (880) | | | (879) | |
| Remediation | (14) | | | (30) | |
| Total underlying costs | (894) | | | (909) | |
| Underlying impairment credit (charge) | 7 | | | (12) | |
| Underlying profit (loss) before tax | 190 | | | (62) | |
1 2022 comparatives have been restated to reflect the impact of IFRS 17. See page F-27. Underlying profit before tax from Insurance, Pensions and Investments was £252 million higher at £190 million compared to an underlying loss before tax of £62 million in 2022 primarily as a result of an increase of £218 million in total income.
Underlying net interest income decreased by £31 million, or 31 per cent, to a loss of £132 million from a loss of £101 million in 2022, with higher interest rates on debt costs for the division offset by improvement in sharedealing net interest income.
Underlying other income increased by £249 million, or 26 per cent to £1,209 million from £960 million in 2022, driven by favourable market returns and balance sheet growth, including the impact of adding a drawdown feature in 2022 to existing longstanding and workplace pension business, resulting in higher contractual service margin and risk adjustment releases to income. General Insurance income net of claims increased by c.50 per cent in the year driven by market share gains and reduced severe weather related claims compared to 2022.
Underlying operating costs were stable, with higher planned strategic investment, severance charges and inflationary effects, partly offset by benefit from efficiency initiatives.
Remediation decreased by £16 million to £14 million in 2023 compared to £30 million in 2022.
| | | | | | | | |
27 | Lloyds Banking Group plc Annual Report on Form 20-F 2023 | |
Operating and financial review and prospects continued
Divisional results continued
Other
Other includes the Group’s equity investments businesses, including Lloyds Development Capital (LDC), the Group’s share of the Business Growth Fund (BGF) and the Housing Growth Partnership (HGP), as well as Citra Living. Also included are income and expenses not attributed to other divisions, including residual underlying net interest income after transfer pricing (which includes the recharging to other divisions of the Group’s external AT1 distributions), in period gains from gilt sales and the unwind of associated hedging costs.
| | | | | | | | | | | |
| 2023 £m | | 20221 £m |
| Underlying income | 515 | | | 462 | |
| Underlying operating costs | (144) | | | (122) | |
| Remediation | (19) | | | – | |
| Total underlying costs | (163) | | | (122) | |
| Underlying impairment credit | 5 | | | 392 | |
| Underlying profit before tax | 357 | | | 732 | |
1 2022 comparatives have been restated to reflect the impact of IFRS 17. See page F-27. Other underlying profit before tax was £357 million in 2023 compared to £732 million in 2022.
Underlying income for the year was higher compared to 2022, with stronger underlying net interest income partly offset by weaker underlying other income. Underlying net interest income benefited from the effect of rising rates on income earned from the placement of funds raised through the issuance of structured medium-term notes (offset within underlying other income by the increased funding costs of the notes) as well as higher internal recharges to other divisions as a result of increased AT1 distribution costs. Underlying other income was weaker, primarily due to higher funding costs and also subdued exit markets affecting the Group’s equity investment businesses.
Total underlying costs were £41 million higher at £163 million in 2023 compared to £122 million in 2022, in part due to the costs of business growth in equity investment businesses, including Citra Living.
Underlying impairment was a £5 million credit compared to a £392 million credit in 2022. The credit in 2022 relates to the release of the expected credit loss central adjustment of £400 million held at the end of 2021. This adjustment was not allocated to specific portfolios and was applied in respect of uncertainty in the economic outlook, relating to the risks of COVID-19.
Results of operations – 2021
IFRS 17 requires that only one year of comparatives are restated. Accordingly, the Group’s results and those of the Insurance, Pensions and Investments division for the year ended 31 December 2021 included in this document are presented under IFRS 4 and have not been restated. A discussion of the Group’s results and those of the Insurance, Pensions and Investment division for the year ended 31 December 2022 (under IFRS 4) compared to those for the year ended 31 December 2021 (under IFRS 4) was included on pages 24 to 38 of the Annual Report on Form 20-F for the year ended 31 December 2022, filed with the SEC on 24 February 2023, which is hereby incorporated by reference into this document.
| | | | | | | | |
28 | Lloyds Banking Group plc Annual Report on Form 20-F 2023 | |
Operating and financial review and prospects continued
Average balance sheet and interest income and expense
| | | | | | | | | | | | | | | | | | | | | | | | | | | | | | | | | | | |
| 2023 | | 20221,2 | | 20212 |
| Average
balance
sheet
amount
£m | Interest
earned
£m | Average yield
% | | Average
balance
sheet
amount
£m | Interest
earned
£m | Average yield
% | | Average
balance
sheet
amount
£m | Interest
earned
£m | Average yield
% |
Assets3 | | | | | | | | | | | |
| Financial assets at amortised cost: | | | | | | | | | | | |
| Loans and advances to banks | 100,631 | | 4,172 | | 4.15 | | | 97,868 | | 1,208 | | 1.23 | | | 84,203 | | 104 | | 0.12 | |
| Loans and advances to customers | 452,222 | | 20,419 | | 4.52 | | | 457,585 | | 14,465 | | 3.16 | | | 450,480 | | 12,556 | | 2.79 | |
| Reverse repurchase agreements | 40,004 | | 2,044 | | 5.11 | | | 54,197 | | 857 | | 1.58 | | | 55,763 | | 77 | | 0.14 | |
| Debt securities | 12,433 | | 559 | | 4.50 | | | 9,079 | | 168 | | 1.85 | | | 5,466 | | 80 | | 1.46 | |
| Financial assets at fair value through other comprehensive income | 23,993 | | 857 | | 3.57 | | | 23,833 | | 947 | | 3.97 | | | 26,434 | | 441 | | 1.67 | |
| Total average interest-earning assets of banking book | 629,283 | | 28,051 | | 4.46 | | | 642,562 | | 17,645 | | 2.75 | | | 622,346 | | 13,258 | | 2.13 | |
| Total average interest-earning financial assets at fair value through profit or loss | 80,201 | | 3,388 | | 4.22 | | | 77,845 | | 1,838 | | 2.36 | | | 74,428 | | 1,314 | | 1.77 | |
| Total average interest-earning assets | 709,484 | | 31,439 | | 4.43 | | | 720,407 | | 19,483 | | 2.70 | | | 696,774 | | 14,572 | | 2.09 | |
| Allowance for impairment losses on financial assets held at amortised cost | (4,732) | | | | | (4,288) | | | | | (5,146) | | | |
| Non-interest earning assets | 174,725 | | | | | 176,359 | | | | | 186,068 | | | |
| Total average assets and interest earned | 879,477 | | 31,439 | | 3.57 | | | 892,478 | | 19,483 | | 2.18 | | | 877,696 | | 14,572 | | 1.66 | |
Liabilities and shareholders’ funds3 | | | | | | | | | | | |
| Deposits by banks | 6,376 | | 213 | | 3.34 | | | 7,902 | | 148 | | 1.87 | | | 9,930 | | 74 | | 0.75 | |
| Customer deposits | 349,171 | | 7,148 | | 2.05 | | | 345,086 | | 1,387 | | 0.40 | | | 348,362 | | 426 | | 0.12 | |
| Repurchase agreements at amortised cost | 43,480 | | 2,397 | | 5.51 | | | 46,226 | | 842 | | 1.82 | | | 22,332 | | 22 | | 0.10 | |
Debt securities in issue at amortised cost4 | 79,038 | | 4,253 | | 5.38 | | | 74,007 | | 1,636 | | 2.21 | | | 79,650 | | 900 | | 1.13 | |
| Lease liabilities | 1,486 | | 30 | | 2.02 | | | 1,323 | | 29 | | 2.19 | | | 1,512 | | 32 | | 2.12 | |
| Subordinated liabilities | 10,549 | | 712 | | 6.75 | | | 10,654 | | 681 | | 6.39 | | | 13,462 | | 932 | | 6.92 | |
| Total average interest-bearing liabilities of banking book | 490,100 | | 14,753 | | 3.01 | | | 485,198 | | 4,723 | | 0.97 | | | 475,248 | | 2,386 | | 0.50 | |
| | | | | | | | | | | |
| Total average interest-bearing liabilities of trading book | 23,513 | | 1,445 | | 6.15 | | | 20,809 | | 468 | | 2.25 | | | 23,269 | | 113 | | 0.49 | |
| Total average interest-bearing liabilities | 513,613 | | 16,198 | | 3.15 | | | 506,007 | | 5,191 | | 1.03 | | | 498,517 | | 2,499 | | 0.50 | |
| Non-interest-bearing customer accounts | 120,817 | | | | | 132,860 | | | | | 120,533 | | | |
| Other non-interest-bearing liabilities | 197,431 | | | | | 203,437 | | | | | 207,329 | | | |
| Total average non-interest-bearing liabilities | 318,248 | | | | | 336,297 | | | | | 327,862 | | | |
| Non-controlling interests, other equity instruments and shareholders’ funds | 47,616 | | | | | 50,174 | | | | | 51,317 | | | |
| Total average liabilities, average shareholders’ funds and interest expense | 879,477 | | 16,198 | | 1.84 | | | 892,478 | | 5,191 | | 0.58 | | | 877,696 | | 2,499 | | 0.28 | |
1 Restated for the adoption of IFRS 17; see notes 1 and 54 to the consolidated financial statements.
2 Restated for presentational changes; see note 1 to the consolidated financial statements.
3 The line items below are based on IFRS terminology and include all major categories of average interest-earning assets and average interest-bearing liabilities.
4 The impact of the Group’s hedging arrangements is included on this line.
| | | | | | | | | | | | | | | | | | | | | | | | | | | | | | | | | | | |
| 2023 | | 20221,2 | | 20212 |
| Average interest-earning assets and net interest income | Average
interest-
earning
assets
£m | Net
interest
income
£m | Net
interest
yield on
interest-
earning
assets
% | | Average
interest-
earning
assets
£m | Net
interest
income
£m | Net
interest
yield on
interest-
earning
assets
% | | Average
interest-
earning
assets
£m | Net
interest
income
£m | Net
interest
yield on
interest-
earning
assets
% |
| | | | | | | | | | | |
| Banking business | 629,283 | | 13,298 | | 2.11 | | | 642,562 | | 12,922 | | 2.01 | | | 622,346 | | 10,872 | | 1.75 | |
| | | | | | | | | | | |
| Trading securities and other financial assets at fair value through profit or loss | 80,201 | | 1,943 | | 2.42 | | | 77,845 | | 1,370 | | 1.76 | | | 74,428 | | 1,201 | | 1.61 | |
| 709,484 | | 15,241 | | 2.15 | | | 720,407 | | 14,292 | | 1.98 | | | 696,774 | | 12,073 | | 1.73 | |
1 Restated for the adoption of IFRS 17; see notes 1 and 54 to the consolidated financial statements.
2 Restated for presentational changes; see note 1 to the consolidated financial statements.
| | | | | | | | |
29 | Lloyds Banking Group plc Annual Report on Form 20-F 2023 | |
Operating and financial review and prospects continued
Average balance sheet and interest income and expense continued
Average balances are based on daily averages for the principal areas of the Group’s banking activities with monthly or less frequent averages used elsewhere. Management believes that the interest rate trends are substantially the same as they would be if all balances were averaged on the same basis.
The Group’s operations are predominantly UK-based and as a result an analysis between domestic and foreign operations is not provided.
Changes in net interest income – volume and rate analysis
The following table allocates changes in net interest income between volume, rate and their combined impact for 2023 compared with 2022 and for 2022 compared with 2021.
| | | | | | | | | | | | | | | | | | | | | | | | | | | | | |
| 2023 compared with 2022
increase/(decrease) | | 2022 compared with 2021
increase/(decrease)1 |
| Total
change
£m | Change in
volume
£m | Change in
rates
£m | Change in
rates and
volume
£m | | Total
change
£m | Change in
volume
£m | Change in
rates
£m | Change in
rates and
volume
£m |
| Interest income | | | | | | | | | |
| Financial assets at amortised cost: | | | | | | | | | |
| Loans and advances to banks | 2,964 | | 34 | | 2,850 | | 80 | | | 1,104 | | 17 | | 935 | | 152 | |
| Loans and advances to customers | 5,954 | | (170) | | 6,197 | | (73) | | | 1,909 | | 198 | | 1,684 | | 27 | |
| Reverse repurchase agreements | 1,187 | | (224) | | 1,912 | | (501) | | | 780 | | (2) | | 805 | | (23) | |
| Debt securities | 391 | | 62 | | 240 | | 89 | | | 88 | | 53 | | 21 | | 14 | |
| Financial assets at fair value through other comprehensive income | (90) | | 6 | | (95) | | (1) | | | 506 | | (43) | | 609 | | (60) | |
| Total banking book interest income | 10,406 | | (292) | | 11,104 | | (406) | | | 4,387 | | 223 | | 4,054 | | 110 | |
| Total interest income on financial assets at fair value through profit or loss | 1,550 | | 56 | | 1,450 | | 44 | | | 524 | | 60 | | 444 | | 20 | |
| Total interest income | 11,956 | | (236) | | 12,554 | | (362) | | | 4,911 | | 283 | | 4,498 | | 130 | |
| Interest expense | | | | | | | | | |
| Deposits by banks | 65 | | (29) | | 116 | | (22) | | | 74 | | (15) | | 112 | | (23) | |
| Customer deposits | 5,761 | | 16 | | 5,678 | | 67 | | | 961 | | (4) | | 974 | | (9) | |
| Repurchase agreements at amortised cost | 1,555 | | (50) | | 1,706 | | (101) | | | 820 | | 24 | | 384 | | 412 | |
| Debt securities in issue at amortised cost | 2,617 | | 111 | | 2,346 | | 160 | | | 736 | | (64) | | 861 | | (61) | |
| Lease liabilities | 1 | | – | | 1 | | – | | | (3) | | (4) | | 1 | | – | |
| Subordinated liabilities | 31 | | (7) | | 38 | | – | | | (251) | | (194) | | (72) | | 15 | |
| Total banking book interest expense | 10,030 | | 41 | | 9,885 | | 104 | | | 2,337 | | (257) | | 2,260 | | 334 | |
| | | | | | | | | |
| Total interest expense on trading and other liabilities at fair value through profit or loss | 977 | | 61 | | 811 | | 105 | | | 355 | | (12) | | 410 | | (43) | |
| Total interest expense | 11,007 | | 102 | | 10,696 | | 209 | | | 2,692 | | (269) | | 2,670 | | 291 | |
1 Restated for presentational changes; see note 1 to the consolidated financial statements.
| | | | | | | | |
30 | Lloyds Banking Group plc Annual Report on Form 20-F 2023 | |
Operating and financial review and prospects continued
Risk overview
Effective risk management and control
Risk management is a key element in shaping our business model and delivering the Group’s strategy to enable sustainable growth. A strong risk management culture is crucial to keep the Group, our colleagues and our customers safe and secure from existing and emerging risks.
Our approach to risk
The Group’s business model is based on a prudent approach to risk, which guides participation decisions while safeguarding our colleagues, customers and the Group. An overview of risk management is included in this section, with the detailed risk management section from pages 37 to 93, which provides: •A detailed overview of how risk is managed within the Group, including the approach to risk appetite
•The framework by which these risks are identified, managed, mitigated and monitored
Risk profile and performance
The Group has remained committed to maintaining support for its customers despite challenges with the rising cost of living and economic uncertainties in the global and domestic markets.
The Group’s loans and advances continue to be well positioned and heightened monitoring is in place to identify signs of affordability stress. The mortgage book remains resilient with arrears below 2019, with the new Mortgage Charter providing additional enhanced support to customers during 2023.
Unsecured and Commercial Banking portfolios continue to exhibit stable new to arrears and default trends broadly at, or below, pre-pandemic levels. Commercial Real Estate is demonstrating resilience and is well diversified with no speculative commercial development lending.
As part of the Group’s strategy, there will be continuing investments in technology and infrastructure. The Group’s operational resilience risks remain a key area of focus, particularly relating to cyber risk and supply chain management.
The Group has overseen the embedding of its operational risk and control framework during 2023 and its oversight of management of financial crime risks and consumer fraud.
Climate risk remains a key priority for the Group, with positive progress in 2023 and a commitment to continued focus in 2024. The Group has enhanced the monitoring of progress against its strategic ambitions, alongside ongoing development of capabilities for measuring and managing key risks.
Our enterprise risk management framework
The enterprise risk management framework (ERMF) is the foundation for the delivery of effective and consistent risk control across the whole Group. It enables proactive identification, active management and monitoring of the Group’s risks, which is supported by our risk and control self-assessment approach.
The ERMF is regularly updated to ensure it remains in line with regulation, law, corporate governance and industry good practice. The Board and senior management are responsible for the approval of the ERMF, together with Group-wide risk principles and policies. The effectiveness of the ERMF is assessed annually with the results reported directly to the Board.
The Board and senior management set and embed a positive culture of diversity, equity and inclusion. The Group’s Code of Ethics and Responsibility and our established values, reinforce colleagues’ accountability for the risks they take, their responsibility to explore customers’ needs and consistently deliver good customer outcomes.
Risk appetite is defined within the Group as the amount and type of risk that the Group is prepared to seek, accept or tolerate in delivering its strategy. The Board is responsible for approving the Group’s Board risk appetite statement annually. Board level risk appetite metrics are augmented further by executive-level metrics and cascaded into more detailed business metrics and limits.
The Group adopts a continuous risk management approach, from identifying the risks through risk and control self-assessment, and managing the risks through to producing appropriate, accurate and focused risk reporting. The Group ensures that the appropriate risk resources and capabilities are in place, with colleagues provided with the necessary training to give them the skills they need.
Governance is maintained through delegation of authority from the Board down to individuals. Senior executives are supported by a committee-based structure which is designed to ensure open challenge and enable effective Board engagement and decision making.
The three lines of defence model defines the responsibilities and accountabilities for risk management, with effective independent oversight and assurance. Business lines have primary responsibility for the identification and management of risks, Risk division provides oversight and challenge, and Group Internal Audit provide independent assurance to the Board and Audit Committee.
More information on the Board’s responsibilities can be found on page 140 and our executive and Risk committees on pages 40 to 42. 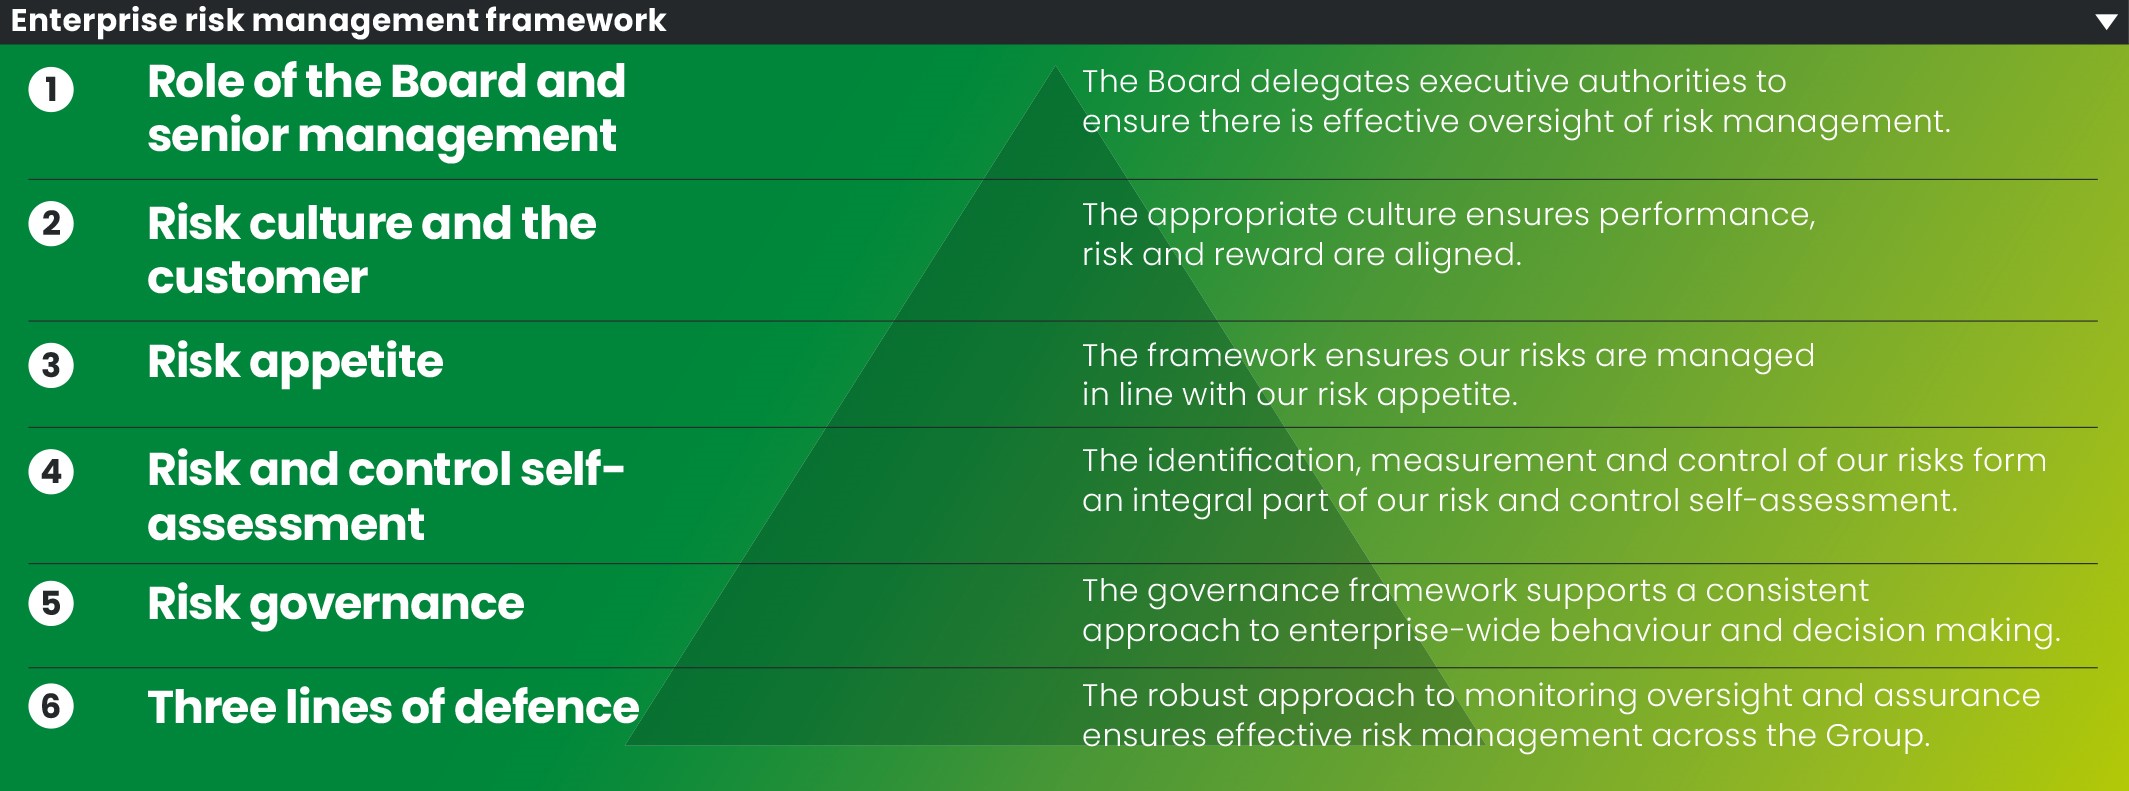
| | | | | | | | |
31 | Lloyds Banking Group plc Annual Report on Form 20-F 2023 | |
Operating and financial review and prospects continued
Principal risks
The principal risks outlined in this section are used to monitor and report the risk exposures posing the greatest potential impact to the Group.
All of the principal risks are Board-approved enterprise-wide risk categories which are reported to the Board Risk Committee and the Board regularly.
The Board Risk Committee report on pages 153 to 158 outlines its purpose, structure and responsibilities in addition to activities during the year. The Group is in the process of conducting a detailed review of the enterprise risk management framework to ensure it remains in line with regulatory expectations, corporate governance and industry good practice, which will result in a reclassification of our principal risks in 2024.
In the risk management section, a summary of the Group’s principal and secondary risks is on page 44, with further information on how each principal risk is managed from pages 45 to 93. Risk trends: 4 Stable risk 5 Elevated risk 6 Reduced risk
Capital risk 4
Link to strategy: Focus
The Group maintained its strong capital position in 2023 with a CET1 capital ratio of 13.7 per cent on an adjusted basis, after absorbing regulatory headwinds and the acquisition of Tusker.
This remains significantly ahead of minimum capital requirements and in excess of the Group’s revised ongoing target of 13.0 per cent (previously 13.5 per cent), which includes a management buffer of around 1 per cent. Downside risks from economic and regulatory headwinds, including the impact of further Retail secured CRD IV model updates, are being closely monitored. This is in addition to the potential impact from the FCA review of historical motor finance commission arrangements.
Risk appetite: The Group maintains capital levels commensurate with a prudent level of solvency to achieve financial resilience and market confidence.
Key mitigating actions:
•Capital management framework that includes the setting of capital risk appetite, capital planning and stress testing activities
•Regular refresh and monitoring of a suite of early warning indicators and maintenance of a Capital Contingency Framework, designed to identify and act on emerging capital concerns at an early stage
Change and execution risk 5
Link to strategy: Focus, Change
The Group’s change and execution risk has remained elevated in 2023. Whilst change continues to be carried out safely and the new platform operating model has enhanced the change controls, the scale and complexity of the Group’s strategic change agenda is significant. Further development of the model, change framework and the associated controls is expected in 2024.
Risk appetite: The Group has limited appetite for negative impacts on customers, colleagues, or the Group as a result of change activity.
Key mitigating actions:
•Measurement and reporting of change and execution risk, including critical elements of the change portfolio through appropriate governance
•Providing sufficient skilled resources to safely deliver and embed change and support future transformation plans
•Continued evolution and enhancement of the Group’s change operating model including the underpinning policy, method and associated controls
Climate risk 4
Link to strategy: Focus
The Group is continuing to develop its capabilities for measuring and managing key climate risks including monitoring progress against its net zero ambitions.
However, the external landscape presents further challenges, both in relation to the policy changes required to support the transition to net zero, as well as increasing regulatory expectations.
Risk appetite: The Group takes action to support the Group and its customers’ transition to net zero, and maintain its resilience against the risks relating to climate change.
Key mitigating actions:
•Further embedding of climate risk policy, providing a framework for consideration of climate-related risks across the Group
•Established targets to reduce emissions across key areas of activity, as well as developing appropriate plans and strategies to support our transition to net zero
•Enhancing consideration of physical and transition risks within the credit risk process, including assessment of clients’ credible transition plans
•Continuing to build an understanding of how greenwashing could impact the Group, including training for all colleagues to ensure it is avoided
| | | | | | | | |
32 | Lloyds Banking Group plc Annual Report on Form 20-F 2023 | |
Operating and financial review and prospects continued
Conduct risk 4
Link to strategy: Grow, Focus
Conduct risk has remained stable in 2023, however there are several areas of emerging risks due to regulatory changes and areas of focus. The Group’s focus is on supporting customers impacted by the rising cost of living, culture and diversity, mindset shift to embed the FCA’s Consumer Duty requirements and ensuring good customer outcomes, amid the transformation of its business and technology. We are also continuing to liaise closely with the FCA and FOS on historical motor commission arrangements.
Risk appetite: The Group delivers good outcomes for its customers.
Key mitigating actions:
•Robust policies in place to support good customer outcomes
•Active engagement with regulatory bodies and key stakeholders to ensure that the Group’s strategic conduct focus continues to meet evolving stakeholder expectations
Credit risk 4
Link to strategy: Grow
The Group’s credit portfolio continued to be resilient with only modest evidence of deterioration to date. UK Mortgages new to arrears were relatively stable throughout 2023, having increased slightly at the start of the year, with other unsecured portfolios performing broadly at or favourable to pre-pandemic levels. Impairment was a net charge of £303 million, compared to £1,522 million for 2022 and includes a significant write-back following the full repayment of debt from a single name client in the fourth quarter and improvements in the Group’s macroeconomic outlook. The Group’s expected credit loss allowances have decreased to £4,039 million (2022: £4,841 million).
Risk appetite: The Group has a conservative and well-balanced credit portfolio through the economic cycle in line with the Group’s target return on equity in aggregate. The Group’s approach focuses on origination quality and levers at Board level while dynamically adapting to the risk environment, business growth strategy, industry practices and regulatory expectations.
Key mitigating actions:
•Extensive and thorough credit processes, strategies and controls to ensure effective risk identification, management and oversight
•Significant monitoring in place, including early warning indicators
•Selective credit tightening reflective of forecast changes in the macroeconomic environment, including updates to affordability lending controls for forward-looking costs
Data risk 4
Link to strategy: Focus
Data risk remained stable in 2023 with investment in end-to-end data risk management and capabilities. The Group’s data strategy will support managing data risk and remediation to achieve the Group’s growth objectives.
Risk appetite: The Group has zero appetite for data-related regulatory fines or enforcement actions.
Key mitigating actions:
•Delivering against the data strategy and uplifting capability in data management and privacy
•Embedding data by design and ethics principles into the data science lifecycle
•Oversight of the data supply chain, emerging technologies, and data controls and processes
Funding and liquidity risk 4
Link to strategy: Focus
The Group maintained its strong funding and liquidity position in 2023. The loan to deposit ratio decreased slightly to 95 per cent (2022: 96 per cent). The Group’s liquid assets continue to exceed the regulatory minimum and internal risk appetite, with a monthly rolling 12 month average liquidity coverage ratio (LCR) of 142 per cent (2022: 144 per cent). The Group maintains its access to diverse sources and tenors of funding.
Risk appetite: The Group maintains a prudent liquidity profile and a balance sheet structure that limits its reliance on potentially volatile sources of funding.
Key mitigating actions:
•Management and monitoring of liquidity risks and ensuring that management systems and arrangements are adequate with regard to the internal risk appetite, Group strategy and regulatory requirements
•Significant customer deposit base, driven by inflows to trusted brands
•Participation in term issuance programmes
| | | | | | | | |
33 | Lloyds Banking Group plc Annual Report on Form 20-F 2023 | |
Operating and financial review and prospects continued
Insurance underwriting risk 4
Link to strategy: Grow
Insurance underwriting risk remained broadly stable. Life and Pensions present value of new business premium reduced to £17.4 billion (2022: £19.0 billion), the reduction driven mainly by higher discounting rates. General Insurance total gross written premium increased to £579 million (2022: £486 million) due to improved trading.
Risk appetite: The Group has an appetite to take on insurance underwriting risks where they fit with our strategic objectives.
Key mitigating actions:
•Significant reinsurance of mortality, morbidity and General Insurance weather risk
•Robust processes for underwriting, reinsurance, claims management, pricing, product design and product management
•Management through diversification and pooling of risks
Market risk 4
Link to strategy: Focus
Market conditions in 2023 remained volatile creating an uncertain environment for the management of market risk. However, the Group remains well hedged ensuring near-term interest rate exposure is appropriately managed.
The Group’s structural hedge decreased to £247 billion (2022: £255 billion) mostly due to the changing mix of customer deposits, from current accounts into fixed savings products. In 2023 the pensions triennial valuation completed and following final contributions of £250 million in December, the pension schemes funding deficit was cleared. The IAS 19 accounting surplus remained broadly unchanged at £3.5 billion (2022: £3.7 billion).
Risk appetite: The Group has effective controls in place to identify and manage the market risk inherent in our customer and client-focused activities
Key mitigating actions:
•Structural hedge programmes implemented to stabilise earnings
•Close monitoring of market risks and, where appropriate, undertaking of asset and liability matching and hedging
•Monitoring of the credit allocation in the defined benefit pension schemes, as well as the hedges in place against adverse movements in nominal rates, inflation and longevity
Model risk 5
Link to strategy: Focus, Change
Model risk remained elevated in 2023, following the pandemic-related government-led support schemes weakening the relationships between model inputs and outputs in 2022. The economy has steadied somewhat compared to 2022, now being more typical of the environment used to build the models, reducing need for judgemental overlays to account for this, but many of the effects of the pandemic and other stresses to the economy are still working their way through. The control environment for model risk continues to be strengthened to meet revised internal and regulatory requirements.
Risk appetite: Material models perform in line with expectations.
Key mitigating actions:
•Robust model risk management framework for managing and mitigating model risk within the Group
Operational risk 5
Link to strategy: Grow, Focus, Change
Operational risk has elevated in 2023. Overall, operational loss event volumes have slightly increased due to fraud instances, but financial losses have reduced compared with 2022.
Key operational risk areas for the Group are security, technology, and fraud, with an uplift in supplier issues over the last 12 months, although these have not been material in impact.
Risk appetite: The Group has robust controls in place to manage operational losses, reputational events and regulatory breaches. It identifies and assesses emerging risks and acts to mitigate these.
Key mitigating actions:
•Review and investment in the Group’s control environment, with a particular focus on automation, to ensure the Group addresses the inherent risks faced
•Deployment of a range of risk management strategies, including avoidance, mitigation, transfer (including insurance) and acceptance
| | | | | | | | |
34 | Lloyds Banking Group plc Annual Report on Form 20-F 2023 | |
Operating and financial review and prospects continued
Operational resilience risk 4
Link to strategy: Focus, Change
Operational resilience remained stable in 2023. Enhancing the Group’s resilience for serving customers has been a key focus. The Group has used operational resilience scenario testing to shape a programme to deliver enhanced resilience of important business services by 2025.
The Group recognises the prominence of cyber security protection and the role that resilience of our suppliers plays in delivering resilient customer experiences. Technology resilience remains a focus area, with dedicated programmes to address key risks.
Risk appetite: The Group has limited appetite for disruption to services to customers and stakeholders from significant unexpected events.
Key mitigating actions:
•Operational resilience programme in place to deliver against new regulation and improve the Group’s ability to respond to incidents while delivering key services to customers
•Investment in technology improvements, including enhancements to the resilience of systems that support important business services
People risk 5
Link to strategy: Grow, Focus, Change
People risk remains a key focus for the Group given the scale and pace of the transformation underway. The strategic focus of the leadership team continues to focus on colleague wellbeing and resilience, driving an inclusive, diverse and customer-centric culture, recruiting the required skills of the future and enabling colleague performance through enhancing their skills and capabilities. This is together with the Group’s revised pay offering which aims to support colleagues facing cost of living pressures.
Risk appetite: The Group leads responsibly and proficiently, manages people resource effectively, supports and develops colleague skills and talent, creates and nurtures the right culture and meets legal and regulatory obligations related to its people.
Key mitigating actions:
•Delivery of strategies to attract, retain and develop high-calibre people with the required capabilities, together with a focus on creating a strong and resilient talent pipeline
•Continued focus on the Group’s culture by developing and delivering initiatives that reinforce inclusivity and appropriate behaviours
•Focus on providing a working environment which promotes colleague safety and enhances their wellbeing and resilience
Regulatory and legal risk 4
Link to strategy: Focus
The regulatory and legal risk profile has remained stable although we are conscious of upcoming regulatory changes and the ongoing implementation of Consumer Duty. Legal risk continued to be impacted by the evolving legal and regulatory landscape, changing regulatory and other standards and uncertainty arising from the current and future litigation landscape.
Risk appetite: The Group interprets and complies with all relevant regulation and all applicable laws (including codes of conduct which could have legal implications) and/or legal obligations.
Key mitigating actions:
•Policies and procedures setting out the principles and key controls that should apply across the business which are aligned to the Group risk appetite
•Identification, assessment and implementation of policy and regulatory requirements by business units and the establishment of local controls, processes, procedures and resources to ensure appropriate governance and compliance
Strategic risk 4
Link to strategy: Grow, Focus, Change
Strategic risk is stable, with further evolution of the Group’s methodology for assessing and prioritising emerging risks. Further information on emerging risks can be found on pages 36 and 43. Risk Appetite: From 2024 strategic risk has been incorporated into emerging and horizon risk, and risk appetite is not set.
Key mitigating actions:
•Considering and addressing the strategic implications of emerging trends
•Embedding of strategic risk into business planning process and day-to-day risk management
| | | | | | | | |
35 | Lloyds Banking Group plc Annual Report on Form 20-F 2023 | |
Operating and financial review and prospects continued
Emerging and horizon risks
The Group continues to focus on horizon scanning activity to inform and support identification of the most pertinent internal and external trends and developments.
Evolution of the Group’s methodology for assessing and prioritising emerging risks
A series of deep dives on the 2022 emerging risk themes have taken place during the year. In addition, individual emerging risks themes have been taken to key executive level committees throughout 2023, including the Board Risk Committee, with actions assigned to monitor more closely their future manifestation and potential opportunities.
The emerging risk themes were also considered as part of the annual financial planning cycle. Geopolitical risks, and how these may generate second order impacts for the Group, have been a focus.
Many emerging and horizon risk topics are reviewed on a recurring basis, alongside ongoing activity addressing their impacts. However, it is acknowledged that the nature of the emerging risks will evolve and could drive future trends in the long term which the Group will need to prepare for.
The 2023 emerging risk landscape has been simplified, combining emerging and strategic risks into a single view (see below), enabling greater management concentration on developing the appropriate responses.
The Group will continue to monitor emerging and horizon risks, exploring how they may impact its future strategy, and how it can continue to best protect its customers, colleagues and shareholders.
For further information on the Board Risk Committee’s Chair Report, see pages 153 to 158. For further information on how the Group is managing key emerging risks through its strategy, see page 43.
| | | | | | | | |
Customer propositions and societal expectations Concerns for the Group and key considerations: The potential impacts of a failure to adapt our propositions to the continually evolving expectations and demographic of consumers, the evolution of and expectations relating to cybercrime, the threats posed by technology-enabled players and the risk of market disintermediation. | | Digital currencies and tokenisation Concerns for the Group and key considerations: Failure to keep pace with the potential expansion of decentralised financial systems, launch of private sector or government-backed digital currencies, growth of blockchain technologies and asset tokenisation and adoption of technologies which support the mainstream utilisation of blockchain technologies. |
| | |
Environmental, social and governance expectations Concerns for the Group and key considerations: Investor, shareholder and public perception of the Group’s; i) awareness of the ecological and environmental impacts associated with its operations and investments, ii) ability to offer sustainable financing options and services at pace, against a continuously evolving environmental and regulatory backdrop, and iii) role in supporting the UK to transition to a low carbon economy. | | Generative AI and ethical data practices Concerns for the Group and key considerations: Failure to keep pace with technological advancements relating to Generative AI and machine learning whilst balancing the competing requirements to; i) maximise customer opportunities through adoption, ii) maintain trust and confidence in customer data privacy, iii) protect our customers from fraud and economic crime, iv) ensure transparency on data ethics practices, v) adhere to evolving data protection regulations, and vi) prepare for potential business model disruptions caused by adoption of the technology |
| | |
Global macroeconomic and geopolitical environment Concerns for the Group and key considerations: Inability to navigate changing international regulations, including sanction and trade compliance, economic fragmentation, deglobalisation, and geopolitical events that may impact operations, customers and suppliers. | | Operational elasticity Concerns for the Group and key considerations: Failure to adequately prepare for the aggregate threat posed by cyber-attacks, disruption of service, third- or fourth-party supplier failure, technology outages or severe data loss. |
| | |
Strategic workforce vision Concerns for the Group and key considerations: Failure to evolve the structure and skill set of a dynamic workforce in line with the Group’s strategy, whilst maintaining pace with the industry and delivering strong customer outcomes. | | UK political and macroeconomic environment Concerns for the Group and key considerations: Failure to anticipate the longer-term impacts of a weak UK economy, quantitative tightening, change in government and the resulting policy and regulatory shifts (a bank levy, for example) and the potential consequences of the UK becoming less attractive to external investors. |
| | | | | | | | |
36 | Lloyds Banking Group plc Annual Report on Form 20-F 2023 | |
Operating and financial review and prospects continued
All narrative and quantitative tables are unaudited unless otherwise stated. The audited information is required to comply with the requirements of relevant International Financial Reporting Standards.
Risk management is at the heart of Helping Britain Prosper and creating a more sustainable and inclusive future for people and businesses.
Our mission is to protect our customers, shareholders, colleagues and the Group, while enabling sustainable growth. This is achieved through informed risk decisions and robust risk management, supported by a consistent risk-focused culture.
The risk overview (pages 31 to 36) provides a summary of risk management within the Group and the key focus areas for 2023, including maintaining support for customers. The risk overview also highlights the importance of the connectivity of principal, emerging and strategic risks and how they are embedded into the Group’s strategic risk management framework. This full risk management section provides a more in-depth picture of how risk is managed within the Group, detailing the Group’s emerging risks, approach to stress testing, risk governance, committee structure, appetite for risk and a full analysis of the principal risk categories (pages 44 to 93), the framework by which risks are identified, managed, mitigated and monitored. The Group’s approach to risk
The Group operates a prudent approach to risk with rigorous management controls to support sustainable business growth and minimise losses. Through a strong and independent risk function (Risk division), a robust control framework is maintained to identify and escalate current and emerging risks, support sustainable growth within the Group’s risk appetite, and to drive and inform good risk reward decision making.
To comply with UK specific ring-fencing requirements, core banking services are ring-fenced from other activities within the overall Group. The Group’s enterprise risk management framework (ERMF) and risk appetite apply across the Group. These are supplemented by sub-group specific risk management frameworks and risk appetites which operate within the Group parameters. The Group’s Corporate Governance Framework applies across Lloyds Banking Group plc, Lloyds Bank plc, Bank of Scotland plc and HBOS plc. It is tailored where needed to meet the entity-specific needs of Lloyds Bank plc and Bank of Scotland plc, within the Ring-Fenced Bank sub-group and supplementary corporate governance frameworks are in place to address the specific requirements of the other sub-groups (Non-Ring-Fenced Bank, Insurance and Equity Investments).
The Group’s ERMF is structured to align with the industry-accepted internal control framework standards.
The ERMF applies to every area of the business and covers all types of risk. It is reviewed, updated and approved by the Board to reflect any changes in the nature of the Group’s business and external regulations, law, corporate governance and industry good practice. The Group is in the process of conducting a more detailed review of the ERMF which will result in a reclassification of our principal risks in 2024.
The ERMF provides the Group with an effective mechanism for developing and embedding risk policies and risk management strategies which are aligned with the risks faced by its businesses. It also seeks to facilitate effective communication on these matters across the Group.
Role of the Board and senior management
Key responsibilities of the Board and senior management include:
•Approval of the ERMF and Board risk appetite
•Approval of Group-wide risk principles and policies
•The cascade of delegated authority (for example to Board sub-committees and the Group Chief Executive)
•Effective oversight of risk management consistent with risk appetite
Risk appetite
The Group’s approach to setting, governing, embedding and monitoring risk appetite is detailed in the risk appetite framework, a key component of the ERMF.
Risk appetite is defined within the Group as the amount and type of risk that the Group is prepared to seek, accept or tolerate in delivering its strategy.
Business planning aims to optimise value within the Group’s risk appetite parameters and deliver on its promise of Helping Britain Prosper.
The Group’s risk appetite statement details the risk parameters within which the Group operates. The statement forms part of the Group’s control framework and is embedded into its policies, authorities and limits, to guide decision making and risk management. Group risk appetite is regularly reviewed and refreshed to ensure appropriate coverage across our principal risks and any emerging risks, and to align with internal or external change.
The Board is responsible for approving the Group’s Board risk appetite statement annually. Group Board level metrics are augmented by further executive-level metrics and cascaded into more detailed business appetite metrics and limits.
The following areas are currently included in the Group Board risk appetite:
•Capital: the Group maintains capital levels commensurate with a prudent level of solvency to achieve financial resilience and market confidence
•Change and execution: the Group has limited appetite for negative impacts on customers, colleagues, or the Group as a result of change activity
•Climate: the Group takes action to support the Group and its customers’ transition to net zero, and maintain its resilience against the risks relating to climate change
•Conduct: the Group delivers good outcomes for its customers
•Credit: the Group has a conservative and well-balanced credit portfolio through the economic cycle in line with the Group’s target return on equity in aggregate. The Group’s approach focuses on origination quality and levers at Board level while dynamically adapting to the risk environment, business growth strategy, industry practices and regulatory expectations
•Data: the Group has zero appetite for data-related regulatory fines or enforcement actions
•Funding and liquidity: the Group maintains a prudent liquidity profile and a balance sheet structure that limits its reliance on potentially volatile sources of funding
•Insurance underwriting: the Group has an appetite to take on insurance underwriting risks where they fit with our strategic objectives
•Market: the Group has effective controls in place to identify and manage the market risk inherent in our customer and client-focused activities
•Model: material models perform in line with expectations
•Operational: the Group has robust controls in place to manage operational losses, reputational events and regulatory breaches. It identifies and assesses emerging risks and acts to mitigate these
•Operational resilience: the Group has limited appetite for disruption to services to customers and stakeholders from significant unexpected events
•People: the Group leads responsibly and proficiently, manages people resource effectively, supports and develops colleague skills and talent, creates and nurtures the right culture and meets legal and regulatory obligations related to its people
•Regulatory and legal: the Group interprets and complies with all relevant regulation and all applicable laws (including codes of conduct which could have legal implications) and/or legal obligations
| | | | | | | | |
37 | Lloyds Banking Group plc Annual Report on Form 20-F 2023 | |
Operating and financial review and prospects continued
Governance frameworks
The Group’s approach to risk is based on a robust control framework and a strong risk management culture which are the foundation for the delivery of effective risk management and guide the way all employees approach their work, behave and make decisions.
Governance is maintained through delegation of authority from the Board to individuals through the management hierarchy. Senior executives are supported where required by a committee-based structure which is designed to ensure open challenge and support effective decision making.
The Group’s risk appetite, principles, policies, procedures, controls and reporting are regularly reviewed and updated where needed to ensure they remain fully in line with regulation, law, corporate governance and industry good practice.
The interaction of the executive and non-executive governance structures relies upon a culture of transparency and openness that is encouraged by both the Board and senior management.
Board level engagement, coupled with the direct involvement of senior management in Group-wide risk issues at Group Executive Committee level, ensures that escalated issues are promptly addressed and remediation plans are initiated where required.
Line managers are directly accountable for identifying and managing risks in their individual businesses, ensuring that business decisions strike an appropriate balance between risk and reward and are consistent with the Group’s risk appetite.
Clear responsibilities and accountabilities for risk are defined across the Group through a three lines of defence model which ensures effective independent oversight and assurance in respect of key decisions.
The Risk Committee governance framework is outlined on page 40. Three lines of defence model
The ERMF is implemented through a ‘three lines of defence’ model which defines clear responsibilities and accountabilities and ensures effective independent oversight and assurance activities take place covering key decisions.
Business lines (first line) have primary responsibility for risk decisions, identifying, measuring, monitoring and controlling risks within their areas of accountability. They are required to establish effective governance and control frameworks for their business to be compliant with Group policy requirements, to maintain appropriate risk management skills, mechanisms and toolkits, and to act within Group risk appetite parameters set and approved by the Board.
Risk division (second line) is centralised, headed by the Chief Risk Officer, providing oversight and constructive challenge to the effectiveness of risk decisions taken by business management, providing proactive advice and guidance, reviewing, challenging and reporting on the risk profile of the Group and ensuring that mitigating actions are appropriate.
It also has a key role in promoting the implementation of a strategic approach to risk management reflecting the risk appetite and ERMF agreed by the Board that encompasses:
•Overseeing embedding of effective risk management processes
•Transparent, focused risk monitoring and reporting
•Provision of expert and high-quality advice and guidance to the Board, executives and management on strategic issues and horizon scanning, including pending regulatory changes
•A constructive dialogue with the first line through provision of advice, development of common methodologies, understanding, education, training, and development of new risk management tools
The primary role of Group Internal Audit (third line) is to help the Board and executive management protect the assets, reputation and sustainability of the Group. Group Internal Audit is led by the Group Chief Internal Auditor. Group Internal Audit provides independent assurance to the Audit Committee and the Board through performing reviews and engaging with committees and executive management, providing opinion, challenge and informal advice on risk and the state of the control environment. Group Internal Audit is a single independent internal audit function, reporting to the Group Audit Committee, and the Board or Board Audit Committees of the sub-groups, subsidiaries and legal entities where applicable.
Risk and control cycle from identification to reporting
To allow senior management to make informed risk decisions, the business follows a continuous risk management approach. This risk and control cycle, from identification to reporting, ensures that there is consistency in the approach to managing and mitigating risks impacting the Group.
The risk and control self-assessment (RCSA) process is used to identify, measure and manage operational risk across the Group. Risks, including emerging risks, are identified and measured on an inherent basis, using a consistent quantification methodology.
All key controls are recorded against material inherent risks, and assessed on a regular basis, in response to triggers or as a minimum annually. Where a control is not effective, the root cause is established and action plans implemented to improve control design or performance. The assessment of control effectiveness combined with a view of the inherent risk assessment is used to determine the residual risk that the Group is exposed to.
Risks are reviewed and independently challenged by the Risk division and then reported on a regular basis to management and the Board through the risk governance structure. Risk exposure is compared to overall risk appetite as well as specific limits or triggers. When thresholds are breached, committee minutes are clear on the actions and time frames required to address the risk and bring the exposure back within tolerance.
Risk identification is also conducted through the use of scenario analysis which considers the most material risks the Group faces and identifies and assesses extreme, but plausible instances which may occur.
Risk culture
The Group operates a prudent business model and a balanced approach to risk management. This provides a solid foundation to deliver good customer outcomes and drive forward the Group’s strategic transformation to ensure we continue Helping Britain Prosper. Guided by the Board, the senior management articulates and role models the core risk values to which the Group aspires. Senior management establishes a strong focus on building and sustaining long-term relationships with customers, through the economic cycle. The Group’s Code of Ethics and Responsibility, reinforce colleagues’ accountability for the risks they take, and supports better decision making to meet their customers’ needs.
| | | | | | | | |
38 | Lloyds Banking Group plc Annual Report on Form 20-F 2023 | |
Operating and financial review and prospects continued
Risk skills and capabilities
To support a strong risk culture across the Group, all colleagues complete risk training as part of their annual mandatory training. A library of risk management learning resources is available, which all colleagues who have specific risk management roles can access to build their skills and capabilities.
There is ongoing investment in risk systems and models alongside the Group’s investment in customer and product systems and processes. This drives improvements in risk data quality, aggregation and reporting leading to effective and efficient risk decisions.
Risk decision making and reporting
Risk analysis and reporting enables better understanding of risks and returns, supporting the identification of opportunities as well as better management of risks.
An aggregate view of the Group’s overall risk profile, key risks and management actions, and performance against risk appetite, including the Key Risk Insights Report and Consolidated Risk Report (CRR), is reported to and discussed monthly at the Group Risk Committee with regular reporting to the Board Risk Committee and the Board.
Financial reporting risk management systems and internal controls
The Group maintains risk management systems and internal controls relating to the financial reporting process which are designed to:
•Ensure that accounting policies are appropriately and consistently applied, transactions are recorded accurately, and undertaken in accordance with delegated authorities, that assets are safeguarded and liabilities are properly stated
•Enable the calculation, preparation and reporting of financial, prudential regulatory and tax outcomes in accordance with applicable International Financial Reporting Standards, statutory and regulatory requirements
•Enable certifications by the Senior Accounting Officer relating to maintenance of appropriate tax accounting and in accordance with the 2009 Finance Act
•Ensure that disclosures are made on a timely basis in accordance with statutory and regulatory requirements (for example, UK Finance Code for Financial Reporting Disclosure and the US Sarbanes-Oxley Act)
•Ensure ongoing monitoring to assess the impact of emerging regulation and legislation on financial, prudential regulatory and tax reporting
•Ensure an accurate view of the Group’s performance to allow the Board and senior management to appropriately manage the affairs and strategy of the business as a whole and each of its sub-groups
The Group has a Disclosure Committee which assists the Group Chief Executive and Chief Financial Officer in fulfilling their disclosure responsibilities under relevant listing and other regulatory and legal requirements. In addition, the Audit Committee reviews the quality and acceptability of the Group’s financial disclosures. For further information on the Audit Committee’s responsibilities relating to financial reporting see pages 149 to 152. Exposure to risk arising from the business activities of the Group
The table below provides a high level guide to how the Group’s business activities are reflected through its risk-weighted assets (RWAs), which are calculated in accordance with prudential capital requirements. There are a number of risks that are not captured in RWAs such as pension obligation risk and interest rate risk in the banking book, which instead fall within the scope of the Group's Pillar 2A capital requirements. Furthermore the risk relating to Insurance activities is not included in this table as Insurance is subject to a different set of prudential rules (Solvency 2 regime). Details of the business activities for each division are provided in the divisional results on pages 25 to 28. | | | | | | | | | | | | | | | | | |
At 31 December 2023 | Retail
£bn | Commercial
Banking
£bn | Insurance, Pensions and Investments1 £bn | Other2 £bn | Group
£bn |
| Risk-weighted assets (RWAs) | | | | | |
| Credit risk | 101.8 | | 56.2 | | 0.1 | | 12.7 | | 170.8 | |
Counterparty credit risk3 | – | | 5.8 | | – | | 0.9 | | 6.7 | |
| Market risk | – | | 4.2 | | – | | – | | 4.2 | |
| Operational risk | 17.5 | | 8.0 | | 0.1 | | 0.8 | | 26.4 | |
| Total (excluding threshold) | 119.3 | | 74.2 | | 0.2 | | 14.4 | | 208.1 | |
Threshold4 | – | | – | | – | | 11.0 | | 11.0 | |
| Total | 119.3 | | 74.2 | | 0.2 | | 25.4 | | 219.1 | |
1 As a separate regulated business, the Insurance business maintains its own solvency requirements, including appropriate management buffers, and reports directly to the Insurance Board. Insurance does not hold any RWAs as its assets are removed from the Group’s banking regulatory capital calculations. However, in accordance with banking capital rules part of the Group’s equity investment in Insurance is included in the calculation of threshold RWAs, while the remainder is taken as a deduction from common equity tier 1 (CET1) capital.
2 Other includes the risk-weighted assets of the Group’s equity investments businesses (including Lloyds Development Capital and Citra Living) and Group Corporate Treasury, in addition to other central amounts.
3 Exposures relating to the default fund of a central counterparty and credit valuation adjustment risk are included in counterparty credit risk.
4 Threshold RWAs reflect the proportion of significant investments and deferred tax assets that are permitted to be risk-weighted instead of deducted from CET1 capital. Significant investments primarily arise from the investment in the Group’s Insurance business.
| | | | | | | | |
39 | Lloyds Banking Group plc Annual Report on Form 20-F 2023 | |
Operating and financial review and prospects continued
Risk governance
The risk governance structure below is integral to effective risk management across the Group. To meet ring-fencing requirements the Boards and Board Committees of the Group and the Ring-Fenced Banks as well as relevant Committees of the Group and the Ring-Fenced Banks will sit concurrently and we refer to this as the Aligned Board Model. The Risk division is appropriately represented on key committees to ensure that risk management is discussed in these meetings. This structure outlines the flow and escalation of risk information and reporting from business areas and the Risk division to the Group Executive Committee and Board. Conversely, strategic direction and guidance is cascaded down from the Board and Group Executive Committee.
The Company Secretariat supports senior and Board level committees, and supports the Chairs in agenda planning. This gives a further line of escalation outside the three lines of defence.
| | | | | |
Group Chief Executive Committees •Group Executive Committee (GEC) •Group and Ring-Fenced Banks Risk Committees (GRC) •Group and Ring-Fenced Banks Asset and Liability Committees (GALCO) •Group and Ring-Fenced Banks Cost Management Committees •Group and Ring-Fenced Banks Contentious Regulatory Committees •Group and Ring-Fenced Banks Strategic Delivery Committees •Group and Ring-Fenced Banks Net Zero Committees •Group and Ring-Fenced Banks Conduct Investigations Committees | Risk Division Committees and Governance •Group Market Risk Committee •Group Economic Crime Prevention Committee •Group Financial Risk Committee •Group Capital Risk Committee •Group Model Governance Committee •Group Liquidity Risk Committee
|
Board, Executive and Risk Committees
The Group’s risk governance structure strengthens risk evaluation and management, while also positioning the Group to manage the changing regulatory environment in an efficient and effective manner.
Assisted by the Board Risk and Audit Committees, the Board approves the Group’s overall governance, risk and control frameworks and risk appetite. Refer to the corporate governance section on pages 125 to 160, for further information on Board Committees. The sub-group, divisional and functional risk committees review and recommend sub-group, divisional and functional risk appetite and monitor local risk profile and adherence to appetite.
| | | | | | | | |
40 | Lloyds Banking Group plc Annual Report on Form 20-F 2023 | |
Operating and financial review and prospects continued
Executive and Risk Committees
The Group Chief Executive is supported by the following:
| | | | | | | | |
| Committees | | Risk focus1 |
| Group Executive Committee (GEC) | | Assists the Group Chief Executive in exercising their authority in relation to material matters having strategic, cross-business unit, cross-function or Group-wide implications. |
| Group and Ring-Fenced Banks Risk Committees (GRC) | | Responsible for the development, implementation and effectiveness of the Group’s enterprise risk management framework, the clear articulation of the Group’s risk appetite and monitoring and reviewing of the Group’s aggregate risk exposures, control environment and concentrations of risk. |
| Group and Ring-Fenced Banks Asset and Liability Committees (GALCO) | | Responsible for the strategic direction of the Group’s assets and liabilities and the profit and loss implications of balance sheet management actions. The Committee reviews and determines the appropriate allocation of capital, funding and liquidity, and market risk resources and makes appropriate trade-offs between risk and reward. |
| Group and Ring-Fenced Banks Cost Management Committees | | Leads and shapes the Group’s approach to cost management, ensuring appropriate governance and process over Group-wide cost management activities and effective control of the Group’s cost base. |
| Group and Ring-Fenced Banks Contentious Regulatory Committees | | Responsible for providing senior management oversight, challenge and accountability in connection with the Group’s engagement with contentious regulatory matters as agreed by the Group Chief Executive. |
| Group and Ring-Fenced Banks Strategic Delivery Committees | | Responsible for driving execution of the Group’s investment portfolio and strategic transformation agenda as agreed by the Group Chief Executive, and monitoring execution performance and progress against strategic objectives. Act as a clearing house to resolve issues on individual project areas and prioritisation across the Group. Engage in resolution of challenges that require cross-Group support to resolve, ensuring funding and project performance provides value for money for the Group, and ensuring autonomy is maintained alongside accountability for projects and platforms. |
| Group and Ring-Fenced Banks Net Zero Committees | | Responsible for providing direction and oversight of the Group’s environmental sustainability strategy, including particular focus on the net zero transition and nature strategy. Oversight of the Group’s approach to meeting external environmental commitments and targets, including but not limited to, progress in relation to the requirements of the Net Zero Banking Alliance (NZBA). Recommend all external material commitments and targets in relation to environmental sustainability. |
| Group and Ring-Fenced Banks Conduct Investigations Committee | | Responsible for protecting and promoting the Group’s conduct, values and behaviours by taking action to rectify the most serious cases of misconduct within the Group, identifying themes and lessons to share with the business. The Committee shall do this by making outcome decisions and recommendations (including sanctions) on investigations which have been referred to the Committee from the triage process and overseeing regular reviews of thematic outcomes and lessons learned. |
| The Group Risk Committee is supported through escalation and ongoing reporting by divisional risk committees, cross-divisional unit committees addressing specific matters of Group-wide significance and the following second line of defence Risk committees which ensure effective oversight of risk management: |
| Group Market Risk Committee | | Responsible for monitoring, oversight and challenge of market risk exposures across the Group. Reviews and proposes changes to the market risk management framework, and reviews the adequacy of data quality needed for managing market risks. It is also responsible for escalating issues of Group-level significance to GEC level (usually via GALCO) relating to the management of the Group’s market risks, including those held in the Group’s insurance companies. |
| Group Economic Crime Prevention Committee | | Brings together accountable stakeholders and subject matter experts to ensure that the development and application of economic crime risk management complies with the Group’s strategic aims, Group corporate responsibility, Group risk appetite and Group economic crime prevention (fraud, anti-money laundering, anti-bribery and sanctions) policy. It provides direction and appropriate focus on priorities to enhance the Group’s economic crime risk management capabilities in line with business and customer objectives while aligning to the Group’s target operating model. |
| Group Financial Risk Committee | | Responsible for overseeing, reviewing, challenging and recommending, as required, to GEC/Board Risk Committee/Board for the Group and Ring-Fenced Bank (i) annual internal stress tests, (ii) all Prudential Regulation Authority (PRA) and any other regulatory stress tests, (iii) reverse stress tests, (iv) Internal Capital Adequacy Assessment Process (ICAAP), (v) Pillar 3, (vi) recovery/resolution plans, and (vii) relevant ad hoc stress tests or other analysis as and when required by the Committee. |
| Group Capital Risk Committee | | Responsible for providing oversight of relevant capital matters within the Group, Ring-Fenced Bank and material subsidiaries, including latest capital position and plans, capital risk appetite proposals, Pillar 2 developments (including stress testing), recovery and resolution matters and the impact of regulatory reforms and developments specific to capital. |
| Group Model Governance Committee | | Responsible for supporting the Model Risk and Validation Director in fulfilling their responsibilities, from a Group-wide perspective, under the Group model governance policy through provision of debate, challenge and support of decisions. The Committee will be held as required to facilitate approval of models, model changes and model-related items as required by model policy, including items related to the governance framework as a whole and its application. |
| Group Liquidity Risk Committee | | Responsible for providing monitoring, oversight, challenge, and approval for funding and liquidity risks across the Ring-Fenced Bank and Group. Reviews and proposes changes to the funding and liquidity risk management framework, including the ILAAP and internal liquidity stress testing. It is also responsible for escalating issues of Ring-Fenced Bank (RFB) and Group-level significance to GEC (usually via GALCO) relating to the management of the Group’s funding and liquidity risk. |
1 Reference to Group within the risk focus of each Committee relates to the Group and the Ring-Fenced Banks.
| | | | | | | | |
41 | Lloyds Banking Group plc Annual Report on Form 20-F 2023 | |
Operating and financial review and prospects continued
Stress testing
Overview
Stress testing is recognised as a key risk management tool by the Boards, senior management, the businesses and the Risk and Finance functions of all parts of the Group and its legal entities. It is fully embedded in the planning process of the Group and its key legal entities as a key activity in medium-term planning, and senior management is actively involved in stress testing activities via the governance process.
Scenario stress testing is used to support:
Risk identification:
•Understanding key vulnerabilities of the Group and its key legal entities under adverse economic conditions
Risk appetite:
•Assessing the results of the stress test against the risk appetite of all parts of the Group to ensure the Group and its legal entities are managed within their risk parameters
•Setting of risk appetite by assessing the underlying risks under stress conditions
Strategic and capital planning:
•Senior management and the Boards of the Group and its applicable legal entities to adjust strategies if the plan does not meet risk appetite in a stressed scenario
•The ICAAP, by demonstrating capital adequacy and meet the requirements of regulatory stress tests that are used to inform the setting of the PRA and management buffers (see capital risk on pages 45 to 52) of the Group and its separately regulated legal entities •The capital allocation process which feeds into business unit performance management
Risk mitigation:
•The development of potential actions and contingency plans to mitigate the impact of adverse scenarios. Stress testing also links directly to the recovery and resolution planning process of the Group and its legal entities
Regulatory stress tests
Following two years of COVID-19 pandemic crisis related stress testing, in 2022 the PRA returned to the annual cyclical scenario (ACS) stress test framework. The 2022 ACS included submissions for both the Group and RFB. The 2022 stress test objective was to assess the resilience of the UK banking system to deep simultaneous recessions in the UK and global economy, large falls in asset prices and higher global interest rates. The results were published in the third quarter of 2023; the Group passed the stress test and given the strong performance, the Group was not required to take any capital actions.
Internal stress tests
On at least an annual basis, the Group conducts macroeconomic stress tests to highlight and understand the key vulnerabilities of the Group’s and its legal entities’ business plans to adverse changes in the economic environment, and to ensure that there are adequate financial resources in the event of a downturn.
Reverse stress testing
Reverse stress testing is used to explore the vulnerabilities of the Group’s and its key legal entities’ strategies and plans for extreme adverse events that would cause the businesses to fail. Where this identifies plausible scenarios with an unacceptably high risk, the Group or its entities will adopt measures to prevent or mitigate that and reflect these in strategic plans.
Other stress testing activity
The Group’s stress testing programme also involves undertaking assessments of liquidity scenarios, market risk sensitivities and scenarios, and business-specific scenarios (see the principal risk categories on pages 45 to 93 for further information on risk-specific stress testing). If required, ad hoc stress testing exercises are also undertaken to assess emerging risks, as well as in response to regulatory requests. This wide-ranging programme provides a comprehensive view of the potential impacts arising from the risks to which the Group is exposed and reflects the nature, scale and complexity of the Group. The Group is currently participating in the Bank of England’s System-wide exploratory scenario (SWES), which aims to improve understanding of the behaviours of banks and non-bank financial institutions during stressed financial market conditions. Results of this exercise will be published in late 2024. Methodology
The stress tests process must comply with all regulatory requirements, which is achieved through comprehensive macroeconomic scenarios and a rigorous divisional, functional, risk and executive review and challenge process, supported by analysis and insight into impacts on customers and business drivers.
All relevant business, Risk and Finance teams are involved in the delivery of analysis, and ensure the sensitivity of the business plan to each risk is well understood. The methodologies and modelling approach used for stress testing embed direct links between the macroeconomic scenarios and the drivers for each business area to give appropriate stress sensitivities. All material assumptions used in modelling are documented and justified, with a clearly communicated review and sign-off process. Modelling is supported by expert judgement and is subject to the Group model governance policy.
Governance
Clear accountabilities and responsibilities for stress testing are assigned to senior management and the Risk and Finance functions throughout the Group and its key legal entities. This is formalised through the Group business planning and stress testing policy and procedure, which are reviewed at least annually.
The GFRC, chaired by the Chief Risk Officer and attended by the Chief Financial Officer and other senior Risk and Finance colleagues, has primary responsibility for overseeing the development and execution of the Group’s and Ring-Fenced Bank’s stress tests. The Lloyds Bank Corporate Markets plc (LBCM) Risk Committee performs a similar function within the scope of LBCM.
The review and challenge of the Group’s and Ring-Fenced Bank’s detailed stress forecasts, the key assumptions behind these, and the methodology used to translate the economic assumptions into stressed outputs conclude with the appropriate Finance and Risk sign-off. The outputs are then presented to the GFRC and the Board Risk Committee for review and challenge. With all regulatory exercises being approved by the Board. There is a similar process within the LBCM for the governance of the LBCM-specific results.
| | | | | | | | |
42 | Lloyds Banking Group plc Annual Report on Form 20-F 2023 | |
Operating and financial review and prospects continued
Emerging risks
Background and framework
Understanding emerging risks is an essential component of the Group’s risk management approach. It enables the Group to identify the most pertinent risks and opportunities, and to proactively respond through strategic planning and appropriate risk mitigation.
Whilst emerging risk is not a principal risk, if left undetected emerging risks have the potential to adversely impact the Group or result in missed opportunities.
Impacts from emerging risks on the Group’s principal risks can materialise in two ways:
•Emerging risks can impact the Group’s principal risks directly in the absence of an appropriate strategic response
•Emerging risks can be a source of new risks, dependent on our chosen response and the underlying assumptions on how given emerging risks may manifest
Where an emerging risk is considered material enough in its own right, the Group may choose to recognise the risk as a principal risk, with a recent example being climate risk. Such elevations are considered and approved through the Board Risk Committee as part of the annual refresh of the enterprise risk management framework.
Risk identification
The basis for risk identification is underpinned by our horizon scanning approach, supported by collaboration between functions across the Group. The Group works closely with regulatory authorities and industry bodies to ensure that the Group can monitor external developments and identify and respond to the evolving landscape, particularly in relation to regulatory and legal risk. In addition, the Group engages with external experts to gain external insight and context. This activity complements and builds upon the annual strategic planning cycle and is used to identify key external trends, risks and opportunities for the Group.
The Group continues to evolve its approach for the identification and prioritisation of emerging risks. During 2023, the Group continued to evolve its emerging risk methodology, refining and enhancing the process, placing greater focus on existing controls, to reflect the Group’s position in its strategic transformation journey and the level of planned investment outlined in the Group’s business plans.
The emerging risk methodology is centred around several key factors:
•The threat presented by a risk
•The Group’s specific vulnerability to the risk
•The preparation and protection the Group has in place to manage or mitigate impacts
•The existing control environment and planned investment (new for 2023)
Our evolved approach has further streamlined the list of emerging risk themes from 10 to eight, enabling greater management concentration on developing the appropriate responses.
The emerging risk themes detailed in the risk overview section on page 36, align to the current primary risks the Group is managing and many of which (for example, operational elasticity and political and macroeconomic environment) are continuous areas of focus. The nature of emerging risks is expected to evolve and may require different ways to mitigate from the measures used today. The risks also correlate, for example customer propositions and societal expectations will be influenced by the UK political and macroeconomic environment. Risk mitigation and monitoring
Emerging risks are currently managed through the Group’s strategic risk framework, detailed on page 93. Emerging risk themes have been discussed at executive-level committees throughout 2023, with key actions assigned to closely monitor their manifestation and potential opportunities, and in some cases, also forming part of the business planning process. Deep dives on selected emerging risk themes are also planned for 2024.
As part of the 2023 analysis, it has been identified that there is significant overlap with the previous strategic risk themes (climate change, customer proposition, organisational purpose, talent attraction and retention, and technology advances) and the emerging risk themes. This further supports our recommendation to merge these into a combined category of horizon and emerging risks from 2024 onwards. The graphic below indicates the mapping of the strategic risk themes to the emerging risk themes.
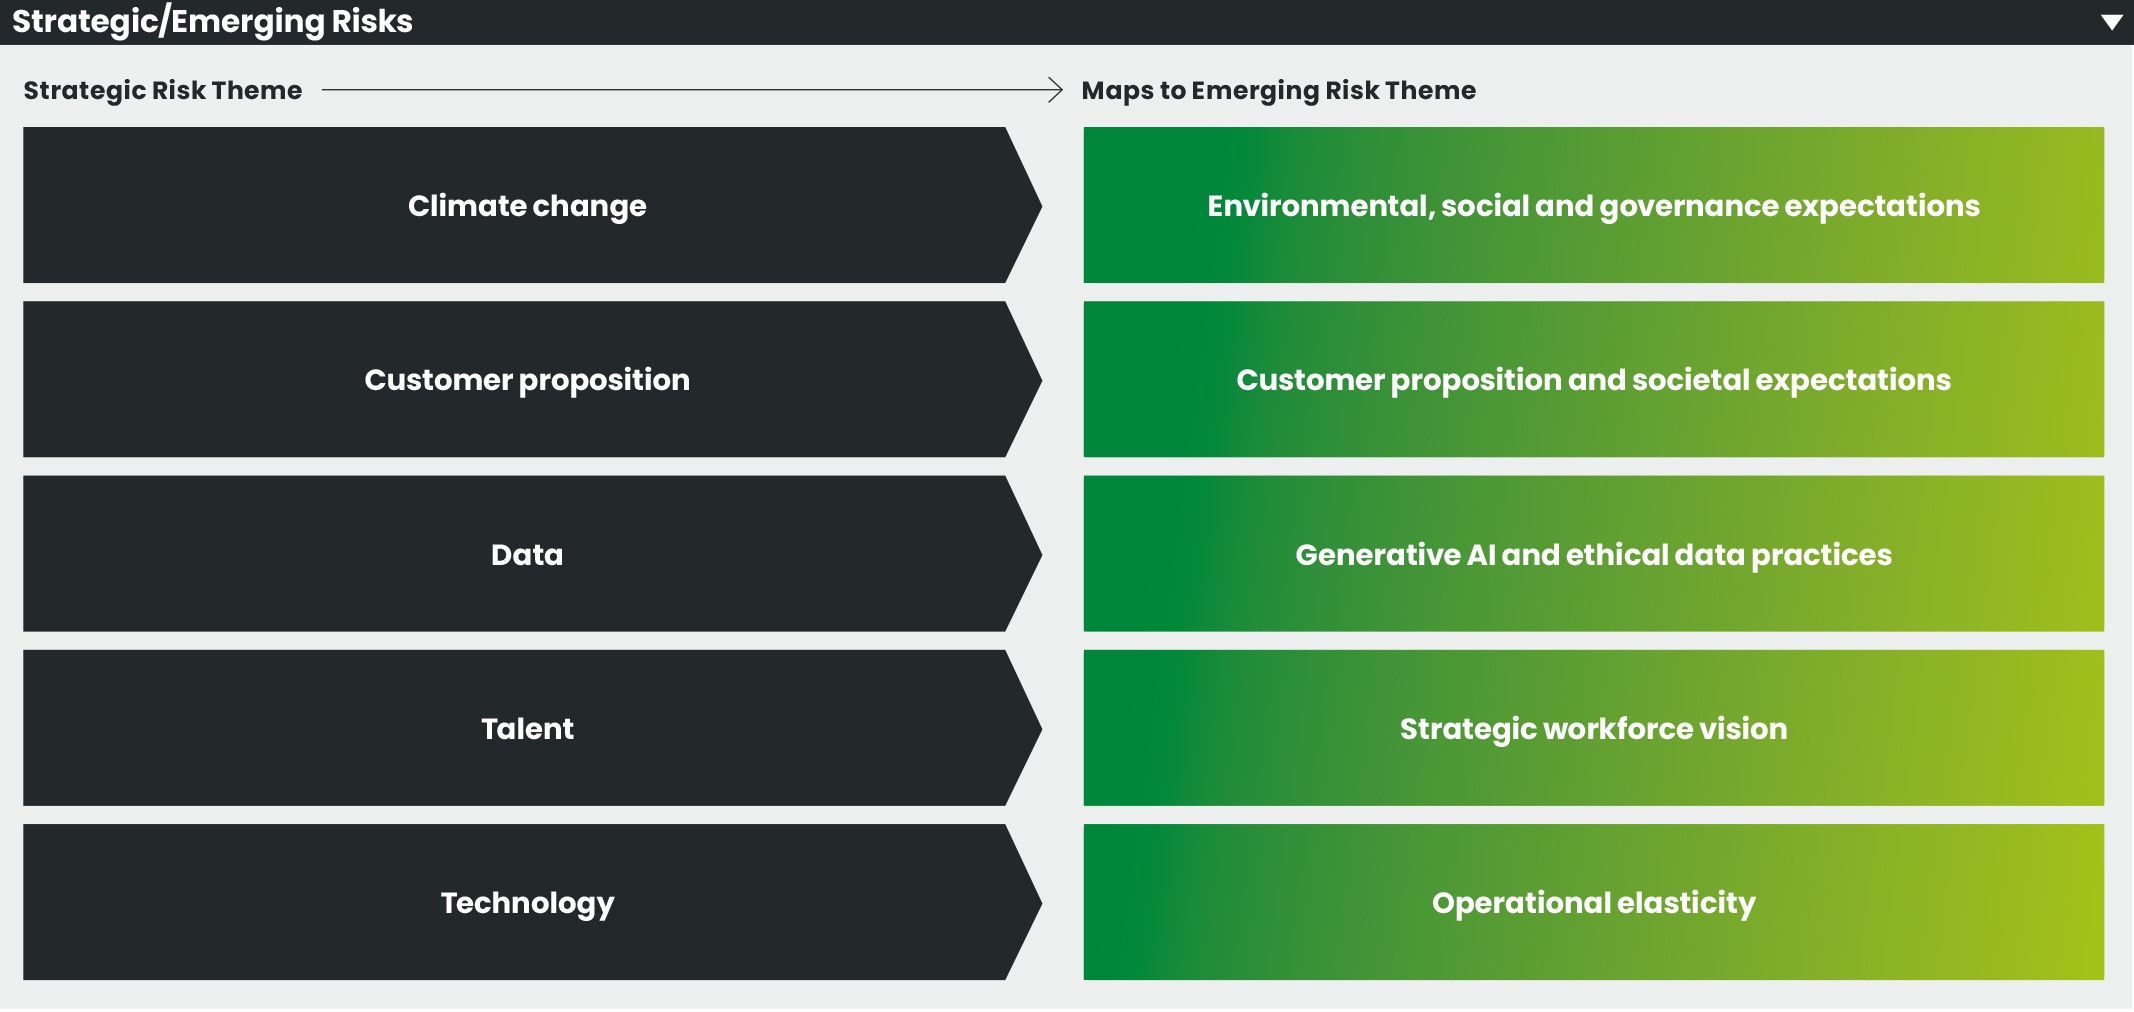
| | | | | | | | |
43 | Lloyds Banking Group plc Annual Report on Form 20-F 2023 | |
Operating and financial review and prospects continued
Full analysis of risk categories
The Group’s risk framework covers all types of risk which affect the Group and could impact on the achievement of its strategic objectives. A detailed description of each category is provided on pages 45 to 93. Risk categories recognised by the Group are periodically reviewed to ensure that they reflect the Group risk profile in light of internal and external factors, such as the Group strategy and the regulatory environment in which it operates. No changes were made to the risk categories in 2023.
| | | | | | | | | | | | | | | | | |
| Risk categories | | | 6 | |
| Principal risk categories | Secondary risk categories | | | |
| Capital risk | – Capital | | | |
| | | | | |
| Change and execution risk | – Change and execution |
| | |
| | | | | |
| Climate risk | – Climate | | | |
| | | | | |
| Conduct risk | – Conduct | | | |
| | | | | |
| Credit risk | – Retail credit | – Commercial credit | | |
| | | | | |
| Data risk | – Data | | | |
| | | | | |
| Funding and liquidity risk | – Funding and liquidity | | | |
| | | | | |
| Insurance underwriting risk | – Insurance underwriting | | | |
| | | | | |
| Market risk | – Trading book | – Pensions | | |
| | – Banking book | – Insurance | | |
| Model risk | – Model | | | |
| | | | | |
| Operational risk | – Business process | – Financial reporting | – Security | |
| | – Economic crime financial | – Governance | – Sourcing and supply chain management | |
| | – Economic crime fraud | – Internal service provision | | |
| | – External service provision | – IT systems | | |
| Operational resilience risk | – Operational resilience | | | |
| | | | | |
| People risk | – People | – Health and safety | | |
| | | | | |
| Regulatory and legal risk | – Regulatory compliance | – Legal | | |
| | | | | |
| Strategic risk | – Strategic | | | |
| | | | | |
The Group considers both reputational and financial impact in the course of managing all its risks and therefore does not classify reputational impact as a separate risk category. | | | | | | | | |
44 | Lloyds Banking Group plc Annual Report on Form 20-F 2023 | |
Operating and financial review and prospects continued
Capital risk
Definition
Capital risk is defined as the risk that an insufficient quantity or quality of capital is held to meet regulatory requirements or to support business strategy, an inefficient level of capital is held or that capital is inefficiently deployed across the Group.
Exposures
A capital risk event arises when the Group has insufficient capital resources to support its strategic objectives and plans, and to meet both regulatory and external stakeholder requirements and expectations. This could arise due to a depletion of the Group’s capital resources as a result of the crystallisation of any of the risks to which it is exposed, or through a significant increase in risk-weighted assets as a result of rule changes or economic deterioration. Alternatively a shortage of capital could arise from an increase in the minimum requirements for capital, leverage or MREL either at Group, Ring-Fenced Bank (RFB) sub-group or regulated entity level. The Group’s capital management approach is focused on maintaining sufficient and appropriate capital resources across all regulated levels of its structure in order to prevent such exposures while optimising value for shareholders.
Measurement
The Group maintains capital levels across all regulated entities commensurate with a prudent level of solvency to achieve financial resilience and market confidence. To support this, capital risk appetite is calibrated by taking into consideration both an internal view of the amount of capital to hold as well as external regulatory requirements.
The Group assesses both its regulatory capital requirements and the quantity and quality of capital resources it holds to meet those requirements in accordance with the relevant provisions of the Capital Requirements Directive (CRD V) and Capital Requirements Regulation (UK CRR). This is supplemented through additional regulation set out under the PRA Rulebook and through associated statements of policy, supervisory statements and other regulatory guidance.
Further details of the regulatory capital and leverage frameworks to which the Group is subject, including the means by which its capital and leverage requirements and capital resources are calculated, are provided in the Group’s Pillar 3 disclosures.
The minimum amount of total capital, under Pillar 1 of the regulatory capital framework, is set at 8 per cent of total risk-weighted assets. At least 4.5 per cent of risk-weighted assets are required to be met with common equity tier 1 (CET1) capital and at least 6 per cent of risk-weighted assets are required to be met with tier 1 capital. Minimum Pillar 1 requirements are supplemented by both additional minimum requirements under Pillar 2A of the regulatory capital framework, the aggregate of which is referred to as the Group’s Total Capital Requirement (TCR), and by a number of regulatory capital buffers as described below.
Additional minimum capital requirements under Pillar 2A are set by the PRA as a firm-specific Individual Capital Requirement (ICR) reflecting a point in time estimate, which may change over time, of the minimum amount of capital to cover risks that are not fully covered by Pillar 1, such as credit concentration and operational risk, and those risks not covered at all by Pillar 1, such as pension obligation risk and interest rate risk in the banking book (IRRBB). This is set as a variable amount for Pillar 2A (being a set percentage of risk-weighted assets), with fixed add-ons for certain risk types. The Group’s Pillar 2A capital requirement is currently the equivalent of around 2.6 per cent of risk-weighted assets, of which the minimum amount to be met by CET1 capital is the equivalent of around 1.5 per cent of risk-weighted assets.
The Group is also required to hold a number of regulatory capital buffers which must be met with CET1 capital.
Systemic buffers are designed to hold systemically important banks to higher capital standards, so that they can withstand a greater level of stress before requiring resolution.
•The Group is not currently classified as a global systemically important institution (G-SII) but has been classified as an ‘other’ systemically important institution (O-SII) by the PRA
•The O-SII buffer applies to the Group’s RFB sub-group and is currently set at 2.0 per cent of the RFB sub-group’s risk-weighted assets. The FPC amended the O-SII buffer framework in 2022, changing the metric for determining the buffer rate from total assets to the UK leverage exposure measure. The first review point under the revised framework occurred during December 2023 (based upon the RFB sub-group’s UK leverage exposure measure as at 31 December 2022) which resulted in no change to the current buffer. This currently equates to 1.7 per cent of risk-weighted assets at Group level, with the difference reflecting the risk-weighted assets of the Group that are not in the RFB sub-group and for which the O-SII buffer does not therefore apply. It is the PRA’s policy to include this in the Group’s PRA Buffer.
The capital conservation buffer (CCB) is a standard buffer of 2.5 per cent of risk-weighted assets designed to provide for losses in the event of stress.
The countercyclical capital buffer (CCyB) is time-varying and is designed to require banks to hold additional capital to remove or reduce the build-up of systemic risk in times of credit boom, providing additional loss-absorbing capacity and acting as an incentive for banks to constrain further credit growth. The amount of the buffer is determined by reference to buffer rates published by the FPC for the individual countries where the Group has relevant credit exposures. The FPC also sets the UK CCyB rate which is currently set at 2 per cent, following a 1 per cent increase in July 2023. The FPC judges that the neutral rate for the UK CCyB is around 2 per cent.
Given the Group’s UK-focused business model, the Group’s CCyB at 31 December 2023 was 1.8 per cent of risk-weighted assets.
As part of the Group’s capital planning process, forecast capital positions are subjected to stress testing to determine the adequacy of the Group’s capital resources against minimum requirements, including the Pillar 2A requirement. The PRA considers outputs from both the Group’s internal stress tests and Bank of England (BoE) stress tests, in conjunction with other information, as part of the process for informing the setting of a bank-specific capital buffer for the Group, known as the PRA Buffer. The PRA requires this buffer to remain confidential.
Under recent Bank of England stress tests, the BoE has taken action to avoid an unwarranted de facto increase in capital requirements that could result from the interaction of IFRS 9. The stress hurdle rates for banks participating in the 2022/23 annual cyclical scenario (ACS) stress test exercise were adjusted to recognise the additional resilience provided by the earlier provisions taken under IFRS 9. The BoE is continuing to work towards a more enduring treatment of IFRS 9 for the purposes of future stress tests.
All buffers are required to be met with CET1 capital. Usage of the PRA Buffer would trigger a dialogue between the Group and the PRA to agree what action is required whereas a breach of the combined buffer (all other regulatory buffers, as referenced above) would give rise to mandatory restrictions upon any discretionary capital distributions. The PRA has previously communicated its expectation that banks’ capital and liquidity buffers can be drawn down as necessary to support the real economy through a shock and that sufficient time would be made available to restore buffers in a gradual manner.
In addition to the risk-based capital framework outlined above, the Group is also subject to minimum capital requirements under the UK Leverage Ratio Framework. The leverage ratio is calculated by dividing tier 1 capital resources by the leverage exposure which is a defined measure of on-balance sheet assets and off-balance sheet items.
| | | | | | | | |
45 | Lloyds Banking Group plc Annual Report on Form 20-F 2023 | |
Operating and financial review and prospects continued
The minimum tier 1 leverage ratio requirement under the UK Leverage Ratio Framework is 3.25 per cent. This is supplemented by a time-varying countercyclical leverage buffer (CCLB) requirement which is determined by multiplying the Group’s CCyB rate by 35 per cent. As at 31 December 2023 the CCLB for the Group was 0.6 per cent. An additional leverage ratio buffer (ALRB) requirement of 0.7 per cent applies to the RFB sub-group and is determined by multiplying the RFB sub-group O-SII buffer by 35 per cent. At Group level an equivalent buffer of 0.6 per cent applies.
At least 75 per cent of the 3.25 per cent minimum leverage ratio requirement as well as 100 per cent of regulatory leverage buffers must be met by CET1 capital.
The leverage ratio framework does not currently give rise to higher regulatory capital requirements for the Group than the risk-based capital framework.
Mitigation
The Group has a capital management framework that includes the setting of capital risk appetite and capital planning and stress testing activities. Close monitoring of capital, leverage and MREL ratios is undertaken to ensure the Group meets regulatory requirements and risk appetite levels and deploys its capital resources efficiently.
The Group regularly refreshes and monitors its suite of early warning indicators and maintains a Capital Contingency Framework as part of a Recovery Plan, which is designed to identify and escalate emerging capital concerns at an early stage, so that mitigating actions can be taken, if needed. For example, the Group is able to accumulate additional capital through the retention of profits over time, which can be enhanced through reducing or cancelling proposed dividend payments and share buybacks, by raising new equity via, for example, a rights issue or debt exchange and by raising additional tier 1 or tier 2 capital securities. The cost and availability of additional capital are dependent upon market conditions and perceptions at the time.
The Group is also able to manage the demand for capital through management actions including adjusting its lending strategy, business disposals and through the efficient use of securitisations and other optimisation activity.
Capital policies and procedures are well established and subject to independent oversight.
Monitoring
The Group’s capital is actively managed and monitoring capital ratios is a key factor in the Group’s planning processes, which separately cover the RFB sub-group and key individual banking entities. Multi-year base case forecasts of the Group’s capital position, based upon the Group’s operating plan, are produced at least annually to inform the Group’s capital plan whilst shorter- term forecasts are more frequently undertaken to understand and respond to variations of the Group’s actual performance against the plan. The Group’s capital plan is tested for capital adequacy using relevant stress scenarios and sensitivities covering adverse economic conditions as well as other adverse factors that could impact the Group.
Regular monitoring of the capital position is undertaken by a range of committees, including Group Capital Risk Committee (GCRC), Group Financial Risk Committee (GFRC), Group and Ring-Fenced Banks Asset and Liability Committees (GALCO), Group and Ring-Fenced Banks Risk Committees (GRC), Board Risk Committee (BRC) and the Board. This includes reporting of actual ratios against forecasts and risk appetite, base case and stress scenario projected ratios, and review of early warning indicators and assessment against the Capital Contingency Framework.
The regulatory capital framework within which the Group operates continues to evolve and further detail on this is provided in the Group’s Pillar 3 disclosures. The Group continues to monitor prudential developments very closely, analysing the potential capital impacts to ensure that, through organic capital generation and management actions, the Group continues to maintain a strong capital position that exceeds both minimum regulatory requirements and the Group’s risk appetite and is consistent with market expectations.
Target capital ratios
The Board’s revised view of the ongoing level of CET1 capital required by the Group to grow the business, meet current and future regulatory requirements and cover economic and business uncertainties is 13.0 per cent which includes a management buffer of around 1 per cent.
This takes into account, amongst other considerations:
•The minimum Pillar 1 CET1 capital requirement of 4.5 per cent of risk-weighted assets
•The Group’s Pillar 2A capital requirement, set by the PRA, of which the minimum amount to be met with CET1 capital is the equivalent of around 1.5 per cent of risk-weighted assets
•The Group’s current CCyB requirement which is 1.8 per cent of risk-weighted assets
•The CCB requirement of 2.5 per cent of risk-weighted assets
•The RFB sub-group’s O-SII buffer of 2.0 per cent of risk-weighted assets, which equates to 1.7 per cent of risk-weighted assets at Group level
•The Group’s PRA Buffer
•The likely performance of the Group in various potential stress scenarios and ensuring capital remains resilient in these
•The economic outlook for the UK and business outlook for the Group
•The desire to maintain a progressive and sustainable ordinary dividend policy in the context of year-on-year earnings movements
Capital returns
The Group has in place a progressive and sustainable ordinary dividend policy which allows for flexibility to return surplus capital to shareholders through share buybacks or special dividends.
Surplus capital represents capital over and above the amount management wish to retain to grow the business, meet current and future regulatory requirements and cover uncertainties. The amount of required capital may vary from time to time depending on circumstances and by its nature there can be no guarantee that any return of surplus capital will be made.
Given the Group’s financial performance and capital position at the year end, the Board has recommended a final ordinary dividend of 1.84 pence per share. This is in addition to the interim ordinary dividend of 0.92 pence per share that was announced as part of the 2023 half year results and paid in September 2023. The total ordinary dividend for the year is therefore 2.76 pence per share. The Group also intends to implement a share buyback programme of up to £2.0 billion which will commence as soon as is practicable and is expected to be completed by 31 December 2024.
The Board remains committed to future capital returns. Going forward, the Board intends to maintain its progressive and sustainable ordinary dividend policy alongside further returns of surplus capital at the end of the year as appropriate. The Board will continue to give due consideration at year end to the size of the final dividend payment and to the return of any surplus capital based upon the circumstances at the time.
The ability of the Group to pay a dividend is also subject to constraints including the availability of distributable reserves, legal and regulatory restrictions and the Group’s financial and operating performance.
| | | | | | | | |
46 | Lloyds Banking Group plc Annual Report on Form 20-F 2023 | |
Operating and financial review and prospects continued
Distributable reserves are determined as required by the Companies Act 2006 by reference to a company’s individual financial statements. At 31 December 2023 Lloyds Banking Group plc (‘the Company’) had accumulated distributable reserves of approximately £12 billion. Substantially all of the Company’s merger reserve is available for distribution under UK company law as a result of transactions undertaken to recapitalise the Company in 2009.
Lloyds Banking Group plc acts as a holding company which also issues capital and other securities to capitalise and fund the activities of the Group. The profitability of the holding company, and its ability to sustain dividend payments, is therefore dependent upon the continued receipt of dividends and interest from its main operating subsidiaries, including Lloyds Bank plc (the Ring-Fenced Bank), Lloyds Bank Corporate Markets plc, LBG Equity Investments Limited and Scottish Widows Group Limited (the Insurance business). The principal operating subsidiary is Lloyds Bank plc which, at 31 December 2023, had a consolidated CET1 capital ratio that exceeded minimum regulatory requirements and internal risk appetite levels. A number of Group subsidiaries, principally those with banking and insurance activities, are subject to regulatory capital requirements which require minimum amounts of capital to be maintained relative to their size and risk. The Group actively manages the capital of its subsidiaries, which includes monitoring the regulatory capital ratios for its banking and insurance subsidiaries and, on a consolidated basis, the RFB sub-group against approved risk appetite levels. The Group operates a formal capital management policy which requires all subsidiary entities, subject to agreement by their governing bodies, to remit surplus capital to their parent companies.
Minimum requirement for own funds and eligible liabilities (MREL)
Global systemically important banks (G-SIBs) are subject to an international standard on total loss absorbing capacity (TLAC). The standard is designed to enhance the resilience of the global financial system by ensuring that failing G-SIBs have sufficient capital to absorb losses and recapitalise under resolution, whilst continuing to provide critical banking services.
In the UK, the Bank of England has implemented the requirements of the international TLAC standard through the establishment of a framework which sets out MREL. The purpose of MREL is to require firms to maintain sufficient own funds and eligible liabilities that are capable of credibly bearing losses or recapitalising a bank whilst in resolution. MREL can be satisfied by a combination of regulatory capital and certain unsecured liabilities (which must be subordinate to a firm’s operating liabilities).
Although the Group is not classified as a G-SIB it is subject to the Bank of England’s MREL framework, including the statement of policy on MREL (the ‘MREL SoP’) which requires the Group to maintain a minimum level of MREL resources.
Under the requirements of the framework, the Group operates a single point of entry (SPE) resolution strategy, with Lloyds Banking Group plc as the designated resolution entity.
Applying the MREL SoP to minimum capital requirements at 31 December 2023, the Group’s MREL, excluding regulatory capital and leverage buffers, is the higher of 2 times Pillar 1 plus 2 times Pillar 2A, equivalent to 21.3 per cent of risk-weighted assets, or 6.5 per cent of the UK leverage ratio exposure measure.
In addition, CET1 capital cannot be used to meet both MREL and capital or leverage buffers.
Internal minimum requirements for own funds and eligible liabilities (Internal MREL) also apply to the Group’s material sub-groups and entities, including the RFB sub-group, Lloyds Bank plc, Bank of Scotland plc and Lloyds Bank Corporate Markets plc.
Analysis of CET1 capital position
The Group’s CET1 capital ratio reduced from 15.1 per cent at 31 December 2022 to 14.6 per cent at 31 December 2023.
This excludes the Insurance dividend received in February 2024 and the full impact of the announced ordinary share buyback programme which will be accrued for through the Group’s actual capital position during the first quarter of 2024.
Including these impacts the Group’s CET1 capital ratio reduced to 13.7 per cent on an adjusted basis at 31 December 2023 (31 December 2022: 14.1 per cent on an adjusted basis). Capital generation before regulatory headwinds during the year was 223 basis points, reflecting strong banking build, the £250 million dividend received from the Insurance business and other movements. These impacts were partially offset by risk-weighted asset increases (before CRD IV model updates within Retail secured and net of optimisation) and the full year payment (£800 million) of fixed pension deficit contributions made to the Group’s three main defined benefit pension schemes. Regulatory headwinds of 50 basis points largely reflect a £5 billion risk-weighted assets adjustment for part of the impact of Retail secured CRD IV model updates. They also reflect the end of IFRS 9 static transitional relief and the reduction in the transitional factor applied to IFRS 9 dynamic relief. Capital generation after the impact of these regulatory headwinds was 173 basis points. This benefited by just under 30 basis points from an impairment credit driven by a significant write-back in the fourth quarter which was materially offset by around 15 basis points in relation to the £450 million charge arising from the potential impact of the FCA review of historical motor finance commission arrangements.
The impact of the interim ordinary dividend paid in September 2023 and the accrual for the recommended final ordinary dividend equated to 86 basis points, with a further 98 basis points utilised to cover the accrual for the announced ordinary share buyback programme and 9 basis points for variable pension contributions reflecting the payment to address the £250 million residual aggregate deficit in the fourth quarter. The acquisition of Tusker utilised 21 basis points of capital.
On 1 January 2024, the transitional factor applied to IFRS 9 dynamic relief reduced by a further 25 per cent, resulting in a reduction of 4 basis points. The Group’s CET1 capital ratio on an adjusted basis at 31 December 2023 does not include the impact of the reduced relief.
Total capital requirement
The Group’s total capital requirement (TCR) as at 31 December 2023, being the aggregate of the Group’s Pillar 1 and current Pillar 2A capital requirements, was £23,322 million (31 December 2022: £22,550 million).
Capital and MREL resources
An analysis of the Group’s capital position and MREL resources as at 31 December 2023 is presented in the following section. This reflects the application of the transitional arrangements for IFRS 9.
| | | | | | | | |
47 | Lloyds Banking Group plc Annual Report on Form 20-F 2023 | |
Operating and financial review and prospects continued
Capital resources (audited) and MREL resources (unaudited)
The table below summarises the consolidated capital position and MREL resources of the Group. The Group’s Pillar 3 disclosures provide a comprehensive analysis of the own funds of the Group.
| | | | | | | | |
| At 31 Dec 2023 £m | At 31 Dec 2022 £m |
| Common equity tier 1 | | |
Shareholders’ equity per balance sheet1 | 40,224 | | 38,370 | |
| Adjustment to retained earnings for foreseeable dividends | (1,169) | | (1,062) | |
Deconsolidation adjustments1 | 6,954 | | 6,668 | |
| | |
| Cash flow hedging reserve | 3,766 | | 5,476 | |
Other adjustments | (54) | | (80) | |
| 49,721 | | 49,372 | |
| less: deductions from common equity tier 1 | | |
| Goodwill and other intangible assets | (5,731) | | (4,982) | |
| Prudent valuation adjustment | (417) | | (434) | |
| | |
| Removal of defined benefit pension surplus | (2,653) | | (2,803) | |
| | |
Significant investments1 | (4,975) | | (4,843) | |
| Deferred tax assets | (4,048) | | (4,445) | |
| Common equity tier 1 capital | 31,897 | | 31,865 | |
| Additional tier 1 | | |
| Other equity instruments | 6,915 | | 5,271 | |
Preference shares and preferred securities2 | 466 | | 470 | |
| Regulatory adjustments | (466) | | (470) | |
| 6,915 | | 5,271 | |
| less: deductions from tier 1 | | |
Significant investments1 | (1,100) | | (1,100) | |
| Total tier 1 capital | 37,712 | | 36,036 | |
| Tier 2 | | |
Other subordinated liabilities2 | 9,787 | | 10,260 | |
Deconsolidation of instruments issued by insurance entities1 | (582) | | (1,430) | |
Regulatory adjustments | (2,514) | | (2,323) | |
| 6,691 | | 6,507 | |
| less: deductions from tier 2 | | |
Significant investments1 | (964) | | (963) | |
Total capital resources | 43,439 | | 41,580 | |
| | |
Ineligible AT1 and tier 2 instruments3 | (139) | | (181) | |
| Amortised portion of eligible tier 2 instruments issued by Lloyds Banking Group plc | 1,113 | | 1,346 | |
Other eligible liabilities issued by Lloyds Banking Group plc4 | 25,492 | | 24,085 | |
Total MREL resources (unaudited) | 69,905 | | 66,830 | |
| | | |
Risk-weighted assets (unaudited) | 219,130 | | 210,859 | |
| | | |
Common equity tier 1 capital ratio (unaudited) | 14.6% | 15.1% |
Tier 1 capital ratio (unaudited) | 17.2% | 17.1% |
Total capital ratio (unaudited) | 19.8% | 19.7% |
MREL ratio (unaudited) | 31.9% | 31.7% |
1 2022 comparatives have been restated to reflect the impact of IFRS 17. The CET1 deconsolidation adjustments applied to shareholders’ equity increased by £3.6 billion to reflect the full offset of the impact of IFRS 17 on the Group’s opening shareholders’ equity position per the Group’s consolidated balance sheet. For regulatory capital purposes, the Group’s Insurance business is deconsolidated and replaced by the amount of the Group’s investment in the business. A part of this amount is deducted from capital (via ‘significant investments’ in the table above) and the remaining amount is risk-weighted, forming part of threshold risk-weighted assets.
2 Preference shares, preferred securities and other subordinated liabilities are reported as subordinated liabilities in the balance sheet.
3 Instruments with less than or equal to one year to maturity or instruments not issued out of the holding company.
4 Includes senior unsecured debt.
| | | | | | | | |
48 | Lloyds Banking Group plc Annual Report on Form 20-F 2023 | |
Operating and financial review and prospects continued
Movements in CET1 capital resources
The key movements are set out in the table below.
| | | | | |
| Common
equity
tier 1
£m |
| At 31 December 2022 | 31,865 | |
Banking business profits1 | 5,417 | |
Movement in foreseeable dividend accrual2 | (109) | |
Dividends paid out on ordinary shares during the year | (1,651) | |
Share buyback reflected through retained profits | (1,993) | |
| |
Dividends received from the Insurance business3 | 100 | |
| IFRS 9 transitional adjustment to retained earnings | (268) | |
| Pension deficit contributions | (768) | |
| |
| |
| Deferred tax asset | 397 | |
| Goodwill and other intangible assets | (749) | |
| Significant investments | (132) | |
| Movement in treasury shares and employee share schemes | 330 | |
| |
| Distributions on other equity instruments | (527) | |
Other movements | (15) | |
| |
At 31 December 2023 | 31,897 | |
1 Under the regulatory capital framework, profits made by Insurance are removed from CET1 capital. However, when dividends are paid to the Group by Insurance these are recognised through CET1 capital.
2 Reflects the reversal of the brought forward accrual for the final 2022 ordinary dividend, net of the accrual for the final 2023 ordinary dividend.
3 Received in February 2023.
The Group’s CET1 capital ratio reduced from 15.1 per cent at 31 December 2022 to 14.6 per cent at 31 December 2023, reflecting the increase in risk-weighted assets.
CET1 capital resources increased marginally by £32 million, with banking business profits for the year, the receipt of the dividend paid up by the Insurance business in February 2023 and other increases through reserves predominantly offset by:
•Pension deficit contributions (fixed and variable) paid during the year into the Group’s three main defined benefit pension schemes
•An increase in goodwill and other intangible assets, which included the acquisition of Tusker in February 2023
•The interim ordinary dividend paid in September 2023, the accrual for the final 2023 ordinary dividend of 1.84 pence per share and distributions on other equity instruments
•The ordinary share buyback programme that was announced as part of the Group’s 2022 year end results and completed in August 2023
The full capital impact of the ordinary share buyback programme and the Insurance dividend received in February 2023 were reflected through the Group’s CET1 ratio on an adjusted basis of 14.1 per cent at 31 December 2022. The Group’s CET1 ratio of 13.7 per cent on an adjusted basis at 31 December 2023 reflects the full capital impact of the ordinary share buyback programme announced as part of the Group’s 2023 year end results and the Insurance dividend received in February 2024.
The IFRS 9 transitional arrangements for static relief ended on 1 January 2023 and therefore no static relief exists at 31 December 2023 (31 December 2022: £232 million). Dynamic relief amounted to £196 million (31 December 2022: £358 million) through CET1 capital.
Movements in total capital and MREL
The Group’s total capital ratio increased to 19.8 per cent at 31 December 2023 (31 December 2022: 19.7 per cent) primarily reflecting AT1 and Tier 2 issuance. This was largely offset by the increase in risk-weighted assets and other movements in Tier 2 capital instruments, which included the impact of a call and regulatory amortisation.
The MREL ratio increased to 31.9 per cent at 31 December 2023 (31 December 2022: 31.7 per cent) reflecting the increase in both total capital resources and other eligible liabilities, largely offset by the increase in risk-weighted assets. The increase in other eligible liabilities was primarily driven by new issuances, partially offset by a call and the exclusion of instruments maturing in 2024.
| | | | | | | | |
49 | Lloyds Banking Group plc Annual Report on Form 20-F 2023 | |
Operating and financial review and prospects continued
Risk-weighted assets
| | | | | | | | |
| At 31 Dec 2023 £m | At 31 Dec 2022 £m |
| Foundation Internal Ratings Based (IRB) Approach | 44,504 | | 46,500 | |
| Retail IRB Approach | 85,459 | | 81,091 | |
Other IRB Approach1 | 20,941 | | 19,764 | |
| IRB Approach | 150,904 | | 147,355 | |
Standardised (STA) Approach1 | 22,074 | | 23,119 | |
| Credit risk | 172,978 | | 170,474 | |
Securitisation | 8,958 | | 6,397 | |
| Counterparty credit risk | 5,847 | | 5,911 | |
| Credit valuation adjustment risk | 689 | | 621 | |
| Operational risk | 26,416 | | 24,241 | |
| Market risk | 4,242 | | 3,215 | |
| Risk-weighted assets | 219,130 | | 210,859 | |
Of which threshold risk-weighted assets2 | 11,028 | | 11,883 | |
1 Threshold risk-weighted assets are included within Other IRB Approach and Standardised (STA) Approach.
2 Threshold risk-weighted assets reflect the element of significant investments and deferred tax assets that are permitted to be risk-weighted instead of being deducted from CET1 capital. Significant investments primarily arise from investment in the Group’s Insurance business.
Risk-weighted assets have increased by £8 billion during the year to £219 billion at 31 December 2023 (31 December 2022: £211 billion). This includes the impact of Retail secured CRD IV model updates of £5 billion. Excluding this, lending, operational and market risk increases, a modest uplift from credit and model calibrations and other movements were partly offset by optimisation, including capital efficient securitisation activity within the balance sheet.
In relation to the Retail secured CRD IV models, it is estimated that a further £5 billion increase will be required over 2024 to 2026, noting that this will be subject to final model outcomes.
| | | | | | | | |
50 | Lloyds Banking Group plc Annual Report on Form 20-F 2023 | |
Operating and financial review and prospects continued
Leverage ratio
The table below summarises the component parts of the Group’s leverage ratio.
| | | | | | | | | | | |
| At 31 Dec 2023 £m | | At 31 Dec 2022 £m |
| | | |
| | | |
| | | |
| Total tier 1 capital | 37,712 | | | 36,036 | |
| | | |
| Exposure measure | | | |
| Statutory balance sheet assets | | | |
| Derivative financial instruments | 22,356 | | | 24,753 | |
| Securities financing transactions | 56,184 | | | 56,646 | |
Loans and advances and other assets1 | 802,913 | | | 791,995 | |
| Total assets | 881,453 | | | 873,394 | |
| | | |
| Qualifying central bank claims | (77,625) | | | (91,125) | |
| | | |
Deconsolidation adjustments2 | | | |
| Derivative financial instruments | 585 | | | 712 | |
| | | |
Loans and advances and other assets1 | (178,552) | | | (164,096) | |
| Total deconsolidation adjustments | (177,967) | | | (163,384) | |
| | | |
| | | |
| | | |
| | | |
| | | |
| | | |
| Derivatives adjustments | (4,896) | | | (7,414) | |
| Securities financing transactions adjustments | 2,262 | | | 2,645 | |
| Off-balance sheet items | 40,942 | | | 42,463 | |
Amounts already deducted from tier 1 capital | (12,523) | | | (12,033) | |
Other regulatory adjustments3 | (4,012) | | | (5,731) | |
Total exposure measure | 647,634 | | | 638,815 | |
Average exposure measure4 | 656,857 | | | |
| | | | |
UK leverage ratio | 5.8% | | 5.6% |
Average UK leverage ratio4 | 5.7% | | |
| | | | |
| Leverage exposure measure (including central bank claims) | 725,259 | | | 729,940 | |
| Leverage ratio (including central bank claims) | 5.2% | | 4.9% |
| | | |
| Total MREL resources | 69,905 | | | 66,830 | |
| MREL leverage ratio | 10.8% | | 10.5% |
1 2022 comparatives have been restated to reflect the impact of IFRS 17.
2 Deconsolidation adjustments relate to the deconsolidation of certain Group entities that fall outside the scope of the Group’s regulatory capital consolidation, primarily the Group’s Insurance business.
3 Includes adjustments to exclude lending under the UK Government’s Bounce Back Loan Scheme (BBLS).
4 The average UK leverage ratio is based on the average of the month end tier 1 capital position and average exposure measure over the quarter (1 October 2023 to 31 December 2023). The average of 5.7 per cent compares to 5.7 per cent at the start and 5.8 per cent at the end of the quarter.
Analysis of leverage movements
The Group’s UK leverage ratio increased to 5.8 per cent (31 December 2022: 5.6 per cent) reflecting the increase in the total tier 1 capital position. This was partially offset by the increase in the leverage exposure measure following increases in financial and other assets (excluding central bank claims), net of reductions in off-balance sheet items and the measure for securities financing transactions.
| | | | | | | | |
51 | Lloyds Banking Group plc Annual Report on Form 20-F 2023 | |
Operating and financial review and prospects continued
Stress testing
The Group undertakes a wide-ranging programme of stress testing, providing a comprehensive view of the potential impacts arising from the risks to which the Group and its key legal entities are exposed. One of the most important uses of stress testing is to assess the resilience of the operational and strategic plans of the Group and its legal entities to adverse economic conditions and other key vulnerabilities.
As part of this programme the Group participated in the delayed 2022 Annual Cyclical Scenario stress test run by the Bank of England, which was submitted to the regulator in January 2023. This assesses the Group’s resilience to a severe economic shock where the House Price Index (HPI) falls by 31 per cent, Commercial Real Estate (CRE) falls by 45 per cent, unemployment peaks at 8.5 per cent and the Base Rate peaks at 6 per cent. The results of this exercise were published by the Bank of England on 12 July 2023. The Bank of England calculated the Group’s transitional CET1 ratio, after the application of management actions, as 11.6 per cent and its Tier 1 leverage ratio as 4.5 per cent, significantly exceeding the hurdle rates of 6.6 per cent and 3.5 per cent, respectively. The Group also continues to internally assess vulnerabilities to adverse economic conditions.
G-SIB indicators
Although the Group is not currently classified as a Global Systemically Important Bank (G-SIB), by virtue of the Group’s leverage exposure measure exceeding €200 billion the Group is required to report G-SIB indicator metrics to the PRA. The Group’s indicator metrics used within the 2023 Basel G-SIBs annual exercise will be disclosed at the end of April 2024 and the results are expected to be made available by the Basel Committee later this year.
Insurance business
The business transacted by the insurance companies within the Group comprises both life insurance business and general insurance business. Life insurance comprises unit-linked, non-profit and With-Profits business.
Scottish Widows Limited (SW Ltd) holds the only With-Profits funds managed by the Group. The UK insurance companies within the Group are regulated by the PRA. SW Ltd’s European insurance subsidiary is regulated by the CAA.
The Solvency II regime for insurers and insurance groups came into force from 1 January 2016 and was most recently updated in December 2023 as part of the Solvency UK framework. Insurance is required to calculate solvency capital requirements and available capital on a risk-based approach. Insurance calculates regulatory capital on the basis of an internal model, which has been approved by the PRA.
The minimum required capital must be maintained at all times throughout the year. These capital requirements and the capital available to meet them are regularly estimated in order to ensure that capital maintenance requirements are being met.
All minimum regulatory requirements of the insurance companies have been met during the year.
Change and execution risk
Definition
Change and execution risk is defined as the risk that, in delivering its change agenda, the Group fails to ensure compliance with laws and regulation, maintain available and effective customer and colleague services, and/or operate within the Group’s risk appetite.
Exposures
Change and execution risks arise when the Group undertakes activities which require products, processes, people, systems or controls to change. These changes can be as a result of external drivers (for example, a new piece of regulation that requires the Group to put in place a new process or reporting) and/or internal drivers including business process changes, technology upgrades and strategic business or technology transformation.
Measurement
The Group currently measures change and execution risk against defined risk appetite metrics which are a combination of leading, quality and delivery indicators across the investment portfolio. These indicators are reported through internal governance structures and monthly execution risk metrics; which form part of the Board risk appetite metrics, and are under ongoing evolution and enhancement to ensure they support the Group’s change and transformation agenda.
Mitigation
The Group takes a range of mitigating actions with respect to change and execution risk. These include the following:
•The Board establishes a Group-wide risk appetite and metric for change and execution risk
•Ensuring compliance with the change policy and associated policies and procedures, which set out the principles and key controls that apply across the business and are aligned to the Group risk appetite
•Businesses assess the potential impacts of undertaking any change activity on their ability to execute effectively, on customers and colleagues and on the potential consequences for existing business risk profiles
•The implementation of effective governance and control frameworks to ensure adequate controls are in place to manage change activity and act to mitigate the change and execution risks identified. These controls are monitored in line with the change policy and enterprise risk management framework
•Events and incidents related to change activities are escalated and managed appropriately in line with risk framework guidance
•Ensuring there are sufficient, appropriately skilled resources to support the safe delivery of the Group’s current and future change portfolio
Monitoring
Change and execution risks are monitored and reported through to the Board and Group Governance Committees in accordance with the Group’s enterprise risk management framework. Risk exposures are assessed monthly through established governance in the Group’s functions and business unit risk committees with escalation to executive committees where required. Material change and execution related risk events or incidents are escalated in accordance with the Group operational risk policy and change policy. In addition there is oversight, challenge and reporting within Risk function to support overall management of risks and ongoing effectiveness of controls.
| | | | | | | | |
52 | Lloyds Banking Group plc Annual Report on Form 20-F 2023 | |
Operating and financial review and prospects continued
Climate risk
Definition
The Group defines climate risk as the risk that the Group experiences losses and/or reputational damage, either from the impacts of climate change and the transition to net zero (inbound) or as a result of the Group’s response to tackling climate change (outbound).
Embedding
Climate risk is considered as a principal risk within the Group’s ERMF, reflecting the importance of the topic and the focus required to manage these risks. This ensures a consistent approach to embedding the consideration of climate risk in activities across the Group, while also enhancing Board level insight.
The Group’s climate risk policy provides an overarching framework for managing climate risks. This policy continues to be refined, to ensure awareness of key climate-related risks across different areas of the Group and appropriate processes and controls are in place to mitigate these risks. This includes requirements in relation to governance, scenario analysis and management for climate risks, as well as governance requirements for different aspects of the Group’s net zero strategy. Activity across the Group to meet these requirements is actively monitored, including through the development of the Group’s climate risk profile.
The Group continues to consider climate risk through an evolving view of ‘Double Materiality’. This reflects the concept that climate risks can materialise through inbound risk, outbound risk or potentially both.
•Inbound risk: impacts of a risk on the Group’s balance sheet, which can lead to a financial loss. Managing inbound risks is critical to mitigate this potential impact, including supporting customers to be aware of potential risks. Examples include property devaluation from physical and transition risks and extreme weather events increasing insurance losses
•Outbound risk: impacts of the Group’s balance sheet or activity on the environment driven by our strategy or purpose. Examples include insufficient consideration of climate risk in external disclosure or external perception of the Group’s actions, claims and disclosures
The Group is continuing to develop its understanding of Double Materiality, as well as reflecting how it applies across broader ESG risks. This approach allows an assessment of the impact of risks to the Group in addition to identification of the impact of the Group’s balance sheet on society and the planet.
Within the Group’s risk and control self-assessment (RCSA) system for risk management, key climate-related risks have been prioritised into five broad themes in line with this view of inbound and outbound risks:
The impacts from climate risk largely manifest through other principal risks. Therefore, in order to ensure these impacts are appropriately managed, the Group is embedding consideration of climate risk into its approach for managing other principal risks.
New and existing controls have also been mapped to key climate-related regulatory obligations to support identification, measurement, management and reporting of the impacts of climate change.
Exposures
Climate risks can arise through two channels, physical or transition risks:
•Physical risks from changes in climate or weather patterns. These can either be acute (event driven such as floods or storms) or chronic (longer-term shifts such as rising sea levels or droughts)
•Transition risks due to changes associated with moving towards a low carbon economy, including changes to policy, legislation and regulation, technology and market, or legal risks from failing to manage the transition
As part of the Group’s ERMF, risks are proactively identified considering various internal and external sources, including environmental factors such as climate change. The Group has identified the sectors at increased risk from the impacts of climate change and continues to monitor its loans and advances to customers in these sectors.
This has informed identification of the key climate-related risks at a Group level, with input from other entities to capture any material risks not reflected. The table on page 54 provides a high-level overview of the Group’s key climate risks, across the five main inbound and outbound themes highlighted in the climate risk diagram. This has also included consideration of the cross-cutting impacts across other principal risks in the Group’s ERMF. A similar exercise has been carried out for Scottish Widows. The materiality of the Group’s key climate risks reflects their potential impact on the Group, considering key impacts across a range of factors including: customer; reputation; financial losses; colleagues; and business objectives. These impacts are considered on an ongoing basis through the Group’s continuous risk management approach, with formal assessment at least annually. This assessment is supported by horizon scanning of climate-related developments across the Group and additional quantitative and qualitative analysis, including scenario analysis results.
Measurement
There are a number of different ways to measure the relative size of the key climate risks facing the Group. However, in order to quantify the impact, scenario analysis is required to understand their effects, particularly given the different potential outcomes and time horizons over which the risks may manifest.
From an outbound perspective, the Group measures its emissions relating to activities across bank finance, Scottish Widows’ investments, supply chain and own operations. This helps to provide a view on the impact of the Group’s activities, as well as identifying the areas where the Group can most effectively reduce emissions to support the transition to net zero. These calculations follow the relevant industry standards and guidelines, noting that such methodologies will continue to evolve.
For inbound risks, the levels of climate risk impacting different areas of the Group are assessed through a variety of metrics and approaches:
•For Commercial lending, the Group’s ESG tool helps to identify and assess the impact of climate risk for individual Commercial customers as part of the credit decisioning process
| | | | | | | | |
53 | Lloyds Banking Group plc Annual Report on Form 20-F 2023 | |
Operating and financial review and prospects continued
| | | | | | | | | | | | | | | | | | | | |
| Key climate risks facing the Group | | | 6 | |
| Impact | Risks | Drivers | Time horizons1 | Risk types impacted | |
| Inbound | Property devaluation from physical and transition risks | Transition (Policy and Legal, Technology, Market) | Short (Acute), Medium and Long (Chronic) | Credit | |
| Physical (Acute, Chronic) | | | |
| Underwriting and insurance risks arising from climate risks | Physical (Acute, Chronic) | Short (Acute), Medium, Long (Chronic) | Insurance underwriting | |
| Adverse impact on residual value of motor vehicles | Transition (Policy and Legal, Technology, Market) | Short, Medium, Long | Credit | |
| Reduction in clients’ creditworthiness or collateral valuation | Transition (Policy and Legal, Technology, Market, Reputation) | Medium, Long | Credit | |
| Physical (Acute, Chronic) | | | |
| Physical and transition risk for impacting value of assets2 and Investments (across customer and shareholder assets) | Transition (Policy and Legal, Technology, Market, Reputation)
Physical (Acute, Chronic) | Medium, Long | Credit
Market
Conduct | |
| Disruption to the Group’s services from extreme weather, for example damage to Group properties | Physical (Acute, Chronic) | Short (Acute), Long (Chronic) | Operational resilience | |
| Meeting relevant expectations/requirements, e.g. Prudential Regulation Authority (PRA) Supervisory Statement (SS3/19) and ISSB | Transition (Policy and Legal) | Short, Medium, Long | Regulatory compliance | |
| Outbound | Failure to adequately support the transition to net zero | Transition (Reputation) | Short, Medium, Long | Climate | |
| Insufficient consideration of climate risk in external disclosures | Transition (Policy and Legal, Reputation) | Short, Medium | Operational (financial reporting) | |
| External perception of greenwashing in the Group’s disclosures, marketing or product communications | Transition (Policy and Legal, Reputation) | Short, Medium, Long | Conduct | |
1 Time horizon categories: Short term: 0-1 year, Medium term: 1-5 years, Long term: 5+ years.
2 This includes the Group’s defined benefit pension schemes assets. Climate change could potentially impact the schemes’ financial position due to changes in asset prices, financial market conditions and members’ longevity.
•For Retail lending, levels of flood risk and energy efficiency, via energy performance certificates (EPC), are measured for the Homes portfolio to inform the physical and transition risk we face. For the motor portfolio, the transition from internal combustion engines (ICE) to electric vehicles (EVs) is a key consideration in measuring residual value risk
•For Home insurance business, there is a dedicated weather modelling team, comprised of specialists in hydrology, meteorology and probabilistic modelling. The team develops a baseline view of physical risk for the UK and conducts forward-looking climate stress testing on this. This team has been in place since 2016 and has monitored and applied climate change science onto the view of risk used for capital, pricing, reinsurance, and planning
Scenario analysis
Given the range of outcomes over which climate risks and opportunities may materialise, scenario analysis is a key tool for understanding the potential impacts on the Group. The Group continues to develop its climate scenario analysis capabilities to inform analysis of climate risks, as well as to help shape the Group’s strategy to reflect climate opportunities and assess its resilience, building on lessons learned from the Bank of England’s 2021 Climate Biennial Exploratory Scenario (CBES). The subsequent analysis has focused on understanding the areas of the Group most impacted by climate change, as well as assessing the impact from key climate-related risks.
Separate assessments have been undertaken for the Group’s Commercial lending and Scottish Widows investments portfolios to identify the sectors most exposed to climate risks.
•For Commercial lending clients, this has been based on estimated financial impacts from physical and transition risk. The relative difference between this climate estimate and a baseline provides an indicative foresight view of discounted cash flow and hence net present value (NPV) of the entity from present day to 2050
•For Scottish Widows’ investments, the analysis focused on the impact of climate risk on broadly defined sectors, considering the quantitative impact of transition risk alone in the high transition scenarios. The chart below is based on projected equity values at 2050, with currency movements hedged and compared to counterfactual projections
| | | | | | | | |
54 | Lloyds Banking Group plc Annual Report on Form 20-F 2023 | |
Operating and financial review and prospects continued
Both assessments have been modelled across two climate scenarios consistent with the Network for Greening the Financial System (NGFS), Net Zero 2050 (Orderly) and Divergent Net Zero (Divergent). The Net Zero 2050 scenario was chosen as it describes the ideal outcome that the Group’s net zero targets are aiming for. The Divergent Net Zero scenario provides a useful comparison, given it reaches the same end goal although at higher overall cost.
The results across both assessments are broadly in line with each other, highlighting that high emitting sectors, such as coal mining and oil and gas, are expected to face a substantial adverse impact, with considerable effects in other sectors, such as automotive and transport. However, these impacts will vary significantly by company and will be most notably observed in the power sector.
The Group has a relatively low commercial lending exposure to the sectors which experience the most significant negative impacts, based on this assessment. Note 52 on page F-109 provides further detail of the Group’s lending by sector. The above assessment also supports the view of the sectors with the greatest potential climate-related impact for the Group. Alongside lending exposure, this analysis validates the focus for the Group’s environmental sustainability strategy, including the banking sectors for which NZBA targets have been set.
Climate risks also transmit via trading book assets and the Group has undertaken climate scenario analysis across three bespoke climate scenarios to understand the impact of very short-term market risk factor shocks stemming from both physical and transition risks. Resulting stressed valuations fell within existing stress test framework outcomes demonstrating the resilience of existing risk management approaches.
Impact assessment
This scenario analysis is intended to inform the Group’s view of the financial impacts from the risks relating to change, which would principally arise through asset impairments or credit losses. Building on this assessment of the sectors at increased risk from climate change, the Group has incorporated consideration of some climate risks into its calculation of ECL. For Commercial Banking clients in these sectors most materially impacted, a top-down sector level approach has been used to estimate impacts in a disorderly scenario, resulting an estimated impact on ECL of less than £15 million. This uses a combination of sector level NPV impact estimates, NGFS Gross Domestic Product (GDP) pathways, historic impairment data and other inputs to assess the impact of physical and transition risks.
Furthermore, the UK Mortgages portfolio has been assessed for physical and transition risk. This assessment considered the impact of the UK introducing minimum EPC requirements and the estimated retrofitting costs to meet these. These additional costs then translated into Probability of Default (PD) uplifts, resulting in an estimated increase in ECL of less than £5 million for the Group’s buy-to-let portfolio. A similar exercise was undertaken for flood risk, also with an estimated impact of less than £5 million. Measurement of the physical and transition risk impacts continues to progress, with ongoing development of a Residential Real Estate Climate Impact model to estimate potential impacts.
These estimated impacts are below the Group’s materiality thresholds, therefore, no adjustments have been made to the expected credit losses measured as at 31 December 2023. Note 24 on page F-82 provides further information on the assessment of climate risks in the Group’s measurement of expected credit losses. Mitigation
The Group manages climate-related risk in different ways across the five key inbound and outbound themes identified. The following sections provide an overview of the Group’s mitigation approach, including the relevant cross-cutting impacts, across each of these themes.
Net Zero
The Group considers how its different areas are supporting the transition to net zero. The Group has set ambitions to reduce emissions across four key areas of activity. This is supported through development of appropriate plans and strategies, as well as sector specific targets for bank financed emissions. We aim to monitor progress against these targets through the Group Net Zero Committee on a quarterly basis.
The 2023 Group climate transition plan sets out the steps it will take to reduce emissions to net zero for its own operations and supply chain, as well as specific activities happening in relation to the Group’s lending and investments.
Disclosures
The Group’s external disclosures are subject to a robust governance process, including appropriate legal review. This includes an assessment of the relevant regulatory requirements, particularly to ensure alignment with CFD requirements and Task Force on Climate-related Financial Disclosures (TCFD) recommendations. External disclosures will continue to progress in line with the changing regulatory landscape, and the Group will look to ensure suitable controls remain in place as these develop.
Greenwashing
The Group’s understanding of greenwashing continues to evolve, with adoption of various methods across the Group to continue to build this understanding, including development of training materials to avoid greenwashing for all colleagues. Current priorities relate to any sustainability related claims in external disclosures and development of consideration of ESG criteria (including climate-related factors) for relevant products across the Group.
The Group will look to ensure that its disclosures outline a clear and accurate message of what it is doing to support the transition to net zero. An external legal review provides assurance on the suitability of content in disclosures. The Group expects its controls and processes will continue to evolve, reflecting increasing understanding of greenwashing, as well as the changing regulatory landscape, such as the FCA’s Sustainability Disclosure Requirements anti-greenwashing rule. In 2023, for example, Scottish Widows launched a Green Claims Framework, under which first line risk teams assess green claims prior to publication of communications to ensure any claims are accurate, clear, not misleading and can be substantiated.
In 2023, the Group product policy was redesigned to ensure compliance with Consumer Duty and focus on customer outcomes. As part of this, initial guidance in relation to climate considerations was strengthened to introduce more comprehensive ESG considerations for all products in line with the Group’s updated values. Dedicated ESG guidance has been introduced to support product governance processes, ensuring climate-related factors and wider ESG risks are appropriately considered and managed throughout the product life cycle. In 2024, further support will be provided to upskill colleagues and ensure the guidance is enhanced in line with the ESG risks landscape.
| | | | | | | | |
55 | Lloyds Banking Group plc Annual Report on Form 20-F 2023 | |
Operating and financial review and prospects continued
Inbound physical and transition risks
The impacts from physical and transition risks cut across other principal risks in different ways for different areas of the Group, as outlined below.
Commercial and Retail lending
The Group continues to integrate climate risk and broader ESG considerations in its credit process, with continued progress in 2023. This is through a credit risk integration strategy, which includes development of an ESG credit risk framework and policies, as well as portfolio and case management.
Operations and supply chain
Climate risk is embedded in the Group approach for managing operational resilience, as one of the key drivers within the Group strategy, considering the impact on and from climate as part of ensuring its operations remain resilient. Climate-related impacts could affect operational resilience through properties, IT systems, people and third party suppliers. The Group approach primarily focuses on the potential impact from physical risks, although transition risk impacts may require further consideration as the approach evolves.
The Group has processes in place to consider the resilience of its property in relation to physical risks, particularly focused on its offices, data centres and branch network, to minimise the risk of service disruption. Insurers periodically highlight the Group’s buildings that are subject to high flood risk. These sites are then surveyed in detail to quantify that risk and determine appropriate flood defence mitigation. The Group proactively monitors the temperature and humidity in its data centres, with root cause analysis undertaken for any incidents to identify any local climate issues and remediate. Additionally, resilient tech rooms have been created where power, temperature and humidity are robustly controlled.
The Group expects its third party suppliers to review their business continuity plans and recovery strategies, ensuring these are appropriately updated to mitigate potential risks posed by climate change, to ensure continued provision of service. The Group’s Code of Supplier Responsibility also outlines expectations for the third parties in relation to environmental sustainability. This includes expectations for the Group’s suppliers to proactively identify, manage and reduce their environmental impact, as well as adopting the principles of the Emerald Standard which the Group launched in 2022.
Regulatory compliance
The Group’s monitoring of regulatory expectations includes understanding the current relevant requirements, and its activity and progress towards these, as well as horizon scanning for new developments. Monitoring progress against current expectations, for example Dear CEO and CFO letters, supports regular engagement with regulators on respective plans and priorities. In addition, the Group maintains a view of how its disclosures support the relevant regulatory requirements, as outlined above.
The Group also maintains an awareness of regulatory developments and seeks to include and map regulatory obligations within its risk and control profile in support of compliance traceability.
Monitoring
The Group ensures visibility and awareness of climate risks wherever they present themselves across its risk profile, with regular reporting and tracking of any identified risks.
Management Information (MI) across a range of themes is regularly assessed to provide insight into and oversight of management of climate risk, together with tracking of associated action plans and identification of triggers for reassessment. This is reported through appropriate Risk governance, across the relevant business units.
Climate risk is also considered through Risk governance on a monthly basis through the Consolidated Risk Report, supported by assessment of identified climate risks across the Group and appropriate analysis of Group Board risk appetite metrics. This provides insight into any changes to the risk profile together with their rationale for awareness and scrutiny by senior leaders. In addition, climate risk MI is reported through this process, with standalone deep dive discussions on climate risk at Board Risk Committee on a half-yearly basis.
Conduct risk
Definition
Conduct risk is defined as the risk of customer detriment across the customer lifecycle including: failures in product management, distribution and servicing activities; from other risks materialising, or other activities which could undermine the integrity of the market or distort competition, leading to unfair customer outcomes, regulatory censure, reputational damage or financial loss.
Harm or detriment is defined as loss, distress or inconvenience to customers due to breaches of regulatory or internal requirements or our wider duty to act fairly and reasonably.
Exposures
The Group faces significant conduct risks, which affect all aspects of the Group’s operations and all types of customers. The introduction of Consumer Duty has increased regulatory expectations in relation to customer outcomes, including how the Group demonstrates and measures them.
Conduct risks can impact directly or indirectly on the Group’s customers and could materialise from a number of areas across the Group, including:
•Business and strategic planning that does not sufficiently consider customer needs
•Ineffective development, management and monitoring of products, their distribution (including the sales process, fair value assessment and responsible lending criteria) and post- sales service (including the management of customers in financial difficulties)
•Unclear, unfair, misleading or untimely customer communications
•A culture that is not sufficiently customer-centric
•Poor governance of colleagues’ incentives and rewards and approval of schemes which lead to behaviours that drive unfair customer outcomes
•Ineffective identification, management and oversight of legacy conduct issues
•Ineffective management and resolution of customers’ complaints or claims
•Outsourcing of customer service and product delivery to third parties that do not have the same level of control, oversight and culture as the Group
The Group is also exposed to the risk of engaging in activities or failing to manage conduct which could constitute market abuse, undermine the integrity of a market in which it is active, distort competition or create conflicts of interest.
There is a high level of scrutiny from regulatory bodies, the media, politicians, and consumer groups regarding financial institutions’ treatment of customers, especially those with characteristics of vulnerability. The Group continues to apply significant focus to its treatment of all customers, in particular those in financial difficulties and those with characteristics of vulnerability, to ensure good outcomes.
The Group is continuing to liaise closely with the FCA and Financial Ombudsman Service on the historical motor commission arrangements.
| | | | | | | | |
56 | Lloyds Banking Group plc Annual Report on Form 20-F 2023 | |
Operating and financial review and prospects continued
The Group continuously adapts to market developments that could pose heightened conduct risk, and actively monitors for early signs of financial difficulties driven by pressures from a rising cost of living and rising interest rates.
Other key areas of focus include transparency and fairness of pricing communications; ensuring victims of Authorised Push Payment Fraud receive good outcomes; and a mindset shift regarding customer outcomes in line with the FCA’s Consumer Duty Regulation.
Measurement
To articulate its conduct risk appetite, the Group has Conduct Risk Appetite Metrics (CRAMs) and tolerances that aim to indicate where it may be operating outside its conduct risk appetite.
CRAMs have been designed for services and products offered by the Group and are measured by a set of common metrics. These contain a range of product design, sales and process metrics (including outcome testing results) to provide a more holistic view of conduct risks; some products also have a suite of additional bespoke metrics.
Each of the tolerances for the metrics are agreed for the individual product or service and are regularly tracked. At a consolidated level these metrics are part of the Board risk appetite. The Group has, and continues to, evolve its approach to conduct risk measurements, to include emerging conduct themes.
Mitigation
The Group takes a range of mitigating actions with respect to conduct risk and remains focused on delivering a leading customer experience.
The Group’s ongoing commitment to good customer outcomes sets the tone from the top and supports the development our values-led culture with customers at the heart, strengthening links between actions to support conduct, culture and customer and enabling more effective control management. Actions to encourage good conduct include:
•Conduct risk appetite established at Group and divisional level, with metrics included in the Group risk appetite to ensure ongoing focus
•Simplified and enhanced conduct policies and procedures in place to ensure appropriate controls and processes that deliver good customer outcomes, and support market integrity and competition requirements
•Customer needs considered through divisional customer plans, with integral conduct lens
•Achieving a values-led culture that delivers great customer outcomes, by focusing on aligning our systems, symbols, behaviours and storytelling
•Development and continued oversight of the implementation of the vulnerability strategy continues through the Group Customer Inclusion Forum to monitor vulnerable outcomes, provide strategic direction and ensure consistency across the Group
•Robust product governance framework to ensure products continue to offer customers fair value, and consistently meet their needs throughout their product lifecycle
•Complaints management through responding to, and learning from, root causes of complaint volumes and Financial Ombudsman Service (FOS) change rates
•Review and oversight of thematic conduct agenda items at senior committees, ensuring holistic consideration of key Group-wide conduct risks
•Robust recruitment and training, with a continued focus on how the Group manages colleagues’ performance with clear customer accountabilities
•Ongoing engagement with third parties involved in serving the Group’s customers to ensure consistent delivery
•Monitoring and testing of customer outcomes to ensure the Group delivers good outcomes for customers throughout the product and service lifecycle, and make continuous improvements to products, services and processes
•Continued focus on market conduct; member of the Fixed Income, Currencies and Commodities Markets Standard Board; and committed to conducting its market activities consistent with the principles of the UK Money Markets Code, the Global Precious Metals Code and the FX Global Code
•Adoption of robust change delivery methodology to enable prioritisation and delivery of initiatives to address conduct challenges
•Continued focus on proactive identification and mitigation of conduct risk in the Group’s strategy
•Active engagement with regulatory bodies and other stakeholders to develop understanding of concerns related to customer treatment, effective competition and market integrity, to ensure that the Group’s strategic conduct focus continues to meet evolving stakeholder expectations
•Creation of tools and additional support for customers impacted by the rising cost of living, including Cost-of-Living Hub and interest-free overdraft buffer
•A programme of work in place to deliver the enhanced expectations of Consumer Duty
Monitoring
Conduct risk is governed through divisional risk committees and significant issues are escalated to the Group Risk Committee, in accordance with the Group’s ERMF, as well as through the monthly Risk Reporting. The risk exposures are reported, discussed and challenged at divisional risk committees. Remedial action is recommended, if required. All material conduct risk events are escalated in accordance with the Group operational risk policy.
A number of activities support the close monitoring of conduct risk including:
•The use of CRAMs across the Group, with an escalation route to Board
•Oversight and assurance activities across the three lines of defence
•Horizon scanning
| | | | | | | | |
57 | Lloyds Banking Group plc Annual Report on Form 20-F 2023 | |
Operating and financial review and prospects continued
Credit risk
Definition
Credit risk is defined as the risk that parties with whom the Group has contracted fail to meet their financial obligations (both on and off-balance sheet).
Exposures
The principal sources of credit risk within the Group arise from loans and advances, contingent liabilities, commitments and debt securities to customers, financial institutions and sovereigns. The credit risk exposures of the Group are set out in note 52 on page F-109. In terms of loans and advances (for example, mortgages, term loans and overdrafts) and contingent liabilities (for example, credit instruments such as guarantees and documentary letters of credit), credit risk arises both from amounts advanced and commitments to extend credit to a customer or bank. With respect to commitments to extend credit, the Group is also potentially exposed to an additional loss up to an amount equal to the total unutilised commitments. However, the likely amount of loss may be less than the total unutilised commitments, as most retail and certain commercial lending commitments may be cancelled based on regular assessment of the prevailing creditworthiness of customers. Commercial term commitments are also contingent upon customers maintaining specific credit standards.
Credit risk also arises from debt securities and derivatives. The total notional principal amount of interest rate, exchange rate, credit derivative and other contracts outstanding at 31 December 2023 is shown on page 68. The notional principal amount does not, however, represent the Group’s credit risk exposure, which is limited to the current cost of replacing contracts with a positive value to the Group. Such amounts are reflected in note 52 on page F-109. Additionally, credit risk arises from leasing arrangements where the Group is the lessor. Note 2(J) on page F-20 provides details on the Group’s approach to the treatment of leases. Credit risk exposures in the Insurance, Pensions and Investments division relate mostly to bond and loan assets which, together with some related swaps, are used to fund annuity commitments within shareholder funds; plus balances held in liquidity funds to manage Insurance division’s liquidity requirements, and exposure to reinsurers.
The investments held in the Group’s defined benefit pension schemes also expose the Group to credit risk. Note 16 on page F-41 provides further information on the defined benefit pension schemes’ assets and liabilities.
Loans and advances, contingent liabilities, commitments, debt securities and derivatives also expose the Group to refinance risk. Refinance risk is the possibility that an outstanding exposure cannot be repaid at its contractual maturity date. If the Group does not wish to refinance the exposure then there is refinance risk if the obligor is unable to repay by securing alternative finance. This may occur for a number of reasons which may include: the borrower is in financial difficulty, because the terms required to refinance are outside acceptable appetite at the time or the customer is unable to refinance externally due to a lack of market liquidity. Refinance risk exposures are managed in accordance with the Group’s existing credit risk policies, processes and controls, and are not considered to be material given the Group’s prudent credit risk appetite. Where heightened refinance risk exists exposures are minimised through intensive account management and, where appropriate, are classed as impaired and/or forborne.
Measurement
The process for credit risk identification, measurement and control is integrated into the Board-approved framework for credit risk appetite and governance.
Credit risk is measured from different perspectives using a range of appropriate modelling and scoring techniques at a number of levels of granularity, including total balance sheet, individual portfolio, pertinent concentrations and individual customer – for both new business and existing exposure. Key metrics, which may include but are not limited to, total exposure, ECL, risk-weighted assets, new business quality, concentration risk and portfolio performance, are reported monthly to risk committees and forums.
Measures such as ECL, risk-weighted assets, observed credit performance, predicted credit quality (usually from predictive credit scoring models), collateral cover and quality, and other credit drivers (such as cash flow, affordability, leverage and indebtedness) have been incorporated into the Group’s credit risk management practices to enable effective risk measurement across the Group.
The Group has also continued to strengthen its capabilities and abilities for identifying, assessing and managing climate-related risks and opportunities, recognising that climate change is likely to result in changes in the risk profile and outlook for the Group’s customers, the sectors the Group operates in and collateral/asset valuations.
In addition, stress testing and scenario analysis, including preparation of credit playbooks to analyse and forward plan for specific events and/or emerging issues, are used to estimate impairment losses and capital demand forecasts for both regulatory and internal purposes and to assist in the formulation and calibration of credit risk appetite, where appropriate.
As part of the ‘three lines of defence’ model, the Risk division is the second line of defence providing oversight and independent challenge to key risk decisions taken by business management. The Risk division also tests the effectiveness of credit risk management and internal credit risk controls. This includes ensuring that the control and monitoring of higher risk and vulnerable portfolios and sectors is appropriate and confirming that appropriate loss allowances for impairment are in place. Output from these reviews helps to inform credit risk appetite, credit policy and portfolio mandates.
As the third line of defence, Group Internal Audit undertakes regular risk-based reviews to assess the effectiveness of credit risk management and controls.
Mitigation
The Group uses a range of approaches to mitigate credit risk.
Prudent credit principles, risk policies and appetite statements: the independent Risk division sets out the credit principles, credit risk policies and credit risk appetite statements. These are subject to regular review and governance, with any changes subject to an approval process. Risk teams monitor credit performance trends and the outlook. Risk teams also test the adequacy of and adherence to credit risk policies and processes throughout the Group. This includes tracking portfolio performance against an agreed set of credit risk appetite tolerances.
Robust models and controls: see model risk on page 88. Limitations on concentration risk: there are portfolio controls on certain industries, sectors and products to reflect risk appetite as well as individual, customer and bank limit risk tolerances. Credit policies, appetite statements and mandates are aligned to the Group’s risk appetite and restrict exposure to higher risk countries and potentially vulnerable sectors and asset classes. Note 52 on page F-110 provides an analysis of loans and advances to customers by industry (for commercial customers) and product (for retail customers). Exposures are monitored to prevent both an excessive concentration of risk and single name concentrations. These concentration risk controls are not necessarily in the form of a maximum limit on exposure, but may instead require new business in concentrated sectors to fulfil additional minimum policy and/or guideline requirements. The Group’s largest credit limits are regularly monitored by the Board Risk Committee and reported in accordance with regulatory requirements. | | | | | | | | |
58 | Lloyds Banking Group plc Annual Report on Form 20-F 2023 | |
Operating and financial review and prospects continued
Defined country risk management framework: the Group sets a broad maximum country risk appetite. Risk-based appetite for all countries is set within the independent Risk division, taking into account economic, financial, political and social factors as well as the approved business and strategic plans of the Group.
Specialist expertise: credit quality is managed and controlled by a number of specialist units within the business and Risk division, which provide for example: intensive management and control; security perfection; maintenance of customer and facility records; expertise in documentation for lending and associated products; sector-specific expertise; and legal services applicable to the particular market segments and product ranges offered by the Group.
Stress testing: the Group’s credit portfolios are subject to regular stress testing. In addition to the Group-led, PRA and other regulatory stress tests, exercises focused on individual divisions and portfolios are also performed. For further information on the Group wide stress testing process, methodology and governance see page 42. Frequent and robust credit risk assurance: assurance of credit risk is undertaken by an independent function operating within the Risk division which is part of the Group’s second line of defence. Its primary objective is to provide reasonable and independent assurance and confidence that credit risk is being effectively managed and to ensure that appropriate controls are in place and being adhered to. Group Internal Audit also provides assurance to the Audit Committee on the effectiveness of credit risk management controls across the Group’s activities.
Collateral
The principal types of acceptable collateral include:
•Residential and commercial properties
•Charges over business assets such as inventory and accounts receivable
•Financial instruments such as debt securities
•Vehicles
•Cash
•Guarantees received from third parties
The Group maintains appetite parameters on the acceptability of specific classes of collateral.
For non-mortgage retail lending to small businesses, collateral may include second charges over residential property and the assignment of life cover.
Collateral held as security for financial assets other than loans and advances is determined by the nature of the underlying exposure. Debt securities, including treasury and other bills, are generally unsecured, with the exception of asset-backed securities and similar instruments such as covered bonds, which are secured by portfolios of financial assets. Collateral is generally not held against loans and advances to financial institutions. However, securities are held as part of reverse repurchase or securities borrowing transactions or where a collateral agreement has been entered into under a master netting agreement. Derivative transactions with financial counterparties are typically collateralised under a Credit Support Annex (CSA) in conjunction with the International Swaps and Derivatives Association (ISDA) Master Agreement. Derivative transactions with non-financial customers are not usually supported by a CSA.
The requirement for collateral and the type to be taken at origination will be based upon the nature of the transaction and the credit quality, size and structure of the borrower. For non-retail exposures, if required, the Group will often seek that any collateral includes a first charge over land and buildings owned and occupied by the business, a debenture over the assets of a company or limited liability partnership, personal guarantees, limited in amount, from the directors of a company or limited liability partnership and key man insurance. The Group maintains policies setting out which types of collateral valuation are acceptable, maximum loan to value (LTV) ratios and other criteria that are to be considered when reviewing an application. The fundamental business proposition must evidence the ability of the business to generate funds from normal business sources to
repay a customer or counterparty’s financial commitment, rather than reliance on the disposal of any security provided.
Although lending decisions are primarily based on expected cash flows, any collateral provided may impact the pricing and other terms of a loan or facility granted. This will have a financial impact on the amount of net interest income recognised and on internal loss given default estimates that contribute to the determination of asset quality and returns.
The Group requires collateral to be realistically valued by an appropriately qualified source, independent of both the credit decision process and the customer, at the time of borrowing. In certain circumstances, for Retail residential mortgages this may include the use of automated valuation models based on market data, subject to accuracy criteria and LTV limits. Where third parties are used for collateral valuations, they are subject to regular monitoring and review. Collateral values are subject to review, which will vary according to the type of lending, collateral involved and account performance. Such reviews are undertaken to confirm that the value recorded remains appropriate and whether revaluation is required, considering, for example, account performance, market conditions and any information available that may indicate that the value of the collateral has materially declined. In such instances, the Group may seek additional collateral and/or other amendments to the terms of the facility. The Group adjusts estimated market values to take account of the costs of realisation and any discount associated with the realisation of the collateral when estimating credit losses.
The Group considers risk concentrations by collateral providers and collateral type with a view to ensuring that any potential undue concentrations of risk are identified and suitably managed by changes to strategy, policy and/or business plans.
The Group seeks to avoid correlation or wrong-way risk where possible. Under the Group’s repurchase (repo) policy, the issuer of the collateral and the repo counterparty should be neither the same nor connected. The same rule applies for derivatives. The Risk division has the necessary discretion to extend this rule to other cases where there is significant correlation. Countries with a rating equivalent to AA- or better may be considered to have no adverse correlation between the counterparty domiciled in that country and the country of risk (issuer of securities).
Refer to note 52 on page F-117 for further information on collateral. Additional mitigation for Retail customers
The Group uses a variety of lending criteria when assessing applications for mortgages and unsecured lending. The general approval process uses credit acceptance scorecards and involves a review of an applicant’s previous credit history using internal data and information held by Credit Reference Agencies (CRA).
The Group also assesses the affordability and sustainability of lending for each borrower. For secured lending this includes use of an appropriate stressed interest rate scenario. Affordability assessments for all lending are compliant with relevant regulatory and conduct guidelines. The Group takes reasonable steps to validate information used in the assessment of a customer’s income and expenditure.
In addition, the Group has in place quantitative limits such as maximum limits for individual customer products, the level of borrowing to income and the ratio of borrowing to collateral. Some of these limits relate to internal approval levels and others are policy limits above which the Group will typically reject borrowing applications. The Group also applies certain criteria that are applicable to specific products, for example applications for buy-to-let mortgages.
For UK mortgages, the Group’s policy permits owner occupier applications with a maximum LTV of 95 per cent. This can increase to 100 per cent for specific products where additional security is provided by a supporter of the applicant and held on deposit by the Group. Applications with an LTV above 90 per cent are subject to enhanced underwriting criteria, including higher scorecard cut-offs and loan size restrictions.
| | | | | | | | |
59 | Lloyds Banking Group plc Annual Report on Form 20-F 2023 | |
Operating and financial review and prospects continued
Buy-to-let mortgages within Retail are limited to a maximum loan size of £2,000,000 and 75 per cent LTV for a single property. Buy-to-let applications must pass a minimum rental cover ratio of 125 per cent under stressed interest rates, after applicable tax liabilities. Portfolio landlords (customers with four or more mortgaged buy-to-let properties) are subject to additional controls including evaluation of overall portfolio resilience.
The Group’s policy is to reject any application for a lending product where a customer is registered as bankrupt or insolvent, or has a recent County Court Judgment or financial default registered at a CRA used by the Group above de minimis thresholds. In addition, the Group typically rejects applicants where total unsecured debt, debt-to-income ratios, or other indicators of financial difficulty exceed policy limits.
Where credit acceptance scorecards are used, new models, model changes and monitoring of model effectiveness are independently reviewed and approved in accordance with the governance framework set by the Group Model Governance Committee.
Additional mitigation for Commercial customers
Individual credit assessment and independent sanction of customer and bank limits: with the exception of small exposures to small to medium-sized enterprises (SME) customers where certain relationship managers have limited delegated credit approval authority, credit risk in commercial customer portfolios is subject to approval by the independent Risk division, which considers the strengths and weaknesses of individual transactions, the balance of risk and reward, and how credit risk aligns to the Group and divisional risk appetite. Exposure to individual counterparties, groups of counterparties or customer risk segments is controlled through a tiered hierarchy of credit authority delegations and risk-based credit limit guidances per client group for larger exposures. Approval requirements for each decision are based on a number of factors including, but not limited to, the transaction amount, the customer’s aggregate facilities, any risk mitigation in place, credit policy, risk appetite, credit risk ratings and the nature and term of the risk. The Group’s credit risk appetite criteria for counterparty and customer loan underwriting is generally the same as that for loans intended to be held to maturity. All hard loan/bond underwriting must be approved by the Risk division. A pre-approved credit matrix may be used for ‘best efforts’ underwriting.
Counterparty credit limits: limits are set against all types of exposure in a counterparty name, in accordance with an agreed methodology for each exposure type. This includes credit risk exposure on individual derivatives and securities financing transactions, which incorporates potential future exposures from market movements against agreed confidence intervals. Aggregate facility levels by counterparty are set and limit breaches are subject to escalation procedures.
Daily settlement limits: settlement risk arises in any situation where a payment in cash, securities or equities is made in the expectation of a corresponding receipt in cash, securities or equities. Daily settlement limits are established for each relevant counterparty to cover the aggregate of all settlement risk arising from the Group’s market transactions on any single day. Where possible, the Group uses Continuous Linked Settlement in order to reduce foreign exchange (FX) settlement risk.
Master netting agreements
It is credit policy that a Group-approved master netting agreement must be used for all derivative and traded product transactions and must be in place prior to trading, with separate documentation required for each Group entity providing facilities. This requirement extends to trades with clients and the counterparties used for the Group’s own hedging activities, which may also include clearing trades with Central Counterparties (CCPs).
Any exceptions must be approved by the appropriate credit approver. Master netting agreements do not generally result in an offset of balance sheet assets and liabilities for accounting purposes, as transactions are usually settled on a gross basis. However, within relevant jurisdictions and for appropriate counterparty types, master netting agreements do reduce the credit risk to the extent that, if an event of default occurs, all trades with the counterparty may be terminated and settled on a net basis. The Group’s overall exposure to credit risk on derivative instruments subject to master netting agreements can change substantially within a short period, since this is the net position of all trades under the master netting agreement.
Other credit risk transfers
The Group also undertakes asset sales, credit derivative based transactions, securitisations (including significant risk transfer transactions), purchases of credit default swaps and purchase of credit insurance as a means of mitigating or reducing credit risk and/or risk concentration, taking into account the nature of assets and the prevailing market conditions.
Monitoring
In conjunction with the Risk division, businesses identify and define portfolios of credit and related risk exposures and the key behaviours and characteristics by which those portfolios are managed and monitored. This entails the production and analysis of regular portfolio monitoring reports for review by senior management. The Risk division in turn produces an aggregated view of credit risk across the Group, including reports on material credit exposures, concentrations, concerns and other management information, which is presented to senior officers, divisional credit risk forums, business unit committees and forums, Group Risk Committee and the Board Risk Committee.
Models
The performance of all models used in credit risk is monitored in line with the Group’s model governance framework – see model risk on page 88. Intensive care of customers in financial difficulty
The Group operates a number of solutions to assist borrowers who are experiencing financial stress. The material elements of these solutions through which the Group has granted a concession, whether temporarily or permanently, are set out below.
Forbearance
The Group’s aim in offering forbearance and other assistance to customers in financial distress is to benefit both the customer and the Group by supporting its customers and acting in their best interests by, where possible, bringing customer facilities back into a sustainable position.
The Group offers a range of tools and assistance to support customers who are encountering financial difficulties. Cases are managed on an individual basis, with the circumstances of each customer considered separately and the action taken judged as being appropriate and sustainable for both the customer and the Group.
Forbearance measures consist of concessions towards a debtor that is experiencing or about to experience difficulties in meeting its financial commitments. This can include modification of the previous terms and conditions of a contract or a total or partial refinancing of a troubled debt contract, either of which would not have been required had the debtor not been experiencing financial difficulties.
The provision and review of such assistance is controlled through the application of an appropriate policy framework and associated controls. Regular review of the assistance offered to customers is undertaken to confirm that it remains appropriate, alongside monitoring of customers’ performance and the level of payments received.
The Group classifies accounts as forborne at the time a customer in financial difficulty is granted a concession.
Balances in default or classified as Stage 3 are always considered to be non-performing. Balances may be non-performing but not in default or Stage 3, where for example they are within their non-performing forbearance cure period.
| | | | | | | | |
60 | Lloyds Banking Group plc Annual Report on Form 20-F 2023 | |
Operating and financial review and prospects continued
Non-performing exposures can be reclassified as performing forborne after a minimum 12-month cure period, providing there are no past due amounts or concerns regarding the full repayment of the exposure. A minimum of a further 24 months must pass from the date the forborne exposure was reclassified as performing forborne before the account can exit forbearance. If conditions to exit forbearance are not met at the end of this probation period, the exposure shall continue to be identified as forborne until all the conditions are met.
The Group’s treatment of loan renegotiations is included in the impairment policy in note 2(H) on page F-19. Customers receiving support from UK Government sponsored programmes
To assist customers in financial distress, the Group participates in UK Government sponsored programmes for households, including the Income Support for Mortgage Interest programme, under which the government pays the Group all or part of the interest on the mortgage on behalf of the customer. This is provided as a government loan which the customer must repay.
The Group credit risk portfolio in 2023
Overview
The Group’s portfolios are well-positioned for the current macroeconomic environment. The Group retains a prudent approach to credit risk appetite and risk management, with strong credit origination criteria and robust LTVs in the secured portfolios.
Observed credit performance remains resilient, despite the continued economic uncertainty with only modest evidence of deterioration to date. In UK mortgages, new to arrears were relatively stable throughout 2023, having increased slightly at the start of the year, largely driven by legacy vintages (mortgages originated in the period 2006 to 2008). Flows to default increased during the year for the same reason with trends stabilising in the second half. Unsecured portfolios continue to exhibit stable new to arrears and flow to default trends, broadly at or below pre-pandemic levels. The Group continues to monitor the impacts of the economic environment carefully through a suite of early warning indicators and governance arrangements that ensure risk mitigating action plans are in place to support customers and protect the Group’s positions.
The impairment charge in 2023 was £303 million, down from a charge of £1,522 million in 2022. This is as a result of a significant write-back following the full repayment of debt from a single name client in the fourth quarter and improvements in the Group’s macroeconomic outlook.
The Group’s ECL allowance on loans and advances to customers decreased in the year to £4,039 million (31 December 2022: £4,841 million).
Group Stage 2 loans and advances to customers reduced to £53,167 million (31 December 2022: £61,164 million) and as a percentage of total lending to 11.7 per cent (31 December 2022: 13.3 per cent). This is due to improvements in the macroeconomic outlook transferring assets to Stage 1, along with impacts from securitisations of legacy Retail mortgages in the first quarter and Retail unsecured loans in the fourth quarter. Of the total Group Stage 2 loans and advances to customers, 92.5 per cent are up to date (31 December 2022: 94.1 per cent). Stage 2 coverage reduced slightly to 3.1 per cent (31 December 2022: 3.3 per cent).
Stage 3 loans and advances to customers reduced to £7,147 million (31 December 2022: £7,640 million), and as a percentage of total lending decreased slightly to 1.6 per cent (31 December 2022: 1.7 per cent). This reduction is largely following the full repayment of debt from a single name client in Commercial Banking and securitisation activity, partially offset by flow to default increases in the UK mortgages portfolio. Stage 3 coverage decreased by 7 percentage points to 15.9 per cent (31 December 2022: 23.0 per cent).
Prudent risk appetite and risk management
•The Group continues to take a prudent and proactive approach to credit risk management and credit risk appetite whilst, in line with the Group’s strategy, supporting clients to grow, as well as working closely with customers to help them through cost of living pressures and the impacts of higher interest rates and any deterioration in broader economic conditions
•Sector, asset and product concentrations within the portfolios are closely monitored and controlled, with mitigating actions taken where appropriate. Sector and product risk appetite parameters help manage exposure to certain higher risk and cyclical sectors, segments and asset classes
•The Group’s effective risk management seeks to ensure early identification and management of customers and counterparties who may be showing signs of distress
•The Group will continue to work closely with its customers to ensure that they receive the appropriate level of support, embracing the standards outlined in the Mortgage Charter and including where customers are leveraging Pay As You Grow options under the UK Government Coronavirus scheme
| | | | | | | | |
61 | Lloyds Banking Group plc Annual Report on Form 20-F 2023 | |
Operating and financial review and prospects continued
Impairment charge (credit) by division
| | | | | | | | | | | | | | | | | | | | | | | | | | | | | | | | | | | | | | | | | | | | | | | |
| Loans and
advances to
customers
£m | | Loans and
advances to
banks
£m | | Debt securities
£m | Financial
assets at
fair value
through other
comprehensive
income
£m | | Other
£m | | Undrawn
balances
£m | | 2023 £m | | 2022 £m |
| | | | | | | | | | | | | | | |
| UK mortgages | (61) | | | – | | | – | | | – | | | – | | | 10 | | | (51) | | | 295 | |
| Credit cards | 438 | | | – | | | – | | | – | | | – | | | 19 | | | 457 | | | 571 | |
| Loans and overdrafts | 271 | | | – | | | – | | | – | | | – | | | (20) | | | 251 | | | 499 | |
| UK Motor Finance | 169 | | | – | | | – | | | – | | | – | | | – | | | 169 | | | (2) | |
| Other | 5 | | | – | | | – | | | – | | | – | | | – | | | 5 | | | 10 | |
| Retail | 822 | | | – | | | – | | | – | | | – | | | 9 | | | 831 | | | 1,373 | |
| Small and Medium Businesses | 114 | | | – | | | – | | | – | | | – | | | – | | | 114 | | | 188 | |
| Corporate and Institutional Banking | (615) | | | (5) | | | 1 | | | 3 | | | – | | | (9) | | | (625) | | | 329 | |
| Commercial Banking | (501) | | | (5) | | | 1 | | | 3 | | | – | | | (9) | | | (511) | | | 517 | |
| Insurance, Pensions and Investments | – | | | (2) | | | – | | | – | | | (10) | | | – | | | (12) | | | 24 | |
| Other | – | | | – | | | – | | | (5) | | | – | | | – | | | (5) | | | (392) | |
| Total impairment charge (credit) | 321 | | | (7) | | | 1 | | | (2) | | | (10) | | | – | | | 303 | | | 1,522 | |
| | | | | | | | |
62 | Lloyds Banking Group plc Annual Report on Form 20-F 2023 | |
Operating and financial review and prospects continued
Group loans and advances to customers
The following pages contain analysis of the Group’s loans and advances to customers by sub-portfolio. Loans and advances to customers are categorised into the following stages:
•Stage 1 assets comprise of newly originated assets (unless purchased or originated credit-impaired), as well as those which have not experienced a significant increase in credit risk. These assets carry an expected credit loss allowance equivalent to the expected credit losses that result from those default events that are possible within 12 months of the reporting date (12 month expected credit losses)
•Stage 2 assets are those which have experienced a significant increase in credit risk since origination. These assets carry an expected credit loss allowance equivalent to the expected credit losses arising over the lifetime of the asset (lifetime expected credit losses)
•Stage 3 assets have either defaulted or are otherwise considered to be credit-impaired. These assets carry a lifetime expected credit loss
•Purchased or originated credit-impaired assets (POCI) are those that have been originated or acquired in a credit-impaired state. This includes within the definition of credit-impaired the purchase of a financial asset at a deep discount that reflects impaired credit losses
Total expected credit loss allowance
| | | | | | | | | | | |
| At 31 Dec 2023 £m | | At 31 Dec 2022 £m |
| Customer related balances | | | |
| Drawn | 3,717 | | | 4,518 | |
| Undrawn | 322 | | | 323 | |
| 4,039 | | | 4,841 | |
| Loans and advances to banks | 8 | | | 15 | |
| Debt securities | 11 | | | 9 | |
| Other assets | 26 | | | 38 | |
| Total expected credit loss allowance | 4,084 | | | 4,903 | |
Movements in total expected credit loss allowance
| | | | | | | | | | | | | | | | | | | | | | | | | | | | | | | | | | | |
| Opening ECL at 31 Dec 2022 £m | | | Write-offs and other 1 £m | | Income
statement
charge (credit)
£m | | | Net ECL
increase
(decrease)
£m | | Closing ECL at 31 Dec 2023 £m |
| | | | | | | | | | | |
| | | | | | | | | | | |
UK mortgages2 | 1,209 | | | | (43) | | | (51) | | | | (94) | | | 1,115 | |
| Credit cards | 763 | | | | (410) | | | 457 | | | | 47 | | | 810 | |
Loans and overdrafts3 | 678 | | | | (414) | | | 251 | | | | (163) | | | 515 | |
| UK Motor Finance | 252 | | | | (79) | | | 169 | | | | 90 | | | 342 | |
| Other | 86 | | | | (3) | | | 5 | | | | 2 | | | 88 | |
| Retail | 2,988 | | | | (949) | | | 831 | | | | (118) | | | 2,870 | |
| Small and Medium Businesses | 549 | | | | (125) | | | 114 | | | | (11) | | | 538 | |
| Corporate and Institutional Banking | 1,320 | | | | (51) | | | (625) | | | | (676) | | | 644 | |
| Commercial Banking | 1,869 | | | | (176) | | | (511) | | | | (687) | | | 1,182 | |
| Insurance, Pensions and Investments | 40 | | | | (2) | | | (12) | | | | (14) | | | 26 | |
| Other | 6 | | | | 5 | | | (5) | | | | – | | | 6 | |
Total4 | 4,903 | | | | (1,122) | | | 303 | | | | (819) | | | 4,084 | |
| | | | | | | | | | | |
1 Contains adjustments in respect of purchased or originated credit-impaired financial assets.
2 Includes £60 million within write-offs and other relating to the £2.5 billion UK mortgages securitisation in the first quarter of 2023.
3 Includes £112 million, within write-offs and other relating to the £2.7 billion unsecured loans securitisation in the fourth quarter of 2023.
4 Total ECL includes £45 million relating to other non customer-related assets (31 December 2022: £62 million).
| | | | | | | | |
63 | Lloyds Banking Group plc Annual Report on Form 20-F 2023 | |
Operating and financial review and prospects continued
Loans and advances to customers and expected credit loss allowance
| | | | | | | | | | | | | | | | | | | | | | | | | | | | | | | | | | | | | | | | | |
| Stage 1
£m | | Stage 2
£m | | Stage 3
£m | | POCI
£m | | Total
£m | | Stage 2
as % of
total
% | | Stage 3
as % of
total
% |
At 31 December 2023 | | | | | | | | | | | | | |
| Loans and advances to customers | | | | | | | | | | | | | |
| UK mortgages | 256,596 | | | 38,533 | | | 4,337 | | | 7,854 | | | 307,320 | | | 12.5 | | | 1.4 | |
| Credit cards | 12,625 | | | 2,908 | | | 284 | | | – | | | 15,817 | | | 18.4 | | | 1.8 | |
| Loans and overdrafts | 7,103 | | | 1,187 | | | 196 | | | – | | | 8,486 | | | 14.0 | | | 2.3 | |
| UK Motor Finance | 13,541 | | | 2,027 | | | 112 | | | – | | | 15,680 | | | 12.9 | | | 0.7 | |
| Other | 15,898 | | | 525 | | | 144 | | | – | | | 16,567 | | | 3.2 | | | 0.9 | |
| Retail | 305,763 | | | 45,180 | | | 5,073 | | | 7,854 | | | 363,870 | | | 12.4 | | | 1.4 | |
| Small and Medium Businesses | 27,525 | | | 4,458 | | | 1,530 | | | – | | | 33,513 | | | 13.3 | | | 4.6 | |
| Corporate and Institutional Banking | 52,049 | | | 3,529 | | | 538 | | | – | | | 56,116 | | | 6.3 | | | 1.0 | |
| Commercial Banking | 79,574 | | | 7,987 | | | 2,068 | | | – | | | 89,629 | | | 8.9 | | | 2.3 | |
| | | | | | | | | | | | | |
Other1 | (43) | | | – | | | 6 | | | – | | | (37) | | | | | |
| Total gross lending | 385,294 | | | 53,167 | | | 7,147 | | | 7,854 | | | 453,462 | | | 11.7 | | | 1.6 | |
| ECL allowance on drawn balances | (900) | | | (1,467) | | | (1,137) | | | (213) | | | (3,717) | | | | | |
| Net balance sheet carrying value | 384,394 | | | 51,700 | | | 6,010 | | | 7,641 | | | 449,745 | | | | | |
| | | | | | | | | | | | | |
| Customer related ECL allowance (drawn and undrawn) |
| UK mortgages | 169 | | | 376 | | | 357 | | | 213 | | | 1,115 | | | | | |
| Credit cards | 234 | | | 446 | | | 130 | | | – | | | 810 | | | | | |
| Loans and overdrafts | 153 | | | 244 | | | 118 | | | – | | | 515 | | | | | |
UK Motor Finance2 | 188 | | | 91 | | | 63 | | | – | | | 342 | | | | | |
| Other | 20 | | | 21 | | | 47 | | | – | | | 88 | | | | | |
| Retail | 764 | | | 1,178 | | | 715 | | | 213 | | | 2,870 | | | | | |
| Small and Medium Businesses | 140 | | | 231 | | | 167 | | | – | | | 538 | | | | | |
| Corporate and Institutional Banking | 156 | | | 218 | | | 253 | | | – | | | 627 | | | | | |
| Commercial Banking | 296 | | | 449 | | | 420 | | | – | | | 1,165 | | | | | |
| | | | | | | | | | | | | |
| Other | – | | | – | | | 4 | | | – | | | 4 | | | | | |
| Total | 1,060 | | | 1,627 | | | 1,139 | | | 213 | | | 4,039 | | | | | |
| | | | | | | | | | | | | |
Customer related ECL allowance (drawn and undrawn) as a percentage of loans and advances to customers3 |
| UK mortgages | 0.1 | | | 1.0 | | | 8.2 | | | 2.7 | | | 0.4 | | | | | |
| Credit cards | 1.9 | | | 15.3 | | | 45.8 | | | – | | | 5.1 | | | | | |
| Loans and overdrafts | 2.2 | | | 20.6 | | | 60.2 | | | – | | | 6.1 | | | | | |
| UK Motor Finance | 1.4 | | | 4.5 | | | 56.3 | | | – | | | 2.2 | | | | | |
| Other | 0.1 | | | 4.0 | | | 32.6 | | | – | | | 0.5 | | | | | |
| Retail | 0.2 | | | 2.6 | | | 14.1 | | | 2.7 | | | 0.8 | | | | | |
| Small and Medium Businesses | 0.5 | | | 5.2 | | | 10.9 | | | – | | | 1.6 | | | | | |
| Corporate and Institutional Banking | 0.3 | | | 6.2 | | | 47.0 | | | – | | | 1.1 | | | | | |
| Commercial Banking | 0.4 | | | 5.6 | | | 20.3 | | | – | | | 1.3 | | | | | |
| | | | | | | | | | | | | |
| Other | | | – | | | 66.7 | | | – | | | | | | | |
| Total | 0.3 | | | 3.1 | | | 15.9 | | | 2.7 | | | 0.9 | | | | | |
1 Contains centralised fair value hedge accounting adjustments.
2 UK Motor Finance for Stages 1 and 2 include £187 million relating to provisions against residual values of vehicles subject to finance leasing agreements for Black Horse. These provisions are included within the calculation of coverage ratios.
3 Allowance for expected credit losses on loans and advances to customers as a percentage of gross loans and advances to customers including loans in recoveries.
| | | | | | | | |
64 | Lloyds Banking Group plc Annual Report on Form 20-F 2023 | |
Operating and financial review and prospects continued
| | | | | | | | | | | | | | | | | | | | | | | | | | | | | | | | | | | | | | | | | |
| Stage 1
£m | | Stage 2
£m | | Stage 3
£m | | POCI
£m | | Total
£m | | Stage 2
as % of
total
% | | Stage 3
as % of
total
% |
At 31 December 2022 | | | | | | | | | | | | | |
| Loans and advances to customers | | | | | | | | | | | | | |
| UK mortgages | 257,517 | | | 41,783 | | | 3,416 | | | 9,622 | | | 312,338 | | | 13.4 | | | 1.1 | |
| Credit cards | 11,416 | | | 3,287 | | | 289 | | | – | | | 14,992 | | | 21.9 | | | 1.9 | |
| Loans and overdrafts | 8,357 | | | 1,713 | | | 247 | | | – | | | 10,317 | | | 16.6 | | | 2.4 | |
| UK Motor Finance | 12,174 | | | 2,245 | | | 154 | | | – | | | 14,573 | | | 15.4 | | | 1.1 | |
| Other | 13,990 | | | 643 | | | 157 | | | – | | | 14,790 | | | 4.3 | | | 1.1 | |
| Retail | 303,454 | | | 49,671 | | | 4,263 | | | 9,622 | | | 367,010 | | | 13.5 | | | 1.2 | |
| Small and Medium Businesses | 30,781 | | | 5,654 | | | 1,760 | | | – | | | 38,195 | | | 14.8 | | | 4.6 | |
| Corporate and Institutional Banking | 49,728 | | | 5,839 | | | 1,611 | | | – | | | 57,178 | | | 10.2 | | | 2.8 | |
| Commercial Banking | 80,509 | | | 11,493 | | | 3,371 | | | – | | | 95,373 | | | 12.1 | | | 3.5 | |
Other1 | (2,972) | | | – | | | 6 | | | – | | | (2,966) | | | | | |
| Total gross lending | 380,991 | | | 61,164 | | | 7,640 | | | 9,622 | | | 459,417 | | | 13.3 | | | 1.7 | |
| ECL allowance on drawn balances | (700) | | | (1,808) | | | (1,757) | | | (253) | | | (4,518) | | | | | |
| Net balance sheet carrying value | 380,291 | | | 59,356 | | | 5,883 | | | 9,369 | | | 454,899 | | | | | |
| | | | | | | | | | | | | |
| Customer related ECL allowance (drawn and undrawn) |
| UK mortgages | 92 | | | 553 | | | 311 | | | 253 | | | 1,209 | | | | | |
| Credit cards | 173 | | | 477 | | | 113 | | | – | | | 763 | | | | | |
| Loans and overdrafts | 185 | | | 367 | | | 126 | | | – | | | 678 | | | | | |
UK Motor Finance2 | 95 | | | 76 | | | 81 | | | – | | | 252 | | | | | |
| Other | 16 | | | 18 | | | 52 | | | – | | | 86 | | | | | |
| Retail | 561 | | | 1,491 | | | 683 | | | 253 | | | 2,988 | | | | | |
| Small and Medium Businesses | 129 | | | 271 | | | 149 | | | – | | | 549 | | | | | |
| Corporate and Institutional Banking | 144 | | | 231 | | | 925 | | | – | | | 1,300 | | | | | |
| Commercial Banking | 273 | | | 502 | | | 1,074 | | | – | | | 1,849 | | | | | |
| Other | – | | | – | | | 4 | | | – | | | 4 | | | | | |
| Total | 834 | | | 1,993 | | | 1,761 | | | 253 | | | 4,841 | | | | | |
| | | | | | | | | | | | | |
Customer related ECL allowance (drawn and undrawn) as a percentage of loans and advances to customers3 |
| UK mortgages | – | | | 1.3 | | | 9.1 | | | 2.6 | | | 0.4 | | | | | |
| Credit cards | 1.5 | | | 14.5 | | | 39.1 | | | – | | | 5.1 | | | | | |
| Loans and overdrafts | 2.2 | | | 21.4 | | | 51.0 | | | – | | | 6.6 | | | | | |
| UK Motor Finance | 0.8 | | | 3.4 | | | 52.6 | | | – | | | 1.7 | | | | | |
| Other | 0.1 | | | 2.8 | | | 33.1 | | | – | | | 0.6 | | | | | |
| Retail | 0.2 | | | 3.0 | | | 16.0 | | | 2.6 | | | 0.8 | | | | | |
| Small and Medium Businesses | 0.4 | | | 4.8 | | | 8.5 | | | – | | | 1.4 | | | | | |
| Corporate and Institutional Banking | 0.3 | | | 4.0 | | | 57.4 | | | – | | | 2.3 | | | | | |
| Commercial Banking | 0.3 | | | 4.4 | | | 31.9 | | | – | | | 1.9 | | | | | |
| Other | | | – | | | 66.7 | | | – | | | | | | | |
| Total | 0.2 | | | 3.3 | | | 23.0 | | | 2.6 | | | 1.1 | | | | | |
1 Contains centralised fair value hedge accounting adjustments.
2 UK Motor Finance for Stages 1 and 2 include £92 million relating to provisions against residual values of vehicles subject to finance leasing agreements for Black Horse. These provisions are included within the calculation of coverage ratios.
3 Allowance for expected credit losses on loans and advances to customers as a percentage of gross loans and advances to customers including loans in recoveries.
| | | | | | | | |
65 | Lloyds Banking Group plc Annual Report on Form 20-F 2023 | |
Operating and financial review and prospects continued
Stage 2 loans and advances to customers and expected credit loss allowance
| | | | | | | | | | | | | | | | | | | | | | | | | | | | | | | | | | | | | | | | | | | | | | | | | | | | | | | | | | | | | | | | | | | | | | | | | | | | | |
| Up to date | | 1-30 days past due2 | | Over 30 days past due | | |
| PD movements | | Other1 | | | |
Gross
lending
£m | | ECL3 £m | As % of
gross
lending
% | Gross
lending
£m | | ECL3 £m | As % of
gross
lending
% | Gross
lending
£m | | ECL3 £m | As % of
gross
lending
% | Gross
lending
£m | | ECL3 £m | As % of
gross
lending
% | | | | |
At 31 December 2023 | | | | | | | | | | | | | | | | | | | | | | | | | | | | |
| UK mortgages | 26,665 | | | 146 | | | 0.5 | | 9,024 | | | 133 | | | 1.5 | | 1,771 | | | 52 | | | 2.9 | | 1,073 | | | 45 | | | 4.2 | | | | | | |
| Credit cards | 2,612 | | | 345 | | | 13.2 | | 145 | | | 49 | | | 33.8 | | 115 | | | 34 | | | 29.6 | | 36 | | | 18 | | | 50.0 | | | | | | |
| Loans and overdrafts | 756 | | | 148 | | | 19.6 | | 279 | | | 46 | | | 16.5 | | 112 | | | 34 | | | 30.4 | | 40 | | | 16 | | | 40.0 | | | | | | |
| UK Motor Finance | 735 | | | 30 | | | 4.1 | | 1,120 | | | 30 | | | 2.7 | | 138 | | | 21 | | | 15.2 | | 34 | | | 10 | | | 29.4 | | | | | | |
| Other | 125 | | | 5 | | | 4.0 | | 295 | | | 7 | | | 2.4 | | 52 | | | 5 | | | 9.6 | | 53 | | | 4 | | | 7.5 | | | | | | |
| Retail | 30,893 | | | 674 | | | 2.2 | | 10,863 | | | 265 | | | 2.4 | | 2,188 | | | 146 | | | 6.7 | | 1,236 | | | 93 | | | 7.5 | | | | | | |
| Small and Medium Businesses | 3,455 | | | 202 | | | 5.8 | | 590 | | | 17 | | | 2.9 | | 253 | | | 8 | | | 3.2 | | 160 | | | 4 | | | 2.5 | | | | | | |
| Corporate and Institutional Banking | 3,356 | | | 214 | | | 6.4 | | 14 | | | – | | | – | | 28 | | | 3 | | | 10.7 | | 131 | | | 1 | | | 0.8 | | | | | | |
| Commercial Banking | 6,811 | | | 416 | | | 6.1 | | 604 | | | 17 | | | 2.8 | | 281 | | | 11 | | | 3.9 | | 291 | | | 5 | | | 1.7 | | | | | | |
| Total | 37,704 | | | 1,090 | | | 2.9 | | 11,467 | | | 282 | | | 2.5 | | 2,469 | | | 157 | | | 6.4 | | 1,527 | | | 98 | | | 6.4 | | | | | | |
| At 31 December 2022 | | | | | | | | | | | | | | | | | | | | | | | | | | | | |
| UK mortgages | 29,718 | | | 263 | | | 0.9 | | 9,613 | | | 160 | | | 1.7 | | 1,633 | | | 67 | | | 4.1 | | 819 | | | 63 | | | 7.7 | | | | | | |
| Credit cards | 3,023 | | | 386 | | | 12.8 | | 136 | | | 46 | | | 33.8 | | 98 | | | 30 | | | 30.6 | | 30 | | | 15 | | | 50.0 | | | | | | |
| Loans and overdrafts | 1,311 | | | 249 | | | 19.0 | | 234 | | | 53 | | | 22.6 | | 125 | | | 45 | | | 36.0 | | 43 | | | 20 | | | 46.5 | | | | | | |
| UK Motor Finance | 1,047 | | | 28 | | | 2.7 | | 1,045 | | | 23 | | | 2.2 | | 122 | | | 18 | | | 14.8 | | 31 | | | 7 | | | 22.6 | | | | | | |
| Other | 160 | | | 5 | | | 3.1 | | 384 | | | 7 | | | 1.8 | | 54 | | | 4 | | | 7.4 | | 45 | | | 2 | | | 4.4 | | | | | | |
| Retail | 35,259 | | | 931 | | | 2.6 | | 11,412 | | | 289 | | | 2.5 | | 2,032 | | | 164 | | | 8.1 | | 968 | | | 107 | | | 11.1 | | | | | | |
| Small and Medium Businesses | 4,081 | | | 223 | | | 5.5 | | 1,060 | | | 27 | | | 2.5 | | 339 | | | 13 | | | 3.8 | | 174 | | | 8 | | | 4.6 | | | | | | |
| Corporate and Institutional Banking | 5,728 | | | 229 | | | 4.0 | | 27 | | | – | | | – | | | 30 | | | 1 | | | 3.3 | | 54 | | | 1 | | | 1.9 | | | | | | |
| Commercial Banking | 9,809 | | | 452 | | | 4.6 | | 1,087 | | | 27 | | | 2.5 | | 369 | | | 14 | | | 3.8 | | 228 | | | 9 | | | 3.9 | | | | | | |
| Total | 45,068 | | | 1,383 | | | 3.1 | | 12,499 | | | 316 | | | 2.5 | | 2,401 | | | 178 | | | 7.4 | | 1,196 | | | 116 | | | 9.7 | | | | | | |
1 Includes forbearance, client and product-specific indicators not reflected within quantitative PD assessments.
2 Includes assets that have triggered PD movements, or other rules, given that being 1 to 29 days in arrears in and of itself is not a Stage 2 trigger.
3 Expected credit loss allowance on loans and advances to customers (drawn and undrawn).
The Group’s assessment of a significant increase in credit risk, and resulting categorisation of Stage 2, includes customers moving into early arrears as well as a broader assessment that an up to date customer has experienced a level of deterioration in credit risk since origination. A more sophisticated assessment is required for up to date customers, which varies across divisions and product type. This assessment incorporates specific triggers such as a significant proportionate increase in probability of default relative to that at origination, recent arrears, forbearance activity, internal watch lists and external bureau flags. Up to date exposures in Stage 2 are likely to show lower levels of expected credit loss (ECL) allowance relative to those that have already moved into arrears given that an arrears status typically reflects a stronger indication of future default and greater likelihood of credit losses.
| | | | | | | | |
66 | Lloyds Banking Group plc Annual Report on Form 20-F 2023 | |
Operating and financial review and prospects continued
Additional information
ECL sensitivity to economic assumptions
The measurement of ECL reflects an unbiased probability-weighted range of possible future economic outcomes. The Group achieves this by generating four economic scenarios to reflect the range of outcomes; the central scenario reflects the Group’s base case assumptions used for medium-term planning purposes, an upside and a downside scenario are also selected together with a severe downside scenario. If the base case moves adversely, it generates a new, more adverse downside and severe downside which are then incorporated into the ECL. Consistent with prior years, the base case, upside and downside scenarios carry a 30 per cent weighting; the severe downside is weighted at 10 per cent.
The table below shows the Group’s ECL for the probability-weighted, upside, base case, downside and severe downside scenarios, with the severe downside scenario incorporating adjustments made to CPI inflation and UK Bank Rate paths. The stage allocation for an asset is based on the overall scenario probability-weighted probability of default and hence the staging of assets is constant across all the scenarios. In each economic scenario the ECL for individual assessments is held constant reflecting the basis on which they are evaluated. Judgemental adjustments applied through changes to model inputs or parameters, or more qualitative post model adjustments, are apportioned across the scenarios in proportion to modelled ECL where this better reflects the sensitivity of these adjustments to each scenario. The probability-weighted view shows the extent to which a higher ECL allowance has been recognised to take account of multiple economic scenarios relative to the base case; the uplift being £678 million compared to £692 million at 31 December 2022.
| | | | | | | | | | | | | | | | | |
| Probability-
weighted
£m | Upside
£m | Base case
£m | Downside
£m | Severe
downside
£m |
| | | | | |
| UK mortgages | 1,115 | | 395 | | 670 | | 1,155 | | 4,485 | |
| Credit cards | 810 | | 600 | | 771 | | 918 | | 1,235 | |
| Other Retail | 945 | | 850 | | 920 | | 981 | | 1,200 | |
| Commercial Banking | 1,182 | | 793 | | 1,013 | | 1,383 | | 2,250 | |
| Other | 32 | | 32 | | 32 | | 32 | | 32 | |
| At 31 December 2023 | 4,084 | | 2,670 | | 3,406 | | 4,469 | | 9,202 | |
| | | | | |
| UK mortgages | 1,209 | | 514 | | 790 | | 1,434 | | 3,874 | |
| Credit cards | 763 | | 596 | | 727 | | 828 | | 1,180 | |
| Other Retail | 1,016 | | 907 | | 992 | | 1,056 | | 1,290 | |
| Commercial Banking | 1,869 | | 1,459 | | 1,656 | | 2,027 | | 3,261 | |
| Other | 46 | | 46 | | 46 | | 47 | | 47 | |
| At 31 December 2022 | 4,903 | | 3,522 | | 4,211 | | 5,392 | | 9,652 | |
| | | | | | | | |
67 | Lloyds Banking Group plc Annual Report on Form 20-F 2023 | |
Operating and financial review and prospects continued
Group derivative credit risk exposures
Derivative credit risk exposure
| | | | | | | | | | | | | | | | | | | | | | | | | | | | | | | | | | | |
| 2023 | | 2022 |
| | Traded over the counter | | | | | Traded over the counter | | |
| Traded on
recognised
exchanges
£m | Settled
by central
counterparties
£m | Not settled
by central
counterparties
£m | | Total
£m | | Traded on
recognised
exchanges
£m | Settled
by central
counterparties
£m | Not settled
by central
counterparties
£m | | Total
£m |
| Notional balances | | | | | | | | | | | |
| Foreign exchange | – | | – | | 575,577 | | | 575,577 | | | – | | – | | 465,800 | | | 465,800 | |
| Interest rate | 29,873 | | 8,031,269 | | 210,669 | | | 8,271,811 | | | 31,393 | | 6,422,514 | | 206,006 | | | 6,659,913 | |
| Equity and other | 3,616 | | – | | 5,847 | | | 9,463 | | | 4,670 | | – | | 11,820 | | | 16,490 | |
| Credit | – | | 94 | | 5,255 | | | 5,349 | | | – | | 286 | | 6,403 | | | 6,689 | |
| Total | 33,489 | | 8,031,363 | | 797,348 | | | 8,862,200 | | | 36,063 | | 6,422,800 | | 690,029 | | | 7,148,892 | |
| Fair values | | | | | | | | | | | |
| Assets | | 2,511 | | 19,814 | | | | | | 1,033 | | 23,643 | | | |
| Liabilities | | (3,210) | | (16,833) | | | | | | (1,850) | | (22,153) | | | |
| Net (liability) asset | | (699) | | 2,981 | | | | | | (817) | | 1,490 | | | |
The total notional principal amount of interest rate, exchange rate, credit derivative and equity and other contracts outstanding at 31 December 2023 and 31 December 2022 is shown in the table above. The notional principal amount does not, however, represent the Group’s credit risk exposure, which is limited to the current cost of replacing contracts with a positive value to the Group. Such amounts are reflected in note 52 on page F-109. Retail
•The Retail portfolio has remained resilient and well-positioned, despite pressure on consumer finances and affordability from a higher cost of living, inflationary pressures and rising interest rates. Robust risk management remains in place, with strong affordability and indebtedness controls for both new and existing lending and a prudent risk appetite approach
•The Retail lending book is concentrated in lower risk segments which are better able to withstand the cost of living challenge and higher interest rates
•In UK mortgages, new to arrears were relatively stable throughout 2023, having increased slightly at the start of the year, largely driven by legacy vintages (mortgages originated in the period 2006 to 2008). Flows to default increased during the year for the same reason with trends stabilising in the second half
•Unsecured portfolios continue to exhibit stable new to arrears and flow to default trends, broadly at, or below pre-pandemic levels
•The Group is closely monitoring the impacts of a higher cost of living on consumers to ensure it remains vigilant for any signs of deterioration. Lending strategies are under continuous review and have been proactively managed and calibrated to the latest macroeconomic outlook, with actions taken to enhance both living and housing cost assumptions in affordability assessments
•The Retail impairment charge in 2023 was £831 million and is materially lower than the charge of £1,373 million for 2022, largely due to favourable updates to the Group’s macroeconomic outlook
•All existing IFRS 9 staging rules and triggers have been maintained across Retail from the 2022 year end. Retail customer related ECL allowance as a percentage of drawn loans and advances (coverage) is stable at 0.8 per cent (31 December 2022: 0.8 per cent)
•Favourable updates to the Group’s macroeconomic outlook have reduced Stage 2 loans and advances to 12.4 per cent of the Retail portfolio (31 December 2022: 13.5 per cent), of which 92.4 per cent are up to date loans (31 December 2022: 94.0 per cent). Stage 2 ECL coverage also reduces slightly to 2.6 per cent (31 December 2022: 3.0 per cent)
•Increased flows to default within UK mortgages result in an increase in Stage 3 loans and advances to 1.4 per cent of total loans and advances (31 December 2022: 1.2 per cent). Retail Stage 3 ECL coverage decreases to 14.1 per cent (31 December 2022: 16.0 per cent) due to portfolio mix changes; notably because UK mortgages hold comparatively lower coverage in comparison to other Retail products due to security. Underlying Stage 3 loans and advances, and Stage 3 coverage for all other Retail products excluding UK mortgages remain broadly stable
UK mortgages
•The UK mortgages portfolio is well positioned with low arrears and a strong loan to value (LTV) profile. The Group has actively improved the quality of the portfolio over the years using robust affordability and credit controls, while the balances of higher risk legacy vintages have continued to reduce
•New to arrears in the UK mortgages portfolio were relatively stable throughout 2023, having increased slightly at the start of the year, largely driven by legacy vintages, where there is a high concentration of variable rate customers. The Group is proactively monitoring existing mortgage customers as they reach the end of fixed rate deals with customers’ immediate behaviour remaining stable
•Total loans and advances decreased to £307.3 billion (31 December 2022: £312.3 billion), with an increase in average LTV. The proportion of balances with a LTV greater than 90 per cent increased. The average LTV of new business remained stable
•Updated macroeconomic assumptions within the ECL model, most notably to account for more resilient house price performance than previously anticipated, resulted in a net impairment release of £51 million for 2023 compared to a charge of £295 million for 2022. Total ECL coverage remained stable at 0.4 per cent (31 December 2022: 0.4 per cent)
•Favourable macroeconomic updates also result in reductions to Stage 2 loans and advances to 12.5 per cent of the portfolio (31 December 2022: 13.4 per cent), largely from up to date loans, and Stage 2 ECL coverage falling slightly to 1.0 per cent (31 December 2022: 1.3 per cent)
•Stage 3 loans and advances increased to 1.4 per cent of the portfolio (31 December 2022: 1.1 per cent) due to increases in legacy variable rate customers triggering 90 days past due. Stage 3 ECL coverage decreased to 8.2 per cent (31 December 2022: 9.1 per cent) due to the favourable macroeconomic outlook
| | | | | | | | |
68 | Lloyds Banking Group plc Annual Report on Form 20-F 2023 | |
Operating and financial review and prospects continued
Credit cards
•Credit cards balances increased to £15.8 billion (31 December 2022: £15.0 billion) due to continued recovery in customer spend
•The credit card portfolio is a prime book, arrears rates are broadly similar to pre-pandemic levels with continued strong repayment rates
•Impairment charge of £457 million for 2023, is lower than the charge of £571 million in 2022 as increased arrears and default flows as a result of high inflation and cost of living pressures have not emerged as previously anticipated. Total ECL coverage remains stable at 5.1 per cent (31 December 2022: 5.1 per cent)
•Favourable updates to the macroeconomic outlook result in a reduction in Stage 2 loans and advances to 18.4 per cent of the portfolio (31 December 2022: 21.9 per cent), with Stage 2 ECL coverage broadly stable at 15.3 per cent (31 December 2022: 14.5 per cent)
•Resilient underlying arrears and default performance has also resulted in stable Stage 3 loans and advances at 1.8 per cent of the portfolio (31 December 2022: 1.9 per cent) and Stage 3 ECL coverage increased to 45.8 per cent (31 December 2022: 39.1 per cent)
Loans and overdrafts
•Loans and advances for personal current account and the personal loans portfolios reduced to £8.5 billion (31 December 2022: £10.3 billion) driven by a £2.7 billion securitisation in the loans portfolio
•Impairment charge of £251 million for 2023 is lower than the charge of £499 million for 2022 again due to favourable macroeconomic updates
•ECL coverage levels at a total level and by individual stage all remain broadly stable
UK Motor Finance
•The UK Motor Finance portfolio increased to £15.7 billion (31 December 2022: £14.6 billion), with lower new car supply versus pre-COVID being offset by used vehicle sales
•Updates to Residual Value (RV) and Voluntary Termination (VT) risk held against Personal Contract Purchase (PCP) and Hire Purchase (HP) lending are included within the impairment charge. Recent falls in used car prices have resulted in a notable increase in this item to £187 million as at 31 December 2023 (31 December 2022: £92 million)
•Updates to account for adverse used car price performance, including RV/VT risk, result in an impairment charge of £169 million for 2023 that is materially higher than a credit of £2 million for 2022, which benefited from more stable used car prices, partially driven by global supply issues following the pandemic
•ECL coverage levels at a total level and by individual stage all increased. Total ECL coverage to 2.2 per cent (31 December 2022: 1.7 per cent), Stage 2 ECL coverage to 4.5 per cent (31 December 2022: 3.4 per cent) and Stage 3 ECL to 56.3 per cent (31 December 2022: 52.6 per cent)
Other
•Other loans and advances increased slightly to £16.6 billion (31 December 2022: £14.8 billion)
•Stage 3 loans and advances remain stable at 0.9 per cent (31 December 2022: 1.1 per cent) and Stage 3 coverage at 32.6 per cent (31 December 2022: 33.1 per cent)
•There was a net impairment charge of £5 million for 2023 compared to a charge of £10 million for 2022
Retail UK mortgages loans and advances to customers1
| | | | | | | | |
| At 31 Dec 2023 £m | At 31 Dec 2022 £m |
| Mainstream | 254,416 | | 253,283 | |
| Buy-to-let | 47,549 | | 51,529 | |
| Specialist | 5,355 | | 7,526 | |
| Total | 307,320 | | 312,338 | |
1 Balances include the impact of HBOS-related acquisition adjustments.
| | | | | | | | |
69 | Lloyds Banking Group plc Annual Report on Form 20-F 2023 | |
Operating and financial review and prospects continued
Interest-only mortgages
The Group provides interest-only mortgages to owner occupier mortgage customers whereby only payments of interest are made for the term of the mortgage with the customer responsible for repaying the principal outstanding at the end of the loan term. At 31 December 2023, owner occupier interest-only balances as a proportion of total owner occupier balances had reduced to 14.4 per cent (31 December 2022: 16.4 per cent). The average indexed loan to value remained low at 36.9 per cent (31 December 2022: 35.5 per cent).
For existing interest-only mortgages, a contact strategy is in place during the term of the mortgage to ensure that customers are aware of their obligations to repay the principal upon maturity of the loan.
Treatment strategies are in place to help customers anticipate and plan for repayment of capital at maturity and support those who may have difficulty in repaying the principal amount. A dedicated specialist team supports customers who have passed their contractual maturity date and are unable to fully repay the principal. A range of treatments are offered to customers based on their individual circumstances to create fair and sustainable outcomes.
Analysis of owner occupier interest-only mortgages
| | | | | | | | |
| At 31 Dec 2023 | At 31 Dec 2022 |
| Interest-only balances (£m) | 37,278 | | 42,697 | |
| Stage 1 (%) | 54.7 | | 58.5 | |
| Stage 2 (%) | 27.6 | | 25.3 | |
| Stage 3 (%) | 5.6 | | 3.7 | |
| Purchased or originated credit-impaired (%) | 12.1 | | 12.6 | |
| | |
Average loan to value (%) | 36.9 | | 35.5 | |
| | |
| Maturity profile (£m) | | |
| Due | 1,982 | | 1,931 | |
| Within 1 year | 1,129 | | 1,453 | |
| 2 to 5 years | 8,803 | | 8,832 | |
| 6 to 10 years | 13,918 | | 16,726 | |
| Greater than 10 years | 11,446 | | 13,755 | |
| | |
Past term interest-only balances1 (£m) | 1,925 | | 1,906 | |
| Stage 1 (%) | 0.2 | | 0.2 | |
| Stage 2 (%) | 9.3 | | 11.9 | |
| Stage 3 (%) | 52.2 | | 45.6 | |
| Purchased or originated credit-impaired (%) | 38.4 | | 42.3 | |
| | |
Average loan to value (%) | 35.2 | | 33.2 | |
| Negative equity (%) | 2.6 | | 2.0 | |
1 Balances where all interest-only elements have moved past term. Some may subsequently have had a term extension, so are no longer classed as due.
| | | | | | | | |
70 | Lloyds Banking Group plc Annual Report on Form 20-F 2023 | |
Operating and financial review and prospects continued
Retail forbearance
The basis of disclosure for forbearance is aligned to definitions used in the European Banking Authority’s FINREP reporting. Total forbearance for the major retail portfolios has reduced by £0.4 billion to £3.9 billion. This is driven by a reduction in customers with a historical capitalisation treatment (where arrears were reset and added to the loan balance) and, following the implementation of new regulatory requirements, the removal of past term interest-only mortgages as a forbearance event where a forbearance treatment has not been granted.
The main customer treatments included are: repair, where arrears are added to the loan balance and the arrears position cancelled; instances where there are suspensions of interest and/or capital repayments; and refinance personal loans.
As a percentage of loans and advances, forbearance loans remain broadly static at 1.1 per cent at 31 December 2023 (31 December 2022: 1.2 per cent).
Retail forborne loans and advances (audited)
| | | | | | | | | | | | | | |
| Total
£m | Of which
Stage 2
£m | Of which
Stage 3
£m | Of which
POCI
£m |
At 31 December 2023 | | | | |
| UK mortgages | 3,269 | | 695 | | 1,008 | | 1,552 | |
| Credit cards | 268 | | 89 | | 141 | | – | |
| Loans and overdrafts | 275 | | 107 | | 108 | | – | |
| UK Motor Finance | 70 | | 36 | | 32 | | – | |
| Total | 3,882 | | 927 | | 1,289 | | 1,552 | |
At 31 December 2022 | | | | |
| UK mortgages | 3,655 | | 684 | | 951 | | 1,995 | |
| Credit cards | 260 | | 90 | | 125 | | – | |
| Loans and overdrafts | 308 | | 125 | | 117 | | – | |
| UK Motor Finance | 77 | | 32 | | 42 | | – | |
| Total | 4,300 | | 931 | | 1,235 | | 1,995 | |
| | | | | | | | |
71 | Lloyds Banking Group plc Annual Report on Form 20-F 2023 | |
Operating and financial review and prospects continued
Commercial Banking
Portfolio overview
•The Commercial portfolio credit quality remains resilient overall, with a focused approach to credit underwriting and monitoring standards and proactively managing exposures to higher risk and vulnerable sectors. While some of the Group’s metrics indicate limited deterioration, especially in consumer-led sectors, these are not considered to be material
•The Group is cognisant of a number of risks and headwinds associated with a heightened inflationary and interest rate environment especially in, but not limited to, sectors reliant upon consumer discretionary spend. Risks include, but are not limited to, reduced asset valuation and refinancing risk, a reduction in market liquidity impacting credit supply and pressure on both household discretionary spending and business margins
•The Group has reduced overall exposure to cyclical sectors since 2019 and continues to closely monitor credit quality, sector and single name concentrations. Sector and credit risk appetite continue to be proactively managed to ensure clients continue to be supported in the right way and the Group is protected
•The Group continues to provide early support to its more vulnerable customers through focused risk management via its Watchlist and Business Support framework, within which volumes have increased marginally in 2023. The Group continues to balance prudent risk appetite with ensuring support for financially viable clients
Impairments
•There was a net impairment release of £511 million in 2023, compared to a net impairment charge of £517 million in 2022. This largely reflects the full repayment of debt from a single name client in the fourth quarter offset by additional charges on existing Stage 3 clients
•ECL allowances decreased in the year to £1,165 million at 31 December 2023 (31 December 2022: £1,849 million). The ECL provision at 31 December 2023 includes the capture of the impact of inflationary pressures and heightened interest rates and assumes additional losses will emerge as a result of these and other emerging risks, through the multiple economic scenarios
•Stage 2 loans and advances decreased to £7,987 million (31 December 2022: £11,493 million), largely as a result of improvements in the Group’s forward-looking modelled macroeconomic assumptions, with 92.8 per cent of Stage 2 balances up to date (31 December 2022: 94.8 per cent). Stage 2 as a proportion of total loans and advances to customers decreased to 8.9 per cent (31 December 2022: 12.1 per cent). Stage 2 ECL coverage was higher at 5.6 per cent (31 December 2022: 4.4 per cent) with the increase in coverage largely a result of the change in the forward-looking multiple economic scenarios
•Stage 3 loans and advances reduced to £2,068 million (31 December 2022: £3,371 million) and as a proportion of total loans and advances to customers, reduced to 2.3 per cent (31 December 2022: 3.5 per cent). Stage 3 ECL coverage reduced to 20.3 per cent (31 December 2022: 31.9 per cent). These reductions are largely driven by the full repayment of debt from a single name client
Commercial Banking UK Real Estate
•Commercial Banking UK Real Estate committed drawn lending stood at c.£10 billion at 31 December 2023 (net of £3.6 billion exposures subject to protection through Significant Risk Transfer (SRT) securitisations). In addition there are undrawn lending facilities of £3.6 billion to predominantly investment grade rated corporate customers
•The Group classifies Direct Real Estate as exposure which is directly supported by cash flows from property activities (as opposed to trading activities, such as hotels, care homes and housebuilders). Exposures of £7.0 billion to social housing providers are also excluded
•Despite some headwinds, including the inflationary environment and the impact of heightened interest rates, the portfolio continues to remain well-positioned and proactively managed with conservative LTVs, good levels of interest cover and appropriate risk mitigants in place
•Overall performance of the portfolio has remained resilient. The Group has seen an increase in cases in its more closely monitored Watchlist category, however this has only translated into a modest flow into Business Support. Rent collection has largely stabilised, although challenges remain in some sectors
•Lending continues to be heavily weighted towards investment real estate (c.91 per cent) rather than development. Of these investment exposures, c.90 per cent have an LTV of less than 70 per cent, with an average LTV of 46 per cent. The average interest cover ratio was 3.3 times, with 78 per cent having interest cover of above 2 times. In SME, LTV at origination has been typically limited to c.55 per cent, given prudent repayment cover criteria (including notional base rate stress)
•The portfolio is well diversified with no speculative commercial development lending (defined as property not pre-sold or pre-let at a level to fully repay the debt or generate sufficient income to meet the minimum interest cover requirements). Approximately 49 per cent of exposures relate to commercial real estate, including c.14 per cent secured by office assets, c.10 per cent by retail assets and c.12 per cent by industrial assets. Approximately 49 per cent of the portfolio relates to residential
•Recognising this is a cyclical sector, total (gross and net) and asset type quantum caps are in place to control origination and exposure, including several asset type categories. Focus remains on the UK market and new business has been written in line with a prudent risk appetite criteria including conservative LTVs, strong quality of income and proven management teams. Development lending criteria also includes maximum loan to gross development value and maximum loan to cost, with funding typically only released against completed work, as confirmed by the Group’s monitoring quantity surveyor
•Use of SRT securitisations also acts as a risk mitigant in this portfolio, with run-off of these carefully managed and sequenced
| | | | | | | | |
72 | Lloyds Banking Group plc Annual Report on Form 20-F 2023 | |
Operating and financial review and prospects continued
LTV – UK Real Estate
| | | | | | | | | | | | | | | | | | | | | | | | | | | | | |
| At 31 December 20231,2 | | At 31 December 20221,2 |
| Stage 1 and 2
£m | Stage 3
£m | Total
£m | Total
% | | Stage 1 and 2
£m | Stage 3
£m | Total
£m | Total
% |
| Investment exposures | | | | | | | | | |
| Less than 60 per cent | 6,161 | | 39 | | 6,200 | | 77.2 | | | 7,821 | | 47 | | 7,868 | | 89.4 | |
| 60 per cent to 70 per cent | 986 | | 9 | | 995 | | 12.4 | | | 503 | | 9 | | 512 | | 5.8 | |
| 70 per cent to 80 per cent | 191 | | 13 | | 204 | | 2.5 | | | 58 | | – | | 58 | | 0.7 | |
| 80 per cent to 100 per cent | 96 | | 45 | | 141 | | 1.8 | | | 17 | | 13 | | 30 | | 0.3 | |
| 100 per cent to 120 per cent | 19 | | 64 | | 83 | | 1.0 | | | 8 | | 23 | | 31 | | 0.4 | |
| 120 per cent to 140 per cent | 11 | | 38 | | 49 | | 0.6 | | | 1 | | – | | 1 | | – | |
| Greater than 140 per cent | 20 | | 20 | | 40 | | 0.5 | | | 13 | | 54 | | 67 | | 0.8 | |
Unsecured3 | 318 | | – | | 318 | | 4.0 | | | 225 | | – | | 225 | | 2.6 | |
| Subtotal | 7,802 | | 228 | | 8,030 | | 100.0 | | | 8,646 | | 146 | | 8,792 | | 100.0 | |
Other4 | 369 | | 19 | | 388 | | | | 346 | | 13 | | 359 | | |
| Total investment | 8,171 | | 247 | | 8,418 | | | | 8,992 | | 159 | | 9,151 | | |
| Development | 776 | | 71 | | 847 | | | | 900 | | 7 | | 907 | | |
UK Government Supported Lending5 | 158 | | 3 | | 161 | | | | 278 | | 5 | | 283 | | |
| Total | 9,105 | | 321 | | 9,426 | | | | 10,170 | | 171 | | 10,341 | | |
1 Excludes Commercial Banking UK Real Estate exposures subject to protection through Significant Risk Transfer transactions.
2 Excludes £0.5 billion in Business Banking (31 December 2022: £0.6 billion).
3 Predominantly Investment grade corporate CRE lending where the Group is relying on the corporate covenant.
4 Mainly lower value transactions where LTV not recorded on Commercial Banking UK Real Estate monitoring system.
5 Bounce Back Loan Scheme (BBLS) and Coronavirus Business Interruption Loan Scheme (CBILS) lending to real estate clients, where government guarantees are in place at 100 per cent and 80 per cent, respectively.
Commercial Banking forbearance
Commercial Banking forborne loans and advances (audited)
| | | | | | | | | | | | | | | | | |
| At 31 December 2023 | | At 31 December 2022 |
| Total
£m | Of which
Stage 3
£m | | Total
£m | Of which
Stage 3
£m |
| Type of forbearance | | | | | |
| Refinancing | 43 | | 43 | | | 13 | | 11 | |
| Modification | 2,346 | | 1,903 | | | 3,484 | | 2,908 | |
| Total | 2,389 | | 1,946 | | | 3,497 | | 2,919 | |
| | | | | | | | |
73 | Lloyds Banking Group plc Annual Report on Form 20-F 2023 | |
Operating and financial review and prospects continued
Loan portfolio
Summary of loan loss experience
| | | | | | | | | | | |
| IFRS | 2023 £m | 2022 £m | 2021 £m |
| Gross loans and advances to banks and customers and reverse repurchase agreements | 503,005 | | 514,929 | | 514,142 | |
| Allowance for impairment losses | 3,725 | | 4,533 | | 3,821 | |
| Ratio of allowance for credit losses to total lending (%) | 0.7 | | 0.9 | | 0.7 | |
| | | | | | | | | | | | | | | | | | | | | | | | | | | | | | | | | | | |
| Advances written off, net of recoveries | | As a percentage of average lending |
| IFRS | 2023 £m | | 2022 £m | | 2021 £m | | 2023 % | | 2022 % | | 2021 % |
| Loans and advances to banks | – | | | – | | | – | | | – | | | – | | | – | |
| Loans and advances to customers: | | | | | | | | | | | |
| Financial, business and other services | (45) | | | (18) | | | (41) | | | 0.1 | | | – | | | 0.1 | |
| Manufacturing | (9) | | | (10) | | | (2) | | | 0.2 | | | 0.3 | | | – | |
| Mortgages | (101) | | | (17) | | | (55) | | | – | | | – | | | – | |
| Other personal lending | (681) | | | (570) | | | (626) | | | 2.6 | | | 2.2 | | | 2.5 | |
| Property companies and construction | (54) | | | (49) | | | (123) | | | 0.2 | | | 0.2 | | | 0.4 | |
| Transport, distribution and hotels | (45) | | | (28) | | | (32) | | | 0.4 | | | 0.2 | | | 0.2 | |
| Other | (180) | | | (67) | | | (56) | | | 0.6 | | | 0.2 | | | 0.2 | |
| (1,115) | | | (759) | | | (935) | | | 0.2 | | | 0.2 | | | 0.2 | |
| Reverse repurchase agreements | – | | | – | | | – | | | – | | | – | | | – | |
| Total net advances written off | (1,115) | | | (759) | | | (935) | | | 0.2 | | | 0.1 | | | 0.2 | |
| | | | | | | | | | | | | | | | | | | | | | | | | | | | | | | | | | | |
| Allowance for expected credit losses | | As a percentage of closing lending |
| IFRS | 2023 £m | | 2022 £m | | 2021 £m | | 2023 % | | 2022 % | | 2021 % |
| Loans and advances to banks | 8 | | | 15 | | | 1 | | | 0.1 | | | 0.1 | | | – | |
| Loans and advances to customers: | | | | | | | | | | | |
| Financial, business and other services | 198 | | | 210 | | | 149 | | | 0.6 | | | 0.6 | | | 0.2 | |
| Manufacturing | 70 | | | 54 | | | 55 | | | 1.7 | | | 1.5 | | | 1.3 | |
| Mortgages | 1,148 | | | 1,252 | | | 1,100 | | | 0.4 | | | 0.4 | | | 0.3 | |
| Other personal lending | 1,195 | | | 1,306 | | | 966 | | | 4.7 | | | 5.0 | | | 3.9 | |
| Property companies and construction | 465 | | | 380 | | | 360 | | | 1.9 | | | 1.5 | | | 1.3 | |
| Transport, distribution and hotels | 154 | | | 940 | | | 799 | | | 1.5 | | | 7.1 | | | 5.9 | |
| Other | 487 | | | 376 | | | 391 | | | 1.6 | | | 1.3 | | | 1.4 | |
| 3,717 | | | 4,518 | | | 3,820 | | | 0.8 | | | 1.0 | | | 0.8 | |
| Reverse repurchase agreements | – | | | – | | | – | | | – | | | – | | | – | |
| At 31 December | 3,725 | | | 4,533 | | | 3,821 | | | 0.7 | | | 0.9 | | | 0.7 | |
| | | | | | | | |
74 | Lloyds Banking Group plc Annual Report on Form 20-F 2023 | |
Operating and financial review and prospects continued
Data risk
Definition
Data risk is defined as the risk of the Group failing to effectively govern, manage and protect its data throughout its lifecycle, including data processed by third parties, or failure to drive value from data; leading to unethical decision making, poor customer outcomes, loss of value to the Group and mistrust.
Exposures
Data risk is present in all aspects of the business where data is processed, both within the Group and by third parties including colleague and contractor, and prospective and existing customers. Data risk manifests:
•When data policies, standards and governance are not adhered to
•When data is processed and fails to meet compliance requirements, for example the General Data Protection Regulations (GDPR) and other data regulatory obligations
•When data-related issues such as quality are not identified, assessed and managed appropriately
•When data is not created, retained, protected, destroyed or retrieved appropriately
Measurement
Data risk covers data governance, data management and data privacy and ethics and is measured through a series of quantitative and qualitative metrics.
Mitigation
The Group continues to invest to reduce data risk exposure to within appetite. Examples include:
•Delivering a data strategy
•Enhancing data quality and capability
•Embedding data by design and ethics
Monitoring
The Group continues to monitor and respond to data-related regulatory initiatives, such as the new Digital Protection and Digital Information Bill expected in 2024, and other legal regimes, for example, the European Commission’s Artificial Intelligence Act.
Data risk is governed through Group and sub-group committees. Significant issues are escalated to Group Risk Committee, in accordance with the Group’s enterprise risk management framework, and RCSA frameworks.
A number of activities support the close monitoring of data risk including:
•Design and monitoring of data risk appetite metrics, including key risk and performance indicators
•Monitoring of significant data-related issues, complaints, events and breaches in accordance with Group Operational Risk and Data policies
•Identification and mitigation of data risk when planning and implementing transformation or business change
Funding and liquidity risk
Definition
Funding risk is defined as the risk that the Group does not have sufficiently stable and diverse sources of funding or the funding structure is inefficient. Liquidity risk is defined as the risk that the Group has insufficient financial resources to meet its commitments as they fall due, or can only secure them at excessive cost.
Exposure
Liquidity exposure represents the potential stressed outflows in any future period less expected inflows. The Group considers liquidity exposure from both an internal and a regulatory perspective.
Measurement
Liquidity risk is managed through a series of measures, tests and reports that are primarily based on contractual maturities with behavioural overlays as appropriate. Note 52 on page F-119 sets out an analysis of assets and liabilities by relevant maturity grouping. The Group undertakes quantitative and qualitative analysis of the behavioural aspects of its assets and liabilities in order to reflect their expected behaviour. Mitigation
The Group manages and monitors liquidity risks and ensures that liquidity risk management systems and arrangements are adequate with regard to the internal risk appetite, Group strategy and regulatory requirements. Liquidity policies and procedures are subject to independent internal oversight by Risk. Overseas branches and subsidiaries of the Group may also be required to meet the liquidity requirements of the entity’s domestic country. Management of liquidity requirements is performed by the overseas branch or subsidiary in line with Group policy. Liquidity risk of the Insurance business is actively managed and monitored within the Insurance business. The Group plans funding requirements over its planning period, combining business as usual and stressed conditions. The Group manages its liquidity position paying regard to its internal risk appetite, Liquidity Coverage Ratio (LCR) and Net Stable Funding Ratio (NSFR) as required by the PRA, the Capital Requirements Directive (CRD IV) and the Capital Requirements Regulation (CRR) liquidity requirements.
The Group’s funding and liquidity position is underpinned by its significant customer deposit base and is supported by strong relationships across customer segments. The Group has consistently observed that, in aggregate, the retail deposit base provides a stable source of funding. Funding concentration by counterparty, currency and tenor is monitored on an ongoing basis and, where concentrations do exist, these are managed as part of the planning process and limited by the internal funding and liquidity risk monitoring framework, with analysis regularly provided to senior management.
To assist in managing the balance sheet, the Group operates a Liquidity Transfer Pricing (LTP) process which: allocates relevant interest expenses from the centre to the Group’s banking businesses within the internal management accounts; helps drive the correct inputs to customer pricing; and is consistent with regulatory requirements. LTP makes extensive use of behavioural maturity profiles, taking account of expected customer loan prepayments and stability of customer deposits, modelled on historic data.
The Group can monetise liquid assets quickly, either through the repurchase agreements (repo) market or through outright sale. In addition, the Group has pre-positioned a substantial amount of assets at the Bank of England’s Discount Window Facility which can be used to access additional liquidity in a time of stress. The Group considers diversification across geography, currency, markets and tenor when assessing appropriate holdings of liquid assets. The Group’s liquid asset buffer is available for deployment at immediate notice, subject to complying with regulatory requirements.
| | | | | | | | |
75 | Lloyds Banking Group plc Annual Report on Form 20-F 2023 | |
Operating and financial review and prospects continued
Liquidity risk within the Insurance business may result from: the inability to sell financial assets quickly at fair value; an insurance liability falling due for payment earlier than expected; the inability to generate cash inflows as anticipated; an unexpected large operational event; or from a general insurance catastrophe, for example, a significant weather event. Liquidity risk is actively managed and monitored within the Insurance business to ensure that it remains within approved risk appetite, so that even under stress conditions, there is sufficient liquidity to meet obligations.
Monitoring
Daily monitoring and control processes are in place to address internal and regulatory liquidity requirements. The Group monitors a range of market and internal early warning indicators on a daily basis for early signs of liquidity risk in the market or specific to the Group. This captures regulatory metrics as well as metrics the Group considers relevant for its liquidity profile. These are a mixture of quantitative and qualitative measures, including: daily variation of customer balances; changes in maturity profiles; funding concentrations; changes in LCR outflows; credit default swap (CDS) spreads; and basis risks.
The Group carries out internal stress testing of its liquidity and potential cash flow mismatch position over both short (up to one month) and longer-term horizons against a range of scenarios forming an important part of the internal risk appetite. The scenarios and assumptions are reviewed at least annually to ensure that they continue to be relevant to the nature of the business, including reflecting emerging horizon risks to the Group. For further information on the Group’s 2023 liquidity stress testing results refer to page 79. The Group maintains a Liquidity Contingency Framework as part of the wider Recovery Plan which is designed to identify emerging liquidity concerns at an early stage, so that mitigating actions can be taken to avoid a more serious crisis developing. The Liquidity Contingency Framework has a foundation of robust and regular monitoring and reporting of key performance indicators, early warning indicators and risk appetite by both Group Corporate Treasury (GCT) and Risk up to and including Board level. Where movements in any of these metrics and indicator suites point to a potential issue, SME teams and their directors will escalate this information as appropriate.
Funding and liquidity management in 2023
The Group has maintained its strong funding and liquidity position with a loan to deposit ratio of 95 per cent as at 31 December 2023 (31 December 2022: 96 per cent). Total wholesale funding decreased to £98.7 billion as at 31 December 2023 (31 December 2022: £100.3 billion) driven by a small reduction in Money Market funding. The Group maintains its access to diverse sources and tenors of funding.
The Group’s liquid assets continue to exceed the regulatory minimum and internal risk appetite, with a liquidity coverage ratio (LCR) of 142 per cent (based on a monthly rolling average over the previous 12 months) as at 31 December 2023 (31 December 2022: 144 per cent) calculated on a Group consolidated basis based on the PRA rulebook. The decrease in LCR is explained primarily by a reduction in customer deposits. All assets within the liquid asset portfolio are hedged for interest rate risk. Following the implementation of structural reform, liquidity risk is managed at a legal entity level with the Group consolidated LCR representing the composite of the Ring-Fenced Bank and Non-Ring-Fenced Bank entities.
LCR eligible assets have reduced to £136.0 billion, from £144.7 billion as at 31 December 2022, driven by a reduction in customer deposits. In addition to the Group’s reported LCR eligible assets, the Group maintains borrowing capacity at central banks which averaged £74 billion in the 12 months to 31 December 2023. The net stable funding ratio remains strong at 130 per cent as at 31 December 2023 (31 December 2022: 130 per cent).
During 2023, the Group accessed wholesale funding across a range of currencies and markets with term issuance volumes totalling £16.1 billion, compared to full year guidance of around £15 billion of wholesale issuance needs. In 2024, the Group expects to have term wholesale issuance requirements of around £15 billion. The total outstanding amount of drawings from the TFSME has remained stable at £30.0 billion at 31 December 2023 (31 December 2022: £30.0 billion), with maturities in 2025, 2027 and beyond.
The Group’s credit ratings continue to reflect the strength of its business model and balance sheet. The rating agencies continue to monitor the impact of economic conditions and elevated rates for the UK banking sector. The strength of the Group’s management and franchise, along with its robust financial performance, capital and funding position, are reflected in the Group’s strong ratings.
| | | | | | | | |
76 | Lloyds Banking Group plc Annual Report on Form 20-F 2023 | |
Operating and financial review and prospects continued
Group funding requirements and sources
| | | | | | | | | | | | | | | | | |
| At 31 Dec 2023 £bn | | At 31 Dec 20221 £bn | | Change
% |
| Group funding position | | | | | |
| Cash and balances at central banks | 78.1 | | | 91.4 | | | (15) | |
Loans and advances to banks2 | 10.7 | | | 10.6 | | | 1 | |
Loans and advances to customers | 449.7 | | | 454.9 | | | (1) | |
| Reverse repurchase agreements – non-trading | 38.8 | | | 44.9 | | | (14) | |
| Debt securities at amortised cost | 15.4 | | | 9.9 | | | 56 | |
| Financial assets at fair value through other comprehensive income | 27.6 | | | 23.2 | | | 19 | |
Other assets3 | 261.2 | | | 238.5 | | | 10 | |
| Total Group assets | 881.5 | | | 873.4 | | | 1 | |
Less other liabilities3 | (226.3) | | | (205.3) | | | 10 | |
| Funding requirements | 655.2 | | | 668.1 | | | (2) | |
| | | | | |
Wholesale funding4 | 98.7 | | | 100.3 | | | (2) | |
Customer deposits | 471.4 | | | 475.3 | | | (1) | |
| Repurchase agreements – non-trading | 7.7 | | | 18.6 | | | (59) | |
Term Funding Scheme with additional incentives for SMEs (TFSME) | 30.0 | | | 30.0 | | | |
| Total equity | 47.4 | | | 43.9 | | | 8 | |
| Funding sources | 655.2 | | | 668.1 | | | (2) | |
1 2022 comparatives have been restated to reflect the impact of IFRS 17. See note 1 on page F-15.
2 Excludes £0.1 billion (31 December 2022: £0.2 billion) of loans and advances to banks within the Insurance business.
3 Other assets and other liabilities primarily include balances in the Group’s Insurance business and the fair value of derivative assets and liabilities.
4 The Group’s definition of wholesale funding aligns with that used by other international market participants; including bank deposits, debt securities in issue and subordinated liabilities. Excludes balances relating to margins of £2.4 billion (31 December 2022: £2.6 billion).
Reconciliation of Group funding to the balance sheet (audited)
| | | | | | | | | | | | | | | | | | | | | | | |
| Included in
funding
analysis
£bn | | Cash collateral received1 £bn | | Fair value and other accounting methods2 £bn | | Balance
sheet
£bn |
At 31 December 2023 | | | | | | | |
| Deposits from banks | 3.7 | | | 2.9 | | | (0.4) | | | 6.2 | |
Debt securities in issue at amortised cost | 82.9 | | | – | | | (7.3) | | | 75.6 | |
| Subordinated liabilities | 12.1 | | | – | | | (1.8) | | | 10.3 | |
Total wholesale funding | 98.7 | | | 2.9 | | | | | |
| Customer deposits | 471.4 | | | – | | | – | | | 471.4 | |
| Total | 570.1 | | | 2.9 | | | | | |
At 31 December 2022 | | | | | | | |
| Deposits from banks | 5.1 | | | 2.7 | | | (0.5) | | | 7.3 | |
Debt securities in issue at amortised cost | 82.3 | | | – | | | (8.5) | | | 73.8 | |
Subordinated liabilities | 12.9 | | | – | | | (2.2) | | | 10.7 | |
| Total wholesale funding | 100.3 | | | 2.7 | | | | | |
| Customer deposits | 475.3 | | | – | | | – | | | 475.3 | |
| Total | 575.6 | | | 2.7 | | | | | |
1 Repurchase agreements, previously reported within deposits from banks and customer deposits, are excluded; comparatives have been restated.
2 Includes the unamortised HBOS acquisition adjustments on subordinated liabilities, the fair value movements on liabilities held at fair value through profit or loss, and hedge accounting adjustments that impact the accounting carrying value of the liabilities.
| | | | | | | | |
77 | Lloyds Banking Group plc Annual Report on Form 20-F 2023 | |
Operating and financial review and prospects continued
Analysis of 2023 total wholesale funding by residual maturity
| | | | | | | | | | | | | | | | | | | | | | | | | | | | | | | | | | | | | | | | | | | | | | | | | | | | | | | | | | | |
| Up to 1
month
£bn | | 1 to 3
months
£bn | | 3 to 6
months
£bn | | 6 to 9
months
£bn | | 9 to 12
months
£bn | | 1 to 2
years
£bn | | 2 to 5
years
£bn | | Over
five years
£bn | | Total at 31 Dec 2023 £bn | | Total at 31 Dec 2022 £bn |
| Deposits from banks | 2.1 | | | 1.0 | | | 0.2 | | | 0.2 | | | 0.2 | | | – | | | – | | | – | | | 3.7 | | | 5.1 | |
| Debt securities in issue at amortised cost: | | | | | | | | | | | | | | | | | | | |
| Certificates of deposit | 0.9 | | | 1.8 | | | 2.7 | | | 1.2 | | | 1.2 | | | – | | | – | | | – | | | 7.8 | | | 7.2 | |
| Commercial paper | 1.3 | | | 4.7 | | | 3.2 | | | 2.3 | | | 0.8 | | | – | | | – | | | – | | | 12.3 | | | 12.7 | |
| Medium-term notes | 0.1 | | | 0.9 | | | 2.0 | | | 2.5 | | | 2.2 | | | 10.4 | | | 16.5 | | | 9.9 | | | 44.5 | | | 45.3 | |
| Covered bonds | – | | | 1.1 | | | 1.1 | | | – | | | 0.5 | | | 2.2 | | | 7.0 | | | 2.2 | | | 14.1 | | | 14.1 | |
Securitisation | – | | | – | | | – | | | 0.1 | | | – | | | 0.1 | | | 3.4 | | | 0.6 | | | 4.2 | | | 3.0 | |
| 2.3 | | | 8.5 | | | 9.0 | | | 6.1 | | | 4.7 | | | 12.7 | | | 26.9 | | | 12.7 | | | 82.9 | | | 82.3 | |
| Subordinated liabilities | – | | | – | | | – | | | – | | | 0.8 | | | 2.0 | | | 3.1 | | | 6.2 | | | 12.1 | | | 12.9 | |
Total wholesale funding1 | 4.4 | | | 9.5 | | | 9.2 | | | 6.3 | | | 5.7 | | | 14.7 | | | 30.0 | | | 18.9 | | | 98.7 | | | 100.3 | |
1 The Group’s definition of wholesale funding aligns with that used by other international market participants; including bank deposits, debt securities and subordinated liabilities. Excludes balances relating to margins of £2.4 billion (31 December 2022: £2.6 billion).
Total wholesale funding by currency (audited)
| | | | | | | | | | | | | | | | | |
| Sterling
£bn | US Dollar
£bn | Euro
£bn | Other
currencies
£bn | Total
£bn |
At 31 December 2023 | 26.0 | | 39.7 | | 25.1 | | 7.9 | | 98.7 | |
At 31 December 2022 | 23.4 | | 43.4 | | 25.8 | | 7.7 | | 100.3 | |
Analysis of 2023 term issuance (audited)
| | | | | | | | | | | | | | | | | |
| Sterling
£bn | US Dollar
£bn | Euro
£bn | Other
currencies
£bn | Total
£bn |
Securitisation1 | 2.1 | | – | | – | | – | | 2.1 | |
| Covered bonds | 2.2 | | – | | 0.9 | | 0.4 | | 3.5 | |
| Senior unsecured notes | – | | 3.0 | | 3.0 | | 1.3 | | 7.3 | |
| Subordinated liabilities | 0.7 | | – | | – | | 0.7 | | 1.4 | |
| Additional tier 1 | 0.8 | | 1.0 | | – | | – | | 1.8 | |
| Total issuance | 5.8 | | 4.0 | | 3.9 | | 2.4 | | 16.1 | |
1 Includes significant risk transfer securitisations.
| | | | | | | | |
78 | Lloyds Banking Group plc Annual Report on Form 20-F 2023 | |
Operating and financial review and prospects continued
Liquidity portfolio
At 31 December 2023, the Group had £136.0 billion of highly liquid unencumbered LCR eligible assets, based on a monthly rolling average over the previous 12 months post any liquidity haircuts (31 December 2022: £144.7 billion), of which £131.3 billion is LCR level 1 eligible (31 December 2022: £140.4 billion) and £4.7 billion is LCR level 2 eligible (31 December 2022: £4.3 billion). These assets are available to meet cash and collateral outflows and regulatory requirements. The Insurance business manages a separate liquidity portfolio to mitigate insurance liquidity risk.
LCR eligible assets
| | | | | | | | | | | |
| Average | Change
% |
| 20231 £bn | 20221 £bn |
| Cash and central bank reserves | 83.9 | | 84.7 | | (1) | |
High quality government/MDB/agency bonds2 | 44.7 | | 53.6 | | (17) | |
| High quality covered bonds | 2.7 | | 2.1 | | 29 | |
| Level 1 | 131.3 | | 140.4 | | (6) | |
Level 23 | 4.7 | | 4.3 | | 9 | |
| Total LCR eligible assets | 136.0 | | 144.7 | | (6) | |
1 Based on 12 months rolling average to 31 December. Eligible assets are calculated as an average of month-end observations over the previous 12 months post any liquidity haircuts.
2 Designated multilateral development banks (MDB).
3 Includes Level 2A and Level 2B.
LCR eligible assets by currency
| | | | | | | | | | | | | | | | | |
| Sterling
£bn | US Dollar
£bn | Euro
£bn | Other
currencies
£bn | Total
£bn |
At 31 December 2023 | | | | | |
| Level 1 | 87.9 | | 18.7 | | 24.7 | | – | | 131.3 | |
| Level 2 | 2.0 | | 1.9 | | 0.5 | | 0.3 | | 4.7 | |
Total1 | 89.9 | | 20.6 | | 25.2 | | 0.3 | | 136.0 | |
| At 31 December 2022 | | | | | |
| Level 1 | 103.0 | | 16.3 | | 21.0 | | 0.1 | | 140.4 | |
| Level 2 | 1.2 | | 1.5 | | 0.5 | | 1.1 | | 4.3 | |
Total1 | 104.2 | | 17.8 | | 21.5 | | 1.2 | | 144.7 | |
1 Based on 12 months rolling average to 31 December. Eligible assets are calculated as an average of month-end observations over the previous 12 months post any liquidity haircuts.
The Group also has a significant amount of non-LCR eligible liquid assets which are eligible for use in a range of central bank or similar facilities. Future use of such facilities will be based on prudent liquidity management and economic considerations, having regard to external market conditions.
Stress testing results
Internal liquidity stress testing results at 31 December 2023 (calculated as an average of month end observations over the previous 12 months) showed that the Group had liquidity resources representing 136 per cent of modelled outflows under the Group’s most severe liquidity stress scenario (31 December 2022: 147 per cent). The decrease in ratio is explained primarily by an increase in modelled stress outflows.
This scenario includes a two notch downgrade of the Group’s current long-term debt rating and accompanying one notch short-term downgrade implemented instantaneously by all major rating agencies.
| | | | | | | | |
79 | Lloyds Banking Group plc Annual Report on Form 20-F 2023 | |
Operating and financial review and prospects continued
Encumbered assets
This disclosure provides further detail on the availability of assets that could be used to support potential future funding requirements of the Group.
The disclosure is not designed to identify assets that would be available in the event of a resolution or bankruptcy.
The Group Asset and Liability Committee (GALCO) monitors and manages total balance sheet encumbrance, including via a defined risk appetite. At 31 December 2023, the Group had £38.0 billion (31 December 2022: £35.5 billion) of externally encumbered on-balance sheet assets with counterparties other than central banks. The increase in encumbered assets was primarily driven by securitisation and covered bond issuances. The Group also had £704.5 billion (31 December 2022: £705.9 billion) of unencumbered on-balance sheet assets, and £139.0 billion (31 December 2022: £132.0 billion) of pre-positioned and encumbered assets held with central banks; the increase in the latter was primarily driven by additional assets pre-positioned at the Bank of England. Primarily, the Group encumbers mortgages, unsecured lending, credit card receivables and car loans through the issuance programmes and tradable securities through securities financing activity. The Group mainly pre-positions mortgage assets at central banks.
On balance sheet encumbered and unencumbered assets
| | | | | | | | | | | | | | | | | | | | | | | | | | | | | | | | | | | | | | |
| Encumbered with
counterparties other
than central banks | Pre-
positioned
and
encumbered
assets
held with
central banks
£m | | Unencumbered assets
not pre-positioned
with central banks | | |
| Securitisations and covered
bonds
£m | Other
£m | Total
£m | | Readily realisable1 £m | Other realisable assets2 £m | Cannot be used3 £m | Total
£m | | Total
£m |
At 31 December 2023 | | | | | | | | | | | | |
| Cash and balances at central banks | – | | – | | – | | | – | | | 71,717 | | – | | 6,393 | | 78,110 | | | 78,110 | |
Financial assets at fair value through profit or loss4 | 35 | | 2,818 | | 2,853 | | | | | 1,321 | | – | | 199,144 | | 200,465 | | | 203,318 | |
| Derivative financial instruments | – | | – | | – | | | – | | | – | | – | | 22,356 | | 22,356 | | | 22,356 | |
| Loans and advances to banks | – | | – | | – | | | – | | | 1,612 | | 7,423 | | 1,729 | | 10,764 | | | 10,764 | |
| Loans and advances to customers | 18,354 | | 3,857 | | 22,211 | | | 139,004 | | | 14,651 | | 215,145 | | 58,734 | | 288,530 | | | 449,745 | |
| Reverse repurchase agreements | – | | – | | – | | | – | | | – | | – | | 38,771 | | 38,771 | | | 38,771 | |
| Debt securities | – | | 1,635 | | 1,635 | | | – | | | 5,756 | | – | | 7,964 | | 13,720 | | | 15,355 | |
| Financial assets at amortised cost | 18,354 | | 5,492 | | 23,846 | | | 139,004 | | | 22,019 | | 222,568 | | 107,198 | | 351,785 | | | 514,635 | |
| Financial assets at fair value through other comprehensive income | – | | 11,268 | | 11,268 | | | – | | | 15,888 | | – | | 436 | | 16,324 | | | 27,592 | |
Other5 | – | | – | | – | | | – | | | – | | 419 | | 35,023 | | 35,442 | | | 35,442 | |
| Total assets | 18,389 | | 19,578 | | 37,967 | | | 139,004 | | | 110,945 | | 222,987 | | 370,550 | | 704,482 | | | 881,453 | |
At 31 December 20226 | | | | | | | | | | | | |
| Cash and balances at central banks | – | | – | | – | | | – | | | 85,305 | | – | | 6,083 | | 91,388 | | | 91,388 | |
Financial assets at fair value through profit or loss4 | 38 | | 2,516 | | 2,554 | | | | | 918 | | – | | 177,297 | | 178,215 | | | 180,769 | |
| Derivative financial instruments | – | | – | | – | | | – | | | – | | – | | 24,753 | | 24,753 | | | 24,753 | |
| Loans and advances to banks | – | | – | | – | | | – | | | 1,800 | | 6,819 | | 2,013 | | 10,632 | | | 10,632 | |
| Loans and advances to customers | 16,472 | | 2,790 | | 19,262 | | | 132,012 | | | 13,419 | | 217,963 | | 72,243 | | 303,625 | | | 454,899 | |
| Reverse repurchase agreements | – | | – | | – | | | – | | | – | | – | | 44,865 | | 44,865 | | | 44,865 | |
| Debt securities | – | | 1,025 | | 1,025 | | | – | | | 5,692 | | – | | 3,209 | | 8,901 | | | 9,926 | |
| Financial assets at amortised cost | 16,472 | | 3,815 | | 20,287 | | | 132,012 | | | 20,911 | | 224,782 | | 122,330 | | 368,023 | | | 520,322 | |
| Financial assets at fair value through other comprehensive income | – | | 12,657 | | 12,657 | | | – | | | 10,045 | | – | | 452 | | 10,497 | | | 23,154 | |
Other5 | – | | – | | – | | | – | | | – | | 421 | | 32,587 | | 33,008 | | | 33,008 | |
| Total assets | 16,510 | | 18,988 | | 35,498 | | | 132,012 | | | 117,179 | | 225,203 | | 363,502 | | 705,884 | | | 873,394 | |
1 Assets regarded by the Group to be readily realisable in the normal course of business, to secure funding, meet collateral needs, or be sold to reduce potential future funding requirements, and are not subject to any restrictions on their use for these purposes.
2 Assets where there are no restrictions on their use to secure funding, meet collateral needs, or be sold to reduce potential future funding requirements, but are not readily realisable in the normal course of business in their current form.
3 The following assets are classified as unencumbered – cannot be used: assets held within the Group’s Insurance businesses which are generally held to either back liabilities to policyholders or to support the solvency of the Insurance subsidiaries; assets held within consolidated limited liability partnerships which provide security for the Group’s obligations to its pension schemes; assets segregated in order to meet the Financial Resilience requirements of the PRA’s Supervisory Statement 9/6 ‘Operational Continuity in Resolution’; assets pledged to facilitate the use of intra-day payment and settlement systems; and reverse repos and derivatives balance sheet ledger items.
4 Contains assets measured at fair value through profit or loss arising from contracts held with reinsurers, previously included within other assets; comparatives have been restated.
5 Other comprises: items in the course of collection from banks; investment properties; goodwill; value of in-force business; other intangible assets; tangible fixed assets; current tax recoverable; deferred tax assets; retirement benefit assets; investments in joint ventures and associates and other assets; comparatives have been restated.
6 2022 comparatives have been restated to reflect the impact of IFRS 17. See note 1 on page F-14. The above table sets out the carrying value of the Group’s encumbered and unencumbered assets, separately identifying those that are available to support the Group’s funding needs. The table does not include collateral received by the Group that is not recognised on its balance sheet, the vast majority of which the Group is permitted to repledge.
| | | | | | | | |
80 | Lloyds Banking Group plc Annual Report on Form 20-F 2023 | |
Operating and financial review and prospects continued
Off-balance sheet arrangements
A table setting out the amounts and maturities of Lloyds Banking Group’s other commercial commitments and guarantees at 31 December 2023 is included in note 52 to the financial statements. These commitments and guarantees are not included in Lloyds Banking Group’s consolidated balance sheet.
Lending commitments are agreements to lend to customers in accordance with contractual provisions; these are either for a specified period or, as in the case of credit cards and overdrafts, represent a revolving credit facility which can be drawn down at any time, provided that the agreement has not been terminated. The total amounts of unused commitments do not necessarily represent future cash requirements, in that commitments often expire without being drawn upon.
Lloyds Banking Group’s banking businesses are also exposed to liquidity risk through the provision of securitisation facilities to certain corporate customers. At 31 December 2023, Lloyds Banking Group offered securitisation facilities to its corporate and financial institution client base through its conduit securitisation programme, Cancara. This is funded in the global asset-backed commercial paper market. The assets and obligations of the programme are included in Lloyds Banking Group’s consolidated balance sheet. Lloyds Banking Group provides short-term asset- backed commercial paper liquidity support facilities on commercial terms to the programme, for use should the issuer be unable to roll over maturing commercial paper or obtain alternative sources of funding.
Details of securitisations and other special purpose entity arrangements entered into by Lloyds Banking Group are provided in notes 29 and 49 to the financial statements. The successful development of Lloyds Banking Group’s ability to securitise its own assets has provided a mechanism to tap a well established market, thereby diversifying Lloyds Banking Group’s funding base.
Within Lloyds Banking Group’s insurance businesses, the principal sources of liquidity are premiums received from policyholders, charges levied upon policyholders, investment income and the proceeds from the sale and maturity of investments. The investment policies followed by Lloyds Banking Group’s life assurance companies take account of anticipated cash flow requirements including by matching the cash inflows with projected liabilities where appropriate. Cash deposits and highly liquid government securities are available to provide liquidity to cover any higher than expected cash outflows.
Contractual cash obligations
At 31 December 2023, the Group had contractual cash obligations in respect of dated subordinated liabilities of £9,643 million of which £4,668 million matures in less than five years; the Group also had £80,857 million of outstanding debt securities in issue of which £68,146 million matures in less than five years. At 31 December 2023, the Group’s obligations in respect of lease liabilities and capital commitments totalled £2,872 million and the Group had other purchase obligations totalling £4,264 million. Other purchase obligations include amounts expected to be payable in respect of material contracts entered into by Lloyds Banking Group, in the ordinary course of business, for the provision of outsourced and other services. The cost of these services will be charged to the income statement as it is incurred. Lloyds Banking Group also has a constructive obligation to ensure that its defined post-retirement benefit schemes remain adequately funded. The amount and timing of Lloyds Banking Group’s cash contributions to these schemes is uncertain and will be affected by factors such as future investment returns and demographic changes. Lloyds Banking Group expects to make cash contributions of at least £0.1 billion to these schemes in 2024.
At 31 December 2023, Lloyds Banking Group also had £610 million of preference shares, preferred securities and undated subordinated liabilities outstanding.
At 31 December 2023, the principal sources of potential liquidity for Lloyds Banking Group plc were dividends received from its directly owned subsidiary companies, particularly Lloyds Bank plc and Scottish Widows Group Limited, and loans from this and other Lloyds Banking Group companies. The ability of Lloyds Bank to pay dividends going forward, or for Lloyds Bank or other Lloyds Banking Group companies to make loans to Lloyds Banking Group plc, depends on a number of factors, including their own regulatory capital requirements, distributable reserves and financial performance.
| | | | | | | | |
81 | Lloyds Banking Group plc Annual Report on Form 20-F 2023 | |
Operating and financial review and prospects continued
Insurance underwriting risk
Definition
Insurance underwriting risk is defined as the risk of adverse developments in the timing, frequency and severity of claims for insured/underwritten events, in customer behaviour and in expense costs, leading to reductions in earnings and/or value.
Exposures
The major source of insurance underwriting risk within the Group arises from the Insurance business.
Longevity and persistency are key risks within the life and pensions business. Longevity risk arises from the annuity portfolios where policyholders’ future cash flows are guaranteed at retirement and increases in life expectancy beyond current assumptions will increase the cost of annuities. Longevity risk exposures are expected to increase with the insurance business growth in the annuity market. Customer behaviour may result in increased cancellations or cessation of contributions, giving rise to the persistency exposure.
The Group’s defined benefit pension schemes also expose the Group to longevity risk. For further information please refer to the defined benefit pension schemes component of the market risk section and note 16 to the financial statements.
Property insurance risk is a key risk within the General Insurance business, arising from home insurance. Exposures can arise, for example, from extreme weather conditions such as flooding, when property damage claims are higher than expected.
Expenses are incurred in writing insurance business, with the risk of costs being higher than expected managed through regular cost initiatives and operating model reviews.
Measurement
Insurance underwriting risks are measured using a variety of techniques including stress, reverse stress and scenario testing, as well as stochastic modelling. Current and potential future insurance underwriting risk exposures are assessed and aggregated across a range of stresses with risk measures based on 1-in-200 year stresses for the Insurance business’ regulatory capital assessments and other supporting measures where appropriate, including those set out in note 36 to the financial statements.
Mitigation
Insurance underwriting risk is mitigated in a number of ways:
•Risks are identified, measured, managed, monitored and reported using the RCSA process
•Embedded insurance processes for underwriting, claims and expense management, pricing, product design and use of reinsurance
•Annual review and setting of demographic and expense best estimate assumptions
•Exposure limits by risk type are assessed through the business planning process and used as a control mechanism to ensure risks are taken within risk appetite
•Longevity risk transfer and hedging solutions are considered on a regular basis
•Life Insurance exposure to demographic risks are mitigated through the use of reinsurance, where there is a clear benefit that outweighs the value of retaining the risks, or where there are risks which are less well understood
•General Insurance exposure to accumulations of risk and possible catastrophes is mitigated by reinsurance arrangements spread over a range of reinsurers. Detailed modelling, including that of the potential losses under various catastrophe scenarios, supports the choice of reinsurance arrangements
Monitoring
Insurance underwriting risks are monitored by Insurance senior executive committees and ultimately the Insurance Board. Significant risks from the Insurance business and the defined benefit pension schemes are reviewed by the Group Executive and Group Risk Committees and Board.
Insurance underwriting risk exposures are monitored against risk appetite with persistency, expenses and GI claims also analysed monthly. The Insurance business monitors experiences against expectations, for example business volumes and mix, claims, expenses and persistency experience. The effectiveness of controls put in place to manage insurance underwriting risk is evaluated and significant divergences from experience or movements in risk exposures are investigated and remedial action taken.
| | | | | | | | |
82 | Lloyds Banking Group plc Annual Report on Form 20-F 2023 | |
Operating and financial review and prospects continued
Market risk
Definition
Market risk is defined as the risk that the Group’s capital or earnings profile is adversely affected by changes in market rates or prices, including, but not limited to, interest rates, foreign exchange, equity prices and credit spreads.
Balance sheet linkages
The information provided in the table below aims to facilitate the understanding of linkages between banking, trading and insurance balance sheet items and the positions disclosed in the Group’s market risk disclosures.
Market risk linkage to the balance sheet
| | | | | | | | | | | | | | | | | | | | | | | | | | | | | |
| | | Banking | | | | |
| 2023 | Total
£m | | Trading book1 £m | | Non-
trading
£m | | Insurance
£m | | Primary market risk factor |
| Assets | | | | | | | | | |
| Cash and balances at central banks | 78,110 | | | – | | | 78,110 | | | – | | | Interest rate |
| Financial assets at fair value through profit or loss | 203,318 | | | 21,638 | | | 5,205 | | | 176,475 | | | Interest rate, foreign exchange, credit spread, equity |
| Derivative financial instruments | 22,356 | | | 19,985 | | | 1,477 | | | 894 | | | Interest rate, foreign exchange, credit spread |
| Financial assets at amortised cost | | | | | | | | | |
| Loans and advances to banks | 10,764 | | | – | | | 10,635 | | | 129 | | | Interest rate |
| Loans and advances to customers | 449,745 | | | – | | | 449,745 | | | – | | | Interest rate |
| Reverse repurchase agreements | 38,771 | | | – | | | 38,771 | | | – | | | Interest rate |
| Debt securities | 15,355 | | | – | | | 15,355 | | | – | | | Interest rate, credit spread |
| Financial assets at amortised cost | 514,635 | | | – | | | 514,506 | | | 129 | | | |
| Financial assets at fair value through other comprehensive income | 27,592 | | | – | | | 27,592 | | | – | | | Interest rate, foreign exchange, credit spread |
| Other assets | 35,442 | | | – | | | 29,268 | | | 6,174 | | | Interest rate |
| Total assets | 881,453 | | | 41,623 | | | 656,158 | | | 183,672 | | | |
| Liabilities | | | | | | | | | |
| Deposit from banks | 6,153 | | | – | | | 6,153 | | | – | | | Interest rate |
| Customer deposits | 471,396 | | | – | | | 471,396 | | | – | | | Interest rate |
| Repurchase agreements at amortised cost | 37,703 | | | – | | | 37,703 | | | – | | | Interest rate |
| Financial liabilities at fair value through profit or loss | 24,914 | | | 19,631 | | | 5,265 | | | 18 | | | Interest rate, foreign exchange |
| Derivative financial instruments | 20,149 | | | 15,206 | | | 3,432 | | | 1,511 | | | Interest rate, foreign exchange, credit spread |
| Debt securities in issue at amortised cost | 75,592 | | | – | | | 74,269 | | | 1,323 | | | Interest rate, credit spread |
| Liabilities arising from insurance and investment contracts | 165,101 | | | – | | | – | | | 165,101 | | | Credit spread |
| Subordinated liabilities | 10,253 | | | – | | | 9,671 | | | 582 | | | Interest rate, foreign exchange |
| Other liabilities | 22,827 | | | – | | | 10,790 | | | 12,037 | | | Interest rate |
| Total liabilities | 834,088 | | | 34,837 | | | 618,679 | | | 180,572 | | | |
1 Assets and liabilities are classified as trading book if they meet the requirements as set out in the Capital Requirements Regulation, article 104.
The defined benefit pension schemes’ assets and liabilities are included under other assets and other liabilities in this table and note 16 on page F-41 provides further information.
The Group’s trading book assets and liabilities are originated within the Commercial Banking business units. Within the Group’s balance sheet these fall under the trading assets and liabilities and derivative financial instruments. The assets and liabilities are classified as trading book if they meet the requirements as set out in the Capital Requirements Regulation, article 104. Further information on these activities can be found under the Trading portfolios section on page 87. Derivative assets and liabilities are held by the Group for three main purposes: to provide risk management solutions for clients, to manage portfolio risks arising from client business and to manage and hedge the Group’s own risks.
Insurance business assets and liabilities relate to policyholder funds, as well as shareholder invested assets, including annuity funds.
The Group ensures that it has adequate cash and balances at central banks and stocks of high quality liquid assets (for example, gilts or US Treasury securities) that can be converted easily into cash to meet liquidity requirements. The majority of these assets are asset swapped and held at fair value through other comprehensive income. Further information on these balances can be found under funding and liquidity risk on page 75. The majority of debt issuance originates from the Group’s capital and funding activities and the interest rate risk of the debt issued is hedged by swapping them into a floating rate.
The non-trading book primarily consists of customer on-balance sheet activities and the Group’s capital and funding activities, which expose it to the risk of adverse movements in market rates or prices, predominantly interest rates, credit spreads, exchange rates and equity prices, as described in further detail within the Banking activities section on page 84. | | | | | | | | |
83 | Lloyds Banking Group plc Annual Report on Form 20-F 2023 | |
Operating and financial review and prospects continued
Measurement
Group risk appetite is calibrated primarily to a number of multi-risk Group economic scenarios, and is supplemented with sensitivity-based measures. The scenarios assess the impact of unlikely, but plausible, adverse stresses on income with the worst case for banking activities, defined benefit pensions, insurance and trading portfolios reported against independently, and across the Group as a whole.
The Group risk appetite is cascaded first to the Group Asset and Liability Committee (GALCO), chaired by the Chief Financial Officer, where risk appetite is approved and monitored by risk type, and then to the Group Market Risk Committee (GMRC) where risk appetite is sub-allocated by business unit. These metrics are reviewed regularly by senior management to inform effective decision making.
Mitigation
GALCO is responsible for approving and monitoring market risk management techniques, market risk measures, behavioural assumptions, and the market risk policy. Various mitigation activities are assessed and undertaken across the Group to manage portfolios and seek to ensure they remain within approved limits. The mitigation actions will vary dependent on exposure but will, in general, look to reduce risk in a cost effective manner by offsetting balance sheet exposures and externalising to the financial markets dependent on market liquidity. The market risk policy is owned by Group Corporate Treasury (GCT) and refreshed annually. The policy is underpinned by supplementary market risk procedures, which define specific market risk management and oversight requirements.
Monitoring
GALCO and GMRC regularly review high level market risk exposures as part of the wider risk management framework. They also make recommendations to the Board concerning overall market risk appetite and market risk policy. Exposures at lower levels of delegation are monitored at various intervals according to their volatility, from daily in the case of trading portfolios to monthly or quarterly in the case of less volatile portfolios. Levels of exposures compared to approved limits and triggers are monitored by Risk and appropriate escalation procedures are in place.
How market risks arise and are managed across the Group’s activities is considered in more detail below.
Banking activities
Exposures
The Group’s banking activities expose it to the risk of adverse movements in market rates or prices, predominantly interest rates, credit spreads, exchange rates and equity prices. The volatility of market rates or prices can be affected by both the transparency of prices and the amount of liquidity in the market for the relevant asset, liability or instrument.
Interest rate risk
Yield curve risk in the Group’s divisional portfolios, and in the Group’s capital and funding activities, arises from the different repricing characteristics of the Group’s non-trading assets, liabilities and off-balance sheet positions.
Basis risk arises from the potential changes in spreads between indices, for example where the bank lends with reference to a central bank rate but funds with reference to a market rate, for example, SONIA, and the spread between these two rates widens or tightens.
Optionality risk arises predominantly from embedded optionality within assets, liabilities or off-balance sheet items where either the Group or the customer can affect the size or timing of cash flows. One example of this is mortgage prepayment risk where the customer owns an option allowing them to prepay when it is economical to do so. This can result in customer balances amortising more quickly or slowly than anticipated due to customers’ response to changes in economic conditions.
Foreign exchange risk
Economic foreign exchange exposure arises from the Group’s investment in its overseas operations (net investment exposures are disclosed in note 52 on page F-109. In addition, the Group incurs foreign exchange risk through non-functional currency flows from services provided by customer-facing divisions, the Group’s debt and capital management programmes and is exposed to volatility in its CET1 ratio, due to the impact of changes in foreign exchange rates on the retranslation of non-Sterling-denominated risk-weighted assets. Equity risk
Equity risk arises primarily from three different sources:
•The Group’s private equity exposure from investments held by Lloyds Development Capital and its stake in BGF, both within the Equities sub-group
•A small number of legacy strategic equity holdings, for example Visa Inc Preference Shares, and recently acquired minority fintech stakes, all held in the Equities sub-group
•A small exposure to Lloyds Banking Group share price through deferred shares and deferred options granted to employees as part of their benefits package
Credit spread risk
Credit spread risk arises largely from: (i) the liquid asset portfolio held in the management of Group liquidity, comprising government, supranational and other eligible assets; (ii) the Credit Valuation Adjustment (CVA) and Debit Valuation Adjustment (DVA) sensitivity to credit spreads; (iii) a number of the Group’s structured medium-term notes where the Group has elected to fair value the notes through the profit and loss account; and (iv) banking book assets in Commercial Banking held at fair value under IFRS 9.
Measurement
Interest rate risk exposure is monitored monthly using, primarily:
Market value sensitivity: this methodology considers all repricing mismatches (behaviourally adjusted where appropriate) in the current balance sheet and calculates the change in market value that would result from an instantaneous 25, 100 and 200 basis points parallel rise or fall in the yield curve. Sterling interest rates are modelled with a floor below zero per cent, with negative rate floors also modelled for non-Sterling currencies where appropriate (product-specific floors apply). The market value sensitivities are calculated on a static balance sheet using principal cash flows excluding interest, commercial margins and other spread components and are therefore discounted at the risk-free rate.
Interest income sensitivity: this measures the impact on future net interest income arising from various economic scenarios. These include instantaneous 25, 100 and 200 basis point parallel shifts in all yield curves and the Group economic scenarios. Sterling interest rates are modelled with a floor below zero per cent, with negative rate floors also modelled for non-Sterling currencies where appropriate (product-specific floors apply). These scenarios are reviewed every year and are designed to replicate severe but plausible economic events, capturing risks that would not be evident through the use of parallel shocks alone such as basis risk and steepening or flattening of the yield curve.
Unlike the market value sensitivities, the interest income sensitivities incorporate additional behavioural assumptions as to how and when individual products would reprice in response to changing rates.
Reported sensitivities are not necessarily predictive of future performance as they do not capture additional management actions that would likely be taken in response to an immediate, large, movement in interest rates. These actions could reduce the net interest income sensitivity, help mitigate any adverse impacts or they may result in changes to total income that are not captured in the net interest income.
Structural hedge: the structural hedging programme managing interest rate risk in the banking book relies on assumptions made around customer behaviour. A number of metrics are in place to monitor the risks within the portfolio.
| | | | | | | | |
84 | Lloyds Banking Group plc Annual Report on Form 20-F 2023 | |
Operating and financial review and prospects continued
The Group has an integrated Asset and Liability Management (ALM) system which supports non-traded asset and liability management of the Group. This provides a single consolidated tool to measure and manage interest rate repricing profiles (including behavioural assumptions), perform stress testing and produce forecast outputs. The Group is aware that any assumptions-based model is open to challenge.
A full behavioural review is performed annually, or in response to changing market conditions, to ensure the assumptions remain appropriate and the model itself is subject to annual re-validation, as required under the Group model governance policy. The key behavioural assumptions are:
•Embedded optionality within products
•The duration of balances that are contractually repayable on demand, such as current accounts and overdrafts, together with net free reserves of the Group
•The re-pricing behaviour of managed rate liabilities, such as variable rate savings
The table below shows, split by material currency, the Group’s market value sensitivities to an instantaneous parallel up and down 25 and 100 basis points change to all interest rates.
Group Banking activities: market value sensitivity (audited)
| | | | | | | | | | | | | | | | | | | | | | | | | | | | | |
| 2023 | | 2022 |
Up
25bps
£m | Down
25bps
£m | Up
100bps
£m | Down
100bps
£m | | Up
25bps
£m | Down
25bps
£m | Up
100bps
£m | Down
100bps
£m |
| Sterling | 9.4 | | (9.9) | | 35.3 | | (42.2) | | | 2.6 | | (3.3) | | 6.5 | | (18.0) | |
| US Dollar | (1.7) | | 1.8 | | (6.9) | | 7.4 | | | 0.6 | | (0.6) | | 2.7 | | (2.1) | |
| Euro | (2.7) | | 0.6 | | (10.1) | | 2.6 | | | (1.6) | | (0.4) | | (6.0) | | (1.6) | |
| Other | (0.2) | | 0.2 | | (0.6) | | 0.6 | | | 0.1 | | (0.1) | | 0.3 | | (0.3) | |
| Total | 4.8 | | (7.3) | | 17.7 | | (31.6) | | | 1.7 | | (4.4) | | 3.5 | | (22.0) | |
This is a risk-based disclosure and the amounts shown would be amortised in the income statement over the duration of the portfolio.
The market value sensitivity has increased year-on-year as a result of small differences in the hedging profile of fixed mortgages.
The table below shows supplementary value sensitivity to a steepening and flattening (c.100 basis points around the three-year point) in the yield curve. This ensures there are no unintended consequences to managing risk to parallel shifts in rates.
Group Banking activities: market value sensitivity to a steepening and flattening of the yield curve (audited)
| | | | | | | | | | | | | | | | | |
| 2023 | | 2022 |
| Steepener
£m | Flattener
£m | | Steepener
£m | Flattener
£m |
| Sterling | 23.1 | | (27.2) | | | 65.4 | | (75.8) | |
| US Dollar | (3.0) | | 3.0 | | | (11.5) | | 11.5 | |
| Euro | (4.2) | | (0.7) | | | (8.9) | | 4.1 | |
| Other | 0.6 | | (0.6) | | | 0.1 | | (0.1) | |
| Total | 16.5 | | (25.5) | | | 45.1 | | (60.3) | |
The table below shows the banking book net interest income sensitivity on a one to three year forward-looking basis to an instantaneous parallel up 25, down 25, up 50 and down 50 basis points change to all interest rates.
Group Banking activities: three year net interest income sensitivity (audited)
| | | | | | | | | | | | | | | | | | | | | | | |
| 2023 | | 2022 |
| Year 1
£m | Year 2
£m | Year 3
£m | | Year 1
£m | Year 2
£m | Year 3
£m |
| Up 50bps | 250 | | 421 | | 614 | | | 298 | | 520 | | 756 | |
| Up 25 bps | 125 | | 211 | | 307 | | | 149 | | 259 | | 378 | |
| Down 25bps | (155) | | (209) | | (303) | | | (181) | | (261) | | (378) | |
| Down 50bps | (311) | | (417) | | (606) | | | (362) | | (522) | | (755) | |
| | | | | | | | |
85 | Lloyds Banking Group plc Annual Report on Form 20-F 2023 | |
Operating and financial review and prospects continued
Year 1 net interest income sensitivity, to both up and down shocks, has decreased slightly year-on-year mostly as a result of changing customer deposit behaviour and structural hedge activity.
The three year net interest income sensitivity to an up 25 basis points and 50 basis points shock is largely due to reinvestment of structural hedge maturities in years two and three.
The sensitivities are illustrative and do not reflect new business margin implications and/or pricing actions, other than as outlined.
The following assumptions have been applied:
•Instantaneous parallel shift in interest rate curve, including bank base rate
•Balance sheet remains constant
•Illustrative 50 per cent pass-through on deposits and 100 per cent pass-through on assets, which could be different in practice.
Basis risk, foreign exchange, equity and credit spread risks are measured primarily through scenario analysis by assessing the impact on profit before tax over a 12-month horizon arising from a change in market rates, and reported within the Board risk appetite on a monthly basis. Supplementary measures such as sensitivity and exposure limits are applied where they provide greater insight into risk positions. Frequency of reporting supplementary measures varies from daily to quarterly appropriate to each risk type.
Mitigation
The Group’s policy is to optimise reward while managing its market risk exposures within the risk appetite defined by the Board. The Group market risk policy and procedures outlines the hedging process, and the centralisation of risk from divisions into Group Corporate Treasury (GCT), for example via the transfer pricing framework. GCT is responsible for managing the centralised risk and does this through natural offsets of matching assets and liabilities, and appropriate hedging activity of the residual exposures, subject to the authorisation and mandate of GALCO within the Board risk appetite. The hedges are externalised to the market by derivative desks within GCT and the Commercial Bank. The Group mitigates income statement volatility through hedge accounting. This reduces the accounting volatility arising from the Group’s economic hedging activities and any hedge accounting ineffectiveness is continuously monitored.
The largest residual risk exposure arises from balances that are deemed to be insensitive to changes in market rates (including current accounts, a portion of variable rate deposits and investable equity), and is managed through the Group’s structural hedge. Consistent with the Group’s strategy to deliver stable returns, GALCO seeks to minimise large reinvestment risk, and to smooth earnings over a range of investment tenors. The structural hedge consists of longer-term fixed rate assets or interest rate swaps and the amount and duration of the hedging activity is reviewed regularly by GALCO.
While the Group faces uncertainty in customer behaviour due to a higher rate environment, its exposure to increased pipeline and prepayment risks are managed through hedging in line with expected customer behaviour. These are appropriately monitored and controlled through divisional Asset and Liability Committees (ALCOs).
Net investment foreign exchange exposures are managed centrally by GCT, by hedging non-Sterling asset values with currency borrowing. Economic foreign exchange exposures arising from non-functional currency flows are identified by divisions and transferred and managed centrally. The Group also has a policy of forward hedging its forecasted currency profit and loss to year end.
The Group makes use of both accounting and economic foreign exchange exposures, as an offset against the impact of changes in foreign exchange rates on the value of non-Sterling-denominated risk-weighted assets. This involves the holding of a structurally open currency position; sensitivity is minimised where, for a given currency, the ratio of the structural open position to risk-weighted assets equals the CET1 ratio. Continually evaluating this structural open currency position against evolving non-Sterling-denominated risk-weighted assets mitigates volatility in the Group’s CET1 ratio.
Monitoring
The appropriate limits and triggers are monitored by senior executive committees within the Banking divisions. Banking assets, liabilities and associated hedging are actively monitored and if necessary rebalanced to be within agreed tolerances.
Defined benefit pension schemes
Exposures
The Group’s defined benefit pension schemes are exposed to significant risks from their assets and liabilities. The liability discount rate exposes the Group to interest rate risk and credit spread risk, which are partially offset by fixed interest assets (such as gilts and corporate bonds) and swaps. Equity and alternative asset risk arises from direct asset holdings. Scheme membership exposes the Group to longevity risk. Increases to pensions in deferment and in payment expose the Group to inflation risk.
For further information on defined benefit pension scheme assets and liabilities please refer to note 16 on page F-40. Measurement
Management of the schemes’ assets is the responsibility of the Trustees of the schemes who are responsible for setting the investment strategy and for agreeing funding requirements with the Group. The Group will be liable for meeting any funding deficit that may arise. As part of the triennial valuation process, the Group will agree with the Trustees a funding strategy to eliminate the deficit over an appropriate period.
Longevity risk is measured using both 1-in-20 year stresses (risk appetite) and 1-in-200 year stresses (regulatory capital).
Mitigation
The Group takes an active involvement in agreeing mitigation strategies with the schemes’ Trustees. An interest rate and inflation hedging programme is in place to reduce liability risk. The schemes have also reduced equity allocation and invested the proceeds in credit assets. The Trustees have put in place longevity swaps to mitigate longevity risk. The merits of longevity risk transfer and hedging solutions are reviewed regularly.
Monitoring
In addition to the wider risk management framework, governance of the schemes includes a specialist pension committee.
The surplus, or deficit, in the schemes is tracked monthly along with various single factor and scenario stresses which consider the assets and liabilities holistically. Key metrics are monitored monthly including the Group’s capital resources of the scheme, the performance against risk appetite triggers, and the performance of the hedged asset and liability matching positions.
Insurance business
Exposures
The main elements of market risk to which the Group is exposed through the Insurance business are equity, credit default spread, interest rate and inflation.
•Equity risk arises indirectly through the value of future management charges on policyholder funds
•Credit default spread risk mainly arises from annuities where policyholders’ future cash flows are guaranteed at retirement. Exposure arises if the market value of the assets moves differently to the liabilities they back. This exposure arises from credit downgrades and defaults
•Interest rate risk arises through credit and interest assets which are mainly held to cover the annuity and general insurance liabilities
•Inflation exposure arises from inflation-linked policyholder benefits and future expenses
| | | | | | | | |
86 | Lloyds Banking Group plc Annual Report on Form 20-F 2023 | |
Operating and financial review and prospects continued
Measurement
Current and potential future market risk exposures within Insurance are assessed using a range of techniques including stress, reverse stress and scenario testing, as well as stochastic modelling.
Risk measures include 1-in-200 year stresses for the Insurance business’ regulatory capital assessments and other supporting measures where appropriate, including those set out in note 36 on page F-94.
Mitigation
Equity and credit spread risks are closely monitored. Asset liability matching, hedging and unit matching are all used to reduce the sensitivity of equity movements.
Interest rate risk in the annuity book is monitored and mitigated by investing in assets whose cash flows closely match those on the projected future liabilities. It is not possible to eliminate the risk completely as the timing of insured events is uncertain and bonds are not available for all required maturities.
Other market risks (e.g. interest rate exposure outside the annuity book and inflation) are also closely monitored and where considered appropriate, hedges are put in place to reduce exposure.
The costs and benefits of market risk mitigation are considered in strategy and business planning decisions, with consideration given to the impacts to various metrics.
Monitoring
Market risks in the Insurance business are monitored by Insurance senior executive committees and ultimately the Insurance Board. Monitoring includes the progression of market risk capital against risk appetite limits, as well as the sensitivity of profit before tax to combined market risk stress scenarios and in-year market movements. Asset and liability matching positions and hedges in place are actively monitored and if necessary rebalanced to be within agreed tolerances. In addition, market risk is controlled via approved investment policies and mandates.
Trading portfolios
Exposures
The Group’s trading activity is small relative to its peers. The Group’s trading activity is undertaken primarily to meet the financial requirements of commercial and retail customers for foreign exchange, credit, interest rate and inflation products. These activities support customer flow and market making activities.
All trading activities are performed within the Commercial Banking division. While the trading positions taken are generally small, any extreme moves in the main risk factors and other related risk factors could cause significant losses in the trading book depending on the positions at the time. The average 95 per cent 1-day trading VaR (Value at Risk; diversified across risk factors) was £2.3 million for 31 December 2023 compared to £1.5 million for 31 December 2022.
Trading market risk measures are applied to all of the Group’s regulatory trading books and they include daily VaR (see trading portfolios: VaR table), sensitivity-based measures, and stress testing calculations.
Measurement
The Group internally uses VaR as the primary risk measure for all trading book positions.
The trading portfolios: VaR table shows some relevant statistics for the Group’s 1-day 95 per cent confidence level VaR that are based on 300 historical consecutive business days to year-end 2022 and year-end 2021.
The risk of loss measured by the VaR model is the loss in earnings which is not expected to be exceeded with 95 per cent confidence. The total and average trading VaR numbers reported below have been obtained after the application of the diversification benefits across the five risk types, but do not reflect any diversification between Lloyds Bank Corporate Markets plc and any other entities. The maximum and minimum VaR reported for each risk category did not necessarily occur on the same day as the maximum and minimum VaR reported at Group level.
Trading portfolios: VaR (1-day 95 per cent confidence level) (audited)
| | | | | | | | | | | | | | | | | | | | | | | | | | | | | |
| At 31 December 2023 | | At 31 December 2022 |
| Close
£m | Average
£m | Maximum
£m | Minimum
£m | | Close
£m | Average
£m | Maximum
£m | Minimum
£m |
| Interest rate risk | 1.7 | | 2.0 | | 3.8 | | 1.0 | | | 1.3 | | 1.4 | | 4.0 | | 0.5 | |
| Foreign exchange risk | 0.1 | | 0.3 | | 0.9 | | 0.1 | | | 0.2 | | 0.1 | | 0.4 | | – | |
| Equity risk | – | | – | | – | | – | | | – | | – | | – | | – | |
| Credit spread risk | 0.2 | | 0.3 | | 0.5 | | 0.1 | | | 0.1 | | 0.1 | | 0.3 | | – | |
| Inflation risk | 0.5 | | 0.5 | | 1.0 | | 0.2 | | | 0.6 | | 0.4 | | 1.1 | | 0.2 | |
| All risk factors before diversification | 2.5 | | 3.1 | | 5.1 | | 1.9 | | | 2.2 | | 2.0 | | 5.1 | | 0.9 | |
| Portfolio diversification | (0.9) | | (0.8) | | | | | (0.5) | | (0.5) | | | |
| Total VaR | 1.6 | | 2.3 | | 4.1 | | 1.2 | | | 1.7 | | 1.5 | | 4.0 | | 0.6 | |
The market risk for the trading book continues to be low relative to the size of the Group and in comparison to peers. This reflects the fact that the Group’s trading operations are customer-centric and focused on hedging and recycling client risks.
Although it is an important market standard measure of risk, VaR has limitations. One of them is the use of a limited historical data sample which influences the output by the implicit assumption that future market behaviour will not differ greatly from the historically observed period. Another known limitation is the use of defined holding periods which assumes that the risk can be liquidated or hedged within that holding period. Also calculating the VaR at the chosen confidence interval does not give enough information about potential losses which may occur if this level is exceeded. The Group fully recognises these limitations and supplements the use of VaR with a variety of other measurements which reflect the nature of the business activity. These include detailed sensitivity analysis, position reporting and a stress testing programme.
Trading book VaR (1-day 99 per cent) is compared daily against both hypothetical and actual profit and loss. The 1-day 99 per cent VaR chart can be found in the Group’s Pillar 3 disclosures.
Mitigation
The level of exposure is controlled by establishing and communicating the approved risk limits and controls through policies and procedures that define the responsibility and authority for risk taking. Market risk limits are clearly and consistently communicated to the business. Any new or emerging risks are brought within risk reporting and defined limits.
Monitoring
Trading risk is monitored daily against 1-day 95 per cent VaR and stress testing limits. These limits are complemented with position level action triggers and profit and loss referrals. Risk and position limits are set and managed at both desk and overall trading book levels. They are reviewed at least annually and can be changed as required within the overall Group risk appetite framework.
| | | | | | | | |
87 | Lloyds Banking Group plc Annual Report on Form 20-F 2023 | |
Operating and financial review and prospects continued
Model risk
Definition
Model risk is defined as the risk of financial loss, regulatory censure, reputational damage or customer detriment, as a result of deficiencies in the development, application and ongoing operation of models and rating systems.
Models are defined as quantitative methods that process input data into quantitative outputs, or qualitative outputs (including ordinal letter output) which have a quantitative measure associated with them. Model governance policy is restricted to specific categories of application of models, principally financial risk, treasury and valuation, with certain exclusions, such as prescribed calculations and project appraisal calculations.
Exposures
The Group makes extensive use of models. They perform a variety of functions including:
•Capital calculation
•Credit decisioning, including fraud
•Pricing models
•Impairment calculation
•Stress testing and forecasting
•Market risk measurement
As a result of the wide scope and breadth of coverage, there is exposure to model risk across a number of the Group’s principal risk categories.
Model risk remained elevated in 2023, following the pandemic related government-led support schemes weakening the relationships between model inputs and outputs in 2022. The economy has steadied somewhat compared to 2022, now being more typical of the environment used to build the models, reducing need for judgemental overlays to account for this, but many of the effects of the pandemic and other stresses to the economy are still working their way through.
The control environment for model risk continues to be strengthened to meet revised internal and regulatory requirements. In addition, in common with the rest of the industry, changes required to capital models following new regulations have created a temporary increase in the risk relating to these models during the period of transition. Further information on capital impacts are detailed in the capital risk section on pages 45 to 52. Measurement
The Board risk appetite metric is the key component for measuring the Group’s most material models; performance is reported monthly to the Group and Board Risk Committees.
Mitigation
The model risk management framework, established by and with continued oversight from an independent team in the Risk division, provides the foundation for managing and mitigating model risk within the Group. Accountability is cascaded from the Board and senior management via the Group enterprise risk management framework.
This provides the basis for the Group’s model governance policy, which defines the mandatory requirements for models across the Group, including:
•The scope of models covered by the policy
•Model materiality
•Roles and responsibilities, including ownership, independent oversight and approval
•Key principles and controls regarding data integrity, development, validation, implementation, ongoing maintenance and revalidation, monitoring, and the process for non-compliance
The model owner takes responsibility for ensuring the fitness for purpose of the models and rating systems, supported and challenged by the independent specialist Group function.
The above ensures all models in scope of policy, including those involved in regulatory capital calculation, are developed consistently and are of sufficient quality to support business decisions and meet regulatory requirements.
Monitoring
The Group Model Governance Committee is the primary body for overseeing model risk. Policy requires that key performance indicators are monitored for every model to ensure they remain fit for purpose and all issues are escalated appropriately. Material model issues are reported to the Group and Board Risk Committees monthly, with more detailed papers as necessary to focus on key issues.
| | | | | | | | |
88 | Lloyds Banking Group plc Annual Report on Form 20-F 2023 | |
Operating and financial review and prospects continued
Operational risk
Definition
Operational risk is defined as the risk of loss from inadequate or failed internal processes, people and systems, or from external events.
Exposures
The principal operational risks to the Group which could result in customer detriment, unfair customer outcomes, financial loss, disruption and/or reputational damage include:
•IT systems: including cyber-attacks, or the failure of IT systems due to volume of change and/or aged infrastructure
•Fraud: including intentional acts of deception or omission by external or internal parties
•Financial crime: including failures relating to anti-money laundering, anti-bribery, counter-terrorist financing and financial sanctions and prohibitions laws and regulations
•Security: including the confidentiality, integrity and/or availability of the Group’s assets (such as physical, data and information) being compromised
•Business process: including failed transaction processing or process management
A number of these risks could increase where there is a reliance on third party suppliers to provide services to the Group or its customers.
Measurement
Operational risk is managed across the Group through an operational risk framework and policies. This framework includes a risk and control self-assessment process, risk impact likelihood matrix, risk and control indicators, risk appetite setting, a robust operational loss event management and escalation process, and a scenario analysis and operational loss forecasting process. This is supplemented by Group level and local management information and reporting across a suite of governed metrics.
The operational risk events by risk category table below shows high level loss and event trends for the Group using Basel II categories. Based on data captured on the Group’s RCSA, in 2023 the highest frequency of events occurred in external fraud with 90.93 per cent of the total volume. Clients, products and business practices accounted for 52.19 per cent of losses by value.
Operational risk losses and scenario analysis is used to inform the Internal Capital Adequacy Assessment Process (ICAAP). The Group calculates its minimum (Pillar I) operational risk capital requirements using The Standardised Approach (TSA). Pillar II is calculated using internal and external loss data and extreme but plausible scenarios that may occur in the next 12 months.
Mitigation
The Group continues to focus on risk management requirements and developing the processes, systems and people skills and capabilities needed to mitigate risks. Risks, including IT systems and security-related risks, are reported and discussed at local governance forums and escalated to executive management and the Board as appropriate to ensure the correct level of visibility and engagement. The Group employs a range of risk management strategies, including: avoidance, mitigation, transfer (including insurance) and acceptance within appetite or tolerance. Where there is a reliance on third party suppliers to provide services, including the areas of IT systems and information security, the Group’s sourcing policy ensures that outsourcing initiatives follow a defined process including due diligence, risk evaluation and ongoing assurance.
The Board has overall oversight responsibility for the Group’s IT systems and information security risk management and delegates this oversight to the Group Risk Committee (GRC). GRC is responsible for ensuring that management has processes in place designed to identify and evaluate IT systems and information security risks that the Group is exposed to and implementing processes and programmes to manage these risks and mitigate related incidents within appetite. GRC also reports material IT systems and information security risks to the Board via the Board Risk Committee. Management is responsible for identifying, considering and assessing material IT systems and information security risks on an ongoing basis, establishing processes to ensure that such potential risk exposures are monitored, putting in place appropriate mitigation measures and maintaining control improvement programmes.
The Group classifies the potential IT systems and information security risk of its suppliers based on the nature and criticality of the information accessed or processed. These assessments are completed at initial service onboarding and periodically throughout the supplier lifecycle. These assessments drive the level of ongoing supplier governance, assurance and monitoring. The Group provides training and other resources to its suppliers to support IT systems and information security resiliency in its supply chain. The Group also requires its suppliers to comply with its standard information security terms and conditions as a condition of doing business with it. Suppliers are required to provide management information to review and assess any potential information security related risks depending on the nature of the services being provided.
Operational risk events by risk category (losses greater than or equal to £10,000)1
| | | | | | | | | | | | | | | | | |
| % of total volume | | % of total losses |
| 2023 | 2022 | | 2023 | 2022 |
Business disruption and system failures | 0.31 | 0.37 | | 0.60 | 0.41 |
| Clients, products and business practices | 1.23 | 4.95 | | 52.19 | 73.43 |
| Damage to physical assets | 0.07 | 0.15 | | 0.09 | 0.03 |
| | | | | |
| Employee practices and workplace safety | 0.31 | 0.48 | | 0.43 | 0.09 |
| Execution, delivery and process management | 6.91 | 9.19 | | 21.43 | 15.17 |
| External fraud | 90.93 | 84.60 | | 25.23 | 10.82 |
| Internal fraud | 0.24 | 0.26 | | 0.03 | 0.05 |
| Total | 100.00 | 100.00 | | 100.00 | 100.00 |
1 Excludes losses related to PPI and provisions; the latter are outlined in note 38. 2022 breakdowns have been restated to reflect the removal of Insurance losses and due to the nature of the risk events which can evolve over time, such as the lag in operational losses.
| | | | | | | | |
89 | Lloyds Banking Group plc Annual Report on Form 20-F 2023 | |
Operating and financial review and prospects continued
Mitigating actions to the principal operational risks include the following:
•The Group has set out key controls, aligned to the Group’s risk appetite, via its policies, procedures and enterprise risk management framework, ensuring businesses assess the potential impacts of activity on customers, markets, colleagues and business risk profiles
•The Group adopts a risk-based approach to mitigate the internal and external fraud risks it faces, reflecting the current and emerging fraud risks within the market. Fraud risk appetite metrics holistically cover the impacts of fraud in terms of losses to the Group, costs of fraud systems and operations, and customer experience of actual and attempted fraud. Oversight of the appropriateness and performance of these metrics is undertaken regularly through business area and Group-level committees. This approach drives a continual programme of prioritised enhancements to the Group’s technology and process and people-related controls; with an emphasis on preventative controls supported by real time detective controls wherever feasible. Group-wide policies and operational control frameworks are maintained and designed to provide customer confidence, protect the Group’s commercial interests and reputation, comply with legal requirements and meet regulatory requirements. The Group’s fraud awareness programme remains a key component of its fraud control environment, and awareness of fraud risk is supported by mandatory training for all colleagues. This is further strengthened by material annual investment into both technology and the personal development needs of colleagues. The Group also plays an active role with other financial institutions, industry bodies and law enforcement agencies in identifying and combatting fraud
•The Group adopts a risk-based approach to mitigate cyber threats it faces. The effective operation of the Group’s estate is supported by an IT and Cyber Security Governance framework, guided by a threat-based strategy which underpins investment decisions. The ongoing protection of the estate and confidentiality of material information is ensured through adherence to the Group Security Policy which has been aligned to industry good practice including the NIST Cyber Security Framework; and material laws and regulations. The Group’s IT systems and information security risk management processes, which includes assessment, documentation and treatment have been integrated into its overall enterprise risk management framework. The Group engages a specialist third party consultancy on a periodic basis, to assess the maturity of its cyber security programme, in assessing, identifying and managing material risks from cybersecurity threats. During the handling of an incident, the Cyber Security team will continuously monitor and assess the impact to the Group. Thresholds have been set that, once triggered, will bring the information security risk owning business representatives, legal and compliance teams together as a subcommittee. The subcommittee will own the invocation of crisis management, Board notification and the drafting of any regulatory notifications. In the event of a major information security incident, including those with a material impact on the Group, the Chief Security Officer (CSO) maintains engagement with the executive, supported by the Group incident management teams
•The Group has adopted policies and procedures designed to detect and prevent the use of its banking network for money laundering, terrorist financing, bribery, tax evasion, human trafficking, modern-day slavery and wildlife trafficking, and activities prohibited by legal and regulatory sanctions. Against a background of complex and detailed laws and regulations, and of continued criminal and terrorist activity, the Group regularly reviews and assesses its policies, procedures and organisational arrangements to keep them current, effective and consistent across markets and jurisdictions
•The Group requires mandatory training on these topics for all employees. Specifically, the anti-money laundering procedures include ‘know-your-customer’ requirements, transaction monitoring technologies, reporting of suspicions of money laundering or terrorist financing to the applicable regulatory authorities, and interaction between the Group’s Integrated Intelligence and Investigations team and external agencies and other financial institutions. The Group economic crime prevention policy prohibits the payment, offer, acceptance or request of a bribe, including ‘facilitation payments’ by any employee or agent and provides a confidential reporting service for anonymous reporting of suspected or actual bribery activity. The Group economic crime prevention policy also sets out a framework of controls for compliance with legal and regulatory sanctions
•In addition to its efforts internally, the Group also contributes to economic crime prevention by supporting and championing industry-level activity, including:
–Representing large retail banks at the National Economic Crime Centre (NECC) led Public Private Operating Board (PPOB); co-chairing the Public Private Threat Group leading the UK’s response to money laundering; chairing the Joint Money Laundering Intelligence Taskforce (JMLIT) senior management team and providing expert resource to the NECC’s operational threat cells
–Collaborating with peer bank to take forward the second phase of data fusion (large-scale information sharing and analysis) with the National Crime Agency (NCA)
–Holding bilateral discussions with the Home Office on using suspected criminal funds to fund economic crime initiatives, in advance of the provisions being included in the Criminal Justice Bill
–In conjunction with UK Finance and peer banks, developing a pilot to use the newly acquired information sharing provisions contained within the Economic Crime and Corporate Transparency Act
–Being an active member of UK Finance where the Group has representation on every economic crime committee and panel. This includes attending the Sanctions and Fraud Committees, which are the industries’ primary forums for considering and responding to issues of mutual interest
–Helping fund the Dedicated Card and Payment Crime Unit to investigate fraud cases, target and where appropriate arrest and gain prosecution of offenders
–Being a member of Cifas, the largest cross-sector fraud sharing organisation, where the Group shares and receives internal and first party fraud data to detect, deter and prevent criminals exploiting our banking facilities
–Engagement with Europol and International Law Enforcement to share fraud and financial crime intelligence
–In partnership with the City of London Police, a pilot scheme was launched to use the proceeds of crime to fund fraud-fighting and victim support programmes: Cyber Detectives: a primary school education programme on fraud and cyber protection and Crooks on Campus: a fraud education programme on money mules which brings to life the reality of organised financial crime for university students
–The Group is an active supporter of Stop Scams UK. Working in partnership with other banks, telecoms and technology companies, the telephone hotline number - 159 - has been rolled out across the UK with excellent results
Operational resilience risk, on page 91, provides further information on the mitigating actions for cyber and IT resilience.
| | | | | | | | |
90 | Lloyds Banking Group plc Annual Report on Form 20-F 2023 | |
Operating and financial review and prospects continued
Monitoring
Monitoring and reporting of operational risk is undertaken at Board, Group, legal entity and business unit and functional committees. Each committee monitors key risks, control effectiveness, indicators, events, operational losses, risk appetite metrics and the results of independent testing conducted by Risk division and/or Group Internal Audit. Additionally, the Group’s IT and information security processes are validated and audited by internal experts within the Risk function and Group Internal Audit.
The Group maintains a formal approach to operational risk event escalation, whereby events are identified, captured and escalated, where appropriate based on materiality. Root causes of events are determined, and action plans put in place to ensure an optimum level of control to keep customers and the business safe, reduce costs, and improve efficiency.
The insurance policies are monitored and reviewed regularly, with recommendations being made to the Group’s senior management annually prior to each renewal. Insurers are monitored on an ongoing basis, to ensure counterparty risk is minimised. A process is in place to manage any insurer rating changes or insolvencies.
Operational resilience risk
Definition
Operational resilience risk is defined as the risk that the Group fails to design resilience into business operations including those that are outsourced, underlying infrastructure and controls (people, property, process, technology) so that it is able to withstand external or internal events which could impact the continuation of operations, and fails to respond in a way which meets customer and stakeholder expectations and needs when the continuity of operations is compromised.
Exposures
Ineffective operational resilience risk management could lead to important services not being available to customers, and in extreme circumstances, bank failure could result. The Group has in place a transparent and effective operating model to identify, monitor and test important business services and critical business processes from a customer, Group and systemic perspective. The failure to adequately build resilience into an important business service or critical business process may occur in a variety of ways, including:
•The Group being overly reliant on one location to deliver a critical business process
•The Group not having an adequate succession plan in place for designated subject matter experts
•The Group being overly reliant on a supplier which fails to provide a service
•A shortcoming in the Group’s ability to respond and/or recover in a timely manner following a cyber incident
•The Group failing to upgrade its IT systems and leaving them vulnerable to failure
Effective operational resilience ensures the Group designs resilience into its systems, is able to withstand and/or recover from a significant unexpected event occurring and can continue to provide services to its customers. A significant outage could result in customers being unable to access accounts or conduct transactions, which as well as presenting significant reputational risk for the Group would negatively impact the Group’s purpose. Operational resilience is also an area of continued regulatory and industry focus, similar in importance to financial resilience.
Failure to manage operational resilience effectively could impact the following other risk categories:
•Regulatory compliance: non-compliance with new/existing operational resilience regulations, for example, through failure to identify emerging regulation or not embedding regulatory requirements within the Group’s policies, processes and procedures or identify further future emerging regulation
•Operational risk: being unable to safely provide customers with business services
•Conduct risk: an operational resilience failure may render the Group liable to fines from the FCA for poor conduct
•Market risk: the Group being unable to provide key services could have ramifications for the wider market and could impact share price
Measurement
Operational resilience risk is managed across the Group through the Group’s enterprise risk management framework and operational risk policy and associated standards. Board risk appetite metrics for operational resilience are in place and are well understood. These specific measures are subject to ongoing monitoring and reporting, including a mandatory review of metrics and thresholds on at least an annual basis. To strengthen the management of operational resilience risk, the Group mobilised an operational resilience enhancement programme which is designed to focus on end-to-end resilience and the management of key risks to important processes.
Mitigation
The Group has increased its focus on operational resilience and has updated its operational resilience strategy to reflect changing priorities of both customers and regulators. Furthermore, the Group is in the process of responding to the publication of regulatory policy statements. Focus has been given to ensure compliance, and existing frameworks have been adapted to consider important business services and impact tolerances. At the core of its approach to operational resilience are the Group’s important business services and critical business processes which drive activity, including scenario testing to identify and drive remediation of vulnerabilities that could impact delivery of an important business service. The Group continues to maintain and develop playbooks that guide its response to a range of interruptions from internal and external threats and tests these through scenario-based testing and exercising.
The Group’s strategy considers the evolving risk management requirements, adapting the change delivery model to be more agile and develop the people skills and capabilities needed. The Group continues to review and invest in its control environment to ensure it addresses the risks it faces. Risks are reported and discussed at local governance forums and escalated to executive management and the Board as appropriate. The Group employs a range of risk management strategies, including: avoidance, mitigation, transfer (including insurance) and acceptance. Where there is a reliance on third party suppliers to provide services, the Group’s sourcing policy ensures that outsourcing initiatives follow a defined process including due diligence, risk evaluation and ongoing assurance.
Mitigating actions to the principal operational resilience risk are:
Cyber: Whilst the Group did not identify any cyber threats that materially affected its business strategy, results of operations or financial condition in 2023, the Group remains exposed to the risk of cyber threats and future interruptions that could potentially disrupt business operations and materially adversely affect the Group’s performance. The Board continues to invest heavily to protect the Group from cyber-attacks. Investment continues to focus on improving the Group’s approach to identity and access management, data loss prevention, improving capability to detect, respond and recover from cyber-attacks and improved ability to manage vulnerabilities across the estate.
| | | | | | | | |
91 | Lloyds Banking Group plc Annual Report on Form 20-F 2023 | |
Operating and financial review and prospects continued
To deal with cybersecurity threats, the Group has a dedicated Cyber Security function led by a certified CSO with over 12 years of experience in this field. The CSO actively participates in Audit Committee and Board meetings and is responsible for offering updates on information security risks and mitigation strategies to the Board and its subcommittees. GRC is responsible for the oversight of all risk policies, including the IT system and information security policy and commissions regular reviews and compliance updates to this policy. Additionally, the CSO chairs a subcommittee comprised of stakeholders including, but not limited to security representatives, risk management, compliance and Group Internal Audit. This subcommittee is focused on information security, to review major policy changes, strategies and key risk mitigations to enhance the governance of the information security strategies and policies.
IT resilience: the Group continues to optimise its approach to IT and operational resilience by investing in technology improvements and enhancing the resilience of systems that support the Group’s critical business processes and important business services, primarily through a portfolio of Technology Resilience and Security Change programmes. The Board optimises the role that resilient technology plays in maintaining banking services across the wider industry. As such, the Board dedicates considerable time and focus to this subject at both the Board and the Board Risk Committee, and continues to sponsor key investment programmes that enhance resilience.
People: the Group acknowledges the risks associated to the failure to maintain appropriately skilled and available colleagues. The Group continues to optimise its approach to ensure that, for example, the right number of colleagues are capable of supporting critical technology components. Key controls and processes are regularly reported to committee(s) and alignment with the Group’s strategy is closely monitored.
Property: the Group’s property portfolio remains a key focus in ensuring targeted resilience requirements are appropriately maintained, including energy resilience. Processes are in place to identify key buildings where an important business service or critical business process is performed. Depending on criticality, a number of mitigating controls are in place to manage the risk of severe critical business process disruption. The Group remains committed to investment in the upkeep of the property portfolio, primarily through the Group property upkeep investment programme.
Sourcing: the threat landscape associated with third party suppliers and the critical services they provide continues to receive a significant amount of regulatory attention. The Group acknowledges the importance of demonstrating control and responsibility for those important business services and critical business processes which could cause significant harm to the Group’s customers. The Group segments its suppliers by criticality and has processes in place to support ongoing supplier management.
Monitoring
Monitoring and reporting of operational resilience risk is undertaken at Board, Group, entity and divisional committees. Each committee monitors key risks, control effectiveness, key risk and control indicators, events, operational losses, risk appetite metrics and the results of independent testing conducted by Risk division and/or Group Internal Audit.
The Group maintains a formal approach to operational resilience risk event escalation, whereby material events are identified, captured and escalated. Root causes are determined, and action plans put in place to ensure an optimum level of control to keep customers and the business safe, reduce costs, and improve efficiency.
People risk
Definition
People risk is defined as the risk that the Group fails to provide an appropriate colleague and customer-centric culture, supported by robust reward and wellbeing policies and processes; effective leadership to manage colleague resources; effective talent and succession management; and robust control to ensure all colleague-related requirements are met.
Exposures
The Group’s management of material people risks is critical to its capacity to deliver against its strategic objectives, particularly in the context of organisational, political and external market change and increasing digitisation. The Group is exposed to the following key people risks:
•Failure to recruit, develop and retain a diverse workforce, with the appropriate mix and required level of skills and capabilities to meet the current and future needs of the Group
•Non-inclusive culture, ineffective leadership, poor communication, weak performance, inappropriate remuneration policies and poor colleague conduct
•Ineffective management of succession planning or failure to identify appropriate talent pipeline
•Failure to manage capacity, colleagues having excessive demands placed on them resulting in wellbeing issues and business objectives not being met
•Failure to meet all colleague-related legal and regulatory requirements
•Inadequately designed people processes that are not resilient to withstand unexpected events
•The increasing digitisation of the business is changing the capability mix required and may impact the Group’s ability to attract and retain talent
•Colleague engagement and sentiment may be challenged by a number of factors including changes to ways of working, dissatisfaction with the colleague proposition, cost of living pressures, and purpose of the business including changes to culture and ethical considerations
Measurement
People risk is measured through a series of quantitative and qualitative indicators, aligned to key sources of people risk for the Group such as succession, diversity, retention, colleague engagement and wellbeing. In addition to risk appetite measures and limits, people risks and controls are monitored on a monthly basis via the Group’s risk governance framework and reporting structures.
Mitigation
The Group takes many mitigating actions with respect to people risk. Key areas of focus include:
•Focusing on leadership and colleague engagement, through delivery of strategies to attract, retain and develop high calibre people together with a focus on creating a strong and resilient talent pipeline
•Continued focus on the Group’s culture and inclusivity strategy by developing and delivering initiatives that reinforce the appropriate behaviours which generate the best possible long-term outcomes for customers and colleagues
•Managing organisational capability and capacity through divisional people strategies to ensure there are the right skills and resources to meet customers’ needs and deliver the Group’s strategic plan
•Maintaining an attractive colleague proposition to promote an appropriate culture and colleague behaviours that meet customer needs and regulatory expectations
•Ensuring colleague wellbeing strategies and support are in place to meet colleague needs, alongside skills and capability growth required to maximise the potential of our people
•Ensuring compliance with legal and regulatory requirements, embedding compliant and appropriate colleague behaviours in line with Group policies, values and its people risk priorities
•Ongoing consultation with the Group’s recognised unions on changes which impact their members
•Reviewing and enhancing people processes to ensure they are fit for purpose and operationally resilient
| | | | | | | | |
92 | Lloyds Banking Group plc Annual Report on Form 20-F 2023 | |
Operating and financial review and prospects continued
Monitoring
People risk appetite metrics and business risk indicators are reported at the People and Places Group and Business Risk Committee, Group and Ring-fenced Bank Risk Committee and Board Risk Committee, on a regular basis.
All material people risk events are escalated in accordance with the Group’s operational risk policy.
Regulatory and legal risk
Definition
Regulatory and legal risk is defined as the risk of financial penalties, regulatory censure, criminal or civil enforcement action or customer detriment as a result of failure to identify, assess, correctly interpret, comply with, or manage regulatory and/or legal requirements.
Exposures
The Group has a zero risk appetite for material legal or regulatory breaches. The Group remains exposed to the evolving legal and regulatory landscape, such as changes to the regulatory framework, changing regulatory and other standards as well as uncertainty arising from the current and future litigation landscape.
Measurement
Regulatory and legal risks are measured against a defined risk appetite metric, which is an assessment of material regulatory breaches and material legal incidents.
Mitigation
The Group undertakes a range of key mitigating actions to manage regulatory and legal risk. These include the following:
•The Board has established a Group-wide risk appetite and metric for regulatory and legal risk
•Group policies and procedures set out the principles that should apply across the business which are aligned to the Group risk appetite. Mandated policies and processes require appropriate control frameworks, management information, standards and colleague training to be implemented to identify and manage regulatory and legal risk
•Business units identify, assess and implement policy and regulatory requirements and establish local controls, processes, procedures and resources to ensure appropriate governance and compliance
•Business units regularly produce management information to assist in the identification of issues and test management controls are working effectively
•The Legal function provides legal advice and together, the Risk and Legal functions provide oversight, proactive support and constructive challenge to the business in identifying and managing regulatory and legal issues
•Risk division conducts thematic reviews to provide oversight of regulatory compliance
•Horizon scanning is conducted to identify and address changes in regulatory and legal requirements
•The Group engages with regulatory authorities and industry bodies on forthcoming regulatory changes, market reviews and investigations, ensuring programmes are established to deliver new regulation and legislation
•The Group has adapted quickly to evolving regulatory expectations due to cost of living pressures and continues to engage with regulatory authorities
Monitoring
Material risks are managed through the relevant business committees, with review and escalation through Group-level committees where appropriate, including the escalation of any material regulatory breaches or material legal incidents.
Strategic risk
Definition
Strategic risk is defined as the risk which results from:
•Incorrect assumptions about internal or external operating environments
•Failure to understand the potential impact of strategic responses and business plans on existing risk types
•Failure to respond or the inappropriate strategic response to material changes in the external or internal operating environments
Exposures
The Group faces significant risks due to the evolving external environment, changing regulatory and competitive environments in the financial services sector, with increased pace, scale and complexity of change. Customer, shareholder and employee expectations continue to evolve, together with societal trends and cost of living pressures.
Similar to emerging risks, strategic risks can manifest themselves in existing principal risks or as new exposures which could adversely impact the Group and its businesses. In considering strategic risks, a key focus is the interconnectivity of individual risks and the cumulative effect of different risks on the Group’s overall risk profile.
Measurement
The Group assesses and monitors strategic risk implications as part of business planning and in its day-to-day activities, ensuring it responds appropriately to internal and external factors including changes to regulatory, macroeconomic and competitive environments. An assessment is made of the key strategic risks that are considered to impact the Group, leveraging internal and external information and the key mitigants or actions that could be taken in response.
Mitigation
The range of mitigating actions includes the following:
•Horizon scanning is conducted across the Group to identify potential threats, risks, emerging issues and opportunities and to explore future trends
•The Group’s business planning processes include an assessment of the strategic risk implications of new business, product entries and other strategic initiatives
•The Group’s governance framework mandates individuals’ and committees’ responsibilities and decision making rights, to ensure that strategic risks are appropriately reported and escalated
Monitoring
A review of the Group’s strategic risks is undertaken on at least an annual basis and the findings are reported to the Group and Board Risk Committees. During 2023, the process and analysis for strategic risks and emerging risks has highlighted the alignment and overlap between these risks. As a result, from 2024 onwards, we will iterate our reporting further and combine both into horizon and emerging risks. Further information on emerging risks can be found on pages 36 and 43. | | | | | | | | |
93 | Lloyds Banking Group plc Annual Report on Form 20-F 2023 | |
Operating and financial review and prospects continued
Investment portfolio, maturities, deposits
Maturities and weighted average yields of interest-bearing securities
Financial assets at fair value through other comprehensive income and debt securities held at amortised cost
The weighted average yield for each range of maturities is calculated by dividing the annualised interest income prevailing at 31 December 2023 by the book value of securities held at that date.
| | | | | | | | | | | | | | | | | | | | | | | | | | | | | | | | | | | |
| Maturing
within one year | | Maturing after one
but within five years | | Maturing after five
but within ten years | | Maturing
after ten years |
| Amount
£m | Average yield
% | | Amount
£m | Average yield
% | | Amount
£m | Average yield
% | | Amount
£m | Average yield
% |
| Financial assets at fair value through other comprehensive income | | | | | | | | | | | |
| US treasury and US government agencies | 283 | | 0.2 | | | 1,110 | | 5.8 | | | 170 | | 2.5 | | | – | | – | |
| Other government securities | 49 | | 0.8 | | | 3,254 | | 0.6 | | | 3,728 | | 0.6 | | | 5,547 | | 2.6 | |
| Asset-backed securities | 9 | | 5.9 | | | 95 | | 5.8 | | | 6 | | 4.2 | | | 63 | | 4.2 | |
| Corporate and other debt securities | 1,473 | | 4.2 | | | 8,791 | | 3.2 | | | 2,782 | | 3.1 | | | – | | – | |
| | | | | | | | | | | |
| 1,814 | | | | 13,250 | | | | 6,686 | | | | 5,610 | | |
| Debt securities held at amortised cost | | | | | | | | | | | |
| Government securities | 75 | | 2.5 | | | 158 | | 3.0 | | | 19 | | 5.3 | | | 483 | | 0.1 | |
| | | | | | | | | | | |
| | | | | | | | | | | |
| Asset-backed securities | 118 | | 5.5 | | | 5,532 | | 6.1 | | | 1,832 | | 5.8 | | | 3,324 | | 6.5 | |
| Corporate and other debt securities | 816 | | 2.4 | | | 2,644 | | 1.1 | | | 275 | | 3.8 | | | 90 | | 5.4 | |
| 1,009 | | | | 8,334 | | | | 2,126 | | | | 3,897 | | |
Maturity analysis and interest rate sensitivity of loans and advances to banks and customers and reverse repurchase agreements
The following table analyses the maturity profile and interest rate sensitivity of loans by type on a contractual repayment basis at 31 December 2023. All amounts are before deduction of impairment allowances. Demand loans and overdrafts are included in the ‘maturing in one year or less’ category.
| | | | | | | | | | | | | | | | | | | | | | | | | | | | | |
| Maturing
in one
year
or less
£m | | Maturing
after one
but within
five years
£m | | Maturing
after five
but within
fifteen years
£m | | Maturing
after
fifteen
years
£m | | Total
£m |
| Loans and advances to banks | 8,502 | | | 2,265 | | | 5 | | | – | | | 10,772 | |
| Loans and advances to customers: | | | | | | | | | |
| Financial, business and other services | 20,664 | | | 12,299 | | | 1,947 | | | 202 | | | 35,112 | |
| Manufacturing | 2,744 | | | 1,074 | | | 185 | | | 18 | | | 4,021 | |
| Mortgages | 15,216 | | | 55,676 | | | 131,505 | | | 121,230 | | | 323,627 | |
| Other personal lending | 2,025 | | | 6,377 | | | 1,120 | | | 15,820 | | | 25,342 | |
| Property companies and construction | 10,957 | | | 10,627 | | | 3,056 | | | 142 | | | 24,782 | |
| Transport, distribution and hotels | 5,491 | | | 3,701 | | | 823 | | | 29 | | | 10,044 | |
| Other | 9,396 | | | 15,997 | | | 3,625 | | | 1,516 | | | 30,534 | |
| 66,493 | | | 105,751 | | | 142,261 | | | 138,957 | | | 453,462 | |
| Reverse repurchase agreements | 37,308 | | | 1,463 | | | – | | | – | | | 38,771 | |
| Total loans | 112,303 | | | 109,479 | | | 142,266 | | | 138,957 | | | 503,005 | |
| Of which: | | | | | | | | | |
| Fixed interest rate | 55,125 | | | 68,802 | | | 112,449 | | | 115,131 | | | 351,507 | |
| Variable interest rate | 57,178 | | | 40,677 | | | 29,817 | | | 23,826 | | | 151,498 | |
| 112,303 | | | 109,479 | | | 142,266 | | | 138,957 | | | 503,005 | |
Deposits
The following tables show the details of the Group’s average customer deposits in each of the past three years.
| | | | | | | | | | | | | | | | | | | | | | | | | | | | | | | | | | | |
| 2023 | | 2022 | | 2021 |
| IFRS | Closing
balance
£m | Average
balance
£m | Average
rate
% | | Closing
balance
£m | Average
balance
£m | Average
rate
% | | Closing
balance
£m | Average
balance
£m | Average
rate
% |
| Non-interest bearing demand deposits | 114,890 | | 120,817 | | – | | | 132,439 | | 132,860 | | – | | | 131,721 | | 120,533 | | – | |
| Interest-bearing demand deposits | 257,511 | | 261,292 | | 2.08 | | | 269,546 | | 273,648 | | 0.40 | | | 272,424 | | 274,122 | | 0.11 | |
| Other deposits | 98,995 | | 87,879 | | 1.95 | | | 73,346 | | 71,438 | | 0.41 | | | 72,199 | | 74,240 | | 0.19 | |
| Total customer deposits | 471,396 | | 469,988 | | 1.52 | | | 475,331 | | 477,946 | | 0.29 | | | 476,344 | | 468,895 | | 0.09 | |
| | | | | | | | |
94 | Lloyds Banking Group plc Annual Report on Form 20-F 2023 | |
Operating and financial review and prospects continued
Investment portfolio, maturities, deposits continued
Uninsured deposits
The following table gives details of Lloyds Banking Group’s customer deposits which were not covered by any deposit protection scheme by time remaining to maturity.
| | | | | | | | | | | | | | | | | |
| 3 months
or less
£m | Over 3
months
but within
6 months
£m | Over 6
months
but within
12 months
£m | Over
12 months
£m | Total
£m |
| At 31 December 2023 | 199,146 | | 5,235 | | 6,557 | | 5,030 | | 215,968 | |
| At 31 December 2022 | 190,014 | | 3,213 | | 3,514 | | 4,313 | | 201,054 | |
Total uninsured customer deposits have been calculated as the aggregate carrying value of the Group’s customer deposits less the insured deposit amounts as determined for regulatory purposes by the Group’s licensed deposit-takers, being those deposits eligible for immediate protection under deposit protection schemes (principally the Financial Services Compensation Scheme in the UK).
The maturity analysis for uninsured deposits has been estimated using the weighted-average maturity profile of the total customer deposits of each of the Group’s licensed deposit-takers. The Group’s analysis of deposit eligibility has been refined in 2023.
| | | | | | | | |
95 | Lloyds Banking Group plc Annual Report on Form 20-F 2023 | |
Directors and senior management
The Group is led by the Board comprising a Chair (who was independent on appointment), independent non-executive directors and executive directors with a wide range of experience. The appointment of directors is considered by the Nomination and Governance Committee and approved by the Board. Following the provisions in the articles of association, directors must stand for election by the shareholders at the first annual general meeting following their appointment. In line with UK Corporate Governance best practice, all directors are subject to annual re-election by shareholders at each annual general meeting thereafter. The service contracts of all current executive directors are terminable on 12 months’ notice from the Group and six months’ notice from the individual. The Chair also has a letter of appointment. The Chair’s engagement may be terminated on six months’ notice by either party. The Chair and the independent non-executive directors are not entitled to receive any payment for loss of office (other than in the case of the Chair’s fees for the six month notice period). Independent non-executive directors are appointed for an initial term of three years after which their appointment may continue subject to an annual review. Their appointment may be terminated, in accordance with statute, regulation and the articles of association, at any time with immediate effect and without compensation.
The Board meets regularly. In 2023, a total of 9 meetings were held.
The roles of the Chair, the Group Chief Executive and the Board and its governance arrangements, including the schedule of matters specifically reserved to the Board for decision, are periodically reviewed. The matters reserved to the Board for decision include the approval of the annual report and accounts and any other financial statements; the payment of dividends; the long-term objectives of the Group; the strategies necessary to achieve these objectives; the Group’s medium-term plan and annual budget; significant investments and disposals; the basis of allocation of capital within the Group; the organisational structure of the Group; the arrangements for ensuring that the Group manages risks effectively; any significant change in accounting policies or practices; the appointment of the Company’s main professional advisers and their fees (where significant) other than the external auditors, whose fees are (subject to shareholder approval) approved by a Committee of the Board; and the determination of Board and Committee structures, together with their size and composition.
According to the articles of association, the business and affairs of the Company are managed by the directors, who have delegated to management the power to make decisions on operational matters, including those relating to credit, liquidity and market risk, within an agreed framework.
All directors have access to the services of the Company Secretary, and independent professional advice is available to the directors at the Group’s expense, where they judge it necessary to discharge their duties as directors.
The Chair has a private discussion at least once a year with each director on a wide range of issues affecting the Group, including any matters which the directors, individually, wish to raise.
There is an induction programme for all directors, which is tailored to their specific requirements having regard to their specific role on the Board and their skills and experience to date.
The directors and senior management of Lloyds Banking Group plc are:
Non-executive directors1
| | | | | | | | |
1.Sir Robin Budenberg CBE Chair Age: 64 Chair of the Nomination and Governance Committee and Member of the Remuneration Committee and the Responsible Business Committee Appointed: October 2020 (Board), January 2021 (Chair) Skills, experience, and contribution: •Extensive financial services and investment banking experience •Strong governance and strategic advisory skills in relation to companies and government •Regulatory, public policy and stakeholder management experience Robin spent 25 years advising UK companies and the UK Government while working for S.G. Warburg/UBS Investment Bank and was formerly Chief Executive and Chairman of UK Financial Investments (UKFI), managing the Government’s investments in UK banks following the 2008 financial crisis. He is a qualified Chartered Accountant. External appointments: Chair of The Crown Estate. | | 2.Alan Dickinson Deputy Chair and Independent Director Age: 73 Member of the Audit Committee, the Board Risk Committee, the Nomination and Governance Committee and the Responsible Business Committee Appointed: September 2014 (Board), May 2020 (Deputy Chair) Skills, experience, and contribution: •Highly regarded retail and commercial banker •Strong strategic, risk management and core banking experience •Regulatory and public policy experience Alan has 37 years’ experience with the Royal Bank of Scotland, most notably as Chief Executive of RBS UK. Alan was formerly Chairman of Urban&Civic plc and of Brown, Shipley & Co. Limited, a Non-Executive Director and Chairman of the Risk Committee of the Nationwide Building Society and of Willis Limited and a Governor of Motability. Alan is a Fellow of the Chartered Institute of Bankers and the Royal Statistical Society. Alan was Senior Independent Director of the Company between December 2019 and September 2023. External appointments: Non-Executive Director of the England and Wales Cricket Board. |
| | | | | | | | |
96 | Lloyds Banking Group plc Annual Report on Form 20-F 2023 | |
Management and employees continued
Non-executive directors continued
| | | | | | | | |
3.Cathy Turner Senior Independent Director Age: 60 Chair of the Remuneration Committee and Member of the Nomination and Governance Committee and Board Risk Committee Appointed: November 2022 (Board), September 2023 (Senior Independent Director) Skills, experience, and contribution: •Significant executive and non-executive financial services experience •Knowledge of complex remuneration matters •Communications expertise with a broad range of stakeholders including investors, regulators, government, media and unions Cathy has significant financial services experience, having worked in senior executive positions at Barclays plc and at the Group. Cathy has previously been a Non-Executive Director and Chair of the Remuneration Committee of Aldermore Group plc, Quilter plc and Countrywide plc. External appointments: Non-Executive Director and Chair of the Remuneration Committee of Rentokil Initial plc and Non-Executive Director, Senior Independent Director and Chair of the Remuneration Committee of Spectris plc. Partner on a part-time basis at Manchester Square Partners LLP. | | 4.Sarah Legg Independent Director Age: 56 Chair of the Audit Committee and Member of the Board Risk Committee and the Responsible Business Committee Appointed: December 2019 Skills, experience, and contribution: •Strong financial leadership and regulatory reporting skills •Significant audit and risk experience in financial leadership •Strong transformation programme experience Sarah has spent her entire executive career in financial services with almost 30 years at HSBC. She was the Group Financial Controller, a Group General Manager and CFO for HSBC’s Asia Pacific region. She also spent eight years as a Non-Executive Director of Hang Seng Bank Limited. External appointments: Non-Executive Director and Chair of the Audit and Risk Committee of Severn Trent plc, a Trustee of the Lloyds Bank Foundation for England and Wales, Board Member of the Audit Committee Chair’s Independent Forum and Chair of the Campaign Advisory Board, King’s College, Cambridge University. |
| | |
5.Lord Lupton CBE Independent Director and Chair of Lloyds Bank Corporate Markets plc Age: 68 Member of the Responsible Business Committee Appointed: June 2017 (Board), August 2017 (Chair of Lloyds Bank Corporate Markets plc) Skills, experience, and contribution: •Extensive international corporate experience, especially in financial markets •Strong board governance experience, including investor relations •Regulatory and public policy experience •Significant experience in strategic planning and implementation Lord Lupton was Deputy Chairman of Baring Brothers, co-founded the London office of Greenhill & Co. and was Chairman of Greenhill Europe. He is a former Treasurer of the Conservative Party and became a Life Peer in October 2015, serving on the House of Lords Select Committee on Charities. External appointments: Senior Advisor to Greenhill Europe, a Trustee of The Lovington Foundation and Chairman of the Board of Visitors of the Ashmolean Museum. | | 6.Amanda Mackenzie LVO OBE Independent Director Age: 60 Chair of the Responsible Business Committee and Member of the Remuneration Committee, the Nomination and Governance Committee and the Audit Committee Appointed: October 2018 Skills, experience, and contribution: •Extensive experience in ESG matters including responsible business and sustainability •Strong customer engagement and digital technology experience •Significant marketing and brand background Amanda was Chief Executive of Business in the Community, of which King Charles III is the Royal Founding Patron and which promotes responsible business and corporate responsibility. Prior to that role, she was a member of Aviva’s Group Executive for seven years as Chief Marketing and Communications Officer and was seconded to help launch the United Nation’s Sustainable Development Goals. She is also a former Director of British Airways AirMiles, BT, Hewlett Packard Inc and British Gas. External appointments: Non-Executive Director of The British Land Company plc, Chair of The Queen’s Reading Room and trustee of the charity Cumberland Lodge. |
| | | | | | | | |
97 | Lloyds Banking Group plc Annual Report on Form 20-F 2023 | |
Management and employees continued
Non-executive directors continued
| | | | | | | | |
7.Harmeen Mehta Independent Director Age: 49 Appointed: November 2021 Skills, experience, and contribution: •Over 25 years’ experience leading digital and complex transformation •Experience of building and running technology-led businesses and creating new ventures •A wealth of international and financial services knowledge having lived in 11 countries and worked across 30 countries on six continents Harmeen was appointed Chief Digital and Innovation Officer at BT in April 2021. Prior to that role, she spent seven years as Global Chief Information Officer and Head of Cyber Security and Cloud Business at Bharti Airtel, leading its cloud and security businesses. Earlier in her career, Harmeen held CIO positions at BBVA, HSBC and Bank of America Merrill Lynch. External appointments: Chief Digital and Innovation Officer at BT. | | 8.Scott Wheway Independent Director and Chair of Scottish Widows Group Age: 57 Member of the Board Risk Committee and Nomination and Governance Committee Appointed: August 2022 (Board), September 2022 (Chair of Scottish Widows Group) Skills, experience, and contribution: •Significant financial services board and chair experience •Extensive knowledge and experience of large-scale banking and insurance businesses •Track record as a non-executive and executive in customer-centric companies Scott was appointed Chair of Centrica plc in 2020 where he has served on the board since 2016. Scott was formerly Chair of AXA UK plc, Chair of Aviva Insurance Limited, a Non-Executive Director of Aviva plc and Senior Independent Director of Santander UK plc. He worked as an executive in the retail sector for over 25 years where he held positions including chief executive officer of Best Buy Europe, managing director of Boots the Chemist plc and a number of senior executive positions at Tesco plc. External appointments: Chair of Centrica plc. |
| | |
9.Catherine Woods Independent Director Age: 61 Chair of the Board Risk Committee, and Member of the Audit Committee and the Remuneration Committee Appointed: March 2020 Skills, experience, and contribution: •Extensive executive experience of international financial institutions •Deep experience of risk and transformation oversight •Strong focus on culture and corporate governance Catherine is a former Deputy Chair and Senior Independent Director of AIB Group plc where she also chaired the Board Audit Committee. In her executive career with J P Morgan Securities, she was Vice President, European Financial Institutions, Mergers and Acquisitions, and Vice President Equity Research Department, forming the European Banks Team. External appointments: Non-Executive Director and Deputy Chair of BlackRock Asset Management Ireland Limited. | | |
1 Alan Dickinson and Lord Lupton have notified the Board that they do not intend to seek re-election at this year’s annual general meeting. Nathan Bostock will be appointed as a non-executive director and, subject to regulatory approval, Chair of Lloyds Bank Corporate Markets plc, in each case with effect from 1 August 2024.
| | | | | | | | |
98 | Lloyds Banking Group plc Annual Report on Form 20-F 2023 | |
Management and employees continued
Executive directors
| | | | | | | | |
1.Charlie Nunn Executive Director and Group Chief Executive Age: 52 Appointed: August 2021 Skills, experience, and contribution: •Extensive financial services experience including in Chief Executive and other leadership roles •Strategic planning and implementation •Extensive experience of digital transformation Charlie has over 25 years’ experience in the financial services sector. Prior to joining the Group, Charlie held a range of leadership positions at HSBC, including Global Chief Executive, Wealth and Personal Banking, and Group Head of Wealth Management and Digital, as well as Global Chief Operating Officer of Retail Banking and Wealth Management. Charlie began his career at Accenture, where he worked for 13 years in the US, France, Switzerland and the UK before being made a Partner. He then moved to McKinsey & Co. as a Senior Partner, leading on projects for five years. External appointments: None. | | 2.William Chalmers Executive Director and Chief Financial Officer Age: 55 Appointed: August 2019 Skills, experience, and contribution: •Significant board level strategic and financial leadership experience •Strategic planning and development, mergers and acquisitions, equity and debt capital structuring and risk management William joined the Board in August 2019, when he was appointed Chief Financial Officer and was Interim Group Chief Executive from May 2021 to August 2021. William has worked in financial services for over 25 years and previously held a number of senior roles at Morgan Stanley, including Co-Head of the Global Financial Institutions Group and Head of EMEA Financial Institutions Group. Before joining Morgan Stanley, William worked for J P Morgan, again in the Financial Institutions Group. External appointments: None. |
| | |
Employees
As at 31 December 2023, the Group employed 62,569 people (on a full-time equivalent basis), compared with 59,354 at 31 December 2022 and 57,955 at 31 December 2021. At 31 December 2023, 61,581 employees were located in the UK, 526 in continental Europe, 232 in the Americas, and 230 in the rest of the world. At the same date, 31,648 people were employed in Retail, 10,472 in Commercial Banking, 5,685 in Insurance, Pensions and Investments, and 14,764 in other functions.
The Group has Codes of Responsibility which apply to all employees. The Codes of Responsibility can be found at: www.lloydsbankinggroup.com/who-we-are/responsible-business.html.
| | | | | | | | |
99 | Lloyds Banking Group plc Annual Report on Form 20-F 2023 | |
Directors’ remuneration report
Remuneration Committee
Chair’s statement
| | |
|
Throughout 2023 we have continued to support our people with the rising cost of living. We recognise the continued commitment of our colleagues and announced changes to our reward package providing greater certainty in what remains a fast-changing economic environment. This latest two-year pay deal means that between August 2022 and April 2025 we will have provided a minimum £5,0001 pay award and £2,0001 in cash support, worth a total of around 35 per cent of salary, for our colleagues at lower grades. |
Cathy Turner Chair, Remuneration Committee |
|
| | | | | | | | | | | |
| Remuneration content | 6 | |
| | | |
| Chair’s statement | | |
| Remuneration at a glance | | |
| 2023 annual report on remuneration | | |
| 2023 Directors’ Remuneration Policy summary | | |
| | | |
| | | |
| Supporting our colleagues | 6 | |
| | | |
| •Agreed a multi-year pay proposal for 2024 and 2025 reflecting our continued desire to support colleagues during uncertain times •Made a £5001 payment in December 2023 to around 44,000 colleagues recognising immediate cost challenges •Consolidated a significant portion of our Group Performance Share (annual bonus) into base salary for around 32,000 colleagues giving more certainty and delivering reward faster | |
| | | |
Dear Shareholder
On behalf of the Board, it is my pleasure to present the directors’ remuneration report for the year ended 31 December 2023. I would also like to take this opportunity to thank Alan Dickinson for his commitment and contribution to the work of the Remuneration Committee (the Committee) during his time as Chair.
Supporting our customers and colleagues in 2023
Helping Britain Prosper has been central to all that the Group has done in 2023, focusing on delivering for customers, clients and shareholders. This has meant providing support through a tough and uncertain economic period which, whilst inflationary pressures have eased somewhat, remains an uncertain outlook for 2024 for many of our customers and colleagues. Our colleagues have worked tirelessly to support our customers, clients and communities as they continue to navigate this fast-changing environment.
We remained committed to our ambition to be the Best Bank for Customers; we proactively targeted support for customers facing economic uncertainty, directly contacting around 675,000 mortgage customers to encourage a review of their options, contacted 7.5 million customers since April 2022 to offer support and enhance financial resilience and, contacted around 15 million customers on their savings options.
The Group delivered a robust financial performance in 2023 enabling a total ordinary dividend of 2.76 pence per share for 2023 and its intention to implement an ordinary share buyback of up to £2.0 billion in 2024, benefiting our 2.2 million shareholders, including most of our employees. Recognising the continued commitment of our colleagues, the Committee has reflected on how our overall reward package meets both their needs and the needs of the Group and, as a result, we have made a number of changes over 2023. For our more senior colleagues, including our executive directors, we are introducing greater performance differentiation in variable reward, including the return to a performance-based Long Term Incentive Plan (LTIP) for our Group Executive Committee members which will deliver stronger alignment and accountability for the delivery of our purpose-driven strategy. For our junior colleagues we’ve kept things simple, giving more certainty and delivering reward faster, with a continuing focus on supporting those impacted most by increased day-to-day living costs.
Recognising the importance of certainty of earnings for many employees, in July 2023, we consolidated a significant portion of our annual bonus, the Group Performance Share (GPS) into base salary for around 32,000 colleagues. We also consolidated our 4 per cent Flex cash allowance into base salary for the majority of colleagues, further simplifying their reward package.
Over the course of 2023 we have worked closely with our recognised unions, Accord and Unite, to agree an industry-leading, multi-year pay deal for 2024 and 2025, reflecting our continued commitment to support colleagues and to help them plan for the future. To recognise the immediate cost of living challenges, we made a further £5001 payment in December 2023 to around 44,000 colleagues who, including this payment, will receive average pay increases of between 9.1 per cent and 14.4 per cent cumulatively over the two years. The overall increase to our total pay costs over this two-year period will be lower at 8.2 per cent, as we continue to direct spend to our lowest paid colleagues. As part of our multi-year pay commitment, we will also raise our minimum salary across the Group to £25,0001 by April 2025, all part of delivering on our purpose of Helping Britain Prosper. Our two-year pay deal means that between August 2022 and April 2025, we will have provided a minimum £5,0001 pay award and £2,0001 in cash support, worth a total of around 35 per cent of salary, for our colleagues at lower grades.
1 Pro rated for reduced hours.
| | | | | | | | |
100 | Lloyds Banking Group plc Annual Report on Form 20-F 2023 | |
2023 variable reward outcomes
In 2023, we are seeing real evidence of strategic progress as we transform the business and have increased our confidence in delivering the 2024 and 2026 commitments and growth. As a result of our robust financial performance this year, the Committee has approved a GPS pool of £384 million. This is a lower absolute pool than in 2022 because of the consolidation referred to above. On a like-for-like basis, including the consolidation of variable pay, the 2023 pool would be higher than 2022. Ensuring colleagues share in the success of the Group is an important element of our remuneration approach.
The approved pool includes the impact of a provision for the potential impact of the recently announced FCA review into historical motor finance commission arrangements.
In 2021, Long Term Share Plan (LTSP) awards were granted to around 600 colleagues and the Committee has determined that these should vest in full. In making this decision, the Committee considered several elements to satisfy itself that the vesting is appropriate. It noted that, during the ‘pre-grant test’ this award was reduced by up to 40 per cent to reflect the Group’s performance in 2020, the share price at the time of award and the wider experience of our shareholders. Furthermore, the vesting is subject to a ‘pre-vest test’ consisting of three financial underpins and four key questions. Finally, there was careful consideration whether an adjustment for windfall gains would be appropriate and it was concluded that given the award was initially reduced by up to 40 per cent, granted at a share price of 39.3015 pence which is higher than the 31.2 pence over the pandemic period and consistent with our share price range over the performance period (33-55 pence), no windfall gain has arisen and therefore no further adjustment would be appropriate. More detail is provided on page 107. Executive directors’ remuneration outcomes
Charlie Nunn, Group Chief Executive (GCE) continues to show strong leadership in all aspects of the business and consistently demonstrates the Group’s values. He has led the strategic and cultural transformation which has maintained momentum whilst the Group has also navigated a challenging external environment. Once again, Charlie has overseen the Group’s robust financial performance and achievement of broader Group balanced scorecard (BSC) targets whilst maintaining a strong regulatory and risk environment.
Likewise, William Chalmers, Chief Financial Officer (CFO), has played a critical role in the development, communication and execution of our new strategy, as well as embedding and delivering a strong commercial, capital and investment discipline across the Group.
The Committee determined that the GPS (annual bonus) awards for the GCE and CFO should be in line with the Group’s performance as assessed by the Group BSC of 80.3 per cent of maximum, with resultant awards of £1,277,372 and £920,658 respectively. This BSC outcome was inclusive of a downward adjustment in recognition of the external factors which benefited the ‘reduction in carbon emissions’ measure. Further details are outlined on page 105. In 2021, William Chalmers was granted an LTSP award of 75 per cent of salary, a reduction of 40 per cent versus the typical award recognising the Group’s performance in 2020. In line with the outcome for other participants set out above, William’s award will vest in full. 2021 LTSP awards were granted prior to Charlie Nunn joining the Group and therefore he did not receive an award.
The 2023 Group BSC outcome also acts as part of a ‘pre-grant test’ for our 2024 LTIP awards. Given our robust 2023 performance, the Committee has determined to grant LTIP awards to the GCE and the CFO of 300 per cent of salary in line with the policy approved at the last AGM.
The vesting outcome of the LTIP award will be subject to the achievement of stretching performance targets (see page 116) measured over the period 2024 to 2026. Strengthening the Group’s performance culture
The pivot towards a more demanding, high-performance culture is critical in delivering against the ambitious strategy we announced in 2022; returning to a performance-related LTIP directly aligns with that objective. We appreciated your overwhelming support having achieved 96 per cent support for the Remuneration Policy at the AGM in 2023.
Our principal reason for reintroducing an LTIP is to deliver stronger alignment between variable reward outcomes and the creation of shareholder value through the delivery of our strategy and the deepening of our relationships with our customers. Accordingly, the Committee has given careful consideration to the choice of LTIP performance measures ensuring that they are both stretching and transparent.
As set out in our Directors’ Remuneration Policy (DRP) approved at the 2023 AGM, 50 per cent of the LTIP outcome will be weighted to robust measures directly linked to our financial performance as we build to higher and more sustainable returns – Return on Tangible Equity, Capital Build and relative Total Shareholder Return (rTSR).
Recognising that the delivery of our refreshed strategy is critical to the creation of value for shareholders and our purpose of Helping Britain Prosper, a further 35 per cent of the LTIP will depend on performance against our four strategic growth pillars – Deepen and innovate in Consumer, Create a new mass affluent offering, Digitise and diversify our SME business and Target our Corporate and Institutional offering.
Our strategy is purpose driven and we continue to aspire towards a more sustainable and inclusive future through support for areas in which we can make a difference, such as our commitment to sustainable financing and the transition to net zero. 15 per cent of the LTIP outcome will therefore depend on the extent to which we deliver on our Sustainable Finance and Investment commitments and make progress towards our 2030 Net-Zero Banking Alliance (NZBA) sector targets and Scottish Widows’ overall 2030 net-zero ambition.
Full details of our new LTIP can be found on page 116. For the last two years, our priority has been pay for our most junior colleagues and we did not award pay increases to our executive directors in 2023. For 2024, we will be increasing the fixed pay of our executive directors by four per cent consistent with the pay rise awarded to the majority of the wider colleague population as part of our unique two-year commitment on pay.
We will also be recommending a resolution to the AGM to ensure our governance remains aligned with the PRA’s updated Policy Statement on the setting of variable to fixed pay ratios for large UK institutions; the variable pay opportunity of our executive directors is determined by our Directors’ Remuneration Policy and will not be impacted.
Finally, together with my Committee members, I would like to thank our shareholders for their continued support and our colleagues for delivering another robust set of results in 2023.
On behalf of the Board
4
Cathy Turner
Chair, Remuneration Committee
| | | | | | | | |
101 | Lloyds Banking Group plc Annual Report on Form 20-F 2023 | |
Our remuneration package
Our remuneration package below summarises the different remuneration elements for executive directors.
| | | | | | | | |
102 | Lloyds Banking Group plc Annual Report on Form 20-F 2023 | |
2023 Remuneration at a glance
Our at a glance summary sets out clearly and transparently the total remuneration paid to our executive directors for 2023.
Full assessments of the 2023 Group balanced scorecard and 2021 Long Term Share Plan can be found on pages 105 to 107. | | | | | | | | | | | | | | | | | | | | |
| Key financial highlights | | | | 6 | |
| £5.5bn | | 15.8% | | £3.8bn | |
| Statutory profit after tax,
up 41 per cent vs 2022 | | Return on tangible equity,
above guidance | | Total capital return including an
ordinary dividend of 2.76 pence
per share, up 15 per cent vs 2022 | |
| | | | | | |
| | |
| | | | | | |
| | | | | | | | | | | | | | |
| 2023 Total remuneration (£000) | | 6 | |
| Group Chief Executive The single total figure of remuneration for the Group Chief Executive during 2023 was £3.7 million. This is a decrease of 2 per cent compared to 2022 largely driven by the lower short term variable award in 2023 given the Group balanced scorecard performance of 80.3 per cent versus 2022 at 84.1 per cent. | | | |
| | | | |
| Chief Financial Officer The single total figure of remuneration for the Chief Financial Officer during 2023 was £3.1 million. This is a decrease of 6 per cent compared to 2022 which was driven by a lower long-term incentive payment for 2023. The 2021 LTSP award was reduced by 40 per cent upfront at the time of grant, showing restraint based on 2020 Group performance. As part of the 2023 Directors’ Remuneration Policy, the maximum GPS opportunity for the CFO was increased from 100 per cent to 140 per cent of salary. | | | |
| | | | |
| | | | | | | | | | | | | | | | | | | | | | | | | | |
| 2023 Group balance scorecard performance | 6 | | | | 2024 Long Term Incentive Plan (LTIP) award | 6 | |
| 80.3% Our Group balanced scorecard reflects a strong business performance. Further details can be found on pages 105 to 106. | | | | The Remuneration Committee has considered the Group’s performance in 2023 and other factors as part of the ‘pre-grant test’ as well as the individual contribution of the executive directors and will grant 2024 Long Term Incentive Plan awards of 300 per cent of salary to the Group Chief Executive and the Chief Financial Officer (see page 116). | |
| | | | | | | | |
| | | | | | | | |
| 2023 Group Performance Share (GPS) pool | 6 | | | | 2021 Long Term Share Plan (LTSP) outcome | 6 | |
| £384m The Committee determined a GPS pool for 2023 of £384 million, reflecting the Group’s strong financial and overall business performance. While the pool is down from 2022, the 2023 outcome reflects the consolidation from GPS to fixed pay to provide greater certainty for our colleagues as described on page 100. | | | | The award level for the 2021 LTSP was appropriately set at grant in March 2021. Vesting was subject to a ‘pre-vest test’ which has been assessed as ‘met’. For full details on the ‘pre-vest test’ please see page 107. | |
| | | | | | | | |
| | | | | | | | |
103 | Lloyds Banking Group plc Annual Report on Form 20-F 2023 | |
2023 annual report on remuneration
| | | | | | | | | | | | | | | | | | | | | | | | | | | | | | | | |
| Executive director single total figure of remuneration | 6 | |
| | | | | | | | | | |
| £000 | Charlie Nunn | | William Chalmers | | Totals | |
| 2023 | 2022 | | 2023 | 2022 | | 2023 | 2022 | |
| Base salary | 1,136 | | 1,133 | | | 819 | | 817 | | | 1,955 | | 1,950 | | |
| Fixed Share Award1 | 1,050 | | 1,050 | | | 504 | | 504 | | | 1,554 | | 1,554 | | |
| Benefits | 48 | | 76 | | | 62 | | 62 | | | 110 | | 138 | | |
| Pension | 170 | | 170 | | | 123 | | 123 | | | 293 | | 293 | | |
| Total fixed pay | 2,404 | | 2,429 | | | 1,508 | | 1,506 | | | 3,912 | | 3,935 | | |
| Group Performance Share2 | 1,277 | | 1,338 | | | 921 | | 689 | | | 2,198 | | 2,027 | | |
| Long-term Incentive3,4,5 | – | | – | | | 674 | | 1,115 | | | 674 | | 1,115 | | |
| Total variable pay | 1,277 | | 1,338 | | | 1,595 | | 1,804 | | | 2,872 | | 3,142 | | |
| Other remuneration6 | – | | – | | | 1 | | 1 | | | 1 | | 1 | | |
| Total remuneration | 3,681 | | 3,767 | | | 3,104 | | 3,311 | | | 6,785 | | 7,078 | | |
| Less: Performance adjustment | – | | – | | | – | | – | | | – | | – | | |
| Total remuneration less performance adjustment | 3,681 | | 3,767 | | | 3,104 | | 3,311 | | | 6,785 | | 7,078 | | |
| | | | | | | | | | |
1 The Fixed Share Award is part of fixed remuneration and is not subject to any performance conditions (see page 121). 2 Awards for Charlie Nunn and William Chalmers will be made in March 2024 in a combination of cash and shares.
3 The 2021 Long Term Share Plan (LTSP) vesting (see page 107) at 100 per cent was confirmed by the Remuneration Committee at its meeting on 15 February 2024. The total number of shares vesting will be 1,547,340 for William Chalmers. The average share price between 1 October 2023 and 31 December 2023 of 43.564 pence has been used to indicate the value. The shares were awarded in 2021 based on a share price of 39.3015 pence and as such 11 per cent of the reported value is attributable to share price appreciation. 4 The long-term incentive figures for 2022 have been adjusted to reflect the share price on the date of vesting (7 March 2023) of 51.764 pence instead of the average price of 44.04 pence reported in the 2022 report.
5 The 2021 LTSP awards were granted prior to Charlie Nunn joining as Group Chief Executive from 16 August 2021.
6 Other remuneration payments comprise income from all employee share plans, which arises through employer matching or discounting of employee purchases.
| | | | | | | | | | | | | | |
| 2023 pension and benefits | | 6 | |
| | | | |
| | Charlie
Nunn
2023 | William
Chalmers
2023 | |
| Pension/Benefits | | | |
| Pension | 170,438 | | 122,842 | | |
| Car or car allowance | – | | 12,000 | | |
| Flexible benefits payments1 | 45,450 | | 48,507 | | |
| Private medical insurance | 1,130 | | 1,130 | | |
| | | | |
| Transportation2 | 1,733 | | 294 | | |
| Subtotal for Total Benefits less pension | 48,313 | | 61,931 | | |
| | | | |
1 Includes flexible benefits allowance and holidays sold through the Group’s flexible benefits plan.
2 Transportation benefits relate to the 2022/23 tax year.
Defined benefits pension arrangements
There are no executive directors with defined benefit pension entitlements.
Payments for loss of office
No payments for loss of office were made in 2023.
Payments within the reporting year to past Directors
As disclosed in the 2021 directors’ remuneration report, Sir António Horta-Osório was provided with tax assistance worth £30,545 (inclusive of VAT) during 2023. There are no other payments made to past directors in 2023.
External appointments
No executive director served as a non-executive director on the board of another company in 2023.
| | | | | | | | |
104 | Lloyds Banking Group plc Annual Report on Form 20-F 2023 | |
Our 2023 balance scorecard
Our balanced scorecard provides transparency on how our performance directly aligns with remuneration outcomes for 2023 GPS.
Strong performance across financial, customer and ESG measures has resulted in an overall outcome of 80.3 per cent as set out in the scorecard assessment table below. Our 2023 employee engagement index score is somewhat reflective of implementing some necessary but tough changes in the operation of flexible working. Further commentary on non-financial performance is described on page 106. For 2023, ESG metrics aligned to our public commitments on climate change and promoting inclusion and diversity accounted for 17.5 per cent of the scorecard.
In determining the scorecard outcome for 2023, the Committee concluded that the mechanical outcome for reducing our operational carbon emissions benefited significantly from external factors including changes in government policy and a milder winter compared to the ten year average. Therefore, while the measure outcome is 93.3 per cent, a downward adjustment to 50 per cent has been applied as shown below reducing the measure outcome to 2.5 per cent.
The Committee is satisfied the adjusted outcome of 80.3 per cent fairly reflects Group performance and appropriately rewards the executive directors for their performance within the context of overall shareholder experience.
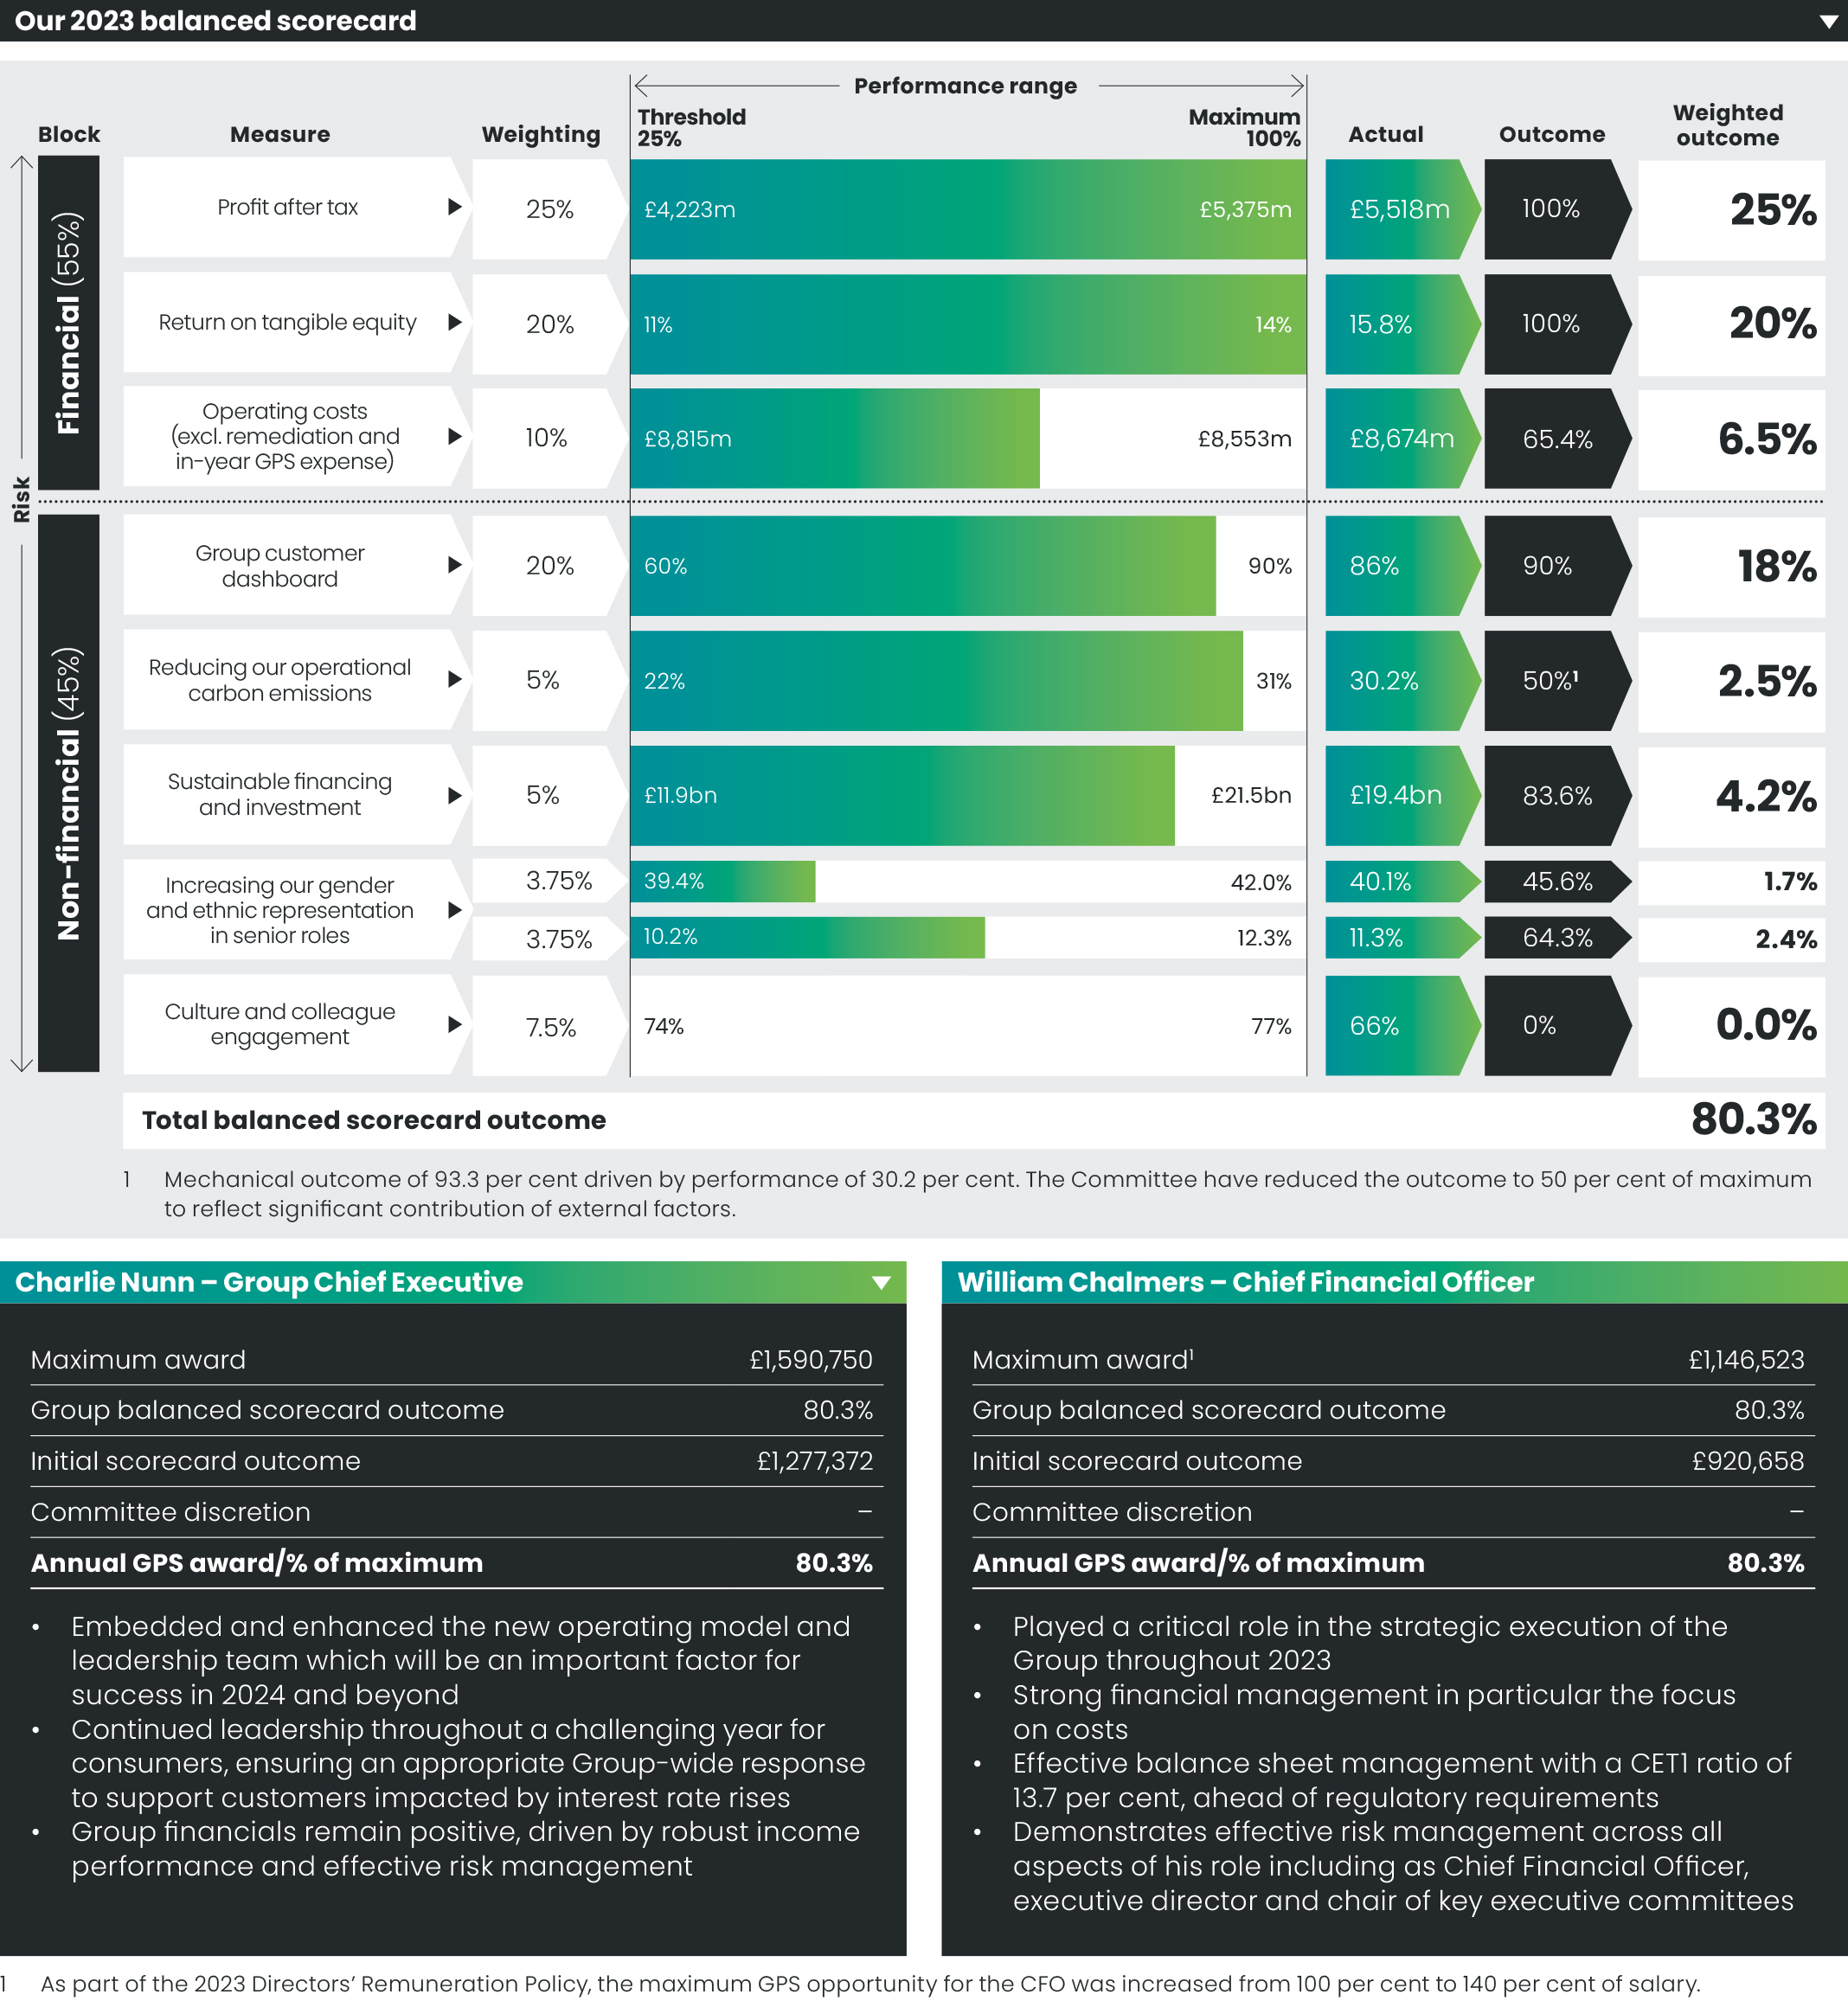
| | | | | | | | |
105 | Lloyds Banking Group plc Annual Report on Form 20-F 2023 | |
Non-financial measures
(45%) commentary
The scorecard that the Committee used in determining the annual Group Performance Share awards for the executive directors, along with the assessment of performance against the scorecard, is detailed on page 105. The table below outlines the Committee’s assessment of the non-financial elements of the scorecard. | | | | | | | | | | | | | | |
| Measure | | Commentary | |
| 6 | | •The 2023 Group customer dashboard contains 195 targeted measures relating to customer satisfaction, including; customer complaints, NPS and peer benchmarks •In 2023, 86 per cent of Group customer dashboard measures achieved target (compared to 80 per cent in 2022), supported by ongoing strong performance relative to peers. Continued focus is required to maintain strong customer performance and to further improve scores in the context of our growth strategy •Score reflects the percentage of Group customer dashboard measures achieving target in 2023 | |
| Group customer dashboard Our assessment of how effectively we are serving customers across all brands, products and services. | | |
| | | | |
| 6 | | •A 30.2 per cent reduction has been achieved in 2023 from our 2018/19 baseline. Year on year reductions in gas and refrigerants have been delivered, although increases continue to be seen in commuting and business travel emissions as colleagues increase their presence in the office as part of the new approach to flexible working •A downward adjustment to 50 per cent of maximum has been applied to reflect that a significant proportion of the 2023 reduction has been driven by external factors including changes in government policy and a milder winter compared to the ten year average •Metric supports our external commitments to achieve net zero carbon operations by 2030 and maintain travel emissions below 50 per cent of 2018/2019 levels | |
| Reducing operational carbon emissions Reported vs 2018/19 baseline. Includes Scope 1, Scope 2 and Scope 3 carbon emissions. Reporting year is October to September. | | |
| | | | |
| 6 | | •We have continued strong performance with our sustainable finance and investment metric across all contributing business lines – Commercial Banking, Consumer Lending Mortgages, Consumer Lending Transport and Scottish Widows Investments •Our robust performance continues to be driven by the positive uptake of electric vehicles and the acquisition of Tusker, along with our expanded product range for EPC A/B properties. Our performance was bolstered by Hybrid/EV Clean Growth Finance Initiative transactions and Debt Capital Markets activity, along with an increase in sustainable financing, for example across solar financing, battery storage and EV charging. Performance of our investments in climate-aware strategies has been driven by allocations to ESG Property and Group Environmental Solutions, as well as into the BlackRock Climate Transition Global Equity Fund | |
| Sustainable financing and investment1 | | |
| | | | |
| 6 | | •We have increased the representation of women within our senior population by 0.7 percentage points since the end of 2022, moving from 39.4 per cent to 40.1 per cent •We have increased the representation of Black, Asian and Minority Ethnic colleagues by 1.1 percentage points since the end of 2022, moving from 10.2 per cent to 11.3 per cent | |
| Increasing our gender and ethnic representation in senior roles | | |
| | | | |
| 6 | | •Our employee engagement index (EEI) encompasses pride and satisfaction working for Lloyds Banking Group, and also recommending Lloyds Banking Group as a great place to work •Our 2023 EEI score has been impacted by changes to flexible working arrangements, made to ensure flexible working is available to all colleagues in moments that matter. Not all colleagues welcomed the changes necessary to transform the Group. Despite this our in-year advocacy measure is moving in a positive direction | |
| Culture and colleague engagement Our employee engagement index score | | |
| | | | |
1 Includes sustainable finance for: Corporate and Institutional, Business and Commercial Banking clients, EPC A/B mortgage lending (full year estimate based on September 2023 actual position), financing for EV and plug-in hybrid electric vehicles and Scottish Widows discretionary investment in climate aware strategies.
| | | | | | | | |
106 | Lloyds Banking Group plc Annual Report on Form 20-F 2023 | |
2021 Long Term Share Plan
A Long Term Share Plan award was granted in relation to 2020 performance under the terms of the previous Remuneration Policy.
It is an important feature of the LTSP that performance is assessed and appropriately recognised upfront in the award size during the ‘pre-grant test’.
A final ‘pre-vest test’ of financial underpins and consideration of four key questions takes place prior to vesting to ensure performance over the period has been sustainable. The Committee has completed the full assessment and there is nothing known now which, had it been known at the time of grant, would have changed the initial award levels.
The outcome of the ‘pre-vest test’ of both financial underpin performance and consideration of the four key questions is shown below.
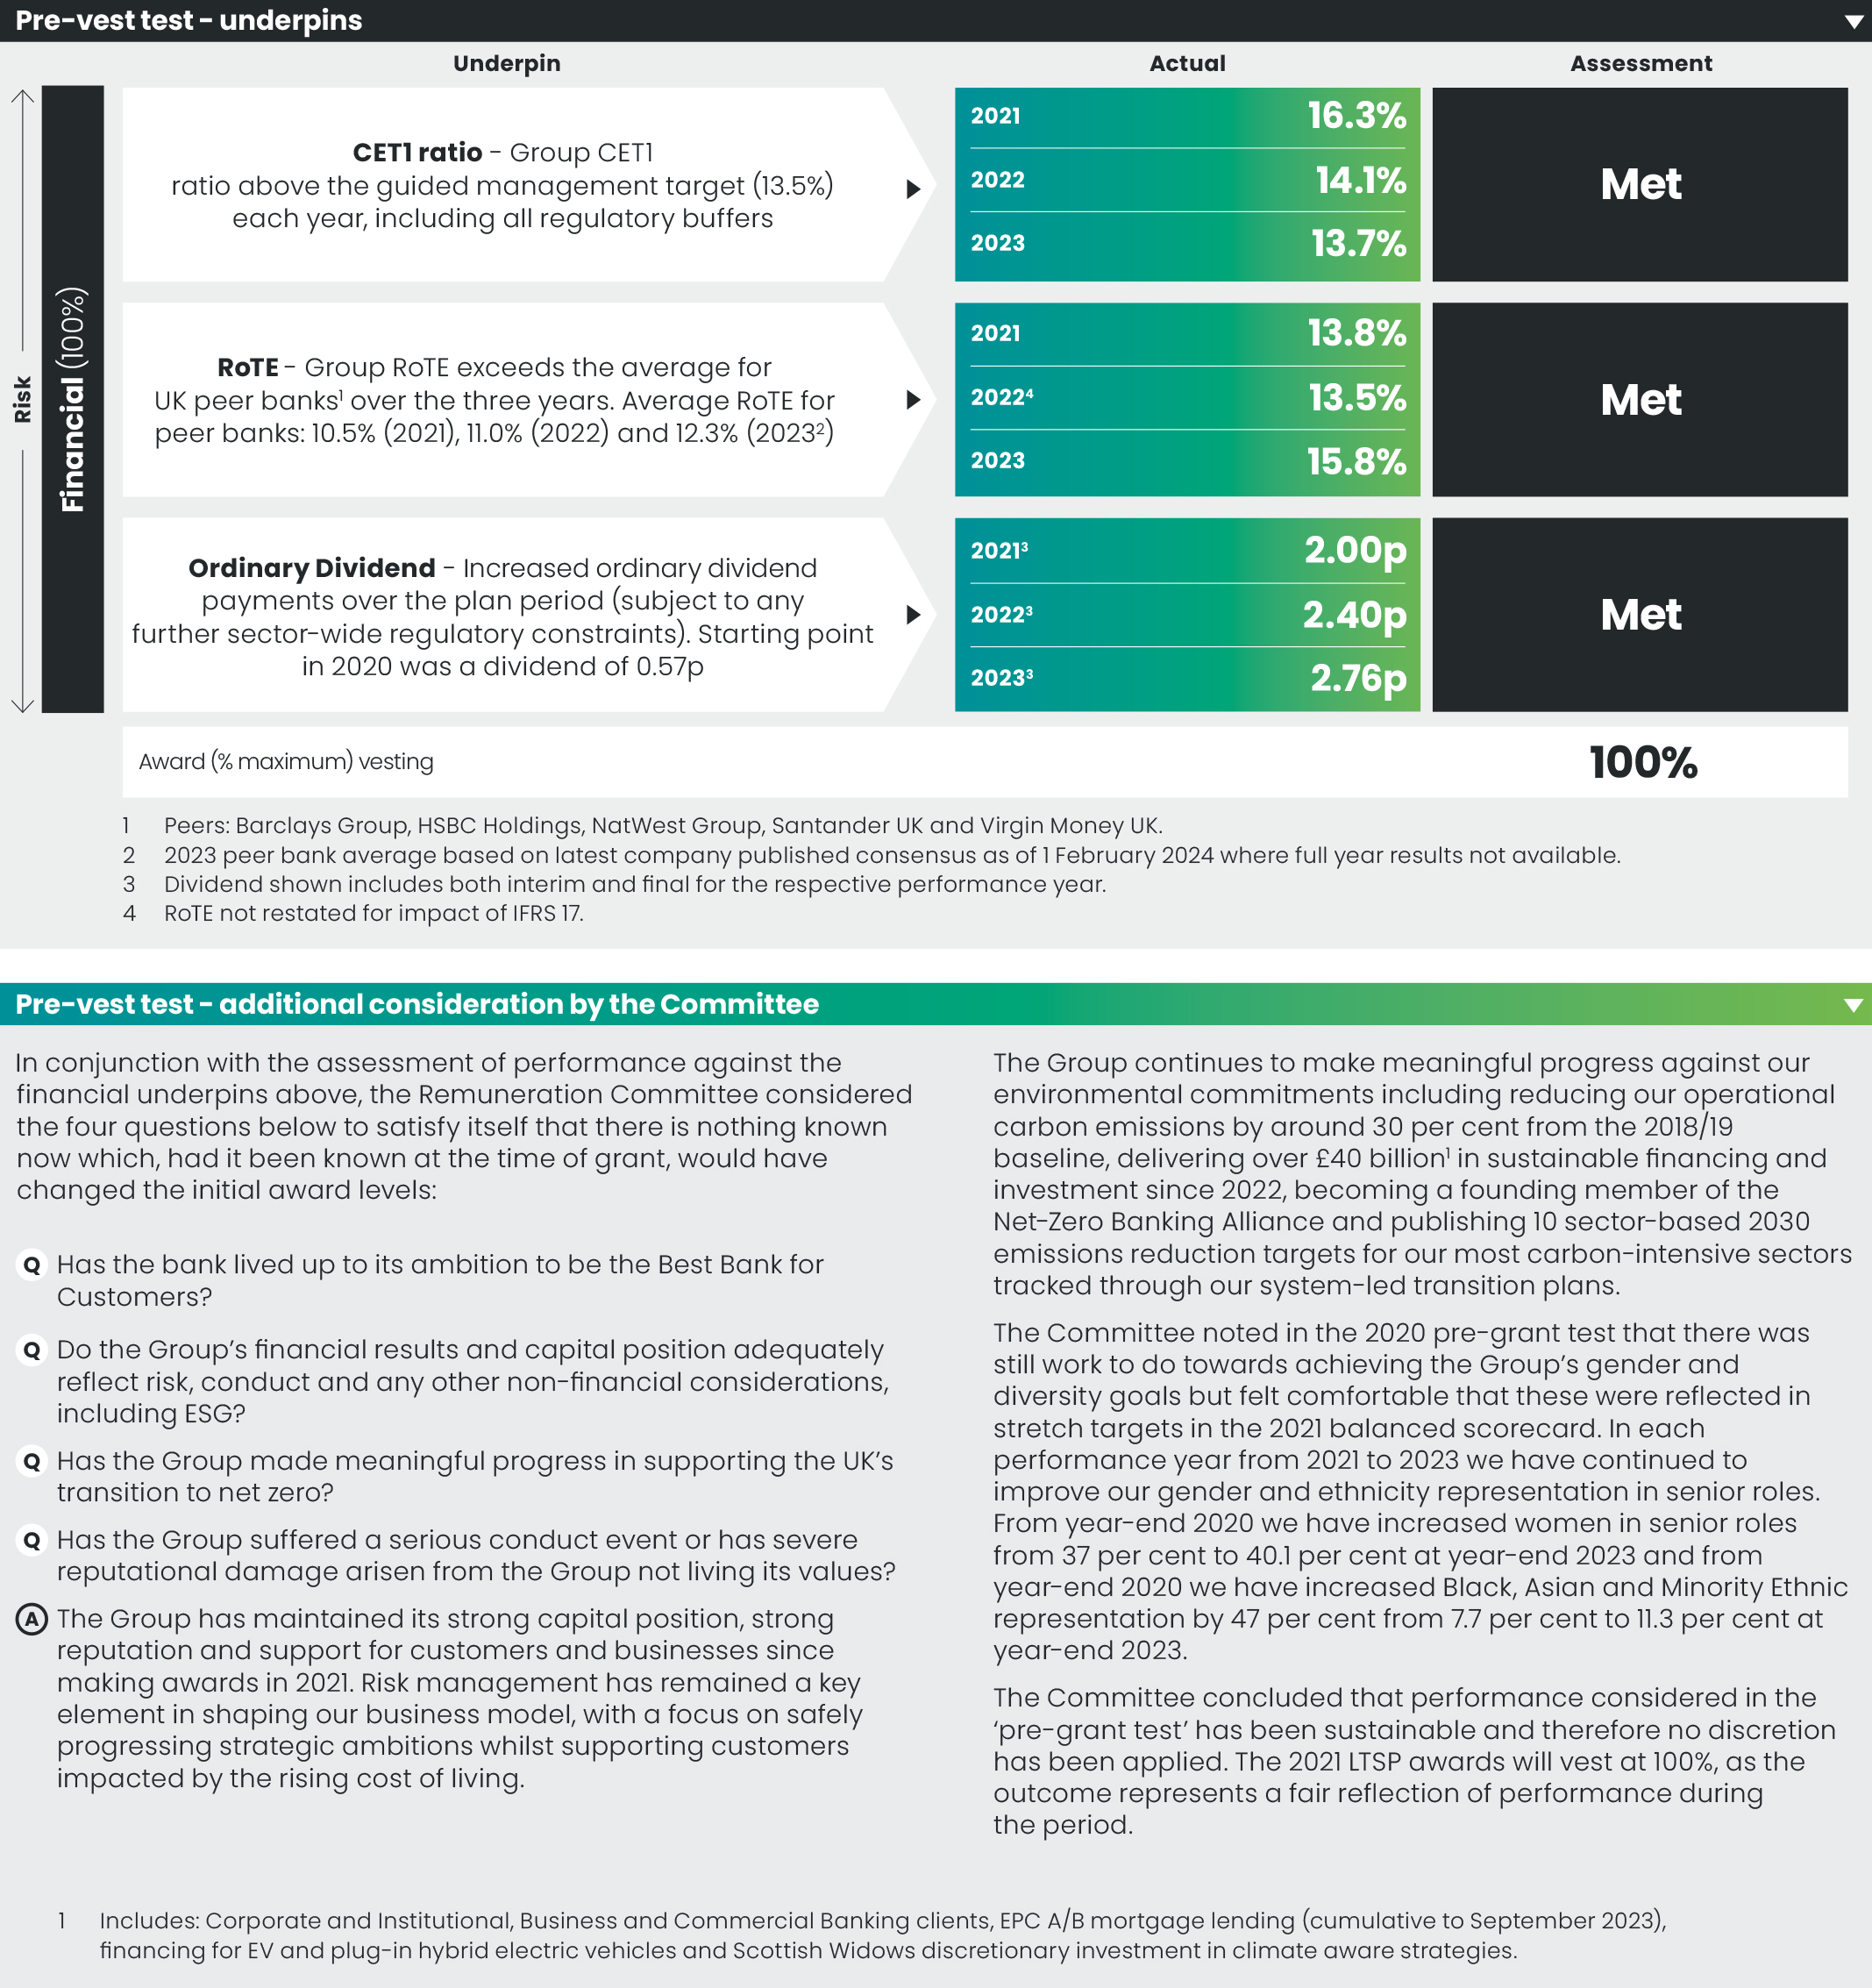
In determining the final vesting outcome of the 2021 Long Term Share Plan, the Committee carefully considered alignment with shareholder experience and whether adjustments were required for windfall gains.
Awards were granted in March 2021 at 39.3015 pence. The share price used to calculate indicative value is 43.564 pence (page 104). While 10.8 per cent higher, the Committee considers it reasonably represents performance over the period. 2021 LTSP awards, including the award for the CFO, were reduced by up to 40 per cent upfront at the time of grant, showing restraint based on 2020 Group performance. The GCE did not receive a 2021 LTSP award as he was not in role at the time of grant. The Committee concluded there was no windfall gain over the period and as such no additional adjustment was required.
| | | | | | | | |
107 | Lloyds Banking Group plc Annual Report on Form 20-F 2023 | |
Relative importance of spend on pay
The graphs below illustrate the total remuneration of all Group employees compared with returns of capital to shareholders in the form of dividends and share buyback.
Comparison of returns to shareholders and Group Chief Executive total remuneration
The required chart below shows the historical total shareholder return (TSR) of Lloyds Banking Group plc compared with the FTSE 100. The FTSE 100 index has been chosen as it is a widely recognised equity index of which Lloyds Banking Group plc has been a constituent throughout this period.
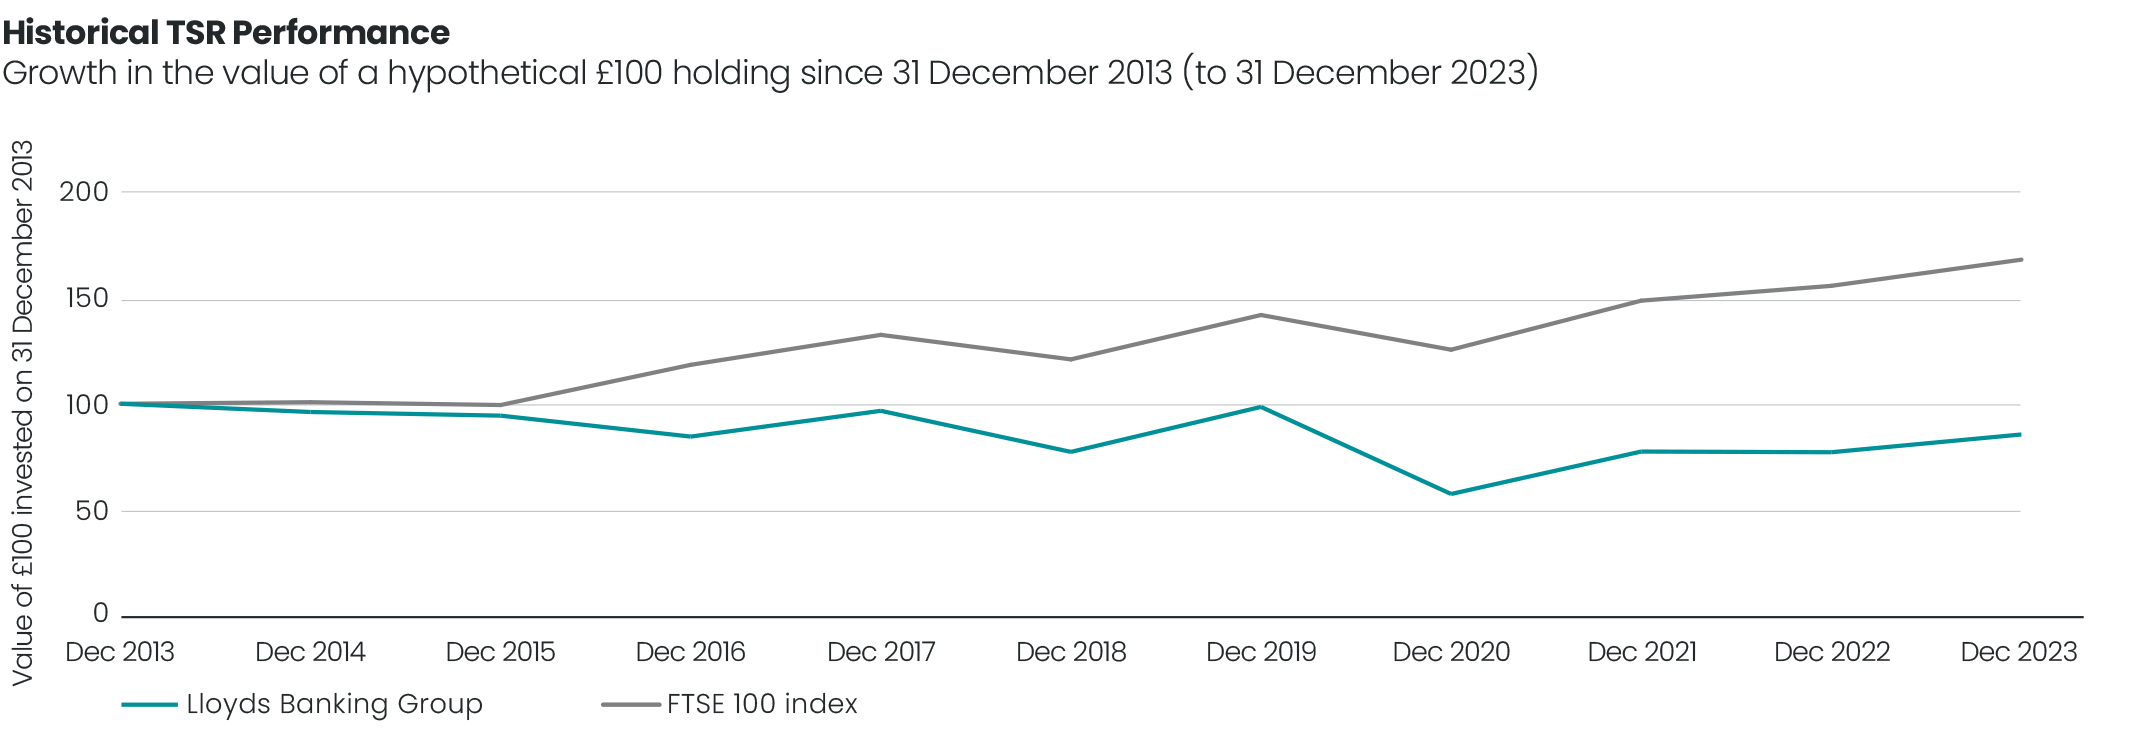
| | | | | | | | | | | | | | | | | | | | | | | | | | | | | | | | | | | |
| GCE | 2014 | 2015 | 2016 | 2017 | 2018 | 2019 | 2020 | 2021 | 2022 | 2023 |
| GCE single figure of remuneration £000 | Sir António Horta-Osório | 11,540 | 8,704 | 5,791 | 6,434 | 6,544 | 4,424 | 3,604 | 2,444 | n/a | n/a |
Charlie Nunn1 | n/a | n/a | n/a | n/a | n/a | n/a | n/a | 5,523 | 3,767 | 3,681 |
William Chalmers2 | n/a | n/a | n/a | n/a | n/a | n/a | n/a | 819 | n/a | n/a |
| | | | | | | | | | | |
| Annual bonus/GPS payout (% of maximum opportunity) | Sir António Horta-Osório3 | 54% | 57% | 77% | 77% | 67.60% | n/a | n/a | 57.80% | n/a | n/a |
| Charlie Nunn | n/a | n/a | n/a | n/a | n/a | n/a | n/a | 57.80% | 84.1% | 80.3% |
William Chalmers2 | n/a | n/a | n/a | n/a | n/a | n/a | n/a | 78.20% | n/a | n/a |
| | | | | | | | | | | |
| Long-term incentive vesting (% of maximum opportunity) | Sir António Horta-Osório | 97% | 94.18% | 55% | 66.30% | 68.70% | 49.70% | 33.75% | 41.80% | n/a | n/a |
| Charlie Nunn | n/a | n/a | n/a | n/a | n/a | n/a | n/a | n/a | n/a | n/a |
William Chalmers2 | n/a | n/a | n/a | n/a | n/a | n/a | n/a | n/a | n/a | n/a |
| | | | | | | | | | | |
| TSR component vesting (% of LTIP maximum) | Sir António Horta-Osório | 30% | 30% | 0% | 0% | 0% | 0% | 0% | 0% | n/a | n/a |
| Charlie Nunn | n/a | n/a | n/a | n/a | n/a | n/a | n/a | n/a | n/a | n/a |
William Chalmers2 | n/a | n/a | n/a | n/a | n/a | n/a | n/a | n/a | n/a | n/a |
1 Charlie Nunn succeeded Sir António Horta-Osório as Group Chief Executive with effect from 16 August 2021 and the single figure total remuneration for 2021 includes a one-off buy-out of £4.231 million.
2 William Chalmers was the Interim Group Chief Executive from 1 May 2021 until 15 August 2021, remuneration in the table above is for this period.
3 Sir António Horta-Osório independently requested that he be withdrawn from consideration for a Group Performance Share award in 2019 and 2020. There were no GPS awards for 2020 performance.
| | | | | | | | |
108 | Lloyds Banking Group plc Annual Report on Form 20-F 2023 | |
| | | | | | | | | | | | | | | | | | | | | | | | | | | | | | | | |
| Single total figure of remuneration for Chair and non-executive directors | 6 | |
| | | | | | | | | | |
| | Fees £000 | | Benefits (£000)3 | | Total (£000) | |
| | 2023 | 2022 | | 2023 | 2022 | | 2023 | 2022 | |
| Chair and non–executive directors | | | | | | | | | |
| Sir Robin Budenberg | 629 | | 624 | | | 2 | | 1 | | | 631 | | 625 | | |
| Alan Dickinson | 402 | | 445 | | | 3 | | – | | | 405 | | 445 | | |
| Sarah Legg | 228 | | 224 | | | 5 | | 5 | | | 233 | | 229 | | |
| Lord Lupton | 286 | | 282 | | | 6 | | – | | | 292 | | 282 | | |
| Amanda Mackenzie | 179 | | 175 | | | 1 | | – | | | 180 | | 175 | | |
| Harmeen Mehta | 102 | | 98 | | | 1 | | – | | | 103 | | 98 | | |
| Cathy Turner1 | 157 | | 19 | | | – | | – | | | 157 | | 19 | | |
| Scott Wheway2 | 458 | | 189 | | | 25 | | – | | | 483 | | 189 | | |
| Catherine Woods | 246 | | 242 | | | 23 | | 10 | | | 269 | | 252 | | |
| | | | | | | | | | |
1 Cathy Turner was appointed on 1 November 2022.
2 Scott Wheway was appointed on 1 August 2022.
3 Benefits for the non-executive directors relates to reimbursement for expenses incurred in the course of duties. The Chair’s benefits also include private medical insurance, including a one-off settlement of tax relating to the restatement in the 2022 annual report. Non-executive directors do not receive variable pay.
| | | | | | | | | | | | | | | | | | | | | | | | | | | | | | | | | | | | | | |
| Directors’ share interests and share awards Directors’ interests | | | 6 | |
| | | | | | | | | | | | |
| | Number of shares | | Number of options | | Total shareholding1 | | Value | |
| | Owned outright | Unvested
subject to
continued
employment | Unvested
subject to
performance | | Unvested
subject to
continued
employment | Vested
unexercised | | Totals at 31 December 20232 | | Expected value at 31 December 2023 (£000s)3 | |
| Executive directors | | | | | | | | | | | |
| Charlie Nunn | 4,855,377 | | 847,433 | | 6,872,2604 | | 5,337,899 | | – | | | 17,912,969 | | | 8,546 | | |
| William Chalmers | 7,433,791 | | 2,270,483 | | 6,500,4804,5 | | 83,665 | | – | | | 16,288,419 | | | 7,771 | | |
| Non-executive directors | | | | | | | | | | |
| Sir Robin Budenberg | 1,500,000 | | – | | – | | | – | | – | | | 1,500,000 | | | n/a | |
| Alan Dickinson | 200,000 | | – | | – | | | – | | – | | | 200,000 | | | n/a | |
| Sarah Legg | 200,000 | | – | | – | | | – | | – | | | 200,000 | | | n/a | |
| Lord Lupton | 2,250,000 | | – | | – | | | – | | – | | | 2,250,000 | | | n/a | |
| Amanda Mackenzie | 63,567 | | – | | – | | | – | | – | | | 63,567 | | | n/a | |
| Harmeen Mehta | 20,000 | | – | | – | | | – | | – | | | 20,000 | | | n/a | |
| Cathy Turner | 424,113 | | – | | – | | | – | | – | | | 424,113 | | | n/a | |
| Scott Wheway | 168,356 | | – | | – | | | – | | – | | | 168,356 | | | n/a | |
| Catherine Woods | 113,496 | | – | | – | | | – | | – | | | 113,496 | | | n/a | |
| | | | | | | | | | | | |
1 Includes holdings of any Person Closely Associated.
2 There has been no change in shareholdings from 31 December 2023 to 22 February 2024.
3 Expected values are based on the Lloyds Banking Group closing share price of 47.708 pence on 29 December 2023.
4 For awards granted under the 2022 and 2023 Long Term Share Plan where the three-year underpin period has not completed, 100 per cent has been applied to calculate the expected value of the LTSP award in line with the applicable Remuneration Policy.
5 For awards granted under the 2021 Long Term Share Plans, as the three-year underpin period has completed, the actual outcome of 100 per cent (see page 107) has been applied to the unvested shares to calculate the expected value. 6 Directors are not permitted to enter into any hedging arrangements in relation to share awards. No director uses shareholding as collateral.
| | | | | | | | |
109 | Lloyds Banking Group plc Annual Report on Form 20-F 2023 | |
| | | | | | | | | | | | | | | | | | | | | | | | | | | | | | | | | | | | | | |
| Outstanding share plan interests | 6 | |
| | | | | | | | | | | | |
| | At 1 January 2023 | Granted/
awarded | Dividends
awarded | Vested/
released/
exercised | Lapsed | At 31 December 2023 | Exercise price | Exercise periods | Notes | |
| From | To | |
| Charlie Nunn | | | | | | | | | | | |
| LTSP 2022 – 2024 | 3,588,364 | | | | | | 3,588,364 | | | | | 2 | |
| LTSP 2023 – 2025 | | 3,283,896 | | | | | 3,283,896 | | | | | 2,3 | |
| Deferred GPS
awarded in 2022
(2021 GPS) | 222,415 | | | | 148,276 | | | 74,139 | | | | | 4 | |
| Deferred GPS
awarded in 2023
(2022 GPS) | | 1,288,821 | | | 515,527 | | | 773,294 | | | | | 5,6 | |
| Share Buy-Out | 1,247,548 | | | | 1,247,548 | | | – | | | 15/03/2023 | 14/03/2028 | 1 | |
| | 1,368,990 | | | | | | 1,368,990 | | | 12/03/2024 | 11/03/2029 | 1 | |
| | 1,368,990 | | | | | | 1,368,990 | | | 11/03/2025 | 10/03/2030 | 1 | |
| | 1,369,012 | | | | | | 1,369,012 | | | 11/03/2026 | 10/03/2031 | 1 | |
| | 891,217 | | | | | | 891,217 | | | 11/03/2027 | 10/03/2032 | 1 | |
| | 339,690 | | | | | | 339,690 | | | 11/03/2028 | 10/03/2033 | 1 | |
| William Chalmers | | | | | | | | | | | |
| GOS 2020 – 2022 | 4,927,191 | | | | 430,636 | | 2,774,011 | | 1,722,544 | | | | | 2 | |
| LTSP 2021 – 2023 | 1,547,340 | | | | | | 1,547,340 | | | | | 2 | |
| LTSP 2022 – 2024 | 2,586,292 | | | | | | 2,586,292 | | | | | 2 | |
| LTSP 2023 – 2025 | | 2,366,848 | | | | | 2,366,848 | | | | | 2,3 | |
| Deferred GPS
awarded in 2022
(2021 GPS) | 449,505 | | | | 299,670 | | | 149,835 | | | | | 4 | |
| Deferred GPS
awarded in 2023
(2022 GPS) | | 663,507 | | | 265,403 | | | 398,104 | | | | | 5,6 | |
| 2020 Sharesave | 46,317 | | | | | | 46,317 | | 24.25p | 01/01/2024 | 30/06/2024 | | |
| 2021 Sharesave | 17,177 | | | | | | 17,177 | | 39.40p | 01/01/2025 | 30/06/2025 | | |
| 2023 Sharesave | | 20,171 | | | | | 20,171 | | 38.55p | 01/01/2027 | 30/06/2027 | | |
| | | | | | | | | | | | |
1 When Charlie Nunn joined the Group on 16 August 2021 as Group Chief Executive and executive director he was granted deferred share awards and deferred cash to replace unvested awards from his previous employer, HSBC. Options vested on the 14 March 2023 and were exercised on 21 March 2023. Charlie Nunn retained all the shares apart from 586,558 shares which were sold at 48.16 pence to meet income tax and National Insurance contributions withholding obligations. The remaining 660,990 shares are subject to holding periods that mirror the shares replaced from HSBC of no hold, six months and 12 months holds.
2 All GOS and LTSP awards have a three-year performance period ending 31 December. Awards were made in the form of conditional rights to free shares.
3 LTSP awards (in the form of conditional share awards) in 2023 were made over shares with a value of 150 per cent of salary for Charlie Nunn (3,283,896 shares with a value of £1,704,375) and a value of 150 per cent for William Chalmers (2,366,848 shares with a value of £1,228,418). Vesting is subject to underpin thresholds applicable for the first three years from grant as detailed on page 122 of the 2022 Annual Report on Form 20-F. Each year the Remuneration Committee will monitor the Group’s progress in relation to the underpins. The share price used to calculate the value is the average price over the five days prior to grant (27 February 2023 to 3 March 2023), which was 51.901 pence.
4 The second tranche of the 2021 GPS deferred award vested on 7 March 2023. The closing market price of the Group’s ordinary shares on that date was 51.360 pence. The award was settled in shares net of tax, with the resulting shares subject to a one-year holding period.
5 Half of the 2022 GPS is deferred into shares (in the form of conditional rights to free shares). The value of the shares awarded in respect of GPS granted in March 2023 was £668,911 (1,288,821 shares) for Charlie Nunn; and £344,367 (663,507 shares) for William Chalmers. As the awards represent deferral of awarded GPS they are not subject to further performance conditions. The share price used to calculate the value is the average price over the five days prior to grant (27 February 2023 to 3 March 2023), which was 51.901 pence.
6 The first tranche of the 2022 GPS award vested on 7 March 2023. The closing market price of the Group’s ordinary shares on that date was 51.360 pence. The award was settled in shares net of tax, with the resulting shares subject to a one-year holding period.
| | | | | | | | | | | | | | | | | | | | | | | |
| Outstanding cash awards | | | | | 6 | |
| | | | | | | |
| | At 1 January
2023
£ | Granted/
awarded
£ | Vested /
released /
exercised
£ | At 31
December
2023
£ | Notes | |
| Charlie Nunn | | | | | | |
| Deferred GPS cash awarded in 2022 (2021 GPS) | 104,594 | | | 69,729 | | 34,865 | | 1 | |
| Deferred GPS cash awarded in 2023 (2022 GPS) | | 401,346 | | | 401,346 | | 1 | |
| William Chalmers | | | | | | |
| Deferred GPS cash awarded in 2022 (2021 GPS) | 211,388 | | | 140,925 | | 70,463 | | 1 | |
| Deferred GPS cash awarded in 2023 (2022 GPS) | | 206,620 | | | 206,620 | | 1 | |
| | | | | | | |
1 Half of the deferred portion of the 2021 and 2022 GPS awards are delivered in cash.
| | | | | | | | |
110 | Lloyds Banking Group plc Annual Report on Form 20-F 2023 | |
Shareholding Requirement
Executives are expected to build and maintain a shareholding in the Group in direct proportion to their salary in order to align their interests to those of shareholders.
The minimum shareholding requirements applicable to executive directors at 31 December 2023 are 350 per cent of salary for the GCE and 250 per cent of salary for the CFO.
Under the Policy applicable at 31 December 2023, the GCE has until 15 August 2026 to meet the requirement of 350 per cent of salary and the CFO has until 2 June 2024 to meet the requirement of 250 cent of salary (in both cases five years from appointment). The CFO has met the requirement of 250 per cent of salary and currently holds 467 per cent of salary at 31 December 2023.
In recognition of the increased variable opportunity offered by the implementation of the LTIP and to further strengthen alignment with shareholders, from 1 January 2024 the shareholding requirement applicable to the GCE will increase from 350 per cent to 400 per cent of salary and from 250 per cent to 300 per cent for the CFO. The time frame over which this requirement must be met remains five years from the date of appointment.
In the event that exceptional individual circumstances exist resulting in an executive not being able to comply with the Policy, the Remuneration Committee will consider whether an exception should apply.
Post-employment shareholding requirement
Executive directors are contractually bound to a post employment shareholding requirement of two years at a level equal to the lower of the shareholding requirements immediately prior to departure or the actual shareholding on departure. The post-employment requirement will be maintained through self-certification, with the Committee keeping this approach under review.
None of those who were directors at the end of the year had any other interest in the capital of Lloyds Banking Group plc or its subsidiaries.
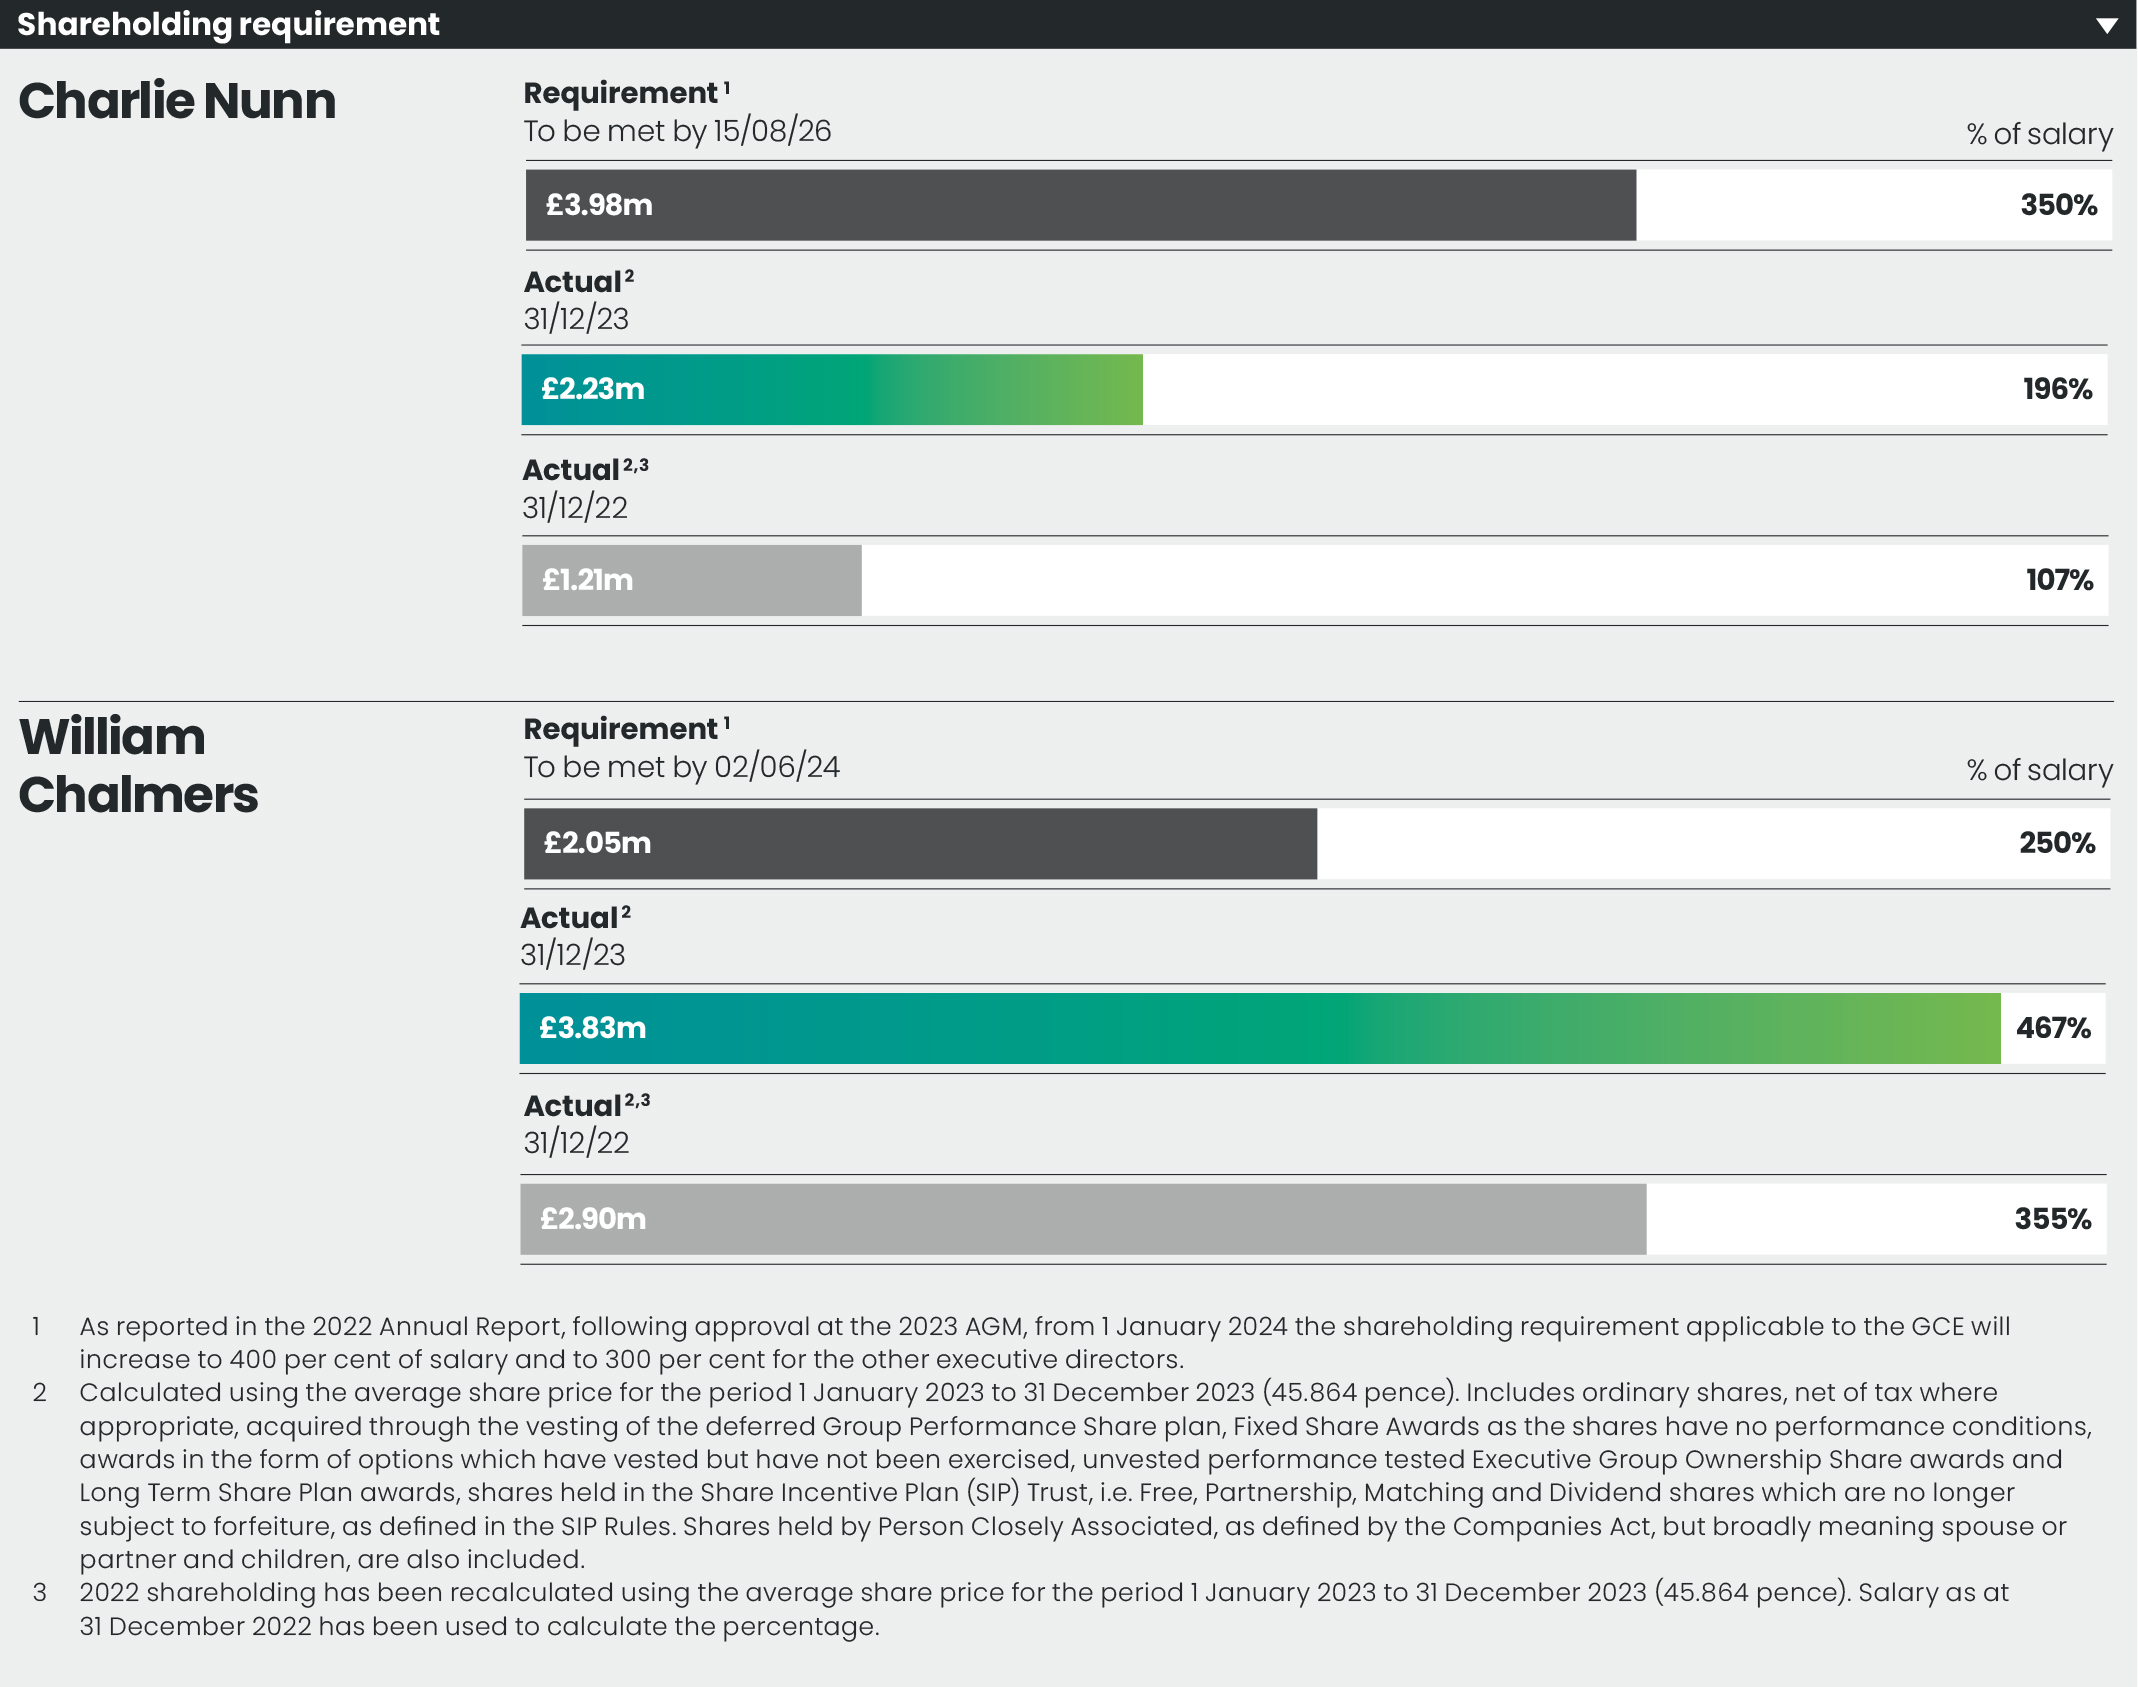
| | | | | | | | |
111 | Lloyds Banking Group plc Annual Report on Form 20-F 2023 | |
| | | | | | | | | | | | | | |
| Chair and non-executive director fees | | 6 | |
| Following a detailed review of peer benchmarks, there is a 4 per cent increase to the annual fee for the Chair (£654,500) aligned to the majority of the wider workforce. The basic board fee, Chair and membership fees for the Responsible Business Committee and IT Forum will also increase by 4 per cent. The Nomination and Governance Committee fee will increase by 1.7 per cent. There are no increases to other non-executive directors’ fees for 2024. | |
| | | | |
| | 2024 | 2023 | |
| Basic non-executive director fee | 89,500 | | 86,100 | | |
| Deputy Chair | 107,000 | | 107,000 | | |
| Senior Independent Director | 64,200 | | 64,200 | | |
| Audit Committee Chair | 75,000 | | 75,000 | | |
| Remuneration Committee Chair | 75,000 | | 75,000 | | |
| Risk Committee Chair | 75,000 | | 75,000 | | |
| Responsible Business Committee Chair | 44,500 | | 42,800 | | |
| IT Forum Chair | 44,500 | | 42,800 | | |
| Audit Committee member | 34,300 | | 34,300 | | |
| Remuneration Committee member | 34,300 | | 34,300 | | |
| Risk Committee member | 34,300 | | 34,300 | | |
| Responsible Business Committee member | 16,750 | | 16,100 | | |
| IT Forum member | 16,750 | | 16,100 | | |
| Nomination and Governance Committee member | 16,375 | | 16,100 | | |
| | | | |
Non-executive directors may receive more than one of the above fees.
| | | | | | | | | | | | | | | | | | | | | | | | | | | | | | | | | | | | | | | | | | | | | | | | | | |
| Percentage change in remuneration levels | 6 | |
| The table below sets out the change in the directors’ base salary/fees, taxable benefits and annual bonus compared with the change in our UK-based colleagues’ pay. Lloyds Banking Group plc is not an employing entity, and therefore the disclosure below is made on a voluntary basis to compare any change with all employees of the wider Group based in the UK. This population has been chosen as the majority of our workforce are based in the UK and is considered to be the most appropriate group of employees. The same population is used for the purposes of the Chief Executive Officer pay ratio disclosure on page 114 of the report. | |
| | | | | | | | | | | | | | | | |
| | % change in base salary/fees | | % change in GPS | | % change in benefits | |
| | 2019 to
2020 | 2020 to 2021 | 2021 to 2022 | 2022 to 2023 | | 2019 to
2020 | 2020 to 2021 | 2021 to 2022 | 2022 to 2023 | | 2019 to
2020 | 2020 to 2021 | 2021 to 2022 | 2022 to 2023 | |
| All employees1 | 4 | 4 | 6 | 139 | | (100) | n/a | 12 | (14)9 | | (32) | 1 | 5 | (43)9 | |
| Executive directors | | | | | | | | | | | | | | | |
| Charlie Nunn2 | n/a | n/a | 1 | – | | n/a | n/a | 47 | (5) | | n/a | n/a | 4 | (37) | |
| William Chalmers3 | 2 | 12 | (9) | – | | (100) | n/a | (2) | 34 | | (1) | 2 | 35 | – | |
| Non-executive directors5,6 | | | | | | | | | | | | | | | |
| Sir Robin Budenberg | n/a | 243 | 1 | 1 | | n/a | n/a | n/a | n/a | | n/a | n/a | – | 100 | |
| Alan Dickinson | 45 | 14 | 12 | (10) | | n/a | n/a | n/a | n/a | | n/a | n/a | n/a | n/a | |
| Sarah Legg | 131 | 28 | 6 | 2 | | n/a | n/a | n/a | n/a | | n/a | n/a | n/a | n/a | |
| Lord Lupton | – | (8) | (2) | 1 | | n/a | n/a | n/a | n/a | | n/a | n/a | n/a | n/a | |
| Amanda Mackenzie | 6 | (1) | 7 | 2 | | n/a | n/a | n/a | n/a | | n/a | n/a | n/a | n/a | |
| Harmeen Mehta | n/a | n/a | 2 | 4 | | n/a | n/a | n/a | n/a | | n/a | n/a | n/a | n/a | |
| Cathy Turner7 | n/a | n/a | n/a | 38 | | n/a | n/a | n/a | n/a | | n/a | n/a | n/a | n/a | |
| Scott Wheway8 | n/a | n/a | n/a | 1 | | n/a | n/a | n/a | n/a | | n/a | n/a | n/a | n/a | |
| Catherine Woods | n/a | 43 | 4 | 2 | | n/a | n/a | n/a | n/a | | n/a | n/a | n/a | n/a | |
| | | | | | | | | | | | | | | | |
1 Lloyds Banking Group is not a contracting entity but considers all UK-based employees to be appropriate for purposes of an ‘All employees’ calculation.
2 Charlie Nunn became the Group Chief Executive in August 2021. Figures for 2021 have been annualised based on the single total figure table.
3 William Chalmers was the Interim Group Chief Executive from May to August 2021 and received a deputisation payment for this period.
4 No Group Performance Share (bonus) was paid for 2020 performance.
5 In some instances, non-executive directors may change membership or become the Chair of a Committee during the year, resulting in large year-on-year percentage changes in fees.
6 Some non-executive directors have received other benefits that relate to reimbursement for expenses incurred in the course of duties. Reimbursements of these expenses do not provide an accurate comparison to benefits received by colleagues and are therefore not included.
7 Cathy Turner was appointed on 1 November 2022. Figures for 2022 have been annualised based on the single total figure table. Cathy was appointed Chair of the Remuneration Committee and Senior Independent Director in September 2023.
8 Scott Wheway was appointed on 1 August 2022. Figures for 2022 have been annualised based on the single total figure table.
9 2022 to 2023 variance was impacted by the consolidation of variable pay and Flex cash allowance into base salary as described on page 100. | | | | | | | | |
112 | Lloyds Banking Group plc Annual Report on Form 20-F 2023 | |
| | | | | | | | | | | | | | | | | | | | | | | | | | |
| Gender pay | 6 | | | | Ethnicity pay | 6 | |
| Lloyds Banking Group has committed to becoming a leader in gender diversity. We recognise that companies with proportionate gender diversity see increased performance, and make better decisions. We are working towards an ambition of 50 per cent of senior leadership roles being held by women by 2025. At the end of April 2023 we were at 39.8 per cent, an increase from when we first set our original gender goal in 2014 when we were at 28 per cent. Continued progress has been made in closing the Gender Pay Gap, with the gap reducing by 2.6 percentage points to 26.7 per cent, the largest improvement since we started reporting. This improvement demonstrates that our actions are moving us in the right direction, however, we remain committed to accelerating our progress. As part of our commitment to Helping Britain Prosper, we believe it is essential for us to make an impact beyond our organisation. We therefore co-sponsor the FTSE Women Leaders review, which has set a target of a minimum of 40 per cent women on boards and in leadership teams. Our ongoing work to improve gender balance in our organisation has resulted in us being named in the 2023 Bloomberg Gender Equality Index for the fifth consecutive year, and in The Times 2023 Top 50 Employers for Gender Equality for the 12th consecutive year. Further information is available at https://www.lloydsbankinggroup.com/assets/pdfs/who-we-are/responsible-business/downloads/2023/lbg-gender-ethnicitypay-gap-report-2023.pdf | | | | We know that diversity of our workforce is important, and that representation is a key driver to close the gaps that exist. For this reason, we made a public commitment to increase Black Heritage representation in senior roles to 3 per cent by 2025 and increase our overall senior Black, Asian and Minority Ethnic representation to 13 per cent by 2025. At the end of April 2023, 10.5 per cent of senior manager roles were held by Black, Asian or Minority Ethnic colleagues, and 1.6 per cent held by Black Heritage colleagues. When it comes to Ethnicity Pay Gap reporting, there is no legislative requirement on UK organisations to publish these figures. However, for the past three years we have published our Ethnicity Pay Gap on a voluntary basis. As a leading UK employer, we’ve chosen to publish this data because we recognise the importance of transparency in encouraging focus and inspiring purposeful, action-led change. It holds us accountable, helps us to learn, and we believe will lead to positive improvement. Encouragingly, our disclosure rate has increased from 85.1 per cent in April 2022 to 88.2 per cent in April 2023 (of those colleagues who have chosen to disclose their ethnicity with us). We’re pleased to see that our overall representation of Black, Asian and Minority Ethnic talent has increased. This is due to higher volumes of inclusive recruitment and a greater proportion of colleagues sharing their ethnicity data with us at the more junior levels of our business. This has, however resulted in an increase in our ethnicity pay gaps from 4.6 per cent to 5.7 per cent because our junior colleagues hold lower paid positions within our business. Whilst we have also seen improvements within the representation of our senior leadership teams this remains lower, affecting our efforts to close the gaps further and we recognise we have more to do to achieve this. Further information is available at https://www.lloydsbankinggroup.com/assets/pdfs/who-we-are/responsible-business/downloads/2023/lbg-gender-ethnicitypay-gap-report-2023.pdf | |
| | | | | | | | |
| | | | | | |
| | | | | | | | |
| | | | | | | | |
| | | | | | | | |
| | | | | | | | |
| | | | | | | | |
| | | | | | | | |
| | | | | | | | |
| | | | | | | | |
| | | | | | | | |
113 | Lloyds Banking Group plc Annual Report on Form 20-F 2023 | |
| | | | | | | | | | | | | | | | | | | | | | | | | | | | | | | | |
| Chief Executive Officer pay ratio | 6 | |
| The Remuneration Committee views pay ratios as a useful reference point to inform policy-setting, but also takes into consideration a number of other factors. The table below shows the ratios of the GCE’s total remuneration to the remuneration of colleagues since 2017. The change in the pay ratios for 2023 is explained in more detail below. | |
| | | | | | | | | | |
| | Total compensation | | Fixed pay | |
| Year | Methodology | P25 (Lower
Quartile) | P50
(Median) | P75 (Upper
Quartile) | | P25 (Lower
Quartile) | P50
(Median) | P75 (Upper
Quartile) | |
| 2023 | A | 112:1 | 80:1 | 45:1 | | 76:1 | 54:1 | 31:1 | |
| 2022 | A | 120:1 | 86:1 | 48:1 | | 81:1 | 59:1 | 35:1 | |
| 2021 | A | 316:1 | 225:1 | 120:1 | | 93:1 | 66:1 | 38:1 | |
| 2020 | A | 132:1 | 95:1 | 54:1 | | 103:1 | 75:1 | 42:1 | |
| 2019 | A | 179:1 | 128:1 | 71:1 | | 114:1 | 82:1 | 47:1 | |
| 2018 | A | 237:1 | 169:1 | 93:1 | | 113:1 | 81:1 | 48:1 | |
| 2017 | A | 245:1 | 177:1 | 97:1 | | 113:1 | 82:1 | 48:1 | |
| Y-o-Y (2022 vs 2023) | | | (7) | % | | | | (8) | % | | |
| | | | | | | | | | |
Notes to the table:•The 2023 total remuneration for the colleagues identified at P25, P50 and P75 are as follows: £32,921, £46,209, £82,030.
•The 2023 base salary for the colleagues identified at P25, P50 and P75 are as follows: £24,682, £37,504, £63,066.
•The P25, P50 and P75 colleagues were determined on 31 December 2023 based on calculating total remuneration for all UK employees for the 2023 financial year. Payroll data from 1 January 2023 to 31 December 2023.
•Colleague total remuneration has been calculated in line with the single total figure of remuneration. The single total figure of remuneration has been calculated for 58,072 UK colleagues within the Group for a full year including full-time equivalent base pay, vesting Long Term Share Plan awards (for eligible colleagues), core benefits, pension, overtime and shift payments, travel/relocation payments (for eligible colleagues) and private medical benefit.
•The average share price between 1 October 2023 and 31 December 2023 of 43.564 pence has been used to indicate the value of vesting Long Term Share Plan awards.
•Due to operational constraints, the calculation of the colleague Pension Input Figure excludes inflationary adjustments for those on the defined benefit scheme. The omission of this factor does not materially affect the outcome of the ratio and/or distort the validity of the valuation.
•All other data has been calculated in line with the methodology for the single total figure of remuneration for the GCE.
Our ratios have been calculated using Methodology option A on the basis that it provided the most accurate means of identifying the median, lower and upper quartile colleagues. The ratio has been calculated taking into account the pay and benefits of 58,072 UK employees, other than the individual performing the role of GCE.
The change in total remuneration ratios since 2017 is largely driven by the more volatile nature of variable pay for the GCE.
The reduction in 2020 can be attributed to the decision not to make awards under the Group Performance Share plan, reduced performance in the vesting of the 2018 Group Ownership plan compared to the 2017 plan and the reduction in the former GCE’s pension allowance from 33 per cent to 15 per cent of salary.
In 2021 the median ratio was calculated for all three individuals undertaking the role of GCE and increased by 137 per cent year-on-year. This increase can be attributed to the one-off buy out awards granted to Charlie Nunn, an increase in the vesting of the LTIP and the payment of Group Performance Share (annual bonus), which were not awarded for 2020.
The reduction in 2022 was due to two factors. Firstly, Charlie Nunn’s remuneration for 2022 did not include any value in respect of Long Term Incentive plans, as no 2020 EGOS award was granted to him given that he was not an executive director at the time of grant. Secondly, the 2021 ratio included the one-off buy-out awards granted to Charlie Nunn. In addition the 2021 ratio was calculated for all three individuals undertaking the role of GCE. Over the same time period, employee total compensation increased by 12 per cent at the lower quartile, 11 per cent at the median and 7 per cent at the upper quartile, also contributing to the decrease in pay ratios.
There has been a further reduction in 2023 which can be attributed to three key factors. Recognising the desire to focus on the remuneration of lower paid colleagues, no annual pay award was proposed for the GCE for 2023 while the pay budget for the wider workforce was 6.3 per cent. Given the approach focused on lower paid colleagues and colleagues lower in their pay range, this resulted in pay increases of between 8 per cent and 13 per cent for around 43,000 colleagues. In addition, from July 2023 we consolidated a significant portion of our Group Performance Share into base salary for around 32,000 colleagues, further increasing the fixed pay element. Finally, the GCE received a lower annual short-term variable award for 2023 compared to 2022.
For the majority of colleagues, year-on-year changes in remuneration are principally driven by pay increases and the impacts of Group performance and collective adjustment. The Group has a commitment to pay progression and a continued focus on ensuring higher pay awards for colleagues who are lower paid, or paid lower within their pay range. We are committed to reducing the pay gap between executives and wider colleagues and continue to remain focused on addressing the gap from the bottom up and not just from the top down.
The Committee is thoughtful of the volatility in pay ratios due to variable reward outcomes. Although the pay ratio is used as a useful reference point to inform policy-setting, the Committee takes into account a number of other factors to assess colleague pay progression.
| | | | | | | | |
114 | Lloyds Banking Group plc Annual Report on Form 20-F 2023 | |
| | | | | | | | | | | | | | |
| Implementation of the policy in 2024 | | 6 | |
The 2023 Directors’ Remuneration Policy was approved at the AGM in May 2023. The Group proposes to operate the policy in the following way for 2024.
| | | | | | | | | | | | | | |
| l Base Salary | | | |
| Pay deal for wider workforce reflects a 4.2 per cent budget. The approach focuses on lower paid colleagues. Salary increases for the Group Chief Executive and Chief Financial Officer are in line with the pay awards for the majority of the wider workforce at 4 per cent. | | Salaries will therefore be as follows: •GCE: £1,181,700 •CFO: £851,703 | |
| | | | |
| | | | | | | | | | | | | | |
| l Fixed Share Award | | | |
| Fixed Share Awards for the Group Chief Executive and Chief Financial Officer will increase as part of the 4 per cent fixed pay increase for 2024. Awards will therefore be as follows: •GCE: £1,092,000 •CFO: £524,160 | | Shares will be released in equal tranches over three years. (See page 121 for further details). | |
| | | | |
| | | | | | | | | | | | | | |
| l Pension | | | |
| Pension allowances for all executive directors are set at 15 per cent of base salary. Any new executive director appointments in 2024 will also attract a maximum allowance of 15 per cent of base salary. Over 56,000 colleagues participate in the Group’s Defined Contribution (DC) Pension scheme where the maximum opportunity for the workforce is 15 per cent of base salary. Executive directors’ employer pension contributions are therefore aligned with those available to the majority of the workforce. | | In addition to the DC arrangement, the Group currently has around 10,000 active members in defined benefit plans, with the effective cost of employer contributions into these arrangements being around 34 per cent of salary. | |
| | | | |
| | | | | | | | | | | | | | |
| l Benefits | | | |
| Benefits remain unchanged from 2023. Executive directors receive a flexible benefit allowance of 4 per cent of base salary. This can be used to select benefits including life assurance and critical illness cover. | | Other benefits include transportation and private medical cover. The CFO also receives a car allowance. | |
| | | | |
| | | | | | | | | | | | | | |
| l Group Performance Share (short term variable) | |
| The performance measures for determining any individual 2024 GPS awards for executive directors are outlined in the 2024 balanced scorecard on page 117. Maximum opportunities for executive directors for 2024 are 140 per cent of base salary. Individual awards as a percentage of maximum will directly relate to the overall performance assessment outcome. For the 2024 performance year, any GPS opportunity will be awarded in March 2025 in a combination of cash (up to 50 per cent) and shares. | | The Group will apply deferral in line with minimum regulatory requirements as set out in the Policy. This is consistent with the approach taken by our peers. At least 60 per cent of total variable remuneration awarded to our executive directors will remain deferred over a period of up to seven years, maintaining strong alignment to shareholders. | |
| | | | |
| | | | | | | | |
115 | Lloyds Banking Group plc Annual Report on Form 20-F 2023 | |
| | | | | | | | | | | | | | |
| l Long Term Incentive Plan | | | |
| The Group’s pivot towards a more demanding, high-performance culture is critical in delivering against our ambitious strategy. LTIP awards will be granted in relation to 2023 performance under the terms of the current Remuneration Policy. The Committee concluded that 2023 performance, including assessment of our 2023 Group scorecard and other factors, was at a level to make awards. This is known as the ‘pre-grant test’. To ensure strong alignment between variable reward outcomes and the creation of shareholder value through the delivery of our strategy and the deepening of our relationships with our customers, the Committee has determined that LTIP awards will be granted with a value of 300 per cent of salary to the GCE and CFO to reflect the Group’s performance in 2023. In accordance with regulatory requirements LTIP awards will not accrue dividend equivalents over the vesting period; in line with the Directors’ Remuneration Policy, the number of shares granted under the awards will be determined using a share price adjusted to reflect the absence of dividends or equivalents during the vesting period. Performance measures and weightings The 2023 DRP set out a framework to align LTIP performance measures to the financial performance of the Group, the delivery of its refreshed, growth-orientated strategy and the progress towards its environmental commitments. Three financial measures have been chosen, aligned to our disclosed intentions in the 2022 ARA, with a total weighting of 50 per cent. Return on Tangible Equity (“RoTE”) emphasises the efficient use of capital and ensures focus on long-term value creation, Capital Build recognises the importance of maintaining a strong financial foundation for the Group and prioritises capital accretive | | decision making for the long-term and rTSR compares the value delivered to a shareholder in the Group over the performance period with the value delivered to shareholders by our peers. A dedicated 35 per cent weighting will focus on the Group’s delivery of its strategy and success of our strategic initiatives in driving revenue growth and diversification. The Committee will give consideration to an assessment of performance against quantifiable Board metrics aligned to each of our four strategic growth pillars: Deepen and innovate in Consumer, Create a new mass affluent offering, Digitise and diversify our SME business and Target our Corporate and Institutional offering. Finally, 15 per cent weight is attributed to environmental measures, reflecting that the transition to a low carbon economy is at the core of our strategy and aligns with our purpose to Help Britain Prosper. The Committee will assess performance of the Group’s sustainable financing and investment commitments over the performance period, 2026 progress towards its 2030 NZBA sector targets and delivery against Scottish Widows’ net-zero ambition (see page 4). Target setting Setting targets is a critical focus area for the Committee and a rigorous exercise has been undertaken to ensure our targets are sufficiently stretching. We have taken into account our long-term strategic ambitions, commitments to our ESG agenda and comparable industry returns. Operation The awards made in 2024 will vest based on the Group’s performance between January 2024 to December 2026. The following table provides a breakdown of the construct which the Committee considers aligns management and shareholder interests appropriately. | |
| | | | |
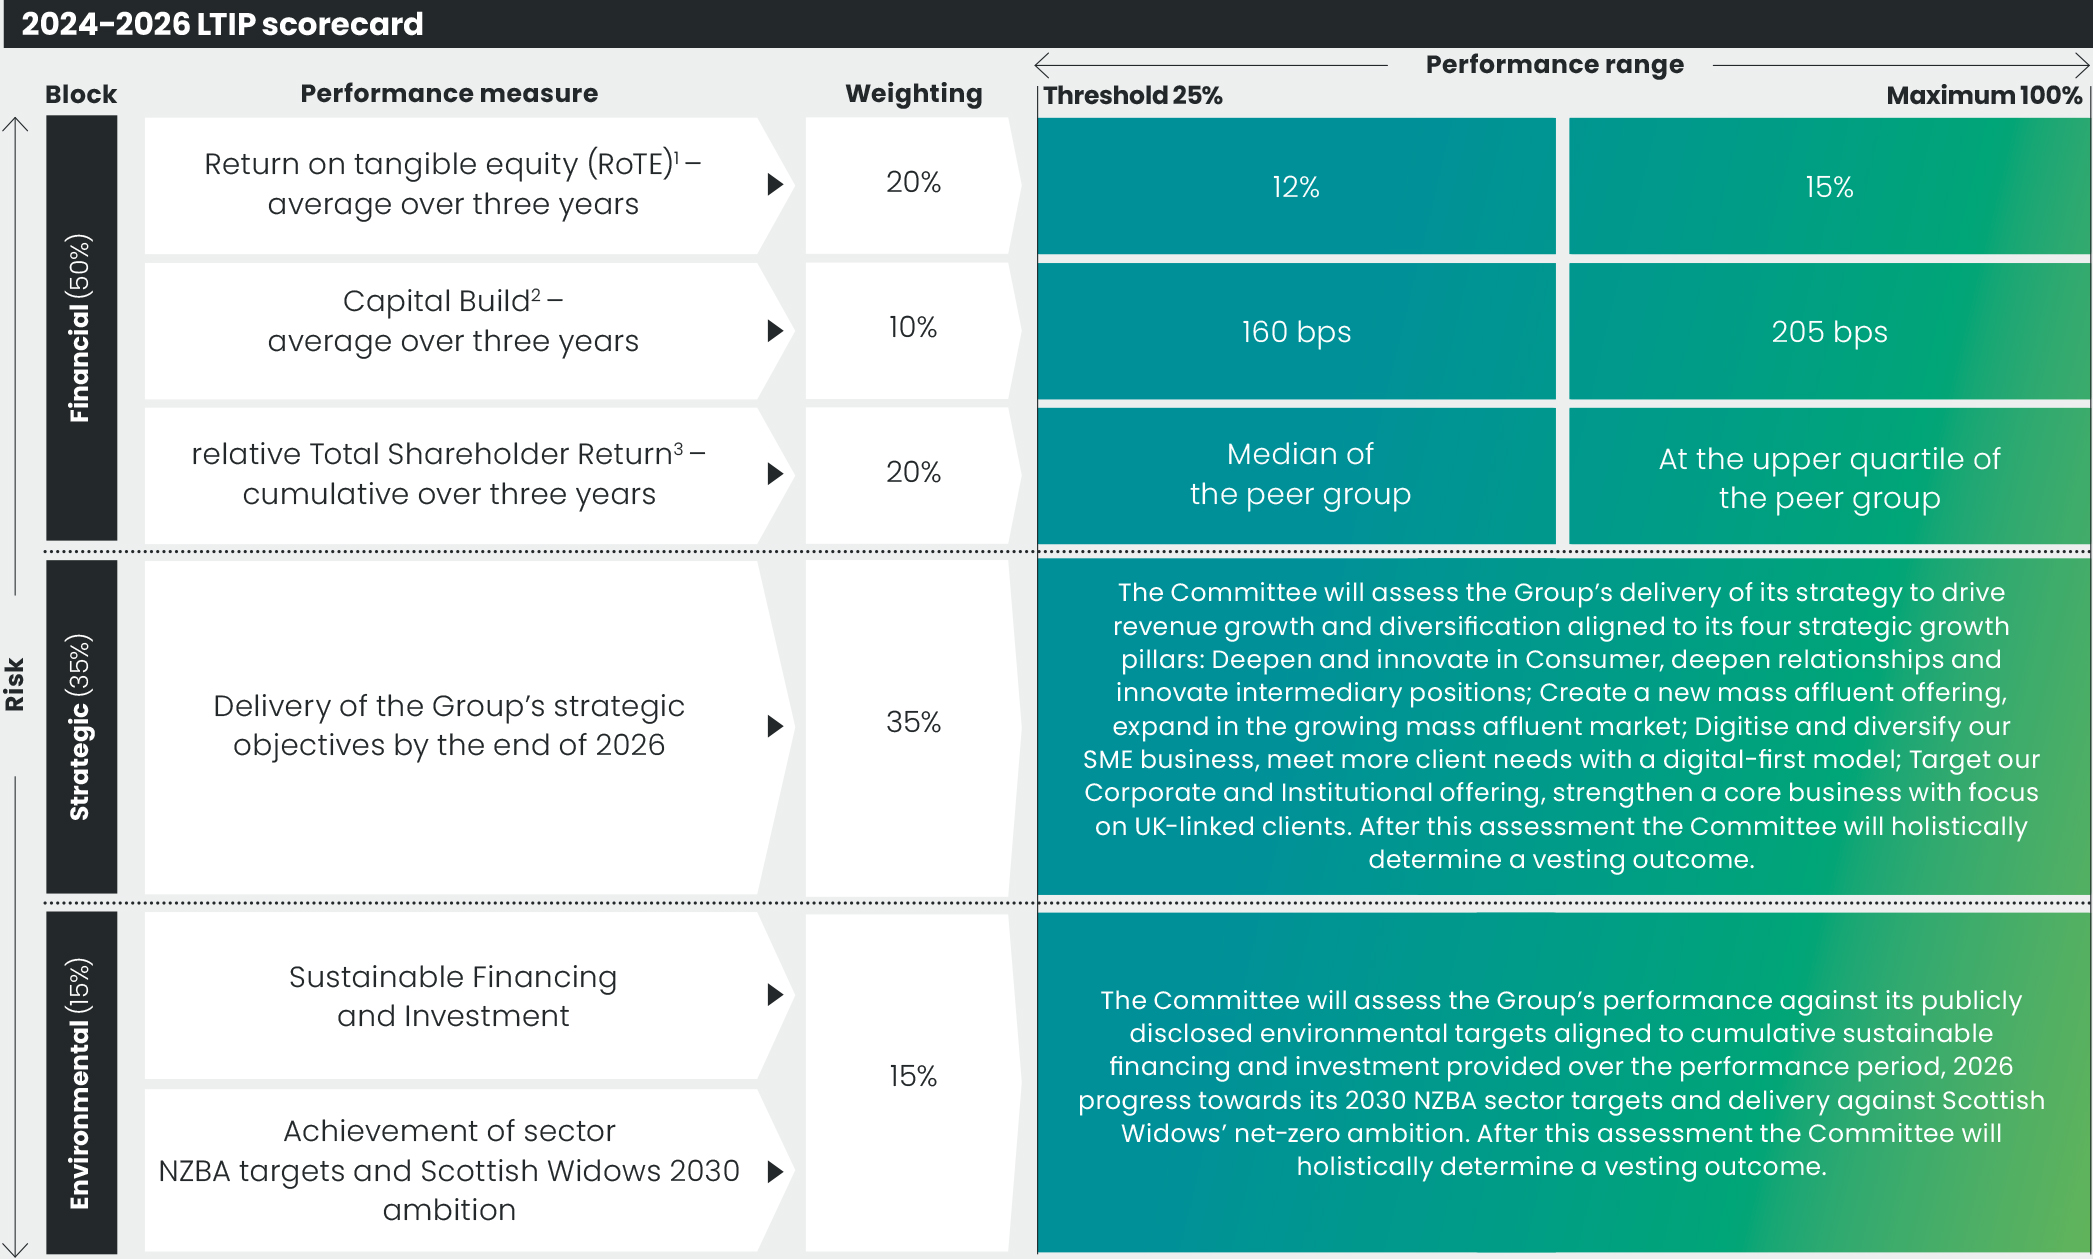
1 If average RoTE reaches 12 per cent then 5 per cent of the award vests. If average RoTE reaches 15 per cent then 20 per cent of the award vests. If average RoTE is between the threshold and maximum, vesting is calculated on a straight-line basis between these two points.
2 If average Capital Build reaches 160 basis points then 2.5 per cent of the award vests. If average Capital Build reaches 205 basis points then 10 per cent of the award vests. If average Capital Build is between the threshold and maximum, vesting is calculated on a straight-line basis between these two points.
3 Peer group: HSBC, Barclays, NatWest, BNP Paribas, Santander, ING, Intesa Sanpaolo, BBVA, UniCredit, Nordea, Crédit Agricole, Caixa, KBC Group, Deutsche Bank, SocGen, Danske, ABN AMRO, Bank of Ireland. Where performance falls between threshold and maximum levels, an intermediate percentage will vest.
4 See page 4 for an overview of our environmental metrics and targets. | | | | | | | | |
116 | Lloyds Banking Group plc Annual Report on Form 20-F 2023 | |
2024 Group balanced scorecard
The performance measures and weightings for determining any 2024 GPS awards for the executive directors are shown in the table below.
The measures and targets are set annually by the Remuneration Committee to reflect the strategic priorities of the Group and take into account both the annual financial plan and operating plan against the backdrop of the rapidly evolving external economic and societal landscape.
Performance measures and weightings
The 2024 scorecard metrics have been reviewed alongside the new 2024 LTIP measures, shown on page 116, to ensure they are complementary and there is minimal overlap which would risk duplication of outcomes. The Sustainable Financing and Investment measure which has featured in previous annual scorecards is a critical part of the 2024 LTIP. For this reason, it has been removed from the 2024 scorecard and its 5 per cent weight allocated to the RoTE measure recognising its importance to shareholders. This brings the total financial weighting to 60 per cent.
Whilst a RoTE measure is also included in the LTIP performance metrics, it is considered a fundamental indicator of Group performance and creation of shareholder value. The RoTE within the annual scorecard focuses on in-year performance while the LTIP assesses long-term performance. There are no other changes from 2023.
Targets
Setting stretching targets is a key component of our demanding performance-driven culture. The Committee has undertaken a thorough exercise to ensure targets are sufficiently stretching, taking into consideration our operating plan and, where applicable, forward-looking guidance.
Targets will be disclosed retrospectively in the 2024 annual report alongside the level of performance achieved, as the Remuneration Committee considers such targets to be commercially sensitive.
Measures of financial and non-financial performance have been agreed by the Remuneration Committee to evaluate performance during 2024.
Discretion
When determining the final outcome, the Remuneration Committee may consider any personal or business area objectives and whether there has been effective, consistent and proactive risk management and conduct outcomes across all dimensions.
When assessing performance, the Committee can exercise its judgment to determine the appropriate outcome. This helps to avoid any potential unintended outcomes that might arise from the application of formulaic performance criteria.
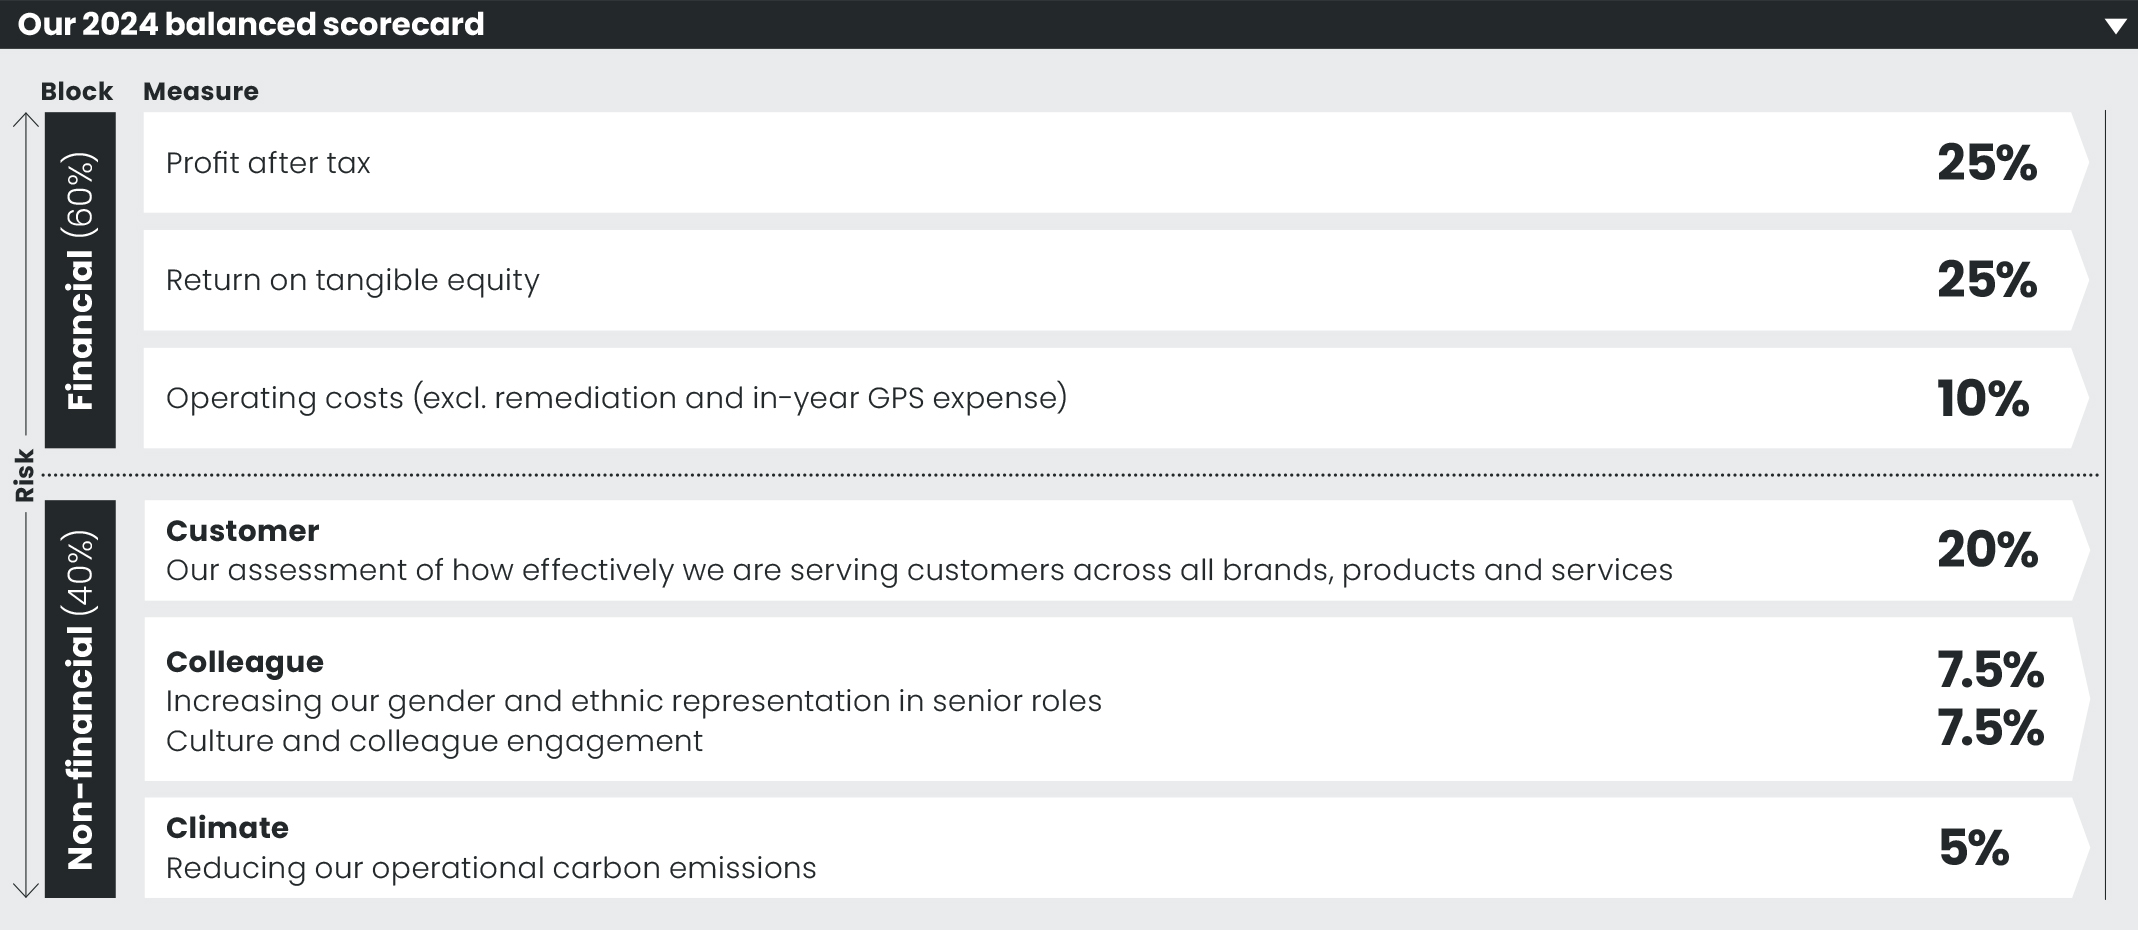
| | | | | | | | |
117 | Lloyds Banking Group plc Annual Report on Form 20-F 2023 | |
Remuneration Committee
At the beginning of 2023, the Committee was comprised of five non-executive directors. From September 2023, the Committee has comprised of four non-executive directors, after Alan Dickinson stepped down from the Committee. Sir Robin Budenberg attends the Committee in his role as Group Chair. The non-executive directors are from a wide background to provide a balanced and independent view on remuneration matters. Two of the three designated independent non-executive directors of the Ring-Fenced Banks also attend meetings of the Committee as observers in order to provide insights on matters relevant to the Ring-Fenced Banks and as part of their role in the Group’s overall governance structure. For further details of Committee membership and attendance at meetings, please see page 131. During the year, Charlie Nunn, as the GCE provided regular briefings to the Committee. In addition, the Committee engaged with and received updates from the Chief People and Places Officer, Total Reward Director and the Chief Risk Officer.
The purpose of the Committee is to set the remuneration for all executive directors and the Chair, including pension rights and any compensation payments. It recommends and monitors the level and structure of remuneration for senior management and material risk takers. It also considers, agrees and recommends to the Board an overall remuneration policy and philosophy for the
Group that is aligned with its long-term business strategy, its business objectives, its risk appetite, purpose and values and the long-term interests of the Group, and recognises the interests of relevant stakeholders, including the wider workforce. The Committee’s operation is designed to ensure that no conflicts of interest arise, and in particular, the Committee ensures that no individual is present when matters relating to their own remuneration are discussed.
Advisers
PwC was appointed by the Committee in May 2022 following a competitive tender process and was retained for 2023. The Committee is of the view that PwC provides independent remuneration advice to the Committee and does not have any connections with the Group or any director that may impair its independence.
More broadly, PwC provides unrelated professional services to the Group in the ordinary course of business including tax, advisory, internal audit and non-audit assurance services. PwC attended Committee meetings upon invitation and fees payable for the provision of services in respect of directors’ remuneration in 2023 amounted to £122,650 excluding VAT. Fees paid to PwC for advising the Committee are based partly on a fixed fee and partly on a time and materials basis.
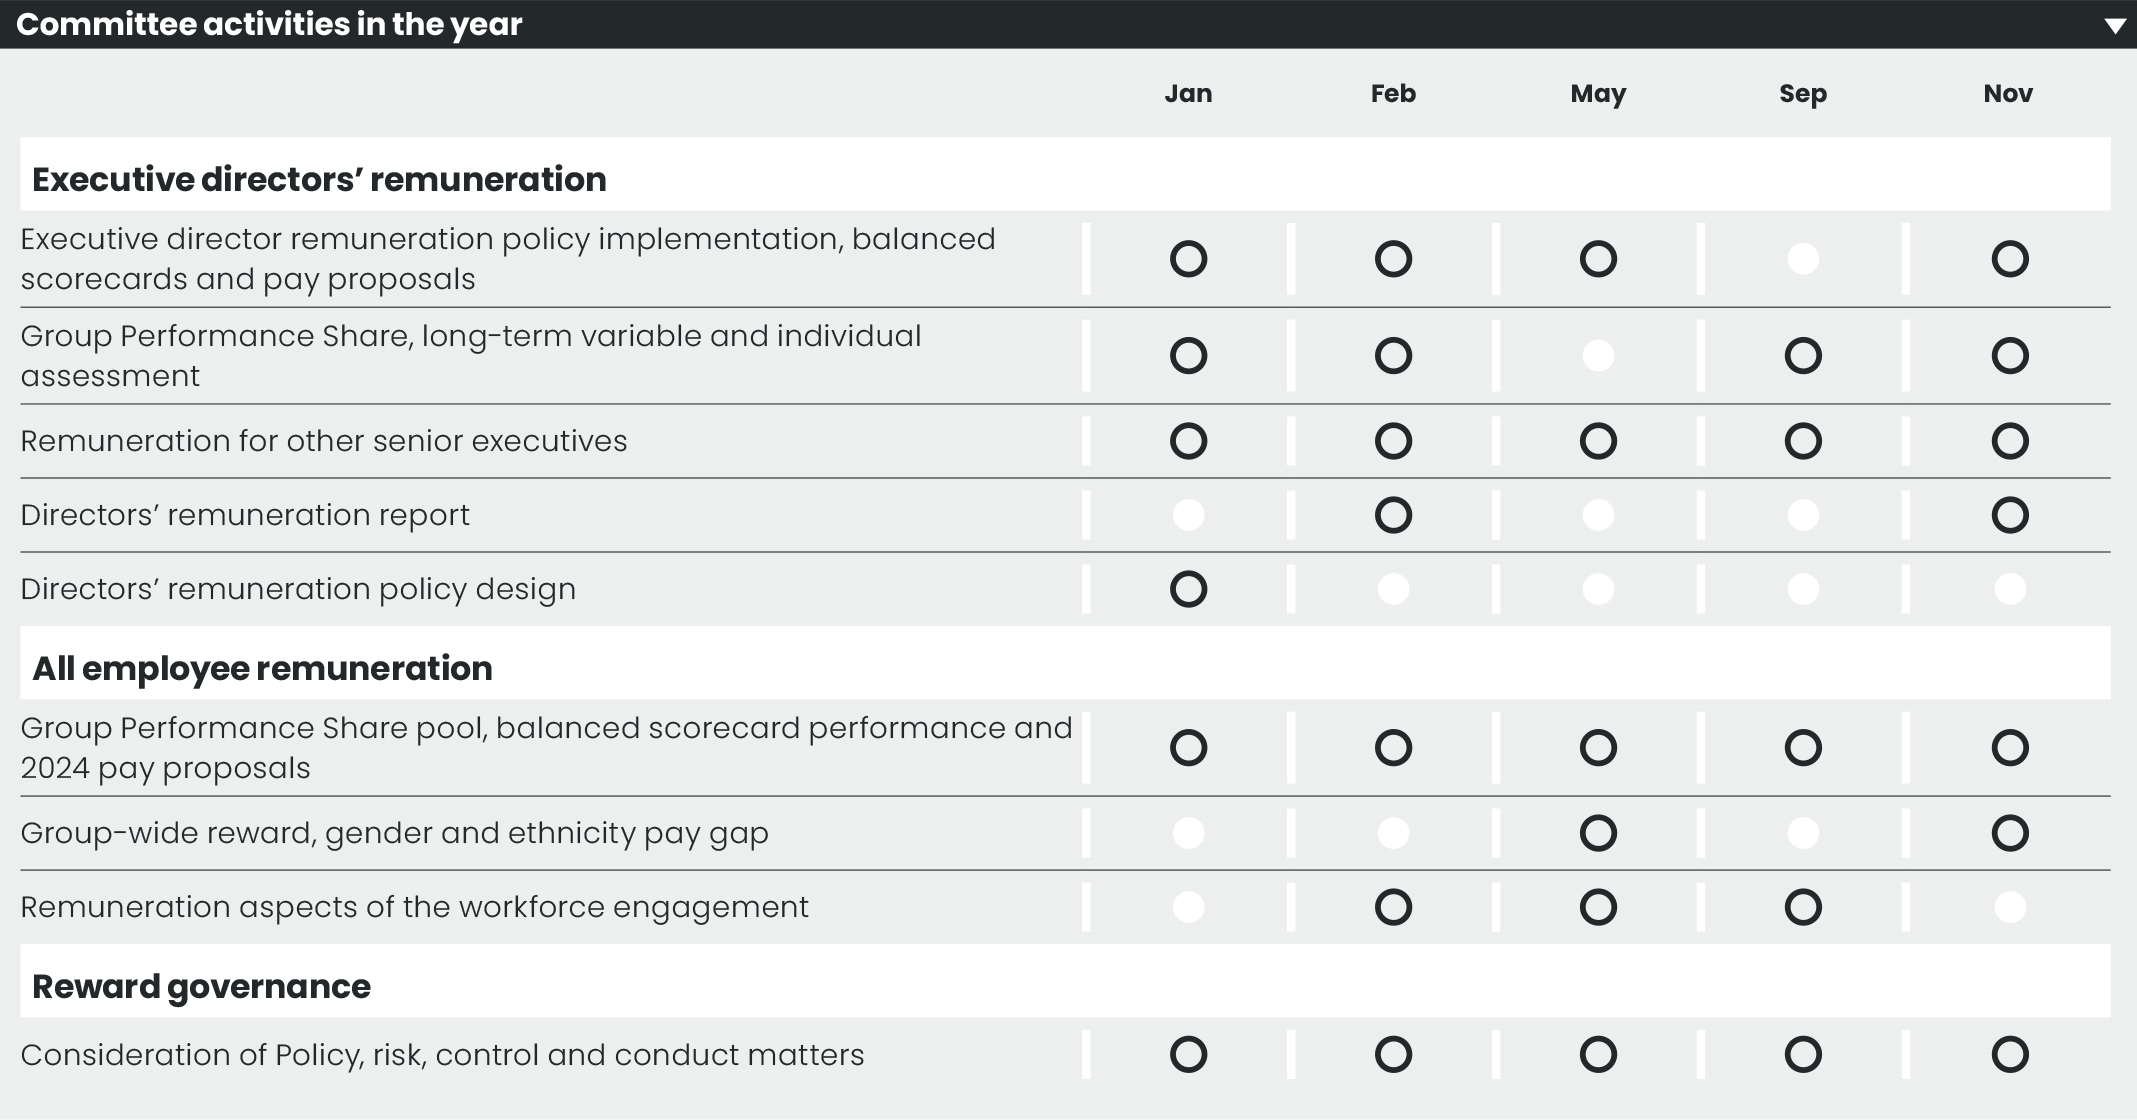
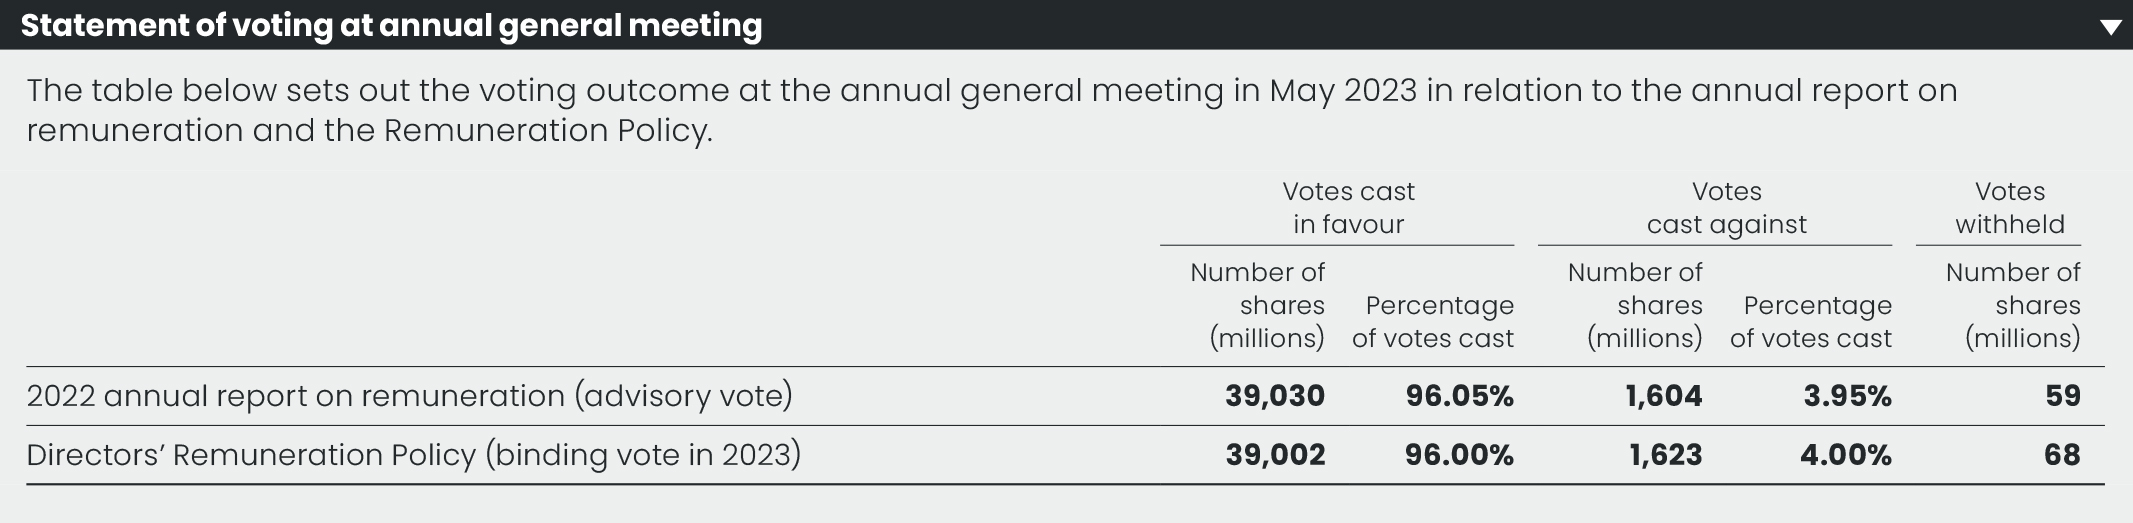
| | | | | | | | |
118 | Lloyds Banking Group plc Annual Report on Form 20-F 2023 | |
Policy alignment to Provision 40 of the Corporate Governance Code
A summary of how the proposed Remuneration Policy addresses the principles set out in the UK Corporate Governance Code is detailed below.
| | | | | | | | | | | | | | | | | | | | | | | | | | |
| Clarity | 6 | | | | Proportionality | 6 | |
| •The Committee regularly consults with key shareholders to ensure transparency on our policy and remuneration outcomes and topics. Shareholder feedback is shared with Board members and considered in the Committee’s reward decisions and policy considerations •Targets are aligned to the Group’s strategy and purpose, providing clarity to shareholders and stakeholders on the relationship between delivery of the strategy and remuneration outcomes •During the year the Group communicated directly with colleagues detailing Group performance, changes in the economic and financial environment, and updates on key strategic initiatives. Meetings were held throughout the year between the Group and our recognised unions. •Non-executive directors attended a number of colleague focus groups, allowing colleagues to share their perspective on matters on the Board’s agenda including the rising cost of living and remuneration | | | | | •There is clear alignment between the performance of the Group, the business strategy, and the reward paid to executive directors •The Committee has the discretion to reduce the annual bonus, LTIP and LTSP awards, if it considers the payout does not appropriately reflect the performance of the Group during the performance period | | |
| | | | | | | | |
| Simplicity | 6 | | | | Risk | 6 | |
| •The Remuneration Policy has been designed so that it is easy to understand and transparent, while complying with all regulatory requirements and meeting the expectations of our shareholders •The purpose of each remuneration element is explained in the Policy and the amount paid in respect of each element is clearly set out | | | | | •The Remuneration Policy supports the Group’s risk management framework •Risk and conduct considerations are taken into account in setting the annual bonus pool •The annual bonus, deferred bonus, LTIP and LTSP incorporate malus and clawback provisions, and overarching Committee discretion to adjust formulaic outcomes | | |
| | | | | | | | |
| Predictability | 6 | | | | Alignment to culture | 6 | |
| •The summarised Remuneration Policy on pages 120 to 124 describes the purpose, operation and maximum potential for each remuneration element •The full Policy set out on pages 126 to 135 of the 2022 Annual Report on Form 20-F illustrates a range of potential outcomes for executive directors | | | | | •Annual and long term variable remuneration are designed to drive behaviours consistent with the Group’s strategy, purpose and values •When considering individual executive directors’ performance, the Committee takes account of the Group’s values | | |
| | | | | | | | |
119 | Lloyds Banking Group plc Annual Report on Form 20-F 2023 | |
2023 Directors’ Remuneration Policy
The Group’s Remuneration Policy was approved at the AGM on 18 May 2023 and took effect from that date.
It is intended that approval of the Policy will be sought at three-year intervals, unless amendments to the Policy are required, in which case further shareholder approval will be sought. Information on how the Policy will be implemented in 2024 is included in the annual report on remuneration on pages 115 to 117. The Committee extensively consulted on the Policy proposals with the Group’s institutional shareholders and key proxy rating agencies. The Committee regularly engages and consults with key shareholders to take into account their feedback on the Policy and its implementation.
The full policy is set out in the 2022 Annual Report on Form 20-F (pages 126 to 135) which is available at: https://www.lloydsbankinggroup.com/assets/pdfs/investors/financial-performance/lloyds-banking-group-plc/2022/full-year/2022-lbg-form-20f.pdf
Directors’ Remuneration Policy and alignment to our Group strategy
The performance measures selected for the GPS and LTIP will be set annually by the Committee taking account of the Group’s strategic priorities and its most important financial measures. Performance measures are selected to ensure an appropriate balance between short and long-term strategic goals and to align executive director and shareholder interests. In determining the appropriate set of measures and targets for annual bonus and LTIP awards, the Committee has discretion to vary the performance measures, or to substitute the metrics, over the life of the Directors’ Remuneration Policy taking into account the Group’s strategic plan or emerging best practice.
The only significant difference between the Policy for executive directors and colleagues outside the Group Executive Committee is participation in the LTIP which is restricted to those most directly accountable for the successful delivery of the Group’s strategy.
The table below summarises how the Policy applies across the Group.
| | | | | | | | | | | | | | |
| Directors’ Remuneration Policy and Group Remuneration Policy alignment | | 6 | |
| | | | | | | | | | | | | | |
| Remuneration policy table for executive directors | | 6 | |
| | | | | | | | | | | | | | |
| l Base Salary | | Maximum Potential The Committee will make no increase which it believes is inconsistent with the two parameters. Increases will normally be no more than the increase awarded to the overall employee population. However, a greater salary increase may be appropriate in certain circumstances, such as a new appointment made on a salary below a market competitive level, where phased increases are planned, or where there has been an increase in the responsibilities of an individual. Where increases are awarded in excess of the wider employee population, the Committee will provide an explanation in the relevant annual report on remuneration. Performance measures N/A | |
| | | |
| Purpose and link to strategy To support the recruitment and retention of executive directors of the calibre required to develop and deliver the Group’s strategic priorities. Base salary reflects the role of the individual, taking account of market competitiveness, responsibilities and experience, and pay in the Group as a whole. Operation Base salaries are typically reviewed annually with any increases normally taking effect from 1 April for executive directors. When determining and reviewing base salary levels, the Committee takes into account base salary increases for employees throughout the Group and ensures that decisions are made within the following two parameters: •An objective assessment of the individual’s responsibilities and the size and scope of their role, using objective job-sizing methodologies. •Pay for comparable roles in comparable publicly listed financial services groups of a similar size. Salary may be paid in sterling or other currency and at an exchange rate determined by the Committee. | | |
| | | | |
| | | | | | | | |
120 | Lloyds Banking Group plc Annual Report on Form 20-F 2023 | |
| | | | | | | | | | | | | | |
| l Fixed Share Award | | Maximum Potential The maximum award is 100 per cent of base salary. Performance measures N/A | |
| | | |
| Purpose and link to strategy To ensure that total fixed remuneration is commensurate with role and to provide a competitive reward package for executive directors with an appropriate balance of fixed and variable remuneration. Operation The Fixed Share Award will be delivered entirely in Lloyds Banking Group shares, released over three years with 33 per cent being released each year following the year of award. Fixed Share Awards are preferred to be delivered in shares to create further alignment with shareholders over time. However, the Committee has discretion to deliver some or all of the awards in cash. | | |
| | | | |
| | | | | | | | | | | | | | |
| l Pension | | Maximum Potential The maximum allowance for all executive directors is set at 15 per cent of base salary in line with the majority of the workforce. Performance measures N/A | |
| | | |
| Purpose and link to strategy To provide cost-effective and market competitive retirement benefits, supporting executive directors in building long-term retirement savings. Operation Executive directors are entitled to participate in the Group’s defined contribution scheme with company contributions set as a percentage of salary. An individual may elect to receive some or all of their pension allowance as cash in lieu of pension contribution. | | |
| | | | |
| | | | | | | | | | | | | | |
| l Benefits | | When determining and reviewing the level of benefits provided, the Committee ensures that decisions are made within the following two parameters: •An objective assessment of the individual’s responsibilities and the size and scope of their role, using objective job-sizing methodologies •Benefits for comparable roles in comparable publicly listed financial services groups of a similar size Maximum Potential The Committee will only make increases in the benefits currently provided which it believes are consistent with the two parameters above. Executive directors receive a flexible benefits allowance which does not currently exceed 4 per cent of base salary. Performance measures N/A | |
| | | |
| Purpose and link to strategy To provide flexible benefits as part of a competitive remuneration package. Operation Benefits may include those currently provided and disclosed in the annual report on remuneration. Core benefits include a company car or car allowance, private medical insurance, life insurance and other benefits that may be selected through the Group’s flexible benefits plan. Additional benefits may be provided to individuals in certain circumstances such as relocation. This may include benefits such as accommodation, relocation, and travel. The Committee retains the right to provide additional benefits depending on individual circumstances. | | |
| | | | |
| | | | | | | | | | | | | | |
| l All-employee plans | | Maximum Potential Participation levels may be increased up to HMRC limits as amended from time to time. The monthly savings limits for Save As You Earn (SAYE) is currently £500. The maximum value of shares that may be purchased under the Share Incentive Plan (SIP) in any year is currently £1,800 with a two-for-one match. Currently a three-for-two match is operated up to a maximum colleague investment of £30 per month. The maximum value of free shares that may be awarded in any year is £3,600. Performance measures N/A | |
| | | |
| Purpose and link to strategy Executive directors are eligible to participate in HMRC-approved share plans which promote share ownership by giving employees an opportunity to invest in Group shares. Operation Executive directors may participate in these plans in line with HMRC guidelines currently prevailing (where relevant), on the same basis as other eligible employees. | | |
| | | | |
| | | | | | | | |
121 | Lloyds Banking Group plc Annual Report on Form 20-F 2023 | |
| | | | | | | | | | | | | | |
| l Group Performance Share (Short term variable) | | Maximum Potential The maximum GPS opportunity is 140 per cent of base salary for executive directors. Performance measures Measures and targets are set annually by the Committee in line with the Group’s strategic business plan and further details are set out in the annual report on remuneration for the relevant year. Measures consist of both financial and non-financial measures and the weighting of these measures will be determined annually by the Committee. All assessments of performance are ultimately subject to the Committee’s judgement, but measures will not vest if a 25 per cent threshold performance is not met. The normal ‘target’ level of the GPS is 50 per cent of maximum opportunity. The Committee is committed to providing transparency in its decision making in respect of GPS awards and will disclose historic measures and target information together with information relating to how the Group has performed against those targets in the annual report on remuneration for the relevant year except to the extent that this information is deemed to be commercially sensitive, in which case it will be disclosed once it is deemed not to be sensitive. | |
| | | |
| Purpose and link to strategy To incentivise and reward the achievement of the Group’s annual financial and strategic targets whilst supporting the delivery of long-term superior and sustainable returns. Operation Measures and targets are set annually and awards are determined by the Committee after the year-end based on performance against the targets set. The GPS may be delivered partly in cash, shares, notes or other debt instruments including contingent convertible bonds. Where all or part of any award is deferred, the Committee may adjust these deferred awards in the event of any variation of share capital, demerger, special dividend or distribution or amend the terms of the plan in accordance with the plan rules. Where an award or a deferred award is in shares or other share-linked instrument, the number of shares to be awarded may be calculated using a fair value or based on discount to market value, as appropriate to reflect the fact that the directors are not eligible for dividends on unvested deferred awards. The Committee applies its judgement to determine the payout level commensurate with business and/or individual performance or other factors as determined by the Committee. The Committee may reduce the level of award (including to zero), apply additional conditions to the vesting, or delay the vesting of deferred awards to a specified date or until conditions set by the Committee are satisfied, where it considers it appropriate. Awards may be subject to malus and clawback for a period of up to seven years after the date of award which may be extended to 10 years where there is an ongoing internal or regulatory investigation. | | |
| | | | |
| | | | | | | | | | | | | | |
| l Long Term Incentive Plan (Long term variable) | | Maximum Potential The maximum Long Term Incentive Plan opportunity is 300 per cent of base salary for annual awards to all executive directors. The actual award level granted will be determined with reference to a pre-grant test based on an assessment of performance by the Committee. Performance measures Awards will be subject to forward-looking performance measures based on financial and other strategic and environmental measures set out in the annual report on remuneration each year; performance will be measured over a period of not less than three years as determined by the Committee. The Committee has the discretion to change the measures or their weightings subject to a minimum of 50 per cent of the award being dependent on financial measures. No more than 25 per cent of the award will vest for threshold performance. 100 per cent of the award will vest for achieving the maximum performance. Where performance falls between threshold, target and maximum levels, an intermediate number of awards will vest. | |
| | | |
| Purpose and link to strategy To incentivise performance linked to the Group’s strategy and aligned to shareholder interests Operation From 2024, awards will be granted under the rules of the 2023 Long Term Incentive Plan, approved at the AGM on 18 May 2023. Awards will be granted in the form of conditional rights to shares in the Group. The grant price of shares to be awarded may be discounted to reflect that the directors are not eligible for dividends on unvested awards. Awards shall vest in five equal annual instalments which will not start before the third anniversary of grant; each vesting will be subject to a further holding period as required by regulation. The Committee retains full discretion to amend the vesting levels should the outcome not reflect business and/or individual performance including risk and conduct outcomes. The Committee may reduce (including to zero) the level of the award, apply additional conditions to the vesting, or delay the vesting of awards to a specified date or until conditions set by the Committee are satisfied, where it considers it appropriate. Awards may be subject to malus and clawback for a period of up to seven years after the date of award which may be extended to 10 years where there is an ongoing internal or regulatory investigation. | | |
| | | | |
| | | | | | | | |
122 | Lloyds Banking Group plc Annual Report on Form 20-F 2023 | |
| | | | | | | | | | | | | | |
| l l Deferral of variable remuneration and holding periods | |
| | | | |
| Operation The GPS and LTIP are both considered variable remuneration for the purpose of regulatory payment and deferral requirements. The payment of variable remuneration and deferral levels are determined at the time of award in compliance with regulatory requirements which currently require that at least 60 per cent of the aggregate variable remuneration (GPS + LTIP) is deferred up to seven years with pro rata vesting between the third and seventh year, and at least 50 per cent of total variable remuneration is delivered in shares or other equity linked instruments subject to a minimum one-year holding period. | | | |
| | | | |
| | | | | | | | | | | | | | |
| l l Performance adjustment | | Judgement on individual performance adjustment is informed by taking into account the severity of the issue, the individual’s proximity to the issue and the individual’s behaviour in relation to the issue. Individual adjustment may be applied through adjustments to balanced scorecard assessments and/or through reducing the variable remuneration outcome. Awards are subject to clawback for a period of up to seven years after the date of award which may be extended to 10 years where there is an ongoing internal or regulatory investigation. The application of clawback will generally be considered when: •There is reasonable evidence of employee misbehaviour or material error •There is material failure of risk management at a Group, business area, division and/or business unit level In 2023 the Group introduced a separate Performance Adjustment Policy which is specifically designed to comply with new US Securities and Exchange Commission (SEC) rules which require listed firms in the US (including foreign issuers such as Lloyds Banking Group) to be able to recover certain variable awards in the event of a restatement of the company’s financial statements. This applies to awards made to the Group Executive Committee Members from 2 October 2023. | |
| | | |
| Performance adjustment is determined by the Remuneration Committee and/or Board Risk Committee and may result in a reduction of up to 100 per cent variable remuneration opportunity for the relevant period. It can be applied on a collective or individual basis. When considering collective adjustment, a report is submitted to the Remuneration Committee and Board Risk Committee regarding any adjustments required to balanced scorecards or the overall GPS and/or LTSP/LTIP outcome to reflect in-year or prior year risk matters. The application of malus will generally be considered when: •There is reasonable evidence of employee misbehaviour or material error or that they participated in conduct which resulted in losses for the Group or failed to meet appropriate standards of fitness and propriety •There is material failure of risk management at a Group, business area, division and/or business unit level •The Committee determines that the financial results for a given year do not support the level of variable remuneration awarded •Any other circumstances where the Committee consider adjustments should be made | | |
| | | | |
| | | | | | | | |
123 | Lloyds Banking Group plc Annual Report on Form 20-F 2023 | |
| | | | | | | | | | | | | | |
| l Chair and non-executive director fees and benefits | |
| | | | |
| Purpose and link to strategy To provide an appropriate reward to attract and retain a high-calibre individual with the relevant skills, knowledge and experience. Operation The Committee is responsible for evaluating and making recommendations to the Board with regard to the Chair’s fees. The Chair does not participate in these discussions. The GCE and the Chair are responsible for evaluating and making recommendations to the Board in relation to the fees of the non-executive directors (NEDs). When determining and reviewing fee and benefit levels, the Committee ensures that decisions are made within the following parameters: •The individual’s skills and experience •An objective assessment of the individual’s responsibilities and the size and scope of their role, using objective sizing methodologies •Fees and benefits for comparable roles in comparable publicly listed financial services groups of a similar size The Chair receives an all-inclusive fee, which is reviewed periodically plus benefits including life insurance, medical insurance and transportation. The Committee retains the right to provide additional benefits depending on individual circumstances. | | NEDs are paid a basic fee plus additional fees for the Chair/ membership of Committees and for membership of Group company boards, non-board level committees and/or other specific responsibilities. Additional fees are also paid to the Senior Independent Director and to the Deputy Chair to reflect additional responsibilities. Any increases normally take effect from 1 January of a given year. The Chair and the NEDs are not entitled to receive any payment for loss of office (other than in the case of the Chair’s fees for the six month notice period) and are not entitled to participate in the Group’s variable remuneration arrangements, all-employee share plan or pension arrangements. NEDs are reimbursed for expenses incurred in the course of their duties, such as travel and accommodation expenses, on a grossed-up basis (where applicable). Maximum potential Any increase in fees or benefits currently provided will be consistent with the parameters above, Performance metrics N/A | |
| | | | |
Service agreements
The service contracts of all current executive directors are terminable on 12 months’ notice from the Group and six months’ notice from the individual. The Chair also has a letter of appointment. The Chair’s engagement may be terminated on six months’ notice by either party.
Letters of appointment
The non-executive directors all have letters of appointment and are appointed for an initial term of three years after which their appointment may continue subject to an annual review. Non-executive directors may have their appointment terminated, in accordance with statute, regulation and the articles of association, at any time with immediate effect and without compensation.
All directors are subject to annual re-election by shareholders.
The service contracts and letters of appointments are available for inspection at the Company’s registered office
| | | | | | | | | | | | | | |
| | | |
| | | | |
| NED | Date of letter of appointment | Date of appointment | |
| Sir Robin Budenberg1 | 4 July 2020 | 1 October 2020 | |
| Alan Dickinson | 26 June 2014 | 8 September 2014 | |
| Sarah Legg | 21 October 2019 | 1 December 2019 | |
| Lord Lupton | 2 March 2017 | 1 June 2017 | |
| Amanda Mackenzie | 17 April 2018 | 1 October 2018 | |
| Harmeen Mehta | 5 October 2021 | 1 November 2021 | |
| Cathy Turner | 11 October 2022 | 1 November 2022 | |
| Scott Wheway | 26 July 2022 | 1 August 2022 | |
| Catherine Woods | 22 October 2019 | 1 March 2020 | |
| | | | |
1 Chair is subject to a 6 month notice period.
| | | | | | | | |
124 | Lloyds Banking Group plc Annual Report on Form 20-F 2023 | |
Statement on US corporate governance standards
The Board is committed to the delivery of the Group’s strategy which is underpinned by high standards of corporate governance designed to ensure consistency and rigour in its decision making. This report explains how those standards, in particular, those laid down in the Financial Reporting Council’s UK Corporate Governance Code 2018 (the UK Code), apply in practice to ensure that the Board and management work together for the long-term benefit of the Company and its shareholders. The UK Code can be accessed at www.frc.org.uk.
To assist the Board in carrying out its functions and to provide independent oversight of internal control and risk management, certain responsibilities are delegated to the Board’s Committees. The Board is kept up to date on the activities of the Committees through reports from each of the Committee Chairs. Terms of Reference for each of the Committees are available on the website at www.lloydsbankinggroup.com. Information on the membership, role and activities of the Nomination and Governance Committee, the Audit Committee, the Board Risk Committee and the Responsible Business Committee can be found on pages 146 to 159. Further information about the work of the Remuneration Committee is included on pages 100 to 101 and page 118. As a non-US company listed on the New York Stock Exchange (NYSE) Lloyds Banking Group plc is required to disclose any significant ways in which its corporate governance practices differ from those followed by domestic US companies listed on the NYSE, key differences are set out in the paragraphs below. As Lloyds Banking Group plc’s main listing is on the London Stock Exchange, it follows the principles contained in the UK Code. The Group confirms that it applied the principles and complied with all the provisions of the Code throughout 2023.
Compliance with the UK Code is discussed further on page 127. The NYSE corporate governance listing standards require domestic US companies to adopt and disclose corporate governance policies. For Lloyds Banking Group plc, consistent with the principles of the UK Code, the Nomination and Governance Committee sets the corporate governance principles applicable to the Company and oversees the annual evaluation of the performance of the Board, its Committees and its individual members.
Under the NYSE corporate governance listing standards, the remuneration, nomination and governance committees of domestic US companies must be comprised of entirely independent directors. However for Lloyds Banking Group plc, again consistent with the principles of the UK Code, the Remuneration Committee and the Nomination and Governance Committee include the Chair, with all other members being independent non-executive directors.
| | | | | | | | |
125 | Lloyds Banking Group plc Annual Report on Form 20-F 2023 | |
Corporate governance continued
Chair's introduction
Strong governance provides the foundation for all that we do
Sir Robin Budenberg
Chair
__________________________________________________________
Since the Group launched its strategy in February 2022, the environment in which we operate has changed significantly. The Board is acutely aware that macroeconomic uncertainties, societal challenges and geopolitical tensions are having a profound impact on people, businesses and society. It is in this context that the Group remains committed to its strategy, including delivering higher, more sustainable returns for our shareholders, aligned to our purpose of Helping Britain Prosper.
Strong governance provides the foundation for the Group to help our customers finance their ambitions and grow whilst navigating this challenging external environment. At the same time, it ensures we address the environmental, social and economic concerns of our wider stakeholders in an effective and appropriate manner.
During 2023, the Board has overseen the executive’s continued delivery of the Group’s strategic transformation and has focused on sound risk management, including a review of operational resilience. The strength of our organisation also depends on our people and our culture and we are conscious of the impact that the strategic implementation is having on our colleagues. Listening sessions with colleagues during 2023 provided valuable insight on how colleagues are experiencing our culture and, crucially, on how our leaders are being empowered to drive the fast-paced change required for the successful delivery of our strategy.
On the topic of culture at Board level, I have been particularly pleased by the open and collaborative relationship the Board has continued to develop with the executive. Together with providing constructive challenge on strategic implementation, the Board encourages the executives to share new plans at an early stage in order for the Board to provide feedback as those plans evolve.
Below I highlight some of the governance activities that took place during 2023.
Board oversight of strategy
As I mentioned above, the Board has overseen the continued implementation of the Group’s strategy, providing feedback on the sequencing of changes and investment priorities, together with monitoring key performance indicators – read more on page 133.
Focus on risk management
Given the scale of change required to deliver the Group’s strategic transformation, the Board, the Board Risk Committee and the Group’s Information Technology and Cyber Advisory Forum (ITCAF) have each played a vital role in evaluating change and execution risk and overseeing operational resilience requirements. Read more on risk management on pages to 153 to 158.
Promoting a healthy culture
Building on previous years’ commitments to promoting a values-led culture, the Board has deepened its understanding of colleague and customer sentiment. Further details on the Board’s role in overseeing the embedding of a healthy corporate culture can be found on page 138.
Diversity, equity and inclusion
Inclusion lies at the heart of the Group’s purpose and increasing diversity in the broadest sense, including diversity of thought and background, remains a priority for the Board. Further information on progress made on diversity, equity and inclusion throughout all levels of the organisation is set out on pages 146 to 148 and 159.
Climate ambitions
The Board, through its Responsible Business Committee, has overseen the Group’s sustainability strategy. The Group now has 10 sector-specific Net Zero Banking Alliance targets together with its overall banking ambition and investment target. In addition to our supply chain ambition, a further three new pledges for water, waste and nature were announced in November for our own operations. Further details can be found on pages 136 and 159.
Board and Committee changes
Succession planning and the composition of the Board are important components of good governance. Alan Dickinson and Lord Lupton will retire at the 2024 annual general meeting after serving nine years and almost seven years respectively on the Board. We are deeply grateful to Alan for the wisdom and insight he has brought to the Board over a long period as both Deputy Chair and formerly as Senior Independent Director and in the many important Committee roles he has held and to James for his leadership as the inaugural Chair of Lloyds Bank Corporate Markets plc and for his significant contribution to the Board. They leave with our thanks and best wishes for the future.
Cathy Turner took over from Alan Dickinson as Chair of the Remuneration Committee and as Senior Independent Director in September 2023.
Nathan Bostock will be appointed as a non-executive director of the Group and, subject to regulatory approval, Chair of Lloyds Bank Corporate Markets plc, in each case with effect from 1 August 2024. Nathan was Chief Executive Officer of Santander UK from 2014 until 2022 and, prior to that, an executive director and Group Chief Financial Officer of The Royal Bank of Scotland plc and previously its Chief Risk Officer. Nathan’s financial services experience and UK banking market knowledge will be invaluable to his roles with the Group.
Read more about Board and Committee changes on page 146.
Ring-fencing governance
Although this is Lloyds Banking Group plc’s corporate governance report, I would like to thank Nigel Hinshelwood, Sarah Bentley and Brendan Gilligan for their continued and valued contribution as non-executive directors of Lloyds Bank plc and Bank of Scotland plc (the Ring-Fenced Banks), which represent the majority of the Group’s banking activities. Further details regarding ring-fencing governance are set out on pages 129 and 139.
Corporate Governance Code
The Company’s statement of compliance with the UK Corporate Governance Code 2018 can be found on page 127.
Stakeholder engagement
Understanding and meeting the Group’s responsibilities and duties to shareholders, customers and the communities we serve is central to our purpose and remains of utmost importance. Read more about Board stakeholder engagement on pages 134 to 135.
Sir Robin Budenberg
Chair
| | | | | | | | |
126 | Lloyds Banking Group plc Annual Report on Form 20-F 2023 | |
Corporate governance continued
| | | | | | | | | | | | | | |
| UK Corporate Governance Code |
| Compliance statement | | Principles of the Code |
The UK Corporate Governance Code 2018 (the Code) applied to the financial year ended 31 December 2023. The Code is available at www.frc.org.uk. | | | |
| 1. Board leadership and company purpose (pages 130 to 139 ) | |
| Chair's introduction | |
| This directors’ report is set out in a way that helps shareholders and investors to evaluate how the Company has applied the principles and complied with the provisions of the Code during 2023. The table below signposts the most relevant parts of the Annual Report, in particular where supporting information is not in the directors’ report. | | Our Board | |
| Purpose, values and strategy | |
| Culture | |
| Board stakeholder engagement and decision making | |
| Risk assessment | |
| The Company confirms that it applied the principles and complied with all the provisions of the Code throughout 2023. | | Risk management | |
| Rewarding our workforce | |
| | |
| On 22 January 2024, the Financial Reporting Council published an updated version of the Code which will apply to financial years beginning on or after 1 January 2025. The Company will report against that updated version in due course. | | 2. Division of responsibilities (page 140) | |
| Our Board and governance structure | |
| Independence and time commitments | |
| Committee reports | |
| Board and Committee meeting attendance | |
| | | | |
| | | 3. Composition, succession and evaluation (pages 141 to 144) | |
| | | Our Board | |
| | | Our Board and governance structure | |
| | | Board and Committee meeting attendance | |
| | | Nomination and Governance Committee report | |
| | | | |
| | | 4. Audit, risk and internal control (page 145) | |
| | | Audit Committee report | |
| | | Risk management | |
| | | Principal risks and emerging risks | |
| | | Board Risk Committee report | |
| | | Going concern | |
| | | | |
| | | | |
| | | 5. Remuneration | |
| | | Directors' remuneration report | |
| | | | | | | | |
127 | Lloyds Banking Group plc Annual Report on Form 20-F 2023 | |
Corporate governance continued
Governance at a glance
| | | | | | | | | | | | | | |
| Our Board in 2023 |
| Skills, experience and knowledge of our Board | | |
Collective view of the skills, experience and knowledge of the non-executive directors1 | |
|
|
| |
|
|
Met the board diversity targets in the FCA Listing Rules of at least: 40% of the board being women; one of the senior board positions being held by a woman2; and one member of the board being from a Minority Ethnic background3 | |
|
| |
| |
1.Assessment by the Nomination and Governance Committee as at 24 January 2024. 2.Cathy Turner is the Senior Independent Director. 3.As at 31 December 2023 and remains correct as at the date of publication of the Annual Report. 4.As at 31 December 2023. 5.Lord Lupton will retire at the Company’s 2024 annual general meeting. 6.Alan Dickinson will retire at the Company’s 2024 annual general meeting. | |
|
|
|
| | | | | | | | |
128 | Lloyds Banking Group plc Annual Report on Form 20-F 2023 | |
Corporate governance continued
Boards of the Ring-Fenced Banks
Since 1 January 2019, UK legislation has required large UK banks to separate personal banking services, such as current and savings accounts, from riskier activities, such as investment banking, in other parts of their business. This is called ring-fencing.
Lloyds Bank plc and Bank of Scotland plc are the banks within the Group which have been included within the ring-fence (together, the Ring-Fenced Banks). As the Group’s core focus is on the UK and on retail and commercial banking customers, the majority of the Group’s banking business is undertaken within the Ring-Fenced Banks.
Each of the directors of Lloyds Banking Group plc is also a director of the Ring-Fenced Banks. The boards of the Ring-Fenced Banks have three additional independent non-executive directors: Nigel
Hinshelwood (Senior Independent Director), Sarah Bentley and Brendan Gilligan (together, the Ring-Fenced Bank-only directors). Read their biographies below.
These Ring-Fenced Bank-only directors are independent of the management and the rest of the Group and their role is to act exclusively in the best interests of the Ring-Fenced Banks. They play a crucial role in the governance structure, with an enhanced role in managing any potential conflicts between the Ring-Fenced Banks and the Group.
Read more about the role of the Ring-Fenced Bank-only directors and the Group’s structure on page 139.
| | | | | | | | | | | | | | |
| Ring-Fenced Bank-only directors |
Nigel Hinshelwood Senior Independent Director Lloyds Bank plc and Bank of Scotland plc | | Sarah Bentley Non-executive director Lloyds Bank plc and Bank of Scotland plc | | Brendan Gilligan Non-executive director Lloyds Bank plc and Bank of Scotland plc |
Appointed: January 2019 Skills, experience and contribution: •Extensive experience in the financial services sector in the UK and worldwide •Significant experience of large-scale transformation, operations and technology Nigel was a partner at Ernst & Young (subsequently Cap Gemini Ernst & Young) for many years where his positions included Head of Financial Services and Chief Executive Officer of Southeast Asia. Before becoming a non-executive, he was the Head of HSBC UK and Deputy CEO of HSBC Bank plc. Within the HSBC Group he held several executive appointments including Head of HSBC Insurance Holdings, Chief Operating Officer for Europe, Middle East and Africa and Global Head of Operations. Nigel was formerly a Non-Executive Director of Lloyd’s of London Franchise Board. External appointments: Deputy Chair and Chair designate of Ikano Bank AB, Chair of AXA XL Underwriting Agencies Limited and AXA XL Insurance Company UK Limited, International Advisory Council Member of Adobe Systems Software Ireland Limited, Advisory Council Member of International Association of Credit Portfolio Managers and Member of the Finance and Risk Committee of Business in the Community. | | Appointed: January 2019 Skills, experience and contribution: •Extensive digital and digital transformation experience •Strong customer and marketing skills Sarah is Chair of the Gender Equality Leadership Team at Business in the Community. She was formerly Chief Executive Officer and Executive Director of Thames Water Utilities Limited and Director of Water UK, the trade association of the water and wastewater industry. Prior to those roles, Sarah was Chief Customer Officer at Severn Trent plc and a member of its Executive Committee and the Managing Partner for Accenture’s Digital business unit in the UK & Ireland. She has worked internationally in a number of roles including Strategy, Marketing & Propositions for BT’s Global Services division, CEO of Datapoint, and Senior Vice President of eLoyalty. External appointments: Chair of the Gender Equality Leadership Team at Business in the Community – His Majesty King Charles III’s Responsible Business Network. | | Appointed: January 2019 Skills, experience and contribution: •Extensive experience in core strategic finance and controllership roles in the financial services industry •Significant experience of serving on the boards of regulated financial services businesses in the UK, France, Switzerland and Poland. Brendan’s career began in the Public Audit division of KPMG in Ireland and Canada. He subsequently worked in commercial and consumer banking services and financing with Woodchester Investments plc and, after its acquisition by General Electric Company, with GE Capital until his retirement in April 2018. External appointments: Non-Executive Director of Cabot Credit Management Group Limited and Chairman of its Audit and Risk Committees. |
| | | | |
| | | | |
| | | | | | | | |
129 | Lloyds Banking Group plc Annual Report on Form 20-F 2023 | |
Corporate governance continued
Board leadership and company purpose
The role of the Board
The Board is collectively responsible for promoting and assessing the long-term, sustainable success of the Group, generating value for shareholders and contributing to wider society.
The Board establishes the Group’s purpose, values and strategy and seeks to ensure that the Group is Helping Britain Prosper. The Board approved the Group’s current strategy in February 2022 and you can read more about how the Board has overseen the implementation of the new strategy by the Group Chief Executive, supported by the wider executive management team, on page 133. The Group’s role as a sustainable and inclusive business is central to its purpose. The Responsible Business Committee oversees the Group’s sustainability ambitions, with specific reporting and risk management responsibility in relation to sustainability-related matters (including climate) shared with the Audit Committee and
Board Risk Committee. This ensures appropriate coordination and cooperation on these matters. Read about our sustainability governance structure on pages 136 to 137. The Board is also responsible for ensuring that the Group’s culture is aligned with its purpose, values and strategy. Read more about how the Board assesses and monitors the Group’s culture on page 138. The Board retains ultimate responsibility for ensuring the necessary resources are in place to meet agreed objectives. The effective management of risk is central to the Group’s strategy, supported by the Group’s enterprise risk management framework, which is discussed in the risk management report on pages 31 to 93. The Board recognises that engaging with, and acting on the needs of, the Group’s stakeholders is key to achieving the strategy and long-term objectives of the Company. Read more about how the Board engages with stakeholders on pages 134 to 135.
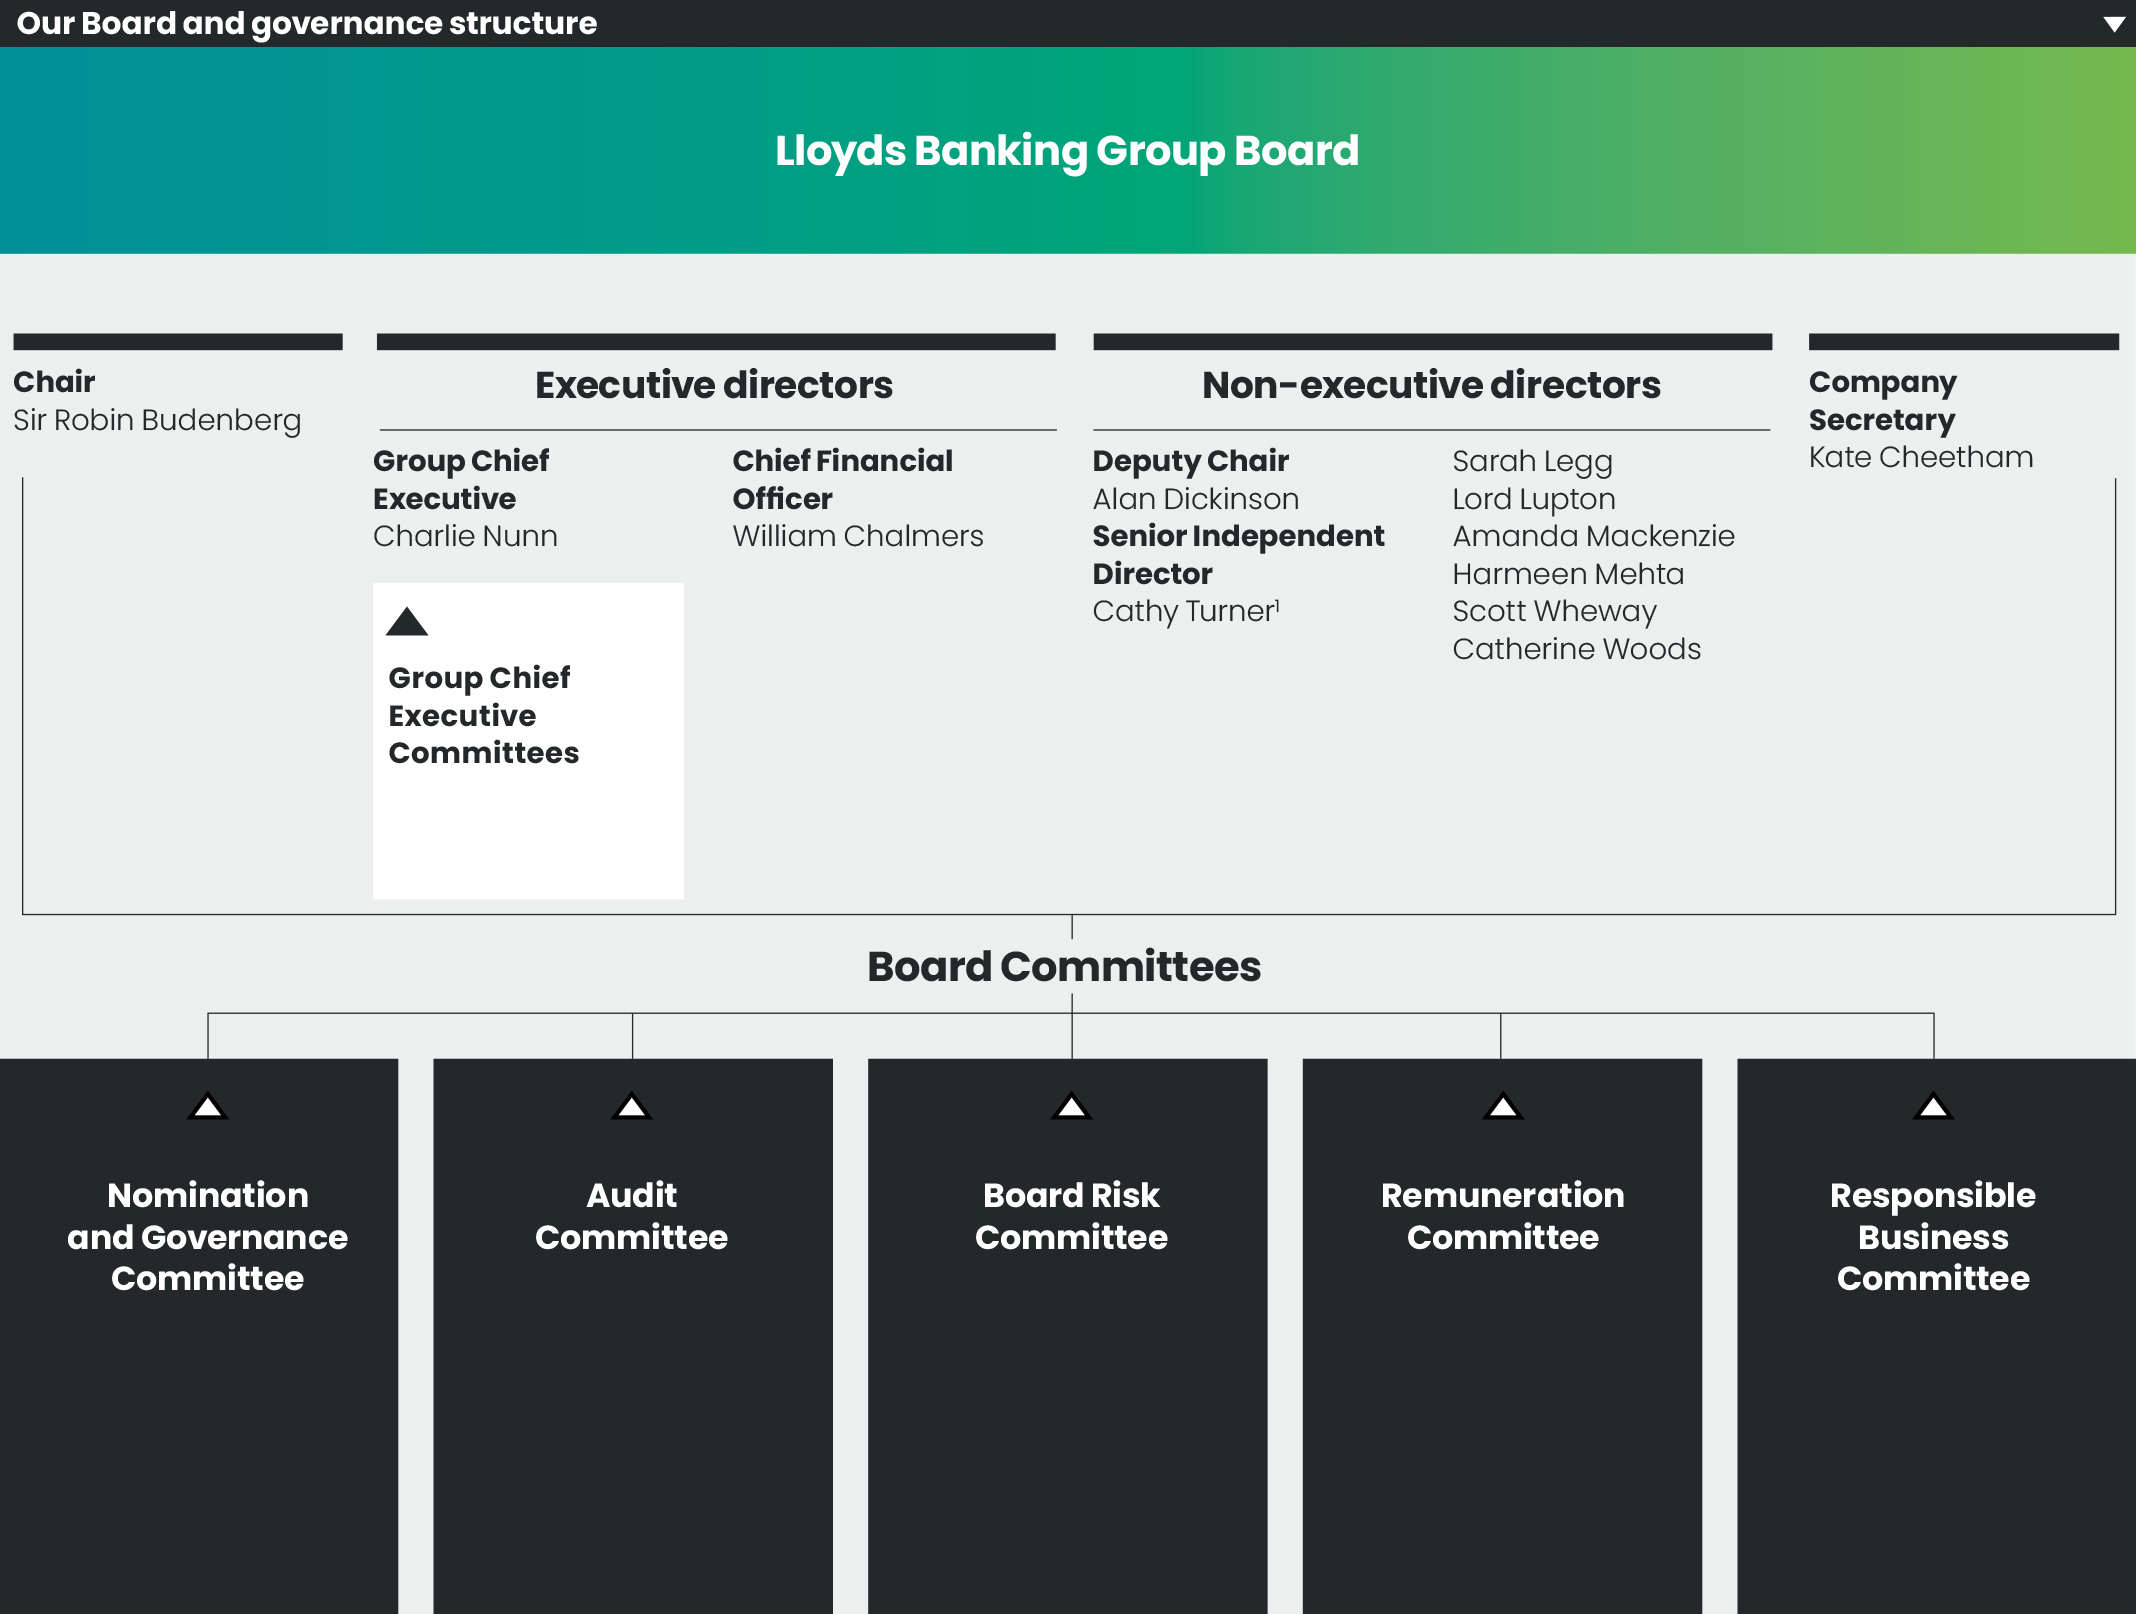
1.Alan Dickinson was Senior Independent Director until 13 September 2023.
The terms of reference for the Board Committees and the matters reserved for the Board can be found at www.lloydsbankinggroup.com/who-we-are/group-overview/corporate-governance
| | | | | | | | |
130 | Lloyds Banking Group plc Annual Report on Form 20-F 2023 | |
Corporate governance continued
Corporate Governance Framework
The key decisions and matters reserved for the Board’s approval, such as the Group’s long-term strategy and priorities, are set out in the Group’s Corporate Governance Framework, which is reviewed periodically by the Board. The Board is supported by its committees which make decisions or recommendations on matters as delegated to them under the Corporate Governance Framework, including Board appointments, the effectiveness of internal controls and the risk management framework, financial reporting, governance and remuneration policies. This enables the Board to spend a greater proportion of its time on strategic, forward-looking matters. Read more about the Corporate Governance Framework on page 147. Each Board Committee comprises non-executive directors only and has an experienced chair. The Committees are managed on the same basis as the Board. The structure of each Committee seeks to facilitate open discussion and debate and ensure adequate time for Committee members to consider all proposals.
The executive directors make decisions within the parameters and principles set out in the Corporate Governance Framework, which aims to ensure that decisions are made by management under the correct authority. However, where appropriate, any activity can be brought to the full Board for consideration, even if the matter falls within agreed executive parameters.
There are executive committees established to support the Group Chief Executive (Group Chief Executive Committees), in particular the Group Executive Committee. Read about the Group Chief Executive Committees on pages 40 to 41. Board meetings in 2023
During 2023 there were nine Board meetings. There are separate boards and board committees of Lloyds Banking Group plc, Lloyds Bank plc, Bank of Scotland plc and HBOS plc, but most meetings of these companies are held concurrently and we refer to this as the ‘Aligned Board Model’. As most of the Group’s business sits within the Ring-Fenced Banks, the interests of the Ring-Fenced Banks, the Group and HBOS plc are aligned in most circumstances. This model is supported by a number of safeguards to enable us to operate in this way including the appointment of three Ring-Fenced Bank only non-executive directors and a Ring-Fenced
| | | | | | | | | | | | | | | | | | | | |
Board and Committee composition and attendance at meetings in 2023 1 | © Chair |
| | | | | | |
| Board member | Board | Nomination
and Governance
Committee | Audit
Committee | Board Risk
Committee | Remuneration
Committee | Responsible
Business
Committee |
| Sir Robin Budenberg | 9/9 © | 7/7 © | | | 5/5 | 4/4 |
| Charlie Nunn | 9/9 | | | | | |
| William Chalmers | 9/9 | | | | | |
| Alan Dickinson | 9/9 | 7/7 | 6/6 | 10/10 | 3/37 | 4/4 |
| Sarah Legg | 9/9 | | 6/6 © | 10/10 | | 4/4 |
| Lord Lupton | 8/94 | | | | | 4/4 |
Amanda Mackenzie2 | 9/9 | 7/7 | | | 5/5 | 4/4 © |
| Harmeen Mehta | 9/9 | | | | | |
Cathy Turner3 | 9/9 | 2/26 | | | 5/5 8 © | |
| Scott Wheway | 9/9 | 7/7 | | 10/10 | | |
| Catherine Woods | 8/9 5 | | 6/6 | 10/10 © | 5/5 | |
1.Where a director is unable to attend a meeting he/she receives papers in advance and has the opportunity to provide comments to the Chair of the Board or to the relevant Committee Chair. 2.Amanda Mackenzie became a member of the Audit Committee on 1 January 2024. 3.Cathy Turner became a member of the Board Risk Committee on 1 February 2024. 4.Lord Lupton was unable to attend one Board meeting due to another commitment. 5.Catherine Woods was unable to attend one Board meeting due to a personal commitment. 6.Cathy Turner became a member of the Nomination and Governance Committee on 13 September 2023. 7.Alan Dickinson stepped down as both Chair and a member of the Remuneration Committee on 13 September 2023. 8.Cathy Turner was a member of the Remuneration Committee throughout 2023 and succeeded Alan Dickinson as Chair of the Remuneration Committee on 13 September 2023. |
Bank Risk Officer, all of whose primary focus is on protecting the interests of the Ring-Fenced Banks. Read more about the Group’s governance structure and ring-fencing governance arrangements on page 139. Updates are provided to the Board by the Committee Chairs as well as by the Chair, the Group Chief Executive, the Chief Financial Officer, the Chief Risk Officer, and the Chairs of the Lloyds Bank Corporate Markets plc and Scottish Widows Group Limited boards. The Chair holds a number of meetings with the non-executive directors without the executive directors present.
The Group has a comprehensive and continuous forward agenda setting and escalation process in place to ensure that the Board has the right information at the right time and in the right format to enable the directors to bring their experience and influence to make the right decisions. The Chair leads the process, assisted by the Group Chief Executive and Company Secretary. The process ensures that sufficient time is allocated for strategic discussions and business critical items.
The process of escalating issues and agenda setting is regularly reviewed as part of the Board evaluation with enhancements made to the process, where necessary, to ensure it remains effective.
The Chair and the Committee Chairs ensure Board and Committee meetings are structured to facilitate open discussion, debate and challenge. If directors have concerns about the Company or a proposed action which cannot be resolved, their concerns are recorded in the Board minutes. Also, on resignation, non-executive directors are encouraged to provide a written statement of any concerns to the Chair, for circulation to the Board. No such concerns were raised in 2023 and up to the date of this report.
The non-executive directors also receive regular updates from management to give context to current issues.
| | | | | | | | |
131 | Lloyds Banking Group plc Annual Report on Form 20-F 2023 | |
Corporate governance continued
Key focus areas
This page shows some of the key focus areas of the Board during 2023 and highlights the stakeholder groups central to those matters considered and decisions taken.
| | | | | | | | |
| Stakeholder key: | | |
Customers and clients | | Communities and environment |
Shareholders | | Suppliers |
Colleagues | | Regulators and government |
| | | | | | | | | | | | | | | | | | | | |
| Key focus areas for 2023 |
| | | | | | |
| | Matters approved | | Other matters considered/undertaken | | Stakeholders |
| | | | | | |
| | | | | | |
Purpose, culture
and values | | •Board diversity policy – read more on page 148 •Operation and effectiveness of the Remuneration Policy •Modern slavery and human trafficking statement
| | •Culture updates – read more on page 138 •Implementation of flexible ways of working for colleagues •Update on the Group’s work to create a skills-based organisation •Updates on the Group’s environmental strategy including on its net zero ambitions | |
|
| | | | | | |
| | | | | | |
| Customers and clients | | •Group customer dashboard targets for assessing customer experience outcomes •The Group’s operational resilience self- assessment as the Group seeks to ensure resilient services for its customers | | •Ongoing support for customers and clients in light of the increase in the cost of living and interest rate rises – read more on page 138 •Progress on the implementation of Consumer Duty •Consumer products and propositions | |
|
| | | | | | |
| | | | | | |
| Strategy | | •Group’s approach to environmental sustainability – read more on pages 135 and 136 •The acquisition of Tusker •Senior management and senior leadership development and succession planning – read more on page 146 | | •Strategy days to discuss the delivery of the strategy and cultural change and to consider the external environment – read more on page 133 •Updates on strategic transformation including on operational resilience •Updates on business unit performance and profile | |
|
| | | | | | |
| | | | | | |
| Financial | | •Four-year operating plan •Annual Report, Form 20-F and half year and quarterly interim management statements •Payment of final dividend for 2022 and interim dividend for 2023 •Share buyback programme | | •Economic assumptions •Financial updates from the Chief Financial Officer including key financial highlights and performance against budget and sub-group business performance •Stress in the global banking sector | |
|
| | | | | | |
| | | | | | |
| Risk management and regulatory | | •Board risk appetite metrics including climate risk •Ring-Fenced Bank governance modifications renewal and modification attestation •PRA Resolvability Assessment Framework •Group Ring-Fencing Policy | | •Risk reports and reports from the Board Risk Committee •Model risk •PRA Periodic Summary Letter and actions •Group Speak Up Champions report •Financial crime | |
|
| | | | | | |
| | | | | | |
| Governance | | •Appointment of Cathy Turner as the Senior Independent Director and Board Committee appointments - read more on pages 146 to 148 •Contracts with major suppliers •Corporate Governance Framework | | •Board workshop on Integrated Scenario Testing •Proposed format of the 2023 annual •general meeting | |
|
| | | | | | |
| | | | | | | | |
132 | Lloyds Banking Group plc Annual Report on Form 20-F 2023 | |
Corporate governance continued
How governance contributes to the delivery of our strategy
Our governance arrangements contribute to the development and delivery of our strategy in various ways, including by creating accountability and responsibility, information flow and independent insight from the non-executive directors.
The Board is responsible for establishing the Group’s strategy and reviews the delivery of that strategy by the Group Chief Executive, supported by the wider executive management team.
In 2022 the Board approved a new strategy and in 2023 the Board reviewed aspects of the strategic transformation including opportunities and risks to delivery.
The below diagram illustrates the different ways in which the Board oversees implementation of the Group’s strategy.
| | | | | | | | |
133 | Lloyds Banking Group plc Annual Report on Form 20-F 2023 | |
Corporate governance continued
Stakeholder engagement
The non-executive directors undertook tailored engagement via the Closer to Customers, Clients and Colleagues Programme, allowing them to hear directly from key stakeholders, including customers, clients and colleagues.
The programme was designed to help the directors better understand the important issues for our customers, clients and colleagues, the role the Group plays in supporting them and how the Group is performing in this respect, helping to inform the directors’ decision making.
A number of activities took place under the programme, which included meetings with customers and clients and conversations with colleagues. The non-executive directors continue to find these sessions beneficial, providing valuable insight which helps in their consideration of the proposals reviewed by the Board during the year.
Further engagement by the Board with its stakeholders is described below.
| | | | | | | | |
| Our stakeholders |
| Customers and clients | | •The Board also took the opportunity to meet with clients when visiting Group sites in Glasgow, Chester and Bristol •Dedicated updates to the Board from across the organisation, which identified areas of customer and client concern and covered a range of internal and external performance measures; in addition, concerns relevant to customers and clients were identified for consideration in wider proposals put to the Board •Regular updates to the Board giving insight into the Group’s performance in delivering on its customer and client-related objectives and commitments, which assisted in determining where further action was required to meet these objectives •The Chair and the Group Chief Executive attended customer and client engagement events across various regions of the UK, providing an important opportunity for customers and clients to raise their concerns directly with these Board members |
The Group’s customer-centric approach means the Board has an ongoing commitment to understanding and addressing customer and client needs, which remains central to achieving the Group’s strategic ambitions. Examples of Board engagement included: •Non-executive directors attended events to provide deeper insight into the issues which customers and clients have faced during the year. These events included sessions on the challenges of running a small business, the issues faced by vulnerable customers, the pressures for customers dealing with financial difficulties and the challenges of managing finances in retirement | |
| | |
| Colleagues | | Examples of Board engagement included: •Review by the Responsible Business Committee of the findings of surveys of colleague sentiment, including annual and ad hoc surveys and review of the progress being made in addressing the matters colleagues have previously raised •Regular review by the Responsible Business Committee of other workforce engagement reports, covering key issues raised, trends on people matters and updates on colleague sentiment •An annual report, summarising all colleague engagement activity, including key themes and issues which colleagues have raised during the year •Non-executive directors attended a number of colleague focus groups, allowing colleagues to share their perspective on matters on the Board’s agenda and discuss the Group’s progress against its strategic objectives •Members of the Board also visited a number of the Group’s sites where they met with colleagues, including Glasgow, Chester, Bristol and Halifax and a visit to the Halifax branch on Commercial Street, Leeds - read more on page 137 •Sessions were hosted by both the Chair and the Group Chief Executive, complemented by engagement sessions led by other senior leaders with feedback shared with the wider Board. The Group Chief Executive also held sessions with colleagues from a number of specific business areas across the Group •Board members attended a range of other events held for the Group’s senior leaders and other colleague network events |
Colleagues remain central to the delivery of the Group’s strategic ambitions and the Board continues to recognise this in its engagement with them. Engagement this year included a variety of sessions across the Group to discuss topical issues relating to challenges both at and outside of work.
As in 2022, the Board’s Responsible Business Committee has been the designated body for workforce engagement, providing focus, but with the Board retaining a commitment for individual Board members to engage with colleagues directly throughout the year. The Board considers these arrangements to be effective as they enable a broader range of colleague engagement activities, as described in this section.
The Responsible Business Committee reports regularly to the Board on all of its activities, including on its colleague engagement agenda. The Board will continue to consider its arrangements for engaging with the Group’s workforce to ensure they remain effective and to encourage meaningful dialogue between the Board and colleagues. | |
| | | | | | | | |
134 | Lloyds Banking Group plc Annual Report on Form 20-F 2023 | |
Corporate governance continued
| | | | | | | | |
| Shareholders | | •The Group Chief Executive and Chief Financial Officer undertook numerous meetings covering topics such as the Group’s strategy, its purpose and its financial performance. Other Board members also attended external investor events. •Regular updates from Investor Relations on market views and shareholder sentiment/feedback, including an annual presentation from the Group’s corporate brokers on market dynamics and perception of the Group •The Board’s Nomination and Governance Committee considered correspondence received from institutional shareholders and non-governmental organisations, along with market feedback •The Senior Independent Director and Chair of the Remuneration Committee engaged with shareholders and proxy agencies on matters relevant to remuneration and other topics •Overall, the Group undertook approximately 380 meetings with institutional investors, many of which were attended by management and directors |
The Group has one of the largest shareholder bases in the UK, which includes most of our colleagues. The Board is committed to understanding the needs and expectations of all our shareholders, both private and institutional. Examples of Board engagement included: •A number of directors engaged directly with institutional shareholders, including the Chair, the Group Chief Executive and Chief Financial Officer. In the fourth quarter of 2023 the Chair undertook a coordinated programme of meetings with approximately 15 major shareholders of the Group, which were largely governance focused, including remuneration | |
| | |
| Communities and environment | | Examples of Board engagement included: •Updates on climate, environmental and social matters, covering aspects of the Group’s business, where the Board reviewed progress made against its stated ambitions in these areas and agreed any further action it considered was required •The Board continues to be supported in environmental matters by its Responsible Business Committee. The Committee considers stakeholder views on all matters relating to the Group’s ambition to be a trusted, sustainable, inclusive and responsible business. The report of the Committee on its work during the year can be found on page 159 |
| The Group is present in almost every community in the country and the Board places great importance on engagement and action to help these communities prosper, while helping to build a more sustainable and inclusive future. | |
| |
|
| Regulators and government | | Examples of Board engagement included: •The Chair and individual directors, including Chairs of the Board’s Committees, held continuing discussions with the FCA and PRA on a number of aspects relevant to the evolving regulatory agenda •The Board reviewed updates on wider Group regulatory interaction, providing a view of key areas of focus and also progress made in addressing key regulatory priorities •A meeting was held between the Board and the PRA in July to discuss the outcomes and progress of action relevant to the PRA’s Periodic Summary Meeting letter •The Chair and individual directors had a number of Continuous Assessment meetings with the PRA to discuss the Board’s oversight of the Group, key risks and strategic priorities |
| The Board continues to maintain strong and open relationships with the Group’s regulators and with government authorities, including key stakeholders such as the Financial Conduct Authority (FCA), the Prudential Regulation Authority (PRA), HM Treasury and HMRC. | |
| | |
| Suppliers | | Examples of Board engagement included: •The Board’s Audit Committee considered reports from the Group’s Sourcing and Finance teams on the efficiency of supplier payment practices, including those relating to the Group’s key suppliers, ensuring our approach continued to meet wider industry standards •The Board continued to oversee resilience in the supply chain, ensuring our most important supplier relationships were not impacted by potential material events •The Board considered matters relating to ensuring continuity in the Group’s customer related print communication, throughout turbulence within the supply chain in the second half of the year
|
| The Group has a number of partners it relies on for important aspects of our operations and customer service provision and the Board recognises the importance of these supplier relationships in achieving the Group’s wider ambitions. | |
| | | | | | | | |
135 | Lloyds Banking Group plc Annual Report on Form 20-F 2023 | |
Corporate governance continued
| | | | | | | | |
Sustainability governance Given the strategic importance of our sustainability ambitions and commitments in managing the impacts arising from climate change and broader social issues, the Group’s governance structure provides clear oversight and ownership of the Group’s sustainability strategy and management of risks and opportunities. Sustainability-related responsibilities at Board level are overseen by the Responsible Business Committee, with specific reporting and risk management responsibility in relation to sustainability related matters (including climate) shared with the Audit Committee and Board Risk Committee. This ensures appropriate Board level coordination and cooperation on these matters. Climate risks and opportunities are identified, assessed and managed by business unit level teams governed via functional and divisional level steering groups and committees. | | The Responsible Business Committee oversees the Group’s delivery of its purpose including the delivery of our sustainability strategy (including climate-related matters). Training has been provided to Committee members on upcoming sustainability regulation and themes of nature and biodiversity. One of the key areas of Board level involvement in 2023 was the approval of three additional Net Zero Banking Alliance sector targets and enhancement of our operational emissions targets. The Responsible Business Chair statement provides an overview of the Responsible Business Committee’s involvement in the Group’s sustainability progress and performance - read more on page 159. We engage proactively with investors and other key stakeholders throughout the year on our sustainability priorities and plans. Given net zero and sustainability are at the heart of our purpose-driven strategy, with ambitious climate targets reflected in strategic objectives, the good progress already being made in this area and the Group’s existing focus on disclosure, transparency and engagement, the Board does not believe it is necessary to propose a separate climate vote at the Company’s 2024 annual general meeting at this time. We will continue to be transparent on our sustainability strategy, targets, plans and progress. We will continue to consider on a regular basis whether to propose a climate vote. |
| |
| Executive level governance |
| The accountable executive for the Group’s sustainability strategy is the Chief Sustainability Officer and Chief Corporate Affairs Officer, with relevant teams in place to drive this strategy forward. There are three key committees that provide management oversight from an executive level: the Group Net Zero Committee, the Group Risk Committee and the Group Executive Committee. These are supported by a number of divisional and function-level teams who consider sustainability topics. |
| Group Executive Committee and Group Net Zero Committee governance Updates on the key areas of the Group’s sustainability strategy are provided to the Responsible Business Committee by the Group Executive Committee on a quarterly basis. The Group Net Zero Committee provides direction and oversight of the Group environmental sustainability strategy, including particular focus on the net zero transition and nature strategy, as well as oversight of the Group’s approach to meeting external environmental commitments and targets, including progress in relation to the requirements of the Net Zero Banking Alliance. |
| Group Risk Committee governance Responsibility for overseeing the management of financial risks from climate change rests with the relevant Chief Risk Officers across the Group, who have Senior Management Function (SMF) responsibility covering the Ring-Fenced Banks (Lloyds Bank plc and Bank of Scotland plc), Lloyds Bank Corporate Markets and the Solvency II regulated entities in Scottish Widows Group (under Scottish Widows Group, the Finance Director has additional SMF responsibilities to manage the risks while the Chief Risk Officer has oversight). Climate risk is considered through the Group’s monthly risk reporting to the Group Risk Committee, in addition to standalone updates on a half-yearly basis which inform discussions at the Board Risk Committee. Relevant updates are also provided across the Group’s key legal entities, as required. Additional engagement on relevant climate-related matters is undertaken through the existing risk governance structure, for example, sector risks and opportunities related to climate are presented and discussed at senior credit forums. Programme governance is also in place for oversight of plans to develop the Group’s climate risk management and scenario analysis capabilities. |
1 The Chair of the Scottish Widows Board sits on the Group Board. The Scottish Widows CEO sits on the Group Executive Committee and will update the Group Executive Committee on relevant insurance matters which can include papers for Group Executive Committee approval. 2 The Chair of the Responsible Business Committee, Amanda Mackenzie, is a non-executive director on the Board, a member of the Remuneration Committee, the Nomination and Governance Committee and, as of 1 January 2024, the Audit Committee, and ensures that sustainability is discussed and considered by the Board. Amanda has extensive experience in ESG matters, including helping launch the United Nations Sustainable Development Goals. 3 The Group Net Zero Committee and the Group Risk Committee provide oversight from an environmental perspective only. | |
| | | | | | | | |
136 | Lloyds Banking Group plc Annual Report on Form 20-F 2023 | |
Corporate governance continued
| | | | | | | | | | | | | | |
| Key sustainability topics discussed at the Board’s Committee meetings in 2023 |
| Across the Group’s governance structure, key areas of discussion at Board Committee level are detailed below in relation to the Group’s sustainability strategy, targets and approach to managing climate-related risk. These Committees meet at least quarterly with sustainability matters, including climate, discussed at a number of these meetings. |
| Lloyds Banking Group plc Board |
| | | | |
Responsible
Business Committee | | Audit
Committee | | Board Risk
Committee |
Topics discussed •Approval of our environmental strategy update, sector targets and methodology for three additional Net Zero Banking Alliance sector targets •Approval of external sector statement updates •Review of proposals for enhancement of our operational emission targets including a more ambitious direct carbon emissions reduction and approval of new water, waste and nature pledges •Monitoring of progress across the Group on implementation of credible transition plan efforts •Discussion of sustainability-related opportunities across the Group •Update on nature-related matters and the impact on our Group sustainability strategy | | Topics discussed •Review of new regulations including International Sustainability Standards Board, Corporate Sustainability Reporting Directive and Climate-related Financial Disclosures •Activity to assess impacts of climate-related risks and opportunities on the financial statements including quantification of impacts of climate risk on Expected Credit Loss •Understanding the control environment embedded to support 2023 sustainability reporting •Review of integrated sustainability reporting for the Group in 2023 •Climate data requirements were discussed at a joint Audit and Risk Committee Forum | | Topics discussed •Overview of activities to meet regulatory expectations, with detailed updates on key areas (e.g. credit integration, scenario analysis) •Approvals of Board risk appetite for climate risk •Update on net zero strategies including trade-offs between different decisions •Update on the Group’s approach to embedding climate risk in its enterprise risk management framework •Climate data requirements were discussed at a joint Audit and Risk Committee Forum |
For further detail on other sustainability-related matters discussed in 2023 see the Responsible Business Committee report on page 159 | | For further detail on matters discussed in 2023 see the Audit Committee report on pages 149 to 152 | | For further detail on matters discussed in 2023 see the Board Risk Committee report on pages 153 to 158 |
| | | | | |
| Non-executive director visits |
Amanda Mackenzie (Chair of the Responsible Business Committee) and Lord Lupton (member of the Responsible Business Committee) visited West Yorkshire in July 2023.
Their first stop was Halifax Town Centre and the Group’s Trinity Road site, where the Group has recently implemented a new energy solution for the site. The Group has removed its natural gas reliance there by introducing a ground source heat pump utilising the natural water that runs below Halifax Town Centre.
Amanda Mackenzie and Lord Lupton then visited the Halifax branch on Commercial Street, Leeds and met with colleagues. The branch had recently gone through a full transformation to make the branch sustainable, change the internal design and layout to the latest style and improve the digital approach in branch to support customer education. | Sir Robin Budenberg (Group Chair and a member of the Responsible Business Committee) visited the Group’s office on Old Broad Street in London in December 2023 to witness first-hand how sustainability is at the heart of the Group’s office refurbishment project there. Using the latest air-source heat pumps to warm and cool the building, the Group aims to reduce energy use on the site by an estimated 63 per cent, fully
supporting our carbon and energy reduction pledges. The Group has been able to recycle or repurpose 99 per cent of the waste that came out of the building.
|
|
|
| | | | | | | | |
137 | Lloyds Banking Group plc Annual Report on Form 20-F 2023 | |
Corporate governance continued
Our Culture
Board engagement in 2023 and beyond
Our non-executive directors continue to engage with colleagues to deepen their understanding of how colleagues experience our culture, including through their participation in the Closer to Customers, Clients and Colleagues Programme. For the culture element of the programme our Board is provided with a range of events and listening sessions with colleagues, giving the Board valuable insight to inform its decision making. Towards the end of 2022, the decision was made to align topics for colleague sessions to key themes arising from colleague surveys.
One session focused on leaders, assessing the impact our Grow with Purpose Programme has had on them leading the transformation of our business. The discussion focused on how leaders are communicating the strategic direction and what barriers are getting in the way of driving fast-paced change.
Another session focused on our strategy, our colleagues’ understanding of it and the impact it is having on customers. This session also looked at the cost of living challenges and how colleagues feel they are being supported by the Group with these challenges.
The Board continues to monitor culture progress and colleague sentiment and engagement by drawing insight from colleague engagement surveys and monthly pulse surveys.
We gathered insight
We looked at data and insights from the following sources
•Colleague surveys: 81 per cent of colleagues responded to our annual all-colleague survey in November
•Conducted monthly pulse surveys with 25 per cent of the organisation each time to focus on key topics
•Analysed sentiment from internal and external sources including nearly 200,000 comments from our annual survey
•Tapped into sentiment being expressed about the world of work online to see external trends and influences
•Refocused existing metrics to create a culture dashboard focusing on the internal and external environment – and developed this at an organisation and business area level
Consumer Duty
2023 has seen the implementation of Consumer Duty. This has included the design and management of the culture workstream for Consumer Duty which was delivered successfully for 31 July 2023, the date on which Consumer Duty came into force for the Group, and continues to be embedded through our ongoing Consumer Duty culture work. This work has been in multiple phases:
•All-colleague training and was completed by more than 99 per cent of colleagues by the end of July 2023
•Creation of four in-depth modules covering the four Consumer Duty outcomes - almost 100,000 module completions recorded in aggregate
•Design and implementation of workshops for leaders. 60 workshops delivered and attended by over 1,200 leaders
Board monitoring of culture progress
New for 2023: Culture Dashboard
Our Group Culture Dashboard is a new development introduced in November 2023, measuring the connection between high performing teams, change readiness and customer outcomes. The Culture Dashboard tracks both quantitative and qualitative insights and recommends actions to drive progress that will help the Group to Grow, Focus and Change.
81%
colleague survey response rate
200,000
colleague survey comments analysed
| | | | | | | | |
138 | Lloyds Banking Group plc Annual Report on Form 20-F 2023 | |
Corporate governance continued
Group structure and ring-fencing governance arrangements
Since 1 January 2019, UK legislation has required large UK banks to separate personal banking services, such as current and savings accounts, from riskier activities, such as investment banking, in other parts of their business. This is called ring-fencing. The Group’s structure and governance arrangements meet these regulatory requirements. As mentioned on page 129, Lloyds Bank plc and Bank of Scotland plc are the banks within the Group which have been included within the ring-fence (together, the Ring-Fenced Banks). The governance structure focuses on ensuring: •Independent decision making by the Ring-Fenced Banks’ boards – on any matters where there might be a conflict between the interests of the Ring-Fenced Banks and the interests of another part of the Group and that any such conflicts are identified and appropriately managed
•Risks affecting the Ring-Fenced Banks are considered and managed from the Ring-Fenced Banks’ perspective – including maintenance of the capital adequacy and liquidity of the Ring-Fenced Banks
•Clear and effective governance at both Ring-Fenced Bank and Lloyds Banking Group plc level – including second and third lines of defence in respect of risk management
The subsidiaries of the Group are structured into the following sub-groups under Lloyds Banking Group plc, providing effective governance for the business undertaken in each sub-group:
•Ring-Fenced Banks sub-group containing Lloyds Bank plc and Bank of Scotland plc (including the Halifax and MBNA businesses), serving both their UK personal and commercial customers
•Non-Ring-Fenced Bank sub-group – Lloyds Bank Corporate Markets plc – which provides products and services to Group customers that are not allowed within the ring-fence, as well as serving financial institutions’ customers and holding certain of the Group’s subsidiaries and branches outside the UK
•Insurance sub-group under Scottish Widows Group Limited (including Scottish Widows Limited)
•Equity sub-group under LBG Equity Investments Limited (including Lloyds Development Capital (Holdings) Limited)
As mentioned on page 129, the boards of the Ring-Fenced Banks comprise all of the Group directors plus three additional independent non-executive directors: Nigel Hinshelwood (Senior Independent Director), Sarah Bentley and Brendan Gilligan. These Ring-Fenced Bank-only directors are independent of the management and the rest of the Group and their role is to act exclusively in the best interests of the Ring-Fenced Banks. They therefore play a crucial role in the governance structure, with an enhanced role in managing any potential conflicts between the Ring-Fenced Banks and the Group. | | | | | | | | | | | |
| Lloyds Banking Group plc simplified sub-group structure |
|
| Lloyds Banking Group Board |
|
|
|
|
| | | |
| Getting closer to customers and clients |
The Board remains very conscious of the challenges our customers and clients continue to face. During the year the Board reviewed and discussed an update dedicated to the impact of the increased cost of living on customers and clients, how the Group had supported, and would support, customers and clients and the Group’s engagement with the Financial Conduct Authority on lenders’ commitments
to support borrowers.
During the year the Board also received additional updates from management on the impacts of the increased cost of living on customers and clients across our businesses.
| During 2023, Board members have attended customer and client engagement sessions to deepen their understanding of the day-to-day challenges our customers and clients face. The topics explored at these sessions included the increased cost of living, the lives of vulnerable customers and customers in financial difficulty and the challenges of managing a small business in the current environment. |
| | | | | | | | |
139 | Lloyds Banking Group plc Annual Report on Form 20-F 2023 | |
Corporate governance continued
Division of responsibilities
Board responsibilities
As Chair, Sir Robin Budenberg has overall responsibility for the leadership of the Board and for ensuring its effectiveness in all aspects of its operation.
The composition of the Board helps ensure that no one individual or small group of individuals dominates the Board’s decision making. The diversity of skills, experience and background on the Board enables the Board to provide constructive challenge and strategic guidance and to offer specialist advice.
There is a clear division of responsibilities between the leadership of the Board and the executive leadership of the Group – please refer to the role summaries below. The responsibilities of the Chair, Group Chief Executive, Senior Independent Director, Board and Committees are agreed by the Board and publicly available on the Group’s website at www.lloydsbankinggroup.com/who-we-are/group-overview/corporate-governance. The Chair periodically refreshes membership of the Committees.
Monitoring independence
The Nomination and Governance Committee monitors whether there are any relationships or circumstances which may affect a director’s independence. Following the most recent review of independence, the Committee concluded that all non-executive directors are independent in character and judgement and are independent directors for the purposes of the Code. For further details of the review in respect of Alan Dickinson, noting his long service, please see page 147. Sir Robin Budenberg was independent on appointment when assessed against the circumstances set out in provision 10 of the Code. Monitoring time commitments
Non-executive directors are advised of time commitments for the Board and relevant Committees prior to their appointment and are required to devote such time as is necessary to discharge their duties effectively. The time commitments of the directors are considered by the Board on appointment and annually thereafter and, following the most recent review, the Board is satisfied there are no directors whose time commitments are considered to be a matter for concern.
External appointments, which may affect existing time commitments to the Board and its Committees, must be agreed with the Chair and prior Board approval must be obtained. During 2023, Amanda Mackenzie was appointed a non-executive director of The British Land Company PLC. The Board considered the time commitment and potential conflicts involved prior to Amanda accepting the role and was satisfied that she would continue to have sufficient time to commit to her Group Board and Committee appointments. The executive directors do not have any significant external appointments. Information on directors’ attendance at meetings can be found on page 131. The right information and support
The Chair, supported by the Company Secretary, ensures that Board members receive appropriate and timely information. All directors have access to the advice of the Company Secretary and the Group provides access, at its expense, to the services of independent professional advisers in order to assist directors in their role. Board Committees are also provided with sufficient resources to discharge their duties.
| | | | | | | | | | | | | | |
| Non-executive directors |
| The independent non-executive directors challenge management constructively and help develop and set the Group’s strategy. They actively participate in Board decision making and scrutinise management performance. The non-executive directors satisfy themselves on the integrity of financial information and review the Group’s risk exposures and controls. The non-executive directors, through the Remuneration Committee, also determine the remuneration of executive directors. |
Chair Sir Robin Budenberg Sir Robin Budenberg leads the Board and promotes high standards of corporate governance. He leads in building an effective and complementary Board and sets the Board’s agenda. The Chair also leads Board succession planning and seeks to ensure effective communication with shareholders.
| | Deputy Chair Alan Dickinson As Deputy Chair, Alan Dickinson supports the Chair in representing the Board and deputises for the Chair. The Deputy Chair may also represent the Group’s interests to official enquiries and review bodies. | | Senior Independent Director Cathy Turner As Senior Independent Director, Cathy Turner is a sounding board for the Chair and Group Chief Executive. She acts as a conduit for the views of other non-executive directors and conducts the Chair’s annual performance appraisal. She is available to help resolve shareholders’ concerns and will attend meetings with major shareholders and financial analysts to understand issues and concerns. |
| Executive directors | | Company Secretary |
Group Chief Executive Charlie Nunn
Charlie Nunn manages and leads the Group on a day-to-day basis, making decisions on matters affecting the operation and performance of the Group’s business and the delivery of the Board’s approved strategy. He delegates aspects of his authority, as permitted under the Corporate Governance Framework, to other members of the Group Executive Committee. | | Chief Financial Officer William Chalmers
Under the leadership of the Group Chief Executive, William Chalmers makes and implements decisions in all matters affecting the management of financial resources. He provides specialist knowledge and experience to the Board. Together with Charlie Nunn, he designs, develops and seeks to implement strategic plans and deals with the day-to-day operations of the Group
| | Company Secretary Kate Cheetham
As Company Secretary, Kate Cheetham advises the Board on matters relating to governance, ensuring good information flows and that comprehensive practical support is provided to directors. She is also responsible for maintaining the Group’s Corporate Governance Framework and organising directors’ induction and training. Both the appointment and removal of the Company Secretary are matters for the Board as a whole.
|
| | | | | | | | |
140 | Lloyds Banking Group plc Annual Report on Form 20-F 2023 | |
Corporate governance continued
Composition, succession and evaluation
Composition
The balance of skills, experience, independence and knowledge on the Board is the responsibility of the Nomination and Governance Committee and is reviewed annually or whenever appointments are considered. The Nomination and Governance Committee assesses the skills, experience and knowledge of the non-executive directors on an individual basis and on a collective basis – please see page 128 for the results of the latest collective assessment, which was approved on 24 January 2024. Having the right balance of skills and experience helps to ensure directors discharge their duties effectively. The Nomination and Governance Committee leads the process for Board appointments, which makes recommendations to the Board. Open advertising and/or an external search consultancy is used for the appointment of the Chair and non-executive directors.
Appointments are made on merit and due consideration is given to diversity in its broadest sense, including gender, social, regional and ethnic backgrounds and cognitive and personal strengths.
Succession planning
The Nomination and Governance Committee ensures plans are in place for orderly succession to both Board and senior management positions and oversees the development of a diverse pipeline for succession. More information about the work of the Nomination and Governance Committee on succession planning can be found on pages 146 to 147. All directors are subject to annual re-election. All directors intend to seek re-election at the Company’s annual general meeting in 2024 except for Alan Dickinson and Lord Lupton, who have notified the Board that they do not intend to seek re-election.
| | | | | | | | | | | | | | | | | | | | | | | | | | |
| Board Committee cross-membership |
| Non-executive directors sitting on multiple Board Committees enables them to read across matters relevant from one Committee to another and, by doing so, enhance the discussion on certain matters. The information below is as at 31 December 2023 and therefore does not reflect Amanda Mackenzie joining the Audit Committee with effect from 1 January 2024 and Cathy Turner joining the Board Risk Committee with effect from 1 February 2024. |
|
|
|
|
|
|
| | | | | | | | | | | | | | | | | | | | | | | | | | | | | | | | | | | | | | |
| Tenure of non-executive directors |
|
|
|
|
|
|
|
|
|
|
1.Lord Lupton and Alan Dickinson have notified the Board that they do not intend to seek re-election at this year’s annual general meeting.
| | | | | | | | |
141 | Lloyds Banking Group plc Annual Report on Form 20-F 2023 | |
Corporate governance continued
Board evaluation
How the Board performs and is evaluated
The annual evaluation, which is typically facilitated externally at least once every three years, provides an opportunity to consider ways of identifying greater efficiencies, maximising strengths and highlighting areas of further development to enable the Board to continuously improve its own performance and the performance of the Group.
The Chair of the Board, with the support of the Nomination and Governance Committee, leads the Board in considering and responding to the review of the Board’s effectiveness, which includes a review of its Committees and individual directors. Performance evaluation of the Chair is carried out by the non-executive directors, led by the Senior Independent Director, considering the views of the executive directors.
The Board is committed to independent evaluation of its own effectiveness and that of its Committees as recommended by the UK Corporate Governance Code 2018. An external evaluation
was carried out by Dr Tracy Long in 2022 and a summary of progress against the feedback from that evaluation is set out on page 143. 2023 evaluation of the Board’s performance
The 2023 evaluation was conducted internally between November 2023 and January 2024 by the Company Secretary and was overseen by the Nomination and Governance Committee.
The 2023 review sought the directors’ views on areas of development identified in the 2022 review and on a range of topics including: board leadership and contribution; purpose and strategy; risk and control; and people, skills, culture and feedback. The topics were selected by the Company Secretary with input from the Chair.
| | | | | | | | |
| Process and timeline for 2023 review |
Stage 1 November – December 2023 | Stage 2 January 2024 | Stage 3 February 2024 |
| The Company Secretary invited all directors to complete a questionnaire relating to the Board and Committees of which they are members. During this stage, the Company Secretary met with each of the directors to discuss their responses. | The findings, based on the questionnaire results and discussions with individual directors, were considered by the Nomination and Governance Committee in January 2024. Committee-specific findings and actions were considered by each Board Committee. | Proposed actions based on these discussions were discussed at the Board’s meeting in February 2024. |
| | | | | | | | |
| Key findings from the 2023 review |
| The evaluation concluded that the performance of the Board, the Committees, the Chair and each of the directors continues to be effective. All directors demonstrated commitment to their roles and contributed effectively. |
| The key findings and areas for consideration include the following: |
| Strengths | Areas for improvement/continued focus |
Board
leadership
and
contribution | •Effective chairing of Board and Committee meetings enabling all views to be heard •Open sharing of information by the Board and engagement in shaping the forward agenda and discussion points •Board having open access to management | •Continue with different approaches to testing and learning to enhance debate and constructive challenge •Executive to continue to bring relevant matters to the Board for debate at an early stage and include examples of lessons learned |
Purpose and
strategy | •Alignment of the Board’s decision making with the Group’s purpose and values •Board dedicates time to consideration of culture and risk transformation as well as purpose and strategy | •Increase scope and cadence of updates from the Chief Customer Officer to provide insights into customer behaviours and trends •Ensuring Board agenda includes time for fast-changing topics such as technology/cyber/data •Board papers to avoid duplication and demonstrate link between decision making and purpose and provide a legal entity lens •Review forward planners to create annual/regular opportunities to invite external experts/speakers to formal and informal sessions with the Board where relevant |
Risk and
control | •Board discussions, decisions and management of conflicts of interest are effective in meeting ring-fencing regime requirements •Board papers and communications are timely and appropriate and there are effective mechanisms to ensure appropriate escalation of issues to the Board | •Bring regular/annual Internal Audit update to Board or other means of providing visibility of Internal Audit’s findings •Individual business updates at Board to include more detail on financial performance, to enable greater discussion and tracking of business unit performance |
| | | | | | | | |
142 | Lloyds Banking Group plc Annual Report on Form 20-F 2023 | |
Corporate governance continued
| | | | | | | | |
| Key findings from the 2023 review |
| Strengths | Areas for improvement or continuing focus |
People, skills,
culture and
feedback | •Board dedicates appropriate time to discussing changes in the executive leadership team, succession of all key executive positions and Board composition (including diversity) •Alignment of Board actions and decisions with culture and ethics of the Group •Board dedicates time to consideration of diversity, equity and inclusion issues | •Review Board, Committee and Strategy Day agendas to continue to create opportunities for informal time together for Board members •Continue to ensure that certain meetings are non-executive director and Chair only to allow for smaller more interactive discussions •In any recruitment, continue to focus on appropriate expertise |
| | | | | | | | | | | | | | | | | | | | |
| Progress against the 2022 evaluation |
| The main focus in improvements to Board effectiveness in 2023 has been on creating room for more forward-looking and strategic discussions on key matters at Board and Committee meetings. These enhancements have been achieved by encouraging the executive team to bring strategic matters to the Board in a phased approach, allowing the Board to bring their challenge, influence and experience to the evolution and delivery of the strategy, ensuring that it is aligned with the Group’s purpose and values. |
| Link to strategy | | Theme | | Feedback from the 2022 evaluation | | Actions taken in 2023 |
| | Board
leadership
and
contribution | | 1.Consider further dedicated professional time outside of Board meetings 2.There is an opportunity for issues to be brought to the Board and Committees earlier to allow more scope for discussion | | 1.A programme of Board events with external speakers was prepared and sessions held. Opportunities were created during meeting cycles for the Board members to spend informal time together 2.The executive team were encouraged by the Board to bring items for earlier Board input and discussion. Topics of strategic importance were brought back iteratively for discussion and the executive and Board members had input into the cadence and focus of these discussions |
| Grow | | | |
| | Risk and
control | | 1.Ongoing development of agenda and papers to encourage broader discussion on priorities 2.Consider a review of the three lines of defence model 3.Continue focus on learning through presentations of ‘lessons learned’ | | 1.The Board forward planner and agenda now include business unit updates on performance and strategic topics, with directors encouraged to raise points of challenge and/or concern in advance of meetings in order to focus the debate 2.A three lines of defence review programme was mobilised, with sponsorship from the Group Chief Executive 3.Papers and presentations from the executive to the Board and Committees have enhanced content and commentary on areas of concern, after the root cause analysis and the lessons learned |
| Focus | | | |
| | Strategy | | 1.Continued awareness by all directors of the changes and challenges in the external environment | | 1.Updates on the progress and challenges to the Group’s strategy and transformation were discussed regularly at the Board, including economic updates, ‘deep dives’ into specific business units and standalone sessions dedicated to the external environment |
| Change | | | |
| People,
culture &
environment | | 1.Ongoing commitment from the Group Chief Executive, Group Executive Committee and the Board to ensure that the culture of accountability is demonstrated from the top 2.Continued focus on data, cyber, environmental issues and impact (including net zero) and inclusion and diversity | | 1.The Board and Committee paper templates were reviewed and training provided to authors to draw out purpose, values and culture discussions 2.Regular updates received on cultural transformation, including role of the senior leadership in driving values and behaviours. Senior leadership held to account through balanced scorecards and objectives 3.Regular updates, including ‘deep dives’ on data, cyber, environmental issues and inclusion and diversity |
| | | | | | | | |
143 | Lloyds Banking Group plc Annual Report on Form 20-F 2023 | |
Corporate governance continued
Board training
The Chair is responsible for leading the development, and monitoring the effective implementation, of training policies and procedures for the directors. On appointment, each director receives a formal and tailored induction. There is also a programme of ongoing training for directors.
The directors are committed to their own ongoing professional development and the Chair discusses training with each non-executive director at least annually. The Company Secretary oversees a training plan for the non-executive directors, with the plan for 2023 discussed at the Nomination and Governance Committee at the start of the year with the non-executive directors encouraged to suggest training topics of interest.
| | | | | | | | | | | | | | | | | | | | | | | | | | | | | | | | |
| Induction |
| New non-executive directors receive a tailored induction that focuses on the Group’s culture and values, stakeholders, strategy, structure, operations and governance with an emphasis on ensuring that the induction brings the business and its issues alive, taking account of the specific role the director has been appointed to fulfil and their skills and experience to date. | | An induction pack is provided containing key corporate documents and information relating to the Group covering aspects such as the role of a director (including relevant Group policies such as anti-bribery, conflicts of interest, expenses, gifts and hospitality and share dealing), the Board and its Committees, financials and strategy, governance, risk management, culture, shareholders and training. |
|
| | | | | | | | | | |
| | | | | | | | | | |
| Group training modules | | Committee training | | New role training | | Other training |
Non-executive directors are asked to complete training modules on a quarterly basis. In 2023, these modules were on: •Modern slavery •Fighting economic crime -advanced anti-bribery •Security •Conduct rules •Speak Up (the Group’s whistleblowing programme) | | Committee-specific training is agreed by Committee Chairs as and when needed such as that provided to the Audit and Risk Committee Forum – please read more at the bottom of this page. | | Directors who take on new roles, such as Cathy Turner taking over as Senior Independent Director and Chair of the Remuneration Committee, or change roles during the year attend induction or handover meetings in respect of those new roles. | | Training sessions have been offered across a range of topics of particular interest that were chosen to complement the Board agenda and facilitate advanced discussion. Where training was offered online, the sessions have been recorded and made available to all directors. The topics are produced based on the level of knowledge and experience of Board members. Key topics during 2023 included: •Group Customer Dashboard •Senior Managers and Certification Regime •Market abuse including disclosure of inside information •Consumer Duty •Recovery and resolution plans •Nature (sustainability and climate) •Data ethics •Tax In addition to the above, a board incident management exercise was undertaken. |
| | |
| | |
| | |
| | | | | |
| Audit and Risk Committee Forum for non-executive directors |
In November 2023 there was the second meeting of the Audit and Risk Committee Forum, which was attended by members of the Group, Insurance and Lloyds Bank Corporate Markets Audit Committees and Board Risk Committees as well as colleagues from the business.
| The aims of this informal forum were to have interactive discussion to gain a shared understanding and appreciation of common areas of interest and to network.
The topics discussed were risk and control environment, model risk management, supplier risk management and climate data. |
| | | | | | | | |
144 | Lloyds Banking Group plc Annual Report on Form 20-F 2023 | |
Corporate governance continued
Audit, risk and internal control
Audit and risk
There are formal policies and procedures in place designed to ensure the independence and effectiveness of the internal and external audit functions. Group Internal Audit is a single independent internal audit function, reporting to the Audit Committee. Further detail can be found in the sections headed ‘Group Internal Audit’ and ‘Auditor independence and remuneration’ on page 152. The Board has delegated a number of responsibilities to the Audit Committee, including monitoring and reviewing financial reporting, the effectiveness of internal controls and the risk management framework, whistleblowing, the internal audit process and the external auditor’s process. The Audit Committee reports regularly to the Board on its activities and its report for 2023, confirming how it has discharged its duties, can be found on pages 149 to 152. Requirements that the annual report is fair, balanced and understandable are considered during the drafting and reviewing process and the Board has concluded that the 2023 annual report meets this requirement. The Board is supported in this by its Audit Committee and a sign-off process involving different sections of the annual report being approved for inclusion by senior management, with additional review by the Group Disclosure Committee. Related information on the Company’s business model and strategy can be found on pages 3 to 14. The Board is responsible for the Group’s risk management and internal controls systems, including the determination of the nature and extent of risk the Company is willing to take. Risk is further managed through the Board-approved risk management framework, as discussed in the risk management report on pages 37 to 93. The Board Risk Committee assists the Board in fulfilling its risk governance and oversight responsibilities, including by the provision of advice to the Board on risk strategy and overseeing the development, implementation and maintenance of the Group’s overall risk management framework, strategy, principles and policies and its risk appetite. The Board Risk Committee reports regularly to the Board on its activities and its report for 2023, confirming how it has discharged its duties, can be found on pages 153 to 158. Internal control
Board responsibility
The Board is responsible for, and monitors, the Group’s risk management and internal control systems. These are designed to facilitate effective and efficient operations and to ensure the quality and integrity of internal and external reporting and compliance with applicable laws and regulations, and for the determination of the nature and extent of the principal risks the Group is willing to take in order to achieve its strategy. The directors and senior management are committed to maintaining a robust control framework as the foundation for the delivery of effective risk management. The directors acknowledge their responsibilities in relation to the Group’s risk management and internal control systems and for reviewing their effectiveness.
In establishing and reviewing the risk management and internal control systems, the directors carried out a robust assessment of the emerging and principal risks facing the Company, including those that would threaten its business model, future performance, solvency or liquidity and reputation, the likelihood of a risk event occurring and the costs of control. The process for identification, evaluation and management of the emerging and principal risks faced by the Group is integrated into the Group’s overall enterprise framework for risk. The risk identification, evaluation and management process is designed to also identify whether the controls in place result in an acceptable level of risk. At Group level, a consolidated risk report, risk appetite dashboard and report by the Chief Risk Officer are reviewed and regularly debated by the Group Risk Committee and the Board Risk Committee, with formal updates provided to the Board to ensure that they are satisfied with the overall risk profile, risk accountabilities and mitigating actions. The report and
dashboard provide a view of the Group’s overall risk profile, key risks and management actions, together with performance against risk appetite and an assessment of emerging risks which could affect the Group’s performance over the life of the operating plan. Information regarding the main features of the internal control and risk management systems in relation to the financial reporting process is provided within the risk management report on pages 37 to 93. Best practice in relation to risk management continues to evolve and throughout 2023 the Group has identified a number of enhancements to its risk management arrangements that are proposed to be implemented as part of continuous improvement. To support the Board’s approval, the Board Risk Committee has reviewed the 2023 plan and recommended approval of the proposals.
The Board Risk Committee and the Board concluded that the Group’s risk management arrangements throughout 2023 were adequate overall and provided assurance that the risk management systems put in place were responsive to the Group’s risk profile and strategy. The Board is confident that the enhancements proposed will ensure that the Group’s risk management arrangements will be sufficiently robust to meet developing risk management best practice for the future.
Control effectiveness review
All material controls are recorded and assessed on a regular basis in response to triggers or at least annually. Control assessments consider both the adequacy of their design and operating effectiveness. Where a control is not effective, the root cause is established and action plans implemented to improve control design or performance. Control effectiveness against all residual risks is aggregated by risk category, reported and monitored via the monthly Key Risk Insights or Consolidated Risk Report (CRR). The Key Risk Insights/CRR are reviewed and independently challenged by the Risk division and provided to the Risk Division Executive Committee and the Group Risk Committee. On an annual basis, a point in time assessment is made for control effectiveness against each risk category and across the sub-groups. The Operational Risk System, Key Risk Insights or CRR are the sources used for this point in time assessment and a year-on-year comparison on control effectiveness is reported to the Board Risk Committee and the Board.
Reviews by the Board
The effectiveness of the risk management and internal control systems is reviewed at least annually by the Board, the Board Risk Committee and the Audit Committee, which also receive reports of reviews undertaken by the Risk division and Group Internal Audit. The Audit Committee receives reports from the Company’s auditor, Deloitte LLP (which include details of significant internal control matters that they have identified) and has a discussion with the auditor at least once a year without executives present to ensure that there are no unresolved issues of concern. The Group’s risk management and internal control systems are regularly reviewed by the Board Risk Committee and the Board and are consistent with the Guidance on Risk Management, Internal Control and Related Financial and Business Reporting issued by the Financial Reporting Council. There is also an annual independent Control Effectiveness review by Group Internal Audit which is reviewed by the Board Risk Committee and the Audit Committee. These reports have confirmed they have been in place for the year under review and up to the date of the approval of the annual report. The Group, Ring-Fenced Bank sub-group and Lloyds Bank Corporate Markets have achieved full compliance with BCBS 239 risk data aggregation and risk reporting requirements and actively continue to maintain this status.
| | | | | | | | |
145 | Lloyds Banking Group plc Annual Report on Form 20-F 2023 | |
Corporate governance continued
Nomination and Governance Committee report
A persistent focus on succession planning helps ensure continuity of strong leadership
| | |
| Sir Robin Budenberg |
| Chair, Nomination and Governance Committee |
|
| Driving an increase in inclusion and diversity across the Board and executive remains a priority. |
| Key activities in 2023 |
• Board succession planning and recruitment • Board and Committee composition, skills and training • Senior executive succession planning • Board evaluation outcomes • Inclusion and diversity |
|
| Q&A |
Q. How have the activities of the Nomination and Governance Committee (the Committee) helped strengthen inclusion and diversity across the membership of the Board and its Committees? |
A. The Committee is responsible for overseeing the development of a diverse pipeline for succession at both Board and executive level. Inclusion continues to lie at the heart of the Group’s purpose and, in its ongoing assessment of the composition of the Board and its Committees, inclusion and diversity remain key considerations. Continuing to meet and exceed industry targets for Board diversity demonstrates our commitment, with the Committee’s role central to achieving this. Details of the Board diversity policy are set out on page 148 |
Q. What aspects of succession planning have the Committee focused on in 2023? |
A. Last year’s report highlighted that September 2023 would see Alan Dickinson having served nine years on the Board. Consequently, a key focus has been the succession arrangements for Alan’s roles, which led to Cathy Turner being appointed as Senior Independent Director during the year and the appointment of Nathan Bostock as a non-executive director to replace Alan’s core banking experience on the Board. Further consideration continues to be given to Board Committee membership as well as non-executive director recruitment. The Committee also considered succession planning for senior executives, building on the additional focus on this during 2022. See page 147 for more details. |
Q. What are the key areas of focus for the Committee in 2024? |
A. In addition to succession planning, the year ahead will see a focus on seeking to continue enhancing inclusion and diversity at both Board and executive levels. Composition of the Board and its Committees, and overseeing implementation of actions arising from the Board evaluation, will also be given appropriate attention. |
IntroductionAs highlighted in my introduction to the corporate governance report on page 126, Cathy Turner was appointed as Senior Independent Director during the year. Cathy’s appointment to this role helps demonstrate not only our commitment to diversity across the Board’s senior roles, but also how strong succession planning can, amongst other things, play its part in providing candidates for different Board roles. Beyond Board and executive succession planning, other key areas of focus for the Committee this year have included Board effectiveness and training, composition of the Board’s Committees and implementation of actions arising from the 2022
externally facilitated Board evaluation process. All of these areas are covered in more detail throughout this report.
Committee purpose and responsibilities
The purpose of the Committee is to keep the Board’s governance, composition, skills, experience, knowledge, independence and succession arrangements under review and to make appropriate recommendations to the Board to ensure the Company’s arrangements are consistent with the highest corporate governance standards.
Board and Committee changes
Alan Dickinson and Lord Lupton have notified the Board that they do not intend to seek re-election at this year’s annual general meeting having served nine and almost seven years respectively on the Board. Nathan Bostock will be appointed as a non-executive director and, subject to regulatory approval, Chair of Lloyds Bank Corporate Markets plc, in each case with effect from 1 August 2024. Cathy Turner succeeded Alan Dickinson as Senior Independent Director and also as Chair of the Remuneration Committee on 13 September 2023, at which point Alan ceased to be a member of the Remuneration Committee. At the same time, Cathy was appointed as a member of the Nomination and Governance Committee and, as announced on 25 January 2024, Cathy was appointed as a member of the Board Risk Committee with effect from 1 February 2024. Details of the selection process for Cathy’s appointment as Senior Independent Director can be found on page 148. As announced on 18 December 2023, Amanda Mackenzie was appointed as a member of the Audit Committee with effect from 1 January 2024. Succession planning
Consideration has been given to tenure of Board members and potential future Board retirements and the impact of these on membership of the Board and its Committees, with particular attention given to succession arrangements for Alan Dickinson and Lord Lupton, as detailed above. The Committee’s ongoing review of the structure, size and composition of the Board and its Committees helps ensure that the appropriate mix of knowledge, skills, experience and diversity is maintained. A summary of Board and Committee composition and attendance can be found on page 131. The Committee also continues to consider the overall health and diversity of the executive talent pipeline, together with detailed executive succession planning. Key considerations include, for example, cultural and strategic capabilities which will help deliver the strategic aims of the Group’s transformation programme. Further details on the Committee’s approach to succession planning can be found on page 147. Board effectiveness and training
An internally facilitated Board evaluation has been conducted this year, overseen by the Committee. Full details of how the review was undertaken, and its outcomes, are provided on page 142, together with a summary of progress against the actions arising from the 2022 external Board evaluation process carried out by Dr Tracy Long on page 143. The Committee considered the outcomes of the review and agreed, and recommended to the Board for approval, the actions arising from the review. During 2024, the Committee will continue to oversee implementation of the remaining actions from the 2022 review, together with outcomes from the 2023 review. The Committee has also undertaken an annual review of its effectiveness, the findings of which, together with the outcomes of the Board evaluation process as relevant to the Committee, were considered by the Committee at its January 2024 meeting; it was considered that the performance of the Committee continues to be effective. The Committee also oversees training undertaken by the non-executive directors. The Chair discusses training with each non-executive director at least annually and, as set out in the summary of Board training on page 144, training sessions have been offered across a range of topics which complement the Board agenda, in addition to mandatory training requirements. Learning and engagement opportunities have been undertaken by all non-executive directors in relation to material aspects of the Group’s business. | | | | | | | | |
146 | Lloyds Banking Group plc Annual Report on Form 20-F 2023 | |
Corporate governance continued
Independence and time commitments
Based on its assessment for 2023, the Committee is satisfied that, throughout the year, all non-executive directors remained independent1 in character and judgement, and are independent directors for the purposes of the Code. Having served nine years on the Board in September 2023, the Committee gave specific and particularly rigorous consideration to Alan Dickinson’s independence. On the basis of the continued robust and constructive challenge and oversight provided in his role, facilitated by his deep knowledge of the Group and significant retail and commercial banking experience, the Committee confirmed Alan’s continued independence as a non-executive director. During the processes leading to the appointment of Cathy Turner as Senior Independent Director, consideration was given to Cathy’s independence and overall time commitments to ensure that her other appointments could continue to be appropriately accommodated. Nathan Bostock’s independence was considered as part of the appointment process and it was determined that he would be independent for the purposes of the Code. As discussed on page 140 of the corporate governance report, consideration is also given to time commitments when directors seek to take on any additional external appointments. In recommending directors for re-election at the annual general meeting, the Committee has reviewed the performance of each non-executive director and their ability to continue meeting the time commitments required, taking into consideration individual capabilities, skills and experiences and any potential conflicts of interest that have been disclosed. The external roles held by all directors were considered to be appropriate.
The Group’s Corporate Governance Framework
The most recent annual review of the Corporate Governance Framework was finalised in April 2023. This review continued to build upon the simplification of the framework achieved during 2022, while ensuring it remains compliant with relevant obligations and best practice.
As part of its broader governance responsibilities, the Committee considered regular updates on developments in corporate governance during the year, including the Edinburgh Reforms, the Financial Reporting Council’s consultation on proposed changes to the UK Corporate Governance Code, FCA and PRA consultations on Diversity & Inclusion in the financial sector and the Economic Crime and Corporate Transparency Act 2023. The Committee also considered correspondence with shareholders on governance issues.
UK Corporate Governance Code
The Company applied the UK Corporate Governance Code 2018 for the year ending 31 December 2023 and complied with all the provisions. A table in relation to the Company’s compliance can be found on page 127. The Committee reports to the Board on how it discharges its responsibilities and makes recommendations to the Board, all of which have been accepted during the year. The Committee’s terms of reference can be found on our website at www.lloydsbankinggroup.com/who-we-are/group-overview/corporate-governance.
Committee composition, skills and experience
To ensure a broad representation of experienced and independent directors, membership of the Committee currently comprises the Chair, Deputy Chair, Senior Independent Director (who is also the Chair of the Remuneration Committee) and the Chair of the Responsible Business Committee, together with a further independent non-executive director (who is the Chair of Scottish Widows Group). The Senior Independent Director of the Ring-Fenced Banks also attends meetings as an observer in order to provide insights on matters relevant to the Ring-Fenced Banks when required and as part of his role in the Group’s overall governance structure.
The Group Chief Executive attends meetings as appropriate. Details of Committee membership and meeting attendance during the year can be found on page 131. 1.The Chair was independent on appointment. Under the Code, thereafter the test of independence is not appropriate in relation to the Chair.
Succession planning, at both Board level and across key senior management roles, continued to be a core area of consideration for the Committee during 2023, with a particular focus on succession arrangements for Alan Dickinson.
Effective succession planning assists the Group in delivering on its strategic objectives over the medium and longer term by ensuring the desired mix of skills and experience of Board members and executives, this being particularly important as we continue to drive forward delivery of the Group’s strategic and cultural transformation. The Board remains committed to ensuring the development of a diverse pipeline of current and future leaders across the Group’s executive and management levels, through the provision of a range of development opportunities.
At an executive level, the Chair is responsible for developing and maintaining a succession plan for the Group Chief Executive who is, in turn, primarily responsible for developing and maintaining succession plans for key leadership positions in the senior executive team. As part of its regular oversight and review of the adequacy and effectiveness of succession arrangements for executive directors and members of the senior executive, the Committee received and discussed regular updates from the Group Chief Executive covering executive succession planning arrangements. These demonstrated the continuing strength and effectiveness of the Group’s senior management succession planning, through the depth and diversity of the succession plans covering key senior management roles.
The Committee also supports the Chair in keeping the composition of the Board and its Committees under regular review and in leading the appointment process for nominations to the Board. This helps ensure continued focus on increasing the overall diversity of the Board and capacity for future succession planning, bearing in mind tenure of Board members and potential future retirements from the Board. The appointment process set out on the following page helps illustrate how this works in practice. In contemplating succession arrangements for Alan Dickinson as Senior Independent Director, the Committee considered both external and internal candidates, before making the recommendation to the Board that Cathy Turner be appointed as Senior Independent Director. Cathy’s breadth of executive and non-executive experience was a key factor, helping demonstrate the strength of our succession planning arrangements and recruitment processes. In addition to the appointment of Nathan Bostock, the Committee continues to give consideration to the appointment of further non-executive representation to the Board.
The Chair leads an ongoing assessment of the Board’s technical and governance skill set, on both an individual and collective basis, using a Board skills matrix to track the Board’s strengths and to identify any gaps in the desired collective skills profile of the Board. Consideration is given to a range of factors such as the Group’s future strategic direction and helping to ensure that due weight is given to diversity in its broadest sense. The skills matrix is considered in the appointment of all Board members. The Group’s diversity commitments and outcomes of the Board evaluation process are also taken into consideration.
Succession planning also plays a key role in the recognition and promotion of diversity across the Board and senior management, further supported by a range of policies across the Group which promote the engagement of under-represented groups within the business in order to help continue to build a diverse talent pipeline.
| | | | | | | | |
147 | Lloyds Banking Group plc Annual Report on Form 20-F 2023 | |
Corporate governance continued
| | |
| Appointment process – non-executive directors |
The Committee leads the process for the appointment of non-executive directors, making recommendations to the Board for the appointment of preferred candidates. The process involves open advertising and the engagement of an external search firm to assist with the identification of potential candidates, based on criteria identified by the Committee. This generates a list of potential candidates for consideration, from which a short list of candidates is selected who are then interviewed by the Chair, with further interviews and meetings then being held with other members of the Board, as deemed appropriate. After further consideration the Committee makes its recommendations to the Board for formal approval. This is a formal, rigorous and transparent process, leading to appointments being made on merit and objective criteria, with due consideration being given to a broad range of factors such as diversity of gender, social and ethnic backgrounds, cognitive and personal strengths and the Group’s future strategic direction.
There were no additional non-executive directors appointed to the Board during 2023. The process described above has been followed in the appointment of Nathan Bostock; the Group will report further on that appointment process in its 2024 annual report.
The Committee gave particular consideration to the Senior Independent Director role recognising that, by September 2023, Alan would have served nine years on the Board. The Committee delegated authority to the Chair to lead the formal interview and selection process for this role and, supported by Alan, consideration was given to both external and internal candidates against criteria identified by the Committee. Russell Reynolds Associates, who were engaged in the process of identifying external candidates for consideration, as well as the process which resulted in Nathan Bostock’s recruitment, have no connection with the Group or individual directors other than conducting leadership search and succession planning services and facilitating leadership performance services. The Committee was kept informed on progress and discussions were held with other Board members, from which the consensus view was a preference for an internal candidate, unless a significantly stronger external candidate was identified. The Chair subsequently canvassed all directors for their views and interviewed the candidates for the role, before the matter was further discussed by the Committee. This led to the Committee’s recommendation, and the Board’s approval, of the appointment of Cathy Turner as Senior Independent Director.
Board diversity policy
The Board diversity policy (the Policy) sets out the Board’s approach to diversity and provides a high-level indication of the Board’s approach to inclusion and diversity in senior management roles which is governed in greater detail through the Group’s policies.
The Board places great emphasis on ensuring that its membership reflects diversity in its broadest sense. Consideration is given to the combination of demographics, skills, experience, race, age, gender, educational and professional background and other relevant personal attributes on the Board to provide the range of perspectives, insights and challenge needed to support good decision making.
New appointments are made on merit, taking account of the specific skills and experience, independence and knowledge needed to ensure a rounded Board and the diverse benefits each candidate can bring to the overall Board composition.
Objectives for achieving Board diversity are reviewed on a regular basis. On gender diversity, the Board is committed to maintaining at least four women Board members and over time will aim to reach 50 per cent representation of men and women on the Board to match the 50 per cent ambition that the Group has set for women in senior roles. Reflecting these aspirations, the Board will also aim to meet the recommendations set out by the FTSE Women Leaders. Currently, this Policy is not applied to Board Committees individually, although we strive to apply similar representation across the Committees. The Board is comfortable that the diversity of the Board is reflected across Committee memberships and that this remains an ongoing consideration. The representation of women on the Board is currently 45 per cent (based on five directors being women and six directors being men). As at 31 December 2023, the Group meets the three board diversity targets identified under Listing Rule 9.8.6R(9), namely that the Board comprises at least 40 per cent women, at least one of the chair, the chief executive, the senior independent director or the chief financial officer is a woman and at least one member of the Board is from a Minority Ethnic background.
The Group has also set a target of 13 per cent of senior roles to be held by Black, Asian and Minority Ethnic executives by 2025. The Board will therefore aim to reflect this goal with regard to Board members. As at 31 December 2023, the Board continues to meet the Board level recommendation of the Parker Review with two Black, Asian and Minority Ethnic Board members. As noted, the Board places high emphasis on ensuring the development of diversity in the senior management roles within the Group and supports and oversees the Group’s ambition of achieving 50 per cent of senior roles held by women by 2025 and of 13 per cent of senior roles held by Black, Asian and Minority Ethnic colleagues by 2025 (including a minimum of 3 per cent of senior roles being held by Black Heritage colleagues). This is underpinned by a range of policies within the Group to help provide mentoring and development opportunities for women and Black, Asian and Minority Ethnic colleagues and to ensure unbiased career progression opportunities. Progress on this objective is monitored by the Board and built into its assessment of executive performance.
As at 31 December 2023, the representation of women within the Group Executive Committee and their direct reports was 46.2 per cent in total (with 46.7 per cent for the Group Executive Committee and 46.2 per cent for their direct reports). The representation of women across all senior roles was 40.1 per cent, and Black, Asian and Minority Ethnic representation in senior roles was 11.3 per cent. The Group’s Race Action Plan, which was launched during 2020, aims to drive cultural change, recruitment and progression across the Group. This includes a goal to increase Black representation in senior roles from 0.6 per cent to at least 3 per cent by 2025. As at 31 December 2023, we have increased the representation of Black Heritage colleagues in senior roles to 1.7 per cent.
A copy of the Policy is available on our website at www.lloydsbankinggroup.com/who-we-are/responsible-business/downloads.
| | | | | | | | |
148 | Lloyds Banking Group plc Annual Report on Form 20-F 2023 | |
Corporate governance continued
Audit Committee report
The integrity of our financial disclosures and the effectiveness of the internal control environment are key priorities for the Group
| | |
|
| Sarah Legg |
| Chair, Audit Committee |
|
| The Group’s IFRS 17 transition and the impacts of external volatility have been key priorities during the year |
• Reviewing and approving the Group’s IFRS 17 transition document published in April 2023 and the new IFRS 17 disclosures included within the Group’s annual report and accounts
• Supporting the close working of the Committees of the Board on matters relevant to sustainability
• Assessing the effects and action required on matters relevant to the remit of the Audit Committee (the Committee) as a consequence of external volatility
| | |
| Q&A |
Q. What role has the Committee played in supporting transformation within the Finance function ? |
A. The Committee has had the opportunity to review and challenge the plans and progress made with the Finance transformation and strategy, a multi-year programme that is critical to the success of Finance and the wider Group. The Committee has received regular updates from management on progress with the Finance transformation and has also heard from Internal and External Audit. The Committee has also had the opportunity to consider further areas which are key to supporting the transformation, including finance talent and succession plans. |
Q. How has the Committee supported the Group’s sustainability reporting during the year? |
A. Throughout the year, the Committee has remained close to the developments in narrative reporting and how this is continuing to translate into financial statement disclosures. Progress on enhanced reporting processes and control environment across the social and environmental spectrum has been monitored, alongside development of new targets through to internal monitoring and external disclosure. The Committee supports the commitment to continuous improvement in sustainability reporting, which will remain a priority in 2024 given the pace of change with external standards. |
Q. Why has the work of the Committee been important in managing the impact of uncertainty on the Group’s pension schemes? |
A. With an uncertain economic environment, including increased interest rates, the Committee continued to focus on the key valuation inputs to the accounting presentation of the Group’s pension schemes. This included consideration of the underlying assumptions, in particular those relating to demographics and rates of inflation. The Committee noted the results of the triennial valuation of the main schemes as at 31 December 2022, which were also shared with the Board. |
Introduction
I am pleased to report on how the Committee has discharged its responsibilities during what has been another busy year and I would like to start by thanking Committee members for their ongoing contributions to and continued support of the Committee’s work. The Committee has also benefited from the participation of Ring-Fenced Bank-only directors, who attend the Committee as observers, bringing insight on matters relevant to the Ring-Fenced Banks. Also, I would like to welcome Amanda Mackenzie, who became a member of the Committee on 1 January 2024.
The Committee has again during 2023 worked closely with other Board Committees, in particular in matters relating to the Group’s sustainability ambitions and climate-related disclosures. I am pleased to report that the joint Audit and Risk Forum, which was formed in 2022 to discuss governance topics of common interest, met again in 2023 providing an opportunity for both Committees to share thinking on areas of common interest.
Looking forward to 2024, in addition to our core responsibilities, the Committee will continue to monitor areas of continuous improvement on an end-to-end basis, and the audit plan to deliver focus from a risk perspective.
Committee purpose and responsibilities
The purpose of the Committee is to monitor and review the formal arrangements established by the Board in respect of the integrity of the financial reporting and narrative reporting of the Group and the Company. The Committee also monitors and reviews the independence and effectiveness of the internal and external audit functions, the effectiveness of the internal controls and the risk management framework and the adequacy and security of the arrangements for whistleblowing.
This includes the statutory audit of the consolidated financial statements and the independence of the statutory external auditor. The Committee reports to the Board on how it discharges its responsibilities and makes recommendations to the Board, all of which have been accepted during the year. A full list of responsibilities is detailed in the Committee’s terms of reference, which can be found at www.lloydsbankinggroup.com/who-we-are/group-overview/corporate-governance. In satisfying its purpose, the Committee undertakes the functions detailed within Disclosure Guidance and Transparency Rule 7.1.3R. During the year the Committee considered a number of matters relating to the Group’s financial reporting. These matters are summarised on the following pages, including discussion of the conclusions the Committee reached, and the key factors considered in reaching these conclusions. In addition, the Committee considered a number of other matters not related directly to financial reporting, including internal controls, internal audit and external audit. These matters are also discussed in detail on the final page of the report.
Committee composition, skills, experience and operation
The Committee acts independently of the executive to ensure the interests of shareholders are properly protected in relation to financial reporting and internal control.
All members of the Committee are independent non-executive directors with competence in the financial sector, and their biographies can be found on pages 96 to 99. Sarah Legg is a Fellow of the Chartered Institute of Management Accountants and of the Association of Corporate Treasurers, with extensive knowledge of financial markets, treasury, risk management and international accounting standards. She is a member having recent and relevant financial experience for the purposes of the UK Corporate Governance Code and is the Audit Committee financial expert for SEC purposes. During the course of the year, the Committee held separate sessions with the internal and external audit teams, without members of the executive management present.
The Committee undertook an annual review of its effectiveness, the findings of which, together with the outcomes of the Board evaluation process as relevant to the Committee (which, for 2023, was internally facilitated) were considered by the Committee at
| | | | | | | | |
149 | Lloyds Banking Group plc Annual Report on Form 20-F 2023 | |
Corporate governance continued
its January 2024 meeting. It was considered that the performance of the Committee continues to be effective. .
While the Committee’s membership comprises the non-executive directors noted on page 99, all non-executive directors may attend meetings as agreed with the Chair of the Committee. The Group Financial Controller, Chief Internal Auditor, the external auditor, the Group Chief Executive, the Chief Financial Officer and the Chief Risk Officer also attend meetings as appropriate. Details of Committee membership and meeting attendance can be found on page 131. | | | | | | | | | | | | | | | | | | | | |
| Matters considered during 2023 |
| | | | | | |
| Jan | Feb | Apr | Jun | Jul | Oct |
| Reporting | |
| Review of external reporting documents | o | o | o | o | o | o |
| Significant accounting judgements | o | o | o | o | o | o |
| Going concern assumption | o | o | o | o | o | o |
| Regulatory reporting | o | o | o | o | o | o |
| Sustainability-related reporting | o | o | o | o | o | o |
| Activities of subsidiary audit committees | o | o | o | o | o | o |
| Updates on IFRS 17 | o | o | o | o | o | o |
| Audit and corporate governance reforms | o | o | o | o | o | o |
| | | | | | |
| Control environment | |
| Control update (including Sarbanes-Oxley) | o | o | o | o | o | o |
| Annual review of risk management framework and control effectiveness review summary | o | o | o | o | o | o |
| | | | | | |
| Group Internal Audit | |
| Reports from Group Internal Audit, including Speak Up (whistleblowing) | o | o | o | o | o | o |
| | | | | | |
| External audit | |
| Reports from the external auditor (including external audit plan) | o | o | o | o | o | o |
| Reappointment, remuneration, non-audit services and effectiveness | o | o | o | o | o | o |
| | | | | | |
| Other | | | | | | |
| Audit Committee effectiveness review | o | o | o | o | o | o |
| Finance strategy and transformation | o | o | o | o | o | o |
Financial reporting
During the year, and in relation to the year ended 31 December 2023, the Committee considered the following issues in relation to the Group’s financial statements and disclosures, with input from management, the Risk division, Group Internal Audit and the external auditor.
| | | | | | | | | | | | | | |
| Areas of focus |
|
| | Key issues | | Committee review and conclusion |
| | | | |
Allowance for impairments on loans and advances 31 December 2023: £4,084 million 31 December 2022:£4,903 million | | The Group’s impairment provision is dependent on management’s judgements on matters such as future interest rates, house prices and unemployment rates, as well as its assessment of the current financial position of its customers. | | During the year, the Committee has reviewed the level of provision held for expected credit losses (ECL) by the Group and the judgements and estimates used to calculate the provision. The most significant judgemental adjustment in 2023 has been in respect of inflationary pressures and interest rate risk. The Group continues to benefit from investment in ECL models, overseen by the Committee, to deliver impact assessments and sensitivity analysis more quickly and accurately. This has been particularly relevant given the constantly changing economic outlook in 2023. Note 24 to the financial statements includes details of the Group’s ECLs allowances, including those resulting from judgemental adjustments (31 December 2023: £28 million; 31 December 2022: £330 million), and a discussion of the improvements the Group has made to its consideration of climate risk on the ECL. The Committee has reviewed management’s rationale for these provisions and has challenged whether their inclusion and quantification are appropriate. It also considered management's assessment of climate risk impacts on ECL and the conclusion that no adjustment was required. Conclusion: The Committee was satisfied that the impairment provision and the disclosures provided in the financial statements were appropriate. |
| | | | | | | | |
150 | Lloyds Banking Group plc Annual Report on Form 20-F 2023 | |
Corporate governance continued
| | | | | | | | | | | | | | |
| | Key issues | | Committee review and conclusion |
| | | | |
| Going concern | | The directors are required to confirm whether they have a reasonable expectation that the Company and the Group will be able to continue to operate and meet their liabilities as they fall due for a specified period. | | The Committee assisted the Board in determining the appropriateness of adopting the going concern basis of accounting. These assessments were based on the Group’s operating, funding and capital plans which included consideration of climate-related matters on the Group’s performance and its projected funding and capital position. The Committee also took into account the results of the Group’s stress testing activities (page 42), its principal risks (page 32 to 35) and its emerging risks (page 36) Conclusion: The Committee determined that the going concern basis of accounting was appropriate. |
| | | | | | | | | | | | | | |
| | | | |
| Uncertain tax provisions | | The Group has open tax matters which require it to make judgements about the most likely outcome for the purposes of calculating its tax position. | | The Committee reviewed management’s assessment of the Group’s uncertain tax positions, which took into account the views of the relevant tax authorities and any external advice it received. In particular, it considered the Group’s claim for group relief of losses incurred in its former Irish banking subsidiary. Conclusion: The Committee was satisfied that the provisions and disclosures made in respect of uncertain tax positions were appropriate. |
| | | | |
| | | | |
Retirement benefit obligations 31 December 2023: £30,201 million 31 December 2022: £28,965 million | | The value of the Group’s defined benefit pension plan obligations is determined using both financial and demographic assumptions. | | The Committee reviewed the process used by management to determine appropriate assumptions to calculate the Group’s defined benefit liabilities. These included the discount rate, the future rate of inflation and expected mortality rates. Conclusion: The Committee was satisfied that management had used appropriate assumptions that reflected the Group’s most recent experience and were consistent with market data and other information. |
| | | | |
| | | | |
Insurance liabilities 31 December 2023: £120,123 million 31 December 2022: £110,278 million | | Determining the value of the Group’s liabilities arising from insurance and participating investment contracts requires management to make significant estimates for both economic and non-economic actuarial assumptions. | | The Committee considered updates from management and from the Group’s Insurance Audit Committee summarising its activities, which included a review of the economic and non-economic assumptions made by management to determine the carrying value of Group’s liabilities arising from insurance and participating investment contracts. The assumptions discussed were in respect of workplace pension persistency, annuitant longevity and expenses. Conclusion: The Committee was satisfied that the assumptions used to calculate the Group’s liabilities arising from insurance and participating investment contracts were appropriate. |
| | | | |
| | | | |
Conduct risk provisions Year ended 31 December 2023: £675 million Year ended 31 December 2022: £255 million | | Management judgement is used to determine the expected costs of remediation and, where appropriate, the related administration costs. | | The Committee has received regular updates on the Group’s conduct risk matters and the progress it has made including updates on HBOS Reading and in relation to the recently announced FCA review of historical motor finance commission arrangements. Conclusion: The Committee has considered management’s assessment of the Group’s provision for conduct-related matters and was satisfied that the provisions were appropriate, noting a high level of uncertainty in relation to these estimates. |
| | | | |
| | | | |
Other significant matters
The following matters were also considered by the Committee.
Risk management and internal control systems
Full details of the internal control and risk management systems in relation to the financial reporting process are given within the risk management section on pages 37 to 93. Specific related matters that the Committee considered for the year included: •The effectiveness of systems for internal control, financial reporting and risk management
•The extent of the work undertaken across the Group to ensure that the control environment continued to operate effectively
•The major findings of internal investigations into control weaknesses, fraud or misconduct and management’s response, along with any control deficiencies identified through the assessment of the effectiveness of the internal controls over financial reporting under the US Sarbanes-Oxley Act (SOX). Specifically the Committee continued to closely
monitor the deficiencies identified in respect of privileged and user access across certain business applications and associated IT infrastructure and the Group’s plans to address the control findings identified.
The Committee was satisfied that internal controls over financial reporting were appropriately designed and operating effectively
Risk-weighted assets (RWA) and regulatory reporting
The focus on the quality of regulatory reporting continues to be high on the PRA’s agenda. To date, a number of skilled person independent reviews have been commissioned across the industry to review the governance, controls and processes supporting the regulatory reporting framework within firms. Across the first, second and third lines of defence management continue to focus on strengthening the control environment in regulatory reporting with a link to longer-term and strategic initiatives also being considered.
| | | | | | | | |
151 | Lloyds Banking Group plc Annual Report on Form 20-F 2023 | |
Corporate governance continued
The ongoing programme of external assurance on regulatory reporting commissioned by the Committee has to date focused on risk-weighted assets. Management have provided regular updates to the Committee over the year to highlight progress made in improving the reporting control environment across a number of regulatory reports.
IFRS 17
The Committee has received updates throughout the year on both the financial and controls impact of the Group’s adoption of IFRS 17. It reviewed the Group’s transition document published in April 2023, which included the significant judgements and estimates, including those relating to the drawdown feature added to some of the Group’s pension products, that affect the reported amounts and the accounting policy choices made by the Group.
Restoring trust in audit and corporate governance
During the year the Committee has received updates on the responses of the Government and the Financial Reporting Council (FRC) to the white paper ‘Restoring trust in audit and corporate governance’. The Committee recognises the importance of an effective corporate reporting and governance framework that is proportionate and does not significantly impact the attractiveness of the UK as a place to do business. The Committee is supportive of the Government’s decision to withdraw the draft Companies (Strategic Report and Directors’ Report) (Amendment) Regulations 2023 so that it can deliver a more targeted, simpler and effective framework for both businesses and investors.
The Group notes that on 22 January 2024 the FRC issued a revised UK Corporate Governance Code which will be effective from 1 January 2025 apart from the updates to the provision on the monitoring and review of a company’s risk management and internal control framework which are effective from 1 January 2026.
Speak Up (the Group’s whistleblowing service)
The Committee received and considered reports from management on the Group’s whistleblowing arrangements. The Committee reviewed the reports to ensure there are arrangements in place which colleagues can use in confidence and without fear of retaliation. In addition, colleagues are able to report concerns about inappropriate and unacceptable practices; these arrangements are well publicised and there is proportionate and independent investigation of such matters or appropriate follow-up. The Committee reported on its consideration of whistleblowing arrangements to the Board.
Sustainability reporting
The Committee discussed and challenged the Group’s progress with sustainability related reporting. Developments in UK companies regulation requirements for climate-related financial disclosure alongside emerging environmental sustainability reporting frameworks have been considered, assessing the near term and future impacts on external disclosures. As previously, the Committee benefited from a dedicated teach-in session focusing on the Group’s capabilities and progress with the production of climate and sustainability reporting and associated data, the enhanced control environment, and the developments with governance and assurance. Further discussion on sustainability governance can be found on pages 136 to 137. Group Internal Audit
In monitoring the activity, role and effectiveness of the internal audit function and their audit programme the Committee:
•Approved the annual audit plan and budget, including resource
•Reviewed progress against the plan through the year with updates including quarterly reports on the activities undertaken and six-monthly updates as a result of reviews by the internal audit Quality Assurance team
•Considered the major findings of significant internal audits, and management’s response
•Monitored the progress of internal audit’s coverage of key risk themes across the Group, including Strategic Delivery, Cultural Transformation, Cost of Living, Consumer Duty, Supplier
Partnerships, Capital Efficiency, Transition to Net Zero and Data Quality
•Continued to monitor completion of enhancements identified by the third party who assessed the effectiveness of the internal audit function in 2021
Finance strategy and transformation
Significant investment has been committed to transform the Finance function, including the near-term deliverables of a new General Ledger across the Group in 2025 in addition to the transformation of processes and procedures across the financial data landscape and costs and investment management. This multi-year transformation journey incorporates significant improvements and efficiencies to the Group, with the Committee receiving timely updates with regard to the proposed plans, progress with them, and the associated financial and non-financial benefits.
Auditor independence and remuneration
The Committee is responsible for establishing the Group’s policies and procedures designed to protect the independence and objectivity of the external auditor. In April 2023, the Committee reviewed its non-audit services policy; no substantive changes were made to the policy.
The policy details those services that the auditor is permitted to carry out and pre-approves certain of these services provided the fee is below a threshold; all other permitted services must be specifically approved in advance by the Committee. Prior to the engagement of the auditor for a permitted service, the policy requires that senior management confirms whether the Committee has pre-approved the service or specific approval is required. The total amount of fees paid to the auditor for both audit and non-audit related services in 2023 and further information on the policy is disclosed in note 17 to the financial statements.
External auditor
Following an external audit tender in 2018, Deloitte LLP (Deloitte) was appointed as auditor of the Company and the Group with effect from the 2021 financial year. Mike Lloyd is the statutory audit partner for the Group and attends all meetings of the Committee. The Committee oversees the relationship with the external auditor including its terms of engagement and remuneration and monitors its independence and objectivity. During 2023, the Committee reviewed Deloitte’s audit plan, including the underlying methodology, and Deloitte’s risk identification processes. In its assessment of Deloitte’s performance and effectiveness, the Committee has considered: Deloitte’s interactions with the Committee; the responses to a questionnaire issued to the Group’s businesses, Finance, Risk and Internal Audit; and the FRC’s Audit Quality Inspection Report published in July 2023. The Committee concluded that it was satisfied with the auditor’s performance and recommended to the Board a proposal for the reappointment of the auditor at the Company’s annual general meeting.
Statutory Audit Services compliance
The Company and the Group confirm compliance with the provisions of The Statutory Audit Services for Large Companies Market Investigation (Mandatory Use of Competitive Tender Processes and Audit Committee Responsibilities) Order 2014, which relates to the frequency and governance of tenders for the appointment of the external auditor and the setting of a policy on the provision of non-audit services, for the year to 31 December 2023. There are no plans as at the date of this report to conduct a tender exercise for external audit services.
Audit Committees and the External Audit: Minimum Standard
While not mandatory the Group is broadly compliant with Audit Committees and the External Audit: Minimum Standard published by the FRC in May 2023.
| | | | | | | | |
152 | Lloyds Banking Group plc Annual Report on Form 20-F 2023 | |
Corporate governance continued
Board Risk Committee report
Operational resilience and sound risk management are fundamental to the strength of the Group
| | |
| Catherine Woods |
| Chair, Board Risk Committee |
|
| Delivery of the Group’s strategic and cultural transformation will help strengthen the management of risks which have the potential to impact the Group and its customers. |
| | |
| Key activities in 2023 |
•Overseeing the Group’s strategic transformation and management of change and execution risks •Considered the impacts of the rising cost of living, higher interest rates and inflation, macroeconomic uncertainties, and geopolitical risks on both the Group and its customers •Overseeing the embedding of the Group’s operational risk and control framework and discussing evolution of the broader risk framework •Assessing the management of operational resilience risks, including cyber, supply chain management and technology risks, data risks and artificial intelligence •Overseeing management of financial crime risks and consumer fraud •Overseeing continued progress on the Group’s climate risk framework and net zero transition •Reviewing management of the Group’s funding and liquidity risks including structural hedge activity •Assessment of key emerging risks and oversight of strategic risks |
| | |
| Q&A |
Q. How has the Board Risk Committee (the Committee) assessed the challenges and uncertainties of the external environment, and the potential impacts of these on the Group’s strategy and its customers? |
A. The Committee is acutely aware of the breadth of challenges which the external environment and ongoing macroeconomic and geopolitical uncertainties continue to present. The Committee continues to use deep dives to focus on specific topics of interest. Areas such as credit and market risk, and the associated impacts of continued high interest rates and inflation, climate risk, cyber and data risks and economic crime prevention have all featured highly on the Committee’s agenda during the year, with consideration being given to actions being taken by management to not only mitigate risks, but to ensure appropriate support for customers and businesses. Further information is set out on the following pages, within the commentary on each risk type. |
Q. In recognition of the external environment, what further consideration has the Committee given to progress with implementation of the Group’s strategic transformation and how successful delivery of the transformation could be impacted? |
| | |
A. The Committee received regular progress updates on the Group’s strategic transformation throughout the year. It also considered a number of deep dives on the Group’s control environment, together with a range of areas core to ensuring the Group’s operational resilience is maintained. This ensures the Committee has an appropriate view of overall progress and visibility of core areas such as the Group’s critical business processes and important business services. These updates and deep dives provide the Committee with the opportunity to challenge management on progress and action being taken to mitigate risks. Further information on a number of these areas is covered throughout this report. |
Q. What are the key areas of focus for the Committee in 2024? |
| A. The Committee will continue to focus on broadly the same areas as have been central to its discussions this year. As part of the Committee’s forward planning of activities, regular reviews are undertaken of areas that the Committee wishes to give additional focus to through, for example, the use of deep dives. This provides an appropriate balance between forward planning and flexibility, helping ensure focus on the Group’s most material risk types and any other areas of specific interest. The year ahead will see a broad range of topics covered, with these anticipated to include areas such as operational resilience, the Group’s control environment, credit reviews in key sectors, climate risk and people risks, amongst others. |
Introduction
I am pleased to report on how the Committee has discharged its responsibilities during the year and would like to thank fellow Committee members for their valued contributions throughout the year. I also take this opportunity to welcome Cathy Turner, who was appointed as a member of the Committee with effect from 1 February 2024. The external environment continued to present a variety of challenging, and evolving, considerations for the Committee, with areas such as cost of living and continued high interest rates, inflationary pressures and macroeconomic uncertainties which notably included the failure of a small number of banks, driving impacts across the broader economy.
The Committee has continued to focus on risks related to delivery of the Group’s strategy, including various aspects of operational and technology resilience, data and cyber risks, people risks and supply chain management, together with overall change and execution risk. Additional oversight is also given to a number of these areas through the IT and Cyber Advisory Forum, which supports the Committee.
Consideration has also been given to credit risk, with deep dives across various areas of the business, alongside regular reporting and updates from the Chief Risk Officer assessing the overall credit environment and economic crime where the Committee considered the impacts and mitigating actions being taken. The Committee was also kept updated on progress with implementation of the Group’s Consumer Duty Programme and progress on new prudential modelling requirements relating to credit risk capital models and market risk models. Each of these areas is covered in more detail throughout this report.
Committee purpose and responsibilities
The Committee assists the Board in fulfilling its risk governance and oversight roles and responsibilities. The Committee is also responsible for ensuring the risk culture is fully embedded and supports at all times the Group’s agreed risk appetite, including the extent and categories of risk which the Board considers as acceptable for the Group to bear. A review and update of the Committee’s terms of reference was completed during the year, with no material changes being made.
The Committee is responsible for reviewing and reporting its conclusions to the Board on the Group’s risk management framework, which captures risk principles, policies, methodologies, systems, processes, procedures and people. This also includes the review of new, or material, amendments to risk principles and policies and overseeing any action resulting from material breaches of such policy. During the year, the Committee
| | | | | | | | |
153 | Lloyds Banking Group plc Annual Report on Form 20-F 2023 | |
Corporate governance continued
discussed the development of the Group’s broader risk management framework and risk taxonomy, which will be an area of further focus in 2024.
More details on the Group’s wider approach to risk management can be found in the risk management section on pages 37 to 93. Full details of the Committee’s responsibilities are set out in its terms of reference, which can be found on our website at www.lloydsbankinggroup.com/who-we-are/group-overview/corporate-governance. Committee composition, skills, experience and operation
There were no changes to the membership of the Committee during the year. As announced on 25 January 2024, Cathy Turner, Senior Independent Director, was appointed as a member of the Committee with effect from 1 February 2024. Two of the three designated independent non-executive directors of the Ring-Fenced Banks also attend meetings as observers in order to provide insights on matters relevant to the Ring-Fenced Banks when required and as part of their role in the Group’s overall governance structure. The Chief Risk Officer has full access to the Committee and attends all meetings. The Chief Internal Auditor and members of the executive also attend meetings as appropriate. Details of Committee membership and meeting attendance can be found on page 131. The Committee undertook an annual review of its effectiveness, the findings of which, together with the outcomes of the Board evaluation process as relevant to the Committee (which, for 2023, was led by the Company Secretary), were considered by the Committee at its January 2024 meeting; it was considered that the performance of the Committee continues to be effective. Details of the Board evaluation process can be found on page 142. As the most senior risk committee in the Group, the Committee interacts with other related risk committees, including the executive Group Risk Committee. These interactions help ensure the appropriate escalation of relevant matters to the Committee for review and consideration.
Matters considered by the Committee
During 2023, the Committee considered a wide range of risks facing the Group and its Ring-Fenced Banks, both current and forward-looking, across all key areas of risk management, in addition to risk culture and risk appetite. The Committee continues to focus on key risk topics through, for example, the use of deep dives to provide greater analysis of particular topics and associated risks.
The following pages provide a summary of the risks considered by the Committee, together with an outline of the material factors considered and the conclusions which were ultimately reached. The Committee continues to be supported by the IT and Cyber Advisory Forum, which dedicates additional time and resource to reviewing and challenging risks associated with IT infrastructure, IT strategy, IT resilience and cyber risks. The Chair and other members of the Committee attend this Forum.
The Board Risk Committee Chair is a member of the Audit Committee, in addition to the Audit Committee Chair being a member of the Board Risk Committee; this close interaction continues to help ensure that common issues of interest are addressed appropriately. A further Group-wide Audit and Risk Committee Forum was held during the year, following a similar forum in 2022. This provided an opportunity for members of both Committees to discuss key areas of common interest and enhances interaction across these Committees. Further information about this Forum can be found on page 144. There continues to be regular interaction with other Board Committees, in particular, with the Responsible Business Committee on climate risk and Consumer Duty, and with the Remuneration Committee on the alignment of remuneration to risk performance. This is further illustrated in the table of Board Committee cross-membership set out on page 141 of the corporate governance report. The Committee also reviewed regular updates from the non-Ring-Fenced Bank and Insurance sub-groups, headed up by Lloyds Bank Corporate Markets plc and Scottish Widows Group Limited respectively, summarising key discussions and decisions taken at the relevant entities’ risk committees.
| | | | | | | | | | | | | | |
| Key activities for the year | | |
| | | | |
| Risk type | | Key issues | | Committee review and conclusions |
| Conduct risk | | | | |
| | | | |
| Rectifications and complaints | | The Group’s management of customer rectifications; resolving customer complaints in a timely and fair manner, together with eradicating the complaint causes through root cause analysis. | | During 2023, the Committee received updates on the Group’s complaints and rectifications performance. For rectifications, the Committee has been kept informed of progress in dealing with customer remediation and process improvement activity as well as any new rectifications being identified. The Committee has also been appraised of key themes and progress against complaint-related appetite metrics, performance relative to peers and the challenges faced in the current landscape. Further investment has been allocated to improving the efficiency and efficacy of complaint handling. The Committee has also considered regular updates in relation to historical motor finance commission arrangements. Conclusion: This will continue to be a key area of focus for the Committee. In particular, supporting the actions being taken to improve time taken to handle complaints and rectifications, deliver good outcomes for customers and to ensure that lessons are learned to minimise future events. |
| | | | |
| | | | |
| Consumer Duty | | Implementation and embedding of the FCA’s new Consumer Duty rules across the Group. | Implementation and embedding of the FCA’s new Consumer Duty rules across the Group. | The Committee has received updates on the Consumer Duty Programme during 2023. The Group’s implementation plan was approved by the Responsible Business Committee in July in line with FCA requirements. As a critical element of Consumer Duty, it is vital that focus remains on the delivery of the key cultural initiatives, the development of Group management information reporting, enhancing customer communication and third party requirements. There will be ongoing engagement and transparency with regulators through quarterly meetings. Conclusion: The Committee recognises the significance of the embedding of the Consumer Duty requirements and will monitor the ongoing delivery and evolution as well as the closed book July 2024 delivery date. |
| | | | |
| | | | | | | | |
154 | Lloyds Banking Group plc Annual Report on Form 20-F 2023 | |
Corporate governance continued
| | | | | | | | | | | | | | |
| Key activities for the year | | |
| | | | |
| Risk type | | Key issues | | Committee review and conclusions |
| Financial risks – covering credit and market risk |
| | | | |
| Commercial credit quality | | Risks and external threats to commercial credit performance, including impacts related to a higher interest rate environment, together with sectors potentially exposed to climate risks. | | The Committee provided oversight of the Commercial Banking portfolio via regular credit quality papers, sector deep dives and spotlight reviews, including large single name exposures. Specific consideration is given to topics on a risk profile basis and this year there were deep dives on the Group’s Agriculture portfolio and exposures to both the shadow banking sector and Liability-Driven Investments (LDIs). Discussion was also held regarding progress against roadmaps to fully embed risk-adjusted returns into active portfolio management as well as credit strategies for new origination flow. Detailed reviews allowed the Committee to assess risk levels and credit exposures, as well as clients requiring closer risk management. This includes the active engagement of the Business Support teams with Commercial customers. The Committee also reviewed emerging risks across a range of sectors, including those considered more vulnerable to the wider economic backdrop or structural change and those exposed to increased levels of physical and transitional climate risk; specific spotlights focused on utilities and real estate office exposures. Conclusion: While recognising the risks in the portfolio, the Committee was satisfied that management was continuing to take appropriate action to mitigate and address current and horizon risks, while preparing to manage an expected increase in defaults in 2024 as a result of economic headwinds including inflation and higher interest rates. |
| | | | |
| | | | |
| Consumer credit quality | | Risks relating to Consumer lending, including impacts of higher cost of living, a higher interest rate environment and climate risks. Customer affordability and indebtedness is a key focus. | | The Committee reviewed the performance of the Consumer portfolio via regular credit quality updates. Consideration is given to topics on a risk profile basis and this year additional focus was given to the Homes and Transport portfolios, as well as progress against the roadmap to fully embed risk-adjusted returns into active portfolio management as well as credit strategies for new origination flow. Enhanced monitoring is in place to provide early warning of any adverse trends requiring further action and the Group continues to closely monitor and manage higher risk segments, such as customers with higher indebtedness levels or lower incomes. Specific attention has been given to mortgages, given the impact of increased interest rates on variable rate customers and those coming to the end of fixed rate periods. Conclusion: The Committee is satisfied that appropriate lending controls and monitoring are in place to control risks across the Consumer lending portfolios and that there is an effective framework in place for ongoing risk management as well as significant support for customers in financial difficulty. |
| | | | |
| | | | |
Balance sheet
management and structural hedge | | Management of the Group’s balance sheet, liquidity and structural hedging programme in an environment of uncertain customer behaviour, high interest rates and high-profile market events. | | A key focus for the Group in 2023 has been the management of the balance sheet and resulting market and liquidity risks through periods of significant volatility driven by higher interest rates and uncertainty over customer behaviour in a world of increasing digitalisation. Updates were presented to the Committee on the LDI crisis, bank failures and the growth of the shadow banking sector, as well as the monitoring and management of risks due to changes in the volume and mix of customer deposits. The Committee discussed the risks associated with the current strategy, the management of those risks and the lessons that the Group has learned from the events of the year. Conclusion: Close monitoring of the associated risks continues and any relevant lessons learned were incorporated into the measurement and management of market and liquidity risk. The Committee was satisfied that management was taking the appropriate actions to monitor and mitigate the risks, while recognising that this will remain a key priority in 2024 as the macroeconomic outlook and global political environment continue to evolve. |
| | | | |
| | | | |
| Model risk | | Model risk continues to be an area of significant activity and importance, both internally and externally. | | The Committee continued to receive updates on the progress to satisfy new prudential modelling requirements relating to credit risk capital models (primarily the new Capital Requirements Directive (CRD) IV regulations) and market risk models within Interbank Offered Rate (IBOR) transition activities. Committee oversight was also focused on wider issues such as the model risk management and governance approach and the increased resources required for these as we proactively enhance the framework and capabilities to meet increasing internal and external demands, including those relating to Supervisory Statement 1/23. The Committee was also kept abreast of model risk management activity relating to advanced analytics (such as machine learning/artificial intelligence) models and associated aspects such as data ethics and climate, as the Group continues to develop its capability in these areas. Conclusion: The Committee is comfortable that the development of new model types is subject to appropriate risk control and will continue to oversee the development of the management and control framework for model risk, as required by the Supervisory Statement 1/23. The Committee will continue to oversight CRD IV and IBOR prudential change related submissions. |
| | | | |
| | | | | | | | |
155 | Lloyds Banking Group plc Annual Report on Form 20-F 2023 | |
Corporate governance continued
| | | | | | | | | | | | | | |
| Key activities for the year | | |
| | | | |
| Risk type | | Key issues | | Committee review and conclusions |
| Climate risk |
| | | | |
| Climate risk | | Risks associated with the Group’s role in supporting the transition to net zero and evolving regulatory expectations. | | The Committee continues to be engaged on the Group’s progress in developing climate risk capabilities, particularly in relation to current and developing regulatory requirements, as well as the key choices faced as part of the Group’s environmental sustainability strategy. Regular updates and periodic deep dives are provided to support the Committee’s oversight. In 2023, the Committee was provided with an overview of activity across the Group to meet climate-related regulation requirements. Regular climate risk updates have also included management information covering key physical and transition risks across the Consumer, Commercial and Insurance portfolios. The Committee also discussed the Group’s implementation of its net zero strategy and the key strategic levers and participation choices facing different areas of the business. Conclusion: The Committee recognises the challenges associated with net zero and dependencies on the wider external landscape, however, maintains the importance of the need to support the transition as part of the Group’s wider purpose of Helping Britain Prosper. This will require difficult choices, which will continue to be monitored and discussed, as well an ongoing capability development, building on further progress made over the last 12 months. |
| | | | | | | | | | | | | | |
| Operational risk |
| | | | |
| Operational risk management framework | | Completing the embedding of One Risk and Control Self-Assessment (One RCSA) to strengthen risk culture, simplify the risk and control environment, achieve better customer outcomes, increasing the pace of change and operational efficiency. | | The Committee was provided with regular updates on embedding of One RCSA ahead of completion by year-end 2023. The Committee noted the emerging benefits, with greater self-identification of issues by business teams, fewer repeat audit findings and continued reduction in the number of material events. One RCSA laid the foundations for a broader evolution of the Group’s risk management framework. The evolution has been a key area of Committee focus in 2023. Defined targets were cascaded on the automation of controls over a three-year time horizon, with each business unit CEO presenting individual plans to the Committee. Whilst it is fit for purpose, the Committee has also discussed the evolution of the broader risk framework, to ensure it truly enables the Group’s strategic ambitions. Proposals to change the Group’s risk taxonomy and reimagine the ‘three lines of defence’ operating model were discussed and will shape activity into 2024. Conclusion: The Committee recognises efforts to embed One RCSA and achieve a significant milestone in the Group’s risk and control management journey. This represents a strong foundation from which the Group can maintain ongoing control over its key risks, while seeking to optimise the associated people, processes and technology, to ensure risk and control can become a true enabler for the Group’s strategic ambitions. |
| | | | |
| | | | |
| Operational resilience (IT resilience, cyber, and supplier management) | | Operational resilience remains one of the Group’s most important non-financial risks. We continue to enhance our resilience to better serve customers and to address regulatory priorities. | | The Committee has received reports on the Group’s overall maturity against a suite of operational resilience capabilities and on the refinement of the impact tolerances of important business services. The Committee has also reviewed Group-wide self-assessments covering progress on the enhancements needed to ensure our important business services can be recovered within impact tolerance by March 2025 (in response to regulatory policy statements on operational resilience published in March 2021). Close attention has been paid to the Group’s management of its contracts with its suppliers to ensure resilience of services to customers. Given the significance of the risk to the Group, the Committee is supported by the IT and Cyber Advisory Forum specifically focused on IT and cyber risks. Conclusion: The Committee has requested further specific updates on the progress of the Group-wide Operational Resilience Programme, the impact of investment on operational resilience and the way in which data is used to support management decisions around operational resilience. |
| | | | |
| | | | |
| Data risk | | Data strategy plans to remediate legacy and emerging risk challenges in the Group’s data control environment to enable strategic objectives. | | Data risk continues to be an area of significant regulatory and media attention, particularly relating to new technologies such as artificial intelligence. Frequent updates have been provided to the Committee on the progress of the data strategy in response to legacy and emerging data risk challenges including on data quality and lineage controls and enhancing the Group’s governance framework e.g. around Data Ethics. Conclusion: The Committee continues to be supportive of the data strategy and approach, recognising the complex roadmap of initiatives planned over a number of years. Delivery of the data strategy is critical, given data is a key enabler for good customer outcomes and the overall Group strategy. |
| | | | |
| | | | | | | | |
156 | Lloyds Banking Group plc Annual Report on Form 20-F 2023 | |
Corporate governance continued
| | | | | | | | | | | | | | |
| Key activities for the year | |
| | | | |
| Risk type | | Key issues | | Committee review and conclusions |
| Operational risk continued |
| People and health & safety risk | | Managing people risks arising from the cultural transformation of the workforce will be critical to ensure we attract and retain the right skills and capabilities to deliver our strategy. | | People risk remains a key focus of the Committee, reflecting the scale and complexity of change required to the skills composition and size of our workforce. The Committee considered the current, emerging and horizon risks arising from the people plan and how these would be effectively monitored and managed with continued focus on culture, capability and capacity, colleague proposition, health & safety and wellbeing. The Committee also considered a deep dive on health & safety which highlighted enhancements to the framework, bringing more rigour and management focus to ensure we create a safe and healthy workplace. Conclusion: The Committee supports the people plan and acknowledges that delivering the plan is critical to increasing our capability and capacity to deliver change faster as we move purposefully towards a high performing culture. People risk will remain a key area of focus in 2024 as the transformation journey continues. |
| | | | |
| | | | |
| Strategic transformation oversight | | Risks associated with the extensive current and future Group strategic change agenda, recognising challenges faced in ensuring both successful delivery and implementation of change. | | The Committee has reviewed the portfolio performance on a regular basis, focusing on the Board metric outcomes and underlying deliverables, which supports the Group’s strategic growth ambitions. The focus for 2023 has centred on embedding the new platform-based operating model and ensuring management is learning from the root causes of any delivery delays. The Committee, with the IT and Cyber Advisory Forum, also increased its monitoring of the safe delivery of change for important business services with dedicated deep dives undertaken throughout 2023, which is critical to ensure we avoid customer harm and minimise operational incidents. Conclusion: The Committee will continue to focus on the management of change and execution risk within appetite and on monitoring the outcomes being achieved. The Committee will review how the expected evolution of the platform model and agile change delivery approach is undertaken in 2024. Enhancing resilience in relation to our important business services remains a priority, ensuring that any strategic transformation delivered does not cause customer harm or compromise our operational resilience posture. |
| | | | |
| | | | |
| Fraud | | The Group’s management of fraud risk, while continuing to minimise the impact on genuine customer journeys. | | Fraud, accounting for over 40 per cent of all crime in the UK according to the Home Office policy paper (Fraud Strategy: stopping scams and protecting the public) published in May 2023, remains a priority for the Group. Updates were provided to the Committee in 2023 related to the Consumer fraud programme and the Group’s preparations for new Payment Systems Regulator (PSR) reforms. Committee members acknowledged the progress made and supported the ongoing focus on and investment into improved detection capabilities and customer fraud remediation. The Committee noted the investment ring-fenced to ensure the Group meets new PSR policy requirements coming into force in 2024. Conclusion: The Committee welcomed the progress made and supports the forward plan for 2024 to improve detection capabilities and customer fraud response and remediation. The Committee will continue to be updated in 2024 on the delivery of the PSR policy requirements. |
| | | | |
| | | | |
| Money laundering and financial crime | | The Group’s management of financial crime risks and compliance with the UK’s anti-money laundering regime. | | Financial crime continues to be a source of significant external threats and remains a regulatory priority. Updates have been provided to the Committee throughout 2023 including the annual Money Laundering Reporting Officer’s Report, an update on the Group’s Ongoing Know Your Customer programme and a Group-wide Economic Crime deep dive review. Committee members have been supportive of the actions being taken by management; and noted that as financial crime risks continue to evolve and increase there is a continued need to prioritise investment to maintain an effective, risk-based and threat-led control environment. Conclusion: The Committee is supportive of the actions being taken to manage financial crime risks and supports management’s continued investment to remain effective in the face of increasing threats. The Committee will continue to be updated in 2024 on key deliverables across the programme. |
| | | | |
| | | | |
| | | | | | | | |
157 | Lloyds Banking Group plc Annual Report on Form 20-F 2023 | |
Corporate governance continued
| | | | | | | | | | | | | | |
| Key activities for the year | | |
| | | | |
| Risk type | | Key issues | | Committee review and conclusions |
| Other categories |
| Regulatory and legal risk | | Managing regulatory and litigation risk is a key focus within the Group. | | The Committee has provided oversight to ensure effective controls are in place to comply with existing regulatory obligations, including consideration of these at an individual legal entity level. The Committee considered regular updates on emerging regulatory and legal risks. In addition, the Committee has continued to closely monitor a number of significant regulatory change and oversight programmes, such as risk-free rates transition; model risk management and ring-fencing reforms. In particular, the Committee has also reviewed regular progress updates on the enhancements to the Group’s Recovery and Resolution planning, including fire drill activities. Conclusion: The Group places significant focus on complex regulatory changes and litigation risk, as well as ensuring effective horizon scanning of upcoming trends and evolving risks. The Committee has discussed the topics raised and will continue to closely monitor compliance with regulatory requirements in 2024. |
| | | | |
| | | | |
| Emerging and strategic risk categories | | Continued evolution of the Group’s emerging risk landscape and methodology with greater focus on geopolitical risks. Incorporation of strategic risk themes into the Group’s business planning process. | | The Group’s focus on the emerging risk landscape and assessment approach has continued to be refined during 2023. A series of deep dives on the top emerging risk themes from 2022 have taken place during the year. In addition, geopolitical risks have been a focus and how these may generate second order impacts for the Group. The 2023 emerging risk landscape has been simplified, combining emerging and strategic risks into a single view. The Committee is supportive of the updated approach and approved the revised emerging risk themes. Conclusion: Ensuring the Group understands the emerging risk landscape and its level of preparedness remains a key priority. In 2024, the Committee will continue to monitor the emerging and strategic risk trends, supported by targeted deep dives, considering their potential impacts and mitigating actions. |
| | | | |
| | | | | | | | |
158 | Lloyds Banking Group plc Annual Report on Form 20-F 2023 | |
Corporate governance continued
Responsible Business Committee report
Responsible business is at the core of our purpose of Helping Britain Prosper
| | |
|
| Amanda Mackenzie |
| Chair, Responsible Business Committee |
|
| Responsible business means delivering good outcomes for our customers and building a more sustainable and inclusive future for people and businesses. |
| | |
| Key activities in 2023 |
•Becoming a purpose-driven organisation •Tackling social and environmental challenges •Engaging our employees to deliver cultural change •Delivering on our duty to customers and stakeholders |
| | |
| Q&A |
Q. What are the Responsible Business Committee’s (Committee) priorities for 2024? |
A. We made significant strides in transforming the Group and embedding purpose in our decision making and behaviours in 2023. The next year will be important in ensuring we continue to support colleagues, customers and communities and deliver on our focus areas of providing access to quality housing, unlocking regional development, greening the built environment and promoting financial resilience and inclusion. |
Q. What role does nature play in your environmental sustainability ambitions? |
A. Protecting and restoring nature goes hand-in-hand with supporting the low carbon transition and Helping Britain Prosper. We’ve made strong progress this year, building an expert team and hiring our first Group Head of Nature. In 2024, we will be working with colleagues, customers and clients to manage our nature-related risks, capitalise on opportunities and embed nature into our decision making. |
IntroductionI am pleased to report on the Committee’s work in 2023 and I would like to thank members for their contributions. We will continue to review progress against our inclusion and diversity aspirations and rigorously support our sustainability plans in 2024. The strong foundations we have laid will continue to shape how we do business to create a more sustainable and inclusive future. This is a key part of how we will grow our business profitably and provide long-term, sustainable value for shareholders and other stakeholders.
Committee purpose and responsibilities
The purpose of the Committee is to support the Board in overseeing the Group’s policies, performance and priorities as a responsible business. We will continue our oversight of the Group’s work in 2024, as well as reacting to key emerging topics for our industry, such as Artificial Intelligence (AI) ethics. The Committee’s terms of reference can be found on our corporate governance page on the Group’s website.
Access to housing
We are one of the largest funders of UK house building and in the course of 2023 supported £2.7 billion of new funding to the social housing sector. In addition, this year, we launched a charity partnership with Crisis and together we are calling for one million
new social homes to be built in the next decade. Our colleagues have actively engaged with our new partnership and we exceeded our fundraising goal of £1 million in 2023.
Environmental sustainability
The Committee provides oversight of the Group’s environmental sustainability strategy, sharing responsibility with the Audit Committee and Board Risk Committee. In 2023, we recommended to the Board an updated environmental sustainability strategy and three new sector targets for road passenger transport, agriculture and commercial & residential real estate. We have also launched enhanced operational emissions goals, including a more ambitious direct carbon emissions reduction target alongside new water, waste and nature pledges. More detail on our sustainability progress can be found in the sustainability report .
Consumer Duty
The Committee is the designated body that fulfils the Board’s responsibility for Consumer Duty oversight. As the Board Consumer Duty champion, I worked alongside the Committee to provide oversight of the Group’s Consumer Duty implementation plan to meet the first of the FCA’s two Consumer Duty deadlines in July 2023 for new and open products. Consumer Duty sits at the heart of everything we do and we will continue our close work with the business as we approach the FCA’s second deadline for closed products in July 2024.
Colleagues and culture
Our colleagues play a vital role in the delivery of the Group’s strategic ambitions. The Committee, as the designated body for workforce engagement, supports the Group’s wider engagement strategy, reporting at least annually to the Board on the key themes and issues we’re hearing from our colleagues. This year we discussed the long-term journey we are on to transform our culture, with change readiness a key theme. Engaging our colleagues in our transformation is key to driving the Group’s success. Please refer to page 134 for more details on our colleague engagement activities. Diversity, equity and inclusion
The Committee received regular updates on our diversity, equity and inclusion performance in 2023 and are pleased by the continued progress in increasing the representation of women and Black, Asian and Minority Ethnic colleagues in senior roles. The latest FTSE Women Leaders Review report confirmed women are represented in over 40 per cent of our senior roles, meeting the review’s recommendation. In April 2023, we also announced a further goal to double the representation of senior colleagues with a disability by 2025. We have asked the executive to continue to progress towards our commitments as we work to build a more inclusive organisation.
Committee composition, skills, experience and operation
The Committee met on four occasions in 2023 and is composed of independent non-executive directors and is attended by the Group Chief Executive. It benefits from a range of perspectives, insight and experience, with representatives from Group Internal Audit and the Chief Operating Office attending meetings as appropriate. Details of Committee membership and meeting attendance can be found on page 131. Sarah Bentley joined the Responsible Business Committee of each of the Ring-Fenced Banks in January and I joined our Audit Committee to support the Committee’s sustainability-related reporting responsibilities. The findings of the internal annual review of effectiveness were considered by the Committee at its January 2024 meeting. Based on the evaluation, the feedback was that the performance of the Committee continues to be effective.
| | | | | | | | |
159 | Lloyds Banking Group plc Annual Report on Form 20-F 2023 | |
Corporate governance continued
Disclosure controls and procedures
As of 31 December 2023, Lloyds Banking Group, under the supervision and with the participation of the Group’s management, including the Group Chief Executive and the Chief Financial Officer, performed an evaluation of the effectiveness of the Group’s disclosure controls and procedures. Based on this evaluation, the Group Chief Executive and Chief Financial Officer concluded that the Company’s disclosure controls and procedures, at 31 December 2023, were effective for gathering, analysing and disclosing with reasonable assurance the information that Lloyds Banking Group is required to disclose in the reports it files under the Securities Exchange Act of 1934, within the time periods specified in the SEC’s rules and forms. Lloyds Banking Group’s management necessarily applied its judgement in assessing the costs and benefits of such controls and procedures, which by their nature can provide only reasonable assurance regarding management’s control objectives.
Changes in internal control over financial reporting
There have been no changes in the Lloyds Banking Group’s internal control over financial reporting during the year ended 31 December 2023 that have materially affected, or are reasonably likely to materially affect, the Lloyds Banking Group’s internal control over financial reporting.
Management report on internal control over financial reporting
The management of Lloyds Banking Group plc is responsible for establishing and maintaining adequate internal control over financial reporting. Lloyds Banking Group plc’s internal control over financial reporting is a process designed to provide reasonable assurance regarding the reliability of financial reporting and the preparation of financial statements for external purposes in accordance with IFRS.
The Company’s internal control over financial reporting includes those policies and procedures that (i) pertain to the maintenance of records that, in reasonable detail, accurately and fairly reflect transactions and dispositions of assets; (ii) provide reasonable assurance that transactions are recorded as necessary to permit preparation of financial statements in accordance with IFRS and that receipts and expenditures are being made only in accordance with authorisations of management and directors of Lloyds Banking Group plc; and (iii) provide reasonable assurance regarding prevention or timely detection of unauthorised acquisition, use, or disposition of the Company’s assets that could have a material effect on the financial statements.
The management of Lloyds Banking Group plc assessed the effectiveness of the Company’s internal control over financial reporting at 31 December 2023 based on the criteria established in Internal Control – Integrated Framework 2013 issued by the Committee of Sponsoring Organisations of the Treadway Commission (COSO). Based on this assessment, management concluded that, at 31 December 2023, the Company’s internal control over financial reporting was effective.
Internal control systems, no matter how well designed, have inherent limitations and may not prevent or detect misstatements. Also, projections of any evaluation of effectiveness to future periods are subject to the risk that controls may become inadequate because of changes in conditions, or that the degree of compliance with the policies and procedures may deteriorate.
Deloitte LLP, an independent registered public accounting firm, has issued opinions on the Company’s consolidated financial statements and on its internal controls over financial reporting. These opinions appear on pages F-2 to F-5 and F-6. Going concern
The going concern of the Company and the Group is dependent on successfully funding their respective balance sheets and maintaining adequate levels of capital. In order to satisfy themselves that the Company and the Group have adequate resources to continue to operate for the foreseeable future, the Directors have considered a number of key dependencies which are set out in the risk management section under principal risks and uncertainties: funding and liquidity on page 33 and pages 75 to 81 and capital position on pages 45 to 52. Additionally, the Directors have considered capital and funding projections for the Company and the Group. Accordingly, the Directors conclude that the Company and the Group have adequate resources to continue in operational existence for a period of at least 12 months from the date of approval of the financial statements and therefore it is appropriate to continue to adopt the going concern basis in preparing the accounts. | | | | | | | | |
160 | Lloyds Banking Group plc Annual Report on Form 20-F 2023 | |
Major shareholders and related party transactions
Major shareholders
All shareholders within a class of the Company’s shares have the same voting rights. As at 13 February 2024 the Company had received notification under the FCA Disclosure Guidance and Transparency Rules (‘DTR’) of the following holdings in the Company’s issued ordinary share capital.
| | | | | | | | |
| Interest in shares | % of issued share capital /voting rights1 |
| BlackRock, Inc. | 3,668,756,7652 | 5.14 | % |
| Harris Associates L.P. | 3,546,216,7873,4 | 4.99 | % |
1 Percentage correct as at the date of notification.
2 The notification of 13 May 2015 provided by BlackRock, Inc. under Rule 5 of the DTR identifies (i) an indirect holding of 3,599,451,380 shares in the Company representing 5.04 per cent of the voting rights in the Company as at 12 May 2015, and (ii) a holding of 69,305,385 in other financial instruments in respect of the Company representing 0.09 per cent of the voting rights of the Company as at 12 May 2015. BlackRock, Inc.’s holding most recently notified to the Company under Rule 5 of the DTR varies from the holding disclosed in BlackRock, Inc.’s Schedule 13-G filing with the US Securities and Exchange Commission dated 8 February 2024, which identifies beneficial ownership of 5,352,886,800 shares in the Company representing 8.4 per cent of the issued share capital in the Company. This variance is attributable to different notification and disclosure requirements between these regulatory regimes. The notifiable holding by BlackRock, Inc. received by the Company has not changed since 31 December 2015. Prior to 31 December 2015, BlackRock, Inc.’s holding in the Company was not required to be disclosed under the US Securities and Exchange Commission rules.
3 An indirect holding.
4 On 31 October 2018, Harris Associates L.P. made a disclosure under the DTR of a decrease in its holding, to 3,551,514,571 ordinary shares, representing 4.99% of that share class. On 19 May 2020, Harris Associates L.P. made a disclosure under the DTR of an increase in its holding to 3,523,149,161 ordinary shares, representing 5.00% of that share class. On 8 July 2021, Harris Associates L.P. made a disclosure under the DTR of a decrease in its holding to 3,545,505,426 ordinary shares, representing 4.99% of that share class. On 14 July 2021, Harris Associates L.P. made a disclosure under the DTR of an increase in its holding to 3,560,036,794 ordinary shares, representing 5.01% of that share class. On 19 July 2021, Harris Associates L.P. made a further disclosure under the DTR of a decrease in its holding to 3,546,216,787 ordinary shares, representing 4.99% of that share class.
As at 13 February 2024, the Company had 2,161,472 registered ordinary shareholders. The majority of the Company’s ordinary shareholders are registered in the United Kingdom. 2,229,571,665 ordinary shares, representing 3.48 per cent of the Company’s issued share capital, were held by BNY Mellon as depositary for the ordinary share American Depositary Share Programme through which there were 195 record holders.
Additionally, the majority of the Company’s preference shareholders are registered in the United Kingdom, with a further one record holder with an address in the United States registered through the Company’s preference share American Depositary Share Programme.
Related party transactions
The Group, as at 31 December 2023, had related party transactions with 25 key management personnel, certain of its pension funds, collective investment schemes and joint ventures and associates. See note 47 to the financial statements.
| | | | | | | | |
161 | Lloyds Banking Group plc Annual Report on Form 20-F 2023 | |
Approach of the Financial Conduct Authority (“FCA”)
Under the Financial and Services and Markets Act 2000, as amended by the Financial Services Act 2012 (“FSMA”), the FCA has a strategic objective to ensure that the relevant markets function well. In support of this, the FCA has three operational objectives: to secure an appropriate degree of protection for consumers; to protect and enhance the integrity of the UK financial system and to promote effective competition in the interests of consumers.
The FCA Handbook sets out rules and guidance across a range of conduct issues with which financial institutions are required to comply including high level principles of business and detailed conduct of business standards and reporting standards.
Approach of the Prudential Regulation Authority (“PRA”)
The PRA is part of the BoE (as defined below), with responsibility for prudential regulation and supervision. The PRA’s strategy is to deliver a resilient financial sector by seeking: an appropriate quantity and quality of capital and liquidity; effective risk management; robust business models; and sound governance including clear accountability of firms’ management. This strategy supports its three statutory objectives: to promote the safety and soundness of these firms; to contribute to the securing of an appropriate degree of protection for policyholders (for insurers); and to act, so far as is reasonably possible, in a way which facilitates effective competition in the markets for services provided.
The PRA Rulebook sets out rules and guidance across a range of prudential matters which firms are required to comply with including areas such as fundamental rules; ring-fencing requirements; reporting and prudential treatments. The PRA will change a firm’s business model if it judges that mitigating risk measures are insufficient. Further to the UK implementation of CRD V a legal requirement has been established in the FSMA that requires the PRA to authorise UK parent financial holding companies (“FHC”) or mixed financial holding companies (“MFHC”) that have at least one bank or designated relevant investment firm as a subsidiary. As a result, Lloyds Banking Group plc (“the Company”) has received authorisation to be recognised as the UK parent MFHC of the Group and is therefore responsible for ensuring prudential capital requirements are applied on a consolidated basis.
Other bodies impacting the regulatory regime
The Bank of England (“BoE”)
The BoE has specific responsibilities in relation to financial stability, including: (i) ensuring the stability of the monetary system; (ii) oversight of the financial system infrastructure, in particular payments systems in the UK and abroad; and (iii) maintaining a broad overview of the financial system through its monetary stability role.
HM Treasury
HM Treasury is the government’s economic and finance ministry, setting the direction of the UK’s economic policy and working to achieve strong and sustainable economic growth. Its responsibilities include financial services policy such as banking and financial services regulation, financial stability, and ensuring competitiveness in the City of London financial markets; strategic oversight of the UK tax system; delivery of infrastructure projects across the public sector; and ensuring the economy is growing sustainably.
UK Financial Ombudsman Service (“FOS”)
The FOS provides consumers with a free and independent service designed to resolve disputes where the customer is not satisfied with the response received from the regulated firm. The FOS resolves disputes for eligible persons that cover most financial products and services provided in (or from) the UK. The jurisdiction of the FOS extends to include firms conducting activities under the Consumer Credit Act 1974. Although the FOS takes account of relevant regulation and legislation, its guiding principle is to resolve cases individually on merit on the basis of what is fair and reasonable; in this regard, the FOS is not bound by law or even its own precedent. The final decisions made by the FOS are legally binding on regulated firms who also have a requirement under the FCA rules to ensure that lessons learned as a result of determinations by the FOS are effectively applied in future complaint handling.
British Bankers Resolution Service (“BBRS”)
The Company is also a member of the BBRS. BBRS is a non-profit organisation set up to resolve disputes between eligible larger small and medium-sized enterprises and participating banks.
The Financial Services Compensation Scheme (“FSCS”)
The FSCS was established under the FSMA and is the UK’s statutory fund of last resort for customers of authorised financial services firms. Companies within the Group are responsible for contributing to compensation schemes in respect of banks and other authorised financial services firms that are unable to meet their obligations to customers. The FSCS can pay compensation to customers if a firm is unable, or likely to be unable, to pay claims against it. The FSCS is funded by levies on firms authorised by the PRA and the FCA, including companies within the Group.
Lending Standards Board (“LSB”)
The LSB is responsible for overseeing the Standards of Lending Practice (for both personal and business customers). The Standards of Lending Practice for personal customers cover six main areas: product and service design; product sales; account maintenance and servicing; money management; financial difficulty; and customer vulnerability across key lending (current account overdrafts, credit cards, loans and chargecards) to consumers. The Standards of Lending Practice for business customers apply to business customers (including Asset Finance), which at the point of lending have an annual turnover of up to £25 million. The standards cover nine main areas: product information; product sale; declined applications; product execution; credit monitoring; treatment of customers in financial difficulty; business support units; portfolio management; and customers in vulnerable circumstances for products including loans, overdrafts, commercial mortgages, credit cards, and chargecards. The LSB is also responsible for overseeing the Contingent Reimbursement Model and Credit Card Market Study Remedies.
| | | | | | | | |
162 | Lloyds Banking Group plc Annual Report on Form 20-F 2023 | |
UK Competition and Markets Authority (“CMA”)
The objective of the CMA is to promote competition to ensure that markets work well for consumers, businesses and the economy. Through its five strategic goals (delivering effective enforcement; extending competition frontiers; refocusing competition protection; achieving professional excellence; and, developing integrated performance) the CMA impacts the banking sector in a number of ways, including with its powers to investigate and prosecute a number of criminal offences under competition law. In addition, the CMA is now the lead enforcer under the Unfair Terms in Consumer Contracts Regulations 1999. The Government is consulting on “reforming competition and consumer policy” which intends to provide new powers to the CMA.
UK Information Commissioner’s Office (“ICO”)
The UK Information Commissioner’s Office is the UK’s independent authority set up to uphold information rights in the public interest, promoting openness by public bodies and data privacy for individuals. The ICO is responsible for overseeing implementation of the Data Protection Act 2018 which enshrines the General Data Protection Regulation. This Act regulates, among other things, the lawful use of data relating to individual customers.
The Payment System Regulator (“PSR”)
The PSR is an independent economic regulator for the payment systems industry, which was launched in April 2015. Payment systems form a vital part of the UK’s financial system – they underpin the services that enable funds to be transferred between people and institutions. The purpose of PSR is to make payment systems work well for those that use them. The PSR is a subsidiary of the FCA, but has its own statutory objectives, Managing Director and Board. In summary its objectives are: (i) to ensure that payment systems are operated and developed in a way that considers and promotes the interests of all the businesses and consumers that use them; (ii) to promote effective competition in the markets for payment systems and services between operators, payment services providers and infrastructure providers; and (iii) to promote the development of and innovation in payment systems, in particular the infrastructure used to operate those systems.
Competition regulation
The Financial Services and Markets Act 2023 gives the FCA and the PRA a secondary objective to facilitate the international competitiveness of the UK economy (including, in particular, the financial services sector), and its medium to long-term growth, subject to aligning with relevant international standards.
The CMA has competition law powers which apply across the whole economy. Sectoral regulators such as the FCA may exercise the competition law powers to enforce the prohibitions on anti-competitive agreements and on abuse of a dominant position, and to make market investigation references, concurrently with the CMA in those sectors for which they have responsibility. In July 2019, the CMA signed a memorandum of understanding with the FCA and the PSR, which sets out the arrangements for allocating cases, sharing information, dealing with confidentiality constraints, and pooling resources in relation to their concurrent objectives to promote competition.
The Digital Markets, Competition and Consumers Bill is set to introduce a new targeted and proportionate regulatory regime to address concerns around competition in the digital industry.
EU regulation
Following the UK’s withdrawal from the EU, much of the EU legislation that previously applied to UK financial institutions has been incorporated into UK law. It is possible that over time the UK will depart from EU-derived financial regulatory standards. The Group will continue to monitor changes to legislation and assess the likely impact on its business.
See also “Regulatory and Legal Risks – The Group faces risks associated with its compliance with a wide range of laws and regulations” and “Regulatory and Legal Risks – The Group is subject to resolution planning requirements”.
| | | | | | | | |
163 | Lloyds Banking Group plc Annual Report on Form 20-F 2023 | |
US regulation
LBCM maintains a branch in the U.S. and Lloyds Bank maintains a representative office in the U.S. As a result, the Company and its subsidiaries doing business or conducting activities in the U.S. are subject to oversight by the Federal Reserve Board.
Each of the Company and Lloyds Bank Corporate Markets plc is treated as a bank holding company under the U.S. Bank Holding Company Act of 1956 (“BHC Act”) and has elected to be a financial holding company. Financial holding companies may engage in a broader range of financial and related activities than are permitted to bank holding companies that do not maintain financial holding company status, including underwriting and dealing in all types of securities. A financial holding company and its depository institution subsidiaries must meet certain capital ratios and be deemed to be “well managed” for purposes of the Federal Reserve Board’s regulations. A financial holding company’s direct and indirect activities and investments in the U.S. are limited to those that are “financial in nature” or “incidental” or “complementary” to a financial activity, as defined in section 4(k)(4) of the BHC Act or determined by the Federal Reserve Board.
Bank holding companies and financial holding companies are also subject to approval requirements in connection with certain acquisitions or investments. For example, the Group is required to obtain the prior approval of the Federal Reserve Board before acquiring, directly or indirectly, the ownership or control of more than 5 per cent of any class of the voting shares of any U.S. bank or bank holding company.
The Group’s U.S. broker dealer, Lloyds Securities Inc. (“LSI”), is subject to regulation and supervision by the U.S. Securities and Exchange Commission (“SEC”) and is a member of the Financial Industry Regulatory Authority (“FINRA”) and is thus subject to requirements and oversight related to areas including sales methods, trade practices, use and safekeeping of customers’ funds and securities, capital structure, recordkeeping, conduct of directors, officers and employees and other matters pertinent to its securities business.
LBCM is registered as a swap dealer and as such, is subject to regulation and supervision by the Commodity Futures Trading Commission (“CFTC”) with respect to certain of its swap activities and registration with the National Futures Association (“NFA”), CFTC and NFA rules and regulations include requirements related to risk management practices, trade documentation and reporting, business conduct and recordkeeping, among others.
A major focus of U.S. governmental policy relating to financial institutions in recent years has been combating money laundering and terrorist financing and enforcing compliance with U.S. economic sanctions, with serious legal and reputational consequences for any failures arising in these areas. The Group engages, or has engaged, in a limited amount of business with counterparties in certain countries which the U.S. State Department designated during the reporting period as state sponsors of terrorism, including Iran, Syria, Cuba and North Korea. At 31 December 2023, the Group did not believe that the Group’s business activities relating to countries designated as state sponsors of terrorism in 2023 were material to its overall business.
The Group estimates that the value of its business in respect of such states represented less than 0.01 per cent of the Group’s total assets and, for the year ended December 2023, the Group believes that the Group’s revenues from all activities relating to such states were less than 0.001 per cent of its total income, net of insurance claims and changes in insurance and investment contract liabilities. This information has been compiled from various sources within the Group, including information manually collected from relevant business units, and this has necessarily involved some degree of estimate and judgement.
Disclosure pursuant to Section 219 of The Iran Threat Reduction and Syria and Human Rights Act (“ITRA”)
Since the introduction of an enhanced financial sanctions policy, the Group has been proactive in reducing its dealings with Iran and Syria, and individuals and entities associated with these countries. There remain a small number of historic business activities which the Group has not yet been able to terminate for legal or contractual reasons.
Pursuant to ITRA Section 219, the Group notes that during 2023, its non-US affiliates, Lloyds Bank and Bank of Scotland plc, received or made payments involving entities owned or controlled by the Government of Iran as defined under section 560.304 of title 31, Code of Federal Regulations, and/or designated under Executive Order 13382 or 13224. In all cases, the payment was permitted under UK sanctions legislation, specific authority was sought from and granted by HM Treasury, the UK’s Competent Authority to provide such authorisations or the payment(s) were credited to a blocked account, held in the name of the entity, in accordance with UK sanctions legislation.
Gross revenues from these activities were approximately £9,000. Net profits from these activities were approximately £9,000.
The Group’s business activities, being reported below, are conducted in compliance with applicable laws in respect of Iran and Syria sanctions and, except as noted below, the Group intends to continue these historic activities until it is able to legally terminate the contractual relationships or to maintain/ manage them in accordance with prevailing sanctions obligations. The nature of these activities is as follows:
1.Limited and infrequent payments made to and received from entities directly or indirectly linked to the Government of Iran. Such payments are only made if they comply with UK regulation and legislation and/or licence from the U.S. Treasury Department’s Office of Foreign Assets Control.
2.Payments made to a blocked account in the name of Commercial Bank of Syria related to historic guarantees, entered into by the Group between 1997 and 2008, the majority of which relate to Bail Bonds for vessels. The Commercial Bank of Syria is designated under Executive Order 13382.
3.Sums paid out from a pension trust fund to UK nationals resident in the UK who were employees of a company indirectly owned or controlled by an entity designated under Executive Order 13382 that is also owned or controlled by the Government of Iran.
| | | | | | | | |
164 | Lloyds Banking Group plc Annual Report on Form 20-F 2023 | |
Trading markets
The ordinary shares of Lloyds Banking Group plc are listed and traded on the London Stock Exchange under the symbol ‘LLOY’. The prices for shares as quoted in the official list of the London Stock Exchange are in pounds Sterling. Lloyds Banking Group plc American Depositary Shares (ADSs) are listed on the New York Stock Exchange under the symbol ‘LYG’. Each ADS represents four ordinary shares.
ADR fees
The Group’s depositary, The Bank of New York Mellon, collects its fees for delivery and surrender of ADSs directly from investors depositing shares or surrendering ADSs for the purpose of withdrawal or from intermediaries acting for them. The depositary collects fees for making cash distributions to investors (including dividends) by deducting those fees from the amounts distributed or by selling a portion of distributable property to pay the fees. The depositary may collect its annual fee for depositary services by deductions from cash distributions or by directly billing investors or by charging the book-entry system accounts of participants acting for them. The depositary may generally refuse to provide fee-attracting services until its fees for those services are paid.
| | | | | |
| Persons depositing or withdrawing shares must pay: | For: |
| $5.00 (or less) per 100 ADSs (or portion of 100 ADSs) | Issuance of ADSs, including issuances resulting from a distribution of shares or rights or other property. Cancellation of ADSs for the purpose of withdrawal, including if the deposit agreement terminates. |
| $.02 (or less) per ADS | Any cash distribution to ADS registered holders (including dividends). |
| A fee equivalent to the fee that would be payable if securities distributed had been shares and the shares had been deposited for issuance of ADSs | Distribution of securities distributed to holders of deposited securities which are distributed by the depositary to ADS registered holders. |
| $.02 (or less) per ADSs per calendar year | Depositary services. |
| Registration or transfer fees | Transfer and registration of shares on the share register to or from the name of the depositary or its agent when you deposit or withdraw shares. |
| Expenses of the depositary | Cable, telex and facsimile transmissions (when expressly provided in the deposit agreement). Converting foreign currency to US Dollars. |
| Taxes and other governmental charges the depositary or the custodian have to pay on any ADS or share underlying an ADS, for example, stock transfer taxes, stamp duty or withholding taxes | As necessary. |
| Any charges incurred by the depositary or its agents for servicing the deposited securities | As necessary. |
Fees received to date
In 2023, the Company received from the depositary $1,278,845 for continuing annual stock exchange listing fees, standard out-of-pocket maintenance costs for the ADSs (consisting of the expenses of postage and envelopes for mailing annual and interim financial reports, printing and distributing dividend checks, electronic filing of US Federal tax information, mailing required tax forms, stationery, postage, facsimile, and telephone calls), any applicable performance indicators relating to the ADS facility, underwriting fees and legal fees.
Fees to paid in the future
The Bank of New York Mellon, as depositary, has agreed to reimburse the Company for maintenance expenses that they incur for the ADS program. The depositary has agreed to pay the standard out-of-pocket maintenance costs for the ADSs, which consist of the expenses of postage and envelopes for mailing annual and interim financial reports, printing and distributing dividend checks, electronic filing of US Federal tax information, mailing required tax forms, stationery, postage, facsimile, and telephone calls. It has also agreed to reimburse the Company annually for certain investor relationship programs or special investor relations promotional activities. The depositary has agreed to provide payments to the Company based on the level of issuance, cancellation and dividend fees.
| | | | | | | | |
165 | Lloyds Banking Group plc Annual Report on Form 20-F 2023 | |
Lloyds Banking Group plc’s ability to pay dividends is restricted under UK company law. Dividends may only be paid if distributable profits are available for that purpose. In the case of a public limited company, a dividend may only be paid if the amount of net assets is not less than the aggregate of the called-up share capital and undistributable reserves and if the payment of the dividend will not reduce the amount of the net assets to less than that aggregate. In addition, a company cannot pay a dividend if any of its UK insurance subsidiaries is insolvent on a regulatory valuation basis or, in the case of regulated entities, if the payment of a dividend results in regulatory capital requirements not being met. Similar restrictions exist over the ability of Lloyds Banking Group plc’s subsidiary companies to pay dividends to their immediate parent companies. Furthermore, in the case of Lloyds Banking Group plc, dividends may only be paid if sufficient distributable profits are available for distributions due in the financial year on certain preferred securities. The board has the discretion to decide whether to pay a dividend and the amount of any dividend. In making this decision, the board is mindful of the level of dividend cover and, consequently, profit growth may not necessarily result in increases in the dividend. In the case of American Depositary Shares, dividends are paid through The Bank of New York Mellon which acts as paying and transfer agent.
The Group has a progressive and sustainable ordinary dividend policy whilst maintaining the flexibility to return further surplus capital through buybacks or special dividends.
In February 2023, the Board decided to return surplus capital in respect of 2022 through a share buyback programme of up to £2 billion. This commenced in February 2023 and completed on 25 August 2023 with c.4.4 billion (c.7 per cent) ordinary shares repurchased.
The Board has recommended a final ordinary dividend of 1.84 pence per share, which, together with the interim ordinary dividend of 0.92 pence per share totals 2.76 pence per share, an increase of 15 per cent compared to 2022, in line with the Board’s commitment to capital returns. The Board has also announced its intention to implement an ordinary share buyback of up to £2.0 billion which will commence as soon as is practicable and is expected to be completed by 31 December 2024.
Based on the total ordinary dividend and the intended ordinary share buyback the total capital return in respect of 2023 will be up to £3.8 billion, equivalent to c.14 per cent1 of the Group’s market capitalisation value.
1 Market capitalisation as at 16 February 2024.
The table below sets out the interim and final dividends declared in respect of the ordinary shares for fiscal years 2019 through 2023. The Sterling amounts have been converted into US Dollars at the Noon Buying Rate in effect on each payment date with the exception of the recommended final dividend for 2023, for which the Sterling amount has been converted into US Dollars at the Noon Buying Rate on 16 February 2024.
| | | | | | | | | | | | | | |
| Interim
ordinary
dividend
per share
(pence) | Interim
ordinary
dividend
per share
(cents) | Final
ordinary
dividend
per share
(pence) | Final
ordinary
dividend
per share
(cents) |
20191 | 1.12 | | 1.40 | | – | | – | |
2020 | – | | – | | 0.57 | | 0.81 | |
2021 | 0.67 | | 0.93 | | 1.33 | | 1.66 | |
2022 | 0.80 | | 0.94 | | 1.60 | | 1.99 | |
| 2023 | 0.92 | | 1.15 | | 1.84 | | 2.32 | |
1At the time of approving the Group’s results for the year ended 31 December 2019, the directors recommended a final dividend of 2.25 pence per share which was to be paid on 27 May 2020. However, on 31 March 2020 the Group announced the cancellation of its final 2019 ordinary dividend. This decision was taken by the Board at the specific request of the regulator, the PRA, in line with all other major UK listed banks, as a result of the developing coronavirus crisis.
Articles of association of Lloyds Banking Group plc
For information regarding the Articles of Association, please refer to the discussion under the corresponding section of the Annual Report on Form 20-F for the year ended 31 December 2021, filed with the SEC on 28 February 2022, which discussion is hereby incorporated by reference into this document.
Exchange controls
There are no UK laws, decrees or regulations that restrict Lloyds Banking Group plc’s import or export of capital, including the availability of cash and cash equivalents for use by Lloyds Banking Group, or that affect the remittance of dividends, interest or other shareholders’ payments to non-UK holders of Lloyds Banking Group plc shares, except as set out in Taxation.
| | | | | | | | |
166 | Lloyds Banking Group plc Annual Report on Form 20-F 2023 | |
The following discussion is intended only as a general guide to current UK and US federal income tax considerations relevant to US holders (as defined below in the section on US federal income tax considerations) of Lloyds Banking Group ordinary shares or ADSs. It is based on current law and tax authority practice and the terms of the current UK/US income tax treaty (the Treaty), all of which are subject to change at any time, possibly with retroactive effect.
This summary does not consider your personal circumstances, and it is not a substitute for tax advice. Any person who is in any doubt as to their tax position should consult their own professional adviser.
UK taxation of chargeable gains
Subject to the provisions set out in the next paragraph in relation to temporary non-residents, US holders generally will not be liable for UK tax on chargeable gains unless they carry on a trade, profession or vocation in the UK through a branch or agency and the ordinary shares or ADSs are or have been used or held by or for the purposes of the branch or agency, in which case such US holder might, depending on individual circumstances, be liable to UK tax on chargeable gains on any disposition of ordinary shares or ADSs.
An individual US holder who is only temporarily not resident in the UK may, under anti-avoidance legislation, still be liable for UK tax on chargeable gains realised, subject to any available exemption, relief and/or foreign tax credit.
UK taxation of dividends
Lloyds Banking Group plc will not be required to withhold tax at source when paying a dividend on the ordinary shares or ADSs to a US holder.
Stamp duty and stamp duty reserve tax
Any conveyance or transfer on sale of ordinary shares (whether effected using the CREST settlement system or not) will be subject to UK stamp duty or stamp duty reserve tax (SDRT). The transfer on sale of ordinary shares will be liable to ad valorem UK stamp duty or SDRT, generally at the rate of 0.5 per cent of the consideration paid (rounded up to the next multiple of £5 in the case of stamp duty). Stamp duty is usually the liability of the purchaser or transferee of the ordinary shares. An unconditional agreement to transfer such ordinary shares will be liable to SDRT, generally at the rate of 0.5 per cent of the consideration paid, but such liability will be cancelled, or, if already paid, refunded, if the agreement is completed by a duly stamped transfer within six years of the agreement having become unconditional. SDRT is normally the liability of the purchaser or transferee of the ordinary shares.
UK tax law requires that when a holder of ordinary shares transfers such shares to the custodian or nominee for the depositary to facilitate the issue of ADSs to a person representing the ordinary shares or to a person providing clearance services (or their nominee or agent), a liability to UK stamp duty or SDRT at the rate of 1.5 per cent (rounded up to the next multiple of £5 in the case of the stamp duty) of the listed price of the ordinary shares, calculated in sterling, will arise. Where a holder of ordinary shares transfers such shares to the custodian or nominee for the depositary or clearance services this charge will generally apply, and generally be payable by the person receiving the ADSs or transferring the ordinary shares into the clearance service. However, such transfers of ordinary shares will not attract a liability to stamp duty or SDRT where they satisfy the conditions of an exemption or relief, including exemptions which can apply to certain transfers made in the course of capital raising or qualifying listing arrangements.
The discussion above assumes that the provisions affecting stamp duty and SDRT contained in the Finance Bill currently proceeding through the UK Parliament are enacted in substantively the same form as currently published and have retroactive effect from 1 January 2024. These provisions, broadly, provide for the repeal of certain 1.5 per cent SDRT charges on the issue of securities by UK companies to a depositary receipt issuer or a clearance service (or their respective nominee or agent) and the capital raising and qualifying listing arrangement exemptions mentioned above. Until this Finance Bill receives Royal Assent (which is likely to be later in 2024) the relevant provisions have been given provisional statutory effect, as if they were contained in an Act of Parliament, under (in the case of SDRT) the Provisional Collection of Taxes Act 1968 and (in the case of stamp duty) the Finance Act 1973.
Specific professional advice should be sought before paying a 1.5 per cent stamp duty or SDRT charge in any circumstances. No liability to stamp duty or SDRT will arise as a result of the cancellation of any ADSs with the ordinary shares that they represent being transferred to the ADS holder. No liability to UK stamp duty or SDRT will arise on a transfer of ADSs provided that any document that gives effect to such transfer is not executed in the UK and remains at all subsequent times outside the UK. An agreement to transfer ADSs will not give rise to a liability to SDRT.
US federal income tax considerations
The following summary describes material US federal income tax consequences of the ownership and disposition of ADSs or ordinary shares to the US holders described below, but it does not purport to be a comprehensive description of all of the tax considerations that may be relevant to a decision to own such securities. The summary applies only to US holders that hold ADSs or ordinary shares as capital assets for US federal income tax purposes.
This discussion does not address any alternative minimum or Medicare Contribution tax consequences, nor does it address US federal tax consequences to US holders that are subject to special rules, such as:
•certain financial institutions;
•dealers or electing traders in securities that use a mark-to-market method of tax accounting;
•persons holding ADSs or ordinary shares as part of a hedge, straddle, wash sale, conversion or other integrated transaction or holders entering into a constructive sale with respect to ADSs or ordinary shares;
•persons whose functional currency for US federal income tax purposes is not the US Dollar;
•persons who acquired ADSs or ordinary shares pursuant to the exercise of any employee stock option or otherwise as compensation;
•tax-exempt entities, ‘individual retirement accounts’ or ‘Roth IRAs’;
•persons holding ADSs or ordinary shares in connection with a trade or business conducted outside of the United States;
•partnerships or other entities classified as partnerships for US federal income tax purposes; or
•persons that own or are deemed to own 10 per cent or more (by vote or value) of the stock of Lloyds Banking Group plc.
If an entity that is classified as a partnership for US federal income tax purposes owns ADSs or ordinary shares, the US federal income tax treatment of a partner will generally depend on the status of the partner and the activities of the partnership. Partnerships owning ADSs or ordinary shares and partners in such partnerships should consult their tax advisers as to the particular US federal income tax consequences of owning and disposing of the ADSs or ordinary shares.
This summary is based on the US Internal Revenue Code of 1986, as amended (the Code), administrative pronouncements, judicial decisions and final, temporary and proposed Treasury Regulations, as well as the Treaty, all as of the date hereof, changes to any of which may affect the tax consequences described herein, possibly with retroactive effect. It assumes that each obligation provided for in or otherwise contemplated by the Deposit Agreement will be performed in accordance with its terms.
| | | | | | | | |
167 | Lloyds Banking Group plc Annual Report on Form 20-F 2023 | |
As used herein, a ‘US holder’ is a person that is, for US federal income tax purposes, a beneficial owner of ADSs or ordinary shares and:
•a citizen or individual resident of the United States;
•a corporation, or other entity taxable as a corporation, created or organised in or under the laws of the United States, any state therein or the District of Columbia; or
•an estate or trust the income of which is subject to US federal income taxation regardless of its source.
In general, a US holder who owns ADSs should be treated as the owner of the underlying shares represented by those ADSs for US federal income tax purposes. Accordingly, no gain or loss should be recognised if a US holder exchanges ADSs for the underlying shares represented by those ADSs.
Owners of ADSs or ordinary shares should consult their tax advisers as to the US, UK or other tax consequences of the ownership and disposition of such securities in their particular circumstances, including the effect of any US state or local tax laws.
Taxation of distributions
Distributions paid on ADSs or ordinary shares, other than certain pro rata distributions of ordinary shares, will generally be treated as dividends to the extent paid out of Lloyds Banking Group plc’s current or accumulated earnings and profits (as determined in accordance with US federal income tax principles). Because Lloyds Banking Group plc does not maintain calculations of its earnings and profits under US federal income tax principles, it is expected that distributions generally will be reported to US holders as dividends. The dividends will generally be foreign-source income to US holders and will not be eligible for the dividends-received deduction generally allowed to US corporations under the Code.
Subject to applicable limitations, dividends paid to certain non-corporate US holders may be taxable at favourable rates. Non-corporate US holders should consult their tax advisers to determine whether the favourable rates will apply to dividends they receive and whether they are subject to any special rules that limit their ability to be taxed at these favourable rates.
Dividends will be included in a US holder’s income on the date of the US holder’s or, in the case of ADSs, the depositary’s receipt of the dividend. The amount of any dividend income will equal the US Dollar value of the pounds Sterling received, calculated by reference to the exchange rate in effect on the date of receipt regardless of whether the payment is converted into US Dollars on the date of receipt. If the pounds Sterling received as a dividend are not converted into US Dollars on the date of receipt, then the US holder’s tax basis in the pounds Sterling received will equal their US Dollar value on the date of receipt and the US holder may realise a foreign exchange gain or loss on the subsequent conversion into US Dollars. Generally, any gains or losses resulting from the conversion of pounds Sterling into US Dollars will be treated as US-source ordinary income or loss.
Taxation of capital gains
Gain or loss realised by a US holder on a sale or other disposition of ADSs or ordinary shares will generally be subject to US federal income tax as capital gain or loss in an amount equal to the difference between the US holder’s tax basis in the ADSs or ordinary shares disposed of and the amount realised on the disposition, in each case as determined in US Dollars. Gains or losses, if any, will generally be US-source and will be long-term if the US holder held the ADSs or ordinary shares for more than one year. The deductibility of losses is subject to limitations.
Any UK stamp duty or SDRT imposed upon transfers of ADSs or ordinary shares will not be treated as a creditable foreign tax for US federal income tax purposes. US holders should consult their tax advisers regarding whether any such UK stamp duty or SDRT may be deductible or reduce the amount of gain (or increase the amount of loss) recognized upon a sale or other disposition of the ADSs or ordinary shares.
Information reporting and backup withholding
Dividends paid on, and the sale proceeds from, ADSs or ordinary shares that are made within the US or through certain US-related financial intermediaries may be subject to information reporting and backup withholding requirements unless the US holder:
•is a corporation or other exempt recipient, or
•in the case of backup withholding, the US holder provides a correct taxpayer identification number and certifies that it is not subject to backup withholding.
The amount of any backup withholding from a payment to a US holder will be allowed as a credit against the US holder’s US federal income tax liability and may entitle it to a refund, provided that the required information is timely furnished to the Internal Revenue Service.
Where you can find more information
The SEC maintains a website at www.sec.gov which contains, in electronic form, each of the reports and other information that the Group has filed electronically with the SEC.
References herein to Lloyds Banking Group websites are textual references only and information on or accessible through such websites does not form part of and is not incorporated into this Form 20-F.
Enforceability of civil liabilities
Lloyds Banking Group plc is a public limited company incorporated under the laws of Scotland. Most of Lloyds Banking Group plc’s directors and executive officers and certain of the experts named herein are residents of the UK. A substantial portion of the assets of Lloyds Banking Group plc, its subsidiaries and such persons, are located outside the United States. As a result, it may not be possible for investors to effect service of process within the United States upon all such persons or to enforce against them in US courts judgments obtained in such courts, including those predicated upon the civil liability provisions of the federal securities laws of the United States. Furthermore, Lloyds Banking Group plc has been advised by its solicitors that there is doubt as to the enforceability in the UK, in original actions or in actions for enforcement of judgments of US courts, of certain civil liabilities, including those predicated solely upon the federal securities laws of the United States.
| | | | | | | | |
168 | Lloyds Banking Group plc Annual Report on Form 20-F 2023 | |
Set out below is a summary of certain risk factors which could affect the Group’s future results and may cause them to differ from expected results materially. The factors discussed below should not be regarded as a complete and comprehensive statement of all potential risks and uncertainties that the Group’s businesses face. This section should be read in conjunction with the more detailed information contained in this document, including as set forth in sections entitled “Business”, “Regulation” and “Operating and financial review and prospects”. For information on the Group’s risk management policies and procedures, see “Operating and financial review and prospects — Risk Management”.
Economic and financial risks
1.The Group’s businesses are subject to inherent and indirect risks arising from general macroeconomic conditions in the UK in particular, but also in the Eurozone, the U.S., Asia and globally
The Group’s businesses are subject to inherent and indirect risks arising from general and sector-specific economic conditions in the markets in which it operates, particularly the UK, where the Group’s earnings are predominantly generated, and its operations are concentrated. Whilst the Group’s revenues are predominantly generated in the UK, the Group does have some credit exposure in countries outside the UK, even if it does not have a presence in all of these countries.
Uncertain and volatile economic conditions can create a challenging operating environment for the Group. The outlook for the global economy has many uncertainties including: low economic activity, inflation and heightened interest rates, falls in asset prices such as residential and commercial property, elevated energy prices, supply chain disruption, changes to monetary and fiscal policy, and the impact of armed conflict (in particular the war between Russia and Ukraine and the conflict in the Middle East).
Any macroeconomic deterioration in the UK and/or other economies could manifest itself through developments such as increased unemployment, reduced corporate profitability, reduced personal income levels, increased inflation, reduced government and/or consumer expenditure, increased corporate, small and medium-sized enterprises (“SME”) or personal insolvency rates, reductions in borrowers’ ability to repay loans, increased tenant defaults, and decreasing property prices. Moreover, divergence in economic performance between countries and regions could induce fluctuations in commodity prices and changes in foreign exchange rates. Any of these could have a material adverse effect on the results of operations, financial condition or prospects of the Group.
Political and geopolitical developments could affect the wider economic environment, as well as the financial condition of the Group’s customers, clients and counterparties, including governments and other financial institutions.
Any adverse changes affecting the economies of the countries in which the Group has significant direct and indirect credit exposures and any further deterioration in global macroeconomic conditions, including as a result of geopolitical events could have a material adverse effect on the Group’s results of operations, financial condition or prospects. These could include acts of terrorism or war, including cyber-attacks.
More generally, wider geopolitical developments have the potential to accentuate the key economic risks in the current economic conjuncture, or to act as the trigger that upsets the finely balanced position of the global economic cycle. In particular, crystallisation of some geopolitical risks might be expected to simultaneously worsen the outlook for economic activity while adding to inflationary pressure through their impacts on commodity and energy markets and global supply chains. Such developments would reinforce the twin supply-side shocks that emerged in the aftermath of the COVID-19 pandemic and Russia’s invasion of Ukraine and complicate the task of calibrating an appropriate setting of monetary policy.
Pertinent geopolitical risks include, but are not limited to, an escalation of recent conflict in the Middle East to include involvement of other sovereign states; a further escalation of Russia’s war with Ukraine; further deterioration in the relationship between the U.S. and China and the potential for conflict in Taiwan; and more gradually, increasing barriers to free trade and diversity of supply chains as a result of inter-bloc economic competition and efforts to re-shore strategic production.
The Group is also likely to be subject to domestically-sourced political risks, including a prospective change of government, policy and regulation in the lead-up to a UK general election which must take place by January 2025. In particular, choices of taxation and spending priorities against a backdrop of fiscal pressures and income and regional inequalities could have implications for the Group’s customers, financial condition and prospects.
Outside of the standard economic and financial risks, and the implications of geopolitical developments, the Group faces a large number of other risks which may have broader economic and financial consequences. Any and all such events described herewith could have a material adverse effect on the Group’s business, financial condition, results of operations, prospects, liquidity, capital position and credit ratings (including potential changes of outlooks or ratings), as well as on its customers, borrowers, counterparties, employees and suppliers.
Pertinent risks include, but are not confined to, risks relating to climate change, epidemiological and health-related developments, and technological disruptions, including from the wider adoption of artificial intelligence.
2.The Group’s businesses are subject to inherent risks concerning liquidity and funding, particularly if the availability of traditional sources of funding such as retail deposits or the access to wholesale funding markets becomes more limited
Liquidity and funding continues to remain a key area of focus for the Group and the industry as a whole. Like all major banks, the Group is dependent on confidence in the short and long-term wholesale funding markets. The Group relies on customer savings and transmission balances, as well as ongoing access to the global wholesale funding markets to meet its funding needs. The ability of the Group to gain access to wholesale and retail funding sources on satisfactory economic terms is subject to a number of factors outside its control, such as liquidity constraints, general market conditions, regulatory requirements, the encouraged or mandated repatriation of deposits by foreign wholesale or central bank depositors and the level of confidence in the UK banking system.
The Group’s profitability or solvency could be adversely affected if access to liquidity and funding is constrained, made more expensive for a prolonged period of time or if the Group experiences an unusually high and unforeseen level of withdrawals. In such circumstances, the Group may not be in a position to continue to operate or meet its regulatory minimum liquidity requirements without additional funding support, which it may be unable to access (including government and central bank facilities).
The Group is also subject to the risk of deterioration of the commercial soundness and/or perceived soundness of other financial services institutions within and outside the UK. Financial services institutions that deal with each other are interrelated as a result of trading, investment, clearing, counterparty and other relationships. This presents systemic risk, as was seen during the failures of Silicon Valley Bank and Credit Suisse in 2023, and may adversely affect financial intermediaries, such as clearing agencies, clearing houses, banks, securities firms and exchanges with which the Group interacts on a daily basis, any of which could have a material adverse effect on the Group’s ability to raise new funding. A default by, or even concerns about the financial resilience of, one or more financial services institutions could lead to further significant systemic liquidity problems, or losses or defaults by other financial institutions, which could have a material adverse effect on the Group’s results of operations, financial condition or prospects.
| | | | | | | | |
169 | Lloyds Banking Group plc Annual Report on Form 20-F 2023 | |
Corporate and institutional counterparties may also seek to reduce aggregate credit exposures to the Group (or to all banks) which could increase the Group’s cost of funding and limit its access to liquidity. The funding structure employed by the Group may also prove to be inefficient, thus giving rise to a level of funding cost where the cumulative costs are not sustainable over the longer term.
In addition, medium-term growth in the Group’s lending activities will rely, in part, on the availability of retail deposit funding on appropriate terms, which is dependent on a variety of factors outside the Group’s control, such as general macroeconomic conditions and market volatility, the confidence of retail depositors in the economy, the financial services industry and the Group, as well as the availability and extent of deposit guarantees. Increases in the cost of retail deposit funding will impact on the Group’s margins and affect profit, and a lack of availability of retail deposit funding could have a material adverse effect on its future growth. Any loss in consumer confidence in the Group could significantly increase the amount of retail deposit withdrawals in a short period of time. See “Economic and Financial Risks – The Group’s businesses are subject to inherent and indirect risks arising from general macroeconomic conditions in the UK in particular, but also in the Eurozone, the U.S., Asia and globally”.
The Group makes use of central bank funding schemes such as the BoE’s Term Funding Scheme with additional incentives for SMEs (the “TFSME”). Following the closure of this scheme in 2021, the Group will have to replace matured drawings in 2025, 2027 and beyond, which could cause an increased dependence on term funding issuances. If the wholesale funding markets were to suffer stress or central bank provision of liquidity to the financial markets is abruptly curtailed, or the Group’s credit ratings are downgraded, it is possible that wholesale funding will prove more difficult to obtain.
Any of the refinancing or liquidity risks mentioned above, in isolation or in concert, could have a material adverse effect on the Group’s results or operations and its ability to meet its financial obligations as they fall due.
3.A reduction in the Group’s longer-term credit rating could materially adversely affect the Group’s results of operations, financial condition or prospects
Rating agencies regularly evaluate the Group and the Company, and their ratings of longer-term debt are based on a number of factors which can change over time, including the Group’s financial strength as well as factors not entirely within its control, such as conditions affecting the financial services industry generally, and the legal and regulatory frameworks affecting its legal structure, business activities and the rights of its creditors. In light of the difficulties in the financial services industry and the financial markets, there can be no assurance that the Group or the Company will maintain their current ratings. The credit rating agencies may also revise the ratings methodologies applicable to issuers within a particular industry or political or economic region. If credit rating agencies perceive there to be adverse changes in the factors affecting an issuer’s credit rating, including by virtue of change to applicable ratings methodologies, the credit rating agencies may downgrade, suspend or withdraw the ratings assigned to an issuer and/or its securities. A downgrade of an entity of the Group may materially adversely affect the other individual Group entities, or the Group as a whole. Downgrades of the Group’s longer-term credit rating could lead to additional collateral posting and cash outflow, significantly increase its borrowing costs, limit its issuance capacity in the capital markets and weaken the Group’s competitive position in certain markets.
4.The Group’s businesses are inherently subject to the risk of market fluctuations, which could have a material adverse effect on the results of operations, financial condition or prospects of the Group
The Group’s businesses are inherently subject to risks in financial markets including changes in, and increased volatility of, interest rates, inflation rates, credit spreads, foreign exchange rates, commodity, equity, bond and property prices and the risk that its customers act in a manner which is inconsistent with the Group’s business, pricing and hedging assumptions. Movements in these markets will continue to have a significant adverse or positive impact on the Group in a number of key areas.
For example, adverse market movements have had, and will likely continue to have, an adverse effect, upon the financial condition of the defined benefit pension schemes of the Group. The schemes’ main exposures are to real rate risk and credit spread risk. These risks arise from two main sources: the “AA” corporate bond liability discount rate and asset holdings.
In addition, the Group’s banking and trading activities are also subject to market movements. For example, changes in interest rate levels, yield curves and spreads affect the interest rate margin realised between lending and borrowing costs. The potential for future volatility and margin changes remains. Competitive pressures on fixed rates or product terms in existing loans and deposits may restrict the Group in its ability to change interest rates applying to customers in response to changes in official and wholesale market rates.
The insurance business of the Group is exposed indirectly to equity and credit markets through the value of future management charges on policyholder funds. Credit default spread risk and interest rate risk within the insurance business primarily arises from bonds and loans used to back annuities. Inflation risk arises from inflation linked policyholder benefits and future expenses.
Changes in foreign exchange rates, including with respect to the U.S. dollar and the Euro, may also have a material adverse effect on the Group’s financial position and/or forecasted earnings.
5.Market conditions have resulted, and are expected to result in the future, in material changes to the estimated fair values of financial assets of the Group, including negative fair value adjustments
The Group has exposures to securities, derivatives and other investments, including asset-backed securities, structured investments and private equity investments that are recorded by the Group at fair value, which may be subject to further negative fair value adjustments in view of the volatile global markets and challenging economic environment.
In volatile markets, hedging and other risk management strategies (including collateralisation and the purchase of credit default swaps) may not be as effective as they are in normal market conditions, due in part to the decreasing credit quality of hedge counterparties, and general illiquidity in the markets within which transactions are executed.
In circumstances where fair values are determined using financial valuation models, the Group’s valuation methodologies may require it to make assumptions, judgements and estimates in order to establish fair value. These valuation models are complex, and the assumptions used are difficult to make and are inherently uncertain. This uncertainty may be amplified during periods of market volatility and illiquidity. Any consequential impairments, write-downs or adjustments could have a material adverse effect on the Group’s results of operations, capital ratios, financial condition or prospects.
Any of these factors could cause the value ultimately realised by the Group for its securities and other investments to be lower than their current fair value or require the Group to record further negative fair value adjustments, which may have a material adverse effect on its results of operations, financial condition or prospects.
| | | | | | | | |
170 | Lloyds Banking Group plc Annual Report on Form 20-F 2023 | |
6.Any tightening of monetary policy in jurisdictions in which the Group operates could affect the financial condition of its customers, clients and counterparties, including governments and other financial institutions
Quantitative easing measures implemented by major central banks, adopted alongside record low interest rates to support recovery from the global financial crisis and, the COVID-19 pandemic, helped to loosen financial conditions and reduced borrowing costs. These measures may have supported liquidity and valuations for asset classes that are vulnerable to rapid price corrections as financial conditions tighten, potentially causing losses to investors and increasing the risk of default on the Group’s exposure to these sectors.
Key economic risks in the current conjuncture centre on the finely-balanced position of the global economic cycle. Monetary policy has been tightened substantially in the UK and globally in response to inflationary pressures that emerged in the aftermath of the twin supply shocks of the COVID-19 pandemic and Russia’s invasion of Ukraine. This has achieved a policy stance generally considered to be intentionally restrictive on aggregate economic activity. There remains uncertainty around whether the extent of monetary policy restriction applied to date is sufficient to eventually return inflation rates to rates targeted by central banks. This may mean an argument for further policy tightening. Conversely, with the full effect of the monetary policy tightening to date yet to be felt on either economic activity or in terms of its eventual impact on inflation, there remains the risk of overtightening, prospectively leading to an unexpected deterioration of economic activity and recessions.
If necessitated by the persistence of underlying inflationary pressures, the further tightening of monetary policy should be expected to add to pressure on individual disposable incomes as well as corporate profits. Whether operating through increases in policy rates or through the direct and indirect effects of ‘Quantitative Tightening’ reversing past purchases of assets by central banks, such impacts on customers could adversely affect the Group’s profitability and prospects. Moreover, the further tightening of monetary policy may accentuate financial vulnerabilities among consumers as well as entities with stretched balance sheets in both the non-financial and financial sectors, including governments and non-bank financial institutions such as insurers, pension funds, hedge funds and mutual funds. More restrictive settings of monetary policy may crystallise a risk of more sudden and discontinuous repricing of assets, and the potential for wider contagion effects. A decline in collateral values could lead to a reduction in recoverability and value of the Group’s assets and higher levels of expected credit loss allowances, which could have an adverse effect on its operations, financial condition and prospects.
Conversely, if prompted by economic weakness or quicker-than-expected disinflation, decreases in policy rates could lead to pressure on the Group’s interest margins, potentially adversely affecting the Group’s profitability and prospects.
7.The Group’s businesses are subject to inherent risks concerning borrower and counterparty credit quality which have affected and may adversely impact the recoverability and value of assets on the Group’s balance sheet
The Group has exposures to many different products, counterparties, obligors and other contractual relationships and the credit quality of its exposures can have a significant impact on its earnings. Credit risk exposures are categorised as either “retail” or “corporate” and reflect the risks inherent in the Group’s lending and lending-related activities and its insurance business primarily in respect of investment holdings and exposures to reinsurers.
Adverse changes in the credit quality of the Group’s UK and/or international borrowers and counterparties or collateral held in support of exposures, or in their behaviour or businesses, may reduce the value of the Group’s assets and materially increase its write-downs and allowances for impairment losses. Credit risk can be affected by a range of factors outside the Group’s control, which include but are not limited to an adverse economic environment, the effect of the UK’s withdrawal from the EU and other changes to external trading agreements, increased unemployment, reduced UK and global consumer and/or government spending and benefits, and changes in consumer and customer demands and requirements, reduced income levels, decreased consumer confidence, reduced corporate profits, labour shortages, knock-on impact of geopolitical developments such as the war in Ukraine and the conflict in the Middle East including, but not limited to, supply constraints and rising energy and commodity costs, which are contributing to high and persistent inflation increasing and/or sustained high interest rates, changes in the credit rating of individual counterparties, over-indebtedness and the debt levels of individual contractual counterparties, increased personal or corporate insolvency levels, changes to insolvency regimes which make it harder to enforce against counterparties, counterparty challenges to the interpretation or validity of contractual arrangements, reduced asset values, falling stock and bond/other financial markets, changes in interest rates or foreign exchange rates, an increase in credit spreads, negative reputational impact or direct campaigns which adversely impact customers, industries or sectors and any external factors of a political, legislative, environmental or regulatory nature, including changes in accounting rules and changes to tax legislation and rates.
In particular, the Group has exposure to concentration risk where its business activities focus particularly on a single obligor, related/connected group of obligors or a similar type of customer (borrower, sovereign, financial institution or central counterparty), product, industrial sector or geographic location, including the UK.
The Group’s credit exposure includes residential mortgage lending (in the UK and, to a lesser extent, the Netherlands) and commercial real estate lending, including lending secured against secondary and tertiary commercial property assets in the UK. As a result, decreases in residential or commercial property values, reduced rental payments and/or increases in tenant defaults are likely to lead to higher impairment charges, which could materially affect the Group’s results, operations, financial condition or prospects. Risks to the housing market are growing because of elevated mortgage rates and tightening lending standards, which may result in adjustments to housing valuations. Elevated interest rates could lead to ‘payment shock’ for borrowers on a variable rate mortgage or whose fixed rate mortgages are due to expire, with a second order impact for renters as landlords may increase rents. An increase in housing costs could make current customer borrowing unaffordable, leading to an increase in defaults and higher impairment charges on secured and unsecured retail exposures. The Group also has significant credit exposure to certain individual counterparties in higher risk and cyclical asset classes and sectors (such as commercial real estate, financial intermediation, manufacturing, leveraged lending, oil and gas and related sectors, hotels, commodities trading, automotive and related sectors, construction, agriculture, consumer-related sectors (such as retail, passenger transport and leisure), house builders and outsourcing services). All sectors, including vulnerable sectors, may also feel the pressure from a number of heightened risk drivers, including higher energy costs. The Group’s retail customer portfolios will remain strongly linked to the UK economic environment, with house price deterioration, unemployment increases, inflationary pressures, consumer over-indebtedness and prolonged low or rising interest rates among the factors that may impact secured and unsecured retail credit exposures. Deterioration in used vehicle prices, including as a result of changing consumer demand or the transition of the motor sector from vehicles with internal combustion engines to electric vehicles, could result in increased provisions and/or losses and/or accelerated depreciation charges.
In addition, climate change is likely to have a significant impact on many of the Group’s customers, as well as on various industry sectors that the Group operates in. There is a risk that borrower and counterparty credit quality and collateral/asset valuations could be adversely affected as a result of these changes. See also “Business and Operational Risks – The Group is subject to the financial and non-financial risks related with Environmental, Social and Governance (“ESG”) matters, for example, climate change and human rights issues”.
| | | | | | | | |
171 | Lloyds Banking Group plc Annual Report on Form 20-F 2023 | |
The Group’s corporate lending portfolio also contains substantial exposure to large and mid-sized, public and private companies. These exposures may give rise to single name concentration and risk capital exposure. Corporate customers, particularly those in consumer facing sectors, are likely to be further impacted by a reduction in discretionary consumer spending in the face of higher inflation and elevated interest rates. Higher rates also increase refinance risk across the Group’s portfolios. Recent depreciation of Sterling has resulted in increased costs for customers, particularly those with little or no hedging arrangements and those heavily reliant on imports. The Group’s corporate and financial institution portfolios are also susceptible to "fallen angel" risk, that is, the probability of significant default increases following material unexpected events, resulting in the potential for large losses. As in the UK, the Group’s lending business overseas is also exposed to a small number of long-term customer relationships and these single name concentrations place the Group at risk of loss should default occur.
Any disruption to the liquidity or transparency of the financial markets may result in the Group’s inability to sell or syndicate securities, loans or other instruments or positions held (including through underwriting), thereby leading to concentrations in these positions. These concentrations could expose the Group to losses if the mark-to-market value of the securities, loans or other instruments or positions declines causing the Group to take write-downs. Moreover, the inability to reduce the Group’s positions not only increases the market and credit risks associated with such positions, but also increases the level of risk-weighted assets on the Group’s balance sheet, thereby increasing its capital requirements and funding costs, all of which could materially adversely affect the Group’s results of operations, financial condition or prospects. Financial markets turbulence could result in reductions in the value of financial collateral, requiring counterparties to post additional funds. Instances where counterparties are unable to meet these margin calls, whether due to operational issues, failure of the Group’s counterparties receiving funds expected from their own counterparties or a lack of borrower liquidity, could place the Group at risk of loss should default occur.
The highly interconnected nature of the financial services ecosystem exposes the Group to a heightened level of contagion and systemic risk. Despite the diversified range of products and services offered by the Group (across a range of sectors and geographies), the underlying commonalities in exposures can lead to unexpected levels of concentration and correlation risk once aggregated across clients and sectors. For example, this may include: i) similarities in security to support lending and trading activity; ii) common use of, and exposure to, core financial services infrastructure (such as custodians, clearing houses and payment banks); and iii) underlying exposures being governed by the same regulation. Although the exposure to certain risk types, including but not limited to credit, will vary across different areas of the Group, this interconnectedness results in a higher propensity for risk transfer, both internally and across the wider financial services sector, meaning the financial quantification of risk is difficult. The shadow banking sector, which is the provision of credit intermediation to borrowers by institutions which are not formally regulated as banks, has grown significantly in recent years, and now represents a significant proportion of the global financial system, giving rise to indirect risks across the financial system, through interconnectedness and asset price volatility. Whilst the Group monitors and controls direct exposure to the shadow banking sectors, the Group remains at risk from direct and indirect risks, which could materially increase its write-downs and allowances for impairment losses.
Providing support to customers under the COVID-19 government schemes meant that the Group extended its lending risk appetite in line with the various scheme guidelines at the time and, despite the protection offered by the UK Government’s or by the BoE’s guarantees, as applicable, in respect of the schemes, this may lead to additional losses. These schemes (Bounce Back Loans Scheme (“BBLS”), Coronavirus Business Interruption Loan Scheme (“CBILS”) and Coronavirus Large Business Interruption Loan Scheme (“CLBILS”)) closed to new applications on 31 March 2021.
Repayments on government lending scheme loans commenced from the second quarter of 2021. However, BBLS benefits from Pay As You Grow options which may materially delay repayments through, for example, extended payment holidays, and have the potential to delay recognition of customer financial difficulties.
Lending decisions, and decisions related to other exposures (including, but not limited to, undrawn commitments, derivative, equity, contingent and/or settlement risks), are dependent on the Group’s assessment of each customer’s ability to repay and the value of any underlying security. Such assessments may also take into account future forecasts, which may be less reliable due to the uncertainty of their accuracy and probability. There is an inherent risk that the Group has incorrectly assessed the credit quality and/or the ability or willingness of borrowers to repay, possibly as a result of incomplete or inaccurate disclosure by those borrowers or as a result of the inherent uncertainty that is involved in the exercise of constructing and using models to estimate the risk of lending to counterparties.
8.The Group’s insurance business and defined benefit pension schemes are subject to insurance risks
The insurance business of the Group is exposed to short-term and longer-term variability arising from uncertain longevity due to the annuity portfolios. The Group’s defined benefit pension schemes are also exposed to longevity risk. Increases in life expectancy (longevity) beyond current allowances will increase the cost of annuities and pension scheme benefits and may adversely affect the Group’s financial condition and results of operations.
Customer behaviour in the insurance business may result in increased cancellations or ceasing of contributions at a rate in excess of business assumptions. Consequent reduction in policy persistency and fee income would have an adverse impact upon the profitability of the insurance business of the Group.
The insurance business of the Group is also exposed to the risk of uncertain insurance claim rates. For example, extreme weather conditions can result in high property damage claims and higher levels of theft can increase claims on home insurance. These claims rates may differ from business assumptions and adversely affect the Group’s financial condition and results of operations.
To a lesser extent, the insurance business is exposed to mortality, morbidity and expense risk. Adverse developments in any of these factors could adversely affect the Group’s financial condition and results of operations.
9.The Group may be required to record Credit Value Adjustments, Funding Value Adjustments and Debit Value Adjustments on its derivative portfolio, which could have a material adverse effect on its results of operations, financial condition or prospects
The Group continually seeks to limit and manage counterparty credit risk exposure to market counterparties. Credit Value Adjustment (“CVA”) and Funding Value Adjustment (“FVA”) reserves are held against uncollateralised derivative exposures and a risk management framework is in place to mitigate the impact on income of reserve value changes. CVA is an expected loss calculation that incorporates current market factors including counterparty credit spreads. FVA reserves are held to capitalise the cost of funding uncollateralised derivative exposures. The Group also calculates a Debit Value Adjustment to reflect own credit spread risk as part of the fair value of derivative liabilities.
Deterioration in the creditworthiness of financial counterparties, or large adverse financial market movements could impact the size of CVA and FVA reserves and result in a material charge to the Group’s profit and loss account which could have a material adverse effect on its results of operations, financial condition or prospects.
| | | | | | | | |
172 | Lloyds Banking Group plc Annual Report on Form 20-F 2023 | |
Regulatory and legal risks
1.The Group and its businesses are subject to substantial regulation and oversight. Adverse legal or regulatory developments could have a material adverse effect on the Group’s business, results of operations, financial condition or prospects
The Group and its businesses are subject to legislation, regulation, court proceedings, policies and voluntary codes of practice in the UK, the EU and the other markets in which it operates. Adverse legal or regulatory developments could have a material adverse effect on the Group’s business, results of operations, financial condition or prospects which are beyond its control, including:
(i)external bodies applying or interpreting standards, laws, regulations or contracts differently to the Group;
(ii)changes to the prudential regulatory environment;
(iii)changes in competitive and pricing environments, including markets investigations, or one or more of the Group’s regulators intervening to mandate the pricing of the Group’s products as a consumer protection measure;
(iv)one or more of the Group’s regulators intervening to prevent or delay the launch of a product or service, or prohibiting an existing product or service;
(v)further requirements relating to financial reporting, corporate governance, corporate structure and conduct of business and employee compensation;
(vi)expropriation, nationalisation, confiscation of assets and changes in legislation relating to foreign ownership;
(vii)changes to regulation and legislation relating to economic and trading sanctions, money laundering and terrorist financing;
(viii)developments in the international or national legal environment resulting in regulation, legislation and/or litigation targeting entities such as the Group for investing in, or lending to, organisations deemed to be responsible for, or contributing to, climate change; and
(ix)regulatory changes which influence business strategy, particularly the rate of growth of the business, or which impose conditions on the sales and servicing of products which have the effect of making such products unprofitable or unattractive to sell.
These laws and regulations include increased regulatory oversight, particularly in respect of conduct issues, data protection, product governance and prudential regulatory developments, including ring-fencing.
Unfavourable developments across any of these areas, both in and outside the UK, as a result of the factors above could materially affect the Group’s ability to maintain appropriate liquidity, increase its funding costs, constrain the operation of its business and/or have a material adverse effect on its business, results of operations and financial condition.
2.The Group faces risks associated with its compliance with a wide range of laws and regulations
The Group is exposed to risk associated with compliance with laws and regulations, including:
(i)certain aspects of the Group’s activities and business may be determined by the relevant authorities, the Financial Ombudsman Service, regulatory bodies or the courts to not have been conducted in accordance with applicable laws or regulations;
(ii)the possibility of alleged mis-selling of financial products or the mishandling of complaints related to the sale of such products by or attributed to a member of the Group, resulting in disciplinary action or requirements to amend sales processes, withdraw products, or provide restitution to affected customers, all of which may require additional provisions and significant time and attention;
(iii)risks relating to compliance with, or enforcement actions in respect of, existing and/or new regulatory or reporting requirements, including as a result of a change in focus of regulation or a transfer of responsibility for regulating certain aspects of the Group’s activities and business to other regulatory bodies;
(iv)risks relating to failure to assess the resilience of banks to potential adverse economic or financial developments including implication from regulatory stress test results;
(v)contractual and other obligations may either not be enforceable as intended or may be enforced against the Group in an adverse way;
(vi)the intellectual property of the Group (such as trade names) may not be adequately protected;
(vii)the Group may be liable for damages to third parties harmed by the conduct of its business; and
(viii)the risk of regulatory proceedings, enforcement actions and/or private litigation, arising out of regulatory investigations or otherwise (brought by individuals or groups of plaintiffs) in the UK and other jurisdictions.
Regulatory and legal actions pose a number of risks to the Group, including substantial monetary damages or fines, the amounts of which are difficult to predict and may exceed the amount of provisions set aside to cover such risks. See “Regulatory and Legal Risks – The financial impact of legal proceedings and regulatory risks may be material and is difficult to quantify. Amounts eventually paid may materially exceed the amount of provisions set aside to cover such risks, or existing provisions may need to be materially increased in response to changing circumstances”. In addition, the Group may be subject, including as a result of regulatory actions, to other penalties and injunctive relief, civil or private litigation arising out of a regulatory investigation or otherwise, the potential for criminal prosecution in certain circumstances and regulatory restrictions on the Group’s business, including the potential requirement to hold additional capital, all of which can have a negative effect on the Group’s reputation as well as taking a significant amount of management time and resources away from the implementation of its strategy.
The Group may settle litigation or regulatory proceedings prior to a final judgment or determination of liability to avoid the cost, management efforts or negative business, regulatory or reputational consequences of continuing to contest liability, even when the Group believes that it has no liability or when the potential consequences of failing to prevail would be disproportionate to the costs of settlement. Furthermore, the Group may, for similar reasons, reimburse counterparties for their losses even in situations where the Group does not believe that it is legally compelled to do so. Failure to manage these risks adequately could materially affect the Group, both financially and reputationally.
Regulatory divergence, including for example with respect to Payment Service Regulations, Consumer Credit Directive, General Data Protection Regulations and Edinburgh Reforms, as a consequence of the UK’s exit from the EU and developments in both the UK and the EU, is likely to result in increased compliance costs on the Group and potential barriers to cross-border trade in financial services and loss of customers.
General changes in government, central bank or regulatory policy, or changes in regulatory regimes that may influence investor decisions in particular markets in which the Group operates, and which may change the structure of those markets and the products offered or may increase the costs of doing business in those markets.
| | | | | | | | |
173 | Lloyds Banking Group plc Annual Report on Form 20-F 2023 | |
3.The Group is subject to resolution planning requirements
In July 2019, the BoE and the PRA published final rules for a resolvability assessment framework (the “Resolvability Assessment Framework”), and full implementation of the framework became effective from 1 January 2022. This requires the Group to carry out a detailed assessment of its preparations for resolution and publicly disclose this every two years. The BoE published the results of their first assessment of the Group’s preparations for resolution on 10 June 2022. The BoE identified one shortcoming and no deficiencies or substantive impediments to resolvability. The shortcoming is with regards to the Group’s approach to achieving the Adequate Financial Resources outcome relating to the Group’s Funding in Resolution capabilities. The Group has enhanced its capabilities and believes these enhancements will work towards addressing the BoE findings. The Group submitted its second Resolvability Assessment Framework Self-Assessment in October 2023, and the BoE will assess progress and report publicly in June 2024. In the event the outcome of biennial assessments as part of the Resolvability Assessment Framework result in the BoE identifying deficiencies or substantive impediments to resolvability, there may be further direction from the BoE to remove impediments to ensure the effective exercise of stabilisation powers which could affect the way in which the Group manages its business and ultimately impact the profitability of the Group. In addition, the public disclosure of the outcome of such assessments may affect the way the Group is perceived by the market which, in turn, may affect the secondary market value of securities issued by the Group and members of the Group.
4.The Group is subject to regulatory actions which may be taken in the event of a bank or Group failure
Under the Banking Act 2009, as amended, (the “Banking Act”), substantial powers have been granted to HM Treasury, the BoE, the PRA and the UK Financial Conduct Authority (the “FCA”, and together with the HM Treasury, the BoE and the PRA, the “Authorities”) as part of the special resolution regime (the “SRR”). These powers enable the Authorities to deal with and stabilise UK-incorporated institutions with permission to accept deposits (including members of the Group) and their parent entities (including the Company) if they are failing or are likely to fail to satisfy certain threshold conditions.
The SRR consists of five stabilisation options: (i) mandatory transfer of all or part of the business of the relevant entity or the shares of the relevant entity to a private sector purchaser; (ii) transfer of all or part of the business of the relevant entity to a “bridge bank” established and wholly owned by the BoE; (iii) transfer of all or part of the relevant entity or “bridge bank” to an asset management vehicle; (iv) bail-in of the relevant entity’s equity, capital instruments and liabilities; and (v) temporary public ownership of the relevant entity. HM Treasury may also take a parent company of a relevant entity into temporary public ownership where certain conditions are met. Certain ancillary powers include the power to modify contractual arrangements in certain circumstances.
Under the Banking Act, powers are granted to the BoE which include, but are not limited to: (i) a mandatory “write-down and conversion power” relating to Tier 1 and Tier 2 capital instruments and (ii) a “bail-in” power relating to the capital instruments and the vast majority of unsecured liabilities (including the senior unsecured debt securities issued by the Group). Such loss absorption powers give the BoE the ability to write-down or write-off all or a portion of the claims of certain securities of a failing institution or group and/or to convert certain debt claims into another security, including ordinary shares of the surviving group entity, if any. Such resulting ordinary shares may be subject to severe dilution, transfer for no consideration, write-down or write-off. The Banking Act specifies the order in which the mandatory write-down and conversion power and the bail-in tool should be applied, reflecting the hierarchy of capital instruments under Regulation (EU) No 575/2013 (as amended) as it forms part of domestic law by virtue of the EUWA and related legislation, with certain amendments (the “Capital Requirements Regulation”) and otherwise respecting the hierarchy of claims in an ordinary insolvency. Furthermore, the BoE has published a statement in regards to the UK creditor hierarchy which explains that the UK’s bank resolution framework has a clear statutory order in which shareholders and creditors would bear losses in a resolution or insolvency scenario and that Additional Tier 1 instruments rank ahead of CET1 and behind Tier 2 in the hierarchy. Holders of such instruments should expect to be exposed to losses in resolution or insolvency in the order of their positions in this hierarchy. Moreover, the Banking Act and secondary legislation made thereunder provides certain limited safeguards for creditors in specific circumstances. For example, a holder of debt securities issued by the Company should not suffer a worse outcome as a result of resolution proceedings than it would in insolvency proceedings. However, this “no creditor worse off” safeguard may not apply in relation to an application of the write-down and conversion power in circumstances where a stabilisation power is not also used. The exercise of mandatory write-down and conversion power, or other stabilisation powers under the Banking Act, or any suggestion of such exercise could materially adversely affect the rights of the holders of equity and debt securities and the price or value of their investment and/or the ability of the Group to satisfy its obligations under such debt securities.
The BoE also has powers to amend the terms of contracts (for example, varying the maturity of a debt instrument) and to override events of default or termination rights that might be invoked as a result of the exercise of the resolution powers, which could have a material adverse effect on the rights of holders of the equity and debt securities issued by the Group, including through a material adverse effect on the price of such securities. The Banking Act also gives the BoE the power to override, vary or impose contractual obligations between a UK bank, its holding company and its group undertakings for reasonable consideration, in order to enable any transferee or successor bank to operate effectively. There is also power for HM Treasury to amend the law (excluding provisions made by or under the Banking Act) for the purpose of enabling it to use the regime powers effectively, potentially with retrospective effect.
The determination that securities and other obligations issued by the Group will be subject to loss absorption is likely to be inherently unpredictable and may depend on a number of factors which may be outside of the Group’s control. This determination will also be made by the BoE and there may be many factors, including factors not directly related to the Company or the Group, which could result in such a determination. Because of this inherent uncertainty and given that the relevant provisions of the Banking Act remain largely untested in practice, it will be difficult to predict when, if at all, the exercise of a loss absorption power may occur which would result in a principal write-off or conversion to other securities, including the ordinary shares of the Company. Moreover, as the criteria that the BoE will be obliged to consider in exercising any loss absorption power provide it with considerable discretion, holders of the securities issued by the Group may not be able to refer to publicly available criteria in order to anticipate a potential exercise of any such power and consequently its potential effect on the Group and the securities issued by the Group.
Potential investors in the securities issued by the Group should consider the risk that a holder may lose some or all of its investment, including the principal amount plus any accrued interest, if such statutory loss absorption measures are acted upon. The Banking Act provides that, other than in certain limited circumstances set out in the Banking Act, extraordinary governmental financial support will only be available to the Group as a last resort once the write-down and conversion powers and resolution tools referred to above have been exploited to the maximum extent possible. Accordingly, it is unlikely that investors in securities issued by the Company will benefit from such support even if it were provided.
| | | | | | | | |
174 | Lloyds Banking Group plc Annual Report on Form 20-F 2023 | |
Holders of the Group’s securities may have limited rights or no rights to challenge any decision of the BoE or HM Treasury to exercise the UK resolution powers or to have that decision reviewed by a judicial or administrative process or otherwise. Accordingly, trading behaviour in respect of such securities is not necessarily expected to follow the trading behaviour associated with other types of securities that are not subject to such resolution powers. Further, the introduction or amendment of such resolution powers, and/or any implication or anticipation that they may be used, may have a significant adverse effect on the market price of such securities, even if such powers are not used.
The minimum requirement for own funds and eligible liabilities (“MREL”) applies to UK financial institutions and mandates the issuance of a minimum level of own funds and debt instruments that are capable of being written-down or converted to equity in order to prevent a financial institution or its group from failing in a crisis. From 1 January 2022, the Group has been required to maintain a minimum level of MREL resources in line with the BoE’s MREL statement of policy (“MREL SoP”), being the higher of 2 times Pillar 1 plus 2 times Pillar 2A, or 6.5% of the UK leverage ratio exposure measure.
In addition, the Group’s costs of doing business may increase by amendments made to the Banking Act in relation to deposits covered by the UK Financial Services Compensation Scheme (the “FSCS”). The Group contributes to compensation schemes such as the FSCS in respect of banks and other authorised financial services firms that are unable to meet their obligations to customers. Furthermore, any future reforms to increase the deposit protection limits, or more broadly, to enhance the SRR could have cost implications for the banking industry as a whole. The ultimate cost to the industry, which will also include the cost of any compensation payments made by the FSCS and, if necessary, the cost of meeting any shortfall after recoveries on the borrowings entered into by the FSCS, remains uncertain but may be significant and may have a material effect on the Group’s business, results of operations or financial condition.
5.The Group is subject to the risk of having insufficient capital resources and/or not meeting liquidity requirements
If the Group has, or is perceived to have, a shortage of regulatory capital or to be unable to meet its regulatory minimum liquidity requirements, then it may be subject to regulatory interventions and sanctions and may suffer a loss of confidence in the market with the result that access to sources of liquidity and funding may become constrained, more expensive or unavailable. This, in turn, may affect the Group’s capacity to continue its business operations, pay future dividends and make other distributions or pursue acquisitions or other strategic opportunities, impacting future growth potential.
See also the risk factor above entitled “Economic and Financial Risks - The Group’s businesses are subject to inherent risks concerning liquidity and funding, particularly if the availability of traditional sources of funding such as retail deposits or the access to wholesale funding markets becomes more limited”.
A shortage of capital could arise from (i) a depletion of the Group’s capital resources through increased costs or liabilities and reduced asset values which could arise as a result of the crystallisation of credit-related risks, regulatory and legal risks, business and economic risks, operational risks, financial soundness-related risks and other risks; and/or (ii) changes to the actual level of risk faced by the Group requiring higher capital to be held; and/or (iii) changes required by legislation or set by the regulatory authorities increasing the amount of minimum capital requirements and/or the risk weightings applicable to its assets.
If, in response to higher capital requirements or a shortage, or perceived shortage, of regulatory capital, the Group raises additional capital through the issuance of shares, existing shareholders may experience a dilution of their holdings. If a capital or debt instrument is converted to ordinary shares as a result of a trigger within the contractual terms of the instrument or through the exercise of statutory powers then, depending upon the terms of the conversion, existing shareholders may experience a dilution of their holdings. Separately, the Group may address a shortage of capital by acting to reduce leverage exposures and/or risk-weighted assets, for example by way of business disposals. Such actions may impact the profitability of the Group.
Whilst the Group monitors current and expected future capital, leverage and liquidity requirements, and seeks to manage and plan its prudential position accordingly and on the basis of current assumptions regarding future regulatory requirements, there can be no assurance that the assumptions will be accurate in all respects or that it will not be required to take additional measures to strengthen its capital, leverage or liquidity position. Market expectations as to capital and liquidity levels may also increase, driven by, for example, the capital and liquidity levels (or targets) of peer banking groups.
The Group’s borrowing costs and access to capital markets, as well as its ability to lend or carry out certain aspects of its business, could also be affected by future prudential regulatory developments in the UK and in other jurisdictions to which the Group has exposure.
Any of the risks mentioned above could have a material adverse effect on the Group’s capital resources and/or liquidity, results of operations, its ability to continue its business operations and its financial condition.
6.The financial impact of legal or other proceedings and regulatory risks may be material and is difficult to quantify. Amounts eventually paid may materially exceed the amount of provisions set aside to cover such risks, or existing provisions may need to be materially increased in response to changing circumstances
Where provisions have already been taken in published financial statements of the Group or results announcements for ongoing legal or regulatory matters, these have been recognised, in accordance with IAS 37 (“Provisions, Contingent Liabilities and Contingent Assets”) (“IAS 37”), as the best estimate of the expenditure required to settle the obligation as at the reporting date. Such estimates are inherently uncertain, and it is possible that the eventual outcomes may differ materially from current estimates, resulting in future increases or decreases to the required provisions, or actual losses that exceed or fall short of the provisions taken.
Provisions have not been taken where no obligation (as defined in IAS 37) has been established, whether associated with a known or potential future litigation or regulatory matter. Accordingly, an adverse decision in any such matters could result in significant losses to the Group which have not been provided for. The Group is exposed to a number of complaints, including certain complaints referred to the Financial Ombudsman Service, that could develop into matters that may require redress and result in significant losses for the Group. Such losses could have an adverse impact on the Group’s financial condition and operations.
| | | | | | | | |
175 | Lloyds Banking Group plc Annual Report on Form 20-F 2023 | |
Following the UK Financial Conduct Authority’s (FCA) Motor Market review, the Group continues to receive a number of court claims and complaints, in respect of motor finance commissions and is actively engaging with the UK Financial Ombudsman Service (FOS) in its assessment of these complaints. On 10 January 2024, the FOS issued its Final Decision on a complaint relating to the Group, as well as decisions relating to other industry participants. On 11 January 2024, the FCA announced a section 166 review of historical motor finance commission arrangements and sales and plans to communicate a decision on next steps in the third quarter of 2024, on the basis of the evidence collated in the review. The FCA has indicated that such steps could include establishing an industry-wide consumer redress scheme and/or applying to the Financial Markets Test Case Scheme, to help resolve any contested legal issues of general importance. In response to both the FOS decisions and the FCA announcement, the Group has recognised a charge of £450 million. This includes estimates for operational and legal costs, including litigation costs, together with estimates for potential awards, based on various scenarios using a range of assumptions, including for example, commission models, commission rates, applicable time periods (between 2007 and 2021), response rates and uphold rates. Costs and awards could arise in the event that the FCA concludes there has been misconduct and customer loss that requires remediation, or from adverse litigation decisions. However, while the FCA review is progressing there is significant uncertainty as to the extent of misconduct and customer loss, if any, the nature and extent of any remediation action, if required, and its timing. The ultimate financial impact could therefore materially differ from the amount provided, both higher or lower.
The Group has incurred costs for Payment Protection Insurance over a number of years totalling £21,960 million. The Group continues to challenge PPI litigation cases, with mainly legal fees and operational costs associated with litigation activity recognised within regulatory and legal provisions.
In November 2014, the UK Supreme Court ruled in Plevin v Paragon Personal Finance Limited [2014] UKSC 61 (“Plevin”) that failure to disclose to a customer a “high” commission payment on a single premium PPI policy sold with a consumer credit agreement created an unfair relationship between the lender and the borrower under section 140 of the Consumer Credit Act 1974. It did not define a tipping point above which commission was deemed “high”. The disclosure of commission was not a requirement of the Financial Services Authority (now FCA’s) Insurance: Conduct of Business sourcebook rules for the sale of general insurance (including PPI). Permission to appeal the redress outcome in the Plevin case was refused by the Court of Appeal in July 2015 and by the President of the Family Division in November 2015.
In November 2015 and August 2016, the FCA consulted on the introduction of a two-year industry deadline by which consumers would need to make their PPI complaints or lose their right to have them assessed, and proposed rules and guidance about how firms should handle PPI complaints fairly in light of the Plevin judgment discussed above. On 2 March 2017, the FCA confirmed an industry deadline of 29 August 2019. The FCA’s rules to address Plevin commenced on 29 August 2017. The industry deadline also applies to the handling of these complaints. The courts are not bound by the FCA’s complaints deadline or redress methodology. Customers therefore can and may wish to continue to bring litigation claims beyond the FCA’s deadline for complaints, which could have a material adverse effect on the Group’s reputation, business, financial condition, results of operations and prospects.
Also, climate and sustainability-related disclosures are a rapidly evolving area and increasingly expose the Group to risk in the face of legal and regulatory expectations, regulatory enforcement and class action risk. The Group in the UK and elsewhere is increasingly becoming subject to more extensive climate and sustainability-related legal and regulatory requirements. In the UK, these include mandatory requirements by the FCA and under the Companies Act 2006 to make climate-related disclosures consistent with the recommendations of the Task Force on Climate related Financial Disclosures (“TCFD”). In addition, in August 2023, the FCA set out its intention to consult in 2024 on rules and guidance for listed companies to disclose in line with the UK-endorsed International Sustainability Standards Board (“ISSB”) standards and the Transition Plan Taskforce (“TPT”) Disclosure Framework published in October 2023 as a complementary package. Further regulatory requirements may emerge as part of the developing UK sustainability-related disclosure requirements. In some jurisdictions, particularly the United States, regulatory and enforcement activity around climate and sustainability initiatives is becoming increasingly politicised. This has resulted in a polarisation between promoting more extensive climate and sustainability-related requirements, such as the SEC’s proposed climate disclosure mandates, and challenging climate, nature and sustainability-related initiatives on the basis of allegations that they could breach applicable laws. Also, the final rules on the SEC’s proposed climate disclosure mandates are expected in 2024. In summary, the current and expected regulatory developments in climate and sustainability-related disclosures further expose the Group to regulatory enforcement and class action risk.
Further, no assurance can be given that the Group will not incur liability in connection with any past, current or future non-compliance with legislation or regulation, and any such non-compliance could be significant and materially adversely affect its reputation, business, financial condition, results of operations and prospects.
7.The Group must comply with anti-money laundering, counter terrorist financing, anti-bribery and sanctions regulations, and a failure to prevent or detect any illegal or improper activities fully or on a timely basis could negatively impact customers and expose the Group to liability
The Group is required to comply with applicable anti-money laundering, anti-terrorism, sanctions, anti-bribery and other laws and regulations in the jurisdictions in which it operates. These extensive laws and regulations require the Group, amongst other things, to adopt and enforce “know-your-customer” policies and procedures and to report suspicions of money laundering and terrorist financing, and in some countries specific transactions to the applicable regulatory authorities. These laws and regulations have become increasingly complex and detailed, require improved systems and sophisticated monitoring and compliance personnel, and have become the subject of enhanced government and regulatory supervision.
The Group has adopted policies and procedures aimed at detecting and preventing the use of its banking network and services for money laundering, financing terrorism, bribery, tax evasion, human trafficking, modern day slavery, wildlife trafficking and related activities. These controls, however, may not eliminate instances where third parties seek to use the Group’s products and services to engage in illegal or improper activities. In addition, while the Group reviews its relevant counterparties’ internal policies and procedures with respect to such matters, the Group, to a large degree, relies upon its relevant counterparties to maintain and properly apply their own appropriate anti-money laundering procedures. Such measures, procedures and compliance may not be effective in preventing third parties from using the Group (and its relevant counterparties) as a conduit for money laundering and terrorist financing (including illegal cash operations) without the Group’s (and its relevant counterparties’) knowledge. In the course of its business, the Group engages in discussions with the PRA, FCA and other UK and overseas regulators on a range of matters including in relation to anti-money laundering. See the FCA investigation into the Group’s anti-money laundering control framework in note 48 on page F-104. If the Group is associated with, or even accused of being associated with, or becomes a party to, money laundering or terrorist financing, its reputation could suffer and it could become subject to fines, sanctions and/or legal enforcement (including being added to any “restricted lists” that would prohibit certain parties from engaging in transactions with the Group) as well as claims and allegations, any one of which could have a material adverse effect on its results of operations, financial condition and prospects.
| | | | | | | | |
176 | Lloyds Banking Group plc Annual Report on Form 20-F 2023 | |
Furthermore, failure to comply with trade and economic sanctions, both primary and secondary (which are frequently subject to change by relevant governments and agencies in the jurisdictions in which the Group operates) and failure to comply fully with other applicable compliance laws and regulations, may result in the imposition of fines and other penalties on the Group, including the revocation of licences. In addition, the Group’s business and reputation could suffer if customers use its banking network for money laundering, financing terrorism, or other illegal or improper purposes.
8.Failure to manage the risks associated with changes in taxation rates or applicable tax laws, or misinterpretation of such tax laws, could materially adversely affect the Group’s results of operations, financial condition or prospects
Tax risk is the risk associated with changes in taxation rates, applicable tax laws, misinterpretation of such tax laws, disputes with relevant tax authorities in relation to historic transactions or conducting a challenge to a relevant tax authority. Failure to manage this risk adequately could cause the Group to suffer losses due to additional tax charges and other financial costs including penalties. Such failure could lead to adverse publicity, reputational damage and potentially costs materially exceeding current provisions, in each case to an extent which could have an adverse effect on the Group’s results of operations, financial condition or prospects.
Business and operational risks
1.The Group is exposed to operational risks, including the failure to build sufficient resilience into business operations, and underlying infrastructure and controls, as well as risks which may arise as a result of the failure of third party services
The Group defines operational risks, as the risk of financial and non-financial impact through inadequate or failed internal processes, people and systems or from external events. The Group’s businesses are dependent on the accurate and efficient processing and reporting of a high volume of complex transactions across a diverse set of products and services. These products and services are transacted in different currencies and subject to different legal and regulatory regimes. Any weakness or errors in these processes or systems could lead to an impact on the Group’s results, the reporting of such results, the ability to deliver appropriate customer outcomes which may lead to an increase in complaints and/or damage to the reputation of the Group, or on the Group’s ability to deliver appropriate customer outcomes which may lead to an increase in complaints and/or damage to the reputation of the Group or impact the Group’s financial performance.
Specifically, failure to develop, deliver or maintain effective IT solutions could lead to a material impact on customer service and business operations. Any prolonged loss of service availability could limit the Group’s ability to provide services safely to its customers, effectively and efficiently which, could lead to customer redress and could cause longer term damage to the Group’s brand. See “Business and Operational Risks – The Group’s business is subject to risks related to cybercrime and technological failure”.
The Group uses a range of third party suppliers to support the delivery of its strategy. These third party suppliers also expose the Group to operational risk,through their own supplier relationships, internal processes, people and systems. Failure to appropriately manage and oversee these third party risks could impact the Group’s ability to effectively achieve its customer, operational or business needs and could have a material effect on the Group’s business and financial position. Whilst the Group undertakes assurance and oversight of its suppliers to mitigate these risks, it remains possible that these risks could result in: a failure, delay or disruption in the provision of services to customers or adversely impact the performance by the Group, the Group facing unanticipated financial or reputational harm, or becoming subject to litigation or regulatory investigations and actions. Changing these third party vendors or moving critical services from one provider to another could pose additional risk.
The Group is also exposed to risk of fraud and other criminal activities (both internal and external) due to the operational risks inherent in banking operations. Fraudsters may target any of the Group’s products, services and delivery channels, including lending, internet banking, payments, bank accounts and cards. This may result in financial loss to the Group and/or its customers, poor customer experience, reputational damage, potential litigation and regulatory proceedings. Industry reported gross fraud losses have continued to increase as both financial institutions and their customers are targeted.
Fraud losses and their impacts on customers and the wider society are now an increasing priority for consumer groups, regulators and the UK Government. Any weakness in the Group’s processes, systems or security could have an adverse effect on the Group’s results and on the ability to deliver appropriate customer responses, which may lead to an increase in complaints and damage to the Group’s reputation. See “Regulatory and Legal Risks – The Group must comply with anti-money laundering, counter terrorist financing, anti-bribery and sanctions regulations, and a failure to prevent or detect any illegal or improper activities fully or on a timely basis could negatively impact customers and expose the Group to liability”.
2.The Group is exposed to conduct risk
The Group is exposed to various forms of conduct risk in its operations. Conduct risk is the risk of customer detriment due to poor design, distribution and execution of products or services, or other activities which could undermine the integrity of the market or distort competition, leading to customer harm, regulatory censure, or reputational damage or financial loss. Such risks are inherent in financial services. Forms of conduct risk include business and strategic planning, processes and systems that do not sufficiently consider customer needs which could lead to customers not receiving the best outcome to meet their needs, products and services that do not offer fair value (which could lead to customer harm) products being offered to customers that are not sustainable (which could lead to customers unfairly falling into arrears) ineffective management and monitoring of products and their distribution (which could result in customer harm), customer communications that are unclear, unfair, misleading or untimely (which could impact customer decision making and result in customer harm), a culture that is not sufficiently customer-centric (potentially driving improper decision making and customer harm), outsourcing of customer service and product delivery via third-parties that do not have the same level of control, oversight and customer-centric culture as the Group (which could result in potentially unfair or inconsistent customer outcomes), the possibility of alleged mis-selling of financial products (which could require amendments to sales processes, withdrawal of products or the provision of restitution to affected customers, all of which may require additional provisions in the Group’s financial accounts), ineffective management of customer complaints or claims (which could result in customer harm), ineffective processes or procedures to support customers, including those in potentially vulnerable circumstances (which could result in customer harm), and poor governance of colleagues’ incentives and rewards and approval of schemes which result in customer harm. Ineffective management and oversight of legacy conduct issues can also result in customers who are undergoing remediation being unfairly treated and therefore further rectification being required, including at the direction of regulators. The Group is also exposed to the risk of engaging in, or failing to manage, conduct which could constitute market abuse, undermine the integrity of a market in which it is active, distort competition or create conflicts of interest. Each of these risks can lead to regulatory censure, reputational damage, regulatory intervention/enforcement, the imposition of lengthy remedial redress programmes and financial penalties or other loss for the Group, all of which could have a material adverse effect on its results of operations, financial condition or prospects. Please also see Regulatory and legal risks – The financial impact of legal or other proceedings and regulatory risks may be material and is difficult to quantify. Amounts eventually paid may materially exceed the amount of provisions set aside to cover such risks, or existing provisions may need to be materially increased in response to changing circumstances.”
| | | | | | | | |
177 | Lloyds Banking Group plc Annual Report on Form 20-F 2023 | |
3.The Group’s business is subject to risks related to cybercrime and technological failure
Cyber-threats are constantly evolving and increasing in terms of complexity, frequency, impact and severity. The financial sector remains a primary target for cybercriminals. Attempts are made on a regular basis to compromise the Group’s IT systems and services, and to steal customer and bank data. Additionally, third parties may also fraudulently attempt to induce employees, customers, third party providers or other users who have access to Group’s systems to disclose sensitive information in order to gain access to the Group’s data or that of customers or employees. Moreover, the Group does not have direct control over the cybersecurity of the systems of its clients, customers, counterparties and third party service providers and suppliers, limiting the Group’s ability to effectively defend against certain threats. Cybersecurity and information security events can derive from groups or factors such as: internal or external threat actors, human error, fraud or malice on the part of the Group’s employees or third parties, including third party providers, or may result from accidental technological failure. Additionally, remote working arrangements, which emerged during the COVID-19 pandemic and are continuing for many of the Group’s and third party providers’ employees, place heavy reliance on the IT systems that enable remote working and may increase exposure to fraud, conduct, operational and other risks and may place additional pressure on the Group’s ability to maintain effective internal controls and governance frameworks. Remote working arrangements are also subject to regulatory scrutiny to ensure adequate recording, surveillance and supervision of regulated activities, and compliance with regulatory requirements and expectations, including requirements to: meet threshold conditions for regulated activities; ensure the ability to oversee functions (including any outsourced functions); ensure no detriment is caused to customers; and ensure no increased risk of financial crime. Common types of cyberattacks include, but are not limited to, deployment of malware to obtain covert access to systems and data; ransomware attacks that render systems and data unavailable through encryption; denial of service and distributed denial of service (DDoS) attacks; infiltration via business email compromise; social engineering, including phishing, vishing and smishing; automated attacks using botnets; and credential validation or stuffing attacks using login and password pairs from unrelated breaches.
A successful cyber-attack or technological failure may impact the confidentiality or integrity of the Group’s or its clients’, employees’ or counterparties’ information or the availability of services to customers. As a result of such an event or a failure in the Group’s cybersecurity policies, the Group could experience a major disruption in operations, material financial loss, loss of competitive position, regulatory actions, inability to deliver customer services, breach of client contracts, loss of data or other sensitive information (including as a result of an outage), reputational harm or legal liability, which, in turn, could have a material adverse effect on its results of operations, financial condition or prospects. The Group may be subject to litigation, sanctions and/or financial losses that are either not insured against fully or not fully covered through any insurance that it maintains. The Group may be required to spend additional resources to notify or compensate customers, modify its protective measures, investigate and remediate vulnerabilities or other exposures, reinforce the due diligence of and revisit its working relationship with third party providers and develop and evolve its cybersecurity controls in order to minimise the potential effect of such attacks. Regulators in the UK, US, Europe and Asia continue to recognise cybersecurity as an important systemic risk to the financial sector and have highlighted the need for financial institutions to improve their monitoring and control of, and resilience (particularly of critical services) to cyberattacks, and to provide timely notification of them, as appropriate. In accordance with the Data Protection Act 2018 and the European Union Withdrawal Act 2018, the Data Protection, Privacy and Electronic Communications (Amendments Etc.) (EU Exit) Regulations 2019, as amended by the Data Protection, Privacy and Electronic Communications (Amendments Etc.) (EU Exit) Regulations 2020 (“UK Data Protection Framework”) and European Banking Authority (“EBA”) Guidelines on ICT and Security Risk Management the Group is required to ensure it implements timely, appropriate and effective organisational and technological safeguards against unauthorised or unlawful access to the data of the Group, its customers and its employees. In order to meet this requirement, the Group relies on the effectiveness of its internal policies, controls and procedures to protect the confidentiality, integrity and availability of information held on its IT systems, networks and devices as well as with third parties with whom the Group interacts. A failure to monitor and manage data in accordance with the UK Data Protection Framework and EBA guidelines may result in financial losses, regulatory fines and investigations and associated reputational damage. The Group expects greater regulatory engagement, supervision and enforcement to continue at a high level in relation to its overall resilience to withstand IT-related disruption, either through a cyberattack or some other disruptive event. Such increased regulatory engagement, supervision and enforcement is uncertain in relation to the scope, cost, consequence and the pace of change, which could negatively impact the Group. Due to the Group’s reliance on technology and the increasing sophistication, frequency and impact of cyberattacks, such attacks may have a material adverse impact on the Group, its business, results of operations and outlook. The Group faces risks related to innovation with new technologies, such as Artificial Intelligence (“AI”). AI can play an important role for businesses by improving customer service, increasing personalisation, or streamlining operational processes. However, the Group must protect privacy and ensure ethical processing of data to maintain customer and regulator trust. The Group’s control framework also needs to keep pace with evolving technology. The risks caused by AI include, among others, data poisoning, potential bias, discrimination, errors, misuse. Further, the use of AI may increase cyberattack and legal liability risk.
4.The Group is subject to the financial and non-financial risks related with ESG matters, for example, climate change and human rights issues
The Group is subject to the financial and non-financial risks related with ESG matters, for example, climate change and human rights issues.
The risks associated with ESG-related matters are coming under an increasing focus, both in the UK and internationally, from governments, regulators and large sections of society. This includes numerous topics, across environmental (including climate change, as well as biodiversity and loss of natural capital); social (including human rights issues, financial inclusion, and workforce diversity and inclusion and employee wellbeing); and governance (including board diversity, culture and ethics, executive compensation, management structure, employee conduct, data privacy and whistleblowing) matters.
ESG ratings from agencies and data providers which rate how the Group manages environmental, social and governance risks are increasingly influencing investment decisions or being used as a basis to compare the sustainability of financial services providers. Any reduction in the Group’s ESG ratings could have a negative impact on the Group’s reputation, influence investors’ risk appetite and impact on customers’ willingness to deal with the Group.
Legislative and regulatory expectations of how banks should prudently manage and transparently disclose ESG-related risks continue to evolve. This includes the Sustainability Disclosure Standards (S1 and S2) issued by the ISSB in June 2023. These standards are intended to provide greater international comparability for companies’ exposure to and management of both sustainability- and climate-related risks and opportunities. Failing to meet or understand the growing number of requirements around sustainability-related reporting across different jurisdictions presents a risk to the Group’s compliance through its financial reporting.
| | | | | | | | |
178 | Lloyds Banking Group plc Annual Report on Form 20-F 2023 | |
In the UK, regulatory expectations are particularly focused on the risks related to climate change. These risks associated with climate change include: physical risks, arising from climate and weather-related events of increasing severity and/or frequency; and transition risks resulting from the process of adjustment towards a lower carbon economy (including stranded, redundant or prohibited assets). Supervisory Statement 3/19 outlines the PRA’s supervisory expectations for managing climate-related risks, supported by further engagement through Dear CEO letters as understanding continues to evolve. The Group must adequately embed the risks associated with climate change identified above into its risk framework to appropriately measure, manage and disclose the various financial and operational risks it faces as a result of climate change. If it fails to adapt its strategy and business model to the changing regulatory requirements and market expectations on a timely basis, this could have an adverse impact on the Group’s regulatory compliance, as well as it results of operations, financial condition, capital requirements and prospects.
Physical risks from climate change arise from a number of factors, relating to specific weather events and longer term shifts in the climate. The nature and timing of extreme weather events are uncertain but they are increasing in frequency and their impact on the economy is predicted to be more acute in the future. The potential impact on the economy includes, but is not limited to, lower GDP growth, higher unemployment and significant changes in asset prices and profitability of industries. Climate change related increases in risk could necessitate the withdrawal of cover from areas that become uninsurable due to extreme inundation risk, opening the Group up to reputational damage in its withdrawal of such support. These risks could also lead to deteriorating claims experience for the Group’s general insurance business, out of line with the original assessment of risk that was used to set price and capital adequacy. This could pose a threat to both profitability and the strength of the solvency position of the general insurance business. The physical risks could also lead to the disruption of business activity at customers’ locations. Damage to the Group customers’ properties and operations could disrupt business, impair asset values and negatively impact the creditworthiness of customers leading to increased default rates, delinquencies, write-offs and impairment charges in the Group’s portfolios. In addition, the Group’s premises and resilience may also suffer physical damage due to weather events leading to increased costs and negatively affecting the Group’s business continuity and reputation.
The move towards a low-carbon economy will also create transition risks, with widespread transition to a net zero economy across all sectors of the economy and markets in which the Group operates will be required to meet the goals of the 2015 Paris Agreement, the UK’s Net Zero Strategy, the Glasgow Climate Pact of 2021 and pledges made at COP28 in December 2023. The impact of the extensive commercial, technological, policy and regulatory changes required to achieve transition remains uncertain, but it is expected to be significant and may be disruptive across the global economy and markets. Some sectors such as property, energy (including oil and gas), mining, infrastructure, transport (including automotive and aviation) and agriculture are expected to be particularly impacted . These changes may cause the impairment of asset values, impact the creditworthiness of the Group’s customers, and impact defaults among retail customers (including through the ability of customers to repay their mortgages, as well as the impact on the value of the underlying property), which could result in currently profitable business deteriorating over the term of agreed facilities. They may also adversely affect a policyholder’s returns.
The Group has set several ambitions across its own operations, supply chain and lending and investments to support the decarbonisation of its business in line with limiting global warming to 1.5°C. These ambitions are supported by financed emissions targets for the Group’s lending, as part of the Group’s membership of the Net Zero Banking Alliance. Making the changes necessary to achieve these ambitions may necessitate material and accelerated changes to the Group’s business, operating model and existing exposures, including potential reductions to its exposure to customers that do not align with a transition to a net zero economy or do not have a credible transition plan, which may have a material adverse effect on the Group’s ability to achieve its financial targets and generate sustainable returns. In addition, the Group’s ability to achieve these ambitions, targets and commitments will depend on many factors and uncertainties beyond the Group’s direct control. These include the macroeconomic environment, the extent and pace of climate change, including the timing and manifestation of physical and transition risks, the effectiveness of actions of governments, legislators, regulators, businesses, investors, customers and other stakeholders to adapt and/or mitigate the impact of climate-related risks, changes in customer behaviour and demand, the challenges related with the implementation and integration of adoption policy tools, changes in the available technology for mitigation and adaptation, the availability of accurate, verifiable, reliable, consistent and comparable data. These internal and external factors and uncertainties will make it challenging for the Group to meet its climate ambitions, targets and commitments and there is a risk that all or some of them will not be achieved. Any delay or failure in setting, making progress against or meeting the Group’s climate-related ambitions, targets and commitments may have a material adverse effect on the Group, its reputation, business, results of operations, outlook, market and competitive position and may increase the climate-related risks the Group faces.
The Group also recognises the need for a 'just transition', to ensure that the most disadvantaged members of society are not disproportionally affected by the transition to a net zero economy, for example, workers in industries that will be displaced by the transition will need to be considered and managed. Although the Group is actively seeking to further understand how it integrates ‘just transition’ considerations alongside its environmental sustainability strategy, including leveraging insight from external memberships such as the Financing Just Transition Alliance, greater external attention on this subject could create risks, including potential reputational damage, for financial institutions, including the Group.
Furthermore, inadequate climate risk disclosure could result in the loss of the Group’s investor base as it will not be perceived to be a green investment. Equally, the Group must ensure that its disclosures, communications and marketing provide an accurate reflection of the appropriate climate, or sustainability-related credentials. In November 2023, the FCA published Policy Statement PS23/16 requiring firms to follow specific rules and guidance for sustainability-related claims with effect from May 2024. The implications of inadequately managing or disclosing sustainability- and/or climate-related risks or evidencing progress in line with expectations, could also result in potential, customer attrition, loss of investor confidence or wider reputational damage. such as increased stakeholder concern or negative feedback, and increased scrutiny around the Group’s activities relating to high emissions sectors and products.
There is increasing focus on nature-related risks beyond climate change, including risks that can be represented more broadly by economic dependency on nature, can and will have significant economic impact. These risks arise when the provision of natural services such as water availability, air quality, and soil quality are compromised by overpopulation, urban development, natural habitat and ecosystem loss, and other environmental stresses beyond climate change. This is an evolving and complex area which requires collaborative approaches with partners, stakeholders and peers to help measure and mitigate negative impacts of financing activities on the environment and all living things within it, as well as supporting nature-based solutions, habitat restoration and biodiversity markets. These risks can manifest in a variety of ways, across all principal risk types, for both the Group and its customers.
| | | | | | | | |
179 | Lloyds Banking Group plc Annual Report on Form 20-F 2023 | |
There is also increased investor, regulatory, civil society and customer scrutiny regarding how businesses address social issues, including tackling inequality, improving financial inclusion and access to finance, working conditions, workplace health, safety and employee wellbeing, workforce diversity and inclusion, data protection and management, human rights and supply chain management which may impact the Group’s employees, customers, and their business activities and the communities in which they operate. The key human rights risks that currently impact the Group include discrimination, in particular with respect to our employees and our customers, modern slavery, human rights and labour conditions in our supply chains, our investee companies and those of our customers. Failure to manage these risks may result in negative impacts on our people (both in terms of hiring and retention), our business and our reputation. Such failure could also lead to breaches of rapidly evolving legal and regulatory requirements and expectations in certain markets, and this could have reputational, legal and financial consequences for the Group.
5.The Group’s businesses are conducted in competitive environments, with increased competition scrutiny, and the Group’s financial performance depends upon management’s ability to respond effectively to competitive pressures and scrutiny
The markets for UK financial services, and the other markets within which the Group operates, remain competitive, and management expects the competition to continue to intensify. This expectation is due to a range of factors including: competitor behaviour, new entrants to the market (including a number of new retail banks as well as non-traditional financial services providers), changes in customer needs, technological developments such as the growth of digital banking, new business models such as buy now pay later and the impact of regulatory actions. The Group’s financial performance and its ability to maintain existing or capture additional market share depends significantly upon the competitive environment and management’s response thereto.
In its recent final report as part of the Strategic Review of Retail Banking, the FCA recognised that the greater competition in retail banking is driving greater choice and lower prices for consumers and small businesses, despite the financial impact of the pandemic. This has particularly been seen in the mortgage and consumer credit markets where competition has intensified leading to lower yields.
Additionally, the internet and mobile technologies are changing customer behaviour and the competitive environment. There has been a steep rise in customer use of mobile banking over the last several years. The Group faces competition from established providers of financial service as well as from banking business developed by non-financial companies, including technology companies with strong brand recognition.
The competitive environment can be, and is, influenced by intervention by the UK Government competition authorities and/or European regulatory bodies and/or governments of other countries in which the Group operates, including in response to any perceived lack of competition within these markets. This may significantly impact the competitive position of the Group relative to its international competitors, which may be subject to different forms of government intervention.
The Competition and Markets Authority (the “CMA”) launched a full market investigation into competition in the SME banking and personal current account (“PCA”) markets between 2014 and 2016 followed by the Retail Banking Market Investigation Order 2017 in February 2017. This led to a number of changes which have impacted the competitive environment, including the introduction of “open banking”, the publication of service quality information and improvements to current accounts switching. The FCA has also undertaken market reviews in each of the major retail product markets and introduced remedies to help customers compare and switch products. For example, the FCA’s overdraft pricing remedies which came into force in April 2020, required all firms to price their overdraft products using a simple comparable interest rate. In addition to this, the implementation of ring-fencing regulations in 2019 has had direct and indirect impacts on UK mortgage providers and the mortgage market. For some firms (who have historically utilised their retail deposits to fund activities outside of traditional retail banking), ring-fencing has impacted their ability to fund such non-retail banking resulting in additional access deposits which may have been directed to the mortgage market, increasing competition and driving down prices.
As a result of any restructuring or evolution in the market, there may emerge one or more new viable competitors in the UK banking market or a material strengthening of one or more of the Group’s existing competitors in that market. Any of these factors or a combination thereof could have an impact on the profitability of the Group.
6.The Group could fail to attract, retain and develop high calibre talent
The Group’s success depends on its ability to attract, retain and develop high calibre talent. Attracting additional and retaining existing skilled personnel is fundamental to the continued growth of the Group. Personnel costs, including salaries, continue to increase as the general level of prices and the standard of living increases in the countries in which the Group does business and as industry-wide demand for suitably qualified personnel increases. No assurance can be given that the Group will successfully attract new personnel or retain existing personnel required to continue to grow its business and to successfully execute and implement its business strategy.
7.The Group may fail to execute its ongoing strategic change initiatives, and the expected benefits of such initiatives may not be achieved on time or as planned
In order to maintain and enhance the Group’s strategic position, it continues to invest in new initiatives and programmes. The Group acknowledges the challenges faced with delivering these initiatives and programmes alongside the extensive agenda of regulatory and legal changes whilst safely operating existing systems and controls.
The successful completion of these programmes and the Group’s other strategic initiatives requires complex judgements, including forecasts of economic conditions in various parts of the world, and can be subject to significant risks. For example, the Group’s ability to execute its strategic initiatives successfully may be adversely impacted by a significant global macroeconomic downturn, legacy issues, limitations in its management or operational capacity and capability or significant and unexpected regulatory change in countries in which it operates.
Failure to execute the Group’s strategic initiatives successfully could have an adverse effect on the Group’s ability to achieve the stated targets and other expected benefits of these initiatives, and there is also a risk that the costs associated with implementing such initiatives may be higher than expected or benefits may be less than expected. Both of these factors could materially adversely impact the Group’s results of operations, financial condition or prospects.
| | | | | | | | |
180 | Lloyds Banking Group plc Annual Report on Form 20-F 2023 | |
8.The Group may be unable to fully capture the expected value from acquisitions, which could materially and adversely affect its results of operations, financial condition or prospects
The Group may from time to time undertake acquisitions as part of its growth strategy, which could subject it to a number of risks, such as: (i) the rationale and assumptions underlying the business plans supporting the valuation of a target business may prove inaccurate, in particular with respect to synergies and expected commercial demand; (ii) the Group may fail to successfully integrate any acquired business, including its technologies, products and personnel; (iii) the Group may fail to retain key employees, customers and suppliers of any acquired business; (iv) the Group may be required or wish to terminate pre-existing contractual relationships, which could prove costly and/or be executed at unfavourable terms and conditions; (v) the Group may fail to discover certain contingent or undisclosed liabilities in businesses that it acquires, or its due diligence to discover any such liabilities may be inadequate; and (vi) it may be necessary to obtain regulatory and other approvals in connection with certain acquisitions and there can be no assurance that such approvals will be obtained and even if granted, that there will be no burdensome conditions attached to such approvals, all of which could materially and adversely affect the Group’s results of operations, financial conditions or prospects.
9.The Group’s financial statements are based, in part, on assumptions and estimates
The preparation of the Group’s financial statements requires management to make judgements, estimates and assumptions that affect the reported amounts of assets, liabilities, income and expenses. Due to the inherent uncertainty in making estimates, actual results reported in future periods may be based upon amounts which differ from those estimates. Estimates, judgements and assumptions are continually evaluated and are based on historical experience and other factors, including expectations of future events that are believed to be reasonable under the circumstances. Revisions to accounting estimates are recognised in the period in which the estimate is revised and in any future periods affected.
The consolidated financial statements are prepared using judgements, estimates and assumptions based on information available at the reporting date. If one or more of these judgements, estimates and assumptions is subsequently revised as a result of new factors or circumstances emerging, there could be a material adverse effect on the Group’s results of operations, financial condition or prospects and a corresponding impact on its funding requirements and capital ratios.
10.The Company may not have sufficient liquidity to meet its obligations, including its payment obligations with respect to its external debt securities
The Company is a non-operating holding company.
The Company’s payment obligations largely relate to its externally issued debt securities. Any market risk, arising as the result of mismatches between the Company’s liabilities and assets is managed through collateralised derivative hedges, which may also give rise to payment obligations.
The principal sources of the Company’s income are, and are expected to continue to be, distributions from operating subsidiaries which also hold the principal assets of the Group, and income from investments in securities issued from its operating subsidiaries. As a separate legal entity, the Company relies on such income in order to be able to meet its obligations, and to create distributable reserves for payment of dividends to ordinary shareholders.
The ability of the Company’s subsidiaries (including subsidiaries incorporated outside the UK) to pay dividends and the Company’s ability to receive income from its investments in other entities will also be subject not only to their financial performance but also to applicable local laws and other restrictions. These restrictions could include, among others, any regulatory requirements, leverage requirements, any statutory reserve requirements and any applicable tax laws. There may also be restrictions as a result of current or forthcoming ring-fencing requirements, including those relating to the payment of dividends and the maintenance of sufficient regulatory capital on a sub-consolidated basis at the level of the ring-fenced bank sub-group. These laws and restrictions could limit the payment of dividends and distributions to the Company by its subsidiaries and any other entities in which it holds an investment from time to time, which could restrict the Company’s ability to meet its obligations and/or to pay dividends to ordinary shareholders.
There is potential for liquidity risk at the Company, whereby in a stress scenario it is unable to meet its payment obligations, even if the Group as a whole and its operating subsidiaries are solvent, if income or distributions from operating subsidiaries are restricted or collateral is required to be posted on the Company’s derivative hedges due to market movements.
11.The Company may not pay a dividend on its ordinary shares in any given financial/calendar year
The determination of the Board of Directors of the Company (the “Board”) in any given year of whether the Company can or should pay a dividend on its ordinary shares, or the amount of such dividend, is subject to a number of factors.
In addition, specific measures, have been, and may continue to be taken by regulators to restrict distributions for example in times of significant economic uncertainty.
The Board must determine the optimum level of investment to foster growth responsibly and to fund investment initiatives in the business, including organic growth or growth through acquisitions as part of its growth strategy, as well as the appropriate level of capital for the Group to retain to meet current and evolving regulatory requirements and to cover uncertainties.
These determinations will change year to year based on the performance of the Group’s business in general, factors affecting its financial position (including capital, funding, liquidity and leverage), the economic environment in which the Group operates, the contractual terms of certain of the Group’s regulatory capital securities and other factors outside of the Group’s control, which could arise as a result of the crystallisation of credit-related risks, regulatory and legal risks, business and economic risks, operational risks, financial soundness-related risks and other risks described herein, many of which may impact the amount of capital that is generated over the course of the year. The Board’s decisions in relation to these matters will have an impact on the ability of the Company to pay a dividend on its ordinary shares in any given year.
12.Volatility in the price of the Company’s ordinary shares may affect the value of any investment in the Company
The market price of the Company’s ordinary shares could be volatile and subject to significant fluctuations due to various factors, some of which may be unrelated to the Group’s operating performance or prospects. These include economic or political disruption in the main jurisdictions in which the Group operates, any regulatory changes affecting the Group’s operations, developments in the industry or its competitors, the operating and share price performance of other companies in the industries and markets in which the Group operates, the potential placing of large volumes of the Company’s ordinary shares in the market or buyback of significant volume of the Company’s ordinary shares from the market, or speculation about the Group’s business in the press, media or investment communities. Furthermore, the Group’s results of operations and prospects from time to time may vary from the expectations of rating agencies, market analysts or investors. Any of these events could result in volatility in the market prices of the Company’s ordinary shares. In general, prospective investors should be aware that the value of an investment in the Company’s ordinary shares may go down as well as up.
| | | | | | | | |
181 | Lloyds Banking Group plc Annual Report on Form 20-F 2023 | |
Lloyds Banking Group structure
The following subsidiaries are disclosed as principal subsidiaries in note 56 to the consolidated financial statements; the list below includes all significant subsidiaries, and certain other subsidiaries as noted below, of the Company at 31 December 2023.
| | | | | | | | | | | | | | |
| Name of subsidiary undertaking | Country of
registration/
incorporation | Percentage of equity
share capital and
voting rights held | Nature of business | Registered office |
| Lloyds Bank plc | England | 100% | Banking and financial services | 25 Gresham Street, London EC2V 7HN |
| Scottish Widows Limited | England | 100%* | Life assurance | 25 Gresham Street, London EC2V 7HN |
| HBOS plc | Scotland | 100%* | Holding company | The Mound, Edinburgh EH1 1YZ |
| Bank of Scotland plc | Scotland | 100%* | Banking and financial services | The Mound, Edinburgh EH1 1YZ |
Lloyds Bank Corporate Markets plc1 | England | 100% | Banking and financial services | 25 Gresham Street, London EC2V 7HN |
LBG Equity Investments Limited1 | England | 100% | Financial services | 25 Gresham Street, London EC2V 7HN |
*Indirect interest
1Subsidiary that does not meet quantitative threshold for significance. Included for consistency with the consolidated financial statements.
| | | | | | | | |
182 | Lloyds Banking Group plc Annual Report on Form 20-F 2023 | |
Forward looking statements
This document contains certain forward-looking statements within the meaning of Section 21E of the US Securities Exchange Act of 1934, as amended, and section 27A of the US Securities Act of 1933, as amended, with respect to the business, strategy, plans and/or results of Lloyds Banking Group plc together with its subsidiaries (the Group) and its current goals and expectations. Statements that are not historical or current facts, including statements about the Group’s or its directors’ and/or management’s beliefs and expectations, are forward-looking statements. Words such as, without limitation, ‘believes’, ‘achieves’, ‘anticipates’, ‘estimates’, ‘expects’, ‘targets’, ‘should’, ‘intends’, ‘aims’, ‘projects’, ‘plans’, ‘potential’, ‘will’, ‘would’, ‘could’, ‘considered’, ‘likely’, ‘may’, ‘seek’, ‘estimate’, ‘probability’, ‘goal’, ‘objective’, ‘deliver’, ‘endeavour’, ‘prospects’, ‘optimistic’ and similar expressions or variations on these expressions are intended to identify forward-looking statements. These statements concern or may affect future matters, including but not limited to: projections or expectations of the Group’s future financial position, including profit attributable to shareholders, provisions, economic profit, dividends, capital structure, portfolios, net interest margin, capital ratios, liquidity, risk-weighted assets (RWAs), expenditures or any other financial items or ratios; litigation, regulatory and governmental investigations; the Group’s future financial performance; the level and extent of future impairments and write-downs; the Group’s ESG targets and/or commitments; statements of plans, objectives or goals of the Group or its management and other statements that are not historical fact and statements of assumptions underlying such statements. By their nature, forward-looking statements involve risk and uncertainty because they relate to events and depend upon circumstances that will or may occur in the future. Factors that could cause actual business, strategy, targets, plans and/or results (including but not limited to the payment of dividends) to differ materially from forward-looking statements include, but are not limited to: general economic and business conditions in the UK and internationally; acts of hostility or terrorism and responses to those acts, or other such events; geopolitical unpredictability; the war between Russia and Ukraine; the conflicts in the Middle East; the tensions between China and Taiwan; political instability including as a result of any UK general election; market related risks, trends and developments; changes in client and consumer behaviour and demand; exposure to counterparty risk; the ability to access sufficient sources of capital, liquidity and funding when required; changes to the Group’s credit ratings; fluctuations in interest rates, inflation, exchange rates, stock markets and currencies; volatility in credit markets; volatility in the price of the Group’s securities; tightening of monetary policy in jurisdictions in which the Group operates; natural pandemic and other disasters; risks concerning borrower and counterparty credit quality; risks affecting insurance business and defined benefit pension schemes; changes in laws, regulations, practices and accounting standards or taxation; changes to regulatory capital or liquidity requirements and similar contingencies; the policies and actions of governmental or regulatory authorities or courts together with any resulting impact on the future structure of the Group; risks associated with the Group’s compliance with a wide range of laws and regulations; assessment related to resolution planning requirements; risks related to regulatory actions which may be taken in the event of a bank or Group failure; exposure to legal, regulatory or competition proceedings, investigations or complaints; failure to comply with anti-money laundering, counter terrorist financing, anti-bribery and sanctions regulations; failure to prevent or detect any illegal or improper activities; operational risks including risks as a result of the failure of third party suppliers; conduct risk; technological changes and risks to the security of IT and operational infrastructure, systems, data and information resulting from increased threat of cyber and other attacks; technological failure; inadequate or failed internal or external processes or systems; risks relating to ESG matters, such as climate change (and achieving climate change ambitions) and decarbonisation, including the Group’s ability along with the government and other stakeholders to measure, manage and mitigate the impacts of climate change effectively, and human rights issues; the impact of competitive conditions; failure to attract, retain and develop high calibre talent; the ability to achieve strategic objectives; the ability to derive cost savings and other benefits including, but without limitation, as a result of any acquisitions, disposals and other strategic transactions; inability to capture accurately the expected value from acquisitions; assumptions and estimates that form the basis of the Group’s financial statements; and potential changes in dividend policy. A number of these influences and factors are beyond the Group’s control. Please refer to the latest Annual Report on Form 20-F filed by Lloyds Banking Group plc with the US Securities and Exchange Commission (the SEC), which is available on the SEC’s website at www.sec.gov, for a discussion of certain factors and risks. Lloyds Banking Group plc may also make or disclose written and/or oral forward-looking statements in other written materials and in oral statements made by the directors, officers or employees of Lloyds Banking Group plc to third parties, including financial analysts. Except as required by any applicable law or regulation, the forward-looking statements contained in this document are made as of today’s date, and the Group expressly disclaims any obligation or undertaking to release publicly any updates or revisions to any forward-looking statements contained in this document whether as a result of new information, future events or otherwise. The information, statements and opinions contained in this document do not constitute a public offer under any applicable law or an offer to sell any securities or financial instruments or any advice or recommendation with respect to such securities or financial instruments.
| | | | | | | | |
183 | Lloyds Banking Group plc Annual Report on Form 20-F 2023 | |
Index to the consolidated financial statements
| | | | | | | | |
F-1 | Lloyds Banking Group plc Annual Report on Form 20-F 2023 | |
Report of independent registered public accounting firm
To the shareholders and the Board of Directors of Lloyds Banking Group plc
Opinion on the financial statements
We have audited the accompanying consolidated balance sheets of Lloyds Banking Group plc and subsidiaries (the 'Group') as at 31 December 2023 and 2022, the related consolidated income statements, consolidated statements of comprehensive income, statements of changes in equity, and cash flow statements, for each of the three years in the period ended 31 December 2023, and the related notes and the tables marked as ‘Audited’ in the Operating and financial review and prospects section on pages 15 to 95 (collectively referred to as the ‘financial statements’). In our opinion, the financial statements present fairly, in all material respects, the financial position of the Group as at 31 December 2023 and 2022, and the results of its operations and its cash flows for each of the three years in the period ended 31 December 2023, in conformity with International Financial Reporting Standards as issued by the International Accounting Standards Board. We have also audited, in accordance with the standards of the Public Company Accounting Oversight Board (United States) (PCAOB), the Group's internal control over financial reporting as at 31 December 2023, based on criteria established in Internal Control – Integrated Framework (2013) issued by the Committee of Sponsoring Organizations of the Treadway Commission and our report dated 22 February 2024, expressed an unqualified opinion on the Group's internal control over financial reporting.
Adoption of new accounting standard
As discussed in notes 1 and 54 to the financial statements, IFRS 17 ‘Insurance Contracts’ (‘IFRS 17’) became effective on 1 January 2023, replacing IFRS 4 ‘Insurance Contracts’ (‘IFRS 4’), which required retrospective restatement effective 1 January 2022.
Basis for opinion
These financial statements are the responsibility of the Group's management. Our responsibility is to express an opinion on the Group's financial statements based on our audit. We are a public accounting firm registered with the PCAOB and are required to be independent with respect to the Group in accordance with the U.S. federal securities laws and the applicable rules and regulations of the Securities and Exchange Commission and the PCAOB.
We conducted our audits in accordance with the standards of the PCAOB. Those standards require that we plan and perform the audit to obtain reasonable assurance about whether the financial statements are free of material misstatement, whether due to error or fraud. Our audits included performing procedures to assess the risks of material misstatement of the financial statements, whether due to error or fraud, and performing procedures that respond to those risks. Such procedures included examining, on a test basis, evidence regarding the amounts and disclosures in the financial statements. Our audits also included evaluating the accounting principles used and significant estimates made by management, as well as evaluating the overall presentation of the financial statements. We believe that our audits provide a reasonable basis for our opinion.
Critical Audit Matters
The critical audit matters communicated below are matters arising from the current-period audit of the financial statements that were communicated or required to be communicated to the audit committee and that (1) relate to accounts or disclosures that are material to the financial statements and (2) involved especially challenging, subjective, or complex judgements. The communication of critical audit matters does not alter in any way our opinion on the financial statements, taken as a whole, and we are not, by communicating the critical audit matters below, providing separate opinions on the critical audit matters or on the accounts or disclosures to which they relate.
Expected credit losses
Impairment of loans and advances
Refer to notes 2, 18, 23, 24 and 52 in the financial statements
Critical Audit Matter description
The Group has recognised £4.1 billion of expected credit losses (‘ECL’) as at 31 December 2023. The determination of ECL consists of a number of assumptions that are inherently uncertain and require a high degree of complex and subjective auditor judgement, specialised skills and knowledge, and complex impairment modelling. Specifically, the impact of high interest rates and inflation, as well as the economic impact of the rising cost of living on the ECL have been particularly judgemental in the current economic environment.
The key areas we identified as having the most significant level of management judgement were in respect of:
•Multiple economic scenarios (‘MES’);
•Collectively assessed ECL;
•Individually assessed ECL; and
•ECL model adjustments.
Multiple economic scenarios
The measurement of expected credit losses is required to reflect an unbiased probability-weighted range of possible future outcomes.
The Group’s economics team develops the future economic scenarios. Firstly, a base case forecast is produced based on a set of conditioning assumptions, which are designed to reflect the Group’s best view of future events. A full distribution of economic scenarios around this base case is produced using a Monte Carlo simulation and scenarios within that distribution are ranked using estimated relationships with industrywide historical loss data.
In addition to the base case, three scenarios are derived from the distribution as averages of constituent modelled scenarios around the 15th, 75th and 95th percentiles of the distribution corresponding to an upside, a downside and a severe downside, respectively. The severe downside is then adjusted to incorporate non-modelled paths for inflation and interest rate assumptions. The upside, the base case and the downside scenarios are weighted at 30 per cent and the severe downside at 10 per cent.
These four scenarios are then used as key assumptions in the determination of the ECL allowance.
The development of these multiple economic scenarios is inherently uncertain, highly complex, and requires significant judgement. .
The principal consideration for our determination that the multiple economic scenarios is a key audit matter was the high degree of management judgement which required specialised auditor knowledge and a high degree of audit effort in areas such as evaluating the forward-looking information used by management, and the weighting applied.
| | | | | | | | |
F-2 | Lloyds Banking Group plc Annual Report on Form 20-F 2023 | |
Report of independent registered public accounting firm continued
Collectively assessed ECL
The ECL for the Retail and Commercial Banking divisions, except for individually assessed stage 3 commercial loans, is determined on a collective basis using impairment models. These models use a number of significant judgements to calculate a probability weighted estimate by applying a probability of default, exposure at default and a loss given default, taking account of collateral held or other loss mitigants, discounted using the effective interest rate.
The key judgements and estimates in determining the ECL include:
•modelling approach, modelling simplifications and judgements, and selection of modelling data;
•behavioural lives for the Retail division;
•credit risk ratings for the Commercial Banking division, which are performed on a counterparty basis for larger exposures by a credit officer; and
•the appropriate allocation of assets into the correct staging taking into account any significant deterioration in credit risk since inception of the loan.
Individually assessed ECL
For individual provision assessments of larger exposures in stage 3 in the Commercial Banking division, complex and subjective auditor judgement including specialised knowledge is required in evaluating the methodology, models and inputs that are inherently uncertain. The significant judgements in determining provisions are the:
•completeness and appropriateness of the potential workout scenarios identified;
•probability of default assigned to each identified potential workout scenarios; and
•valuation assumptions used in determining the expected recovery strategies.
ECL model adjustments
Adjustments are made to models to address known model and data limitations, and emerging or non-modelled risks. The current economic environment, characterised by elevated cost of living pressures on borrowers and high inflation, has increased the uncertainty of credit losses. As a result, the amount and timing of adjustments recognised in the model to account for the impacts of the current economic environment are highly judgemental and inherently uncertain. These adjustments require specialist auditor judgement when evaluating the:
•completeness of adjustments; and
•methodology, models and inputs used in determining the relevant adjustments.
Where impairment models do not incorporate all factors relevant to estimating the ECL, adjustments are made to address known model limitations and data limitations, emerging or non-modelled risks and the impact of economic uncertainty on different industry sectors. The measurement of judgements around model adjustments to evaluate the completeness of adjustments, methodology and model inputs for these adjustments is highly judgemental and inherently uncertain.
How the Critical Audit Matter was addressed in the audit
Multiple economic scenarios
We performed the following procedures:
•Tested the controls over the generation of the multiple economic scenarios including those over the Group’s governance processes to determine the base case, different scenarios and the weightings applied to each scenario;
•Working with our internal economic specialists:
–Challenged and evaluated economic forecasts in the base scenario such as the unemployment rate, House Price Index, inflation and forecasted interest rates, and Gross Domestic Product through comparison to independent economic outlooks, other external analyses and market data;
–Challenged and evaluated the appropriateness of management’s change in assumptions in the model;
–Challenged and evaluated the appropriateness of the methodology applied to generate alternative macroeconomic scenarios, including associated weightings and assumptions within; and
–Independently replicated the multiple economic scenario model and compared the outputs of our independent model to the Group’s output to test scenario generation;
•Tested the completeness and accuracy of the data used by the model;
•Performed a stand back assessment of the appropriateness of the weightings applied to each of the scenarios based on publicly available data; and
•Evaluated the appropriateness of disclosures in respect of significant judgements and sources of estimation uncertainty including macroeconomic scenarios.
Collectively assessed ECL
We tested controls across the process to determine the ECL provisions including:
•Model governance, including model validation and monitoring;
•Model assumptions;
•The allocation of assets into stages, including those to determine the Credit Risk Rating in the Commercial Banking division; and
•Data accuracy and completeness.
Working with our internal modelling specialists our audit procedures over the key areas of estimation covered the following:
•Model estimations; where we:
–Evaluated the appropriateness of the modelling approach and assumptions used;
–Independently replicated the models for all material portfolios and compared the outputs of our independent models to the Group’s outputs;
–Assessed model performance by evaluating variations between observed data and model predictions;
–Developed an understanding and assessed model limitations and remedial actions; and
–Tested the completeness and accuracy of the data used in model execution and calibration.
•Allocation of assets into stages, where we:
–Evaluated the appropriateness of quantitative and qualitative criteria used for allocation into IFRS 9 stages, including independently assessing the credit rating of loans in the commercial banking division;
–Tested the appropriateness of the stage allocation for a sample of exposures; and
–Tested the data used by models in assigning IFRS 9 stages and evaluated the appropriateness of the model logic used.
| | | | | | | | |
F-3 | Lloyds Banking Group plc Annual Report on Form 20-F 2023 | |
Report of independent registered public accounting firm continued
Individually assessed ECL
For expected credit losses assessed individually we have:
•Selected senior team members with extensive IFRS 9 knowledge and expertise to design and lead the execution of ECL recognised in respect of these exposures;
•Tested the controls over the determination of individually assessed exposures including assumptions and inputs into workout and recovery scenarios, as well as valuation assumptions used; and
•Evaluated the appropriateness of workout and recovery scenarios including associated cash flows and consideration of climate risk.
ECL model adjustments
In respect of the adjustment to models, we performed the following procedures in conjunction with our specialists:
•Tested the controls over the valuation of in-model and post-model adjustments;
•Evaluated the methodology, approach and assumptions in developing the adjustments, and evaluated the Group’s selection of approach;
•Tested the completeness and accuracy of the data used in formulating the judgements;
•Performed a recalculation of adjustments;
•Evaluated the completeness of adjustments based on our understanding of both model and data limitations, including those related to cost of living and high inflation pressures; and
•Assessed the appropriateness of the disclosures and whether the disclosures appropriately address the uncertainty which exists in determining the ECL.
Regulatory and litigation matters
Provisions
Refer to notes 2 and 38 in the financial statements
Critical Audit Matter description
The Group operates in an environment where it is subject to regulatory investigations, litigation and customer remediation including allegations of fraud and misconduct. The Group is currently exposed to a number of regulatory and litigation matters. The Group’s provision for these matters is £1.1 billion as at 31 December 2023. In the current year, the Group recognised a provision of £450 million relating to motor finance commission arrangements.
Significant judgement is required by the Group in determining whether, under IAS 37 Provisions, Contingent Liabilities and Contingent Assets:
•The amount recorded is representative of the Group’s best estimate to settle the obligation based on the information available to the Group, including in respect of motor finance commission arrangements where there is significant uncertainty around the final outcome of the on-going review by the FCA; and
•Any contingent liabilities and underlying significant estimation uncertainties are adequately disclosed.
How the Critical Audit Matter was addressed in the audit
We performed the following audit procedures:
•Tested the Group’s controls over the completeness of provisions, the review of the assessment of the provision against the requirements of IAS 37, the review of the appropriateness of judgements used to determined a ‘best estimate’ and the completeness and accuracy of data used in the process;
•Evaluated the assessment of the provisions, associated probabilities, and potential outcomes in accordance with IAS 37;
•Verified and evaluated whether the methodology, data and significant judgements and assumptions used in the valuation of the provisions are appropriate in the context of the applicable financial reporting framework;
•In respect of motor finance commission arrangements, we inspected information available for the historical complaints, both supportive and contradictory, and the limited number of decisions made by the Financial Ombudsman Service. We tested the methodology and assumptions applied to determine the provision;
•Inspected correspondence and, where appropriate, made direct inquiry with the Group’s regulators and internal and external legal counsel;
•Where no provision was made, we critically evaluated the conclusion in the context of the requirements of IAS 37; and
•Evaluated whether the disclosures made in the financial statements appropriately reflect the facts and key sources of estimation uncertainty, including in respect of motor finance commission arrangements.
Defined benefit obligations
Retirement benefit obligations
Refer to notes 2 and 16 in the financial statements
Critical Audit Matter description
The Group operates a number of defined benefit retirement schemes, the obligations for which totalled £30.2 billion as at 31 December 2023. Their valuation is determined with reference to key actuarial assumptions including mortality assumptions, discount rates and inflation rates. Due to the size of these schemes, small changes in these assumptions can have a material impact on the value of the defined benefit obligation and therefore, the determination of these assumptions require significant auditor judgement.
How the Critical Audit Matter was addressed in the audit
We performed the following audit procedures:
•Tested the Group’s controls over the valuation of the defined benefit obligations, including controls over the assumptions setting process; and
•Challenged the key actuarial assumptions used by comparing these against ranges and expectations determined by our internal actuarial experts, which are calculated with reference to the central assumptions adopted by the actuarial firms for whom we have reviewed and accepted their methodologies.
| | | | | | | | |
F-4 | Lloyds Banking Group plc Annual Report on Form 20-F 2023 | |
Report of independent registered public accounting firm continued
Valuation of certain complex and illiquid financial instruments held at fair value
Financial assets at fair value through profit or loss
Refer to notes 2, 20, 21 and 52 in the financial statements
Critical Audit Matter description
Financial instruments are classified as level 1, 2 or 3 in accordance with IFRS 13 ‘Fair Value Measurement’.
The fair value of complex and illiquid financial instruments, involves significant judgement. The extent of judgement applied by the Group in valuing the Group’s financial investments varies with the nature of assets held, the markets in which they are traded, and the valuation methodology applied.
The Group holds several portfolios of level 3 illiquid investments totalling £7.9 billion, the largest of which is held within the Insurance, Pensions and Investments division, which comprises loans in the commercial real estate, social housing, infrastructure, and education sectors. The valuation of these loans uses complex valuation models as they are without readily determinable market values and were valued using significant unobservable inputs, such as loan to bond premium and calibration spread that involved considerable judgement by management.
We also consider these judgements to be at risk of management bias.
How the Critical Audit Matter was addressed in the audit
We tested the controls over the valuation of financial instruments, including controls over assumptions used in the valuation of these financial assets, and model review controls.
We utilised our valuation specialists in our audit of the valuation of the level 3 portfolio loans and we performed the following procedures:
•Evaluated the appropriateness of loan valuation methodologies;
•Calculated a range of comparable values for a sample of modelled illiquid financial instruments using an independent valuation model and considered reasonable alternative key assumptions based on comparable securities and compared results;
•Evaluated the appropriateness of the internal credit ratings methodology and tested the appropriateness of the ratings for a sample of credit files;
•Evaluated the consistency and appropriateness of inputs and assumptions over time, challenging both significant movements and non-movements where we expected change; and
•Assessed the appropriateness of disclosures and sensitivity analysis.
First time implementation of IFRS 17
Liabilities arising from insurance contracts and participating investment contracts
Refer to notes 1, 2, 30, 36 and 54 in the financial statements
Critical Audit Matter description
IFRS 17 ‘Insurance Contracts’ became effective from 1 January 2023, replacing IFRS 4 ‘Insurance Contracts’. The new standard establishes the principles for the recognition, measurement, presentation and disclosure of insurance contracts which are significantly different to those required under IFRS 4.
As a result, comparative financial information has been restated from 1 January 2022, with the first time adoption of IFRS 17 resulting in a decrease in reserves by £1.9 billion upon transition.
Under IFRS 17, insurance contracts are categorised into groups with similar measurement characteristics and valued at a risk-adjusted present value of estimated future cash flows plus or minus an amount representing unearned profits. Unearned profits are recognised over the period of the insurance contract unless a group of contracts are loss-making, in which case losses would have to be recognised immediately.
In accordance with the transition arrangements allowed under IFRS 17, from 1 January 2022 LBG adopted a fair value approach to certain groups of contracts, as it was determined to be impracticable to apply the standard on a fully retrospective basis. All other contracts were remeasured and recognised on a fully retrospective basis.
This required a significant level of judgement in the interpretation and determination of accounting policies and methodologies to be applied to the IFRS 17 calculation models, primarily related to the estimate of the fulfilment cashflows and contractual service margin (‘CSM’); under both the full retrospective and fair value approaches. Determining the first-time adoption of these judgements is inherently judgemental and complex, requiring significant auditor effort.
Implementation of IFRS 17 has also required incremental data to be used within the new models and new disclosure requirements both on transition and on an ongoing basis.
How the Critical Audit Matter was addressed in the audit
We performed the following audit procedures:
•Tested the controls over the accounting methodologies applied in the new IFRS 17 calculation models, CSM and the estimated fulfilment of cashflows;
•Evaluated the appropriateness of key technical accounting decisions, judgements, assumptions and elections made in determining the impacts to assess compliance with the requirements of the standard;
•Involved our internal actuarial specialists in performing procedures to assess the Group’s implementation of the defined methodology and IFRS 17 calculation models, including those related to the estimate of the fulfilment cashflows and CSM; under both the full retrospective and fair value approaches, as applicable;
•Tested the completeness and accuracy of incremental data and other information required for IFRS 17 calculations, including the attribution of cash flows and modelled results to the appropriate CSM calculation groups; and
•Evaluated the new ongoing disclosures and the disclosures related to the transition impact and reconciled the disclosures to underlying accounting records and supporting data.
/s/ Deloitte LLP
London, United Kingdom
22 February 2024
We have served as the Group’s auditor since 2021.
| | | | | | | | |
F-5 | Lloyds Banking Group plc Annual Report on Form 20-F 2023 | |
Report of independent registered public accounting firm continued
To the shareholders and the Board of Directors of Lloyds Banking Group plc
Opinion on Internal Control over Financial Reporting
We have audited the internal control over financial reporting of Lloyds Banking Group plc and subsidiaries (the "Group") as at 31 December 2023, based on criteria established in Internal Control — Integrated Framework (2013) issued by the Committee of Sponsoring Organizations of the Treadway Commission (COSO). In our opinion, the Group maintained, in all material respects, effective internal control over financial reporting as of 31 December 2023, based on criteria established in Internal Control — Integrated Framework (2013) issued by COSO.
We have also audited, in accordance with the standards of the Public Company Accounting Oversight Board (United States) (PCAOB), the consolidated financial statements as at and for the year ended 31 December 2023, of the Group and our report dated 22 February 2024, expressed an unqualified opinion on those consolidated financial statements and included an explanatory paragraph regarding the Group’s adoption of a new accounting standard.
Basis for opinion
The Group’s management is responsible for maintaining effective internal control over financial reporting and for its assessment of the effectiveness of internal control over financial reporting, included in the accompanying Management Report on Internal Control Over Financial Reporting. Our responsibility is to express an opinion on the Group’s internal control over financial reporting based on our audit. We are a public accounting firm registered with the PCAOB and are required to be independent with respect to the Group in accordance with the U.S. federal securities laws and the applicable rules and regulations of the Securities and Exchange Commission and the PCAOB.
We conducted our audit in accordance with the standards of the PCAOB. Those standards require that we plan and perform the audit to obtain reasonable assurance about whether effective internal control over financial reporting was maintained in all material respects. Our audit included obtaining an understanding of internal control over financial reporting, assessing the risk that a material weakness exists, testing and evaluating the design and operating effectiveness of internal control based on the assessed risk, and performing such other procedures as we considered necessary in the circumstances. We believe that our audit provides a reasonable basis for our opinion.
Definition and Limitations of Internal Control over Financial Reporting
A company’s internal control over financial reporting is a process designed to provide reasonable assurance regarding the reliability of financial reporting and the preparation of financial statements for external purposes in accordance with generally accepted accounting principles. A company’s internal control over financial reporting includes those policies and procedures that (1) pertain to the maintenance of records that, in reasonable detail, accurately and fairly reflect the transactions and dispositions of the assets of the company; (2) provide reasonable assurance that transactions are recorded as necessary to permit preparation of financial statements in accordance with generally accepted accounting principles, and that receipts and expenditures of the company are being made only in accordance with authorisations of management and directors of the company; and (3) provide reasonable assurance regarding prevention or timely detection of unauthorised acquisition, use, or disposition of the company’s assets that could have a material effect on the financial statements.
Because of its inherent limitations, internal control over financial reporting may not prevent or detect misstatements. Also, projections of any evaluation of effectiveness to future periods are subject to the risk that controls may become inadequate because of changes in conditions, or that the degree of compliance with the policies or procedures may deteriorate.
/s/ Deloitte LLP
London, United Kingdom
22 February 2024
| | | | | | | | |
F-6 | Lloyds Banking Group plc Annual Report on Form 20-F 2023 | |
Consolidated income statement
for the year ended 31 December
| | | | | | | | | | | | | | | | | | | | | | | |
| Note | | 2023 £m | | 20221,2 £m | | 20212 £m |
| Interest income | | | 28,051 | | | 17,645 | | | 13,258 | |
| Interest expense | | | (14,753) | | | (4,723) | | | (2,386) | |
| Net interest income | 5 | | 13,298 | | | 12,922 | | | 10,872 | |
| Fee and commission income | | | 2,926 | | | 2,790 | | | 2,608 | |
| Fee and commission expense | | | (1,095) | | | (1,070) | | | (1,185) | |
| Net fee and commission income | 6 | | 1,831 | | | 1,720 | | | 1,423 | |
| Net trading income (losses) | 7 | | 18,049 | | | (19,987) | | | 17,200 | |
| Insurance premium income | 8 | | | | | | 8,283 | |
| Insurance revenue | 9 | | 3,008 | | | 2,461 | | | |
| Insurance service expense | 10 | | (2,414) | | | (3,863) | | | |
| Net income from reinsurance contracts held | | | 2 | | | 62 | | | |
| Insurance service result | | | 596 | | | (1,340) | | | |
| Other operating income | 11 | | 1,631 | | | 1,339 | | | 1,172 | |
| Other income | | | 22,107 | | | (18,268) | | | 28,078 | |
| Total income | | | 35,405 | | | (5,346) | | | 38,950 | |
| Insurance claims and changes in insurance and investment contract liabilities | 12 | | | | | | (21,120) | |
| Net finance (expense) income from insurance, participating investment and reinsurance contracts | 13 | | (11,684) | | | 15,893 | | | |
| Movement in third party interests in consolidated funds | | | (1,109) | | | 1,035 | | | (1,506) | |
| Change in non-participating investment contracts | | | (3,983) | | | 3,959 | | | |
| Total income, after net finance (expense) income in respect of insurance and investment contracts | | | 18,629 | | | 15,541 | | | 16,324 | |
| Operating expenses | 14 | | (10,823) | | | (9,237) | | | (10,800) | |
| Impairment (charge) credit | 18 | | (303) | | | (1,522) | | | 1,378 | |
| Profit before tax | | | 7,503 | | | 4,782 | | | 6,902 | |
| Tax expense | 19 | | (1,985) | | | (859) | | | (1,017) | |
| Profit for the year | | | 5,518 | | | 3,923 | | | 5,885 | |
| | | | | | | |
| Profit attributable to ordinary shareholders | | | 4,933 | | | 3,389 | | | 5,355 | |
| Profit attributable to other equity holders | | | 527 | | | 438 | | | 429 | |
| Profit attributable to equity holders | | | 5,460 | | | 3,827 | | | 5,784 | |
| Profit attributable to non-controlling interests | | | 58 | | | 96 | | | 101 | |
| Profit for the year | | | 5,518 | | | 3,923 | | | 5,885 | |
| | | | | | | |
| Basic earnings per share | 41 | | 7.6p | | 4.9p | | 7.5p |
| Diluted earnings per share | 41 | | 7.5p | | 4.9p | | 7.5p |
1 Restated for the adoption of IFRS 17; see notes 1 and 54.
2 Restated for presentational changes; see note 1.
The accompanying notes are an integral part of the consolidated financial statements.
| | | | | | | | |
F-7 | Lloyds Banking Group plc Annual Report on Form 20-F 2023 | |
Consolidated statement of comprehensive income
for the year ended 31 December
| | | | | | | | | | | | | | | | | |
| 2023 £m | | 20221 £m | | 2021 £m |
| Profit for the year | 5,518 | | | 3,923 | | | 5,885 | |
| Other comprehensive income | | | | | |
| Items that will not subsequently be reclassified to profit or loss: | | | | | |
| Post-retirement defined benefit scheme remeasurements: | | | | | |
| Remeasurements before tax | (1,633) | | | (3,012) | | | 1,720 | |
| Tax | 428 | | | 860 | | | (658) | |
| (1,205) | | | (2,152) | | | 1,062 | |
| Movements in revaluation reserve in respect of equity shares held at fair value through other comprehensive income: | | | | | |
| Change in fair value | (54) | | | 44 | | | 61 | |
| Tax | (3) | | | 3 | | | (4) | |
| (57) | | | 47 | | | 57 | |
| Gains and losses attributable to own credit risk: | | | | | |
| (Losses) gains before tax | (234) | | | 519 | | | (86) | |
| Tax | 66 | | | (155) | | | 34 | |
| (168) | | | 364 | | | (52) | |
| | | | | |
| Items that may subsequently be reclassified to profit or loss: | | | | | |
| Movements in revaluation reserve in respect of debt securities held at fair value through other comprehensive income: | | | | | |
| Change in fair value | (40) | | | (133) | | | 133 | |
| Income statement transfers in respect of disposals | (122) | | | (92) | | | 2 | |
| Income statement transfers in respect of impairment | (2) | | | 6 | | | (2) | |
| Tax | 47 | | | 62 | | | (25) | |
| (117) | | | (157) | | | 108 | |
| Movements in cash flow hedging reserve: | | | | | |
| Effective portion of changes in fair value taken to other comprehensive income | 545 | | | (6,990) | | | (2,279) | |
| Net income statement transfers | 1,838 | | | 43 | | | (621) | |
| Tax | (673) | | | 1,928 | | | 814 | |
| 1,710 | | | (5,019) | | | (2,086) | |
| Movements in foreign currency translation reserve: | | | | | |
Currency translation differences (tax: £nil) | (53) | | | 116 | | | (39) | |
Transfers to income statement (tax: £nil) | – | | | (31) | | | – | |
| (53) | | | 85 | | | (39) | |
| Total other comprehensive income (loss) for the year, net of tax | 110 | | | (6,832) | | | (950) | |
| Total comprehensive income (loss) for the year | 5,628 | | | (2,909) | | | 4,935 | |
| | | | | |
| Total comprehensive income (loss) attributable to ordinary shareholders | 5,043 | | | (3,443) | | | 4,405 | |
| Total comprehensive income attributable to other equity holders | 527 | | | 438 | | | 429 | |
| Total comprehensive income (loss) attributable to equity holders | 5,570 | | | (3,005) | | | 4,834 | |
| Total comprehensive income attributable to non-controlling interests | 58 | | | 96 | | | 101 | |
| Total comprehensive income (loss) for the year | 5,628 | | | (2,909) | | | 4,935 | |
1 Restated for the adoption of IFRS 17; see notes 1 and 54.
The accompanying notes are an integral part of the consolidated financial statements.
| | | | | | | | |
F-8 | Lloyds Banking Group plc Annual Report on Form 20-F 2023 | |
Consolidated balance sheet
at 31 December
| | | | | | | | | | | | | | | | | | | | | | | |
| Note | | 2023 £m | | 20221 £m | | 1 Jan 20221 £m |
| Assets | | | | | | | |
| Cash and balances at central banks | | | 78,110 | | | 91,388 | | | 76,420 | |
Financial assets at fair value through profit or loss | 21 | | 203,318 | | | 180,769 | | | 206,971 | |
| Derivative financial instruments | 22 | | 22,356 | | | 24,753 | | | 22,051 | |
Loans and advances to banks | | | 10,764 | | | 10,632 | | | 7,001 | |
Loans and advances to customers | 23 | | 449,745 | | | 454,899 | | | 448,567 | |
Reverse repurchase agreements | | | 38,771 | | | 44,865 | | | 54,753 | |
| Debt securities | | | 15,355 | | | 9,926 | | | 6,835 | |
| Financial assets at amortised cost | | | 514,635 | | | 520,322 | | | 517,156 | |
| Financial assets at fair value through other comprehensive income | 21 | | 27,592 | | | 23,154 | | | 28,137 | |
| Goodwill and other intangible assets | 26 | | 8,306 | | | 7,615 | | | 6,713 | |
| Current tax recoverable | | | 1,183 | | | 612 | | | 363 | |
| Deferred tax assets | 19 | | 5,185 | | | 6,422 | | | 3,773 | |
| Retirement benefit assets | 16 | | 3,624 | | | 3,823 | | | 4,531 | |
Other assets | 27 | | 17,144 | | | 14,536 | | | 15,142 | |
| Total assets | | | 881,453 | | | 873,394 | | | 881,257 | |
| Liabilities | | | | | | | |
Deposits from banks | | | 6,153 | | | 7,266 | | | 7,647 | |
Customer deposits | | | 471,396 | | | 475,331 | | | 476,344 | |
Repurchase agreements at amortised cost | | | 37,703 | | | 48,596 | | | 31,125 | |
| Financial liabilities at fair value through profit or loss | 21 | | 24,914 | | | 17,755 | | | 23,123 | |
| Derivative financial instruments | 22 | | 20,149 | | | 24,042 | | | 18,060 | |
| Notes in circulation | | | 1,392 | | | 1,280 | | | 1,321 | |
| Debt securities in issue at amortised cost | 29 | | 75,592 | | | 73,819 | | | 71,552 | |
| Liabilities arising from insurance and participating investment contracts | 30 | | 120,123 | | | 110,278 | | | 125,179 | |
| Liabilities arising from non-participating investment contracts | | | 44,978 | | | 39,476 | | | 40,890 | |
| Other liabilities | 37 | | 19,026 | | | 18,764 | | | 19,367 | |
| Retirement benefit obligations | 16 | | 136 | | | 126 | | | 230 | |
| Current tax liabilities | | | 39 | | | 8 | | | 6 | |
| Deferred tax liabilities | 19 | | 157 | | | 209 | | | 8 | |
| Provisions | 38 | | 2,077 | | | 1,803 | | | 2,080 | |
| Subordinated liabilities | 39 | | 10,253 | | | 10,730 | | | 13,108 | |
| Total liabilities | | | 834,088 | | | 829,483 | | | 830,040 | |
| Equity | | | | | | | |
| Share capital | 40 | | 6,358 | | | 6,729 | | | 7,102 | |
| Share premium account | 42 | | 18,568 | | | 18,504 | | | 18,479 | |
| Other reserves | 43 | | 8,508 | | | 6,587 | | | 11,177 | |
| Retained profits | 44 | | 6,790 | | | 6,550 | | | 8,318 | |
| Ordinary shareholders’ equity | | | 40,224 | | | 38,370 | | | 45,076 | |
| Other equity instruments | 45 | | 6,940 | | | 5,297 | | | 5,906 | |
| Total equity excluding non-controlling interests | | | 47,164 | | | 43,667 | | | 50,982 | |
| Non-controlling interests | | | 201 | | | 244 | | | 235 | |
| Total equity | | | 47,365 | | | 43,911 | | | 51,217 | |
| Total equity and liabilities | | | 881,453 | | | 873,394 | | | 881,257 | |
1 Restated for presentational changes and for the adoption of IFRS 17; see notes 1 and 54.
The accompanying notes are an integral part of the consolidated financial statements.
| | | | | | | | |
F-9 | Lloyds Banking Group plc Annual Report on Form 20-F 2023 | |
Consolidated statement of changes in equity
for the year ended 31 December
| | | | | | | | | | | | | | | | | | | | | | | | | | | | | | | | | | | | | | | | | | | | |
| | Attributable to ordinary shareholders | | Other
equity
instruments
£m | | Non-
controlling
interests
£m | | Total
£m |
| | Share
capital and
premium
£m | | Other
reserves
£m | | Retained
profits
£m | | Total
£m | | | |
| At 31 December 2022 (as previously reported) | | 25,233 | | | 6,602 | | | 10,145 | | | 41,980 | | | 5,297 | | | 244 | | | 47,521 | |
Adjustment on adoption of IFRS 17 (see notes 1 and 54) | | – | | | (15) | | | (3,595) | | | (3,610) | | | – | | | – | | | (3,610) | |
| At 1 January 2023 | | 25,233 | | | 6,587 | | | 6,550 | | | 38,370 | | | 5,297 | | | 244 | | | 43,911 | |
| Comprehensive income | | | | | | | | | | | | | | |
| Profit for the year | | – | | | – | | | 4,933 | | | 4,933 | | | 527 | | | 58 | | | 5,518 | |
| Other comprehensive income | | | | | | | | | | | | | | |
| Post-retirement defined benefit scheme remeasurements, net of tax | | – | | | – | | | (1,205) | | | (1,205) | | | – | | | – | | | (1,205) | |
| Movements in revaluation reserve in respect of financial assets held at fair value through other comprehensive income, net of tax: | | | | | | | | | | | | | | |
| Debt securities | | – | | | (117) | | | – | | | (117) | | | – | | | – | | | (117) | |
| Equity shares | | – | | | (57) | | | – | | | (57) | | | – | | | – | | | (57) | |
| Gains and losses attributable to own credit risk, net of tax | | – | | | – | | | (168) | | | (168) | | | – | | | – | | | (168) | |
| Movements in cash flow hedging reserve, net of tax | | – | | | 1,710 | | | – | | | 1,710 | | | – | | | – | | | 1,710 | |
| Movements in foreign currency translation reserve, net of tax | | – | | | (53) | | | – | | | (53) | | | – | | | – | | | (53) | |
| Total other comprehensive income (loss) | | – | | | 1,483 | | | (1,373) | | | 110 | | | – | | | – | | | 110 | |
Total comprehensive income1 | | – | | | 1,483 | | | 3,560 | | | 5,043 | | | 527 | | | 58 | | | 5,628 | |
| Transactions with owners | | | | | | | | | | | | | | |
| Dividends (note 46) | | – | | | – | | | (1,651) | | | (1,651) | | | – | | | (101) | | | (1,752) | |
| Distributions on other equity instruments | | – | | | – | | | – | | | – | | | (527) | | | – | | | (527) | |
| Issue of ordinary shares | | 131 | | | – | | | – | | | 131 | | | – | | | – | | | 131 | |
| Share buyback (note 43) | | (438) | | | 438 | | | (1,993) | | | (1,993) | | | – | | | – | | | (1,993) | |
| | | | | | | | | | | | | | |
| Issue of other equity instruments (note 45) | | – | | | – | | | (6) | | | (6) | | | 1,778 | | | – | | | 1,772 | |
| Repurchases and redemptions of other equity instruments (note 45) | | – | | | – | | | – | | | – | | | (135) | | | – | | | (135) | |
| Movement in treasury shares | | – | | | – | | | 103 | | | 103 | | | – | | | – | | | 103 | |
| Value of employee services: | | | | | | | | | | | | | | |
| Share option schemes | | – | | | – | | | 58 | | | 58 | | | – | | | – | | | 58 | |
| Other employee award schemes | | – | | | – | | | 169 | | | 169 | | | – | | | – | | | 169 | |
| Changes in non-controlling interests | | – | | | – | | | – | | | – | | | – | | | – | | | – | |
| Total transactions with owners | | (307) | | | 438 | | | (3,320) | | | (3,189) | | | 1,116 | | | (101) | | | (2,174) | |
| Realised gains and losses on equity shares held at fair value through other comprehensive income | | – | | | – | | | – | | | – | | | – | | | – | | | – | |
| At 31 December 2023 | | 24,926 | | | 8,508 | | | 6,790 | | | 40,224 | | | 6,940 | | | 201 | | | 47,365 | |
1 Total comprehensive income attributable to owners of the parent was a surplus of £5,570 million (2022: loss of £3,005 million; 2021: surplus of £4,834 million).
Further details of movements in the Group’s share capital, reserves and other equity instruments are provided in notes 40 and 42 to 45.
The accompanying notes are an integral part of the consolidated financial statements.
| | | | | | | | |
F-10 | Lloyds Banking Group plc Annual Report on Form 20-F 2023 | |
Consolidated statement of changes in equity continued
for the year ended 31 December
| | | | | | | | | | | | | | | | | | | | | | | | | | | | | | | | | | | | | | | | | | | | |
| | Attributable to ordinary shareholders | | Other
equity
instruments
£m | | Non-
controlling
interests
£m | | Total
£m |
| | Share
capital and
premium
£m | | Other
reserves
£m | | Retained
profits
£m | | Total
£m | | | |
| At 31 December 2021 | | 25,581 | | | 11,189 | | | 10,241 | | | 47,011 | | | 5,906 | | | 235 | | | 53,152 | |
Adjustment on adoption of IFRS 17 (see notes 1 and 54) | | – | | | (12) | | | (1,923) | | | (1,935) | | | – | | | – | | | (1,935) | |
| At 1 January 2022 | | 25,581 | | | 11,177 | | | 8,318 | | | 45,076 | | | 5,906 | | | 235 | | | 51,217 | |
| Comprehensive income | | | | | | | | | | | | | | |
Profit for the year1 | | – | | | – | | | 3,389 | | | 3,389 | | | 438 | | | 96 | | | 3,923 | |
| Other comprehensive income | | | | | | | | | | | | | | |
| Post-retirement defined benefit scheme remeasurements, net of tax | | – | | | – | | | (2,152) | | | (2,152) | | | – | | | – | | | (2,152) | |
| Movements in revaluation reserve in respect of financial assets held at fair value through other comprehensive income, net of tax: | | | | | | | | | | | | | | |
| Debt securities | | – | | | (157) | | | – | | | (157) | | | – | | | – | | | (157) | |
| Equity shares | | – | | | 47 | | | – | | | 47 | | | – | | | – | | | 47 | |
| Gains and losses attributable to own credit risk, net of tax | | – | | | – | | | 364 | | | 364 | | | – | | | – | | | 364 | |
| Movements in cash flow hedging reserve, net of tax | | – | | | (5,019) | | | – | | | (5,019) | | | – | | | – | | | (5,019) | |
Movements in foreign currency translation reserve, net of tax1 | | – | | | 85 | | | – | | | 85 | | | – | | | – | | | 85 | |
| Total other comprehensive (loss) income | | – | | | (5,044) | | | (1,788) | | | (6,832) | | | – | | | – | | | (6,832) | |
| Total comprehensive (loss) income | | – | | | (5,044) | | | 1,601 | | | (3,443) | | | 438 | | | 96 | | | (2,909) | |
| Transactions with owners | | | | | | | | | | | | | | |
| Dividends (note 46) | | – | | | – | | | (1,475) | | | (1,475) | | | – | | | (92) | | | (1,567) | |
| Distributions on other equity instruments | | – | | | – | | | – | | | – | | | (438) | | | – | | | (438) | |
| Issue of ordinary shares | | 105 | | | – | | | – | | | 105 | | | – | | | – | | | 105 | |
| Share buyback | | (453) | | | 453 | | | (2,013) | | | (2,013) | | | – | | | – | | | (2,013) | |
| | | | | | | | | | | | | | |
| Issue of other equity instruments (note 45) | | – | | | – | | | (5) | | | (5) | | | 750 | | | – | | | 745 | |
| Repurchases and redemptions of other equity instruments (note 45) | | – | | | – | | | (36) | | | (36) | | | (1,359) | | | – | | | (1,395) | |
Movement in treasury shares1 | | – | | | – | | | (60) | | | (60) | | | – | | | – | | | (60) | |
| Value of employee services: | | | | | | | | | | | | | | |
| Share option schemes | | – | | | – | | | 41 | | | 41 | | | – | | | – | | | 41 | |
| Other employee award schemes | | – | | | – | | | 183 | | | 183 | | | – | | | – | | | 183 | |
| Changes in non-controlling interests | | – | | | – | | | (3) | | | (3) | | | – | | | 5 | | | 2 | |
| Total transactions with owners | | (348) | | | 453 | | | (3,368) | | | (3,263) | | | (1,047) | | | (87) | | | (4,397) | |
| Realised gains and losses on equity shares held at fair value through other comprehensive income | | – | | | 1 | | | (1) | | | – | | | – | | | – | | | – | |
At 31 December 2022 | | 25,233 | | | 6,587 | | | 6,550 | | | 38,370 | | | 5,297 | | | 244 | | | 43,911 | |
1 Restated for the adoption of IFRS 17; see notes 1 and 54.
The accompanying notes are an integral part of the consolidated financial statements.
| | | | | | | | |
F-11 | Lloyds Banking Group plc Annual Report on Form 20-F 2023 | |
Consolidated statement of changes in equity continued
for the year ended 31 December
| | | | | | | | | | | | | | | | | | | | | | | | | | | | | | | | | | | | | | | | | | | | |
| | Attributable to ordinary shareholders | | Other
equity
instruments
£m | | Non-
controlling
interests
£m | | Total
£m |
| | Share
capital and
premium
£m | | Other
reserves
£m | | Retained
profits
£m | | Total
£m | | | |
| At 1 January 2021 | | 24,947 | | | 13,747 | | | 4,584 | | | 43,278 | | | 5,906 | | | 229 | | | 49,413 | |
| Comprehensive income | | | | | | | | | | | | | | |
| Profit for the year | | – | | | – | | | 5,355 | | | 5,355 | | | 429 | | | 101 | | | 5,885 | |
| Other comprehensive income | | | | | | | | | | | | | | |
| Post-retirement defined benefit scheme remeasurements, net of tax | | – | | | – | | | 1,062 | | | 1,062 | | | – | | | – | | | 1,062 | |
| Movements in revaluation reserve in respect of financial assets held at fair value through other comprehensive income, net of tax: | | | | | | | | | | | | | | |
| Debt securities | | – | | | 108 | | | – | | | 108 | | | – | | | – | | | 108 | |
| Equity shares | | – | | | 57 | | | – | | | 57 | | | – | | | – | | | 57 | |
| Gains and losses attributable to own credit risk, net of tax | | – | | | – | | | (52) | | | (52) | | | – | | | – | | | (52) | |
| Movements in cash flow hedging reserve, net of tax | | – | | | (2,086) | | | – | | | (2,086) | | | – | | | – | | | (2,086) | |
| Movements in foreign currency translation reserve, net of tax | | – | | | (39) | | | – | | | (39) | | | – | | | – | | | (39) | |
| Total other comprehensive income | | – | | | (1,960) | | | 1,010 | | | (950) | | | – | | | – | | | (950) | |
| Total comprehensive income | | – | | | (1,960) | | | 6,365 | | | 4,405 | | | 429 | | | 101 | | | 4,935 | |
| Transactions with owners | | | | | | | | | | | | | | |
| Dividends (note 46) | | – | | | – | | | (877) | | | (877) | | | – | | | (93) | | | (970) | |
| Distributions on other equity instruments | | – | | | – | | | – | | | – | | | (429) | | | – | | | (429) | |
| Issue of ordinary shares | | 37 | | | – | | | – | | | 37 | | | – | | | – | | | 37 | |
| | | | | | | | | | | | | | |
| Redemption of preference shares | | 597 | | | (597) | | | – | | | – | | | – | | | – | | | – | |
| | | | | | | | | | | | | | |
| | | | | | | | | | | | | | |
| Movement in treasury shares | | – | | | – | | | (13) | | | (13) | | | – | | | – | | | (13) | |
| Value of employee services: | | | | | | | | | | | | | | |
| Share option schemes | | – | | | – | | | 51 | | | 51 | | | – | | | – | | | 51 | |
| Other employee award schemes | | – | | | – | | | 131 | | | 131 | | | – | | | – | | | 131 | |
| Changes in non-controlling interests | | – | | | – | | | (1) | | | (1) | | | – | | | (2) | | | (3) | |
| Total transactions with owners | | 634 | | | (597) | | | (709) | | | (672) | | | (429) | | | (95) | | | (1,196) | |
| Realised gains and losses on equity shares held at fair value through other comprehensive income | | – | | | (1) | | | 1 | | | – | | | – | | | – | | | – | |
| At 31 December 2021 | | 25,581 | | | 11,189 | | | 10,241 | | | 47,011 | | | 5,906 | | | 235 | | | 53,152 | |
The accompanying notes are an integral part of the consolidated financial statements.
| | | | | | | | |
F-12 | Lloyds Banking Group plc Annual Report on Form 20-F 2023 | |
Consolidated cash flow statement
for the year ended 31 December
| | | | | | | | | | | | | | | | | | | | | | | |
| Note | | 2023 £m | | 20221,2 £m | | 20212 £m |
| Cash flows from operating activities | | | | | | | |
| Profit before tax | | | 7,503 | | | 4,782 | | | 6,902 | |
| Adjustments for: | | | | | | | |
| Change in operating assets | 53(A) | | (9,110) | | | 16,735 | | | (10,365) | |
| Change in operating liabilities | 53(B) | | 4,232 | | | 1,481 | | | 12,282 | |
| Non-cash and other items | 53(C) | | 5,622 | | | (244) | | | (1,265) | |
| Net tax paid | | | (1,437) | | | (743) | | | (796) | |
| Net cash provided by operating activities | | | 6,810 | | | 22,011 | | | 6,758 | |
| Cash flows from investing activities | | | | | | | |
| Purchase of financial assets | | | (10,311) | | | (7,984) | | | (8,984) | |
| Proceeds from sale and maturity of financial assets | | | 5,298 | | | 11,172 | | | 8,287 | |
| Purchase of fixed assets | | | (5,455) | | | (3,855) | | | (3,228) | |
| Proceeds from sale of fixed assets | | | 1,027 | | | 1,550 | | | 1,437 | |
| Repayment of capital by joint ventures and associates | | | – | | | 36 | | | – | |
| Acquisition of businesses, net of cash acquired | 53(D) | | (380) | | | (409) | | | (57) | |
| | | | | | | |
| Net cash (used in) provided by investing activities | | | (9,821) | | | 510 | | | (2,545) | |
| Cash flows from financing activities | | | | | | | |
| Dividends paid to ordinary shareholders | 46 | | (1,651) | | | (1,475) | | | (877) | |
| Distributions in respect of other equity instruments | | | (527) | | | (438) | | | (429) | |
| Distributions in respect of non-controlling interests | | | (101) | | | (92) | | | (93) | |
| Interest paid on subordinated liabilities | | | (623) | | | (603) | | | (1,303) | |
| Proceeds from issue of subordinated liabilities | | | 1,417 | | | 838 | | | 499 | |
| Proceeds from issue of other equity instruments | | | 1,772 | | | 745 | | | – | |
| Proceeds from issue of ordinary shares | | | 86 | | | 31 | | | 25 | |
| Share buyback | | | (1,993) | | | (2,013) | | | – | |
| Repayment of subordinated liabilities | | | (1,745) | | | (2,216) | | | (1,056) | |
| Repurchases and redemptions of other equity instruments | | | (135) | | | (1,395) | | | – | |
| Change in stake of non-controlling interests | | | – | | | 5 | | | – | |
| Net cash used in financing activities | | | (3,500) | | | (6,613) | | | (3,234) | |
| Effects of exchange rate changes on cash and cash equivalents | | | (480) | | | 727 | | | 70 | |
| Change in cash and cash equivalents | | | (6,991) | | | 16,635 | | | 1,049 | |
| Cash and cash equivalents at beginning of year | | | 95,829 | | | 79,194 | | | 78,145 | |
| Cash and cash equivalents at end of year | 53(E) | | 88,838 | | | 95,829 | | | 79,194 | |
1 Restated for the adoption of IFRS 17; see notes 1 and 54.
2 Restated for presentational changes; see note 1.
The accompanying notes are an integral part of the consolidated financial statements.
| | | | | | | | |
F-13 | Lloyds Banking Group plc Annual Report on Form 20-F 2023 | |
Notes to the consolidated financial statements
for the year ended 31 December
Note 1: Basis of preparation
The consolidated financial statements of Lloyds Banking Group plc and its subsidiary undertakings (the Group) have been prepared in accordance with International Financial Reporting Standards as issued by the International Accounting Standards Board (IASB).
The financial information has been prepared under the historical cost convention, as modified by the revaluation of investment properties, insurance and reinsurance contract assets and liabilities measured at their fulfilment values in accordance with IFRS 17, financial assets measured at fair value through other comprehensive income, trading securities and certain other financial assets and liabilities at fair value through profit or loss and all derivative contracts. The directors consider that it is appropriate to continue to adopt the going concern basis in preparing the financial statements. In reaching this assessment, the directors have considered the impact of climate change upon the Group’s performance and projected funding and capital position. The directors have also taken into account the results from stress testing scenarios.
Except for accounting policies and methods of computation affected by IFRS 17 and the IAS 12 exception relating to the recognition and disclosure of the implication of certain potential deferred tax consequences, the Group’s accounting policies are consistent with those applied by the Group in its financial statements for the year ended 31 December 2022 and there have been no changes in the Group’s methods of computation. Following amendments to IAS 12 by the IASB (International Tax Reform – Pillar Two Model Rules, issued in May 2023) entities are not permitted to disclose information about deferred tax assets and liabilities related to the Organisation for Economic, Co-operation and Development’s Pillar Two Model Rules, including any qualified domestic minimum top-up taxes. No changes arise to the Group’s deferred tax assets or liabilities as a result of the Group having applied the relevant exception.
Presentational changes
Changes have been made to the presentation of the Group’s income statement and the Group’s balance sheet arising from the adoption of IFRS 17. In addition to the impact of IFRS 17, the following changes have been made to the presentation of the Group’s income statement and balance sheet to provide a more relevant analysis of the Group’s financial performance and financial position:
•Movement in third party interests in consolidated funds are presented separately on the face of the income statement rather than within interest expense. There is no change to the balance sheet presentation of the third party interests
•Items in the course of collection from banks are reported within other assets rather than separately on the face of the balance sheet
•Investments in joint ventures and associates are reported within other assets rather than separately on the face of the balance sheet
•Goodwill and other intangible assets are aggregated on the face of the balance sheet
•Items in the course of transmission to banks are reported within other liabilities rather than separately on the face of the balance sheet
Except for the impact of IFRS 17, there has been no change in the basis of accounting for any of the underlying transactions. Comparatives for 2022 have been restated for the impact of IFRS 17. Comparatives for 2022 and 2021 have been restated for all other changes.
IFRS 17 Insurance Contracts
On 1 January 2023, the Group adopted IFRS 17 Insurance Contracts, which replaced IFRS 4 Insurance Contracts. A summary of the impact is set out below.
IFRS 17 establishes principles for the recognition, measurement, presentation and disclosure of insurance contracts, including reinsurance contracts issued, participating investment contracts and reinsurance contracts held.
The Group’s change in accounting policies arising from the adoption of IFRS 17 has been made in accordance with the transitional provisions of the standard. IFRS 17 requires a full retrospective approach unless it is impracticable to do so. Under the full retrospective approach, transition impacts are calculated as if IFRS 17 had always applied and it prohibits the use of hindsight. This requires having full and granular data on assumptions and cash flows so that, at the point of contract recognition, the IFRS 17 contract value and contractual service margin (CSM) can be calculated and revalued up to the point of transition. If it is impracticable to apply IFRS 17 retrospectively, a choice is permitted between a modified retrospective approach, provided qualifying conditions are met, or a fair value approach. The different approaches can be applied to different groups of insurance contracts.
On transition, the Group used the full retrospective approach for business written since 1 January 2016 using Solvency II modelling tools developed when Solvency II was implemented, which are only available to support the calculation of IFRS 17 results from that date. The full retrospective approach was deemed impracticable for contracts initially recognised prior to 1 January 2016 as the models required to calculate the risk adjustment were not in use within the business prior to this date. The Group opted to use the fair value approach for business initially recognised prior to 2016, and valuations supporting Solvency II at the transition date were used to support the fair value calculation for transition for that business.
Changes have also been made to the Group’s cash flow statement arising from the adoption of IFRS 17. As noted below, IFRS 17 has required several measurement changes to the balance sheet including the derecognition of the value of in-force (VIF) asset, the measurement of contract liabilities on a probability-weighted basis and the creation of a CSM liability. These changes, together with the presentation of the change in insurance contract liabilities within the change in operating liabilities, have resulted in a restatement of the adjustment for changes in both operating assets and liabilities as well as non-cash and other items. Cash and cash equivalents at 31 December 2022 were not impacted by the adoption of IFRS 17.
On transition to IFRS 17, the Group’s total equity at 1 January 2022 was reduced by £1,935 million from £53,152 million under IFRS 4 to £51,217 million under IFRS 17. The reduction in equity is primarily driven by the derecognition of the VIF asset (£5,317 million), the move to a probability-weighted estimate (expected value) of contract liabilities (£5,915 million), the creation of the new CSM liability (£1,927 million, net of reinsurance) and the establishment of the risk adjustment (£1,492 million, net of reinsurance).
| | | | | | | | |
F-14 | Lloyds Banking Group plc Annual Report on Form 20-F 2023 | |
Notes to the consolidated financial statements continued
for the year ended 31 December
Note 1: Basis of preparation continued
The CSM at the transition date is released to the income statement in future periods as insurance contract services are provided. The table below summarises the approach the Group has applied to groups of insurance contracts at the transition date and the resulting CSM.
| | | | | | | | | | | | | | |
| | CSM at transition date |
| Year contracts initially recognised | Transition approach | £m | | % |
| Contracts initially recognised prior to 1 January 2016 | Fair value approach1 | 1,419 | | | 74 | |
| Contracts initially recognised after 1 January 2016 | Full retrospective approach | 508 | | | 26 | |
| | 1,927 | | | 100 | |
1 The fair value element of the CSM was determined as the difference between the fair value of a group of contracts and the fulfilment cash flows at 1 January 2022. Fair value was determined using an economic value creation model which relied on a number of judgements, assumptions and non-observable inputs including: the market participant in the transaction shared the same characteristics as the Group, the best estimate assumptions were aligned to those used by the Group in its 1 January 2022 regulatory calculations and the required capital in the model was based on the capital requirement, plus the additional internal capital buffer, at that date. The model considered the expected profit arising in each future period as the value of the realistic cash flow less the release of required capital. The stream of profits derived was then discounted at a required rate of return. The Group has applied the simplification permitting contracts in different annual cohorts to be grouped together into a single group for measurement purposes.
In addition to the impact of £1,935 million at 1 January 2022, at 31 December 2022, total equity is also impacted by the restatement of the income statement for the year ended 31 December 2022, resulting in a further reduction of £1,632 million in retained profits. This arose from the impact of revised income recognition requirements, changes in interest rates during 2022 and the effect of contract modifications. There is a further reduction in total equity of £43 million in respect of the foreign currency translation reserve and the reclassification of treasury shares on transition to IFRS 17. Total equity at 31 December 2022 reduced by £3,610 million, from £47,521 million under IFRS 4 to £43,911 million under IFRS 17.
Whilst IFRS 17 does not change the total profit recognised over the life of an insurance contract or participating investment contract, it does change both the phasing of profit recognition and the amounts recognised within individual income statement line items, including other income and operating expenses. Under IFRS 17, the Group is required to defer substantially all of the expected profit through the recognition of a CSM on the balance sheet; the CSM is subsequently released to the income statement over the coverage period of the product. The expected profit includes estimated future premiums and claims together with expected administration costs such as claims handling costs, costs incurred to provide contractual policyholder benefits and policy administration and maintenance costs.
The impact of IFRS 17 on the Group’s results for the year ended 31 December 2022 was to reduce profit before tax by £2,146 million and reduce profit after tax by £1,632 million compared to results reported under IFRS 4.
Future accounting developments
The IASB has issued a number of minor amendments to IFRSs effective 1 January 2024, including IFRS 16 Lease Liability in a Sale and Leaseback, IAS 1 Non-current Liabilities with Covenants, and IAS 1 Classification of Liabilities as Current or Non-current. These amendments are not expected to have a significant impact on the Group.
Note 2: Accounting policies
The Group’s accounting policies are set out below. These accounting policies have been applied consistently.
(A) Consolidation
The assets, liabilities and results of Group undertakings (including structured entities) are included in the financial statements on the basis of accounts made up to the reporting date. Group undertakings include subsidiaries, associates and joint ventures.
(1) Subsidiaries
Subsidiaries are entities controlled by the Group. The Group controls an entity when it has power over the entity, is exposed to, or has rights to, variable returns from its involvement with the entity, and has the ability to affect those returns through the exercise of its power. This generally accompanies a shareholding of more than one half of the voting rights although in certain circumstances a holding of less than one half of the voting rights may still result in the ability of the Group to exercise control. The existence and effect of potential voting rights that are currently exercisable or convertible are considered when assessing whether the Group controls another entity. The Group reassesses whether or not it controls an entity if facts and circumstances indicate that there have been changes to any of the above elements. Subsidiaries are fully consolidated from the date on which control is transferred to the Group; they are de-consolidated from the date that control ceases.
The Group consolidates collective investment vehicles if its beneficial ownership interests give it substantive rights to remove the external fund manager of the investment activities of the fund. Where a subsidiary of the Group is the fund manager of a collective investment vehicle, the Group considers a number of factors in determining whether it acts as principal, and therefore controls the collective investment vehicle, including: an assessment of the scope of the Group’s decision making authority over the investment vehicle; the rights held by other parties including substantive removal rights without cause over the Group acting as fund manager; the remuneration to which the Group is entitled in its capacity as decision-maker; and the Group’s exposure to variable returns from the beneficial interest that it holds in the investment vehicle. Consolidation may be appropriate in circumstances where the Group has less than a majority beneficial interest. Where a collective investment vehicle is consolidated the interests of parties other than the Group are reported in other liabilities and the movement in those interests in movement in third party interests in consolidated funds.
Structured entities are entities that are designed so that their activities are not governed by way of voting rights. In assessing whether the Group has power over such entities in which it has an interest, the Group considers factors such as the purpose and design of the entity; its practical ability to direct the relevant activities of the entity; the nature of the relationship with the entity; and the size of its exposure to the variability of returns of the entity.
| | | | | | | | |
F-15 | Lloyds Banking Group plc Annual Report on Form 20-F 2023 | |
Notes to the consolidated financial statements continued
for the year ended 31 December
Note 2: Accounting policies continued
The treatment of transactions with non-controlling interests depends on whether, as a result of the transaction, the Group loses control of the subsidiary. Changes in the parent’s ownership interest in a subsidiary that do not result in a loss of control are accounted for as equity transactions; any difference between the amount by which the non-controlling interests are adjusted and the fair value of the consideration paid or received is recognised directly in equity and attributed to the owners of the parent entity. Where the Group loses control of the subsidiary, at the date when control is lost the amount of any non-controlling interest in that former subsidiary is derecognised and any investment retained in the former subsidiary is remeasured to its fair value; the gain or loss that is recognised in profit or loss on the partial disposal of the subsidiary includes the gain or loss on the remeasurement of the retained interest.
Intercompany transactions, balances and unrealised gains and losses on transactions between Group companies are eliminated.
The acquisition method of accounting is used to account for business combinations by the Group. The consideration for the acquisition of a subsidiary is the fair value of the assets transferred, the liabilities incurred and the equity interests issued by the Group. The consideration includes the fair value of any asset or liability resulting from a contingent consideration arrangement. Acquisition-related costs are expensed as incurred except those relating to the issuance of debt instruments (see (E)(4) below) or share capital (see (Q) below). Identifiable assets acquired and liabilities assumed in a business combination are measured initially at their fair value at the acquisition date.
(2) Joint ventures and associates
Joint ventures are joint arrangements over which the Group has joint control with other parties and has rights to the net assets of the arrangements. Joint control is the contractually agreed sharing of control of an arrangement and only exists when decisions about the relevant activities require the unanimous consent of the parties sharing control. Associates are entities over which the Group has significant influence. Significant influence is the power to participate in the financial and operating policy decisions of the entity, but is not control or joint control of those policies, and is generally achieved through holding between 20 per cent and 50 per cent of the voting share capital of the entity.
The Group utilises the venture capital exemption for investments where significant influence or joint control is present and the business unit operates as a venture capital business. These investments are designated on initial recognition at fair value through profit or loss. Otherwise, the Group’s investments in joint ventures and associates are accounted for using the equity method of accounting.
(B) Goodwill
Goodwill arises on business combinations and represents the excess of the cost of an acquisition over the fair value of the Group’s share of the identifiable assets, liabilities and contingent liabilities acquired. Where the fair value of the Group’s share of the identifiable assets, liabilities and contingent liabilities of the acquired entity is greater than the cost of acquisition, the excess is recognised immediately in the income statement.
Goodwill is recognised as an asset at cost and is tested at least annually for impairment. For impairment testing, goodwill is allocated to the cash-generating unit (CGU) or groups of CGUs that are expected to benefit from the business combination. The Group’s CGUs are largely product based for its Retail and Insurance businesses and client based for its Commercial Banking business. An impairment loss is recognised if the carrying amount of a CGU is determined to be greater than its recoverable amount. The recoverable amount of a CGU is the higher of its fair value less costs to sell and its value in use. If an impairment is identified the carrying value of the goodwill is written down immediately through the income statement and this is not subsequently reversed. At the date of disposal of a subsidiary, the carrying value of attributable goodwill is included in the calculation of the profit or loss on disposal.
(C) Other intangible assets
Intangible assets which have been determined to have a finite useful life are amortised on a straight-line basis over their estimated useful life as follows: up to seven years for capitalised software; 10 to 15 years for brands and other intangible assets.
Intangible assets with finite useful lives are reviewed at each reporting date to assess whether there is any indication that they are impaired. If any such indication exists the recoverable amount of the asset is determined and in the event that the asset’s carrying amount is greater than its recoverable amount, it is written down immediately. Certain brands have been determined to have an indefinite useful life and are not amortised. Such intangible assets are assessed annually to determine whether the asset is impaired and to reconfirm that an indefinite useful life remains appropriate. In the event that an indefinite life is inappropriate, a finite life is determined and a further impairment review is performed on the asset.
(D) Revenue recognition
(1) Net interest income
Interest income and expense are recognised in the income statement using the effective interest method for all interest-bearing financial instruments, except for those classified at fair value through profit or loss. The effective interest method is a method of calculating the amortised cost of a financial asset or liability and of allocating the interest income or interest expense over the expected life of the financial instrument. The effective interest rate is the rate that exactly discounts the estimated future cash payments or receipts over the expected life of the financial instrument to the gross carrying amount of the financial asset (before adjusting for expected credit losses) or to the amortised cost of the financial liability, including early redemption fees, other fees, and premiums and discounts that are an integral part of the overall return. In the case of financial assets that are purchased or originated credit-impaired, the effective interest rate is the rate that discounts the estimated future cash flows to the amortised cost of the instrument. Direct incremental transaction costs related to the acquisition, issue or disposal of a financial instrument are also taken into account. Interest income from non-credit-impaired financial assets is recognised by applying the effective interest rate to the gross carrying amount of the asset; for credit-impaired financial assets, the effective interest rate is applied to the net carrying amount after deducting the allowance for expected credit losses. Impairment policies are set out in (H) below.
(2) Fee and commission income and expense
Fees and commissions receivable which are not an integral part of the effective interest rate are recognised as income as the Group fulfils its performance obligations. The Group’s principal performance obligations arising from contracts with customers are in respect of value added current accounts, credit cards and debit cards. These fees are received, and the Group provides the service, monthly; the fees are recognised in income on this basis. The Group also receives certain fees in respect of its asset finance business where the performance obligations are typically fulfilled towards the end of the customer contract; these fees are recognised in income on this basis. Where it is unlikely that the loan commitments will be drawn, loan commitment fees are recognised in fee and commission income over the life of the facility, rather than as an adjustment to the effective interest rate for the lending expected to be drawn. Incremental costs incurred to generate fee and commission income are charged to fee and commission expense as they are incurred.
| | | | | | | | |
F-16 | Lloyds Banking Group plc Annual Report on Form 20-F 2023 | |
Notes to the consolidated financial statements continued
for the year ended 31 December
Note 2: Accounting policies continued
(3) Other
Dividend income is recognised when the right to receive payment is established.
Revenue recognition policies specific to trading income are set out in (E)(3) below; those relating to life insurance and general insurance business are detailed below (see (M) and (N) below); and those relating to leases are set out in (J)(1) below.
(E) Financial assets and liabilities
On initial recognition, financial assets are classified as measured at amortised cost, fair value through other comprehensive income or fair value through profit or loss, depending on the Group’s business model for managing those financial assets and whether the resultant cash flows represent solely payments of principal and interest. The Group assesses its business models at a portfolio level based on its objectives for the relevant portfolio, how the performance of the portfolio is managed and reported, and the frequency of asset sales. Financial assets with embedded derivatives are considered in their entirety when considering their cash flow characteristics. The Group reclassifies financial assets only when its business model for managing those assets changes. A reclassification will only take place when the change is significant to the Group’s operations and will occur at a portfolio level and not for individual instruments; reclassifications are expected to be rare. Equity investments are measured at fair value through profit or loss unless the Group elects at initial recognition to account for the instruments at fair value through other comprehensive income. For these instruments, principally strategic investments, dividends are recognised in profit or loss but fair value gains and losses are not subsequently reclassified to profit or loss following derecognition of the investment.
The Group initially recognises loans and advances, deposits, debt securities in issue and subordinated liabilities when the Group becomes a party to the contractual provisions of the instrument. Regular way purchases and sales of securities and other financial assets and trading liabilities are recognised on trade date, being the date that the Group is committed to purchase or sell an asset.
Financial assets are derecognised when the contractual right to receive cash flows from those assets has expired or when the Group has transferred its contractual right to receive the cash flows from the assets and either: substantially all of the risks and rewards of ownership have been transferred; or the Group has neither retained nor transferred substantially all of the risks and rewards, but has transferred control.
Financial liabilities are derecognised when the obligation is discharged, cancelled or expires.
(1) Financial instruments measured at amortised cost
Financial assets that are held to collect contractual cash flows where those cash flows represent solely payments of principal and interest are measured at amortised cost. A basic lending arrangement results in contractual cash flows that are solely payments of principal and interest on the principal amount outstanding. Where the contractual cash flows introduce exposure to risks or volatility unrelated to a basic lending arrangement such as changes in equity prices or commodity prices, the payments do not comprise solely principal and interest. Financial assets measured at amortised cost are predominantly loans and advances to customers and banks, reverse repurchase agreements and certain debt securities used by the Group to manage its liquidity. Loans and advances and reverse repurchase agreements are initially recognised when cash is advanced to the borrower at fair value inclusive of transaction costs. Interest income is accounted for using the effective interest method (see (D) above).
Financial liabilities are measured at amortised cost, except for trading liabilities and other financial liabilities designated at fair value through profit or loss on initial recognition which are held at fair value.
Where changes are made to the contractual cash flows of a financial asset or financial liability that are economically equivalent and arise as a direct consequence of interest rate benchmark reform, the Group updates the effective interest rate and does not recognise an immediate gain or loss.
(2) Financial assets measured at fair value through other comprehensive income
Financial assets that are held to collect contractual cash flows and for subsequent sale, where the assets’ cash flows represent solely payments of principal and interest, are recognised in the balance sheet at their fair value, inclusive of transaction costs. Interest calculated using the effective interest method and foreign exchange gains and losses on assets denominated in foreign currencies are recognised in the income statement. All other gains and losses arising from changes in fair value are recognised directly in other comprehensive income, until the financial asset is either sold or matures, at which time, other than in respect of equity shares, the cumulative gain or loss previously recognised in other comprehensive income is recognised in the income statement. The cumulative revaluation amount in respect of equity shares is transferred directly to retained profits. The Group recognises a charge for expected credit losses in the income statement (see (H) below). As the asset is measured at fair value, the charge does not adjust the carrying value of the asset, and this is reflected in other comprehensive income.
(3) Financial instruments measured at fair value through profit or loss
Financial assets are classified at fair value through profit or loss where they do not meet the criteria to be measured at amortised cost or fair value through other comprehensive income or where they are designated at fair value through profit or loss to reduce an accounting mismatch. All derivatives are carried at fair value through profit or loss, other than those in effective cash flow and net investment hedging relationships. Derivatives are carried on the balance sheet as assets when their fair value is positive and as liabilities when their fair value is negative. Refer to note 21(2) (Financial instruments: Financial assets and liabilities carried at fair value) for details of valuation techniques and significant inputs to valuation models.
Derivatives embedded in a financial asset are not considered separately; the financial asset is considered in its entirety when determining whether its cash flows are solely payments of principal and interest. Derivatives embedded in financial liabilities and insurance contracts (unless the embedded derivative is itself an insurance contract) are treated as separate derivatives when their economic characteristics and risks are not closely related to those of the host contract and the host contract is not carried at fair value through profit or loss. These embedded derivatives are measured at fair value with changes in fair value recognised in the income statement.
The assets backing the insurance and investment contracts issued by the Group do not meet the criteria to be measured at amortised cost or fair value through other comprehensive income as they are managed on a fair value basis and accordingly are measured at fair value through profit or loss. Similarly, trading securities, which are debt securities and equity shares acquired principally for the purpose of selling in the short term or which are part of a portfolio which is managed for short-term gains, do not meet these criteria and are also measured at fair value through profit or loss. Financial assets measured at fair value through profit or loss are recognised in the balance sheet at their fair value. Fair value gains and losses together with interest coupons and dividend income are recognised in the income statement within net trading income.
| | | | | | | | |
F-17 | Lloyds Banking Group plc Annual Report on Form 20-F 2023 | |
Notes to the consolidated financial statements continued
for the year ended 31 December
Note 2: Accounting policies continued
Financial liabilities are measured at fair value through profit or loss where they are trading liabilities or where they are designated at fair value through profit or loss in order to reduce an accounting mismatch; where the liabilities are part of a group of liabilities (or assets and liabilities) which is managed, and its performance evaluated, on a fair value basis; or where the liabilities contain one or more embedded derivatives that significantly modify the cash flows arising under the contract and would otherwise need to be separately accounted for. Financial liabilities measured at fair value through profit or loss are recognised in the balance sheet at their fair value. Fair value gains and losses are recognised in the income statement within net trading income in the period in which they occur, except in the case of financial liabilities designated at fair value through profit or loss where gains and losses attributable to changes in own credit risk are recognised in other comprehensive income.
The fair values of assets and liabilities traded in active markets are based on current bid and offer prices, respectively, which include the expected effects of potential changes to laws and regulations, risks associated with climate change and other factors. If the market is not active the Group establishes a fair value by using valuation techniques. The fair values of derivative financial instruments are adjusted where appropriate to reflect credit risk (via credit valuation adjustments (CVAs), debit valuation adjustments (DVAs) and funding valuation adjustments (FVAs)), market liquidity and other risks.
(4) Borrowings
Borrowings (which include deposits from banks, customer deposits, repurchase agreements, debt securities in issue and subordinated liabilities) are recognised initially at fair value, being their issue proceeds net of transaction costs incurred. These instruments are subsequently stated at amortised cost using the effective interest method.
Preference shares and other instruments which carry a mandatory coupon or are redeemable on a specific date are classified as financial liabilities. The coupon on these instruments is recognised in the income statement as interest expense. Securities which carry a discretionary coupon and have no fixed maturity or redemption date are classified as other equity instruments. Interest payments on these securities are recognised as distributions from equity in the period in which they are paid. An exchange of financial liabilities on substantially different terms is accounted for as an extinguishment of the original financial liability and the recognition of a new financial liability. The difference between the carrying amount of a financial liability extinguished and the new financial liability is recognised in profit or loss together with any related costs or fees incurred.
When a financial liability is exchanged for an equity instrument, the new equity instrument is recognised at fair value and any difference between the carrying value of the liability and the fair value of the new equity instrument is recognised in profit or loss.
(5) Sale and repurchase agreements (including securities lending and borrowing)
Securities sold subject to repurchase agreements (repos) continue to be recognised on the balance sheet where substantially all of the risks and rewards are retained. Funds received for repos carried at fair value are included within trading liabilities. Conversely, securities purchased under agreements to resell (reverse repos), where the Group does not acquire substantially all of the risks and rewards of ownership, are measured at amortised cost or at fair value. Those measured at fair value are recognised within trading securities. The difference between sale and repurchase price is treated as interest and accrued over the life of the agreements using the effective interest method.
Securities borrowing and lending transactions are typically secured; collateral takes the form of securities or cash advanced or received. Securities lent to counterparties are retained on the balance sheet. Securities borrowed are not recognised on the balance sheet, unless these are sold to third parties, in which case the obligation to return them is recorded at fair value as a trading liability. Cash collateral given or received is treated as a loan and advance measured at amortised cost or customer deposit.
(F) Hedge accounting
As permitted by IFRS 9, the Group continues to apply the requirements of IAS 39 to its hedging relationships.
Changes in the fair value of all derivative instruments, other than those in effective cash flow and net investment hedging relationships, are recognised immediately in the income statement. As noted in (2) and (3) below, the change in fair value of a derivative in an effective cash flow or net investment hedging relationship is allocated between the income statement and other comprehensive income.
Hedge accounting allows one financial instrument, generally a derivative such as a swap, to be designated as a hedge of another financial instrument such as a loan or deposit or a portfolio of such instruments. At the inception of the hedge relationship, formal documentation is drawn up specifying the hedging strategy, the hedged item, the hedging instrument and the methodology that will be used to measure the effectiveness of the hedge relationship in offsetting changes in the fair value or cash flow of the hedged risk. The effectiveness of the hedging relationship is tested both at inception and throughout its life and if at any point it is concluded that it is no longer highly effective in achieving its documented objective, hedge accounting is discontinued. Note 22 provides details of the types of derivatives held by the Group and presents separately those designated in hedge relationships.
Where there is uncertainty arising from interest rate benchmark reform, the Group assumes that the interest rate benchmark on which the hedged cash flows and/or the hedged risk are based, or the interest rate benchmark on which the cash flows of the hedging instrument are based, are not altered as a result of interest rate benchmark reform. The Group does not discontinue a hedging relationship during the period of uncertainty arising from the interest rate benchmark reform solely because the actual results of the hedge are not highly effective.
Where the contractual terms of a financial asset, financial liability or derivative are amended, on an economically equivalent basis, as a direct consequence of interest rate benchmark reform, the uncertainty arising from the reform is no longer present. In these circumstances, the Group amends the hedge documentation to reflect the changes required by the reform; these changes to the documentation do not in and of themselves result in the discontinuation of hedge accounting or require the designation of a new hedge relationship.
(1) Fair value hedges
Changes in the fair value of derivatives that are designated and qualify as fair value hedges are recorded in the income statement, together with the changes in the fair value of the hedged asset or liability that are attributable to the hedged risk; this also applies if the hedged asset is classified as a financial asset at fair value through other comprehensive income. If the hedge no longer meets the criteria for hedge accounting, changes in the fair value of the hedged item attributable to the hedged risk are no longer recognised in the income statement. The cumulative adjustment that has been made to the carrying amount of the hedged item is amortised to the income statement using the effective interest method over the period to maturity.
| | | | | | | | |
F-18 | Lloyds Banking Group plc Annual Report on Form 20-F 2023 | |
Notes to the consolidated financial statements continued
for the year ended 31 December
Note 2: Accounting policies continued
(2) Cash flow hedges
The effective portion of changes in the fair value of derivatives that are designated and qualify as cash flow hedges is recognised in other comprehensive income in the cash flow hedging reserve. The gain or loss relating to the ineffective portion is recognised immediately in the income statement. Amounts accumulated in equity are reclassified to the income statement in the periods in which the hedged item affects profit or loss. When a hedging instrument expires or is sold, or when a hedge no longer meets the criteria for hedge accounting, any cumulative gain or loss existing in equity at that time remains in equity and is recognised in the income statement when the forecast transaction is ultimately recognised in the income statement. When a forecast transaction is no longer expected to occur, the cumulative gain or loss that was reported in equity is immediately transferred to the income statement.
(3) Net investment hedges
Hedges of net investments in foreign operations are accounted for similarly to cash flow hedges. Any gain or loss on the hedging instrument relating to the effective portion of the hedge is recognised in other comprehensive income, and the gain or loss relating to the ineffective portion is recognised immediately in the income statement. Gains and losses accumulated in equity are included in the income statement when the foreign operation is disposed of. The hedging instruments used in net investment hedges may include non-derivative liabilities as well as derivative financial instruments.
(G) Offset
Financial assets and liabilities are offset and the net amount reported in the balance sheet when there is a legally enforceable right of offset and there is an intention to settle on a net basis, or realise the asset and settle the liability simultaneously. Cash collateral on exchange traded derivative transactions is presented gross unless the collateral cash flows are always settled net with the derivative cash flows. In certain situations, even though master netting agreements exist, the lack of management intention to settle on a net basis results in the financial assets and liabilities being reported gross on the balance sheet.
(H) Impairment of financial assets
The impairment charge in the income statement reflects the change in expected credit losses, including those arising from fraud. Expected credit losses are recognised for loans and advances to customers and banks, other financial assets held at amortised cost, financial assets (other than equity investments) measured at fair value through other comprehensive income, and certain loan commitments and financial guarantee contracts. Expected credit losses are calculated as an unbiased and probability-weighted estimate using an appropriate probability of default, adjusted to take into account a range of possible future economic scenarios, and applying this to the estimated exposure of the Group at the point of default after taking into account the value of any collateral held, repayments, or other mitigants of loss and including the impact of discounting using the effective interest rate.
At initial recognition, allowance (or provision in the case of some loan commitments and financial guarantees) is made for expected credit losses resulting from default events that are possible within the next 12 months (12-month expected credit losses). In the event of a significant increase in credit risk since origination, allowance (or provision) is made for expected credit losses resulting from all possible default events over the expected life of the financial instrument (lifetime expected credit losses). Financial assets where 12-month expected credit losses are recognised are considered to be Stage 1; financial assets which are considered to have experienced a significant increase in credit risk since initial recognition are in Stage 2; and financial assets which have defaulted or are otherwise considered to be credit-impaired are allocated to Stage 3. Some Stage 3 assets, mainly in Commercial Banking, are subject to individual rather than collective assessment. Such cases are subject to a risk-based impairment sanctioning process, and these are reviewed and updated at least quarterly, or more frequently if there is a significant change in the credit profile. The collective assessment of impairment aggregates financial instruments with similar risk characteristics, such as whether the facility is revolving in nature or secured and the type of security held against financial assets.
An assessment of whether credit risk has increased significantly since initial recognition considers the change in the risk of default occurring over the remaining expected life of the financial instrument. In determining whether there has been a significant increase in credit risk, the Group uses quantitative tests based on relative and absolute probability of default (PD) movements linked to internal credit ratings together with qualitative indicators such as watchlists and other indicators of historical delinquency, credit weakness or financial difficulty. The use of internal credit ratings and qualitative indicators ensures alignment between the assessment of staging and the Group’s management of credit risk which utilises these internal metrics within distinct retail and commercial portfolio risk management practices. However, unless identified at an earlier stage, the credit risk of financial assets is deemed to have increased significantly when more than 30 days past due. The use of a payment holiday in and of itself has not been judged to indicate a significant increase in credit risk, with the underlying long-term credit risk deemed to be driven by economic conditions and captured through the use of forward-looking models. These portfolio-level models are capturing the anticipated volume of increased defaults and therefore an appropriate assessment of staging and expected credit loss. Where the credit risk subsequently improves such that it no longer represents a significant increase in credit risk since initial recognition, the asset is transferred back to Stage 1.
Assets are transferred to Stage 3 when they have defaulted or are otherwise considered to be credit-impaired. Default is considered to have occurred when there is evidence that the customer is experiencing financial difficulty which is likely to affect significantly the ability to repay the amount due. IFRS 9 contains a rebuttable presumption that default occurs no later than when a payment is 90 days past due which the Group now uses for all its products following changes to the definition of default for UK mortgages on 1 January 2022. In addition, other indicators of mortgage default are added including end-of-term payments on past due interest-only accounts and loans considered non-performing due to recent arrears or forbearance. The use of payment holidays is not considered to be an automatic trigger of regulatory default and therefore does not automatically trigger Stage 3. Days past due will also not accumulate on any accounts that have taken a payment holiday including those already past due.
In certain circumstances, the Group will renegotiate the original terms of a customer’s loan, either as part of an ongoing customer relationship or in response to adverse changes in the circumstances of the borrower. In the latter circumstances, the loan will remain classified as either Stage 2 or Stage 3 until the credit risk has improved such that it no longer represents a significant increase since origination (for a return to Stage 1), or the loan is no longer credit-impaired (for a return to Stage 2). On renegotiation the gross carrying amount of the loan is recalculated as the present value of the renegotiated or modified contractual cash flows, which are discounted at the original effective interest rate. Renegotiation may also lead to the loan and associated allowance being derecognised and a new loan being recognised initially at fair value.
Purchased or originated credit-impaired financial assets (POCI) include financial assets that are purchased or originated at a deep discount that reflects incurred credit losses. At initial recognition, POCI assets do not carry an impairment allowance; instead, lifetime expected credit losses are incorporated into the calculation of the effective interest rate. All changes in lifetime expected credit losses subsequent to the assets’ initial recognition are recognised as an impairment charge.
| | | | | | | | |
F-19 | Lloyds Banking Group plc Annual Report on Form 20-F 2023 | |
Notes to the consolidated financial statements continued
for the year ended 31 December
Note 2: Accounting policies continued
A loan or advance is normally written off, either partially or in full, against the related allowance when the proceeds from realising any available security have been received or there is no realistic prospect of recovery and the amount of the loss has been determined. Subsequent recoveries of amounts previously written off decrease the amount of impairment losses recorded in the income statement. For both secured and unsecured retail balances, the write-off takes place only once an extensive set of collections processes has been completed, or the status of the account reaches a point where policy dictates that continuing attempts to recover are no longer appropriate. For commercial lending, a write-off occurs if the loan facility with the customer is restructured, the asset is under administration and the only monies that can be received are the amounts estimated by the administrator, the underlying assets are disposed and a decision is made that no further settlement monies will be received, or external evidence (for example, third party valuations) is available that there has been an irreversible decline in expected cash flows.
(I) Property, plant and equipment
Property, plant and equipment (other than investment property) is included at cost less accumulated depreciation. The value of land (included in premises) is not depreciated. Depreciation on other assets is calculated using the straight-line method to allocate the difference between the cost and the residual value over their estimated useful lives, as follows: the shorter of 50 years and the remaining period of the lease for freehold/long and short leasehold premises; the shorter of 10 years and, if lease renewal is not likely, the remaining period of the lease for leasehold improvements; 10 to 20 years for fixtures and furnishings; and 2 to 8 years for other equipment and motor vehicles.
The assets’ residual values and useful lives are reviewed and, if appropriate, revised at each balance sheet date.
Assets are reviewed for impairment whenever events or changes in circumstances indicate that the carrying amount may not be recoverable. In assessing the recoverable amount of assets the Group considers the effects of potential or actual changes in legislation, customer behaviour, climate-related risks and other factors on the asset’s CGU. In the event that an asset’s CGU carrying amount is determined to be greater than its recoverable amount the asset is written down immediately.
Investment property comprises freehold and long leasehold land and buildings that are held either to earn rental income or for capital accretion or both, primarily within the life insurance funds. In accordance with the guidance published by the Royal Institution of Chartered Surveyors, investment property is carried at fair value based on current prices for similar properties, adjusted for the specific characteristics of the property (such as location or condition). If this information is not available, the Group uses alternative valuation methods such as discounted cash flow projections or recent prices in less active markets. These valuations are reviewed at least annually by independent professionally qualified valuers. Investment property being redeveloped for continuing use as investment property, or for which the market has become less active, continues to be valued at fair value.
(J) Leases
Under IFRS 16, a lessor is required to determine whether a lease is a finance or operating lease. A lessee is not required to make this determination.
(1) As lessor
Assets leased to customers are classified as finance leases if the lease agreements transfer substantially all of the risks and rewards of ownership to the lessee but not necessarily legal title. All other leases are classified as operating leases. When assets are subject to finance leases, the present value of the lease payments, together with any unguaranteed residual value, is recognised as a receivable, net of allowances for expected credit losses and residual value impairment, within loans and advances to banks and customers. The difference between the gross receivable and the present value of the receivable is recognised as unearned finance lease income. Finance lease income is recognised in interest income over the term of the lease using the net investment method (before tax) so as to give a constant rate of return on the net investment in the lease. Unguaranteed residual values are reviewed regularly to identify any impairment.
Operating lease assets are included within other assets at cost and depreciated over their estimated useful lives. The depreciation charge is based on the asset’s residual value and the life of the lease. Operating lease rental income is recognised on a straight-line basis over the life of the lease.
The Group evaluates non-lease arrangements such as outsourcing and similar contracts to determine if they contain a lease which is then accounted for separately.
(2) As lessee
Leases are recognised as a right-of-use asset and a corresponding liability at the date at which the leased asset is available for use by the Group. Assets and liabilities arising from a lease are initially measured on a present value basis. The lease payments are discounted using the interest rate implicit in the lease, if that rate can be determined, or the Group’s incremental borrowing rate appropriate for the right-of-use asset arising from the lease, and the liability recognised within other liabilities.
Lease payments are allocated between the liability and finance cost. The finance cost is charged to profit or loss over the lease period so as to produce a constant periodic rate of interest on the remaining balance of the liability for each period. The right-of-use asset is depreciated over the shorter of the asset’s useful life and the lease term on a straight-line basis.
Payments associated with short-term leases and leases of low-value assets are recognised on a straight-line basis as an expense in profit or loss. Short-term leases are leases with a lease term of 12 months or less. Low-value assets comprise IT equipment and small items of office furniture.
(K) Employee benefits
Short-term employee benefits, such as salaries, paid absences, performance-based cash awards and social security costs, are recognised over the period in which the employees provide the related services.
(1) Pension schemes
The Group operates a number of post-retirement benefit schemes for its employees including both defined benefit and defined contribution pension plans. A defined benefit scheme is a pension plan that defines an amount of pension benefit that an employee will receive on retirement, dependent on one or more factors such as age, years of pensionable service and pensionable salary. A defined contribution plan is a pension plan into which the Group pays fixed contributions; there is no legal or constructive obligation to pay further contributions.
| | | | | | | | |
F-20 | Lloyds Banking Group plc Annual Report on Form 20-F 2023 | |
Notes to the consolidated financial statements continued
for the year ended 31 December
Note 2: Accounting policies continued
(i) Defined benefit schemes
Scheme assets are included at their fair value and scheme liabilities are measured on an actuarial basis using the projected unit credit method. The defined benefit scheme liabilities are discounted using rates equivalent to the market yields at the balance sheet date on high quality corporate bonds that are denominated in the currency in which the benefits will be paid, and that have terms to maturity approximating to the terms of the related pension liability. The Group’s income statement charge includes the current service cost of providing pension benefits, past service costs, net interest expense (income), and plan administration costs that are not deducted from the return on plan assets. Past service costs, which represents the change in the present value of the defined benefit obligation resulting from a plan amendment or curtailment, are recognised when the plan amendment or curtailment occurs. Net interest expense (income) is calculated by applying the discount rate at the beginning of the period to the net defined benefit liability or asset.
Remeasurements, comprising actuarial gains and losses, the return on plan assets (excluding amounts included in net interest expense (income) and net of the cost of managing the plan assets), and the effect of changes to the asset ceiling (if applicable) are reflected immediately in the balance sheet with a charge or credit recognised in other comprehensive income in the period in which they occur. Remeasurements recognised in other comprehensive income are reflected immediately in retained profits and will not subsequently be reclassified to profit or loss.
The Group’s balance sheet includes the net surplus or deficit, being the difference between the fair value of scheme assets and the discounted value of scheme liabilities at the balance sheet date. Surpluses are only recognised to the extent that they are recoverable through reduced contributions in the future or through refunds from the schemes. In assessing whether a surplus is recoverable, the Group considers (i) its current right to obtain a refund or a reduction in future contributions and (ii) the rights of other parties existing at the balance sheet date. In determining the rights of third parties existing at the balance sheet date, the Group does not anticipate any future acts by other parties.
(ii) Defined contribution schemes
The costs of the Group’s defined contribution plans are charged to the income statement in the period in which they fall due.
(2) Share-based compensation
The Group operates a number of equity-settled, share-based compensation plans in respect of services received from certain of its employees. The value of the employee services received in exchange for equity instruments granted under these plans is recognised as an expense over the vesting period of the instruments, with a corresponding increase in equity. This expense is determined by reference to the fair value of the number of equity instruments that are expected to vest. The fair value of equity instruments granted is based on market prices, if available, at the date of grant. In the absence of market prices, the fair value of the instruments at the date of grant is estimated using an appropriate valuation technique, such as a Black-Scholes option pricing model or a Monte Carlo simulation. The determination of fair values excludes the impact of any non-market vesting conditions, which are included in the assumptions used to estimate the number of options that are expected to vest. At each balance sheet date, this estimate is reassessed and if necessary revised. Any revision of the original estimate is recognised in the income statement, together with a corresponding adjustment to equity. Cancellations by employees of contributions to the Group’s Save As You Earn plans are treated as non-vesting conditions and the Group recognises, in the year of cancellation, the amount of the expense that would have otherwise been recognised over the remainder of the vesting period. Modifications are assessed at the date of modification and any incremental charges are charged to the income statement.
(L) Taxation
Tax expense comprises current and deferred tax. Current and deferred tax are charged or credited in the income statement except to the extent that the tax arises from a transaction or event which is recognised, in the same or a different period, outside the income statement (either in other comprehensive income, directly in equity, or through a business combination), in which case the tax appears in the same statement as the transaction that gave rise to it. The tax consequences of the Group’s dividend payments (including distributions on other equity instruments), if any, are charged or credited to the statement in which the profit distributed originally arose.
Current tax is the amount of corporate income taxes expected to be payable or recoverable based on the profit for the period as adjusted for items that are not taxable or not deductible, and is calculated using tax rates and laws that were enacted or substantively enacted at the balance sheet date.
Current tax includes amounts provided in respect of uncertain tax positions when management expects that, upon examination of the uncertainty by His Majesty’s Revenue and Customs (HMRC) or other relevant tax authority, it is more likely than not that an economic outflow will occur. Provisions reflect management’s best estimate of the ultimate liability based on their interpretation of tax law, precedent and guidance, informed by external tax advice as necessary. Changes in facts and circumstances underlying these provisions are reassessed at each balance sheet date, and the provisions are remeasured as required to reflect current information.
For the Group’s long-term insurance businesses, the tax expense is analysed between tax that is payable in respect of policyholders’ returns and tax that is payable on the shareholders’ returns. This allocation is based on an assessment of the rates of tax which will be applied to the returns under the current UK tax rules.
Deferred tax is recognised on temporary differences arising between the tax bases of assets and liabilities and their carrying amounts in the balance sheet. Deferred tax is calculated using tax rates and laws that have been enacted or substantively enacted at the balance sheet date, and which are expected to apply when the related deferred tax asset is realised or the deferred tax liability is settled.
Deferred tax liabilities are generally recognised for all taxable temporary differences but not recognised for taxable temporary differences arising on investments in subsidiaries where the reversal of the temporary difference can be controlled and it is probable that the difference will not reverse in the foreseeable future. Deferred tax liabilities are not recognised on temporary differences that arise from goodwill which is not deductible for tax purposes.
Deferred tax assets are recognised to the extent it is probable that taxable profits will be available against which the deductible temporary differences can be utilised, and are reviewed at each balance sheet date and reduced to the extent that it is no longer probable that sufficient taxable profits will be available to allow all or part of the asset to be recovered.
Deferred tax assets and liabilities are not recognised in respect of temporary differences that arise on initial recognition of assets and liabilities acquired other than in a business combination. Deferred tax is not discounted.
| | | | | | | | |
F-21 | Lloyds Banking Group plc Annual Report on Form 20-F 2023 | |
Notes to the consolidated financial statements continued
for the year ended 31 December
Note 2: Accounting policies continued
(M) Insurance – IFRS 17
The Group undertakes both life insurance and general insurance business. Insurance and participating investment contracts, and reinsurance contracts issued and held, are accounted for under IFRS 17 Insurance Contracts.
Products sold by the life insurance business are classified into three categories:
•Insurance contracts are contracts that transfer significant insurance risk and may also transfer financial risk. The Group defines significant insurance risk as the possibility of having to pay benefits on the occurrence of an insured event which are significantly higher than the benefits payable if the insured event were not to occur. Once a contract has been classified as an insurance contract, it remains an insurance contract until all obligations are extinguished unless that contract is derecognised due to a contract modification. These contracts are classified as either direct participating contracts or contracts without direct participation features. Contracts without direct participation features are accounted for using the general measurement model (GMM) for life contracts or the premium allocation approach (PAA) for general insurance contracts. Direct participating contracts are contracts for which, at inception, the contractual terms specify the policyholders participate in a clearly identified pool of underlying items. Under the terms of these contracts the policyholders are entitled to a substantial share of the returns and change in fair value of the underlying items. These contracts are accounted for under the variable fee approach (VFA)
•Participating investment contracts are investment contracts that contain a discretionary participation feature (DPF). They do not transfer significant insurance risk, but contain a contractual right to receive, as a supplement to an amount not subject to the discretion of the Group, additional amounts that are expected to be a significant portion of the total contractual benefits. The timing or amount of these additional amounts are at the discretion of the Group and are contractually based on the returns on a specified pool of contracts or type of contract, returns on a specified pool of assets held by the Group or profit or loss of a fund
•For certain insurance and investment contracts, the contract can be partly invested in units which contain a DPF and partly in units without. In these circumstances, where the contract also contains features that transfer significant insurance risk, they are classified as insurance contracts. Where this is not the case, and the discretionary cash flows are expected to be a significant portion of the total contractual benefits, they are classified as participating investment contracts. Where the discretionary cash flows are not expected to be a significant portion of the total contractual benefits, they are classified as financial instruments. An investment component is defined as the amount that an insurance contract requires the entity to repay to a policyholder in all circumstances, regardless of whether an insured event occurs. The investment component of the insurance and participating investment contract is non-distinct and is not separated. The Group applies judgement to determine the investment component for each contract considering the extent to which insurance and investment components are highly interrelated or not applying factors such as: whether the policyholder is able to benefit from one component unless the other component is present; and whether the value of the investment component is dependent on the timing of the insured event. The value of the non-distinct investment component is determined on the following bases: for immediate annuities, full claim amount when within the guaranteed period; for unit-linked and With-Profits contracts, policyholder’s account value
The general insurance business issues only insurance contracts.
(1) Life insurance business
(i) Accounting for insurance and participating investment contracts
Recognition
The Group aggregates insurance and participating investment contracts into portfolios of contracts subject to similar risks and managed together. Each portfolio of insurance contracts is divided into annual cohorts (by year of issue). Annual cohorts are divided into groups of insurance and participating investment contracts based on profitability expectations at initial recognition. The directly attributable costs of selling, underwriting and starting a group of insurance and participating investment contracts are allocated to the group of insurance and participating investment contracts using a systematic and rational method.
On initial recognition, a group of insurance and participating investment contracts is measured as the total of the fulfilment cash flows and the contractual service margin (CSM). The measurement includes all future cash flows that are within the contract boundary of each contract in the group. The fulfilment cash flows comprise unbiased and probability-weighted estimates of future cash flows, discounted to present value to reflect the time value of money and financial risks, plus an explicit risk adjustment for non-financial risk. The discount rate applied reflects the time value of money, the characteristics of the cash flows, the liquidity characteristics of the insurance and participating investment contracts and, where appropriate, is consistent with observable current market prices. The risk adjustment for non-financial risk for a group of insurance and participating investment contracts is the compensation required for bearing the uncertainty about the amount and timing of the cash flows that arises from non-financial risk. Diversification benefit is calculated based on Group level diversification of risks. To determine the risk adjustments for non-financial risk for reinsurance contracts, the Group applies these techniques both gross and net of excess of loss reinsurance and derives the amount of risk being transferred to the reinsurer as the difference between the two results. The CSM of a group of insurance and participating investment contracts represents the unearned profit that the Group expects to recognise as it provides insurance contract services under those contracts in the future.
Contract boundaries
The measurement of a group of contracts includes all future cash flows within the boundary of each contract in the group.
Cash flows are within the contract boundary:
•For an insurance contract, if they arise from substantive rights and obligations that exist during the reporting period in which the Group can compel the policyholder to pay premiums or has a substantive obligation to provide insurance contract services
•For a participating investment contract, if they result from a substantive obligation of the Group to deliver cash at a present or future date
A substantive obligation to provide insurance contract services ends when the Group has the practical ability to reassess the risks of the particular policyholder, and can set a price or level of benefits that fully reflects those reassessed risks; or the Group has the practical ability to reassess the risks of the portfolio that contains the contract and can set a price or level of benefits that fully reflects the risks of that portfolio, and the pricing of the premiums up to the reassessment date does not take into account risks that relate to periods after the reassessment date.
For certain unitised With-Profits and unit-linked policies, a guaranteed minimum pension is payable at a vesting date. For certain conventional With-Profits pensions, policyholders have the option to convert to an annuity on guaranteed terms. There is no contract boundary at the vesting date of these policies; the pre and post vesting date phases are treated as a single insurance contract.
The contract boundary of each group is reassessed at the end of each reporting period.
| | | | | | | | |
F-22 | Lloyds Banking Group plc Annual Report on Form 20-F 2023 | |
Notes to the consolidated financial statements continued
for the year ended 31 December
Note 2: Accounting policies continued
Measurement
The carrying amount of a group of insurance and participating investment contracts at each reporting date is the sum of the liability for remaining coverage (LRC) and the liability for incurred claims (LIC). The LRC comprises the fulfilment cash flows that relate to services that will be provided under the contracts in future periods and any remaining CSM at that date. The LIC includes the fulfilment cash flows for incurred claims and expenses that have not yet been paid, including claims that have been incurred but not yet reported. The fulfilment cash flows of groups of insurance and participating investment contracts are measured at the reporting date using current estimates of future cash flows, current discount rates and current estimates of the risk adjustment for non-financial risk. Changes in fulfilment cash flows are recognised as follows:
•Changes related to future service are adjusted against the CSM unless the group is onerous in which case such changes are recognised in the insurance service result in profit or loss
•Changes related to past or current service are recognised in the insurance service result in profit or loss
•The effects of the time value of money and financial risk are recognised as net finance income or expense from insurance, participating investment and reinsurance contracts in profit or loss
The carrying amount of the CSM is remeasured at the end of each reporting period. For contracts measured under the GMM, interest is accreted on the carrying amount of the CSM using the discount rate curve determined at the date of initial recognition of the group of contracts. The CSM is also adjusted for the changes in fulfilment cash flows relating to future service at the locked-in discount rates determined at initial recognition, unless the increases in fulfilment cash flows cause a group of contracts to become onerous or decreases in fulfilment cash flows are allocated to the loss component of the liability for remaining coverage.
The majority of the Group’s With-Profits and unit-linked insurance and participating investment contracts are direct participating contracts under which the Group’s obligation to the policyholder is the payment of an amount equal to the fair value of the underlying items, less a variable fee. On subsequent remeasurement of a group of direct participating contracts (measured under VFA), changes to the fulfilment cash flows, discounted at current rates, reflecting changes in the obligation to pay the policyholder an amount equal to the fair value of the underlying items are recognised in the income statement, within net finance income or expense from insurance, participating investment and reinsurance contracts. The CSM is adjusted for changes in the amount of the Group’s share of the fair value of the underlying items, which relate to future services, except where such changes result in recognition or reversal of the loss component for onerous groups, or where the Group applies the risk mitigation option. For certain contracts with direct participation features, the Group mitigates financial risks using equity and currency hedges. The Group does not adjust the CSM for changes in the fulfilment cash flows and/or entity’s share of the underlying items that reflect some of the changes in the effect of time value of money and financial risk. These amounts are instead reflected in profit or loss. The CSM is also adjusted for those fulfilment cashflows that do not vary based on the returns on underlying items that relate to future service (including the effect of time value of money and financial risks not arising from underlying items, such as the impact of minimum return guarantees), except where such changes result in recognition or reversal of the loss component for onerous groups. Changes in fulfilment cash flows relating to future service adjust the CSM using current discount rates.
For contracts measured under the GMM or VFA at the end of each reporting period the appropriate proportion of the CSM is recognised in the income statement to reflect the amount of profit related to the insurance contract services provided in the period. This is calculated using coverage units, a measure used to determine the allocation of the CSM over the remaining coverage periods. The number of coverage units in a group is the quantity of insurance contract services provided by the contracts in the group, determined by considering for each contract the quantity of the benefits provided and its expected coverage period.
Derecognition
The Group derecognises an insurance and participating investment contract when it is extinguished (that is, when the obligation specified in the contract expires or is discharged or cancelled) or if its terms are modified in a way that would have changed the accounting for the contract significantly had the new terms always existed.
If a contract is derecognised, then the fulfilment cash flows of the group are adjusted to eliminate the present value of the future cash flows and risk adjustment of the contract derecognised from the group, and the CSM of the group is adjusted for the change in fulfilment cash flows, except where such changes are allocated to the loss component.
If a contract is derecognised because its terms are modified, then the CSM of the existing group is also adjusted for the premium that would have been charged had the Group entered into a contract with the new contract’s terms at the date of modification, less any additional premium charged for the modification. A new modified contract is recognised assuming the Group received the premium that would have been charged had the Group entered into a contract with the new contract’s terms at the date of the modification.
Where the adjustments to CSM result in the CSM being reduced to nil, any further adjustments are recognised in the income statement in insurance service expense.
(2) General insurance contracts
General insurance contracts issued by the Group are presented on the balance sheet within liabilities arising from insurance and participating investment contracts. The Group applies the PAA to the measurement of general insurance contracts, which either have a coverage period of each contract in the group of one year or less or have an annual re-pricing option.
For a group of general insurance contracts that is not onerous at initial recognition, the Group measures the LRC as any premium received at initial recognition, less any insurance acquisition cash flows at that date, plus any other asset or liability previously recognised for cash flows related to the group of contracts that the Group pays or receives before the group of insurance contracts is recognised.
The Group estimates the LIC using the methodology described in the Measurement section for life insurance contracts above.
Where, during the coverage period, facts and circumstances indicate that a group of insurance contracts is onerous, the Group recognises a loss in the income statement for the net outflow, resulting in the carrying amount of the liability for the group being equal to the fulfilment cash flows. A loss component is established by the Group within the LRC for such onerous group.
On subsequent measurement, the Group measures the carrying amount of the LRC at the end of each reporting period as the LRC at the beginning of the period plus premiums received in the period, less insurance acquisition cash flows, plus any amounts relating to the amortisation of the insurance acquisition cash flows recognised as an expense in the reporting period for the group, less the amount recognised as insurance revenue for the services provided in the period. For onerous groups, the LRC is also adjusted for the remeasurement of the loss component.
| | | | | | | | |
F-23 | Lloyds Banking Group plc Annual Report on Form 20-F 2023 | |
Notes to the consolidated financial statements continued
for the year ended 31 December
Note 2: Accounting policies continued
(3) Reinsurance
(i) Reinsurance contracts issued
Reinsurance contracts issued by the Group (where insurance risk is transferred to the Group) are accounted for under the GMM as insurance contracts. These contracts are presented within other assets or liabilities arising from insurance and participating investment contracts.
(ii) Reinsurance contracts held
The classification of contracts entered into by the Group with reinsurers under which the Group is compensated for amounts payable on one or more other contracts issued by the Group is dependent on whether the contract with the reinsurer transfers significant insurance risk to the reinsurer. Where the reinsurance contract transfers significant insurance risk (reinsurance contracts held), it is accounted for under the GMM, as modified for reinsurance contracts held. The Group adjusts the CSM of the group to which a reinsurance contract held belongs and as a result recognises income, when it recognises a loss on initial recognition of onerous underlying contracts.
Contracts that do not transfer significant insurance risk to the reinsurer are recognised within financial assets at fair value through profit or loss as they are within a portfolio of financial assets that is managed, and whose performance is evaluated, on a fair value basis. These contracts, while legally reinsurance contracts, do not meet the definition of a reinsurance contract under IFRS. Investment returns (including movements in fair value and investment income) allocated to these contracts are recognised on the face of the income statement within net trading income.
(4) Non-participating investment contracts
The Group’s non-participating investment contracts are primarily unit-linked. These contracts are accounted for under IFRS 9 as financial liabilities whose value is contractually linked to the fair values of financial assets within the Group’s unitised investment funds. The value of the unit-linked financial liabilities is determined using current unit prices multiplied by the number of units attributed to the contract holders at the balance sheet date. Their value is never less than the amount payable on surrender, discounted for the required notice period where applicable. Investment returns (including movements in fair value and investment income) allocated to those contracts are recognised in the income statement through change in non-participating investment contracts.
Deposits and withdrawals are not accounted for through the income statement but are accounted for directly in the balance sheet as adjustments to the non-participating investment contract liability.
The Group receives investment management fees in the form of an initial adjustment or charge to the amount invested. These fees are in respect of services rendered in conjunction with the issue and management of investment contracts where the Group actively manages the consideration received from its customers to fund a return that is based on the investment profile that the customer selected on origination of the contract. These services comprise an indeterminate number of acts over the lives of the individual contracts and, therefore, the Group defers these fees and recognises them over the estimated lives of the contracts, in line with the provision of investment management services.
Costs which are directly attributable and incremental to securing new non-participating investment contracts are deferred. This asset is subsequently amortised over the period of the provision of investment management services and its recoverability is reviewed in circumstances where its carrying amount may not be recoverable. If the asset is greater than its recoverable amount it is written down immediately through fee and commission expense in the income statement. All other costs are recognised as expenses when incurred.
(N) Insurance – IFRS 4
As permitted by IFRS 17, the Group’s income statement for the year ended 31 December 2021 has been prepared under IFRS 4 Insurance Contracts. The balance sheets as at 31 December 2023, 31 December 2022 and the opening balance sheet for IFRS 17 transition as at 1 January 2022 are presented under IFRS 17 Insurance Contracts.
Products sold by the life insurance business are classified into three categories: insurance contracts, participating investment contracts and non-participating investment contracts.
For certain investment contracts, the contract can be partly invested in units which contain a discretionary participation feature (DPF) and partly in units without. Where switching levels for similar contracts are deemed to be significant, new investment contracts which contain an option to switch into investment contracts with DPF have been classified as participating investment contracts. Where the switching levels are not deemed to be significant, a new contract is split, with units containing a DPF being allocated as a participating investment contract and the units without a DPF as a non-participating investment contract.
The general insurance business issues only insurance contracts.
(1) Life insurance business
(i) Accounting for insurance and participating investment contracts
Premiums and claims
Premiums received in respect of insurance and participating investment contracts are recognised as revenue when due except for unit-linked contracts on which premiums are recognised as revenue when received. Claims are recorded as an expense on the earlier of the maturity date or the date on which the claim is notified.
Liabilities
Changes in the value of liabilities are recognised in the income statement through insurance claims and changes in insurance and investment contract liabilities.
•Insurance and participating investment contracts in the Group’s with-profit funds: liabilities of the Group’s with-profit funds, including guarantees and options embedded within products written by these funds, are stated at their realistic values in accordance with the Prudential Regulation Authority’s realistic capital regime, except that projected transfers out of the funds into other Group funds are recorded in the unallocated surplus (see below)
•Insurance contracts which are not unit-linked or in the Group’s with-profit funds: a liability for contractual benefits that are expected to be incurred in the future is recorded when the premiums are recognised. The liability is calculated by estimating the future cash flows over the duration of in-force policies and discounting them back to the valuation date allowing for probabilities of occurrence. The liability will vary with movements in interest rates and with the cost of life insurance and annuity benefits where future mortality is uncertain
| | | | | | | | |
F-24 | Lloyds Banking Group plc Annual Report on Form 20-F 2023 | |
Notes to the consolidated financial statements continued
for the year ended 31 December
Note 2: Accounting policies continued
Assumptions are made in respect of all material factors affecting future cash flows, including future interest rates, mortality and costs.
•Insurance and participating investment contracts which are unit-linked; Liabilities for unit-linked insurance and participating investment contracts are stated at the bid value of units plus an additional allowance where appropriate (such as for any excess of future expenses over charges). The liability is increased or reduced by the change in the unit prices and is reduced by policy administration fees, mortality and surrender charges and any withdrawals. Benefit claims in excess of the account balances incurred in the period are also charged through insurance claims and changes in insurance and investment contract liabilities. Revenue consists of fees deducted for mortality, policy administration and surrender charges
Unallocated surplus
Any amounts in the with-profit funds not yet determined as being due to policyholders or shareholders are recognised as an unallocated surplus which is shown separately from liabilities arising from insurance and participating investment contracts.
(ii) Accounting for non-participating investment contracts
The accounting policy is consistent with M(4) above, except that investment returns (including movements in fair value and investment income) allocated to those contracts are recognised in the income statement through insurance claims and changes in insurance and investment contract liabilities.
(2) General insurance business
The Group both underwrites and acts as intermediary in the sale of general insurance products. Underwriting premiums are included in insurance premium income, net of refunds, in the period in which insurance cover is provided to the customer; premiums received relating to future periods are deferred in the balance sheet within liabilities arising from insurance and participating investment contracts on a basis that reflects the length of time for which contracts have been in-force and the projected incidence of risk over the term of the contract and only credited to the income statement when earned. Broking commission is recognised when the underwriter accepts the risk of providing insurance cover to the customer. Where appropriate, provision is made for the effect of future policy terminations based upon past experience.
The underwriting business makes provision for the estimated cost of claims notified but not settled and claims incurred but not reported at the balance sheet date. The provision for the cost of claims notified but not settled is based upon a best estimate of the cost of settling the outstanding claims after taking into account all known facts. In those cases where there is insufficient information to determine the required provision, statistical techniques are used which take into account the cost of claims that have recently been settled and make assumptions about the future development of the outstanding cases. Similar statistical techniques are used to determine the provision for claims incurred but not reported at the balance sheet date. Claims liabilities are not discounted.
(3) Liability adequacy test
At each balance sheet date liability adequacy tests are performed to ensure the adequacy of insurance and participating investment contract liabilities net of related deferred cost assets and value of in-force business. In performing these tests, current best estimates of discounted future contractual cash flows and claims handling and policy administration expenses, as well as investment income from the assets backing such liabilities, are used. Any deficiency is immediately charged to the income statement, initially by writing off the relevant assets and subsequently by establishing a provision for losses arising from liability adequacy tests.
(4) Reinsurance
The presentation of contracts entered into by the Group with reinsurers under which the Group is compensated for amounts payable on one or more other contracts issued by the Group is dependent on whether the contract with the reinsurer transfers significant insurance risk to the reinsurer. Where the reinsurance contract transfers significant insurance risk, it is classified as an insurance contract and the asset is recognised separately on the balance sheet. Where the reinsurance contract does not transfer significant insurance risk to the reinsurer, the assets arising from contracts held with reinsurers are presented within financial assets at fair value through profit or loss.
(i) Contracts with reinsurers that transfer significant insurance risk
Amounts recoverable from or due to reinsurers are measured consistently with the amounts associated with the reinsured contracts and in accordance with the terms of each reinsurance contract and are regularly reviewed for impairment. Premiums payable for reinsurance contracts are recognised as an expense when due within insurance premium income. Changes in the reinsurance recoverable assets are recognised in the income statement through insurance claims and changes in insurance and investment contract liabilities.
(ii) Contracts with reinsurers that do not transfer significant insurance risk
Contracts that do not transfer significant insurance risk to the reinsurer are recognised within financial assets at fair value through profit or loss as they are within a portfolio of financial assets that is managed, and whose performance is evaluated, on a fair value basis. These contracts, while legally reinsurance contracts, do not meet the definition of a reinsurance contract under IFRS. Investment returns (including movements in fair value and investment income) allocated to these contracts are recognised in insurance claims and changes in insurance and investment contract liabilities.
(O) Foreign currency translation
Items included in the financial statements of each of the Group’s entities are measured using the currency of the primary economic environment in which the entity operates (the functional currency). Foreign currency transactions are translated into the appropriate functional currency using the exchange rates prevailing at the dates of the transactions. Foreign exchange gains and losses resulting from the settlement of such transactions and from the translation at year end exchange rates of monetary assets and liabilities denominated in foreign currencies are recognised in the income statement, except when recognised in other comprehensive income as qualifying cash flow or net investment hedges. Non-monetary assets that are measured at fair value are translated using the exchange rate at the date that the fair value was determined. Translation differences on equities and similar non-monetary items held at fair value through profit and loss are recognised in profit or loss as part of the fair value gain or loss. Translation differences on non-monetary financial assets measured at fair value through other comprehensive income, such as equity shares, are included in the fair value reserve in equity unless the asset is a hedged item in a fair value hedge.
| | | | | | | | |
F-25 | Lloyds Banking Group plc Annual Report on Form 20-F 2023 | |
Notes to the consolidated financial statements continued
for the year ended 31 December
Note 2: Accounting policies continued
The results and financial position of all Group entities that have a functional currency different from the presentation currency are translated into the presentation currency as follows: the assets and liabilities of foreign operations, including goodwill and fair value adjustments arising on the acquisition of a foreign entity, are translated into Sterling at foreign exchange rates ruling at the balance sheet date; and the income and expenses of foreign operations are translated into Sterling at average exchange rates unless these do not approximate to the foreign exchange rates ruling at the dates of the transactions, in which case income and expenses are translated at the dates of the transactions.
Foreign exchange differences arising on the translation of a foreign operation are recognised in other comprehensive income and accumulated in a separate component of equity together with exchange differences arising from the translation of borrowings and other currency instruments designated as hedges of such investments (see (F)(3) above). On disposal or liquidation of a foreign operation, the cumulative amount of exchange differences relating to that foreign operation is reclassified from equity and included in determining the profit or loss arising on disposal or liquidation.
(P) Provisions and contingent liabilities
Provisions are recognised in respect of present obligations arising from past events where it is probable that outflows of resources will be required to settle the obligations and they can be reliably estimated.
Contingent liabilities are possible obligations whose existence depends on the outcome of uncertain future events or those present obligations where the outflows of resources are uncertain or cannot be measured reliably. Contingent liabilities are not recognised in the financial statements but are disclosed unless they are remote.
Provision is made for expected credit losses in respect of irrevocable undrawn loan commitments and financial guarantee contracts (see (H) above).
(Q) Share capital
Incremental costs directly attributable to the issue of new shares or options or to the acquisition of a business are shown in equity as a deduction, net of tax, from the proceeds. Dividends paid on the Group’s ordinary shares are recognised as a reduction in equity in the period in which they are paid.
Where the Company or any member of the Group purchases the Company’s share capital, the consideration paid is deducted from shareholders’ equity as treasury shares until they are cancelled; if these shares are subsequently sold or reissued, any consideration received is included in shareholders’ equity.
(R) Cash and cash equivalents
For the purposes of the cash flow statement, cash and cash equivalents comprise cash and non-mandatory deposits held with central banks, mandatory deposits held with central banks in demand accounts and amounts due from banks with an original maturity of less than three months that are available to finance the Group’s day-to-day operations.
Note 3: Critical accounting judgements and key sources of estimation uncertainty
The preparation of the Group’s financial statements in accordance with IFRS requires management to make judgements, estimates and assumptions in applying the accounting policies that affect the reported amounts of assets, liabilities, income and expenses. Due to the inherent uncertainty in making estimates, actual results reported in future periods may be based upon amounts which differ from those estimates. Estimates, judgements and assumptions are continually evaluated and are based on historical experience and other factors, including expectations of future events that are believed to be reasonable under the circumstances. In preparing the financial statements, the Group has considered the impact of climate-related risks on its financial position and performance. While the effects of climate change represent a source of uncertainty, the Group does not consider there to be a material impact on its judgements and estimates from the physical, transition and other climate-related risks in the short term.
The significant judgements, apart from those involving estimation, made by management in applying the Group’s accounting policies in these financial statements (critical judgements) and the key sources of estimation uncertainty that may have a significant risk of causing a material adjustment to the carrying amount of assets and liabilities within the next financial year (key sources of estimation uncertainty), which together are considered critical to the Group’s results and financial position, are as follows:
•Retirement benefit obligations (note 16)
•Uncertain tax positions (note 19)
•Fair value of financial instruments (note 21)
•Allowance for expected credit losses (note 24)
•Valuation of liabilities arising from insurance business (notes 30 and 36)
•Regulatory and legal provisions (note 38)
Consideration of climate change
Financial statement preparation includes the consideration of the impact of climate change on the Group’s financial statements. There has been no material impact identified on the financial reporting judgements and estimates. In particular, the directors considered the impact of climate change in respect of the:
•Going concern of the Group for a period of at least 12 months from the date of approval of the financial statements
•Assessment of impairment of non-financial assets including goodwill
•Carrying value and useful economic lives of property, plant and equipment
•Fair value of financial assets and liabilities. These are generally based on market indicators which include the market’s assessment of climate risk
•Initial assessments on expected credit loss, focussing on specific climate-related macroeconomic, physical and transition risk impacts on credit quality at a sector and segment level
•Forecasting of the Group’s future UK taxable profits, which impacts deferred tax recognition
Whilst there is currently no material short-term impact of climate change expected, the Group acknowledges the long-term nature of climate risk and continues to monitor and assess climate risks highlighted in the risk management section on pages 53 to 56. | | | | | | | | |
F-26 | Lloyds Banking Group plc Annual Report on Form 20-F 2023 | |
Notes to the consolidated financial statements continued
for the year ended 31 December
Note 4: Segmental analysis
Lloyds Banking Group provides a wide range of banking and financial services in the UK and in certain locations overseas.
The Group Executive Committee (GEC) has been determined to be the chief operating decision-maker, as defined by IFRS 8 Operating Segments, for the Group. The Group’s operating segments reflect its organisational and management structures. The GEC reviews the Group’s internal reporting based around these segments in order to assess performance and allocate resources. It considers interest income and expense on a net basis and consequently the total interest income and expense for all reportable segments is presented net. The segments are differentiated by the type of products provided and by whether the customers are individuals or corporate entities.
The segmental results and comparatives are presented on an underlying basis (pre-tax), the basis reviewed by the chief operating decision-maker. The underlying basis is derived from the recognition and measurement principles of IFRS with the effects of the following excluded in arriving at underlying profit before tax:
•Restructuring costs relating to merger, acquisition and integration activities
•Volatility and other items, which includes the effects of certain asset sales, the volatility relating to the Group’s hedging arrangements and that arising in the insurance businesses, the unwind of acquisition-related fair value adjustments and the amortisation of purchased intangible assets
•Losses from insurance and participating investment contract modifications relating to the enhancement to the Group’s longstanding and workplace pension business through the addition of a drawdown feature
For the purposes of the underlying income statement, operating lease depreciation (net of gains on disposal of operating lease assets) is shown as an adjustment to underlying income.
The Group has three operating and reportable segments: Retail; Commercial Banking; and Insurance, Pensions and Investments:
•Retail offers a broad range of financial services products to personal customers, including current accounts, savings, mortgages, credit cards, unsecured loans, motor finance and leasing solutions
•Commercial Banking serves small and medium businesses and corporate and institutional clients, providing lending, transactional banking, working capital management, debt financing and risk management services
•Insurance, Pensions and Investments offers insurance, investment and pension management products and services
Other comprises income and expenditure not attributed to the Group’s operating segments. These amounts include those arising from the Group’s equities business, residual net interest income after transfer pricing (which includes the central recovery of the Group’s distributions on other equity instruments), in period gains from gilt sales and the unwind of associated hedging costs.
Inter-segment services are generally recharged at cost, although some attract a margin. In particular, a profit margin is charged on the internal commission arrangements between the branch network and other distribution channels and the insurance product manufacturing businesses within the Group. Inter-segment lending and deposits are generally entered into at market rates, except that non-interest bearing balances are priced at a rate that reflects the external yield that could be earned on such funds.
For the majority of those derivative contracts entered into by business units for risk management purposes, the business unit recognises the net interest income or expense on an accrual accounting basis and transfers the remainder of the movement in the fair value of the derivative to the central function where the resulting accounting volatility is managed where possible through the establishment of hedge accounting relationships. Any change in fair value of the hedged instrument attributable to the hedged risk is also recorded within the central function. This allocation of the fair value of the derivative and change in fair value of the hedged instrument attributable to the hedged risk avoids accounting asymmetry in segmental results and leads to accounting volatility, which is managed centrally and reported within Other.
| | | | | | | | |
F-27 | Lloyds Banking Group plc Annual Report on Form 20-F 2023 | |
Notes to the consolidated financial statements continued
for the year ended 31 December
Note 4: Segmental analysis continued
| | | | | | | | | | | | | | | | | | | | | | | | | | | | | |
| Year ended 31 December 2023 | Retail
£m | Commercial
Banking
£m | Insurance, Pensions and Investments
£m | | Other
£m | | Total
£m |
| Underlying net interest income | 9,647 | | | 3,799 | | | (132) | | | 451 | | | 13,765 | |
| Underlying other income | 2,159 | | | 1,691 | | | 1,209 | | | 64 | | | 5,123 | |
| Total underlying income, net of net finance income in respect of insurance and investment contracts | 11,806 | | | 5,490 | | | 1,077 | | | 515 | | | 18,888 | |
Operating lease depreciation1 | (948) | | | (8) | | | – | | | – | | | (956) | |
| Underlying income, net of operating lease depreciation | 10,858 | | | 5,482 | | | 1,077 | | | 515 | | | 17,932 | |
| Underlying operating costs | (5,469) | | | (2,647) | | | (880) | | | (144) | | | (9,140) | |
| Remediation | (515) | | | (127) | | | (14) | | | (19) | | | (675) | |
| Total underlying costs | (5,984) | | | (2,774) | | | (894) | | | (163) | | | (9,815) | |
| Underlying impairment (charge) credit | (831) | | | 511 | | | 7 | | | 5 | | | (308) | |
| Underlying profit before tax | 4,043 | | | 3,219 | | | 190 | | | 357 | | | 7,809 | |
| | | | | | | | | |
| External income | 12,803 | | | 4,570 | | | 1,221 | | | 294 | | | 18,888 | |
External operating lease depreciation1 | (948) | | | (8) | | | – | | | – | | | (956) | |
| Inter-segment (expense) income | (997) | | | 920 | | | (144) | | | 221 | | | – | |
| Underlying income, net of operating lease depreciation | 10,858 | | | 5,482 | | | 1,077 | | | 515 | | | 17,932 | |
| | | | | | | | | |
Loans and advances to customers2 | 361,181 | | | 88,606 | | | – | | | (42) | | | 449,745 | |
| External assets | 376,789 | | | 150,834 | | | 184,267 | | | 169,563 | | | 881,453 | |
| Customer deposits | 308,441 | | | 162,752 | | | – | | | 203 | | | 471,396 | |
| External liabilities | 313,244 | | | 204,815 | | | 179,962 | | | 136,067 | | | 834,088 | |
| | | | | | | | | | |
| Analysis of underlying other income: | | | | | | | | | |
| Net fee and commission income | 618 | | | 955 | | | 249 | | | 9 | | | 1,831 | |
| Operating lease rental income | 1,373 | | | 10 | | | – | | | – | | | 1,383 | |
| Rental income from investment properties | – | | | – | | | 140 | | | 6 | | | 146 | |
| Gains less losses on disposal of financial assets at fair value through other comprehensive income | – | | | – | | | – | | | 122 | | | 122 | |
Trading income, insurance and other, net of net finance income in respect
of insurance and investment contracts | (27) | | | 327 | | | 272 | | | 1,069 | | | 1,641 | |
| Inter-segment other income | 195 | | | 399 | | | 548 | | | (1,142) | | | – | |
| Underlying other income | 2,159 | | | 1,691 | | | 1,209 | | | 64 | | | 5,123 | |
| | | | | | | | | |
| Other items reflected in income statement above: | | | | | | | | | |
| Depreciation and amortisation | 1,927 | | | 410 | | | 201 | | | 367 | | | 2,905 | |
| Defined benefit scheme charge (credit) | 53 | | | 21 | | | 6 | | | (159) | | | (79) | |
| Non-income statement items: | | | | | | | | | |
| Additions to fixed assets | 3,294 | | | 88 | | | 80 | | | 1,993 | | | 5,455 | |
| Investments in joint ventures and associates at end of year | – | | | – | | | – | | | 401 | | | 401 | |
1 Net of profits on disposal of operating lease assets of £93 million.
2 Other includes centralised fair value hedge accounting adjustments.
| | | | | | | | |
F-28 | Lloyds Banking Group plc Annual Report on Form 20-F 2023 | |
Notes to the consolidated financial statements continued
for the year ended 31 December
Note 4: Segmental analysis continued
| | | | | | | | | | | | | | | | | | | | | | | | | | | | | |
Year ended 31 December 20221 | Retail
£m | | Commercial
Banking
£m | Insurance, Pensions and Investments
£m | | Other
£m | | Total
£m |
| Underlying net interest income | 9,774 | | | 3,447 | | | (101) | | | 52 | | | 13,172 | |
| Underlying other income | 1,731 | | | 1,565 | | | 960 | | | 410 | | | 4,666 | |
| Total underlying income, net of net finance income in respect of insurance and investment contracts | 11,505 | | | 5,012 | | | 859 | | | 462 | | | 17,838 | |
Operating lease depreciation2 | (368) | | | (5) | | | – | | | – | | | (373) | |
| Underlying income, net of operating lease depreciation | 11,137 | | | 5,007 | | | 859 | | | 462 | | | 17,465 | |
| Underlying operating costs | (5,175) | | | (2,496) | | | (879) | | | (122) | | | (8,672) | |
| Remediation | (92) | | | (133) | | | (30) | | | – | | | (255) | |
| Total underlying costs | (5,267) | | | (2,629) | | | (909) | | | (122) | | | (8,927) | |
| Underlying impairment (charge) credit | (1,373) | | | (517) | | | (12) | | | 392 | | | (1,510) | |
| Underlying profit (loss) before tax | 4,497 | | | 1,861 | | | (62) | | | 732 | | | 7,028 | |
| | | | | | | | | |
| External income | 12,055 | | | 4,330 | | | 910 | | | 543 | | | 17,838 | |
External operating lease depreciation2 | (368) | | | (5) | | | – | | | – | | | (373) | |
| Inter-segment (expense) income | (550) | | | 682 | | | (51) | | | (81) | | | – | |
| Underlying income, net of operating lease depreciation | 11,137 | | | 5,007 | | | 859 | | | 462 | | | 17,465 | |
| | | | | | | | | |
Loans and advances to customers3 | 364,194 | | | 93,675 | | | – | | | (2,970) | | | 454,899 | |
| External assets | 372,485 | | | 147,477 | | | 170,777 | | | 182,655 | | | 873,394 | |
| Customer deposits | 310,765 | | | 163,828 | | | – | | | 738 | | | 475,331 | |
| External liabilities | 314,091 | | | 202,070 | | | 168,357 | | | 144,965 | | | 829,483 | |
| | | | | | | | | | |
| Analysis of underlying other income: | | | | | | | | | |
| Net fee and commission income | 555 | | | 928 | | | 239 | | | (2) | | | 1,720 | |
| Operating lease rental income | 1,065 | | | 12 | | | – | | | – | | | 1,077 | |
| Rental income from investment properties | – | | | – | | | 144 | | | 1 | | | 145 | |
| Gains less losses on disposal of financial assets at fair value through other comprehensive income | – | | | – | | | – | | | 92 | | | 92 | |
Trading income, insurance and other, net of net finance income in respect
of insurance and investment contracts | 296 | | | (765) | | | 1,938 | | | 163 | | | 1,632 | |
| Inter-segment other income | (185) | | | 1,390 | | | (1,361) | | | 156 | | | – | |
| Underlying other income | 1,731 | | | 1,565 | | | 960 | | | 410 | | | 4,666 | |
| | | | | | | | | |
| Other items reflected in income statement above: | | | | | | | | | |
| Depreciation and amortisation | 1,216 | | | 207 | | | 142 | | | 831 | | | 2,396 | |
| Defined benefit scheme charge | 72 | | | 28 | | | 7 | | | 18 | | | 125 | |
| Non-income statement items: | | | | | | | | | |
| Additions to fixed assets | 2,146 | | | 101 | | | 151 | | | 1,457 | | | 3,855 | |
| Investments in joint ventures and associates at end of year | 4 | | | – | | | – | | | 381 | | | 385 | |
1 Restated for the adoption of IFRS 17; see notes 1 and 54.
2 Net of profits on disposal of operating lease assets of £197 million.
3 Other includes centralised fair value hedge accounting adjustments.
| | | | | | | | |
F-29 | Lloyds Banking Group plc Annual Report on Form 20-F 2023 | |
Notes to the consolidated financial statements continued
for the year ended 31 December
Note 4: Segmental analysis continued
| | | | | | | | | | | | | | | | | | | | | | | | | | | | | |
Year ended 31 December 2021 | Retail
£m | | Commercial
Banking
£m | Insurance, Pensions and Investments
£m | | Other
£m | | Total
£m |
| Underlying net interest income | 8,577 | | | 2,602 | | | (103) | | | 87 | | | 11,163 | |
| Underlying other income | 1,597 | | | 1,442 | | | 1,406 | | | 615 | | | 5,060 | |
| Total underlying income, net of insurance claims and changes in insurance and investment contract liabilities | 10,174 | | | 4,044 | | | 1,303 | | | 702 | | | 16,223 | |
Operating lease depreciation1 | (442) | | | (18) | | | – | | | – | | | (460) | |
| Underlying income, net of operating lease depreciation | 9,732 | | | 4,026 | | | 1,303 | | | 702 | | | 15,763 | |
| Underlying operating costs | (4,987) | | | (2,288) | | | (899) | | | (138) | | | (8,312) | |
| Remediation | (360) | | | (830) | | | (123) | | | 13 | | | (1,300) | |
| Total underlying costs | (5,347) | | | (3,118) | | | (1,022) | | | (125) | | | (9,612) | |
| Underlying impairment credit | 447 | | | 936 | | | – | | | 2 | | | 1,385 | |
| Underlying profit before tax | 4,832 | | | 1,844 | | | 281 | | | 579 | | | 7,536 | |
| | | | | | | | | |
| External income | 11,260 | | | 3,883 | | | 1,323 | | | (243) | | | 16,223 | |
| External operating lease depreciation1 | (442) | | | (18) | | | – | | | – | | | (460) | |
| Inter-segment (expense) income | (1,086) | | | 161 | | | (20) | | | 945 | | | – | |
| Underlying income, net of operating lease depreciation | 9,732 | | | 4,026 | | | 1,303 | | | 702 | | | 15,763 | |
| | | | | | | | | |
Loans and advances to customers2 | 356,351 | | | 92,470 | | | – | | | (254) | | | 448,567 | |
| External assets | 364,179 | | | 144,390 | | | 195,039 | | | 182,917 | | | 886,525 | |
| Customer deposits | 308,412 | | | 167,530 | | | – | | | 402 | | | 476,344 | |
| External liabilities | 312,594 | | | 204,641 | | | 188,372 | | | 127,766 | | | 833,373 | |
| | | | | | | | | | |
| Analysis of underlying other income: | | | | | | | | | |
| Net fee and commission income | 452 | | | 927 | | | 13 | | | 31 | | | 1,423 | |
| Operating lease rental income | 1,046 | | | 13 | | | – | | | – | | | 1,059 | |
| Rental income from investment properties | – | | | – | | | 186 | | | – | | | 186 | |
| Gains less losses on disposal of financial assets at fair value through other comprehensive income | – | | | (5) | | | – | | | 3 | | | (2) | |
| Trading income, insurance and other, net of insurance claims and changes in insurance and investment contract liabilities | 188 | | | 1,045 | | | 1,766 | | | (605) | | | 2,394 | |
| Inter-segment other income | (89) | | | (538) | | | (559) | | | 1,186 | | | – | |
| Underlying other income | 1,597 | | | 1,442 | | | 1,406 | | | 615 | | | 5,060 | |
| | | | | | | | | |
| Other items reflected in income statement above: | | | | | | | | | |
| Depreciation and amortisation | 1,525 | | | 283 | | | 170 | | | 847 | | | 2,825 | |
| Movement in value of in-force business | – | | | – | | | (70) | | | – | | | (70) | |
| Defined benefit scheme charge | 91 | | | 30 | | | 9 | | | 106 | | | 236 | |
| Non-income statement items: | | | | | | | | | |
| Additions to fixed assets | 1,921 | | | 179 | | | 117 | | | 1,011 | | | 3,228 | |
| Investments in joint ventures and associates at end of year | 6 | | | – | | | – | | | 346 | | | 352 | |
1 Net of profits on disposal of operating lease assets of £249 million.
2 Other includes centralised fair value hedge accounting adjustments.
Geographical areas
The Group’s operations are predominantly UK-based and as a result an analysis between UK and non-UK activities is not provided.
| | | | | | | | |
F-30 | Lloyds Banking Group plc Annual Report on Form 20-F 2023 | |
Notes to the consolidated financial statements continued
for the year ended 31 December
Note 4: Segmental analysis continued
Reconciliation of underlying basis to statutory results
The underlying basis is the basis on which financial information is presented to the chief operating decision-maker which excludes certain items included in the statutory results. The table below reconciles the statutory results to the underlying basis.
| | | | | | | | | | | | | | | | | | |
| | | Removal of: | |
| Year ended 31 December 2023 | Lloyds Banking
Group statutory
£m | Volatility, and other items1 £m | Insurance gross up2 £m | | Underlying
basis
£m |
| Net interest income / Underlying interest income | | 13,298 | | 479 | | (12) | | | 13,765 | |
| Other income, net of net finance income in respect of insurance and investment contracts / Underlying other income | | 5,331 | | (447) | | 239 | | | 5,123 | |
| Total income, net of net finance income in respect of insurance and investment contracts | | 18,629 | | 32 | | 227 | | | 18,888 | |
Operating lease depreciation3 | | | (956) | | – | | | (956) | |
| Total income, net of net finance income in respect of insurance and investment contracts / Underlying income, net of operating lease depreciation | | 18,629 | | (924) | | 227 | | | 17,932 | |
| Operating expenses / Total costs | | (10,823) | | 1,235 | | (227) | | | (9,815) | |
Impairment charge / Underlying impairment charge | | (303) | | (5) | | – | | | (308) | |
| Profit before tax / Underlying profit | | 7,503 | | 306 | | – | | | 7,809 | |
| | | | | | | | | | | | | | | | | | |
| | | Removal of: | |
Year ended 31 December 20225,6 | Lloyds Banking
Group statutory
£m | Volatility, and other items4 £m | Insurance gross up2 £m | | Underlying
basis
£m |
| Net interest income / Underlying interest income | | 12,922 | | 226 | | 24 | | | 13,172 | |
| Other income, net of net finance income in respect of insurance and investment contracts / Underlying other income | | 2,619 | | 1,846 | | 201 | | | 4,666 | |
| Total income, net of net finance income in respect of insurance and investment contracts | | 15,541 | | 2,072 | | 225 | | | 17,838 | |
Operating lease depreciation3 | | | (373) | | – | | | (373) | |
| Total income, net of net finance income in respect of insurance and investment contracts / Underlying income, net of operating lease depreciation | | 15,541 | | 1,699 | | 225 | | | 17,465 | |
| Operating expenses / Total costs | | (9,237) | | 535 | | (225) | | | (8,927) | |
| Impairment credit / Underlying impairment credit | | (1,522) | | 12 | | – | | | (1,510) | |
| Profit before tax / Underlying profit | | 4,782 | | 2,246 | | – | | | 7,028 | |
| | | | | | | | | | | | | | | | | | |
| | | Removal of: | |
Year ended 31 December 20216 | Lloyds Banking
Group statutory
£m | Volatility, and other items7 £m | Insurance gross up2 £m | | Underlying
basis
£m |
| Net interest income / Underlying interest income | | 10,872 | | 255 | | 36 | | | 11,163 | |
| Other income, net of insurance claims and changes in insurance and investment contract liabilities / Underlying other income | | 5,452 | | (139) | | (253) | | | 5,060 | |
| Total income, net of insurance claims and changes in insurance and investment contract liabilities | | 16,324 | | 116 | | (217) | | | 16,223 | |
Operating lease depreciation3 | | | (460) | | – | | | (460) | |
| Total income, net of insurance claims and changes in insurance and investment contract liabilities / Underlying income, net of operating lease depreciation | | 16,324 | | (344) | | (217) | | | 15,763 | |
| Operating expenses / Total costs | | (10,800) | | 971 | | 217 | | | (9,612) | |
| Impairment charge / Underlying impairment charge | | 1,378 | | 7 | | – | | | 1,385 | |
| Profit before tax / Underlying profit | | 6,902 | | 634 | | – | | | 7,536 | |
1 In the year ended 31 December 2023 this comprises the effects of market volatility and asset sales (gain of £35 million); the amortisation of purchased intangibles (£80 million); restructuring (£154 million of merger, acquisition and integration costs); and the fair value unwind (losses of £107 million).
2 The Group’s Insurance business statutory income statement includes income and expenses attributable to the policyholders of the Group’s long-term assurance funds, investors in the Group's non-participating investment contracts and third party interests in consolidated funds. These items have no impact in total upon the profit attributable to equity shareholders and, in order to provide a clearer representation of the underlying trends within the business, these items are shown net within the underlying results.
3 Net of profits on disposal of operating lease assets of £93 million (2022: £197 million; 2021: £249 million). Statutory operating expenses includes operating lease depreciation. On an underlying basis operating lease depreciation is included in net income.
4 Comprises the effects of market volatility and asset sales (losses of £1,978 million); the amortisation of purchased intangibles (£70 million); restructuring (£80 million of merger, acquisition and integration costs); and the fair value unwind (losses of £118 million).
5 Restated for the adoption of IFRS 17; see notes 1 and 54.
6 Restated for presentational changes; see note 1.
7 Comprises the effects of market volatility and asset sales (gain of £87 million); the amortisation of purchased intangibles (£70 million); restructuring (£452 million, including a software write-off as a result on investment in new technology and systems infrastructure together with merger, acquisition and integration costs); and the fair value unwind (losses of £199 million).
| | | | | | | | |
F-31 | Lloyds Banking Group plc Annual Report on Form 20-F 2023 | |
Notes to the consolidated financial statements continued
for the year ended 31 December
Note 5: Net interest income
| | | | | | | | | | | |
| 2023 £m | 20221 £m | 20211 £m |
| Interest income: | | | |
| Loans and advances to banks | 4,172 | | 1,208 | | 104 | |
| Loans and advances to customers | 20,419 | | 14,465 | | 12,556 | |
| Reverse repurchase agreements | 2,044 | | 857 | | 77 | |
| Debt securities | 559 | | 168 | | 80 | |
| Financial assets held at amortised cost | 27,194 | | 16,698 | | 12,817 | |
| Financial assets at fair value through other comprehensive income | 857 | | 947 | | 441 | |
Total interest income2 | 28,051 | | 17,645 | | 13,258 | |
| Interest expense: | | | |
| Deposits from banks | (213) | | (148) | | (74) | |
| Customer deposits | (7,148) | | (1,387) | | (426) | |
| Repurchase agreements at amortised cost | (2,397) | | (842) | | (22) | |
Debt securities in issue at amortised cost3 | (4,253) | | (1,636) | | (900) | |
| Lease liabilities | (30) | | (29) | | (32) | |
| Subordinated liabilities | (712) | | (681) | | (932) | |
Total interest expense | (14,753) | | (4,723) | | (2,386) | |
| Net interest income | 13,298 | | 12,922 | | 10,872 | |
1 Restated for presentational changes; see note 1.
2 Includes £923 million (2022: £724 million; 2021: £748 million) in respect of finance lease receivables.
3 The impact of the Group’s hedging arrangements is included on this line.
Net interest income includes a debit of £1,838 million (2022: debit of £43 million; 2021: credit of £621 million) transferred from the cash flow hedging reserve (see note 43).
Note 6: Net fee and commission income
| | | | | | | | | | | | | | | | | | | | | | | | | | | | | |
Year ended 31 December 2023 | Retail
£m | Commercial
Banking
£m | Insurance, Pensions and Investments
£m | | Other
£m | | Total
£m |
| Fee and commission income: | | | | | | | | | |
| Current accounts | 406 | | | 218 | | | – | | | – | | | 624 | |
| Credit and debit card fees | 800 | | | 464 | | | – | | | – | | | 1,264 | |
| Commercial banking and treasury fees | – | | | 334 | | | – | | | – | | | 334 | |
| Unit trust and insurance broking | – | | | – | | | 69 | | | – | | | 69 | |
| Factoring | – | | | 75 | | | – | | | – | | | 75 | |
| Other fees and commissions | 85 | | | 186 | | | 264 | | | 25 | | | 560 | |
| Total fee and commission income | 1,291 | | | 1,277 | | | 333 | | | 25 | | | 2,926 | |
| Fee and commission expense | (673) | | | (322) | | | (84) | | | (16) | | | (1,095) | |
| Net fee and commission income | 618 | | | 955 | | | 249 | | | 9 | | | 1,831 | |
| | | | | | | | | | | | | | | | | | | | | | | | | | | | | |
Year ended 31 December 2022 | Retail
£m | Commercial
Banking
£m | Insurance, Pensions and Investments1 £m | | Other
£m | | Total1 £m |
| Fee and commission income: | | | | | | | | | |
| Current accounts | 421 | | | 225 | | | – | | | – | | | 646 | |
| Credit and debit card fees | 735 | | | 460 | | | – | | | – | | | 1,195 | |
| Commercial banking and treasury fees | – | | | 310 | | | – | | | 1 | | | 311 | |
| Unit trust and insurance broking | – | | | – | | | 78 | | | – | | | 78 | |
| Factoring | – | | | 79 | | | – | | | – | | | 79 | |
| Other fees and commissions | 64 | | | 169 | | | 233 | | | 15 | | | 481 | |
| Total fee and commission income | 1,220 | | | 1,243 | | | 311 | | | 16 | | | 2,790 | |
| Fee and commission expense | (665) | | | (315) | | | (72) | | | (18) | | | (1,070) | |
| Net fee and commission income | 555 | | | 928 | | | 239 | | | (2) | | | 1,720 | |
1 Restated for the adoption of IFRS 17; see notes 1 and 54.
| | | | | | | | |
F-32 | Lloyds Banking Group plc Annual Report on Form 20-F 2023 | |
Notes to the consolidated financial statements continued
for the year ended 31 December
Note 6: Net fee and commission income continued
| | | | | | | | | | | | | | | | | | | | | | | | | | | | | |
| Year ended 31 December 2021 | Retail
£m | Commercial
Banking
£m | Insurance, Pensions and Investments
£m | | Other
£m | | Total
£m |
| Fee and commission income: | | | | | | | | | |
| Current accounts | 425 | | | 213 | | | – | | | – | | | 638 | |
| Credit and debit card fees | 533 | | | 350 | | | – | | | – | | | 883 | |
| Commercial banking and treasury fees | – | | | 376 | | | – | | | 37 | | | 413 | |
| Unit trust and insurance broking | – | | | – | | | 113 | | | – | | | 113 | |
| Factoring | – | | | 76 | | | – | | | – | | | 76 | |
| Other fees and commissions | 65 | | | 183 | | | 213 | | | 24 | | | 485 | |
| Total fee and commission income | 1,023 | | | 1,198 | | | 326 | | | 61 | | | 2,608 | |
| Fee and commission expense | (571) | | | (271) | | | (313) | | | (30) | | | (1,185) | |
| Net fee and commission income | 452 | | | 927 | | | 13 | | | 31 | | | 1,423 | |
Fees and commissions which are an integral part of the effective interest rate form part of net interest income shown in note 5. Fees and commissions relating to instruments that are held at fair value through profit or loss are included within net trading income shown in note 7.
In determining the disaggregation of fees and commissions the Group has considered how the nature, amount, timing and uncertainty of revenue and cash flows are affected by economic factors, including those that are impacted by climate-related factors. It has determined that the above disaggregation by product type provides useful information that does not aggregate items that have substantially different characteristics and is not too detailed.
At 31 December 2023, the Group held on its balance sheet £163 million (31 December 2022: £173 million) in respect of services provided to customers and £69 million (31 December 2022: £74 million) in respect of amounts received from customers for services to be provided after the balance sheet date. Current unsatisfied performance obligations amount to £172 million (31 December 2022: £149 million); the Group expects to receive substantially all of this revenue by 2025.
Income recognised during the year included £32 million (2022: £8 million) in respect of amounts included in the contract liability balance at the start of the year and £2 million (2022: £1 million) in respect of amounts from performance obligations satisfied in previous years.
The most significant performance obligations undertaken by the Group are in respect of current accounts, the provision of other banking services for commercial customers and credit and debit card services.
In respect of current accounts, the Group receives fees for the provision of bank account and transaction services such as ATM services, fund transfers, overdraft facilities and other value-added offerings.
For commercial customers, alongside its provision of current accounts, the Group provides other corporate banking services including factoring and commitments to provide loan financing. Loan commitment fees are included in fees and commissions where the loan is not expected to be drawn down by the customer.
The Group receives interchange and merchant fees, together with fees for overseas use and cash advances, for provision of card services to cardholders and merchants.
Note 7: Net trading income (losses)
| | | | | | | | | | | | | | | | | |
| 2023 £m | | 2022 £m | | 2021 £m |
| Net gains (losses) on financial assets and liabilities at fair value through profit or loss: | | | | | |
Net gains (losses) on financial instruments held for trading1 | 406 | | | (1,049) | | | 141 | |
| Net gains (losses) on other financial instruments mandatorily held at fair value through profit or loss | 16,653 | | | (17,210) | | | 15,943 | |
Net losses on financial liabilities designated at fair value through profit or loss2 | (341) | | | (154) | | | (65) | |
| 16,718 | | | (18,413) | | | 16,019 | |
| Foreign exchange | 1,418 | | | (1,063) | | | 606 | |
| Investment property (losses) gains (note 27) | (87) | | | (511) | | | 575 | |
| Net trading income (losses) | 18,049 | | | (19,987) | | | 17,200 | |
1 Includes hedge ineffectiveness in respect of fair value hedges (2023: loss of £267 million; 2022: loss of £41 million; 2021: gain of £177 million) and cash flow hedges (2023: gain of £19 million; 2022: loss of £10 million; 2021: loss of £69 million).
2 Excludes gains and losses arising from non-participating investment contracts, which are presented separately on the face of the income statement.
| | | | | | | | |
F-33 | Lloyds Banking Group plc Annual Report on Form 20-F 2023 | |
Notes to the consolidated financial statements continued
for the year ended 31 December
Note 8: Insurance premium income
| | | | | |
| 2021 £m |
| Life | |
| Gross premiums: | |
| Life and pensions, excluding annuities | 7,515 | |
| Annuities | 531 | |
| 8,046 | |
| Ceded reinsurance premiums | (376) | |
| Net earned premiums | 7,670 | |
| |
| Non-life | |
| Net earned premiums | 613 | |
| Total insurance premium income | 8,283 | |
Note 9: Insurance revenue
| | | | | | | | | | | | | |
| 2023 £m | | 2022 £m | | |
| Life | | | | | |
| Amounts relating to the changes in liabilities for remaining coverage: | | | | | |
| CSM recognised for services provided | 329 | | | 245 | | | |
| Change in risk adjustments for non-financial risk for risk expired | 84 | | | 103 | | | |
| Expected incurred claims and other insurance services expenses | 1,907 | | | 1,696 | | | |
| Charges (credits) to funds in respect of policyholder tax and other | 87 | | | (228) | | | |
| 2,407 | | | 1,816 | | | |
Recovery of insurance acquisition cash flows1 | 87 | | | 86 | | | |
| Total life | 2,494 | | | 1,902 | | | |
| | | | | |
| Non-life | | | | | |
| Total non-life | 514 | | | 559 | | | |
| Total insurance revenue | 3,008 | | | 2,461 | | | |
1 During 2022, acquisition costs of £383 million related to contracts modified and derecognised in the year were excluded from both the amortisation of insurance acquisition cash flows and the recovery of insurance acquisition cash flows as there were no insurance contract services arising from the derecognition upon contract modification.
Note 10: Insurance service expense
| | | | | | | | | | | | | | | | | | | | | | | | | | | | | | | | | | | |
| 2023 | | 2022 |
| Life
£m | | Non-life
£m | | Total
£m | | Life
£m | | Non-life
£m | | Total
£m |
Incurred claims and other directly attributable expenses1 | 1,897 | | | 448 | | | 2,345 | | | 1,751 | | | 475 | | | 2,226 | |
Changes that relate to past service: adjustment to liabilities
for incurred claims | – | | | 3 | | | 3 | | | – | | | 57 | | | 57 | |
Changes that relate to future service: losses and reversal of losses on onerous contracts2 | (58) | | | (1) | | | (59) | | | 1,486 | | | 2 | | | 1,488 | |
Amortisation of insurance acquisition cash flows3 | 88 | | | 30 | | | 118 | | | 85 | | | (7) | | | 78 | |
| Net impairment loss on insurance acquisition assets | 7 | | | – | | | 7 | | | 14 | | | – | | | 14 | |
| Total insurance service expense | 1,934 | | | 480 | | | 2,414 | | | 3,336 | | | 527 | | | 3,863 | |
1 Included weather-related claims of £57 million (2022: £116 million), of which £51 million (2022: £108 million) was related to severe weather events.
2 During 2022, the Group enhanced its existing longstanding and workplace pension business through the addition of a drawdown feature. The Group applied judgement to determine that if the drawdown feature had been included in the contract terms at inception, the modified contracts would have had a substantially different contract boundary. As a result, the existing contracts were derecognised and the modified contracts recognised as new contracts. Judgement was also applied in determining the premium that would have been charged had the Group entered into a contract with the new contracts’ terms at the date of modification. The contracts were modified throughout 2022, in line with the dates of policyholder communication of enhanced benefits. The Group recognised a charge to its 2022 income statement of £1,242 million comprising:
–The Group derecognised existing CSM relating to contracts modified of £399 million and recognised CSM of £1,730 million relating to the new contracts recognised. During 2022, the CSM increased by £1,331 million and will be released to the income statement, in line with service provided. The new CSM is larger than the previously existing CSM as (i) there were no acquisition costs incurred following modification, and (ii) the CSM for those contracts that were originally recognised prior to 1 January 2016 was previously calculated using the fair value approach on transition
–The new CSM also included additional future profit of £89 million expected to emerge from the addition of a drawdown feature, as a result of the increase in the expected length of the contract services period for this business. There has been an equivalent change in the fulfilment cash flows arising upon contract modification
3 During 2022, acquisition costs of £383 million related to contracts modified and derecognised in the year were excluded from both the amortisation of insurance acquisition cash flows and the recovery of insurance acquisition cash flows as there were no insurance contract services arising from the derecognition upon contract modification.
| | | | | | | | |
F-34 | Lloyds Banking Group plc Annual Report on Form 20-F 2023 | |
Notes to the consolidated financial statements continued
for the year ended 31 December
Note 11: Other operating income
| | | | | | | | | | | | | | | | | |
| 2023 £m | | 20221 £m | | 2021 £m |
| Operating lease rental income | 1,383 | | | 1,077 | | | 1,059 | |
| Rental income from investment properties (note 27) | 146 | | | 145 | | | 186 | |
Net gains (losses) on disposal of financial assets at fair value through other comprehensive
income (note 43) | 122 | | | 92 | | | (2) | |
| Movement in value of in-force business | | | | | (70) | |
| Liability management | – | | | (31) | | | (22) | |
| | | | | |
| Share of results of joint ventures and associates | (16) | | | 10 | | | 2 | |
| Other | (4) | | | 46 | | | 19 | |
| Total other operating income | 1,631 | | | 1,339 | | | 1,172 | |
1 Restated for the adoption of IFRS 17; see notes 1 and 54.
Note 12: Insurance claims
| | | | | |
| 2021 £m |
| Life insurance and participating investment contracts | |
| Deaths | (790) | |
| |
| |
| Maturities including surrenders | (6,915) | |
| Annuities | (1,194) | |
| Other | (164) | |
| Gross claims and surrenders | (9,063) | |
| Change in insurance and participating investment contracts | (7,474) | |
| (16,537) | |
| Non-participating investment contracts | |
| Change in non-participating investment contracts | (4,581) | |
| (21,118) | |
Reinsurers’ share1 | 285 | |
| (20,833) | |
| Change in unallocated surplus | 35 | |
| Total life insurance and investment contracts | (20,798) | |
| Non-life insurance | |
| |
| |
| Total non-life insurance claims, net of reinsurance | (322) | |
| Total insurance claims and changes in insurance and investment contract liabilities | (21,120) | |
1 Reinsurers’ share comprises a charge of £5 million in respect of contracts classified as financial assets at fair value through profit or loss and a credit of £290 million in respect of contracts classified as reinsurance contracts.
Total non-life insurance claims, net of reinsurance, in 2021 included weather-related claims of £30 million, of which £11 million was related to severe weather events.
| | | | | | | | |
F-35 | Lloyds Banking Group plc Annual Report on Form 20-F 2023 | |
Notes to the consolidated financial statements continued
for the year ended 31 December
Note 13: Net investment return on assets held to back insurance and participating investment contracts and net insurance finance (expense) income
| | | | | | | | | | | | | | | | | | | | | | | | | | | | | | | | | | | |
| 2023 | | 2022 |
| Life
£m | | Non-life
£m | | Total
£m | | Life
£m | | Non-life
£m | | Total
£m |
| Net gains (losses) on financial assets and liabilities at fair value through profit or loss | 11,218 | | | 35 | | | 11,253 | | | (14,876) | | | 9 | | | (14,867) | |
| Foreign exchange | 542 | | | – | | | 542 | | | (1,039) | | | – | | | (1,039) | |
| Investment property losses | (4) | | | – | | | (4) | | | (3) | | | – | | | (3) | |
Net investment return on assets held to back insurance and participating investment contracts (memorandum item)1 | 11,756 | | | 35 | | | 11,791 | | | (15,918) | | | 9 | | | (15,909) | |
| | | | | | | | | | | |
| Changes in fair value of underlying items of direct participating contracts | (10,293) | | | – | | | (10,293) | | | 11,212 | | | – | | | 11,212 | |
| Effects of risk mitigation option | 172 | | | – | | | 172 | | | (118) | | | – | | | (118) | |
| Interest accreted | (874) | | | (6) | | | (880) | | | (350) | | | (2) | | | (352) | |
| Effect of changes in interest rates and other financial assumptions | (654) | | | – | | | (654) | | | 5,226 | | | – | | | 5,226 | |
| Effect of changes in fulfilment cash flows at current rates when CSM is unlocked at locked-in rates | (80) | | | – | | | (80) | | | (20) | | | – | | | (20) | |
| | | | | | | | | | | |
| Net finance (expense) income from insurance and participating investment contracts | (11,729) | | | (6) | | | (11,735) | | | 15,950 | | | (2) | | | 15,948 | |
| | | | | | | | | | | |
| Net finance income (expense) from reinsurance contracts held | 51 | | | – | | | 51 | | | (55) | | | – | | | (55) | |
| | | | | | | | | | | |
| Net finance (expense) income from insurance, participating investment and reinsurance contracts | (11,678) | | | (6) | | | (11,684) | | | 15,895 | | | (2) | | | 15,893 | |
1 Net investment return on assets held to back insurance and participating investment contracts is reported within net trading income (losses) on the face of the Group’s income statement; includes income of £10,200 million (2022: loss of £11,081 million) in respect of unit-linked and with-profit contracts measured applying the variable fee approach. The assets generating the investment return held to back insurance and participating investment contracts are carried at fair value on the Group’s balance sheet.
Note 14: Operating expenses
| | | | | | | | | | | | | | | | | |
| 2023 £m | | 2022 £m | | 2021 £m |
| Staff costs: | | | | | |
Salaries and social security costs1 | 3,651 | | | 3,310 | | | 3,048 | |
| Pensions and other retirement benefit schemes (note 16) | 355 | | | 455 | | | 538 | |
| Restructuring and other staff costs | 487 | | | 307 | | | 299 | |
| 4,493 | | | 4,072 | | | 3,885 | |
Premises and equipment costs2 | 449 | | | 332 | | | 261 | |
Depreciation and amortisation3 | 2,905 | | | 2,396 | | | 2,825 | |
| Other expenses: | | | | | |
| UK bank levy | 150 | | | 148 | | | 132 | |
| Regulatory and legal provisions (note 38) | 675 | | | 255 | | | 1,300 | |
| Other | 2,720 | | | 2,556 | | | 2,397 | |
| 3,545 | | | 2,959 | | | 3,829 | |
| Operating expenses before adjustment for: | 11,392 | | | 9,759 | | | 10,800 | |
| Amounts attributable to the acquisition of insurance and participating investment contracts | (183) | | | (168) | | | |
| Amounts reported within insurance service expenses | (386) | | | (354) | | | |
| Total operating expenses | 10,823 | | | 9,237 | | | 10,800 | |
1 Including social security costs of £371 million (2022: £341 million; 2021: £308 million).
2 Net of profits on disposal of operating lease assets of £93 million (2022: £197 million; 2021: £249 million).
3 Including depreciation in respect of premises £110 million (2022: £114 million; 2021: £123 million), equipment £388 million (2022: £561 million; 2021: £779 million), operating lease assets £1,070 million (2022: £570 million; 2021: £709 million) and right-of-use assets £209 million (2022: £226 million; 2021: £228 million).
Average headcount
The average number of persons on a headcount basis employed by the Group during the year was as follows:
| | | | | | | | | | | |
| 2023 | 2022 | 2021 |
| UK | 65,390 | 62,587 | 64,250 |
| Overseas | 807 | 785 | 826 |
| Total | 66,197 | 63,372 | 65,076 |
| | | | | | | | |
F-36 | Lloyds Banking Group plc Annual Report on Form 20-F 2023 | |
Notes to the consolidated financial statements continued
for the year ended 31 December
Note 14: Operating expenses continued
Performance-based compensation
The tables below analyse the Group’s performance-based compensation costs between those relating to the current performance year and those relating to earlier years.
| | | | | | | | | | | | | | | | | | | | | | | |
| Performance-based
compensation expense | | Performance-based compensation expense
deferred until later years |
| 2023 £m | 2022 £m | 2021 £m | | 2023 £m | 2022 £m | 2021 £m |
| Awards made in respect of the year ended 31 December | 316 | | 349 | | 313 | | | 108 | | 128 | | 110 | |
| Awards made in respect of earlier years | 124 | | 109 | | 22 | | | 22 | | 20 | | 22 | |
| 440 | | 458 | | 335 | | | 130 | | 148 | | 132 | |
Performance-based awards expensed in 2023 include cash awards amounting to £169 million (2022: £144 million; 2021: £134 million).
Note 15: Share-based payments
Charge to the income statement
The charge to the income statement is set out below:
| | | | | | | | | | | | | | | | | |
| 2023 £m | | 2022 £m | | 2021 £m |
| Deferred bonus plan | 241 | | | 289 | | | 179 | |
| Executive and SAYE plans: | | | | | |
| Options granted in the year | 14 | | | 10 | | | 10 | |
| Options granted in prior years | 45 | | | 42 | | | 37 | |
| 59 | | | 52 | | | 47 | |
| Share plans: | | | | | |
| Shares granted in the year | 6 | | | 9 | | | 18 | |
| Shares granted in prior years | 22 | | | 26 | | | 24 | |
| 28 | | | 35 | | | 42 | |
Total charge to the income statement1 | 328 | | | 376 | | | 268 | |
1 Share-based payments impacted by partial consolidation of Group Performance Share into basic salary during 2023.
During the year ended 31 December 2023 the Group operated the following share-based payment schemes, all of which are mainly equity settled.
Group Performance Share plan
The Group operates a Group Performance Share plan that is part equity settled. Bonuses in respect of employee service in 2023 have been recognised in the charge in line with the proportion of the deferral period completed.
Save-As-You-Earn schemes
Eligible employees may enter into contracts through the Save-As-You-Earn (SAYE) schemes to save up to £500 per month and, at the expiry of a fixed term of three years, have the option to use these savings within six months of the expiry of the fixed term to acquire shares in the Group at a discounted price of no less than 90 per cent of the market price at the start of the invitation period.
Movements in the number of share options outstanding under the SAYE schemes are set out below:
| | | | | | | | | | | | | | | | | |
| 2023 | | 2022 |
| Number
of options | Weighted
average
exercise price
(pence) | | Number
of options | Weighted
average
exercise price
(pence) |
| Outstanding at 1 January | 1,256,918,075 | 31.30 | | | 1,180,563,291 | 30.63 | |
| Granted | 287,984,574 | 38.55 | | | 217,611,519 | 39.38 | |
| Exercised | (164,709,399) | 38.55 | | | (23,359,526) | 37.75 | |
| Forfeited | (12,862,726) | 31.78 | | | (20,961,259) | 29.20 | |
| Cancelled | (45,807,000) | 37.65 | | | (47,687,607) | 33.88 | |
| Expired | (10,318,376) | 38.25 | | | (49,248,343) | 46.29 | |
| Outstanding at 31 December | 1,311,205,148 | 31.70 | | | 1,256,918,075 | 31.30 | |
| Exercisable at 31 December | 410,368 | 39.87 | | | 263,302 | 47.92 | |
The weighted average share price at the time that the options were exercised during 2023 was £0.48 (2022: £0.49). The weighted average remaining contractual life of options outstanding at the end of the year was 1.58 years (2022: 1.88 years).
The weighted average fair value of SAYE options granted during 2023 was £0.09 (2022: £0.07). The fair values of the SAYE options have been determined using a standard Black-Scholes model.
| | | | | | | | |
F-37 | Lloyds Banking Group plc Annual Report on Form 20-F 2023 | |
Notes to the consolidated financial statements continued
for the year ended 31 December
Note 15: Share-based payments continued
Other share option plans
Executive Share Plans - buyout and retention awards
Share options may be granted to senior employees under the Lloyds Banking Group Executive Share Plan 2003, Lloyds Banking Group Executive Group Ownership Share Plan and Deferred Bonus Scheme 2021 specifically to facilitate recruitment (to compensate new recruits for any lost share awards), and also to make grants to key individuals for retention purposes. In some instances, grants may be made subject to individual performance conditions.
Participants are not entitled to any dividends paid during the vesting period.
| | | | | | | | | | | | | | | | | |
| 2023 | | 2022 |
| Number
of options | Weighted
average
exercise price
(pence) | | Number
of options | Weighted
average
exercise price
(pence) |
| Outstanding at 1 January | 20,466,471 | Nil | | 14,032,762 | Nil |
| Granted | 15,198,717 | Nil | | 10,278,224 | Nil |
| Exercised | (8,739,497) | Nil | | (3,333,322) | Nil |
| Vested | (765,247) | Nil | | – | Nil |
| Forfeited | (8,216) | Nil | | (33,409) | Nil |
| Lapsed | (20,973) | Nil | | (477,784) | Nil |
| Outstanding at 31 December | 26,131,255 | Nil | | 20,466,471 | Nil |
| Exercisable at 31 December | 1,148,770 | Nil | | 1,638,202 | Nil |
The weighted average fair value of options granted in the year was £0.41 (2022: £0.44). The fair values of options granted have been determined using a standard Black-Scholes model. The weighted average share price at the time that the options were exercised during 2023 was £0.46 (2022: £0.46). The weighted average remaining contractual life of options outstanding at the end of the year was 6.3 years (2022: 6.0 years).
Included in the above are awards to the Group Chief Executive.
William Chalmers joined the Group on 3 June 2019 and was appointed as Chief Financial Officer on 1 August 2019. He was granted deferred share awards over 4,086,632 shares, to replace unvested awards from his former employer, Morgan Stanley, that were forfeited as a result of him joining the Group. The final tranche was exercised in 2022 and no options were outstanding for 2023.
| | | | | | | | |
| 2023 Number of shares | 2022 Number of shares |
| Outstanding at 1 January | – | 686,085 |
| | |
| Exercised | – | (686,085) |
| Outstanding at 31 December | – | – |
Charlie Nunn joined the Group on 16 August 2021 as Group Chief Executive. He was granted deferred share awards over 8,301,708 shares to replace unvested awards from his former employer, HSBC, that were forfeited as a result of him joining the Group.
| | | | | | | | |
| 2023 Number of shares | 2022 Number of shares |
| Outstanding at 1 January | 6,585,447 | 7,444,787 |
| | |
| Exercised | (1,247,548) | (859,340) |
| Outstanding at 31 December | 5,337,899 | 6,585,447 |
Other share plans
Lloyds Banking Group Executive Group Ownership Share Plan
The plan, introduced in 2006, is aimed at delivering shareholder value by linking the receipt of shares to an improvement in the performance of the Group over a three-year period. Awards are made within limits set by the rules of the plan, with the limits determining the maximum number of shares that can be awarded equating to three times annual salary. In exceptional circumstances this may increase to four times annual salary.
At the end of the performance period for the 2021 grant, the targets had not been fully met and therefore these awards vested in 2023 at a rate of 43.70 per cent.
The Executive Group Ownership awards were replaced by Long Term Share Plan awards in 2021.
| | | | | | | | |
| 2023 Number of shares | 2022 Number of shares |
| Outstanding at 1 January | 202,394,509 | 350,873,627 |
| | |
| Vested | (66,555,435) | (50,703,778) |
| Forfeited | (96,034,781) | (98,741,356) |
| Dividend award | – | 966,016 |
| Outstanding at 31 December | 39,804,293 | 202,394,509 |
| | | | | | | | |
F-38 | Lloyds Banking Group plc Annual Report on Form 20-F 2023 | |
Notes to the consolidated financial statements continued
for the year ended 31 December
Note 15: Share-based payments continued
Lloyds Banking Group Long Term Share Plan
The plan, introduced in 2021, replaced the Executive Group Ownership Share Plan and is intended to provide alignment to the Group’s aim of delivering sustainable returns to shareholders, supported by its values and behaviours.
The awards in respect of the 2021 grant are due to vest in 2024 at a rate of 100 per cent.
| | | | | | | | |
| 2023 Number of shares | 2022 Number of shares |
| Outstanding at 1 January | 171,947,743 | 77,883,068 |
| Granted | 108,551,439 | 108,513,202 |
| | |
| Forfeited | (18,089,793) | (14,448,527) |
| | |
| Outstanding at 31 December | 262,409,389 | 171,947,743 |
The weighted average fair value of awards granted in the year was £0.42 (2022: £0.36).
Assumptions at 31 December 2023
The fair value calculations at 31 December 2023 for grants made in the year, using Black-Scholes models and Monte Carlo simulation, are based on the following assumptions:
| | | | | | | | | | | | |
| SAYE | Executive
Share Plans | Long Term Share Plan | |
| Weighted average risk-free interest rate | 4.52% | 4.36% | 3.71% | |
| Weighted average expected life | 3.3 years | 1.9 years | 3.6 years | |
| Weighted average expected volatility | 28% | 30% | 34% | |
| Weighted average expected dividend yield | 6.0% | 6.0% | 6.0% | |
| Weighted average share price | £0.44 | £0.46 | £0.52 | |
| Weighted average exercise price | £0.39 | Nil | Nil | |
Expected volatility is a measure of the amount by which the Group’s shares are expected to fluctuate during the life of an option. The expected volatility is estimated based on the historical volatility of the closing daily share price over the most recent period that is commensurate with the expected life of the option. The historical volatility is compared to the implied volatility generated from market traded options in the Group’s shares to assess the reasonableness of the historical volatility and adjustments made where appropriate.
Share Incentive Plans
Matching shares
The Group undertakes to match shares purchased by employees up to the value of £45 per month; these matching shares are held in trust for a mandatory period of three years on the employee’s behalf, during which period the employee is entitled to any dividends paid on such shares. The award is subject to a non-market based condition: if an employee leaves within this three-year period for other than a ‘good’ reason, all of the matching shares are forfeited. Similarly, if the employees sell their purchased shares within three years, their matching shares are forfeited.
The number of shares awarded relating to matching shares in 2023 was 43,945,238 (2022: 43,378,504), with an average fair value of £0.46 (2022: £0.45), based on market prices at the date of award.
Fixed share awards
Fixed share awards were introduced in 2014 in order to ensure that total fixed remuneration is commensurate with role and to provide a competitive reward package for certain Lloyds Banking Group employees, with an appropriate balance of fixed and variable remuneration, in line with regulatory requirements. The fixed share awards are delivered in Lloyds Banking Group plc shares, and were initially released over five years with 20 per cent being released each year following the year of award. From June 2020, the fixed share awards are released over three years with one third being released each year following the year of award. The number of shares purchased in relation to fixed share awards in 2023 was 1,790,243 (2022: 7,261,080) with an average fair value of £0.46 (2022: £0.47) based on market prices at the date of the award.
The fixed share award is not subject to any performance conditions, performance adjustment or clawback. On an employee leaving the Group, there is no change to the timeline for which shares will become unrestricted.
Since the beginning of 2023 the number of recipients of these awards has been reduced to the executive directors only.
Free shares
An award of shares may be made annually to employees up to a maximum of £3,600. The shares awarded are held in trust for a mandatory period of three years on the employee’s behalf, during which period the employee is entitled to any dividends paid on such shares. The award is subject to a non-market based condition. If an employee leaves the Group within this three-year period for other than a ‘good’ reason, all of the shares awarded will be forfeited.
There have not been any awards made since 2021.
| | | | | | | | |
F-39 | Lloyds Banking Group plc Annual Report on Form 20-F 2023 | |
Notes to the consolidated financial statements continued
for the year ended 31 December
Note 16: Retirement benefit obligations
Critical accounting judgements and key sources of estimation uncertainty
| | | | | |
| Key sources of estimation uncertainty: | Discount rate applied to future cash flows |
| Expected lifetime of the schemes’ members |
| Expected rate of future inflationary increases |
The net asset recognised in the balance sheet at 31 December 2023 in respect of the Group’s defined benefit pension scheme obligations was £3,532 million, comprising an asset of £3,624 million and a liability of £92 million (2022: a net asset of £3,732 million comprising an asset of £3,823 million and a liability of £91 million). The Group’s accounting policy for its defined benefit pension scheme obligations is set out in note 2(K).
Income statement and balance sheet sensitivities to changes in the key sources of estimation uncertainty and other actuarial assumptions are provided in part (v).
| | | | | | | | | | | |
| 2023 £m | 2022 £m | 2021 £m |
| (Credit) charge to the income statement | | | |
| Defined benefit pension schemes | (80) | | 123 | | 234 | |
| Other retirement benefit schemes | 1 | | 2 | | 2 | |
| Total defined benefit schemes | (79) | | 125 | | 236 | |
| Defined contribution pension schemes | 434 | | 330 | | 302 | |
| Total charge to the income statement (note 14) | 355 | | 455 | | 538 | |
| | | | | | | | |
| 2023 £m | 2022 £m |
| Amounts recognised in the balance sheet | | |
| Retirement benefit assets | 3,624 | | 3,823 | |
| Retirement benefit obligations | (136) | | (126) | |
| Total amounts recognised in the balance sheet | 3,488 | | 3,697 | |
The total amounts recognised in the balance sheet relate to:
| | | | | | | | |
| 2023 £m | 2022 £m |
| Defined benefit pension schemes | 3,532 | | 3,732 | |
| Other retirement benefit schemes | (44) | | (35) | |
| Total amounts recognised in the balance sheet | 3,488 | | 3,697 | |
Pension schemes
Defined benefit schemes
(i) Characteristics of and risks associated with the Group’s schemes
The Group has established a number of defined benefit pension schemes in the UK and overseas. All significant schemes are based in the UK, with the three most significant being the main sections of the Lloyds Bank Pension Scheme No. 1, the Lloyds Bank Pension Scheme No. 2 and the HBOS Final Salary Pension Scheme. At 31 December 2023, these schemes represented 94 per cent of the Group’s total gross defined benefit pension assets (2022: 94 per cent). These schemes provide retirement benefits calculated as a proportion of final pensionable salary depending upon the length of pensionable service; the minimum retirement age under the rules of the schemes at 31 December 2023 is generally 55, although certain categories of member are deemed to have a protected right to retire at 50.
The Group operates both funded and unfunded pension arrangements; the majority, including the three most significant schemes, are funded schemes in the UK. All of these UK funded schemes are operated as separate legal entities under trust law, are in compliance with the Pensions Act 2004 and are managed by a Trustee Board (the Trustee) whose role is to ensure that their scheme is administered in accordance with the scheme rules and relevant legislation, and to safeguard the assets in the best interests of all members and beneficiaries. The Trustee is solely responsible for setting investment policy and for agreeing funding requirements with the employer through the funding valuation process. The Board of Trustees must be composed of representatives of the scheme membership along with a combination of independent and employer appointed trustees to comply with legislation and scheme rules.
A valuation to determine the funding status of each scheme is carried out at least every three years, whereby scheme assets are measured at market value and liabilities (technical provisions) are measured using prudent assumptions. If a deficit is identified a recovery plan is agreed between the employer and the scheme Trustee and sent to the Pensions Regulator for review. The Group does not provide for these deficit contributions as the future economic benefits arising from these contributions are expected to be available to the Group. The Group’s overseas defined benefit pension schemes are subject to local regulatory arrangements.
The Group has completed the triennial valuation of its main defined benefit pension schemes as at 31 December 2022. Following a fixed contribution of £800 million in the first half of 2023, a residual aggregate deficit of £250 million was agreed with the Trustee which the Group paid in December 2023. There will be no further deficit contributions, fixed or variable, for this triennial period (to 31 December 2025).
The deficit contributions are in addition to the regular contributions to meet benefits accruing over the year, and to cover the expenses of running the schemes. The Group expects to pay contributions of at least £0.1 billion to its defined benefit schemes in 2024.
| | | | | | | | |
F-40 | Lloyds Banking Group plc Annual Report on Form 20-F 2023 | |
Notes to the consolidated financial statements continued
for the year ended 31 December
Note 16: Retirement benefit obligations continued
During 2009, the Group made one-off contributions to the Lloyds Bank Pension Scheme No. 1 and Lloyds Bank Pension Scheme No. 2 in the form of interests in limited liability partnerships for each of the two schemes which hold assets to provide security for the Group’s obligations to the two schemes. At 31 December 2023, the limited liability partnerships held assets of £6.2 billion. The limited liability partnerships are consolidated fully in the Group’s balance sheet.
The Group has also established three private limited companies which hold assets to provide security for the Group’s obligations to the HBOS Final Salary Pension Scheme, a section of the Lloyds Bank Pension Scheme No. 1 and the Lloyds Bank Offshore Pension Scheme. At 31 December 2023 these held assets of £4.1 billion in aggregate. The private limited companies are consolidated fully in the Group’s balance sheet. The terms of these arrangements require the Group to maintain assets in these vehicles to agreed minimum values in order to secure obligations owed to the relevant Group pension schemes. The Group has satisfied this requirement during 2023.
The last funding valuations of other Group schemes were carried out on a number of different dates. In order to report the position under IAS 19 as at 31 December 2023, the most recent valuation results for all schemes have been updated by qualified independent actuaries. The funding valuations use a more prudent approach to setting the discount rate and more conservative longevity and inflation assumptions than the IAS 19 valuations.
In a judgment in 2018, the High Court confirmed the requirement to equalise the Guaranteed Minimum Pension (GMP) benefits of men and women accruing between 1990 and 1997 from contracting out of the State Earnings Related Pension Scheme. The Group recognised a past service cost of £108 million in respect of equalisation in 2018 and, following agreement of the detailed implementation approach with the Trustee, a further £33 million was recognised in 2019. A further hearing was held during 2020 which confirmed the extent of the Trustee’s obligation to revisit past transfers out of the schemes. The amount of any additional liability as a result of this judgment is not considered likely to be material.
The Group is aware of the High Court ruling in the case of Virgin Media Ltd v NTL Pension Trustees II Ltd & Ors and is waiting for the outcome of the appeal, scheduled for 25 June 2024, and any additional hearings, as well as confirmation from the Government as to whether it will issue new regulations in response to this issue.
(ii) Amounts in the financial statements
| | | | | | | | |
| 2023 £m | 2022 £m |
| Amount included in the balance sheet | | |
| Present value of funded obligations | (30,201) | | (28,965) | |
| Fair value of scheme assets | 33,733 | | 32,697 | |
| Net amount recognised in the balance sheet | 3,532 | | 3,732 | |
| | | | | | | | |
| 2023 £m | 2022 £m |
| Net amount recognised in the balance sheet | | |
| At 1 January | 3,732 | | 4,404 | |
| Net defined benefit pension credit (charge) | 80 | | (123) | |
| Actuarial (losses) gains on defined benefit obligation | (1,304) | | 17,222 | |
| Return on plan assets | (318) | | (20,302) | |
| Employer contributions | 1,342 | | 2,530 | |
| Exchange and other adjustments | – | | 1 | |
| At 31 December | 3,532 | | 3,732 | |
| | | | | | | | |
| 2023 £m | 2022 £m |
| Movements in the defined benefit obligation | | |
| At 1 January | (28,965) | | (47,130) | |
| Current service cost | (88) | | (180) | |
| Interest expense | (1,394) | | (902) | |
| Remeasurements: | | |
| Actuarial gains – demographic assumptions | 153 | | 288 | |
| Actuarial losses – experience | (1,067) | | (1,186) | |
| Actuarial (losses) gains – financial assumptions | (390) | | 18,120 | |
| Benefits paid | 1,544 | | 2,048 | |
| Past service cost | (5) | | (4) | |
| Settlements | – | | 13 | |
| Exchange and other adjustments | 11 | | (32) | |
| At 31 December | (30,201) | | (28,965) | |
| | | | | | | | |
F-41 | Lloyds Banking Group plc Annual Report on Form 20-F 2023 | |
Notes to the consolidated financial statements continued
for the year ended 31 December
Note 16: Retirement benefit obligations continued
| | | | | | | | |
| 2023 £m | 2022 £m |
| Analysis of the defined benefit obligation | | |
| Active members | (2,955) | | (3,088) | |
| Deferred members | (8,438) | | (8,515) | |
| Dependants | (1,572) | | (1,349) | |
| Pensioners | (17,236) | | (16,013) | |
| At 31 December | (30,201) | | (28,965) | |
| | | | | | | | |
| 2023 £m | 2022 £m |
| Changes in the fair value of scheme assets | | |
| At 1 January | 32,697 | | 51,534 | |
| Return on plan assets excluding amounts included in interest income | (318) | | (20,302) | |
| Interest income | 1,602 | | 997 | |
| Employer contributions | 1,342 | | 2,530 | |
| Benefits paid | (1,544) | | (2,048) | |
| Settlements | – | | (13) | |
| Administrative costs paid | (35) | | (34) | |
| Exchange and other adjustments | (11) | | 33 | |
| At 31 December | 33,733 | | 32,697 | |
The (credit) expense recognised in the income statement for the year ended 31 December comprises:
| | | | | | | | | | | |
| 2023 £m | 2022 £m | 2021 £m |
| Current service cost | 88 | | 180 | | 213 | |
| Net interest amount | (208) | | (95) | | (29) | |
| | | |
| Settlements | – | | – | | 1 | |
| Past service cost – plan amendments | 5 | | 4 | | 11 | |
| Plan administration costs incurred during the year | 35 | | 34 | | 38 | |
| Total defined benefit pension (credit) expense | (80) | | 123 | | 234 | |
(iii) Composition of scheme assets
| | | | | | | | | | | | | | | | | | | | | | | | | | | | | | | | | | | |
| 2023 | | 2022 |
| Quoted
£m | | Unquoted
£m | | Total
£m | | Quoted
£m | | Unquoted
£m | | Total
£m |
Debt instruments1: | | | | | | | | | | | |
| Fixed interest government bonds | 5,657 | | | – | | | 5,657 | | | 3,007 | | | – | | | 3,007 | |
| Index-linked government bonds | 16,105 | | | – | | | 16,105 | | | 15,497 | | | – | | | 15,497 | |
| Corporate and other debt securities | 7,305 | | | – | | | 7,305 | | | 3,978 | | | – | | | 3,978 | |
| Asset-backed securities | 4 | | | – | | | 4 | | | – | | | – | | | – | |
| 29,071 | | | – | | | 29,071 | | | 22,482 | | | – | | | 22,482 | |
| Pooled investment vehicles | 613 | | | 8,361 | | | 8,974 | | | 2,730 | | | 15,863 | | | 18,593 | |
| Property | – | | | 97 | | | 97 | | | – | | | 116 | | | 116 | |
| Equity instruments | 23 | | | 62 | | | 85 | | | 7 | | | 47 | | | 54 | |
| Money market instruments, cash, derivatives and other assets and liabilities | 466 | | | (4,960) | | | (4,494) | | | 1,069 | | | (9,617) | | | (8,548) | |
| At 31 December | 30,173 | | | 3,560 | | | 33,733 | | | 26,288 | | | 6,409 | | | 32,697 | |
1 Of the total debt instruments, £26,777 million (2022: £20,369 million) were investment grade (credit ratings equal to or better than ‘BBB’).
The assets of all of the funded plans are held independently of the Group’s assets in separate trustee-administered funds.
| | | | | | | | |
F-42 | Lloyds Banking Group plc Annual Report on Form 20-F 2023 | |
Notes to the consolidated financial statements continued
for the year ended 31 December
Note 16: Retirement benefit obligations continued
The pension schemes’ pooled investment vehicles comprise:
| | | | | | | | |
| 2023 £m | 2022 £m |
| Alternative credit funds | 1,962 | | 2,222 | |
| Bond and debt funds | 571 | | 354 | |
| Equity funds | 1,674 | | 1,421 | |
| Hedge and mutual funds | 808 | | 240 | |
| Infrastructure funds | 1,147 | | 1,193 | |
| Liquidity funds | 1,585 | | 11,527 | |
| Property funds | 1,227 | | 1,604 | |
| Other | – | | 32 | |
| At 31 December | 8,974 | | 18,593 | |
The Trustee’s approach to investment is focused on acting in the members’ best financial interests, with the integration of ESG (environmental, social and governance) considerations into investment management processes and practices. This policy is reviewed annually (or more frequently as required) and has been shared with the schemes’ investment managers for implementation.
Climate change is one of the risks the schemes manage given its potential financial impact on valuation of assets.
(iv) Assumptions
The principal actuarial and financial assumptions used in valuations of the defined benefit pension schemes were as follows:
| | | | | | | | |
| 2023 % | 2022 % |
| Discount rate | 4.70 | | 4.93 | |
| Rate of inflation: | | |
| Retail Price Index (RPI) | 2.96 | | 3.13 | |
| Consumer Price Index (CPI) | 2.47 | | 2.69 | |
| Rate of salary increases | 0.00 | | 0.00 | |
| Weighted average rate of increase for pensions in payment | 2.73 | | 2.84 | |
On 25 November 2020 the Chancellor of the Exchequer announced the outcome of a consultation into a reform of the calculation of RPI. It is now expected that from 2030 RPI will be aligned with CPIH (the Consumer Price Index including owner occupiers’ housing costs). To determine the RPI assumption a term-dependent inflation curve has been used adjusting for an assumed inflation risk premium. A gap of 130 basis points has been assumed between RPI and CPI in 2024 reducing to 120 basis points in 2025, 110 basis points in 2026 and 100 basis points from 2027 to 2030; thereafter a 10 basis point gap has been assumed.
| | | | | | | | | | | | | | | | | |
| Men | | Women |
| 2023 Years | 2022 Years | | 2023 Years | 2022 Years |
| Life expectancy for member aged 60, on the valuation date | 26.7 | 26.7 | | 28.7 | 28.8 |
| Life expectancy for member aged 60, 15 years after the valuation date | 27.8 | 27.8 | | 29.8 | 30.0 |
The mortality assumptions used in the UK scheme valuations are based on standard tables published by the Institute and Faculty of Actuaries which were adjusted in line with the actual experience of the relevant schemes. The table shows that a member retiring at age 60 at 31 December 2023 is assumed to live for, on average, 26.7 years for a male and 28.7 years for a female. In practice there will be much variation between individual members but these assumptions are expected to be appropriate across all members. It is assumed that younger members will live longer in retirement than those retiring now. This reflects the expectation that mortality rates will continue to fall over time as medical science and standards of living improve. To illustrate the degree of improvement assumed, the table also shows the life expectancy for members aged 45 now, when they retire in 15 years time at age 60. The Group uses the CMI mortality projections model and in line with actuarial industry recommendations has placed no weight on 2020 and 2021 mortality experience and 25 per cent weight on 2022 mortality experience.
(v) Amount, timing and uncertainty of future cash flows
Risk exposure of the defined benefit schemes
While the Group is not exposed to any unusual, entity-specific or scheme-specific risks in its defined benefit pension schemes, it is exposed to a number of significant risks, detailed below:
Inflation rate risk: The majority of the plans’ benefit obligations are linked to inflation both in deferment and once in payment. Higher inflation will lead to higher liabilities although this will be materially offset by holdings of inflation-linked gilts and, in most cases, caps on the level of inflationary increases are in place to protect against extreme inflation.
Interest rate risk: The defined benefit obligation is determined using a discount rate derived from yields on AA-rated corporate bonds. A decrease in corporate bond yields will increase plan liabilities although this will be materially offset by an increase in the value of bond holdings and through the use of derivatives.
| | | | | | | | |
F-43 | Lloyds Banking Group plc Annual Report on Form 20-F 2023 | |
Notes to the consolidated financial statements continued
for the year ended 31 December
Note 16: Retirement benefit obligations continued
Longevity risk: The majority of the schemes’ obligations are to provide benefits for the life of the members so increases in life expectancy will result in an increase in the plans’ liabilities.
Investment risk: Scheme assets are invested in a diversified portfolio of debt securities, equities and other return-seeking assets. If the assets underperform the discount rate used to calculate the defined benefit obligation, it will reduce the surplus or increase the deficit. Volatility in asset values and the discount rate will lead to volatility in the net pension asset on the Group’s balance sheet and in other comprehensive income. To a lesser extent this will also lead to volatility in the pension expense in the Group’s income statement.
In addition, the schemes themselves are exposed to liquidity risk with the need to ensure that liquid assets held are sufficient to meet benefit payments as they fall due and there is sufficient collateral available to support their hedging activity.
The ultimate cost of the defined benefit obligations to the Group will depend upon actual future events rather than the assumptions made. The assumptions made are unlikely to be borne out in practice and as such the cost may be higher or lower than expected.
Sensitivity analysis
The effect of reasonably possible changes in key assumptions on the value of scheme liabilities and the resulting pension charge in the Group’s income statement and on the net defined benefit pension scheme asset, for the Group’s three most significant schemes, is set out below. The sensitivities provided assume that all other assumptions and the value of the schemes’ assets remain unchanged, and are not intended to represent changes that are at the extremes of possibility. The calculations are approximate in nature and full detailed calculations could lead to a different result. It is unlikely that isolated changes to individual assumptions will be experienced in practice. Due to the correlation of assumptions, aggregating the effects of these isolated changes may not be a reasonable estimate of the actual effect of simultaneous changes in multiple assumptions.
| | | | | | | | | | | | | | | | | |
| Effect of reasonably possible alternative assumptions |
| Increase (decrease) in the income statement charge | | (Increase) decrease in the
net defined benefit
pension scheme surplus |
| 2023 £m | 2022 £m | | 2023 £m | 2022 £m |
Inflation (including pension increases)1: | | | | | |
Increase of 0.1 per cent | 11 | | 13 | | | 224 | | 251 | |
Decrease of 0.1 per cent | (12) | | (13) | | | (235) | | (245) | |
Discount rate2: | | | | | |
Increase of 0.1 per cent | (22) | | (25) | | | (355) | | (379) | |
Decrease of 0.1 per cent | 21 | | 24 | | | 363 | | 388 | |
| Expected life expectancy of members: | | | | | |
Increase of one year | 45 | | 38 | | | 927 | | 745 | |
Decrease of one year | (46) | | (39) | | | (946) | | (762) | |
1 At 31 December 2023, the assumed rate of RPI inflation is 2.96 per cent and CPI inflation 2.47 per cent (2022: RPI 3.13 per cent and CPI 2.69 per cent).
2 At 31 December 2023, the assumed discount rate is 4.70 per cent (2022: 4.93 per cent).
Sensitivity analysis method and assumptions
The sensitivity analysis above reflects the impact on the liabilities of the Group’s three most significant schemes which account for over 90 per cent of the Group’s defined benefit obligations. While differences in the underlying liability profiles for the remainder of the Group’s pension arrangements mean that they may exhibit slightly different sensitivities to variations in these assumptions, the sensitivities provided above are indicative of the impact across the Group as a whole.
The inflation assumption sensitivity applies to the assumed rate of increase in both the Consumer Price Index (CPI) and the Retail Price Index (RPI), and includes the impact on the rate of increases to pensions, both before and after retirement. These pension increases are linked to inflation (either CPI or RPI) subject to certain minimum and maximum limits.
The sensitivity analysis (including the inflation sensitivity) does not include the impact of any change in the rate of salary increases as pensionable salaries have been frozen since 2 April 2014.
The life expectancy assumption has been applied by allowing for an increase/decrease in life expectation from age 60 of one year, based upon the approximate weighted average age for each scheme. While this is an approximate approach and will not give the same result as a one year increase in life expectancy at every age, it provides an appropriate indication of the potential impact on the schemes from changes in life expectancy.
There was no change in the methods and assumptions used in preparing the sensitivity analysis from the prior year.
| | | | | | | | |
F-44 | Lloyds Banking Group plc Annual Report on Form 20-F 2023 | |
Notes to the consolidated financial statements continued
for the year ended 31 December
Note 16: Retirement benefit obligations continued
Asset-liability matching strategies
The main schemes’ assets are invested in a diversified portfolio. Whilst c.50 per cent are held to generate the long-term returns required to support the funding position of the schemes, the remainder is invested in liability-driven investment (LDI) strategies which hedge the material risk exposures of the schemes. The investment strategy is not static and will evolve to reflect the structure of liabilities within the schemes. Specific strategies for each pension plan are independently determined by the responsible governance body for each scheme and in consultation with the employer.
A significant goal of the strategies adopted by the schemes is to reduce volatility caused by changes in market expectations of interest rates and inflation. In the main schemes, this is achieved by investing scheme assets in bonds, primarily fixed interest gilts and index linked gilts, and by entering into interest rate and inflation swap arrangements. The assets in these LDI strategies represented 50 per cent of scheme assets at 31 December 2023.
These investments are structured to take into account the profile of scheme liabilities and actively managed to reflect both changing market conditions and changes to the liability profile. At 31 December 2023 the asset-liability matching strategy mitigated c.117 per cent of the liability sensitivity to interest rate movements and c.125 per cent of the liability sensitivity to inflation movements. In addition, a small amount of interest rate sensitivity arises through holdings of corporate and other debt securities. The higher level of hedging provides greater protection to the funding position of the schemes.
On 28 January 2020, the main schemes entered into a £10 billion longevity insurance arrangement to hedge part of the schemes’ exposure to unexpected increases in life expectancy. This arrangement forms part of the schemes’ investment portfolio and will provide income to the schemes in the event that pensions are paid out for longer than expected. The transaction was structured as a pass-through with Scottish Widows as the insurer, and onwards reinsurance to Pacific Life Re Limited.
On 28 January 2022, the Lloyds Bank Pension Scheme No. 1 entered into an additional £5.5 billion longevity insurance arrangement. The transaction is structured as a pass-through with Scottish Widows as the insurer, and onwards reinsurance to SCOR SE – UK Branch.
At 31 December 2023 the value of scheme assets included £(160) million representing the value of the longevity swaps (after allowing for the impact on the IAS 19 liabilities of the revisions to the base mortality assumptions).
In total the schemes have now hedged c.30 per cent of their longevity risk exposure.
Maturity profile of defined benefit obligation
The following table provides information on the weighted average duration of the defined benefit pension obligation and the distribution and timing of benefit payments:
| | | | | | | | |
| 2023 Years | 2022 Years |
| Duration of the defined benefit obligation | 13 | 15 |
Maturity analysis of benefits expected to be paid:
| | | | | | | | |
| 2023 £m | 2022 £m |
| Within 12 months | 1,697 | | 1,409 | |
| Between 1 and 2 years | 1,513 | | 1,464 | |
| Between 2 and 5 years | 4,886 | | 4,678 | |
| Between 5 and 10 years | 9,159 | | 8,930 | |
| Between 10 and 15 years | 9,176 | | 9,296 | |
| Between 15 and 25 years | 16,882 | | 17,479 | |
| Between 25 and 35 years | 12,343 | | 12,720 | |
| Between 35 and 45 years | 6,121 | | 6,138 | |
| In more than 45 years | 1,595 | | 1,685 | |
Maturity analysis method and assumptions
The projected benefit payments are based on the assumptions underlying the assessment of the obligations, including allowance for expected future inflation. They are shown in their undiscounted form and therefore appear large relative to the discounted assessment of the defined benefit obligations recognised in the Group’s balance sheet. They are in respect of benefits that have been accrued prior to the respective year end date only and make no allowance for any benefits that may have been accrued subsequently.
Defined contribution schemes
The Group operates a number of defined contribution pension schemes in the UK and overseas, principally Your Tomorrow and the defined contribution sections of the Lloyds Bank Pension Scheme No. 1.
During the year ended 31 December 2023 the charge to the income statement in respect of defined contribution schemes was £434 million (2022: £330 million; 2021: £302 million), representing the contributions payable by the employer in accordance with each scheme’s rules.
| | | | | | | | |
F-45 | Lloyds Banking Group plc Annual Report on Form 20-F 2023 | |
Notes to the consolidated financial statements continued
for the year ended 31 December
Note 16: Retirement benefit obligations continued
Other retirement benefit schemes
The Group operates a number of schemes which provide post-retirement healthcare benefits to certain employees, retired employees and their dependants. The principal scheme relates to former Lloyds Bank staff and under this scheme the Group has undertaken to meet the cost of post-retirement healthcare for all eligible former employees (and their dependants) who retired prior to 1 January 1996. The Group has entered into an insurance contract to provide these benefits and a provision has been made for the estimated cost of future insurance premiums payable.
For the principal post-retirement healthcare scheme, the latest actuarial valuation of the liability was carried out at 31 December 2023 by qualified independent actuaries. The principal assumptions used were as set out above, except that the rate of increase in healthcare premiums has been assumed at 10.00 per cent (2022: 6.74 per cent).
Movements in the other retirement benefits obligation:
| | | | | | | | |
| 2023 £m | 2022 £m |
| At 1 January | (35) | | (103) | |
| Actuarial (losses) gains | (11) | | 68 | |
| Insurance premiums paid | 3 | | 3 | |
| Charge for the year | (1) | | (2) | |
| Exchange and other adjustments | – | | (1) | |
| At 31 December | (44) | | (35) | |
Note 17: Auditors’ remuneration
Fees payable to the Company’s auditors by the Group are as follows:
| | | | | | | | | | | | | | | | | |
| 2023 £m | | 2022 £m | | 2021 £m |
| Fees payable for the: | | | | | |
| – audit of the Company’s current year annual report | 2.0 | | | 1.9 | | | 1.8 | |
| – audits of the Company’s subsidiaries | 32.3 | | | 29.5 | | | 23.7 | |
– total audit fees in respect of the statutory audit of Group entities1 | 34.3 | | | 31.4 | | | 25.5 | |
| – services normally provided in connection with statutory and regulatory filings or engagements | 6.6 | | | 6.3 | | | 4.8 | |
Total audit fees2 | 40.9 | | | 37.7 | | | 30.3 | |
| | | | | |
Other audit-related fees2 | 1.3 | | | 1.5 | | | 0.5 | |
All other fees2 | 1.2 | | | 5.0 | | | 1.2 | |
Total non-audit services3 | 2.5 | | | 6.5 | | | 1.7 | |
| Total fees payable to the Company’s auditors by the Group | 43.4 | | | 44.2 | | | 32.0 | |
1 As defined by the Financial Reporting Council (FRC).
2 As defined by the Securities and Exchange Commission (SEC).
3 As defined by the SEC. Total non-audit services as defined by the FRC include all fees other than audit fees in respect of the statutory audit of Group entities. These fees totalled £9.1 million in 2023 (2022: £12.8 million; 2021: £6.5 million).
The following types of services are included in the categories listed above:
Audit fees: This category includes fees in respect of the audit of the Group’s annual financial statements (including work related to the adoption of new accounting standards) and other services in connection with regulatory filings. Other services supplied pursuant to legislation relate primarily to costs incurred in connection with client asset assurance and with the Sarbanes-Oxley Act requirements associated with the audit of the Group’s financial statements filed on its Form 20-F.
Other audit-related fees: This category includes fees in respect of services for assurance and related services that are reasonably related to the performance of the audit or review of the financial statements, for example acting as reporting accountants in respect of debt prospectuses required by the Listing Rules.
All other fees: This category includes other assurance services not related to the performance of the audit or review of the financial statements, for example, the review of controls operated by the Group on behalf of a third party. The auditors are not engaged to provide tax services.
It is the Group’s policy to use the auditors only on assignments in cases where their knowledge of the Group means that it is neither efficient nor cost effective to employ another firm of accountants.
The Group has procedures that are designed to ensure auditor independence, including prohibiting certain non-audit services. All audit and non-audit assignments must be pre-approved by the Audit Committee on an individual engagement basis; for certain types of non-audit engagements where the fee is ‘de minimis’ the Audit Committee has pre-approved all assignments subject to confirmation by management. On a quarterly basis, the Audit Committee receives and reviews a report detailing all pre-approved services and amounts paid to the auditors for such pre-approved services.
During the year, the auditors also earned fees payable by entities outside the consolidated Lloyds Banking Group in respect of the following:
| | | | | | | | | | | |
| 2023 £m | 2022 £m | 2021 £m |
| Audits of Group pension schemes | 0.5 | | 0.4 | | 0.4 | |
| Audits of the unconsolidated Open-Ended Investment Companies managed by the Group | 0.2 | | 0.2 | | 0.3 | |
| Reviews of the financial position of corporate and other borrowers | – | | – | | 0.3 | |
| | | | | | | | |
F-46 | Lloyds Banking Group plc Annual Report on Form 20-F 2023 | |
Notes to the consolidated financial statements continued
for the year ended 31 December
Note 18: Impairment
| | | | | | | | | | | | | | | | | | | | | | | | | | | | | |
| Year ended 31 December 2023 | Stage 1
£m | | Stage 2
£m | | Stage 3
£m | | POCI
£m | | Total
£m |
| In respect of: | | | | | | | | | |
| Loans and advances to banks | (5) | | | (2) | | | – | | | – | | | (7) | |
| Loans and advances to customers | 261 | | | (281) | | | 414 | | | (73) | | | 321 | |
| Debt securities | – | | | 1 | | | – | | | – | | | 1 | |
| Financial assets at amortised cost | 256 | | | (282) | | | 414 | | | (73) | | | 315 | |
| Other assets | – | | | – | | | (10) | | | – | | | (10) | |
| Impairment charge (credit) on drawn balances | 256 | | | (282) | | | 404 | | | (73) | | | 305 | |
| Loan commitments and financial guarantees | 27 | | | (25) | | | (2) | | | – | | | – | |
| Financial assets at fair value through other comprehensive income | (2) | | | – | | | – | | | – | | | (2) | |
| Total impairment charge (credit) | 281 | | | (307) | | | 402 | | | (73) | | | 303 | |
| | | | | | | | | | | | | | | | | | | | | | | | | | | | | |
| Year ended 31 December 2022 | Stage 1
£m | | Stage 2
£m | | Stage 3
£m | | POCI
£m | | Total
£m |
| In respect of: | | | | | | | | | |
| Loans and advances to banks | 12 | | | 2 | | | – | | | – | | | 14 | |
| Loans and advances to customers | (217) | | | 694 | | | 883 | | | (9) | | | 1,351 | |
| Debt securities | 7 | | | – | | | – | | | – | | | 7 | |
| Financial assets at amortised cost | (198) | | | 696 | | | 883 | | | (9) | | | 1,372 | |
| Other assets | – | | | – | | | 22 | | | – | | | 22 | |
| Impairment (credit) charge on drawn balances | (198) | | | 696 | | | 905 | | | (9) | | | 1,394 | |
| Loan commitments and financial guarantees | 24 | | | 99 | | | (1) | | | – | | | 122 | |
| Financial assets at fair value through other comprehensive income | 6 | | | – | | | – | | | – | | | 6 | |
| Total impairment (credit) charge | (168) | | | 795 | | | 904 | | | (9) | | | 1,522 | |
| | | | | | | | | | | | | | | | | | | | | | | | | | | | | |
| Year ended 31 December 2021 | Stage 1
£m | | Stage 2
£m | | Stage 3
£m | | POCI
£m | | Total
£m |
| In respect of: | | | | | | | | | |
| Loans and advances to banks | (5) | | | – | | | – | | | – | | | (5) | |
| Loans and advances to customers | (454) | | | (1,025) | | | 498 | | | (135) | | | (1,116) | |
| Debt securities | – | | | – | | | – | | | – | | | – | |
| Financial assets at amortised cost | (459) | | | (1,025) | | | 498 | | | (135) | | | (1,121) | |
| Other assets | – | | | – | | | 2 | | | – | | | 2 | |
| Impairment (credit) charge on drawn balances | (459) | | | (1,025) | | | 500 | | | (135) | | | (1,119) | |
| Loan commitments and financial guarantees | (102) | | | (146) | | | (9) | | | – | | | (257) | |
| Financial assets at fair value through other comprehensive income | (2) | | | – | | | – | | | – | | | (2) | |
| Total impairment (credit) charge | (563) | | | (1,171) | | | 491 | | | (135) | | | (1,378) | |
The impairment charge includes a £73 million charge (2022: £nil; 2021: release of £77 million) in respect of residual value impairment and voluntary terminations within the Group’s UK Motor Finance business.
| | | | | | | | |
F-47 | Lloyds Banking Group plc Annual Report on Form 20-F 2023 | |
Notes to the consolidated financial statements continued
for the year ended 31 December
Note 19: Tax
Analysis of tax expense for the year
| | | | | | | | | | | | | | | | | |
| 2023 £m | | 20221 £m | | 2021 £m |
| UK corporation tax: | | | | | |
| Current tax on profit for the year | (1,301) | | | (1,152) | | | (1,472) | |
| Adjustments in respect of prior years | 51 | | | 31 | | | 94 | |
| (1,250) | | | (1,121) | | | (1,378) | |
| Foreign tax: | | | | | |
| Current tax on profit for the year | (101) | | | (74) | | | (51) | |
| Adjustments in respect of prior years | 3 | | | (9) | | | 21 | |
| (98) | | | (83) | | | (30) | |
| Current tax expense | (1,348) | | | (1,204) | | | (1,408) | |
| | | | | |
| Deferred tax: | | | | | |
| Current year | (583) | | | 124 | | | 546 | |
| Adjustments in respect of prior years | (54) | | | 221 | | | (155) | |
| Deferred tax (expense) credit | (637) | | | 345 | | | 391 | |
| Tax expense | (1,985) | | | (859) | | | (1,017) | |
The tax expense is made up as follows:
| | | | | | | | | | | | | | | | | |
| | | | | |
| Tax credit (expense) attributable to policyholders | 30 | | | (54) | | | (163) | |
| Shareholder tax expense | (2,015) | | | (805) | | | (854) | |
| Tax expense | (1,985) | | | (859) | | | (1,017) | |
1 Restated for the adoption of IFRS 17; see notes 1 and 54.
Factors affecting the tax expense for the year
The UK corporation tax rate for the year was 23.5 per cent (2022: 19.0 per cent; 2021: 19.0 per cent). The increase in applicable tax rate from 2022 relates to the change in statutory tax rate effective from 1 April 2023. An explanation of the relationship between tax expense and accounting profit is set out below.
| | | | | | | | | | | |
| 2023 £m | 20221 £m | 2021 £m |
| Profit before tax | 7,503 | | 4,782 | | 6,902 | |
| UK corporation tax thereon | (1,763) | | (909) | | (1,311) | |
| Impact of surcharge on banking profits | (305) | | (339) | | (439) | |
| Non-deductible costs: conduct charges | (29) | | (5) | | (185) | |
| Non-deductible costs: bank levy | (35) | | (28) | | (22) | |
| Other non-deductible costs | (106) | | (70) | | (83) | |
| Non-taxable income | 80 | | 138 | | 40 | |
| Tax relief on coupons on other equity instruments | 124 | | 83 | | 81 | |
| Tax-exempt gains on disposals | 35 | | 67 | | 140 | |
| Tax losses where no deferred tax recognised | (2) | | 11 | | (1) | |
| Remeasurement of deferred tax due to rate changes | (14) | | 60 | | 954 | |
| Differences in overseas tax rates | 6 | | (63) | | (19) | |
| Policyholder tax | (61) | | (65) | | (63) | |
| Deferred tax asset in respect of life assurance expenses | 84 | | 21 | | (69) | |
| Adjustments in respect of prior years | – | | 243 | | (40) | |
| Tax effect of share of results of joint ventures | 1 | | (3) | | – | |
| Tax expense | (1,985) | | (859) | | (1,017) | |
1 Restated for the adoption of IFRS 17; see notes 1 and 54.
The tax impact of the IFRS 17 adjustments is recognised at the rate of tax at which it is expected to be realised. For 2022, this includes the impact of the transitional tax provisions to allow spreading of life companies’ profit or loss arising on transition to IFRS 17 over 10 years.
On 17 November 2022 the UK Government confirmed its intention to implement the G20-OECD Inclusive Framework Pillar 2 rules in the UK, including a Qualified Domestic Minimum Top-Up Tax rule. This legislation, which was enacted in 2023, will seek to ensure that UK-headquartered multinational enterprises pay a minimum tax rate of 15 per cent on UK and overseas profits arising after 31 December 2023. As the UK rate of corporation tax in 2024 will be 25 per cent, and the Group’s business is primarily in the UK, the impact of these rules on the Group is not expected to be material.
| | | | | | | | |
F-48 | Lloyds Banking Group plc Annual Report on Form 20-F 2023 | |
Notes to the consolidated financial statements continued
for the year ended 31 December
Note 19: Tax continued
Deferred tax
The Group’s deferred tax assets and liabilities are as follows:
| | | | | | | | | | | | | | | | | | | | |
| Statutory position | 2023 £m | 20221 £m | | Tax disclosure | 2023 £m | 20221 £m |
| Deferred tax assets | 5,185 | | 6,422 | | | Deferred tax assets | 7,409 | | 8,741 | |
| Deferred tax liabilities | (157) | | (209) | | | Deferred tax liabilities | (2,381) | | (2,528) | |
| Net deferred tax asset at 31 December | 5,028 | | 6,213 | | | Net deferred tax asset at 31 December | 5,028 | | 6,213 | |
1 Restated for the adoption of IFRS 17; see notes 1 and 54.
The statutory position reflects the deferred tax assets and liabilities as disclosed in the consolidated balance sheet and takes into account the ability of the Group to net assets and liabilities where there is a legally enforceable right of offset. The tax disclosure of deferred tax assets and liabilities ties to the amounts outlined in the tables below which splits the deferred tax assets and liabilities by type, before such netting.
Movements in deferred tax assets and liabilities (before taking into consideration the offsetting of balances within the same taxing jurisdiction) can be summarised as follows:
| | | | | | | | | | | | | | | | | | | | | | | | | | | | | | | | |
| Deferred tax assets | Tax
losses
£m | Property,
plant and
equipment
£m | Provisions
£m | Long-term assurance business1 £m | Share-
based
payments
£m | Pension
liabilities
£m | Derivatives
£m | Asset revaluations2 £m | Other
temporary
differences
£m | Total
£m |
| | | | | | | | | | |
| | | | | | | | | | |
| At 1 January 2022 | 5,023 | | 744 | | 302 | | – | | 38 | | 69 | | 700 | | – | | 219 | | 7,095 | |
| Credit (charge) to the income statement | 39 | | (238) | | 113 | | 114 | | (5) | | (22) | | (205) | | 8 | | 62 | | (134) | |
| Credit (charge) to other comprehensive income | – | | – | | (155) | | – | | – | | – | | 1,928 | | – | | – | | 1,773 | |
| Acquisitions | 4 | | – | | – | | – | | – | | – | | – | | – | | – | | 4 | |
| Other credit to equity | – | | – | | – | | – | | 3 | | – | | – | | – | | – | | 3 | |
| At 31 December 2022 | 5,066 | | 506 | | 260 | | 114 | | 36 | | 47 | | 2,423 | | 8 | | 281 | | 8,741 | |
| Credit (charge) to the income statement | (283) | | (258) | | (39) | | 119 | | 10 | | – | | (84) | | – | | (179) | | (714) | |
| Credit (charge) to other comprehensive income | – | | – | | – | | – | | – | | – | | (672) | | 42 | | – | | (630) | |
| | | | | | | | | | |
| Other credit to equity | – | | – | | – | | – | | 12 | | – | | – | | – | | – | | 12 | |
| At 31 December 2023 | 4,783 | | 248 | | 221 | | 233 | | 58 | | 47 | | 1,667 | | 50 | | 102 | | 7,409 | |
| | | | | | | | | | | | | | | | | | | | | | | | | | |
| Deferred tax liabilities | Capitalised
software
enhancements
£m | Long-term assurance business1 £m | Acquisition
fair value
£m | Pension
assets
£m | Derivatives
£m | Asset revaluations2 £m | Other temporary differences1 £m | Total
£m |
| At 31 December 2021 | (275) | | (1,162) | | (352) | | (1,331) | | (509) | | (56) | | (331) | | (4,016) | |
| Adjustment on adoption of IFRS 17 | – | | 655 | | – | | – | | – | | – | | 31 | | 686 | |
| At 1 January 2022 | (275) | | (507) | | (352) | | (1,331) | | (509) | | (56) | | (300) | | (3,330) | |
| Credit (charge) to the income statement | 118 | | 507 | | 21 | | 29 | | (32) | | – | | (164) | | 479 | |
| Credit to other comprehensive income | – | | – | | – | | 283 | | – | | 56 | | – | | 339 | |
| Acquisitions | (5) | | – | | (1) | | – | | – | | – | | – | | (6) | |
| Exchange and other adjustments | – | | – | | – | | – | | – | | – | | (10) | | (10) | |
| At 31 December 2022 | (162) | | – | | (332) | | (1,019) | | (541) | | – | | (474) | | (2,528) | |
| Credit (charge) to the income statement | 70 | | – | | 38 | | (5) | | (167) | | – | | 141 | | 77 | |
| Credit to other comprehensive income | – | | – | | – | | 53 | | – | | – | | 66 | | 119 | |
| Acquisitions | – | | – | | (58) | | – | | – | | – | | – | | (58) | |
| Exchange and other adjustments | – | | – | | – | | – | | – | | – | | 9 | | 9 | |
| At 31 December 2023 | (92) | | – | | (352) | | (971) | | (708) | | – | | (258) | | (2,381) | |
1 Restated for the adoption of IFRS 17; see notes 1 and 54.
2 Financial assets at fair value through other comprehensive income.
| | | | | | | | |
F-49 | Lloyds Banking Group plc Annual Report on Form 20-F 2023 | |
Notes to the consolidated financial statements continued
for the year ended 31 December
Note 19: Tax continued
At 31 December 2023 the Group carried net deferred tax assets on its balance sheet of £5,185 million (2022: £6,422 million) principally relating to tax losses carried forward.
Estimation of income taxes includes the assessment of recoverability of deferred tax assets. Deferred tax assets are only recognised to the extent that they are considered more likely than not to be recoverable based on existing tax laws and forecasts of future taxable profits against which the underlying tax deductions can be utilised. The Group has recognised a deferred tax asset of £4,783 million (2022: £5,066 million) in respect of trading losses carried forward. Substantially all of these losses have arisen in Bank of Scotland plc and Lloyds Bank plc, and they will be utilised as taxable profits arise in those legal entities in future periods.
The Group’s expectations of future UK taxable profits require management judgement, and take into account the Group’s long-term financial and strategic plans and anticipated future tax-adjusting items. In making this assessment, account is taken of business plans, the Board-approved operating plan and the expected future economic outlook as set out in the strategic report, as well as the risks associated with future regulatory, climate-related and other change, in order to produce a base case forecast of future UK taxable profits. Under current law there is no expiry date for UK trading losses not yet utilised, and given the forecast of future profitability and the Group’s commitment to the UK market, in management’s judgement it is more likely than not that the value of the losses will be recovered by the Group while still operating as a going concern. Banking tax losses that arose before 1 April 2015 can only be used against 25 per cent of taxable profits arising after 1 April 2016, and they cannot be used to reduce the surcharge on banking profits. These restrictions in utilisation mean that the value of the deferred tax asset in respect of tax losses is only expected to be fully recovered by 2036 (2022: 2036) in the base case forecast. The rate of recovery of the Group’s tax loss asset is not a straight line, being affected by the relative profitability of the different legal entities in future periods, and the relative size of their tax losses carried forward. It is expected in the base case that 90 per cent of the value will be recovered by 2034, when Bank of Scotland plc will have utilised all of its available tax losses. It is possible that future tax law changes could materially affect the timing of recovery and the value of these losses ultimately realised by the Group.
A deferred tax asset of £118 million (2022: £8 million) has been recognised in respect of the future tax benefit of certain expenses of the life assurance business. The increase is driven by higher forecast investment returns in the long term projections for the life insurance business due to interest rate rises which increases the amount of expenses expected to be utilised. The deferred tax asset not recognised in respect of the remaining expenses is £88 million (2022: £339 million), and these expenses can be carried forward indefinitely. The unrecognised deferred tax asset has decreased in 2023 due to utilisation of expenses in the year and the higher expected investment returns in the long term projections for the life insurance business reducing the net amount of unutilised expenses in the long term.
Deferred tax not recognised
Deferred tax assets of £160 million (2022: £156 million) have not been recognised in respect of £635 million of UK tax losses and other temporary differences which can only be used to offset future capital gains. UK capital losses can be carried forward indefinitely.
No deferred tax has been recognised in respect of foreign trade losses where it is not more likely than not that we will be able to utilise them in future periods. Of the asset not recognised, £51 million (2022: £53 million) relates to losses that will expire if not used within 20 years, and £9 million (2022: £9 million) relates to losses with no expiry date.
As a result of parent company exemptions on dividends from subsidiaries and on capital gains on disposal there are no significant taxable temporary differences associated with investments in subsidiaries, branches, associates and joint arrangements.
Critical accounting judgements and key sources of estimation uncertainty
| | | | | |
| Critical judgement: | The Group believes that its interpretation of the tax rules on group relief are correct |
The Group has an open matter in relation to a claim for group relief of losses incurred in its former Irish banking subsidiary, which ceased trading on 31 December 2010. In 2013, HMRC informed the Group that its interpretation of the UK rules means that the group relief is not available. In 2020, HMRC concluded its enquiry into the matter and issued a closure notice. The Group’s interpretation of the UK rules has not changed and hence it appealed to the First Tier Tax Tribunal, with a hearing having taken place in May 2023. If the final determination of the matter by the judicial process is that HMRC’s position is correct, management believes that this would result in an increase in current tax liabilities of approximately £920 million (including interest) and a reduction in the Group’s deferred tax asset of approximately £285 million. The Group, following conclusion of the hearing and having taken appropriate advice, does not consider that this is a case where additional tax will ultimately fall due.
There are a number of other open matters on which the Group is in discussions with HMRC (including the tax treatment of certain costs arising from the divestment of TSB Banking Group plc), none of which is expected to have a material impact on the financial position of the Group.
| | | | | | | | |
F-50 | Lloyds Banking Group plc Annual Report on Form 20-F 2023 | |
Notes to the consolidated financial statements continued
for the year ended 31 December
Note 20: Measurement basis of financial assets and liabilities
The accounting policies in note 2 describe how different classes of financial instruments are measured, and how income and expenses, including fair value gains and losses, are recognised. The following table analyses the carrying amounts of the financial assets and liabilities by category and by balance sheet heading.
| | | | | | | | | | | | | | | | | | | | | | | | | | | | | | | | | | | | | | | | | | | | | | | |
| Derivatives
designated
as hedging
instruments
£m | | Mandatorily held at
fair value through
profit or loss | | Designated
at fair value
through
profit or loss
£m | At fair value
through other
comprehensive
income
£m | | Held at
amortised
cost
£m | Insurance-
related
contracts
£m | | |
| At 31 December 2023 | | Held for
trading
£m | | Other
£m | | | | Total
£m |
| Financial assets | | | | | | | | | | | | | | | |
| Cash and balances at central banks | – | | | – | | | – | | | – | | | – | | | 78,110 | | | – | | | 78,110 | |
| Financial assets at fair value through profit or loss | – | | | 21,638 | | | 181,680 | | | – | | | – | | | – | | | – | | | 203,318 | |
| Derivative financial instruments | 103 | | | 22,253 | | | – | | | – | | | – | | | – | | | – | | | 22,356 | |
| Loans and advances to banks | – | | | – | | | – | | | – | | | – | | | 10,764 | | | – | | | 10,764 | |
| Loans and advances to customers | – | | | – | | | – | | | – | | | – | | | 449,745 | | | – | | | 449,745 | |
| Reverse repurchase agreements | – | | | – | | | – | | | – | | | – | | | 38,771 | | | – | | | 38,771 | |
| Debt securities | – | | | – | | | – | | | – | | | – | | | 15,355 | | | – | | | 15,355 | |
| Financial assets at amortised cost | – | | | – | | | – | | | – | | | – | | | 514,635 | | | – | | | 514,635 | |
| Financial assets at fair value through other comprehensive income | – | | | – | | | – | | | – | | | 27,592 | | | – | | | – | | | 27,592 | |
| Other | – | | | – | | | – | | | – | | | – | | | 299 | | | 443 | | | 742 | |
| Total financial assets | 103 | | | 43,891 | | | 181,680 | | | – | | | 27,592 | | | 593,044 | | | 443 | | | 846,753 | |
| Financial liabilities | | | | | | | | | | | | | | | |
| Deposits from banks | – | | | – | | | – | | | – | | | – | | | 6,153 | | | – | | | 6,153 | |
| Customer deposits | – | | | – | | | – | | | – | | | – | | | 471,396 | | | – | | | 471,396 | |
| Repurchase agreements at amortised cost | – | | | – | | | – | | | – | | | – | | | 37,703 | | | – | | | 37,703 | |
| Financial liabilities at fair value through profit or loss | – | | | 19,631 | | | – | | | 5,283 | | | – | | | – | | | – | | | 24,914 | |
| Derivative financial instruments | 505 | | | 19,644 | | | – | | | – | | | – | | | – | | | – | | | 20,149 | |
| Notes in circulation | – | | | – | | | – | | | – | | | – | | | 1,392 | | | – | | | 1,392 | |
| Debt securities in issue at amortised cost | – | | | – | | | – | | | – | | | – | | | 75,592 | | | – | | | 75,592 | |
| Liabilities arising from insurance and participating investment contracts | – | | | – | | | – | | | – | | | – | | | – | | | 120,123 | | | 120,123 | |
Liabilities arising from non-participating investment contracts | – | | | – | | | – | | | 44,978 | | | – | | | – | | | – | | | 44,978 | |
| Other | – | | | – | | | – | | | – | | | – | | | 1,960 | | | 8 | | | 1,968 | |
| Subordinated liabilities | – | | | – | | | – | | | – | | | – | | | 10,253 | | | – | | | 10,253 | |
| Total financial liabilities | 505 | | | 39,275 | | | – | | | 50,261 | | | – | | | 604,449 | | | 120,131 | | | 814,621 | |
| | | | | | | | |
F-51 | Lloyds Banking Group plc Annual Report on Form 20-F 2023 | |
Notes to the consolidated financial statements continued
for the year ended 31 December
Note 20: Measurement basis of financial assets and liabilities continued
| | | | | | | | | | | | | | | | | | | | | | | | | | | | | | | | | | | | | | | | | | | | | | | |
| Derivatives
designated
as hedging
instruments
£m | | Mandatorily held at
fair value through
profit or loss | | Designated
at fair value
through
profit or loss
£m | At fair value
through other
comprehensive
income
£m | | Held at
amortised
cost
£m | Insurance-
related
contracts
£m | | |
At 31 December 20221 | | Held for
trading
£m | | Other
£m | | | | Total
£m |
| Financial assets | | | | | | | | | | | | | | | |
| Cash and balances at central banks | – | | | – | | | – | | | – | | | – | | | 91,388 | | | – | | | 91,388 | |
| Financial assets at fair value through profit or loss | – | | | 14,216 | | | 166,553 | | | – | | | – | | | – | | | – | | | 180,769 | |
| Derivative financial instruments | 75 | | | 24,678 | | | – | | | – | | | – | | | – | | | – | | | 24,753 | |
| Loans and advances to banks | – | | | – | | | – | | | – | | | – | | | 10,632 | | | – | | | 10,632 | |
| Loans and advances to customers | – | | | – | | | – | | | – | | | – | | | 454,899 | | | – | | | 454,899 | |
| Reverse repurchase agreements | – | | | – | | | – | | | – | | | – | | | 44,865 | | | – | | | 44,865 | |
| Debt securities | – | | | – | | | – | | | – | | | – | | | 9,926 | | | – | | | 9,926 | |
| Financial assets at amortised cost | – | | | – | | | – | | | – | | | – | | | 520,322 | | | – | | | 520,322 | |
| Financial assets at fair value through other comprehensive income | – | | | – | | | – | | | – | | | 23,154 | | | – | | | – | | | 23,154 | |
| Other | – | | | – | | | – | | | – | | | – | | | 242 | | | 372 | | | 614 | |
| Total financial assets | 75 | | | 38,894 | | | 166,553 | | | – | | | 23,154 | | | 611,952 | | | 372 | | | 841,000 | |
| Financial liabilities | | | | | | | | | | | | | | | |
| Deposits from banks | – | | | – | | | – | | | – | | | – | | | 7,266 | | | – | | | 7,266 | |
| Customer deposits | – | | | – | | | – | | | – | | | – | | | 475,331 | | | – | | | 475,331 | |
| Repurchase agreements at amortised cost | – | | | – | | | – | | | – | | | – | | | 48,596 | | | – | | | 48,596 | |
| Financial liabilities at fair value through profit or loss | – | | | 12,577 | | | – | | | 5,178 | | | – | | | – | | | – | | | 17,755 | |
| Derivative financial instruments | 527 | | | 23,515 | | | – | | | – | | | – | | | – | | | – | | | 24,042 | |
| Notes in circulation | – | | | – | | | – | | | – | | | – | | | 1,280 | | | – | | | 1,280 | |
| Debt securities in issue at amortised cost | – | | | – | | | – | | | – | | | – | | | 73,819 | | | – | | | 73,819 | |
| Liabilities arising from insurance and participating investment contracts | – | | | – | | | – | | | – | | | – | | | – | | | 110,278 | | | 110,278 | |
Liabilities arising from non-participating investment contracts | – | | | – | | | – | | | 39,476 | | | – | | | – | | | – | | | 39,476 | |
| Other | – | | | – | | | – | | | – | | | – | | | 1,689 | | | 19 | | | 1,708 | |
| Subordinated liabilities | – | | | – | | | – | | | – | | | – | | | 10,730 | | | – | | | 10,730 | |
| Total financial liabilities | 527 | | | 36,092 | | | – | | | 44,654 | | | – | | | 618,711 | | | 110,297 | | | 810,281 | |
1 Restated for presentational changes and for the adoption of IFRS 17; see notes 1 and 54.
| | | | | | | | |
F-52 | Lloyds Banking Group plc Annual Report on Form 20-F 2023 | |
Notes to the consolidated financial statements continued
for the year ended 31 December
Note 21: Fair values of financial assets and liabilities
At 31 December 2023, the carrying value of the Group’s financial instrument assets held at fair value was £253,266 million (2022: £228,676 million), and its financial instrument liabilities held at fair value was £90,041 million (2022: £81,273 million).
(1) Fair value measurement
Fair value is the price that would be received on sale of an asset or paid to transfer a liability in an orderly transaction between market participants at the measurement date. It is a measure as at a specific date and may be significantly different from the amount which will actually be paid or received on maturity or settlement date.
Wherever possible, fair values have been calculated using unadjusted quoted market prices in active markets for identical instruments to those held by the Group. Where quoted market prices are not available, or are unreliable because of poor liquidity, fair values have been determined using valuation techniques which, to the extent possible, use market observable inputs, but in some cases use non-market observable inputs. Valuation techniques used include discounted cash flow analysis and pricing models and, where appropriate, comparison to instruments with characteristics similar to those of the instruments held by the Group. The Group measures valuation adjustments for its derivative exposures on the same basis as the derivatives are managed.
The carrying amount of the following financial instruments is a reasonable approximation of fair value: cash and balances at central banks, items in the course of collection from banks, items in course of transmission to banks and notes in circulation. Liabilities arising from non-participating investment contracts are carried at fair value.
Because a variety of estimation techniques are employed and significant estimates made, comparisons of fair values between financial institutions may not be meaningful. Readers of these financial statements are thus advised to use caution when using this data to evaluate the Group’s financial position.
Fair value information is not provided for items that are not financial instruments or for other assets and liabilities which are not carried at fair value in the Group’s consolidated balance sheet. These items include intangible assets, property, plant and equipment, and shareholders’ equity. These items are material and accordingly the Group believes that any fair value information presented would not represent the underlying value of the Group.
Valuation control framework
The key elements of the control framework for the valuation of financial instruments include model validation, product implementation review and independent price verification. These functions are carried out by appropriately skilled risk and finance teams, independent of the business area responsible for the products.
Model validation covers both qualitative and quantitative elements relating to new models. In respect of new products, a product implementation review is conducted pre and post-trading. Pre-trade testing ensures that the new model is integrated into the Group’s systems and that the profit and loss and risk reporting are consistent throughout the trade lifecycle. Post-trade testing examines the explanatory power of the implemented model, actively monitoring model parameters and comparing in-house pricing to external sources. Independent price verification procedures cover financial instruments carried at fair value. The frequency of the review is matched to the availability of independent data, monthly being the minimum. Valuation differences in breach of established thresholds are escalated to senior management. The results from independent pricing and valuation reserves are reviewed monthly by senior management.
Formal committees, consisting of senior risk, finance and business management, meet at least quarterly to discuss and approve valuations in more judgemental areas, in particular for unquoted equities, structured credit, derivatives and the credit valuation adjustment (CVA), funding valuation adjustment (FVA) and other valuation adjustments.
Valuation of financial assets and liabilities
Assets and liabilities carried at fair value or for which fair values are disclosed have been classified into three levels according to the quality and reliability of information used to determine the fair values.
Level 1
Level 1 fair value measurements are those derived from unadjusted quoted prices in active markets for identical assets or liabilities. Products classified as level 1 predominantly comprise listed equity shares, treasury bills and other government securities.
Level 2
Level 2 valuations are those where quoted market prices are not available, for example where the instrument is traded in a market that is not considered to be active or valuation techniques are used to determine fair value and where these techniques use inputs that are based significantly on observable market data. Examples of such financial instruments include most over-the-counter derivatives, financial institution issued securities, certificates of deposit and certain asset-backed securities.
Level 3
Level 3 portfolios are those where at least one input which could have a significant effect on the instrument’s valuation is not based on observable market data. Such instruments would include the Group’s venture capital and unlisted equity investments which are valued using various valuation techniques that require significant management judgement in determining appropriate assumptions, including earnings multiples and estimated future cash flows. Certain of the Group’s asset-backed securities, loans and advances recognised at fair value and derivatives are also classified as level 3.
Transfers out of the level 3 portfolio arise when inputs that could have a significant impact on the instrument’s valuation become market observable after previously having been non-market observable. In the case of asset-backed securities this can arise if more than one consistent independent source of data becomes available. Conversely, transfers into the portfolio arise when consistent sources of data cease to be available.
| | | | | | | | |
F-53 | Lloyds Banking Group plc Annual Report on Form 20-F 2023 | |
Notes to the consolidated financial statements continued
for the year ended 31 December
Note 21: Fair values of financial assets and liabilities continued
(2) Financial assets and liabilities carried at fair value
(A) Financial assets (excluding derivatives)
Valuation hierarchy
At 31 December 2023, the Group’s financial assets (excluding derivatives) carried at fair value totalled £230,910 million (2022: £203,923 million). The table below analyses these financial assets by balance sheet classification, asset type and valuation methodology (level 1, 2 or 3, as described above). The fair value measurement approach is recurring in nature. There were no significant transfers between level 1 and 2 during the year. For amounts included below which are subject to repurchase and reverse repurchase agreements see note 52.
| | | | | | | | | | | | | | | | | | | | | | | |
| Level 1
£m | | Level 2
£m | | Level 3
£m | | Total
£m |
| At 31 December 2023 | | | | | | | |
| Trading assets | | | | | | | |
| | | | | | | |
| Loans and advances to customers | – | | | 23 | | | – | | | 23 | |
| Reverse repurchase agreements | – | | | 17,413 | | | – | | | 17,413 | |
| Debt securities: | | | | | | | |
| Government securities | 3,596 | | | – | | | – | | | 3,596 | |
| | | | | | | |
| | | | | | | |
| Asset-backed securities | – | | | 77 | | | – | | | 77 | |
| Corporate and other debt securities | – | | | 529 | | | – | | | 529 | |
| 3,596 | | | 606 | | | – | | | 4,202 | |
| Total trading assets | 3,596 | | | 18,042 | | | – | | | 21,638 | |
| Other financial assets mandatorily held at fair value through profit or loss | | | | | | | |
| Loans and advances to banks | – | | | 3,127 | | | – | | | 3,127 | |
| Loans and advances to customers | – | | | 1,992 | | | 7,890 | | | 9,882 | |
| Debt securities: | | | | | | | |
| Government securities | 8,005 | | | 4 | | | – | | | 8,009 | |
| Other public sector securities | 10 | | | 2,300 | | | – | | | 2,310 | |
| Bank and building society certificates of deposit | – | | | 7,504 | | | – | | | 7,504 | |
| Asset-backed securities | – | | | 327 | | | 186 | | | 513 | |
| Corporate and other debt securities | – | | | 18,061 | | | 2,064 | | | 20,125 | |
| 8,015 | | | 28,196 | | | 2,250 | | | 38,461 | |
| Treasury and other bills | 51 | | | – | | | – | | | 51 | |
| Equity shares | 117,194 | | | – | | | 1,541 | | | 118,735 | |
| Contracts held with reinsurers | – | | | 11,424 | | | – | | | 11,424 | |
Total other financial assets mandatorily held at fair value through profit or loss1 | 125,260 | | | 44,739 | | | 11,681 | | | 181,680 | |
| Total financial assets at fair value through profit or loss | 128,856 | | | 62,781 | | | 11,681 | | | 203,318 | |
| Financial assets at fair value through other comprehensive income | | | | | | | |
| Debt securities: | | | | | | | |
| Government securities | 14,093 | | | 48 | | | – | | | 14,141 | |
| Asset-backed securities | – | | | 121 | | | 52 | | | 173 | |
| Corporate and other debt securities | 956 | | | 12,090 | | | – | | | 13,046 | |
| 15,049 | | | 12,259 | | | 52 | | | 27,360 | |
| Equity shares | – | | | – | | | 232 | | | 232 | |
| Total financial assets at fair value through other comprehensive income | 15,049 | | | 12,259 | | | 284 | | | 27,592 | |
| Total financial assets (excluding derivatives) at fair value | 143,905 | | | 75,040 | | | 11,965 | | | 230,910 | |
1 Other financial assets mandatorily at fair value through profit or loss include assets backing insurance contracts and investment contracts of £176,475 million. Included within these assets are investments in unconsolidated structured entities of £76,426 million; see note 49.
| | | | | | | | |
F-54 | Lloyds Banking Group plc Annual Report on Form 20-F 2023 | |
Notes to the consolidated financial statements continued
for the year ended 31 December
Note 21: Fair values of financial assets and liabilities continued
| | | | | | | | | | | | | | | | | | | | | | | |
| Level 1
£m | | Level 2
£m | | Level 3
£m | | Total
£m |
At 31 December 20221 | | | | | | | |
| Trading assets | | | | | | | |
| | | | | | | |
| Loans and advances to customers | – | | | 1 | | | – | | | 1 | |
| Reverse repurchase agreements | – | | | 11,781 | | | – | | | 11,781 | |
| Debt securities: | | | | | | | |
| Government securities | 2,185 | | | – | | | – | | | 2,185 | |
| | | | | | | |
| | | | | | | |
| Asset-backed securities | – | | | 21 | | | – | | | 21 | |
| Corporate and other debt securities | – | | | 228 | | | – | | | 228 | |
| 2,185 | | | 249 | | | – | | | 2,434 | |
| Total trading assets | 2,185 | | | 12,031 | | | – | | | 14,216 | |
| Other financial assets mandatorily held at fair value through profit or loss | | | | | | | |
| Loans and advances to banks | – | | | 3,329 | | | – | | | 3,329 | |
| Loans and advances to customers | – | | | 1,878 | | | 7,883 | | | 9,761 | |
| Debt securities: | | | | | | | |
| Government securities | 7,865 | | | 7 | | | – | | | 7,872 | |
| Other public sector securities | – | | | 2,516 | | | – | | | 2,516 | |
| Bank and building society certificates of deposit | – | | | 7,133 | | | – | | | 7,133 | |
| Asset-backed securities | – | | | 336 | | | 63 | | | 399 | |
| Corporate and other debt securities | 77 | | | 15,877 | | | 1,739 | | | 17,693 | |
| 7,942 | | | 25,869 | | | 1,802 | | | 35,613 | |
| Treasury and other bills | 62 | | | – | | | – | | | 62 | |
| Equity shares | 105,263 | | | – | | | 1,619 | | | 106,882 | |
| Contracts held with reinsurers | – | | | 10,906 | | | – | | | 10,906 | |
Total other financial assets mandatorily held at fair value through profit or loss2 | 113,267 | | | 41,982 | | | 11,304 | | | 166,553 | |
| Total financial assets at fair value through profit or loss | 115,452 | | | 54,013 | | | 11,304 | | | 180,769 | |
| Financial assets at fair value through other comprehensive income | | | | | | | |
| Debt securities: | | | | | | | |
| Government securities | 10,854 | | | 357 | | | – | | | 11,211 | |
| Asset-backed securities | – | | | 87 | | | 59 | | | 146 | |
| Corporate and other debt securities | 536 | | | 10,978 | | | – | | | 11,514 | |
| 11,390 | | | 11,422 | | | 59 | | | 22,871 | |
| Equity shares | – | | | – | | | 283 | | | 283 | |
| Total financial assets at fair value through other comprehensive income | 11,390 | | | 11,422 | | | 342 | | | 23,154 | |
| Total financial assets (excluding derivatives) at fair value | 126,842 | | | 65,435 | | | 11,646 | | | 203,923 | |
1 Restated for presentational changes and for the adoption of IFRS 17; see notes 1 and 54.
2 Other financial assets mandatorily at fair value through profit or loss include assets backing insurance contracts and investment contracts of £161,778 million. Included within these assets are investments in unconsolidated structured entities of £68,913 million; see note 49.
| | | | | | | | |
F-55 | Lloyds Banking Group plc Annual Report on Form 20-F 2023 | |
Notes to the consolidated financial statements continued
for the year ended 31 December
Note 21: Fair values of financial assets and liabilities continued
Movements in level 3 portfolio
The table below analyses movements in level 3 financial assets (excluding derivatives) at fair value, recurring basis.
| | | | | | | | | | | | | | | | | | | | | | | |
| 2023 | | 2022 |
| Financial
assets at
fair value
through
profit or loss
£m | Financial
assets at
fair value
through other
comprehensive
income
£m | Total level 3
financial assets
(excluding
derivatives)
at fair value,
recurring basis
£m | | Financial
assets at
fair value
through
profit or loss
£m | Financial
assets at
fair value
through other
comprehensive
income
£m | Total level 3
financial assets
(excluding
derivatives)
at fair value,
recurring basis
£m |
| At 1 January | 11,304 | | 342 | | 11,646 | | | 13,313 | | 305 | | 13,618 | |
| Exchange and other adjustments | (4) | | (1) | | (5) | | | 15 | | 3 | | 18 | |
| Gains (losses) recognised in the income statement within other income | 723 | | 6 | | 729 | | | (1,609) | | (2) | | (1,611) | |
| (Losses) gains recognised in other comprehensive income within the revaluation reserve in respect of financial assets at fair value through other comprehensive income | – | | (54) | | (54) | | | – | | 44 | | 44 | |
| Purchases/increases to customer loans | 744 | | 3 | | 747 | | | 959 | | 3 | | 962 | |
| Sales/repayments of customer loans | (1,140) | | (12) | | (1,152) | | | (1,320) | | (11) | | (1,331) | |
| Transfers into the level 3 portfolio | 136 | | – | | 136 | | | 197 | | – | | 197 | |
| Transfers out of the level 3 portfolio | (82) | | – | | (82) | | | (251) | | – | | (251) | |
| At 31 December | 11,681 | | 284 | | 11,965 | | | 11,304 | | 342 | | 11,646 | |
| Gains (losses) recognised in the income statement, within other income, relating to the change in fair value of those assets held at 31 December | 654 | | – | | 654 | | | (1,596) | | – | | (1,596) | |
Valuation methodology for financial assets (excluding derivatives)
Loans and advances to banks and customers
The fair value of these assets is determined using discounted cash flow techniques. The discount rates are derived from market observable interest rates, a risk margin that reflects loan credit ratings and an incremental illiquidity premium based on historical spreads at origination on similar loans.
Debt securities
Debt securities measured at fair value and classified as level 2 are valued by discounting expected cash flows using an observable credit spread applicable to the particular instrument.
Where there is limited trading activity in debt securities, the Group uses valuation models, consensus pricing information from third party pricing services and broker or lead manager quotes to determine an appropriate valuation. Debt securities are classified as level 3 if there is a significant valuation input that cannot be corroborated through market sources or where there are materially inconsistent values for an input. Asset classes classified as level 3 mainly comprise venture capital investments.
Equity investments
Unlisted equity and fund investments are valued using different techniques in accordance with the Group’s valuation policy and International Private Equity and Venture Capital Guidelines.
Depending on the business sector and the circumstances of the investment, unlisted equity valuations are based on earnings multiples, net asset values or discounted cash flows.
•A number of earnings multiples are used in valuing the portfolio including price earnings, earnings before interest and tax and earnings before interest, tax, depreciation and amortisation. The particular multiple selected is appropriate for the size and type of business being valued and is derived by reference to the current market-based multiple. Consideration is given to the risk attributes, growth prospects and financial gearing of comparable businesses when selecting the appropriate multiple
•Discounted cash flow valuations use estimated future cash flows, usually based on management forecasts, with the application of appropriate exit yields or terminal multiples and discounted using rates appropriate to the specific investment, business sector or recent economic rates of return. Recent transactions involving the sale of similar businesses may sometimes be used as a frame of reference in deriving an appropriate multiple
•For fund investments the most recent capital account value calculated by the fund manager is used as the basis for the valuation and adjusted, if necessary, to align valuation techniques with the Group’s valuation policy
Unlisted equity investments and investments in property partnerships held in the life assurance funds are valued using third party valuations. Management take account of any pertinent information, such as recent transactions and information received on particular investments, to adjust the third party valuations where necessary
| | | | | | | | |
F-56 | Lloyds Banking Group plc Annual Report on Form 20-F 2023 | |
Notes to the consolidated financial statements continued
for the year ended 31 December
Note 21: Fair values of financial assets and liabilities continued
(B) Financial liabilities (excluding derivatives)
Valuation hierarchy
At 31 December 2023, the Group’s financial liabilities (excluding derivatives) carried at fair value, comprised its financial liabilities at fair value through profit or loss and totalled £24,914 million (2022: £17,755 million). The table below analyses these financial liabilities by balance sheet classification and valuation methodology (level 1, 2 or 3, as described on page F-53). The fair value measurement approach is recurring in nature. There were no significant transfers between level 1 and 2 during the year. | | | | | | | | | | | | | | | | | | | | | | | |
| Level 1
£m | | Level 2
£m | | Level 3
£m | | Total
£m |
| At 31 December 2023 | | | | | | | |
| Trading liabilities | | | | | | | |
| Liabilities in respect of securities sold under repurchase agreements | – | | | 18,057 | | | – | | | 18,057 | |
| | | | | | | |
| Short positions in securities | 1,569 | | | 5 | | | – | | | 1,574 | |
| Total trading liabilities | 1,569 | | | 18,062 | | | – | | | 19,631 | |
| Liabilities designated at fair value through profit or loss | | | | | | | |
| Debt securities in issue | – | | | 5,223 | | | 42 | | | 5,265 | |
| Other | – | | | 18 | | | – | | | 18 | |
| Total liabilities designated at fair value through profit or loss | – | | | 5,241 | | | 42 | | | 5,283 | |
| Total financial liabilities (excluding derivatives) at fair value | 1,569 | | | 23,303 | | | 42 | | | 24,914 | |
| At 31 December 2022 | | | | | | | |
| Trading liabilities | | | | | | | |
| Liabilities in respect of securities sold under repurchase agreements | – | | | 11,037 | | | – | | | 11,037 | |
| | | | | | | |
| Short positions in securities | 1,505 | | | 35 | | | – | | | 1,540 | |
| Total trading liabilities | 1,505 | | | 11,072 | | | – | | | 12,577 | |
| Liabilities designated at fair value through profit or loss | | | | | | | |
| Debt securities in issue | – | | | 5,114 | | | 45 | | | 5,159 | |
| Other | – | | | 19 | | | – | | | 19 | |
| Total liabilities designated at fair value through profit or loss | – | | | 5,133 | | | 45 | | | 5,178 | |
| Total financial liabilities (excluding derivatives) at fair value | 1,505 | | | 16,205 | | | 45 | | | 17,755 | |
Liabilities designated at fair value through profit or loss primarily represent debt securities in issue which either contain substantive embedded derivatives which would otherwise need to be recognised and measured at fair value separately from the related debt securities, or which are accounted for at fair value to significantly reduce an accounting mismatch.
The amount contractually payable on maturity of the debt securities held at fair value through profit or loss at 31 December 2023 was £10,433 million, which was £5,167 million higher than the balance sheet carrying value (2022: £11,195 million, which was £6,036 million higher than the balance sheet carrying value). At 31 December 2023 there was a cumulative £90 million decrease in the fair value of these liabilities attributable to changes in credit spread risk; this is determined by reference to the quoted credit spreads of Lloyds Bank plc, the issuing entity within the Group. Of the cumulative amount, an increase of £234 million arose in 2023 and a decrease of £519 million arose in 2022.
For the fair value of collateral pledged in respect of repurchase agreements see note 52.
In addition to the liabilities above, the Group’s non-participating investment contracts are held at fair value through profit or loss and were all categorised as level 2.
Movements in level 3 portfolio
The table below analyses movements in the level 3 financial liabilities (excluding derivatives) at fair value portfolio.
| | | | | | | | |
| 2023 £m | 2022 £m |
| At 1 January | 45 | | 37 | |
| Gains recognised in the income statement within other income | (1) | | (4) | |
| Additions | – | | 33 | |
| Redemptions | (1) | | (3) | |
| | |
| Transfers out of the level 3 portfolio | (1) | | (18) | |
| At 31 December | 42 | | 45 | |
| Gains recognised in the income statement, within other income, relating to the change in fair value of those liabilities held at 31 December | (1) | | (4) | |
| | | | | | | | |
F-57 | Lloyds Banking Group plc Annual Report on Form 20-F 2023 | |
Notes to the consolidated financial statements continued
for the year ended 31 December
Note 21: Fair values of financial assets and liabilities continued
Valuation methodology for financial liabilities (excluding derivatives)
Liabilities held at fair value through profit or loss
These principally comprise debt securities in issue which are classified as level 2 and their fair value is determined using techniques whose inputs are based on observable market data. The carrying amount of the securities is adjusted to reflect the effect of changes in own credit spreads and the resulting gain or loss is recognised in other comprehensive income.
In the year ended 31 December 2023, the own credit adjustment arising from the fair valuation of £5,265 million (2022: £5,159 million) of the Group’s debt securities in issue designated at fair value through profit or loss resulted in a loss of £234 million (2022: gain of £519 million), before tax, recognised in other comprehensive income.
Trading liabilities in respect of securities sold under repurchase agreements
The fair value of these liabilities is determined using discounted cash flow techniques. The discount rates are derived from observable repurchase agreement rate curves specific to the type of security sold under the repurchase agreement.
(C) Derivatives
Valuation hierarchy
All of the Group’s derivative assets and liabilities are carried at fair value. At 31 December 2023, such assets totalled £22,356 million (2022: £24,753 million) and liabilities totalled £20,149 million (2022: £24,042 million). The table below analyses these derivative balances by valuation methodology (level 1, 2 or 3, as described on page F-53). The fair value measurement approach is recurring in nature. There were no significant transfers between level 1 and level 2 during the year. | | | | | | | | | | | | | | | | | | | | | | | | | | | | | |
| 2023 | | 2022 |
| Level 1
£m | Level 2
£m | Level 3
£m | Total
£m | | Level 1
£m | Level 2
£m | Level 3
£m | Total
£m |
| Derivative assets | 77 | | 21,857 | | 422 | | 22,356 | | | 78 | | 24,122 | | 553 | | 24,753 | |
| Derivative liabilities | (116) | | (19,589) | | (444) | | (20,149) | | | (39) | | (23,395) | | (608) | | (24,042) | |
Movements in level 3 portfolio
The table below analyses movements in level 3 derivative assets and liabilities carried at fair value.
| | | | | | | | | | | | | | | | | |
| 2023 | | 2022 |
| Derivative
assets
£m | Derivative
liabilities
£m | | Derivative
assets
£m | Derivative
liabilities
£m |
| At 1 January | 553 | | (608) | | | 893 | | (944) | |
| Exchange and other adjustments | (8) | | 5 | | | 47 | | (37) | |
| (Losses) gains recognised in the income statement within other income | (104) | | 111 | | | 72 | | 204 | |
| Purchases (additions) | 19 | | (15) | | | 48 | | (46) | |
| (Sales) redemptions | (38) | | 63 | | | (21) | | 38 | |
| | | | | |
| Transfers out of the level 3 portfolio | – | | – | | | (486) | | 177 | |
| At 31 December | 422 | | (444) | | | 553 | | (608) | |
| (Losses) gains recognised in the income statement, within other income, relating to the change in fair value of those assets or liabilities held at 31 December | (72) | | 76 | | | 222 | | 125 | |
Valuation methodology for derivatives
The Group’s derivatives are valued using techniques including discounted cash flow and options pricing models, as appropriate. The types of derivatives classified as level 2 and the valuation techniques used include:
•Interest rate swaps which are valued using discounted cash flow models; the most significant inputs into those models are interest rate yield curves which are developed from publicly quoted rates
•Foreign exchange derivatives that do not contain options which are priced using rates available from publicly quoted sources
•Credit derivatives are valued using standard models with observable inputs, including publicly available yield and credit default swap (CDS) curves
•Less complex interest rate and foreign exchange option products which are valued using volatility surfaces developed from publicly available interest rate cap, interest rate swaption and other option volatilities; option volatility skew information is derived from a market standard consensus pricing service.
Complex interest rate products where inputs to the valuation are significant and unobservable are classified as level 3.
Certain inputs used to calculate CVA, FVA, and own credit adjustments, are not significant in determining the classification of the derivative and debt instruments. Consequently, these inputs do not form part of the level 3 sensitivities presented.
| | | | | | | | |
F-58 | Lloyds Banking Group plc Annual Report on Form 20-F 2023 | |
Notes to the consolidated financial statements continued
for the year ended 31 December
Note 21: Fair values of financial assets and liabilities continued
Derivative valuation adjustments
Derivative financial instruments which are carried in the balance sheet at fair value are adjusted where appropriate to reflect credit risk, market liquidity and other risks.
(i) Uncollateralised derivative valuation adjustments
The following table summarises the movement on this valuation adjustment account during 2022 and 2023:
| | | | | | | | |
| 2023 £m | 2022 £m |
| At 1 January | 381 | | 456 | |
| Income statement credit | (102) | | (75) | |
| Transfers | (3) | | – | |
| At 31 December | 276 | | 381 | |
Represented by:
| | | | | | | | |
| 2023 £m | 2022 £m |
| Credit Valuation Adjustment | 191 | | 294 | |
| Debit Valuation Adjustment | (34) | | (55) | |
| Funding Valuation Adjustment | 119 | | 142 | |
| 276 | | 381 | |
Credit and Debit Valuation Adjustments (CVA and DVA) are applied to the Group’s over-the-counter derivative exposures with counterparties that are not subject to strong interbank collateral arrangements. These exposures largely relate to the provision of risk management solutions for corporate customers within the Commercial Banking division.
A CVA is taken where the Group has a positive future uncollateralised exposure (asset). A DVA is taken where the Group has a negative future uncollateralised exposure (liability). These adjustments reflect interest rates and expectations of counterparty creditworthiness and the Group’s own credit spread respectively.
The CVA is sensitive to:
•The current size of the mark-to-market position on the uncollateralised asset
•Expectations of future market volatility of the underlying asset
•Expectations of counterparty creditworthiness
Market Credit Default Swap (CDS) spreads are used to develop the probability of default for quoted counterparties. For unquoted counterparties, internal credit ratings and market sector CDS curves and recovery rates are used. The loss given default (LGD) is based on market recovery rates and internal credit assessments.
The combination of a one-notch deterioration in the credit rating of derivative counterparties and a 10 per cent increase in LGD increases the CVA by £50 million. Current market value is used to estimate the projected exposure for products not supported by the model, which are principally complex interest rate options that are traded in very low volumes. For these, the CVA is calculated on an add-on basis (although no such adjustment was required at 31 December 2023).
The DVA is sensitive to:
•The current size of the mark-to-market position on the uncollateralised liability
•Expectations of future market volatility of the underlying liability
•The Group’s own CDS spread
A 1 per cent rise in the CDS spread would lead to an increase in the DVA of £75 million.
The risk exposures that are used for the CVA and DVA calculations are strongly influenced by interest rates. Due to the nature of the Group’s business the CVA/DVA exposures tend to be on average the same way around such that the valuation adjustments fall when interest rates rise. A 1 per cent rise in interest rates would lead to a £39 million fall in the overall valuation adjustment to £118 million. The CVA model used by the Group does not assume any correlation between the level of interest rates and default rates.
The Group has also recognised a Funding Valuation Adjustment to adjust for the net cost of funding uncollateralised derivative positions. This adjustment is calculated on the expected future exposure discounted at a suitable cost of funds. A 10 basis points increase in the cost of funds will increase the funding valuation adjustment by £12 million.
(ii) Market liquidity
The Group includes mid to bid-offer valuation adjustments against the expected cost of closing out the net market risk in the Group’s trading positions within a time frame that is consistent with historical trading activity and spreads that the trading desks have accessed historically during the ordinary course of business in normal market conditions.
At 31 December 2023, the Group’s derivative trading business held mid to bid-offer valuation adjustments of £52 million (2022: £61 million).
| | | | | | | | |
F-59 | Lloyds Banking Group plc Annual Report on Form 20-F 2023 | |
Notes to the consolidated financial statements continued
for the year ended 31 December
Note 21: Fair values of financial assets and liabilities continued
(D) Sensitivity of level 3 valuations
Critical accounting judgements and key sources of estimation uncertainty
| | | | | |
| Key sources of estimation uncertainty: | Interest rate spreads, credit spreads, earnings multiples and interest rate volatility |
The Group’s valuation control framework and a description of level 1, 2 and 3 financial assets and liabilities is set out in section (1) above. The valuation techniques for level 3 financial instruments involve management judgement and estimates, the extent of which depends on the complexity of the instrument and the availability of market observable information. In addition, in line with market practice, the Group applies credit, debit and funding valuation adjustments in determining the fair value of its uncollateralised derivative positions. A description of these adjustments is set out in section (C)(i) above. A quantitative analysis of the sensitivities to market risk arising from the Group’s trading portfolios is set out in the tables marked audited on page 87. | | | | | | | | | | | | | | | | | | | | | | | | | | | | | | | | | | | | | | | | | |
| | | 2023 | | 2022 |
| | | | | Effect of reasonably possible
alternative assumptions1 | | | | Effect of reasonably possible
alternative assumptions1 |
| Valuation techniques | Significant
unobservable inputs2 | Carrying
value
£m | | Favourable
changes
£m | Unfavourable
changes
£m | | Carrying
value
£m | | Favourable
changes
£m | Unfavourable
changes
£m |
| Financial assets at fair value through profit or loss |
| Loans and advances to customers | Discounted cash flows | Interest rate spreads (-50bps/+272bps)4 | 7,890 | | | 369 | | | (351) | | | 7,883 | | | 356 | | | (385) | |
| Debt securities | Discounted cash flows | Credit spreads (+/- 6%)5 | 445 | | | 39 | | | (41) | | | 162 | | | 9 | | | (9) | |
| Equity and venture capital investments | Market approach | Earnings multiple (1.6/17.8)6 | 2,228 | | | 131 | | | (131) | | | 1,907 | | | 84 | | | (84) | |
| Underlying asset/net asset value (incl. property prices)3 | n/a | 809 | | | 77 | | | (99) | | | 771 | | | 81 | | | (88) | |
| Unlisted equities, debt securities and property partnerships in the life funds | Underlying asset/net asset value (incl. property prices), broker quotes or discounted cash flows3 | n/a | 309 | | | 7 | | | (6) | | | 581 | | | 2 | | | (33) | |
| | | 11,681 | | | | | | | 11,304 | | | | | |
| Financial assets at fair value through other comprehensive income |
| Asset-backed securities | Lead manager or broker quote/consensus pricing | n/a | 52 | | | 2 | | | (2) | | | 59 | | | – | | | – | |
| Equity and venture capital investments | Underlying asset/net asset value (incl. property prices)3 | n/a | 232 | | | 22 | | | (22) | | | 283 | | | 15 | | | (15) | |
| | | 284 | | | | | | | 342 | | | | | |
| Derivative financial assets |
| Interest rate derivatives | Option pricing
model | Interest rate volatility (13%/200%)7 | 422 | | | 6 | | | (3) | | | 553 | | | 9 | | | (7) | |
| | | | | | | | | | | | | |
| Level 3 financial assets carried at fair value | 12,387 | | | | | | | 12,199 | | | | | |
| Financial liabilities at fair value through profit or loss |
| Securitisation notes and other | Discounted cash flows | Interest rate spreads (+/– 50bps)8 | 42 | | | 1 | | | (1) | | | 45 | | | 1 | | | (1) | |
| Derivative financial liabilities |
| Interest rate derivatives | Option pricing model | Interest rate volatility (13%/200%)7 | 444 | | | 10 | | | (7) | | | 608 | | | – | | | – | |
| | | | | | | | | | | | | |
| Level 3 financial liabilities carried at fair value | 486 | | | | | | | 653 | | | | | |
1 Where the exposure to an unobservable input is managed on a net basis, only the net impact is shown in the table.
2 Ranges are shown where appropriate and represent the highest and lowest inputs used in the level 3 valuations.
3 Underlying asset/net asset values represent fair value.
4 2022: -50bps/+289bps.
5 2022: +/- 6%.
6 2022: 1.9/15.2.
7 2022: 17%/105%.
8 2022: +/- 50bps.
| | | | | | | | |
F-60 | Lloyds Banking Group plc Annual Report on Form 20-F 2023 | |
Notes to the consolidated financial statements continued
for the year ended 31 December
Note 21: Fair values of financial assets and liabilities continued
Unobservable inputs
Significant unobservable inputs affecting the valuation of debt securities, unlisted equity investments and derivatives are as follows:
•Credit spreads represent the premium above the benchmark reference instrument required to compensate for lower credit quality; higher spreads lead to a lower fair value
•Volatility parameters represent key attributes of option behaviour; higher volatilities typically denote a wider range of possible outcomes
•Earnings multiples are used to value certain unlisted equity investments. The earnings multiples used are derived from those of listed entities operating in the same sector with adjustments made for factors such as the size of the company and the quality of its earnings. The majority of the Group’s venture capital investments are valued using an estimate of the company’s maintainable earnings before interest, tax, depreciation and amortisation and in accordance with the International Private Equity and Venture Capital Valuation Guidelines. A higher earnings multiple will result in a higher fair value
Reasonably possible alternative assumptions
Valuation techniques applied to many of the Group’s level 3 instruments often involve the use of two or more inputs whose relationship is interdependent. The calculation of the effect of reasonably possible alternative assumptions included in the table above reflects such relationships.
Debt securities
Reasonably possible alternative assumptions have been determined in respect of the Group’s structured credit investments by flexing credit spreads.
Derivatives
Reasonably possible alternative assumptions have been determined in respect of swaptions in the Group’s derivative portfolios which are priced using industry standard option pricing models. Such models require interest rate volatilities which may be unobservable at longer maturities. To derive reasonably possible alternative valuations these volatility parameters have been flexed within a range of 13 per cent to 200 per cent (2022: 17 per cent to 105 per cent).
Unlisted equity, venture capital investments and investments in property partnerships
The valuation techniques used for unlisted equity and venture capital investments vary depending on the nature of the investment. Reasonably possible alternative valuations for these investments have been calculated by reference to the approach taken, as appropriate to the business sector and investment circumstances and as such the following inputs have been considered:
•For valuations derived from earnings multiples, consideration is given to the risk attributes, growth prospects and financial gearing of comparable businesses when selecting an appropriate multiple
•The discount rates used in discounted cash flow valuations
•In line with International Private Equity and Venture Capital Guidelines, the values of underlying investments in fund investment portfolios
(3) Financial assets and liabilities carried at amortised cost
(A) Financial assets
Valuation hierarchy
The table below analyses the fair values of those financial assets of the Group which are carried at amortised cost by valuation methodology (level 1, 2 or 3, as described on page F-53). Financial assets carried at amortised cost are mainly classified as level 3 due to significant unobservable inputs used in the valuation models. Where inputs are observable, debt securities are classified as level 1 or 2. | | | | | | | | | | | | | | | | | | | | | | | | | | | | | |
| Carrying
value
£m | | Fair
value
£m | | Valuation hierarchy |
| | | Level 1
£m | | Level 2
£m | | Level 3
£m |
| At 31 December 2023 | | | | | | | | | |
| Loans and advances to banks | 10,764 | | | 10,764 | | | – | | | – | | | 10,764 | |
| Loans and advances to customers | 449,745 | | | 439,449 | | | – | | | – | | | 439,449 | |
| Reverse repurchase agreements | 38,771 | | | 38,771 | | | – | | | 38,771 | | | – | |
| Debt securities | 15,355 | | | 15,139 | | | – | | | 10,939 | | | 4,200 | |
| Financial assets at amortised cost | 514,635 | | | 504,123 | | | – | | | 49,710 | | | 454,413 | |
| At 31 December 2022 | | | | | | | | | |
| Loans and advances to banks | 10,632 | | | 10,632 | | | – | | | – | | | 10,632 | |
| Loans and advances to customers | 454,899 | | | 450,071 | | | – | | | – | | | 450,071 | |
| Reverse repurchase agreements | 44,865 | | | 44,865 | | | – | | | 44,865 | | | – | |
| Debt securities | 9,926 | | | 9,930 | | | 167 | | | 9,647 | | | 116 | |
| Financial assets at amortised cost | 520,322 | | | 515,498 | | | 167 | | | 54,512 | | | 460,819 | |
| | | | | | | | |
F-61 | Lloyds Banking Group plc Annual Report on Form 20-F 2023 | |
Notes to the consolidated financial statements continued
for the year ended 31 December
Note 21: Fair values of financial assets and liabilities continued
Valuation methodology
Loans and advances to banks
The carrying value of short-dated loans and advances to banks is assumed to be their fair value. The fair value of other loans and advances to banks is estimated by discounting the anticipated cash flows at a market discount rate adjusted for the credit spread of the obligor or, where not observable, the credit spread of borrowers of similar credit quality.
Loans and advances to customers
The Group provides loans and advances to commercial, corporate and personal customers at both fixed and variable rates.
To determine the fair value of loans and advances to customers, loans are segregated into portfolios of similar characteristics. A number of techniques are used to estimate the fair value of fixed rate lending; these take account of expected credit losses based on historic trends, prevailing market interest rates and expected future cash flows. For retail exposures, fair value is usually estimated by discounting anticipated cash flows (including interest at contractual rates) at market rates for similar loans offered by the Group and other financial institutions. Certain loans secured on residential properties are made at a fixed rate for a limited period, typically two to five years, after which the loans revert to the relevant variable rate. The fair value of such loans is estimated by reference to market rates for similar loans of maturity equal to the remaining fixed interest rate period. The fair value of commercial loans is estimated by discounting anticipated cash flows at a rate which reflects the effects of interest rate changes, adjusted for changes in credit risk.
Reverse repurchase agreements
The carrying amount is deemed a reasonable approximation of fair value given the short-term nature of these instruments.
Debt securities
The fair values of debt securities are determined predominantly from lead manager quotes and, where these are not available, by alternative techniques including reference to credit spreads on similar assets with the same obligor, market standard consensus pricing services, broker quotes and other research data.
(B) Financial liabilities
Valuation hierarchy
The table below analyses the fair values of those financial liabilities of the Group which are carried at amortised cost by valuation methodology (level 1, 2 or 3, as described on page F-53). | | | | | | | | | | | | | | | | | | | | |
| Carrying
value
£m | Fair
value
£m | | Valuation hierarchy |
| | Level 1
£m | Level 2
£m | Level 3
£m |
| At 31 December 2023 | | | | | | |
| Deposits from banks | 6,153 | | 6,153 | | | – | | 6,153 | | – | |
| Customer deposits | 471,396 | | 471,857 | | | – | | 471,857 | | – | |
| Repurchase agreements at amortised cost | 37,703 | | 37,703 | | | – | | 37,703 | | – | |
| Debt securities in issue at amortised cost | 75,592 | | 75,021 | | | – | | 75,021 | | – | |
| Subordinated liabilities | 10,253 | | 10,345 | | | – | | 10,345 | | – | |
| At 31 December 2022 | | | | | | |
| Deposits from banks | 7,266 | | 7,268 | | | – | | 7,268 | | – | |
| Customer deposits | 475,331 | | 475,147 | | | – | | 475,147 | | – | |
| Repurchase agreements at amortised cost | 48,596 | | 48,596 | | | – | | 48,596 | | – | |
| Debt securities in issue at amortised cost | 73,819 | | 71,975 | | | – | | 71,975 | | – | |
| Subordinated liabilities | 10,730 | | 10,065 | | | – | | 10,065 | | – | |
Valuation methodology
Deposits from banks and customer deposits
The fair value of bank and customer deposits repayable on demand is assumed to be equal to their carrying value.
The fair value for all other deposits is estimated using discounted cash flows applying either market rates, where applicable, or current rates for deposits of similar remaining maturities.
Repurchase agreements at amortised cost
The carrying amount is deemed a reasonable approximation of fair value given the short-term nature of these instruments.
Debt securities in issue at amortised cost
The fair value of short-term debt securities in issue is approximately equal to their carrying value. Fair value for other debt securities in issue is calculated based on quoted market prices where available. Where quoted market prices are not available, fair value is estimated using discounted cash flow techniques at a rate which reflects market rates of interest and the Group’s own credit spread.
Subordinated liabilities
The fair value of subordinated liabilities is determined by reference to quoted market prices where available or by reference to quoted market prices of similar instruments. Subordinated liabilities are classified as level 2, since the inputs used to determine their fair value are largely observable.
(4) Reclassifications of financial assets
There have been no reclassifications of financial assets in 2022 or 2023.
| | | | | | | | |
F-62 | Lloyds Banking Group plc Annual Report on Form 20-F 2023 | |
Notes to the consolidated financial statements continued
for the year ended 31 December
Note 22: Derivative financial instruments
The fair values and notional amounts of derivative instruments are set out in the following table:
| | | | | | | | | | | | | | | | | | | | | | | | | | | | | | | | | | | |
| 2023 | | 2022 |
| Contract/
notional
amount
£m | | Fair value | | Contract/
notional
amount
£m | | Fair value |
| | Assets
£m | | Liabilities
£m | | | Assets
£m | | Liabilities
£m |
| Trading and other | | | | | | | | | | | |
| | | | | | | | | | | |
| | | | | | | | | | | |
| | | | | | | | | | | |
| | | | | | | | | | | |
| Exchange rate contracts | 572,858 | | | 6,631 | | | 6,222 | | | 464,223 | | | 8,733 | | | 9,216 | |
| | | | | | | | | | | |
| | | | | | | | | | | |
| | | | | | | | | | | |
| | | | | | | | | | | |
| | | | | | | | | | | |
| Interest rate contracts | 7,654,512 | | | 15,116 | | | 12,724 | | | 6,257,548 | | | 14,966 | | | 13,332 | |
| Credit derivatives | 5,349 | | | 51 | | | 118 | | | 6,689 | | | 134 | | | 118 | |
| Equity, commodity and other contracts | 9,463 | | | 455 | | | 580 | | | 16,490 | | | 845 | | | 849 | |
| Total derivative assets/liabilities – trading and other | 8,242,182 | | | 22,253 | | | 19,644 | | | 6,744,950 | | | 24,678 | | | 23,515 | |
| Hedging | | | | | | | | | | | |
| | | | | | | | | | | |
| | | | | | | | | | | |
| Derivatives designated as fair value hedges | 153,674 | | | 83 | | | 425 | | | 152,697 | | | 11 | | | 503 | |
| | | | | | | | | | | |
| | | | | | | | | | | |
| Derivatives designated as cash flow hedges | 466,344 | | | 20 | | | 80 | | | 251,245 | | | 64 | | | 24 | |
| Total derivative assets/liabilities – hedging | 620,018 | | | 103 | | | 505 | | | 403,942 | | | 75 | | | 527 | |
| Total recognised derivative assets/liabilities | 8,862,200 | | | 22,356 | | | 20,149 | | | 7,148,892 | | | 24,753 | | | 24,042 | |
The notional amount of the contract does not represent the Group’s exposure to credit risk, which is limited to the current cost of replacing contracts with a positive value to the Group should the counterparty default. To reduce credit risk the Group uses a variety of credit enhancement techniques such as netting and collateralisation, where security is provided against the exposure; a large proportion of the Group’s derivatives are held through exchanges such as London Clearing House and are collateralised through those exchanges. Further details are provided in note 52 Credit risk.
The Group holds derivatives as part of the following strategies:
•Customer driven, where derivatives are held as part of the provision of risk management products to Group customers
•To manage and hedge the Group’s interest rate and foreign exchange risk arising from normal banking business. The hedge accounting strategy adopted by the Group is to utilise a combination of fair value and cash flow hedge approaches as described in note 52
•Derivatives held in policyholder funds as permitted by the investment strategies of those funds
The principal derivatives used by the Group are as follows:
•Interest rate related contracts include interest rate swaps, forward rate agreements and options. An interest rate swap is an agreement between two parties to exchange fixed and floating interest payments, based upon interest rates defined in the contract, without the exchange of the underlying principal amounts. Forward rate agreements are contracts for the payment of the difference between a specified rate of interest and a reference rate, applied to a notional principal amount at a specific date in the future. An interest rate option gives the buyer, on payment of a premium, the right, but not the obligation, to fix the rate of interest on a future loan or deposit, for a specified period and commencing on a specified future date
•Exchange rate related contracts include forward foreign exchange contracts, currency swaps and options. A forward foreign exchange contract is an agreement to buy or sell a specified amount of foreign currency on a specified future date at an agreed rate. Currency swaps generally involve the exchange of interest payment obligations denominated in different currencies; the exchange of principal can be notional or actual. A currency option gives the buyer, on payment of a premium, the right, but not the obligation, to sell specified amounts of currency at agreed rates of exchange on or before a specified future date
•Credit derivatives, principally credit default swaps, are used by the Group as part of its trading activity and to manage its own exposure to credit risk. A credit default swap is a swap in which one counterparty receives a premium at pre-set intervals in consideration for guaranteeing to make a specific payment should a negative credit event take place
•Equity derivatives are also used by the Group as part of its equity-based retail product activity to eliminate the Group’s exposure to fluctuations in various international stock exchange indices. Index-linked equity options are purchased which give the Group the right, but not the obligation, to buy or sell a specified amount of equities, or basket of equities, in the form of published indices on or before a specified future date
| | | | | | | | |
F-63 | Lloyds Banking Group plc Annual Report on Form 20-F 2023 | |
Notes to the consolidated financial statements continued
for the year ended 31 December
Note 22: Derivative financial instruments continued
Details of the Group’s hedging instruments are set out below:
| | | | | | | | | | | | | | | | | | | | | | | | | | | | | | | | | | | |
| Maturity |
| At 31 December 2023 | Up to 1 month
£m | | 1 to 3 months
£m | 3 to 12 months
£m | | 1 to 5 years
£m | Over 5 years
£m | | Total
£m |
| Fair value hedges | | | | | | | | | | | |
| Interest rate | | | | | | | | | | | |
| Cross currency swap | | | | | | | | | | | |
| Notional | – | | | – | | | – | | | – | | | 35 | | | 35 | |
| Average fixed interest rate | – | | | – | | | – | | | – | | | 1.28% | | |
| Average EUR/GBP exchange rate | – | | | – | | | – | | | – | | | 1.38 | | | |
| | | | | | | | | | | |
| | | | | | | | | | | |
| Interest rate swap | | | | | | | | | | | |
| Notional | 1,908 | | | 5,778 | | | 19,353 | | | 87,119 | | | 39,481 | | | 153,639 | |
| Average fixed interest rate | 0.95% | | 1.72% | | 2.03% | | 2.90% | | 2.00% | | |
| Cash flow hedges | | | | | | | | | | | |
| Foreign exchange | | | | | | | | | | | |
| Currency swap | | | | | | | | | | | |
| Notional | 18 | | | 470 | | | 1,648 | | | 541 | | | 7 | | | 2,684 | |
| Average EUR/GBP exchange rate | 1.15 | | | 1.14 | | | 1.14 | | | 1.08 | | | 1.07 | | | |
| Average USD/GBP exchange rate | 1.25 | | | 1.23 | | | 1.25 | | | 1.24 | | | – | | | |
| Interest rate | | | | | | | | | | | |
| Interest rate swap | | | | | | | | | | | |
| Notional | 9,501 | | | 23,015 | | | 76,439 | | | 284,969 | | | 69,736 | | | 463,660 | |
| Average fixed interest rate | 4.13% | | 4.14% | | 3.82% | | 3.35% | | 2.58% | | |
| | | | | | | | | | | | | | | | | | | | | | | | | | | | | | | | | | | |
| Maturity |
| At 31 December 2022 | Up to 1 month
£m | | 1 to 3 months
£m | 3 to 12 months
£m | | 1 to 5 years
£m | | Over 5 years
£m | | Total
£m |
| Fair value hedges | | | | | | | | | | | |
| Interest rate | | | | | | | | | | | |
| Cross currency swap | | | | | | | | | | | |
| Notional | – | | | – | | | – | | | – | | | 35 | | | 35 | |
| Average fixed interest rate | – | | | – | | | – | | | – | | | 1.28% | | |
| Average EUR/GBP exchange rate | – | | | – | | | – | | | – | | | 1.38 | | | |
| | | | | | | | | | | |
| | | | | | | | | | | |
| Interest rate swap | | | | | | | | | | | |
| Notional | 1,904 | | | 12,765 | | | 37,488 | | | 64,307 | | | 36,198 | | | 152,662 | |
| Average fixed interest rate | 1.51% | | 0.17% | | 0.72% | | 1.92% | | 1.94% | | |
| Cash flow hedges | | | | | | | | | | | |
| Foreign exchange | | | | | | | | | | | |
| Currency swap | | | | | | | | | | | |
| Notional | – | | | – | | | 509 | | | 1,004 | | | 29 | | | 1,542 | |
| Average EUR/GBP exchange rate | – | | | – | | | 1.15 | | | 1.10 | | | 1.04 | | | |
| Average USD/GBP exchange rate | – | | | – | | | 1.24 | | | 1.25 | | | – | | | |
| Interest rate | | | | | | | | | | | |
| Interest rate swap | | | | | | | | | | | |
| Notional | 4,741 | | | 6,472 | | | 26,175 | | | 161,391 | | | 50,924 | | | 249,703 | |
| Average fixed interest rate | 3.01% | | 1.18% | | 2.36% | | 2.40% | | 1.60% | | |
| | | | | | | | |
F-64 | Lloyds Banking Group plc Annual Report on Form 20-F 2023 | |
Notes to the consolidated financial statements continued
for the year ended 31 December
Note 22: Derivative financial instruments continued
The carrying amounts of the Group’s hedging instruments are as follows:
| | | | | | | | | | | | | | |
| Carrying amount of the hedging instrument |
| At 31 December 2023 | Contract/
notional
amount
£m | Assets
£m | Liabilities
£m | Changes in fair
value used for
calculating
hedge
ineffectiveness
£m |
| Fair value hedges | | | | |
| Interest rate | | | | |
| Currency swaps | 35 | | 3 | | – | | 2 | |
| Interest rate swaps | 153,639 | | 80 | | 425 | | (2,665) | |
| Cash flow hedges | | | | |
| Foreign exchange | | | | |
| Currency swaps | 2,684 | | 11 | | 72 | | (138) | |
| Interest rate | | | | |
| Interest rate swaps | 463,660 | | 9 | | 8 | | 2,541 | |
| | | | | | | | | | | | | | |
| Carrying amount of the hedging instrument |
| At 31 December 2022 | Contract/
notional
amount
£m | Assets
£m | Liabilities
£m | Changes in fair
value used for
calculating
hedge
ineffectiveness
£m |
| Fair value hedges | | | | |
| Interest rate | | | | |
| Currency swaps | 35 | | 1 | | – | | (2) | |
| Interest rate swaps | 152,662 | | 10 | | 503 | | 1,286 | |
| Cash flow hedges | | | | |
| Foreign exchange | | | | |
| Currency swaps | 1,542 | | 63 | | 21 | | 198 | |
| Interest rate | | | | |
| Interest rate swaps | 249,703 | | 1 | | 3 | | (6,990) | |
All amounts are held within derivative financial instruments.
| | | | | | | | |
F-65 | Lloyds Banking Group plc Annual Report on Form 20-F 2023 | |
Notes to the consolidated financial statements continued
for the year ended 31 December
Note 22: Derivative financial instruments continued
The Group’s hedged items are as follows:
| | | | | | | | | | | | | | | | | | | | | | | | | | | | | | | | | | | | | | | | | |
| Carrying amount of
the hedged item | | Accumulated amount of
fair value adjustment on
the hedged item | | Change in fair
value of hedged
item for
ineffectiveness
assessment
£m | | Cash flow hedging reserve |
| | | | Continuing
hedges
£m | | Discontinued
hedges
£m |
| At 31 December 2023 | Assets
£m | | Liabilities
£m | | Assets
£m | | Liabilities
£m | | | |
| Fair value hedges | | | | | | | | | | | | | |
| Interest rate | | | | | | | | | | | | | |
Fixed rate mortgages1 | 75,871 | | | – | | | 25 | | | – | | | 2,544 | | | | | |
Fixed rate issuance2 | – | | | 50,466 | | | – | | | 1,365 | | | (1,110) | | | | | |
Fixed rate bonds3 | 24,146 | | | – | | | (331) | | | – | | | 962 | | | | | |
| Cash flow hedges | | | | | | | | | | | | | |
| Foreign exchange | | | | | | | | | | | | | |
Foreign currency issuance2 | | | | | | | | | 138 | | | 8 | | | 69 | |
Customer deposits4 | | | | | | | | | – | | | – | | | 3 | |
| Interest rate | | | | | | | | | | | | | |
Customer loans1 | | | | | | | | | (1,796) | | | (2,934) | | | (1,885) | |
Central bank balances5 | | | | | | | | | (648) | | | (624) | | | (1,462) | |
Customer deposits4 | | | | | | | | | 262 | | | 1,591 | | | (3) | |
| | | | | | | | | | | | | | | | | | | | | | | | | | | | | | | | | | | | | | | | | |
| Carrying amount of
the hedged item | | Accumulated amount of
fair value adjustment on
the hedged item | | Change in fair
value of hedged
item for
ineffectiveness
assessment
£m | | Cash flow hedging reserve |
| | | | Continuing
hedges
£m | | Discontinued
hedges
£m |
| At 31 December 2022 | Assets
£m | | Liabilities
£m | | Assets
£m | | Liabilities
£m | | | |
| Fair value hedges | | | | | | | | | | | | | |
| Interest rate | | | | | | | | | | | | | |
Fixed rate mortgages1 | 73,282 | | | – | | | (2,602) | | | – | | | (3,198) | | | | | |
Fixed rate issuance2 | – | | | 52,190 | | | – | | | 2,392 | | | 4,223 | | | | | |
Fixed rate bonds3 | 19,259 | | | – | | | (1,549) | | | – | | | (2,350) | | | | | |
| Cash flow hedges | | | | | | | | | | | | | |
| Foreign exchange | | | | | | | | | | | | | |
Foreign currency issuance2 | | | | | | | | | (198) | | | 134 | | | 90 | |
Customer deposits4 | | | | | | | | | – | | | – | | | 3 | |
| Interest rate | | | | | | | | | | | | | |
Customer loans1 | | | | | | | | | 5,636 | | | (5,587) | | | (868) | |
Central bank balances5 | | | | | | | | | 2,703 | | | (2,130) | | | (965) | |
Customer deposits4 | | | | | | | | | (1,295) | | | 1,781 | | | (76) | |
1 Included within loans and advances to customers.
2 Included within debt securities in issue at amortised cost.
3 Included within financial assets at amortised cost and financial assets at fair value through other comprehensive income.
4 Included within customer deposits.
5 Included within cash and balances at central banks.
The accumulated amount of fair value hedge adjustments remaining on the balance sheet for hedged items that have ceased to be adjusted for hedging gains and losses is a liability of £1,446 million relating to fixed rate issuances of £656 million and mortgages of £790 million (2022: liability of £1,988 million relating to fixed rate issuances of £760 million and mortgages of £1,228 million).
| | | | | | | | |
F-66 | Lloyds Banking Group plc Annual Report on Form 20-F 2023 | |
Notes to the consolidated financial statements continued
for the year ended 31 December
Note 22: Derivative financial instruments continued
Gains and losses arising from hedge accounting are summarised as follows:
| | | | | | | | | | | | | | | | | | | | | | | | | | | | | |
| Gain (loss)
recognised
in other
comprehensive
income
£m | | Hedge ineffectiveness recognised in the income statement1 £m | | Amounts reclassified from reserves
to income statement as: |
| At 31 December 2023 | | | Hedged
cash flows
will no
longer
occur
£m | | Hedged
item
affected
income
statement
£m | | Income
statement
line item
that includes
reclassified
amount |
| Fair value hedges | | | | | | | | | |
| Interest rate | | | | | | | | | |
| Fixed rate mortgages | | | (264) | | | | | | | |
| Fixed rate issuance | | | (17) | | | | | | | |
| Fixed rate bonds | | | 14 | | | | | | | |
| Cash flow hedges | | | | | | | | | |
| Foreign exchange | | | | | | | | | |
| Foreign currency issuance | (138) | | | – | | | – | | | (9) | | | Interest expense |
| Customer deposits | – | | | – | | | – | | | – | | | Interest expense |
| Interest rate | | | | | | | | | |
| Customer loans | (37) | | | 20 | | | – | | | 1,674 | | | Interest income |
| Central bank balances | 284 | | | 2 | | | – | | | 725 | | | Interest income |
| Customer deposits | 436 | | | (3) | | | – | | | (552) | | | Interest expense |
| | | | | | | | | | | | | | | | | | | | | | | | | | | | | |
| Gain (loss)
recognised
in other
comprehensive
income
£m | | Hedge ineffectiveness recognised in the income statement1 £m | | Amounts reclassified from reserves
to income statement as: |
| At 31 December 2022 | | | Hedged
cash flows
will no
longer
occur
£m | | Hedged
item
affected
income
statement
£m | | Income
statement
line item
that includes
reclassified
amount |
| Fair value hedges | | | | | | | | | |
| Interest rate | | | | | | | | | |
| Fixed rate mortgages | | | 22 | | | | | | | |
| Fixed rate issuance | | | (49) | | | | | | | |
| Fixed rate bonds | | | (14) | | | | | | | |
| Cash flow hedges | | | | | | | | | |
| Foreign exchange | | | | | | | | | |
| Foreign currency issuance | 198 | | | – | | | – | | | (22) | | | Interest expense |
| Customer deposits | 3 | | | – | | | – | | | – | | | Interest expense |
| Interest rate | | | | | | | | | |
| Customer loans | (6,145) | | | (30) | | | – | | | 53 | | | Interest income |
| Central bank balances | (2,831) | | | – | | | – | | | 26 | | | Interest income |
| Customer deposits | 1,785 | | | 20 | | | – | | | (14) | | | Interest expense |
1 Hedge ineffectiveness is included in the income statement within net trading income.
There was no gain or loss in either 2023 or 2022 reclassified from the cash flow hedging reserve for which hedge accounting had previously been used but for which the hedged future cash flows are no longer expected to occur.
| | | | | | | | |
F-67 | Lloyds Banking Group plc Annual Report on Form 20-F 2023 | |
Notes to the consolidated financial statements continued
for the year ended 31 December
Note 23: Loans and advances to customers
Year ended 31 December 2023
| | | | | | | | | | | | | | | | | | | | | | | | | | | | | | | | | | | | | | | | | | | | | | | | | | | | | | | | | | | |
| Gross carrying amount | | Allowance for expected credit losses |
| Stage 1
£m | | Stage 2
£m | | Stage 3
£m | | POCI
£m | | Total
£m | | Stage 1
£m | | Stage 2
£m | | Stage 3
£m | | POCI
£m | | Total
£m |
| | | | | | | | | | | | | | | | | | | |
| | | | | | | | | | | | | | | | | | | |
| | | | | | | | | | | | | | | | | | | |
| | | | | | | | | | | | | | | | | | | |
| | | | | | | | | | | | | | | | | | | |
| | | | | | | | | | | | | | | | | | | |
| | | | | | | | | | | | | | | | | | | |
| | | | | | | | | | | | | | | | | | | |
| | | | | | | | | | | | | | | | | | | |
| | | | | | | | | | | | | | | | | | | |
| | | | | | | | | | | | | | | | | | | |
| | | | | | | | | | | | | | | | | | | |
| | | | | | | | | | | | | | | | | | | |
| | | | | | | | | | | | | | | | | | | |
| | | | | | | | | | | | | | | | | | | |
| | | | | | | | | | | | | | | | | | |
| At 1 January 2023 | 380,991 | | | 61,164 | | | 7,640 | | | 9,622 | | | 459,417 | | | 700 | | | 1,808 | | | 1,757 | | | 253 | | | 4,518 | |
Exchange and other adjustments1 | 1,830 | | | (24) | | | (6) | | | 18 | | | 1,818 | | | (7) | | | (1) | | | 105 | | | 67 | | | 164 | |
| | | | | | | | | | | | | | | | | | | |
| Transfers to Stage 1 | 18,991 | | | (18,953) | | | (38) | | | | | – | | | 401 | | | (393) | | | (8) | | | | | – | |
| Transfers to Stage 2 | (18,010) | | | 18,592 | | | (582) | | | | | – | | | (53) | | | 121 | | | (68) | | | | | – | |
| Transfers to Stage 3 | (1,216) | | | (2,507) | | | 3,723 | | | | | – | | | (13) | | | (223) | | | 236 | | | | | – | |
| Impact of transfers between stages | (235) | | | (2,868) | | | 3,103 | | | | | – | | | (260) | | | 402 | | | 312 | | | | | 454 | |
| | | | | | | | | | | 75 | | | (93) | | | 472 | | | | | 454 | |
Other changes in credit quality2 | | | | | | | | | | | 105 | | | (103) | | | 804 | | | 8 | | | 814 | |
| Additions and repayments | 6,393 | | | (4,213) | | | (2,353) | | | (1,043) | | | (1,216) | | | 81 | | | (85) | | | (862) | | | (81) | | | (947) | |
| Charge (credit) to the income statement | | | | | | | | | | | 261 | | | (281) | | | 414 | | | (73) | | | 321 | |
Disposals and derecognition3 | (3,685) | | | (892) | | | (122) | | | (743) | | | (5,442) | | | (54) | | | (59) | | | (24) | | | (34) | | | (171) | |
| Advances written off | | | | | (1,231) | | | – | | | (1,231) | | | | | | | (1,231) | | | – | | | (1,231) | |
| Recoveries of advances written off in previous years | | | | | 116 | | | – | | | 116 | | | | | | | 116 | | | – | | | 116 | |
| At 31 December 2023 | 385,294 | | | 53,167 | | | 7,147 | | | 7,854 | | | 453,462 | | | 900 | | | 1,467 | | | 1,137 | | | 213 | | | 3,717 | |
| Allowance for impairment losses | (900) | | | (1,467) | | | (1,137) | | | (213) | | | (3,717) | | | | | | | | | | | |
| Net carrying amount | 384,394 | | | 51,700 | | | 6,010 | | | 7,641 | | | 449,745 | | | | | | | | | | | |
Drawn ECL coverage4 (%) | 0.2 | | | 2.8 | | | 15.9 | | | 2.7 | | | 0.8 | | | | | | | | | | | |
| | | | | | | | | | | | | | | | | | | |
| | | | | | | | | | | | | | | | | | | |
| | | | | | | | | | | | | | | | | | | |
| | | | | | | | | | | | | | | | | | | |
| | | | | | | | | | | | | | | | | | | |
1 Exchange and other adjustments includes the impact of movements in exchange rates, discount unwind, derecognising assets as a result of modifications and adjustments in respect of purchased or originated credit-impaired financial assets (POCI). Where a POCI asset’s expected credit loss is less than its expected credit loss on purchase or origination, the increase in its carrying value is recognised within gross loans, rather than as a negative impairment allowance.
2 Includes a charge for methodology and model changes of £60 million, split by stage as £96 million charge for Stage 1, £33 million credit for Stage 2, £1 million credit for Stage 3 and £2 million credit for POCI.
3 Relates to the securitisations of legacy Retail mortgages and Retail unsecured loans.
4 Allowance for expected credit losses on loans and advances to customers as a percentage of gross loans and advances to customers.
The total allowance for impairment losses includes £187 million (2022: £92 million) in respect of residual value impairment and voluntary terminations within the Group’s UK Motor Finance business.
Movements in Retail UK mortgage balances were as follows:
| | | | | | | | | | | | | | | | | | | | | | | | | | | | | | | | | | | | | | | | | | | | | | | | | | | | | | | | | | | |
| Gross carrying amount | | Allowance for expected credit losses |
| Stage 1
£m | | Stage 2
£m | | Stage 3
£m | | POCI
£m | | Total
£m | | Stage 1
£m | | Stage 2
£m | | Stage 3
£m | | POCI
£m | | Total
£m |
| Retail – UK mortgages | | | | | | | | | | | | | | | | | | | |
| At 1 January 2023 | 257,517 | | | 41,783 | | | 3,416 | | | 9,622 | | | 312,338 | | | 91 | | | 552 | | | 311 | | | 253 | | | 1,207 | |
Exchange and other adjustments1 | – | | | – | | | – | | | 18 | | | 18 | | | – | | | – | | | 53 | | | 67 | | | 120 | |
| | | | | | | | | | | | | | | | | | | |
| Transfers to Stage 1 | 12,202 | | | (12,195) | | | (7) | | | | | – | | | 66 | | | (65) | | | (1) | | | | | – | |
| Transfers to Stage 2 | (12,673) | | | 13,103 | | | (430) | | | | | – | | | (7) | | | 33 | | | (26) | | | | | – | |
| Transfers to Stage 3 | (450) | | | (1,656) | | | 2,106 | | | | | – | | | – | | | (66) | | | 66 | | | | | – | |
| Impact of transfers between stages | (921) | | | (748) | | | 1,669 | | | | | – | | | (50) | | | 91 | | | 115 | | | | | 156 | |
| | | | | | | | | | | 9 | | | (7) | | | 154 | | | | | 156 | |
Other changes in credit quality2 | | | | | | | | | | | 43 | | | (104) | | | 14 | | | 8 | | | (39) | |
| Additions and repayments | 1,202 | | | (1,955) | | | (553) | | | (1,043) | | | (2,349) | | | 19 | | | (49) | | | (67) | | | (81) | | | (178) | |
| Charge (credit) to the income statement | | | | | | | | | | | 71 | | | (160) | | | 101 | | | (73) | | | (61) | |
Disposals and derecognition3 | (1,202) | | | (547) | | | (94) | | | (743) | | | (2,586) | | | (1) | | | (18) | | | (7) | | | (34) | | | (60) | |
| Advances written off | | | | | (108) | | | – | | | (108) | | | | | | | (108) | | | – | | | (108) | |
| Recoveries of advances written off in previous years | | | | | 7 | | | – | | | 7 | | | | | | | 7 | | | – | | | 7 | |
| At 31 December 2023 | 256,596 | | | 38,533 | | | 4,337 | | | 7,854 | | | 307,320 | | | 161 | | | 374 | | | 357 | | | 213 | | | 1,105 | |
| Allowance for impairment losses | (161) | | | (374) | | | (357) | | | (213) | | | (1,105) | | | | | | | | | | | |
| Net carrying amount | 256,435 | | | 38,159 | | | 3,980 | | | 7,641 | | | 306,215 | | | | | | | | | | | |
Drawn ECL coverage4 (%) | 0.1 | | | 1.0 | | | 8.2 | | | 2.7 | | | 0.4 | | | | | | | | | | | |
1 Exchange and other adjustments includes the impact of movements in exchange rates, discount unwind, derecognising assets as a result of modifications and adjustments in respect of purchased or originated credit-impaired financial assets (POCI). Where a POCI asset’s expected credit loss is less than its expected credit loss on purchase or origination, the increase in its carrying value is recognised within gross loans, rather than as a negative impairment allowance.
2 Includes a charge for methodology and model changes of £74 million, split by stage as £91 million charge for Stage 1, £12 million credit for Stage 2, £3 million credit for Stage 3 and £2 million credit for POCI.
3 Relates to the securitisation of legacy Retail mortgages.
4 Allowance for expected credit losses on loans and advances to customers as a percentage of gross loans and advances to customers.
| | | | | | | | |
F-68 | Lloyds Banking Group plc Annual Report on Form 20-F 2023 | |
Notes to the consolidated financial statements continued
for the year ended 31 December
Note 23: Loans and advances to customers continued
Movements in Retail credit cards were as follows:
| | | | | | | | | | | | | | | | | | | | | | | | | | | | | | | | | | | | | | | | | | | | | | | | | | | |
| Gross carrying amount | | Allowance for expected credit losses |
| Stage 1
£m | | Stage 2
£m | | Stage 3
£m | | | | Total
£m | | Stage 1
£m | | Stage 2
£m | | Stage 3
£m | | | | Total
£m |
| Retail – credit cards | | | | | | | | | | | | | | | | | | | |
| At 1 January 2023 | 11,416 | | | 3,287 | | | 289 | | | | | 14,992 | | | 120 | | | 433 | | | 113 | | | | | 666 | |
| Exchange and other adjustments | – | | | – | | | – | | | | | – | | | – | | | – | | | (16) | | | | | (16) | |
| | | | | | | | | | | | | | | | | | | |
| Transfers to Stage 1 | 1,311 | | | (1,308) | | | (3) | | | | | – | | | 142 | | | (141) | | | (1) | | | | | – | |
| Transfers to Stage 2 | (744) | | | 782 | | | (38) | | | | | – | | | (11) | | | 28 | | | (17) | | | | | – | |
| Transfers to Stage 3 | (172) | | | (266) | | | 438 | | | | | – | | | (4) | | | (69) | | | 73 | | | | | – | |
| Impact of transfers between stages | 395 | | | (792) | | | 397 | | | | | – | | | (80) | | | 125 | | | 80 | | | | | 125 | |
| | | | | | | | | | | 47 | | | (57) | | | 135 | | | | | 125 | |
Other changes in credit quality1 | | | | | | | | | | | 15 | | | 9 | | | 298 | | | | | 322 | |
| Additions and repayments | 814 | | | 413 | | | (13) | | | | | 1,214 | | | (14) | | | 16 | | | (11) | | | | | (9) | |
| Charge to the income statement | | | | | | | | | | | 48 | | | (32) | | | 422 | | | | | 438 | |
| Advances written off | | | | | (449) | | | | | (449) | | | | | | | (449) | | | | | (449) | |
| Recoveries of advances written off in previous years | | | | | 60 | | | | | 60 | | | | | | | 60 | | | | | 60 | |
| At 31 December 2023 | 12,625 | | | 2,908 | | | 284 | | | | | 15,817 | | | 168 | | | 401 | | | 130 | | | | | 699 | |
| Allowance for impairment losses | (168) | | | (401) | | | (130) | | | | | (699) | | | | | | | | | | | |
| Net carrying amount | 12,457 | | | 2,507 | | | 154 | | | | | 15,118 | | | | | | | | | | | |
Drawn ECL coverage2 (%) | 1.3 | | | 13.8 | | | 45.8 | | | | | 4.4 | | | | | | | | | | | |
1 Includes a credit for methodology and model changes of £18 million, split by stage as £2 million charge for Stage 1, £20 million credit for Stage 2 and £nil for Stage 3.
2 Allowance for expected credit losses on loans and advances to customers as a percentage of gross loans and advances to customers.
Movements in Commercial Banking lending were as follows:
| | | | | | | | | | | | | | | | | | | | | | | | | | | | | | | | | | | | | | | | | | | | | | | | | | | |
| Gross carrying amount | | Allowance for expected credit losses |
| Stage 1
£m | | Stage 2
£m | | Stage 3
£m | | | | Total
£m | | Stage 1
£m | | Stage 2
£m | | Stage 3
£m | | | | Total
£m |
| Commercial Banking | | | | | | | | | | | | | | | | | | | |
| At 1 January 2023 | 80,509 | | | 11,493 | | | 3,371 | | | | | 95,373 | | | 214 | | | 414 | | | 1,070 | | | | | 1,698 | |
| Exchange and other adjustments | (968) | | | (14) | | | (6) | | | | | (988) | | | (6) | | | – | | | 83 | | | | | 77 | |
| | | | | | | | | | | | | | | | | | | |
| Transfers to Stage 1 | 4,026 | | | (4,011) | | | (15) | | | | | – | | | 101 | | | (101) | | | – | | | | | – | |
| Transfers to Stage 2 | (3,074) | | | 3,143 | | | (69) | | | | | – | | | (16) | | | 19 | | | (3) | | | | | – | |
| Transfers to Stage 3 | (369) | | | (327) | | | 696 | | | | | – | | | (3) | | | (26) | | | 29 | | | | | – | |
| Impact of transfers between stages | 583 | | | (1,195) | | | 612 | | | | | – | | | (76) | | | 117 | | | 32 | | | | | 73 | |
| | | | | | | | | | | 6 | | | 9 | | | 58 | | | | | 73 | |
| Other changes in credit quality | | | | | | | | | | | 17 | | | 9 | | | 230 | | | | | 256 | |
| Additions and repayments | (550) | | | (2,297) | | | (1,657) | | | | | (4,504) | | | 1 | | | (60) | | | (771) | | | | | (830) | |
| Charge to the income statement | | | | | | | | | | | 24 | | | (42) | | | (483) | | | | | (501) | |
| Advances written off | | | | | (256) | | | | | (256) | | | | | | | (256) | | | | | (256) | |
| Recoveries of advances written off in previous years | | | | | 4 | | | | | 4 | | | | | | | 4 | | | | | 4 | |
| At 31 December 2023 | 79,574 | | | 7,987 | | | 2,068 | | | | | 89,629 | | | 232 | | | 372 | | | 418 | | | | | 1,022 | |
| Allowance for impairment losses | (232) | | | (372) | | | (418) | | | | | (1,022) | | | | | | | | | | | |
| Net carrying amount | 79,342 | | | 7,615 | | | 1,650 | | | | | 88,607 | | | | | | | | | | | |
Drawn ECL coverage1 (%) | 0.3 | | | 4.7 | | | 20.2 | | | | | 1.1 | | | | | | | | | | | |
1 Allowance for expected credit losses on loans and advances to customers as a percentage of gross loans and advances to customers.
| | | | | | | | |
F-69 | Lloyds Banking Group plc Annual Report on Form 20-F 2023 | |
Notes to the consolidated financial statements continued
for the year ended 31 December
Note 23: Loans and advances to customers continued
Year ended 31 December 2022
| | | | | | | | | | | | | | | | | | | | | | | | | | | | | | | | | | | | | | | | | | | | | | | | | | | | | | | | | | | |
| Gross carrying amount | | Allowance for expected credit losses |
| Stage 1
£m | | Stage 2
£m | | Stage 3
£m | | POCI
£m | | Total
£m | | Stage 1
£m | | Stage 2
£m | | Stage 3
£m | | POCI
£m | | Total
£m |
| | | | | | | | | | | | | | | | | | | |
| | | | | | | | | | | | | | | | | | | |
| | | | | | | | | | | | | | | | | | | |
| | | | | | | | | | | | | | | | | | | |
| | | | | | | | | | | | | | | | | | | |
| | | | | | | | | | | | | | | | | | | |
| | | | | | | | | | | | | | | | | | | |
| | | | | | | | | | | | | | | | | | | |
| | | | | | | | | | | | | | | | | | | |
| | | | | | | | | | | | | | | | | | | |
| | | | | | | | | | | | | | | | | | | |
| | | | | | | | | | | | | | | | | | | |
| | | | | | | | | | | | | | | | | | | |
| | | | | | | | | | | | | | | | | | | |
| | | | | | | | | | | | | | | | | | | |
| | | | | | | | | | | | | | | | | | |
| At 1 January 2022 | 400,036 | | | 34,931 | | | 6,443 | | | 10,977 | | | 452,387 | | | 915 | | | 1,114 | | | 1,581 | | | 210 | | | 3,820 | |
Exchange and other adjustments1 | (393) | | | 15 | | | (23) | | | 12 | | | (389) | | | 2 | | | – | | | 39 | | | 65 | | | 106 | |
| | | | | | | | | | | | | | | | | | | |
| Transfers to Stage 1 | 8,330 | | | (8,257) | | | (73) | | | | | – | | | 176 | | | (167) | | | (9) | | | | | – | |
| Transfers to Stage 2 | (35,046) | | | 35,448 | | | (402) | | | | | – | | | (66) | | | 135 | | | (69) | | | | | – | |
| Transfers to Stage 3 | (1,250) | | | (2,528) | | | 3,778 | | | | | – | | | (8) | | | (158) | | | 166 | | | | | – | |
| Impact of transfers between stages | (27,966) | | | 24,663 | | | 3,303 | | | | | – | | | (120) | | | 701 | | | 268 | | | | | 849 | |
| | | | | | | | | | | (18) | | | 511 | | | 356 | | | | | 849 | |
Other changes in credit quality2 | | | | | | | | | | | (309) | | | 85 | | | 618 | | | 49 | | | 443 | |
| Additions and repayments | 9,314 | | | 1,555 | | | (1,337) | | | (1,354) | | | 8,178 | | | 110 | | | 98 | | | (91) | | | (58) | | | 59 | |
| (Credit) charge to the income statement | | | | | | | | | | | (217) | | | 694 | | | 883 | | | (9) | | | 1,351 | |
| Advances written off | | | | | (928) | | | (13) | | | (941) | | | | | | | (928) | | | (13) | | | (941) | |
| Recoveries of advances written off in previous years | | | | | 182 | | | – | | | 182 | | | | | | | 182 | | | – | | | 182 | |
| At 31 December 2022 | 380,991 | | | 61,164 | | | 7,640 | | | 9,622 | | | 459,417 | | | 700 | | | 1,808 | | | 1,757 | | | 253 | | | 4,518 | |
| Allowance for impairment losses | (700) | | | (1,808) | | | (1,757) | | | (253) | | | (4,518) | | | | | | | | | | | |
| Net carrying amount | 380,291 | | | 59,356 | | | 5,883 | | | 9,369 | | | 454,899 | | | | | | | | | | | |
Drawn ECL coverage3 (%) | 0.2 | | | 3.0 | | | 23.0 | | | 2.6 | | | 1.0 | | | | | | | | | | | |
| | | | | | | | | | | | | | | | | | | |
| | | | | | | | | | | | | | | | | | | |
| | | | | | | | | | | | | | | | | | | |
| | | | | | | | | | | | | | | | | | | |
| | | | | | | | | | | | | | | | | | | |
1 Exchange and other adjustments includes the impact of movements in exchange rates, discount unwind, derecognising assets as a result of modifications and adjustments in respect of purchased or originated credit-impaired financial assets (POCI). Where a POCI asset’s expected credit loss is less than its expected credit loss on purchase or origination, the increase in its carrying value is recognised within gross loans, rather than as a negative impairment allowance.
2 Includes a credit for methodology and model changes of £63 million, split by stage as £2 million charge for Stage 1, £11 million charge for Stage 2, £47 million credit for Stage 3 and £29 million credit for POCI.
3 Allowance for expected credit losses on loans and advances to customers as a percentage of gross loans and advances to customers.
Movements in Retail UK mortgage balances were as follows:
| | | | | | | | | | | | | | | | | | | | | | | | | | | | | | | | | | | | | | | | | | | | | | | | | | | | | | | | | | | |
| Gross carrying amount | | Allowance for expected credit losses |
| Stage 1
£m | | Stage 2
£m | | Stage 3
£m | | POCI
£m | | Total
£m | | Stage 1
£m | | Stage 2
£m | | Stage 3
£m | | POCI
£m | | Total
£m |
| Retail – UK mortgages | | | | | | | | | | | | | | | | | | | |
| At 1 January 2022 | 273,629 | | | 21,798 | | | 1,940 | | | 10,977 | | | 308,344 | | | 48 | | | 394 | | | 184 | | | 210 | | | 836 | |
Exchange and other adjustments1 | – | | | – | | | – | | | 12 | | | 12 | | | – | | | – | | | 28 | | | 65 | | | 93 | |
| | | | | | | | | | | | | | | | | | | |
| Transfers to Stage 1 | 5,107 | | | (5,096) | | | (11) | | | | | – | | | 28 | | | (27) | | | (1) | | | | | – | |
| Transfers to Stage 2 | (26,043) | | | 26,204 | | | (161) | | | | | – | | | (14) | | | 25 | | | (11) | | | | | – | |
| Transfers to Stage 3 | (444) | | | (1,793) | | | 2,237 | | | | | – | | | – | | | (63) | | | 63 | | | | | – | |
| Impact of transfers between stages | (21,380) | | | 19,315 | | | 2,065 | | | | | – | | | (25) | | | 254 | | | 98 | | | | | 327 | |
| | | | | | | | | | | (11) | | | 189 | | | 149 | | | | | 327 | |
Other changes in credit quality2 | | | | | | | | | | | 36 | | | (21) | | | (1) | | | 49 | | | 63 | |
| Additions and repayments | 5,268 | | | 670 | | | (585) | | | (1,354) | | | 3,999 | | | 18 | | | (10) | | | (45) | | | (58) | | | (95) | |
| Charge (credit) to the income statement | | | | | | | | | | | 43 | | | 158 | | | 103 | | | (9) | | | 295 | |
| Advances written off | | | | | (28) | | | (13) | | | (41) | | | | | | | (28) | | | (13) | | | (41) | |
| Recoveries of advances written off in previous years | | | | | 24 | | | – | | | 24 | | | | | | | 24 | | | – | | | 24 | |
| At 31 December 2022 | 257,517 | | | 41,783 | | | 3,416 | | | 9,622 | | | 312,338 | | | 91 | | | 552 | | | 311 | | | 253 | | | 1,207 | |
| Allowance for impairment losses | (91) | | | (552) | | | (311) | | | (253) | | | (1,207) | | | | | | | | | | | |
| Net carrying amount | 257,426 | | | 41,231 | | | 3,105 | | | 9,369 | | | 311,131 | | | | | | | | | | | |
Drawn ECL coverage3 (%) | – | | | 1.3 | | | 9.1 | | | 2.6 | | | 0.4 | | | | | | | | | | | |
1 Exchange and other adjustments includes the impact of movements in exchange rates, discount unwind, derecognising assets as a result of modifications and adjustments in respect of purchased or originated credit-impaired financial assets (POCI). Where a POCI asset’s expected credit loss is less than its expected credit loss on purchase or origination, the increase in its carrying value is recognised within gross loans, rather than as a negative impairment allowance.
2 Includes a credit for methodology and model changes of £96 million, split by stage as £nil for Stage 1, £12 million credit for Stage 2, £55 million credit for Stage 3 and £29 million credit for POCI.
3 Allowance for expected credit losses on loans and advances to customers as a percentage of gross loans and advances to customers.
| | | | | | | | |
F-70 | Lloyds Banking Group plc Annual Report on Form 20-F 2023 | |
Notes to the consolidated financial statements continued
for the year ended 31 December
Note 23: Loans and advances to customers continued
Movements in Retail credit cards were as follows:
| | | | | | | | | | | | | | | | | | | | | | | | | | | | | | | | | | | | | | | | | | | | | | | | | | | |
| Gross carrying amount | | Allowance for expected credit losses |
| Stage 1
£m | | Stage 2
£m | | Stage 3
£m | | | | Total
£m | | Stage 1
£m | | Stage 2
£m | | Stage 3
£m | | | | Total
£m |
| Retail – credit cards | | | | | | | | | | | | | | | | | | | |
| At 1 January 2022 | 11,918 | | | 2,077 | | | 292 | | | | | 14,287 | | | 96 | | | 218 | | | 128 | | | | | 442 | |
| Exchange and other adjustments | (13) | | | (2) | | | – | | | | | (15) | | | 4 | | | 2 | | | (16) | | | | | (10) | |
| | | | | | | | | | | | | | | | | | | |
| Transfers to Stage 1 | 569 | | | (566) | | | (3) | | | | | – | | | 48 | | | (47) | | | (1) | | | | | – | |
| Transfers to Stage 2 | (1,319) | | | 1,358 | | | (39) | | | | | – | | | (16) | | | 36 | | | (20) | | | | | – | |
| Transfers to Stage 3 | (184) | | | (191) | | | 375 | | | | | – | | | (3) | | | (43) | | | 46 | | | | | – | |
| Impact of transfers between stages | (934) | | | 601 | | | 333 | | | | | – | | | (26) | | | 185 | | | 73 | | | | | 232 | |
| | | | | | | | | | | 3 | | | 131 | | | 98 | | | | | 232 | |
Other changes in credit quality1 | | | | | | | | | | | 18 | | | 49 | | | 230 | | | | | 297 | |
| Additions and repayments | 445 | | | 611 | | | (14) | | | | | 1,042 | | | (1) | | | 33 | | | (5) | | | | | 27 | |
| Charge to the income statement | | | | | | | | | | | 20 | | | 213 | | | 323 | | | | | 556 | |
| Advances written off | | | | | (413) | | | | | (413) | | | | | | | (413) | | | | | (413) | |
| Recoveries of advances written off in previous years | | | | | 91 | | | | | 91 | | | | | | | 91 | | | | | 91 | |
| At 31 December 2022 | 11,416 | | | 3,287 | | | 289 | | | | | 14,992 | | | 120 | | | 433 | | | 113 | | | | | 666 | |
| Allowance for impairment losses | (120) | | | (433) | | | (113) | | | | | (666) | | | | | | | | | | | |
| Net carrying amount | 11,296 | | | 2,854 | | | 176 | | | | | 14,326 | | | | | | | | | | | |
Drawn ECL coverage2 (%) | 1.1 | | | 13.2 | | | 39.1 | | | | | 4.4 | | | | | | | | | | | |
1 Includes a charge for methodology and model changes of £33 million, split by stage as £3 million charge for Stage 1, £27 million charge for Stage 2 and £3 million charge for Stage 3.
2 Allowance for expected credit losses on loans and advances to customers as a percentage of gross loans and advances to customers.
Movements in Commercial Banking lending were as follows:
| | | | | | | | | | | | | | | | | | | | | | | | | | | | | | | | | | | | | | | | | | | | | | | | | | | |
| Gross carrying amount | | Allowance for expected credit losses |
| Stage 1
£m | | Stage 2
£m | | Stage 3
£m | | | | Total
£m | | Stage 1
£m | | Stage 2
£m | | Stage 3
£m | | | | Total
£m |
| Commercial Banking | | | | | | | | | | | | | | | | | | | |
| At 1 January 2022 | 82,719 | | | 7,530 | | | 3,563 | | | | | 93,812 | | | 125 | | | 260 | | | 956 | | | | | 1,341 | |
| Exchange and other adjustments | 748 | | | 6 | | | (20) | | | | | 734 | | | 4 | | | (2) | | | 41 | | | | | 43 | |
| | | | | | | | | | | | | | | | | | | |
| Transfers to Stage 1 | 1,723 | | | (1,676) | | | (47) | | | | | – | | | 55 | | | (55) | | | – | | | | | – | |
| Transfers to Stage 2 | (5,807) | | | 5,950 | | | (143) | | | | | – | | | (11) | | | 19 | | | (8) | | | | | – | |
| Transfers to Stage 3 | (404) | | | (326) | | | 730 | | | | | – | | | (2) | | | (14) | | | 16 | | | | | – | |
| Impact of transfers between stages | (4,488) | | | 3,948 | | | 540 | | | | | – | | | (44) | | | 131 | | | 7 | | | | | 94 | |
| | | | | | | | | | | (2) | | | 81 | | | 15 | | | | | 94 | |
Other changes in credit quality1 | | | | | | | | | | | 28 | | | 18 | | | 192 | | | | | 238 | |
| Additions and repayments | 1,530 | | | 9 | | | (587) | | | | | 952 | | | 59 | | | 57 | | | (9) | | | | | 107 | |
| Charge to the income statement | | | | | | | | | | | 85 | | | 156 | | | 198 | | | | | 439 | |
| Advances written off | | | | | (127) | | | | | (127) | | | | | | | (127) | | | | | (127) | |
| Recoveries of advances written off in previous years | | | | | 2 | | | | | 2 | | | | | | | 2 | | | | | 2 | |
| At 31 December 2022 | 80,509 | | | 11,493 | | | 3,371 | | | | | 95,373 | | | 214 | | | 414 | | | 1,070 | | | | | 1,698 | |
| Allowance for impairment losses | (214) | | | (414) | | | (1,070) | | | | | (1,698) | | | | | | | | | | | |
| Net carrying amount | 80,295 | | | 11,079 | | | 2,301 | | | | | 93,675 | | | | | | | | | | | |
Drawn ECL coverage2 (%) | 0.3 | | | 3.6 | | | 31.7 | | | | | 1.8 | | | | | | | | | | | |
1 Includes a credit for methodology and model changes of £25 million, split by stage as £7 million credit for Stage 1, £18 million credit for Stage 2 and £nil for Stage 3.
2 Allowance for expected credit losses on loans and advances to customers as a percentage of gross loans and advances to customers.
The movement tables are compiled by comparing the position at 31 December to that at the beginning of the year. Transfers between stages are deemed to have taken place at the start of the reporting period, with all other movements shown in the stage in which the asset is held at 31 December, with the exception of those held within purchased or originated credit-impaired, which are not transferable.
Additions and repayments comprise new loans originated and repayments of outstanding balances throughout the reporting period.
The Group’s impairment charge comprises impact of transfers between stages, other changes in credit quality and additions and repayments.
Advances written off have first been transferred to Stage 3 and then acquired a full allowance through other changes in credit quality.
Recoveries of advances written off in previous years are shown at the full recovered value, with a corresponding entry in repayments and release of allowance through other changes in credit quality.
| | | | | | | | |
F-71 | Lloyds Banking Group plc Annual Report on Form 20-F 2023 | |
Notes to the consolidated financial statements continued
for the year ended 31 December
Note 24: Allowance for expected credit losses
The Group recognises an allowance for expected credit losses (ECLs) for loans and advances to customers and banks, other financial assets held at amortised cost, financial assets (other than equity investments) measured at fair value through other comprehensive income and certain loan commitment and financial guarantee contracts. At 31 December 2023, the Group’s expected credit loss allowance was £4,084 million (2022: £4,903 million), of which £3,762 million (2022: £4,580 million) was in respect of drawn balances.
The Group’s total impairment allowances were as follows:
| | | | | | | | | | | | | | | | | | | | | | | | | | | | | | | | | | | | | | | | | | | | | | | | | | | | | | | | | | | |
| | | | | | | | | | | Allowance for expected credit losses |
At 31 December 2023 | | | | | | | | | | | Stage 1
£m | | Stage 2
£m | | Stage 3
£m | | POCI
£m | | Total
£m |
| In respect of: | | | | | | | | | | | | | | | | | | | |
| Loans and advances to banks | | | | | | | | | | | 8 | | | – | | | – | | | – | | | 8 | |
| UK mortgages | | | | | | | | | | | 161 | | | 374 | | | 357 | | | 213 | | | 1,105 | |
| Credit cards | | | | | | | | | | | 168 | | | 401 | | | 130 | | | – | | | 699 | |
| Other | | | | | | | | | | | 339 | | | 320 | | | 228 | | | – | | | 887 | |
| Retail | | | | | | | | | | | 668 | | | 1,095 | | | 715 | | | 213 | | | 2,691 | |
| Commercial Banking | | | | | | | | | | | 232 | | | 372 | | | 418 | | | – | | | 1,022 | |
| Other | | | | | | | | | | | – | | | – | | | 4 | | | – | | | 4 | |
| | | | | | | | | | | | | | | | | | | |
| Loans and advances to customers | | | | | | | | | | | 900 | | | 1,467 | | | 1,137 | | | 213 | | | 3,717 | |
| Debt securities | | | | | | | | | | | 7 | | | 2 | | | 2 | | | – | | | 11 | |
| Financial assets at amortised cost | | | | | | | | | | | 915 | | | 1,469 | | | 1,139 | | | 213 | | | 3,736 | |
| Other assets | | | | | | | | | | | 16 | | | – | | | 10 | | | – | | | 26 | |
| Provisions in relation to loan commitments and financial guarantees | | | | 160 | | | 160 | | | 2 | | | – | | | 322 | |
| Total | | | | | | | | | | | 1,091 | | | 1,629 | | | 1,151 | | | 213 | | | 4,084 | |
| Expected credit loss in respect of financial assets at fair value through other comprehensive income (memorandum item) | | | | 7 | | | – | | | – | | | – | | | 7 | |
| | | | | | | | | | | | | | | | | | | | | | | | | | | | | | | | | | | | | | | | | | | | | | | | | | | | | | | | | | | |
| | | | | | | | | | | Allowance for expected credit losses |
At 31 December 2022 | | | | | | | | | | | Stage 1
£m | | Stage 2
£m | | Stage 3
£m | | POCI
£m | | Total
£m |
| In respect of: | | | | | | | | | | | | | | | | | | | |
| Loans and advances to banks | | | | 13 | | | 2 | | | – | | | – | | | 15 | |
| UK mortgages | | | | | | | | | | | 91 | | | 552 | | | 311 | | | 253 | | | 1,207 | |
| Credit cards | | | | | | | | | | | 120 | | | 433 | | | 113 | | | – | | | 666 | |
| Other | | | | | | | | | | | 275 | | | 409 | | | 259 | | | – | | | 943 | |
| Retail | | | | | | | | | | | 486 | | | 1,394 | | | 683 | | | 253 | | | 2,816 | |
| Commercial Banking | | | | | | | | | | | 214 | | | 414 | | | 1,070 | | | – | | | 1,698 | |
| Other | | | | | | | | | | | – | | | – | | | 4 | | | – | | | 4 | |
| | | | | | | | | | | | | | | | | | | |
| Loans and advances to customers | | | | 700 | | | 1,808 | | | 1,757 | | | 253 | | | 4,518 | |
| Debt securities | | | | | | | | | | | 8 | | | – | | | 1 | | | – | | | 9 | |
| Financial assets at amortised cost | | | | | | | | | | | 721 | | | 1,810 | | | 1,758 | | | 253 | | | 4,542 | |
| Other assets | | | | | | | | | | | – | | | – | | | 38 | | | – | | | 38 | |
| Provisions in relation to loan commitments and financial guarantees | | | | 134 | | | 185 | | | 4 | | | – | | | 323 | |
| Total | | | | | | | | | | | 855 | | | 1,995 | | | 1,800 | | | 253 | | | 4,903 | |
| Expected credit loss in respect of financial assets at fair value through other comprehensive income (memorandum item) | | | | 9 | | | – | | | – | | | – | | | 9 | |
| | | | | | | | |
F-72 | Lloyds Banking Group plc Annual Report on Form 20-F 2023 | |
Notes to the consolidated financial statements continued
for the year ended 31 December
Note 24: Allowance for expected credit losses continued
The calculation of the Group’s expected credit loss allowances and provisions against loan commitments and guarantees, which are set out above, under IFRS 9 requires the Group to make a number of judgements, assumptions and estimates. The most significant are set out below:
Critical accounting judgements and key sources of estimation uncertainty
| | | | | |
| Critical judgements: | Determining an appropriate definition of default against which a probability of default, exposure at default and loss given default parameter can be evaluated |
| Establishing the criteria for a significant increase in credit risk (SICR) |
| The individual assessment of material cases and the use of judgemental adjustments made to impairment modelling processes that adjust inputs, parameters and outputs to reflect risks not captured by models |
| Key source of estimation uncertainty: | Base case and multiple economic scenarios (MES) assumptions, including the rate of unemployment and the rate of change of house prices, required for creation of MES scenarios and forward-looking credit parameters |
Definition of default
The probability of default (PD) of an exposure, both over a 12-month period and over its lifetime, is a key input to the measurement of the ECL allowance. Default has occurred when there is evidence that the customer is experiencing significant financial difficulty which is likely to affect the ability to repay amounts due. The definition of default adopted by the Group is described in note 2(H) Impairment of financial assets. IFRS 9 contains a rebuttable presumption that default occurs no later than when a payment is 90 days past due which the Group now uses for all its products following changes to the definition of default for UK mortgages on 1 January 2022. In addition, other indicators of mortgage default include end-of-term payments on past due interest-only accounts and loans considered in probation due to recent arrears or forbearance, aligning the definition of Stage 3 credit-impaired for IFRS 9 to the CRD IV prudential regulatory definition of default.
Significant increase in credit risk
An ECL allowance equivalent to 12 months’ expected losses is established against assets in Stage 1; assets classified as Stage 2 carry an ECL allowance equivalent to lifetime expected losses. Assets are transferred from Stage 1 to Stage 2 when there has been a significant increase in credit risk (SICR) since initial recognition. Credit-impaired assets are transferred to Stage 3 with a lifetime expected losses allowance. The Group uses both quantitative and qualitative indicators to determine whether there has been a SICR for an asset. For Retail, the following tables set out the retail master scale (RMS) grade triggers which result in a SICR for financial assets and the PD boundaries for each RMS grade.
SICR triggers for key Retail portfolios
| | | | | | | | | | | | | | | | | | | | | | | |
| Origination grade | 1 | 2 | 3 | 4 | 5 | 6 | 7 |
| Mortgages SICR grade | 5 | 5 | 6 | 7 | 8 | 9 | 10 |
| Credit cards, loans and overdrafts SICR grade | 4 | 5 | 6 | 7 | 8 | 9 | 10 |
| | | | | | | |
| | | | | | | | | | | | | | | | | | | | | | | | | | | | | | | | | | | | | | | | | | | | |
| RMS grade | 1 | 2 | 3 | 4 | 5 | 6 | 7 | 8 | 9 | 10 | 11 | 12 | 13 | 14 |
PD boundary1 (%) | 0.10 | | 0.40 | | 0.80 | | 1.20 | | 2.50 | | 4.50 | | 7.50 | | 10.00 | | 14.00 | | 20.00 | | 30.00 | | 45.00 | | 99.99 | | 100.00 | |
1 Probability-weighted annualised lifetime probability of default.
For Commercial a doubling of PD with a minimum increase in PD of 1 per cent and a resulting change in the underlying grade is treated as a SICR.
The Group uses the internal credit risk classification and watchlist as qualitative indicators to identify a SICR. The Group does not use the low credit risk exemption in its staging assessments. The use of a payment holiday in and of itself has not been judged to indicate a significant increase in credit risk, nor forbearance, with the underlying long-term credit risk deemed to be driven by economic conditions and captured through the use of forward-looking models. These portfolio level models are capturing the anticipated volume of increased defaults and therefore an appropriate assessment of staging and expected credit loss.
All financial assets are assumed to have suffered a SICR if they are more than 30 days past due; credit cards, loans and overdrafts financial assets are also assumed to have suffered a SICR if they are in arrears on three or more separate occasions in a rolling 12-month period. Financial assets are classified as credit-impaired if they are 90 days past due.
A Stage 3 asset that is no longer credit-impaired is transferred back to Stage 2 as no general probation period is applied to assets in Stage 3. UK mortgages is an exception to this rule where a probation period is enforced for non-performing, forborne and defaulted exposures in accordance with prudential regulation. If an exposure that is classified as Stage 2 no longer meets the SICR criteria, which in some cases capture customer behaviour in previous periods, it is moved back to Stage 1.
The setting of precise trigger points combined with risk indicators requires judgement. The use of different trigger points may have a material impact upon the size of the ECL allowance. The Group monitors the effectiveness of SICR criteria on an ongoing basis.
Lifetime of an exposure
A range of approaches, segmented by product type, has been adopted by the Group to estimate a product’s expected life. These include using the full contractual life and taking into account behavioural factors such as early repayments, extensions and refinancing. For non-revolving retail assets, the Group has assumed the expected life for each product to be the time taken for all significant losses to be observed. For revolving retail products, the Group has considered the losses beyond the contractual term over which the Group is exposed to credit risk. For commercial overdraft facilities, the average behavioural life has been used. Changes to the assumed expected lives of the Group’s assets could impact the ECL allowance recognised by the Group. The assessment of SICR and corresponding lifetime loss, and the PD, of a financial asset designated as Stage 2, or Stage 3, is dependent on its expected life.
| | | | | | | | |
F-73 | Lloyds Banking Group plc Annual Report on Form 20-F 2023 | |
Notes to the consolidated financial statements continued
for the year ended 31 December
Note 24: Allowance for expected credit losses continued
Individual assessments and application of judgement in adjustments to modelled ECL
The table below analyses total ECL allowances by portfolio, separately identifying the amounts that have been modelled, those that have been individually assessed and those arising through the application of judgemental adjustments.
| | | | | | | | | | | | | | | | | | | | | | | | | | | | | |
| Modelled
ECL
£m | | Individually
assessed
£m | | Judgements due to: | | Total
ECL
£m |
| | Inflationary
and interest
rate risk
£m | | Other1 £m | |
| At 31 December 2023 | | | | | | | | | |
| UK mortgages | 991 | | | – | | | 61 | | | 63 | | | 1,115 | |
| Credit cards | 703 | | | – | | | 92 | | | 15 | | | 810 | |
| Other Retail | 866 | | | – | | | 33 | | | 46 | | | 945 | |
| Commercial Banking | 1,124 | | | 340 | | | – | | | (282) | | | 1,182 | |
| Other | 32 | | | – | | | – | | | – | | | 32 | |
| Total | 3,716 | | | 340 | | | 186 | | | (158) | | | 4,084 | |
| At 31 December 2022 | | | | | | | | | |
| UK mortgages | 946 | | | – | | | 49 | | | 214 | | | 1,209 | |
| Credit cards | 698 | | | – | | | 93 | | | (28) | | | 763 | |
| Other Retail | 903 | | | – | | | 53 | | | 60 | | | 1,016 | |
| Commercial Banking | 972 | | | 1,008 | | | – | | | (111) | | | 1,869 | |
| Other | 46 | | | – | | | – | | | – | | | 46 | |
| Total | 3,565 | | | 1,008 | | | 195 | | | 135 | | | 4,903 | |
1 2022 includes £1 million which was previously reported within judgements due to COVID-19.
Individual assessed ECL
Stage 3 ECL in Commercial Banking is largely assessed on an individual basis by the Business Support Unit using bespoke assessment of loss for each specific client based on potential recovery strategies. While these assessments are based on the Group’s latest economic view, the use of Group-wide multiple economic scenarios and weightings is not considered appropriate for these cases due to their individual characteristics. In place of this, a range of case-specific outcomes are considered with any alternative better or worse outcomes that carry a 25 per cent likelihood taken into account in establishing a probability-weighted ECL. At 31 December 2023, individually assessed provisions for Commercial Banking were £340 million (2022: £1,008 million) which reflected a range of £291 million to £413 million (2022: £908 million to £1,140 million), based on the range of alternative outcomes considered.
Application of judgement in adjustments to modelled ECL
Impairment models fall within the Group’s model risk framework with model monitoring, periodic validation and back testing performed on model components, such as probability of default. Limitations in the Group’s impairment models or data inputs may be identified through the ongoing assessment and validation of the output of the models. In these circumstances, management applies appropriate judgemental adjustments to the ECL to ensure that the overall provision adequately reflects all material risks. These adjustments are determined by considering the particular attributes of exposures which have not been adequately captured by the impairment models and range from changes to model inputs and parameters, at account level, through to more qualitative post-model adjustments. Post-model adjustments are not typically calculated under each distinct economic scenario used to generate ECL, but on final modelled ECL. All adjustments are reviewed quarterly and are subject to internal review and challenge, including by the Audit Committee, to ensure that amounts are appropriately calculated and specific release criteria is identified.
During 2022 the intensifying inflationary pressures, alongside rising interest rates within the Group’s outlook created further risks not deemed to be fully captured by ECL models. These pressures played out in 2023 with households experiencing increased interest rates and living costs. These risks, whilst still present, are beginning to subside with inflation now reducing and interest rates now believed to have peaked. As a result, the judgements held in respect of inflationary and interest rate risks are at a slightly reduced level of £186 million (2022: £195 million). Other judgements continue to be applied for broader data and model limitations, both increasing and decreasing ECL. These include incremental risks associated with a material devaluation in commercial real estate prices present since 2022. Given ECL models only capture future price movements, and not the suppressed level, there is a risk that further losses are yet to emerge as well as greater risk on specific sector valuations. At 31 December 2023 judgemental adjustments resulted in net additional ECL allowances totalling £28 million (2022: £330 million).
Judgements due to inflationary and interest rate risk
UK mortgages: £61 million (2022: £49 million)
There has been only modest evidence of credit deterioration in the UK mortgages portfolio through 2023 despite the high levels of inflation and the rising interest rate environment. Increases in new to arrears and defaults that have emerged are mainly driven by variable rate customers, who have experienced material increases in their monthly payment. Mortgage ECL models use UK Bank Rate as a driver of predicted defaults largely capturing the stretch on customers due to increased payments, and that has contributed materially to the elevated levels of ECL at 31 December 2023. The impact is also partly mitigated by stressed affordability assessments applied at loan origination which means most customers have demonstrated the ability to absorb payment shocks.
However, there remains a potential risk to affordability from continued inflationary pressures combined with higher interest rates, and that this may not be fully captured by the Group’s ECL models. The risk remains for customers maturing from low fixed rate deals, the accumulated impact on variable rate product holders, lower levels of real household income and rental cover value. Therefore a judgemental uplift in ECL has been taken in these segments of the mortgages portfolio, either where inflation is expected to present a more material risk, or where segments within the model do not recognise UK Bank Rate as a material driver of predicted defaults.
| | | | | | | | |
F-74 | Lloyds Banking Group plc Annual Report on Form 20-F 2023 | |
Notes to the consolidated financial statements continued
for the year ended 31 December
Note 24: Allowance for expected credit losses continued
Credit cards: £92 million (2022: £93 million) and Other Retail: £33 million (2022: £53 million)
The Group’s ECL models for credit cards and personal loan portfolios use predictions of wage growth to account for future affordability stress. As elevated inflation erodes nominal wage growth, adjustments have been made to the econometric models to account for real, rather than nominal, income to produce adjusted predicted defaults. These adjustments also include the specific risk to affordability from increased housing costs, not captured by CPI. As these adjustments are made within predicted default models, they are calculated under each economic scenario and impact the staging of assets through increased PDs.
Alongside these portfolio-wide adjustments management has also made an additional uplift to ECL for customers with lower income levels and higher indebtedness deemed most vulnerable to inflationary pressures and interest rate rises. Although this segment of customers has not exhibited any greater deterioration to date, uplifts continue to be applied to recognise that continued inflation and interest rates risks remain.
Other judgements
UK mortgages: £63 million (2022: £214 million)
These adjustments principally comprise:
Increase in time to repossession: £106 million (2022: £118 million)
Due to the Group suspending mortgage litigation activity between late-2014 and mid-2018 due to policy changes for the treatment of arrears, and as collections strategy normalises post COVID-19 pandemic, the Group’s experience of possessions data on which our models rely is limited. This reflects an adjustment made to allow for an increase in the time assumed between default and repossession. A number of defaulted accounts, equivalent in scale to the estimated shortfall in possessions experienced, have had their provision coverage judgementally increased to the level of those accounts already in repossession. A further adjustment is made to accounts which have been in default for more than 24 months, with an arrears balance increase in the last six months. These accounts have their probability of possession judgmentally set to an increased level based on observed historical losses incurred on accounts that were of an equivalent status.
Asset recovery values: £nil(2022: £69 million)
The low level of repossession volumes throughout 2020 to 2022 restricted the calibration of Forced Sale Discount (FSD) model parameters which uses the achieved sales price experience over the last 12 months. Over this period management partly incorporated an increasing trend in FSD rates through judgementally extending the observation period. At December 2023 the level of sales volumes observed over the past 12 months has subsequently returned to an adequate level for model calibrations to again be performed removing the need for judgemental adjustment.
Adjustment for specific segments: £23 million (2022: £25 million)
The Group monitors risks across specific segments of its portfolios which may not be fully captured through wider collective models. The judgement for fire safety and cladding uncertainty has been maintained. Though experience remains limited the risk is considered sufficiently material to address through judgement, given that there is evidence of assessed cases having defective cladding, or other fire safety issues.
Adjustment for Stage 2 oversensitivity: £(68) million (2022: £nil)
Management has observed an increasing degree of oversensitivity in the number of recently originated low risk accounts moving to Stage 2 through the PD trigger mechanism. This arises from a blend of factors currently present, with the combination of the Group’s current MES assumptions and the uplift approach applied, disproportionately applying greater forward-looking uplifts to recent vintages. Given these accounts have shown no significant movement in observed credit scores and were originated under a similar or more adverse economic outlook, an adjustment has been made pending a model rebuild. Management has judgementally increased the threshold applied to these accounts by one further grade (to what is set out on page F-73) which results in £6 billion of assets being moved back to Stage 1 which results in a lower 12-month ECL. Credit cards: £15 million (2022: £(28) million) and Other Retail: £46 million (2022: £60 million)
These adjustments principally comprise:
Lifetime extension on revolving products: Credit cards: £67 million (2022: £82 million) and Other Retail: £10 million (2022: £14 million)
An adjustment is required to extend the lifetime used for Stage 2 exposures on Retail revolving products from a three-year modelled lifetime, which reflected the outcome data available when the ECL models were developed. Incremental defaults beyond year three are calculated through the extrapolation of the default trajectory observed throughout the three years and beyond. The judgement has reduced slightly in the period following refinement to the discounting methodology applied.
Adjustments to loss given defaults (LGDs): Credit cards: £(50) million (2022: £(96) million) and Other Retail: £37 million (2022: £13 million)
A number of adjustments have been made to the loss given default assumptions used within unsecured and motor credit models. For unsecured portfolios, the adjustments reflect the impact of changes in collection debt sale strategy on the Group’s LGD models, incorporating up to date customer performance and forward flow debt sale pricing. For motor, the adjustment captures a decline in used car prices.
Commercial Banking: £(282) million (2022: £(111) million)
These adjustments principally comprise:
Corporate insolvency rates: £(292) million (2022: £(35) million)
During 2023, the volume of UK corporate insolvencies continued to exhibit an increasing trend beyond December 2019 levels, revealing a marked misalignment between observed UK corporate insolvencies and the Group’s credit performance. This dislocation gives rise to uncertainty over the drivers of observed trends and the appropriateness of the Group’s Commercial Banking model response which uses observed UK corporate insolvencies data to anchor future loss estimates to. Given the Group’s asset quality remains strong with low new defaults, a negative adjustment is applied by using the long-term average rate. The larger negative adjustment in the period reflects the widening gap between the increasing industry level and the long-term average rate used.
Adjustments to loss given defaults (LGDs): £(105) million (2022: £(105) million)
Following a review on the loss given default approach for commercial exposures, management deems that ECL should be adjusted to mitigate limitations identified in the approach which are causing loss given defaults to be inflated. These include the benefit from amortisation of exposures relative to collateral values at default and a move to an exposure-weighted approach being adopted. These temporary adjustments will be addressed through future model development.
| | | | | | | | |
F-75 | Lloyds Banking Group plc Annual Report on Form 20-F 2023 | |
Notes to the consolidated financial statements continued
for the year ended 31 December
Note 24: Allowance for expected credit losses continued
Commercial Real Estate (CRE) price reduction: £67 million (2022: £nil)
Rolling the forecast model forwards into the period has resulted in the material fall in CRE prices seen in late 2022 moving out of the model assumptions used to assess ECL. Given the model uses future changes in the metric as a driver of defaults and loss rates there is a risk that the model benefit that arises does not reflect the residual risk caused by the sustained low level of prices. Management therefore considers it appropriate to judgementally reinstate the CRE price drop within the ECL model assumptions given the materially reduced level in CRE prices could still trigger additional defaults Within this adjustment management has refined the potential impact on loss rates through capturing updated valuations as well as stressing valuations on specific sectors where evidence suggests valuations may lag achievable levels, notably in cases of stressed sale.
Generation of multiple economic scenarios
The estimate of expected credit losses is required to be based on an unbiased expectation of future economic scenarios. The approach used to generate the range of future economic scenarios depends on the methodology and judgements adopted. The Group’s approach is to start from a defined base case scenario, used for planning purposes, and to generate alternative economic scenarios around this base case. The base case scenario is a conditional forecast underpinned by a number of conditioning assumptions that reflect the Group’s best view of key future developments. If circumstances appear likely to materially deviate from the conditioning assumptions, then the base case scenario is updated.
The base case scenario is central to a range of future economic scenarios generated by simulation of an economic model, for which the same conditioning assumptions apply as in the base case scenario. These scenarios are ranked by using estimated relationships with industry-wide historical loss data. With the base case already pre-defined, three other scenarios are identified as averages of constituent scenarios located around the 15th, 75th and 95th percentiles of the distribution. The full distribution is therefore summarised by a practical number of scenarios to run through ECL models representing an upside, the base case, and a downside scenario weighted at 30 per cent each, together with a severe downside scenario weighted at 10 per cent. The scenario weights represent the distribution of economic scenarios and not subjective views on likelihood. The inclusion of a severe downside scenario with a smaller weighting ensures that the non-linearity of losses in the tail of the distribution is adequately captured. Macroeconomic projections may employ reversionary techniques to adjust the paths of economic drivers towards long-run equilibria after a reasonable forecast horizon. The Group does not use such techniques to force the MES scenarios to revert to the base case planning view. Utilising such techniques would be expected to be immaterial for expected credit losses since loss sensitivity is highest over the initial five years of the projections. Most assets are expected to have matured, or reached the end of their behavioural life before the five-year horizon.
A forum under the chairmanship of the Chief Economist meets at least quarterly to review and, if appropriate, recommend changes to the method by which economic scenarios are generated, for approval by the Chief Financial Officer and Chief Risk Officer. In June 2022, the Group judged it appropriate to include an adjusted severe downside scenario to incorporate a high CPI inflation and UK Bank Rate profiles and to adopt this adjusted severe downside scenario to calculate the Group’s ECL. This is because the historic macroeconomic and loan loss data upon which the scenario model is calibrated imply an association of downside economic outcomes with easier monetary policy, and therefore low interest rates. The adjustment is considered to better reflect the risks around the Group’s base case view in an economic environment where the potential for supply shocks remains an elevated concern. The Group has continued to include a non-modelled severe downside scenario for Group ECL calculations for 31 December 2023 reporting.
Base case and MES economic assumptions
The Group’s base case economic scenario has been updated to reflect ongoing geopolitical developments, and further evidence of easing of inflationary pressures allowing shifts to less restrictive monetary policies globally. The Group’s updated base case scenario has three conditioning assumptions: first, the wars in Ukraine and the Middle East remain geographically contained and do not lead to a major escalation in energy prices; second, China’s economic stabilisation policy is effective; and third, less restrictive monetary and fiscal policy throughout this year.
Based on these assumptions and incorporating the economic data published in the fourth quarter, the Group’s base case scenario is for slow expansion in GDP and a rise in the unemployment rate alongside modest changes in residential and commercial property prices. Following a reduction in inflationary pressures, UK Bank Rate is expected to be lowered during 2024. Risks around this base case economic view lie in both directions and are largely captured by the generation of alternative economic scenarios.
The Group has accommodated the latest available information at the reporting date in defining its base case scenario and generating alternative economic scenarios. The scenarios include forecasts for key variables in the fourth quarter of 2023, for which actuals may have since emerged prior to publication.
Scenarios by year
The key UK economic assumptions made by the Group are shown in the following tables across a number of measures explained below.
Annual assumptions
Gross domestic product (GDP) and Consumer Price Index (CPI) inflation are presented as an annual change, house price growth and commercial real estate price growth are presented as the growth in the respective indices over each year. Unemployment rate and UK Bank Rate are averages over the year.
Five-year average
The five-year average reflects the average annual growth rate, or level, over the five-year period. It includes movements within the current reporting year, such that the position as at 31 December 2023 covers the five years 2023 to 2027. The inclusion of the reporting year within the five-year period reflects the need to predict variables which remain unpublished at the reporting date and recognises that credit models utilise both level and annual changes. The use of calendar years maintains a comparability between the annual assumptions presented.
Five-year start to peak and trough
The peak or trough for any metric may occur intra year and therefore not be identifiable from the annual assumptions, so they are also disclosed. For GDP, house price growth and commercial real estate price growth, the peak, or trough, reflects the highest, or lowest cumulative quarterly position reached relative to the start of the five-year period, which as at 31 December 2023 is 1 January 2023. Given these metrics may exhibit increases followed by greater falls, the start to trough movements quoted may be smaller than the equivalent ‘peak to trough’ movement (and vice versa for start to peak). Unemployment, UK Bank Rate and CPI inflation reflect the highest, or lowest, quarterly level reached in the five-year period.
| | | | | | | | |
F-76 | Lloyds Banking Group plc Annual Report on Form 20-F 2023 | |
Notes to the consolidated financial statements continued
for the year ended 31 December
Note 24: Allowance for expected credit losses continued
| | | | | | | | | | | | | | | | | | | | | | | | | | |
At 31 December 2023 | 2023 % | 2024 % | 2025 % | 2026 % | 2027 % | 2023 to 2027 average % | Start to
peak
% | Start to
trough
% |
| Upside | | | | | | | | |
| Gross domestic product | 0.3 | | 1.5 | | 1.7 | | 1.7 | | 1.9 | | 1.4 | | 8.1 | | 0.2 | |
| Unemployment rate | 4.0 | | 3.3 | | 3.1 | | 3.1 | | 3.1 | | 3.3 | | 4.2 | | 3.0 | |
| House price growth | 1.9 | | 0.8 | | 6.9 | | 7.2 | | 6.8 | | 4.7 | | 25.7 | | (1.2) | |
| Commercial real estate price growth | (3.9) | | 9.0 | | 3.8 | | 1.3 | | 1.3 | | 2.2 | | 11.5 | | (3.9) | |
| UK Bank Rate | 4.94 | | 5.72 | | 5.61 | | 5.38 | | 5.18 | | 5.37 | | 5.79 | | 4.25 | |
| CPI inflation | 7.3 | | 2.7 | | 3.1 | | 3.2 | | 3.1 | | 3.9 | | 10.2 | | 2.1 | |
| Base case | | | | | | | | |
| Gross domestic product | 0.3 | | 0.5 | | 1.2 | | 1.7 | | 1.9 | | 1.1 | | 6.4 | | 0.2 | |
| Unemployment rate | 4.2 | | 4.9 | | 5.2 | | 5.2 | | 5.0 | | 4.9 | | 5.2 | | 3.9 | |
| House price growth | 1.4 | | (2.2) | | 0.5 | | 1.6 | | 3.5 | | 1.0 | | 4.8 | | (1.2) | |
| Commercial real estate price growth | (5.1) | | (0.2) | | 0.1 | | 0.0 | | 0.8 | | (0.9) | | (1.2) | | (5.3) | |
| UK Bank Rate | 4.94 | | 4.88 | | 4.00 | | 3.50 | | 3.06 | | 4.08 | | 5.25 | | 3.00 | |
| CPI inflation | 7.3 | | 2.7 | | 2.9 | | 2.5 | | 2.2 | | 3.5 | | 10.2 | | 2.1 | |
| Downside | | | | | | | | |
| Gross domestic product | 0.2 | | (1.0) | | (0.1) | | 1.5 | | 2.0 | | 0.5 | | 3.4 | | (1.2) | |
| Unemployment rate | 4.3 | | 6.5 | | 7.8 | | 7.9 | | 7.6 | | 6.8 | | 8.0 | | 3.9 | |
| House price growth | 1.3 | | (4.5) | | (6.0) | | (5.6) | | (1.7) | | (3.4) | | 2.0 | | (15.7) | |
| Commercial real estate price growth | (6.0) | | (8.7) | | (4.0) | | (2.1) | | (1.2) | | (4.4) | | (1.2) | | (20.4) | |
| UK Bank Rate | 4.94 | | 3.95 | | 1.96 | | 1.13 | | 0.55 | | 2.51 | | 5.25 | | 0.43 | |
| CPI inflation | 7.3 | | 2.8 | | 2.7 | | 1.8 | | 1.1 | | 3.2 | | 10.2 | | 1.0 | |
| Severe downside | | | | | | | | |
| Gross domestic product | 0.1 | | (2.3) | | (0.5) | | 1.3 | | 1.8 | | 0.1 | | 1.0 | | (2.9) | |
| Unemployment rate | 4.5 | | 8.7 | | 10.4 | | 10.5 | | 10.1 | | 8.8 | | 10.5 | | 3.9 | |
| House price growth | 0.6 | | (7.6) | | (13.3) | | (12.7) | | (7.5) | | (8.2) | | 2.0 | | (35.0) | |
| Commercial real estate price growth | (7.7) | | (19.5) | | (10.6) | | (7.7) | | (5.2) | | (10.3) | | (1.2) | | (41.8) | |
| UK Bank Rate – modelled | 4.94 | | 2.75 | | 0.49 | | 0.13 | | 0.03 | | 1.67 | | 5.25 | | 0.02 | |
UK Bank Rate – adjusted1 | 4.94 | | 6.56 | | 4.56 | | 3.63 | | 3.13 | | 4.56 | | 6.75 | | 3.00 | |
| CPI inflation – modelled | 7.3 | | 2.7 | | 2.2 | | 0.9 | | (0.2) | | 2.6 | | 10.2 | | (0.3) | |
CPI inflation – adjusted1 | 7.6 | | 7.5 | | 3.5 | | 1.3 | | 1.0 | | 4.2 | | 10.2 | | 0.9 | |
| Probability-weighted | | | | | | | | |
| Gross domestic product | 0.3 | | 0.1 | | 0.8 | | 1.6 | | 1.9 | | 0.9 | | 5.4 | | 0.1 | |
| Unemployment rate | 4.2 | | 5.3 | | 5.9 | | 5.9 | | 5.7 | | 5.4 | | 6.0 | | 3.9 | |
| House price growth | 1.4 | | (2.5) | | (0.9) | | (0.3) | | 1.8 | | (0.1) | | 2.0 | | (2.8) | |
| Commercial real estate price growth | (5.3) | | (1.9) | | (1.1) | | (1.0) | | (0.2) | | (1.9) | | (1.2) | | (9.9) | |
| UK Bank Rate – modelled | 4.94 | | 4.64 | | 3.52 | | 3.02 | | 2.64 | | 3.75 | | 5.25 | | 2.59 | |
UK Bank Rate – adjusted1 | 4.94 | | 5.02 | | 3.93 | | 3.37 | | 2.95 | | 4.04 | | 5.42 | | 2.89 | |
| CPI inflation – modelled | 7.3 | | 2.7 | | 2.8 | | 2.3 | | 1.9 | | 3.4 | | 10.2 | | 1.9 | |
CPI inflation – adjusted1 | 7.4 | | 3.2 | | 3.0 | | 2.4 | | 2.0 | | 3.6 | | 10.2 | | 2.0 | |
1 The adjustment to UK Bank Rate and CPI inflation in the severe downside is considered to better reflect the risks around the Group’s base case view in an economic environment where supply shocks are the principal concern.
| | | | | | | | | | | | | | | | | | | | | | | | | | |
Base case scenario by quarter1 At 31 December 2023 | First quarter 2023 % | Second quarter 2023 % | Third quarter 2023 % | Fourth quarter 2023 % | First quarter 2024 % | Second quarter 2024 % | Third quarter 2024 % | Fourth quarter 2024 % |
| Gross domestic product | 0.3 | | 0.0 | | (0.1) | | 0.0 | | 0.1 | | 0.2 | | 0.3 | | 0.3 | |
| Unemployment rate | 3.9 | | 4.2 | | 4.2 | | 4.3 | | 4.5 | | 4.8 | | 5.0 | | 5.2 | |
| House price growth | 1.6 | | (2.6) | | (4.5) | | 1.4 | | (1.1) | | (1.5) | | 0.5 | | (2.2) | |
| Commercial real estate price growth | (18.8) | | (21.2) | | (18.2) | | (5.1) | | (4.1) | | (3.8) | | (2.2) | | (0.2) | |
| UK Bank Rate | 4.25 | | 5.00 | | 5.25 | | 5.25 | | 5.25 | | 5.00 | | 4.75 | | 4.50 | |
| CPI inflation | 10.2 | | 8.4 | | 6.7 | | 4.0 | | 3.8 | | 2.1 | | 2.3 | | 2.8 | |
1 Gross domestic product is presented quarter-on-quarter. House price growth, commercial real estate growth and CPI inflation are presented year-on-year, i.e. from the equivalent quarter in the previous year. Unemployment rate and UK Bank Rate are presented as at the end of each quarter.
| | | | | | | | |
F-77 | Lloyds Banking Group plc Annual Report on Form 20-F 2023 | |
Notes to the consolidated financial statements continued
for the year ended 31 December
Note 24: Allowance for expected credit losses continued
| | | | | | | | | | | | | | | | | | | | | | | | | | |
At 31 December 2022 | 2022 % | 2023 % | 2024 % | 2025 % | 2026 % | 2022 to 2026 average % | Start to
peak
% | Start to
trough
% |
| Upside | | | | | | | | |
| Gross domestic product | 4.1 | | 0.1 | | 1.1 | | 1.7 | | 2.1 | | 1.8 | | 6.5 | | 0.4 | |
| Unemployment rate | 3.5 | | 2.8 | | 3.0 | | 3.3 | | 3.4 | | 3.2 | | 3.8 | | 2.8 | |
| House price growth | 2.4 | | (2.8) | | 6.5 | | 9.0 | | 8.0 | | 4.5 | | 24.8 | | (1.1) | |
| Commercial real estate price growth | (9.4) | | 8.5 | | 3.5 | | 2.6 | | 2.3 | | 1.3 | | 7.2 | | (9.4) | |
| UK Bank Rate | 1.94 | | 4.95 | | 4.98 | | 4.63 | | 4.58 | | 4.22 | | 5.39 | | 0.75 | |
| CPI inflation | 9.0 | | 8.3 | | 4.2 | | 3.3 | | 3.0 | | 5.5 | | 10.7 | | 2.9 | |
| Base case | | | | | | | | |
| Gross domestic product | 4.0 | | (1.2) | | 0.5 | | 1.6 | | 2.1 | | 1.4 | | 4.3 | | (1.1) | |
| Unemployment rate | 3.7 | | 4.5 | | 5.1 | | 5.3 | | 5.1 | | 4.8 | | 5.3 | | 3.6 | |
| House price growth | 2.0 | | (6.9) | | (1.2) | | 2.9 | | 4.4 | | 0.2 | | 6.4 | | (6.3) | |
| Commercial real estate price growth | (11.8) | | (3.3) | | 0.9 | | 2.8 | | 3.1 | | (1.8) | | 7.2 | | (14.8) | |
| UK Bank Rate | 1.94 | | 4.00 | | 3.38 | | 3.00 | | 3.00 | | 3.06 | | 4.00 | | 0.75 | |
| CPI inflation | 9.0 | | 8.3 | | 3.7 | | 2.3 | | 1.7 | | 5.0 | | 10.7 | | 1.6 | |
| Downside | | | | | | | | |
| Gross domestic product | 3.9 | | (3.0) | | (0.5) | | 1.4 | | 2.1 | | 0.8 | | 1.2 | | (3.6) | |
| Unemployment rate | 3.8 | | 6.3 | | 7.5 | | 7.6 | | 7.2 | | 6.5 | | 7.7 | | 3.6 | |
| House price growth | 1.6 | | (11.1) | | (9.8) | | (5.6) | | (1.5) | | (5.4) | | 6.4 | | (24.3) | |
| Commercial real estate price growth | (13.9) | | (15.0) | | (3.7) | | 0.4 | | 1.4 | | (6.4) | | 7.2 | | (29.6) | |
| UK Bank Rate | 1.94 | | 2.93 | | 1.39 | | 0.98 | | 1.04 | | 1.65 | | 3.62 | | 0.75 | |
| CPI inflation | 9.0 | | 8.2 | | 3.3 | | 1.3 | | 0.3 | | 4.4 | | 10.7 | | 0.2 | |
| Severe downside | | | | | | | | |
| Gross domestic product | 3.7 | | (5.2) | | (1.0) | | 1.3 | | 2.1 | | 0.1 | | 0.7 | | (6.4) | |
| Unemployment rate | 4.1 | | 9.0 | | 10.7 | | 10.4 | | 9.7 | | 8.8 | | 10.7 | | 3.6 | |
| House price growth | 1.1 | | (14.8) | | (18.0) | | (11.5) | | (4.2) | | (9.8) | | 6.4 | | (40.1) | |
| Commercial real estate price growth | (17.3) | | (28.8) | | (9.9) | | (1.3) | | 3.2 | | (11.6) | | 7.2 | | (47.8) | |
| UK Bank Rate – modelled | 1.94 | | 1.41 | | 0.20 | | 0.13 | | 0.14 | | 0.76 | | 3.50 | | 0.12 | |
UK Bank Rate – adjusted1 | 2.44 | | 7.00 | | 4.88 | | 3.31 | | 3.25 | | 4.18 | | 7.00 | | 0.75 | |
| CPI inflation – modelled | 9.0 | | 8.2 | | 2.6 | | (0.1) | | (1.6) | | 3.6 | | 10.7 | | (1.7) | |
CPI inflation – adjusted1 | 9.7 | | 14.3 | | 9.0 | | 4.1 | | 1.6 | | 7.7 | | 14.8 | | 1.5 | |
| Probability-weighted | | | | | | | | |
| Gross domestic product | 4.0 | | (1.8) | | 0.2 | | 1.5 | | 2.1 | | 1.2 | | 3.4 | | (1.8) | |
| Unemployment rate | 3.7 | | 5.0 | | 5.8 | | 5.9 | | 5.7 | | 5.2 | | 5.9 | | 3.6 | |
| House price growth | 1.9 | | (7.7) | | (3.2) | | 0.7 | | 2.9 | | (1.2) | | 6.4 | | (9.5) | |
| Commercial real estate price growth | (12.3) | | (5.8) | | (0.8) | | 1.6 | | 2.3 | | (3.1) | | 7.2 | | (18.6) | |
| UK Bank Rate – modelled | 1.94 | | 3.70 | | 2.94 | | 2.59 | | 2.60 | | 2.76 | | 3.89 | | 0.75 | |
UK Bank Rate – adjusted1 | 1.99 | | 4.26 | | 3.41 | | 2.91 | | 2.91 | | 3.10 | | 4.31 | | 0.75 | |
| CPI inflation – modelled | 9.0 | | 8.3 | | 3.6 | | 2.1 | | 1.4 | | 4.9 | | 10.7 | | 1.3 | |
CPI inflation – adjusted1 | 9.1 | | 8.9 | | 4.3 | | 2.5 | | 1.7 | | 5.3 | | 11.0 | | 1.6 | |
1 The adjustment to UK Bank Rate and CPI inflation in the severe downside is considered to better reflect the risks around the Group’s base case view in an economic environment where supply shocks are the principal concern.
| | | | | | | | | | | | | | | | | | | | | | | | | | |
Base case scenario by quarter1 At 31 December 2022 | First quarter 2022 % | Second quarter 2022 % | Third quarter 2022 % | Fourth quarter 2022 % | First quarter 2023 % | Second quarter 2023 % | Third quarter 2023 % | Fourth quarter 2023 % |
| Gross domestic product | 0.6 | | 0.1 | | (0.3) | | (0.4) | | (0.4) | | (0.4) | | (0.2) | | (0.1) | |
| Unemployment rate | 3.7 | | 3.8 | | 3.6 | | 3.7 | | 4.0 | | 4.4 | | 4.7 | | 4.9 | |
| House price growth | 11.1 | | 12.5 | | 9.8 | | 2.0 | | (3.0) | | (8.4) | | (9.8) | | (6.9) | |
| Commercial real estate price growth | 18.0 | | 18.0 | | 8.4 | | (11.8) | | (16.9) | | (19.8) | | (15.9) | | (3.3) | |
| UK Bank Rate | 0.75 | | 1.25 | | 2.25 | | 3.50 | | 4.00 | | 4.00 | | 4.00 | | 4.00 | |
| CPI inflation | 6.2 | | 9.2 | | 10.0 | | 10.7 | | 10.0 | | 8.9 | | 8.0 | | 6.1 | |
1 Gross domestic product is presented quarter-on-quarter. House price growth, commercial real estate growth and CPI inflation are presented year-on-year, i.e. from the equivalent quarter in the previous year. Unemployment rate and UK Bank Rate are presented as at the end of each quarter.
| | | | | | | | |
F-78 | Lloyds Banking Group plc Annual Report on Form 20-F 2023 | |
Notes to the consolidated financial statements continued
for the year ended 31 December
Note 24: Allowance for expected credit losses continued
ECL sensitivity to economic assumptions
The table below shows the Group’s ECL for the probability-weighted, upside, base case, downside and severe downside scenarios, with the severe downside scenario incorporating adjustments made to CPI inflation and UK Bank Rate paths. The stage allocation for an asset is based on the overall scenario probability-weighted probability of default and hence the staging of assets is constant across all the scenarios. In each economic scenario the ECL for individual assessments is held constant reflecting the basis on which they are evaluated. Judgemental adjustments applied through changes to model inputs or parameters, or more qualitative post model adjustments, are apportioned across the scenarios in proportion to modelled ECL where this better reflects the sensitivity of these adjustments to each scenario. The probability-weighted view shows the extent to which a higher ECL allowance has been recognised to take account of multiple economic scenarios relative to the base case; the uplift being £678 million compared to £692 million at 31 December 2022.
| | | | | | | | | | | | | | | | | | | | | | | | | | | | | | | | | | | |
| At 31 December 2023 | | At 31 December 2022 |
| Probability-
weighted
£m | Upside
£m | Base case
£m | Downside
£m | Severe
downside
£m | | Probability-
weighted
£m | Upside
£m | Base case
£m | Downside
£m | Severe
downside
£m |
| UK mortgages | 1,115 | | 395 | | 670 | | 1,155 | | 4,485 | | | 1,209 | | 514 | | 790 | | 1,434 | | 3,874 | |
| Credit cards | 810 | | 600 | | 771 | | 918 | | 1,235 | | | 763 | | 596 | | 727 | | 828 | | 1,180 | |
| Other Retail | 945 | | 850 | | 920 | | 981 | | 1,200 | | | 1,016 | | 907 | | 992 | | 1,056 | | 1,290 | |
| | | | | | | | | | | |
| Commercial Banking | 1,182 | | 793 | | 1,013 | | 1,383 | | 2,250 | | | 1,869 | | 1,459 | | 1,656 | | 2,027 | | 3,261 | |
| Other | 32 | | 32 | | 32 | | 32 | | 32 | | | 46 | | 46 | | 46 | | 47 | | 47 | |
| ECL allowance | 4,084 | | 2,670 | | 3,406 | | 4,469 | | 9,202 | | | 4,903 | | 3,522 | | 4,211 | | 5,392 | | 9,652 | |
The impact of isolated changes in the UK unemployment rate and House Price Index (HPI) has been assessed on a univariate basis. Although such changes would not be observed in isolation, as economic indicators tend to be correlated in a coherent scenario, this gives insight into the sensitivity of the Group’s ECL to gradual changes in these two critical economic factors. The assessment has been made against the base case with staging held flat to the reported probability-weighted view and is assessed through the direct impact on modelled ECL and only includes judgemental adjustments applied through changes to model inputs.
The table below shows the impact on the Group’s ECL resulting from a 1 percentage point increase or decrease in the UK unemployment rate. The increase or decrease is presented based on the adjustment phased evenly over the first 10 quarters of the base case scenario. A more immediate increase or decrease would drive a more material ECL impact as it would be fully reflected in both 12-month and lifetime probability of defaults.
| | | | | | | | | | | | | | | | | |
| At 31 December 2023 | | At 31 December 2022 |
| 1pp increase in
unemployment
£m | 1pp decrease in
unemployment
£m | | 1pp increase in
unemployment
£m | 1pp decrease in
unemployment
£m |
| UK mortgages | 33 | | (32) | | | 26 | | (21) | |
| Credit cards | 38 | | (38) | | | 41 | | (41) | |
| Other Retail | 19 | | (19) | | | 25 | | (25) | |
| | | | | |
| Commercial Banking | 88 | | (83) | | | 100 | | (91) | |
| | | | | |
| ECL impact | 178 | | (172) | | | 192 | | (178) | |
The table below shows the impact on the Group’s ECL in respect of UK mortgages of an increase or decrease in loss given default for a 10 percentage point increase or decrease in the UK HPI. The increase or decrease is presented based on the adjustment phased evenly over the first 10 quarters of the base case scenario.
| | | | | | | | | | | | | | | | | |
| At 31 December 2023 | | At 31 December 2022 |
| 10pp increase
in HPI
£m | 10pp decrease
in HPI
£m | | 10pp increase
in HPI
£m | 10pp decrease
in HPI
£m |
| ECL impact | (201) | | 305 | | | (225) | | 370 | |
| | | | | | | | |
F-79 | Lloyds Banking Group plc Annual Report on Form 20-F 2023 | |
Notes to the consolidated financial statements continued
for the year ended 31 December
Note 24: Allowance for expected credit losses continued
The table below shows the Group’s ECL and drawn balances for the upside, base case, downside and severe downside scenarios, with staging of assets based on each specific scenario probability of default. In each economic scenario the ECL for individual assessments is held constant reflecting the basis on which they are evaluated. Judgemental adjustments applied through changes to model inputs or parameters, or more qualitative post-model adjustments, are apportioned across the scenarios in proportion to modelled ECL where this better reflects the sensitivity of these adjustments to each scenario. A probability-weighted scenario is not shown as this view does not reflect the basis on which ECL is calculated. Comparing the probability-weighted ECL in the table above to the base case ECL with base case scenario specific staging, as shown in the table below, results in an uplift of £596 million compared to £820 million at 31 December 2022.
| | | | | | | | | | | | | | | | | | | | | | | | | | | | | | | | | | | | | | | | | | | | |
| Drawn balances1 | | ECL allowance | | Coverage ratio2 |
At 31 December 2023 | Upside
£m | Base case
£m | Downside
£m | Severe
downside
£m | | Upside
£m | Base case
£m | Downside
£m | Severe
downside
£m | | Upside
% | Base case
% | Downside
% | Severe
downside
% |
| Stage 1 | | | | | | | | | | | | | | |
| UK mortgages | 270,131 | | 269,581 | | 266,388 | | 129,736 | | | 20 | | 40 | | 84 | | 153 | | | – | | – | | – | | 0.1 | |
| Credit cards | 13,338 | | 12,668 | | 12,109 | | 10,966 | | | 169 | | 211 | | 242 | | 298 | | | 1.3 | | 1.7 | | 2.0 | | 2.7 | |
| Other Retail | 39,260 | | 38,939 | | 38,373 | | 30,202 | | | 360 | | 384 | | 404 | | 448 | | | 0.9 | | 1.0 | | 1.1 | | 1.5 | |
| Commercial Banking | 98,202 | | 97,394 | | 92,919 | | 78,781 | | | 165 | | 260 | | 376 | | 431 | | | 0.2 | | 0.3 | | 0.4 | | 0.6 | |
| Other | 7,632 | | 7,632 | | 7,632 | | 7,632 | | | 14 | | 16 | | 17 | | 20 | | | 0.2 | | 0.2 | | 0.2 | | 0.3 | |
| Total | 428,563 | | 426,214 | | 417,421 | | 257,317 | | | 728 | | 911 | | 1,123 | | 1,350 | | | 0.2 | | 0.2 | | 0.3 | | 0.5 | |
| | | | | | | | | | | | | | |
| Stage 2 | | | | | | | | | | | | | | |
| UK mortgages | 24,998 | | 25,548 | | 28,741 | | 165,393 | | | 73 | | 139 | | 316 | | 4,074 | | | 0.3 | | 0.6 | | 1.1 | | 2.5 | |
| Credit cards | 2,195 | | 2,865 | | 3,424 | | 4,567 | | | 302 | | 437 | | 567 | | 859 | | | 13.7 | | 15.3 | | 16.6 | | 18.8 | |
| Other Retail | 5,711 | | 6,032 | | 6,598 | | 14,769 | | | 325 | | 378 | | 424 | | 619 | | | 5.7 | | 6.3 | | 6.4 | | 4.2 | |
| Commercial Banking | 4,487 | | 5,295 | | 9,770 | | 23,908 | | | 259 | | 379 | | 722 | | 2,466 | | | 5.8 | | 7.2 | | 7.4 | | 10.3 | |
| Other | – | | – | | – | | – | | | – | | – | | – | | – | | | – | | – | | – | | – | |
| Total | 37,391 | | 39,740 | | 48,533 | | 208,637 | | | 959 | | 1,333 | | 2,029 | | 8,018 | | | 2.6 | | 3.4 | | 4.2 | | 3.8 | |
| | | | | | | | | | | | | | |
| Stage 3 | | | | | | | | | | | | | | |
| UK mortgages | 4,337 | | 4,337 | | 4,337 | | 4,337 | | | 78 | | 225 | | 457 | | 963 | | | 1.8 | | 5.2 | | 10.5 | | 22.2 | |
| Credit cards | 284 | | 284 | | 284 | | 284 | | | 122 | | 122 | | 122 | | 122 | | | 43.0 | | 43.0 | | 43.0 | | 43.0 | |
| Other Retail | 452 | | 452 | | 452 | | 452 | | | 238 | | 242 | | 248 | | 261 | | | 52.7 | | 53.5 | | 54.9 | | 57.7 | |
| Commercial Banking | 2,068 | | 2,068 | | 2,068 | | 2,068 | | | 426 | | 426 | | 426 | | 426 | | | 20.6 | | 20.6 | | 20.6 | | 20.6 | |
| Other | 39 | | 39 | | 39 | | 39 | | | 16 | | 16 | | 16 | | 16 | | | 41.0 | | 41.0 | | 41.0 | | 41.0 | |
| Total | 7,180 | | 7,180 | | 7,180 | | 7,180 | | | 880 | | 1,031 | | 1,269 | | 1,788 | | | 12.3 | | 14.4 | | 17.7 | | 24.9 | |
| | | | | | | | | | | | | | |
| POCI | | | | | | | | | | | | | | |
UK mortgages3 | 7,854 | | 7,854 | | 7,854 | | 7,854 | | | 213 | | 213 | | 213 | | 213 | | | 2.7 | | 2.7 | | 2.7 | | 2.7 | |
| | | | | | | | | | | | | | |
| Total | | | | | | | | | | | | | | |
| UK mortgages | 307,320 | | 307,320 | | 307,320 | | 307,320 | | | 384 | | 617 | | 1,070 | | 5,403 | | | 0.1 | | 0.2 | | 0.4 | | 1.8 | |
| Credit cards | 15,817 | | 15,817 | | 15,817 | | 15,817 | | | 593 | | 770 | | 931 | | 1,279 | | | 3.8 | | 4.9 | | 5.9 | | 8.1 | |
| Other Retail | 45,423 | | 45,423 | | 45,423 | | 45,423 | | | 923 | | 1,004 | | 1,076 | | 1,328 | | | 2.0 | | 2.2 | | 2.4 | | 2.9 | |
| Commercial Banking | 104,757 | | 104,757 | | 104,757 | | 104,757 | | | 850 | | 1,065 | | 1,524 | | 3,323 | | | 0.8 | | 1.0 | | 1.5 | | 3.2 | |
| Other | 7,671 | | 7,671 | | 7,671 | | 7,671 | | | 30 | | 32 | | 33 | | 36 | | | 0.4 | | 0.4 | | 0.4 | | 0.5 | |
| Total | 480,988 | | 480,988 | | 480,988 | | 480,988 | | | 2,780 | | 3,488 | | 4,634 | | 11,369 | | | 0.6 | | 0.7 | | 1.0 | | 2.4 | |
1 Includes loans and advances to banks, loans and advances to customers, debt securities and items identified as other assets in note 27.
2 Coverage ratio is ECL allowance shown as a percentage of drawn balances.
3 POCI ECL has been presented on a probability-weighted basis. The sensitivity is captured within the UK mortgages total.
| | | | | | | | |
F-80 | Lloyds Banking Group plc Annual Report on Form 20-F 2023 | |
Notes to the consolidated financial statements continued
for the year ended 31 December
Note 24: Allowance for expected credit losses continued
| | | | | | | | | | | | | | | | | | | | | | | | | | | | | | | | | | | | | | | | | | | | |
| Drawn balances1 | | ECL allowance | | Coverage ratio2 |
At 31 December 2022 | Upside
£m | Base case
£m | Downside
£m | Severe
downside
£m | | Upside
£m | Base case
£m | Downside
£m | Severe
downside
£m | | Upside
% | Base case
% | Downside
% | Severe
downside
% |
| Stage 1 | | | | | | | | | | | | | | |
| UK mortgages | 272,780 | | 264,062 | | 259,684 | | 112,102 | | | 39 | | 55 | | 91 | | 106 | | | – | | – | | – | | 0.1 | |
| Credit cards | 12,277 | | 11,583 | | 11,111 | | 9,049 | | | 112 | | 157 | | 195 | | 255 | | | 0.9 | | 1.4 | | 1.8 | | 2.8 | |
| Other Retail | 36,001 | | 35,356 | | 34,807 | | 30,927 | | | 242 | | 274 | | 298 | | 346 | | | 0.7 | | 0.8 | | 0.9 | | 1.1 | |
| Commercial Banking | 99,319 | | 98,481 | | 87,192 | | 51,452 | | | 137 | | 222 | | 323 | | 339 | | | 0.1 | | 0.2 | | 0.4 | | 0.7 | |
| Other | 4,301 | | 4,301 | | 4,301 | | 4,301 | | | 42 | | 42 | | 43 | | 43 | | | 1.0 | | 1.0 | | 1.0 | | 1.0 | |
| Total | 424,678 | | 413,783 | | 397,095 | | 207,831 | | | 572 | | 750 | | 950 | | 1,089 | | | 0.1 | | 0.2 | | 0.2 | | 0.5 | |
| | | | | | | | | | | | | | |
| Stage 2 | | | | | | | | | | | | | | |
| UK mortgages | 26,520 | | 35,238 | | 39,616 | | 187,198 | | | 137 | | 242 | | 557 | | 6,649 | | | 0.5 | | 0.7 | | 1.4 | | 3.6 | |
| Credit cards | 2,426 | | 3,120 | | 3,592 | | 5,654 | | | 338 | | 449 | | 534 | | 952 | | | 13.9 | | 14.4 | | 14.9 | | 16.8 | |
| Other Retail | 3,671 | | 4,316 | | 4,865 | | 8,745 | | | 390 | | 453 | | 501 | | 839 | | | 10.6 | | 10.5 | | 10.3 | | 9.6 | |
| Commercial Banking | 6,663 | | 7,501 | | 18,790 | | 54,530 | | | 214 | | 304 | | 745 | | 3,777 | | | 3.2 | | 4.1 | | 4.0 | | 6.9 | |
| Other | – | | – | | – | | – | | | – | | – | | – | | – | | | – | | – | | – | | – | |
| Total | 39,280 | | 50,175 | | 66,863 | | 256,127 | | | 1,079 | | 1,448 | | 2,337 | | 12,217 | | | 2.7 | | 2.9 | | 3.5 | | 4.8 | |
| | | | | | | | | | | | | | |
| Stage 3 | | | | | | | | | | | | | | |
| UK mortgages | 3,416 | | 3,416 | | 3,416 | | 3,416 | | | 40 | | 184 | | 443 | | 840 | | | 1.2 | | 5.4 | | 13.0 | | 24.6 | |
| Credit cards | 289 | | 289 | | 289 | | 289 | | | 113 | | 113 | | 113 | | 113 | | | 39.1 | | 39.1 | | 39.1 | | 39.1 | |
| Other Retail | 558 | | 558 | | 558 | | 558 | | | 254 | | 257 | | 260 | | 264 | | | 45.5 | | 46.1 | | 46.6 | | 47.3 | |
| Commercial Banking | 3,371 | | 3,371 | | 3,371 | | 3,371 | | | 1,074 | | 1,074 | | 1,074 | | 1,074 | | | 31.9 | | 31.9 | | 31.9 | | 31.9 | |
| Other | 6 | | 6 | | 6 | | 6 | | | 4 | | 4 | | 4 | | 4 | | | 66.7 | | 66.7 | | 66.7 | | 66.7 | |
| Total | 7,640 | | 7,640 | | 7,640 | | 7,640 | | | 1,485 | | 1,632 | | 1,894 | | 2,295 | | | 19.4 | | 21.4 | | 24.8 | | 30.0 | |
| | | | | | | | | | | | | | |
| POCI | | | | | | | | | | | | | | |
UK mortgages3 | 9,622 | | 9,622 | | 9,622 | | 9,622 | | | 253 | | 253 | | 253 | | 253 | | | 2.6 | | 2.6 | | 2.6 | | 2.6 | |
| | | | | | | | | | | | | | |
| Total | | | | | | | | | | | | | | |
| UK mortgages | 312,338 | | 312,338 | | 312,338 | | 312,338 | | | 469 | | 734 | | 1,344 | | 7,848 | | | 0.2 | | 0.2 | | 0.4 | | 2.5 | |
| Credit cards | 14,992 | | 14,992 | | 14,992 | | 14,992 | | | 563 | | 719 | | 842 | | 1,320 | | | 3.8 | | 4.8 | | 5.6 | | 8.8 | |
| Other Retail | 40,230 | | 40,230 | | 40,230 | | 40,230 | | | 886 | | 984 | | 1,059 | | 1,449 | | | 2.2 | | 2.4 | | 2.6 | | 3.6 | |
| Commercial Banking | 109,353 | | 109,353 | | 109,353 | | 109,353 | | | 1,425 | | 1,600 | | 2,142 | | 5,190 | | | 1.3 | | 1.5 | | 2.0 | | 4.7 | |
| Other | 4,307 | | 4,307 | | 4,307 | | 4,307 | | | 46 | | 46 | | 47 | | 47 | | | 1.1 | | 1.1 | | 1.1 | | 1.1 | |
| Total | 481,220 | | 481,220 | | 481,220 | | 481,220 | | | 3,389 | | 4,083 | | 5,434 | | 15,854 | | | 0.7 | | 0.8 | | 1.1 | | 3.3 | |
1 Includes loans and advances to banks, loans and advances to customers, debt securities and items identified as other assets in note 27.
2 Coverage ratio is ECL allowance shown as a percentage of drawn balances.
3 POCI ECL has been presented on a probability-weighted basis. The sensitivity is captured within the UK mortgages total.
| | | | | | | | |
F-81 | Lloyds Banking Group plc Annual Report on Form 20-F 2023 | |
Notes to the consolidated financial statements continued
for the year ended 31 December
Note 24: Allowance for expected credit losses continued
Assessment of climate risk impacts on ECL
The Group continues to develop capabilities to quantify the potential impact of climate risks on ECL. This includes identifying the climate-related risk drivers that could influence future credit losses for loan portfolios that have the highest sensitivity to climate risks and commencing the use of more quantitative analysis on the impact of these risk drivers on ECL. This initial assessment has focused on specific climate-related risk drivers, with the intention to broaden and further develop the assessment in future years. The approach leverages the Group’s climate scenario analysis, to identify the potential physical and transition risk impacts on credit quality. Retail mortgages and Commercial Banking portfolios were identified to have the highest sensitivity to climate risk, with both physical and transition risk drivers assessed. The assessment used a combination of macroeconomic and sector level modelling alongside similar techniques used in estimating judgemental adjustments for non-climate related risks at sector and segment level.
UK mortgages physical and transition risks – additional costs resulting in affordability pressure for buy-to-let (BTL) borrowers of UK properties assessed with a low EPC rating requiring retrofitting to meet potential legislative regulations; and similarly additional costs driven by increased flood risk through property repair or rebuild - discussed below.
Commercial Banking physical and transition risks – chronic and acute impacts of rising temperatures on a company’s costs and revenues. Companies adapting to a sudden transition scenario could potentially lead to increased transition costs in operations, direct carbon costs, and deteriorating financial performance due to changing consumer perspectives - discussed below.
Macroeconomic and sector scenario risks assessments
An assessment was performed on the Group’s internally generated economic scenarios used in the measurement of expected credit losses against external scenarios published by the Network for Greening the Financial System (NGFS) in November 2023. The analysis found the Group’s base case, incorporating the impact of assumed policies over a five-year planning horizon, was positioned broadly within the range of the NGFS climate scenarios considered to be the most plausible, with limited differences in both directions for key impairment drivers. The Group’s MES downside and severe downside together comprising 40 per cent weighting in ECL calculations, are generally more severe than the most adverse NGFS scenario (Net Zero 2050). The assessment suggests that no material changes are required to the Group’s existing suite of economic scenarios.
In Retail, the potential incremental impact of climate factors on key economic drivers has been isolated from a range of NGFS scenarios management judged most plausible (Current Policies, Delayed Transition and Fragmented World scenarios). The incremental risk to ECL was then quantified by overlaying the specific climate impact of these scenarios on macroeconomic drivers, the Group’s base case and MES scenarios. Given these more plausible scenarios exhibited very similar impacts, management modelled the ECL impact from the Delayed Transition scenario, which assumes strong environmental policies are needed to compensate for the absence of early action. The results from the most material portfolios, UK mortgages and credit card ECL models allowed management to conclude on an immaterial ECL impact for Retail.
In Commercial Banking, an exploratory top-down analysis using newly developed sectoral modelling was adopted to estimate the ECL impact of climate risk on commercial credit conditions. This assessment specifically segmented agriculture, automotive, transport, oil and gas and real estate sectors where climate impacts were judged to be more significant. Sector-specific, climate-adjusted credit cycle indices (CCI) were used to calculate probability of default and resulting ECL. These adjusted CCI model inputs combined external NGFS scenarios with client level valuation impacts where available, alongside historic impairment data. Taking into account methodological limitations, the additional ECL required was shown to be immaterial. However, the analysis has been an informative exercise to take further forward in 2024.
Physical and transition risks assessments
In 2023 the Group has progressed with third party consultants to enhance both its access to climate-related data and the development of climate modelling capabilities.
In the UK mortgage portfolio, an affordability stress for customers was applied, by considering a scenario with minimum EPC requirements being introduced for the UK and estimated average retrofitting costs to bring the estimated EPC distribution for the current UK mortgage portfolio into alignment. The potential default risk from additional costs linked to retrofitting risks was assessed, with independent EPC data used to estimate the ECL impact from increased costs to customers for upgrading or retrofitting to meet a potential legislative target of EPC rating of C by 2028 for BTL. The provision impact was assessed using sensitivity analysis that utilises the relationship between disposable income and probability of default. The impact on ECL has been estimated to be less than £5 million for the potential legislative requirement in place for BTL.
Consideration has also been given to flooding risk – a delayed transition climate outlook, out to 2035 was assessed, resulting in over 80 per cent of the book expected to have no risk of flood damage. The impact on ECL related to the affordability risk from flood damage has been estimated to be immaterial. Whilst this supports no judgemental adjustment to ECL being required, the narrow scope does not capture the wider impact on loss rates emanating from being located in a high risk area.
| | | | | | | | | | | |
| Assessment | Nature of risk assessed | Portfolios assessed | ECL impact |
| Macroeconomic impact from climate scenario | Scenario risk – macro level | Retail | < £5 million |
| Sector level impacts from climate scenario | Scenario risk – sector level | Commercial Banking (excluding Business Banking) | < £15 million |
| Retrofitting cost to meet EPC regulation | Transition risk | UK mortgages – BTL | < £5 million |
| Flood risk | Physical risk | UK mortgages | < £5 million |
The assessments are limited due to the degree of uncertainty underpinning key assumptions used, as well as the developmental nature of the data, approach and models used in the quantification. These include, but are not limited to the analyses being restricted to PD impacts only, client level valuation impacts not incorporating climate transition plans, only considering the most material hazard (flooding) for UK mortgages and more broadly the political landscape, future climate data enhancements and further model development.
However, the conclusions made using the Group’s best internal view of likely outcomes across all analyses further strengthens management’s view there is a low residual risk of material error or omission in the Group’s financial statements due to climate-related risks at present and as a result no adjustments have been made to the ECL measured as at 31 December 2023. The current behavioural lives of the Group’s lending dilutes the potential exposure to the later emergence of potential physical climate impacts, with the incorporation of climate risk within underwriting assessments in Commercial Banking providing further mitigation on more recent originations.
| | | | | | | | |
F-82 | Lloyds Banking Group plc Annual Report on Form 20-F 2023 | |
Notes to the consolidated financial statements continued
for the year ended 31 December
Note 25: Finance lease receivables
The Group’s finance lease receivables are classified as loans and advances to customers and accounted for at amortised cost. These balances are analysed as follows:
| | | | | | | | |
| 2023 £m | 2022 £m |
| Not later than 1 year | 5,950 | | 6,562 | |
| Later than 1 year and not later than 2 years | 4,851 | | 4,119 | |
| Later than 2 years and not later than 3 years | 4,609 | | 3,844 | |
| Later than 3 years and not later than 4 years | 3,074 | | 3,029 | |
| Later than 4 years and not later than 5 years | 631 | | 428 | |
| Later than 5 years | 545 | | 574 | |
| Gross investment | 19,660 | | 18,556 | |
| Unearned future finance income | (2,272) | | (1,639) | |
| Rentals received in advance | (14) | | (122) | |
| Net investment | 17,374 | | 16,795 | |
The net investment represents amounts recoverable as follows:
| | | | | | | | |
| 2023 £m | 2022 £m |
| Not later than 1 year | 5,236 | | 5,823 | |
| Later than 1 year and not later than 2 years | 4,328 | | 3,660 | |
| Later than 2 years and not later than 3 years | 4,090 | | 3,552 | |
| Later than 3 years and not later than 4 years | 2,711 | | 2,894 | |
| Later than 4 years and not later than 5 years | 551 | | 385 | |
| Later than 5 years | 458 | | 481 | |
| Net investment | 17,374 | | 16,795 | |
Equipment leased to customers under finance lease receivables relates to financing transactions to fund the purchase of aircraft, ships, motor vehicles and other items. There was an allowance for uncollectable finance lease receivables included in the allowance for impairment losses of £360 million (2022: £252 million).
The Group’s finance lease assets are comprised as follows:
| | | | | | | | |
| 2023 £m | 2022 £m |
| Electric vehicles | 1,339 | | 586 | |
| Internal combustion engine vehicles | 11,465 | | 10,993 | |
| Hybrid vehicles | 1,146 | | 746 | |
| Other | 3,424 | | 4,470 | |
| Net investment | 17,374 | | 16,795 | |
| | | | | | | | |
F-83 | Lloyds Banking Group plc Annual Report on Form 20-F 2023 | |
Notes to the consolidated financial statements continued
for the year ended 31 December
Note 26: Goodwill and other intangible assets1
| | | | | | | | | | | | | | | | | | | | | | | |
| Goodwill
£m | Acquired
value of
in-force
business
£m | Brands
£m | Purchased
credit card
relationships
£m | Customer-
related
intangibles
£m | Capitalised
software
enhancements
£m | Total
£m |
Cost2: | | | | | | | |
| At 1 January 2022 | 2,664 | | 834 | | 596 | | 1,002 | | 538 | | 6,451 | | 12,085 | |
| Exchange and other adjustments | – | | – | | – | | – | | – | | (1) | | (1) | |
| Additions and acquisitions | 335 | | – | | 5 | | – | | 34 | | 1,452 | | 1,826 | |
| Disposals and write-offs | – | | – | | (12) | | – | | – | | (186) | | (198) | |
| At 31 December 2022 | 2,999 | | 834 | | 589 | | 1,002 | | 572 | | 7,716 | | 13,712 | |
| Exchange and other adjustments | – | | – | | – | | – | | – | | – | | – | |
| Additions and acquisitions | 143 | | – | | 2 | | – | | 180 | | 1,494 | | 1,819 | |
| Disposals and write-offs | – | | – | | – | | – | | (70) | | (292) | | (362) | |
| At 31 December 2023 | 3,142 | | 834 | | 591 | | 1,002 | | 682 | | 8,918 | | 15,169 | |
| Accumulated amortisation: | | | | | | | |
| At 1 January 2022 | 344 | | 637 | | 216 | | 621 | | 538 | | 3,016 | | 5,372 | |
| Exchange and other adjustments | – | | 1 | | – | | 1 | | 3 | | (7) | | (2) | |
Charge for the year3 | – | | 22 | | – | | 70 | | – | | 833 | | 925 | |
| Disposals and write-offs | – | | – | | (12) | | – | | – | | (186) | | (198) | |
| At 31 December 2022 | 344 | | 660 | | 204 | | 692 | | 541 | | 3,656 | | 6,097 | |
| Exchange and other adjustments | – | | – | | – | | – | | 3 | | (3) | | – | |
Charge for the year3 | – | | 20 | | 1 | | 70 | | 9 | | 1,028 | | 1,128 | |
| Disposals and write-offs | – | | – | | – | | – | | (70) | | (292) | | (362) | |
| At 31 December 2023 | 344 | | 680 | | 205 | | 762 | | 483 | | 4,389 | | 6,863 | |
Balance sheet amount at 31 December 20234 | 2,798 | | 154 | | 386 | | 240 | | 199 | | 4,529 | | 8,306 | |
Balance sheet amount at 31 December 20224 | 2,655 | | 174 | | 385 | | 310 | | 31 | | 4,060 | | 7,615 | |
1 See note 1 regarding changes to presentation.
2 For acquisitions made prior to 1 January 2004, the date of transition to IFRS, cost is included net of amounts amortised up to 31 December 2003.
3 The charge for the year is recognised in operating expenses (note 14).
4 Includes core deposit intangible of £nil, cost of £2,770 million and accumulated amortisation of £2,770 million.
Goodwill
On 21 February 2023, Lloyds Bank Asset Finance Limited, a wholly owned subsidiary of the Group, acquired 100 per cent of the ordinary share capital of Hamsard 3352 Limited (Tusker), which together with its subsidiaries operates a vehicle management and leasing business. The acquisition, which supports the Group’s sustainability ambitions, will enable the Group to expand its salary sacrifice proposition within motor finance. The total fair value of the purchase consideration was £331 million, settled in cash, and the business has been consolidated into the Group’s results since 21 February 2023. The acquisition is expected to provide significant growth opportunities and funding synergies. Goodwill of £143 million has been recognised on the transaction. None of the goodwill recognised is deductible for tax purposes. Acquisition-related costs of £3 million have been included in operating expenses for the year ended 31 December 2023. The revenue included in the consolidated statement of comprehensive income since 21 February 2023 contributed by Tusker was £171 million, with net loss after tax of £11 million over the same period. Had Tusker been consolidated from 1 January 2023, the consolidated statement of comprehensive income would have included revenue of £196 million and a net loss after tax of £6 million.
The goodwill held in the Group’s balance sheet is tested at least annually for impairment. For the purposes of impairment testing the goodwill is allocated to the appropriate cash-generating unit; of the total balance of £2,798 million (2022: £2,655 million), £2,171 million, or 78 per cent (2022: £2,171 million, 82 per cent) has been allocated to the Life and pensions cash-generating unit; £302 million, or 11 per cent (2022: £302 million, 11 per cent) has been allocated to the Credit card cash-generating unit in the Group’s Retail division; and £309 million, or 11 per cent (2022: £166 million, 6 per cent) to the Motor business cash-generating units, both in the Group’s Retail division.
The recoverable amount of the goodwill relating to Scottish Widows is based on a value-in-use calculation. The calculation uses pre-tax projections of future cash flows based upon budgets and plans approved by management covering a four-year period, the related run-off of existing business in-force and a discount rate (pre-tax) of 11.0 per cent. The budgets and plans are based upon past experience adjusted to take into account anticipated changes in sales volumes, product mix and margins having regard to expected market conditions (which will reflect current and future risks, such as climate and expected economic activity conditions) and competitor activity. The discount rate is determined with reference to internal measures and available industry information. New business cash flows beyond the four-year period have been extrapolated using a reducing balance growth rate that falls from 3.5 per cent to 2.0 per cent after 20 years, which does not exceed the long-term average growth rate for the life assurance market. Management believes that any reasonably possible change in the key assumptions above would not cause the recoverable amount of the goodwill relating to Scottish Widows to fall below its balance sheet carrying value.
The recoverable amount of the goodwill relating to the Motor business is based on a value-in-use calculation using post-tax cash flow projections based on financial budgets and plans approved by management covering a four-year period and a discount rate (post-tax) of 10.5 per cent, based on the Group’s cost of equity. This is equivalent to a pre-tax rate of 14.0 per cent. The budgets and plans are based upon past experience adjusted to take into account anticipated changes in sales volumes having regard to expected market conditions and competitor activity. The cash flows beyond the four-year period are extrapolated using a growth rate of 3.5 per cent which does not exceed the long-term average growth rates for the markets in which the Motor business participates. Management believes that any reasonably possible change in the key assumptions, including from the impacts of climate change or climate-related legislation, would not cause the recoverable amount of the goodwill relating to the Motor business to fall below the balance sheet carrying value.
| | | | | | | | |
F-84 | Lloyds Banking Group plc Annual Report on Form 20-F 2023 | |
Notes to the consolidated financial statements continued
for the year ended 31 December
Note 26: Goodwill and other intangible assets continued
The recoverable amount of the goodwill relating to Credit cards has been based on a value-in-use calculation using post-tax cash flow projections based on financial budgets and plans approved by management covering a four-year period and a discount rate (post-tax) of 10.5 per cent, based on the Group’s cost of equity. This is equivalent to a pre-tax rate of 14.0 per cent. The budgets and plans are based upon past experience adjusted to take into account anticipated changes in credit card volumes having regard to expected market conditions and competitor activity. The cash flows beyond the four-year period assume 3.5 per cent growth, which does not exceed the long-term average growth rates for the markets in which the Cards business participates. Management believes that any reasonably possible change in the key assumptions above would not cause the recoverable amount of the goodwill relating to Credit cards to fall below the balance sheet carrying value.
Other intangible assets
The acquired value of in-force non-participating investment contracts includes £93 million (2022: £106 million) in relation to OEIC business.
The brand arising from the acquisition of Bank of Scotland in 2009 is recognised on the Group’s balance sheet and has been determined to have an indefinite useful life. The carrying value at 31 December 2023 was £380 million (2022: £380 million). The Bank of Scotland name has been in existence for over 300 years and there are no indications that the brand should not have an indefinite useful life. The recoverable amount has been based on a value-in-use calculation. The calculation uses post-tax projections for a four-year period of the income generated by the Bank of Scotland cash-generating unit, a discount rate of 10.5 per cent and a future growth rate of 3.5 per cent. Management believes that any reasonably possible change in the key assumptions would not cause the recoverable amount of the Bank of Scotland brand to fall below its balance sheet carrying value.
Note 27: Other assets
| | | | | | | | | | | |
| 2023 £m | | 20221 £m |
| Insurance contract assets | 1 | | | – | |
| Reinsurance contract assets | 442 | | | 372 | |
| Investment in joint ventures and associates | 401 | | | 385 | |
| Property, plant and equipment: | | | |
| Investment properties (see below) | 2,862 | | | 2,532 | |
| Premises | 920 | | | 871 | |
| Equipment | 1,170 | | | 1,285 | |
| Operating lease assets (see below) | 6,523 | | | 4,816 | |
| Right-of-use assets (note 28) | 1,055 | | | 1,156 | |
| 12,530 | | | 10,660 | |
| Settlement balances and items in the course of collection from banks | 912 | | | 658 | |
| Prepayments | 1,455 | | | 1,224 | |
| Deferred acquisition and origination costs | 39 | | | 54 | |
| Other assets | 1,364 | | | 1,183 | |
| Total other assets | 17,144 | | | 14,536 | |
1 Restated for presentational changes and for the adoption of IFRS 17; see notes 1 and 54.
Investment properties
The Group’s investment properties are predominantly held by the Insurance, Pensions and Investments business where they back policyholder liabilities. They are valued by external Chartered Surveyors using industry standard techniques based on guidance from the Royal Institute of Chartered Surveyors. The valuation methodology includes an assessment of general market conditions and sector level transactions and takes account of expectations of occupancy rates, rental income and growth. Property valuations undergo individual scrutiny using cash flow analysis to factor in the timing of rental reviews, capital expenditure, lease incentives, dilapidation and operating expenses; these reviews utilise both observable and unobservable inputs. Within the fair value hierarchy, all of the Group’s investment properties are categorised as level 3 (see note 21 for details of levels in the fair value hierarchy). The table below analyses movements in level 3 investment properties, which are carried at fair value.
| | | | | | | | |
| 2023 £m | 2022 £m |
| At 1 January | 2,532 | | 3,612 | |
| Acquisition of new properties | 450 | | 60 | |
| Additional expenditure on existing properties | 19 | | 50 | |
Change in fair value (note 7) | (87) | | (511) | |
| Disposals | (52) | | (679) | |
| At 31 December | 2,862 | | 2,532 | |
Rental income of £146 million (2022: £145 million) and direct operating expenses of £16 million (2022: £32 million) arising from investment properties that generate rental income have been recognised in the income statement.
Capital expenditure in respect of investment properties which had been contracted for but not recognised in the financial statements was £488 million (2022: £119 million).
| | | | | | | | |
F-85 | Lloyds Banking Group plc Annual Report on Form 20-F 2023 | |
Notes to the consolidated financial statements continued
for the year ended 31 December
Note 27: Other assets continued
Operating lease assets where the Group is lessor
Equipment leased to customers under operating leases primarily relates to vehicle contract hire arrangements. At 31 December the future minimum rentals receivable under non-cancellable operating leases were as follows:
| | | | | | | | | | | | | | | | | | | | | | | |
| Within 1 year
£m | 1 to 2 years
£m | 2 to 3 years
£m | 3 to 4 years
£m | 4 to 5 years
£m | Over 5 years
£m | Total
£m |
At 31 December 2023 | 1,336 | | 857 | | 680 | | 309 | | 70 | | 4 | | 3,256 | |
At 31 December 2022 | 912 | | 620 | | 322 | | 102 | | 11 | | – | | 1,967 | |
Equipment leased to customers under operating leases primarily relates to vehicle contract hire arrangements. Operating lease assets are comprised as follows:
| | | | | | | | |
| 2023 £m | 2022 £m |
| Electric vehicles | 3,259 | | 1,610 | |
| Internal combustion engine vehicles | 1,815 | | 2,042 | |
| Hybrid vehicles | 1,444 | | 1,159 | |
| Other | 5 | | 5 | |
| Total operating lease assets | 6,523 | | 4,816 | |
Note 28: Lessee disclosures
The table below sets out the movement in the Group’s right-of-use assets, which are primarily in respect of premises, and are recognised within other assets (note 27).
| | | | | | | | |
| 2023 £m | 2022 £m |
| At 1 January | 1,156 | | 1,318 | |
| Exchange and other adjustments | 3 | | 3 | |
| Additions | 136 | | 98 | |
| Disposals | (31) | | (37) | |
| Depreciation charge for the year | (209) | | (226) | |
| At 31 December | 1,055 | | 1,156 | |
The Group’s lease liabilities are recognised within other liabilities (note 37). The maturity analysis of the Group’s lease liabilities on an undiscounted basis is set out in the liquidity risk section of note 52.
The total cash outflow for leases in the year ended 31 December 2023 was £215 million (2022: £210 million). The amount recognised within interest expense in respect of lease liabilities is disclosed in note 5.
| | | | | | | | |
F-86 | Lloyds Banking Group plc Annual Report on Form 20-F 2023 | |
Notes to the consolidated financial statements continued
for the year ended 31 December
Note 29: Debt securities in issue
| | | | | | | | | | | | | | | | | | | | | | | |
| 2023 | | 2022 |
| At fair value through profit or loss
£m | At
amortised
cost
£m | Total
£m | | At fair value through profit or loss
£m | At
amortised
cost
£m | Total
£m |
| Senior unsecured notes issued | 5,242 | | 37,038 | | 42,280 | | | 5,133 | | 36,819 | | 41,952 | |
| Covered bonds | – | | 14,243 | | 14,243 | | | – | | 14,242 | | 14,242 | |
| Certificates of deposit issued | – | | 8,059 | | 8,059 | | | – | | 7,225 | | 7,225 | |
| Securitisation notes | 23 | | 4,211 | | 4,234 | | | 26 | | 2,780 | | 2,806 | |
| Commercial paper | – | | 12,041 | | 12,041 | | | – | | 12,753 | | 12,753 | |
| Total debt securities in issue | 5,265 | | 75,592 | | 80,857 | | | 5,159 | | 73,819 | | 78,978 | |
Covered bonds and securitisation programmes
At 31 December 2023, the bonds held by external parties and those held internally, were secured on certain loans and advances to customers amounting to £27,019 million (2022: £28,231 million) which have been assigned to bankruptcy remote limited liability partnerships to provide security for issues of covered bonds by the Group. The Group retains all of the risks and rewards associated with these loans and the partnerships are consolidated fully with the loans retained on the Group’s balance sheet and the related covered bonds in issue included within debt securities in issue at amortised cost.
The Group has two covered bond programmes, for which limited liability partnerships have been established to ring-fence asset pools and guarantee the covered bonds issued by the Group. At the reporting date the Group had over-collateralised these programmes to meet the terms of the programmes, to secure the rating of the covered bonds and to provide operational flexibility. From time to time, the obligations of the Group to provide collateral may increase due to the formal requirements of the programmes. The Group may also voluntarily contribute collateral to support the ratings of the covered bonds.
At 31 December 2023, the Group’s securitisation notes in issue held by external parties includes £23 million at fair value through profit or loss (2022: £26 million). Those notes held internally, are secured on loans and advances to customers amounting to £30,716 million (2022: £29,384 million), the majority of which have been sold by subsidiary companies to bankruptcy remote structured entities. As the structured entities are funded by the issue of debt on terms whereby the majority of the risks and rewards of the portfolio are retained by the subsidiary, the structured entities are consolidated fully and all of these loans are retained on the Group’s balance sheet, with the related notes in issue included within debt securities in issue at amortised cost.
Certain loans and advances to customers have been assigned to bankruptcy remote limited liability partnerships.
Cash deposits of £3,794 million (2022: £3,896 million) which support the debt securities issued by the structured entities, the term advances related to covered bonds and other legal obligations, are held by the Group. Additionally, the Group has certain contractual arrangements to provide liquidity facilities to some of these structured entities. At 31 December 2023 these obligations had not been triggered; the maximum exposure under these facilities was £29 million (2022: £25 million).
The Group recognises the full liabilities associated with its securitisation and covered bond programmes within debt securities in issue, although the obligations of the Group in respect of its securitisation issuances are limited to the cash flows generated from the underlying assets. The Group could be required to provide additional support to a number of the securitisation programmes to support the credit ratings of the debt securities issued, in the form of increased cash reserves and the holding of subordinated notes. Further, certain programmes contain contractual obligations that require the Group to repurchase assets should they become credit-impaired or as otherwise required by the transaction documents. The Group has not provided financial or other support by voluntarily offering to repurchase assets from any of its public securitisation programmes during 2023 (2022: none).
| | | | | | | | |
F-87 | Lloyds Banking Group plc Annual Report on Form 20-F 2023 | |
Notes to the consolidated financial statements continued
for the year ended 31 December
Note 30: Insurance and participating investment contracts assets and liabilities
Critical accounting judgements and key sources of estimation uncertainty
| | | | | |
| Critical judgements: | Determining the characteristics which make a product illiquid, the level of illiquidity premium to apply to the discount rate of different products and how the illiquidity premium is determined |
| The determination of whether a drawdown feature added to its longstanding and workplace pension products was a modification that required derecognition and the determination of the premium that would have been charged if these were new contracts. |
| | | | | | | | | | | | | | | | | | | | | | | |
| 2023 | | 2022 |
| Life
£m | Non-life
£m | Total
£m | | Life
£m | Non-life
£m | Total
£m |
| Insurance contract assets | 1 | | – | | 1 | | | – | | – | | – | |
Liabilities arising from insurance and participating investment contracts1 | (119,784) | | (364) | | (120,148) | | | (109,920) | | (380) | | (110,300) | |
| Insurance acquisition assets | 8 | | 16 | | 24 | | | 8 | | 14 | | 22 | |
| Net liabilities | (119,775) | | (348) | | (120,123) | | | (109,912) | | (366) | | (110,278) | |
1 Excluding insurance acquisition assets.
The Group estimates future cash flows based on which cash flows are expected and the probability that they will occur as at the measurement date. The Group uses information about past events, current conditions and forecasts of future conditions to inform these expectations. The Group’s estimate of future cash flows is the mean of a range of scenarios that reflect the full range of possible outcomes, considering all reasonable and supportable information available at the reporting date. The probability-weighted average of the future cash flows is calculated using a deterministic scenario representing the probability-weighted mean of a range of scenarios.
The Group uses assumptions to develop estimates of future cash flows. These assumptions are reassessed at each reported date to reflect conditions existing at the measurement date.
The Group has applied judgment in determining the characteristics which make a product illiquid, the level of illiquidity premium to apply to the discount rate of different products and how the illiquidity premium is determined, where material.
The products to which an illiquidity premium has been applied to the discount rate are annuity contracts, due to the illiquid nature of their cash flows, certain reinsurance contracts held where the underlying contracts are annuity contracts, due to the transfer of longevity risk to the reinsurer, and whole of life protection contracts, due to the inherent policyholder value and zero surrender option.
For annuity contracts, at initial recognition, the illiquidity premium is calculated with reference to a strategic portfolio of assets, and subsequently measured to reflect the mix of actual assets backing annuity contracts, adjusted to reflect the impacts of transition from initial recognition. To reflect differences between the characteristics of insurance contracts and the derivation of discount rates based on a reference portfolio, adjustments for credit risk are required, and the Group uses the fundamental spread to maintain consistency with its Solvency II approach. For protection contracts, the illiquidity premium is based on the spread on a covered bond index.
The average yield curves (GBP currency) that were used to discount the estimates of future cash flows that do not vary based on the returns of the underlying items are as follows:
| | | | | | | | | | | | | | | | | |
| 1 year | 5 year | 10 year | 20 year | 30 year |
| 2023 | 5.37 | | 4.15 | | 4.79 | | 4.72 | | 4.19 | |
| 2022 | 6.11 | | 5.15 | | 5.03 | | 4.84 | | 4.42 | |
The Group has also applied judgement to determine if a drawdown feature added to its longstanding and workplace pension products was a modification that required derecognition. See note 10 for more details.
The Group determines the quantity of benefits provided under each contract as follows:
| | | | | |
| Product | Basis |
| With-Profits and unit linked | Policyholder account value1 |
| Annuities | Pre-vesting date2: defined amount payable Post-vesting date: annuity payout |
1 Or the guaranteed benefits, if higher.
2 Immediate annuities have no pre-vesting date period.
Mortality
The mortality assumptions for the main classes of business are set with regard to recent Group experience and general industry trends, all of which are adjusted for smoker status and age/gender specific factors. The base mortality tables used for the annuities business for the year ended 31 December 2023 and the prior period were selected from the bespoke mortality tables. The mortality improvements adopt the 100% Bespoke tables and CMI 2022_{M/F}_(7.25)_{2.0/1.8}%_{0.0/0.2}A_2013 for the year ended 31 December 2023 and the 100% Bespoke tables and CMI 2021_{M/F}_(7.25)_{2.0/1.8}%_{0.0/0.2}A_2013 for the prior period.
Lapse rates
Lapse rates refer to the rate of policy termination or the rate at which policyholders stop paying regular premiums due under the contract. Historical persistency experience is analysed using statistical techniques. As experience can vary considerably between different product types and for contracts that have been in force for different periods, the data is broken down into broadly homogeneous groups for the purposes of determining the Group’s lapse rate in determining the assumptions, which are set on a best estimates basis, based on investigations of historical experience with some expert judgement overlays reflecting expectations of future trends and other external data. The lapse rates for workplace pensions range from 0.8 per cent to 14.6 per cent (2022: 0.8 per cent to 15.7 per cent) and for longstanding business range from 0.5 per cent to 74.1 per cent (2022: 0.5 per cent to 74.1 per cent), the wide range being a result of the age and variety of products.
| | | | | | | | |
F-88 | Lloyds Banking Group plc Annual Report on Form 20-F 2023 | |
Notes to the consolidated financial statements continued
for the year ended 31 December
Note 31: Reconciliation of insurance balances for liability for remaining coverage and liability for incurred claims
| | | | | | | | | | | | | | | | | | | | | | | | | | | | | | | | |
| | 2023 | | 2022 |
| | Liabilities for
remaining coverage | Liability for
incurred
claims
£m | | | Liabilities for
remaining coverage | Liability for
incurred
claims
£m | |
| Life | Excluding loss
component
£m | Loss
component
£m | Total
£m | | Excluding loss
component
£m | Loss
component
£m | Total
£m |
| At 1 January | | | | | | | | | | |
| Insurance contract assets | | – | | – | | – | | – | | | 184 | | (160) | | – | | 24 | |
Liabilities arising from insurance and participating investment contracts1 | | (108,846) | | (471) | | (603) | | (109,920) | | | (124,053) | | (179) | | (653) | | (124,885) | |
| Net asset (liability) | | (108,846) | | (471) | | (603) | | (109,920) | | | (123,869) | | (339) | | (653) | | (124,861) | |
| | | | | | | | | | | |
| Insurance revenue | | | | | | | | | | |
| Contracts under the modified retrospective approach | | – | | – | | – | | – | | | – | | – | | – | | – | |
| Contracts under the fair value transition approach | | 1,467 | | – | | – | | 1,467 | | | 1,266 | | – | | – | | 1,266 | |
| Other contracts | | 1,027 | | – | | – | | 1,027 | | | 636 | | – | | – | | 636 | |
| | 2,494 | | – | | – | | 2,494 | | | 1,902 | | – | | – | | 1,902 | |
| Insurance service expenses | | | | | | | | | | |
| Incurred claims and other directly attributable expenses | | – | | 52 | | (1,949) | | (1,897) | | | – | | 44 | | (1,795) | | (1,751) | |
| Adjustments to liabilities for incurred claims | | – | | – | | – | | – | | | – | | – | | – | | – | |
| Losses from drawdown contract modifications | | – | | – | | – | | – | | | (1,242) | | – | | – | | (1,242) | |
| Losses and reversal of losses on onerous insurance contracts | | – | | 58 | | – | | 58 | | | – | | (244) | | – | | (244) | |
| Amortisation of insurance acquisition cash flows | | (88) | | – | | – | | (88) | | | (85) | | – | | – | | (85) | |
| | (88) | | 110 | | (1,949) | | (1,927) | | | (1,327) | | (200) | | (1,795) | | (3,322) | |
| Insurance service result | | 2,406 | | 110 | | (1,949) | | 567 | | | 575 | | (200) | | (1,795) | | (1,420) | |
| Net finance income (expense) from insurance and participating investment contracts | | (11,576) | | (105) | | (3) | | (11,684) | | | 15,885 | | 68 | | (3) | | 15,950 | |
| Exchange differences | | 32 | | – | | – | | 32 | | | (94) | | – | | – | | (94) | |
| Total change in profit or loss | | (9,138) | | 5 | | (1,952) | | (11,085) | | | 16,366 | | (132) | | (1,798) | | 14,436 | |
| | | | | | | | | | | |
| Investment components | | 8,793 | | – | | (8,793) | | – | | | 7,285 | | – | | (7,285) | | – | |
| | | | | | | | | | | |
| Cash flows | | | | | | | | | | |
| Premiums received | | (9,768) | | – | | – | | (9,768) | | | (8,861) | | – | | – | | (8,861) | |
| Claims and other insurance service expenses paid | | – | | – | | 10,721 | | 10,721 | | | – | | – | | 9,099 | | 9,099 | |
| Insurance acquisition cash flows | | 203 | | – | | – | | 203 | | | 200 | | – | | – | | 200 | |
| | (9,565) | | – | | 10,721 | | 1,156 | | | (8,661) | | – | | 9,099 | | 438 | |
| | | | | | | | | | | |
| Transfer to other items in the balance sheet | | 32 | | – | | 34 | | 66 | | | 33 | | – | | 34 | | 67 | |
| | | | | | | | | | | |
| At 31 December | | | | | | | | | | |
| Insurance contract assets | | 1 | | – | | – | | 1 | | | – | | – | | – | | – | |
Liabilities arising from insurance and participating investment contracts1 | | (118,725) | | (466) | | (593) | | (119,784) | | | (108,846) | | (471) | | (603) | | (109,920) | |
| Net asset (liability) | | (118,724) | | (466) | | (593) | | (119,783) | | | (108,846) | | (471) | | (603) | | (109,920) | |
1 Excluding insurance acquisition assets.
| | | | | | | | |
F-89 | Lloyds Banking Group plc Annual Report on Form 20-F 2023 | |
Notes to the consolidated financial statements continued
for the year ended 31 December
Note 31: Reconciliation of insurance balances for liability for remaining coverage and liability for incurred claims continued
| | | | | | | | | | | | | | | | | | | | | | | | | | | | | | | | |
| | 2023 | | 2022 |
| | Liabilities for
remaining coverage | Liability for
incurred
claims
£m | | | Liabilities for
remaining coverage | Liability for
incurred
claims
£m | |
| Non-life | Excluding loss
component
£m | Loss
component
£m | Total
£m | | Excluding loss
component
£m | Loss
component
£m | Total
£m |
| At 1 January | | | | | | | | | | |
| Insurance contract assets | | – | | – | | – | | – | | | – | | – | | – | | – | |
Liabilities arising from insurance and participating investment contracts1 | | (22) | | (1) | | (357) | | (380) | | | (32) | | (4) | | (286) | | (322) | |
| Net asset (liability) | | (22) | | (1) | | (357) | | (380) | | | (32) | | (4) | | (286) | | (322) | |
| | | | | | | | | | | |
| Insurance revenue | | | | | | | | | | |
| Contracts under the modified retrospective approach | | – | | – | | – | | – | | | – | | – | | – | | – | |
| Contracts under the fair value transition approach | | – | | – | | – | | – | | | – | | – | | – | | – | |
| Other contracts | | 514 | | – | | – | | 514 | | | 559 | | – | | – | | 559 | |
| | 514 | | – | | – | | 514 | | | 559 | | – | | – | | 559 | |
| Insurance service expenses | | | | | | | | | | |
| Incurred claims and other directly attributable expenses | | – | | – | | (448) | | (448) | | | – | | 5 | | (480) | | (475) | |
| Adjustments to liabilities for incurred claims | | – | | – | | (3) | | (3) | | | – | | – | | (57) | | (57) | |
| Losses and reversal of losses on onerous insurance contracts | – | | 1 | | – | | 1 | | | – | | (2) | | – | | (2) | |
| Amortisation of insurance acquisition cash flows | | (30) | | | – | | (30) | | | 7 | | – | | – | | 7 | |
| | (30) | | 1 | | (451) | | (480) | | | 7 | | 3 | | (537) | | (527) | |
| Insurance service result | | 484 | | 1 | | (451) | | 34 | | | 566 | | 3 | | (537) | | 32 | |
| Net finance income (expense) from insurance and participating investment contracts | | – | | – | | (6) | | (6) | | | – | | – | | (2) | | (2) | |
| Exchange differences | | – | | – | | – | | – | | | – | | – | | – | | – | |
| Total change in profit or loss | | 484 | | 1 | | (457) | | 28 | | | 566 | | 3 | | (539) | | 30 | |
| | | | | | | | | | | |
| Investment components | | – | | – | | – | | – | | | – | | – | | – | | – | |
| | | | | | | | | | | |
| Cash flows | | | | | | | | | | |
| Premiums received | | (525) | | – | | – | | (525) | | | (584) | | – | | – | | (584) | |
| Claims and other insurance service expenses paid | | – | | – | | 475 | | 475 | | | – | | – | | 468 | | 468 | |
| Insurance acquisition cash flows | | 38 | | – | | – | | 38 | | | 28 | | – | | – | | 28 | |
| | (487) | | – | | 475 | | (12) | | | (556) | | – | | 468 | | (88) | |
| | | | | | | | | | | |
| Transfer to other items in the balance sheet | | – | | – | | – | | – | | | – | | – | | – | | – | |
| | | | | | | | | | | |
| At 31 December | | | | | | | | | | |
| Insurance contract assets | | – | | – | | – | | – | | | – | | – | | – | | – | |
Liabilities arising from insurance and participating investment contracts1 | | (25) | | – | | (339) | | (364) | | | (22) | | (1) | | (357) | | (380) | |
| Net asset (liability) | | (25) | | – | | (339) | | (364) | | | (22) | | (1) | | (357) | | (380) | |
1 Excluding insurance acquisition assets.
| | | | | | | | |
F-90 | Lloyds Banking Group plc Annual Report on Form 20-F 2023 | |
Notes to the consolidated financial statements continued
for the year ended 31 December
Note 32: Reconciliation of measurement components of insurance contract balances
| | | | | | | | | | | | | | | | | | | | | | | | | | | | | | | | | | | | | | | | | | | | |
| | 2023 |
| | | | | | Contractual service margin | | |
| Life | | Present
value of
future
cash
flows
£m | Risk
adjustment
for non-
financial
risk
£m | Contracts
measured
under the
modified
retrospective
approach
£m | | Contracts
measured
under the
fair value
approach
£m | | Other
contracts
£m | | Total
£m | | Total
£m |
| At 1 January | | | | | | | | | | | | | | |
| Insurance contract assets | | – | | | – | | | – | | | – | | | – | | | – | | | – | |
Liabilities arising from insurance and participating investment contracts1 | | (104,545) | | | (1,165) | | | – | | | (1,441) | | | (2,769) | | | (4,210) | | | (109,920) | |
| Net asset (liability) | | (104,545) | | | (1,165) | | | – | | | (1,441) | | | (2,769) | | | (4,210) | | | (109,920) | |
| | | | | | | | | | | | | | | |
| Relating to current services | | | | | | | | | | | | | | |
| CSM recognised for services provided | | – | | | – | | | – | | | 130 | | | 199 | | | 329 | | | 329 | |
| Changes in risk adjustment for non-financial risk for risk expired | | – | | | 84 | | | – | | | – | | | – | | | – | | | 84 | |
| Experience adjustments | | 99 | | | – | | | – | | | (1) | | | (2) | | | (3) | | | 96 | |
| | 99 | | | 84 | | | – | | | 129 | | | 197 | | | 326 | | | 509 | |
| Relating to future services | | | | | | | | | | | | | | |
| Contracts initially recognised in the year | | 107 | | | (86) | | | – | | | – | | | (92) | | | (92) | | | (71) | |
| Changes in estimates that adjust the CSM | | 390 | | | (12) | | | – | | | (170) | | | (208) | | | (378) | | | – | |
| Changes in estimates that result in losses and reversal of losses on onerous contracts | | 109 | | | 20 | | | – | | | – | | | – | | | – | | | 129 | |
| | 606 | | | (78) | | | – | | | (170) | | | (300) | | | (470) | | | 58 | |
| Relating to past services | | | | | | | | | | | | | | |
| Adjustments to liabilities for incurred claims | | – | | | – | | | – | | | – | | | – | | | – | | | – | |
| Insurance service result | | 705 | | | 6 | | | – | | | (41) | | | (103) | | | (144) | | | 567 | |
| Net finance income (expense) from insurance and participating investment contracts | | (11,621) | | | – | | | – | | | 7 | | | (70) | | | (63) | | | (11,684) | |
| Exchange differences | | 30 | | | – | | | – | | | 2 | | | – | | | 2 | | | 32 | |
| Total change in profit or loss | | (10,886) | | | 6 | | | – | | | (32) | | | (173) | | | (205) | | | (11,085) | |
| | | | | | | | | | | | | | | |
| Cash flows | | | | | | | | | | | | | | |
| Premiums received | | (9,768) | | | – | | | – | | | – | | | – | | | – | | | (9,768) | |
| Claims and other insurance service expenses paid | | 10,721 | | | – | | | – | | | – | | | – | | | – | | | 10,721 | |
| Insurance acquisition cash flows | | 203 | | | – | | | – | | | – | | | – | | | – | | | 203 | |
| | 1,156 | | | – | | | – | | | – | | | – | | | – | | | 1,156 | |
| | | | | | | | | | | | | | | |
| Transfer to other items in the balance sheet | | 66 | | | – | | | – | | | – | | | – | | | – | | | 66 | |
| | | | | | | | | | | | | | | |
| At 31 December | | | | | | | | | | | | | | |
| Insurance contract assets | | – | | | 1 | | | – | | | – | | | – | | | – | | | 1 | |
Liabilities arising from insurance and participating investment contracts1 | | (114,209) | | | (1,160) | | | – | | | (1,473) | | | (2,942) | | | (4,415) | | | (119,784) | |
| Net asset (liability) | | (114,209) | | | (1,159) | | | – | | | (1,473) | | | (2,942) | | | (4,415) | | | (119,783) | |
1 Excluding insurance acquisition assets.
| | | | | | | | |
F-91 | Lloyds Banking Group plc Annual Report on Form 20-F 2023 | |
Notes to the consolidated financial statements continued
for the year ended 31 December
Note 32: Reconciliation of measurement components of insurance contract balances continued
| | | | | | | | | | | | | | | | | | | | | | | | | | | | | | | | | | | | | | | | | | | | |
| | 2022 |
| | | | | | Contractual service margin | | |
| Life | | Present
value of
future
cash
flows
£m | Risk
adjustment
for non-
financial
risk
£m | Contracts
measured
under the
modified
retrospective
approach
£m | | Contracts
measured
under the
fair value
approach
£m | | Other
contracts
£m | | Total
£m | | Total
£m |
| At 1 January | | | | | | | | | | | | | | |
| Insurance contract assets | | 149 | | | (53) | | | – | | | (67) | | | (5) | | | (72) | | | 24 | |
Liabilities arising from insurance and participating investment contracts1 | | (121,344) | | | (1,599) | | | – | | | (1,359) | | | (583) | | | (1,942) | | | (124,885) | |
| Net asset (liability) | | (121,195) | | | (1,652) | | | – | | | (1,426) | | | (588) | | | (2,014) | | | (124,861) | |
| | | | | | | | | | | | | | | |
| Relating to current services | | | | | | | | | | | | | | |
| CSM recognised for services provided | | – | | | – | | | – | | | 123 | | | 122 | | | 245 | | | 245 | |
| Changes in risk adjustment for non-financial risk for risk expired | | – | | | 103 | | | – | | | – | | | – | | | – | | | 103 | |
| Experience adjustments | | (189) | | | – | | | – | | | – | | | (93) | | | (93) | | | (282) | |
| | (189) | | | 103 | | | – | | | 123 | | | 29 | | | 152 | | | 66 | |
| Relating to future services | | | | | | | | | | | | | | |
Contracts initially recognised in the year2 | | 2,364 | | | (646) | | | – | | | – | | | (1,793) | | | (1,793) | | | (75) | |
Changes in estimates that adjust the CSM3 | | (158) | | | 603 | | | – | | | (83) | | | (362) | | | (445) | | | – | |
Changes in estimates that result in losses and reversal of losses on onerous contracts3 | | (1,835) | | | 424 | | | – | | | – | | | – | | | – | | | (1,411) | |
| | 371 | | | 381 | | | – | | | (83) | | | (2,155) | | | (2,238) | | | (1,486) | |
| Relating to past services | | | | | | | | | | | | | | |
| Adjustments to liabilities for incurred claims | | (4) | | | 4 | | | – | | | – | | | – | | | – | | | – | |
| Insurance service result | | 178 | | | 488 | | | – | | | 40 | | | (2,126) | | | (2,086) | | | (1,420) | |
| Net finance income (expense) from insurance and participating investment contracts | | 16,055 | | | – | | | – | | | (50) | | | (55) | | | (105) | | | 15,950 | |
| Exchange differences | | (88) | | | (1) | | | – | | | (5) | | | – | | | (5) | | | (94) | |
| Total change in profit or loss | | 16,145 | | | 487 | | | – | | | (15) | | | (2,181) | | | (2,196) | | | 14,436 | |
| | | | | | | | | | | | | | | |
| Cash flows | | | | | | | | | | | | | | |
| Premiums received | | (8,861) | | | – | | | – | | | – | | | – | | | – | | | (8,861) | |
| Claims and other insurance service expenses paid | | 9,099 | | | – | | | – | | | – | | | – | | | – | | | 9,099 | |
| Insurance acquisition cash flows | | 200 | | | – | | | – | | | – | | | – | | | – | | | 200 | |
| | 438 | | | – | | | – | | | – | | | – | | | – | | | 438 | |
| | | | | | | | | | | | | | | |
| Transfer to other items in the balance sheet | | 67 | | | – | | | – | | | – | | | – | | | – | | | 67 | |
| | | | | | | | | | | | | | | |
| At 31 December | | | | | | | | | | | | | | |
| Insurance contract assets | | – | | | – | | | – | | | – | | | – | | | – | | | – | |
Liabilities arising from insurance and participating investment contracts1 | | (104,545) | | | (1,165) | | | – | | | (1,441) | | | (2,769) | | | (4,210) | | | (109,920) | |
| Net asset (liability) | | (104,545) | | | (1,165) | | | – | | | (1,441) | | | (2,769) | | | (4,210) | | | (109,920) | |
1 Excluding insurance acquisition assets.
2 Contracts initially recognised in the year, include present value of future cash flows of £2,281 million, risk adjustment of £(551) million and CSM of £(1,730) million relating to contracts that were modified to add a drawdown feature and recognised as new contracts.
3 The Group derecognised present value of future cash flows of £2,175 million, risk adjustment of £(534) million and CSM of £(399) million relating to contracts that were derecognised due to a contract modification to add a drawdown feature. The amounts derecognised are included within changes in estimates that adjust the CSM and changes that result in losses and reversal of losses on onerous contracts. A loss on contract derecognition modification of £1,242 million arose and was recognised in insurance service expense. Further details are provided in note 10.
| | | | | | | | |
F-92 | Lloyds Banking Group plc Annual Report on Form 20-F 2023 | |
Notes to the consolidated financial statements continued
for the year ended 31 December
Note 32: Reconciliation of measurement components of insurance contract balances continued
The Group estimates the risk adjustment separately from other components of the fulfilment cash flows using an explicit margins approach such that a confidence level scenario is used to determine the margins to be applied to the best estimate assumptions. The risk adjustment represents the difference in the value of the best estimate cash flows with and without these margins. The risk adjustment is calculated at a policy level.
The confidence level corresponding to the risk adjustment is 90 per cent (2022: 90 per cent). The risk adjustment is calibrated to the value at risk over a one-year time horizon at this confidence level for non-financial risks. This is translated, using statistical approximations, into an equivalent confidence level on a value at risk basis over the expected lifetime of in-force policies of approximately 70 per cent (2022: 70 per cent) at end of the reporting period.
Note 33: Impacts of insurance and participating investment contracts recognised in the year
| | | | | | | | | | | | | | | | | | | | | | | |
| 2023 | | 2022 |
| Life | Profitable
contracts
issued
£m | Onerous
contracts
issued
£m | Total
£m | | Profitable
contracts
issued
£m | Onerous
contracts
issued
£m | Total
£m |
| Insurance and participating investment contracts | | | | | | | |
| Insurance acquisition cash flows | 87 | | 142 | | 229 | | | 85 | | 173 | | 258 | |
| Claims and other directly attributable expenses | 5,450 | | 447 | | 5,897 | | | 82,246 | | 1,130 | | 83,376 | |
| Estimates of the present value of future cash outflows | 5,537 | | 589 | | 6,126 | | | 82,331 | | 1,303 | | 83,634 | |
| Estimates of the present value of future cash inflows | (5,708) | | (525) | | (6,233) | | | (84,754) | | (1,244) | | (85,998) | |
| Risk adjustment for non-financial risk | 79 | | 7 | | 86 | | | 630 | | 16 | | 646 | |
| Contractual service margin | 92 | | – | | 92 | | | 1,793 | | – | | 1,793 | |
| Losses recognised on initial recognition | – | | 71 | | 71 | | | – | | 75 | | 75 | |
Note 34: Direct participating contracts
| | | | | | | | |
| 2023 £m | 2022 £m |
| Cash and cash equivalents | 2 | | 2 | |
| Financial assets at fair value through profit or loss | 103,022 | | 92,037 | |
| Other assets | 154 | | 331 | |
| Derivative financial instruments | (1,337) | | (1,022) | |
| Other liabilities | (416) | | (422) | |
| Fair value of underlying items in respect of direct participating contracts | 101,425 | | 90,926 | |
Note 35: Life business contractual service margin run-off
The following table analyses the expected recognition of the contractual service margin (CSM) in profit or loss.
| | | | | | | | | | | | | | | | | | | | | | | | | | |
| At 31 December 2023 | Less than 1
year
£m | 1 to 2
years
£m | 2 to 3
years
£m | 3 to 4
years
£m | 4 to 5
years
£m | 5 to 10
years
£m | Over 10
years
£m | Total
£m |
| Annuities | (106) | | (99) | | (92) | | (87) | | (82) | | (340) | | (708) | | (1,514) | |
| Pensions and investments | (186) | | (176) | | (168) | | (157) | | (133) | | (535) | | (1,088) | | (2,443) | |
| Protection and other | (41) | | (37) | | (33) | | (30) | | (27) | | (104) | | (186) | | (458) | |
| Insurance and participating investment contracts | (333) | | (312) | | (293) | | (274) | | (242) | | (979) | | (1,982) | | (4,415) | |
| Reinsurance contracts held | 20 | | 17 | | 15 | | 14 | | 13 | | 48 | | 94 | | 221 | |
| Total | (313) | | (295) | | (278) | | (260) | | (229) | | (931) | | (1,888) | | (4,194) | |
| | | | | | | | | | | | | | | | | | | | | | | | | | |
| At 31 December 2022 | Less than 1
year
£m | 1 to 2
years
£m | 2 to 3
years
£m | 3 to 4
years
£m | 4 to 5
years
£m | 5 to 10
years
£m | Over 10
years
£m | Total
£m |
| Annuities | (91) | | (85) | | (79) | | (75) | | (71) | | (297) | | (608) | | (1,306) | |
| Pensions and investments | (173) | | (162) | | (153) | | (143) | | (134) | | (564) | | (1,073) | | (2,402) | |
| Protection and other | (41) | | (37) | | (34) | | (32) | | (29) | | (114) | | (215) | | (502) | |
| Insurance and participating investment contracts | (305) | | (284) | | (266) | | (250) | | (234) | | (975) | | (1,896) | | (4,210) | |
| Reinsurance contracts held | 16 | | 15 | | 13 | | 12 | | 12 | | 47 | | 96 | | 211 | |
| Total | (289) | | (269) | | (253) | | (238) | | (222) | | (928) | | (1,800) | | (3,999) | |
| | | | | | | | |
F-93 | Lloyds Banking Group plc Annual Report on Form 20-F 2023 | |
Notes to the consolidated financial statements continued
for the year ended 31 December
Note 36: Life insurance sensitivity analysis
Critical accounting judgements and key sources of estimation uncertainty
| | | | | |
| Key sources of estimation uncertainty: | Future investment returns, mortality rates and expenses, annuitant mortality, future maintenance and investment expenses, widening of credit default spreads and increase in illiquidity premia |
The following table demonstrates the effect of reasonably possible changes in key assumptions on profit before tax and equity disclosed in these financial statements assuming that the other assumptions remain unchanged. In practice this is unlikely to occur, and changes in some assumptions may be correlated. The sensitivities below are on a gross of reinsurance basis, which do not differ materially from the sensitivities net of reinsurance. These amounts include movements in liabilities relating to insurance and participating investment contracts and related assets in order to demonstrate the impacts on shareholder profit and equity. Therefore, these sensitivities have not been applied to the proportion of assets and liabilities where the risks are borne by the policyholder and where assets and liabilities are well matched so as not to have a significant impact on shareholder profit.
| | | | | | | | | | | | | | | | | | | | |
| | 2023 | | 2022 |
| Change in variable | Increase
(reduction)
in profit
before tax
£m | Increase
(reduction)
in equity
£m | | Increase
(reduction)
in profit
before tax
£m | Increase
(reduction)
in equity
£m |
| Key sources of estimation uncertainty | | | | | | |
Annuitant mortality1 | 5% reduction | 70 | | 52 | | | 85 | | 69 | |
| 5% increase | (75) | | (56) | | | (101) | | (82) | |
Future maintenance and investment expenses2 | 10% reduction | 29 | | 21 | | | 28 | | 23 | |
| 10% increase | (29) | | (21) | | | (28) | | (23) | |
Risk free rate, including illiquidity premia3 | 1% reduction | 393 | | 294 | | | 357 | | 289 | |
| 1% increase | (333) | | (250) | | | (317) | | (256) | |
Widening of credit default spreads on corporate bonds4 | 0.25% addition | (316) | | (237) | | | (276) | | (224) | |
| Other accounting estimates | | | | | | |
Non-annuitant mortality and morbidity5 | 5% reduction | 63 | | 47 | | | 54 | | 44 | |
| 5% increase | (63) | | (47) | | | (54) | | (44) | |
Lapse rates6 | 10% reduction | (11) | | (8) | | | (2) | | (2) | |
| 10% increase | 8 | | 6 | | | 1 | | 1 | |
1 This sensitivity shows the impact on the annuity and deferred annuity business of reducing/increasing mortality rates to 95/105 per cent of the expected rate.
2 This sensitivity shows the impact of reducing/increasing maintenance expenses and investment expenses to 90/110 per cent of the expected rate.
3 This sensitivity shows the impact of a 100 basis point increase/decrease in the risk-free rate, including illiquidity premia. This impacts both the related assets and liabilities.
4 This sensitivity shows the impact of a 25 basis point increase in credit default spreads on corporate bonds and the corresponding reduction in market values. Swap curves, the risk-free rate and illiquidity premia are all assumed to be unchanged and therefore this sensitivity impacts the related assets.
5 This sensitivity shows the impact of reducing/increasing mortality and morbidity rates on non-annuity business to 95/105 per cent of the expected rate.
6 This sensitivity shows the impact of reducing/increasing lapse and surrender rates to 90/110 per cent of the expected rate.
Note 37: Other liabilities
| | | | | | | | |
| 2023 £m | 20221 £m |
| Reinsurance contract liabilities | 8 | | 19 | |
| Settlement balances and items in the course of transmission to banks | 1,429 | | 1,497 | |
Third party interests in consolidated funds2 | 10,518 | | 10,413 | |
| | |
| Lease liabilities | 1,632 | | 1,317 | |
| Other creditors and accruals | 5,439 | | 5,518 | |
| Total other liabilities | 19,026 | | 18,764 | |
1 Restated for presentational changes and for the adoption of IFRS 17; see notes 1 and 54.
2 Where a collective investment vehicle is consolidated, the interests of parties other than the Group are reported at fair value in other liabilities.
The maturity analysis of the Group’s lease liabilities on an undiscounted basis is set out in the liquidity risk section of note 52.
Note 38: Provisions
Critical accounting judgements and key sources of estimation uncertainty
| | | | | |
| Critical judgement: | Determining whether a present obligation exists and whether it is more likely than not that an outflow of resources will be required to settle that obligation |
| Key sources of estimation uncertainty: | Populations impacted, response rates and uphold rates |
Determining the amount of the provisions, which represent management’s best estimate of the cost of settling these issues, requires the exercise of significant judgement and estimation. It will often be necessary to form a view on matters which are inherently uncertain, such as the scope of reviews required by regulators, and to estimate the number of future complaints, the extent to which they will be upheld, the average cost of redress and the impact of decisions reached by legal and other review processes that may be relevant to claims received. Consequently the continued appropriateness of the underlying assumptions is reviewed on a regular basis against actual experience and other relevant evidence and adjustments made to the provisions where appropriate.
| | | | | | | | |
F-94 | Lloyds Banking Group plc Annual Report on Form 20-F 2023 | |
Notes to the consolidated financial statements continued
for the year ended 31 December
Note 38: Provisions continued
| | | | | | | | | | | | | | |
Provisions
for financial
commitments
and guarantees
£m | Regulatory
and legal
provisions
£m | Other1 £m | Total
£m |
At 1 January 2023 | 323 | | 803 | | 677 | | 1,803 | |
| Exchange and other adjustments | (1) | | 5 | | 3 | | 7 | |
| Provisions applied | – | | (378) | | (372) | | (750) | |
| Charge for the year | – | | 675 | | 342 | | 1,017 | |
| At 31 December 2023 | 322 | | 1,105 | | 650 | | 2,077 | |
1 Restated for the adoption of IFRS 17; see notes 1 and 54.
Provisions for financial commitments and guarantees
Provisions are recognised for expected credit losses on undrawn loan commitments and financial guarantees.
Regulatory and legal provisions
In the course of its business, the Group is engaged on a regular basis in discussions with UK and overseas regulators and other governmental authorities on a range of matters, including legal and regulatory reviews and, from time to time, enforcement investigations (including in relation to compliance with applicable laws and regulations, such as those relating to prudential regulation, consumer protection, investment advice, business conduct, systems and controls, environmental, competition/anti-trust, tax, anti-bribery, anti-money laundering and sanctions). Any matters discussed or identified during such discussions and inquiries may result in, among other things, further inquiry or investigation, other action being taken by governmental and/or regulatory authorities, increased costs being incurred by the Group, remediation of systems and controls, public or private censure, restriction of the Group’s business activities and/or fines. The Group also receives complaints in connection with its past conduct and claims brought by or on behalf of current and former employees, customers (including their appointed representatives), investors and other third parties and is subject to legal proceedings and other legal actions from time to time. Any events or circumstances disclosed could have a material adverse effect on the Group’s financial position, operations or cash flows. Provisions are held where the Group can reliably estimate a probable outflow of economic resources. The ultimate liability of the Group may be significantly more, or less, than the amount of any provision recognised. If the Group is unable to determine a reliable estimate, a contingent liability is disclosed. The recognition of a provision does not amount to an admission of liability or wrongdoing on the part of the Group. During the year ended 31 December 2023 the Group charged a further £675 million in respect of legal actions and other regulatory matters and the unutilised balance at 31 December 2023 was £1,105 million (31 December 2022: £803 million). The most significant items are outlined below.
Motor commission review
A £450 million provision, all recognised in the fourth quarter, has been established for the potential impact of the recently announced FCA review into historical motor finance commission arrangements and sales.
As disclosed in previous periods, the Group continues to receive a number of court claims and complaints in respect of motor finance commissions and is actively engaging with the FOS in its assessment of these complaints. On 10 January 2024, the FOS issued its Final Decision on a complaint relating to the Group, as well as decisions relating to other industry participants. On 11 January 2024, the FCA announced a section 166 review of historical motor finance commission arrangements and sales and plans to communicate a decision on next steps in the third quarter of 2024 on the basis of the evidence collated in the review. The FCA has indicated that such steps could include establishing an industry-wide consumer redress scheme and/or applying to the Financial Markets Test Case Scheme, to help resolve any contested legal issues of general importance.
Following the FCA Motor Market Review in March 2019, the FCA issued a policy statement in July 2020 prohibiting the use of discretionary commission models from 28 January 2021, which the Group adhered to. The Group continues to believe that its historical practices were compliant with the law and regulations in place at that time.
As noted above, in response to both the FOS decisions and the FCA announcement the Group has recognised a charge of £450 million. This includes estimates for operational and legal costs, including litigation costs, together with estimates for potential awards, based on various scenarios using a range of assumptions, including for example, commission models, commission rates, applicable time periods (between 2007 and 2021), response rates and uphold rates. Costs and awards could arise in the event that the FCA concludes there has been misconduct and customer loss that requires remediation, or from adverse litigation decisions. However, while the FCA review is progressing there is significant uncertainty as to the extent of misconduct and customer loss, if any, the nature and extent of any remediation action, if required, and its timing. The ultimate financial impact could therefore materially differ from the amount provided, both higher or lower. The Group welcomes the FCA intervention through an independent section 166 review.
HBOS Reading – review
The Group continues to apply the recommendations from Sir Ross Cranston’s review, issued in December 2019, including a reassessment of direct and consequential losses by an independent panel (the Foskett Panel), an extension of debt relief and a wider definition of de facto directors. The Foskett Panel’s full scope and methodology was published on 7 July 2020. The Foskett Panel’s stated objective is to consider cases via a non-legalistic and fair process and to make its decisions in a generous, fair and common sense manner, assessing claims against an expanded definition of the fraud and on a lower evidential basis.
In June 2022, the Foskett Panel announced an alternative option, in the form of a fixed sum award which could be accepted as an alternative to participation in the full re-review process, to support earlier resolution of claims for those deemed by the Foskett Panel to be victims of the fraud. Around 90 per cent of the population have now had outcomes via this new process. The provision is unchanged in 2023. Notwithstanding the settled claims and the increase in outcomes which builds confidence in the full estimated cost, uncertainties remain and the final outcome could be different from the current provision once the re-review is concluded by the Foskett Panel. There is no confirmed timeline for the completion of the Foskett Panel re-review process nor the review by Dame Linda Dobbs. The Group is committed to implementing Sir Ross Cranston’s recommendations in full.
| | | | | | | | |
F-95 | Lloyds Banking Group plc Annual Report on Form 20-F 2023 | |
Notes to the consolidated financial statements continued
for the year ended 31 December
Note 38: Provisions continued
Payment protection insurance (PPI)
The Group has incurred costs for PPI over a number of years totalling £21,960 million. The Group continues to challenge PPI litigation cases, with mainly legal fees and operational costs associated with litigation activity recognised within regulatory and legal provisions.
Customer claims in relation to insurance branch business in Germany
The Group continues to receive claims from customers in Germany relating to policies issued by Clerical Medical Investment Group Limited (subsequently renamed Scottish Widows Limited), with smaller numbers of claims received from customers in Austria and Italy. The total provision made to 31 December 2023, was £709 million (31 December 2022: £709 million) with £13 million utilisation of the provision during the year, leaving an unutilised provision at 31 December 2023 of £75 million. The ultimate financial effect, which could be significantly different from the current provision, will be known only once all relevant claims have been resolved.
Other
The Group carries provisions of £137 million (2022: £112 million) in respect of dilapidations, rent reviews and other property-related matters.
Provisions are also made for staff and other costs related to Group restructuring initiatives at the point at which the Group becomes committed to the expenditure; at 31 December 2023 provisions of £245 million (31 December 2022: £112 million) were held.
The Group carries provisions of £46 million (2022: £86 million) for indemnities and other matters relating to legacy business disposals in prior years. Whilst there remains significant uncertainty as to the timing of the utilisation of the provisions, the Group expects the majority of the remaining provisions to have been utilised by 31 December 2026.
Note 39: Subordinated liabilities
The movement in subordinated liabilities during the year was as follows:
| | | | | | | | | | | | | | | | | | | | | | | | | | | | | |
| Preference
shares
£m | | Preferred
securities
£m | | Undated
£m | | Dated
£m | | Total
£m |
| At 1 January 2022 | 488 | | | 1,661 | | | 174 | | | 10,785 | | | 13,108 | |
Issued during the year1: | | | | | | | | | |
7.953% Fixed Rate Reset Dated Subordinated notes 2033 (US$1,000 million) | – | | | – | | | – | | | 838 | | | 838 | |
| – | | | – | | | – | | | 838 | | | 838 | |
Repurchases and redemptions during the year1: | | | | | | | | | |
12% Fixed to Floating Rate Perpetual Tier 1 Capital Securities callable 2024 (US$2,000 million) | – | | | (1,399) | | | – | | | – | | | (1,399) | |
13% Sterling Step-up Perpetual Capital Securities callable 2029 (£700 million) | – | | | (221) | | | – | | | – | | | (221) | |
7.281% Perpetual Regulatory Tier One Securities (Series B) (£150 million) | – | | | (22) | | | – | | | – | | | (22) | |
7.881% Guaranteed Non-voting Non-cumulative Preferred Securities (£245 million) | – | | | (12) | | | – | | | – | | | (12) | |
12% Perpetual Subordinated Bonds (£100 million) | – | | | – | | | (22) | | | – | | | (22) | |
5.75% Undated Subordinated Step-up Notes (£600 million) | – | | | – | | | (4) | | | – | | | (4) | |
7.625% Dated Subordinated Notes 2025 (£750 million) | – | | | – | | | – | | | (502) | | | (502) | |
| – | | | (1,654) | | | (26) | | | (502) | | | (2,182) | |
| Foreign exchange movements | 8 | | | (6) | | | – | | | 699 | | | 701 | |
Other movements (cash and non-cash)2 | (26) | | | (1) | | | 2 | | | (1,710) | | | (1,735) | |
| At 31 December 2022 | 470 | | | – | | | 150 | | | 10,110 | | | 10,730 | |
Issued during the year1: | | | | | | | | | |
6.625% Fixed Rate Reset Dated Subordinated Notes 2033 (£750 million) | – | | | – | | | – | | | 747 | | | 747 | |
5.25% Fixed Rate Reset Dated Subordinated Notes 2033 (S$500 million) | – | | | – | | | – | | | 288 | | | 288 | |
Fixed-to-Floating Rate Dated Subordinated Notes 2033 (A$750 million) | – | | | – | | | – | | | 382 | | | 382 | |
| | | | | | | | | |
| – | | | – | | | – | | | 1,417 | | | 1,417 | |
Repurchases and redemptions during the year1: | | | | | | | | | |
9.625% Subordinated Bonds 2023 (£300 million) | – | | | – | | | – | | | (92) | | | (92) | |
7.07% Subordinated Fixed Rate Notes 2023 (€175 million) | – | | | – | | | – | | | (155) | | | (155) | |
5.5% Dated Subordinated Notes 2023 (£850 million) | – | | | – | | | – | | | (850) | | | (850) | |
Dated Subordinated Fixed Rate Reset Notes 2028 (€750 million) | – | | | – | | | – | | | (643) | | | (643) | |
8.75% Perpetual Subordinated Bonds (£100 million) | – | | | – | | | (5) | | | – | | | (5) | |
7.375% Subordinated Undated Instruments (£150 million) | – | | | – | | | – | | | – | | | – | |
8% Undated Subordinated Step-up Notes 2023 (£200 million) | – | | | – | | | – | | | – | | | – | |
| – | | | – | | | (5) | | | (1,740) | | | (1,745) | |
| Foreign exchange movements | (2) | | | – | | | – | | | (379) | | | (381) | |
Other movements (cash and non-cash)2 | (2) | | | – | | | (1) | | | 235 | | | 232 | |
| At 31 December 2023 | 466 | | | – | | | 144 | | | 9,643 | | | 10,253 | |
1 Issuances in the year generated cash inflows of £1,417 million (2022: £838 million); the repurchases and redemptions resulted in cash outflows of £1,745 million (2022: £2,216 million).
2 Other movements include hedge accounting movements and cash payments in respect of interest on subordinated liabilities in the year amounting to £623 million (2022: £603 million) offset by the interest expense in respect of subordinated liabilities of £712 million (2022: £681 million).
| | | | | | | | |
F-96 | Lloyds Banking Group plc Annual Report on Form 20-F 2023 | |
Notes to the consolidated financial statements continued
for the year ended 31 December
Note 39: Subordinated liabilities continued
Certain of the above securities were issued or redeemed under exchange offers, which did not result in an extinguishment of the original financial liability for accounting purposes.
These securities will, in the event of the winding-up of the issuer, be subordinated to the claims of depositors and all other creditors of the issuer, other than creditors whose claims rank equally with, or are junior to, the claims of the holders of the subordinated liabilities. The subordination of specific subordinated liabilities is determined in respect of the issuer and any guarantors of that liability. The claims of holders of preference shares and preferred securities are generally junior to those of the holders of undated subordinated liabilities, which in turn are junior to the claims of holders of the dated subordinated liabilities. The Group has not had any defaults of principal or interest or other breaches with respect to its subordinated liabilities during 2023 (2022: none).
Preference shares
The Company has in issue various classes of preference shares which are all classified as liabilities under accounting standards.
| | | | | | | | | | | | | | | | | | | | | | | | | | | | | | | | | | | | | | | | | |
| | | | | 2023 | | 2022 | | |
| 2023 Number of shares | 2022 Number of shares | 2021 Number of shares | | £m | | % of
share
capital | | £m | | % of
share
capital | | 2021 £m |
6% Non-cumulative Redeemable Preference shares of GBP0.25 | 400 | 400 | 400 | | – | | | – | | | – | | | – | | | – | |
6.475% Non-cumulative Preference shares of GBP0.25 | 47,273,816 | 47,273,816 | 47,273,816 | | 12 | | | 0.07 | | | 12 | | | 0.07 | | | 12 | |
9.25% Non-cumulative Irredeemable Preference shares of GBP0.25 | 252,510,147 | 252,510,147 | 252,510,147 | | 63 | | | 0.40 | | | 63 | | | 0.37 | | | 63 | |
9.75% Non-cumulative Irredeemable Preference shares of GBP0.25 | 43,630,285 | 43,630,285 | 43,630,285 | | 11 | | | 0.07 | | | 11 | | | 0.06 | | | 11 | |
6.413% Non-cumulative Fixed/Floating Rate Callable Preference shares of USD0.25 | 48,990 | 48,990 | 48,990 | | – | | | – | | | – | | | – | | | – | |
6.657% Non-cumulative Fixed/Floating Rate Callable Preference shares of USD0.25 | 37,627 | 37,627 | 37,627 | | – | | | – | | | – | | | – | | | – | |
Note 40: Share capital
Issued and fully paid ordinary share capital
| | | | | | | | | | | | | | | | | | | | | | | | | | | | | | | | | | | | | | |
| | | | | 2023 | | 2022 | |
Ordinary shares of 10p (formerly 25p) each | 2023 Number of shares | 2022 Number of shares | 2021 Number of shares | | £m | | % of
share
capital | | £m | | % of
share
capital | 2021 £m |
| At 1 January | 67,287,852,204 | 71,022,593,135 | 70,839,206,060 | | 6,729 | | | | | 7,102 | | | | 7,084 | |
| Issued under employee share schemes | 667,636,165 | 793,990,660 | 183,387,075 | | 67 | | | | | 80 | | | | 18 | |
| Share buyback programme (note 43) | (4,386,262,707) | (4,528,731,591) | – | | (438) | | | | | (453) | | | | – | |
| At 31 December | 63,569,225,662 | 67,287,852,204 | 71,022,593,135 | | 6,358 | | | 99.46 | | | 6,729 | | | 99.50 | | 7,102 | |
Ordinary shares
As permitted by the Companies Act 2006, the Company removed references to authorised share capital from its articles of association at the annual general meeting on 5 June 2009. This change took effect from 1 October 2009. There are no restrictions on the transfer of shares in the Company other than as set out in the articles of association and:
•Certain restrictions which may from time to time be imposed by law and regulations (for example, insider trading laws)
•Where directors and certain employees of the Company require the approval of the Company to deal in the Company’s shares
•Pursuant to the rules of some of the Company’s employee share plans where certain restrictions may apply while the shares are subject to the plans
Where, under an employee share plan operated by the Company, participants are the beneficial owners of shares but not the registered owners, the voting rights are normally exercised by the registered owner at the direction of the participant. Outstanding awards and options would normally vest and become exercisable on a change of control, subject to the satisfaction of any performance conditions at that time.
| | | | | | | | |
F-97 | Lloyds Banking Group plc Annual Report on Form 20-F 2023 | |
Notes to the consolidated financial statements continued
for the year ended 31 December
Note 40: Share capital continued
All of the Company’s issued ordinary share capital is listed (i.e. the free float percentage of the ordinary shares is 100 per cent) and none of the shares have any multiple or unequal voting rights; each share carries one vote. In addition, the Company is not aware of any agreements between shareholders that may result in restrictions on the transfer of securities and/or voting rights.
The directors have authority to allot and issue ordinary and preference shares and to make market purchases of ordinary and preference shares as granted at the annual general meeting on 18 May 2023. The authority to issue shares and the authority to make market purchases of shares will expire at the next annual general meeting. Shareholders will be asked, at the annual general meeting, to give similar authorities.
Subject to any rights or restrictions attached to any shares, on a show of hands at a general meeting of the Company every holder of shares present in person or by proxy and entitled to vote has one vote and on a poll every member present and entitled to vote has one vote for every share held. The special rights attached to any class of shares in the Company may, subject to the statutory provisions, be varied or abrogated either with the consent in writing of the holders of three-quarters in nominal value of the issued shares of the class or with the sanction of a special resolution passed at a separate meeting of the holders of the shares of the class (but not otherwise).
The holders of ordinary shares, who held 100 per cent of the total ordinary share capital at 31 December 2023, are entitled to receive the Company’s report and accounts, attend, speak and vote at general meetings and appoint proxies to exercise voting rights. Holders of ordinary shares may also receive a dividend (subject to the provisions of the Company’s articles of association) and on a winding-up may share in the assets of the Company.
Preference shares
The Company has in issue various classes of preference shares which are all classified as liabilities under accounting standards and which are included in note 39.
Note 41: Earnings per share
| | | | | | | | | | | |
| 2023 £m | 2022 £m | 2021 £m |
Profit attributable to ordinary shareholders – basic and diluted1 | 4,933 | | 3,389 | | 5,355 | |
| | | | | | | | | | | |
| 2023 million | 2022 million | 2021 million |
| Weighted average number of ordinary shares in issue – basic | 64,953 | | 68,847 | | 70,937 | |
| Adjustment for share options and awards | 807 | | 835 | | 848 | |
| Weighted average number of ordinary shares in issue – diluted | 65,760 | | 69,682 | | 71,785 | |
| | | | |
Basic earnings per share1 | 7.6p | 4.9p | 7.5p |
Diluted earnings per share1 | 7.5p | 4.9p | 7.5p |
1 Restated for the adoption of IFRS 17; see notes 1 and 54.
Basic earnings per share are calculated by dividing the net profit attributable to equity shareholders by the weighted average number of ordinary shares in issue during the year, which has been calculated after deducting 180 million (2022: 198 million; 2021: 19 million) ordinary shares representing the Group’s holdings of own shares in respect of employee share schemes.
For the calculation of diluted earnings per share the weighted average number of ordinary shares in issue is adjusted to assume conversion of all dilutive potential ordinary shares that arise in respect of share options and awards granted to employees. The number of shares that could have been acquired at the annual average price of the Company’s shares based on the monetary value of the subscription rights attached to outstanding share options and awards is determined. This is deducted from the number of shares issuable under such options and awards to leave a residual bonus amount of shares which are added to the weighted average number of ordinary shares in issue, but no adjustment is made to the profit attributable to equity shareholders.
There were 41 million anti-dilutive share options and awards excluded from the calculation of diluted earnings per share (2022: 63 million; 2021: 143 million).
Note 42: Share premium account
| | | | | | | | | | | |
| 2023 £m | 2022 £m | 2021 £m |
| At 1 January | 18,504 | | 18,479 | | 17,863 | |
| Issued under employee share schemes | 64 | | 25 | | 19 | |
Redemption of preference shares1 | – | | – | | 597 | |
| At 31 December | 18,568 | | 18,504 | | 18,479 | |
1 During the year ended 31 December 2021, the Company redeemed certain tranches of its preference shares, which had been accounted for as subordinated liabilities. On redemption an amount of £17 million was transferred from the distributable merger reserve to the capital redemption reserve and £597 million was transferred from the distributable merger reserve to the share premium account, with these amounts representing the nominal value of the shares redeemed and premium upon original issuance respectively.
| | | | | | | | |
F-98 | Lloyds Banking Group plc Annual Report on Form 20-F 2023 | |
Notes to the consolidated financial statements continued
for the year ended 31 December
Note 43: Other reserves
| | | | | | | | | | | |
| 2023 £m | 20221 £m | 2021 £m |
| Merger reserve | 7,149 | | 7,149 | | 7,149 | |
| Capital redemption reserve | 5,370 | | 4,932 | | 4,479 | |
| Revaluation reserve in respect of debt securities held at fair value through other comprehensive income | (67) | | 50 | | 207 | |
| Revaluation reserve in respect of equity shares held at fair value through other comprehensive income | – | | 57 | | 9 | |
| Cash flow hedging reserve | (3,766) | | (5,476) | | (457) | |
| Foreign currency translation reserve | (178) | | (125) | | (198) | |
| At 31 December | 8,508 | | 6,587 | | 11,189 | |
1 Restated for the adoption of IFRS 17; see notes 1 and 54.
The merger reserve primarily comprises the premium on shares issued in January 2009 as part of the recapitalisation of the Group and the acquisition of HBOS plc.
The capital redemption reserve represents transfers from distributable reserves in accordance with companies’ legislation upon the redemption of ordinary and preference share capital.
The revaluation reserves in respect of debt securities and equity shares held at fair value through other comprehensive income represent the cumulative after-tax unrealised change in the fair value of financial assets so classified since initial recognition; or in the case of financial assets obtained on acquisitions of businesses, since the date of acquisition.
The cash flow hedging reserve represents the cumulative after-tax gains and losses on effective cash flow hedging instruments that will be reclassified to the income statement in the periods in which the hedged item affects profit or loss.
The foreign currency translation reserve represents the cumulative after-tax gains and losses on the translation of foreign operations and exchange differences arising on financial instruments designated as hedges of the Group’s net investment in foreign operations.
Movements in other reserves were as follows:
| | | | | | | | | | | |
| Merger reserve | 2023 £m | 2022 £m | 2021 £m |
| At 1 January | 7,149 | | 7,149 | | 7,763 | |
| Redemption of preference shares (note 42) | – | | – | | (614) | |
| At 31 December | 7,149 | | 7,149 | | 7,149 | |
| | | | | | | | | | | |
| Capital redemption reserve | 2023 £m | 2022 £m | 2021 £m |
| At 1 January | 4,932 | | 4,479 | | 4,462 | |
| Redemption of preference shares (note 42) | – | | – | | 17 | |
| Shares cancelled under share buyback programme (see below) | 438 | | 453 | | – | |
| At 31 December | 5,370 | | 4,932 | | 4,479 | |
In 2023 and 2022 the Group commenced and completed share buyback programmes to repurchase outstanding ordinary shares. In 2023 the Group bought back and cancelled 4,386 million shares under the programme (2022: 4,529 million shares), for a total consideration, including expenses, of £1,993 million (2022: £2,013 million). Upon cancellation, £438 million (2022: £453 million), being the nominal value of the shares repurchased, was transferred to the capital redemption reserve.
| | | | | | | | | | | | | | | | | |
| Revaluation reserve in respect of debt securities held at fair value through other comprehensive income | 2023 £m | | 2022 £m | | 2021 £m |
| At 1 January | 50 | | | 207 | | | 99 | |
| Change in fair value | (40) | | | (133) | | | 133 | |
| Deferred tax | 11 | | | 31 | | | (45) | |
| Current tax | 1 | | | 8 | | | – | |
| (28) | | | (94) | | | 88 | |
| Income statement transfers in respect of disposals (note 11) | (122) | | | (92) | | | 2 | |
| Deferred tax | 35 | | | 23 | | | 20 | |
| (87) | | | (69) | | | 22 | |
| Impairment recognised in the income statement | (2) | | | 6 | | | (2) | |
| At 31 December | (67) | | | 50 | | | 207 | |
| | | | | | | | |
F-99 | Lloyds Banking Group plc Annual Report on Form 20-F 2023 | |
Notes to the consolidated financial statements continued
for the year ended 31 December
Note 43: Other reserves continued
| | | | | | | | | | | | | | | | | |
| Revaluation reserve in respect of equity shares held at fair value through other comprehensive income | 2023 £m | | 2022 £m | | 2021 £m |
| At 1 January | 57 | | | 9 | | | (47) | |
| Change in fair value | (54) | | | 44 | | | 61 | |
| Deferred tax | (3) | | | 3 | | | (4) | |
| (57) | | | 47 | | | 57 | |
| Realised gains and losses transferred to retained profits | – | | | – | | | – | |
| Deferred tax | – | | | 1 | | | (1) | |
| – | | | 1 | | | (1) | |
| At 31 December | – | | | 57 | | | 9 | |
| | | | | | | | | | | | | | | | | |
| Cash flow hedging reserve | 2023 £m | | 2022 £m | | 2021 £m |
| At 1 January | (5,476) | | | (457) | | | 1,629 | |
| Change in fair value of hedging derivatives | 545 | | | (6,990) | | | (2,279) | |
| Deferred tax | (160) | | | 1,940 | | | 646 | |
| 385 | | | (5,050) | | | (1,633) | |
| Net income statement transfers | 1,838 | | | 43 | | | (621) | |
| Deferred tax | (513) | | | (12) | | | 168 | |
| 1,325 | | | 31 | | | (453) | |
| At 31 December | (3,766) | | | (5,476) | | | (457) | |
| | | | | | | | | | | | | | | | | |
| Foreign currency translation reserve | 2023 £m | | 20221 £m | | 2021 £m |
| At 31 December 2021 | | | (198) | | | |
| Adjustment on the adoption of IFRS 17 | | | (12) | | | |
| At 1 January | (125) | | | (210) | | | (159) | |
| Currency translation differences arising in the year | (53) | | | 116 | | | (39) | |
| Income statement transfers | – | | | (31) | | | – | |
| At 31 December | (178) | | | (125) | | | (198) | |
1 Restated for the adoption of IFRS 17; see notes 1 and 54.
Note 44: Retained profits
| | | | | | | | | | | | | | | | | |
| 2023 £m | | 20221 £m | | 2021 £m |
| At 31 December 2021 | | | 10,241 | | | |
| Adjustment on the adoption of IFRS 17 | | | (1,923) | | | |
| At 1 January | 6,550 | | | 8,318 | | | 4,584 | |
| Profit attributable to ordinary shareholders | 4,933 | | | 3,389 | | | 5,355 | |
| Post-retirement defined benefit scheme remeasurements | (1,205) | | | (2,152) | | | 1,062 | |
Gains and losses attributable to own credit risk (net of tax) | (168) | | | 364 | | | (52) | |
| Dividends paid (note 46) | (1,651) | | | (1,475) | | | (877) | |
| Share buyback programme (note 43) | (1,993) | | | (2,013) | | | – | |
| Issue costs of other equity instruments (net of tax) | (6) | | | (5) | | | – | |
| Repurchase and redemption costs of other equity instruments | – | | | (36) | | | – | |
| | | | | |
| Movement in treasury shares | 103 | | | (60) | | | (13) | |
| Value of employee services: | | | | | |
| Share option schemes | 58 | | | 41 | | | 51 | |
| Other employee award schemes | 169 | | | 183 | | | 131 | |
| Change in non-controlling interests | – | | | (3) | | | (1) | |
| Realised gains and losses on equity shares held at fair value through other comprehensive income | – | | | (1) | | | 1 | |
| At 31 December | 6,790 | | | 6,550 | | | 10,241 | |
1 Restated for the adoption of IFRS 17; see notes 1 and 54.
Retained profits are stated after deducting £10 million (2022: £196 million; 2021: £205 million) representing 61 million (2022: 688 million; 2021: 434 million) treasury shares held.
| | | | | | | | |
F-100 | Lloyds Banking Group plc Annual Report on Form 20-F 2023 | |
Notes to the consolidated financial statements continued
for the year ended 31 December
Note 44: Retained profits continued
The payment of dividends by subsidiaries and the ability of members of the Group to lend money to other members of the Group may be subject to regulatory or legal restrictions, the availability of reserves and the financial and operating performance of the entity. A number of Group subsidiaries, principally those with banking and insurance activities, are subject to regulatory capital requirements which require minimum amounts of capital to be maintained relative to their size and risk. The Group actively manages the capital of its subsidiaries, which includes monitoring the regulatory capital ratios for its banking and insurance subsidiaries and, on a consolidated basis, the Ring-Fenced Bank sub-group, against approved risk appetite levels.
Note 45: Other equity instruments
| | | | | | | | | | | | | | | | | |
| 2023 £m | | 2022 £m | | 2021 £m |
| At 1 January | 5,297 | | | 5,906 | | | 5,906 | |
| Issued during the year: | | | | | |
$1,250 million 8% Fixed Rate Reset Additional Tier 1 Perpetual Subordinated Contingent Convertible Securities Callable 2029 | 1,028 | | | – | | | – | |
£750 million 8.5% Fixed Rate Reset Additional Tier 1 Perpetual Subordinated Contingent Convertible Securities Callable 2028 | 750 | | | – | | | – | |
£750 million 8.5% Fixed Rate Reset Additional Tier 1 Perpetual Subordinated Contingent Convertible Securities Callable 2027 | – | | | 750 | | | – | |
| 1,778 | | | 750 | | | – | |
| Repurchases and redemptions during the year: | | | | | |
£1,494 million 7.625% Fixed Rate Reset Additional Tier 1 Perpetual Subordinated Contingent Convertible Securities Callable 2023 | (135) | | | (1,359) | | | – | |
| | | | | |
| (135) | | | (1,359) | | | – | |
| Profit for the year attributable to other equity holders | 527 | | | 438 | | | 429 | |
| Distributions on other equity instruments | (527) | | | (438) | | | (429) | |
| At 31 December | 6,940 | | | 5,297 | | | 5,906 | |
The AT1 securities are Fixed Rate Resetting Perpetual Subordinated Contingent Convertible Securities with no fixed maturity or redemption date. The principal terms of the AT1 securities are described below:
•The securities rank behind the claims against Lloyds Banking Group plc of (a) unsubordinated creditors, (b) claims which are, or are expressed to be, subordinated to the claims of unsubordinated creditors of Lloyds Banking Group plc but not further or otherwise, or (c) whose claims are, or are expressed to be, junior to the claims of other creditors of Lloyds Banking Group, whether subordinated or unsubordinated, other than those whose claims rank, or are expressed to rank, pari passu with, or junior to, the claims of the holders of the AT1 securities in a winding-up occurring prior to a conversion event being triggered
•The securities bear a fixed rate of interest until the first reset date. After the first reset date or any reset date thereafter, in the event that they are not redeemed, the AT1 securities will bear interest at rates fixed periodically in advance for five-year periods based on market rates
•Interest on the securities will be due and payable only at the sole discretion of Lloyds Banking Group plc, and Lloyds Banking Group plc may at any time elect to cancel any interest payment (or any part thereof) which would otherwise be payable on any interest payment date. There are also certain restrictions on the payment of interest as specified in the terms
•The securities are undated and are repayable, at the option of Lloyds Banking Group plc, in whole at the first call date or period, or on any fifth anniversary after the first call date or period. In addition, the AT1 securities are repayable, at the option of Lloyds Banking Group plc, in whole for certain regulatory or tax reasons. Any repayments require the prior consent of the PRA
•The securities convert into ordinary shares of Lloyds Banking Group plc, at a pre-determined price, should the CET1 ratio of the Group fall below 7.0 per cent
Note 46: Dividends on ordinary shares
The directors have recommended a final dividend, which is subject to approval by the shareholders at the annual general meeting on 16 May 2024, of 1.84 pence per ordinary share (2022: 1.60 pence per ordinary share), equivalent to £1,169 million, before the impact of any cancellations of shares under the Company’s buyback programme (2022: £1,059 million, following cancellations of shares under the Company’s 2023 buyback programme up to the record date), which will be paid on 21 May 2024. These financial statements do not reflect the recommended dividend.
Dividends paid during the year were as follows:
| | | | | | | | | | | | | | | | | | | | |
| 2023 pence per share | 2022 pence per share | 2021 pence per share | 2023 £m | 2022 £m | 2021 £m |
| Final dividend recommended by directors at previous year end | 1.60 | | 1.33 | | 0.57 | | 1,059 | | 930 | | 404 | |
| Interim dividend paid in the year | 0.92 | | 0.80 | | 0.67 | | 592 | | 545 | | 473 | |
| 2.52 | | 2.13 | | 1.24 | | 1,651 | | 1,475 | | 877 | |
The trustees of the following holdings of Lloyds Banking Group plc shares in relation to employee share schemes retain the right to receive dividends but have chosen to waive their entitlement to the dividends on those shares as indicated: the Lloyds Banking Group Share Incentive Plan (holding at 31 December 2023: 3,280,207 shares, 31 December 2022: 32,377,089 shares, waived rights to all dividends) and the Lloyds Banking Group Employee Share Ownership Trust (holding at 31 December 2023: 57,736,111 shares, 31 December 2022: 311,540,740 shares, waived rights to all dividends).
| | | | | | | | |
F-101 | Lloyds Banking Group plc Annual Report on Form 20-F 2023 | |
Notes to the consolidated financial statements continued
for the year ended 31 December
Note 47: Related party transactions
Key management personnel
Key management personnel are those persons having authority and responsibility for planning, directing and controlling the activities of an entity; the Group’s key management personnel are the members of the Lloyds Banking Group plc Group Executive Committee together with its non-executive directors.
The table below details, on an aggregated basis, key management personnel compensation:
| | | | | | | | | | | |
| Compensation | 2023 £m | 2022 £m | 2021 £m |
| Salaries and other short-term benefits | 16 | | 12 | | 10 | |
| Post-employment benefits | – | | – | | – | |
| Share-based payments | 22 | | 16 | | 15 | |
| Total compensation | 38 | | 28 | | 25 | |
Aggregate contributions in respect of key management personnel to defined contribution pension schemes were £nil (2022: £nil; 2021: £nil).
| | | | | | | | | | | | | | | | | | | | | | | |
| Share option plans | | Share plans |
| 2023 million | 2022 million | 2021 million | | 2023 million | 2022 million | 2021 million |
| At 1 January | – | | – | | – | | | 72 | | 74 | | 117 | |
| Granted, including certain adjustments (includes entitlements of appointed key management personnel) | – | | – | | – | | | 27 | | 29 | | 19 | |
| Exercised/lapsed (includes entitlements of former key management personnel) | – | | – | | – | | | (44) | | (31) | | (62) | |
| At 31 December | – | | – | | – | | | 55 | | 72 | | 74 | |
The tables below detail, on an aggregated basis, balances outstanding at the year end and related income and expense, together with information relating to other transactions between the Group and its key management personnel:
| | | | | | | | | | | |
| Loans | 2023 £m | 2022 £m | 2021 £m |
| At 1 January | 2 | | 3 | | 2 | |
| Advanced (includes loans to appointed key management personnel) | – | | 1 | | 1 | |
| Repayments (includes loans to former key management personnel) | (1) | | (2) | | – | |
| At 31 December | 1 | | 2 | | 3 | |
The loans are on both a secured and unsecured basis and are expected to be settled in cash. The loans attracted interest rates of between 1.09 per cent and 32.40 per cent in 2023 (2022: 1.01 per cent and 30.15 per cent; 2021: 0.39 per cent and 22.93 per cent).
No provisions have been recognised in respect of loans given to key management personnel (2022 and 2021: £nil).
| | | | | | | | | | | |
| Deposits | 2023 £m | 2022 £m | 2021 £m |
| At 1 January | 10 | | 11 | | 10 | |
| Placed (includes deposits of appointed key management personnel) | 44 | | 37 | | 26 | |
| Withdrawn (includes deposits of former key management personnel) | (40) | | (38) | | (25) | |
| At 31 December | 14 | | 10 | | 11 | |
Deposits placed by key management personnel attracted interest rates of up to 6.25 per cent (2022: 5.0 per cent; 2021: 1.0 per cent).
At 31 December 2023, the Group did not provide any guarantees in respect of key management personnel (2022 and 2021: none).
At 31 December 2023, transactions, arrangements and agreements entered into by the Group’s banking subsidiaries with directors and connected persons included amounts outstanding in respect of loans and credit card transactions of £23.4 thousand with five directors and no connected persons (2022: £2.0 thousand with two directors and no connected persons; 2021: £0.9 million with two directors and one connected person).
| | | | | | | | |
F-102 | Lloyds Banking Group plc Annual Report on Form 20-F 2023 | |
Notes to the consolidated financial statements continued
for the year ended 31 December
Note 47: Related party transactions continued
Subsidiaries
In accordance with IFRS 10 Consolidated Financial Statements, transactions and balances with subsidiaries have been eliminated on consolidation.
Pension funds
The Group provides banking and some investment management services to certain of its pension funds. At 31 December 2023, customer deposits of £133 million (2022: £155 million) related to the Group’s pension funds. As disclosed in note 16, the Group’s main pension funds have entered into a longevity insurance arrangement that was structured as a pass-through involving Scottish Widows.
Collective investment vehicles
The Group manages 129 (2022: 125) collective investment vehicles, such as Open-Ended Investment Companies (OEICs) and of these 68 (2022: 73) are consolidated. The Group invested £55 million (2022: £196 million) and redeemed £210 million (2022: £486 million) in the unconsolidated collective investment vehicles during the year and had investments, at fair value, of £1,448 million (2022: £1,491 million) at 31 December. The Group earned fees of £72 million from the unconsolidated collective investment vehicles during 2023 (2022: £80 million).
Joint ventures and associates
At 31 December 2023 there were loans and advances to customers of £47 million (2022: £21 million) outstanding and balances within customer deposits of £6 million (2022: £58 million) relating to joint ventures and associates.
During the year the Group paid fees of £4 million (2022: £5 million) to its Schroders Personal Wealth joint venture and no payment was made (2022: £18 million) under the terms of agreements put in place on the establishment of the joint venture.
In addition to the above balances, the Group has a number of other associates held by its venture capital business that it accounts for at fair value through profit or loss. At 31 December 2023, these companies had total assets of £7,519 million (2022: £4,709 million), total liabilities of £5,927 million (2022: £5,557 million) and for the year ended 31 December 2023 had turnover of £3,381 million (2022: £4,196 million) and made a net loss of £293 million (2022: net loss of £228 million). In addition, the Group has provided £1,574 million (2022: £1,466 million) of financing to these companies on which it received £120 million (2022: £98 million) of interest income in the year.
Note 48: Contingent liabilities, commitments and guarantees
Contingent liabilities, commitments and guarantees arising from the banking business
At 31 December 2023 contingent liabilities, such as performance bonds and letters of credit, arising from the banking business were £2,849 million (2022: £2,986 million).
The contingent liabilities of the Group arise in the normal course of its banking business and it is not practicable to quantify their future financial effect. Total commitments and guarantees were £143,319 million (2022: £143,795 million), of which in respect of undrawn formal standby facilities, credit lines and other commitments to lend, £75,080 million (2022: £74,692 million) was irrevocable.
Capital commitments
Excluding commitments in respect of investment property (note 27), capital expenditure contracted but not provided for at 31 December 2023 amounted to £1,240 million (2022: £1,663 million) and related to assets to be leased to customers under operating leases. The Group’s management is confident that future net revenues and funding will be sufficient to cover these commitments.
Interchange fees
With respect to multi-lateral interchange fees (MIFs), the Group is not a party in the ongoing or threatened litigation which involves the card schemes Visa and Mastercard (as described below). However, the Group is a member/licensee of Visa and Mastercard and other card schemes. The litigation in question is as follows:
•Litigation brought by or on behalf of retailers against both Visa and Mastercard in the English Courts, in which retailers are seeking damages on grounds that Visa and Mastercard’s MIFs breached competition law (this includes a judgment of the Supreme Court in June 2020 upholding the Court of Appeal’s finding in 2018 that certain historic interchange arrangements of Mastercard and Visa infringed competition law)
•Litigation brought on behalf of UK consumers in the English Courts against Mastercard
Any impact on the Group of the litigation against Visa and Mastercard remains uncertain at this time, such that it is not practicable for the Group to provide an estimate of any potential financial effect. Insofar as Visa is required to pay damages to retailers for interchange fees set prior to June 2016, contractual arrangements to allocate liability have been agreed between various UK banks (including the Group) and Visa Inc, as part of Visa Inc’s acquisition of Visa Europe in 2016. These arrangements cap the maximum amount of liability to which the Group may be subject and this cap is set at the cash consideration received by the Group for the sale of its stake in Visa Europe to Visa Inc in 2016. In 2016, the Group received Visa preference shares as part of the consideration for the sale of its shares in Visa Europe. A release assessment is carried out by Visa on certain anniversaries of the sale (in line with the Visa Europe sale documentation) and as a result, some Visa preference shares may be converted into Visa Inc Class A common stock from time to time. Any such release and any subsequent sale of Visa common stock does not impact the contingent liability.
LIBOR and other trading rates
Certain Group companies, together with other panel banks, have been named as defendants in ongoing private lawsuits, including purported class action suits, in the US in connection with their roles as panel banks contributing to the setting of US Dollar, Japanese Yen and Sterling London Interbank Offered Rate and the Australian BBSW reference rate.
Certain Group companies are also named as defendants in (i) UK-based claims, and (ii) two Dutch class actions, raising LIBOR manipulation allegations. A number of claims against the Group in the UK relating to the alleged mis-sale of interest rate hedging products also include allegations of LIBOR manipulation.
It is currently not possible to predict the scope and ultimate outcome on the Group of any private lawsuits or ongoing related challenges to the interpretation or validity of any of the Group’s contractual arrangements, including their timing and scale. As such, it is not practicable to provide an estimate of any potential financial effect.
| | | | | | | | |
F-103 | Lloyds Banking Group plc Annual Report on Form 20-F 2023 | |
Notes to the consolidated financial statements continued
for the year ended 31 December
Note 48: Contingent liabilities, commitments and guarantees continued
Tax authorities
The Group has an open matter in relation to a claim for group relief of losses incurred in its former Irish banking subsidiary, which ceased trading on 31 December 2010. In 2013, HMRC informed the Group that its interpretation of the UK rules means that the group relief is not available. In 2020, HMRC concluded its enquiry into the matter and issued a closure notice. The Group’s interpretation of the UK rules has not changed and hence it appealed to the First Tier Tax Tribunal, with a hearing having taken place in May 2023. If the final determination of the matter by the judicial process is that HMRC’s position is correct, management believes that this would result in an increase in current tax liabilities of approximately £920 million (including interest) and a reduction in the Group’s deferred tax asset of approximately £285 million. The Group, following conclusion of the hearing and having taken appropriate advice, does not consider that this is a case where additional tax will ultimately fall due.
There are a number of other open matters on which the Group is in discussions with HMRC (including the tax treatment of certain costs arising from the divestment of TSB Banking Group plc), none of which is expected to have a material impact on the financial position of the Group.
FCA investigation into the Group’s anti-money laundering control framework
The FCA has opened an investigation into the Group’s compliance with domestic UK money laundering regulations and the FCA’s rules and Principles for Businesses, with a focus on aspects of its anti-money laundering control framework. The Group has been fully co-operating with the investigation. It is not currently possible to estimate the potential financial impact, if any, to the Group.
Other legal actions and regulatory matters
In addition, in the course of its business the Group is subject to other complaints and threatened or actual legal proceedings (including class or group action claims) brought by or on behalf of current or former employees, customers (including their appointed representatives), investors or other third parties, as well as legal and regulatory reviews, enquiries and examinations, requests for information, audits, challenges, investigations and enforcement actions, which could relate to a number of issues. This includes matters in relation to compliance with applicable laws and regulations, such as those relating to prudential regulation, consumer protection, investment advice, business conduct, systems and controls, environmental, competition/anti-trust, tax, anti-bribery, anti-money laundering and sanctions, some of which may be beyond the Group’s control, both in the UK and overseas. Where material, such matters are periodically reassessed, with the assistance of external professional advisers where appropriate, to determine the likelihood of the Group incurring a liability. The Group does not currently expect the final outcome of any such case to have a material adverse effect on its financial position, operations or cash flows. Where there is a contingent liability related to an existing provision the relevant disclosures are included within note 38.
Note 49: Structured entities
The Group’s interests in structured entities are both consolidated and unconsolidated. Details of the Group’s interests in consolidated structured entities are set out in note 29 for securitisations and covered bond vehicles, note 16 for structured entities associated with the Group’s pension schemes, and below in part (A) and (B). Details of the Group’s interests in unconsolidated structured entities are included below in part (C).
(A) Asset-backed conduits
In addition to the structured entities discussed in note 29, which are used for securitisation and covered bond programmes, the Group sponsors an active asset-backed conduit, Cancara, which invests in client receivables and debt securities. The total consolidated exposure of Cancara at 31 December 2023 was £2,808 million (2022: £2,357 million), comprising £1,521 million of loans and advances (2022: £1,464 million), £698 million of debt securities (2022: £850 million) and £589 million of financial assets at fair value through profit or loss (2022: £43 million).
All lending assets and debt securities held by the Group in Cancara are restricted in use, as they are held by the collateral agent for the benefit of the commercial paper investors and the liquidity providers only. The Group provides liquidity facilities to Cancara under terms that are usual and customary for standard lending activities in the normal course of the Group’s banking activities. During 2023 there have continued to be planned drawdowns on certain liquidity facilities for balance sheet management purposes, supporting the programme to provide funding alongside the proceeds of the asset-backed commercial paper issuance. The Group could be asked to provide support under the contractual terms of these arrangements including, for example, if Cancara experienced a shortfall in external funding, which may occur in the event of market disruption.
The external assets in Cancara are consolidated in the Group’s financial statements.
(B) Consolidated collective investment vehicles and limited partnerships
The assets of the Insurance business held in consolidated collective investment vehicles, such as Open-Ended Investment Companies and limited partnerships, are not directly available for use by the Group. However, the Group’s investment in the majority of these collective investment vehicles is readily realisable. As at 31 December 2023, the total carrying value of these consolidated collective investment vehicle assets and liabilities held by the Group was £58,351 million (2022: £54,749 million).
The Group has no contractual arrangements (such as liquidity facilities) that would require it to provide financial or other support to the consolidated collective investment vehicles; the Group has not previously provided such support and has no current intentions to provide such support.
(C) Unconsolidated structured entities
The Group considers itself the sponsor of a structured entity where it is primarily involved in the design and establishment of the structured entity and further where the Group transfers assets to the structured entity, markets products associated with the structured entity in its own name and/or provides guarantees regarding the structured entity’s performance.
The Group sponsors a range of diverse investment funds and limited partnerships where it acts as the fund manager or equivalent decision-maker and markets the funds under one of the Group’s brands.
| | | | | | | | |
F-104 | Lloyds Banking Group plc Annual Report on Form 20-F 2023 | |
Notes to the consolidated financial statements continued
for the year ended 31 December
Note 49: Structured entities continued
The following table describes the types of structured entities that the Group does not consolidate but in which it holds an interest.
| | | | | | | | | | | | | | |
| | | Total assets of
structured entities |
| Type of entity | Nature and purpose of structured entities | Interest held by the Group | 2023 £bn | 2022 £bn |
| Collective investment vehicles and limited partnerships | These vehicles are primarily financed by investments from investors in the vehicles and are matched by policyholder liabilities in the Insurance division. | •Interests in units issued by the vehicles •Fees from management of vehicles | 2,184 | | 2,176 | |
| Securitisation vehicles | These vehicles issue asset-backed notes to investors and facilitate the management of the Group’s balance sheet. | •Interest in notes issued by the vehicles •Fees for loan servicing | 5 | | – | |
The following table sets out an analysis of the carrying amount of interest held by the Group in the unconsolidated structured entities. The maximum exposure to loss is the carrying amounts of the assets held.
| | | | | | | | |
| Carrying amount | 2023 £m | 2022 £m |
Collective investment vehicles and limited partnerships1 | 76,426 | | 68,913 | |
| Notes held in securitisation vehicles | 4,127 | | – | |
| Interest rate derivatives provided to securitisation vehicles | (17) | | – | |
1 Recognised within financial assets at fair value through profit or loss.
During the year the Group has not provided any non-contractual financial or other support to these entities and has no current intention of providing any non-contractual financial or other support in the future.
The fee income earned from unconsolidated structured entities that the Group sponsors but does not have an interest in was £72 million (2022: £80 million) for collective investment vehicles and £nil (2022: £nil) for securitisation vehicles. The carrying amount of assets transferred to securitisation vehicles at the time of transfer was £5,625 million and the Group recognised a gain of £31 million on transfer.
Continuing involvement in financial assets that have been derecognised
The Group has derecognised financial assets in their entirety following transactions with securitisation vehicles, as noted above. The continuing involvement largely arises from funding provided to the vehicles through the purchase of issued notes. The majority of these notes are recognised as debt securities held at amortised cost. The remaining notes held by the Group, together with interest rate derivatives transacted with the vehicles, are recognised at fair value through profit or loss. The carrying amount of these interests and the maximum exposure to loss is included in the table above. At 31 December 2023 the fair value of the retained notes was £4,142 million. The income from the Group’s interest in these structures for the year ended 31 December 2023 and cumulatively for the lifetime was £133 million.
Note 50: Transfers of financial assets
Transferred financial assets derecognised in their entirety with ongoing exposure
Through asset securitisations, the Group has transferred financial assets which were derecognised in their entirety, with some continuing involvement. Further details are available in note 49.
Transferred financial assets that continue to be recognised
Details of transferred financial assets that continue to be recognised in full are as follows.
The Group enters into repurchase and securities lending transactions in the normal course of business that do not result in derecognition of the financial assets as substantially all of the risks and rewards, including credit, interest rate, prepayment and other price risks are retained by the Group. In all cases, the transferee has the right to sell or repledge the assets concerned.
As set out in note 29, included within financial assets measured at amortised cost are loans transferred under the Group’s securitisation and covered bond programmes. As the Group retains all or a majority of the risks and rewards associated with these loans, including credit, interest rate, prepayment and liquidity risk, they remain on the Group’s balance sheet. Assets transferred into the Group’s securitisation and covered bond programmes are not available to be used by the Group while the assets are within the programmes. However, the Group retains the right to remove loans from the covered bond programmes where they are in excess of the programme’s requirements. In addition, where the Group has retained some of the notes issued by securitisation and covered bond programmes, the Group has the ability to sell or pledge these retained notes.
| | | | | | | | |
F-105 | Lloyds Banking Group plc Annual Report on Form 20-F 2023 | |
Notes to the consolidated financial statements continued
for the year ended 31 December
Note 50: Transfers of financial assets continued
The table below sets out the carrying values of the transferred assets and the associated liabilities. For repurchase and securities lending transactions, the associated liabilities represent the Group’s obligation to repurchase the transferred assets. For securitisation programmes, the associated liabilities represent the external notes in issue (note 29). The liabilities shown in the table below have recourse to the transferred assets.
| | | | | | | | | | | | | | | | | |
| 2023 | | 2022 |
| Assets
£m | Liabilities
£m | | Assets
£m | Liabilities
£m |
| Repurchase and securities lending transactions | | | | | |
| Financial assets at fair value through profit or loss | 2,716 | | 1,990 | | | 6,370 | | 1,483 | |
| Debt securities held at amortised cost | 1,189 | | – | | | 173 | | – | |
| Financial assets at fair value through other comprehensive income | 10,928 | | 5,526 | | | 8,803 | | 6,990 | |
| Securitisation programmes | | | | | |
| Financial assets at amortised cost: | | | | | |
Loans and advances to customers1 | 30,716 | | 4,234 | | | 29,384 | | 2,806 | |
1 The carrying value of associated liabilities excludes securitisation notes held by the Group of £20,150 million (31 December 2022: £22,343 million).
Note 51: Offsetting of financial assets and liabilities
The following information relates to financial assets and liabilities which have been offset in the balance sheet and those which have not been offset but for which the Group has enforceable master netting agreements or collateral arrangements in place with counterparties.
| | | | | | | | | | | | | | | | | | | | | | | | | | | | | | | | | | | |
| | | | | | | Related amounts where
set off in the balance
sheet not permitted1 | | Potential
net amounts
if offset
of related
amounts
permitted
£m |
| Gross amounts of assets and liabilities2 £m | | Amount offset in the balance sheet3 £m | Net amounts
presented in
the balance
sheet
£m | | Cash
collateral
received/
pledged
£m | | Non-cash
collateral
received/
pledged
£m | |
| At 31 December 2023 | | | | | | | | | | | |
| Financial assets | | | | | | | | | | | |
| Financial assets at fair value through profit or loss: | | | | | | | | | | | |
| Excluding reverse repurchase agreements | 185,905 | | | – | | | 185,905 | | | (946) | | | (2,448) | | | 182,511 | |
| Reverse repurchase agreements | 29,778 | | | (12,365) | | | 17,413 | | | (75) | | | (17,226) | | | 112 | |
| 215,683 | | | (12,365) | | | 203,318 | | | (1,021) | | | (19,674) | | | 182,623 | |
| Derivative financial instruments | 61,820 | | | (39,464) | | | 22,356 | | | (3,361) | | | (12,731) | | | 6,264 | |
| Financial assets at amortised cost: | | | | | | | | | | | |
| Loans and advances to banks | 10,764 | | | – | | | 10,764 | | | (2,730) | | | – | | | 8,034 | |
| Loans and advances to customers | 453,045 | | | (3,300) | | | 449,745 | | | (653) | | | (2,214) | | | 446,878 | |
| Reverse repurchase agreements | 46,157 | | | (7,386) | | | 38,771 | | | 71 | | | (38,581) | | | 261 | |
| | | | | | | | | | | |
| | | | | | | | | | | |
| | | | | | | | | | | |
| Debt securities | 15,355 | | | – | | | 15,355 | | | – | | | – | | | 15,355 | |
| 525,321 | | | (10,686) | | | 514,635 | | | (3,312) | | | (40,795) | | | 470,528 | |
| Financial assets at fair value through other comprehensive income | 27,592 | | | – | | | 27,592 | | | – | | | (4,979) | | | 22,613 | |
| Financial liabilities | | | | | | | | | | | |
| Deposits from banks | 6,153 | | | – | | | 6,153 | | | (2,194) | | | – | | | 3,959 | |
| Customer deposits | 472,036 | | | (640) | | | 471,396 | | | (1,516) | | | (2,214) | | | 467,666 | |
| Repurchase agreements at amortised cost | 45,089 | | | (7,386) | | | 37,703 | | | 60 | | | (37,715) | | | 48 | |
| | | | | | | | | | | |
| | | | | | | | | | | |
| | | | | | | | | | | |
| Financial liabilities at fair value through profit or loss: | | | | | | | | | | | |
| Excluding repurchase agreements | 6,857 | | | – | | | 6,857 | | | – | | | – | | | 6,857 | |
| Repurchase agreements | 30,422 | | | (12,365) | | | 18,057 | | | 102 | | | (18,043) | | | 116 | |
| 37,279 | | | (12,365) | | | 24,914 | | | 102 | | | (18,043) | | | 6,973 | |
| Derivative financial instruments | 62,273 | | | (42,124) | | | 20,149 | | | (4,146) | | | (12,767) | | | 3,236 | |
1 The Group enters into derivatives and repurchase and reverse repurchase agreements with various counterparties which are governed by industry standard master netting agreements. The Group holds and provides cash and securities collateral in respect of derivative transactions covered by these agreements. The right to set off balances under these master netting agreements or to set off cash and securities collateral only arises in the event of non-payment or default and, as a result, these arrangements do not qualify for offsetting under IAS 32.
2 Net of impairment allowances.
3 The amounts offset in the balance sheet as shown above mainly represent derivatives and repurchase agreements with central clearing houses which meet the criteria for offsetting under IAS 32.
The effects of over-collateralisation have not been taken into account in the above table.
| | | | | | | | |
F-106 | Lloyds Banking Group plc Annual Report on Form 20-F 2023 | |
Notes to the consolidated financial statements continued
for the year ended 31 December
Note 51: Offsetting of financial assets and liabilities continued
| | | | | | | | | | | | | | | | | | | | | | | | | | | | | | | | | | | |
| | | | | | | Related amounts where
set off in the balance
sheet not permitted1 | | Potential
net amounts
if offset
of related
amounts
permitted
£m |
| Gross amounts of assets and liabilities2 £m | | Amount offset in the balance sheet3 £m | Net amounts
presented in
the balance
sheet
£m | | Cash
collateral
received/
pledged
£m | | Non-cash
collateral
received/
pledged
£m | |
| At 31 December 2022 | | | | | | | | | | | |
| Financial assets | | | | | | | | | | | |
| Financial assets at fair value through profit or loss: | | | | | | | | | | | |
Excluding reverse repurchase agreements4 | 168,988 | | | – | | | 168,988 | | | – | | | (1,127) | | | 167,861 | |
| Reverse repurchase agreements | 32,064 | | | (20,283) | | | 11,781 | | | (87) | | | (11,694) | | | – | |
| 201,052 | | | (20,283) | | | 180,769 | | | (87) | | | (12,821) | | | 167,861 | |
| Derivative financial instruments | 76,437 | | | (51,684) | | | 24,753 | | | (3,951) | | | (15,839) | | | 4,963 | |
| Financial assets at amortised cost: | | | | | | | | | | | |
| Loans and advances to banks | 10,632 | | | – | | | 10,632 | | | (2,823) | | | – | | | 7,809 | |
| Loans and advances to customers | 458,229 | | | (3,330) | | | 454,899 | | | (907) | | | (2,171) | | | 451,821 | |
| Reverse repurchase agreements | 55,675 | | | (10,810) | | | 44,865 | | | – | | | (44,865) | | | – | |
| | | | | | | | | | | |
| | | | | | | | | | | |
| | | | | | | | | | | |
| Debt securities | 9,926 | | | – | | | 9,926 | | | – | | | – | | | 9,926 | |
| 534,462 | | | (14,140) | | | 520,322 | | | (3,730) | | | (47,036) | | | 469,556 | |
| Financial assets at fair value through other comprehensive income | 23,154 | | | – | | | 23,154 | | | – | | | (6,202) | | | 16,952 | |
| Financial liabilities | | | | | | | | | | | |
| Deposits from banks | 7,266 | | | – | | | 7,266 | | | (2,169) | | | – | | | 5,097 | |
| Customer deposits | 476,255 | | | (924) | | | 475,331 | | | (1,869) | | | (2,171) | | | 471,291 | |
| Repurchase agreements at amortised cost | 59,406 | | | (10,810) | | | 48,596 | | | – | | | (48,596) | | | – | |
| | | | | | | | | | | |
| | | | | | | | | | | |
| | | | | | | | | | | |
| Financial liabilities at fair value through profit or loss: | | | | | | | | | | | |
| Excluding repurchase agreements | 6,718 | | | – | | | 6,718 | | | – | | | – | | | 6,718 | |
| Repurchase agreements | 31,320 | | | (20,283) | | | 11,037 | | | – | | | (11,037) | | | – | |
| 38,038 | | | (20,283) | | | 17,755 | | | – | | | (11,037) | | | 6,718 | |
| Derivative financial instruments | 78,132 | | | (54,090) | | | 24,042 | | | (3,731) | | | (14,490) | | | 5,821 | |
1 The Group enters into derivatives and repurchase and reverse repurchase agreements with various counterparties which are governed by industry standard master netting agreements. The Group holds and provides cash and securities collateral in respect of derivative transactions covered by these agreements. The right to set off balances under these master netting agreements or to set off cash and securities collateral only arises in the event of non-payment or default and, as a result, these arrangements do not qualify for offsetting under IAS 32.
2 Net of impairment allowances.
3 The amounts offset in the balance sheet as shown above mainly represent derivatives and repurchase agreements with central clearing houses which meet the criteria for offsetting under IAS 32.
4 Restated for the adoption of IFRS 17; see notes 1 and 54.
The effects of over-collateralisation have not been taken into account in the above table.
| | | | | | | | |
F-107 | Lloyds Banking Group plc Annual Report on Form 20-F 2023 | |
Notes to the consolidated financial statements continued
for the year ended 31 December
Note 52: Financial risk management
As a bancassurer, financial instruments are fundamental to the Group’s activities and, as a consequence, the risks associated with financial instruments represent a significant component of the risks faced by the Group.
The primary risks affecting the Group through its use of financial instruments are: market risk, which includes interest rate risk and foreign exchange risk; credit risk; liquidity risk; capital risk; and insurance risk. The following disclosures provide quantitative and qualitative information about the Group’s exposure to these risks.
Market risk
(A) Interest rate risk
Interest rate risk arises from the different repricing characteristics of the Group’s assets and liabilities. Liabilities are generally either insensitive to interest rate movements, for example interest free or very low interest customer deposits, or are sensitive to interest rate changes but bear rates which may be varied at the Group’s discretion and that for competitive reasons generally reflect changes in the UK Bank Rate, set by the Bank of England. The rates on the remaining liabilities are contractually fixed for their term to maturity.
Many banking assets are sensitive to interest rate movements; there is a large volume of managed rate assets such as variable rate mortgages which may be considered as a natural offset to the interest rate risk arising from the managed rate liabilities. However, a significant proportion of the Group’s lending assets, for example many personal loans and mortgages, bear interest rates which are contractually fixed. Interest rate sensitivity analysis relating to the Group’s banking activities is set out in the tables marked audited on page 85. The Group’s risk management policy is to optimise reward while managing its market risk exposures within the risk appetite defined by the Board. The largest residual risk exposure arises from balances that are deemed to be insensitive to changes in market rates (including current accounts, a portion of variable rate deposits and investable equity), and is managed through the Group’s structural hedge. The structural hedge consists of longer-term fixed rate assets or interest rate swaps and the amount and duration of the hedging activity is reviewed regularly by the Group Asset and Liability Committee.
The Group establishes hedge accounting relationships for interest rate risk components using cash flow hedges and fair value hedges. The Group is exposed to cash flow interest rate risk on its variable rate loans and deposits together with its floating rate subordinated debt. The derivatives used to manage the structural hedge may be designated into cash flow hedges to manage income statement volatility. The economic items related to the structural hedge, for example current accounts, are not eligible hedged items under IAS 39 for inclusion into accounting hedge relationships. The Group is exposed to fair value interest rate risk on its fixed rate customer loans, its fixed rate customer deposits and the majority of its subordinated debt, and to cash flow interest rate risk on its variable rate loans and deposits together with its floating rate subordinated debt. The Group applies netting between similar risks before applying hedge accounting.
Hedge ineffectiveness arises during the management of interest rate risk due to residual unhedged risk. Sources of ineffectiveness, which the Group may decide to not fully mitigate, can include basis differences, timing differences and notional amount differences. The effectiveness of accounting hedge relationships is assessed between the hedging derivatives and the documented hedged item, which can differ to the underlying economically hedged item.
At 31 December 2023 the aggregate notional principal of interest rate and other swaps (predominantly interest rate) designated as fair value hedges was £153,639 million (2022: £152,662 million) with a net fair value liability of £345 million (2022: liability of £493 million) (note 22). The losses on the hedging instruments were £2,663 million (2022: gains of £1,284 million). The gains on the hedged items attributable to the hedged risk were £2,396 million (2022: losses of £1,325 million). The gains and losses relating to the fair value hedges are recorded in net trading income.
The notional principal of the interest rate swaps designated as cash flow hedges at 31 December 2023 was £463,660 million (2022: £249,703 million) with a net fair value asset of £1 million (2022: liability of £2 million) (note 22). In 2023, ineffectiveness recognised in the income statement that arises from cash flow hedges was a gain of £19 million (2022: loss of £10 million).
Interest rate benchmark reform
Following the completion of industry events, including the two London Clearing House USD derivatives transition events in the second quarter of the year, together with bilateral customer consents, the Group has transitioned materially all of its LIBOR linked products. We continue to work with customers to transition a small number of remaining contracts that were not subject to the above events and either have a future dated transition trigger or have defaulted to the relevant synthetic LIBOR benchmark in the interim. Each remaining contract has a known path to transition which is not expected to have a material impact on the Group’s financial statements.
While the volume of outstanding transactions impacted by IBOR benchmark reforms continues to reduce, the Group does not expect material changes to its risk management approach.
(B) Foreign exchange risk
The corporate and retail businesses incur foreign exchange risk in the course of providing services to their customers. All non-structural foreign exchange exposures in the non-trading book are managed centrally within allocated exposure limits. Trading book exposures in the authorised trading centres are allocated exposure limits. The limits are monitored daily by the local centres and reported to the market and liquidity risk function in London. Associated VaR and the closing, average, maximum and minimum are disclosed in the tables marked audited on page 87. The Group manages foreign currency accounting exposure via cash flow hedge accounting, utilising currency swaps and forward foreign exchange trades.
Risk arises from the Group’s investments in its overseas operations. The Group’s structural foreign currency exposure is represented by the net asset value of the foreign currency equity and subordinated debt investments in its subsidiaries and branches. Gains or losses on structural foreign currency exposures are taken to reserves. The Group’s main overseas operations are in the Americas and Europe.
| | | | | | | | |
F-108 | Lloyds Banking Group plc Annual Report on Form 20-F 2023 | |
Notes to the consolidated financial statements continued
for the year ended 31 December
Note 52: Financial risk management continued
Details of the Group’s structural foreign currency exposures are as follows:
| | | | | | | | | | | | | | | | | | | | | | | |
| 2023 | | 2022 |
| Foreign currency of Group operations | Euro
£m | US Dollar
£m | Other
non-Sterling
£m | | Euro
£m | US Dollar
£m | Other
non-Sterling
£m |
| Exposure | 1,471 | | 204 | | 1 | | | 1,843 | | 209 | | 5 | |
Credit risk
The Group’s credit risk exposure arises in respect of the instruments below and predominantly in the United Kingdom. Credit risk appetite is set at Board level and is described and reported through a suite of metrics devised from a combination of accounting and credit portfolio performance measures, which include the use of various credit risk rating systems as inputs and assess credit risk at a counterparty level using three components: (i) the probability of default by the counterparty on its contractual obligations; (ii) the current exposures to the counterparty and their likely future development, from which the Group derives the exposure at default; and (iii) the likely loss ratio on the defaulted obligations, the loss given default. The Group uses a range of approaches to mitigate credit risk, including internal control policies, obtaining collateral, using master netting agreements and other credit risk transfers, such as asset sales and credit derivatives based transactions.
(A) Maximum credit exposure
The maximum credit risk exposure of the Group in the event of other parties failing to perform their obligations is detailed below. No account is taken of any collateral held and the maximum exposure to loss, which includes amounts held to cover unit-linked and With-Profits Funds liabilities, is considered to be the balance sheet carrying amount or, for non-derivative off-balance sheet transactions and financial guarantees, their contractual nominal amounts.
| | | | | | | | | | | | | | | | | | | | | | | | | | | | | | | | | | | |
| 2023 | | 20221 |
| Maximum
exposure
£m | | Offset2 £m | | Net
exposure
£m | | Maximum
exposure
£m | | Offset2 £m | | Net
exposure
£m |
Financial assets at fair value through profit or loss3,4 | 84,583 | | | – | | | 84,583 | | | 73,887 | | | – | | | 73,887 | |
| Derivative financial instruments | 22,356 | | | (9,862) | | | 12,494 | | | 24,753 | | | (12,330) | | | 12,423 | |
Financial assets at amortised cost, net5: | | | | | | | | | | | |
Loans and advances to banks, net5 | 10,764 | | | – | | | 10,764 | | | 10,632 | | | – | | | 10,632 | |
Loans and advances to customers, net5 | 449,745 | | | (2,214) | | | 447,531 | | | 454,899 | | | (2,171) | | | 452,728 | |
Reverse repurchase agreements, net5 | 38,771 | | | – | | | 38,771 | | | 44,865 | | | – | | | 44,865 | |
Debt securities, net5 | 15,355 | | | – | | | 15,355 | | | 9,926 | | | – | | | 9,926 | |
| 514,635 | | | (2,214) | | | 512,421 | | | 520,322 | | | (2,171) | | | 518,151 | |
Financial assets at fair value through other comprehensive income3 | 27,360 | | | – | | | 27,360 | | | 22,871 | | | – | | | 22,871 | |
| Reinsurance contract assets | 442 | | | – | | | 442 | | | 372 | | | – | | | 372 | |
| Off-balance sheet items: | | | | | | | | | | | |
| Acceptances and endorsements | 191 | | | – | | | 191 | | | 58 | | | – | | | 58 | |
| Other items serving as direct credit substitutes | 286 | | | – | | | 286 | | | 781 | | | – | | | 781 | |
| Performance bonds, including letters of credit, and other transaction-related contingencies | 2,372 | | | – | | | 2,372 | | | 2,147 | | | – | | | 2,147 | |
| Irrevocable commitments and guarantees | 75,080 | | | – | | | 75,080 | | | 74,692 | | | – | | | 74,692 | |
| 77,929 | | | – | | | 77,929 | | | 77,678 | | | – | | | 77,678 | |
| 727,305 | | | (12,076) | | | 715,229 | | | 719,883 | | | (14,501) | | | 705,382 | |
1 Restated for the adoption of IFRS 17; see notes 1 and 54.
2 Offset items comprise deposit amounts available for offset and amounts available for offset under master netting arrangements that do not meet the criteria under IAS 32 to enable loans and advances and derivative assets respectively to be presented net of these balances in the financial statements.
3 Excluding equity shares.
4 Includes assets within the Group’s unit-linked funds for which credit risk is borne by the policyholders and assets within the Group’s With-Profits Funds for which credit risk is largely borne by the policyholders. Consequently, the Group has no significant exposure to credit risk for such assets which back related contract liabilities.
5 Amounts shown net of related impairment allowances.
| | | | | | | | |
F-109 | Lloyds Banking Group plc Annual Report on Form 20-F 2023 | |
Notes to the consolidated financial statements continued
for the year ended 31 December
Note 52: Financial risk management continued
(B) Concentrations of exposure
The Group’s management of concentration risk includes portfolio controls on certain industries, sectors and products to reflect risk appetite as well as individual, customer and bank limit risk tolerances. Credit policies and appetite statements are aligned to the Group’s risk appetite and restrict exposure to higher risk countries and potentially vulnerable sectors and asset classes. Exposures are monitored to prevent both an excessive concentration of risk and single name concentrations. The Group’s largest credit limits are regularly monitored by the Board Risk Committee and reported in accordance with regulatory requirements. As part of its credit risk policy, the Group considers sustainability risk (which incorporates environmental (including climate), social and governance) in the assessment of Commercial Banking facilities.
At 31 December 2023 the most significant concentrations of exposure were in mortgages.
| | | | | | | | |
| 2023 £m | 2022 £m |
| Agriculture, forestry and fishing | 7,038 | | 7,447 | |
| Construction | 3,878 | | 4,066 | |
| Energy and water supply | 3,468 | | 2,552 | |
| Financial, business and other services | 35,112 | | 37,666 | |
| Lease financing | 17,374 | | 16,795 | |
| Manufacturing | 4,021 | | 3,619 | |
| Personal: | | |
Mortgages1 | 323,627 | | 323,923 | |
| Other | 25,342 | | 26,154 | |
| Postal and telecommunications | 2,654 | | 2,526 | |
| Property companies | 20,904 | | 21,499 | |
| Transport, distribution and hotels | 10,044 | | 13,170 | |
| Total loans and advances to customers before allowance for impairment losses | 453,462 | | 459,417 | |
| Allowance for impairment losses (note 24) | (3,717) | | (4,518) | |
| Total loans and advances to customers | 449,745 | | 454,899 | |
1 Includes both UK and overseas mortgage balances.
The Group’s operations are predominantly UK based and as a result an analysis of credit risk exposures by geographical region is not provided.
| | | | | | | | |
F-110 | Lloyds Banking Group plc Annual Report on Form 20-F 2023 | |
Notes to the consolidated financial statements continued
for the year ended 31 December
Note 52: Financial risk management continued
(C) Credit quality of assets
Cash and balances at central banks
Significantly all of the Group’s cash and balances at central banks of £78,110 million (2022: £91,388 million) are due from the Bank of England, the Federal Reserve Bank of New York or the Deutsche Bundesbank.
Debt securities, treasury and other bills, and contracts held with reinsurers at fair value through profit or loss
Substantially all of the loans and advances to customers, loans and advances to banks and reverse repurchase agreements recognised at fair value through profit or loss have an investment grade rating. The credit quality of the Group’s debt securities, treasury and other bills, and contracts held with reinsurers held at fair value through profit or loss is set out below:
| | | | | | | | | | | | | | | | | | | | | | | | | | | | | | | | | | | |
| 2023 | | 2022 |
| Investment grade1 £m | | Other2 £m | | Total
£m | | Investment grade1 £m | | Other2 £m | | Total
£m |
| Trading assets | | | | | | | | | | | |
| Debt securities: | | | | | | | | | | | |
| Government securities | 3,596 | | | – | | | 3,596 | | | 2,185 | | | – | | | 2,185 | |
| Asset-backed securities | 77 | | | – | | | 77 | | | 21 | | | – | | | 21 | |
| Corporate and other debt securities | 471 | | | 58 | | | 529 | | | 216 | | | 12 | | | 228 | |
| Total trading assets (excluding loans and advances to customers and reverse repurchase agreements) | 4,144 | | | 58 | | | 4,202 | | | 2,422 | | | 12 | | | 2,434 | |
| Other financial assets mandatorily at fair value through profit or loss: | | | | | | | | | | | |
| Debt securities: | | | | | | | | | | | |
| Government securities | 8,009 | | | – | | | 8,009 | | | 7,871 | | | 1 | | | 7,872 | |
| Other public sector securities | 2,303 | | | 7 | | | 2,310 | | | 2,510 | | | 6 | | | 2,516 | |
| Bank and building society certificates of deposit | 7,504 | | | – | | | 7,504 | | | 7,129 | | | 4 | | | 7,133 | |
| Asset-backed securities | 506 | | | 7 | | | 513 | | | 399 | | | – | | | 399 | |
| Corporate and other debt securities | 17,076 | | | 3,049 | | | 20,125 | | | 14,932 | | | 2,761 | | | 17,693 | |
| 35,398 | | | 3,063 | | | 38,461 | | | 32,841 | | | 2,772 | | | 35,613 | |
| Treasury and other bills | 51 | | | – | | | 51 | | | 62 | | | – | | | 62 | |
| Contracts held with reinsurers | 11,336 | | | 88 | | | 11,424 | | | 10,822 | | | 84 | | | 10,906 | |
| Total other financial assets mandatorily held at fair value through profit or loss (excluding loans and advances and equity shares) | 46,785 | | | 3,151 | | | 49,936 | | | 43,725 | | | 2,856 | | | 46,581 | |
1 Credit ratings equal to or better than ‘BBB’.
2 Other comprises sub-investment grade (2023: £1,202 million; 2022: £1,256 million) and not rated (2023: £2,007 million; 2022: £1,612 million).
Credit risk in respect of trading and other financial assets at fair value through profit or loss held within the Group’s unit-linked funds is borne by the policyholders and credit risk in respect of With-Profits funds is largely borne by the policyholders. Consequently, the Group has no significant exposure to credit risk for such assets which back those contract liabilities.
Loans and advances banks
Significantly all of the Group’s loans and advances to banks are assessed as Stage 1.
Loans and advances to customers
The analysis of lending has been prepared based on the division in which the asset is held; with the business segment in which the exposure is recorded reflected in the ratings system applied. The internal credit ratings systems used by the Group differ between Retail and Commercial, reflecting the characteristics of these exposures and the way that they are managed internally; these credit ratings are set out below. All probabilities of default (PDs) include forward-looking information and are based on 12-month values, with the exception of credit-impaired.
| | | | | | | | | | | | | | |
| Retail | | | Commercial | |
| Quality classification | IFRS 9 PD range | | Quality classification | IFRS 9 PD range |
| RMS 1–3 | 0.00–0.80% | | CMS 1–5 | 0.000–0.100% |
| RMS 4–6 | 0.81–4.50% | | CMS 6–10 | 0.101–0.500% |
| | | | |
| RMS 7–9 | 4.51–14.00% | | CMS 11–14 | 0.501–3.000% |
| RMS 10 | 14.01–20.00% | | CMS 15–18 | 3.001–20.000% |
| RMS 11–13 | 20.01–99.99% | | CMS 19 | 20.001–99.999% |
| RMS 14 | 100.00% | | CMS 20–23 | 100.000% |
Stage 3 assets include balances of £364 million (2022: £727 million) (with outstanding amounts due of £1,167 million (2022: £1,360 million)) which have been subject to a partial write-off and where the Group continues to enforce recovery action.
Stage 2 and Stage 3 assets with a carrying amount of £180 million (2022: £126 million) were modified during the year. No material gain or loss was recognised by the Group.
As at 31 December 2023 assets that had been previously modified while classified as Stage 2 or Stage 3 and were classified as Stage 1 amounted to £5 million (2022: £5,279 million).
| | | | | | | | |
F-111 | Lloyds Banking Group plc Annual Report on Form 20-F 2023 | |
Notes to the consolidated financial statements continued
for the year ended 31 December
Note 52: Financial risk management continued
| | | | | | | | | | | | | | | | | | | | | | | | | | | | | | | | | | | | | | | | | | | | | | | | | | | | | | | | | | | |
| Drawn exposures | | Allowance for expected credit losses |
| Gross drawn exposures and expected credit loss allowance | Stage 1
£m | | Stage 2
£m | | Stage 3
£m | | POCI
£m | | Total
£m | | Stage 1
£m | | Stage 2
£m | | Stage 3
£m | | POCI
£m | | Total
£m |
| At 31 December 2023 | | | | | | | | | | | | | | | | | | | |
| | | | | | | | | | |
| | | | | | | | | | | | | | | | | | | |
| | | | | | | | | | | | | | | | | | | |
| | | | | | | | | | | | | | | | | | | |
| | | | | | | | | | | | | | | | | | | |
| | | | | | | | | | | | | | | | | | | |
| | | | | | | | | | | | | | | | | | | |
| | | | | | | | | | | | | | | | | | | |
| | | | | | | | | | | | | | | | | | | |
| | | | | | | | | | |
| Retail – UK mortgages | | | | | | | | | | | | | | | | | | | |
| RMS 1–3 | 226,740 | | | 4,137 | | | – | | | – | | | 230,877 | | | 123 | | | 37 | | | – | | | – | | | 160 | |
| RMS 4–6 | 29,637 | | | 27,037 | | | – | | | – | | | 56,674 | | | 38 | | | 151 | | | – | | | – | | | 189 | |
| | | | | | | | | | | | | | | | | | | |
| RMS 7–9 | 219 | | | 2,713 | | | – | | | – | | | 2,932 | | | – | | | 37 | | | – | | | – | | | 37 | |
| RMS 10 | – | | | 590 | | | – | | | – | | | 590 | | | – | | | 13 | | | – | | | – | | | 13 | |
| RMS 11–13 | – | | | 4,056 | | | – | | | – | | | 4,056 | | | – | | | 136 | | | – | | | – | | | 136 | |
| RMS 14 | – | | | – | | | 4,337 | | | 7,854 | | | 12,191 | | | – | | | – | | | 357 | | | 213 | | | 570 | |
| 256,596 | | | 38,533 | | | 4,337 | | | 7,854 | | | 307,320 | | | 161 | | | 374 | | | 357 | | | 213 | | | 1,105 | |
| Retail – credit cards | | | | | | | | | | | | | | | | | | | |
| RMS 1–3 | 3,906 | | | 5 | | | – | | | – | | | 3,911 | | | 9 | | | – | | | – | | | – | | | 9 | |
| RMS 4–6 | 7,159 | | | 1,248 | | | – | | | – | | | 8,407 | | | 91 | | | 65 | | | – | | | – | | | 156 | |
| | | | | | | | | | | | | | | | | | | |
| RMS 7–9 | 1,548 | | | 1,069 | | | – | | | – | | | 2,617 | | | 67 | | | 145 | | | – | | | – | | | 212 | |
| RMS 10 | 12 | | | 220 | | | – | | | – | | | 232 | | | 1 | | | 50 | | | – | | | – | | | 51 | |
| RMS 11–13 | – | | | 366 | | | – | | | – | | | 366 | | | – | | | 141 | | | – | | | – | | | 141 | |
| RMS 14 | – | | | – | | | 284 | | | – | | | 284 | | | – | | | – | | | 130 | | | – | | | 130 | |
| 12,625 | | | 2,908 | | | 284 | | | – | | | 15,817 | | | 168 | | | 401 | | | 130 | | | – | | | 699 | |
| Retail – loans and overdrafts | | | | | | | | | | | | | | | | | | | |
| RMS 1–3 | 638 | | | 1 | | | – | | | – | | | 639 | | | 1 | | | – | | | – | | | – | | | 1 | |
| RMS 4–6 | 5,152 | | | 250 | | | – | | | – | | | 5,402 | | | 83 | | | 18 | | | – | | | – | | | 101 | |
| | | | | | | | | | | | | | | | | | | |
| RMS 7–9 | 1,256 | | | 473 | | | – | | | – | | | 1,729 | | | 44 | | | 50 | | | – | | | – | | | 94 | |
| RMS 10 | 43 | | | 135 | | | – | | | – | | | 178 | | | 4 | | | 27 | | | – | | | – | | | 31 | |
| RMS 11–13 | 14 | | | 328 | | | – | | | – | | | 342 | | | 2 | | | 113 | | | – | | | – | | | 115 | |
| RMS 14 | – | | | – | | | 196 | | | – | | | 196 | | | – | | | – | | | 118 | | | – | | | 118 | |
| 7,103 | | | 1,187 | | | 196 | | | – | | | 8,486 | | | 134 | | | 208 | | | 118 | | | – | | | 460 | |
| Retail – UK Motor Finance | | | | | | | | | | | | | | | | | | | |
| RMS 1–3 | 9,979 | | | 569 | | | – | | | – | | | 10,548 | | | 142 | | | 12 | | | – | | | – | | | 154 | |
| RMS 4–6 | 2,791 | | | 998 | | | – | | | – | | | 3,789 | | | 41 | | | 29 | | | – | | | – | | | 70 | |
| | | | | | | | | | | | | | | | | | | |
| RMS 7–9 | 769 | | | 228 | | | – | | | – | | | 997 | | | 3 | | | 13 | | | – | | | – | | | 16 | |
| RMS 10 | – | | | 63 | | | – | | | – | | | 63 | | | – | | | 7 | | | – | | | – | | | 7 | |
| RMS 11–13 | 2 | | | 169 | | | – | | | – | | | 171 | | | – | | | 30 | | | – | | | – | | | 30 | |
| RMS 14 | – | | | – | | | 112 | | | – | | | 112 | | | – | | | – | | | 63 | | | – | | | 63 | |
| 13,541 | | | 2,027 | | | 112 | | | – | | | 15,680 | | | 186 | | | 91 | | | 63 | | | – | | | 340 | |
| Retail – other | | | | | | | | | | | | | | | | | | | |
| RMS 1–3 | 13,613 | | | 240 | | | – | | | – | | | 13,853 | | | 3 | | | 4 | | | – | | | – | | | 7 | |
| RMS 4–6 | 2,197 | | | 186 | | | – | | | – | | | 2,383 | | | 16 | | | 13 | | | – | | | – | | | 29 | |
| | | | | | | | | | | | | | | | | | | |
| RMS 7–9 | – | | | 86 | | | – | | | – | | | 86 | | | – | | | 4 | | | – | | | – | | | 4 | |
| RMS 10 | – | | | 6 | | | – | | | – | | | 6 | | | – | | | – | | | – | | | – | | | – | |
| RMS 11–13 | 88 | | | 7 | | | – | | | – | | | 95 | | | – | | | – | | | – | | | – | | | – | |
| RMS 14 | – | | | – | | | 144 | | | – | | | 144 | | | – | | | – | | | 47 | | | – | | | 47 | |
| 15,898 | | | 525 | | | 144 | | | – | | | 16,567 | | | 19 | | | 21 | | | 47 | | | – | | | 87 | |
| Total Retail | 305,763 | | | 45,180 | | | 5,073 | | | 7,854 | | | 363,870 | | | 668 | | | 1,095 | | | 715 | | | 213 | | | 2,691 | |
| Commercial Banking | | | | | | | | | | | | | | | | | | | |
| CMS 1–5 | 14,100 | | | 7 | | | – | | | – | | | 14,107 | | | 2 | | | – | | | – | | | – | | | 2 | |
| CMS 6–10 | 30,534 | | | 124 | | | – | | | – | | | 30,658 | | | 32 | | | – | | | – | | | – | | | 32 | |
| | | | | | | | | | | | | | | | | | | |
| CMS 11–14 | 31,210 | | | 2,927 | | | – | | | – | | | 34,137 | | | 133 | | | 59 | | | – | | | – | | | 192 | |
| CMS 15–18 | 3,719 | | | 4,115 | | | – | | | – | | | 7,834 | | | 65 | | | 232 | | | – | | | – | | | 297 | |
| CMS 19 | 11 | | | 814 | | | – | | | – | | | 825 | | | – | | | 81 | | | – | | | – | | | 81 | |
| CMS 20–23 | – | | | – | | | 2,068 | | | – | | | 2,068 | | | – | | | – | | | 418 | | | – | | | 418 | |
| 79,574 | | | 7,987 | | | 2,068 | | | – | | | 89,629 | | | 232 | | | 372 | | | 418 | | | – | | | 1,022 | |
| | | | | | | | | | | | | | | | | | | |
| | | | | | | | | | | | | | | | | | | |
| | | | | | | | | | | | | | | | | | | |
| | | | | | | | | | | | | | | | | | | |
| | | | | | | | | | | | | | | | | | | |
| | | | | | | | | | | | | | | | | | | |
| | | | | | | | | | | | | | | | | | | |
| | | | | | | | | | | | | | | | | | | |
| | | | | | | | | | | | | | | | | | | |
Other1 | (43) | | | – | | | 6 | | | – | | | (37) | | | – | | | – | | | 4 | | | – | | | 4 | |
| Total loans and advances to customers | 385,294 | | | 53,167 | | | 7,147 | | | 7,854 | | | 453,462 | | | 900 | | | 1,467 | | | 1,137 | | | 213 | | | 3,717 | |
1 Drawn exposures include centralised fair value hedge accounting adjustments.
| | | | | | | | |
F-112 | Lloyds Banking Group plc Annual Report on Form 20-F 2023 | |
Notes to the consolidated financial statements continued
for the year ended 31 December
Note 52: Financial risk management continued
| | | | | | | | | | | | | | | | | | | | | | | | | | | | | | | | | | | | | | | | | | | | | | | | | | | | | | | | | | | |
| Drawn exposures | | Allowance for expected credit losses |
| Gross drawn exposures and expected credit loss allowance | Stage 1
£m | | Stage 2
£m | | Stage 3
£m | | POCI
£m | | Total
£m | | Stage 1
£m | | Stage 2
£m | | Stage 3
£m | | POCI
£m | | Total
£m |
| At 31 December 2022 | | | | | | | | | | | | | | | | | | | |
| | | | | | | | | | |
| | | | | | | | | | | | | | | | | | | |
| | | | | | | | | | | | | | | | | | | |
| | | | | | | | | | | | | | | | | | | |
| | | | | | | | | | | | | | | | | | | |
| | | | | | | | | | | | | | | | | | | |
| | | | | | | | | | | | | | | | | | | |
| | | | | | | | | | | | | | | | | | | |
| | | | | | | | | | | | | | | | | | | |
| | | | | | | | | | |
| Retail – UK mortgages | | | | | | | | | | | | | | | | | | | |
| RMS 1–3 | 250,937 | | | 24,844 | | | – | | | – | | | 275,781 | | | 81 | | | 180 | | | – | | | – | | | 261 | |
| RMS 4–6 | 6,557 | | | 11,388 | | | – | | | – | | | 17,945 | | | 10 | | | 140 | | | – | | | – | | | 150 | |
| | | | | | | | | | | | | | | | | | | |
| RMS 7–9 | 23 | | | 2,443 | | | – | | | – | | | 2,466 | | | – | | | 72 | | | – | | | – | | | 72 | |
| RMS 10 | – | | | 734 | | | – | | | – | | | 734 | | | – | | | 24 | | | – | | | – | | | 24 | |
| RMS 11–13 | – | | | 2,374 | | | – | | | – | | | 2,374 | | | – | | | 136 | | | – | | | – | | | 136 | |
| RMS 14 | – | | | – | | | 3,416 | | | 9,622 | | | 13,038 | | | – | | | – | | | 311 | | | 253 | | | 564 | |
| 257,517 | | | 41,783 | | | 3,416 | | | 9,622 | | | 312,338 | | | 91 | | | 552 | | | 311 | | | 253 | | | 1,207 | |
| Retail – credit cards | | | | | | | | | | | | | | | | | | | |
| RMS 1–3 | 3,587 | | | 5 | | | – | | | – | | | 3,592 | | | 7 | | | – | | | – | | | – | | | 7 | |
| RMS 4–6 | 6,497 | | | 1,441 | | | – | | | – | | | 7,938 | | | 66 | | | 70 | | | – | | | – | | | 136 | |
| | | | | | | | | | | | | | | | | | | |
| RMS 7–9 | 1,332 | | | 1,246 | | | – | | | – | | | 2,578 | | | 47 | | | 167 | | | – | | | – | | | 214 | |
| RMS 10 | – | | | 227 | | | – | | | – | | | 227 | | | – | | | 52 | | | – | | | – | | | 52 | |
| RMS 11–13 | – | | | 368 | | | – | | | – | | | 368 | | | – | | | 144 | | | – | | | – | | | 144 | |
| RMS 14 | – | | | – | | | 289 | | | – | | | 289 | | | – | | | – | | | 113 | | | – | | | 113 | |
| 11,416 | | | 3,287 | | | 289 | | | – | | | 14,992 | | | 120 | | | 433 | | | 113 | | | – | | | 666 | |
| Retail – loans and overdrafts | | | | | | | | | | | | | | | | | | | |
| RMS 1–3 | 659 | | | 1 | | | – | | | – | | | 660 | | | 2 | | | – | | | – | | | – | | | 2 | |
| RMS 4–6 | 5,902 | | | 451 | | | – | | | – | | | 6,353 | | | 90 | | | 24 | | | – | | | – | | | 114 | |
| | | | | | | | | | | | | | | | | | | |
| RMS 7–9 | 1,724 | | | 657 | | | – | | | – | | | 2,381 | | | 69 | | | 83 | | | – | | | – | | | 152 | |
| RMS 10 | 53 | | | 199 | | | – | | | – | | | 252 | | | 5 | | | 45 | | | – | | | – | | | 50 | |
| RMS 11–13 | 19 | | | 405 | | | – | | | – | | | 424 | | | 3 | | | 163 | | | – | | | – | | | 166 | |
| RMS 14 | – | | | – | | | 247 | | | – | | | 247 | | | – | | | – | | | 126 | | | – | | | 126 | |
| 8,357 | | | 1,713 | | | 247 | | | – | | | 10,317 | | | 169 | | | 315 | | | 126 | | | – | | | 610 | |
| Retail – UK Motor Finance | | | | | | | | | | | | | | | | | | | |
| RMS 1–3 | 8,969 | | | 743 | | | – | | | – | | | 9,712 | | | 66 | | | 9 | | | – | | | – | | | 75 | |
| RMS 4–6 | 2,778 | | | 930 | | | – | | | – | | | 3,708 | | | 25 | | | 20 | | | – | | | – | | | 45 | |
| | | | | | | | | | | | | | | | | | | |
| RMS 7–9 | 425 | | | 325 | | | – | | | – | | | 750 | | | 2 | | | 13 | | | – | | | – | | | 15 | |
| RMS 10 | – | | | 99 | | | – | | | – | | | 99 | | | – | | | 8 | | | – | | | – | | | 8 | |
| RMS 11–13 | 2 | | | 148 | | | – | | | – | | | 150 | | | – | | | 26 | | | – | | | – | | | 26 | |
| RMS 14 | – | | | – | | | 154 | | | – | | | 154 | | | – | | | – | | | 81 | | | – | | | 81 | |
| 12,174 | | | 2,245 | | | 154 | | | – | | | 14,573 | | | 93 | | | 76 | | | 81 | | | – | | | 250 | |
| Retail – other | | | | | | | | | | | | | | | | | | | |
| RMS 1–3 | 12,588 | | | 328 | | | – | | | – | | | 12,916 | | | 9 | | | 4 | | | – | | | – | | | 13 | |
| RMS 4–6 | 1,311 | | | 213 | | | – | | | – | | | 1,524 | | | 4 | | | 11 | | | – | | | – | | | 15 | |
| | | | | | | | | | | | | | | | | | | |
| RMS 7–9 | – | | | 90 | | | – | | | – | | | 90 | | | – | | | 3 | | | – | | | – | | | 3 | |
| RMS 10 | – | | | 5 | | | – | | | – | | | 5 | | | – | | | – | | | – | | | – | | | – | |
| RMS 11–13 | 91 | | | 7 | | | – | | | – | | | 98 | | | – | | | – | | | – | | | – | | | – | |
| RMS 14 | – | | | – | | | 157 | | | – | | | 157 | | | – | | | – | | | 52 | | | – | | | 52 | |
| 13,990 | | | 643 | | | 157 | | | – | | | 14,790 | | | 13 | | | 18 | | | 52 | | | – | | | 83 | |
| Total Retail | 303,454 | | | 49,671 | | | 4,263 | | | 9,622 | | | 367,010 | | | 486 | | | 1,394 | | | 683 | | | 253 | | | 2,816 | |
| Commercial Banking | | | | | | | | | | | | | | | | | | | |
| CMS 1–5 | 13,573 | | | 33 | | | – | | | – | | | 13,606 | | | 2 | | | – | | | – | | | – | | | 2 | |
| CMS 6–10 | 32,070 | | | 512 | | | – | | | – | | | 32,582 | | | 37 | | | 3 | | | – | | | – | | | 40 | |
| | | | | | | | | | | | | | | | | | | |
| CMS 11–14 | 31,591 | | | 5,627 | | | – | | | – | | | 37,218 | | | 128 | | | 93 | | | – | | | – | | | 221 | |
| CMS 15–18 | 3,275 | | | 4,508 | | | – | | | – | | | 7,783 | | | 47 | | | 244 | | | – | | | – | | | 291 | |
| CMS 19 | – | | | 813 | | | – | | | – | | | 813 | | | – | | | 74 | | | – | | | – | | | 74 | |
| CMS 20–23 | – | | | – | | | 3,371 | | | – | | | 3,371 | | | – | | | – | | | 1,070 | | | – | | | 1,070 | |
| 80,509 | | | 11,493 | | | 3,371 | | | – | | | 95,373 | | | 214 | | | 414 | | | 1,070 | | | – | | | 1,698 | |
| | | | | | | | | | | | | | | | | | | |
| | | | | | | | | | | | | | | | | | | |
| | | | | | | | | | | | | | | | | | | |
| | | | | | | | | | | | | | | | | | | |
| | | | | | | | | | | | | | | | | | | |
| | | | | | | | | | | | | | | | | | | |
| | | | | | | | | | | | | | | | | | | |
| | | | | | | | | | | | | | | | | | | |
| | | | | | | | | | | | | | | | | | | |
| | | | | | | | | | | | | | | | | | | |
| | | | | | | | | | | | | | | | | | | |
| | | | | | | | | | | | | | | | | | | |
| | | | | | | | | | | | | | | | | | | |
| | | | | | | | | | | | | | | | | | | |
| | | | | | | | | | | | | | | | | | | |
| | | | | | | | | | | | | | | | | | | |
| | | | | | | | | | | | | | | | | | | |
| | | | | | | | | | | | | | | | | | | |
Other1 | (2,972) | | | – | | | 6 | | | – | | | (2,966) | | | – | | | – | | | 4 | | | – | | | 4 | |
| Total loans and advances to customers | 380,991 | | | 61,164 | | | 7,640 | | | 9,622 | | | 459,417 | | | 700 | | | 1,808 | | | 1,757 | | | 253 | | | 4,518 | |
1 Drawn exposures include centralised fair value hedge accounting adjustments.
| | | | | | | | |
F-113 | Lloyds Banking Group plc Annual Report on Form 20-F 2023 | |
Notes to the consolidated financial statements continued
for the year ended 31 December
Note 52: Financial risk management continued
Average PD grade
The table below shows the average PD for the major portfolios used in the calculation of ECL and therefore Stage 2 average PD reflects the lifetime value. These reflect the forward-looking view under the Group’s base case scenario prior to the application of MES and post-model adjustments which further impact ECL.
| | | | | | | | | | | | | | | | | |
| 2023 | | 2022 |
| Stage 1
average PD
% | Stage 2
average PD
% | | Stage 1
average PD
% | Stage 2
average PD
% |
| Retail | | | | | |
| UK mortgages | 0.57 | | 17.60 | | | 0.26 | | 15.48 | |
| Credit cards | 2.14 | | 23.02 | | | 2.06 | | 20.89 | |
| Loans and overdrafts | 2.75 | | 29.66 | | | 3.36 | | 29.75 | |
| UK Motor Finance | 0.61 | | 10.00 | | | 0.71 | | 11.24 | |
| Commercial Banking | | | | | |
| | | | | |
| Loans and advances to customers | 0.92 | | 22.55 | | | 0.88 | | 18.50 | |
Reverse repurchase agreement held at amortised cost
All of the Group’s reverse repurchase agreements held at amortised cost are assessed as Stage 1.
Debt securities held at amortised cost
At 31 December 2023 £15,240 million of gross debt securities held at amortised cost were investment grade (credit ratings equal to or better than ‘BBB’) (2022: £9,919 million), £20 million were sub-investment grade (2022: £nil) and £106 million not rated (2022: £16 million).
Financial assets at fair value through other comprehensive income (excluding equity shares)
At 31 December 2023 £27,267 million of financial assets at fair value through other comprehensive income (excluding equity shares) were investment grade (credit ratings equal to or better than ‘BBB’) (2022: £22,761 million), £80 million were sub-investment grade (2022: £71 million) and £13 million not rated (2022: £39 million).
Derivative assets
An analysis of derivative assets is given in note 22. The Group reduces exposure to credit risk by using master netting agreements and by obtaining collateral in the form of cash or highly liquid securities.
| | | | | | | | | | | | | | | | | | | | | | | | | | | | | | | | | | | |
| 2023 | | 2022 |
| Investment grade1 £m | | Other2 £m | | Total
£m | | Investment grade1 £m | | Other2 £m | | Total
£m |
| Trading and other | 21,297 | | | 956 | | | 22,253 | | | 23,326 | | | 1,352 | | | 24,678 | |
| Hedging | 99 | | | 4 | | | 103 | | | 53 | | | 22 | | | 75 | |
| Total derivative financial instruments | 21,396 | | | 960 | | | 22,356 | | | 23,379 | | | 1,374 | | | 24,753 | |
1 Credit ratings equal to or better than ‘BBB’.
2 Other comprises sub-investment grade (2023: £855 million; 2022: £1,031 million) and not rated (2023: £105 million; 2022: £343 million).
Financial guarantees and irrevocable loan commitments
Financial guarantees represent undertakings that the Group will meet a customer’s obligation to third parties if the customer fails to do so. Commitments to extend credit represent unused portions of authorisations to extend credit in the form of loans, guarantees or letters of credit. The Group is theoretically exposed to loss in an amount equal to the total guarantees or unused commitments, however, the likely amount of loss is expected to be significantly less. Most commitments to extend credit are contingent upon customers maintaining specific credit standards.
| | | | | | | | |
F-114 | Lloyds Banking Group plc Annual Report on Form 20-F 2023 | |
Notes to the consolidated financial statements continued
for the year ended 31 December
Note 52: Financial risk management continued
| | | | | | | | | | | | | | | | | | | | | | | | | | | | | | | | | | | | | | | | | | | | | | | | | | | | | | | | | | | |
| Undrawn exposures | | Allowance for expected credit losses |
| Gross undrawn exposures and expected credit loss allowance | Stage 1
£m | | Stage 2
£m | | Stage 3
£m | | POCI
£m | | Total
£m | | Stage 1
£m | | Stage 2
£m | | Stage 3
£m | | POCI
£m | | Total
£m |
| At 31 December 2023 | | | | | | | | | | | | | | | | | | | |
| | | | | | | | | | |
| Retail – UK mortgages | | | | | | | | | | | | | | | | | | | |
| RMS 1–3 | 12,207 | | | 36 | | | – | | | – | | | 12,243 | | | 7 | | | – | | | – | | | – | | | 7 | |
| RMS 4–6 | 456 | | | 190 | | | – | | | – | | | 646 | | | 1 | | | 2 | | | – | | | – | | | 3 | |
| | | | | | | | | | | | | | | | | | | |
| RMS 7–9 | 5 | | | 16 | | | – | | | – | | | 21 | | | – | | | – | | | – | | | – | | | – | |
| RMS 10 | – | | | 5 | | | – | | | – | | | 5 | | | – | | | – | | | – | | | – | | | – | |
| RMS 11–13 | – | | | 37 | | | – | | | – | | | 37 | | | – | | | – | | | – | | | – | | | – | |
| RMS 14 | – | | | – | | | 25 | | | 58 | | | 83 | | | – | | | – | | | – | | | – | | | – | |
| 12,668 | | | 284 | | | 25 | | | 58 | | | 13,035 | | | 8 | | | 2 | | | – | | | – | | | 10 | |
| Retail – credit cards | | | | | | | | | | | | | | | | | | | |
| RMS 1–3 | 39,857 | | | 24 | | | – | | | – | | | 39,881 | | | 21 | | | – | | | – | | | – | | | 21 | |
| RMS 4–6 | 14,522 | | | 2,079 | | | – | | | – | | | 16,601 | | | 38 | | | 29 | | | – | | | – | | | 67 | |
| | | | | | | | | | | | | | | | | | | |
| RMS 7–9 | 606 | | | 322 | | | – | | | – | | | 928 | | | 7 | | | 8 | | | – | | | – | | | 15 | |
| RMS 10 | 2 | | | 40 | | | – | | | – | | | 42 | | | – | | | 2 | | | – | | | – | | | 2 | |
| RMS 11–13 | – | | | 69 | | | – | | | – | | | 69 | | | – | | | 6 | | | – | | | – | | | 6 | |
| RMS 14 | – | | | – | | | 40 | | | – | | | 40 | | | – | | | – | | | – | | | – | | | – | |
| 54,987 | | | 2,534 | | | 40 | | | – | | | 57,561 | | | 66 | | | 45 | | | – | | | – | | | 111 | |
| Retail – loans and overdrafts | | | | | | | | | | | | | | | | | | | |
| RMS 1–3 | 4,354 | | | 1 | | | – | | | – | | | 4,355 | | | 4 | | | – | | | – | | | – | | | 4 | |
| RMS 4–6 | 1,638 | | | 239 | | | – | | | – | | | 1,877 | | | 10 | | | 7 | | | – | | | – | | | 17 | |
| | | | | | | | | | | | | | | | | | | |
| RMS 7–9 | 223 | | | 122 | | | – | | | – | | | 345 | | | 5 | | | 13 | | | – | | | – | | | 18 | |
| RMS 10 | 4 | | | 28 | | | – | | | – | | | 32 | | | – | | | 4 | | | – | | | – | | | 4 | |
| RMS 11–13 | – | | | 49 | | | – | | | – | | | 49 | | | – | | | 12 | | | – | | | – | | | 12 | |
| RMS 14 | – | | | – | | | 15 | | | – | | | 15 | | | – | | | – | | | – | | | – | | | – | |
| 6,219 | | | 439 | | | 15 | | | – | | | 6,673 | | | 19 | | | 36 | | | – | | | – | | | 55 | |
| Retail – UK Motor Finance | | | | | | | | | | | | | | | | | | | |
| RMS 1–3 | 274 | | | – | | | – | | | – | | | 274 | | | – | | | – | | | – | | | – | | | – | |
| RMS 4–6 | 959 | | | – | | | – | | | – | | | 959 | | | 2 | | | – | | | – | | | – | | | 2 | |
| | | | | | | | | | | | | | | | | | | |
| RMS 7–9 | 250 | | | – | | | – | | | – | | | 250 | | | | | – | | | – | | | – | | | – | |
| RMS 10 | – | | | – | | | – | | | – | | | – | | | – | | | – | | | – | | | – | | | – | |
| RMS 11–13 | 3 | | | – | | | – | | | – | | | 3 | | | – | | | – | | | – | | | – | | | – | |
| RMS 14 | – | | | – | | | – | | | – | | | – | | | – | | | – | | | – | | | – | | | – | |
| 1,486 | | | – | | | – | | | – | | | 1,486 | | | 2 | | | – | | | – | | | – | | | 2 | |
| Retail – other | | | | | | | | | | | | | | | | | | | |
| RMS 1–3 | 544 | | | – | | | – | | | – | | | 544 | | | – | | | – | | | – | | | – | | | – | |
| RMS 4–6 | 267 | | | – | | | – | | | – | | | 267 | | | 1 | | | – | | | – | | | – | | | 1 | |
| | | | | | | | | | | | | | | | | | | |
| RMS 7–9 | – | | | – | | | – | | | – | | | – | | | – | | | – | | | – | | | – | | | – | |
| RMS 10 | – | | | – | | | – | | | – | | | – | | | – | | | – | | | – | | | – | | | – | |
| RMS 11–13 | – | | | – | | | – | | | – | | | – | | | – | | | – | | | – | | | – | | | – | |
| RMS 14 | – | | | – | | | – | | | – | | | – | | | – | | | – | | | – | | | – | | | – | |
| 811 | | | – | | | – | | | – | | | 811 | | | 1 | | | – | | | – | | | – | | | 1 | |
| Total Retail | 76,171 | | | 3,257 | | | 80 | | | 58 | | | 79,566 | | | 96 | | | 83 | | | – | | | – | | | 179 | |
| Commercial Banking | | | | | | | | | | | | | | | | | | | |
| CMS 1–5 | 19,250 | | | – | | | – | | | – | | | 19,250 | | | 1 | | | – | | | – | | | – | | | 1 | |
| CMS 6–10 | 31,282 | | | 6 | | | – | | | – | | | 31,288 | | | 22 | | | – | | | – | | | – | | | 22 | |
| | | | | | | | | | | | | | | | | | | |
| CMS 11–14 | 9,000 | | | 1,537 | | | – | | | – | | | 10,537 | | | 28 | | | 24 | | | – | | | – | | | 52 | |
| CMS 15–18 | 923 | | | 1,169 | | | – | | | – | | | 2,092 | | | 13 | | | 47 | | | – | | | – | | | 60 | |
| CMS 19 | – | | | 33 | | | – | | | – | | | 33 | | | – | | | 6 | | | – | | | – | | | 6 | |
| CMS 20–23 | – | | | – | | | 64 | | | – | | | 64 | | | – | | | – | | | 2 | | | – | | | 2 | |
| 60,455 | | | 2,745 | | | 64 | | | – | | | 63,264 | | | 64 | | | 77 | | | 2 | | | – | | | 143 | |
| | | | | | | | | | | | | | | | | | | |
| | | | | | | | | | | | | | | | | | | |
| | | | | | | | | | | | | | | | | | | |
| | | | | | | | | | | | | | | | | | | |
| | | | | | | | | | | | | | | | | | | |
| | | | | | | | | | | | | | | | | | | |
| | | | | | | | | | | | | | | | | | | |
| Other | 483 | | | – | | | 6 | | | – | | | 489 | | | – | | | – | | | – | | | – | | | – | |
| Total | 137,109 | | | 6,002 | | | 150 | | | 58 | | | 143,319 | | | 160 | | | 160 | | | 2 | | | – | | | 322 | |
| | | | | | | | |
F-115 | Lloyds Banking Group plc Annual Report on Form 20-F 2023 | |
Notes to the consolidated financial statements continued
for the year ended 31 December
Note 52: Financial risk management continued
| | | | | | | | | | | | | | | | | | | | | | | | | | | | | | | | | | | | | | | | | | | | | | | | | | | | | | | | | | | |
| Undrawn exposures | | Allowance for expected credit losses |
| Gross undrawn exposures and expected credit loss allowance | Stage 1
£m | | Stage 2
£m | | Stage 3
£m | | POCI
£m | | Total
£m | | Stage 1
£m | | Stage 2
£m | | Stage 3
£m | | POCI
£m | | Total
£m |
| At 31 December 2022 | | | | | | | | | | | | | | | | | | | |
| | | | | | | | | | |
| Retail – UK mortgages | | | | | | | | | | | | | | | | | | | |
| RMS 1–3 | 16,003 | | | 159 | | | – | | | – | | | 16,162 | | | – | | | – | | | – | | | – | | | – | |
| RMS 4–6 | 83 | | | 62 | | | – | | | – | | | 145 | | | 1 | | | – | | | – | | | – | | | 1 | |
| | | | | | | | | | | | | | | | | | | |
| RMS 7–9 | – | | | 25 | | | – | | | – | | | 25 | | | – | | | – | | | – | | | – | | | – | |
| RMS 10 | – | | | 7 | | | – | | | – | | | 7 | | | – | | | – | | | – | | | – | | | – | |
| RMS 11–13 | – | | | 21 | | | – | | | – | | | 21 | | | – | | | 1 | | | – | | | – | | | 1 | |
| RMS 14 | – | | | – | | | 17 | | | 67 | | | 84 | | | – | | | – | | | – | | | – | | | – | |
| 16,086 | | | 274 | | | 17 | | | 67 | | | 16,444 | | | 1 | | | 1 | | | – | | | – | | | 2 | |
| Retail – credit cards | | | | | | | | | | | | | | | | | | | |
| RMS 1–3 | 39,384 | | | 30 | | | – | | | – | | | 39,414 | | | 16 | | | – | | | – | | | – | | | 16 | |
| RMS 4–6 | 14,355 | | | 2,975 | | | – | | | – | | | 17,330 | | | 32 | | | 28 | | | – | | | – | | | 60 | |
| | | | | | | | | | | | | | | | | | | |
| RMS 7–9 | 580 | | | 422 | | | – | | | – | | | 1,002 | | | 5 | | | 8 | | | – | | | – | | | 13 | |
| RMS 10 | – | | | 46 | | | – | | | – | | | 46 | | | – | | | 2 | | | – | | | – | | | 2 | |
| RMS 11–13 | – | | | 76 | | | – | | | – | | | 76 | | | – | | | 6 | | | – | | | – | | | 6 | |
| RMS 14 | – | | | – | | | 45 | | | – | | | 45 | | | – | | | – | | | – | | | – | | | – | |
| 54,319 | | | 3,549 | | | 45 | | | – | | | 57,913 | | | 53 | | | 44 | | | – | | | – | | | 97 | |
| Retail – loans and overdrafts | | | | | | | | | | | | | | | | | | | |
| RMS 1–3 | 4,174 | | | 2 | | | – | | | – | | | 4,176 | | | 4 | | | – | | | – | | | – | | | 4 | |
| RMS 4–6 | 1,618 | | | 386 | | | – | | | – | | | 2,004 | | | 6 | | | 12 | | | – | | | – | | | 18 | |
| | | | | | | | | | | | | | | | | | | |
| RMS 7–9 | 253 | | | 159 | | | – | | | – | | | 412 | | | 6 | | | 18 | | | – | | | – | | | 24 | |
| RMS 10 | 6 | | | 36 | | | – | | | – | | | 42 | | | – | | | 7 | | | – | | | – | | | 7 | |
| RMS 11–13 | – | | | 61 | | | – | | | – | | | 61 | | | – | | | 15 | | | – | | | – | | | 15 | |
| RMS 14 | – | | | – | | | 17 | | | – | | | 17 | | | – | | | – | | | – | | | – | | | – | |
| 6,051 | | | 644 | | | 17 | | | – | | | 6,712 | | | 16 | | | 52 | | | – | | | – | | | 68 | |
| Retail – UK Motor Finance | | | | | | | | | | | | | | | | | | | |
| RMS 1–3 | 318 | | | – | | | – | | | – | | | 318 | | | – | | | – | | | – | | | – | | | – | |
| RMS 4–6 | 1,259 | | | – | | | – | | | – | | | 1,259 | | | 2 | | | – | | | – | | | – | | | 2 | |
| | | | | | | | | | | | | | | | | | | |
| RMS 7–9 | 347 | | | 1 | | | – | | | – | | | 348 | | | – | | | – | | | – | | | – | | | – | |
| RMS 10 | – | | | – | | | – | | | – | | | – | | | – | | | – | | | – | | | – | | | – | |
| RMS 11–13 | – | | | – | | | – | | | – | | | – | | | – | | | – | | | – | | | – | | | – | |
| RMS 14 | – | | | – | | | – | | | – | | | – | | | – | | | – | | | – | | | – | | | – | |
| 1,924 | | | 1 | | | – | | | – | | | 1,925 | | | 2 | | | – | | | – | | | – | | | 2 | |
| Retail – other | | | | | | | | | | | | | | | | | | | |
| RMS 1–3 | 702 | | | – | | | – | | | – | | | 702 | | | – | | | – | | | – | | | – | | | – | |
| RMS 4–6 | 198 | | | – | | | – | | | – | | | 198 | | | 3 | | | – | | | – | | | – | | | 3 | |
| | | | | | | | | | | | | | | | | | | |
| RMS 7–9 | – | | | – | | | – | | | – | | | – | | | – | | | – | | | – | | | – | | | – | |
| RMS 10 | – | | | – | | | – | | | – | | | – | | | – | | | – | | | – | | | – | | | – | |
| RMS 11–13 | – | | | – | | | – | | | – | | | – | | | – | | | – | | | – | | | – | | | – | |
| RMS 14 | – | | | – | | | – | | | – | | | – | | | – | | | – | | | – | | | – | | | – | |
| 900 | | | – | | | – | | | – | | | 900 | | | 3 | | | – | | | – | | | – | | | 3 | |
| Total Retail | 79,280 | | | 4,468 | | | 79 | | | 67 | | | 83,894 | | | 75 | | | 97 | | | – | | | – | | | 172 | |
| Commercial Banking | | | | | | | | | | | | | | | | | | | |
| CMS 1–5 | 17,047 | | | – | | | – | | | – | | | 17,047 | | | 2 | | | – | | | – | | | – | | | 2 | |
| CMS 6–10 | 29,141 | | | 135 | | | – | | | – | | | 29,276 | | | 21 | | | 2 | | | – | | | – | | | 23 | |
| | | | | | | | | | | | | | | | | | | |
| CMS 11–14 | 9,808 | | | 1,647 | | | – | | | – | | | 11,455 | | | 28 | | | 33 | | | – | | | – | | | 61 | |
| CMS 15–18 | 779 | | | 800 | | | – | | | – | | | 1,579 | | | 8 | | | 43 | | | – | | | – | | | 51 | |
| CMS 19 | – | | | 85 | | | – | | | – | | | 85 | | | – | | | 10 | | | – | | | – | | | 10 | |
| CMS 20–23 | – | | | – | | | 48 | | | – | | | 48 | | | – | | | – | | | 4 | | | – | | | 4 | |
| 56,775 | | | 2,667 | | | 48 | | | – | | | 59,490 | | | 59 | | | 88 | | | 4 | | | – | | | 151 | |
| | | | | | | | | | | | | | | | | | | |
| | | | | | | | | | | | | | | | | | | |
| | | | | | | | | | | | | | | | | | | |
| | | | | | | | | | | | | | | | | | | |
| | | | | | | | | | | | | | | | | | | |
| | | | | | | | | | | | | | | | | | | |
| | | | | | | | | | | | | | | | | | | |
| | | | | | | | | | | | | | | | | | | |
| | | | | | | | | | | | | | | | | | | |
| | | | | | | | | | | | | | | | | | | |
| | | | | | | | | | | | | | | | | | | |
| | | | | | | | | | | | | | | | | | | |
| | | | | | | | | | | | | | | | | | | |
| | | | | | | | | | | | | | | | | | | |
| | | | | | | | | | | | | | | | | | | |
| | | | | | | | | | | | | | | | | | | |
| Other | 400 | | | – | | | 11 | | | – | | | 411 | | | – | | | – | | | – | | | – | | | – | |
| Total | 136,455 | | | 7,135 | | | 138 | | | 67 | | | 143,795 | | | 134 | | | 185 | | | 4 | | | – | | | 323 | |
| | | | | | | | |
F-116 | Lloyds Banking Group plc Annual Report on Form 20-F 2023 | |
Notes to the consolidated financial statements continued
for the year ended 31 December
Note 52: Financial risk management continued
(D) Collateral held as security for financial assets
The principal types of collateral accepted by the Group include: residential and commercial properties; charges over business assets such as premises, inventory and accounts receivable; financial instruments; cash; and guarantees from third parties. The terms and conditions associated with the use of the collateral are varied and are dependent on both the type of agreement and the counterparty. The Group holds collateral against loans and advances and irrevocable loan commitments; qualitative and, where appropriate, quantitative information is provided in respect of this collateral below. Collateral held as security for financial assets at fair value through profit or loss and for derivative assets is also shown below.
The Group holds collateral in respect of loans and advances to customers and reverse repurchase agreements as set out below. The Group does not hold collateral against debt securities which are classified as financial assets held at amortised cost.
Loans and advances to customers
Retail lending
UK mortgages
An analysis by loan-to-value ratio of the Group’s UK residential mortgage lending is provided below. The value of collateral used in determining the loan-to-value ratios has been estimated based upon the last actual valuation, adjusted to take into account subsequent movements in house prices. The market takes into account many factors, including environmental considerations such as flood risk and energy efficient additions, in arriving at the value of a home.
In some circumstances, where the discounted value of the estimated net proceeds from the liquidation of collateral (i.e. net of costs, expected haircuts and anticipated changes in the value of the collateral to the point of sale) is greater than the estimated exposure at default, no credit losses are expected and no ECL allowance is recognised.
| | | | | | | | | | | | | | | | | | | | | | | | | | | | | | | | | | | |
| Gross drawn exposures | | Allowance for expected credit losses |
| Stage 1
£m | Stage 2
£m | Stage 3
£m | POCI
£m | Total
£m | | Stage 1
£m | Stage 2
£m | Stage 3
£m | POCI
£m | Total
£m |
| At 31 December 2023 | | | | | | | | | | | |
Less than 70 per cent | 193,235 | | 28,754 | | 3,882 | | 7,168 | | 233,039 | | | 57 | | 208 | | 226 | | 118 | | 609 | |
70 per cent to 80 per cent | 36,413 | | 4,506 | | 290 | | 333 | | 41,542 | | | 37 | | 75 | | 61 | | 26 | | 199 | |
80 per cent to 90 per cent | 20,949 | | 2,821 | | 87 | | 142 | | 23,999 | | | 48 | | 53 | | 27 | | 20 | | 148 | |
90 per cent to 100 per cent | 5,981 | | 2,389 | | 30 | | 91 | | 8,491 | | | 19 | | 31 | | 12 | | 14 | | 76 | |
Greater than 100 per cent | 18 | | 63 | | 48 | | 120 | | 249 | | | – | | 7 | | 31 | | 35 | | 73 | |
| Total | 256,596 | | 38,533 | | 4,337 | | 7,854 | | 307,320 | | | 161 | | 374 | | 357 | | 213 | | 1,105 | |
| At 31 December 2022 | | | | | | | | | | | |
Less than 70 per cent | 210,457 | | 33,205 | | 3,161 | | 8,845 | | 255,668 | | | 51 | | 330 | | 210 | | 117 | | 708 | |
70 per cent to 80 per cent | 31,788 | | 5,264 | | 170 | | 359 | | 37,581 | | | 25 | | 124 | | 55 | | 42 | | 246 | |
80 per cent to 90 per cent | 11,942 | | 2,604 | | 48 | | 149 | | 14,743 | | | 12 | | 59 | | 20 | | 19 | | 110 | |
90 per cent to 100 per cent | 3,319 | | 606 | | 13 | | 113 | | 4,051 | | | 3 | | 18 | | 7 | | 18 | | 46 | |
Greater than 100 per cent | 11 | | 104 | | 24 | | 156 | | 295 | | | – | | 21 | | 19 | | 57 | | 97 | |
| Total | 257,517 | | 41,783 | | 3,416 | | 9,622 | | 312,338 | | | 91 | | 552 | | 311 | | 253 | | 1,207 | |
The energy performance certificate (EPC) profile of the security associated with the Group’s UK mortgage portfolio is shown below:
| | | | | | | | | | | | | | | | | | | | | | | | | | | | | |
| EPC profile | A
£m | B
£m | C
£m | D
£m | E
£m | F
£m | G
£m | Unrated properties
£m | Total |
At 31 December 2023 | 971 | | 41,250 | | 64,466 | | 95,958 | | 34,327 | | 6,663 | | 1,465 | | 62,220 | | 307,320 | |
At 31 December 2022 | 731 | | 37,075 | | 60,086 | | 93,010 | | 35,015 | | 6,990 | | 1,519 | | 77,912 | | 312,338 | |
The above data is sourced using the latest available government EPC information as at the relevant balance sheet date. The Group has no EPC data available for 20.2 per cent (2022: 25.0 per cent) of the UK mortgage portfolio; this portion is classified as unrated properties.
EPC ratings are not considered to be a material credit risk factor, and do not form part of the Group’s credit risk calculations.
Other
The majority of other retail lending is unsecured. At 31 December 2023, Stage 3 other retail lending amounted to £378 million, net of an impairment allowance of £358 million (2022: £475 million, net of an impairment allowance of £372 million).
Stage 1 and Stage 2 other retail lending amounted to £55,814 million (2022: £53,825 million). Lending decisions are predominantly based on an obligor’s ability to repay rather than reliance on the disposal of any security provided. Where the lending is secured, collateral values are rigorously assessed at the time of loan origination and are thereafter monitored in accordance with business unit credit policy.
The Group’s credit risk disclosures for unimpaired other retail lending show assets gross of collateral and therefore disclose the maximum loss exposure. The Group believes that this approach is appropriate.
| | | | | | | | |
F-117 | Lloyds Banking Group plc Annual Report on Form 20-F 2023 | |
Notes to the consolidated financial statements continued
for the year ended 31 December
Note 52: Financial risk management continued
Commercial lending
Stage 1 and Stage 2 secured lending
For Stage 1 and Stage 2 secured commercial lending, the Group reports assets gross of collateral and therefore discloses the maximum loss exposure.
Stage 1 and Stage 2 secured commercial lending is predominantly managed on a cash flow basis. On occasion, it may include an assessment of underlying collateral, although, for Stage 3 lending, this will not always involve assessing it on a fair value basis. No aggregated collateral information for the entire unimpaired secured commercial lending portfolio is provided to key management personnel.
Stage 3 secured lending
The value of collateral is re-evaluated and its legal soundness reassessed if there is observable evidence of distress of the borrower; this evaluation is used to determine potential loss allowances and management’s strategy to try to either repair the business or recover the debt.
At 31 December 2023, Stage 3 secured commercial lending amounted to £507 million, net of an impairment allowance of £133 million (2022: £410 million, net of an impairment allowance of £160 million). The fair value of the collateral held in respect of impaired secured commercial lending was £608 million (2022: £484 million). In determining the fair value of collateral, no specific amounts have been attributed to the costs of realisation. For the purposes of determining the total collateral held by the Group in respect of impaired secured commercial lending, the value of collateral for each loan has been limited to the principal amount of the outstanding advance in order to eliminate the effects of any over-collateralisation and to provide a clearer representation of the Group’s exposure.
Stage 3 secured commercial lending and associated collateral relates to lending to property companies and to customers in the financial, business and other services; transport, distribution and hotels; and construction industries.
Reverse repurchase agreements
There were reverse repurchase agreements which are accounted for as collateralised loans with a carrying value of £38,771 million (2022: £44,865 million), against which the Group held collateral with a fair value of £38,510 million, capped at the reverse repurchase agreement carrying value (2022: £33,715 million). These transactions were generally conducted under terms that are usual and customary for standard secured lending activities.
Financial assets at fair value through profit or loss (excluding equity shares)
Included in financial assets at fair value through profit or loss are reverse repurchase agreements treated as collateralised loans with a carrying value of £17,413 million (2022: £11,781 million). Collateral is held with a fair value of £17,301 million, capped at the reverse repurchase agreement carrying value (2022: £9,598 million), all of which the Group is able to repledge. At 31 December 2023, £9,926 million had been repledged (2022: £5,232 million).
In addition, securities held as collateral in the form of stock borrowed amounted to £17,280 million (2022: £26,368 million). Of this amount, £9,363 million (2022: £14,375 million) had been resold or repledged as collateral for the Group’s own transactions.
These transactions were generally conducted under terms that are usual and customary for standard secured lending activities.
Derivative assets, after offsetting of amounts under master netting arrangements
The Group reduces exposure to credit risk by using master netting agreements and by obtaining collateral in the form of cash or highly liquid securities. In respect of the net derivative assets after offsetting of amounts under master netting arrangements of £12,494 million (2022: £12,423 million), cash collateral of £3,361 million (2022: £3,951 million) was held.
Irrevocable loan commitments and other credit-related contingencies
At 31 December 2023, the Group held irrevocable loan commitments and other credit-related contingencies of £77,929 million (2022: £77,678 million). Collateral is held as security, in the event that lending is drawn down, on £13,036 million (2022: £16,442 million) of these balances.
Collateral repossessed
During the year, £229 million of collateral was repossessed (2022: £219 million), consisting primarily of residential property.
In respect of retail portfolios, the Group does not take physical possession of properties or other assets held as collateral and uses external agents to realise the value as soon as practicable, generally at auction, to settle indebtedness. Any surplus funds are returned to the borrower or are otherwise dealt with in accordance with appropriate insolvency regulations. In certain circumstances the Group takes physical possession of assets held as collateral against commercial lending. In such cases, the assets are carried on the Group’s balance sheet and are classified according to the Group’s accounting policies.
(E) Collateral pledged as security
The Group pledges assets primarily for repurchase agreements and securities lending transactions which are generally conducted under terms that are usual and customary for standard securitised borrowing contracts.
Repurchase transactions
Amortised cost
There are balances arising from repurchase transactions of £37,703 million (2022: £48,596 million), which include amounts due under the Bank of England’s Term Funding Scheme with additional incentives for SMEs (TFSME). The fair value of the collateral provided under these agreements at 31 December 2023 was £37,655 million, capped at the repurchase agreement carrying value (2022: £53,827 million including over collaterisation).
Financial liabilities at fair value through profit or loss
The fair value of collateral pledged in respect of repurchase transactions, accounted for as secured borrowing, where the secured party is permitted by contract or custom to repledge was £17,941 million, capped at the repurchase agreement carrying value (2022: £10,427 million).
| | | | | | | | |
F-118 | Lloyds Banking Group plc Annual Report on Form 20-F 2023 | |
Notes to the consolidated financial statements continued
for the year ended 31 December
Note 52: Financial risk management continued
Securities lending transactions
The following on-balance sheet financial assets have been lent to counterparties under securities lending transactions:
| | | | | | | | |
| 2023 £m | 2022 £m |
| Financial assets at fair value through profit or loss | 633 | | 1,463 | |
| Financial assets at fair value through other comprehensive income | 5,245 | | 5,429 | |
| Total | 5,878 | | 6,892 | |
Securitisations and covered bonds
In addition to the assets detailed above, the Group also holds assets that are encumbered through the Group’s asset-backed conduits and its securitisation and covered bond programmes. Further details of these assets are provided in note 29.
Liquidity risk
Liquidity risk is defined as the risk that the Group has insufficient financial resources to meet its commitments as they fall due, or can only secure them at excessive cost. Liquidity risk is managed through a series of measures, tests and reports that are primarily based on contractual maturity. The Group carries out monthly stress testing of its liquidity position against a range of scenarios, including those prescribed by the PRA. The Group’s liquidity risk appetite is also calibrated against a number of stressed liquidity metrics.
The table below analyses assets and liabilities of the Group, other than liabilities arising from insurance and investment contracts, into relevant maturity groupings based on the remaining contractual period at the balance sheet date; balances with no fixed maturity are included in the over 5 years category. Liabilities arising from insurance and investment contracts are analysed on a behavioural basis. Certain balances, included in the table below on the basis of their residual maturity, are repayable on demand upon payment of a penalty.
(A) Maturities of assets and liabilities
| | | | | | | | | | | | | | | | | | | | | | | | | | | | | | | | | | | | | | | | | | | | | | | | | | | | | |
| Up to 1
month
£m | | 1 to 3
months
£m | | 3 to 6
months
£m | | 6 to 9
months
£m | | 9 to 12
months
£m | | 1 to 2
years
£m | | 2 to 5
years
£m | | Over 5
years
£m | | Total
£m |
| At 31 December 2023 | | | | | | | | | | | | | | | | | |
| Assets | | | | | | | | | | | | | | | | | |
| Cash and balances at central banks | 78,110 | | | – | | | – | | | – | | | – | | | – | | | – | | | – | | | 78,110 | |
| Financial assets at fair value through profit or loss | 13,286 | | | 8,279 | | | 6,192 | | | 1,999 | | | 1,499 | | | 3,403 | | | 9,420 | | | 159,240 | | | 203,318 | |
| Derivative financial instruments | 2,747 | | | 1,380 | | | 907 | | | 693 | | | 448 | | | 1,094 | | | 2,448 | | | 12,639 | | | 22,356 | |
| Loans and advances to banks | 5,768 | | | 1,213 | | | 873 | | | 413 | | | 228 | | | 579 | | | 1,686 | | | 4 | | | 10,764 | |
| Loans and advances to customers | 19,148 | | | 11,274 | | | 13,310 | | | 11,555 | | | 10,326 | | | 32,667 | | | 72,029 | | | 279,436 | | | 449,745 | |
| Reverse repurchase agreements | 19,475 | | | 10,242 | | | 5,002 | | | 1,969 | | | 620 | | | 754 | | | 709 | | | – | | | 38,771 | |
| Debt securities | 427 | | | 185 | | | 7 | | | 93 | | | 297 | | | 2,588 | | | 5,742 | | | 6,016 | | | 15,355 | |
| Financial assets at amortised cost | 44,818 | | | 22,914 | | | 19,192 | | | 14,030 | | | 11,471 | | | 36,588 | | | 80,166 | | | 285,456 | | | 514,635 | |
| Financial assets at fair value through other comprehensive income | 276 | | | 428 | | | 221 | | | 272 | | | 617 | | | 1,663 | | | 11,587 | | | 12,528 | | | 27,592 | |
| Other assets | 1,901 | | | 1,024 | | | 71 | | | 777 | | | 65 | | | 137 | | | 160 | | | 31,307 | | | 35,442 | |
| Total assets | 141,138 | | | 34,025 | | | 26,583 | | | 17,771 | | | 14,100 | | | 42,885 | | | 103,781 | | | 501,170 | | | 881,453 | |
| Liabilities | | | | | | | | | | | | | | | | | |
| Deposits from banks | 2,092 | | | 1,065 | | | 201 | | | 218 | | | 184 | | | 349 | | | 2,044 | | | – | | | 6,153 | |
| Customer deposits | 427,657 | | | 11,052 | | | 9,138 | | | 6,925 | | | 6,093 | | | 7,685 | | | 2,520 | | | 326 | | | 471,396 | |
| Repurchase agreements at amortised cost | 3,222 | | | 4,057 | | | 23 | | | 2 | | | – | | | 21,448 | | | 8,951 | | | – | | | 37,703 | |
| Financial liabilities at fair value through profit or loss | 8,971 | | | 4,115 | | | 4,883 | | | 479 | | | 169 | | | 658 | | | 926 | | | 4,713 | | | 24,914 | |
| Derivative financial instruments | 2,821 | | | 1,381 | | | 814 | | | 660 | | | 526 | | | 1,420 | | | 2,829 | | | 9,698 | | | 20,149 | |
| Debt securities in issue at amortised cost | 1,954 | | | 8,057 | | | 9,260 | | | 5,873 | | | 4,554 | | | 12,489 | | | 24,418 | | | 8,987 | | | 75,592 | |
| Liabilities arising from insurance and participating investment contracts | 456 | | | 324 | | | 12 | | | 178 | | | 287 | | | 2,485 | | | 11,235 | | | 105,146 | | | 120,123 | |
| Liabilities arising from non-participating investment contracts | 348 | | | 527 | | | 789 | | | 787 | | | 776 | | | 4,280 | | | 9,517 | | | 27,954 | | | 44,978 | |
| Other liabilities | 5,846 | | | 1,169 | | | 372 | | | 1,532 | | | 469 | | | 639 | | | 876 | | | 11,924 | | | 22,827 | |
| Subordinated liabilities | – | | | – | | | 15 | | | 47 | | | 789 | | | 1,943 | | | 3,130 | | | 4,329 | | | 10,253 | |
| Total liabilities | 453,367 | | | 31,747 | | | 25,507 | | | 16,701 | | | 13,847 | | | 53,396 | | | 66,446 | | | 173,077 | | | 834,088 | |
| | | | | | | | |
F-119 | Lloyds Banking Group plc Annual Report on Form 20-F 2023 | |
Notes to the consolidated financial statements continued
for the year ended 31 December
Note 52: Financial risk management continued
| | | | | | | | | | | | | | | | | | | | | | | | | | | | | | | | | | | | | | | | | | | | | | | | | | | | | |
| Up to 1
month
£m | | 1 to 3
months
£m | | 3 to 6
months
£m | | 6 to 9
months
£m | | 9 to 12
months
£m | | 1 to 2
years
£m | | 2 to 5
years
£m | | Over 5
years
£m | | Total
£m |
At 31 December 20221 | | | | | | | | | | | | | | | | | |
| Assets | | | | | | | | | | | | | | | | | |
| Cash and balances at central banks | 91,388 | | | – | | | – | | | – | | | – | | | – | | | – | | | – | | | 91,388 | |
| Financial assets at fair value through profit or loss | 12,019 | | | 8,108 | | | 3,269 | | | 2,186 | | | 858 | | | 2,827 | | | 7,726 | | | 143,776 | | | 180,769 | |
| Derivative financial instruments | 2,896 | | | 1,823 | | | 1,069 | | | 656 | | | 637 | | | 1,424 | | | 2,828 | | | 13,420 | | | 24,753 | |
| Loans and advances to banks | 4,756 | | | 763 | | | 896 | | | 700 | | | 352 | | | 78 | | | 3,084 | | | 3 | | | 10,632 | |
| Loans and advances to customers | 17,535 | | | 7,628 | | | 10,337 | | | 8,849 | | | 9,952 | | | 33,886 | | | 78,857 | | | 287,855 | | | 454,899 | |
| Reverse repurchase agreements | 14,530 | | | 10,908 | | | 11,600 | | | 4,035 | | | 285 | | | 2,924 | | | 583 | | | – | | | 44,865 | |
| Debt securities | 7 | | | 219 | | | 73 | | | 275 | | | 77 | | | 874 | | | 6,475 | | | 1,926 | | | 9,926 | |
| Financial assets at amortised cost | 36,828 | | | 19,518 | | | 22,906 | | | 13,859 | | | 10,666 | | | 37,762 | | | 88,999 | | | 289,784 | | | 520,322 | |
| Financial assets at fair value through other comprehensive income | 310 | | | 273 | | | 391 | | | 456 | | | 665 | | | 2,324 | | | 9,334 | | | 9,401 | | | 23,154 | |
| Other assets | 1,537 | | | 969 | | | 47 | | | 589 | | | 132 | | | 71 | | | 129 | | | 29,534 | | | 33,008 | |
| Total assets | 144,978 | | | 30,691 | | | 27,682 | | | 17,746 | | | 12,958 | | | 44,408 | | | 109,016 | | | 485,915 | | | 873,394 | |
| Liabilities | | | | | | | | | | | | | | | | | |
| Deposits from banks | 3,988 | | | 364 | | | 141 | | | 139 | | | 408 | | | 4 | | | 2,222 | | | – | | | 7,266 | |
| Customer deposits | 446,311 | | | 8,074 | | | 5,628 | | | 2,953 | | | 4,695 | | | 3,887 | | | 3,402 | | | 381 | | | 475,331 | |
| Repurchase agreements at amortised cost | 12,203 | | | 6,183 | | | – | | | – | | | – | | | – | | | 30,210 | | | – | | | 48,596 | |
| Financial liabilities at fair value through profit or loss | 5,245 | | | 2,363 | | | 1,526 | | | 1,431 | | | 665 | | | 615 | | | 1,476 | | | 4,434 | | | 17,755 | |
| Derivative financial instruments | 3,197 | | | 1,647 | | | 942 | | | 739 | | | 779 | | | 2,030 | | | 3,850 | | | 10,858 | | | 24,042 | |
| Debt securities in issue at amortised cost | 5,562 | | | 9,761 | | | 8,646 | | | 3,940 | | | 2,114 | | | 10,124 | | | 23,964 | | | 9,708 | | | 73,819 | |
| Liabilities arising from insurance and participating investment contracts | 574 | | | 422 | | | 94 | | | 163 | | | 331 | | | 1,247 | | | 8,465 | | | 98,982 | | | 110,278 | |
| Liabilities arising from non-participating investment contracts | 439 | | | 497 | | | 736 | | | 742 | | | 716 | | | 2,793 | | | 9,890 | | | 23,663 | | | 39,476 | |
| Other liabilities | 5,680 | | | 1,236 | | | 378 | | | 1,476 | | | 515 | | | 499 | | | 688 | | | 11,718 | | | 22,190 | |
| Subordinated liabilities | – | | | – | | | 541 | | | 662 | | | – | | | 915 | | | 3,770 | | | 4,842 | | | 10,730 | |
| Total liabilities | 483,199 | | | 30,547 | | | 18,632 | | | 12,245 | | | 10,223 | | | 22,114 | | | 87,937 | | | 164,586 | | | 829,483 | |
1 Restated for the adoption of IFRS 17; see notes 1 and 54.
The above table is provided on a contractual basis. The Group’s assets and liabilities may be repaid or otherwise mature earlier or later than implied by their contractual terms and readers are, therefore, advised to use caution when using this data to evaluate the Group’s liquidity position. In particular, amounts in respect of customer deposits are usually contractually payable on demand or at short notice. However, in practice, these deposits are not usually withdrawn on their contractual maturity.
The table below analyses financial instrument liabilities of the Group, excluding those arising from insurance and participating investment contracts, on an undiscounted future cash flow basis according to contractual maturity, into relevant maturity groupings based on the remaining period at the balance sheet date; balances with no fixed maturity are included in the over 5 years category.
| | | | | | | | | | | | | | | | | | | | | | | | | | | | | | | | | | | |
| Up to 1
month
£m | | 1 to 3
months
£m | | 3 to 12
months
£m | | 1 to 5
years
£m | | Over 5
years
£m | | Total
£m |
| At 31 December 2023 | | | | | | | | | | | |
| Deposits from banks | 2,093 | | | 1,073 | | | 623 | | | 2,394 | | | – | | | 6,183 | |
| Customer deposits | 427,695 | | | 11,133 | | | 22,572 | | | 10,767 | | | 325 | | | 472,492 | |
| Repurchase agreements at amortised cost | 3,627 | | | 4,092 | | | 1,085 | | | 31,399 | | | – | | | 40,203 | |
| Financial liabilities at fair value through profit or loss | 8,801 | | | 4,157 | | | 5,694 | | | 1,808 | | | 5,845 | | | 26,305 | |
| Debt securities in issue at amortised cost | 2,334 | | | 8,492 | | | 21,111 | | | 40,741 | | | 8,085 | | | 80,763 | |
| Liabilities arising from non-participating investment contracts | 44,978 | | | – | | | – | | | – | | | – | | | 44,978 | |
| Lease liabilities | 18 | | | 70 | | | 247 | | | 779 | | | 666 | | | 1,780 | |
| Subordinated liabilities | 32 | | | 80 | | | 1,274 | | | 6,627 | | | 7,822 | | | 15,835 | |
| Total non-derivative financial liabilities | 489,578 | | | 29,097 | | | 52,606 | | | 94,515 | | | 22,743 | | | 688,539 | |
| Derivative financial liabilities | | | | | | | | | | | |
| Gross settled derivatives – outflows | 80,148 | | | 46,874 | | | 47,777 | | | 35,807 | | | 20,302 | | | 230,908 | |
| Gross settled derivatives – inflows | (78,031) | | | (45,249) | | | (46,575) | | | (35,753) | | | (20,327) | | | (225,935) | |
| Gross settled derivatives – net flows | 2,117 | | | 1,625 | | | 1,202 | | | 54 | | | (25) | | | 4,973 | |
| Net settled derivative liabilities | 12,095 | | | 138 | | | 161 | | | 402 | | | 1,501 | | | 14,297 | |
| Total derivative financial liabilities | 14,212 | | | 1,763 | | | 1,363 | | | 456 | | | 1,476 | | | 19,270 | |
| | | | | | | | |
F-120 | Lloyds Banking Group plc Annual Report on Form 20-F 2023 | |
Notes to the consolidated financial statements continued
for the year ended 31 December
Note 52: Financial risk management continued
| | | | | | | | | | | | | | | | | | | | | | | | | | | | | | | | | | | |
| Up to 1
month
£m | | 1 to 3
months
£m | | 3 to 12
months
£m | | 1 to 5
years
£m | | Over 5
years
£m | | Total
£m |
At 31 December 20221 | | | | | | | | | | | |
| Deposits from banks | 3,925 | | | 369 | | | 714 | | | 2,227 | | | 135 | | | 7,370 | |
| Customer deposits | 449,801 | | | 6,717 | | | 11,635 | | | 7,417 | | | 382 | | | 475,952 | |
| Repurchase agreements at amortised cost | 12,501 | | | 6,188 | | | 904 | | | 33,054 | | | 38 | | | 52,685 | |
| Financial liabilities at fair value through profit or loss | 5,297 | | | 2,397 | | | 3,725 | | | 2,293 | | | 4,747 | | | 18,459 | |
| Debt securities in issue at amortised cost | 6,108 | | | 12,625 | | | 15,517 | | | 39,527 | | | 11,623 | | | 85,400 | |
| Liabilities arising from non-participating investment contracts | 42,975 | | | – | | | – | | | – | | | – | | | 42,975 | |
| Lease liabilities | 13 | | | 54 | | | 166 | | | 582 | | | 700 | | | 1,515 | |
| Subordinated liabilities | 27 | | | 113 | | | 1,648 | | | 6,741 | | | 12,384 | | | 20,913 | |
| Total non-derivative financial liabilities | 520,647 | | | 28,463 | | | 34,309 | | | 91,841 | | | 30,009 | | | 705,269 | |
| Derivative financial liabilities | | | | | | | | | | | |
| Gross settled derivatives – outflows | 55,671 | | | 43,380 | | | 40,826 | | | 34,808 | | | 20,677 | | | 195,362 | |
| Gross settled derivatives – inflows | (52,383) | | | (41,255) | | | (39,132) | | | (34,015) | | | (20,130) | | | (186,915) | |
| Gross settled derivatives – net flows | 3,288 | | | 2,125 | | | 1,694 | | | 793 | | | 547 | | | 8,447 | |
| Net settled derivative liabilities | 13,078 | | | 82 | | | 130 | | | 752 | | | 1,501 | | | 15,543 | |
| Total derivative financial liabilities | 16,366 | | | 2,207 | | | 1,824 | | | 1,545 | | | 2,048 | | | 23,990 | |
1 Restated for the adoption of IFRS 17; see notes 1 and 54.
The majority of the Group’s non-participating investment contract liabilities are unit-linked. These unit-linked products are invested in accordance with unit fund mandates. Clauses are included in policyholder contracts to permit the deferral of sales, where necessary, so that linked assets can be realised without being a forced seller.
The principal amount for undated subordinated liabilities with no redemption option is included within the over 5 years column; interest of £16 million (2022: £17 million) per annum which is payable in respect of those instruments for as long as they remain in issue is not included beyond 5 years.
An analysis of the Group’s total wholesale funding by residual maturity and by currency is set out on page 78. The following table presents the estimated amount and timing of the remaining contractual discounted cash flows arising from insurance liabilities The amounts presented do not include those relating to LRC of contracts that are measured under the PAA.
| | | | | | | | | | | | | | | | | | | | | | | |
| Less than 1
year
£m | 1 to 2
years
£m | 2 to 3
years
£m | 3 to 4
years
£m | 4 to 5
years
£m | Over 5
years
£m | Total
£m |
| At 31 December 2023 | | | | | | | |
| Liabilities arising from insurance and participating investment contracts | (843) | | (2,112) | | (3,035) | | (3,537) | | (3,667) | | (101,354) | | (114,548) | |
| Reinsurance contract liabilities | – | | – | | – | | – | | – | | (13) | | (13) | |
| Total | (843) | | (2,112) | | (3,035) | | (3,537) | | (3,667) | | (101,367) | | (114,561) | |
At 31 December 2022 | | | | | | | |
| Liabilities arising from insurance and participating investment contracts | (1,115) | | (752) | | (1,882) | | (2,621) | | (3,147) | | (95,362) | | (104,879) | |
| Reinsurance contract liabilities | (4) | | (4) | | (4) | | (4) | | (4) | | (118) | | (138) | |
| Total | (1,119) | | (756) | | (1,886) | | (2,625) | | (3,151) | | (95,480) | | (105,017) | |
For insurance contracts which are neither unit-linked nor in the Group’s with-profit funds, in particular annuity liabilities, the aim is to invest in assets such that the cash flows on investments match those on the projected future liabilities.
Some of the Group’s insurance and participating investment contract liabilities are payable on demand as shown in the table below:
| | | | | | | | | | | | | | | | | |
| 2023 | | 2022 |
| Amounts
payable on
demand
£m | Carrying
amount
£m | | Amounts
payable on
demand
£m | Carrying
amount
£m |
| Life | 102,396 | | 99,799 | | | 93,663 | | 91,163 | |
| Non-life | – | | – | | | – | | – | |
| Total | 102,396 | | 99,799 | | | 93,663 | | 91,163 | |
The amounts payable on demand represent contract surrender values and incurred claims.
| | | | | | | | |
F-121 | Lloyds Banking Group plc Annual Report on Form 20-F 2023 | |
Notes to the consolidated financial statements continued
for the year ended 31 December
Note 52: Financial risk management continued
The figures below are presented in timing categories representing the remaining offer periods of lending commitments or remaining coverage periods of financial guarantees, but the Group could be required to lend or pay amounts under those arrangements earlier than the periods presented below. Payment under the significant majority of the Group’s lending commitments and financial guarantee contracts could be required to be made on demand.
| | | | | | | | | | | | | | | | | | | | | | | | | | | | | |
| Up to 1
month
£m | 1 to 3
months
£m | 3 to 6
months
£m | 6 to 9
months
£m | 9 to 12
months
£m | 1 to 3
years
£m | 3 to 5
years
£m | Over 5
years
£m | Total
£m |
| At 31 December 2023 | | | | | | | | | |
| Acceptances and endorsements | 7 | | 10 | | 166 | | – | | 8 | | – | | – | | – | | 191 | |
| Other contingent liabilities | 214 | | 558 | | 157 | | 148 | | 200 | | 598 | | 190 | | 593 | | 2,658 | |
| Total contingent liabilities | 221 | | 568 | | 323 | | 148 | | 208 | | 598 | | 190 | | 593 | | 2,849 | |
| Lending commitments and guarantees | 69,932 | | 4,767 | | 17,384 | | 4,212 | | 6,528 | | 23,269 | | 14,142 | | 2,983 | | 143,217 | |
| Other commitments | – | | – | | – | | – | | – | | 38 | | 41 | | 23 | | 102 | |
| Total commitments and guarantees | 69,932 | | 4,767 | | 17,384 | | 4,212 | | 6,528 | | 23,307 | | 14,183 | | 3,006 | | 143,319 | |
| Total contingents, commitments and guarantees | 70,153 | | 5,335 | | 17,707 | | 4,360 | | 6,736 | | 23,905 | | 14,373 | | 3,599 | | 146,168 | |
| At 31 December 2022 | | | | | | | | | |
| Acceptances and endorsements | 47 | | 11 | | – | | – | | – | | – | | – | | – | | 58 | |
| Other contingent liabilities | 355 | | 744 | | 263 | | 240 | | 144 | | 554 | | 181 | | 447 | | 2,928 | |
| Total contingent liabilities | 402 | | 755 | | 263 | | 240 | | 144 | | 554 | | 181 | | 447 | | 2,986 | |
| Lending commitments and guarantees | 68,984 | | 2,419 | | 17,641 | | 1,586 | | 6,439 | | 12,787 | | 14,329 | | 19,571 | | 143,756 | |
| Other commitments | – | | – | | – | | – | | – | | – | | 10 | | 29 | | 39 | |
| Total commitments and guarantees | 68,984 | | 2,419 | | 17,641 | | 1,586 | | 6,439 | | 12,787 | | 14,339 | | 19,600 | | 143,795 | |
| Total contingents, commitments and guarantees | 69,386 | | 3,174 | | 17,904 | | 1,826 | | 6,583 | | 13,341 | | 14,520 | | 20,047 | | 146,781 | |
Capital risk
Capital is actively managed on an ongoing basis for both the Group and its regulated banking subsidiaries, with associated capital policies and procedures subjected to regular review. The Group assesses both its regulatory capital requirements and the quantity and quality of capital resources it holds to meet those requirements in accordance with the relevant provisions of the Capital Requirements Directive (CRD V) and Capital Requirements Regulation (UK CRR). This is supplemented through additional regulation set out under the PRA Rulebook and through associated statements of policy, supervisory statements and other regulatory guidance. Regulatory capital ratios are considered a key part of the budgeting and planning processes and forecast ratios are reviewed by the Group Asset and Liability Committee. Target capital levels take account of current and future regulatory requirements, capacity for growth and to cover uncertainties. Details of the Group’s capital resources are provided in the table marked audited on page 48. Each insurance company within the Group is regulated by the PRA. The insurance businesses are required to calculate solvency capital requirements and available capital in accordance with Solvency II. The Group complied with these requirements in 2023 and 2022. The Insurance business of the Group calculates regulatory capital on the basis of an internal model, which was approved by the PRA on 5 December 2015, with the latest major change to the model approved in November 2020. The capital position of the Group’s insurance businesses is reviewed on a regular basis by the Insurance, Pensions and Investments Executive Committee.
Insurance risk
Insurance underwriting risk is the risk of adverse developments in the timing, frequency and severity of claims for insured/underwritten events and in customer behaviour, leading to reductions in earnings and/or value and arises within the Group’s Insurance business. Insurance underwriting risk is measured using a variety of techniques including stress, reverse stress and scenario testing, as well as stochastic modelling. Current and potential future insurance underwriting risk exposures are assessed and aggregated on a range of stresses including risk measures based on 1-in-200 year stresses for the Insurance business’s regulatory capital assessments and other supporting measures where appropriate. The Group also mitigates insurance underwriting risk via the use of reinsurance arrangements. The Group's critical accounting judgements and key sources of estimation uncertainty for its Insurance business are set out in note 36.
Note 53: Cash flow statement
(A) Change in operating assets
| | | | | | | | | | | |
| 2023 £m | 20221,2 £m | 20212 £m |
| Change in financial assets held at amortised cost | 12,311 | | (1,639) | | (2,379) | |
| Change in financial assets at fair value through profit or loss | (22,539) | | 26,219 | | (15,565) | |
| Change in derivative financial instruments | 1,805 | | (7,704) | | 6,132 | |
| Change in other operating assets | (687) | | (141) | | 1,447 | |
| Change in operating assets | (9,110) | | 16,735 | | (10,365) | |
1 Restated for the adoption of IFRS 17; see notes 1 and 54.
2 Restated for presentational changes; see note 1.
| | | | | | | | |
F-122 | Lloyds Banking Group plc Annual Report on Form 20-F 2023 | |
Notes to the consolidated financial statements continued
for the year ended 31 December
Note 53: Cash flow statement continued
(B) Change in operating liabilities
| | | | | | | | | | | |
| 2023 £m | 20221,2 £m | 20212 £m |
| Change in deposits from banks | (1,110) | | (388) | | (5,052) | |
| Change in customer deposits | (3,850) | | (1,207) | | 25,672 | |
| Change in repurchase agreements | (10,893) | | 17,471 | | 2,941 | |
| Change in financial liabilities at fair value through profit or loss | 6,925 | | (4,849) | | 391 | |
| Change in derivative financial instruments | (3,893) | | 5,982 | | (9,258) | |
| Change in debt securities in issue at amortised cost | 2,094 | | 1,651 | | (15,896) | |
| Change in insurance contracts | 9,845 | | (14,901) | | 7,328 | |
| Change in investment contract liabilities | 5,502 | | (1,414) | | 6,588 | |
Change in other operating liabilities3 | (388) | | (864) | | (432) | |
| Change in operating liabilities | 4,232 | | 1,481 | | 12,282 | |
1 Restated for the adoption of IFRS 17; see notes 1 and 54.
2 Restated for presentational changes; see note 1.
3 Includes an increase of £315 million (2022: decrease of £158 million; 2021: decrease of £197 million) in respect of lease liabilities.
(C) Non-cash and other items
| | | | | | | | | | | |
| 2023 £m | 20221,2 £m | 20212 £m |
| Interest expense on subordinated liabilities | 720 | | 697 | | 1,320 | |
| Hedging valuation adjustments on subordinated debt | 141 | | (1,871) | | (781) | |
| Accretion of discounts and amortisation of premiums and issue costs | 1,259 | | 462 | | (306) | |
| Revaluation of investment properties | 87 | | 511 | | (575) | |
| Net gain on sale of financial assets at fair value through other comprehensive income | (122) | | (92) | | 2 | |
| Share of post-tax results of associates and joint ventures | 16 | | (10) | | (2) | |
| Profit on disposal of tangible fixed assets | (61) | | (121) | | (268) | |
| Net (credit) charge in respect of defined benefit schemes | (79) | | 125 | | 236 | |
| Depreciation and amortisation | 2,905 | | 2,396 | | 2,825 | |
| Regulatory and legal provisions | 675 | | 255 | | 1,300 | |
| Other provision movements | (30) | | (74) | | (66) | |
| Allowance for loan losses | 315 | | 1,372 | | (1,121) | |
| Write-off of allowance for loan losses, net of recoveries | (1,115) | | (759) | | (935) | |
| Impairment charge (credit) on undrawn balances | – | | 122 | | (257) | |
| Impairment (credit) charge on financial assets at fair value through other comprehensive income | (2) | | 6 | | (2) | |
| Transactions in own shares | 103 | | (60) | | (13) | |
| Transfers to income statement from reserves | 1,838 | | 43 | | (621) | |
Foreign exchange impact on balance sheet3 | 502 | | (286) | | 140 | |
| Other non-cash items | 176 | | 185 | | 23 | |
| Total non-cash items | 7,328 | | 2,901 | | 899 | |
| Contributions to defined benefit schemes | (1,345) | | (2,533) | | (1,347) | |
| Payments in respect of regulatory and legal provisions | (378) | | (625) | | (817) | |
| Other | 17 | | 13 | | – | |
| Total other items | (1,706) | | (3,145) | | (2,164) | |
| Non-cash and other items | 5,622 | | (244) | | (1,265) | |
1 Restated for the adoption of IFRS 17; see notes 1 and 54.
2 Restated for presentational changes; see note 1.
3 When considering the movement on each line of the balance sheet, the impact of foreign exchange rate movements is removed in order to show the underlying cash impact.
| | | | | | | | |
F-123 | Lloyds Banking Group plc Annual Report on Form 20-F 2023 | |
Notes to the consolidated financial statements continued
for the year ended 31 December
Note 53: Cash flow statement continued
(D) Acquisition of Group undertakings and businesses
| | | | | | | | | | | | | | | | | |
| 2023 £m | | 2022 £m | | 2021 £m |
| Net assets acquired: | | | | | |
| Cash and cash equivalents | 38 | | | – | | | – | |
| | | | | |
| | | | | |
| Intangible assets | 182 | | | 68 | | | – | |
| Other assets | 672 | | | 131 | | | 3 | |
| | | | | |
| Deferred tax | (58) | | | – | | | – | |
| Other liabilities | (646) | | | (146) | | | – | |
| Goodwill arising on acquisition | 143 | | | 335 | | | – | |
| Cash consideration | 331 | | | 388 | | | 3 | |
| Less cash and cash equivalents acquired | (38) | | | (74) | | | – | |
| Net cash outflow arising from acquisition of subsidiaries and businesses | 293 | | | 314 | | | 3 | |
| Acquisition of and additional investment in joint ventures | 87 | | | 95 | | | 54 | |
| Net cash outflow from acquisitions in the year | 380 | | | 409 | | | 57 | |
(E) Analysis of cash and cash equivalents as shown in the balance sheet
| | | | | | | | | | | | | | | | | |
| 2023 £m | | 2022 £m | | 2021 £m |
| | | | | |
| Cash and balances at central banks | 78,110 | | | 91,388 | | | 76,420 | |
Less mandatory reserve deposits1 | (1,930) | | | (2,111) | | | (2,178) | |
| 76,180 | | | 89,277 | | | 74,242 | |
| Loans and advances to banks and reverse repurchase agreements | 19,048 | | | 14,418 | | | 10,533 | |
| Less amounts with a maturity of three months or more | (6,390) | | | (7,866) | | | (5,581) | |
| 12,658 | | | 6,552 | | | 4,952 | |
| Total cash and cash equivalents | 88,838 | | | 95,829 | | | 79,194 | |
1 Mandatory reserve deposits are held with local central banks in accordance with statutory requirements. Where these deposits are not held in demand accounts and are not available to finance the Group’s day-to-day operations they are excluded from cash and cash equivalents.
Included within cash and cash equivalents at 31 December 2023 is £31 million (2022: £37 million; 2021: £76 million) of restricted cash and cash equivalents is held within the Group’s long-term insurance and investments operations, which is not immediately available for use in the business.
| | | | | | | | |
F-124 | Lloyds Banking Group plc Annual Report on Form 20-F 2023 | |
Notes to the consolidated financial statements continued
for the year ended 31 December
Note 54: Restatement of prior period information
As explained in note 1, the Group adopted IFRS 17 Insurance Contracts on 1 January 2023. The following tables summarise the adjustments arising on the adoption of IFRS 17 to the Group’s:
•Consolidated income statement, consolidated statement of comprehensive income and consolidated cash flow statement for the year ended 31 December 2022
•Consolidated balance sheet at 31 December 2022
| | | | | | | | | | | | | | | | | | | | | | | | | | | | | |
Consolidated income statement for the year ended 31 December 2022 | Footnote | | As
previously
reported
£m | | Impact
of IFRS 17
(see below)
£m | | Other changes
(see note 1)
£m | | Restated
£m |
| Interest income | | | 17,645 | | | – | | | – | | | 17,645 | |
| Interest expense | 1 | | (3,688) | | | – | | | (1,035) | | | (4,723) | |
| Net interest income | | | 13,957 | | | – | | | (1,035) | | | 12,922 | |
| Fee and commission income | | | 2,835 | | | (45) | | | – | | | 2,790 | |
| Fee and commission expense | | | (1,332) | | | 262 | | | – | | | (1,070) | |
| Net fee and commission income | | | 1,503 | | | 217 | | | – | | | 1,720 | |
| Net trading income (losses) | | | (19,987) | | | – | | | – | | | (19,987) | |
| Insurance premium income | 2 | | 9,059 | | | (9,059) | | | – | | | |
| Insurance revenue | 3 | | | | 2,461 | | | – | | | 2,461 | |
| Insurance service expense | 4 | | | | (3,863) | | | – | | | (3,863) | |
| Net income (losses) from reinsurance contracts held | | | | | 62 | | | – | | | 62 | |
| Insurance service result | | | | | (1,340) | | | – | | | (1,340) | |
| Other operating income | 5 | | 1,276 | | | 63 | | | – | | | 1,339 | |
| Other income | | | (8,149) | | | (10,119) | | | – | | | (18,268) | |
| Total income | | | 5,808 | | | (10,119) | | | (1,035) | | | (5,346) | |
| Insurance claims and changes in insurance and investment contract liabilities | 6 | | 12,401 | | | (12,401) | | | – | | | |
| Net finance (expense) income from insurance, participating investment and reinsurance contracts | 7 | | | | 15,893 | | | – | | | 15,893 | |
| Movement in third party interests in consolidated funds | 1 | | | | – | | | 1,035 | | | 1,035 | |
| Change in non-participating investment contracts | 8 | | | | 3,959 | | | – | | | 3,959 | |
| Total income, after net finance (expense) income in respect of insurance and investment contracts | | | 18,209 | | | (2,668) | | | – | | | 15,541 | |
| Operating expenses | 9 | | (9,759) | | | 522 | | | – | | | (9,237) | |
| Impairment | | | (1,522) | | | – | | | – | | | (1,522) | |
| Profit before tax | | | 6,928 | | | (2,146) | | | – | | | 4,782 | |
| Tax expense | | | (1,373) | | | 514 | | | – | | | (859) | |
| Profit for the year | | | 5,555 | | | (1,632) | | | – | | | 3,923 | |
| | | | | | | | | | |
| Profit attributable to ordinary shareholders | | | 5,021 | | | (1,632) | | | – | | | 3,389 | |
| Profit attributable to other equity holders | | | 438 | | | – | | | – | | | 438 | |
| Profit attributable to equity holders | | | 5,459 | | | (1,632) | | | – | | | 3,827 | |
| Profit attributable to non-controlling interests | | | 96 | | | – | | | – | | | 96 | |
| Profit for the year | | | 5,555 | | | (1,632) | | | – | | | 3,923 | |
| | | | | | | | | | |
| Basic earnings per share | | | 7.3p | | (2.4p) | | – | | | 4.9p |
| Diluted earnings per share | | | 7.2p | | (2.3p) | | – | | | 4.9p |
1 Movement in third party interests in consolidated funds is reclassified from interest expense to a separate line on the face of the income statement.
2 Insurance premium income is removed as this is no longer presented in the income statement under IFRS 17.
3 Insurance revenue includes the CSM released to the income statement and changes in the risk adjustment related to current service (for more details on IFRS 17 measurement see note 1).
4 Insurance services expense includes incurred claims excluding any investment components, attributable service expenses and losses as a result of contract modifications.
5 The change in operating income is primarily driven by the removal of the movement in the value of in-force asset.
6 These changes are analysed using different line items under IFRS 17.
7 Finance related changes to the carrying value of insurance, participating investment and reinsurance contracts.
8 Change in non-participating investment contracts is presented as a separate line item.
9 Maintenance expenses are included within insurance service expense and acquisition expenses are deferred within the CSM under IFRS 17.
| | | | | | | | |
F-125 | Lloyds Banking Group plc Annual Report on Form 20-F 2023 | |
Notes to the consolidated financial statements continued
for the year ended 31 December
Note 54: Restatement of prior period information continued
| | | | | | | | | | | | | | | | | |
| Consolidated statement of comprehensive income for the year ended 31 December 2022 | As
previously
reported
£m | | Impact
of IFRS 17
£m | | Restated
£m |
| Profit for the year | 5,555 | | | (1,632) | | | 3,923 | |
| Other comprehensive income | | | | | |
| Items that will not subsequently be reclassified to profit or loss: | | | | | |
| Post-retirement defined benefit scheme remeasurements: | | | | | |
| Remeasurements before tax | (3,012) | | | – | | | (3,012) | |
| Tax | 860 | | | – | | | 860 | |
| (2,152) | | | – | | | (2,152) | |
| Movements in revaluation reserve in respect of equity shares held at fair value through other comprehensive income: | | | | | |
| Change in fair value | 44 | | | – | | | 44 | |
| Tax | 3 | | | – | | | 3 | |
| 47 | | | – | | | 47 | |
| Gains and losses attributable to own credit risk: | | | | | |
| Gains before tax | 519 | | | – | | | 519 | |
| Tax | (155) | | | – | | | (155) | |
| 364 | | | – | | | 364 | |
| | | | | |
| Items that may subsequently be reclassified to profit or loss: | | | | | |
| Movements in revaluation reserve in respect of debt securities held at fair value through other comprehensive income: | | | | | |
| Change in fair value | (133) | | | – | | | (133) | |
| Income statement transfers in respect of disposals | (92) | | | – | | | (92) | |
| Income statement transfers in respect of impairment | 6 | | | – | | | 6 | |
| Tax | 62 | | | – | | | 62 | |
| (157) | | | – | | | (157) | |
| Movements in cash flow hedging reserve: | | | | | |
| Effective portion of changes in fair value taken to other comprehensive income | (6,990) | | | – | | | (6,990) | |
| Net income statement transfers | 43 | | | – | | | 43 | |
| Tax | 1,928 | | | – | | | 1,928 | |
| (5,019) | | | – | | | (5,019) | |
| Movements in foreign currency translation reserve: | | | | | |
| Currency translation differences (tax: £nil) | 119 | | | (3) | | | 116 | |
| Transfers to income statement (tax: £nil) | (31) | | | – | | | (31) | |
| 88 | | | (3) | | | 85 | |
| Total other comprehensive loss for the year, net of tax | (6,829) | | | (3) | | | (6,832) | |
| Total comprehensive loss for the year | (1,274) | | | (1,635) | | | (2,909) | |
| | | | | | |
| Total comprehensive loss attributable to ordinary shareholders | (1,808) | | | (1,635) | | | (3,443) | |
| Total comprehensive income attributable to other equity holders | 438 | | | – | | | 438 | |
| Total comprehensive loss attributable to equity holders | (1,370) | | | (1,635) | | | (3,005) | |
| Total comprehensive income attributable to non-controlling interests | 96 | | | – | | | 96 | |
| Total comprehensive loss for the year | (1,274) | | | (1,635) | | | (2,909) | |
| | | | | | | | |
F-126 | Lloyds Banking Group plc Annual Report on Form 20-F 2023 | |
Notes to the consolidated financial statements continued
for the year ended 31 December
Note 54: Restatement of prior period information continued
| | | | | | | | | | | | | | | | | | | | | | | | | | | | | | | | | | | |
| Consolidated balance sheet as at 31 December 2022 | Footnote | | As
previously
reported
£m | | IFRS 17
adjustments
as at
1 Jan 2022
(see below)
£m | | Other
changes
(see note 1)
£m | | IFRS 17
2022
movements
£m | | Restated
£m |
| Assets | | | | | | | | | | | |
| Cash and balances at central banks | | | 91,388 | | | – | | | – | | | – | | | 91,388 | |
| Items in the course of collection from banks | | | 242 | | | – | | | (242) | | | – | | | |
| Financial assets at fair value through profit or loss | 1 | | 180,609 | | | 200 | | | – | | | (40) | | | 180,769 | |
| Derivative financial instruments | | | 24,753 | | | – | | | – | | | – | | | 24,753 | |
| Financial assets at amortised cost | | | 520,322 | | | – | | | – | | | – | | | 520,322 | |
| Financial assets at fair value through other comprehensive income | | 23,154 | | | – | | | – | | | – | | | 23,154 | |
| Reinsurance assets | 2 | | 616 | | | (759) | | | – | | | 143 | | | |
| Investments in joint ventures and associates | | | 385 | | | – | | | (385) | | | – | | | |
| Goodwill | | | 2,655 | | | – | | | (2,655) | | | – | | | |
| Value of in-force business | 3 | | 5,419 | | | (5,317) | | | (174) | | | 72 | | | |
| Other intangible assets | | | 4,786 | | | – | | | (4,786) | | | – | | | |
| Goodwill and other intangible assets | | | | | – | | | 7,615 | | | – | | | 7,615 | |
| Current tax recoverable | | | 612 | | | – | | | – | | | – | | | 612 | |
| Deferred tax assets | 4 | | 5,228 | | | 655 | | | – | | | 539 | | | 6,422 | |
| Retirement benefit assets | | | 3,823 | | | – | | | – | | | – | | | 3,823 | |
| Other assets | 2 | | 13,837 | | | (47) | | | 627 | | | 119 | | | 14,536 | |
| Total assets | | | 877,829 | | | (5,268) | | | – | | | 833 | | | 873,394 | |
| Liabilities | | | | | | | | | | | |
| Deposits from banks | | | 7,266 | | | – | | | – | | | – | | | 7,266 | |
| Customer deposits | | | 475,331 | | | – | | | – | | | – | | | 475,331 | |
| Repurchase agreements at amortised cost | | | 48,596 | | | – | | | – | | | – | | | 48,596 | |
| Items in course of transmission to banks | | | 372 | | | – | | | (372) | | | – | | | |
| Financial liabilities at fair value through profit or loss | | | 17,755 | | | – | | | – | | | – | | | 17,755 | |
| Derivative financial instruments | | | 24,042 | | | – | | | – | | | – | | | 24,042 | |
| Notes in circulation | | | 1,280 | | | – | | | – | | | – | | | 1,280 | |
| Debt securities in issue at amortised cost | | | 73,819 | | | – | | | – | | | – | | | 73,819 | |
| Liabilities arising from insurance and participating investment contracts | 5 | | 106,893 | | | 1,756 | | | – | | | 1,629 | | | 110,278 | |
| Liabilities arising from non-participating investment contracts | 6 | | 42,975 | | | (4,150) | | | – | | | 651 | | | 39,476 | |
| Other liabilities | 7 | | 19,090 | | | (896) | | | 372 | | | 198 | | | 18,764 | |
| Retirement benefit obligations | | | 126 | | | – | | | – | | | – | | | 126 | |
| Current tax liabilities | | | 8 | | | – | | | – | | | – | | | 8 | |
| Deferred tax liabilities | 4 | | 216 | | | (31) | | | – | | | 24 | | | 209 | |
| Other provisions | | | 1,809 | | | (12) | | | – | | | 6 | | | 1,803 | |
| Subordinated liabilities | | | 10,730 | | | – | | | – | | | – | | | 10,730 | |
| Total liabilities | | | 830,308 | | | (3,333) | | | – | | | 2,508 | | | 829,483 | |
| Equity | | | | | | | | | | | |
| Share capital | | | 6,729 | | | – | | | – | | | – | | | 6,729 | |
| Share premium account | | | 18,504 | | | – | | | – | | | – | | | 18,504 | |
| Other reserves | | | 6,602 | | | (12) | | | – | | | (3) | | | 6,587 | |
| Retained profits | | | 10,145 | | | (1,923) | | | – | | | (1,672) | | | 6,550 | |
| Ordinary shareholders’ equity | | | 41,980 | | | (1,935) | | | – | | | (1,675) | | | 38,370 | |
| Other equity instruments | | | 5,297 | | | – | | | – | | | – | | | 5,297 | |
| Total equity excluding non-controlling interests | | | 47,277 | | | (1,935) | | | – | | | (1,675) | | | 43,667 | |
| Non-controlling interests | | | 244 | | | – | | | – | | | – | | | 244 | |
| Total equity | | | 47,521 | | | (1,935) | | | – | | | (1,675) | | | 43,911 | |
| Total equity and liabilities | | | 877,829 | | | (5,268) | | | – | | | 833 | | | 873,394 | |
1 Own shares held through consolidated collective investment vehicles classified as financial assets at fair value through profit or loss rather than in equity under IFRS 17.
2 Reinsurance assets are replaced by reinsurance contract assets, which are presented within other assets, under IFRS 17.
3 The value of in-force business (VIF) is not recognised on the balance sheet under IFRS 17 and acquired VIF presented within goodwill and other intangible assets.
4 Deferred tax assets and liabilities are recalculated based on IFRS 17 retained earnings.
5 Change in measurement basis of liabilities arising from insurance and participating investment contracts under IFRS 17.
6 Reclassification of certain hybrid unit-linked and With-Profit contracts from IFRS 9 to IFRS 17.
7 Unallocated surplus relating to the With-Profit funds is recognised as part of the liabilities arising from insurance and participating investment contracts under IFRS 17.
| | | | | | | | |
F-127 | Lloyds Banking Group plc Annual Report on Form 20-F 2023 | |
Notes to the consolidated financial statements continued
for the year ended 31 December
Note 54: Restatement of prior period information continued
| | | | | | | | | | | | | | | | | | | | | | | | | | | | | |
| Consolidated cash flow statement for the year ended 31 December 2022 | | | As
previously
reported
£m | | Impact
of IFRS 17
£m | | Other
changes
(see note 1)
£m | | Restated
£m |
| Cash flows from operating activities | | | | | | | | | |
| Profit before tax | | | 6,928 | | | (2,146) | | | – | | | 4,782 | |
| Adjustments for: | | | | | | | | | |
| Change in operating assets | | | 17,037 | | | (302) | | | – | | | 16,735 | |
| Change in operating liabilities | | | 15,593 | | | 2,418 | | | (16,530) | | | 1,481 | |
| Non-cash and other items | | | (16,804) | | | 30 | | | 16,530 | | | (244) | |
| Net tax paid | | | (743) | | | – | | | – | | | (743) | |
| Net cash provided by operating activities | | | 22,011 | | | – | | | – | | | 22,011 | |
| Cash flows from investing activities | | | | | | | | | |
| Purchase of financial assets | | | (7,984) | | | – | | | – | | | (7,984) | |
| Proceeds from sale and maturity of financial assets | | | 11,172 | | | – | | | – | | | 11,172 | |
| Purchase of fixed assets | | | (3,855) | | | – | | | – | | | (3,855) | |
| Proceeds from sale of fixed assets | | | 1,550 | | | – | | | – | | | 1,550 | |
| Repayment of capital by joint ventures and associates | | | 36 | | | – | | | – | | | 36 | |
| Acquisition of businesses, net of cash acquired | | | (409) | | | – | | | – | | | (409) | |
| | | | | | | | | |
| Net cash provided by investing activities | | | 510 | | | – | | | – | | | 510 | |
| Cash flows from financing activities | | | | | | | | | |
| Dividends paid to ordinary shareholders | | | (1,475) | | | – | | | – | | | (1,475) | |
| Distributions in respect of other equity instruments | | | (438) | | | – | | | – | | | (438) | |
| Distributions in respect of non-controlling interests | | | (92) | | | – | | | – | | | (92) | |
| Interest paid on subordinated liabilities | | | (603) | | | – | | | – | | | (603) | |
| Proceeds from issue of subordinated liabilities | | | 838 | | | – | | | – | | | 838 | |
| Proceeds from issue of other equity instruments | | | 745 | | | – | | | – | | | 745 | |
| Proceeds from issue of ordinary shares | | | 31 | | | – | | | – | | | 31 | |
| Share buyback | | | (2,013) | | | – | | | – | | | (2,013) | |
| Repayment of subordinated liabilities | | | (2,216) | | | – | | | – | | | (2,216) | |
| Repurchases and redemptions of other equity instruments | | | (1,395) | | | – | | | – | | | (1,395) | |
| Change in stake of non-controlling interests | | | 5 | | | – | | | – | | | 5 | |
| Net cash used in financing activities | | | (6,613) | | | – | | | – | | | (6,613) | |
| Effects of exchange rate changes on cash and cash equivalents | | | 727 | | | – | | | – | | | 727 | |
| Change in cash and cash equivalents | | | 16,635 | | | – | | | – | | | 16,635 | |
| Cash and cash equivalents at beginning of year | | | 79,194 | | | – | | | – | | | 79,194 | |
| Cash and cash equivalents at end of year | | | 95,829 | | | – | | | – | | | 95,829 | |
Note 55: Events since the balance sheet date
Share buyback
The Board has announced its intention to implement an ordinary share buyback of up to £2.0 billion. This represents the return to shareholders of capital, surplus to that required to provide capacity to grow the business, meet current and future regulatory requirements and cover uncertainties. The share buyback programme will commence as soon as is practicable and is expected to be completed, subject to continued authority from the PRA, by 31 December 2024.
| | | | | | | | |
F-128 | Lloyds Banking Group plc Annual Report on Form 20-F 2023 | |
Notes to the consolidated financial statements continued
for the year ended 31 December
Note 56: Parent company disclosures
(A) Company income statement
| | | | | | | | | | | | | | | | | |
| 2023 £m | | 2022 £m | | 2021 £m |
| Net interest expense | (497) | | | (346) | | | (176) | |
| Dividends from subsidiaries | 5,024 | | | 1,120 | | | 3,600 | |
| Other income | 743 | | | 770 | | | 633 | |
| Total income | 5,270 | | | 1,544 | | | 4,057 | |
| Operating expenses | (225) | | | (200) | | | (164) | |
| Impairment credit (charge) | 10 | | | (13) | | | – | |
| Profit before tax | 5,055 | | | 1,331 | | | 3,893 | |
| Tax credit | 84 | | | 68 | | | 12 | |
| Profit for the year | 5,139 | | | 1,399 | | | 3,905 | |
| | | | | |
| Profit attributable to ordinary shareholders | 4,612 | | | 961 | | | 3,476 | |
| Profit attributable to other equity holders | 527 | | | 438 | | | 429 | |
| Profit for the year | 5,139 | | | 1,399 | | | 3,905 | |
(B) Company balance sheet
| | | | | | | | | | | |
| 2023 £m | | 2022 £m |
| Assets | | | |
| Cash and cash equivalents | 17 | | | 48 | |
| Financial assets at fair value through profit or loss | 21,453 | | | 20,292 | |
| Derivative financial instruments | 552 | | | 1,197 | |
| Amounts due from subsidiaries | – | | | – | |
| Debt securities | 2,429 | | | 2,279 | |
| Loans to subsidiaries | 14,742 | | | 14,119 | |
| Investment in subsidiaries | 50,826 | | | 49,609 | |
| Current tax recoverable | 114 | | | 4 | |
| Deferred tax assets | 74 | | | 93 | |
| Other assets | 6 | | | – | |
| Total assets | 90,213 | | | 87,641 | |
| Liabilities | | | |
| Due to subsidiaries | 3 | | | 27 | |
| Financial liabilities at fair value through profit or loss | 18,473 | | | 13,865 | |
| Derivative financial instruments | 1,129 | | | 1,550 | |
| Debt securities in issue at amortised cost | 10,211 | | | 15,366 | |
| Other liabilities | 141 | | | 125 | |
| | | |
| Subordinated liabilities | 9,707 | | | 9,218 | |
| Total liabilities | 39,664 | | | 40,151 | |
| Equity | | | |
| Share capital | 6,358 | | | 6,729 | |
| Share premium account | 18,568 | | | 18,504 | |
| Merger reserve | 6,806 | | | 6,806 | |
| Capital redemption reserve | 5,370 | | | 4,932 | |
| Retained profits | 6,507 | | | 5,222 | |
| Shareholders’ equity | 43,609 | | | 42,193 | |
| Other equity instruments | 6,940 | | | 5,297 | |
| Total equity | 50,549 | | | 47,490 | |
| Total equity and liabilities | 90,213 | | | 87,641 | |
| | | | | | | | |
F-129 | Lloyds Banking Group plc Annual Report on Form 20-F 2023 | |
Notes to the consolidated financial statements continued
for the year ended 31 December
Note 56: Parent company disclosures continued
(C) Company statement of changes in equity
| | | | | | | | | | | | | | | | | | | | | | | | | | | | | | | | | | | | | | | | | | | | |
| | Attributable to ordinary shareholders | | | | |
| | Share
capital and
premium
£m | | Merger
reserve
£m | | Capital
redemption
reserve
£m | | Retained
profits
£m | | Total
£m | | Other
equity
instruments
£m | | Total
£m |
| At 1 January 2021 | | 24,947 | | | 7,420 | | | 4,462 | | | 4,869 | | | 41,698 | | | 5,906 | | | 47,604 | |
Total comprehensive income1 | | – | | | – | | | – | | | 3,476 | | | 3,476 | | | 429 | | | 3,905 | |
| Transactions with owners | | | | | | | | | | | | | | |
| Dividends | | – | | | – | | | – | | | (877) | | | (877) | | | – | | | (877) | |
| Distributions on other equity instruments | | – | | | – | | | – | | | – | | | – | | | (429) | | | (429) | |
| Issue of ordinary shares | | 37 | | | – | | | – | | | – | | | 37 | | | – | | | 37 | |
| | | | | | | | | | | | | | |
| Redemption of preference shares | | 597 | | | (614) | | | 17 | | | – | | | – | | | – | | | – | |
| | | | | | | | | | | | | | |
| | | | | | | | | | | | | | |
| Movement in treasury shares | | – | | | – | | | – | | | (24) | | | (24) | | | – | | | (24) | |
| Value of employee services: | | | | | | | | | | | | | | |
| Share option schemes | | – | | | – | | | – | | | 51 | | | 51 | | | – | | | 51 | |
| Other employee award schemes | | – | | | – | | | – | | | 131 | | | 131 | | | – | | | 131 | |
| Total transactions with owners | | 634 | | | (614) | | | 17 | | | (719) | | | (682) | | | (429) | | | (1,111) | |
| At 31 December 2021 | | 25,581 | | | 6,806 | | | 4,479 | | | 7,626 | | | 44,492 | | | 5,906 | | | 50,398 | |
Total comprehensive income1 | | – | | | – | | | – | | | 961 | | | 961 | | | 438 | | | 1,399 | |
| Transactions with owners | | | | | | | | | | | | | | |
| Dividends | | – | | | – | | | – | | | (1,475) | | | (1,475) | | | – | | | (1,475) | |
| Distributions on other equity instruments | | – | | | – | | | – | | | – | | | – | | | (438) | | | (438) | |
| Issue of ordinary shares | | 105 | | | – | | | – | | | – | | | 105 | | | – | | | 105 | |
| Share buyback | | (453) | | | – | | | 453 | | | (2,013) | | | (2,013) | | | – | | | (2,013) | |
| | | | | | | | | | | | | | |
| Issue of other equity instruments | | – | | | – | | | – | | | (5) | | | (5) | | | 750 | | | 745 | |
| Repurchase and redemptions of other equity instruments | | – | | | – | | | – | | | (37) | | | (37) | | | (1,359) | | | (1,396) | |
| Movement in treasury shares | | – | | | – | | | – | | | (59) | | | (59) | | | – | | | (59) | |
| Value of employee services: | | | | | | | | | | | | | | |
| Share option schemes | | – | | | – | | | – | | | 41 | | | 41 | | | – | | | 41 | |
| Other employee award schemes | | – | | | – | | | – | | | 183 | | | 183 | | | – | | | 183 | |
| Total transactions with owners | | (348) | | | – | | | 453 | | | (3,365) | | | (3,260) | | | (1,047) | | | (4,307) | |
| At 31 December 2022 | | 25,233 | | | 6,806 | | | 4,932 | | | 5,222 | | | 42,193 | | | 5,297 | | | 47,490 | |
Total comprehensive income1 | | – | | | – | | | – | | | 4,612 | | | 4,612 | | | 527 | | | 5,139 | |
| Transactions with owners | | | | | | | | | | | | | | |
| Dividends | | – | | | – | | | – | | | (1,651) | | | (1,651) | | | – | | | (1,651) | |
| Distributions on other equity instruments | | – | | | – | | | – | | | – | | | – | | | (527) | | | (527) | |
| Issue of ordinary shares | | 131 | | | – | | | – | | | – | | | 131 | | | – | | | 131 | |
| Share buyback | | (438) | | | – | | | 438 | | | (1,993) | | | (1,993) | | | – | | | (1,993) | |
| | | | | | | | | | | | | | |
| Issue of other equity instruments | | – | | | – | | | – | | | (13) | | | (13) | | | 1,778 | | | 1,765 | |
| Repurchase and redemptions of other equity instruments | | – | | | – | | | – | | | – | | | – | | | (135) | | | (135) | |
| Movement in treasury shares | | – | | | – | | | – | | | 103 | | | 103 | | | – | | | 103 | |
| Value of employee services: | | | | | | | | | | | | | | |
| Share option schemes | | – | | | – | | | – | | | 58 | | | 58 | | | – | | | 58 | |
| Other employee award schemes | | – | | | – | | | – | | | 169 | | | 169 | | | – | | | 169 | |
| Total transactions with owners | | (307) | | | – | | | 438 | | | (3,327) | | | (3,196) | | | 1,116 | | | (2,080) | |
| At 31 December 2023 | | 24,926 | | | 6,806 | | | 5,370 | | | 6,507 | | | 43,609 | | | 6,940 | | | 50,549 | |
1 Total comprehensive income comprises only the profit for the year.
| | | | | | | | |
F-130 | Lloyds Banking Group plc Annual Report on Form 20-F 2023 | |
Notes to the consolidated financial statements continued
for the year ended 31 December
Note 56: Parent company disclosures continued
(D) Company cash flow statement
| | | | | | | | | | | |
| 2023 £m | 2022 £m | 2021 £m |
| Cash flows from operating activities | | | |
| Profit before tax | 5,055 | | 1,331 | | 3,893 | |
| Adjustments for: | | | |
| Fair value and exchange adjustments and other non-cash items | 744 | | 21 | | 1,134 | |
| Change in other assets | (1,317) | | (177) | | (7,028) | |
| Change in other liabilities and other items | (555) | | 1,626 | | (3,322) | |
| Dividends received | (5,024) | | (1,120) | | (3,600) | |
| Distributions on other equity instruments received | (505) | | (338) | | (423) | |
| Tax received | 4 | | 27 | | 2 | |
| Net cash (used in) provided by operating activities | (1,598) | | 1,370 | | (9,344) | |
| Cash flows from investing activities | | | |
| Return of capital contribution | 1 | | 4 | | 4 | |
| Dividends received | 5,024 | | 1,120 | | 3,600 | |
| Distributions on other equity instruments received | 505 | | 338 | | 423 | |
| Acquisitions of and capital injections to subsidiaries | (1,496) | | (250) | | (3,209) | |
| Return of capital by subsidiaries | 278 | | – | | 4,130 | |
| Amounts advanced to subsidiaries | (4,563) | | (3,148) | | (974) | |
| Repayment of loans to subsidiaries | 3,556 | | 4,234 | | 6,727 | |
| Interest received on loans to subsidiaries | 410 | | 408 | | 461 | |
| | | |
| | | |
| Net cash provided by investing activities | 3,715 | | 2,706 | | 11,162 | |
| Cash flows from financing activities | | | |
| Dividends paid to ordinary shareholders | (1,651) | | (1,475) | | (877) | |
| Distributions on other equity instruments | (527) | | (438) | | (429) | |
| Interest paid on subordinated liabilities | (466) | | (370) | | (793) | |
| Proceeds from issue of subordinated liabilities | 1,416 | | 838 | | 499 | |
| Proceeds from issue of other equity instruments | 1,765 | | 745 | | – | |
| Proceeds from issue of ordinary shares | 86 | | 31 | | 25 | |
| Share buyback | (1,993) | | (2,013) | | – | |
| Repayment of subordinated liabilities | (643) | | – | | (200) | |
| Repurchase and redemptions of other equity instruments | (135) | | (1,396) | | – | |
| Net cash used in financing activities | (2,148) | | (4,078) | | (1,775) | |
| Change in cash and cash equivalents | (31) | | (2) | | 43 | |
| Cash and cash equivalents at beginning of year | 48 | | 50 | | 7 | |
| Cash and cash equivalents at end of year | 17 | | 48 | | 50 | |
(E) Interests in subsidiaries
The principal subsidiaries, all of which have prepared accounts to 31 December and whose results are included in the consolidated accounts of Lloyds Banking Group plc, are:
| | | | | | | | | | | |
| Name of subsidiary undertaking | Country of
registration/
incorporation | Percentage of equity
share capital and
voting rights held | Nature of business |
| Lloyds Bank plc | England | 100% | Banking and financial services |
| Scottish Widows Limited | England | 100%1 | Life assurance |
| HBOS plc | Scotland | 100%1 | Holding company |
| Bank of Scotland plc | Scotland | 100%1 | Banking and financial services |
| Lloyds Bank Corporate Markets plc | England | 100% | Banking and financial services |
| LBG Equity Investments Limited | England | 100% | Financial services |
1Indirect interest.
The principal area of operation for each of the above subsidiaries is the United Kingdom.
| | | | | | | | |
F-131 | Lloyds Banking Group plc Annual Report on Form 20-F 2023 | |
| | | | | |
| Term used | US equivalent or brief description |
| Accounts | Financial statements. |
| Articles of association | Articles and bylaws. |
| Associates | Long-term equity investments accounted for by the equity method. |
| Attributable profit | Net income. |
| Balance sheet | Statement of financial position. |
| Broking | Brokerage. |
| Building society | A building society is a mutual institution set up to lend money to its members for house purchases. See also ‘Demutualisation’. |
| Buy-to-let mortgages | Buy-to-let mortgages are those mortgages offered to customers purchasing residential property as a rental investment. |
| Called-up share capital | Ordinary shares, issued and fully paid. |
| Contract hire | Leasing. |
| Creditors | Payables. |
| Debtors | Receivables. |
| Deferred tax | Deferred income tax. |
| Demutualisation | Process by which a mutual institution is converted into a public limited company. |
| Endowment mortgage | An interest-only mortgage to be repaid by the proceeds of an endowment insurance policy which is assigned to the lender providing the mortgage. The sum insured, which is payable on maturity or upon the death of the policyholder, is used to repay the mortgage. |
| Finance lease | Capital lease. |
| Freehold | Ownership with absolute rights in perpetuity. |
| Leasehold | Land or property which is rented from the owner for a specified term under a lease. At the expiry of the term the land or property reverts back to the owner. |
| Lien | Under UK law, a right to retain possession pending payment. |
| Life assurance | Life insurance. |
| Loan capital | Long-term debt. |
| Members | Shareholders. |
| National Insurance | A form of taxation payable in the UK by employees, employers and the self-employed. It is part of the UK’s national social security system and ultimately controlled by HM Revenue & Customs. |
| Nominal value | Par value. |
| Open Ended Investment Company (OEIC) | Mutual fund. |
| Ordinary shares | Common stock. |
| Overdraft | A line of credit, contractually repayable on demand unless a fixed-term has been agreed, established through a customer’s current account. |
| Preference shares | Preferred stock. |
| Premises | Real estate. |
| Profit attributable to equity shareholders | Net income. |
| Provisions | Reserves. |
| Regular premium | Premiums which are payable throughout the duration of a policy or for some shorter fixed period. |
| Reinsurance | The insuring again by an insurer of the whole or part of a risk that it has already insured with another insurer called a reinsurer. |
| Retained profits | Retained earnings. |
| Share capital | Capital stock. |
| Shareholders’ equity | Stockholders’ equity. |
| Share premium account | Additional paid-in capital. |
| Shares in issue | Shares outstanding. |
| Single premium | A premium in relation to an insurance policy payable once at the commencement of the policy. |
| Specialist mortgages | Specialist mortgages include those mortgage loans provided to customers who have self-certified their income. New mortgage lending of this type has not been offered by the Group since early 2009. |
| Undistributable reserves | Restricted surplus. |
| Write-offs | Charge-offs. |
| | | | | | | | |
184 | Lloyds Banking Group plc Annual Report on Form 20-F 2023 | |
Form 20-F cross reference sheet
| | | | | | | | | | | | | | |
| Form 20-F Item Number and Caption | Location | Page |
| Part I | | | | |
| Item 1. | Identity of Directors, Senior Management and Advisers | Not applicable. | |
| Item 2. | Offer Statistics and Expected Timetable | Not applicable. | |
| Item 3. | Key Information | | |
| A. | Reserved by the Securities and Exchange Commission | Not applicable. | |
| B. | Capitalisation and indebtedness | Not applicable. | |
| C. | Reason for the offer and use of proceeds | Not applicable. | |
| D. | Risk factors | “Risk factors” | |
| Item 4. | Information on the Company | | |
| A. | History and development of the company | “Business overview” | |
| | | “Business – History and development of Lloyds Banking Group” | |
| | | “Regulation” | |
| | | “Where you can find more information” | |
| B. | Business overview | “Business overview” | |
| | | “Business – Legal actions and regulatory matters” | |
| | | “Business – Competitive Environment” | |
| | | “Business – Recent developments” | |
| | | “Operating and financial review and prospects – Divisional information” | |
| | | “Operating and financial review and prospects” | |
| | | “Corporate Governance – Board oversight” | |
| | | “Regulation” | |
| C. | Organisational structure | “Lloyds Banking Group structure” | |
| D. | Property, plant and equipment | Not applicable. | |
| Item 4A. | Unresolved Staff Comments | Not applicable. | |
| Item 5. | Operating and Financial Review and Prospects | | |
| A. | Operating results | “Operating and financial review and prospects” | |
| | | “Operating and financial review and prospects – Market Risk” | |
| | | “Regulation” | |
| B. | Liquidity and capital resources | “Operating and financial review and prospects – Capital risk” | |
| | | “Operating and financial review and prospects – Funding and Liquidity Risk” | |
| | | “Operating and financial review and prospects – Investment portfolio, maturities, deposits” | |
| | | “Dividends” | |
| | | “Notes to the consolidated financial statements – note 48” | |
| C. | Research and development, patents and licenses, etc. | Not applicable. | |
| D. | Trend information | “Operating and financial review and prospects – Overview and trend information” | |
| E. | Critical accounting estimates | “Operating and financial review and prospects – Critical accounting judgements and key sources of estimation uncertainty” | |
| | | “Notes to the consolidated financial statements – note 3” | |
| | | “Notes to the consolidated financial statements – note 24” | |
| | | | | | | | |
185 | Lloyds Banking Group plc Annual Report on Form 20-F 2023 | |
Form 20-F cross reference sheet continued
| | | | | | | | | | | | | | |
| Form 20-F Item Number and Caption | Location | Page |
| Item 6. | Directors, Senior Management and Employees | | |
| A. | Directors and senior management | “Management and employees – Directors and senior management” | |
| B. | Compensation | “Compensation” | |
| | | “Notes to the consolidated financial statements – note 14” | |
| | | “Notes to the consolidated financial statements – note 15” | |
| C. | Board practices | “Management and employees” | |
| | | “Compensation – Annual report on remuneration – Remuneration Committee” | |
| | | “Corporate governance – Board Leadership and Company Purpose” | 130–144 |
| | | “Corporate governance – Audit Committee report” | |
| | | “Articles of association of Lloyds Banking Group plc” | |
| D. | Employees | “Management and employees – Employees” | |
| E. | Share ownership | “Compensation – Directors’ share interests and share awards” | |
| | | “Notes to the consolidated financial statements – note 2 – employee benefits” | F-21 |
| F. | Disclosure of a registrant’s action to recover erroneously awarded compensation | Not applicable. | |
| Item 7. | Major Shareholders and Related Party Transactions | | |
| A. | Major shareholders | “Major shareholders and related party transactions – Major shareholders” | |
| B. | Related party transactions | “Major shareholders and related party transactions – Related party transactions” | |
| | | “Notes to the consolidated financial statements – note 47” | |
| C. | Interests of experts and counsel | Not applicable. | |
| Item 8. | Financial Information | | |
| A. | Consolidated statements and other financial information | “Report of Independent Registered Public Accounting Firm” | |
| | “Consolidated financial statements” | |
| | | “Notes to the consolidated financial statements” | |
| | | “Business – Legal actions and regulatory matters” | |
| | | “Operating and financial review and prospects” | |
| | | “Dividends” | |
| B. | Significant changes | Not Applicable | |
| Item 9. | The Offer and Listing | | |
| A. | Offer and listing details | “Listing information” | |
| B. | Plan of distribution | Not applicable. | |
| C. | Markets | “Listing information” | |
| D. | Selling shareholders | Not applicable. | |
| E. | Dilution | Not applicable. | |
| F. | Expenses of the issue | Not applicable. | |
| Item 10. | Additional Information | | |
| A. | Share capital | Not applicable. | |
| B. | Memorandum and articles of association | “Articles of association of Lloyds Banking Group plc” | |
| C. | Material contracts | “Business – Material contracts” | |
| D. | Exchange controls | “Exchange controls” | |
| E. | Taxation | “Taxation” | |
| F. | Dividends and paying agents | Not applicable. | |
| G. | Statements by experts | Not applicable. | |
| H. | Documents on display | “Where you can find more information” | |
| I. | Subsidiary information | “Lloyds Banking Group structure” | |
| J. | Annual report to security holders | To be filed as exhibit to Form 6-K | |
| | | | | | | | |
186 | Lloyds Banking Group plc Annual Report on Form 20-F 2023 | |
Form 20-F cross reference sheet continued
| | | | | | | | | | | | | | |
| Form 20-F Item Number and Caption | Location | Page |
| Item 11. | Quantitative and Qualitative Disclosures about Market Risk | “Operating and financial review and prospects – Credit risk” | |
| “Operating and financial review and prospects – Market risk” | |
| | | “Notes to the consolidated financial statements – note 52” | |
| Item 12. | Description of Securities Other than Equity Securities | | |
| A. | Debt securities | Not applicable. | |
| B. | Warrants and rights | Not applicable. | |
| C. | Other securities | Not applicable. | |
| D. | American Depositary Shares | “Listing information – ADR fees” | |
| Part II | | | | |
| Item 13. | Defaults, Dividends Arrearages and Delinquencies | Not applicable. | |
| Item 14. | Material Modifications to the Rights of Security Holders and Use of Proceeds | Not applicable. | |
| Item 15. | Controls and Procedures | “Corporate governance” | |
| | | “Report of Independent Registered Public Accounting Firm” | |
| Item 16. | Reserved by the Securities and Exchange Commission | Not applicable. | |
| Item 16A. | Audit committee financial expert | “Corporate governance – Audit Committee report” | |
| Item 16B. | Code of ethics | “Management and employees – Employees” | |
| Item 16C. | Principal accountant fees and services | “Corporate governance – Audit Committee report – Other significant issues – Auditor independence and remuneration” | |
| | | “Notes to the consolidated financial statements – note 17” | |
| Item 16D. | Exemptions from the listing standards for audit committees | Not applicable. | |
| Item 16E. | Purchases of equity securities by the issuer and affiliated purchasers | Not applicable. | |
| Item 16F. | Change in registrant’s certifying accountant | Not applicable. | |
| Item 16G. | Corporate governance | “Corporate governance – Statement on US corporate governance standards” | |
| Item 16H. | Mine safety disclosure | Not applicable. | |
| Item 16I. | Disclosure regarding foreign jurisdictions that prevent inspections | Not applicable. | |
| Item 16J. | Insider trading policies | Not applicable. | |
| Item 16K. | Cybersecurity | “Operating and financial review and prospects - Operational risk and operational resilience risk” | |
| Part III | | | | |
| Item 17. | Financial statements | See response to item 18. | |
| Item 18. | Financial statements | “Report of Independent Registered Public Accounting Firm” | |
| | | “Consolidated financial statements” | |
| | | “Notes to the consolidated financial statements” | |
| Item 19. | Exhibits | See “Exhibit index” | |
| | | | | | | | |
187 | Lloyds Banking Group plc Annual Report on Form 20-F 2023 | |
| | | | | | | | | | | |
| 1 | |
| 2 | Neither Lloyds Banking Group plc nor any subsidiary is party to any single long-term debt instrument pursuant to which a total amount of securities exceeding 10 per cent of the Group’s total assets (on a consolidated basis) is authorised to be issued. Lloyds Banking Group plc hereby agrees to furnish to the Securities and Exchange Commission (the Commission), upon its request, a copy of any instrument defining the rights of holders of its long-term debt or the rights of holders of the long-term debt issued by it or any subsidiary for which consolidated or unconsolidated financial statements are required to be filed with the Commission. |
| 2 | (d) | |
| | | |
| | | |
| | | |
| | | |
| | | |
| 4 | (b) | (i) | |
| | (ii) | |
| | (iii) | |
| | (iv) | |
| | (v) | |
| | (vi) | |
| | (vii) | |
| | (viii) | |
| | (ix) | |
| | (x) | |
| | (xi) | |
| | (xii) | |
| | (xiii) | |
| | (xiv) | |
| | (xv) | |
| | (xvi) | |
| | (xvii) | |
| | (xviii) | |
| | (xix) | |
| | (xx) | |
| 8.1 | | |
| 12.1 | | |
| 12.2 | | |
| 13.1 | | |
| 15.1 | | |
| 97 | | |
| | | |
| | |
1 | Previously filed with the SEC on Lloyds Banking Group’s Form 20-F filed 12 March 2015. |
2 | Previously filed with the SEC on Lloyds Banking Group’s Form 20-F filed 9 March 2018. |
3 | Previously filed with the SEC on Lloyds Banking Group’s Form 20-F filed 25 February 2019. |
4 | Previously filed with the SEC on Lloyds Banking Group’s Form 20-F filed 25 February 2020. |
5 | Previously filed with the SEC on Lloyds Banking Group’s Form 20-F filed 26 February 2021. |
6 | Previously filed with the SEC on Lloyds Banking Group’s Form 20-F filed 28 February 2022. |
7 | Previously filed with the SEC on Lloyds Banking Group’s Form 20-F filed 24 February 2023. |
| | | | | | | | |
188 | Lloyds Banking Group plc Annual Report on Form 20-F 2023 | |
The registrant hereby certifies that it meets all of the requirements for filing on Form 20-F and that it has duly caused and authorised the undersigned to sign this annual report on its behalf.
| | | | | | | | |
| Lloyds Banking Group plc |
| By: | /s/ William Chalmers |
| | |
| Name: | William Chalmers |
| Title: | Chief Financial Officer |
| Dated: | 22 February 2024 |
| | | | | | | | |
189 | Lloyds Banking Group plc Annual Report on Form 20-F 2023 | |