Table of Contents
SECURITIES AND EXCHANGE COMMISSION
Washington, DC 20549
FORM 6-K
REPORT OF FOREIGN PRIVATE ISSUER
PURSUANT TO RULE 13a-16 OR 15d-16 OF
THE SECURITIES EXCHANGE ACT OF 1934
PURSUANT TO RULE 13a-16 OR 15d-16 OF
THE SECURITIES EXCHANGE ACT OF 1934
From: August 12, 2011
IVANHOE MINES LTD.
(Translation of Registrant’s Name into English)
Suite 654 — 999 CANADA PLACE, VANCOUVER, BRITISH COLUMBIA V6C 3E1
(Address of Principal Executive Offices)
(Indicate by check mark whether the registrant files or will file annual reports under cover of
Form 20-F or Form 40-F.)
Form 20-F- o Form 40-F- þ
(Indicate by check mark whether the registrant by furnishing the information contained in this form
is also thereby furnishing the information to the Commission pursuant to Rule 12g3-2(b) under the
Securities Exchange Act of 1934.)
Yes: o No: þ
(If “Yes” is marked, indicate below the file number assigned to the registrant in connection with
Rule 12g3-2(b):
82-_____.)
Enclosed:
Q2-2011 Financial Statement
Q2-2011 MD&A
CEO Certification
CFO Certification
Q2-2011 MD&A
CEO Certification
CFO Certification
Table of Contents

SECOND QUARTER REPORT
JUNE 30, 2011
JUNE 30, 2011
TABLE OF CONTENTS
2
Table of Contents
IVANHOE MINES LTD.
Consolidated Balance Sheets
(Stated in thousands of U.S. dollars)
(Unaudited)
(Unaudited)
| June 30, | December 31, | |||||||
| 2011 | 2010 | |||||||
ASSETS |
||||||||
CURRENT |
||||||||
Cash and cash equivalents (Note 4) |
$ | 1,575,079 | $ | 1,264,031 | ||||
Short-term investments (Note 5) |
15,003 | 98,373 | ||||||
Accounts receivable |
100,267 | 65,741 | ||||||
Inventories (Note 6) |
70,354 | 40,564 | ||||||
Prepaid expenses |
42,973 | 23,338 | ||||||
TOTAL CURRENT ASSETS |
1,803,676 | 1,492,047 | ||||||
LONG-TERM INVESTMENTS (Note 7) |
191,903 | 151,191 | ||||||
OTHER LONG-TERM INVESTMENTS (Note 8) |
306,121 | 191,816 | ||||||
PROPERTY, PLANT AND EQUIPMENT (Note 9) |
2,622,091 | 1,332,648 | ||||||
DEFERRED INCOME TAXES |
30,324 | 16,889 | ||||||
OTHER ASSETS |
42,261 | 33,883 | ||||||
TOTAL ASSETS |
$ | 4,996,376 | $ | 3,218,474 | ||||
LIABILITIES |
||||||||
CURRENT |
||||||||
Accounts payable and accrued liabilities |
$ | 393,274 | $ | 260,528 | ||||
Amounts due under credit facilities (Note 10) |
16,316 | 14,615 | ||||||
Interest payable on long-term debt (Note 11) |
4,285 | 6,312 | ||||||
Rights offering derivative liability (Note 12 (c)) |
— | 766,238 | ||||||
TOTAL CURRENT LIABILITIES |
413,875 | 1,047,693 | ||||||
CONVERTIBLE CREDIT FACILITY (Note 11) |
214,670 | 248,284 | ||||||
AMOUNTS DUE UNDER CREDIT FACILITIES (Note 10) |
41,520 | 40,080 | ||||||
PAYABLE TO RELATED PARTY |
31,724 | 14,013 | ||||||
DEFERRED INCOME TAXES |
10,985 | 11,123 | ||||||
ASSET RETIREMENT OBLIGATIONS |
43,296 | 40,838 | ||||||
TOTAL LIABILITIES |
756,070 | 1,402,031 | ||||||
CONTINGENCIES (Note 19) |
||||||||
EQUITY |
||||||||
SHARE CAPITAL (Note 12) |
||||||||
Authorized |
||||||||
Unlimited number of preferred shares without par value |
||||||||
Unlimited number of common shares without par value |
||||||||
Issued and outstanding |
||||||||
710,279,903 (2010 - 568,560,669) common shares |
6,261,950 | 3,378,921 | ||||||
SHARE PURCHASE WARRANTS (Note 12 (b)) |
— | 11,832 | ||||||
ADDITIONAL PAID-IN CAPITAL |
1,357,839 | 1,303,581 | ||||||
ACCUMULATED OTHER COMPREHENSIVE INCOME (Note 13) |
23,923 | 33,075 | ||||||
DEFICIT |
(3,405,472 | ) | (2,913,576 | ) | ||||
TOTAL IVANHOE MINES LTD. SHAREHOLDERS’ EQUITY |
4,238,240 | 1,813,833 | ||||||
NONCONTROLLING INTERESTS (Note 14) |
2,066 | 2,610 | ||||||
TOTAL EQUITY |
4,240,306 | 1,816,443 | ||||||
TOTAL LIABILITIES AND EQUITY |
$ | 4,996,376 | $ | 3,218,474 | ||||
APPROVED BY THE BOARD: |
||||
/s/ D. Korbin
|
/s/ L. Mahler
|
The accompanying notes are an integral part of these consolidated financial statements.
3
Table of Contents
IVANHOE MINES LTD.
Consolidated Statements of Operations
(Stated in thousands of U.S. dollars, except for share and per share amounts)
(Unaudited)
(Unaudited)
| Three Months Ended June 30, | Six Months Ended June 30, | |||||||||||||||
| 2011 | 2010 | 2011 | 2010 | |||||||||||||
REVENUE |
$ | 47,336 | $ | 17,668 | $ | 67,494 | $ | 31,585 | ||||||||
COST OF SALES |
||||||||||||||||
Production and delivery |
(31,416 | ) | (10,901 | ) | (43,574 | ) | (22,098 | ) | ||||||||
Depreciation and depletion |
(7,731 | ) | (2,304 | ) | (10,530 | ) | (4,827 | ) | ||||||||
Write-down of carrying value of inventory |
(10,557 | ) | — | (15,875 | ) | (6,535 | ) | |||||||||
COST OF SALES |
(49,704 | ) | (13,205 | ) | (69,979 | ) | (33,460 | ) | ||||||||
EXPENSES |
||||||||||||||||
Exploration (Note 2 and 12 (a)) |
(68,579 | ) | (39,483 | ) | (114,802 | ) | (110,906 | ) | ||||||||
General and administrative (Note 12 (a)) |
(19,483 | ) | (14,730 | ) | (44,761 | ) | (23,047 | ) | ||||||||
Depreciation |
(703 | ) | (354 | ) | (1,215 | ) | (1,270 | ) | ||||||||
Accretion of asset retirement obligations |
(172 | ) | (48 | ) | (334 | ) | (91 | ) | ||||||||
TOTAL EXPENSES |
(138,641 | ) | (67,820 | ) | (231,091 | ) | (168,774 | ) | ||||||||
OPERATING LOSS |
(91,305 | ) | (50,152 | ) | (163,597 | ) | (137,189 | ) | ||||||||
OTHER INCOME (EXPENSES) |
||||||||||||||||
Interest income |
4,913 | 2,538 | 10,051 | 7,167 | ||||||||||||
Interest expense |
(3,336 | ) | (8,278 | ) | (7,683 | ) | (21,677 | ) | ||||||||
Accretion of convertible credit facilities (Note 11) |
(14 | ) | (4,535 | ) | (28 | ) | (8,662 | ) | ||||||||
Foreign exchange gains (losses) |
2,254 | (4,859 | ) | 5,403 | (3,189 | ) | ||||||||||
Unrealized gains (losses) on long-term investments (Note 7 (d)) |
3,453 | (4,509 | ) | (309 | ) | (5,212 | ) | |||||||||
Unrealized gains on other long-term investments |
1,007 | 789 | 1,395 | 1,509 | ||||||||||||
Realized gain on redemption of other long-term investments (Note 8 (a)) |
65 | 26 | 98 | 87 | ||||||||||||
Change in fair value of derivative (Note 12 (c)) |
— | — | (432,536 | ) | — | |||||||||||
Change in fair value of embedded derivatives (Note 11) |
70,422 | 72,233 | 33,641 | 70,861 | ||||||||||||
Loss on conversion of convertible credit facility (Note 11) |
— | — | — | (154,316 | ) | |||||||||||
Write-down of carrying value of long-term investments |
— | (161 | ) | — | (417 | ) | ||||||||||
Gain on sale of long-term investment (Note 7 (e)) |
— | — | 10,628 | — | ||||||||||||
(LOSS) INCOME BEFORE INCOME TAXES AND OTHER ITEMS |
(12,541 | ) | 3,092 | (542,937 | ) | (251,038 | ) | |||||||||
(Provision) recovery of income taxes |
(4,283 | ) | (1,308 | ) | 8,615 | 2,174 | ||||||||||
Share of income (loss) of significantly influenced investees (Note 7) |
44,844 | (13,151 | ) | 41,130 | (23,210 | ) | ||||||||||
NET INCOME (LOSS) FROM CONTINUING OPERATIONS |
28,020 | (11,367 | ) | (493,192 | ) | (272,074 | ) | |||||||||
INCOME FROM DISCONTINUED OPERATIONS (Note 3) |
— | — | — | 6,585 | ||||||||||||
NET INCOME (LOSS) |
28,020 | (11,367 | ) | (493,192 | ) | (265,489 | ) | |||||||||
NET (INCOME) LOSS ATTRIBUTABLE TO
NONCONTROLLING INTERESTS (Note 14) |
(27,416 | ) | (18,664 | ) | 1,296 | 41,593 | ||||||||||
NET INCOME (LOSS) ATTRIBUTABLE TO IVANHOE MINES LTD. |
$ | 604 | $ | (30,031 | ) | $ | (491,896 | ) | $ | (223,896 | ) | |||||
BASIC EARNINGS (LOSS) PER SHARE ATTRIBUTABLE
TO IVANHOE MINES LTD. FROM CONTINUING OPERATIONS |
$ | — | $ | (0.06 | ) | $ | (0.77 | ) | $ | (0.50 | ) | |||||
DISCONTINUED OPERATIONS |
— | — | — | 0.01 | ||||||||||||
| $ | — | $ | (0.06 | ) | $ | (0.77 | ) | $ | (0.49 | ) | ||||||
DILUTED EARNINGS (LOSS) PER SHARE ATTRIBUTABLE
TO IVANHOE MINES LTD. FROM CONTINUING OPERATIONS |
$ | — | $ | (0.06 | ) | $ | (0.77 | ) | $ | (0.50 | ) | |||||
DISCONTINUED OPERATIONS |
— | — | — | 0.01 | ||||||||||||
| $ | — | $ | (0.06 | ) | $ | (0.77 | ) | $ | (0.49 | ) | ||||||
WEIGHTED AVERAGE NUMBER OF
SHARES OUTSTANDING (000’s) (Note 1 (f)) |
||||||||||||||||
BASIC |
660,414 | 466,451 | 640,588 | 459,107 | ||||||||||||
DILUTED |
700,650 | 466,451 | 640,588 | 459,107 | ||||||||||||
The accompanying notes are an integral part of these consolidated financial statements.
4
Table of Contents
IVANHOE MINES LTD.
Consolidated Statements of Equity
(Stated in thousands of U.S. dollars, except for share amounts)
(Unaudited)
(Unaudited)
| Accumulated | ||||||||||||||||||||||||||||||||
| Share Capital | Additional | Other | ||||||||||||||||||||||||||||||
| Number | Share Purchase | Paid-In | Comprehensive | Noncontrolling | ||||||||||||||||||||||||||||
| of Shares | Amount | Warrants | Capital | Income | Deficit | Interests | Total | |||||||||||||||||||||||||
Balances, December 31, 2010 |
568,560,669 | $ | 3,378,921 | $ | 11,832 | $ | 1,303,581 | $ | 33,075 | $ | (2,913,576 | ) | $ | 2,610 | $ | 1,816,443 | ||||||||||||||||
Net loss |
— | — | — | — | — | (491,896 | ) | (1,296 | ) | (493,192 | ) | |||||||||||||||||||||
Other comprehensive income (Note 13) |
— | — | — | — | (9,152 | ) | — | 5,731 | (3,421 | ) | ||||||||||||||||||||||
Comprehensive loss |
(496,613 | ) | ||||||||||||||||||||||||||||||
Shares issued for: |
||||||||||||||||||||||||||||||||
Exercise of stock options |
1,712,740 | 23,979 | — | (9,855 | ) | — | — | — | 14,124 | |||||||||||||||||||||||
Rights Offering (Note 12 (c)), net of issue costs
of $27,311 |
84,867,671 | 2,346,277 | — | 5,711 | — | — | — | 2,351,988 | ||||||||||||||||||||||||
Exercise of share purchase warrants (Note 12
(b)), net of issue costs of $1,065 |
55,122,253 | 512,347 | (11,832 | ) | — | — | — | — | 500,515 | |||||||||||||||||||||||
Bonus shares |
4,527 | 120 | — | 4,090 | — | — | — | 4,210 | ||||||||||||||||||||||||
Share purchase plan |
12,043 | 306 | — | — | — | — | — | 306 | ||||||||||||||||||||||||
Other increase in noncontrolling interests (Note 14) |
— | — | — | — | — | — | (4,979 | ) | (4,979 | ) | ||||||||||||||||||||||
Dilution losses |
— | — | — | (4,555 | ) | — | — | — | (4,555 | ) | ||||||||||||||||||||||
Stock-based compensation |
— | — | — | 58,867 | — | — | — | 58,867 | ||||||||||||||||||||||||
Balances, June 30, 2011 |
710,279,903 | $ | 6,261,950 | $ | — | $ | 1,357,839 | $ | 23,923 | $ | (3,405,472 | ) | $ | 2,066 | $ | 4,240,306 | ||||||||||||||||
The accompanying notes are an integral part of these consolidated financial statements.
5
Table of Contents
IVANHOE MINES LTD.
Consolidated Statements of Cash Flows
(Stated in thousands of U.S. dollars)
(Unaudited)
(Unaudited)
| Three Months Ended June 30, | Six Months Ended June 30, | |||||||||||||||
| 2011 | 2010 | 2011 | 2010 | |||||||||||||
OPERATING ACTIVITIES |
||||||||||||||||
Cash used in operating activities (Note 15) |
$ | (119,356 | ) | $ | (39,052 | ) | $ | (186,045 | ) | $ | (99,135 | ) | ||||
INVESTING ACTIVITIES |
||||||||||||||||
Proceeds from sale of discontinued operations |
— | 6,442 | — | 6,442 | ||||||||||||
Purchase of short-term investments |
— | — | (20,657 | ) | — | |||||||||||
Purchase of long-term investments |
— | (7,322 | ) | (8,537 | ) | (13,025 | ) | |||||||||
Purchase of other long-term investments |
(100,000 | ) | (50,000 | ) | (145,000 | ) | (80,000 | ) | ||||||||
Proceeds from redemption of short-term investments |
23,148 | — | 103,991 | 15,000 | ||||||||||||
Proceeds from sale of long-term investments |
— | — | 14,000 | 1,800 | ||||||||||||
Proceeds from redemption of other long-term investments |
121 | 42 | 30,181 | 144 | ||||||||||||
Expenditures on property, plant and equipment |
(601,565 | ) | (168,407 | ) | (1,130,269 | ) | (207,855 | ) | ||||||||
Expenditures on (proceeds from) other assets |
(1,452 | ) | 38 | (12,695 | ) | (47 | ) | |||||||||
Cash used in investing activities |
(679,748 | ) | (219,207 | ) | (1,168,986 | ) | (277,541 | ) | ||||||||
FINANCING ACTIVITIES |
||||||||||||||||
Issue of share capital |
512,042 | 394,599 | 1,668,160 | 446,138 | ||||||||||||
Proceeds from (repayment of) credit facilities |
(3,061 | ) | (349 | ) | 1,547 | (431 | ) | |||||||||
Noncontrolling interests’ reduction of investment in subsidiaries |
(9,449 | ) | — | (18,233 | ) | — | ||||||||||
Noncontrolling interests’ investment in subsidiaries |
709 | 929 | 4,689 | 421,141 | ||||||||||||
Cash provided by financing activities |
500,241 | 395,179 | 1,656,163 | 866,848 | ||||||||||||
EFFECT OF EXCHANGE RATE CHANGES ON CASH |
6,130 | (6,090 | ) | 9,916 | (1,520 | ) | ||||||||||
NET CASH (OUTFLOW) INFLOW |
(292,733 | ) | 130,830 | 311,048 | 488,652 | |||||||||||
CASH AND CASH EQUIVALENTS, BEGINNING OF PERIOD |
1,867,812 | 1,323,645 | 1,264,031 | 965,823 | ||||||||||||
CASH AND CASH EQUIVALENTS, END OF PERIOD |
$ | 1,575,079 | $ | 1,454,475 | $ | 1,575,079 | $ | 1,454,475 | ||||||||
CASH AND CASH EQUIVALENTS IS COMPRISED OF: |
||||||||||||||||
Cash on hand and demand deposits |
$ | 521,463 | $ | 726,510 | $ | 521,463 | $ | 726,510 | ||||||||
Short-term money market instruments |
1,053,616 | 727,965 | 1,053,616 | 727,965 | ||||||||||||
| $ | 1,575,079 | $ | 1,454,475 | $ | 1,575,079 | $ | 1,454,475 | |||||||||
Supplementary cash flow information (Note 15)
The accompanying notes are an integral part of these consolidated financial statements.
6
Table of Contents
IVANHOE MINES LTD.
Notes to the Consolidated Financial Statements
(Stated in U.S. dollars unless otherwise noted; tabular amounts in thousands)
| 1. | SIGNIFICANT ACCOUNTING POLICIES |
| (a) | Basis of preparation |
These unaudited interim consolidated financial statements have been prepared in
accordance with accounting principles generally accepted in the United States of
America (“U.S. GAAP”). The accounting policies followed in preparing these
consolidated financial statements are those used by Ivanhoe Mines Ltd. (the “Company”)
as set out in the audited consolidated financial statements for the year ended December
31, 2010.
Certain information and note disclosures normally included for annual consolidated
financial statements prepared in accordance with U.S. GAAP have been omitted. These
interim consolidated financial statements should be read together with the audited
consolidated financial statements of the Company for the year ended December 31, 2010.
In the opinion of management, all adjustments considered necessary (including
reclassifications and normal recurring adjustments) to present fairly the financial
position, results of operations and cash flows at June 30, 2011 and for all periods
presented, have been included in these financial statements. The interim results are
not necessarily indicative of results for the full year ending December 31, 2011, or
future operating periods. For further information, see the Company’s annual
consolidated financial statements, including the accounting policies and notes thereto.
The Company has three operating segments, its development division located in Mongolia,
its coal division located in Mongolia, and its exploration division with projects
located primarily in Australia and Mongolia.
References to “Cdn$” refer to Canadian currency, “Aud$” to Australian currency, and “$”
to United States currency.
| (b) | Basis of presentation |
||
For purposes of these consolidated financial statements, the Company, subsidiaries of
the Company, and variable interest entities for which the Company is the primary
beneficiary, are collectively referred to as “Ivanhoe Mines”. |
|||
| (c) | Comparative figures |
||
In February 2011, the Company completed a rights offering which was open to all
shareholders on a dilution free, equal participation bases at a subscription price less
than the fair value of a common share of the Company (Note 12 (c)). In accordance with
the Financial Accounting Standards Board Accounting Standards Codification (“ASC”)
guidance for earnings per share, basic and diluted loss per share for all periods prior
to the rights offering have been adjusted retroactively for a bonus element contained
in the rights offering. Specifically, the weighted average number of common shares
outstanding used to compute basic and diluted loss per share for the three and six
months ended June 30, 2010 has been multiplied by a factor of 1.06. |
7
Table of Contents
IVANHOE MINES LTD.
Notes to the Consolidated Financial Statements
(Stated in U.S. dollars unless otherwise noted; tabular amounts in thousands)
| 1. | SIGNIFICANT ACCOUNTING POLICIES (Continued) |
| (d) | Accounting changes |
| • | In January 2010, the ASC guidance for fair value measurements and disclosures
was updated to require additional disclosures related to transfers in and out of
level 1 and 2 fair value measurements and enhanced detail in the level 3
reconciliation. The updated guidance clarified the level of disaggregation
required for assets and liabilities and the disclosures required for inputs and
valuation techniques to be used to measure the fair value of assets and
liabilities that fall in either level 2 or level 3. The updated guidance was
effective for the Company’s fiscal year beginning January 1, 2010, except for the
level 3 disaggregation which is effective for the Company’s fiscal year beginning
January 1, 2011. The adoption of the updated guidance had no impact on the
Company’s consolidated financial position, results of operations or cash flows. |
| • | In December 2010, the ASC guidance for business combinations was updated to
clarify existing guidance requiring a public entity to disclose pro forma revenue
and earnings of the combined entity as though the business combination(s) that
occurred during the current year had occurred as of the beginning of the
comparable prior annual period only. The update also expands the supplemental pro
forma disclosures required to include a description of the nature and amount of
material, nonrecurring pro forma adjustments directly attributable to the business
combination included in the reported pro forma revenue and earnings. The updated
guidance was effective for the Company’s fiscal year beginning January 1, 2011.
The adoption of the updated guidance had no impact on the Company’s consolidated
financial position, results of operations or cash flows. |
| (e) | Recent Accounting Pronouncements |
| • | In May 2011, the ASC guidance for fair value measurement and disclosure was
updated to clarify the Financial Accounting Standards Board’s intent on current
guidance, modify and change certain guidance and principles, and expand
disclosures concerning Level 3 fair value measurements in the fair value hierarchy
(including quantitative information about significant unobservable inputs within
Level 3 of the fair value hierarchy). In addition, the updated guidance requires
disclosure of the fair value hierarchy for assets and liabilities not measured at
fair value in the statement of financial position, but whose fair value is
required to be disclosed. The updated guidance is effective for the Company’s
fiscal year beginning January 1, 2012. The Company does not expect the updated
guidance to have a material impact on its financial position or results of
operations. |
8
Table of Contents
IVANHOE MINES LTD.
Notes to the Consolidated Financial Statements
(Stated in U.S. dollars unless otherwise noted; tabular amounts in thousands)
| 1. | SIGNIFICANT ACCOUNTING POLICIES (Continued) |
| (e) | Recent Accounting Pronouncements (continued) |
| • | In June 2011, the ASC guidance on presentation of comprehensive income was
updated to improve the comparability, consistency and transparency of financial
reporting and to increase the prominence of items reported in other comprehensive
income. The updated guidance requires an entity to present the components of net
income and other comprehensive income either in a single continuous statement of
comprehensive income or in two separate but consecutive statements. This update
eliminates the option to present the components of other comprehensive income as
part of the statement of equity, but does not change the items that must be
reported in other comprehensive income. The updated guidance is effective for the
Company’s fiscal year beginning January 1, 2012. The Company is in the process of
assessing which presentation choice it will adopt. |
| (f) | Earnings (loss) per share |
||
The following table reconciles the numerators and the denominators of the basic and
diluted earnings (loss) per share computations for net income from continuing
operations: |
| Three Months Ended | Six Months Ended | |||||||||||||||
| June 30, | June 30, | |||||||||||||||
| 2011 | 2010 | 2011 | 2010 | |||||||||||||
Net income (loss) attributable to Ivanhoe
Mines Ltd. from continuing operations |
$ | 604 | $ | (30,031 | ) | $ | (497,896 | ) | $ | (230,481 | ) | |||||
Effect of dilutive securities |
||||||||||||||||
None |
— | — | — | — | ||||||||||||
Adjusted net income (loss) attributable to Ivanhoe
Mines Ltd. From continuing operations |
$ | 604 | $ | (30,031 | ) | $ | (497,896 | ) | $ | (230,481 | ) | |||||
Basic weighted average number of shares
outstanding |
660,414 | 466,451 | 640,588 | 459,107 | ||||||||||||
Effect of dilutive securities |
||||||||||||||||
Share purchase warrants |
31,586 | — | — | — | ||||||||||||
Stock options |
8,473 | — | — | — | ||||||||||||
Bonus shares |
177 | — | — | — | ||||||||||||
| 700,650 | 466,451 | 640,588 | 459,107 | |||||||||||||
9
Table of Contents
IVANHOE MINES LTD.
Notes to the Consolidated Financial Statements
(Stated in U.S. dollars unless otherwise noted; tabular amounts in thousands)
| 1. | SIGNIFICANT ACCOUNTING POLICIES (Continued) |
| (f) | Earnings (loss) per share (continued) |
||
The following table lists securities that could potentially dilute basic earnings
(loss) per share in the future that were not included in the computation of diluted
earnings (loss) per share because to do so would have been antidilutive for the periods
presented: |
| Three Months Ended | Six Months Ended | |||||||||||||||
| June 30, | June 30, | |||||||||||||||
| 2011 | 2010 | 2011 | 2010 | |||||||||||||
Convertible credit facility |
— | 39,774 | — | 39,774 | ||||||||||||
Share purchase warrants |
— | 82,467 | — | 82,467 | ||||||||||||
Stock options |
2,460 | 20,943 | 19,996 | 20,943 | ||||||||||||
Bonus shares |
— | — | 623 | — | ||||||||||||
| 2,460 | 143,184 | 20,619 | 143,184 | |||||||||||||
| 2. | EXPLORATION EXPENSES |
Generally, exploration costs are charged to operations in the period incurred until it has
been determined that a property has economically recoverable reserves, at which time
subsequent exploration costs and the costs incurred to develop a property are capitalized.
Summary of exploration expenditures by location:
| Three Months Ended | Six Months Ended | |||||||||||||||
| June 30, | June 30, | |||||||||||||||
| 2011 | 2010 | 2011 | 2010 | |||||||||||||
Mongolia |
||||||||||||||||
Oyu Tolgoi (1) |
$ | 6,009 | $ | 7,887 | $ | 11,097 | $ | 60,010 | ||||||||
Coal Division |
14,136 | 14,307 | 22,620 | 20,871 | ||||||||||||
Other Mongolia Exploration |
2,617 | 982 | 2,495 | 1,534 | ||||||||||||
| 22,762 | 23,176 | 36,212 | 82,415 | |||||||||||||
Australia |
43,021 | 14,868 | 73,384 | 25,686 | ||||||||||||
Indonesia |
1,389 | 732 | 2,497 | 1,279 | ||||||||||||
Other |
1,407 | 707 | 2,709 | 1,526 | ||||||||||||
| 68,579 | 39,483 | 114,802 | 110,906 | |||||||||||||
| (1) | Until March 31, 2010, exploration costs charged to operations included
development costs associated with the Oyu Tolgoi Project in Mongolia. On April 1, 2010,
Ivanhoe Mines commenced capitalizing Oyu Tolgoi Project development costs. As of this
date, reserve estimates for the Oyu Tolgoi Project had been announced and the procedural
and administrative conditions contained in the Investment Agreement were satisfied.
During the six months ended June 30, 2011, additions to property, plant and equipment
for the Oyu Tolgoi Project totalled $1,179.5 million, which included development costs. |
10
Table of Contents
IVANHOE MINES LTD.
Notes to the Consolidated Financial Statements
(Stated in U.S. dollars unless otherwise noted; tabular amounts in thousands)
| 3. | DISCONTINUED OPERATIONS |
In February 2005, Ivanhoe Mines sold the Savage River Iron Ore Project in Tasmania, Australia
for two initial payments totalling $21.5 million, plus a series of five contingent, annual
payments that commenced on March 31, 2006. The annual payments are based on annual iron ore
pellet tonnes sold and an escalating price formula based on the prevailing annual
Nibrasco/JSM pellet price.
In 2010, Ivanhoe Mines received two payments totalling $6.4 million in relation to the fifth
annual contingent payment. The original purchaser of the Savage River Project has disputed
the estimated $22.1 million remaining balance of the fifth annual contingent payment.
Ivanhoe Mines is committed to collecting this amount in full and has included the $22.1
million in accounts receivable as at June 30, 2011. In 2010, Ivanhoe Mines initiated
arbitration proceedings by filing a Request for Arbitration with the ICC International Court
of Arbitration (ICC). In January 2011, the ICC determined that the location of arbitration is
Sydney, Australia and that the matter will be submitted to a sole arbitrator. The arbitration
hearing is scheduled to occur in December 2011.
To date, Ivanhoe Mines has received $144.4 million in proceeds from the sale.
| 4. | CASH AND CASH EQUIVALENTS |
Cash and cash equivalents at June 30, 2011 included SouthGobi Resources Ltd.’s (Canada)
(57.3% owned) (“SouthGobi”) balance of $282.7 million (December 31, 2010 — $492.0 million)
and Ivanhoe Australia Limited’s (Australia) (62.0% owned) (“Ivanhoe Australia”) balance of
$94.5 million (December 31, 2010 — $59.3 million), which were not available for Ivanhoe
Mines’ general corporate purposes.
| 5. | SHORT-TERM INVESTMENTS |
Short-term investments at June 30, 2011 included SouthGobi’s balance of $15.0 million
(December 31, 2010 — $17.5 million) and Ivanhoe Australia’s balance of $nil (December 31,
2010 — $80.8 million), which were not available for Ivanhoe Mines’ general corporate
purposes.
| 6. | INVENTORIES |
| June 30, | December 31, | |||||||
| 2011 | 2010 | |||||||
Stockpiles |
$ | 12,477 | $ | 3,637 | ||||
Materials and supplies |
57,877 | 36,927 | ||||||
| $ | 70,354 | $ | 40,564 | |||||
11
Table of Contents
IVANHOE MINES LTD.
Notes to the Consolidated Financial Statements
(Stated in U.S. dollars unless otherwise noted; tabular amounts in thousands)
| 7. | LONG-TERM INVESTMENTS |
| June 30, | December 31, | |||||||
| 2011 | 2010 | |||||||
Investments in companies subject to significant influence: |
||||||||
Altynalmas Gold Ltd. (a) |
$ | — | $ | — | ||||
Exco Resources N.L. (b) |
68,922 | 16,991 | ||||||
Available-for-sale equity securities (c) |
95,893 | 103,431 | ||||||
Held-for-trading equity securities (d) |
9,926 | 10,235 | ||||||
Other equity securities, cost method (e) |
17,162 | 20,534 | ||||||
| $ | 191,903 | $ | 151,191 | |||||
| (a) | The Company holds a 50.0% interest in Altynalmas Gold Ltd. (“Altynalmas”), which
owns the Kyzyl Gold Project that hosts the Bakyrchik and Bolshevik gold deposits in
Kazakhstan. |
| June 30, | December 31, | |||||||
| 2011 | 2010 | |||||||
Amount due from Altynalmas |
$ | 110,336 | $ | 100,545 | ||||
Share of equity method losses in excess of
common share investment |
(110,336 | ) | (100,545 | ) | ||||
Net investment in Altynalmas |
$ | — | $ | — | ||||
Amounts advanced to Altynalmas bear interest compounded monthly at a rate per annum
equal to the one month London Inter-Bank Offered Rate plus 3.0% and are due on demand.
During the six month period ended June 30, 2011, Ivanhoe Mines recorded a $9.8 million
equity method loss (2010 — $22.6 million loss) on this investment.
| (b) | During the six month period ended June 30, 2011, Ivanhoe Mines recorded a $50.9
million equity method gain (2010 — $0.6 million loss) on its investment in Exco
Resources N.L. (“Exco”). |
||
At June 30, 2011, the market value of Ivanhoe Mines’ 22.8% investment in Exco was $54.8
million (Aud$51.1 million). |
12
Table of Contents
IVANHOE MINES LTD.
Notes to the Consolidated Financial Statements
(Stated in U.S. dollars unless otherwise noted; tabular amounts in thousands)
| 7. | LONG-TERM INVESTMENTS (Continued) |
| (c) | Available-for-sale equity securities |
| June 30, 2011 | December 31, 2010 | |||||||||||||||||||||||||||||||
| Equity | Cost | Unrealized | Fair | Equity | Cost | Unrealized | Fair | |||||||||||||||||||||||||
| Interest | Basis | Gain (Loss) | Value | Interest | Basis | Gain (Loss) | Value | |||||||||||||||||||||||||
Entrée Gold Inc. |
12.0 | % | $ | 19,957 | $ | 7,401 | $ | 27,358 | 12.1 | % | $ | 19,957 | $ | 27,746 | $ | 47,703 | ||||||||||||||||
Aspire Mining Limited (i) |
19.8 | % | 20,741 | 44,498 | 65,239 | 19.8 | % | 20,280 | 31,727 | 52,007 | ||||||||||||||||||||||
Emmerson Resources Limited |
10.0 | % | 3,323 | (414 | ) | 2,909 | 10.0 | % | 3,636 | (304 | ) | 3,332 | ||||||||||||||||||||
Intec Ltd. |
1.9 | % | 36 | 39 | 75 | 1.9 | % | 36 | 91 | 127 | ||||||||||||||||||||||
Other |
— | 60 | 252 | 312 | — | 60 | 202 | 262 | ||||||||||||||||||||||||
| $ | 44,117 | $ | 51,776 | $ | 95,893 | $ | 43,969 | $ | 59,462 | $ | 103,431 | |||||||||||||||||||||
| (i) | During the three month period ended March 31, 2011, Ivanhoe Mines acquired
798,139 common shares of Aspire Mining Limited at a cost of $461,000. |
| (d) | Held-for-trading equity securities |
||
As at June 30, 2011, the market value of Ivanhoe Mines 1.5% investment in Kangaroo
Resources Limited was $9.9 million, resulting in an unrealized loss of $0.3 million
during the six month period ended June 30, 2011. |
|||
| (e) | Other equity securities, cost method |
| June 30, 2011 | December 31, 2010 | |||||||||||||||
| Equity | Cost | Equity | Cost | |||||||||||||
| Interest | Basis | Interest | Basis | |||||||||||||
Ivanplats Limited (i) |
8.8 | % | $ | 16,119 | 7.9 | % | $ | 19,491 | ||||||||
GoviEx Gold Inc. |
2.0 | % | 1,043 | 1.5 | % | 1,043 | ||||||||||
| $ | 17,162 | $ | 20,534 | |||||||||||||
| (i) | In January 2011, Ivanhoe Mines sold 1.4 million shares of Ivanplats Limited
(formerly Ivanhoe Nickel and Platinum Ltd.) (“Ivanplats”), a private company, for
$14.0 million. This transaction resulted in a gain on sale of $10.6 million. |
In March 2011, Ivanhoe Mines converted the remaining Ivanplats special warrants
into 2.5 million common shares of Ivanplats for no additional proceeds.
13
Table of Contents
IVANHOE MINES LTD.
Notes to the Consolidated Financial Statements
(Stated in U.S. dollars unless otherwise noted; tabular amounts in thousands)
| 8. | OTHER LONG-TERM INVESTMENTS |
| June 30, | December 31, | |||||||
| 2011 | 2010 | |||||||
Long-Term Notes (a) |
$ | 32,121 | $ | 29,763 | ||||
Government of Mongolia Treasury Bill (b) |
84,264 | 80,394 | ||||||
Government of Mongolia Prepayments (b) |
129,705 | 36,486 | ||||||
Money Market investments (c) |
60,031 | 45,173 | ||||||
| $ | 306,121 | $ | 191,816 | |||||
| (a) | Long-Term Notes |
||
As at June 30, 2011, the Company held $65.6 million (December 31, 2010 — $65.0 million)
principal amount of Long-Term Notes (received in 2009 upon completion of the
Asset-Backed Commercial Paper restructuring) which was recorded at a fair value of
$32.1 million. The increase from December 2010 in principal of $0.6 million was due to
the strengthening of the Canadian dollar ($1.9 million), offset by principal
redemptions ($1.3 million). The Company has designated the Long-Term Notes as
held-for-trading. Accordingly, the Long-Term Notes are recorded at fair value with
unrealized holding gains and losses included in earnings. |
|||
There is a significant amount of uncertainty in estimating the amount and timing of
cash flows associated with the Long-Term Notes. The Company has estimated the fair
value of the Long-Term Notes considering information provided on the restructuring, the
best available public information regarding market conditions and other factors that a
market participant would consider for such investments. |
|||
The Company is aware of a limited number of trades in the Long-Term Notes that occurred
prior to June 30, 2011, but does not consider them to be of sufficient volume or value
to constitute an active market. Accordingly, the Company has not used these trades to
determine the fair value of its notes. |
|||
The Company has used a discounted cash flow approach to value the Long-Term Notes at
June 30, 2011 incorporating the following assumptions: |
Bankers Acceptance Rate: |
1.12 | % | ||
Discount Rates: |
9% to 25 | % | ||
Maturity Dates: |
5.5 years | |||
Expected Return of Principal: |
||||
A-1 Notes |
100 | % | ||
A-2 Notes |
100 | % | ||
B Notes |
10 | % | ||
C Notes |
0 | % | ||
IA Notes |
0 | % | ||
TA Notes |
100 | % | ||
14
Table of Contents
IVANHOE MINES LTD.
Notes to the Consolidated Financial Statements
(Stated in U.S. dollars unless otherwise noted; tabular amounts in thousands)
| 8. | OTHER LONG-TERM INVESTMENTS (Continued) |
| (a) | Long-Term Notes (continued) |
||
Based on the discounted cash flow model as at June 30, 2011, the fair value of the
Long-Term Notes was estimated at $32.1 million. As a result of this valuation, the
Company recorded an unrealized trading gain of $1.6 million for the six month period
ended June 30, 2011. |
|||
Continuing uncertainties regarding the value of the assets that underlie the Long-Term
Notes, the amount and timing of cash flows and changes in general economic conditions
could give rise to a further change in the fair value of the Company’s investment in
the Long-Term Notes, which would impact the Company’s results from operations. A 1.0%
increase, representing 100 basis points, in the discount rate will decrease the fair
value of the Long-Term Notes by approximately $1.5 million. |
|||
| (b) | Government of Mongolia Treasury Bill and Tax Prepayments |
||
On October 6, 2009, Ivanhoe Mines agreed to purchase three Treasury Bills (“T-Bills”)
from the Mongolian Government, having an aggregate face value of $287.5 million, for
the aggregate sum of $250.0 million. The annual rate of interest on the T-Bills was set
at 3.0%. The initial T-Bill, with a face-value of $115.0 million, was purchased by
Ivanhoe Mines on October 20, 2009 for $100.0 million and will mature on October 20,
2014. |
|||
However, on March 31, 2010 Ivanhoe Mines agreed to an alternative arrangement for the
advancement of funds that would not involve the purchase of the remaining two T-Bills.
Specifically, rather than purchasing the second and third remaining T-Bills, with face
values of $57.5 million and $115.0 million respectively, Ivanhoe Mines agreed to make
two tax prepayments. Tax prepayments of $50.0 million and $100.0 million were made on
April 7, 2010 and June 7, 2011 respectively. |
|||
The after tax rate of interest on the tax prepayments is 1.59% compounding annually.
Unless already off-set fully against Mongolian taxes, the Mongolian Government must
repay any remaining tax prepayment balance, including accrued interest, on the fifth
anniversary of the date the tax prepayment was made. |
|||
The Company has designated the T-Bill and tax prepayments as available-for-sale
investments because they were not purchased with the intent of selling them in the near
term and the Company’s intention to hold them to maturity is uncertain. The fair
values of the T-Bill and tax prepayments are estimated based on available public
information regarding what market participants would consider for such investments.
Changes in the fair value of available-for-sale investments are recognized in
accumulated other comprehensive income. |
15
Table of Contents
IVANHOE MINES LTD.
Notes to the Consolidated Financial Statements
(Stated in U.S. dollars unless otherwise noted; tabular amounts in thousands)
| 8. | OTHER LONG-TERM INVESTMENTS (Continued) |
| (b) | Government of Mongolia Treasury Bill and Tax Prepayments (continued) |
||
The Company has used a discounted cash flow approach to value the T-Bill and tax
prepayments at June 30, 2011 incorporating the following weighted average assumptions: |
| T-Bill | Tax Prepayments | |||||||
Purchased Amount |
$ | 100,000,000 | $ | 150,000,000 | ||||
Discount Rate |
9.9 | % | 9.9 | % | ||||
Term |
3.3 years | 2.0 years | ||||||
Based on the discounted cash flow models as at June 30, 2011, the fair values of
the T-Bill and tax prepayments were estimated at $84.3 million and $129.7 million
respectively. As a result of these valuations, Ivanhoe Mines recorded an unrealized
gain of $2.4 million on the T-Bill and an unrealized loss of $7.3 million on the tax
prepayments in accumulated other comprehensive income for the six month period ended
June 30, 2011.
| (c) | Money Market Investments |
||
As at June 30, 2011, Ivanhoe Mines held $60.0 million of money market investments with
remaining maturities in excess of one year. |
| 9. | PROPERTY, PLANT AND EQUIPMENT |
| June 30, | December 31, | |||||||||||||||||||||||
| 2011 | 2010 | |||||||||||||||||||||||
| Accumulated | Accumulated | |||||||||||||||||||||||
| Depletion and | Depletion and | |||||||||||||||||||||||
| Depreciation, | Depreciation, | |||||||||||||||||||||||
| Including | Net Book | Including | Net Book | |||||||||||||||||||||
| Cost | Write-downs | Value | Cost | Write-downs | Value | |||||||||||||||||||
Mining plant and equipment |
||||||||||||||||||||||||
Ovoot Tolgoi, Mongolia |
$ | 11,082 | $ | (2,029 | ) | $ | 9,053 | $ | 10,647 | $ | (1,428 | ) | $ | 9,219 | ||||||||||
Other mineral property interests |
||||||||||||||||||||||||
Oyu Tolgoi, Mongolia |
$ | 48,120 | $ | (6,402 | ) | $ | 41,718 | $ | 48,120 | $ | (6,316 | ) | $ | 41,804 | ||||||||||
Ovoot Tolgoi, Mongolia |
36,786 | (1,169 | ) | 35,617 | 26,831 | (766 | ) | 26,065 | ||||||||||||||||
Australia |
25,885 | (126 | ) | 25,759 | 25,470 | (126 | ) | 25,344 | ||||||||||||||||
Other exploration projects |
1,252 | (1,244 | ) | 8 | 1,252 | (1,244 | ) | 8 | ||||||||||||||||
| $ | 112,043 | $ | (8,941 | ) | $ | 103,102 | $ | 101,673 | $ | (8,452 | ) | $ | 93,221 | |||||||||||
Other capital assets |
||||||||||||||||||||||||
Oyu Tolgoi, Mongolia |
$ | 33,201 | $ | (16,168 | ) | $ | 17,033 | $ | 24,203 | $ | (14,471 | ) | $ | 9,732 | ||||||||||
Ovoot Tolgoi, Mongolia |
303,074 | (36,431 | ) | 266,643 | 228,241 | (24,154 | ) | 204,087 | ||||||||||||||||
Australia |
53,320 | (3,544 | ) | 49,776 | 46,785 | (2,723 | ) | 44,062 | ||||||||||||||||
Other exploration projects |
4,304 | (3,138 | ) | 1,166 | 3,351 | (2,573 | ) | 778 | ||||||||||||||||
| $ | 393,899 | $ | (59,281 | ) | $ | 334,618 | $ | 302,580 | $ | (43,921 | ) | $ | 258,659 | |||||||||||
Capital works in progress |
||||||||||||||||||||||||
Oyu Tolgoi, Mongolia |
$ | 2,124,090 | $ | — | $ | 2,124,090 | $ | 953,581 | $ | — | $ | 953,581 | ||||||||||||
Ovoot Tolgoi, Mongolia |
49,746 | — | 49,746 | 16,364 | — | 16,364 | ||||||||||||||||||
Australia |
1,482 | — | 1,482 | 1,604 | — | 1,604 | ||||||||||||||||||
| $ | 2,175,318 | $ | — | $ | 2,175,318 | $ | 971,549 | $ | — | $ | 971,549 | |||||||||||||
| $ | 2,692,342 | $ | (70,251 | ) | $ | 2,622,091 | $ | 1,386,449 | $ | (53,801 | ) | $ | 1,332,648 | |||||||||||
16
Table of Contents
IVANHOE MINES LTD.
Notes to the Consolidated Financial Statements
(Stated in U.S. dollars unless otherwise noted; tabular amounts in thousands)
| 10. | AMOUNTS DUE UNDER CREDIT FACILITIES |
| June 30, | December 31, | |||||||
| 2011 | 2010 | |||||||
Current |
||||||||
Non-revolving bank loans (a) |
$ | 14,650 | $ | 14,615 | ||||
Revolving line of credit facility (b) |
1,666 | — | ||||||
| $ | 16,316 | $ | 14,615 | |||||
Non-Current |
||||||||
Two-year extendible loan facility (c) |
$ | 41,520 | $ | 40,080 | ||||
| (a) | In October 2007, Ivanhoe Mines obtained non-revolving bank loans which are due on
demand and secured against certain securities and other investments. |
||
| (b) | In January 2011, Ivanhoe Mines obtained a one year revolving line of credit
facility, which is secured against certain equipment in Mongolia. |
||
| (c) | In April 2009, Ivanhoe Mines obtained a non-revolving, two-year extendible loan
facility. Upon the loan facility’s original maturity in October 2010, Ivanhoe Mines
elected to utilize the first one-year extension. The loan facility is secured against
certain securities and other investments. |
| 11. | CONVERTIBLE CREDIT FACILITY |
| June 30, | December 31, | |||||||
| 2011 | 2010 | |||||||
Principal amount of convertible debenture |
$ | 500,000 | $ | 500,000 | ||||
(Deduct) add: |
||||||||
Bifurcation of embedded derivative liability |
(313,292 | ) | (313,292 | ) | ||||
Accretion of discount |
96 | 69 | ||||||
Reduction of carrying amount upon
partial conversion |
(93,370 | ) | (93,370 | ) | ||||
Carrying amount of debt host contract |
93,434 | 93,407 | ||||||
Embedded derivative liability |
121,236 | 154,877 | ||||||
Convertible credit facility |
214,670 | 248,284 | ||||||
Accrued interest |
4,285 | 6,312 | ||||||
Transaction costs allocated to deferred charges |
(2,799 | ) | (2,800 | ) | ||||
Net carrying amount of convertible debenture |
$ | 216,156 | $ | 251,796 | ||||
17
Table of Contents
IVANHOE MINES LTD.
Notes to the Consolidated Financial Statements
(Stated in U.S. dollars unless otherwise noted; tabular amounts in thousands)
| 11. | CONVERTIBLE CREDIT FACILITY (Continued) |
|
On November 19, 2009, SouthGobi issued a convertible debenture to a wholly-owned subsidiary
of China Investment Corporation (“CIC”) for $500.0 million. The convertible debenture is
secured, bears interest at 8.0% (6.4% payable semi-annually in cash and 1.6% payable annually
in shares of SouthGobi) and has a term of 30 years. The financing primarily will support an
accelerated investment program in Mongolia and up to $120.0 million of the financing may also
be used for working capital, repayment of debt due on funding, general and administrative
expense and other general corporate purposes. |
||
Pursuant to the convertible debentures’ terms, SouthGobi had the right to call for the
conversion of up to $250.0 million of the convertible debenture upon SouthGobi achieving a
public float of 25.0% of its common shares under certain agreed circumstances. On March 29,
2010, SouthGobi exercised this right and completed the conversion of $250.0 million of the
convertible debenture into 21.5 million shares at a conversion price of $11.64 (Cdn$11.88).
Also on March 29, 2010, SouthGobi settled the $1.4 million accrued interest payable in shares
on the $250.0 million converted by issuing 0.1 million shares at the 50-day VWAP conversion
price of $15.97 (Cdn$16.29). On April 1, 2010, SouthGobi settled the outstanding accrued
interest payable in cash on the $250.0 million converted with a cash payment of $5.7 million. |
||
As at March 29, 2010, the fair value of the embedded derivative liability associated with the
$250.0 million converted was $102.8 million, a decrease of $9.4 million compared to its fair
value at December 31, 2009. The $347.6 million fair value of the SouthGobi shares issued
upon conversion exceeded the $193.3 million aggregate carrying value of the debt host
contract, embedded derivative liability and deferred charges. The difference of $154.3
million was recorded as a loss on conversion of the convertible debenture. |
||
As at June 30, 2011, the fair value of the embedded derivative liability associated with the
remaining $250.0 million principal outstanding was determined to be $121.2 million. |
||
The embedded derivative liability was valued using a Monte Carlo simulation valuation model.
A Monte Carlo simulation model is a valuation model that relies on random sampling and is
often used when modeling systems with a large number of inputs and where there is significant
uncertainty in the future value of inputs and where the movement in the inputs can be
independent of each other. Some of the key inputs used by the Monte Carlo simulation
include: floor and ceiling conversion prices, risk-free rate of return, expected volatility
of SouthGobi’s share price, forward Cdn$ exchange rate curves and spot Cdn$ exchange rates. |
18
Table of Contents
IVANHOE MINES LTD.
Notes to the Consolidated Financial Statements
(Stated in U.S. dollars unless otherwise noted; tabular amounts in thousands)
| 11. | CONVERTIBLE CREDIT FACILITY (Continued) |
Assumptions used in the Monte Carlo valuation model are as follows:
| June 30, | December 31, | |||||||
| 2011 | 2010 | |||||||
Floor conversion price |
Cdn$8.88 | Cdn$8.88 | ||||||
Ceiling conversion price |
Cdn$11.88 | Cdn$11.88 | ||||||
Expected volatility |
72 | % | 73 | % | ||||
Risk-free rate of return |
3.49 | % | 3.48 | % | ||||
Spot Cdn$ exchange rate |
1.04 | 1.01 | ||||||
Forward Cdn$ exchange rate curve |
1.00 - 1.13 | 0.97 - 1.14 | ||||||
During the three and six months ended June 30, 2011, Ivanhoe Mines capitalized $2.1 million
and $3.3 million, respectively, of interest expense incurred on the convertible credit
facility. |
| 12. | SHARE CAPITAL |
| (a) | Equity Incentive Plan |
||
Stock-based compensation charged to operations was allocated between exploration
expenses and general and administrative expenses as follows: |
| Three Months Ended | Six Months Ended | |||||||||||||||
| June 30, | June 30, | |||||||||||||||
| 2011 | 2010 | 2011 | 2010 | |||||||||||||
Exploration (i) |
$ | 9,303 | $ | 5,466 | $ | 18,625 | $ | 12,254 | ||||||||
General and administrative |
8,214 | 2,537 | 22,311 | 4,777 | ||||||||||||
| $ | 17,517 | $ | 8,003 | $ | 40,936 | $ | 17,031 | |||||||||
| (i) | During the six months ended June 30, 2011, stock-based compensation of $22.0 million (2010 -
$1.6 million), relating to the development of the Oyu Tolgoi Project was capitalized as
property, plant and equipment (Note 2). |
19
Table of Contents
IVANHOE MINES LTD.
Notes to the Consolidated Financial Statements
(Stated in U.S. dollars unless otherwise noted; tabular amounts in thousands)
| 12. | SHARE CAPITAL (Continued) |
| (a) | Equity Incentive Plan (Continued) |
||
Stock-based compensation charged to operations was incurred by Ivanhoe Mines as follows: |
| Three Months Ended | Six Months Ended | |||||||||||||||
| June 30, | June 30, | |||||||||||||||
| 2011 | 2010 | 2011 | 2010 | |||||||||||||
Ivanhoe Mines Ltd. (i) |
$ | 10,295 | $ | 3,543 | $ | 26,939 | $ | 7,649 | ||||||||
SouthGobi Resources Ltd. |
3,205 | 2,344 | 6,292 | 4,693 | ||||||||||||
Ivanhoe Australia Ltd. |
4,017 | 2,116 | 7,705 | 4,689 | ||||||||||||
| $ | 17,517 | $ | 8,003 | $ | 40,936 | $ | 17,031 | |||||||||
| (i) | During the six months ended June 30, 2011, 1,793,805 options were
exercised, 148,253 options were cancelled and 5,225,923 options were granted.
These granted options have a weighted average exercise price of Cdn$18.83, lives of
seven years, and vest over periods ranging from grant date to four years. The
weighted average grant-date fair value of stock options granted during the six
months ended June 30, 2011 was Cdn$17.30. The fair value of these options was
determined using the Black-Scholes option pricing model. The option valuation was
based on a weighted average expected life of 3.0 years, risk-free interest rate of
2.09%, expected volatility of 66%, and dividend yield of nil%. |
||
During the six months ended June 30, 2011, stock-based compensation of $22.0
million (2010 — $1.6 million), relating to the development of the Oyu Tolgoi
Project was capitalized as property, plant and equipment (Note 2). |
| (b) | Rio Tinto Placements |
||
In 2006, the Company and Rio Tinto formed a strategic partnership and entered into a
private placement agreement whereby Rio Tinto would invest in Ivanhoe Mines. Since 2006
the parties have entered into a series of agreements pursuant to which Rio Tinto has
provided equity and debt financing to Ivanhoe Mines. As a result of these transactions,
Rio Tinto holds a significant investment interest in Ivanhoe Mines. These transactions
are set out below: |
20
Table of Contents
IVANHOE MINES LTD.
Notes to the Consolidated Financial Statements
(Stated in U.S. dollars unless otherwise noted; tabular amounts in thousands)
| 12. | SHARE CAPITAL (Continued) |
| (b) | Rio Tinto Placements (Continued) |
||
(Stated in thousands of U.S. dollars, except for share amounts) |
| Number of | Proceeds/ | |||||||||||
| Shares | Transaction | |||||||||||
| Nature of Investment by Rio Tinto | Period | Acquired (1) | Value | |||||||||
Private Placement — Tranche 1 |
2006 | 37,089,883 | $ | 303,395 | ||||||||
Anti Dilution Shares |
2008 | 243,772 | 612 | |||||||||
Private Placement — Tranche 2 |
2009 | 46,304,473 | 388,031 | |||||||||
March 2010 Private Placement |
2010 | 15,000,000 | 240,916 | |||||||||
Exercise of Series A Warrants |
2010 | 46,026,522 | 393,066 | |||||||||
Conversion of Convertible Credity Facility |
2010 | 40,083,206 | 400,832 | |||||||||
Exercise of Anti Dilution Warrants |
2010 | 720,203 | 2,229 | |||||||||
Partial exercise of Series B Warrants |
2010 | 33,783,784 | 300,000 | |||||||||
Balance at December 31, 2010 |
219,251,843 | $ | 2,029,081 | |||||||||
Rights Offering |
February 2011 | 34,387,776 | 477,302 | |||||||||
Exercise of remaining Series B Warrants (2) |
June 2011 | 14,070,182 | 119,737 | |||||||||
Exercise of Anti Dilution Warrants (2) |
June 2011 | 827,706 | 2,527 | |||||||||
Exercise of Series C Warrants (2) |
June 2011 | 40,224,365 | 379,316 | |||||||||
Balance at June 30, 2011 |
308,761,872 | $ | 3,007,963 | |||||||||
| (1) | Shares acquired excludes other purchases made by Rio Tinto from third
parties. |
|
| (2) | In June 2011, Ivanhoe Mines received $501.6 million from Rio Tinto
following Rio Tinto’s decision to exercise all remaining share-purchase warrants that
it holds in Ivanhoe Mines. Rio Tinto exercised all the remaining Series B and Series C
warrants that it was granted as part of the 2006 and 2007 financing agreements
associated with Rio Tinto’s original investment in Ivanhoe Mines. Rio Tinto previously
had committed to convert all the warrants to shares by January 2012. The additional
shares increased Rio Tinto’s ownership stake in Ivanhoe Mines from 42.0% to 46.5%. |
|
As at June 30, 2011, Rio Tinto’s equity ownership in the Company was 46.5% (December
31, 2010 — 40.3%). |
||
| (c) | Rights Offering |
||
In December 2010, the Company filed a final short form prospectus for a rights offering
open to all shareholders on a dilution-free, equal participation basis. In accordance
with the terms of the rights offering, each shareholder of record as at December 31,
2010 received one right for each common share held. Every 100 rights held entitled the
holder thereof to purchase 15 common shares of the Company at $13.88 per share or
Cdn$13.93 per share, at the election of the holder. The rights traded on the TSX, NYSE
and NASDAQ and expired on January 26, 2011. |
21
Table of Contents
IVANHOE MINES LTD.
Notes to the Consolidated Financial Statements
(Stated in U.S. dollars unless otherwise noted; tabular amounts in thousands)
| 12. | SHARE CAPITAL (Continued) |
| (c) | Rights Offering (continued) |
||
Upon the closing of the rights offering, the Company issued a total of 84,867,671
common shares for gross proceeds of $1.18 billion. Expenses and fees relating to the
rights offering totalled approximately $27.3 million. |
|||
Under the terms of the rights offering, the monetary amount to be received by the
Company upon the exercise of rights was not fixed. Each holder of rights could elect
either the $13.88 or Cdn$13.93 subscription price. Furthermore, the Cdn$13.93
subscription price is not denominated in the Company’s U.S. dollar functional currency.
Therefore, the pro rata distribution of rights to the Company’s shareholders was
accounted for as a derivative financial liability measured at fair value. |
|||
On December 23, 2010, rights to be issued under the rights offering began trading on a
“when issued” basis. On this date, the Company recognized a derivative financial
liability of $901.9 million associated with the Company’s legal obligation to carry out
the rights offering. Deficit was adjusted by a corresponding amount. Each reporting
period the derivative financial liability was remeasured at fair value with changes
being recognized in earnings. During the three month period ended March 31, 2011,
Ivanhoe Mines recognized a derivative loss of $432.5 million. |
|||
During the three months ended March 31, 2011, the derivative financial liability was
settled as rights were exercised or expired unexercised. A total of $1.19 billion was
reclassified from the derivative financial liability to share capital, representing the
fair value of rights exercised. At expiry, a total of $5.7 million was reclassified
from derivative financial liability to additional paid-in capital, representing the
fair value of rights which expired unexercised. |
|||
The fair value of the derivative financial liability was determined by reference to
published market quotations for the rights. |
22
Table of Contents
IVANHOE MINES LTD.
Notes to the Consolidated Financial Statements
(Stated in U.S. dollars unless otherwise noted; tabular amounts in thousands)
| 13. | ACCUMULATED OTHER COMPREHENSIVE INCOME |
| Three Months Ended | Six Months Ended | |||||||||||||||
| June 30, | June 30, | |||||||||||||||
| 2011 | 2010 | 2011 | 2010 | |||||||||||||
Accumulated OCI at beginning of period: |
||||||||||||||||
Long-term investments, net of tax of $12,682, $1,653, $6,224, $1,896 |
$ | 99,789 | $ | 21,905 | $ | 53,239 | $ | 17,763 | ||||||||
Other long-term investments, net of tax of $nil, $nil, $nil, $nil |
(35,360 | ) | (26,363 | ) | (37,180 | ) | (27,448 | ) | ||||||||
Currency translation adjustment, net of tax of $nil, $nil, $nil, $nil |
24,533 | (5,305 | ) | 23,039 | (6,015 | ) | ||||||||||
Noncontrolling interests |
(28,705 | ) | 1,880 | (6,023 | ) | 1,122 | ||||||||||
| $ | 60,257 | $ | (7,883 | ) | $ | 33,075 | $ | (14,578 | ) | |||||||
Other comprehensive income (loss) for the period: |
||||||||||||||||
Changes in fair value of long-term investments |
$ | (61,149 | ) | $ | (16,335 | ) | $ | (8,141 | ) | $ | (12,439 | ) | ||||
Changes in fair value of other long-term investments |
(6,738 | ) | (14,327 | ) | (4,918 | ) | (13,242 | ) | ||||||||
Currency translation adjustments |
7,454 | (2,893 | ) | 8,948 | (2,183 | ) | ||||||||||
Noncontrolling interests |
16,951 | 13,657 | (5,731 | ) | 14,415 | |||||||||||
Less: reclassification adjustments for gains/losses recorded in earnings: |
||||||||||||||||
Investments: |
||||||||||||||||
Other than temporary impairment charges |
— | — | — | 3 | ||||||||||||
Other comprehensive income, before tax |
(43,482 | ) | (19,898 | ) | (9,842 | ) | (13,446 | ) | ||||||||
Income tax expense related to OCI |
7,148 | 1,653 | 690 | 1,896 | ||||||||||||
Other comprehensive income, net of tax |
$ | (36,334 | ) | $ | (18,245 | ) | $ | (9,152 | ) | $ | (11,550 | ) | ||||
Accumulated OCI at end of period: |
||||||||||||||||
Long-term investments, net of tax of $5,534, $nil, $5,534, $nil |
$ | 45,788 | $ | 7,223 | $ | 45,788 | $ | 7,223 | ||||||||
Other long-term investments, net of tax of $nil, $nil, $nil, $nil |
(42,098 | ) | (40,690 | ) | (42,098 | ) | (40,690 | ) | ||||||||
Currency translation adjustment, net of tax of $nil, $nil, $nil, $nil |
31,987 | (8,198 | ) | 31,987 | (8,198 | ) | ||||||||||
Noncontrolling interests |
(11,754 | ) | 15,537 | (11,754 | ) | 15,537 | ||||||||||
| $ | 23,923 | $ | (26,128 | ) | $ | 23,923 | $ | (26,128 | ) | |||||||
23
Table of Contents
IVANHOE MINES LTD.
Notes to the Consolidated Financial Statements
(Stated in U.S. dollars unless otherwise noted; tabular amounts in thousands)
| 14. | NONCONTROLLING INTERESTS |
At June 30, 2011 there were noncontrolling interests in SouthGobi, Ivanhoe Australia and Oyu
Tolgoi LLC:
| Noncontrolling Interests | ||||||||||||||||
| Ivanhoe | ||||||||||||||||
| SouthGobi | Australia | Oyu Tolgoi | Total | |||||||||||||
Balance, December 31, 2010 |
$ | 286,919 | $ | 69,092 | $ | (353,401 | ) | $ | 2,610 | |||||||
Noncontrolling interests’ share of loss |
8,292 | (4,556 | ) | (5,032 | ) | (1,296 | ) | |||||||||
Noncontrolling interests’ share of other
comprehensive income |
4,772 | 2,631 | (1,672 | ) | 5,731 | |||||||||||
Changes in noncontrolling interests arising
from changes in ownership interests |
(5,066 | ) | 87 | — | (4,979 | ) | ||||||||||
Balance, June 30, 2011 |
$ | 294,917 | $ | 67,254 | $ | (360,105 | ) | $ | 2,066 | |||||||
| 15. | CASH FLOW INFORMATION |
| (a) | Reconciliation of net loss to net cash flow used in operating activities |
| Three Months Ended | Six Months Ended | |||||||||||||||
| June 30, | June 30, | |||||||||||||||
| 2011 | 2010 | 2011 | 2010 | |||||||||||||
Net income (loss) |
$ | 28,020 | $ | (11,367 | ) | $ | (493,192 | ) | $ | (265,489 | ) | |||||
Income from discontinued operations |
— | — | — | (6,585 | ) | |||||||||||
Items not involving use of cash
|
||||||||||||||||
Stock-based compensation |
16,354 | 8,003 | 38,622 | 17,031 | ||||||||||||
Accretion expense |
186 | 4,583 | 362 | 8,753 | ||||||||||||
General and administrative expenses |
— | 3,421 | — | 3,421 | ||||||||||||
Depreciation |
8,434 | 2,658 | 11,745 | 6,097 | ||||||||||||
Accrued interest income |
(3,078 | ) | (1,529 | ) | (6,105 | ) | (5,120 | ) | ||||||||
Interest expense |
(2,182 | ) | 2,981 | 742 | 7,741 | |||||||||||
Unrealized (gains) losses on long-term investments |
(3,453 | ) | 4,508 | 309 | 5,211 | |||||||||||
Unrealized gains on other long-term investments |
(1,007 | ) | (789 | ) | (1,395 | ) | (1,509 | ) | ||||||||
Realized gain on redemption of other long-term investments |
(65 | ) | (26 | ) | (98 | ) | (87 | ) | ||||||||
Change in fair value of derivative |
— | — | 432,536 | — | ||||||||||||
Change in fair value of embedded derivatives |
(70,422 | ) | (72,233 | ) | (33,641 | ) | (70,861 | ) | ||||||||
Loss on conversion of convertible debenture |
— | — | — | 154,316 | ||||||||||||
Unrealized foreign exchange (gains) losses |
(430 | ) | 3,347 | (3,505 | ) | (113 | ) | |||||||||
Share of (income) loss of significantly influenced investees |
(44,844 | ) | 13,151 | (41,130 | ) | 23,210 | ||||||||||
Write-down of carrying value of inventory |
10,557 | — | 15,875 | 6,535 | ||||||||||||
Gain on sale of long-term investments |
— | — | (10,628 | ) | — | |||||||||||
Write-down of carrying value of long-term investments |
— | 161 | — | 417 | ||||||||||||
Deferred income taxes |
1,909 | 850 | (12,883 | ) | (2,773 | ) | ||||||||||
Bonus shares |
1,163 | — | 2,314 | — | ||||||||||||
Net change in non-cash operating working capital items: |
||||||||||||||||
Increase in: |
||||||||||||||||
Accounts receivable |
(39,936 | ) | (1,720 | ) | (32,187 | ) | (6,337 | ) | ||||||||
Inventories |
(12,943 | ) | (14,425 | ) | (45,354 | ) | (14,980 | ) | ||||||||
Prepaid expenses |
(15,082 | ) | (704 | ) | (19,451 | ) | (1,698 | ) | ||||||||
Increase (decrease) in: |
||||||||||||||||
Accounts payable and accrued liabilities |
10,411 | 28,812 | 13,046 | 44,101 | ||||||||||||
Interest payable on long-term debt |
(2,948 | ) | (8,734 | ) | (2,027 | ) | (416 | ) | ||||||||
Cash used in operating activities |
$ | (119,356 | ) | $ | (39,052 | ) | $ | (186,045 | ) | $ | (99,135 | ) | ||||
24
Table of Contents
IVANHOE MINES LTD.
Notes to the Consolidated Financial Statements
(Stated in U.S. dollars unless otherwise noted; tabular amounts in thousands)
| 15. | CASH FLOW INFORMATION (Continued) |
| (b) | Supplementary information regarding other non-cash transactions |
||
The non-cash investing and financing activities relating to continuing operations
not already disclosed in the Consolidated Statements of Cash Flows were as follows: |
| Three Months Ended | Six Months Ended | |||||||||||||||
| June 30, | June 30, | |||||||||||||||
| 2011 | 2010 | 2011 | 2010 | |||||||||||||
Investing activities: |
||||||||||||||||
Acquisition of property, plant
and equipment (i) |
$ | — | $ | — | $ | — | $ | (195,357 | ) | |||||||
Financing activites: |
||||||||||||||||
Partial conversion of convertible
debenture (Note 11) |
— | — | — | (349,079 | ) | |||||||||||
| $ | — | $ | — | $ | — | $ | (544,436 | ) | ||||||||
| (i) | In March 2010, the Company and Rio Tinto completed an agreement
whereby the Company issued 15.0 million common shares to Rio Tinto for net
proceeds of $241.1 million (Cdn$244.7 million) (Note 12 (b)). The Company used
$195.4 million of the proceeds to purchase from Rio Tinto key mining and milling
equipment to be installed during the construction of the Oyu Tolgoi Project. |
25
Table of Contents
IVANHOE MINES LTD.
Notes to the Consolidated Financial Statements
(Stated in U.S. dollars unless otherwise noted; tabular amounts in thousands)
| 16. | SEGMENT DISCLOSURES |
| Six Months Ended June 30, 2011 | ||||||||||||||||||||
| Development | Exploration | Coal | Corporate | Consolidated | ||||||||||||||||
REVENUE |
$ | — | $ | — | $ | 67,494 | $ | — | $ | 67,494 | ||||||||||
COST OF SALES |
||||||||||||||||||||
Production and delivery |
— | — | (43,574 | ) | — | (43,574 | ) | |||||||||||||
Depreciation and depletion |
— | — | (10,530 | ) | — | (10,530 | ) | |||||||||||||
Write-down of carrying value of inventory |
— | — | (15,875 | ) | — | (15,875 | ) | |||||||||||||
COST OF SALES |
— | — | (69,979 | ) | — | (69,979 | ) | |||||||||||||
EXPENSES |
||||||||||||||||||||
Exploration |
(11,097 | ) | (81,085 | ) | (22,620 | ) | — | (114,802 | ) | |||||||||||
General and administrative |
— | — | — | (44,761 | ) | (44,761 | ) | |||||||||||||
Depreciation |
(86 | ) | (907 | ) | (141 | ) | (81 | ) | (1,215 | ) | ||||||||||
Accretion of asset retirement obligations |
(207 | ) | — | (127 | ) | — | (334 | ) | ||||||||||||
TOTAL EXPENSES |
(11,390 | ) | (81,992 | ) | (92,867 | ) | (44,842 | ) | (231,091 | ) | ||||||||||
OPERATING LOSS |
(11,390 | ) | (81,992 | ) | (25,373 | ) | (44,842 | ) | (163,597 | ) | ||||||||||
OTHER INCOME (EXPENSES) |
||||||||||||||||||||
Interest income |
2,196 | 4,179 | 782 | 2,894 | 10,051 | |||||||||||||||
Interest expense |
— | — | (6,935 | ) | (748 | ) | (7,683 | ) | ||||||||||||
Accretion of convertible credit facilities |
— | — | (28 | ) | — | (28 | ) | |||||||||||||
Foreign exchange gains |
2,140 | 9 | 12 | 3,242 | 5,403 | |||||||||||||||
Unrealized losses on long-term investments |
— | — | (309 | ) | — | (309 | ) | |||||||||||||
Unrealized (losses) gains on other long-term investments |
— | — | (179 | ) | 1,574 | 1,395 | ||||||||||||||
Realized gain on redemption of other long-term investments |
— | — | — | 98 | 98 | |||||||||||||||
Change in fair value of derivative |
— | — | — | (432,536 | ) | (432,536 | ) | |||||||||||||
Change in fair value of embedded derivatives |
— | — | 33,641 | — | 33,641 | |||||||||||||||
Loss on conversion of convertible credit facility |
— | — | — | — | — | |||||||||||||||
Write-down of carrying value of long-term investments |
— | — | — | — | — | |||||||||||||||
Gain on sale of long-term investment |
— | — | — | 10,628 | 10,628 | |||||||||||||||
(LOSS) INCOME
BEFORE INCOME TAXES AND OTHER ITEMS |
(7,054 | ) | (77,804 | ) | 1,611 | (459,690 | ) | (542,937 | ) | |||||||||||
(Provision) recovery for income taxes |
(5 | ) | (631 | ) | 11,333 | (2,082 | ) | 8,615 | ||||||||||||
Share of income (loss) of significantly influenced investees |
— | 50,921 | — | (9,791 | ) | 41,130 | ||||||||||||||
NET (LOSS) INCOME FROM CONTINUING OPERATIONS |
(7,059 | ) | (27,514 | ) | 12,944 | (471,563 | ) | (493,192 | ) | |||||||||||
INCOME FROM DISCONTINUED OPERATIONS |
— | — | — | — | — | |||||||||||||||
NET (LOSS) INCOME |
(7,059 | ) | (27,514 | ) | 12,944 | (471,563 | ) | (493,192 | ) | |||||||||||
NET LOSS (INCOME) ATTRIBUTABLE TO NONCONTROLLING
INTERESTS |
5,032 | 4,556 | (8,292 | ) | — | 1,296 | ||||||||||||||
NET
(LOSS) INCOME ATTRIBUTABLE TO IVANHOE MINES LTD. |
$ | (2,027 | ) | $ | (22,958 | ) | $ | 4,652 | $ | (471,563 | ) | $ | (491,896 | ) | ||||||
CAPITAL EXPENDITURES |
$ | 1,014,136 | $ | 3,934 | $ | 112,158 | $ | 41 | $ | 1,130,269 | ||||||||||
TOTAL ASSETS |
$ | 2,675,550 | $ | 295,247 | $ | 955,722 | $ | 1,069,857 | $ | 4,996,376 | ||||||||||
During the six months ended June 30, 2011, all of the coal division’s revenue arose from coal
sales in Mongolia. Revenues for the three largest customers were $28.5 million, $17.3 million and
$13.3 million, respectively.
26
Table of Contents
IVANHOE MINES LTD.
Notes to the Consolidated Financial Statements
(Stated in U.S. dollars unless otherwise noted; tabular amounts in thousands)
| 16. | SEGMENT DISCLOSURES (Continued) |
| Three Months Ended June 30, 2011 | ||||||||||||||||||||
| Development | Exploration | Coal | Corporate | Consolidated | ||||||||||||||||
REVENUE |
$ | — | $ | — | $ | 47,336 | $ | — | $ | 47,336 | ||||||||||
COST OF SALES |
||||||||||||||||||||
Production and delivery |
— | — | (31,416 | ) | — | (31,416 | ) | |||||||||||||
Depreciation and depletion |
— | — | (7,731 | ) | — | (7,731 | ) | |||||||||||||
Write-down of carrying value of inventory |
— | — | (10,557 | ) | — | (10,557 | ) | |||||||||||||
COST OF SALES |
— | — | (49,704 | ) | — | (49,704 | ) | |||||||||||||
EXPENSES |
||||||||||||||||||||
Exploration |
(6,009 | ) | (48,434 | ) | (14,136 | ) | — | (68,579 | ) | |||||||||||
General and administrative |
— | — | — | (19,483 | ) | (19,483 | ) | |||||||||||||
Depreciation |
(43 | ) | (530 | ) | (54 | ) | (76 | ) | (703 | ) | ||||||||||
Accretion of asset retirement obligations |
(104 | ) | — | (68 | ) | — | (172 | ) | ||||||||||||
TOTAL EXPENSES |
(6,156 | ) | (48,964 | ) | (63,962 | ) | (19,559 | ) | (138,641 | ) | ||||||||||
OPERATING LOSS |
(6,156 | ) | (48,964 | ) | (16,626 | ) | (19,559 | ) | (91,305 | ) | ||||||||||
OTHER INCOME (EXPENSES) |
||||||||||||||||||||
Interest income |
1,193 | 1,930 | 355 | 1,435 | 4,913 | |||||||||||||||
Interest expense |
— | — | (2,959 | ) | (377 | ) | (3,336 | ) | ||||||||||||
Accretion of convertible credit facilities |
— | — | (14 | ) | — | (14 | ) | |||||||||||||
Foreign exchange gains (losses) |
1,028 | (47 | ) | 324 | 949 | 2,254 | ||||||||||||||
Unrealized gains on long-term investments |
— | — | 3,453 | — | 3,453 | |||||||||||||||
Unrealized gains on other long-term investments |
— | — | 175 | 832 | 1,007 | |||||||||||||||
Realized gain on redemption of other long-term investments |
— | — | — | 65 | 65 | |||||||||||||||
Change in fair value of derivative |
— | — | — | — | — | |||||||||||||||
Change in fair value of embedded derivatives |
— | — | 70,422 | — | 70,422 | |||||||||||||||
Loss on conversion of convertible credit facility |
— | — | — | — | — | |||||||||||||||
Write-down of carrying value of long-term investments |
— | — | — | — | — | |||||||||||||||
Gain on sale of long-term investment |
— | — | — | — | — | |||||||||||||||
(LOSS) INCOME
BEFORE INCOME TAXES AND OTHER ITEMS |
(3,935 | ) | (47,081 | ) | 55,130 | (16,655 | ) | (12,541 | ) | |||||||||||
Provision for income taxes |
(5 | ) | (517 | ) | (2,365 | ) | (1,396 | ) | (4,283 | ) | ||||||||||
Share of income (loss) of significantly influenced investees |
— | 45,721 | — | (877 | ) | 44,844 | ||||||||||||||
NET (LOSS) INCOME FROM CONTINUING OPERATIONS |
(3,940 | ) | (1,877 | ) | 52,765 | (18,928 | ) | 28,020 | ||||||||||||
INCOME FROM DISCONTINUED OPERATIONS |
— | — | — | — | — | |||||||||||||||
NET (LOSS) INCOME |
(3,940 | ) | (1,877 | ) | 52,765 | (18,928 | ) | 28,020 | ||||||||||||
NET INCOME ATTRIBUTABLE TO NONCONTROLLING
INTERESTS |
(731 | ) | (2,640 | ) | (24,045 | ) | — | (27,416 | ) | |||||||||||
NET
(LOSS) INCOME ATTRIBUTABLE TO IVANHOE MINES LTD. |
$ | (4,671 | ) | $ | (4,517 | ) | $ | 28,720 | $ | (18,928 | ) | $ | 604 | |||||||
CAPITAL EXPENDITURES |
$ | 519,910 | $ | 2,102 | $ | 79,519 | $ | 34 | $ | 601,565 | ||||||||||
TOTAL ASSETS |
$ | 2,675,550 | $ | 295,247 | $ | 955,722 | $ | 1,069,857 | $ | 4,996,376 | ||||||||||
During the three months ended June 30, 2011, all of the coal division’s revenue arose from
coal sales in Mongolia. Revenues for the three largest customers were $20.4 million, $13.3 million
and $9.0 million, respectively.
27
Table of Contents
IVANHOE MINES LTD.
Notes to the Consolidated Financial Statements
(Stated in U.S. dollars unless otherwise noted; tabular amounts in thousands)
| 16. | SEGMENT DISCLOSURES (Continued) |
| Six Months Ended June 30, 2010 | ||||||||||||||||||||
| Development | Exploration | Coal | Corporate | Consolidated | ||||||||||||||||
REVENUE |
$ | — | $ | — | $ | 31,585 | $ | — | $ | 31,585 | ||||||||||
COST OF SALES |
||||||||||||||||||||
Production and delivery |
— | — | (22,098 | ) | — | (22,098 | ) | |||||||||||||
Depreciation and depletion |
— | — | (4,827 | ) | — | (4,827 | ) | |||||||||||||
Write-down of carrying value of inventory |
— | — | (6,535 | ) | — | (6,535 | ) | |||||||||||||
COST OF SALES |
— | — | (33,460 | ) | — | (33,460 | ) | |||||||||||||
EXPENSES |
||||||||||||||||||||
Exploration |
(60,010 | ) | (30,025 | ) | (20,871 | ) | — | (110,906 | ) | |||||||||||
General and administrative |
— | — | — | (23,047 | ) | (23,047 | ) | |||||||||||||
Depreciation |
(636 | ) | (478 | ) | (89 | ) | (67 | ) | (1,270 | ) | ||||||||||
Accretion of asset retirement obligations |
(44 | ) | — | (47 | ) | — | (91 | ) | ||||||||||||
TOTAL EXPENSES |
(60,690 | ) | (30,503 | ) | (54,467 | ) | (23,114 | ) | (168,774 | ) | ||||||||||
OPERATING LOSS |
(60,690 | ) | (30,503 | ) | (22,882 | ) | (23,114 | ) | (137,189 | ) | ||||||||||
OTHER INCOME (EXPENSES) |
||||||||||||||||||||
Interest income |
1,648 | 120 | 1,224 | 4,175 | 7,167 | |||||||||||||||
Interest expense |
— | — | (14,733 | ) | (6,944 | ) | (21,677 | ) | ||||||||||||
Accretion of convertible credit facilities |
— | — | (33 | ) | (8,629 | ) | (8,662 | ) | ||||||||||||
Foreign exchange (losses) gains |
(203 | ) | 15 | (601 | ) | (2,400 | ) | (3,189 | ) | |||||||||||
Unrealized losses on long-term investments |
— | — | (5,212 | ) | — | (5,212 | ) | |||||||||||||
Unrealized (losses) gains on other long-term investments |
— | — | (30 | ) | 1,539 | 1,509 | ||||||||||||||
Realized gain on redemption of other long-term investments |
— | — | — | 87 | 87 | |||||||||||||||
Change in fair value of derivative |
— | — | — | — | — | |||||||||||||||
Change in fair value of embedded derivatives |
— | — | 70,861 | — | 70,861 | |||||||||||||||
Loss on conversion of convertible credit facility |
— | — | (154,316 | ) | — | (154,316 | ) | |||||||||||||
Write-down of carrying value of long-term investments |
— | — | — | (417 | ) | (417 | ) | |||||||||||||
Gain on sale of long-term investment |
— | — | — | — | — | |||||||||||||||
LOSS BEFORE INCOME TAXES AND OTHER ITEMS |
(59,245 | ) | (30,368 | ) | (125,722 | ) | (35,703 | ) | (251,038 | ) | ||||||||||
(Provision) recovery for income taxes |
(16 | ) | (1,299 | ) | 3,141 | 348 | 2,174 | |||||||||||||
Share of loss of significantly influenced investees |
— | (618 | ) | — | (22,592 | ) | (23,210 | ) | ||||||||||||
NET LOSS FROM CONTINUING OPERATIONS |
(59,261 | ) | (32,285 | ) | (122,581 | ) | (57,947 | ) | (272,074 | ) | ||||||||||
INCOME FROM DISCONTINUED OPERATIONS |
— | — | — | 6,585 | 6,585 | |||||||||||||||
NET LOSS |
(59,261 | ) | (32,285 | ) | (122,581 | ) | (51,362 | ) | (265,489 | ) | ||||||||||
NET LOSS ATTRIBUTABLE TO NONCONTROLLING
INTERESTS |
2,159 | 4,456 | 34,978 | — | 41,593 | |||||||||||||||
NET LOSS ATTRIBUTABLE TO IVANHOE MINES LTD. |
$ | (57,102 | ) | $ | (27,829 | ) | $ | (87,603 | ) | $ | (51,362 | ) | $ | (223,896 | ) | |||||
CAPITAL EXPENDITURES |
$ | 153,392 | $ | 1,085 | $ | 53,334 | $ | 44 | $ | 207,855 | ||||||||||
TOTAL ASSETS |
$ | 647,889 | $ | 66,810 | $ | 958,710 | $ | 799,619 | $ | 2,473,028 | ||||||||||
During the six months ended June 30, 2010, all of the coal division’s revenue arose from coal
sales in Mongolia to three customers. Total revenues by customer were $20.2 million, $10.8 million
and $0.6 million, respectively.
28
Table of Contents
IVANHOE MINES LTD.
Notes to the Consolidated Financial Statements
(Stated in U.S. dollars unless otherwise noted; tabular amounts in thousands)
| 16. | SEGMENT DISCLOSURES (Continued) |
| Three Months Ended June 30, 2010 | ||||||||||||||||||||
| Development | Exploration | Coal | Corporate | Consolidated | ||||||||||||||||
REVENUE |
$ | — | $ | — | $ | 17,668 | $ | — | $ | 17,668 | ||||||||||
COST OF SALES |
||||||||||||||||||||
Production and delivery |
— | — | (10,901 | ) | — | (10,901 | ) | |||||||||||||
Depreciation and depletion |
— | — | (2,304 | ) | — | (2,304 | ) | |||||||||||||
Write-down of carrying value of inventory |
— | — | — | — | — | |||||||||||||||
COST OF SALES |
— | — | (13,205 | ) | — | (13,205 | ) | |||||||||||||
EXPENSES |
||||||||||||||||||||
Exploration |
(7,887 | ) | (17,289 | ) | (14,307 | ) | — | (39,483 | ) | |||||||||||
General and administrative |
— | — | — | (14,730 | ) | (14,730 | ) | |||||||||||||
Depreciation |
(6 | ) | (262 | ) | (25 | ) | (61 | ) | (354 | ) | ||||||||||
Accretion of asset retirement obligations |
(22 | ) | — | (26 | ) | — | (48 | ) | ||||||||||||
TOTAL EXPENSES |
(7,915 | ) | (17,551 | ) | (27,563 | ) | (14,791 | ) | (67,820 | ) | ||||||||||
OPERATING LOSS |
(7,915 | ) | (17,551 | ) | (9,895 | ) | (14,791 | ) | (50,152 | ) | ||||||||||
OTHER INCOME (EXPENSES) |
||||||||||||||||||||
Interest income |
882 | 54 | 649 | 953 | 2,538 | |||||||||||||||
Interest expense |
— | — | (4,974 | ) | (3,304 | ) | (8,278 | ) | ||||||||||||
Accretion of convertible credit facilities |
— | — | (11 | ) | (4,524 | ) | (4,535 | ) | ||||||||||||
Foreign exchange gains (losses) |
31 | (8 | ) | (187 | ) | (4,695 | ) | (4,859 | ) | |||||||||||
Unrealized losses on long-term investments |
— | — | (4,509 | ) | — | (4,509 | ) | |||||||||||||
Unrealized (losses) gains on other long-term investments |
— | — | (48 | ) | 837 | 789 | ||||||||||||||
Realized gain on redemption of other long-term investments |
— | — | — | 26 | 26 | |||||||||||||||
Change in fair value of derivative |
— | — | — | — | — | |||||||||||||||
Change in fair value of embedded derivatives |
— | — | 72,233 | — | 72,233 | |||||||||||||||
Loss on conversion of convertible credit facility |
— | — | — | — | — | |||||||||||||||
Write-down of carrying value of long-term investments |
— | — | — | (161 | ) | (161 | ) | |||||||||||||
Gain on sale of long-term investment |
— | — | — | — | — | |||||||||||||||
(LOSS) INCOME
BEFORE INCOME TAXES AND OTHER ITEMS |
(7,002 | ) | (17,505 | ) | 53,258 | (25,659 | ) | 3,092 | ||||||||||||
(Provision) recovery for income taxes |
(2 | ) | (378 | ) | 618 | (1,546 | ) | (1,308 | ) | |||||||||||
Share of loss of significantly influenced investees |
— | (217 | ) | — | (12,934 | ) | (13,151 | ) | ||||||||||||
NET (LOSS) INCOME FROM CONTINUING OPERATIONS |
(7,004 | ) | (18,100 | ) | 53,876 | (40,139 | ) | (11,367 | ) | |||||||||||
INCOME FROM DISCONTINUED OPERATIONS |
— | — | — | — | — | |||||||||||||||
NET (LOSS) INCOME |
(7,004 | ) | (18,100 | ) | 53,876 | (40,139 | ) | (11,367 | ) | |||||||||||
NET LOSS (INCOME) ATTRIBUTABLE TO NONCONTROLLING
INTERESTS |
2,159 | 2,862 | (23,685 | ) | — | (18,664 | ) | |||||||||||||
NET
(LOSS) INCOME ATTRIBUTABLE TO IVANHOE MINES LTD. |
$ | (4,845 | ) | $ | (15,238 | ) | $ | 30,191 | $ | (40,139 | ) | $ | (30,031 | ) | ||||||
CAPITAL EXPENDITURES |
$ | 147,440 | $ | 560 | $ | 20,385 | $ | 22 | $ | 168,407 | ||||||||||
TOTAL ASSETS |
$ | 647,889 | $ | 66,810 | $ | 958,710 | $ | 799,619 | $ | 2,473,028 | ||||||||||
During the three months ended June 30, 2010, all of the coal division’s revenue arose from
coal sales in Mongolia to three customers. Total revenues by customer were $11.2 million, $5.9
million and $0.6 million, respectively.
29
Table of Contents
IVANHOE MINES LTD.
Notes to the Consolidated Financial Statements
(Stated in U.S. dollars unless otherwise noted; tabular amounts in thousands)
| 17. | FAIR VALUE ACCOUNTING |
The ASC establishes a fair value hierarchy that prioritizes the inputs to valuation
techniques used to measure fair value. The hierarchy gives the highest priority to
unadjusted quoted prices in active markets for identical assets or liabilities and the lowest
priority to unobservable inputs. The three levels of the fair value hierarchy are as follows:
| Level 1: | Quoted prices in active markets for identical assets or
liabilities that the reporting entity has the ability to access at the measurement
date. |
||
| Level 2: | Quoted prices in markets that are not active, or inputs that are
observable, either directly or indirectly, for substantially the full term of the
asset or liability. |
||
| Level 3: | Prices or valuation techniques that require inputs that are both
significant to the fair value measurement and unobservable. |
The following table sets forth the Company’s assets and liabilities measured at fair value on
a recurring basis by level within the fair value hierarchy. Assets and liabilities are
classified in their entirety based on the lowest level of input that is significant to the
fair value measurement.
| Fair Value at June 30, 2011 | ||||||||||||||||
| Total | Level 1 | Level 2 | Level 3 | |||||||||||||
Assets: |
||||||||||||||||
Short-term investments |
$ | 15,003 | $ | 15,003 | $ | — | $ | — | ||||||||
Long-term investments |
105,819 | 105,819 | — | — | ||||||||||||
Other long-term investments |
306,121 | 60,031 | — | 246,090 | ||||||||||||
| $ | 426,943 | $ | 180,853 | $ | — | $ | 246,090 | |||||||||
Liabilities: |
||||||||||||||||
Embedded derivative liability |
121,236 | — | 121,236 | — | ||||||||||||
| $ | 121,236 | $ | — | $ | 121,236 | $ | — | |||||||||
| Fair Value at December 31, 2010 | ||||||||||||||||
| Total | Level 1 | Level 2 | Level 3 | |||||||||||||
Assets: |
||||||||||||||||
Short-term investments |
$ | 98,373 | $ | 98,373 | $ | — | $ | — | ||||||||
Long-term investments |
113,666 | 113,458 | 208 | — | ||||||||||||
Other long-term investments |
191,816 | 45,173 | — | 146,643 | ||||||||||||
| $ | 403,855 | $ | 257,004 | $ | 208 | $ | 146,643 | |||||||||
Liabilities: |
||||||||||||||||
Rights offering derivative liability |
$ | 766,238 | $ | 766,238 | $ | — | $ | — | ||||||||
Embedded derivative liability |
154,877 | — | 154,877 | — | ||||||||||||
| $ | 921,115 | $ | 766,238 | $ | 154,877 | $ | — | |||||||||
30
Table of Contents
IVANHOE MINES LTD.
Notes to the Consolidated Financial Statements
(Stated in U.S. dollars unless otherwise noted; tabular amounts in thousands)
| 17. | FAIR VALUE ACCOUNTING (Continued) |
The Company’s short-term and long-term investments are classified within Level 1 and 2 of the
fair value hierarchy as they are valued using quoted market prices of certain investments, as
well as quoted prices for similar investments.
The Company’s other long-term investments are classified within Level 1 and 3 of the fair
value hierarchy and consist of Long-Term Notes, T-Bill, tax prepayments and Money Market
investments.
The Company’s rights offering derivative liability is classified within Level 1 of the fair
value hierarchy as it is valued using quoted market prices for the rights.
The Company’s embedded derivative liability, included within the convertible credit facility
(Note 11), is classified within Level 2 of the fair value hierarchy as it is determined using
a Monte Carlo simulation valuation model, which uses readily observable market inputs.
The table below sets forth a summary of changes in the fair value of the Company’s Level 3
financial assets for the six months ended June 30, 2011.
| Long-Term | Tax | |||||||||||||||
| Notes | T-Bills | Prepayments | Totals | |||||||||||||
Balance, December 31, 2010 |
$ | 29,763 | $ | 80,394 | $ | 36,486 | $ | 146,643 | ||||||||
Additions |
— | — | 100,000 | 100,000 | ||||||||||||
Accrued interest |
— | 1,445 | 562 | 2,007 | ||||||||||||
Foreign exchange gains |
867 | — | — | 867 | ||||||||||||
Fair value redeemed |
(83 | ) | — | — | (83 | ) | ||||||||||
Unrealized gains (losses) included in
other comprehensive income |
— | 2,425 | (7,343 | ) | (4,918 | ) | ||||||||||
Unrealized gains included in
earnings |
1,574 | — | — | 1,574 | ||||||||||||
Balance, June 30, 2011 |
$ | 32,121 | $ | 84,264 | $ | 129,705 | $ | 246,090 | ||||||||
31
Table of Contents
IVANHOE MINES LTD.
Notes to the Consolidated Financial Statements
(Stated in U.S. dollars unless otherwise noted; tabular amounts in thousands)
| 18. | DISCLOSURES REGARDING FINANCIAL INSTRUMENTS |
| (a) | The estimated fair value of Ivanhoe Mines’ financial instruments was as follows: |
| June 30, | December 31, | |||||||||||||||
| 2011 | 2010 | |||||||||||||||
| Carrying | Fair | Carrying | Fair | |||||||||||||
| Amount | Value | Amount | Value | |||||||||||||
Cash and cash equivalents |
$ | 1,575,079 | $ | 1,575,079 | $ | 1,264,031 | $ | 1,264,031 | ||||||||
Short-term investments |
15,003 | 15,003 | 98,373 | 98,373 | ||||||||||||
Accounts receivable |
100,267 | 100,267 | 65,741 | 65,741 | ||||||||||||
Long-term investments |
191,903 | 288,151 | 151,191 | 280,181 | ||||||||||||
Other long-term investments |
306,121 | 306,121 | 191,816 | 191,816 | ||||||||||||
Accounts payable and
accrued liabilities |
393,274 | 393,274 | 260,528 | 260,528 | ||||||||||||
Amounts due under credit facilities |
57,836 | 57,836 | 54,695 | 54,695 | ||||||||||||
Rights offering derivative liability |
— | — | 766,238 | 766,238 | ||||||||||||
Convertible credit facility |
218,955 | 218,955 | 254,596 | 254,596 | ||||||||||||
The fair value of Ivanhoe Mines’ long-term investments was determined by reference to
published market quotations, which may not be reflective of future values.
The fair value of Ivanhoe Mines’ other long-term investments, consisting of the
Long-Term Notes, T-Bill, tax prepayments and Money Market investments, was determined
by considering the best available data regarding market conditions for such
investments, which may not be reflective of future values.
The fair value of the rights offering derivative liability was determined by reference
to published market quotations, which may not be reflective of future value.
The fair value of the CIC convertible debenture was estimated to approximate the
aggregate carrying amount of the CIC convertible credit facility liability and interest
payable. This aggregate carrying amount includes the estimated fair value of the
embedded derivative liability which was determined using a Monte Carlo simulation
valuation model.
The fair values of Ivanhoe Mines’ remaining financial instruments were estimated to
approximate their carrying values, due primarily to the immediate or short-term
maturity of these financial instruments.
| (b) | Ivanhoe Mines is exposed to credit risk with respect to its accounts receivable.
The significant concentrations of credit risk are situated in Mongolia and Australia.
Ivanhoe Mines does not mitigate the balance of this risk in light of the credit
worthiness of its major debtors. |
||
| (c) | Ivanhoe Mines is exposed to interest rate risk with respect to the variable rates
of interest incurred on the amounts due under credit facilities (Note 10). Interest
rate risk is concentrated in Canada. Ivanhoe Mines does not mitigate the balance of
this risk. |
32
Table of Contents
IVANHOE MINES LTD.
Notes to the Consolidated Financial Statements
(Stated in U.S. dollars unless otherwise noted; tabular amounts in thousands)
| 19. | CONTINGENCIES |
Due to the size, complexity and nature of the Company’s operations, various legal and tax
matters arise in the ordinary course of business. The Company accrues for such items when a
liability is both probable and the amount can be reasonably estimated. In the opinion of
management, these matters will not have a material effect on the consolidated financial
statements of the Company.
33
Table of Contents
 |
Share Information |
Investor
Information |
||||
| Interim Report for the three and six month periods ended June 30, 2011. | Common shares of Ivanhoe Mines Ltd. are listed for trading under the symbol IVN on the New York Stock Exchange, NASDAQ and the Toronto Stock Exchange. | All financial reports, news releases and corporate information can be accessed on our web site at www.ivanhoe-mines.com | ||||
At August 12, 2011, the Company had 710.6 million common shares issued and outstanding and stock options outstanding for 19.7 million additional common shares. |
Transfer Agents and Registrars CIBC Mellon Trust Company 320 Bay Street Toronto, Ontario, Canada M5H 4A6 Toll free in North America: 1-800-387-0825 |
Contact Information Investors: Bill Trenaman Media: Bob Williamson Suite 654-999 Canada Place Vancouver, B.C., Canada V6C 3E1 Email: info@ivanhoemines.com Tel: (604) 688-5755 |
||||
INTRODUCTION
This discussion and analysis of the financial condition and results of operations (MD&A) of
Ivanhoe Mines Ltd. should be read in conjunction with the unaudited consolidated financial
statements of Ivanhoe Mines Ltd. and the notes thereto for the three- and six-month periods ended
June 30, 2011, and with the audited consolidated financial statements of Ivanhoe Mines Ltd. and the
notes thereto for the year ended December 31, 2010. These financial statements have been prepared
in accordance with generally accepted accounting principles in the United States of America (U.S.
GAAP). In this MD&A, unless the context otherwise dictates, a reference to the Company refers to
Ivanhoe Mines Ltd. and a reference to Ivanhoe Mines refers to Ivanhoe Mines Ltd., together with its
subsidiaries. Additional information about the Company, including its Annual Information Form, is
available at www.sedar.com.
References to “C$” refer to Canadian dollars, “A$” to Australian dollars, and “$” to United States
dollars.
This discussion and analysis contains forward-looking statements. Please refer to the cautionary
language on page 35.
The effective date of this MD&A is August 12, 2011.
OVERVIEW
IVANHOE MINES ANNOUNCES FINANCIAL RESULTS
AND REVIEW OF OPERATIONS FOR THE SECOND QUARTER OF 2011
AND REVIEW OF OPERATIONS FOR THE SECOND QUARTER OF 2011
HIGHLIGHTS DURING THE QUARTER AND SUBSEQUENT WEEKS
| • | Overall construction at Oyu Tolgoi continues to advance on schedule and on budget, and
reached a 30.8% level of completion at the end of Q2’11. Key elements of the project,
including the concentrator complex, primary crusher and tailings-thickening ponds, remain
ahead of schedule. Commercial production is expected to commence in the first half of 2013. |
| • | Pre-stripping for the phase-one, open-pit mine on the gold-rich Southern Oyu deposits at
Oyu Tolgoi began in August 2011. A ground-breaking ceremony for the open pit was held to
officially mark the commencement of pre-stripping operations. |
| • | The development of the first lift of the phase-two, underground block-cave mine at the
Hugo North Deposit continued successfully during Q2’11. Lateral mine development 1,300
metres below surface at Hugo North is on schedule, achieving an advance during Q2’11 of 1,190
metres, for a total of 7,939 metres completed since tunneling started in 2008. |
Table of Contents
IVANHOE MINES LTD.
MANAGEMENT’S DISCUSSION AND ANALYSIS OF FINANCIAL CONDITION AND
RESULTS OF OPERATIONS
(Stated in U.S. dollars, except where noted)
| • | Official approvals were received in early May 2011 that enabled the Oyu Tolgoi Project to
begin construction of a 95-kilometre, high-voltage power transmission line to deliver
electricity expected to be imported from China to supply the initial mining operation. The
erection of towers for the 220-kilovolt transmission line in Mongolia is expected to be
completed later this year and the line stringing is planned for spring 2012 to coincide with
anticipated stringing on the Chinese side of the border. |
| • | Contract negotiations for the supply and sale of copper-gold-silver concentrate to be
produced at Oyu Tolgoi are expected to be finalized in Q4’11. Most of the concentrate
initially is expected to be delivered to smelters in China. |
| • | Oyu Tolgoi’s site-based construction workforce totalled approximately 14,200 at the end
of July 2011, with approximately 11,200 working on site each day and the balance on leave.
Approximately 7,320 Mongolians were employed at the Oyu Tolgoi site, with an additional
3,500 Mongolians participating in offsite training. |
| • | On July 12, 2011, Ivanhoe Mines and BHP Billiton Ltd. began a new exploration drilling
program on their copper-molybdenum-gold discovery at the Ulaan Khud North joint-venture
licence, approximately 10 kilometres north of Oyu Tolgoi. The first drill hole, UKD056, is
planned to test its target to a depth of 1,100 metres. |
| • | During Q2’11, Ivanhoe Mines’ 57%-owned subsidiary, SouthGobi Resources (SGQ: TSX; 1878:
HK), reported coal sales of $47.3 million from its Ovoot Tolgoi mine in southern Mongolia,
representing approximately 1.05 million tonnes of coal sold to customers in China at an
average realized price of approximately $54 per tonne. |
| • | Ivanhoe Mines’ 62%-owned subsidiary, Ivanhoe Australia (IVA: ASX &TSX), continued to focus
on the development of its Merlin high-grade molybdenum and rhenium project in the Cloncurry
region of Queensland. Construction of the decline to access the Merlin and Little Wizard
deposits had progressed to 1,097 metres by the end of Q2’11. |
| • | Altynalmas Gold, 50%-owned by Ivanhoe Mines, is continuing its drilling program designed
to further delineate resources and reserves to NI 43-101 standards at the Kyzyl Gold Project
in Kazakhstan. |
2
Table of Contents
IVANHOE
MINES LTD.
MANAGEMENT’S DISCUSSION AND ANALYSIS OF FINANCIAL CONDITION AND
RESULTS OF OPERATIONS
(Stated in U.S. dollars, except where noted)
MANAGEMENT’S DISCUSSION AND ANALYSIS OF FINANCIAL CONDITION AND
RESULTS OF OPERATIONS
(Stated in U.S. dollars, except where noted)
INDEX
The MD&A is comprised of the following sections:
1. Selected Quarterly Data |
||||
2. Review of Operations |
||||
A. Core Interests and Activities |
||||
i. Mongolia |
||||
ii. Australia |
||||
iii. Kazakhstan |
||||
iv. Other Exploration |
||||
v. Other Developments |
||||
B. Discontinued Operations |
||||
C. Administrative and Other |
||||
3. Liquidity and Capital Resources |
||||
4. Share Capital |
||||
5. Outlook |
||||
6. Off-Balance-Sheet Arrangements |
||||
7. Contractual Obligations |
||||
8. Changes in Accounting Policies |
||||
9. Critical Accounting Estimates |
||||
10. Recent Accounting Pronouncements |
||||
11. International Financial Reporting Standards |
||||
12. Risks and Uncertainties |
||||
13. Related-Party Transactions |
||||
14. Changes in Internal Control over Financial Reporting |
||||
15. Qualified Person |
||||
16. Cautionary Statements |
||||
17. Forward-Looking Statements |
3
Table of Contents
IVANHOE
MINES LTD.
MANAGEMENT’S DISCUSSION AND ANALYSIS OF FINANCIAL CONDITION AND
RESULTS OF OPERATIONS
(Stated in U.S. dollars, except where noted)
MANAGEMENT’S DISCUSSION AND ANALYSIS OF FINANCIAL CONDITION AND
RESULTS OF OPERATIONS
(Stated in U.S. dollars, except where noted)
SELECTED QUARTERLY DATA
($ in millions of dollars, except per share information)
| Quarter Ended | ||||||||||||||||
| Jun-30 | Mar-31 | Dec-31 | Sep-30 | |||||||||||||
| 2011 | 2011 | 2010 | 2010 | |||||||||||||
Revenue |
$ | 47.3 | $ | 20.2 | $ | 41.6 | $ | 6.6 | ||||||||
Cost of sales |
(49.7 | ) | (20.3 | ) | (46.4 | ) | (14.9 | ) | ||||||||
Exploration expenses |
(68.6 | ) | (46.2 | ) | (59.6 | ) | (48.1 | ) | ||||||||
General and administrative |
(19.5 | ) | (25.3 | ) | (46.4 | ) | (15.0 | ) | ||||||||
Foreign exchange gains (losses) |
2.3 | 3.2 | 6.6 | 5.3 | ||||||||||||
Change in fair value of derivative |
— | (432.5 | ) | 135.7 | — | |||||||||||
Change in fair value of embedded derivatives |
70.4 | (36.8 | ) | (20.0 | ) | 49.8 | ||||||||||
Net income (loss) from continuing operations |
0.6 | (492.5 | ) | 37.3 | (24.9 | ) | ||||||||||
Income (loss) from discontinued operations |
— | — | — | — | ||||||||||||
Net income (loss) |
0.6 | (492.5 | ) | 37.3 | (24.9 | ) | ||||||||||
Net income (loss) per share — basic |
||||||||||||||||
Continuing operations |
$ | 0.00 | $ | (0.79 | ) | $ | 0.07 | $ | (0.05 | ) | ||||||
Discontinued operations |
$ | 0.00 | $ | 0.00 | $ | 0.00 | $ | 0.00 | ||||||||
Total |
$ | 0.00 | $ | (0.79 | ) | $ | 0.07 | $ | (0.05 | ) | ||||||
Net income (loss) per share — diluted |
||||||||||||||||
Continuing operations |
$ | 0.00 | $ | (0.79 | ) | $ | 0.06 | $ | (0.05 | ) | ||||||
Discontinued operations |
$ | 0.00 | $ | 0.00 | $ | 0.00 | $ | 0.00 | ||||||||
Total |
$ | 0.00 | $ | (0.79 | ) | $ | 0.06 | $ | (0.05 | ) | ||||||
| Quarter Ended | ||||||||||||||||
| Jun-30 | Mar-31 | Dec-31 | Sep-30 | |||||||||||||
| 2010 | 2010 | 2009 | 2009 | |||||||||||||
Revenue |
$ | 17.7 | $ | 13.9 | $ | 9.9 | $ | 11.9 | ||||||||
Cost of sales |
(13.2 | ) | (20.3 | ) | (8.5 | ) | (8.6 | ) | ||||||||
Exploration expenses |
(39.5 | ) | (71.4 | ) | (67.2 | ) | (40.9 | ) | ||||||||
General and administrative |
(14.7 | ) | (8.3 | ) | (15.0 | ) | (12.5 | ) | ||||||||
Foreign exchange gains (losses) |
(4.9 | ) | 1.7 | 2.2 | 19.5 | |||||||||||
Change in fair value of embedded derivatives |
72.2 | (1.4 | ) | (45.0 | ) | — | ||||||||||
Loss on conversion of convertible credit facility |
— | (154.3 | ) | — | — | |||||||||||
Net income (loss) from continuing operations |
(30.0 | ) | (200.5 | ) | (138.7 | ) | (47.8 | ) | ||||||||
Income (loss) from discontinued operations |
— | 6.6 | 9.2 | (21.9 | ) | |||||||||||
Net income (loss) |
(30.0 | ) | (193.9 | ) | (129.5 | ) | (69.8 | ) | ||||||||
Net income (loss) per share — basic |
||||||||||||||||
Continuing operations |
$ | (0.06 | ) | $ | (0.44 | ) | $ | (0.32 | ) | $ | (0.12 | ) | ||||
Discontinued operations |
$ | 0.00 | $ | 0.01 | $ | 0.02 | $ | (0.05 | ) | |||||||
Total |
$ | (0.06 | ) | $ | (0.43 | ) | $ | (0.30 | ) | $ | (0.17 | ) | ||||
Net income (loss) per share — diluted |
||||||||||||||||
Continuing operations |
$ | (0.06 | ) | $ | (0.44 | ) | $ | (0.32 | ) | $ | (0.12 | ) | ||||
Discontinued operations |
$ | 0.00 | $ | 0.01 | $ | 0.02 | $ | (0.05 | ) | |||||||
Total |
$ | (0.06 | ) | $ | (0.43 | ) | $ | (0.30 | ) | $ | (0.17 | ) | ||||
4
Table of Contents
IVANHOE
MINES LTD.
MANAGEMENT’S DISCUSSION AND ANALYSIS OF FINANCIAL CONDITION AND
RESULTS OF OPERATIONS
(Stated in U.S. dollars, except where noted)
MANAGEMENT’S DISCUSSION AND ANALYSIS OF FINANCIAL CONDITION AND
RESULTS OF OPERATIONS
(Stated in U.S. dollars, except where noted)
REVIEW OF OPERATIONS
Ivanhoe Mines is an international exploration and development company with activities
concentrated in Central Asia and the Asia Pacific Region. The Company’s principal assets include:
| • | A 100% interest in Oyu Tolgoi Netherlands BV that, together with a related company, holds
a 66% interest in Oyu Tolgoi LLC, whose principal asset is the Oyu Tolgoi copper-gold-silver
project now under construction in southern Mongolia. |
| • | A 57% interest in SouthGobi Resources, which is selling coal produced at its Ovoot Tolgoi
mine in southern Mongolia to customers in China and is conducting ongoing exploration and
development programs at several other Mongolian coal prospects. |
| • | A 62% interest in Ivanhoe Australia, which is developing its copper-gold discoveries in
the Cloncurry region of Queensland, Australia, and also is planning the development of its
wholly-owned Merlin Project, a high-grade molybdenum and rhenium deposit. |
| • | A 50% interest in Altynalmas Gold, which owns the Kyzyl Gold Project that hosts the
Bakyrchik and Bolshevik gold deposits in Kazakhstan. |
In Q2’11, Ivanhoe Mines recorded net income of $0.6 million ($0.00 per share), compared to a net
loss of $30.0 million ($0.06 per share) in Q2’10, which was an increase of $30.6 million. Results
for Q2’11 mainly were affected by $68.6 million in exploration expenses, $49.7 million in cost of
sales, $19.5 million in general and administrative expenses and $3.3 million in interest expense.
These amounts were offset by coal revenue of $47.3 million, a $70.4 million change in the fair
value of embedded derivatives, a $44.8 million in share of gain of significantly influenced
investees, $4.9 million in interest income and $2.3 million in mainly unrealized foreign exchange
gains.
Exploration expenses of $68.6 million in Q2’11 increased $29.1 million from $39.5 million in Q2’10.
Exploration expenses included $22.8 million spent in Mongolia ($23.2 million in Q2’10), primarily
for Oyu Tolgoi and Ovoot Tolgoi, and $43.0 million incurred by Ivanhoe Australia ($14.9 million in
Q2’10). Exploration costs are charged to operations in the period incurred and often represent the
bulk of Ivanhoe Mines’ operating loss for that period.
Ivanhoe Mines’ cash position, on a consolidated basis at June 30, 2011, was $1.6 billion. As at
August 12, 2011, Ivanhoe Mines’ consolidated cash position was approximately $1.3 billion.
5
Table of Contents
IVANHOE
MINES LTD.
MANAGEMENT’S DISCUSSION AND ANALYSIS OF FINANCIAL CONDITION AND
RESULTS OF OPERATIONS
(Stated in U.S. dollars, except where noted)
MANAGEMENT’S DISCUSSION AND ANALYSIS OF FINANCIAL CONDITION AND
RESULTS OF OPERATIONS
(Stated in U.S. dollars, except where noted)
A. CORE INTERESTS AND ACTIVITIES
Ivanhoe Mines’ main activities during Q2’11 were the mine development activities at the Oyu
Tolgoi Project and exploration activities largely focused in Australia and Mongolia.
In Q2’11, Ivanhoe Mines capitalized $653.9 million in additions to property, plant and equipment
for the Oyu Tolgoi Project.
In Q2’11, Ivanhoe Mines expensed $68.6 million in exploration activities, compared to $39.5 million
in Q2’10.
Exploration costs generally are charged to operations in the period incurred until it has been
determined that a property has economically recoverable reserves, at which time subsequent
exploration costs and the costs incurred to develop a property are capitalized.
Summary of exploration expenditures by location:
| Quarter Ended | ||||||||
| June 30, | ||||||||
| (Stated in $000’s of dollars) | 2011 | 2010 | ||||||
Mongolia |
||||||||
Oyu Tolgoi |
$ | 6,009 | $ | 7,887 | ||||
Coal Division |
14,136 | 14,307 | ||||||
Other Mongolia Exploration |
2,617 | 982 | ||||||
| 22,762 | 23,176 | |||||||
Australia |
43,021 | 14,868 | ||||||
Indonesia |
1,389 | 732 | ||||||
Other |
1,407 | 707 | ||||||
| $ | 68,579 | $ | 39,483 | |||||
MONGOLIA
OYU TOLGOI COPPER-GOLD-SILVER PROJECT (66% owned)
The Oyu Tolgoi Project is approximately 550 kilometres south of Ulaanbaatar, Mongolia’s
capital city, and 80 kilometres north of the Mongolia-China border. Mineralization on the property
consists of porphyry-style copper, gold, silver and molybdenum contained in a linear structural
trend (the Oyu Tolgoi Trend) with a strike length that extends over 23 kilometres. Mineral
resources have been identified in a series of deposits throughout this trend. They include, from
south to north, the Heruga
Deposit, the Southern Oyu deposits (Southwest Oyu, South Oyu, Wedge and Central Oyu), and the Hugo
Dummett deposits (Hugo South, Hugo North and Hugo North Extension).
6
Table of Contents
IVANHOE
MINES LTD.
MANAGEMENT’S DISCUSSION AND ANALYSIS OF FINANCIAL CONDITION AND
RESULTS OF OPERATIONS
(Stated in U.S. dollars, except where noted)
MANAGEMENT’S DISCUSSION AND ANALYSIS OF FINANCIAL CONDITION AND
RESULTS OF OPERATIONS
(Stated in U.S. dollars, except where noted)
Ivanhoe Mines began capitalizing Oyu Tolgoi development costs on April 1, 2010. During Q2’11,
additions to property, plant and equipment for the Oyu Tolgoi Project totalled $653.9 million,
which included development costs. In Q2’11, Ivanhoe Mines incurred exploration expenses of $6.0
million at Oyu Tolgoi, compared to $7.9 million incurred in Q2’10.
Construction of the Oyu Tolgoi copper-gold-silver complex advancing toward planned start
of commercial production in the first half of 2013
The Oyu Tolgoi Project initially is being developed as an open-pit operation, with the first phase
of mining planned to start at the near-surface Southern Oyu deposits, which include Southwest Oyu
and Central Oyu. A copper concentrator plant, related facilities and necessary infrastructure that
will support an initial throughput of 100,000 tonnes of ore per day are being constructed to
process ore scheduled to be mined from the Southern Oyu open pit. Commercial production of
copper-gold-silver concentrate is projected to begin in the first half of 2013.
Along with the surface activities, an 85,000-tonne-per-day underground block-cave mine also is
being developed at the Hugo North Deposit, with initial production expected to begin in 2015. The
throughput capacity of the concentrator plant is expected to be expanded to approximately 160,000
tonnes of ore per day when the underground mine begins production.
Fluor Corporation is in charge of overall Oyu Tolgoi program management, as well as services
related to engineering, procurement and construction management for the ore processing plant and
mine-related infrastructure, such as roads, water supply, a regional airport and administration
buildings.
Current operations activities related to the phase-one concentrator are focused on finalizing the
operational readiness plan. Detailed commissioning, operation and maintenance plans are being
developed for all the components of the concentrator circuits. Representatives of various
manufacturers and engineering groups are assisting with the preparation of the operational
readiness plan. At the open pit, assembly of the mining fleet is continuing. Pre-stripping for the
open-pit mine began in early August 2011.
In early May 2011, the Oyu Tolgoi Project received the final approvals required to proceed with
construction of a 220-kilovolt power transmission line from Oyu Tolgoi along a 95-kilometre route
south to the Mongolia-China international border. The construction approval from Mongolia’s Energy
Regulatory Authority and a land-use contract from the governor of Khanbogd soum (township), which
includes Oyu Tolgoi, are key to the plan to import electricity from China to operate the Oyu Tolgoi
complex during its initial four years of commercial production. Contracts have been awarded to
Mongolian companies for construction of the power transmission line to the border. Tower
construction is scheduled for completion during Q4’11, with line stringing expected to commence in
spring 2012. The transmission line is planned to be extended south of the border by Chinese
contractors to tie into the neighbouring Inner Mongolian electrical grid.
Discussions between the Mongolian and Chinese governments were held during Q2’11 and are expected
to continue in Q3’11 to conclude a bilateral agreement that would secure the supply of
electrical power from China. Subject to negotiations and final agreement, the remaining permits,
commercial arrangements and power-purchase tariffs are expected to be expedited to ensure that
imported power will be available at the Oyu Tolgoi site by Q3’12. In the meantime, additional
diesel-powered generating capacity has been approved to meet the project’s requirements during the
remaining stages of construction.
7
Table of Contents
IVANHOE
MINES LTD.
MANAGEMENT’S DISCUSSION AND ANALYSIS OF FINANCIAL CONDITION AND
RESULTS OF OPERATIONS
(Stated in U.S. dollars, except where noted)
MANAGEMENT’S DISCUSSION AND ANALYSIS OF FINANCIAL CONDITION AND
RESULTS OF OPERATIONS
(Stated in U.S. dollars, except where noted)
The long-term Investment Agreement for the development and operation of Oyu Tolgoi, signed by
Ivanhoe Mines, Rio Tinto and the Government of Mongolia on October 6, 2009, recognized that the
reliable supply of electrical power is critical to the project and that Ivanhoe Mines has the right
to initially obtain electrical power from inside or outside Mongolia, including China. The
agreement also established a) that Ivanhoe Mines has the right to build or sub-contract
construction of a coal-fired power plant at an appropriate site in Mongolia’s South Gobi Region to
supply Oyu Tolgoi and b) that all of the project’s power requirements would be sourced from within
Mongolia no later than four years after Oyu Tolgoi begins commercial production.
Oyu Tolgoi LLC is finalizing a study on alternative power-generation arrangements that could be
implemented. To date, the study demonstrates that advancing the construction of a coal-fired power
plant would be the most appropriate option. Additional studies are underway to provide “bridging
power” to allow one of the two concentrator circuits to be brought into operation pending the
supply of electricity from the Chinese grid or from a purpose-built coal-fired power plant in
Mongolia. As specified in the Investment Agreement, alternatives could include the building or
sub-contracting of a coal-fired power plant at an appropriate site to supply the Oyu Tolgoi
Project. Such an approach would require Mongolian Government permits, the negotiation of commercial
agreements with the Mongolian Government and coal suppliers, and the arrangement of financing for
the accelerated establishment of a power plant. Should such alternatives prove to be our first
source of power it may impact the Oyu Tolgoi construction schedule and could adversely affect the
project’s ability to achieve full commercial production in 2013, as planned. In addition,
construction of a power plant, although expected as part of the Oyu Tolgoi Project’s future
development plans, is not included in the current capital cost estimates for 2011 and 2012 and
therefore would require additional financing, which is not contemplated as part of the Company’s
current financing plan. The Heads of Agreement signed with Rio Tinto in December 2010 provided that
if construction of a 50-megawatt or greater power plant was started before January 1, 2015, the
construction would be funded by loans from Rio Tinto, with 40% of the outstanding balance to be
repaid in 2015 and the remainder in 2016.
Overall construction of the Oyu Tolgoi Project was 30.8% complete at the end of Q2
Overall construction reached a 30.8% level of completion at the end of Q2’11. Total capital
invested in the project by the end of Q2’11 was approximately $2.5 billion.
Major updates for Q2’11 and plans for Q3’11 include:
| • | Pre-stripping, as part of the construction of the phase-one open-pit mine to recover ore
from the Southern Oyu deposits, began in early August 2011. |
| • | The development of the first lift of the phase two, underground block-cave mine at the
Hugo North Deposit continued successfully during Q2’11. Lateral mine development 1,300
metres below surface at Hugo North is on schedule, achieving an advance during Q2’11 of
1,190 metres, for a total of 7,939 metres completed since tunneling started in 2008. |
| • | Oyu Tolgoi’s site-based construction workforce totalled approximately 14,200 at the end
of July 2011, with approximately 11,200 working on site each day and the balance on leave.
Approximately 7,320 Mongolians were employed at the Oyu Tolgoi site, with an additional
3,500 Mongolians participating in offsite training. These Mongolian employees will form the
bulk of the eventual production workforce, particularly in the open-pit operations. |
8
Table of Contents
IVANHOE
MINES LTD.
MANAGEMENT’S DISCUSSION AND ANALYSIS OF FINANCIAL CONDITION AND
RESULTS OF OPERATIONS
(Stated in U.S. dollars, except where noted)
MANAGEMENT’S DISCUSSION AND ANALYSIS OF FINANCIAL CONDITION AND
RESULTS OF OPERATIONS
(Stated in U.S. dollars, except where noted)
| • | Construction progress on the concentrator and primary crusher is continuing ahead of
schedule. The concentrator was 37.8% complete at the end of Q2’11, ahead of the plan of
35.8%. The primary crusher achieved its final lift for the foundation and work on the
coarse-ore storage facility, conveyors and tailings thickeners also is making good
progress. Work has begun on the tailings storage facility and exterior cladding of the
concentrator shell is well advanced. |
| • | Overall infrastructure progress at end of Q2’11 was 24.4% slightly behind the plan of
27.1%. Late delivery of materials and equipment impacted progress. Refractory material is
being expedited to site to allow lining of the central heating plant to start early in
Q3’11. The phase-one raw-water supply also is slightly behind forecast and recovering from
delays in permitting and land-use approvals. Recovery plans are in place and some of the
lost time is expected to be recovered in Q3’11. |
| • | Construction of the headframe at Shaft #2 resumed in early August and sinking is
expected to start in Q4’11. Works are progressing to schedule on the ancillary facilities
associated with the sinking and construction of the shaft. Planning now being completed
will allow shaft sinking to begin with the use of a partially completed headframe, which
will permit postponement of the headframe construction until spring 2012 and eliminate
special measures that otherwise would be required to pour concrete during the coming
winter. |
| • | Safety performance continues to remain a primary focus, especially in light of the large
number of new employees on site during the peak construction period. |
| • | A Russian ban on exports of diesel fuel, including those to Mongolia, was in place
during May and early June 2011. Russia provides more than 90% of Mongolia’s diesel fuel.
Oyu Tolgoi successfully managed this supply shortage through rationing and securing a
nine-million-litre offsite storage facility. A study will begin in Q3’11 to review options
to further expand onsite diesel storage to increase security of diesel supply. |
| • | A wide range of technical, social, environmental and commercial reviews were conducted
in Mongolia in support of project financing activities. |
| • | Conclusion of the competitive bidding process for the main infrastructure works is
expected in Q3’11, which include on-site infrastructure required to support mine
operations. |
| • | Contract negotiations are close to finalization for the supply and sale of
copper-gold-silver concentrate to be produced from the project. Most of the concentrate
initially is expected to be sold to smelters in China. Final term sheets with smelters are
expected to be finalized in Q4’11. |
| • | Discussions are continuing with relevant government agencies on the outbound copper
concentrate logistics. Oyu Tolgoi is investigating the ability to use large trailer-train
trucks to increase efficiencies across the Mongolia-China border. |
9
Table of Contents
IVANHOE
MINES LTD.
MANAGEMENT’S DISCUSSION AND ANALYSIS OF FINANCIAL CONDITION AND
RESULTS OF OPERATIONS
(Stated in U.S. dollars, except where noted)
MANAGEMENT’S DISCUSSION AND ANALYSIS OF FINANCIAL CONDITION AND
RESULTS OF OPERATIONS
(Stated in U.S. dollars, except where noted)
Phase one construction on budget
In December 2010, Ivanhoe Mines announced that a $2.3 billion capital budget had been approved for
2011 in what is the peak year of construction activity on the first phase of the Oyu Tolgoi
Project. In addition to the $2.3 billion capital budget, approval also was received for an
additional $150 million budget for the 2011 Ulaanbaatar office operations and $100 million for the
second tax prepayment that was made to the Mongolian Government in June 2011. At the end of Q2’11,
$1.4 billion of the 2011 budget had been spent by the project, which was under the forecast of $1.5
billion.
Capital required from January 1, 2011, through to completion of the phase-one,
100,000-tonne-per-day project and the commencement of commercial production is expected to total
approximately $4.5 billion.
The 2011-2013 estimate of $4.5 billion includes approximately $550 million in remaining
contingencies and escalation allowances although no provision has been made for foreign exchange
variances or cost increases on construction commitments that may be incurred.
Capital invested in phase-one construction to support future expansion
The engineering and construction stages have recognized the need to accommodate a major increase in
ore-processing capacity in the future while minimizing potential disruption to operations that will
be underway at that time.
Wherever possible, Oyu Tolgoi has taken the opportunity to allow for expansion with minimal impact
on operations. Oyu Tolgoi’s plans call for initial production of 100,000 tonnes of ore per day,
which is expected to increase to between 150,000 and 160,000 tonnes per day when ore from the
underground mine becomes available. To facilitate this expansion, Oyu Tolgoi has constructed a
third ore-reclaim tunnel that will increase the capacity to feed ore to the concentrator by 50-60%
over the initial rate of production. To cater to future increased production, a pipeline has been
installed that, with minor modifications, could supply water for processing up to 160,000 tonnes a
day. Oyu Tolgoi also has allowed for expansion in the concentrator by adding space in the flotation
area and installing other equipment to handle higher production rates. Studies examining options to
process additional ore are ongoing.
Pre-stripping of open-pit mine started as planned in Q3’11
Pre-stripping of overburden to gain access to ore in the phase-one open-pit mine began on schedule
in August 2011 using the construction fleet, which will be replaced by the mining fleet as assembly
is completed. It is expected that the first units of the mining fleet will join in the
pre-stripping during Q3’11. All operational-readiness activities also are on schedule.
10
Table of Contents
IVANHOE
MINES LTD.
MANAGEMENT’S DISCUSSION AND ANALYSIS OF FINANCIAL CONDITION AND
RESULTS OF OPERATIONS
(Stated in U.S. dollars, except where noted)
MANAGEMENT’S DISCUSSION AND ANALYSIS OF FINANCIAL CONDITION AND
RESULTS OF OPERATIONS
(Stated in U.S. dollars, except where noted)
Underground development of Hugo North Mine proceeding on schedule
The development of the first lift of the phase-two, underground block-cave mine at the Hugo North
Deposit continued successfully during Q2’11. Lateral mine development 1,300 metres below surface at
Hugo North is on schedule, achieving an advance of 1,190 metres during Q2’11.
Progress continued through Q2’11, with raise-pilot drilling from the 512-metre level to the
1,300-metre level. The ventilation raise-pilot-hole broke through to the 1,300-metre level in
Q2’11. Initial reaming from the 1,300 metre level has proven difficult and additional grouting is
being undertaken to stabilize the ground. Work is progressing on contracting for a second
raise-pilot drilling program that will help to increase lateral development performance.
The underground development of Shaft #1 is expected to connect with the bottom of Shaft #2 in early
2013 and production from the first lift of the Hugo North block-cave mine is scheduled to begin in
2015.
Rio Tinto working with Ivanhoe Mines to complete international project-finance package
of up to $4.0 billion
Ivanhoe Mines, Rio Tinto, a core lending group and their advisers are working together to finalize
an approximate $4.0 billion project-finance facility for the Oyu Tolgoi Project; their objective is
to sign loan documentation by the end of this year.
The initial core lending group of Mandated Lead Arrangers is comprised of European Bank for
Reconstruction and Development, International Finance Corporation, Export Development Canada, BNP
Paribas and Standard Chartered Bank. USExim Bank — together with its adviser, Standard Bank —
MIGA and EFIC recently joined the lender group and have commenced their due diligence process with
a view to supporting the financing.
Recent meetings with lenders also were attended by Erdenes MGL LLC (the Mongolian state-owned
shareholder that owns 34% of Oyu Tolgoi LLC) and representatives from Oyu Tolgoi LLC.
A term sheet outlining the main terms and conditions common to all lenders is well advanced.
Lenders have built a financial model and are expected to finalize their technical, marketing,
financial, legal, insurance, environmental and social due diligence later this year. When loan
documentation is agreed upon and signed, drawdowns will be subject to conditions precedent
currently being negotiated.
Prior to first drawdown, it is expected that Ivanhoe Mines may utilize a $1.8 billion interim
funding facility to be provided by Rio Tinto as bridge financing. This facility will be repaid from
the first drawdown of the project finance facility.
Final terms of a third-party project-finance facility for the Oyu Tolgoi Project remain subject to
the approval of the Oyu Tolgoi LLC Board of Directors, the Ivanhoe Mines Board of Directors and the
joint Ivanhoe Mines-Rio Tinto Technical Committee.
11
Table of Contents
IVANHOE
MINES LTD.
MANAGEMENT’S DISCUSSION AND ANALYSIS OF FINANCIAL CONDITION AND
RESULTS OF OPERATIONS
(Stated in U.S. dollars, except where noted)
MANAGEMENT’S DISCUSSION AND ANALYSIS OF FINANCIAL CONDITION AND
RESULTS OF OPERATIONS
(Stated in U.S. dollars, except where noted)
Skills training and community programs well advanced
The Oyu Tolgoi Project’s staffing strategy relies heavily on the utilization of Mongolian nationals
being developed and trained during ongoing construction activities. At the end of July 2011,
approximately 7,320 Mongolians were working on the project at the development site. In addition,
more than 3,500 Mongolians were participating in offsite training.
Priorities for Q2’11 were to finalize the strategy, process, action plan, calendar and tools for
the assessment of existing employees on the construction site for potential transition to
operations.
Oyu Tolgoi has committed more than $58 million in funding over five years toward technical and
vocational training in Mongolia. Major training activities in Q2’11 included:
| • | Upgrades began of facilities and curriculums at five government technical training
colleges across Mongolia. |
| • | Initial construction of facilities and dormitories for Dalanzadgad technical training
school in the South Gobi Region. |
| • | Continued development of training materials for operations at the concentrator, the
open-pit and the underground mine. |
| • | Continued selection process for overseas university scholarships. |
| • | English-language training began for all trades trainees. |
Principal community development activities in Q2’11 included:
| • | The signing of community agreements with neighbouring communities in the South Gobi
Region. These agreements establish the terms of Oyu Tolgoi’s long-term relationships with
the local communities. |
| • | More than $300,000 dollars in low-interest, micro-credit loans have been provided to
South Gobi businesses and entrepreneurs in the past six months as part of the $1.0 million
funding facility financed by Oyu Tolgoi with a leading Mongolian micro-credit bank. |
| • | Oyu Tolgoi has engaged with local communities on a wide range of cultural heritage and
environmental protection programs. |
| • | Oyu Tolgoi launched a local herder procurement support program aimed at providing
financial assistance and mandated procurement of goods and services from herders in
communities surrounding the mine area. As part of this program, two water wells were
drilled for households located close to the Gunii Khooloi deep underground aquifer. |
| • | An opening ceremony was held at the Dalanzadgad supplier training, evaluation and
development centre that Oyu Tolgoi has funded to provide business incubation services for
South Gobi entrepreneurs. More than 150 South Gobi suppliers and entrepreneurs are
supplying goods and services to Oyu Tolgoi, which is an increase of 300% in just 12 months. |
12
Table of Contents
IVANHOE
MINES LTD.
MANAGEMENT’S DISCUSSION AND ANALYSIS OF FINANCIAL CONDITION AND
RESULTS OF OPERATIONS
(Stated in U.S. dollars, except where noted)
MANAGEMENT’S DISCUSSION AND ANALYSIS OF FINANCIAL CONDITION AND
RESULTS OF OPERATIONS
(Stated in U.S. dollars, except where noted)
Third agreed prepayment of Mongolian taxes made in Q2
On June 7, 2011, Ivanhoe Mines and Oyu Tolgoi LLC made the third and final prepayment to the
Government of Mongolia in a ceremony held in Ulaanbaatar and attended by senior project
representatives and government cabinet ministers. The $100 million prepayment, which was due by
June 30 this year, completed a total prepayment package of $250 million that was an attendant
arrangement to the long-term Oyu Tolgoi Investment Agreement signed in October 2009. Together with
the second prepayment of $50 million made after the Investment Agreement took effect March 31,
2010, the third prepayment will accrue interest at the rate of 1.59% after tax and will be credited
against the project’s future taxes and royalties beginning January 2012. The first payment of $100
million was made by Oyu Tolgoi LLC at the time the Investment Agreement was signed, in October
2009, through the purchase of a Treasury Bill from the government that had a face value of $115
million payable within five years after issuance.
Ivanhoe Mines signs Amended and Restated Shareholders’ Agreement
In June 2011, Ivanhoe Mines and Rio Tinto agreed with the Mongolian government to execute the
Amended and Restated Shareholders’ Agreement, which provided limited amendments to the Oyu Tolgoi
Shareholders’ Agreement that was signed in conjunction with the Investment Agreement in October
2009. Ivanhoe Mines is funding the Mongolian government’s 34% share of the project’s initial
capital costs. The interest rate to be applied to the repayment of the government’s share of the
costs for amounts incurred after January 31, 2011, has been reduced to LIBOR plus 6.5%, down from
the previous rate of 9.9%, adjusted for the US CPI. The interest-rate adjustment was made at the
government’s request and took into consideration the higher costs of capital that prevailed in 2009
following the global economic crisis.
Exploration
Exploration drilling continued in Q2’11
During Q2’11, Ivanhoe Mines continued its drilling program on the Oyu Tolgoi Project with 10,279
metres of surface resource geology drilling (including geotechnical and mine-development
investigation holes), 2,680 metres of underground geotechnical drilling and 5,280 metres of surface
exploration diamond drilling.
Exploration drilling is ongoing at Heruga North. Hole OTD1510D included a 374-metre intercept, from
1,498 to 1,872 metres down hole, that graded 0.26 grams of gold per tonne, 0.56% copper and 86 ppm
molybdenum on the eastern flank of Heruga North (including a 158-metre interval, from 1,646 to
1,804 metres, that graded 0.37 g/t gold, 0.71% copper and 125 ppm molybdenum, or 1.01% copper
equivalent) and ended before reaching the western mineralized zone in unmineralized quartz
monzodiorite, at 2,736 metres down hole. OTD1510E is a daughter hole off OTD1510D and is designed
to further test the eastern flank of the quartz monzodiorite, where bornite-rich mineralization is
thought to occur, similar to earlier discoveries in the Hugo Dummett ore body. OTD1569, an infill
hole between the Heruga Deposit and Heruga North 200 metres to the south of the OTD1510 section,
was
lost in moderate-grade copper mineralization at 1,848 metres after passing through a 350-metre
section of moderate-to-weak mineralization. Assay results are pending.
13
Table of Contents
IVANHOE
MINES LTD.
MANAGEMENT’S DISCUSSION AND ANALYSIS OF FINANCIAL CONDITION AND
RESULTS OF OPERATIONS
(Stated in U.S. dollars, except where noted)
MANAGEMENT’S DISCUSSION AND ANALYSIS OF FINANCIAL CONDITION AND
RESULTS OF OPERATIONS
(Stated in U.S. dollars, except where noted)
A total of 1,815 metres of drilling was completed on the Shivee Tolgoi licence. Hole EGD154
currently is testing the northern extension to the Hugo Dummett ore body, some 150 metres north of
the last significant mineralization.
Detailed geological mapping is continuing in the area around the Javkhlant prospect at the
southwestern end of the Oyu Tolgoi mineralized trend. An area of Devonian cover rocks larger than
previously recognized has been mapped.
Map: Exploration Holes — April to July 2011
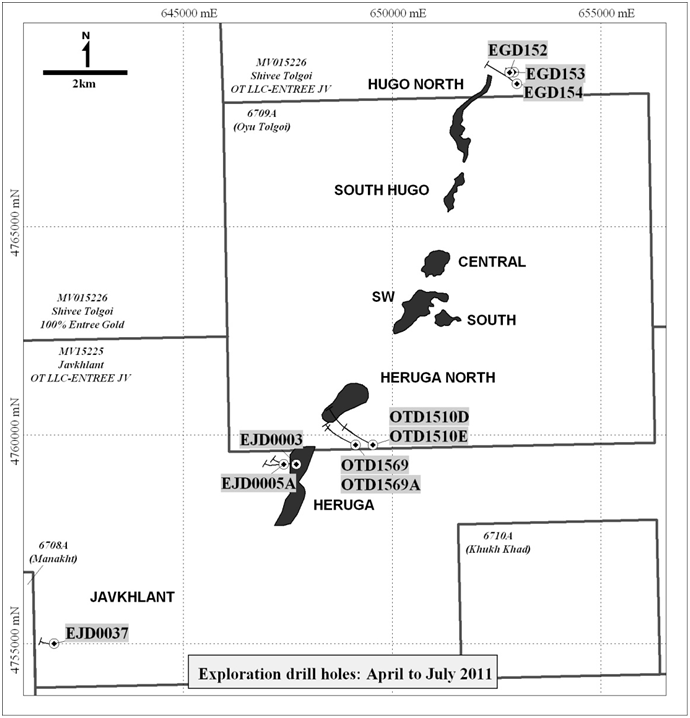
14
Table of Contents
IVANHOE
MINES LTD.
MANAGEMENT’S DISCUSSION AND ANALYSIS OF FINANCIAL CONDITION AND
RESULTS OF OPERATIONS
(Stated in U.S. dollars, except where noted)
MANAGEMENT’S DISCUSSION AND ANALYSIS OF FINANCIAL CONDITION AND
RESULTS OF OPERATIONS
(Stated in U.S. dollars, except where noted)
Exploration at Ulaan Khud North (50% owned)
New copper-molybdenum-gold zone discovered on Ivanhoe-BHP Billiton joint-venture licence
In March 2011, Ivanhoe Mines announced that Ivanhoe Mines and BHP Billiton Ltd. had discovered a
new zone of shallow copper-molybdenum-gold mineralization approximately 10 kilometres north of the
Oyu Tolgoi Project. The discovery, known as Ulaan Khud North, extended the known strike length of
the Oyu Tolgoi mineralized system by an additional three kilometres to the north, to a new total of
more than 23 kilometres.
Ulaan Khud North is located on a 19,625-hectare exploration licence that is part of Ivanhoe Mines’
joint-venture partnership with BHP Billiton, formed in 2005. BHP Billiton has earned a 50% interest
in the joint venture, which includes the Ulaan Khud North property, by spending $8 million in
exploration costs and conducting an airborne survey using BHP Billiton’s proprietary
FalconTM gravity gradiometer system over the Oyu Tolgoi area.
A Pre-Mining Agreement for the Ulaan Khud licence was received from the Government of Mongolia in
March 2011. It specifies that Ivanhoe Mines and BHP Billiton have three years to conduct additional
exploration, complete an environmental impact study, prepare a final feasibility study and gain
approval for the design for the project. The agreement also specifies that a Technical and
Economical Study to mine the deposit is required to be delivered to the Mineral Resources Authority
of Mongolia by June 30, 2013.
A 3-D Induced Polarization survey with resistivity and Magneto Telluric commenced in May 2011 and
to date has identified five geophysical targets. Drilling commenced on the first target on July 12,
2011. Hole UKD056 is designed to test the first target to a depth of 1,100 metres.
MONGOLIA
SOUTHGOBI RESOURCES (57% owned)
Ongoing expansion of SouthGobi’s Ovoot Tolgoi coal mine
SouthGobi continues to mine and sell coal produced at its Ovoot Tolgoi Mine in Mongolia’s South
Gobi Region, approximately 40 kilometres north of the Shivee Khuren-Ceke crossing at the
Mongolia-China border.
The major trans-shipment terminal at Ceke, across the border in China, has rail connections
directly to key industrial markets in China. A north-south railway line connects Ceke with
Jiayuguan City in Gansu Province and other markets in China’s interior. Another east-west railway
line connects Ceke to Linhe, an industrial city in China’s eastern Inner Mongolia. This line has a
stated initial capacity of approximately 15 million tonnes per year, with a planned increase to 25
million tonnes per year.
15
Table of Contents
IVANHOE MINES LTD.
MANAGEMENT’S DISCUSSION AND ANALYSIS OF FINANCIAL CONDITION AND
RESULTS OF OPERATIONS
RESULTS OF OPERATIONS
(Stated in U.S. dollars, except where noted)
The Ovoot Tolgoi Mine’s proximity to the Shivee Khuren-Ceke border crossing allows SouthGobi’s
coal to be transported by truck on an unpaved road from the mine site to China. On August 2, 2011,
the State Property Committee of Mongolia awarded the tender to construct a paved highway from Ovoot
Tolgoi to the Mongolia-China border to consortium partners NTB LLC and SouthGobi’s Mongolian
operating subsidiary, SouthGobi Sands LLC (NTB-SGS). NTB-SGS now has the right to conclude a
15-year build, operate and transfer contract under the Mongolian Law on Concessions. NTB-SGS
intends to commence construction this year of the paved highway with an intended carrying capacity
upon completion of in excess of 20 million tonnes of coal per year.
During 2010, SouthGobi began construction of a coal-handling facility at the Ovoot Tolgoi Mine. The
facility will include a 300-tonne-capacity dump hopper, which will receive run-of-mine coal from
Ovoot Tolgoi and feed a rotary breaker that will size coal to a maximum of 50 millimetres and
reject oversize ash. Commissioning of the rotary breaker is expected before the end of 2011. The
facility also will include dry-air separation as an additional stage, through the insertion of
dry-air separation modules, and is expected to be completed by mid-2012. Interim screening
operations will continue at Ovoot Tolgoi until the permanent coal-handling facility is completed.
In Q2’11, SouthGobi had sales of approximately 1.05 million tonnes at an average realized price of
approximately $54 per tonne. This was an improvement over the sale of approximately 450,000 tonnes
in Q2’10 at an average realized selling price of $43 per tonne. Revenue increased from $17.7
million in Q2’10 to $47.3 million in Q2’11, due to the higher realized average prices and higher
sales volume.
SouthGobi’s revenues are net of royalties. SouthGobi is subject to a 5% royalty on all coal sold
based on a set reference price per tonne that is published monthly by the Mongolian government.
Effective January 1, 2011, SouthGobi also became subject to a sliding-scale royalty of up to 5%
based on the set reference price of coal. Based on the reference price for Q2’11, SouthGobi was
subject to a 3% sliding royalty in addition to the 5% base royalty. The weighted average reference
price for Q2’11 was $95 per tonne.
Cost of sales of $49.7 million for Q2’11 was $36.5 million higher than Q2’10 ($13.2 million). Cost
of sales is comprised of the cost of the product sold, inventory write-downs, mine administration
costs, equipment depreciation, depletion of pre-production stripping costs and stock-based
compensation costs. The increase is due to the significantly higher sales volume, higher diesel
costs and a $10.6 million inventory write-down.
Mineral licence received for Soumber
On June 3, 2011, SouthGobi announced it had successfully registered a resource associated with the
Soumber Deposit with the Mineral Resource Authority of Mongolia (MRAM) and on July 6, 2011,
SouthGobi announced that MRAM had issued SouthGobi a 10,993-hectare mining licence. The new mining
licence was granted for an initial term of 30 years, with an option for two 20-year extensions.
Regional coal exploration
A number of SouthGobi’s exploration licences are associated with the broader Ovoot Tolgoi Complex
and Soumber Deposit.
16
Table of Contents
IVANHOE MINES LTD.
MANAGEMENT’S DISCUSSION AND ANALYSIS OF FINANCIAL CONDITION AND
RESULTS OF OPERATIONS
RESULTS OF OPERATIONS
(Stated in U.S. dollars, except where noted)
The exploration program in 2011 will include drilling, trenching and geological reconnaissance. Key
exploration targets for 2011 include additional drilling at the Soumber Deposit and additional
areas within the Ovoot Tolgoi mining licences that have not been fully explored.
AUSTRALIA
IVANHOE AUSTRALIA (62% owned)
Ivanhoe Australia’s key projects, all situated on granted Mining Leases, are Merlin, Mount Dore and
Mount Elliott. During Q2’11, work focused on progressing the Merlin pre-feasibility study and
decline, the copper-gold study, finalizing the Mount Dore heap-leach scoping study and commencing
underground work at the Osborne and Kulthor deposits.
Ivanhoe Australia incurred exploration expenses of $43.0 million in Q2’11, compared to $14.9
million in Q2’10. The $28.1 million increase was largely due to work on the Merlin decline, work on
the underground at the Osborne and Kulthor deposits and work on the various ongoing studies.
Merlin molybdenum and rhenium development study
The Merlin molybdenum and rhenium deposit is the lower-most mineralized zone in the Mount Dore
deposit and starts near the surface and dips east at between 45 and 55 degrees. To date, drilling
has defined mineralization to vertical depths ranging from 60 to 580 metres and over a strike
length of 1,000 metres. The overall mineralized zone at Merlin has an average true width of 3.9
metres and ranges between two and 20 metres. The mineralization zone consists of high-grade
breccias and a lower-grade, generally thicker disseminated zone. Mineralization thins to the north,
where the copper, zinc and gold content increases, while to the south it flattens and pinches out.
The Little Wizard Deposit represents the southern-most extent of the Merlin molybdenum
mineralization of economic interest found to date.
During Q2’11, Ivanhoe Australia focused on continuing the Merlin pre-feasibility study, with
further optimization work required on the mining, flotation circuit and roaster design prior to
completion of the study. Ivanhoe Australia expects that the requirement for further studies may
result in the commencement of Merlin production in late 2013. Ivanhoe Australia plans to construct
a purpose-built processing facility for Merlin and expects to use the existing Osborne concentrator
for the copper-gold business.
At the end of Q2’11, construction of the Merlin decline was on schedule and budget. The decline
face had progressed to 1,097 metres and was adjacent to the Little Wizard deposit at the end of
Q2’11. Ivanhoe Australia plans to develop an access drive into the Little Wizard deposit to
undertake geotechnical tests to assess potential mining methods and obtain bulk samples for
metallurgical test work.
Copper-gold study underway
During Q2’11, Ivanhoe Australia continued work on the copper-gold study to identify potential ore
feed for the Osborne concentrator from the Kulthor, Osborne underground, Osborne open pit and
Starra 276
deposits. The study is assessing these near-term production opportunities, including mining and
processing production rates and capital and operating cost profiles.
17
Table of Contents
IVANHOE MINES LTD.
MANAGEMENT’S DISCUSSION AND ANALYSIS OF FINANCIAL CONDITION AND
RESULTS OF OPERATIONS
RESULTS OF OPERATIONS
(Stated in U.S. dollars, except where noted)
Ivanhoe Australia began underground work at Osborne and Kulthor during Q2’11, with the first blast
at Kulthor on May 1, 2011. By the end of Q2’11, a total of 296 metres were advanced on both
deposits. Access to Kulthor deposit is expected by the end of August 2011.
Ivanhoe Australia plans to complete a Preliminary Economic Assessment (a NI 43-101-compliant
report) during Q3’11.
Mount Dore scoping study
Ivanhoe Australia plans to complete a Preliminary Economic Assessment (a NI 43-101-compliant
report) for the Mount Dore copper leach project in Q3’11.
Mount Elliott scoping study started
During Q2’11, Ivanhoe Australia continued work on the Mount Elliott scoping study and plans to
finalize the study in Q1’12. The study plans to evaluate all mining options for the large-tonnage
deposit, including the potential to extract copper-gold ore from the high-grade SWAN zone for
processing at Osborne.
The scoping study expects to identify the future development path for the project, including
additional resource drilling, metallurgical testwork and infrastructure requirements.
Regional exploration
Ivanhoe Australia directly holds 22 Exploration Permits for Minerals (EPMs) covering a total of
2,862 square kilometres and 28 Mining Leases (MLs) totalling 104.8 square kilometres in the
Cloncurry area. Ivanhoe Australia also has applications for 21 EPMs covering 3,205 square
kilometres and three MLs covering 10.6 square kilometres in process. Joint Venture EPMs cover 579
square kilometres.
During Q2’11, work focused on drilling copper-gold targets at Houdini and along the Mount Dore
trend. The drilling included 12,133 metres of diamond drilling and 654 metres of
reverse-circulation drilling.
Gain on investment in Exco
During Q2’11, Ivanhoe Australia recognized a gain of $45.7 million in relation to its investment in
Exco Resources Limited (Exco). Ivanhoe Australia owns approximately 22.8% of Exco. On June 30,
2011, Exco completed the sale of its Cloncurry Copper Project to Xstrata Copper for A$175 million.
Exco intends to return a proportion of the proceeds to its shareholders. Ivanhoe Australia expects
to receive approximately A$30 million by the end of October 2011.
18
Table of Contents
IVANHOE MINES LTD.
MANAGEMENT’S DISCUSSION AND ANALYSIS OF FINANCIAL CONDITION AND
RESULTS OF OPERATIONS
RESULTS OF OPERATIONS
(Stated in U.S. dollars, except where noted)
KAZAKHSTAN
Kyzyl Gold Project (50% owned)
Altynalmas Gold holds 100% ownership of the Kyzyl Gold Project in northeastern Kazakhstan. The
Kyzyl Gold Project contains the Bakyrchik and Bolshevik gold deposits, as well as a number of
satellite deposits. Altynalmas Gold is proceeding to advance the development of the Kyzyl Gold
Project following the successful completion of the pre-feasibility study in 2010.
New Bakyrchik East Mineral Resource Gold deposit boosts total gold resources at Kyzyl Project
On August 3, 2011, Ivanhoe Mines announced a NI 43-101-compliant Mineral Resource estimate for the
new Bakyrchik East Deposit at the Kyzyl Gold Project. The Mineral Gold Resources at Bakyrchik East
are hosted in two lenses comprised of more than 20 sub-zones that collectively measure 2,000 metres
along strike by 1,500 metres down dip, extending from surface to a depth of 800 metres.
Roscoe Postle Associates Inc. (RPA), an internationally recognized consulting firm, estimates the
Bakyrchik East Deposit at 6.8 million tonnes of Inferred Mineral Resources grading 6.0 grams of
gold per tonne, containing 1.3 million ounces of gold.
The Bakyrchik East Gold Deposit, consisting of the Globoki Log and Promezhutochny zones, is located
800 metres east along strike from the eastern edge of the main Bakyrchik Gold Deposit within the
Kyzyl Shear Zone. The RPA estimate is based on drilling results that were available to July 11,
2011. Further details can be found in Ivanhoe Mines’ August 3, 2011 press release.
Exploration continuing with 60,000 metres of drilling planned
Altynalmas Gold is continuing its drilling program designed to further delineate resources and
reserves at the Kyzyl Gold Project. A total of 24,170 metres were drilled during Q2’11 on the
Bakyrchik Mining Lease (42,667 metres year to date). For the remainder of the year, an additional
11,333 metres are planned to be drilled on the Bakyrchik Mining Lease and a further 50,000 metres
are planned to begin the delineation of the numerous satellite deposits on the surrounding
exploration licence.
Recent drilling activities have been focused on exploring the down-dip extensions of known gold
resources, as well as on the flanks of known gold lenses.
Feasibility study nearing completion
The definitive feasibility study on the Kyzyl Gold Project, focusing on the Bakyrchik Deposit,
which began in 2010 is nearing completion and is expected to be issued in Q4’11. Additional test
work and verification of the process of stabilization of wastes containing arsenic that are
generated during the roasting of sulphide ore are required prior to the issuance of the study.
The feasibility study is being conducted in conjunction with detailed engineering work. Tender
requests have been circulated by Altynalmas Gold for the fabrication of long-lead items, including
an oxygen
plant and dry-grinding mill. The placement of long-lead items and commencement of early
construction works are expected later this year, with scheduled commissioning of a
1.5-million-tonne per year fluidized-bed roasting plant in early 2014.
19
Table of Contents
IVANHOE MINES LTD.
MANAGEMENT’S DISCUSSION AND ANALYSIS OF FINANCIAL CONDITION AND
RESULTS OF OPERATIONS
RESULTS OF OPERATIONS
(Stated in U.S. dollars, except where noted)
Subsoil use amendment granted
On June 22, 2011, Amendment No. 3 to Contract 120 dated July 2, 1997, (the Amendment) was executed
by the Republic of Kazakhstan’s Ministry of Industry and New Technology.
In terms of the Amendment, BMV has agreed to amend the tax stabilization provisions and has agreed
to pay taxes in accordance with prevailing Kazakh tax legislation and pay import duties in
accordance with prevailing customs legislation. BMV will need to comply with Kazakh local content
legislation passed in June 2010. Under the Amendment, the Kazakh local content for the period 2011
to 2013 is 40% to 50% for goods and 50% to 75% for works and services.
OTHER EXPLORATION
During Q2’11, Ivanhoe Mines had active exploration programs in Indonesia, Mongolia and the
Philippines. These programs principally are being conducted through joint ventures and are focused
on porphyry-related copper-gold and epithermal gold-silver deposits. Exploration involved detailed
data reviews, field traverses and systematic rock-chip and channel sampling of all properties,
trenching and, in some cases, exploration diamond drilling. In addition, Ivanhoe Mines conducted
detailed reviews of projects and prospective belts in Latin America. Exploration was ongoing in all
these regions at the end of Q2’11.
OTHER DEVELOPMENTS
Rio Tinto’s stake in Ivanhoe Mines increases to 46.5%
In June 2011, Ivanhoe Mines received $501.6 million from Rio Tinto following Rio Tinto’s decision
to exercise all remaining share-purchase warrants that it holds in Ivanhoe Mines. Rio Tinto
exercised all the remaining Series B and Series C warrants that it was granted as part of the 2006
and 2007 financing agreements associated with Rio Tinto’s original investment in Ivanhoe Mines. Rio
Tinto previously had committed to convert all the warrants to shares by January 2012. The
additional shares increased Rio Tinto’s ownership stake in Ivanhoe Mines from 42.0% to 46.5%.
The $501.6 million from the exercise of the warrants is being applied toward the construction of
the first phase of the Oyu Tolgoi copper-gold-silver complex.
The Rio Tinto payment comprised of $119.7 million for the purchase of 14.1 million Ivanhoe Mines
shares at $8.51 per share from the exercise of the remaining Series B Warrants; $379.3 million for
40.2 million Ivanhoe Mines shares priced at $9.43 per share from the Series C warrants; and C$2.5
million for 0.8 million anti-dilution warrants.
20
Table of Contents
IVANHOE MINES LTD.
MANAGEMENT’S DISCUSSION AND ANALYSIS OF FINANCIAL CONDITION AND
RESULTS OF OPERATIONS
RESULTS OF OPERATIONS
(Stated in U.S. dollars, except where noted)
The increased level of ownership entitled Rio Tinto to nominate one additional director to the 14-
member Ivanhoe Mines board, increasing to seven the total number of Ivanhoe Mines directors
nominated by Rio Tinto. On July 14, 2011, Dan Larsen, Rio Tinto’s Controller and Global Head of
Planning and Reporting, was appointed to the Ivanhoe Mines board. Howard Balloch, a director of
Ivanhoe Mines since 2005, relinquished his position to enable Mr. Larsen’s nomination.
Including proceeds from the warrants, Rio Tinto’s combined investment in Ivanhoe Mines since
October
2006 amounts to $3.5 billion through the purchase of shares, the exercise of warrants and a
converted debt facility.
The maximum level of ownership interest in Ivanhoe Mines that Rio Tinto may achieve — through the
exercise of its right to subscribe, from time to time, for additional Ivanhoe Mines shares and
permitted open market purchases of common shares — is capped at 49% until the current standstill
limitation expires on January 18, 2012.
Table: Present and potential Rio Tinto investments in Ivanhoe Mines and levels of ownership
| Investment | % interest | |||||||
| Item | (US$ billions) | in IVN | ||||||
Total of Rio Tinto investments at June 30, 2011 (1)(2) |
$3.5 | 46.5 | % | |||||
Subscription right (3) |
Up to approx. $0.7 | 48.5 | % | |||||
3.7 million shares purchased in open market (4) |
$0.1 | 49.0 | % | |||||
Total potential Rio Tinto investment |
Up to approx. $4.3 | 49.0 | % | |||||
(before Interim Funding Facility) |
||||||||
| 1. | Includes $0.5 billion paid by Rio Tinto to Robert Friedland and Citibank. Rio Tinto
purchased 10.0 million shares from Mr. Friedland at $25.34 per share and 10.0 million shares
from Citibank at $25.34 per share and 1.5 million shares at $13.88 per share. Ivanhoe Mines
did not receive any proceeds from the transactions. |
|
| 2. | Based on 710.3 million shares outstanding as of June 30, 2011. |
|
| 3. | Rio Tinto is not required to exercise its subscription right, in which case there may be
no proceeds from the subscription right. The exercise price of the subscription right will
be based on the prevailing market price at the time of exercise. For example, up to
approximately $0.7 billion of proceeds assumes a $25.00 per share exercise price on all
shares issuable under the subscription right. |
|
| 4. | If acquired, the per-share purchase price will be based on the prevailing market price at
the time of acquisition. For example, $0.1 billion assumes a $25.00 per share purchase price
on all 3.7 million shares. Ivanhoe Mines will not receive any proceeds from the
transactions. |
21
Table of Contents
IVANHOE MINES LTD.
MANAGEMENT’S DISCUSSION AND ANALYSIS OF FINANCIAL CONDITION AND
RESULTS OF OPERATIONS
RESULTS OF OPERATIONS
(Stated in U.S. dollars, except where noted)
Arbitration update
The arbitration proceeding between Ivanhoe Mines and Rio Tinto regarding Ivanhoe Mines’
Shareholders’ Rights Plan resumed during June 2011 following the expiry of a six-month suspension
that was agreed upon by the companies as part of the Heads of Agreement signed in December 2010.
Ivanhoe Mines is confident that the rights plan, overwhelmingly supported by 95% of the votes cast
by its minority shareholders more than a year ago, is not in breach of any of Rio Tinto’s existing
contractual rights. Ivanhoe Mines is committed to vigorously protecting the rights of all of its
shareholders and has received very strong support from institutional shareholders for its
insistence that all shareholders be treated fairly during any takeover bid.
Ivanhoe Mines submitted a statement of defence in October 2010 that rejected Rio Tinto’s claim and
also filed a counter-claim contending that Rio Tinto had breached certain covenants in its October
2006 private placement agreement with Ivanhoe Mines. Rio Tinto has filed a statement of defence to
the Ivanhoe Mines counterclaim.
Ivanhoe Mines received proceeds of $103 million from Monywa Trust
In early August 2011, Ivanhoe Mines received $103 million as payment for a promissory note
from the Monywa Trust.
Ivanhoe Mines transferred the ownership of its former 50% interest in the Monywa Project to the
independent, third-party Monywa Trust in February 2007. In exchange for the interest, the Monywa
Trust issued an unsecured, non-interest-bearing promissory note to an Ivanhoe Mines subsidiary.
Ivanhoe Mines has held no interest in the Monywa Project, and has had no involvement with the
administration and operation of the Monywa Project, since 2007.
After acquiring Ivanhoe Mines’ former interest in the Monywa Project, the independent trustee
engaged an independent service provider to help the Trust identify potential buyers. Ivanhoe Mines
had no involvement in discussions between the Monywa Trust and its service provider or with
potential purchasers or with the ultimate sale of the interest in July 2011.
B. DISCONTINUED OPERATIONS
In February 2005, Ivanhoe Mines sold the Savage River Iron Ore Project in Tasmania, Australia,
for two initial cash payments totalling $21.5 million, plus a series of five contingent, annual
payments that commenced on March 31, 2006. From 2006 to 2009, these contingent payments totalled
$116.4 million.
During 2010, Ivanhoe Mines received two payments totalling $6.4 million in relation to the fifth
annual contingent payment. The original purchaser of the Savage River Project has disputed the
estimated $22.1 million remaining balance of the fifth annual contingent payment. Ivanhoe Mines is
committed to collecting the full amount of the fifth annual contingent payment and has included the
total estimated
amount of $22.1 million in accounts receivable as at June 30, 2011. In 2010, Ivanhoe Mines
initiated arbitration proceedings by filing a Request for Arbitration with the ICC International
Court of Arbitration (ICC). In January 2011, the ICC determined that the location of arbitration is
Sydney, Australia, and that the matter will be submitted to a sole arbitrator. The arbitration
hearing is scheduled to occur in December 2011.
22
Table of Contents
IVANHOE MINES LTD.
MANAGEMENT’S DISCUSSION AND ANALYSIS OF FINANCIAL CONDITION AND
RESULTS OF OPERATIONS
RESULTS OF OPERATIONS
(Stated in U.S. dollars, except where noted)
To date, Ivanhoe Mines has received $144.4 million in proceeds from the sale of the Savage River
Project.
C. ADMINISTRATIVE AND OTHER
General and administrative costs. General and administrative costs in Q2’11 were $19.5
million, an increase of $4.8 million from Q2’10 ($14.7 million). The increase was primarily due to
a $5.7 million increase in non-cash expenses in relation to stock options expense over Q2’10.
Interest income. Interest income in Q2’11 of $4.9 million was $2.4 million higher than Q2’10 ($2.5
million). The increase is largely attributable to a $1.9 million increase in interest income from
Ivanhoe Australia. Ivanhoe Australia’s cash balance has increased from Q2’10 as a result of its
September 2010 rights offering.
Interest expense. Interest expense in Q2’11 of $3.3 million was $5.0 million lower than Q2’10 ($8.3
million). Included in interest expense is $2.8 million (Q2’10 — $4.9 million) in interest incurred
by SouthGobi on the convertible debenture issued to CIC. The Q2’10 balance also included $3.0
million incurred by Ivanhoe Mines on the Rio Tinto convertible credit facility which was converted
in September 2010.
Foreign exchange gains. The $2.3 million foreign exchange gain during Q2’11 was mainly attributable
to the strengthening of the Canadian and Australian dollars against the U.S. dollar during the
quarter. The majority of this foreign exchange gain was unrealized at June 30, 2011.
Share of income of significantly influenced investees. The $44.8 million share of income of
significantly influenced investees in Q2’11 represents Ivanhoe Mines’ share of Exco Resources
N.L.’s income ($45.7 million) net of Ivanhoe Mines’ share of Altynalmas Gold’s loss ($0.9 million).
Change in fair value of embedded derivatives. The $70.4 million change in fair value of embedded
derivatives relates to the Q2’11 change in fair value of the SouthGobi CIC convertible debenture’s
embedded derivative liability.
23
Table of Contents
IVANHOE MINES LTD.
MANAGEMENT’S DISCUSSION AND ANALYSIS OF FINANCIAL CONDITION AND
RESULTS OF OPERATIONS
RESULTS OF OPERATIONS
(Stated in U.S. dollars, except where noted)
LIQUIDITY AND CAPITAL RESOURCES
Cash flow
Operating activities. The $119.4 million of cash used in operating activities in Q2’11
primarily was the result of $59.3 million in cash exploration expenditures, $11.3 million in cash
general and administrative expenditures and a $60.5 million change in non-cash operating working
capital.
Investing activities. The $679.7 million of cash used in investing activities in Q2’11 included
$601.6 million used in property, plant and equipment purchases mainly relating to Oyu Tolgoi
($519.9 million) and Ovoot Tolgoi ($79.5 million). Also included in investing activities was the
purchase by Oyu Tolgoi LLC of the $100.0 million tax prepayment. Offsetting these investments was
$23.1 million received on the redemption of other short-term investments.
Financing activities. The $500.2 million in cash provided by financing activities mainly was
attributable to $501.6 million received in June 2011 upon Rio Tinto exercising its warrants.
Liquidity and capital resources
At June 30, 2011, Ivanhoe Mines’ consolidated working capital was $1.4 billion, including cash
and cash equivalents of $1.6 billion, compared with working capital of $444.4 million and cash and
cash equivalents of $1.3 billion at December 31, 2010. Included in the June 30, 2011, cash and cash
equivalents balance of $1.6 billion was $282.7 million of SouthGobi’s cash and cash equivalents and
$94.5 million of Ivanhoe Australia’s cash and cash equivalents, which were not available for the
Company’s use.
As at August 12, 2011, Ivanhoe Mines’ consolidated cash position was approximately $1.3 billion.
Ivanhoe Mines, based on its current cash position, the value of investments in publicly-traded
subsidiaries and the availability of an interim credit facility with Rio Tinto, believes that its
existing funds should be sufficient to fund its minimum obligations, including general corporate
activities, for at least the next 12 months.
Ivanhoe Mines, Rio Tinto, a core lending group and their advisers are working together to finalize
an approximate $4.0 billion project-finance facility for the Oyu Tolgoi Project; their objective is
to sign loan documentation by the end of this year.
The initial core lending group of Mandated Lead Arrangers is comprised of European Bank for
Reconstruction and Development, International Finance Corporation, Export Development Canada, BNP
Paribas and Standard Chartered Bank. USExim Bank — together with its adviser, Standard Bank —
MIGA and EFIC recently joined the lender group and have commenced their due diligence process with
a view to supporting the financing.
24
Table of Contents
IVANHOE MINES LTD.
MANAGEMENT’S DISCUSSION AND ANALYSIS OF FINANCIAL CONDITION AND
RESULTS OF OPERATIONS
RESULTS OF OPERATIONS
(Stated in U.S. dollars, except where noted)
Recent meetings with lenders also were attended by Erdenes MGL LLC (the Mongolian state-owned
shareholder that owns 34% of Oyu Tolgoi LLC) and representatives from Oyu Tolgoi LLC.
A term sheet outlining the main terms and conditions common to all lenders is well advanced.
Lenders have built a financial model and are expected to finalize their technical, marketing,
financial, legal, insurance, environmental and social due diligence later this year. When loan
documentation is agreed upon and signed, drawdowns will be subject to conditions precedent
currently being negotiated.
Prior to first drawdown, it is expected that Ivanhoe Mines may utilize a $1.8 billion interim
funding facility to be provided by Rio Tinto as bridge financing. This facility will be repaid from
the first drawdown of the project finance facility.
Final terms of a third-party project-finance facility for the Oyu Tolgoi Project remain subject to
the approval of the Oyu Tolgoi LLC Board of Directors, the Ivanhoe Mines Board of Directors and the
joint Ivanhoe Mines-Rio Tinto Technical Committee.
Carrying out the development and exploration of the Oyu Tolgoi Project and the various other
mineral properties in which Ivanhoe Mines holds interests depends upon Ivanhoe Mines’ ability to
obtain financing through capital markets, sales of non-core assets or other means. Ivanhoe Mines
expects to be able to meet its minimum obligations from its existing financial resources, but these
funds will not be sufficient to meet all anticipated development expenditure requirements. The
terms of the Oyu Tolgoi Investment Agreement obligate Ivanhoe Mines to obtain, within two years of
the agreement’s Effective Date, project financing sufficient to complete the development activities
necessary to establish commercial production. Market volatility in precious and base metals may
affect the terms upon which debt financing or equity financing is available. Ivanhoe Mines operates
in a region of the world that is prone to economic and political upheaval and instability, which
may make it more difficult for Ivanhoe Mines to obtain debt financing from project lenders. Failure
to obtain additional financing on a timely basis may cause Ivanhoe Mines to postpone its
development plans, forfeit rights in some or all of its properties or joint ventures, reduce or
terminate some or all of its operations or force Ivanhoe Mines to raise funds from alternative
sources on less favourable terms.
25
Table of Contents
IVANHOE MINES LTD.
MANAGEMENT’S DISCUSSION AND ANALYSIS OF FINANCIAL CONDITION AND
RESULTS OF OPERATIONS
RESULTS OF OPERATIONS
(Stated in U.S. dollars, except where noted)
Financial instruments
The estimated fair value of Ivanhoe Mines’ financial instruments was as follows:
| June 30, | December 31, | |||||||||||||||
| 2011 | 2010 | |||||||||||||||
| Carrying | Fair | Carrying | Fair | |||||||||||||
| (Stated in $000’s of dollars) | Amount | Value | Amount | Value | ||||||||||||
Financial Assets |
||||||||||||||||
Held-for-trading |
||||||||||||||||
Short-term investments |
15,003 | 15,003 | 98,373 | 98,373 | ||||||||||||
Long-term investments |
9,926 | 9,926 | 10,235 | 10,235 | ||||||||||||
Other long-term investments |
92,152 | 92,152 | 74,936 | 74,936 | ||||||||||||
Available-for-sale |
||||||||||||||||
Long-term investments |
95,893 | 95,893 | 103,431 | 103,431 | ||||||||||||
Other long-term investments |
213,969 | 213,969 | 116,880 | 116,880 | ||||||||||||
Cost method |
||||||||||||||||
Long-term investments |
17,162 | 17,162 | 20,534 | 20,534 | ||||||||||||
Loans and receivables |
||||||||||||||||
Accounts receivable |
100,267 | 100,267 | 65,741 | 65,741 | ||||||||||||
Investments in companies subject to
significant influence |
||||||||||||||||
Long-term investments |
68,922 | 165,170 | 16,991 | 145,981 | ||||||||||||
Financial Liabilities |
||||||||||||||||
Accounts payable and accrued liabilities |
393,274 | 393,274 | 260,528 | 260,528 | ||||||||||||
Amounts due under credit facilities |
57,836 | 57,836 | 54,695 | 54,695 | ||||||||||||
CIC convertible credit facility
debt host contract and interest payable |
97,719 | 97,719 | 99,719 | 99,719 | ||||||||||||
Derivatives |
||||||||||||||||
Rights offering derivative liability |
— | — | 766,238 | 766,238 | ||||||||||||
CIC convertible credit facility
embedded derivative liability |
121,236 | 121,236 | 154,877 | 154,877 | ||||||||||||
The fair value of Ivanhoe Mines’ long-term investments was determined by reference to
published market quotations, which may not be reflective of future values.
The fair value of Ivanhoe Mines’ other long-term investments, consisting of the Long-Term Notes,
the Mongolian Treasury Bill and tax prepayment and long-term Money Market instruments, was
determined by considering the best available data regarding market conditions for such investments,
which may not be reflective of future values.
26
Table of Contents
IVANHOE MINES LTD.
MANAGEMENT’S DISCUSSION AND ANALYSIS OF FINANCIAL CONDITION AND
RESULTS OF OPERATIONS
RESULTS OF OPERATIONS
(Stated in U.S. dollars, except where noted)
The fair value of the rights offering derivative liability was determined by reference to published
market quotations, which may not be reflective of future value.
The fair value of the CIC convertible debenture was estimated to approximate the aggregate carrying
amount of the CIC convertible credit facility liability and interest payable. This aggregate
carrying amount includes the estimated fair value of the embedded derivative liability, which was
determined using a Monte Carlo simulation valuation model.
The fair values of Ivanhoe Mines’ remaining financial instruments were estimated to approximate
their carrying values, due primarily to the immediate or short-term maturity of these financial
instruments.
The consolidated statements of operations include the following amounts of unrealized gains
(losses) from fair value adjustments to financial instruments:
| Three Months Ended | Six Months Ended | |||||||||||||||
| June 30, | June 30, | |||||||||||||||
| (Stated in $000’s of dollars) | 2011 | 2010 | 2011 | 2010 | ||||||||||||
Unrealized gains (losses) on long-term investments |
$ | 3,453 | $ | (4,509 | ) | $ | (309 | ) | $ | (5,212 | ) | |||||
Unrealized gains on other long-term investments |
1,007 | 789 | 1,395 | 1,509 | ||||||||||||
Change in fair value of derivative |
— | — | (432,536 | ) | — | |||||||||||
Change in fair value of embedded derivatives |
70,422 | 72,233 | 33,641 | 70,861 | ||||||||||||
The consolidated statement of accumulated other comprehensive income includes the following
amounts of unrealized gains (losses) from fair value adjustments to financial instruments:
| Three Months Ended | Six Months Ended | |||||||||||||||
| June 30, | June 30, | |||||||||||||||
| (Stated in $000’s of dollars) | 2011 | 2010 | 2011 | 2010 | ||||||||||||
Changes in fair value of long-term investments |
$ | (61,149 | ) | $ | (16,335 | ) | $ | (8,141 | ) | $ | (12,439 | ) | ||||
Changes in fair value of other long-term investments |
(6,738 | ) | (14,327 | ) | (4,918 | ) | (13,242 | ) | ||||||||
Ivanhoe Mines is exposed to credit risk with respect to its accounts receivable. The
significant concentrations of credit risk are situated in Mongolia and Australia. Ivanhoe Mines
does not mitigate the balance of this risk in light of the credit worthiness of its major debtors.
Ivanhoe Mines is exposed to interest-rate risk with respect to the variable rates of interest
incurred on the amounts due under credit facilities. Interest-rate risk is concentrated in Canada.
Ivanhoe Mines does not mitigate the balance of this risk.
27
Table of Contents
IVANHOE MINES LTD.
MANAGEMENT’S DISCUSSION AND ANALYSIS OF FINANCIAL CONDITION AND
RESULTS OF OPERATIONS
RESULTS OF OPERATIONS
(Stated in U.S. dollars, except where noted)
SHARE CAPITAL
At August 12, 2011, the Company had a total of:
| • | 710.6 million common shares outstanding. |
| • | 19.7 million incentive stock options outstanding, with a weighted average exercise price
of C$12.00 per share. Each option is exercisable to purchase a common share of the Company
at prices ranging from C$2.82 to C$27.83 per share. |
OUTLOOK
The information below is in addition to disclosures already contained in this report regarding
the Company’s operations and activities.
Ivanhoe Mines’ financial performance and its ability to advance its future operations and
development plans are heavily dependent on availability of funding, base and precious metal prices,
coal prices and foreign exchange rates. Volatility in these markets continues to be unusually high.
Accordingly, given the high volatility of commodity prices, it is difficult to forecast commodity
prices or customer demand for Ivanhoe Mines’ products.
Commodity prices and 2011 production
Commodity prices are a key driver of Ivanhoe Mines’ future earnings and current prices are well
above historic averages. Although Ivanhoe Mines is concerned about current global economic
conditions, particularly in the United States and Europe, it believes that, over the longer term,
as China and India continue to industrialize, those two economies will continue to be major
positive factors in the future demand for Ivanhoe Mines’ commodities. Ivanhoe Mines believes that
the long-term price environment for the products that it produces and sells remains favourable.
Copper prices currently are trading approximately 30% higher than 2010 average prices. Partly
offsetting the higher commodity prices is a stronger Mongolian Tugrik, which to date in 2011 is
averaging approximately MNT1,241 against the US dollar compared with MNT1,356 against the US dollar
in 2010.
It is difficult to reliably forecast commodity prices and customer demand for Ivanhoe Mines’
products; however, Ivanhoe Mines’ sales and marketing efforts continue to provide positive results.
To date. SouthGobi has signed contracts with seven major customers to purchase coal in Q3’11.
SouthGobi anticipates the overall average realized sales price in Q3’11 to be similar to that
achieved in Q2’11. Assuming various contracts are performed and the Mongolian-China border remains
efficient, SouthGobi expects sale volumes for Q3’11 to be in the range of 1.2 million tonnes to 1.6
million tonnes.
Capital expenditures
Ivanhoe Mines continues to review its capital spending in light of current market conditions.
28
Table of Contents
IVANHOE MINES LTD.
MANAGEMENT’S DISCUSSION AND ANALYSIS OF FINANCIAL CONDITION AND
RESULTS OF OPERATIONS
RESULTS OF OPERATIONS
(Stated in U.S. dollars, except where noted)
In December 2010, Ivanhoe Mines approved a $2.3 billion capital budget for 2011 for what is proving
to be the peak year of construction activity on the first phase of the Oyu Tolgoi copper-gold
project.
Approval of the budget by the Ivanhoe Mines Board of Directors followed earlier full approval of
the 100,000-tonne-per-day project by the Ivanhoe Mines-Rio Tinto joint Technical Committee, which
is overseeing the Oyu Tolgoi Project, and the Board of Directors of Oyu Tolgoi LLC.
The 2011 project budget was approved after the Boards of Directors of Ivanhoe Mines and
Oyu Tolgoi LLC, the shareholders of Oyu Tolgoi LLC and the joint Technical Committee reviewed
current estimates of projected capital requirements through to project completion. The reviews
included cash requirements from January 1, 2011, for the completion of the Southern Oyu open-pit
mine; completion of the 100,000-tonne-per-day concentrator; and advancing construction on elements
of the Hugo North underground mine, including the Shaft #2 headframe, sinking of Shaft #2,
completion of final design and ongoing development of the underground mine.
Total capital required for phase one from January 1, 2011, to the start of commissioning of the ore
processing plant is projected to be $3.5 billion. This includes approximately $2.9 billion to
complete construction of the Southern Oyu open-pit mine, processing plant and essential
infrastructure, including electrical transmission lines, water, roads, a paved airport runway and
Mongolian-designed passenger terminal; it also includes taxes and continued underground development
of the phase-two Hugo North mine.
Capital required from January 1, 2011, through to completion of the phase-one,
100,000-tonne-per-day project and the commencement of commercial production is expected to total
approximately $4.5 billion.
The 2011-2013 estimate of $4.5 billion includes approximately $550 million in remaining
contingencies and escalation allowances although no provision has been made for foreign exchange
variances or cost increases on construction commitments that may be incurred.
Corporate development activities
The Company, through its Office of the CEO, is continuing to lead Ivanhoe Mines’ assessment of
potential strategic initiatives and directing any necessary negotiations to create and enhance
value for shareholders. This could include, and is not limited to, initiatives related to the
Company’s subsidiary interests.
The Company has provided Rio Tinto with an ability to acquire up to 49% of the outstanding shares
of Ivanhoe Mines until the expiry of the standstill limitation on January 18, 2012. In addition,
the Company has implemented a Shareholders’ Rights Plan that seeks to ensure that all shareholders
are treated fairly in any transaction involving a change in control of Ivanhoe Mines and that all
shareholders have an equal opportunity to participate in the benefits of a take-over bid. Unless
re-confirmed by shareholders at the 2013 annual general meeting, the Plan will terminate upon the
conclusion of that meeting.
29
Table of Contents
IVANHOE MINES LTD.
MANAGEMENT’S DISCUSSION AND ANALYSIS OF FINANCIAL CONDITION AND
RESULTS OF OPERATIONS
RESULTS OF OPERATIONS
(Stated in U.S. dollars, except where noted)
Other information
The Company is actively involved in advancing several other projects. These activities are ongoing
in 2011, with a focus on subsidiary SouthGobi and its mining of coal; subsidiary Ivanhoe Australia
and its integration of the Osborne Complex, its activities on its Cloncurry tenements and its
Tennant Creek joint-venture; and Altynalmas Gold and its drilling program at the Kyzyl Gold
Project. SouthGobi has sufficient funds to advance its operations and development plans for 2011.
Ivanhoe Australia believes that its existing funds should be sufficient to fund its minimum
obligations; however, it may need additional funds, or may seek to develop opportunities that will
require it to raise additional capital from equity or debt sources in the future. Ivanhoe Mines
owns 50% of Altynalmas Gold, which is reviewing its operating plans to determine the amount of
funding that it will require from its shareholders.
Exchange Rates
The sale of Ivanhoe Mines’ coal products are denominated in US dollars, while a significant portion
of its expenses are incurred in local currencies. Foreign exchange fluctuations can have a
significant effect on its operating margins, unless such fluctuations are offset by related changes
to commodity prices.
Ivanhoe Mines holds a portion of its cash resources in currencies other than the US$. Ivanhoe Mines
expects to incur future expenditures in currencies other than the US$, most notably in Canadian and
Australian dollars. As a result, exchange gains and losses from holding Canadian and Australian
dollars primarily are unrealized and are expected to continue to fluctuate significantly given the
recent volatility in foreign exchange rates.
OFF-BALANCE-SHEET ARRANGEMENTS
During the three months ended June 30, 2011, Ivanhoe Mines was not a party to any
off-balance-sheet arrangements that have, or are reasonably likely to have, a current or future
effect on the results of operations, financial condition, revenues or expenses, liquidity, capital
expenditures or capital resources of the Company.
CONTRACTUAL OBLIGATIONS
As at June 30, 2011, there were no significant changes in Ivanhoe Mines contractual
obligations and commercial commitments from those disclosed in its MD&A for the year ended December
31, 2010.
CHANGES IN ACCOUNTING POLICIES
In January 2010, the Financial Accounting Standards Board Accounting Standards Codification
(ASC) guidance for fair value measurements and disclosures was updated to require additional
disclosures related to transfers in and out of level 1 and 2 fair value measurements and enhanced
detail in the level 3 reconciliation. The updated guidance clarified the level of disaggregation
required for assets and liabilities and the disclosures required for inputs and valuation
techniques to be used to measure the
fair value of assets and liabilities that fall in either level 2 or level 3. The updated guidance
was effective for the Company’s fiscal year beginning January 1, 2010, except for the level 3
disaggregation which is effective for the Company’s fiscal year beginning January 1, 2011. The
adoption of the updated guidance had no impact on the Company’s consolidated financial position,
results of operations or cash flows.
30
Table of Contents
IVANHOE MINES LTD.
MANAGEMENT’S DISCUSSION AND ANALYSIS OF FINANCIAL CONDITION AND
RESULTS OF OPERATIONS
RESULTS OF OPERATIONS
(Stated in U.S. dollars, except where noted)
In December 2010, the ASC guidance for business combinations was updated to clarify existing
guidance requiring a public entity to disclose pro forma revenue and earnings of the combined
entity as though the business combination(s) that occurred during the current year had occurred as
of the beginning of the comparable prior annual period only. The update also expands the
supplemental pro forma disclosures required to include a description of the nature and amount of
material, nonrecurring pro forma adjustments directly attributable to the business combination
included in the reported pro forma revenue and earnings. The updated guidance was effective for
the Company’s fiscal year beginning January 1, 2011. The adoption of the updated guidance had no
impact on the Company’s consolidated financial position, results of operations or cash flows.
CRITICAL ACCOUNTING ESTIMATES
The preparation of financial statements in conformity with generally accepted accounting
principles in the United States requires the Company to establish accounting policies and to make
estimates that affect both the amount and timing of the recording of assets, liabilities, revenues
and expenses. Some of these estimates require judgments about matters that are inherently
uncertain.
The Company’s significant accounting policies and the estimates derived therefrom identified as
being critical are substantially unchanged from those disclosed in its MD&A for the year ended
December 31, 2010.
RECENT ACCOUNTING PRONOUNCEMENTS
In May 2011, the ASC guidance for fair value measurement and disclosure was updated to clarify
the Financial Accounting Standards Board’s intent on current guidance, modify and change certain
guidance and principles, and expand disclosures concerning Level 3 fair value measurements in the
fair value hierarchy (including quantitative information about significant unobservable inputs
within Level 3 of the fair value hierarchy). In addition, the updated guidance requires disclosure
of the fair value hierarchy for assets and liabilities not measured at fair value in the statement
of financial position, but whose fair value is required to be disclosed. The updated guidance is
effective for the Company’s fiscal year beginning January 1, 2012. The Company does not expect the
updated guidance to have a material impact on its financial position or results of operations.
In June 2011, the ASC guidance on presentation of comprehensive income was updated to improve the
comparability, consistency and transparency of financial reporting and to increase the prominence
of items reported in other comprehensive income. The updated guidance requires an entity to
present the components of net income and other comprehensive income either in a single continuous
statement of comprehensive income or in two separate but consecutive statements. This update
eliminates the option to present the components of other comprehensive income as part of the
statement of equity, but does not change the items that must be reported in other comprehensive
income. The updated
guidance is effective for the Company’s fiscal year beginning January 1, 2012. The Company is in
the process of assessing which presentation choice it will adopt.
31
Table of Contents
IVANHOE MINES LTD.
MANAGEMENT’S DISCUSSION AND ANALYSIS OF FINANCIAL CONDITION AND
RESULTS OF OPERATIONS
RESULTS OF OPERATIONS
(Stated in U.S. dollars, except where noted)
INTERNATIONAL FINANCIAL REPORTING STANDARDS
Ivanhoe Mines has been monitoring the deliberations and progress being made by accounting
standard-setting bodies and securities regulators in Canada and the United States on their plans
regarding convergence to International Financial Reporting Standards (IFRS). Ivanhoe Mines is a
‘domestic’ issuer under Canadian securities law and a ‘foreign private issuer’ under US Securities
and Exchange Commission (SEC) regulations. Ivanhoe Mines files its financial statements with
Canadian and US securities regulators in accordance with US GAAP, as permitted under current
regulations. In 2008, the Accounting Standards Board in Canada and the Canadian Securities
Administrators (CSA) confirmed that domestic issuers will be required to transition to IFRS for
fiscal years beginning on or after January 1, 2011. On October 1, 2010, the CSA approved National
Instrument 52-107, “Acceptable Accounting Principles and Auditing Standards” (NI 52-107) which
permits Canadian public companies that are also SEC registrants the option to prepare their
financial statements in accordance with US GAAP. Under NI 52-107 there will be no requirement to
provide a reconciliation of the US GAAP financial statements to IFRS. Consequently, Ivanhoe Mines
was not required to convert to IFRS effective January 1, 2011.
RISKS AND UNCERTAINTIES
Material risks and uncertainties affecting Ivanhoe Mines, their potential impact, and the
Company’s principal risk-management strategies are substantially unchanged from those disclosed in
its MD&A for the year ended December 31, 2010.
RELATED-PARTY TRANSACTIONS
The following tables summarize transactions with related parties which were primarily incurred
by Ivanhoe Mines on a cost-recovery basis with a company affiliated with Ivanhoe Mines, companies
related by way of directors or shareholders in common or a legal firm which an officer of a
subsidiary of the Company is a partner of. The tables summarize related party transactions by
related party and by type:
| Three Months Ended June 30, | Six Month Ended June 30, | |||||||||||||||
| (Stated in $000’s of U.S. dollars) | 2011 | 2010 | 2011 | 2010 | ||||||||||||
Rio Tinto plc (a) |
$ | 16,742 | $ | 2,558 | $ | 27,797 | $ | 4,931 | ||||||||
Global Mining Management Corporation (b) |
2,648 | 2,306 | 5,307 | 5,065 | ||||||||||||
Ivanhoe Capital Aviation LLC (c) |
1,710 | 1,934 | 3,446 | 3,194 | ||||||||||||
Fognani & Faught, PLLC (d) |
418 | 119 | 421 | 119 | ||||||||||||
Ivanhoe Capital Corporation (e) |
86 | 42 | 150 | 116 | ||||||||||||
Ivanhoe Capital Services Ltd. (f) |
249 | 172 | 507 | 318 | ||||||||||||
| $ | 21,853 | $ | 7,131 | $ | 37,628 | $ | 13,743 | |||||||||
32
Table of Contents
IVANHOE MINES LTD.
MANAGEMENT’S DISCUSSION AND ANALYSIS OF FINANCIAL CONDITION AND
RESULTS OF OPERATIONS
RESULTS OF OPERATIONS
(Stated in U.S. dollars, except where noted)
| Three Months Ended June 30, | Six Month Ended June 30, | |||||||||||||||
| 2011 | 2010 | 2011 | 2010 | |||||||||||||
Development and exploration |
$ | 16,742 | $ | 2,558 | $ | 27,797 | $ | 4,931 | ||||||||
Salaries and benefits |
2,023 | 1,783 | 4,226 | 4,028 | ||||||||||||
Travel (including aircraft rental) |
1,710 | 1,934 | 3,446 | 3,194 | ||||||||||||
Office and administrative |
960 | 737 | 1,738 | 1,471 | ||||||||||||
Legal |
418 | 119 | 421 | 119 | ||||||||||||
| $ | 21,853 | $ | 7,131 | $ | 37,628 | $ | 13,743 | |||||||||
The above noted transactions were in the normal course of operations and were measured at the
exchange amount, which is the amount of consideration established and agreed to by the related
parties.
Accounts receivable and accounts payable at June 30, 2011, included $1.1 million and $12.5 million,
respectively (December 31, 2010 — $2.1 million and $8.7 million, respectively), which were due
from/to a company affiliated with Ivanhoe Mines, companies related by way of directors or
shareholders in common or a legal firm which an officer of a subsidiary of the Company is a partner
of.
| (a) | Rio Tinto owns 46.5% of Ivanhoe Mines. Rio Tinto provides services for the Oyu Tolgoi Project
on a cost-recovery basis. At as June 30, 2011, $31.7 million (December 31, 2010 — $14.0
million) in payables to Rio Tinto have been classified as non-current. Payments of these
amounts have been deferred until Ivanhoe Mines reaches certain production milestones at the
Oyu Tolgoi Project. |
In addition, Rio Tinto exercised its remaining Ivanhoe Mines warrants in Q2’11. This is
detailed in the “Other Developments” section. |
| (b) | Global Mining Management Corporation (Global) is a private company based in Vancouver owned
equally by seven companies, one of which is Ivanhoe Mines. Global has a director in common
with the Company. Global provides administration, accounting and other office services to the
Company on a cost-recovery basis. |
| (c) | Ivanhoe Capital Aviation LLC (Aviation) is a private company 100%-owned by the Company’s
Founder and Chief Executive Officer. Aviation operates aircraft which are rented by the
Company on a cost-recovery basis. |
| (d) | An officer of a subsidiary of the Company is associated with Fognani & Faught, PLLC, a legal
firm that provides legal services to Ivanhoe Mines. |
| (e) | Ivanhoe Capital Corporation (ICC) is a private company 100%-owned by the Company’s Founder
and Chief Executive Officer. ICC provides administration and other office services out of
London, England on a cost-recovery basis. |
33
Table of Contents
IVANHOE MINES LTD.
MANAGEMENT’S DISCUSSION AND ANALYSIS OF FINANCIAL CONDITION AND
RESULTS OF OPERATIONS
RESULTS OF OPERATIONS
(Stated in U.S. dollars, except where noted)
| (f) | Ivanhoe Capital Services Ltd. (ICS) is a private company 100%-owned by the Company’s Founder
and Chief Executive Officer. ICS provides management services out of Singapore on a
cost-recovery basis. |
Ivanhoe Mines has a 50% interest in Altynalmas Gold. During Q2’11, Ivanhoe Mines recognized $0.9
million (Q2’10 — $0.7 million) in interest income on its shareholder loan balance with Altynalmas
Gold.
The Company’s Founder and Chief Executive Officer has an interest in Ivanplats Limited (Ivanplats)
(formerly Ivanhoe Nickel and Platinum Ltd). As at June 30, 2011, Ivanhoe Mines held 8.8% of
Ivanplats issued and outstanding shares.
CHANGES IN INTERNAL CONTROL OVER FINANCIAL REPORTING
During the three months ended June 30, 2011, there were no changes in the Company’s internal
control over financial reporting that have materially affected, or are reasonably likely to
materially affect, the Company’s internal control over financial reporting.
QUALIFIED PERSON
Disclosure of a scientific or technical nature in this MD&A in respect of the Oyu Tolgoi
Project was prepared under the supervision of Stephen Torr, P. Geo, an employee of Ivanhoe Mines
and a “qualified person” as that term is defined in NI 43-101.
CAUTIONARY STATEMENTS
LANGUAGE REGARDING RESERVES AND RESOURCES
Readers are advised that NI 43-101 Standards of Disclosure for Mineral Projects (NI 43-101) of the
Canadian Securities Administrators requires that each category of mineral reserves and mineral
resources be reported separately. For detailed information related to Company resources and
reserves, readers should refer to the Annual Information Form of the Company for the year ended
December 31, 2010, and other continuous disclosure documents filed by the Company since January 1,
2011, at www.sedar.com.
NOTE TO UNITED STATES INVESTORS CONCERNING ESTIMATES OF MEASURED, INDICATED AND INFERRED RESOURCES
This document, including the documents incorporated by reference herein, has been prepared in
accordance with the requirements of securities laws in effect in Canada, which differ from the
requirements of United States securities laws. Without limiting the foregoing, this document,
including the documents incorporated by reference herein, uses the terms “measured”, “indicated”
and “inferred” resources. United States investors are advised that, while such terms are recognized
and required by Canadian securities laws, the SEC does not recognize them. Under United States
standards, mineralization may not be classified as a “reserve” unless the determination has been
made that the mineralization could be economically and legally produced or extracted at the time
the reserve determination is made. United States investors are cautioned not to assume that all or
any part of measured or indicated resources will ever be converted into reserves.
34
Table of Contents
IVANHOE MINES LTD.
MANAGEMENT’S DISCUSSION AND ANALYSIS OF FINANCIAL CONDITION AND
RESULTS OF OPERATIONS
RESULTS OF OPERATIONS
(Stated in U.S. dollars, except where noted)
Further,
“inferred resources” have a great amount of uncertainty as to their existence and as to whether they can be mined
legally or economically. It cannot be assumed that all or any part of the “inferred resources” will
ever be upgraded to a higher category. Therefore, United States investors are also cautioned not to
assume that all or any part of the inferred resources exist, or that they can be mined legally or
economically. Disclosure of “contained ounces” is a permitted disclosure under Canadian
regulations; however, the SEC only permits issuers to report “resources” as in place tonnage and
grade without reference to unit measures. Accordingly, information concerning descriptions of
mineralization and resources contained in this document, or in the documents incorporated by
reference, may not be comparable to information made public by United States companies subject to
the reporting and disclosure requirements of the SEC. National Instrument 43-101 Standards of
Disclosure for Mineral Projects (NI 43-101) is a rule developed by the Canadian Securities
Administrators that establishes standards for all public disclosure an issuer makes of scientific
and technical information concerning mineral projects. Unless otherwise indicated, all reserve and
resource estimates contained in or incorporated by reference in this document have been prepared in
accordance with NI 43-101. These standards differ significantly from the requirements of the SEC,
and reserve and resource information contained herein and incorporated by reference herein may not
be comparable to similar information disclosed by U.S. companies. NI 43-101 permits a historical
estimate made prior to the adoption of NI 43-101 that does not comply with NI 43-101 to be
disclosed using the historical terminology if the disclosure: (a) identifies the source and date of
the historical estimate; (b) comments on the relevance and reliability of the historical estimate;
(c) states whether the historical estimate uses categories other than those prescribed by NI
43-101; and (d) includes any more recent estimates or data available.
FORWARD-LOOKING STATEMENTS
Certain statements made herein, including statements relating to matters that are not
historical facts and statements of our beliefs, intentions and expectations about developments,
results and events which will or may occur in the future, constitute “forward-looking information”
within the meaning of applicable Canadian securities legislation and “forward-looking statements”
within the meaning of the “safe harbor” provisions of the United States Private Securities
Litigation Reform Act of 1995. Forward-looking information and statements are typically identified
by words such as “anticipate,” “could,” “should,” “expect,” “seek,” “may,” “intend,” “likely,”
“plan,” “estimate,” “will,” “believe” and similar expressions suggesting future outcomes or
statements regarding an outlook. These include, but are not limited to: statements respecting
anticipated business activities; planned expenditures; corporate strategies; proposed acquisitions
and dispositions of assets; discussions with third parties respecting material agreements; the
schedule for carrying out and completing construction of the Oyu Tolgoi Project; the expansion of
throughput capacity of the concentrator, and the progress of construction of the primary crusher,
tailings-thickening ponds and Shaft #2 at the Oyu Tolgoi Project; the timing of replacing the
construction fleet with a mining fleet at the Oyu Tolgoi Project; the estimated delivery of the
first ores from the Southern Oyu open pit to the concentrator; the estimated schedule to bring the
Oyu Tolgoi Project into commercial production; statements related to the anticipated capital costs
of the Oyu Tolgoi Project; the anticipated return to the original infrastructure progress timing
and a conclusion to the competitive bidding process for main infrastructure works; the expected
timing of production from the first lift of the Hugo North block-cave mine; possible expansion
scenarios for the Oyu Tolgoi Project; the expected timing of construction of the electrical
transmission power line from the Oyu Tolgoi Project to the Chinese border; the timing and outcome
of discussions between the Mongolian and Chinese
35
Table of Contents
IVANHOE MINES LTD.
MANAGEMENT’S DISCUSSION AND ANALYSIS OF FINANCIAL CONDITION AND
RESULTS OF OPERATIONS
RESULTS OF OPERATIONS
(Stated in U.S. dollars, except where noted)
governments regarding importing electrical power
from China; the progress of the electrical power transmission line within Mongolia; the development of alternative power generation arrangements
relating to the Oyu Tolgoi Project if a timely agreement to secure electrical power from China is
not secured by the Mongolian Government; the schedule of receipt of permits from the Mongolian
Government relating to land use, permanent airport and roads; contract negotiations and expected
markets for concentrate produced at the Oyu Tolgoi Project; initial production estimates; the
commencement of construction of the water pipeline and paved road to the Oyu Tolgoi Project; the
Oyu Tolgoi Project’s anticipated yearly production of copper and gold; the ability of Ivanhoe Mines
to arrange acceptable financing commitments for the Oyu Tolgoi Project and the timing of such
commitments; implementation of the Oyu Tolgoi Project’s training and development strategy;
statements concerning mineralization potential and planned drilling activities at Ulaan Khud North;
target milling rates, mining plans and production forecasts for the coal mine at Ovoot Tolgoi,
Mongolia; the schedule for carrying out and completing an expansion of the production capability of
the Ovoot Tolgoi Coal Project; the elements of SouthGobi’s planned exploration program for 2011;
anticipated outcomes with respect to the ongoing marketing of coal products from the Ovoot Tolgoi
Coal Project; the anticipated timing of payback of capital invested in the Ovoot Tolgoi Coal
Project; the statements concerning the timing of commencement of commercial operation and operating
capacity of the Ceke to Linhe railway line; the statements concerning the expected timing of
construction and the intended capacity of the planned paved highway from Ovoot Tolgoi to the
Mongolia-China border; the statements concerning the timing of the expected completion of the Ovoot
Tolgoi coal-handling facility by mid-2012; the statements concerning SouthGobi’s expected coal
sales and prices in Q3’11; the statements concerning the timing of the Merlin pre-feasibility
study; the statements concerning the development and construction of the Merlin Project; the
statements concerning the anticipated timing of the copper-gold study; the statements concerning
the anticipated timing of the Mount Dore preliminary economic assessment and the Mount Elliott
scoping study; timing of receipt of expected proceeds from Exco’s sale of Cloncurry Copper Project;
the statements that Altynalmas Gold’s definitive feasibility study is expected to be completed in
Q4’11 and that it will commence construction during 2011 on a roasting plant to process refractory
ore; planned drilling on the Bakyrchik Mining Lease and the surrounding exploration licence;
statements respecting future equity investments in Ivanhoe Mines by Rio Tinto and the intended use
of such funds; Ivanhoe Mines’ position that its Shareholders’ Rights Plan is not in breach of Rio
Tinto’s existing contractual rights; the impact of amendments to the laws of Mongolia and other
countries in which Ivanhoe Mines carries on business, particularly with respect to taxation;
statements concerning global economic expectations and future demand for commodities; and the
anticipated timing, cost and outcome of plans to continue the development of non-core projects, and
other statements that are not historical facts.
All such forward-looking information and statements are based on certain assumptions and analyses
made by Ivanhoe Mines’ management in light of their experience and perception of historical trends,
current conditions and expected future developments, as well as other factors management believes
are appropriate in the circumstances. These statements, however, are subject to a variety of risks
and uncertainties and other factors that could cause actual events or results to differ materially
from those projected in the forward-looking information or statements. Important factors that could
cause actual results to differ from these forward-looking statements include those described under
the heading “Risks and Uncertainties” elsewhere in the Company’s MD&A. The reader is cautioned not
to place undue reliance on forward-looking information or statements.
36
Table of Contents
IVANHOE MINES LTD.
MANAGEMENT’S DISCUSSION AND ANALYSIS OF FINANCIAL CONDITION AND
RESULTS OF OPERATIONS
RESULTS OF OPERATIONS
(Stated in U.S. dollars, except where noted)
The MD&A also contains references to estimates of mineral reserves and mineral resources. The
estimation of reserves and resources is inherently uncertain and involves subjective judgments
about
many relevant factors. The accuracy of any such estimates is a function of the quantity and quality
of available data, and of the assumptions made and judgments used in engineering and geological
interpretation, which may prove to be unreliable. There can be no assurance that these estimates
will be accurate or that such mineral reserves and mineral resources can be mined or processed
profitably. Mineral resources that are not mineral reserves do not have demonstrated economic
viability. Except as required by law, the Company does not assume the obligation to revise or
update these forward-looking statements after the date of this document or to revise them to
reflect the occurrence of future unanticipated events.
37
Table of Contents
Form 52-109F2
Certification of interim filings — full certificate
Certification of interim filings — full certificate
I, Robert Friedland, Chief Executive Officer of Ivanhoe Mines Ltd., certify the following:
| 1. | Review: I have reviewed the interim financial statements and interim MD&A (together, the
“interim filings”) of Ivanhoe Mines Ltd. (the “issuer”) for the interim period ended June 30,
2011. |
| 2. | No misrepresentations: Based on my knowledge, having exercised reasonable diligence, the
interim filings do not contain any untrue statement of a material fact or omit to state a
material fact required to be stated or that is necessary to make a statement not misleading in
light of the circumstances under which it was made, with respect to the period covered by the
interim filings. |
| 3. | Fair presentation: Based on my knowledge, having exercised reasonable diligence, the interim
financial statements together with the other financial information included in the interim
filings fairly present in all material respects the financial condition, results of operations
and cash flows of the issuer, as of the date of and for the periods presented in the interim
filings. |
| 4. | Responsibility: The issuer’s other certifying officer(s) and I are responsible for
establishing and maintaining disclosure controls and procedures (DC&P) and internal control
over financial reporting (ICFR), as those terms are defined in National Instrument 52-109
Certification of Disclosure in Issuers’ Annual and Interim Filings, for the issuer. |
| 5. | Design: Subject to the limitations, if any, described in paragraphs 5.2 and 5.3, the
issuer’s other certifying officer(s) and I have, as at the end of the period covered by the
interim filings |
| (a) | designed DC&P, or caused it to be designed under our supervision, to provide
reasonable assurance that |
| (i) | material information relating to the issuer is made known to us by
others, particularly during the period in which the interim filings are being
prepared; and |
| (ii) | information required to be disclosed by the issuer in its annual
filings, interim filings or other reports filed or submitted by it under
securities legislation is recorded, processed, summarized and reported within the
time periods specified in securities legislation; and |
| (b) | designed ICFR, or caused it to be designed under our supervision, to provide
reasonable assurance regarding the reliability of financial reporting and the preparation
of financial statements for external purposes in accordance with the issuer’s GAAP. |
| 5.1 | Control framework: The control framework the issuer’s other certifying officer(s) and I used
to design the issuer’s ICFR is the Internal Control — Integrated Framework issued by the
Committee of Sponsoring Organizations of the Treadway Commission (COSO). |
||
| 5.2 | ICFR — material weakness relating to design: N/A |
||
| 5.3 | Limitation on scope of design: N/A |
| 6. | Reporting changes in ICFR: The issuer has disclosed in its interim MD&A any change in the
issuer’s ICFR that occurred during the period beginning on April 1, 2011 and ended on June 30,
2011 that has materially affected, or is reasonably likely to materially affect, the issuer’s
ICFR. |
Date: 12 August 2011
/s/ R. Friedland
|
||
Chief Executive Officer |
||
Ivanhoe Mines Ltd. |
Table of Contents
FORM 52-109F2
Certification of interim filings — full certificate
I, Tony Giardini, Chief Financial Officer of Ivanhoe Mines Ltd., certify the following:
| 1. | Review: I have reviewed the interim financial statements and interim MD&A (together, the
“interim filings”) of Ivanhoe Mines Ltd. (the “issuer”) for the interim period ended June 30,
2011. |
| 2. | No misrepresentations: Based on my knowledge, having exercised reasonable diligence, the
interim filings do not contain any untrue statement of a material fact or omit to state a
material fact required to be stated or that is necessary to make a statement not misleading in
light of the circumstances under which it was made, with respect to the period covered by the
interim filings. |
| 3. | Fair presentation: Based on my knowledge, having exercised reasonable diligence, the interim
financial statements together with the other financial information included in the interim
filings fairly present in all material respects the financial condition, results of operations
and cash flows of the issuer, as of the date of and for the periods presented in the interim
filings. |
| 4. | Responsibility: The issuer’s other certifying officer(s) and I are responsible for
establishing and maintaining disclosure controls and procedures (DC&P) and internal control
over financial reporting (ICFR), as those terms are defined in National Instrument 52-109
Certification of Disclosure in Issuers’ Annual and Interim Filings, for the issuer. |
| 5. | Design: Subject to the limitations, if any, described in paragraphs 5.2 and 5.3, the
issuer’s other certifying officer(s) and I have, as at the end of the period covered by the
interim filings |
| (a) | designed DC&P, or caused it to be designed under our supervision, to provide
reasonable assurance that |
| (i) | material information relating to the issuer is made known to us by
others, particularly during the period in which the interim filings are being
prepared; and |
| (ii) | information required to be disclosed by the issuer in its annual
filings, interim filings or other reports filed or submitted by it under
securities legislation is recorded, processed, summarized and reported within the
time periods specified in securities legislation; and |
| (b) | designed ICFR, or caused it to be designed under our supervision, to provide
reasonable assurance regarding the reliability of financial reporting and the preparation
of financial statements for external purposes in accordance with the issuer’s GAAP. |
| 5.1 | Control framework: The control framework the issuer’s other certifying officer(s) and I used
to design the issuer’s ICFR is the Internal Control — Integrated Framework issued by the
Committee of Sponsoring Organizations of the Treadway Commission (COSO). |
||
| 5.2 | ICFR — material weakness relating to design: N/A |
||
| 5.3 | Limitation on scope of design: N/A |
| 6. | Reporting changes in ICFR: The issuer has disclosed in its interim MD&A any change in the
issuer’s ICFR that occurred during the period beginning on April 1, 2011 and ended on June 30,
2011 that has materially affected, or is reasonably likely to materially affect, the issuer’s
ICFR. |
Date: 12 August 2011
/s/ T. Giardini
|
||
Chief Financial Officer |
||
Ivanhoe Mines Ltd. |
Table of Contents
SIGNATURES
Pursuant to the requirements of the Securities Exchange Act of 1934, the registrant has duly caused
this report to be signed on its behalf by the undersigned, thereunto duly authorized.
| IVANHOE MINES LTD. |
||||
| Date: August 12, 2011 | By: | /s/ Beverly A. Bartlett | ||
| BEVERLY A. BARTLETT | ||||
| Vice President & Corporate Secretary | ||||