UNITED STATES
SECURITIES AND EXCHANGE COMMISSION
FORM N-CSR
CERTIFIED SHAREHOLDER REPORT OF REGISTERED MANAGEMENT INVESTMENT COMPANIES
Investment Company Act file number 811-10401
Trust for Professional Managers
(Exact name of registrant as specified in charter)
615 East Michigan Street
Milwaukee
(Address of principal executive offices) (Zip code)
Jay S. Fitton
U.S. Bancorp Fund Services, LLC
615 East Michigan Street
Milwaukee
(Name and address of agent for service)
(513)-629-8104
Registrant's telephone number, including area code
Date of fiscal year end: August 31, 2020
Date of reporting period: February 29, 2020
Item 1. Reports to Stockholders.

PMC Funds
PMC Core Fixed Income Fund
Advisor Class Shares: (PMFIX)
Institutional Class Shares: (PMFQX)
PMC Diversified Equity Fund
Advisor Class Shares: (PMDEX)
Institutional Class Shares: (PMDQX)
Semi-Annual Report
February 29, 2020
Beginning on January 1, 2021, as permitted by regulations adopted by the U.S. Securities and Exchange Commission, paper copies of the Funds’ annual and semi-annual shareholder reports will no longer be sent by mail, unless you specifically request paper copies of the reports from the Funds or from your financial intermediary (such as a broker-dealer or bank). Instead, the reports will be made available on a website, and you will be notified by mail each time a report is posted and provided with a website link to access the report.
If you already elected to receive shareholder reports electronically, you will not be affected by this change and you need not take any action. You may elect to receive shareholder reports and other communications from the Funds electronically by contacting your financial intermediary or, if you are a direct investor, by calling the Funds at 1-866-762-7338.
You may elect to receive all future reports in paper free of charge. If you invest through a financial intermediary, you can contact your financial intermediary to request that you continue to receive paper copies of your shareholder reports; if you invest directly with the Funds, you can call the Funds at 1-866-762-7338. Your election to receive reports in paper form will apply to all funds held in your account with your financial intermediary or, if you invest directly, to all PMC Funds you hold.
| 3 | ||||
| 6 | ||||
| 8 | ||||
| 15 | ||||
| SCHEDULE OF OPEN FUTURES CONTRACTS—PMC CORE FIXED INCOME FUND |
37 | |||
| 38 | ||||
| 76 | ||||
| 77 | ||||
| 78 | ||||
| 80 | ||||
| 84 | ||||
| 96 | ||||
| 97 | ||||
PMC Funds
To our Shareholders:
We are pleased to present you with the Semi-Annual Report for the PMC Funds mutual fund family. This report covers the six-month period ended February 29, 2020, as well as the period since the inception of the PMC Funds. The table below presents the performance of the two PMC Funds relative to their respective benchmarks.
The six-month period ended February 29, 2020 was one in which the COVID-19 coronavirus shut down a large portion of the U.S. economy, and wreaked havoc on financial markets. For most of the period, conditions were benign and uneventful, with equity markets rising steadily to record highs on February 19th on the back of an economy that was by most accounts growing resiliently. The unemployment rate had dipped to 3.5% as the economy extended its record expansion to more than 126 months. Interest rates also rose steadily as investors took into account the positive economic data. However, news about how COVID-19 was quickly spreading beyond China forced government leaders to take unprecedented action by requiring non-essential businesses to close, and citizens to shelter-in-place in order to slow the contagion. In an abrupt reversal, equity markets throughout the world went into a tailspin, dropping more than 12% in the final few days of February. Government bond yields also plunged, as investors drove up prices in a rush to the perceived security of safe-haven assets. The 10-year U.S. Treasury yield dropped to 1.15% by the end of February, after trading at 1.65% two weeks earlier, and as high as 1.94% in November 2019.
For its part, the U.S. Federal Open Market Committee (FOMC) was very aggressive in taking action to provide monetary stimulus when the economy began to be shuttered. While the FOMC had not moved by the end of February, the committee did reduce the target federal funds rate twice during the first two weeks of March, first by 0.50%, and then by a whopping 1.00%, bringing the rate to a range of 0%-0.25%. The FOMC also stated that it would take additional action if necessary, although most economists believe it will be hesitant to move rates below 0%.
Policymakers at all levels of government were also quick to mobilize, given the uncertainty of the virus’s spread and the dire predictions of some of the models used to forecast its effects. Many states set forth shelter-in-place rules that effectively closed down large portions of the economy. President Trump tapped Vice President Pence to head the newly established Coronavirus Task Force, which promulgated virus mitigation guidelines, including those related to hygiene and the new concept of social distancing. Congress had not acted by the end of February, but approved three stimulus bills in March amounting to about $6 trillion to help the economy through the uncertainty.
Prior to the economic chaos created by COVID-19, the overall U.S. economy continued to post solid, if unspectacular, results. Real gross domestic product (GDP) grew at an annualized rate of 2.1% in the fourth quarter of 2019. Housing has shown signs of accelerating in recent months, as mortage rates have declined. Inflation has remained benign, and may be less of an issue now with the economy on pause.
Overall, equity markets were little changed over the past six months, but gave up all their gains in the last two weeks of the period. Investors are focused intently on how quickly progress is being made in mitigating the spread of the virus, and policymakers’ plans to begin to open up the economy once again. Within that context, the MSCI World Index Net Return (global all-capitalization) posted a total return of +0.88% for the six months ended February 29, 2020. In the fixed income asset class, bond prices were mixed, with prices of U.S. government securities rising due to the flight-to-quality environment precipitated by COVID-19. However, corporate bonds saw yields rise due to the economic fallout of the shutdown. As such, the Bloomberg Barclays U.S. Aggregate Bond Index, a broad-based index of fixed-income securities, delivered a positive total return of +3.39% over the six months ended February 29, 2020.
3
Total Returns as of February 29, 2020*
*Periods of Less than 1-Year Are Unannualized
| Fund |
Three Months |
Six Months |
One Year |
Five Year |
Ten Year |
Gross Expense Ratio |
||||||||||||||||||
| PMC Diversified Equity Fund (Advisor Class) |
-7.78 | % | -0.99 | % | -1.32 | % | 3.10 | % | 8.00 | % | 0.95 | % | ||||||||||||
| PMC Diversified Equity Fund |
-7.69 | % | -0.82 | % | N/A | N/A | N/A | 0.74 | % | |||||||||||||||
| MSCI World Index Net Return |
-6.28 | % | 0.88 | % | 4.63 | % | 5.88 | % | 8.75 | % | ||||||||||||||
| PMC Core Fixed Income Fund (Advisor Class) |
3.10 | % | 2.86 | % | 10.50 | % | 2.94 | % | 3.65 | % | 1.29 | % | ||||||||||||
| PMC Core Fixed Income Fund |
3.22 | % | 2.99 | % | N/A | N/A | N/A | 1.04 | % | |||||||||||||||
| Bloomberg Barclays U.S. Aggregate Bond Index |
3.69 | % | 3.39 | % | 11.68 | % | 3.58 | % | 3.93 | % | ||||||||||||||
Past performance is no guarantee of future returns. Current performance may be higher or lower than the performance data shown. Investment return and principal value will fluctuate so that an investor’s shares, when redeemed, may be worth more or less than original cost. For the most recent month-end performance, please visit the Funds’ website at http://www.investpmc.com/solutions/portfolios or by calling 866-762-7338. Performance results reflect contractual expense subsidies and waivers in effect until December 29, 2020; without these waivers, returns would have been less favorable.
PMC Diversified Equity Fund
The PMC Diversified Equity Fund was launched on August 26, 2009, and provides broad equity asset class exposure. The Fund’s investment objective is long-term capital appreciation, and is managed internally by Envestnet’s Quantitative Research Group (“QRG”). QRG employs its Factor-Enhanced strategies in four different asset class portfolios within the Fund: US Large Cap, US Small Cap, International Developed Markets ADR, and Emerging Markets ADR.
One of the primary drivers of the Fund’s performance is its exposure to the well-known value, momentum and quality asset pricing factors. As discussed in our last annual letter, value-oriented stocks have significantly underperformed the past 36 months, and this has been a contributor to the Fund’s relative performance, as it lagged the benchmark over the six-month period ending February 29, 2020. Over that period the Fund’s Advisor Class shares generated a total return of -0.99%, trailing the +0.88% return of the benchmark MSCI World Index Net Return. The primary driver of the Fund’s performance during the period was the poor aggregate performance of the asset pricing factors toward which the portfolio is tilted. The Fund’s orientation toward value stocks was a key cause of the underperformance relative to the benchmark. Performance was also negatively impacted by having a lower weighted average market capitalization than the index, as stocks of smaller companies underperformed stocks of larger companies. Relative performance was also disadvantaged during the twelve-month period from an underweight to domestic equities relative to European equities, as domestic markets have outperformed international indices. Among the detractors to performance during the period was a modest underweight to the information technology energy sector, and security selection in the info tech, communications services and financials sectors. Slight underweights to energy and financials contributed to performance during the period, as did security selection in the real estate, industrials and materials sectors. As is typically the case, the strategy’s factor orientation resulted in over- or underweights to specific stocks that have a meaningful impact on performance. Over the past six months underweights to well-known companies such as Apple, Inc. (AAPL), Microsoft, Inc. (MSFT), Alphabet, Inc. (GOOG), and Amazon.com, Inc. (AMZN) resulted in underperformance. However, underweights to The Boeing Co. (BA) and The Walt Disney Co. (DIS) benefited performance.
In addition to the risk that the investment strategy employed in the Fund will underperform the benchmark index generally, the primary risks continue to primarily involve systematic risk. Because QRG controls the risk of the portfolio relative to the benchmark, the overall portfolio should track the Fund’s benchmark fairly closely on a relative basis. However, in general market declines the Fund’s fully invested strategy would incur a setback commensurate with the decline in the benchmark.
4
PMC Core Fixed Income Fund
The PMC Core Fixed Income Fund was launched on September 28, 2007, and provides broad exposure to the U.S. fixed income market. The Fund’s investment objective is to provide current income consistent with low volatility of principal, and is sub-advised by two institutional investment managers: Neuberger Berman Investment Advisers, LLC and Schroder Investment Management North America, Inc.
Over the past six months the environment for fixed income securities has been one of declining yields resulting from demand for U.S. Treasury securities as a result of a flight to quality in the midst of the coronavirus pandemic. Against this backdrop, the Fund’s Advisor Class shares generated positive return of 2.86% for the six-month period ending February 29, 2020, trailing the performance of the Bloomberg Barclays U.S. Aggregate Bond Index return of 3.39%. The primary factors positively impacting performance over the past six-month period were security selection within the U.S. Treasury bond and securitized securities segments. The Fund’s aggregate underweight to corporate bonds was a positive contributor during the period. The primary detractors from performance included security selection in the corporate bonds and an overweight to cash.
The primary risks to the strategies employed by the Fund’s sub-advisers remain in place, and exist at both the macro level and in individual security selection. Due to the Fund’s aggregate overweight exposure to credit securities, the Fund remains likely to underperform the benchmark somewhat if the Federal Reserve makes a policy misstep, and Treasury securities consequently rise relative to credits. In addition, if the general level of interest rates rises rapidly, the Fund will not be immune to losses. Similarly, if certain of the individual credits currently owned by the Fund are adversely affected by economic events, the Fund itself will also be affected.
Remarks
As always, we appreciate your continued trust and confidence in the PMC Funds. We will continue to do all we can to ensure that such trust and confidence are well placed and will manage the PMC Funds with that goal clearly in mind.

Brandon R. Thomas
Co-Founder and Chief Investment Officer
Envestnet | PMC
Envestnet Asset Management
The views in this report were those of the Funds’ Investment Adviser and the Investment Sub-Advisers as of the date of this report, and may not reflect their views on the date the report is first published or anytime thereafter. These views are intended to assist the shareholders of the Funds in understanding their investments in the Funds and do not constitute investment advice.
Investments in smaller companies carry greater risk than is customarily associated with larger companies for various reasons such as volatility of earnings and prospects, higher failure rates, and limited markets, product lines or financial resources. Investing overseas involves special risks, including the volatility of currency exchange rates and, in some cases, limited geographic focus, political and economic instability, and relatively illiquid markets. Income (bond) funds are subject to interest rate risk which is the risk that debt securities in a fund’s portfolio will decline in value because of increases in market interest rates. Please see the prospectus for a complete description of the risks associated with investing in the PMC Funds.
5
PMC FUNDS
(Unaudited)
As a shareholder of the PMC Core Fixed Income Fund or the PMC Diversified Equity Fund (each a “Fund”, and together the “Funds”), you incur two types of costs: (1) transaction costs, and (2) ongoing costs, including management fees, distribution (12b-1) fees (Advisor Class shares only) and other fund expenses. This Example is intended to help you understand your ongoing costs (in dollars) of investing in the Funds, and to compare these costs with the ongoing costs of investing in other mutual funds. The Example is based on an investment of $1,000 invested at the beginning of the period and held for the entire period.
| Actual | Expenses |
The first lines of the following tables provide information about actual account values and actual expenses. Although the Funds do not charge a sales load, you will be assessed fees for outgoing wire transfers, returned checks and stop payment orders at prevailing rates charged by U.S. Bancorp Fund Services, LLC, the Funds’ transfer agent. Individual Retirement Accounts (“IRA”) will be charged a $15.00 annual maintenance fee. To the extent the Funds invest in shares of exchange-traded funds or other investment companies as part of their investment strategy, you will indirectly bear your proportionate share of any fees and expenses charged by the underlying funds in which the Funds invest in addition to the direct expenses of the Funds. Actual expenses of the underlying funds are expected to vary among the various underlying funds. These expenses are not included in the Example. The Example includes, but is not limited to, management fees, distribution (12b-1) fees, fund administration and accounting, custody and transfer agent fees. You may use the information in this line, together with the amount you invested, to estimate the expenses that you paid over the period. Simply divide your account value by $1,000 (for example, an $8,600 account value divided by $1,000 = 8.6), then multiply the result by the number in the first line under the heading entitled “Expenses Paid During Period” to estimate the expenses you paid on your account during this period.
| Hypothetical | Example for Comparison Purposes |
The second lines of the tables provide information about hypothetical account values and hypothetical expenses based on the Funds’ actual expense ratio and an assumed rate of return of 5% per year before expenses, which is not the Funds’ actual returns. The hypothetical account values and expenses may not be used to estimate the actual ending account balance or expenses you paid for the period. You may use this information to compare the ongoing costs of investing in the Funds and other funds. To do so, compare this 5% hypothetical example with the 5% hypothetical examples that appear in the shareholder reports of other funds. Please note that the expenses shown in the table are meant to highlight your ongoing costs only and do not reflect any transactional costs, such as sales charges (loads), or exchange fees. Therefore, the second lines of the tables are useful in comparing ongoing costs only, and will not help you determine the relative total costs of owning different funds. In addition, if these transactional costs were included, your costs would have been higher.
| Beginning Account Value 9/1/19 |
Ending Account Value 2/29/20 |
Expenses Paid During Period 9/1/19-2/29/20* |
||||||||||
| PMC Core Fixed Income Fund–Advisor Class |
||||||||||||
| Actual |
$ | 1,000.00 | $ | 1,028.60 | $ | 5.04 | ||||||
| Hypothetical (5% return before expenses) |
1,000.00 | 1,019.89 | 5.02 | |||||||||
| * | Expenses are equal to the Fund’s annualized expense ratio of 1.00%, multiplied by the average account value over the period, multiplied by 182/366 to reflect the one-half year period. |
| Beginning Account Value 9/1/19 |
Ending Account Value 2/29/20 |
Expenses Paid During Period 9/1/19-2/29/20* |
||||||||||
| PMC Core Fixed Income Fund–Institutional Class |
||||||||||||
| Actual |
$ | 1,000.00 | $ | 1,029.90 | $ | 3.79 | ||||||
| Hypothetical (5% return before expenses) |
1,000.00 | 1,021.13 | 3.77 | |||||||||
| * | Expenses are equal to the Fund’s annualized expense ratio of 0.75%, multiplied by the average account value over the period, multiplied by 182/366 to reflect the one-half year period. |
6
| Beginning Account Value 9/1/19 |
Ending Account Value 2/29/20 |
Expenses Paid During Period 9/1/19-2/29/20* |
||||||||||
| PMC Diversified Equity Fund–Advisor Class |
||||||||||||
| Actual |
$ | 1,000.00 | $ | 990.10 | $ | 4.85 | ||||||
| Hypothetical (5% return before expenses) |
1,000.00 | 1,019.99 | 4.92 | |||||||||
| * | Expenses are equal to the Fund’s annualized expense ratio of 0.98%, multiplied by the average account value over the period, multiplied by 182/366 to reflect the one-half year period. |
| Beginning Account Value 9/1/19 |
Ending Account Value 2/29/20 |
Expenses Paid During Period 9/1/19-2/29/20* |
||||||||||
| PMC Diversified Equity Fund–Institutional Class |
||||||||||||
| Actual |
$ | 1,000.00 | $ | 991.80 | $ | 3.47 | ||||||
| Hypothetical (5% return before expenses) |
1,000.00 | 1,021.38 | 3.52 | |||||||||
| * | Expenses are equal to the Fund’s annualized expense ratio of 0.70%, multiplied by the average account value over the period, multiplied by 182/366 to reflect the one-half year period. |
7
PMC CORE FIXED INCOME FUND (PMFIX, PMFQX)
Investment Highlights (Unaudited)
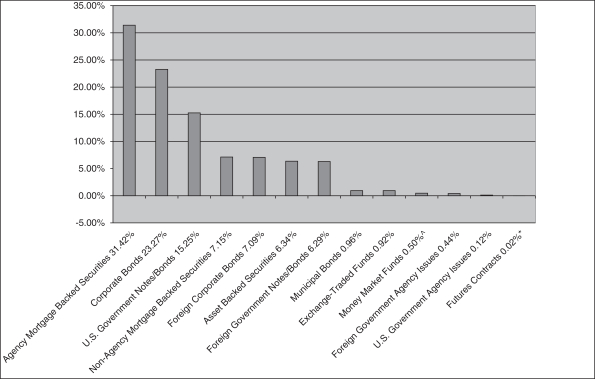
The investment objective of the Fund is to provide current income consistent with low volatility of principal. The Fund’s allocation of portfolio holdings as of February 29, 2020 is shown below.
Allocation of Portfolio Holdings
% of Net assets
| ^ | Excludes securities lending collateral. |
| * | Valued at the net unrealized appreciation (depreciation). |
8
PMC CORE FIXED INCOME FUND–ADVISOR CLASS (PMFIX)
Investment Highlights (Unaudited) (Continued)
Average Annual Returns as of February 29, 2020
| PMC Core Fixed Income Fund–Advisor Class |
Bloomberg Barclays U.S. Aggregate Bond Index |
|||||||
| One Year |
10.50 | % | 11.68 | % | ||||
| Five Year |
2.94 | % | 3.58 | % | ||||
| Ten Year |
3.65 | % | 3.93 | % | ||||
| Since Inception (9/28/07) |
4.81 | % | 4.47 | % | ||||
Performance data quoted represents past performance and does not guarantee future results. The investment return and principal value of an investment will fluctuate so that an investor’s shares, when redeemed, may be worth more or less than their original cost. Current performance of the Fund may be lower or higher than the performance quoted. Performance data current to the most recent month end may be obtained by calling the Fund (toll free) at (866) PMC-7338.
Short-term performance, in particular, is not a good indication of the Fund’s future performance, and an investment should not be made based solely on historical returns.
Investment performance reflects fee waivers in effect. In the absence of such waivers, total return would be reduced.
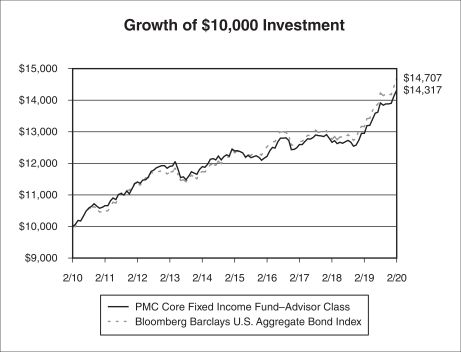
The returns shown assume reinvestment of Fund distributions and do not reflect the deduction of taxes that a shareholder would pay on Fund distributions or the redemption of Fund shares. The graph illustrates performance of a hypothetical investment made in the Fund and a broad-based securities index on February 28, 2010. The graph does not reflect any future performance.
The Bloomberg Barclays U.S. Aggregate Bond Index is an index composed of U.S. securities in Treasury, Government-Related, Corporate and Securitized Sectors. It includes securities that are of investment-grade quality or better, have at least one year to maturity and have an outstanding par value of at least $250 million.
One cannot invest directly in an index.
9
PMC CORE FIXED INCOME FUND–INSTITUTIONAL CLASS (PMFQX)
Investment Highlights (Unaudited) (Continued)
Total Returns as of February 29, 2020
| PMC Core Fixed Income Fund–Institutional Class |
Bloomberg Barclays U.S. Aggregate Bond Index |
|||||||
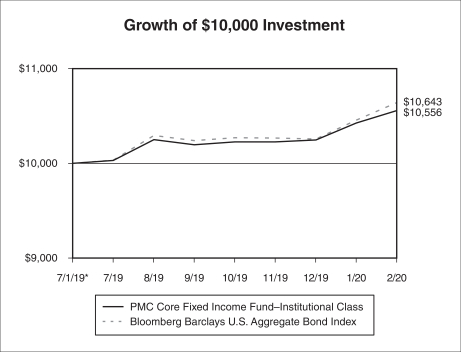
| Since Inception (7/1/19) |
5.56 | % | 6.43 | % | ||||
Performance data quoted represents past performance and does not guarantee future results. The investment return and principal value of an investment will fluctuate so that an investor’s shares, when redeemed, may be worth more or less than their original cost. Current performance of the Fund may be lower or higher than the performance quoted. Performance data current to the most recent month end may be obtained by calling the Fund (toll free) at (866) PMC-7338.
Short-term performance, in particular, is not a good indication of the Fund’s future performance, and an investment should not be made based solely on historical returns.
Investment performance reflects fee waivers in effect. In the absence of such waivers, total return would be reduced.
The returns shown assume reinvestment of Fund distributions and do not reflect the deduction of taxes that a shareholder would pay on Fund distributions or the redemption of Fund shares. The graph illustrates performance of a hypothetical investment made in the Fund and a broad-based securities index on July 1, 2019, the inception date of the Institutional Class. The graph does not reflect any future performance.
The Bloomberg Barclays U.S. Aggregate Bond Index is an index composed of U.S. securities in Treasury, Government-Related, Corporate and Securitized Sectors. It includes securities that are of investment-grade quality or better, have at least one year to maturity and have an outstanding par value of at least $250 million.
One cannot invest directly in an index.
| * | Inception Date |
10
PMC DIVERSIFIED EQUITY FUND (PMDEX, PMDQX)
Investment Highlights (Unaudited)
The investment objective of the Fund is long-term capital appreciation. The Fund’s allocation of portfolio holdings as of February 29, 2020 is shown below.
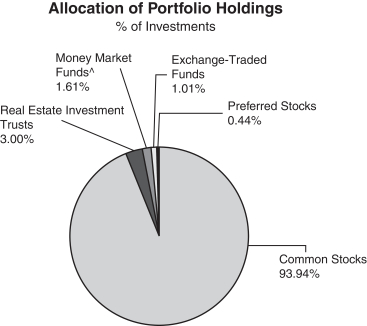
| ^ | Excludes securities lending collateral. |
11
PMC DIVERSIFIED EQUITY FUND–ADVISOR CLASS (PMDEX)
Investment Highlights (Unaudited) (Continued)
Average Annual Returns as of February 29, 2020
| PMC Diversified Equity Fund– Advisor Class |
MSCI World Index Net Return |
|||||||
| One Year |
-1.32 | % | 4.63 | % | ||||
| Five Year |
3.10 | % | 5.88 | % | ||||
| Ten Year |
8.00 | % | 8.75 | % | ||||
| Since Inception (8/26/09) |
8.24 | % | 8.82 | % | ||||
On May 25, 2018, Envestnet Asset Management, Inc. (the “Adviser”), the Fund’s investment adviser, assumed all responsibilities for selecting investments in the Fund’s portfolio in connection with a change to the Fund’s investment strategies. The Fund’s performance prior to this date reflects the Fund’s returns achieved when the Adviser actively managed a portion of the Fund’s portfolio and used a “manager of managers” investment strategy by engaging sub-advisers to manage other portions of the Fund’s portfolio.
Performance data quoted represents past performance and does not guarantee future results. The investment return and principal value of an investment will fluctuate so that an investor’s shares, when redeemed, may be worth more or less than their original cost. Current performance of the Fund may be lower or higher than the performance quoted. Performance data current to the most recent month end may be obtained by calling the Fund (toll free) at (866) PMC-7338.
Short-term performance, in particular, is not a good indication of the Fund’s future performance, and an investment should not be made based solely on historical returns.
Investment performance reflects fee waivers in effect. In the absence of such waivers, total return would be reduced.
The returns shown assume reinvestment of Fund distributions and do not reflect the deduction of taxes that a shareholder would pay on Fund distributions or the redemption of Fund shares. The graph illustrates performance of a hypothetical investment made in the Fund and a broad-based securities index on February 28, 2010. The graph does not reflect any future performance. On May 25, 2018, the Adviser assumed all responsibilities for selecting investments in the Fund’s portfolio in connection with a change to the Fund’s investment strategies. The Fund’s performance prior to this date reflects the Fund’s returns achieved when the Adviser actively managed a portion of the Fund’s portfolio and used a “manager of managers” investment strategy by engaging sub-advisers to manage other portions of the Fund’s portfolio.
The MSCI World Index Net Return is a free float-adjusted market capitalization weighted index that is designed to measure the equity market performance of developed markets. Net return indices reinvest dividends after the deduction of taxes, using a tax rate applicable to non-resident investors who do not benefit from table taxation treaties. The MSCI World Index consists of the following 23 developed market country indices: Australia, Austria, Belgium, Canada, Denmark, Finland, France, Germany, Hong Kong, Ireland, Israel, Italy, Japan, Netherlands, New Zealand, Norway, Portugal, Singapore, Spain, Sweden, Switzerland, the United Kingdom, and the United States.
One cannot invest directly in an index.
Continued
12
PMC DIVERSIFIED EQUITY FUND–ADVISOR CLASS (PMDEX)
Investment Highlights (Unaudited) (Continued)
13
PMC DIVERSIFIED EQUITY FUND–INSTITUTIONAL CLASS (PMDQX)
Investment Highlights (Unaudited) (Continued)
Total Returns as of February 29, 2020
| PMC Diversified Equity Fund– Institutional Class |
MSCI World Index Net Return |
|||||||
| Since Inception (7/1/19) |
-4.47 | % | -1.32 | % | ||||
Performance data quoted represents past performance and does not guarantee future results. The investment return and principal value of an investment will fluctuate so that an investor’s shares, when redeemed, may be worth more or less than their original cost. Current performance of the Fund may be lower or higher than the performance quoted. Performance data current to the most recent month end may be obtained by calling the Fund (toll free) at (866) PMC-7338.
Short-term performance, in particular, is not a good indication of the Fund’s future performance, and an investment should not be made based solely on historical returns.
Investment performance reflects fee waivers in effect. In the absence of such waivers, total return would be reduced.
The returns shown assume reinvestment of Fund distributions and do not reflect the deduction of taxes that a shareholder would pay on Fund distributions or the redemption of Fund shares. The graph illustrates performance of a hypothetical investment made in the Fund and a broad-based securities index on July 1, 2019, the inception date of the Institutional Class. The graph does not reflect any future performance.
The MSCI World Index Net Return is a free float-adjusted market capitalization weighted index that is designed to measure the equity market performance of developed markets. Net return indices reinvest dividends after the deduction of taxes, using a tax rate applicable to non-resident investors who do not benefit from table taxation treaties. The MSCI World Index consists of the following 23 developed market country indices: Australia, Austria, Belgium, Canada, Denmark, Finland, France, Germany, Hong Kong, Ireland, Israel, Italy, Japan, Netherlands, New Zealand, Norway, Portugal, Singapore, Spain, Sweden, Switzerland, the United Kingdom, and the United States.
One cannot invest directly in an index.
| * | Inception Date |
14
| PMC CORE FIXED INCOME FUND |
Schedule of Investments |
February 29, 2020 (Unaudited)
| Principal Amount |
Value |
|||||||
| Asset Backed Securities—6.34% | ||||||||
| AM Capital Funding LLC |
||||||||
| 2018-1, 4.980%, 12/15/2023(b) |
$ | 560,000 | $ | 595,442 | ||||
| Asset Backed Funding Certificates |
||||||||
| 2004-OPT3, 2.407% (1 Month LIBOR USD + 0.780%), 11/25/2033(c) |
276,662 | 273,262 | ||||||
| BlueMountain CLO Ltd. |
||||||||
| 2013-2R, 2.982% (3 Month LIBOR USD + 1.180%), 10/22/2030(b)(c) |
370,000 | 369,852 | ||||||
| CAL Funding III Ltd. |
||||||||
| 2017-1A, 3.620%, 06/25/2042(b) |
713,533 | 715,023 | ||||||
| Carlyle Global Market Strategies |
||||||||
| 2017-1A, 3.119% (3 Month LIBOR USD + 1.300%), 04/20/2031(b)(c) |
1,375,000 | 1,375,000 | ||||||
| Cedar Funding VI CLO Ltd. |
||||||||
| 2016-6A, 2.909% (3 Month LIBOR USD + 1.090%), 10/20/2028(b)(c) |
1,480,000 | 1,477,780 | ||||||
| Centex Home Equity Loan Trust |
||||||||
| 2005-D M3, 2.107% (1 Month LIBOR USD + 0.480%), 10/25/2035(c) |
358,767 | 359,745 | ||||||
| 2005-D M4, 2.237% (1 Month LIBOR USD + 0.610%), 10/25/2035(c) |
390,000 | 390,722 | ||||||
| CIFC Funding Ltd. |
||||||||
| 2017-4, 3.051% (3 Month LIBOR USD + 1.250%), 10/24/2030(b)(c) |
500,000 | 500,050 | ||||||
| Citibank Credit Card Issuance Trust |
||||||||
| 2018-A1, 2.490%, 01/20/2023 |
125,000 | 126,199 | ||||||
| Citigroup Mortgage Loan Trust, Inc. |
||||||||
| 2006-WFHE4, 1.907% (1 Month LIBOR USD + 0.280%), 11/25/2036(c) |
203,171 | 203,089 | ||||||
| CWABS, Inc. |
||||||||
| 2004-5, 2.127% (1 Month LIBOR USD + 0.500%), 10/25/2034(c) |
337,200 | 335,475 | ||||||
| Dewolf Park Clo Ltd. |
||||||||
| 2017-1A, 3.041% (3 Month LIBOR USD + 1.210%), 10/15/2030(b)(c) |
1,700,000 | 1,699,320 | ||||||
| ECAF I Ltd. |
||||||||
| 2015-1A, 3.473%, 06/15/2040(b) |
179,267 | 179,585 | ||||||
| EquiFirst Mortgage Loan Trust |
||||||||
| 2003-2, 2.784% (1 Month LIBOR USD + 1.125%), 09/25/2033(c) |
270,511 | 269,616 | ||||||
| GCAT Trust |
||||||||
| 2019-NQM2, 2.855%, 09/25/2059(b) |
837,877 | 848,977 | ||||||
| 2019-NQM3, 2.686%, 11/25/2059(b)(d) |
542,023 | 550,949 | ||||||
| Goldentree Loan Management US Clo 2 Ltd. |
||||||||
| 2017-2A, 2.969% (3 Month LIBOR USD + 1.150%), 11/28/2030(b)(c) |
1,525,000 | 1,524,390 | ||||||
| Home Equity Mortgage Trust |
||||||||
| 2004-5, 3.227% (1 Month LIBOR USD + 1.600%), 02/25/2035(c) |
5,472 | 5,480 | ||||||
| JP Morgan Mortgage Acquisition Trust |
||||||||
| 2007-CH1, 1.941% (1 Month LIBOR USD + 0.280%), 11/25/2036(c) |
310,000 | 310,262 | ||||||
| Madison Park Funding XVIII Ltd. |
||||||||
| 2015-18, 3.009% (3 Month LIBOR USD + 1.190%), 10/21/2030(b)(c) |
2,000,000 | 2,000,000 | ||||||
| Madison Park Funding XXVI Ltd. |
||||||||
| 2007-26, 2.975% (3 Month LIBOR USD + 1.200%), 07/29/2030(b)(c) |
2,295,000 | 2,295,230 | ||||||
| Navient Student Loan Trust |
||||||||
| 2017-3A, 1.927% (1 Month LIBOR USD + 0.300%), 07/26/2066(b)(c) |
233 | 233 | ||||||
| 2019-7, 2.127% (1 Month LIBOR USD + 0.500%), 01/25/2068(b)(c) |
970,931 | 971,354 | ||||||
| Octagon Investment Partners 30 Ltd. |
||||||||
| 2017-1A, 3.139% (3 Month LIBOR USD + 1.320%), 03/17/2030(b)(c) |
550,000 | 549,945 | ||||||
| Permanent Master Issuer PLC |
||||||||
| 2018-1, 2.211% (3 Month LIBOR USD + 0.380%), 07/15/2058(b)(c) |
187,500 | 187,538 | ||||||
| Popular ABS Mortgage Pass-Through Trust |
||||||||
| 2005-2, 2.181% (1 Month LIBOR USD + 0.260%), 04/25/2035(c) |
29,142 | 29,207 | ||||||
The accompanying notes are an integral part of these financial statements.
15
| PMC CORE FIXED INCOME FUND |
Schedule of Investments |
February 29, 2020 (Unaudited) (Continued)
| Principal Amount |
Value |
|||||||
| RASC Trust |
||||||||
| 2005-EMX2, 2.277% (1 Month LIBOR USD + 0.650%), 07/25/2035(c) |
$ | 177,357 | $ | 178,859 | ||||
| 2005-KS12, 2.087% (1 Month LIBOR USD + 0.460%), 01/25/2036(c) |
390,000 | 390,099 | ||||||
| Structured Asset Securities Corp. |
||||||||
| 2005-NC1, 2.147% (1 Month LIBOR USD + 0.520%), 02/25/2035(c) |
440,000 | 441,518 | ||||||
| Structured Asset Securities Corp. Mortgage Loan Trust |
||||||||
| 2006-AM1, 1.787% (1 Month LIBOR USD + 0.160%), 04/25/2036(c) |
63 | 63 | ||||||
| TAL Advantage V LLC |
||||||||
| 2014-2A, 3.330%, 05/20/2039(b) |
70,125 | 70,852 | ||||||
| Textainer Marine Containers V Ltd. |
||||||||
| 2017-1A, 3.720%, 05/20/2042(b) |
134,075 | 137,710 | ||||||
| 2017-2A, 3.520%, 06/20/2042(b) |
452,017 | 462,379 | ||||||
| Towd Point Mortgage Trust |
||||||||
| 2015-6, 3.500%, 04/25/2055(b)(d) |
45,103 | 46,275 | ||||||
| 2016-2, 2.750%, 08/25/2055(b)(d) |
46,302 | 47,266 | ||||||
| 2016-3, 2.250%, 04/25/2056(b)(d) |
37,936 | 38,253 | ||||||
| 2017-5, 2.227% (1 Month LIBOR USD + 0.600%), 02/25/2057(b)(c) |
745,430 | 746,321 | ||||||
| 2017-2, 2.750%, 04/25/2057(b)(d) |
257,806 | 262,257 | ||||||
| 2017-3, 2.750%, 06/25/2057(b)(d) |
534,707 | 547,780 | ||||||
| 2017-4, 2.750%, 06/25/2057(b)(d) |
295,969 | 304,507 | ||||||
| Voya CLO Ltd. |
||||||||
| 2014-2A, 0.000% (3 Month LIBOR USD + 1.020%), 04/17/2030(b)(c) |
1,750,000 | 1,749,212 | ||||||
| 2014-2R, 3.086% (3 Month LIBOR USD + 1.250%), 04/17/2030(b)(c) |
1,380,000 | 1,380,000 | ||||||
| Wind River CLO Ltd. |
||||||||
| 2017-2A, 3.049% (3 Month LIBOR USD + 1.230%), 07/20/2030(b)(c) |
1,440,000 | 1,441,872 | ||||||
| Total Asset Backed Securities (Cost $26,165,708) |
26,388,948 | |||||||
| Corporate Bonds—23.27% | ||||||||
| Accommodation—0.03% |
||||||||
| Wynn Las Vegas LLC |
||||||||
| 5.250%, 05/15/2027(b) |
117,000 | 113,636 | ||||||
| Administrative and Support Services—0.12% |
||||||||
| Scientific Games International, Inc. |
||||||||
| 5.000%, 10/15/2025(b) |
492,000 | 494,460 | ||||||
| Ambulatory Health Care Services—0.10% |
||||||||
| Encompass Health Corp. |
||||||||
| 5.750%, 09/15/2025(f) |
420,000 | 436,974 | ||||||
| Beverage and Tobacco Product Manufacturing—1.13% |
||||||||
| Altria Group, Inc. |
||||||||
| 4.400%, 02/14/2026 |
483,000 | 540,820 | ||||||
| 4.800%, 02/14/2029(f) |
721,000 | 824,544 | ||||||
| Anheuser-Busch InBev Worldwide, Inc. |
||||||||
| 4.150%, 01/23/2025 |
1,006,000 | 1,121,887 | ||||||
| 4.600%, 04/15/2048 |
420,000 | 504,934 | ||||||
| 4.750%, 04/15/2058 |
755,000 | 917,671 | ||||||
| 5.800%, 01/23/2059 |
550,000 | 782,365 | ||||||
| 4,692,221 | ||||||||
| Broadcasting (except Internet)—1.44% |
||||||||
| Comcast Corp. |
||||||||
| 3.700%, 04/15/2024 |
595,000 | 646,676 | ||||||
| 3.950%, 10/15/2025 |
838,000 | 939,107 | ||||||
| 3.150%, 02/15/2028 |
1,000,000 | 1,087,062 | ||||||
| 4.950%, 10/15/2058 |
765,000 | 1,051,073 | ||||||
The accompanying notes are an integral part of these financial statements.
16
| PMC CORE FIXED INCOME FUND |
Schedule of Investments |
February 29, 2020 (Unaudited) (Continued)
| Principal Amount |
Value |
|||||||
| Discovery Communications LLC |
||||||||
| 2.950%, 03/20/2023 |
$ | 1,220,000 | $ | 1,262,277 | ||||
| Fox Corp. |
||||||||
| 5.576%, 01/25/2049(b) |
755,000 | 1,015,401 | ||||||
| 6,001,596 | ||||||||
| Chemical Manufacturing—1.53% |
||||||||
| AbbVie, Inc. |
||||||||
| 3.200%, 11/06/2022 |
45,000 | 46,595 | ||||||
| 2.950%, 11/21/2026(b) |
135,000 | 141,458 | ||||||
| 3.200%, 11/21/2029(b) |
1,713,000 | 1,810,523 | ||||||
| 4.050%, 11/21/2039(b) |
270,000 | 299,598 | ||||||
| 4.700%, 05/14/2045 |
580,000 | 687,360 | ||||||
| 4.250%, 11/21/2049(b) |
775,000 | 880,070 | ||||||
| Bayer US Finance II LLC |
||||||||
| 3.875%, 12/15/2023(b) |
1,840,000 | 1,980,825 | ||||||
| Church & Dwight Co., Inc. |
||||||||
| 2.450%, 08/01/2022(f) |
500,000 | 510,357 | ||||||
| 6,356,786 | ||||||||
| Computer and Electronic Product Manufacturing—0.78% |
||||||||
| Apple, Inc. |
||||||||
| 3.000%, 06/20/2027 |
1,200,000 | 1,300,626 | ||||||
| Dell International LLC |
||||||||
| 5.450%, 06/15/2023(b) |
1,085,000 | 1,196,904 | ||||||
| Microchip Technology, Inc. |
||||||||
| 4.333%, 06/01/2023 |
690,000 | 745,253 | ||||||
| 3,242,783 | ||||||||
| Credit Intermediation and Related Activities—4.22% |
||||||||
| Bank of America Corp. |
||||||||
| 2.738% to 01/23/2021, then 3 Month LIBOR USD + 0.370%, 01/23/2022(a) |
545,000 | 550,648 | ||||||
| 2.456% to 10/22/2024, then 3 Month LIBOR USD + 0.870%, 10/22/2025(a) |
187,000 | 191,843 | ||||||
| 3.705% to 04/24/2027, then 3 Month LIBOR USD + 1.512%, 04/24/2028(a) |
660,000 | 721,221 | ||||||
| 3.970% to 03/05/2028, then 3 Month LIBOR USD + 1.070%, 03/05/2029(a) |
630,000 | 706,296 | ||||||
| 2.884% to 10/22/2029, then 3 Month LIBOR USD + 1.190%, 10/22/2030(a) |
1,418,000 | 1,489,055 | ||||||
| BNP Paribas SA |
||||||||
| 3.052% to 01/13/2030, then SOFR + 1.507%, 01/13/2031(a)(b) |
615,000 | 631,969 | ||||||
| Capital One NA |
||||||||
| 2.150%, 09/06/2022 |
820,000 | 829,964 | ||||||
| Citigroup, Inc. |
||||||||
| 2.700%, 03/30/2021 |
775,000 | 783,272 | ||||||
| 4.050%, 07/30/2022 |
65,000 | 68,616 | ||||||
| 3.200%, 10/21/2026 |
1,095,000 | 1,166,915 | ||||||
| 4.300%, 11/20/2026 |
890,000 | 987,755 | ||||||
| 3.887% to 01/10/2027, then 3 Month LIBOR USD + 1.563%, 01/10/2028(a) |
795,000 | 881,921 | ||||||
| 3.520% to 10/27/2027, then 3 Month LIBOR USD + 1.151%, 10/27/2028(a)(f) |
455,000 | 495,865 | ||||||
| Fifth Third Bancorp |
||||||||
| 3.650%, 01/25/2024 |
703,000 | 753,973 | ||||||
| 2.375%, 01/28/2025 |
1,197,000 | 1,230,314 | ||||||
| General Motors Financial Co., Inc. |
||||||||
| 3.700%, 11/24/2020 |
525,000 | 529,571 | ||||||
| 3.200%, 07/06/2021 |
150,000 | 151,810 | ||||||
| 5.100%, 01/17/2024 |
370,000 | 405,637 | ||||||
The accompanying notes are an integral part of these financial statements.
17
| PMC CORE FIXED INCOME FUND |
Schedule of Investments |
February 29, 2020 (Unaudited) (Continued)
| Principal Amount |
Value |
|||||||
| JPMorgan Chase & Co. |
||||||||
| 2.700%, 05/18/2023 |
$ | 1,255,000 | $ | 1,302,321 | ||||
| Wells Fargo & Co. |
||||||||
| 3.069%, 01/24/2023 |
645,000 | 661,836 | ||||||
| 2.406% to 10/30/2024, then 3 Month LIBOR USD + 0.825%, 10/30/2025(a) |
2,097,000 | 2,147,612 | ||||||
| 2.572% to 02/11/2030, then 3 Month LIBOR USD + 1.000%, 02/11/2031(a)(f) |
865,000 | 884,186 | ||||||
| 17,572,600 | ||||||||
| Data Processing, Hosting and Related Services—0.12% |
||||||||
| Hewlett Packard Enterprise Co. |
||||||||
| 3.600%, 10/15/2020 |
490,000 | 494,217 | ||||||
| Food and Beverage Stores—0.05% |
||||||||
| Kroger Co. |
||||||||
| 5.400%, 01/15/2049 |
170,000 | 221,097 | ||||||
| Food Manufacturing—0.56% |
||||||||
| Kraft Heinz Foods Co. |
||||||||
| 3.750%, 04/01/2030(b) |
860,000 | 877,102 | ||||||
| 4.625%, 10/01/2039 |
524,000 | 501,387 | ||||||
| 5.000%, 06/04/2042 |
110,000 | 109,785 | ||||||
| 5.200%, 07/15/2045 |
50,000 | 51,478 | ||||||
| 4.875%, 10/01/2049(b)(f) |
790,000 | 780,529 | ||||||
| 2,320,281 | ||||||||
| General Merchandise Stores—0.00% |
||||||||
| JC Penney Corp., Inc. |
||||||||
| 5.650%, 06/01/2020 |
1,000 | 959 | ||||||
| Health and Personal Care Stores—0.47% |
||||||||
| Albertsons Cos LLC / Safeway, Inc. / New Albertsons LP / Albertson’s LLC |
||||||||
| 5.875%, 02/15/2028(b) |
79,000 | 82,251 | ||||||
| CVS Health Corp. |
||||||||
| 4.300%, 03/25/2028 |
1,076,000 | 1,206,400 | ||||||
| 5.050%, 03/25/2048 |
555,000 | 683,437 | ||||||
| 1,972,088 | ||||||||
| Hospitals—0.41% |
||||||||
| Advocate Health & Hospitals Corp. |
||||||||
| 3.829%, 08/15/2028 |
495,000 | 569,548 | ||||||
| CommonSpirit Health |
||||||||
| 3.347%, 10/01/2029 |
445,000 | 473,086 | ||||||
| HCA, Inc. |
||||||||
| 5.250%, 06/15/2049 |
570,000 | 665,516 | ||||||
| 1,708,150 | ||||||||
| Insurance Carriers and Related Activities—0.84% |
||||||||
| American International Group, Inc. |
||||||||
| 3.300%, 03/01/2021 |
674,000 | 683,737 | ||||||
| 3.900%, 04/01/2026 |
646,000 | 715,804 | ||||||
| Equitable Holdings, Inc. |
||||||||
| 4.350%, 04/20/2028 |
1,104,000 | 1,243,080 | ||||||
| 5.000%, 04/20/2048 |
545,000 | 618,342 | ||||||
| UnitedHealth Group, Inc. |
||||||||
| 3.875%, 08/15/2059 |
215,000 | 245,244 | ||||||
| 3,506,207 | ||||||||
The accompanying notes are an integral part of these financial statements.
18
| PMC CORE FIXED INCOME FUND |
Schedule of Investments |
February 29, 2020 (Unaudited) (Continued)
| Principal Amount |
Value |
|||||||
| Machinery Manufacturing—0.26% |
||||||||
| General Electric Co. |
||||||||
| 3.100%, 01/09/2023 |
$ | 317,000 | $ | 328,963 | ||||
| 5.875%, 01/14/2038 |
590,000 | 768,122 | ||||||
| 1,097,085 | ||||||||
| Merchant Wholesalers, Durable Goods—0.26% |
||||||||
| KLA Corp. |
||||||||
| 3.300%, 03/01/2050 |
250,000 | 246,656 | ||||||
| TransDigm, Inc. |
||||||||
| 6.250%, 03/15/2026(b)(f) |
780,000 | 827,288 | ||||||
| 1,073,944 | ||||||||
| Merchant Wholesalers, Nondurable Goods—0.08% |
||||||||
| Cardinal Health, Inc. |
||||||||
| 3.079%, 06/15/2024 |
305,000 | 318,315 | ||||||
| Motor Vehicle and Parts Dealers—0.22% |
||||||||
| Volkswagen Group of America Finance LLC |
||||||||
| 2.700%, 09/26/2022(b)(f) |
890,000 | 910,826 | ||||||
| Miscellaneous Manufacturing—0.15% |
||||||||
| Boston Scientific Corp. |
||||||||
| 3.450%, 03/01/2024 |
567,000 | 604,617 | ||||||
| Oil and Gas Extraction—1.80% |
||||||||
| Apache Corp. |
||||||||
| 4.375%, 10/15/2028(f) |
945,000 | 995,272 | ||||||
| Concho Resources, Inc. |
||||||||
| 4.875%, 10/01/2047 |
445,000 | 525,035 | ||||||
| EQT Corp. |
||||||||
| 7.000%, 02/01/2030(f) |
2,010,000 | 1,507,500 | ||||||
| Occidental Petroleum Corp. |
||||||||
| 3.200%, 08/15/2026 |
700,000 | 713,427 | ||||||
| 3.500%, 08/15/2029 |
710,000 | 714,893 | ||||||
| 4.300%, 08/15/2039 |
260,000 | 249,873 | ||||||
| Phillips 66 Partners LP |
||||||||
| 3.605%, 02/15/2025 |
95,000 | 101,349 | ||||||
| Plains All American Pipeline LP / PAA Finance Corp. |
||||||||
| 4.650%, 10/15/2025 |
280,000 | 305,088 | ||||||
| 3.550%, 12/15/2029 |
2,420,000 | 2,384,013 | ||||||
| 7,496,450 | ||||||||
| Pipeline Transportation—1.14% |
||||||||
| Energy Transfer Operating LP |
||||||||
| 3.600%, 02/01/2023 |
600,000 | 622,162 | ||||||
| 6.625% to 05/15/2028, then 3 Month LIBOR USD + 4.155%(a)(h) |
785,000 | 701,983 | ||||||
| 3.750%, 05/15/2030 |
961,000 | 976,471 | ||||||
| 7.125% to 05/15/2030, then 5 Year CMT Rate + 5.306%(a)(h) |
1,055,000 | 998,294 | ||||||
| Kinder Morgan Energy Partners LP |
||||||||
| 4.150%, 02/01/2024 |
755,000 | 813,530 | ||||||
| MPLX LP |
||||||||
| 4.700%, 04/15/2048 |
640,000 | 649,421 | ||||||
| 4,761,861 | ||||||||
The accompanying notes are an integral part of these financial statements.
19
| PMC CORE FIXED INCOME FUND |
Schedule of Investments |
February 29, 2020 (Unaudited) (Continued)
| Principal Amount |
Value |
|||||||
| Professional, Scientific, and Technical Services—0.21% |
||||||||
| International Business Machines Corp. |
||||||||
| 4.250%, 05/15/2049 |
$ | 170,000 | $ | 212,316 | ||||
| Mylan, Inc. |
||||||||
| 4.550%, 04/15/2028(f) |
585,000 | 660,406 | ||||||
| 872,722 | ||||||||
| Publishing Industries (except Internet)—0.06% |
||||||||
| Oracle Corp. |
||||||||
| 4.000%, 07/15/2046 |
205,000 | 244,393 | ||||||
| Real Estate—0.87% |
||||||||
| Boston Properties LP |
||||||||
| 3.400%, 06/21/2029 |
1,362,000 | 1,498,161 | ||||||
| Camden Property Trust |
||||||||
| 3.150%, 07/01/2029 |
275,000 | 299,517 | ||||||
| Digital Realty Trust LP |
||||||||
| 3.950%, 07/01/2022 |
1,010,000 | 1,060,174 | ||||||
| Healthcare Trust of America Holdings LP |
||||||||
| 3.100%, 02/15/2030 |
400,000 | 418,829 | ||||||
| Healthpeak Properties, Inc. |
||||||||
| 3.250%, 07/15/2026 |
335,000 | 361,763 | ||||||
| 3,638,444 | ||||||||
| Rental and Leasing Services—0.69% |
||||||||
| Air Lease Corp. |
||||||||
| 2.300%, 02/01/2025(f) |
655,000 | 655,623 | ||||||
| Ford Motor Credit Co. LLC |
||||||||
| 4.063%, 11/01/2024 |
1,008,000 | 1,024,115 | ||||||
| Synchrony Financial |
||||||||
| 2.850%, 07/25/2022(f) |
1,165,000 | 1,192,136 | ||||||
| 2,871,874 | ||||||||
| Securities, Commodity Contracts, and Other Financial Investments and Related Activities—2.57% |
||||||||
| BAT Capital Corp. |
||||||||
| 2.764%, 08/15/2022 |
790,000 | 811,569 | ||||||
| 3.222%, 08/15/2024 |
297,000 | 312,119 | ||||||
| 3.557%, 08/15/2027 |
320,000 | 335,931 | ||||||
| Goldman Sachs Group, Inc. |
||||||||
| 2.875%, 02/25/2021 |
50,000 | 50,518 | ||||||
| 3.850%, 01/26/2027 |
1,375,000 | 1,511,427 | ||||||
| 3.691% to 06/05/2027, then 3 Month LIBOR USD + 1.510%, 06/05/2028(a) |
590,000 | 645,798 | ||||||
| 3.814% to 04/23/2028, then 3 Month LIBOR USD + 1.158%, 04/23/2029(a) |
640,000 | 706,433 | ||||||
| 4.017% to 10/31/2037, then 3 Month LIBOR USD + 1.373%, 10/31/2038(a) |
250,000 | 284,107 | ||||||
| Morgan Stanley |
||||||||
| 2.750%, 05/19/2022 |
1,000,000 | 1,028,382 | ||||||
| 3.750%, 02/25/2023 |
1,380,000 | 1,466,506 | ||||||
| 3.950%, 04/23/2027 |
935,000 | 1,026,013 | ||||||
| 3.591% to 07/22/2027, then 3 Month LIBOR USD + 1.340%, 07/22/2028(a) |
1,125,000 | 1,231,518 | ||||||
| 3.772% to 01/24/2028, then 3 Month LIBOR USD + 1.140%, 01/24/2029(a) |
875,000 | 972,997 | ||||||
| 5.441% to 12/20/2049, then 3 Month LIBOR USD + 3.610%(a)(h) |
320,000 | 320,722 | ||||||
| 10,704,040 | ||||||||
The accompanying notes are an integral part of these financial statements.
20
| PMC CORE FIXED INCOME FUND |
Schedule of Investments |
February 29, 2020 (Unaudited) (Continued)
| Principal Amount |
Value |
|||||||
| Support Activities for Mining—0.04% |
||||||||
| Targa Resources Partners LP |
||||||||
| 6.750%, 03/15/2024 |
$ | 150,000 | $ | 153,189 | ||||
| Telecommunications—1.92% |
||||||||
| American Tower Corp. |
||||||||
| 3.700%, 10/15/2049 |
849,000 | 908,987 | ||||||
| AT&T, Inc. |
||||||||
| 3.400%, 05/15/2025 |
345,000 | 367,747 | ||||||
| 4.350%, 06/15/2045(f) |
220,000 | 248,338 | ||||||
| 5.450%, 03/01/2047 |
795,000 | 1,034,490 | ||||||
| 4.500%, 03/09/2048(f) |
545,000 | 625,768 | ||||||
| Charter Communications Operating LLC |
||||||||
| 5.050%, 03/30/2029(f) |
996,000 | 1,155,309 | ||||||
| 4.800%, 03/01/2050 |
545,000 | 589,910 | ||||||
| Crown Castle International Corp. |
||||||||
| 3.200%, 09/01/2024 |
825,000 | 873,208 | ||||||
| 3.800%, 02/15/2028(f) |
700,000 | 769,734 | ||||||
| Verizon Communications, Inc. |
||||||||
| 2.792% (3 Month LIBOR USD + 1.100%), 05/15/2025(c) |
825,000 | 843,765 | ||||||
| 4.016%, 12/03/2029 |
500,000 | 581,257 | ||||||
| 7,998,513 | ||||||||
| Transportation Equipment Manufacturing—0.39% |
||||||||
| General Motors Co. |
||||||||
| 2.542% (3 Month LIBOR USD + 0.800%), 08/07/2020(c) |
1,100,000 | 1,103,180 | ||||||
| United Technologies Corp. |
||||||||
| 3.950%, 08/16/2025 |
480,000 | 537,475 | ||||||
| 1,640,655 | ||||||||
| Utilities—0.81% |
||||||||
| DTE Energy Co. |
||||||||
| 2.529%, 10/01/2024 |
370,000 | 380,432 | ||||||
| 3.400%, 06/15/2029 |
825,000 | 890,427 | ||||||
| Evergy, Inc. |
||||||||
| 2.900%, 09/15/2029 |
780,000 | 806,703 | ||||||
| Kinder Morgan, Inc. |
||||||||
| 5.550%, 06/01/2045(f) |
730,000 | 868,843 | ||||||
| Southern Co. |
||||||||
| 2.950%, 07/01/2023 |
388,000 | 404,422 | ||||||
| 3,350,827 | ||||||||
| Total Corporate Bonds (Cost $91,131,494) |
96,871,810 | |||||||
| Foreign Corporate Bonds—7.09% | ||||||||
| Chemical Manufacturing—0.07% |
||||||||
| Mylan NV |
||||||||
| 3.950%, 06/15/2026 |
260,000 | 282,958 | ||||||
| Computer and Electronic Product Manufacturing—0.21% |
||||||||
| AerCap Ireland Capital DAC / AerCap Global Aviation Trust |
||||||||
| 4.450%, 10/01/2025 |
800,000 | 882,723 | ||||||
| Credit Intermediation and Related Activities—3.80% |
||||||||
| Banque Federative du Credit Mutuel SA |
||||||||
| 2.700%, 07/20/2022(b)(f) |
1,770,000 | 1,826,906 | ||||||
The accompanying notes are an integral part of these financial statements.
21
| PMC CORE FIXED INCOME FUND |
Schedule of Investments |
February 29, 2020 (Unaudited) (Continued)
| Principal Amount |
Value |
|||||||
| Barclays Bank PLC |
||||||||
| 10.179%, 06/12/2021(b) |
$ | 1,950,000 | $ | 2,149,739 | ||||
| Barclays PLC |
||||||||
| 3.072% (3 Month LIBOR USD + 1.380%), 05/16/2024(c) |
895,000 | 911,638 | ||||||
| Credit Agricole SA/London |
||||||||
| 2.821% (3 Month LIBOR USD + 1.020%), 04/24/2023(b)(c) |
745,000 | 757,474 | ||||||
| Credit Suisse Group AG |
||||||||
| 2.997% to 12/14/2022, then 3 Month LIBOR USD + 1.200%, 12/14/2023(a)(b) |
1,145,000 | 1,171,738 | ||||||
| 3.869% to 01/12/2028, then 3 Month LIBOR USD + 1.410%, 01/12/2029(a)(b) |
250,000 | 272,072 | ||||||
| HSBC Holdings PLC |
||||||||
| 2.650%, 01/05/2022 |
765,000 | 778,810 | ||||||
| 2.692% (3 Month LIBOR USD + 1.000%), 05/18/2024(c) |
400,000 | 403,684 | ||||||
| 2.633% to 11/07/2024, then 3 Month LIBOR USD + 1.140%, 11/07/2025(a) |
2,017,000 | 2,061,963 | ||||||
| 6.000% to 05/22/2027, then 5 Year Mid Swap Rate USD + 3.746%(a)(h) |
910,000 | 947,160 | ||||||
| Lloyds Banking Group PLC |
||||||||
| 2.438% to 02/05/2025, then 1 Year CMT Rate + 1.000%, 02/05/2026(a) |
970,000 | 984,372 | ||||||
| Royal Bank of Scotland Group PLC |
||||||||
| 6.125%, 12/15/2022 |
835,000 | 911,586 | ||||||
| 3.875%, 09/12/2023 |
835,000 | 887,551 | ||||||
| UBS Group AG |
||||||||
| 2.859% to 08/15/2022, then 3 Month LIBOR USD + 0.954%, 08/15/2023(a)(b) |
500,000 | 512,667 | ||||||
| 4.125%, 09/24/2025(b) |
1,100,000 | 1,227,000 | ||||||
| 15,804,360 | ||||||||
| Food Manufacturing—0.20% |
||||||||
| Grupo Bimbo SAB de CV |
||||||||
| 4.700%, 11/10/2047(b) |
730,000 | 837,379 | ||||||
| Funds, Trusts, and Other Financial Vehicles—0.22% |
||||||||
| Credit Suisse Group Funding Guernsey Ltd. |
||||||||
| 3.800%, 06/09/2023 |
860,000 | 903,750 | ||||||
| Machinery Manufacturing—0.25% |
||||||||
| GE Capital International Funding Co. Unlimited Co. |
||||||||
| 3.373%, 11/15/2025(f) |
963,000 | 1,027,431 | ||||||
| Management of Companies and Enterprises—0.32% |
||||||||
| Bank of Ireland Group PLC |
||||||||
| 4.500%, 11/25/2023(b) |
1,245,000 | 1,348,667 | ||||||
| Merchant Wholesalers, Durable Goods—0.02% |
||||||||
| Johnson Controls International PLC |
||||||||
| 3.900%, 02/14/2026 |
79,000 | 88,161 | ||||||
| Merchant Wholesalers, Nondurable Goods—0.30% |
||||||||
| Allergan Funding SCS |
||||||||
| 3.450%, 03/15/2022 |
1,211,000 | 1,255,035 | ||||||
| Miscellaneous Manufacturing—0.16% |
||||||||
| Shire Acquisitions Investments Ireland DAC |
||||||||
| 2.400%, 09/23/2021 |
675,000 | 684,167 | ||||||
| Oil and Gas Extraction—0.27% |
||||||||
| Canadian Natural Resources Ltd. |
||||||||
| 6.250%, 03/15/2038 |
850,000 | 1,109,675 | ||||||
| Rental and Leasing Services—0.05% |
||||||||
| FLY Leasing Ltd. |
||||||||
| 6.375%, 10/15/2021 |
200,000 | 202,875 | ||||||
The accompanying notes are an integral part of these financial statements.
22
| PMC CORE FIXED INCOME FUND |
Schedule of Investments |
February 29, 2020 (Unaudited) (Continued)
| Principal Amount |
Value |
|||||||
| Securities, Commodity Contracts, and Other Financial Investments and Related Activities—0.51% |
||||||||
| AIB Group PLC |
||||||||
| 4.263% to 04/10/2024, then 3 Month LIBOR USD + 1.874%, 04/10/2025(a)(b) |
$ | 1,995,000 | $ | 2,131,197 | ||||
| Telecommunications—0.48% |
||||||||
| British Telecommunications PLC |
||||||||
| 3.250%, 11/08/2029(b) |
860,000 | 890,173 | ||||||
| Vodafone Group PLC |
||||||||
| 2.833% (3 Month LIBOR USD + 0.990%), 01/16/2024(c) |
1,095,000 | 1,105,903 | ||||||
| 1,996,076 | ||||||||
| Transportation Services—0.12% |
||||||||
| JSL Europe SA |
||||||||
| 7.750%, 07/26/2024 |
474,000 | 504,376 | ||||||
| Utilities—0.11% |
||||||||
| Engie Energia Chile SA |
||||||||
| 3.400%, 01/28/2030(b) |
450,000 | 453,555 | ||||||
| Total Foreign Corporate Bonds (Cost $28,286,375) |
29,512,385 | |||||||
| Foreign Government Agency Issues—0.44% | ||||||||
| European Investment Bank |
||||||||
| 1.625%, 03/14/2025(f) |
1,780,000 | 1,833,805 | ||||||
| Total Foreign Government Agency Issues (Cost $1,774,660) |
1,833,805 | |||||||
| Foreign Government Notes/Bonds—6.29% | ||||||||
| Abu Dhabi Government International Bond |
||||||||
| 4.125%, 10/11/2047(b) |
610,000 | 737,479 | ||||||
| Angolan Government International Bond |
||||||||
| 9.500%, 11/12/2025(b) |
700,000 | 782,313 | ||||||
| Argentine Republic Government International Bond |
||||||||
| 4.625%, 01/11/2023 |
463,000 | 200,444 | ||||||
| 6.875%, 01/26/2027 |
435,000 | 185,423 | ||||||
| Brazilian Government International Bond |
||||||||
| 2.625%, 01/05/2023 |
760,000 | 771,788 | ||||||
| 5.625%, 02/21/2047 |
220,000 | 263,108 | ||||||
| Colombia Government International Bond |
||||||||
| 4.000%, 02/26/2024 |
390,000 | 415,089 | ||||||
| 3.875%, 04/25/2027 |
150,000 | 161,602 | ||||||
| 3.000%, 01/30/2030 |
1,305,000 | 1,318,716 | ||||||
| 5.200%, 05/15/2049 |
200,000 | 252,187 | ||||||
| Costa Rica Government International Bond |
||||||||
| 7.158%, 03/12/2045 |
995,000 | 1,038,218 | ||||||
| Croatia Government International Bond |
||||||||
| 6.000%, 01/26/2024(b) |
300,000 | 343,472 | ||||||
| Dominican Republic International Bond |
||||||||
| 5.875%, 04/18/2024(b) |
505,000 | 544,352 | ||||||
| 6.875%, 01/29/2026(b) |
360,000 | 410,529 | ||||||
| Guatemala Government Bond |
||||||||
| 4.375%, 06/05/2027(b) |
600,000 | 630,958 | ||||||
| Hungary Government International Bond |
||||||||
| 7.625%, 03/29/2041 |
660,000 | 1,131,084 | ||||||
| Indonesia Government International Bond |
||||||||
| 3.700%, 01/08/2022(b) |
330,000 | 340,494 | ||||||
| 4.350%, 01/08/2027(b) |
350,000 | 388,089 | ||||||
The accompanying notes are an integral part of these financial statements.
23
| PMC CORE FIXED INCOME FUND |
Schedule of Investments |
February 29, 2020 (Unaudited) (Continued)
| Principal Amount |
Value |
|||||||
| Kazakhstan Government International Bond |
||||||||
| 6.500%, 07/21/2045(b) |
$ | 200,000 | $ | 305,380 | ||||
| Mexico Government International Bond |
||||||||
| 4.150%, 03/28/2027 |
200,000 | 220,052 | ||||||
| 3.250%, 04/16/2030 |
1,785,000 | 1,836,319 | ||||||
| 4.350%, 01/15/2047(f) |
825,000 | 910,334 | ||||||
| Mongolia Government International Bond |
||||||||
| 8.750%, 03/09/2024(b) |
635,000 | 707,287 | ||||||
| Morocco Government International Bond |
||||||||
| 4.250%, 12/11/2022(b) |
475,000 | 500,051 | ||||||
| 5.500%, 12/11/2042(b) |
150,000 | 191,100 | ||||||
| Namibia International Bonds |
||||||||
| 5.250%, 10/29/2025(b)(f) |
785,000 | 810,271 | ||||||
| Nigeria Government International Bond |
||||||||
| 7.875%, 02/16/2032(b) |
535,000 | 540,282 | ||||||
| Oman Government International Bond |
||||||||
| 3.875%, 03/08/2022(b) |
290,000 | 291,834 | ||||||
| 5.375%, 03/08/2027(b) |
350,000 | 349,620 | ||||||
| 6.500%, 03/08/2047(b) |
350,000 | 328,564 | ||||||
| Panama Government International Bond |
||||||||
| 4.500%, 05/15/2047 |
450,000 | 562,363 | ||||||
| Paraguay Government International Bond |
||||||||
| 4.700%, 03/27/2027(b) |
790,000 | 883,107 | ||||||
| Peruvian Government International Bond |
||||||||
| 8.750%, 11/21/2033 |
450,000 | 761,630 | ||||||
| Qatar Government International Bond |
||||||||
| 3.250%, 06/02/2026(b) |
450,000 | 479,052 | ||||||
| 4.625%, 06/02/2046(b) |
360,000 | 449,602 | ||||||
| Republic of South Africa Government International Bond |
||||||||
| 4.875%, 04/14/2026 |
690,000 | 722,293 | ||||||
| 4.850%, 09/27/2027 |
933,000 | 974,985 | ||||||
| 4.300%, 10/12/2028 |
150,000 | 148,613 | ||||||
| 5.000%, 10/12/2046 |
150,000 | 137,685 | ||||||
| Romanian Government International Bond |
||||||||
| 6.125%, 01/22/2044(b) |
665,000 | 888,336 | ||||||
| Saudi Government International Bond |
||||||||
| 4.500%, 10/26/2046(b) |
150,000 | 172,383 | ||||||
| Sri Lanka Government International Bond |
||||||||
| 6.750%, 04/18/2028 (b) |
880,000 | 809,820 | ||||||
| Trinidad & Tobago Government International Bond |
||||||||
| 4.500%, 08/04/2026(b)(f) |
1,030,000 | 1,079,293 | ||||||
| Turkey Government International Bond |
||||||||
| 6.000%, 01/14/2041 |
250,000 | 224,190 | ||||||
| Uruguay Government International Bond |
||||||||
| 4.375%, 01/23/2031(f) |
590,000 | 679,243 | ||||||
| 5.100%, 06/18/2050 |
245,000 | 309,238 | ||||||
| Total Foreign Government Notes/Bonds (Cost $25,375,733) |
26,188,272 | |||||||
| Non-Agency Mortgage Backed Securities—7.15% | ||||||||
| Angel Oak Mortgage Trust |
||||||||
| 2019-6, 2.620%, 11/25/2059(b)(d) |
625,169 | 632,082 | ||||||
| BANK 2019-BNK22 |
||||||||
| 2019-BNK22, 2.978%, 11/15/2062 |
110,000 | 120,158 | ||||||
The accompanying notes are an integral part of these financial statements.
24
| PMC CORE FIXED INCOME FUND |
Schedule of Investments |
February 29, 2020 (Unaudited) (Continued)
| Principal Amount |
Value |
|||||||
| BANK 2020-BNK25 |
||||||||
| 2020-BNK25, 2.649%, 01/15/2063 |
$ | 1,536,680 | $ | 1,635,430 | ||||
| Benchmark Mortgage Trust |
||||||||
| 2018-B8, 4.232%, 01/15/2052 |
1,690,000 | 1,992,660 | ||||||
| BX Commercial Mortgage Trust |
||||||||
| 2018-IND B, 2.559% (1 Month LIBOR USD + 0.900%), 11/15/2035(b)(c) |
808,500 | 808,965 | ||||||
| 2018-IND C, 2.759% (1 Month LIBOR USD + 1.100%), 11/15/2035(b)(c) |
500,500 | 500,945 | ||||||
| Citigroup Commercial Mortgage Trust |
||||||||
| 2013-GCJ11, 3.732%, 04/10/2046(d) |
455,000 | 480,194 | ||||||
| 2013-GC17, 5.095%, 11/10/2046(d) |
145,000 | 160,569 | ||||||
| 2014-GC25, 0.993%, 10/10/2047(d)(e) |
1,488,013 | 59,657 | ||||||
| 2015-GC27, 1.346%, 02/10/2048(d)(e) |
1,104,469 | 59,820 | ||||||
| 2016-GC36, 3.616%, 02/10/2049 |
200,000 | 221,107 | ||||||
| 2017-C4, 2.121%, 10/12/2050 |
239,847 | 241,301 | ||||||
| 2018-C6, 3.300%, 11/10/2051 |
443,622 | 459,335 | ||||||
| COMM Mortgage Trust |
||||||||
| 2012-CCRE4, 3.251%, 10/15/2045 |
385,000 | 391,388 | ||||||
| 2014-UBS2, 3.472%, 03/10/2047 |
619,354 | 642,430 | ||||||
| 2014-CR16, 0.977%, 04/10/2047(d)(e) |
1,336,766 | 46,488 | ||||||
| 2014-LC15, 1.096%, 04/10/2047(d)(e) |
1,519,403 | 57,455 | ||||||
| 2014-CR17, 0.973%, 05/10/2047(d)(e) |
1,120,818 | 39,157 | ||||||
| 2014-UBS3, 1.078%, 06/10/2047(d)(e) |
911,193 | 36,186 | ||||||
| 2014-UBS6, 0.892%, 12/10/2047(d)(e) |
1,684,703 | 57,839 | ||||||
| 2014-CR21, 3.987%, 12/10/2047 |
281,514 | 308,350 | ||||||
| 2015-LC21, 3.708%, 07/10/2048 |
100,000 | 110,089 | ||||||
| 2015-CR25, 3.759%, 08/10/2048 |
340,000 | 376,814 | ||||||
| 2017-COR2, 2.111%, 09/10/2050 |
172,468 | 173,619 | ||||||
| Connecticut Avenue Securities Trust |
||||||||
| 2019-R07, 2.397% (1 Month LIBOR USD + 0.770%), 10/25/2039(b)(c) |
210,015 | 210,140 | ||||||
| CSAIL Commercial Mortgage Trust |
||||||||
| 2015-C3, 4.103%, 08/15/2048(d) |
350,000 | 376,609 | ||||||
| 2016-C7, 3.502%, 11/15/2049 |
275,000 | 302,235 | ||||||
| 2019-C15, 4.053%, 03/15/2052 |
215,000 | 250,372 | ||||||
| 2015-C2, 0.757%, 06/15/2057(d)(e) |
1,575,832 | 51,554 | ||||||
| Flagstar Mortgage Trust |
||||||||
| 2017-2, 3.500%, 10/25/2047(b)(d) |
1,149,902 | 1,165,169 | ||||||
| FREMF Mortgage Trust |
||||||||
| 2015-K718, 3.541%, 02/25/2048(b)(d) |
580,000 | 596,399 | ||||||
| GS Mortgage Securities Trust |
||||||||
| 2012-GCJ7, 4.740%, 05/10/2045 |
405,000 | 429,191 | ||||||
| 2012-GCJ9, 3.747%, 11/10/2045(b) |
345,000 | 359,459 | ||||||
| 2014-GC18, 1.013%, 01/10/2047(d)(e) |
3,939,478 | 125,231 | ||||||
| 2014-GC26, 0.967%, 11/10/2047(d)(e) |
2,202,417 | 86,949 | ||||||
| 2015-GC32, 3.764%, 07/10/2048 |
105,000 | 116,191 | ||||||
| 2015-GC34, 3.278%, 10/10/2048 |
131,000 | 137,778 | ||||||
| 2015-GS1, 4.420%, 11/10/2048(d) |
205,000 | 216,938 | ||||||
| 2019-GSA1, 3.048%, 11/10/2052 |
430,000 | 467,288 | ||||||
| Impac Secured Assets Trust |
||||||||
| 2006-2, 2.127% (1 Month LIBOR USD + 0.500%), 08/25/2036(c) |
50,000 | 50,133 | ||||||
| JP Morgan Chase Commercial Mortgage Securities Trust |
||||||||
| 2013-LC11, 3.499%, 04/15/2046 |
375,000 | 389,771 | ||||||
| 2011-C5, 5.418%, 08/15/2046(b)(d) |
305,000 | 319,569 | ||||||
| JP Morgan Mortgage Trust |
||||||||
| 2016-3, 3.500%, 10/25/2046(b)(d) |
804,704 | 832,868 | ||||||
The accompanying notes are an integral part of these financial statements.
25
| PMC CORE FIXED INCOME FUND |
Schedule of Investments |
February 29, 2020 (Unaudited) (Continued)
| Principal Amount |
Value |
|||||||
| 2017-1, 3.500%, 01/25/2047(b)(d) |
$ | 198,731 | $ | 202,376 | ||||
| 2017-2, 3.500%, 05/25/2047(b)(d) |
118,635 | 121,912 | ||||||
| 2017-3, 3.500%, 08/25/2047(b)(d) |
722,994 | 742,718 | ||||||
| 2017-4, 3.500%, 11/25/2048(b)(d) |
654,746 | 669,836 | ||||||
| JP Morgan Trust |
||||||||
| 2015-3, 3.500%, 05/25/2045(b)(d) |
144,417 | 145,809 | ||||||
| JPMBB Commercial Mortgage Securities Trust |
||||||||
| 2015-C31, 3.801%, 08/15/2048 |
320,000 | 354,319 | ||||||
| JPMDB Commercial Mortgage Securities Trust |
||||||||
| 2017-C7, 2.081%, 10/15/2050 |
237,816 | 239,524 | ||||||
| Morgan Stanley Bank of America Merrill Lynch Trust |
||||||||
| 2013-C9, 2.657%, 05/15/2046 |
471,320 | 478,961 | ||||||
| 2015-C24, 3.732%, 05/15/2048 |
220,000 | 242,279 | ||||||
| 2017-C34, 2.109%, 11/18/2052 |
327,740 | 330,027 | ||||||
| Morgan Stanley Capital I Trust |
||||||||
| 2015-MS1, 3.779%, 05/15/2048(d) |
200,000 | 220,262 | ||||||
| New Residential Mortgage Loan Trust |
||||||||
| 2019-NQM5, 2.710%, 11/25/2059(b)(d) |
579,169 | 587,435 | ||||||
| OBX Trust |
||||||||
| 2019-EXP3, 2.527% (1 Month LIBOR USD + 0.900%), 10/25/2059(b)(c) |
369,382 | 370,754 | ||||||
| One Market Plaza Trust |
||||||||
| 2017-1MKT, 4.142%, 02/10/2032(b) |
445,000 | 461,164 | ||||||
| Sequoia Mortgage Trust |
||||||||
| 2015-2, 3.500%, 05/25/2045(b)(d) |
389,385 | 396,085 | ||||||
| 2015-3, 3.500%, 07/25/2045(b)(d) |
473,503 | 480,215 | ||||||
| 2017-2, 3.500%, 02/25/2047(b)(d) |
933,196 | 968,482 | ||||||
| Starwood Mortgage Residential Trust |
||||||||
| 2019-INV1, 2.610%, 09/27/2049(b)(d) |
552,975 | 555,834 | ||||||
| UBS Commercial Mortgage Trust |
||||||||
| 2017-C2, 3.487%, 08/15/2050 |
200,000 | 222,203 | ||||||
| 2017-C4 A1, 2.129%, 10/15/2050 |
135,129 | 135,501 | ||||||
| 2017-C4 A4, 3.563%, 10/15/2050 |
160,500 | 179,485 | ||||||
| 2017-C4, 3.836%, 10/15/2050(d) |
200,000 | 224,453 | ||||||
| 2018-C15, 3.321%, 12/15/2051 |
189,523 | 196,564 | ||||||
| 2018-C14, 3.379%, 12/15/2051 |
716,019 | 740,563 | ||||||
| UBS-Barclays Commercial Mortgage Trust |
||||||||
| 2013-C6, 2.788%, 04/10/2046 |
248,219 | 252,241 | ||||||
| Verus Securitization Trust |
||||||||
| 2019-4, 2.642%, 11/25/2059(b) |
426,022 | 430,739 | ||||||
| 2019-INV1, 3.402%, 12/25/2059(b)(d) |
413,452 | 419,061 | ||||||
| Wells Fargo Commercial Mortgage Trust |
||||||||
| 2012-LC5, 4.142%, 10/15/2045 |
305,000 | 321,420 | ||||||
| 2015-C29, 3.637%, 06/15/2048 |
130,000 | 142,596 | ||||||
| 2016-LC24, 2.942%, 10/15/2049 |
280,000 | 299,756 | ||||||
| 2016-NXS6, 2.918%, 11/15/2049 |
300,000 | 320,692 | ||||||
| 2017-C39, 3.418%, 09/15/2050 |
260,000 | 287,251 | ||||||
| 2017-C40, 2.110%, 10/15/2050 |
150,422 | 151,406 | ||||||
| 2018-C48, 4.302%, 01/15/2052 |
625,000 | 736,894 | ||||||
| 2019-C49, 4.023%, 03/15/2052 |
185,000 | 214,697 | ||||||
| 2016-LC25, 3.640%, 12/15/2059 |
315,000 | 351,342 | ||||||
| WFRBS Commercial Mortgage Trust |
||||||||
| 2014-LC14, 1.208%, 03/15/2047(d)(e) |
883,217 | 33,403 | ||||||
| 2014-C22 XA, 0.808%, 09/15/2057(d)(e) |
3,366,433 | 100,722 | ||||||
| 2014-C22 AS, 4.069%, 09/15/2057(d) |
290,000 | 315,603 | ||||||
| Total Non-Agency Mortgage Backed Securities (Cost $29,331,370) |
29,740,466 | |||||||
The accompanying notes are an integral part of these financial statements.
26
| PMC CORE FIXED INCOME FUND |
Schedule of Investments |
February 29, 2020 (Unaudited) (Continued)
| Principal Amount |
Value |
|||||||
| Agency Mortgage Backed Securities—31.42% | ||||||||
| Fannie Mae Connecticut Avenue Securities |
||||||||
| 2017-C03, 4.627% (1 Month LIBOR USD + 3.000%), 10/25/2029(c) |
$ | 300,000 | $ | 312,044 | ||||
| 2017-C04, 4.477% (1 Month LIBOR USD + 2.850%), 11/25/2029(c) |
364,000 | 376,368 | ||||||
| 2017-C05, 3.827% (1 Month LIBOR USD + 2.200%), 01/25/2030(c) |
461,510 | 469,773 | ||||||
| 2017-C06, 4.427% (1 Month LIBOR USD + 2.800%), 02/25/2030(c) |
307,761 | 314,993 | ||||||
| 2017-C07, 4.127% (1 Month LIBOR USD + 2.500%), 05/25/2030(c) |
952,462 | 964,857 | ||||||
| 2018-C01, 3.877% (1 Month LIBOR USD + 2.250%), 07/25/2030(c) |
780,000 | 790,304 | ||||||
| 2018-C02, 3.827% (1 Month LIBOR USD + 2.200%), 08/25/2030(c) |
599,411 | 605,852 | ||||||
| Fannie Mae or Freddie Mac |
||||||||
| #TBA, 4.500%, 03/01/2040 |
320,000 | 341,656 | ||||||
| #TBA, 3.000%, 03/15/2043 |
400,000 | 412,062 | ||||||
| Fannie Mae Pool |
||||||||
| 254908, 5.000%, 09/01/2023 |
29,764 | 32,175 | ||||||
| 255320, 5.000%, 07/01/2024 |
5,519 | 5,968 | ||||||
| MA0023, 5.000%, 04/01/2029 |
12,103 | 13,092 | ||||||
| MA0096, 4.500%, 06/01/2029 |
7,154 | 7,732 | ||||||
| AE0205, 5.000%, 03/01/2030 |
12,619 | 13,765 | ||||||
| AB3000, 4.500%, 05/01/2031 |
16,507 | 17,990 | ||||||
| BM3905, 5.000%, 08/01/2031 |
81,590 | 88,197 | ||||||
| 720679, 5.000%, 06/01/2033 |
11,855 | 13,245 | ||||||
| 725027, 5.000%, 11/01/2033 |
7,588 | 8,511 | ||||||
| 888283, 5.000%, 08/01/2034 |
35,656 | 39,983 | ||||||
| 735484, 5.000%, 05/01/2035 |
10,651 | 12,005 | ||||||
| 830722, 5.000%, 07/01/2035 |
31,928 | 35,272 | ||||||
| 735925, 5.000%, 10/01/2035 |
30,524 | 34,548 | ||||||
| 836427, 5.000%, 10/01/2035 |
16,460 | 18,606 | ||||||
| 900527, 6.000%, 09/01/2036 |
1,604 | 1,881 | ||||||
| 915320, 6.000%, 03/01/2037 |
22,106 | 24,732 | ||||||
| 889757, 5.000%, 02/01/2038 |
15,767 | 18,060 | ||||||
| 962343, 5.000%, 03/01/2038 |
17,093 | 19,310 | ||||||
| 929301, 5.000%, 04/01/2038 |
12,147 | 13,699 | ||||||
| 257161, 5.500%, 04/01/2038 |
27,358 | 30,949 | ||||||
| 982126, 5.000%, 05/01/2038 |
33,007 | 37,089 | ||||||
| 889579, 6.000%, 05/01/2038 |
19,725 | 23,207 | ||||||
| 995681, 6.000%, 05/01/2038 |
2,934 | 3,439 | ||||||
| 889533, 5.500%, 06/01/2038 |
25,434 | 29,324 | ||||||
| AB0131, 5.000%, 12/01/2038 |
9,853 | 11,170 | ||||||
| 995245, 5.000%, 01/01/2039 |
31,236 | 35,318 | ||||||
| 995906, 5.000%, 03/01/2039 |
11,405 | 12,917 | ||||||
| BC4575, 5.500%, 04/01/2039 |
46,832 | 52,824 | ||||||
| 995838, 5.500%, 05/01/2039 |
77,138 | 88,876 | ||||||
| AL0070, 5.000%, 07/01/2039 |
18,423 | 20,790 | ||||||
| AD7406, 5.000%, 07/01/2040 |
10,534 | 11,678 | ||||||
| AD9173, 4.000%, 08/01/2040 |
313,266 | 340,343 | ||||||
| AB1389, 4.500%, 08/01/2040 |
67,974 | 75,024 | ||||||
| MA0510, 4.500%, 09/01/2040 |
709 | 782 | ||||||
| AE8714, 3.500%, 11/01/2040 |
32,440 | 34,527 | ||||||
| 890310, 4.500%, 12/01/2040 |
14,813 | 16,349 | ||||||
| AH3952, 4.000%, 01/01/2041 |
185,108 | 201,134 | ||||||
| AL0791, 4.000%, 02/01/2041 |
57,707 | 62,743 | ||||||
| AE0954, 4.500%, 02/01/2041 |
50,870 | 56,144 | ||||||
| AH7196, 4.500%, 03/01/2041 |
485,659 | 535,943 | ||||||
| AL0245, 4.000%, 04/01/2041 |
11,682 | 12,701 | ||||||
The accompanying notes are an integral part of these financial statements.
27
| PMC CORE FIXED INCOME FUND |
Schedule of Investments |
February 29, 2020 (Unaudited) (Continued)
| Principal Amount |
Value |
|||||||
| AL0065, 4.500%, 04/01/2041 |
$ | 23,211 | $ | 25,617 | ||||
| AI1170, 5.000%, 04/01/2041 |
186,009 | 209,360 | ||||||
| AB2817, 5.000%, 04/01/2041 |
12,331 | 13,880 | ||||||
| AL0214, 5.000%, 04/01/2041 |
13,046 | 14,684 | ||||||
| AH7395, 4.500%, 06/01/2041 |
9,245 | 10,203 | ||||||
| AB3194, 4.500%, 06/01/2041 |
21,724 | 23,977 | ||||||
| AI4891, 4.500%, 06/01/2041 |
261,365 | 288,430 | ||||||
| AH1662, 4.500%, 07/01/2041 |
28,257 | 30,782 | ||||||
| 890603, 5.000%, 08/01/2041 |
76,917 | 86,981 | ||||||
| FM0040, 3.000%, 10/01/2041 |
297,340 | 310,429 | ||||||
| AJ1959, 4.500%, 10/01/2041 |
586,699 | 647,538 | ||||||
| AL1547, 4.500%, 11/01/2041 |
11,591 | 12,791 | ||||||
| AJ6346, 3.500%, 12/01/2041 |
38,240 | 40,698 | ||||||
| AJ9278, 3.500%, 12/01/2041 |
13,410 | 14,272 | ||||||
| AX5302, 4.000%, 01/01/2042 |
27,784 | 30,172 | ||||||
| AK2415, 4.000%, 02/01/2042 |
48,104 | 52,190 | ||||||
| AK6743, 4.000%, 03/01/2042 |
67,009 | 72,729 | ||||||
| AK6744, 4.000%, 03/01/2042 |
77,927 | 84,526 | ||||||
| AK9393, 3.500%, 04/01/2042 |
27,024 | 28,759 | ||||||
| AK6568, 3.500%, 04/01/2042 |
66,937 | 71,212 | ||||||
| AO1214, 3.500%, 04/01/2042 |
163,084 | 173,508 | ||||||
| AL4029, 4.500%, 04/01/2042 |
67,958 | 74,995 | ||||||
| AL1886, 3.247% (12 Month LIBOR USD + 1.755%), 06/01/2042(c) |
33,898 | 35,202 | ||||||
| AO9553, 4.000%, 07/01/2042 |
228,932 | 247,488 | ||||||
| AL7306, 4.500%, 09/01/2042 |
36,422 | 40,196 | ||||||
| AP8743, 3.500%, 10/01/2042 |
415,632 | 442,255 | ||||||
| AP7363, 4.000%, 10/01/2042 |
267,928 | 290,346 | ||||||
| AQ9330, 3.500%, 01/01/2043 |
52,601 | 55,981 | ||||||
| AL3714, 3.500%, 01/01/2043 |
38,746 | 41,235 | ||||||
| AL2897, 3.500%, 01/01/2043 |
49,733 | 52,935 | ||||||
| AB7965, 3.500%, 02/01/2043 |
28,809 | 30,663 | ||||||
| AB8897, 3.000%, 04/01/2043 |
322,217 | 337,239 | ||||||
| AT1001, 3.500%, 04/01/2043 |
27,195 | 29,439 | ||||||
| AT2021, 3.500%, 04/01/2043 |
29,926 | 31,969 | ||||||
| AB9046, 3.500%, 04/01/2043 |
75,711 | 81,655 | ||||||
| AB9341, 3.000%, 05/01/2043 |
51,101 | 53,894 | ||||||
| AB9260, 3.500%, 05/01/2043 |
88,057 | 93,620 | ||||||
| AR7218, 3.000%, 06/01/2043 |
158,830 | 167,510 | ||||||
| AU1628, 3.000%, 07/01/2043 |
2,560 | 2,679 | ||||||
| AS0203, 3.000%, 08/01/2043 |
126,024 | 132,912 | ||||||
| AS0205, 3.000%, 08/01/2043 |
180,071 | 189,133 | ||||||
| AU0949, 3.500%, 08/01/2043 |
54,888 | 60,047 | ||||||
| AS0212, 3.500%, 08/01/2043 |
67,402 | 72,002 | ||||||
| AU3751, 4.000%, 08/01/2043 |
147,175 | 159,688 | ||||||
| AS0531, 4.000%, 09/01/2043 |
75,293 | 82,127 | ||||||
| AU6857, 4.000%, 09/01/2043 |
66,467 | 72,996 | ||||||
| AU4658, 4.500%, 09/01/2043 |
22,057 | 24,342 | ||||||
| MA1600, 3.500%, 10/01/2043 |
38,643 | 41,091 | ||||||
| AS1042, 4.000%, 11/01/2043 |
67,834 | 73,602 | ||||||
| AS1333, 4.500%, 12/01/2043 |
30,887 | 33,767 | ||||||
| AL4450, 4.500%, 12/01/2043 |
30,556 | 33,568 | ||||||
| AS1559, 4.000%, 01/01/2044 |
39,891 | 43,255 | ||||||
| AS2516, 4.500%, 05/01/2044 |
32,548 | 35,256 | ||||||
| MA1926, 4.500%, 06/01/2044 |
33,710 | 36,819 | ||||||
The accompanying notes are an integral part of these financial statements.
28
| PMC CORE FIXED INCOME FUND |
Schedule of Investments |
February 29, 2020 (Unaudited) (Continued)
| Principal Amount |
Value |
|||||||
| AS2751, 4.500%, 06/01/2044 |
$ | 43,459 | $ | 47,468 | ||||
| BM1761, 4.000%, 08/01/2044 |
250,044 | 270,513 | ||||||
| AL6223, 4.500%, 08/01/2044 |
31,985 | 35,224 | ||||||
| AX0118, 4.000%, 09/01/2044 |
220,394 | 238,046 | ||||||
| AS3467, 4.000%, 10/01/2044 |
42,104 | 45,615 | ||||||
| AX2491, 4.000%, 10/01/2044 |
29,199 | 31,669 | ||||||
| AL6432, 4.000%, 01/01/2045 |
62,174 | 67,360 | ||||||
| AL6520, 4.000%, 02/01/2045 |
242,472 | 262,845 | ||||||
| AL9578, 4.000%, 06/01/2045 |
211,883 | 229,535 | ||||||
| AZ0814, 3.500%, 07/01/2045 |
69,534 | 74,117 | ||||||
| AZ0862, 3.500%, 07/01/2045 |
136,367 | 144,288 | ||||||
| BM1953, 3.500%, 08/01/2045 |
143,351 | 152,534 | ||||||
| AZ4775, 3.500%, 10/01/2045 |
39,553 | 41,850 | ||||||
| AS6311, 3.500%, 12/01/2045 |
57,436 | 60,773 | ||||||
| CA2929, 3.500%, 12/01/2045 |
286,636 | 302,973 | ||||||
| AS6464, 3.500%, 01/01/2046 |
53,368 | 57,003 | ||||||
| BC4114, 3.500%, 02/01/2046 |
354,149 | 374,698 | ||||||
| BC0305, 4.000%, 03/01/2046 |
156,109 | 167,907 | ||||||
| AS6795, 4.000%, 03/01/2046 |
226,442 | 241,210 | ||||||
| BC0793, 3.500%, 04/01/2046 |
348,509 | 369,082 | ||||||
| BC0835, 4.000%, 04/01/2046 |
284,532 | 305,690 | ||||||
| AS7248, 4.000%, 05/01/2046 |
184,653 | 198,279 | ||||||
| AS7200, 4.500%, 05/01/2046 |
46,694 | 50,711 | ||||||
| AS7388, 3.500%, 06/01/2046 |
118,160 | 124,845 | ||||||
| AL8735, 4.000%, 06/01/2046 |
283,590 | 305,851 | ||||||
| AL9282, 4.000%, 06/01/2046 |
243,184 | 261,108 | ||||||
| AS7401, 4.000%, 06/01/2046 |
143,957 | 154,418 | ||||||
| AS7580, 3.000%, 07/01/2046 |
344,702 | 360,408 | ||||||
| BC7146, 3.000%, 07/01/2046 |
413,544 | 432,386 | ||||||
| AS7492, 4.000%, 07/01/2046 |
118,642 | 127,276 | ||||||
| AS7801, 3.500%, 08/01/2046 |
358,892 | 378,753 | ||||||
| BM3932, 3.500%, 10/01/2046 |
281,879 | 297,909 | ||||||
| AS8661, 4.000%, 01/01/2047 |
221,661 | 235,901 | ||||||
| AS8699, 4.000%, 01/01/2047 |
87,201 | 93,169 | ||||||
| AS8659, 4.000%, 01/01/2047 |
160,650 | 171,881 | ||||||
| BE2975, 4.000%, 01/01/2047 |
254,780 | 275,119 | ||||||
| MA2872, 4.500%, 01/01/2047 |
172,492 | 188,242 | ||||||
| AS8700, 4.500%, 01/01/2047 |
83,010 | 90,566 | ||||||
| AL9879, 3.500%, 02/01/2047 |
2,417,973 | 2,597,464 | ||||||
| BE5475, 3.500%, 02/01/2047 |
134,723 | 141,990 | ||||||
| AL9916, 4.000%, 02/01/2047 |
307,278 | 329,611 | ||||||
| AS8966, 4.000%, 03/01/2047 |
128,096 | 136,342 | ||||||
| BD7081, 4.000%, 03/01/2047 |
576,979 | 616,388 | ||||||
| AS8982, 4.500%, 03/01/2047 |
35,997 | 38,881 | ||||||
| FM1000, 3.000%, 04/01/2047 |
113,369 | 118,430 | ||||||
| MA2959, 3.500%, 04/01/2047 |
289,257 | 305,219 | ||||||
| BD7165, 4.000%, 04/01/2047 |
1,857,866 | 1,983,995 | ||||||
| BM5347, 3.500%, 05/01/2047 |
284,568 | 300,251 | ||||||
| BM5348, 3.500%, 05/01/2047 |
155,645 | 164,097 | ||||||
| BM5784, 3.500%, 05/01/2047 |
336,601 | 355,262 | ||||||
| AS9536, 3.500%, 05/01/2047 |
193,652 | 204,013 | ||||||
| CA0180, 3.500%, 05/01/2047 |
166,963 | 175,688 | ||||||
| BE3619, 4.000%, 05/01/2047 |
412,227 | 440,148 | ||||||
| MA3008, 4.500%, 05/01/2047 |
58,160 | 63,278 | ||||||
The accompanying notes are an integral part of these financial statements.
29
| PMC CORE FIXED INCOME FUND |
Schedule of Investments |
February 29, 2020 (Unaudited) (Continued)
| Principal Amount |
Value |
|||||||
| AS9829, 3.500%, 06/01/2047 |
$ | 177,101 | $ | 186,593 | ||||
| AS9664, 4.000%, 06/01/2047 |
130,628 | 139,466 | ||||||
| MA3027, 4.000%, 06/01/2047 |
1,450,598 | 1,546,582 | ||||||
| AS9831, 4.000%, 06/01/2047 |
302,296 | 321,842 | ||||||
| BE3702, 4.000%, 06/01/2047 |
213,201 | 227,672 | ||||||
| BE3767, 3.500%, 07/01/2047 |
195,688 | 206,212 | ||||||
| MA3057, 3.500%, 07/01/2047 |
502,478 | 528,994 | ||||||
| CA0062, 4.000%, 07/01/2047 |
274,501 | 292,921 | ||||||
| CA0182, 4.000%, 08/01/2047 |
65,768 | 69,903 | ||||||
| CA0237, 4.000%, 08/01/2047 |
366,885 | 391,046 | ||||||
| MA3088, 4.000%, 08/01/2047 |
262,455 | 279,756 | ||||||
| MA3121, 4.000%, 09/01/2047 |
435,740 | 464,911 | ||||||
| MA3149, 4.000%, 10/01/2047 |
163,863 | 174,875 | ||||||
| BH9392, 3.500%, 11/01/2047 |
2,152,159 | 2,259,933 | ||||||
| FM1467, 3.000%, 12/01/2047 |
186,711 | 196,400 | ||||||
| BJ1662, 3.500%, 12/01/2047 |
98,789 | 103,745 | ||||||
| MA3210, 3.500%, 12/01/2047 |
460,437 | 485,100 | ||||||
| BH7058, 3.500%, 12/01/2047 |
445,302 | 469,455 | ||||||
| BM2005, 4.000%, 12/01/2047 |
3,070,398 | 3,269,816 | ||||||
| BM3392, 4.000%, 01/01/2048 |
455,342 | 484,995 | ||||||
| CA4140, 3.000%, 02/01/2048 |
373,813 | 386,644 | ||||||
| CA1535, 3.500%, 02/01/2048 |
100,034 | 105,378 | ||||||
| BJ8783, 3.500%, 02/01/2048 |
263,680 | 277,286 | ||||||
| CA1218, 4.500%, 02/01/2048 |
154,789 | 167,165 | ||||||
| BJ0648, 3.500%, 03/01/2048 |
189,572 | 199,592 | ||||||
| BJ0650, 3.500%, 03/01/2048 |
193,590 | 204,235 | ||||||
| BM3590, 3.500%, 03/01/2048 |
290,541 | 309,662 | ||||||
| BM3900, 4.000%, 04/01/2048 |
240,778 | 256,528 | ||||||
| CA1710, 4.500%, 05/01/2048 |
255,341 | 274,204 | ||||||
| MA3384, 4.000%, 06/01/2048 |
288,646 | 306,449 | ||||||
| MA3415, 4.000%, 07/01/2048 |
434,849 | 460,292 | ||||||
| CA2204, 4.500%, 08/01/2048 |
1,641,755 | 1,762,025 | ||||||
| FM1572, 3.000%, 09/01/2048 |
545,259 | 570,739 | ||||||
| MA3466, 3.500%, 09/01/2048 |
329,309 | 343,495 | ||||||
| BK7608, 4.000%, 09/01/2048 |
187,603 | 198,072 | ||||||
| BM2007, 4.000%, 09/01/2048 |
378,092 | 400,824 | ||||||
| BM4991, 4.000%, 09/01/2048 |
235,205 | 248,106 | ||||||
| CA2491, 4.500%, 10/01/2048 |
2,795,975 | 2,995,619 | ||||||
| BM4835, 3.500%, 11/01/2048 |
3,233,684 | 3,366,709 | ||||||
| FM1239, 3.500%, 11/01/2048 |
332,006 | 348,191 | ||||||
| BN1628, 4.500%, 11/01/2048 |
1,678,877 | 1,793,601 | ||||||
| MA3522, 4.500%, 11/01/2048 |
1,611,624 | 1,725,566 | ||||||
| FM2239, 3.000%, 12/01/2048 |
321,799 | 335,801 | ||||||
| BM5793, 3.000%, 04/01/2049 |
402,867 | 415,361 | ||||||
| MA3638, 4.000%, 04/01/2049 |
374,105 | 394,360 | ||||||
| MA3686, 3.500%, 06/01/2049 |
247,622 | 257,133 | ||||||
| FM1299, 3.000%, 07/01/2049 |
391,867 | 404,052 | ||||||
| MA3692, 3.500%, 07/01/2049 |
404,936 | 420,524 | ||||||
| MA3693, 4.000%, 07/01/2049 |
340,040 | 358,214 | ||||||
| MA3744, 3.000%, 08/01/2049 |
516,592 | 532,612 | ||||||
| BN7703, 3.000%, 08/01/2049 |
262,975 | 271,254 | ||||||
| MA3745, 3.500%, 08/01/2049 |
886,077 | 920,224 | ||||||
| MA3774, 3.000%, 09/01/2049 |
722,342 | 744,742 | ||||||
| BO2201, 3.000%, 09/01/2049 |
585,559 | 603,718 | ||||||
The accompanying notes are an integral part of these financial statements.
30
| PMC CORE FIXED INCOME FUND |
Schedule of Investments |
February 29, 2020 (Unaudited) (Continued)
| Principal Amount |
Value |
|||||||
| MA3775, 3.500%, 09/01/2049 |
$ | 763,388 | $ | 792,947 | ||||
| BO2200, 3.500%, 09/01/2049 |
251,331 | 261,608 | ||||||
| BN8330, 3.500%, 09/01/2049 |
392,072 | 407,903 | ||||||
| MA3802, 3.000%, 10/01/2049 |
674,502 | 695,419 | ||||||
| MA3803, 3.500%, 10/01/2049 |
636,047 | 661,453 | ||||||
| MA3834, 3.000%, 11/01/2049 |
974,590 | 1,004,813 | ||||||
| MA3835, 3.500%, 11/01/2049 |
478,668 | 497,810 | ||||||
| MA3871, 3.000%, 12/01/2049 |
1,063,410 | 1,096,486 | ||||||
| MA3872, 3.500%, 12/01/2049 |
419,247 | 436,586 | ||||||
| BO8947, 3.000%, 01/01/2050 |
299,504 | 310,072 | ||||||
| MA3905, 3.000%, 01/01/2050 |
2,855,920 | 2,946,194 | ||||||
| BO6164, 3.000%, 01/01/2050 |
274,005 | 282,712 | ||||||
| Fannie Mae REMICS |
||||||||
| 2012-70, 4.373% (1 Month LIBOR USD + 6.000%), 07/25/2042(c)(e) |
1,012,694 | 216,149 | ||||||
| 2012-68, 4.423% (1 Month LIBOR USD + 6.050%), 07/25/2042(c)(e) |
904,826 | 204,271 | ||||||
| 2012-130, 5.073% (1 Month LIBOR USD + 6.700%), 12/25/2042(c)(e) |
897,685 | 206,080 | ||||||
| 2012-149, 4.000%, 01/25/2043(e) |
840,395 | 134,134 | ||||||
| 2013-6 SB, 4.473% (1 Month LIBOR USD + 6.100%), 02/25/2043(c)(e) |
791,519 | 157,774 | ||||||
| 2014-90, 4.523% (1 Month LIBOR USD + 6.150%), 01/25/2045(c)(e) |
955,485 | 181,429 | ||||||
| 2016-03, 4.000%, 02/25/2046(e) |
1,101,308 | 171,287 | ||||||
| Freddie Mac Gold Pool |
||||||||
| G1-3122, 5.000%, 04/01/2023 |
470 | 497 | ||||||
| D9-6037, 5.000%, 05/01/2023 |
24,743 | 26,758 | ||||||
| C9-0918, 5.000%, 09/01/2025 |
141,610 | 153,185 | ||||||
| D9-7472, 5.500%, 12/01/2027 |
2,444 | 2,662 | ||||||
| G1-4953, 3.500%, 01/01/2029 |
38,274 | 40,242 | ||||||
| C9-1267, 5.000%, 09/01/2029 |
28,265 | 30,811 | ||||||
| G0-1772, 5.000%, 02/01/2035 |
2,222 | 2,498 | ||||||
| G0-1883, 5.000%, 08/01/2035 |
1,746 | 1,975 | ||||||
| A6-8761, 5.500%, 09/01/2037 |
2,387 | 2,598 | ||||||
| G0-3535, 5.500%, 10/01/2037 |
845 | 974 | ||||||
| G0-3812, 5.500%, 02/01/2038 |
1,155 | 1,331 | ||||||
| G0-4449, 5.500%, 07/01/2038 |
4,437 | 5,099 | ||||||
| G0-4471, 5.500%, 07/01/2038 |
3,074 | 3,541 | ||||||
| A8-1743, 5.500%, 09/01/2038 |
1,746 | 1,899 | ||||||
| A8-2657, 5.500%, 10/01/2038 |
5,702 | 6,219 | ||||||
| A8-2134, 6.000%, 10/01/2038 |
2,088 | 2,423 | ||||||
| G0-5205, 5.000%, 01/01/2039 |
15,125 | 17,113 | ||||||
| A8-6521, 4.500%, 05/01/2039 |
51,636 | 56,905 | ||||||
| A8-6315, 4.500%, 05/01/2039 |
30,570 | 33,717 | ||||||
| A9-3617, 4.500%, 08/01/2040 |
7,645 | 8,426 | ||||||
| A9-3485, 5.000%, 08/01/2040 |
79,162 | 89,095 | ||||||
| C0-3531, 4.000%, 10/01/2040 |
25,612 | 27,806 | ||||||
| A9-6592, 4.000%, 02/01/2041 |
109,808 | 119,237 | ||||||
| Q0-0285, 4.500%, 04/01/2041 |
8,707 | 9,599 | ||||||
| Q0-0876, 4.500%, 05/01/2041 |
61,923 | 68,311 | ||||||
| Q0-0950, 5.000%, 05/01/2041 |
8,912 | 9,876 | ||||||
| Q0-2173, 4.500%, 07/01/2041 |
41,978 | 46,303 | ||||||
| Q0-3705, 4.000%, 10/01/2041 |
18,438 | 19,435 | ||||||
| Q0-4674, 4.000%, 12/01/2041 |
157,357 | 170,786 | ||||||
| C0-3795, 3.500%, 04/01/2042 |
270,382 | 288,379 | ||||||
| Q0-7726, 4.000%, 04/01/2042 |
342,919 | 372,658 | ||||||
| Q0-9004, 3.500%, 06/01/2042 |
28,854 | 30,721 | ||||||
| C0-9004, 3.500%, 07/01/2042 |
32,559 | 34,708 | ||||||
The accompanying notes are an integral part of these financial statements.
31
| PMC CORE FIXED INCOME FUND |
Schedule of Investments |
February 29, 2020 (Unaudited) (Continued)
| Principal Amount |
Value |
|||||||
| Q0-9896, 3.500%, 08/01/2042 |
$ | 40,892 | $ | 43,545 | ||||
| Q1-1348, 3.500%, 09/01/2042 |
61,443 | 65,430 | ||||||
| Q1-4869, 3.000%, 01/01/2043 |
84,375 | 89,235 | ||||||
| Q1-8305, 3.500%, 05/01/2043 |
29,895 | 31,834 | ||||||
| Q1-9475, 3.500%, 06/01/2043 |
61,578 | 65,584 | ||||||
| G6-0030, 3.500%, 07/01/2043 |
143,966 | 153,389 | ||||||
| Q2-0857, 3.500%, 08/01/2043 |
30,035 | 32,691 | ||||||
| Q2-0780, 3.500%, 08/01/2043 |
44,189 | 47,856 | ||||||
| G0-8541, 3.500%, 08/01/2043 |
62,456 | 66,443 | ||||||
| G0-7459, 3.500%, 08/01/2043 |
32,259 | 34,351 | ||||||
| V8-0509, 4.000%, 10/01/2043 |
37,243 | 40,372 | ||||||
| G6-0174, 4.000%, 10/01/2043 |
81,044 | 88,053 | ||||||
| G0-8558, 4.000%, 11/01/2043 |
47,682 | 51,687 | ||||||
| Q2-6367, 4.000%, 05/01/2044 |
10,358 | 11,243 | ||||||
| Q2-5885, 4.500%, 05/01/2044 |
47,834 | 51,655 | ||||||
| Q2-6513, 4.500%, 06/01/2044 |
19,155 | 20,497 | ||||||
| Q2-9916, 4.000%, 11/01/2044 |
63,900 | 69,112 | ||||||
| Q4-5219, 3.500%, 01/01/2045 |
234,030 | 247,600 | ||||||
| G0-7961, 3.500%, 03/01/2045 |
49,563 | 52,957 | ||||||
| G0-8633, 4.000%, 03/01/2045 |
95,068 | 103,038 | ||||||
| G0-8636, 3.500%, 04/01/2045 |
73,096 | 77,377 | ||||||
| G0-8637, 4.000%, 04/01/2045 |
58,008 | 62,799 | ||||||
| Q3-3869, 4.000%, 06/01/2045 |
25,726 | 27,870 | ||||||
| Q3-5225, 3.500%, 08/01/2045 |
41,615 | 44,047 | ||||||
| G0-8659, 3.500%, 08/01/2045 |
201,586 | 213,324 | ||||||
| V8-1873, 4.000%, 08/01/2045 |
50,077 | 54,054 | ||||||
| G0-8660, 4.000%, 08/01/2045 |
214,145 | 231,134 | ||||||
| G0-8672, 4.000%, 10/01/2045 |
40,694 | 43,877 | ||||||
| V8-1992, 4.000%, 10/01/2045 |
223,319 | 240,831 | ||||||
| G0-8676, 3.500%, 11/01/2045 |
90,507 | 95,844 | ||||||
| G6-0480, 4.500%, 11/01/2045 |
29,053 | 31,813 | ||||||
| G0-8681, 3.500%, 12/01/2045 |
65,821 | 69,706 | ||||||
| G0-8682, 4.000%, 12/01/2045 |
72,309 | 77,876 | ||||||
| Q3-8473, 4.000%, 01/01/2046 |
75,165 | 80,907 | ||||||
| Q3-8470, 4.000%, 01/01/2046 |
45,086 | 48,281 | ||||||
| G0-8694, 4.000%, 02/01/2046 |
44,448 | 47,825 | ||||||
| Q3-9644, 3.500%, 03/01/2046 |
364,088 | 385,325 | ||||||
| Q3-9434, 3.500%, 03/01/2046 |
14,403 | 15,259 | ||||||
| G0-8693, 3.500%, 03/01/2046 |
15,690 | 16,605 | ||||||
| G0-8699, 4.000%, 03/01/2046 |
118,311 | 127,213 | ||||||
| Q3-9438, 4.000%, 03/01/2046 |
228,755 | 246,100 | ||||||
| G0-8702, 3.500%, 04/01/2046 |
161,788 | 171,121 | ||||||
| Q4-0375, 3.500%, 05/01/2046 |
102,783 | 108,713 | ||||||
| G0-8706, 3.500%, 05/01/2046 |
75,019 | 79,323 | ||||||
| Q4-0718, 3.500%, 05/01/2046 |
438,821 | 463,549 | ||||||
| G0-8708, 4.500%, 05/01/2046 |
88,682 | 96,868 | ||||||
| Q4-1208, 3.500%, 06/01/2046 |
204,145 | 216,299 | ||||||
| Q4-5458, 4.000%, 08/01/2046 |
167,970 | 180,733 | ||||||
| G0-8735, 4.500%, 10/01/2046 |
116,635 | 126,429 | ||||||
| G0-8743, 4.000%, 01/01/2047 |
102,050 | 109,170 | ||||||
| Q4-6279, 3.500%, 02/01/2047 |
221,612 | 233,996 | ||||||
| Q4-6283, 4.000%, 02/01/2047 |
194,770 | 207,261 | ||||||
| G0-8752, 4.000%, 03/01/2047 |
67,498 | 72,058 | ||||||
| Q4-6539, 4.500%, 03/01/2047 |
34,623 | 37,436 | ||||||
The accompanying notes are an integral part of these financial statements.
32
| PMC CORE FIXED INCOME FUND |
Schedule of Investments |
February 29, 2020 (Unaudited) (Continued)
| Principal Amount |
Value |
|||||||
| G0-8757, 3.500%, 04/01/2047 |
$ | 34,100 | $ | 35,953 | ||||
| G0-8758, 4.000%, 04/01/2047 |
529,879 | 564,719 | ||||||
| G0-8759, 4.500%, 04/01/2047 |
53,068 | 57,452 | ||||||
| G0-8762, 4.000%, 05/01/2047 |
427,120 | 455,157 | ||||||
| V8-3204, 4.500%, 05/01/2047 |
111,739 | 121,752 | ||||||
| G0-8767, 4.000%, 06/01/2047 |
352,593 | 376,180 | ||||||
| Q4-9100, 4.000%, 07/01/2047 |
354,066 | 377,993 | ||||||
| Q4-9394, 4.500%, 07/01/2047 |
225,410 | 243,659 | ||||||
| Q4-9888, 3.500%, 08/01/2047 |
173,172 | 182,434 | ||||||
| Q5-0109, 3.500%, 08/01/2047 |
50,547 | 53,292 | ||||||
| G0-8774, 3.500%, 08/01/2047 |
219,152 | 231,056 | ||||||
| Q5-0035, 3.500%, 08/01/2047 |
237,248 | 250,094 | ||||||
| G0-8775, 4.000%, 08/01/2047 |
462,438 | 493,827 | ||||||
| G6-1228, 4.000%, 08/01/2047 |
364,443 | 390,396 | ||||||
| G0-8779, 3.500%, 09/01/2047 |
752,645 | 793,935 | ||||||
| G0-8785, 4.000%, 10/01/2047 |
355,380 | 379,988 | ||||||
| G6-1631, 3.500%, 11/01/2047 |
413,268 | 436,480 | ||||||
| Q5-2319, 3.500%, 11/01/2047 |
59,513 | 62,874 | ||||||
| G6-1467, 4.000%, 11/01/2047 |
543,585 | 577,715 | ||||||
| G0-8789, 4.000%, 11/01/2047 |
149,803 | 160,072 | ||||||
| G6-1281, 3.500%, 01/01/2048 |
237,384 | 251,634 | ||||||
| Q5-4463, 4.000%, 02/01/2048 |
193,779 | 206,798 | ||||||
| G0-8801, 4.000%, 02/01/2048 |
222,067 | 236,514 | ||||||
| G6-7710, 3.500%, 03/01/2048 |
381,788 | 406,965 | ||||||
| G0-8805, 4.000%, 03/01/2048 |
265,831 | 283,825 | ||||||
| G0-8814, 4.000%, 05/01/2048 |
136,107 | 144,687 | ||||||
| G6-1578, 4.500%, 08/01/2048 |
2,577,588 | 2,757,691 | ||||||
| G6-1606, 4.500%, 09/01/2048 |
1,754,832 | 1,891,264 | ||||||
| Q5-9893, 4.000%, 11/01/2048 |
1,382,694 | 1,464,576 | ||||||
| G0-8853, 4.500%, 12/01/2048 |
1,570,722 | 1,677,863 | ||||||
| Q6-1925, 4.000%, 03/01/2049 |
105,888 | 112,016 | ||||||
| G0-8887, 3.000%, 06/01/2049 |
1,795,321 | 1,851,813 | ||||||
| Freddie Mac Multifamily Structured Pass Through Certificates |
||||||||
| K-076, 3.900%, 04/25/2028 |
210,000 | 244,912 | ||||||
| K-077, 3.850%, 05/25/2028(d) |
265,000 | 308,459 | ||||||
| K-078, 3.854%, 06/25/2028 |
1,190,000 | 1,386,175 | ||||||
| K-083, 4.050%, 09/25/2028(d) |
2,650,000 | 3,143,453 | ||||||
| K-084, 3.780%, 10/25/2028(d) |
580,000 | 676,019 | ||||||
| K-087, 3.771%, 12/25/2028 |
420,000 | 490,104 | ||||||
| K-098, 1.516%, 08/25/2029(d)(e) |
1,985,000 | 243,682 | ||||||
| Freddie Mac Pool |
||||||||
| ZT-1955, 3.000%, 05/01/2049 |
267,950 | 276,353 | ||||||
| ZA-7141, 3.000%, 06/01/2049 |
350,157 | 361,016 | ||||||
| ZT-2090, 3.000%, 06/01/2049 |
464,307 | 478,706 | ||||||
| QA-0192, 3.500%, 06/01/2049 |
611,852 | 638,439 | ||||||
| SD-8004, 3.000%, 08/01/2049 |
470,284 | 484,868 | ||||||
| QA-1790, 3.000%, 08/01/2049 |
177,428 | 183,036 | ||||||
| RA-1313, 3.000%, 08/01/2049 |
209,127 | 215,738 | ||||||
| SD-8010, 3.000%, 09/01/2049 |
289,224 | 298,193 | ||||||
| SD-8016, 3.000%, 10/01/2049 |
341,832 | 352,433 | ||||||
| SD-8024, 3.000%, 11/01/2049 |
157,347 | 162,226 | ||||||
| SD-8030, 3.000%, 12/01/2049 |
835,249 | 861,151 | ||||||
| SD-8044, 3.000%, 02/01/2050 |
299,046 | 308,552 | ||||||
The accompanying notes are an integral part of these financial statements.
33
| PMC CORE FIXED INCOME FUND |
Schedule of Investments |
February 29, 2020 (Unaudited) (Continued)
| Principal Amount |
Value |
|||||||
| QA-7325, 3.000%, 02/01/2050 |
$ | 425,000 | $ | 440,513 | ||||
| SD-8045, 3.500%, 02/01/2050 |
4,480,002 | 4,677,660 | ||||||
| Freddie Mac REMICS |
||||||||
| 4073, 4.342% (1 Month LIBOR USD + 6.000%), 07/15/2042(c)(e) |
993,831 | 205,733 | ||||||
| 4122, 4.000%, 10/15/2042(e) |
1,045,900 | 161,568 | ||||||
| 4121, 4.542% (1 Month LIBOR USD + 6.200%), 10/15/2042(c)(e) |
974,496 | 213,843 | ||||||
| 4159, 4.492% (1 Month LIBOR USD + 6.150%), 01/15/2043(c)(e) |
511,058 | 121,105 | ||||||
| 4459, 4.000%, 08/15/2043(e) |
940,353 | 138,000 | ||||||
| 4573, 3.500%, 04/15/2046(e) |
1,113,692 | 169,038 | ||||||
| 4583, 4.342% (1 Month LIBOR USD + 6.000%), 05/15/2046(c)(e) |
1,075,944 | 191,815 | ||||||
| 4623, 4.342% (1 Month LIBOR USD + 6.000%), 10/15/2046(c)(e) |
824,805 | 194,950 | ||||||
| 4648, 4.342% (1 Month LIBOR USD + 6.000%), 01/15/2047(c)(e) |
915,516 | 180,437 | ||||||
| Freddie Mac Structured Agency Credit Risk Debt Notes |
||||||||
| 2017-DNA2, 5.077% (1 Month LIBOR USD + 3.450%), 10/25/2029(c) |
930,000 | 991,587 | ||||||
| 2017-HQA2, 4.277% (1 Month LIBOR USD + 2.650%), 12/25/2029(c) |
500,000 | 513,734 | ||||||
| 2017-DNA3, 4.127% (1 Month LIBOR USD + 2.500%), 03/25/2030(c) |
285,000 | 294,433 | ||||||
| 2017-HQA3, 3.977% (1 Month LIBOR USD + 2.350%), 04/25/2030(c) |
1,166,572 | 1,189,019 | ||||||
| 2018-DNA1, 3.427% (1 Month LIBOR USD + 1.800%), 07/25/2030(c) |
570,000 | 572,866 | ||||||
| 2018-HQA1, 3.927% (1 Month LIBOR USD + 2.300%), 09/25/2030(c) |
970,000 | 980,080 | ||||||
| Ginnie Mae |
||||||||
| #TBA, 3.000%, 03/15/2043 |
875,000 | 904,292 | ||||||
| Ginnie Mae II Pool |
||||||||
| MA0699M, 3.500%, 01/20/2043 |
53,249 | 56,455 | ||||||
| MA0783M, 3.500%, 02/20/2043 |
73,654 | 77,998 | ||||||
| 784689C, 3.500%, 04/20/2043 |
2,662,735 | 2,813,793 | ||||||
| MA0934M, 3.500%, 04/20/2043 |
53,451 | 56,833 | ||||||
| MA1376M, 4.000%, 10/20/2043 |
78,011 | 83,699 | ||||||
| MA1861M, 3.875% (1 Year CMT Rate + 1.500%), 04/20/2044(c) |
123,464 | 127,605 | ||||||
| MA2893M, 4.000%, 06/20/2045 |
37,572 | 40,310 | ||||||
| MA3035M, 4.000%, 08/20/2045 |
21,716 | 23,325 | ||||||
| MA3245M, 4.000%, 11/20/2045 |
93,750 | 100,572 | ||||||
| MA3663M, 3.500%, 05/20/2046 |
132,163 | 138,840 | ||||||
| MA3803M, 3.500%, 07/20/2046 |
53,012 | 55,847 | ||||||
| MA4510M, 3.500%, 06/20/2047 |
249,318 | 260,109 | ||||||
| MA4511M, 4.000%, 06/20/2047 |
109,394 | 116,096 | ||||||
| MA4586M, 3.500%, 07/20/2047 |
343,559 | 360,335 | ||||||
| MA4652M, 3.500%, 08/20/2047 |
230,439 | 241,758 | ||||||
| MA4778M, 3.500%, 10/20/2047 |
49,416 | 51,758 | ||||||
| MA4900M, 3.500%, 12/20/2047 |
178,918 | 187,417 | ||||||
| MA4962M, 3.500%, 01/20/2048 |
218,589 | 228,139 | ||||||
| MA5263M, 3.500%, 06/20/2048 |
60,622 | 63,254 | ||||||
| MA5529M, 4.500%, 10/20/2048 |
1,380,887 | 1,463,086 | ||||||
| MA5530M, 5.000%, 10/20/2048 |
1,309,594 | 1,396,451 | ||||||
| MA5986M, 4.000%, 06/20/2049 |
744,541 | 775,796 | ||||||
| MA6039M, 3.500%, 07/20/2049 |
352,793 | 365,848 | ||||||
| MA6283M, 3.000%, 11/20/2049 |
372,228 | 385,157 | ||||||
| MA6338M, 3.000%, 12/20/2049 |
149,329 | 154,465 | ||||||
| Government National Mortgage Association |
||||||||
| 2013-23, 3.500%, 02/20/2043(e) |
1,176,068 | 196,270 | ||||||
| 2016-91, 4.433% (1 Month LIBOR USD + 6.080%), 07/20/2046(c)(e) |
861,025 | 196,141 | ||||||
| 2012-147, 2.600%, 04/16/2054(d) |
88,170 | 91,523 | ||||||
| Total Agency Mortgage Backed Securities (Cost $126,441,789) |
130,791,719 | |||||||
The accompanying notes are an integral part of these financial statements.
34
| PMC CORE FIXED INCOME FUND |
Schedule of Investments |
February 29, 2020 (Unaudited) (Continued)
| Principal Amount |
Value |
|||||||
| Municipal Bonds—0.96% | ||||||||
| American Municipal Power, Inc. |
||||||||
| 8.084%, 02/15/2050 |
$ | 20,000 | $ | 38,581 | ||||
| California Health Facilities Financing Authority |
||||||||
| 2.584%, 06/01/2029 |
210,000 | 225,383 | ||||||
| 2.704%, 06/01/2030 |
320,000 | 344,166 | ||||||
| 2.864%, 06/01/2031 |
425,000 | 458,720 | ||||||
| California State University |
||||||||
| 2.965%, 11/01/2039 |
360,000 | 379,325 | ||||||
| 3.065%, 11/01/2042 |
315,000 | 330,262 | ||||||
| Metropolitan Transit Authority of Harris County Sales & Use Tax Revenue |
||||||||
| 2.329%, 11/01/2031 |
195,000 | 207,037 | ||||||
| 2.399%, 11/01/2032 |
855,000 | 912,413 | ||||||
| 2.429%, 11/01/2033 |
540,000 | 576,520 | ||||||
| New Jersey Economic Development Authority |
||||||||
| 7.425%, 02/15/2029 |
225,000 | 293,960 | ||||||
| Philadelphia Authority for Industrial Development |
||||||||
| 3.964%, 04/15/2026 |
195,000 | 212,878 | ||||||
| Total Municipal Bonds (Cost $3,717,139) |
3,979,245 | |||||||
| U.S. Government Agency Issues—0.12% | ||||||||
| Tennessee Valley Authority |
||||||||
| 5.250%, 09/15/2039 |
320,000 | 480,845 | ||||||
| Total U.S. Government Agency Issues (Cost $395,244) |
480,845 | |||||||
| U.S. Government Notes/Bonds—15.25% | ||||||||
| United States Treasury Inflation Indexed Bonds |
||||||||
| 0.750%, 07/15/2028 |
3,771,831 | 4,125,630 | ||||||
| 2.125%, 02/15/2040 |
2,056,849 | 2,929,313 | ||||||
| 1.375%, 02/15/2044 |
1,279,028 | 1,672,345 | ||||||
| United States Treasury Notes/Bonds |
||||||||
| 2.250%, 04/15/2022(f) |
10,075,000 | 10,361,508 | ||||||
| 1.500%, 10/31/2024(f) |
510,000 | 523,597 | ||||||
| 1.750%, 12/31/2024 |
960,000 | 997,706 | ||||||
| 1.375%, 01/31/2025(f) |
640,000 | 654,137 | ||||||
| 2.875%, 05/31/2025(f) |
5,110,000 | 5,614,014 | ||||||
| 2.375%, 04/30/2026 |
1,440,000 | 1,558,041 | ||||||
| 1.750%, 11/15/2029(f) |
630,000 | 665,782 | ||||||
| 1.500%, 02/15/2030 |
226,000 | 233,928 | ||||||
| 4.500%, 02/15/2036(f) |
2,563,000 | 3,731,818 | ||||||
| 4.375%, 11/15/2039 |
143,000 | 214,031 | ||||||
| 2.875%, 05/15/2043 |
1,074,600 | 1,331,538 | ||||||
| 3.750%, 11/15/2043 |
395,000 | 559,241 | ||||||
| 3.125%, 08/15/2044 |
61,700 | 79,820 | ||||||
| 2.500%, 02/15/2045 |
18,000 | 21,011 | ||||||
| 3.000%, 05/15/2045(f) |
4,930,000 | 6,272,944 | ||||||
| 2.500%, 02/15/2046 |
513,300 | 601,323 | ||||||
| 2.500%, 05/15/2046(f) |
3,575,000 | 4,194,201 | ||||||
| 2.250%, 08/15/2046 |
464,200 | 520,403 | ||||||
| 3.000%, 05/15/2047 |
440,000 | 567,617 | ||||||
| 2.750%, 08/15/2047 |
210,000 | 259,617 | ||||||
| 2.750%, 11/15/2047(f) |
3,308,900 | 4,096,767 | ||||||
| 3.000%, 02/15/2048 |
565,000 | 732,503 | ||||||
| 3.125%, 05/15/2048 |
665,600 | 883,896 | ||||||
The accompanying notes are an integral part of these financial statements.
35
| PMC CORE FIXED INCOME FUND |
Schedule of Investments |
February 29, 2020 (Unaudited) (Continued)
| Principal Amount |
Value |
|||||||
| 2.250%, 08/15/2049(f) |
$ | 3,214,000 | $ | 3,650,275 | ||||
| 2.375%, 11/15/2049(f) |
5,511,000 | 6,428,172 | ||||||
| Total U.S. Government Notes/Bonds (Cost $56,900,241) |
63,481,178 | |||||||
| Shares |
||||||||
| Exchange-Traded Funds—0.92% | ||||||||
| SPDR Bloomberg Barclays Short Term High Yield Bond ETF(f) |
144,707 | 3,830,394 | ||||||
| Total Exchange-Traded Funds (Cost $3,960,138) |
3,830,394 | |||||||
| Investments Purchased With Collateral From Securities Lending—15.08% | ||||||||
| Money Market Fund—15.08% |
||||||||
| Mount Vernon Liquid Assets Portfolio, LLC, 1.760%(g) |
62,786,009 | 62,786,009 | ||||||
| Total Investments Purchased With Collateral From Securities Lending (Cost $62,786,009) |
62,786,009 | |||||||
| Short-Term Investments—0.50% | ||||||||
| First American Government Obligations Fund, Class X, 1.493%(g) |
2,059,721 | 2,059,721 | ||||||
| Total Short-Term Investments (Cost $2,059,721) |
2,059,721 | |||||||
| Total Investments (Cost $458,325,621)—114.83% | 477,944,797 | |||||||
| Liabilities in Excess of Other Assets—(14.83)% |
(61,711,896 | ) | ||||||
| Total Net Assets—100.00% | $ | 416,232,901 | ||||||
Percentages are stated as a percent of net assets.
| (a) | Variable rate security; the rate shown represents the rate at February 29, 2020. |
| (b) | Securities issued under Rule 144A under the Securities Act of 1933. Such securities are deemed to be liquid. |
| (c) | Floating rate security; the rate shown represents the rate at February 29, 2020. The coupon is based on an underlying pool of loans. |
| (d) | Variable rate security; the rate shown represents the rate at February 29, 2020. The coupon is based on an underlying pool of loans. |
| (e) | Represents an interest-only security that entitles holders to receive only interest payments on underlying mortgages. |
| (f) | All or portion of this security is out on loan as of February 29, 2020. Total value of securities out on loan is $62,198,507. |
| (g) | The rate shown represents the seven day yield at February 29, 2020. |
| (h) | Perpetual maturity. The date referenced is the next call date. |
| Abbreviations | ||
| #TBA | Pool number to be announced |
The accompanying notes are an integral part of these financial statements.
36
| PMC CORE FIXED INCOME FUND |
Schedule of Open Futures Contracts |
February 29, 2020 (Unaudited)
| Number of Contracts |
Expiration Month |
Notional Amount |
Value/Unrealized Appreciation (Depreciation) |
|||||||||||||
| Futures Contracts Purchased | ||||||||||||||||
| 10 Year U.S. Treasury Note |
43 | June 2020 | $ | 4,638,877 | $ | 86,830 | ||||||||||
| 5 Year U.S. Treasury Note |
179 | June 2020 | 18,173,248 | 254,582 | ||||||||||||
| U.S. Treasury Long Bond |
14 | June 2020 | 2,025,975 | 47,372 | ||||||||||||
| Total Futures Contracts Purchased | $ | 388,784 | ||||||||||||||
| Futures Contracts Sold | ||||||||||||||||
| CME Ultra Long Term U.S. Treasury Bond |
(48 | ) | June 2020 | (6,098,508 | ) | $ | (299,337 | ) | ||||||||
| Total Futures Contracts Sold | $ | (299,337 | ) | |||||||||||||
The accompanying notes are an integral part of these financial statements.
37
| PMC DIVERSIFIED EQUITY FUND |
Schedule of Investments |
February 29, 2020 (Unaudited)
| Shares |
Value |
|||||||
| COMMON STOCKS—93.96% | ||||||||
| Accommodation—0.31% |
||||||||
| GreenTree Hospitality Group Ltd.—ADR |
3,629 | $ | 41,770 | |||||
| Hilton Worldwide Holdings, Inc. |
2,835 | 275,562 | ||||||
| Hyatt Hotels Corp.—Class A |
4,425 | 338,955 | ||||||
| Marcus Corp. |
708 | 18,918 | ||||||
| Melco Resorts & Entertainment Ltd.—ADR |
10,738 | 186,197 | ||||||
| MGM Resorts International |
12,963 | 318,371 | ||||||
| Sands China Ltd.—ADR |
9,970 | 468,789 | ||||||
| Vail Resorts, Inc. |
288 | 61,232 | ||||||
| Whitbread PLC—ADR(c) |
33,082 | 417,826 | ||||||
| Wynn Macau Ltd.—ADR |
19,146 | 387,515 | ||||||
| 2,515,135 | ||||||||
| Administration of Economic Programs—0.01% |
||||||||
| Centrais Electricas Brasileiras SA—ADR |
7,529 | 58,199 | ||||||
| Administration of Human Resource Programs—0.03% |
||||||||
| Hailiang Education Group, Inc.—ADR(a) |
3,738 | 217,888 | ||||||
| Administrative and Support Services—1.77% |
||||||||
| ABM Industries, Inc.(c) |
6,358 | 209,305 | ||||||
| AMN Healthcare Services, Inc.(a) |
3,034 | 223,302 | ||||||
| Automatic Data Processing, Inc. |
2,192 | 339,190 | ||||||
| BG Staffing, Inc. |
3,725 | 57,440 | ||||||
| Bilibili, Inc.—ADR(a)(c) |
9,294 | 238,670 | ||||||
| Booking Holdings, Inc.(a) |
138 | 234,001 | ||||||
| Cardtronics PLC—Class A(a)(b) |
2,780 | 100,831 | ||||||
| Cass Information Systems, Inc.(c) |
4,547 | 213,482 | ||||||
| CorVel Corp.(a) |
2,174 | 149,876 | ||||||
| Criteo SA—ADR(a) |
8,460 | 107,188 | ||||||
| Deutsche Post AG—ADR |
5,783 | 173,143 | ||||||
| DHI Group, Inc.(a) |
16,144 | 36,808 | ||||||
| Donnelley Financial Solutions, Inc.(a) |
3,160 | 27,492 | ||||||
| Essity AB—ADR |
44,729 | 1,448,996 | ||||||
| Everi Holdings, Inc.(a) |
8,384 | 87,194 | ||||||
| FleetCor Technologies, Inc.(a) |
1,881 | 499,951 | ||||||
| Grupo Aeroportuario del Pacifico SAB de CV—ADR |
703 | 76,191 | ||||||
| Heidrick & Struggles International, Inc. |
2,640 | 58,872 | ||||||
| HMS Holdings Corp.(a) |
7,754 | 178,109 | ||||||
| I3 Verticals, Inc.—Class A(a)(c) |
2,043 | 59,206 | ||||||
| IHS Markit Ltd.(b) |
6,635 | 472,676 | ||||||
| InterActiveCorp(a) |
2,420 | 493,535 | ||||||
| Kelly Services, Inc.—Class A |
10,719 | 178,043 | ||||||
| Kforce, Inc. |
8,370 | 254,950 | ||||||
| ManpowerGroup, Inc. |
3,059 | 232,300 | ||||||
| ManTech International Corp.—Class A |
4,272 | 319,973 | ||||||
| MasterCard, Inc.—Class A |
11,530 | 3,346,583 | ||||||
| Moody’s Corp. |
240 | 57,607 | ||||||
| Orange SA—ADR |
27,044 | 361,849 | ||||||
| QIWI PLC—ADR |
7,849 | 136,887 | ||||||
| Rakuten, Inc.—ADR(c) |
71,302 | 587,528 | ||||||
| Randstad NV—ADR |
5,824 | 148,104 | ||||||
| Robert Half International, Inc.(c) |
1,856 | 93,561 | ||||||
| Scotts Miracle-Gro Co. |
2,404 | 254,800 | ||||||
| Secom Co. Ltd.—ADR |
40,158 | 777,057 | ||||||
The accompanying notes are an integral part of these financial statements.
38
| PMC DIVERSIFIED EQUITY FUND |
Schedule of Investments |
February 29, 2020 (Unaudited) (Continued)
| Shares |
Value |
|||||||
| Teladoc Health, Inc.(a)(c) |
5,177 | $ | 646,918 | |||||
| Teleperformance—ADR(c) |
3,257 | 392,729 | ||||||
| TransUnion |
3,153 | 280,365 | ||||||
| Trip.com Group Ltd.—ADR(a) |
2,082 | 63,210 | ||||||
| TrueBlue, Inc.(a) |
11,247 | 167,355 | ||||||
| TTEC Holdings, Inc. |
3,450 | 129,134 | ||||||
| Tuniu Corp.—ADR(a) |
13,839 | 22,142 | ||||||
| Vectrus, Inc.(a) |
2,407 | 125,381 | ||||||
| Waddell & Reed Financial, Inc.—Class A(c) |
17,622 | 242,479 | ||||||
| WNS Holdings Ltd.—ADR(a) |
578 | 38,056 | ||||||
| 14,342,469 | ||||||||
| Air Transportation—0.49% |
||||||||
| Air China Ltd.—ADR |
438 | 7,052 | ||||||
| Air France-KLM—ADR(a) |
19,447 | 146,728 | ||||||
| Alaska Air Group, Inc. |
5,097 | 257,195 | ||||||
| American Airlines Group, Inc.(c) |
9,409 | 179,241 | ||||||
| ANA Holdings, Inc.—ADR |
62,540 | 318,329 | ||||||
| Cathay Pacific Airways Ltd.—ADR |
42,168 | 265,658 | ||||||
| China Southern Airlines Co. Ltd.—ADR |
245 | 6,561 | ||||||
| Controladora Vuela Cia de Aviacion SAB de CV—ADR(a) |
2,125 | 21,356 | ||||||
| Delta Air Lines, Inc. |
20,944 | 966,147 | ||||||
| Japan Airlines Co. Ltd.—ADR |
39,902 | 486,006 | ||||||
| JetBlue Airways Corp.(a)(c) |
12,172 | 192,074 | ||||||
| Mesa Air Group, Inc.(a) |
6,592 | 38,036 | ||||||
| SkyWest, Inc. |
8,087 | 367,150 | ||||||
| Spirit Airlines, Inc.(a)(c) |
5,086 | 144,697 | ||||||
| United Airlines Holdings, Inc.(a) |
8,914 | 549,013 | ||||||
| 3,945,243 | ||||||||
| Ambulatory Health Care Services—0.55% |
||||||||
| Addus HomeCare Corp.(a) |
2,186 | 166,726 | ||||||
| Amedisys, Inc.(a) |
2,144 | 373,077 | ||||||
| Apollo Medical Holdings, Inc.(a) |
1,592 | 27,812 | ||||||
| CareDx, Inc.(a)(c) |
3,708 | 86,433 | ||||||
| Chemed Corp. |
358 | 149,508 | ||||||
| DaVita, Inc.(a) |
5,770 | 447,868 | ||||||
| HealthStream, Inc.(a) |
3,059 | 74,395 | ||||||
| Joint Corp.(a)(c) |
2,720 | 40,338 | ||||||
| Kura Oncology, Inc.(a) |
5,187 | 62,607 | ||||||
| Laboratory Corp. of America Holdings(a) |
3,362 | 590,670 | ||||||
| LHC Group, Inc.(a)(c) |
2,795 | 339,481 | ||||||
| Medpace Holdings, Inc.(a) |
3,830 | 344,470 | ||||||
| Novocure Ltd.(a)(b)(c) |
4,414 | 321,119 | ||||||
| OrthoPediatrics Corp.(a)(c) |
2,006 | 93,119 | ||||||
| Pennant Group, Inc.(a) |
2,234 | 60,698 | ||||||
| Quest Diagnostics, Inc. |
5,012 | 531,573 | ||||||
| RadNet, Inc.(a) |
4,075 | 83,252 | ||||||
| Select Medical Holdings Corp.(a) |
3,322 | 79,529 | ||||||
| Sonic Healthcare Ltd.—ADR(c) |
29,791 | 545,770 | ||||||
| US Physical Therapy, Inc. |
403 | 42,000 | ||||||
| 4,460,445 | ||||||||
| Amusement, Gambling, and Recreation Industries—0.04% |
||||||||
| Las Vegas Sands Corp. |
2,876 | 167,700 | ||||||
The accompanying notes are an integral part of these financial statements.
39
| PMC DIVERSIFIED EQUITY FUND |
Schedule of Investments |
February 29, 2020 (Unaudited) (Continued)
| Shares |
Value |
|||||||
| SeaWorld Entertainment, Inc.(a)(c) |
5,928 | $ | 161,301 | |||||
| WW International, Inc.(a) |
790 | 23,700 | ||||||
| 352,701 | ||||||||
| Animal Production and Aquaculture—0.01% |
||||||||
| Cal-Maine Foods, Inc.(a) |
581 | 20,271 | ||||||
| JBS SA—ADR |
9,847 | 98,569 | ||||||
| 118,840 | ||||||||
| Apparel Manufacturing—0.26% |
||||||||
| Burberry Group PLC—ADR |
9,449 | 205,232 | ||||||
| Columbia Sportswear Co.(c) |
3,319 | 269,835 | ||||||
| G-III Apparel Group Ltd.(a) |
1,762 | 39,398 | ||||||
| Hanesbrands, Inc.(c) |
7,597 | 100,584 | ||||||
| Lululemon Athletica, Inc.(a) |
4,003 | 870,292 | ||||||
| Oxford Industries, Inc. |
615 | 37,140 | ||||||
| PVH Corp. |
3,547 | 262,868 | ||||||
| Ralph Lauren Corp. |
2,313 | 244,045 | ||||||
| Under Armour, Inc.—Class C(a) |
6,222 | 77,651 | ||||||
| 2,107,045 | ||||||||
| Beverage and Tobacco Product Manufacturing—1.65% |
||||||||
| Boston Beer Co., Inc.—Class A(a) |
166 | 61,551 | ||||||
| Brown-Forman Corp.—Class B |
2,833 | 173,975 | ||||||
| C&C Group PLC—ADR |
32,331 | 428,709 | ||||||
| Carlsberg A/S—ADR |
54,449 | 1,440,176 | ||||||
| Cia Cervecerias Unidas SA—ADR |
22,690 | 361,679 | ||||||
| Coca-Cola Bottlers Japan Holdings, Inc.—ADR |
53,939 | 604,656 | ||||||
| Coca-Cola Co. |
14,494 | 775,284 | ||||||
| Coca-Cola Consolidated, Inc. |
265 | 52,041 | ||||||
| Coca-Cola Femsa SAB de CV—ADR |
5,106 | 283,536 | ||||||
| Diageo PLC—ADR(c) |
12,486 | 1,771,888 | ||||||
| Embotelladora Andina SA—Class A—ADR(c) |
2,259 | 27,453 | ||||||
| Embotelladora Andina SA—Class B—ADR |
11,883 | 166,956 | ||||||
| Fomento Economico Mexicano SAB de CV—ADR |
1,251 | 101,819 | ||||||
| Heineken Holding NV—ADR |
3,445 | 150,951 | ||||||
| Japan Tobacco, Inc.—ADR |
147,332 | 1,449,747 | ||||||
| Kirin Holdings Co. Ltd.—ADR |
43,031 | 818,880 | ||||||
| Molson Coors Brewing Co.—Class B(c) |
7,362 | 365,229 | ||||||
| PepsiCo, Inc. |
20,475 | 2,703,315 | ||||||
| Philip Morris International, Inc. |
12,670 | 1,037,293 | ||||||
| Swedish Match AB—ADR(c) |
16,418 | 477,764 | ||||||
| Tsingtao Brewery Co. Ltd.—ADR |
1,631 | 41,786 | ||||||
| Turning Point Brands, Inc.(c) |
1,936 | 50,626 | ||||||
| 13,345,314 | ||||||||
| Broadcasting (except Internet)—1.77% |
||||||||
| Altice USA, Inc.—Class A(a) |
25,950 | 671,067 | ||||||
| AMC Networks, Inc.—Class A(a)(c) |
8,810 | 273,110 | ||||||
| Cable One, Inc. |
744 | 1,170,327 | ||||||
| Central European Media Enterprises Ltd.—Class A(a)(b) |
16,108 | 71,358 | ||||||
| Comcast Corp.—Class A |
90,964 | 3,677,674 | ||||||
| Discovery, Inc.—Class A(a)(c) |
47,869 | 1,230,233 | ||||||
| Discovery, Inc.—Class C(a) |
56,442 | 1,416,694 | ||||||
| DISH Network Corp.—Class A(a) |
24,401 | 817,922 | ||||||
The accompanying notes are an integral part of these financial statements.
40
| PMC DIVERSIFIED EQUITY FUND |
Schedule of Investments |
February 29, 2020 (Unaudited) (Continued)
| Shares |
Value |
|||||||
| EW Scripps Co.—Class A(c) |
8,219 | $ | 97,806 | |||||
| Gray Television, Inc.(a)(c) |
7,896 | 149,392 | ||||||
| Ideanomics, Inc.(a) |
15,839 | 5,710 | ||||||
| Liberty Broadband Corp.—Class A(a) |
736 | 91,028 | ||||||
| Liberty Broadband Corp.—Class C(a) |
1,893 | 238,310 | ||||||
| Liberty Media Corp-Liberty Braves(a) |
2,569 | 66,743 | ||||||
| Liberty Media Corp-Liberty SiriusXM(a) |
6,075 | 271,067 | ||||||
| MSG Networks, Inc.—Class A(a)(c) |
10,249 | 129,547 | ||||||
| Nexstar Media Group, Inc.—Class A |
8,837 | 1,016,079 | ||||||
| Qurate Retail, Inc.—Class A(a) |
31,850 | 217,217 | ||||||
| Roku, Inc.(a)(c) |
3,549 | 403,415 | ||||||
| Sinclair Broadcast Group, Inc.—Class A |
17,214 | 399,537 | ||||||
| Walt Disney Co. |
15,379 | 1,809,339 | ||||||
| WideOpenWest, Inc.(a)(c) |
18,220 | 114,604 | ||||||
| 14,338,179 | ||||||||
| Building Material and Garden Equipment and Supplies Dealers—0.40% |
||||||||
| BMC Stock Holdings, Inc.(a) |
20,840 | 511,205 | ||||||
| Home Depot, Inc. |
12,434 | 2,708,623 | ||||||
| 3,219,828 | ||||||||
| Chemical Manufacturing—8.01% |
||||||||
| Abbott Laboratories |
17,276 | 1,330,770 | ||||||
| AbbVie, Inc. |
3,891 | 333,498 | ||||||
| Abcam PLC—ADR |
883 | 13,068 | ||||||
| Acorda Therapeutics, Inc.(a) |
8,557 | 12,322 | ||||||
| Air Liquide SA—ADR |
21,528 | 585,661 | ||||||
| Air Products & Chemicals, Inc. |
4,488 | 985,610 | ||||||
| Alexion Pharmaceuticals, Inc.(a) |
9,755 | 917,263 | ||||||
| Allergan PLC(b) |
9,749 | 1,858,841 | ||||||
| Alnylam Pharmaceuticals, Inc.(a) |
1,279 | 150,487 | ||||||
| AMAG Pharmaceuticals, Inc.(a)(c) |
2,235 | 17,321 | ||||||
| Amgen, Inc. |
9,043 | 1,806,157 | ||||||
| Amphastar Pharmaceuticals, Inc.(a)(c) |
5,511 | 84,814 | ||||||
| ANI Pharmaceuticals, Inc.(a) |
1,715 | 82,337 | ||||||
| Antares Pharma, Inc.(a) |
30,739 | 95,291 | ||||||
| Aratana Therapeutics, Inc.(a) |
18,388 | 4,597 | ||||||
| Arena Pharmaceuticals, Inc.(a)(c) |
5,285 | 235,711 | ||||||
| Arkema SA—ADR |
2,558 | 240,733 | ||||||
| Astellas Pharma, Inc.—ADR |
55,147 | 852,573 | ||||||
| AstraZeneca PLC—ADR |
39,126 | 1,713,719 | ||||||
| Bayer AG—ADR |
34,981 | 630,358 | ||||||
| BioDelivery Sciences International, Inc.(a) |
12,580 | 61,139 | ||||||
| Biogen, Inc.(a) |
3,689 | 1,137,651 | ||||||
| BioSpecifics Technologies Corp.(a) |
2,343 | 129,310 | ||||||
| Bristol-Myers Squibb Co. |
23,663 | 1,397,537 | ||||||
| Cabot Microelectronics Corp. |
796 | 110,867 | ||||||
| Catalent, Inc.(a) |
5,638 | 290,526 | ||||||
| Catalyst Pharmaceuticals, Inc.(a) |
9,132 | 38,446 | ||||||
| Celanese Corp. |
1,720 | 161,233 | ||||||
| CF Industries Holdings, Inc. |
3,170 | 116,846 | ||||||
| Chemours Co.(c) |
8,096 | 120,306 | ||||||
| Church & Dwight Co., Inc. |
2,245 | 156,072 | ||||||
| Clinuvel Pharmaceuticals Ltd.—ADR |
18,455 | 192,301 | ||||||
| Corcept Therapeutics, Inc.(a)(c) |
8,952 | 112,974 | ||||||
The accompanying notes are an integral part of these financial statements.
41
| PMC DIVERSIFIED EQUITY FUND |
Schedule of Investments |
February 29, 2020 (Unaudited) (Continued)
| Shares |
Value |
|||||||
| Coty, Inc.—Class A |
7,965 | $ | 73,517 | |||||
| Covestro AG—ADR |
12,377 | 237,391 | ||||||
| CSL Ltd.—ADR(c) |
12,153 | 1,206,793 | ||||||
| D&L Industries, Inc.—ADR(c) |
14,473 | 49,541 | ||||||
| Daiichi Sankyo Co. Ltd.—ADR |
22,178 | 1,314,712 | ||||||
| Denali Therapeutics, Inc.(a)(c) |
6,351 | 125,559 | ||||||
| Dr Reddy’s Laboratories Ltd.—ADR |
4,966 | 199,435 | ||||||
| Eagle Pharmaceuticals, Inc.(a) |
534 | 24,511 | ||||||
| Eisai Co. Ltd.—ADR |
7,574 | 551,766 | ||||||
| Eli Lilly & Co. |
7,715 | 973,093 | ||||||
| Enanta Pharmaceuticals, Inc.(a) |
1,715 | 87,259 | ||||||
| Endo International PLC(a)(b) |
19,084 | 105,344 | ||||||
| Esperion Therapeutics, Inc.(a)(c) |
1,420 | 71,696 | ||||||
| Estee Lauder Cos., Inc.—Class A |
1,374 | 252,266 | ||||||
| Fate Therapeutics, Inc.(a) |
3,880 | 113,296 | ||||||
| FMC Corp. |
6,607 | 615,111 | ||||||
| Galectin Therapeutics, Inc.(a)(c) |
7,847 | 16,636 | ||||||
| Genetic Technologies Ltd.—ADR(a) |
2,167 | 6,111 | ||||||
| GlaxoSmithKline PLC—ADR(c) |
63,308 | 2,565,872 | ||||||
| Global Blood Therapeutics, Inc.(a)(c) |
3,174 | 203,009 | ||||||
| GW Pharmaceuticals PLC—ADR(a)(c) |
2,105 | 215,363 | ||||||
| H Lundbeck A/S—ADR |
4,784 | 164,187 | ||||||
| Huntsman Corp. |
5,298 | 100,344 | ||||||
| Hypera SA—ADR |
10,211 | 77,093 | ||||||
| Immutep Ltd.—ADR(a)(c) |
56,365 | 126,258 | ||||||
| Incyte Corp. Ltd.(a) |
3,611 | 272,306 | ||||||
| Innospec, Inc. |
1,622 | 140,368 | ||||||
| Innoviva, Inc.(a)(c) |
17,143 | 230,916 | ||||||
| Inter Parfums, Inc. |
1,779 | 106,847 | ||||||
| Intercept Pharmaceuticals, Inc.(a)(c) |
398 | 36,592 | ||||||
| Ionis Pharmaceuticals, Inc.(a) |
6,246 | 317,172 | ||||||
| Jazz Pharmaceuticals PLC(a)(b) |
6,764 | 775,019 | ||||||
| Johnson & Johnson |
21,648 | 2,911,222 | ||||||
| KalVista Pharmaceuticals, Inc.(a) |
3,163 | 42,542 | ||||||
| Kao Corp.—ADR(c) |
107,406 | 1,544,498 | ||||||
| Kimberly-Clark Corp. |
8,062 | 1,057,654 | ||||||
| Koninklijke DSM NV—ADR |
15,200 | 425,904 | ||||||
| Kose Corp.—ADR(c) |
24,931 | 588,471 | ||||||
| Kraton Corp.(a) |
3,078 | 31,149 | ||||||
| Kronos Worldwide, Inc. |
4,040 | 40,360 | ||||||
| Krystal Biotech, Inc.(a) |
990 | 52,916 | ||||||
| Kuraray Co. Ltd.—ADR |
13,430 | 411,361 | ||||||
| Lantheus Holdings, Inc.(a) |
5,210 | 81,016 | ||||||
| Lexicon Pharmaceuticals, Inc.(a) |
18,914 | 52,486 | ||||||
| Lifevantage Corp.(a) |
5,668 | 67,506 | ||||||
| Linde PLC(b) |
1,787 | 341,335 | ||||||
| Lonza Group AG—ADR |
10,635 | 422,210 | ||||||
| Madrigal Pharmaceuticals, Inc.(a)(c) |
556 | 47,911 | ||||||
| Magenta Therapeutics, Inc.(a) |
2,539 | 29,859 | ||||||
| Mallinckrodt PLC(a)(b)(c) |
5,474 | 23,429 | ||||||
| Merck & Co., Inc. |
33,940 | 2,598,445 | ||||||
| Merck KGaA—ADR |
23,005 | 557,871 | ||||||
| Minerva Neurosciences, Inc.(a) |
3,602 | 26,223 | ||||||
| Mitsubishi Tanabe Pharma Corp.—ADR |
20,812 | 363,586 | ||||||
The accompanying notes are an integral part of these financial statements.
42
| PMC DIVERSIFIED EQUITY FUND |
Schedule of Investments |
February 29, 2020 (Unaudited) (Continued)
| Shares |
Value |
|||||||
| Mylan NV(a)(b) |
8,862 | $ | 152,338 | |||||
| Nektar Therapeutics(a)(c) |
5,867 | 122,092 | ||||||
| Novartis AG—ADR(c) |
71,886 | 6,035,548 | ||||||
| Novo Nordisk A/S—ADR |
30,945 | 1,798,833 | ||||||
| Novozymes A/S—ADR(c) |
7,232 | 366,807 | ||||||
| Olin Corp.(c) |
6,267 | 101,463 | ||||||
| Ono Pharmaceutical Co. Ltd.—ADR |
60,623 | 391,018 | ||||||
| Otsuka Holdings Co. Ltd.—ADR |
22,752 | 417,499 | ||||||
| Pacira BioSciences, Inc.(a) |
1,941 | 84,201 | ||||||
| PDL BioPharma, Inc.(a) |
37,914 | 128,908 | ||||||
| Perrigo Co. PLC(b) |
3,194 | 161,904 | ||||||
| PetIQ, Inc.(a)(c) |
2,971 | 92,398 | ||||||
| Pfizer, Inc. |
75,403 | 2,519,967 | ||||||
| PPG Industries, Inc. |
286 | 29,873 | ||||||
| Prestige Consumer Healthcare, Inc.(a) |
2,404 | 89,813 | ||||||
| PTC Therapeutics, Inc.(a) |
4,213 | 231,041 | ||||||
| Quidel Corp.(a) |
3,241 | 250,335 | ||||||
| Ra Pharmaceuticals, Inc.(a) |
2,819 | 131,816 | ||||||
| Redhill Biopharma Ltd.—ADR(a)(c) |
5,433 | 22,438 | ||||||
| Regeneron Pharmaceuticals, Inc.(a) |
750 | 333,428 | ||||||
| REGENXBIO, Inc.(a) |
1,635 | 65,400 | ||||||
| Repligen Corp.(a) |
5,402 | 462,411 | ||||||
| Rogers Corp.(a) |
823 | 95,468 | ||||||
| Sanofi—ADR |
35,254 | 1,630,498 | ||||||
| Santen Pharmaceutical Co. Ltd.—ADR(c) |
36,994 | 586,355 | ||||||
| Sarepta Therapeutics, Inc.(a)(c) |
871 | 99,703 | ||||||
| Seattle Genetics, Inc.(a) |
2,104 | 239,561 | ||||||
| Shin-Etsu Chemical Co. Ltd.—ADR |
66,478 | 1,824,155 | ||||||
| Shionogi & Co Ltd.—ADR |
43,796 | 582,487 | ||||||
| Shiseido Co. Ltd.—ADR(c) |
22,216 | 1,321,408 | ||||||
| SIGA Technologies, Inc.(a)(c) |
4,887 | 24,411 | ||||||
| Starpharma Holdings Ltd.—ADR(a) |
4,304 | 28,665 | ||||||
| Stepan Co. |
1,778 | 156,162 | ||||||
| Sumitomo Chemical Co. Ltd.—ADR |
21,727 | 380,005 | ||||||
| Sysmex Corp.—ADR |
6,365 | 199,097 | ||||||
| Takeda Pharmaceutical Co. Ltd.—ADR |
33,847 | 585,553 | ||||||
| Teijin Ltd.—ADR(c) |
34,021 | 549,269 | ||||||
| Teva Pharmaceutical Industries Ltd.—ADR(a) |
21,636 | 249,463 | ||||||
| THERAPIX BIOSCIENCES Ltd.—ADR(a) |
5,684 | 2,843 | ||||||
| Toray Industries, Inc.—ADR |
47,065 | 534,188 | ||||||
| Trex Co., Inc.(a)(c) |
359 | 34,338 | ||||||
| Trinity Biotech PLC—ADR(a) |
97,114 | 138,873 | ||||||
| UCB SA—ADR(c) |
2,184 | 100,573 | ||||||
| Vanda Pharmaceuticals, Inc.(a) |
8,396 | 92,608 | ||||||
| Veracyte, Inc.(a) |
4,293 | 105,994 | ||||||
| Vericel Corp.(a)(c) |
4,194 | 64,755 | ||||||
| Vertex Pharmaceuticals, Inc.(a) |
851 | 190,650 | ||||||
| West Pharmaceutical Services, Inc. |
1,609 | 242,251 | ||||||
| Xencor, Inc.(a)(c) |
4,364 | 141,786 | ||||||
| Yara International ASA—ADR(c) |
3,387 | 61,847 | ||||||
| Zoetis, Inc. |
12,382 | 1,649,654 | ||||||
| 64,951,827 | ||||||||
| Clothing and Clothing Accessories Stores—1.29% |
||||||||
| Abercrombie & Fitch Co.—Class A(c) |
5,488 | 72,057 | ||||||
The accompanying notes are an integral part of these financial statements.
43
| PMC DIVERSIFIED EQUITY FUND |
Schedule of Investments |
February 29, 2020 (Unaudited) (Continued)
| Shares |
Value |
|||||||
| ASOS PLC—ADR(a) |
474 | $ | 18,126 | |||||
| Carter’s, Inc. |
936 | 85,616 | ||||||
| Charter Communications, Inc.—Class A(a) |
1,303 | 642,601 | ||||||
| Citi Trends, Inc. |
7,416 | 146,614 | ||||||
| Fast Retailing Co. Ltd.—ADR |
23,824 | 1,180,956 | ||||||
| Foot Locker, Inc.(c) |
7,502 | 271,948 | ||||||
| Gap, Inc.(c) |
19,057 | 273,087 | ||||||
| Genesco, Inc.(a)(c) |
2,820 | 97,036 | ||||||
| Hennes & Mauritz AB—ADR |
251,360 | 892,328 | ||||||
| J. Jill, Inc.(c) |
35,811 | 30,439 | ||||||
| Kering SA—ADR |
11,662 | 657,737 | ||||||
| L Brands, Inc.(c) |
9,224 | 199,792 | ||||||
| LVMH Moet Hennessy Louis Vuitton SE—ADR |
25,445 | 2,104,809 | ||||||
| Mr Price Group Ltd.—ADR |
20,336 | 200,849 | ||||||
| Nordstrom, Inc.(c) |
8,807 | 305,603 | ||||||
| Pandora A/S—ADR |
40,525 | 453,880 | ||||||
| Ross Stores, Inc. |
6,667 | 725,236 | ||||||
| Shoe Carnival, Inc.(c) |
4,209 | 125,891 | ||||||
| Tiffany & Co. |
1,366 | 182,484 | ||||||
| Tilly’s, Inc.—Class A |
8,495 | 55,218 | ||||||
| TJX Cos., Inc. |
20,318 | 1,215,015 | ||||||
| Urban Outfitters, Inc.(a)(c) |
15,658 | 368,120 | ||||||
| Zumiez, Inc.(a) |
5,506 | 146,074 | ||||||
| 10,451,516 | ||||||||
| Computer and Electronic Product Manufacturing—9.53% |
||||||||
| AAC Technologies Holdings, Inc.—ADR(c) |
5,443 | 35,575 | ||||||
| Advanced Micro Devices, Inc.(a) |
13,504 | 614,162 | ||||||
| Agilent Technologies, Inc. |
6,064 | 467,352 | ||||||
| Alphabet, Inc.—Class A(a) |
1,059 | 1,418,266 | ||||||
| Alphabet, Inc.—Class C(a) |
1,895 | 2,538,030 | ||||||
| AMETEK, Inc. |
220 | 18,920 | ||||||
| Amphenol Corp.—Class A |
1,029 | 94,339 | ||||||
| Analog Devices, Inc. |
3,334 | 363,573 | ||||||
| Apple, Inc. |
42,536 | 11,627,641 | ||||||
| Arista Networks, Inc.(a) |
971 | 187,520 | ||||||
| ASE Technology Holding Co Ltd.—ADR |
29,892 | 137,503 | ||||||
| ASM Pacific Technology Ltd.—ADR(c) |
5,023 | 179,622 | ||||||
| AU Optronics Corp.—ADR |
2,777 | 8,525 | ||||||
| AVX Corp. |
28,994 | 630,330 | ||||||
| Benchmark Electronics, Inc. |
8,071 | 219,370 | ||||||
| Bio-Rad Laboratories, Inc.—Class A(a) |
558 | 196,427 | ||||||
| Bruker Corp.(c) |
14,070 | 612,889 | ||||||
| Casio Computer Co. Ltd.—ADR |
1,688 | 278,944 | ||||||
| ChipMOS Technologies, Inc.—ADR |
12,298 | 236,245 | ||||||
| Ciena Corp.(a) |
9,559 | 367,544 | ||||||
| Cirrus Logic, Inc.(a) |
5,979 | 410,399 | ||||||
| Cisco Systems, Inc. |
84,532 | 3,375,362 | ||||||
| Consolidated-Tomoka Land Co. |
1,583 | 91,038 | ||||||
| CTS Corp. |
8,697 | 226,731 | ||||||
| Cypress Semiconductor Corp. |
27,462 | 634,098 | ||||||
| Danaher Corp. |
9,445 | 1,365,558 | ||||||
| Daqo New Energy Corp.—ADR(a) |
869 | 56,980 | ||||||
| Dell Technologies, Inc.—Class C(a) |
605 | 24,478 | ||||||
The accompanying notes are an integral part of these financial statements.
44
| PMC DIVERSIFIED EQUITY FUND |
Schedule of Investments |
February 29, 2020 (Unaudited) (Continued)
| Shares |
Value |
|||||||
| Digi International, Inc.(a) |
3,954 | $ | 52,351 | |||||
| Diodes, Inc.(a) |
12,729 | 560,203 | ||||||
| Dolby Laboratories, Inc.—Class A |
8,222 | 540,185 | ||||||
| Eaton Corp. PLC(b) |
19,051 | 1,728,307 | ||||||
| Ecolab, Inc. |
3,617 | 652,688 | ||||||
| Enphase Energy, Inc.(a)(c) |
3,366 | 164,833 | ||||||
| ESCO Technologies, Inc. |
2,008 | 182,567 | ||||||
| FLIR Systems, Inc. |
909 | 38,605 | ||||||
| FormFactor, Inc.(a) |
17,742 | 396,889 | ||||||
| Fortinet, Inc.(a) |
468 | 47,764 | ||||||
| Fossil Group, Inc.(a)(c) |
9,956 | 45,698 | ||||||
| Hitachi Ltd.—ADR |
21,204 | 1,391,618 | ||||||
| Hoya Corp.—ADR |
16,056 | 1,406,666 | ||||||
| HP, Inc. |
24,902 | 517,713 | ||||||
| Ichor Holdings Ltd.(a)(b) |
2,626 | 75,944 | ||||||
| IDEXX Laboratories, Inc.(a) |
1,572 | 400,090 | ||||||
| Ingenico Group SA—ADR |
20,590 | 579,609 | ||||||
| Intel Corp.(c) |
66,491 | 3,691,579 | ||||||
| Jabil, Inc. |
19,462 | 623,757 | ||||||
| JinkoSolar Holding Co. Ltd.—ADR(a)(c) |
6,867 | 156,842 | ||||||
| Johnson Controls International PLC(b) |
40,107 | 1,466,713 | ||||||
| Juniper Networks, Inc.(c) |
24,357 | 516,856 | ||||||
| KEMET Corp. |
5,794 | 151,108 | ||||||
| Keysight Technologies, Inc.(a) |
8,531 | 808,398 | ||||||
| Kyocera Corp.—ADR(c) |
19,732 | 1,217,464 | ||||||
| L3Harris Technologies, Inc. |
1,194 | 236,090 | ||||||
| Lam Research Corp. |
5,702 | 1,673,138 | ||||||
| Lattice Semiconductor Corp.(a) |
3,446 | 61,856 | ||||||
| LG Display Co. Ltd.—ADR(c) |
6,001 | 34,806 | ||||||
| Logitech International SA(b)(c) |
995 | 38,765 | ||||||
| Lumentum Holdings, Inc.(a) |
1,620 | 126,068 | ||||||
| Masimo Corp.(a) |
1,508 | 246,302 | ||||||
| Maxim Integrated Products, Inc. |
1,965 | 109,293 | ||||||
| Medtronic PLC(b) |
30,976 | 3,118,353 | ||||||
| Methode Electronics, Inc. |
2,904 | 89,037 | ||||||
| Microchip Technology, Inc. |
2,115 | 191,852 | ||||||
| Micron Technology, Inc.(a) |
32,029 | 1,683,444 | ||||||
| MKS Instruments, Inc. |
838 | 83,959 | ||||||
| MongoDB, Inc.(a)(c) |
2,158 | 329,095 | ||||||
| Moog, Inc.—Class A |
2,251 | 173,597 | ||||||
| Motorola Solutions, Inc. |
7,425 | 1,230,174 | ||||||
| MTS Systems Corp. |
3,551 | 142,537 | ||||||
| Napco Security Technologies, Inc.(a)(c) |
2,790 | 56,749 | ||||||
| NetApp, Inc. |
8,759 | 409,220 | ||||||
| Nitto Denko Corp.—ADR(c) |
25,729 | 628,302 | ||||||
| NVIDIA Corp. |
2,174 | 587,132 | ||||||
| Omron Corp.—ADR |
17,314 | 914,525 | ||||||
| ON Semiconductor Corp.(a) |
16,127 | 300,930 | ||||||
| OSI Systems, Inc.(a) |
3,074 | 249,824 | ||||||
| Panasonic Corp.—ADR(c) |
47,958 | 450,805 | ||||||
| Photronics, Inc.(a) |
10,567 | 131,559 | ||||||
| Plexus Corp.(a) |
1,598 | 106,027 | ||||||
| Power Integrations, Inc. |
1,642 | 142,936 | ||||||
| Qorvo, Inc.(a)(c) |
9,795 | 985,181 | ||||||
| QUALCOMM, Inc. |
19,321 | 1,512,834 | ||||||
The accompanying notes are an integral part of these financial statements.
45
| PMC DIVERSIFIED EQUITY FUND |
Schedule of Investments |
February 29, 2020 (Unaudited) (Continued)
| Shares |
Value |
|||||||
| Raytheon Co. |
2,881 | $ | 543,241 | |||||
| ResMed, Inc. |
2,033 | 323,166 | ||||||
| Rohm Co. Ltd.—ADR |
12,268 | 390,306 | ||||||
| Sanmina Corp.(a) |
5,440 | 143,018 | ||||||
| Seagate Technology PLC(b) |
11,343 | 543,897 | ||||||
| Seiko Epson Corp.—ADR(c) |
110,394 | 766,134 | ||||||
| Sharp Corp.—ADR |
105,769 | 312,019 | ||||||
| Skyworks Solutions, Inc. |
10,318 | 1,033,657 | ||||||
| SMART Global Holdings, Inc.(a)(b) |
3,267 | 87,686 | ||||||
| Sony Corp.—ADR |
31,950 | 1,987,290 | ||||||
| Stratasys Ltd.(a)(b)(c) |
4,019 | 64,304 | ||||||
| Sumitomo Electric Industries Ltd.—ADR |
25,493 | 294,189 | ||||||
| Taiwan Semiconductor Manufacturing Co. Ltd.—ADR(c) |
54,923 | 2,957,055 | ||||||
| TDK Corp.—ADR |
4,803 | 456,765 | ||||||
| Tech Data Corp.(a) |
4,747 | 675,925 | ||||||
| Telefonaktiebolaget LM Ericsson—ADR(c) |
47,647 | 383,082 | ||||||
| Teradyne, Inc. |
11,182 | 657,054 | ||||||
| Texas Instruments, Inc. |
5,056 | 577,092 | ||||||
| Thermo Fisher Scientific, Inc. |
7,101 | 2,064,972 | ||||||
| Toshiba Corp.—ADR |
26,675 | 353,711 | ||||||
| Trimble, Inc.(a) |
10,985 | 433,688 | ||||||
| TTM Technologies, Inc.(a) |
4,594 | 59,676 | ||||||
| United Microelectronics Corp.—ADR |
41,320 | 102,474 | ||||||
| Universal Display Corp. |
2,172 | 344,892 | ||||||
| Vishay Intertechnology, Inc.(c) |
15,240 | 284,988 | ||||||
| Vishay Precision Group, Inc.(a) |
1,452 | 39,886 | ||||||
| Vocera Communications, Inc.(a) |
1,060 | 25,853 | ||||||
| Western Digital Corp. |
4,524 | 251,353 | ||||||
| Xilinx, Inc. |
5,351 | 446,755 | ||||||
| Xperi Corp. |
6,817 | 117,184 | ||||||
| Zebra Technologies Corp.—Class A(a) |
3,236 | 682,699 | ||||||
| ZTE Corp.—ADR(a) |
6,946 | 56,749 | ||||||
| 77,337,018 | ||||||||
| Construction of Buildings—1.28% |
||||||||
| ACS Actividades de Construccion y Servicios SA—ADR(a) |
104,785 | 618,231 | ||||||
| China State Construction International Holdings Ltd.—ADR |
146 | 5,717 | ||||||
| Daito Trust Construction Co. Ltd.—ADR |
9,472 | 238,979 | ||||||
| Daiwa House Industry Co. Ltd.—ADR |
13,206 | 360,524 | ||||||
| DR Horton, Inc. |
18,898 | 1,006,696 | ||||||
| KB Home(c) |
10,760 | 350,668 | ||||||
| Lennar Corp.—Class A |
15,206 | 917,530 | ||||||
| Lennar Corp.—Class B |
844 | 40,352 | ||||||
| M/I Homes, Inc.(a) |
6,292 | 234,251 | ||||||
| MDC Holdings, Inc. |
14,754 | 580,422 | ||||||
| Meritage Homes Corp.(a) |
6,463 | 410,142 | ||||||
| NVR, Inc. |
234 | 858,120 | ||||||
| Persimmon PLC—ADR(c) |
7,528 | 560,309 | ||||||
| PulteGroup, Inc. |
36,427 | 1,464,366 | ||||||
| Sekisui House Ltd.—ADR |
50,808 | 987,708 | ||||||
| Sun Hung Kai Properties Ltd.—ADR |
52,326 | 743,029 | ||||||
| Taylor Morrison Home Corp.(a) |
15,592 | 351,132 | ||||||
| Toll Brothers, Inc. |
17,499 | 647,988 | ||||||
| 10,376,164 | ||||||||
The accompanying notes are an integral part of these financial statements.
46
| PMC DIVERSIFIED EQUITY FUND |
Schedule of Investments |
February 29, 2020 (Unaudited) (Continued)
| Shares |
Value |
|||||||
| Credit Intermediation and Related Activities—5.95% |
||||||||
| Absa Group Ltd.—ADR |
10,083 | $ | 165,966 | |||||
| Akbank T.A.S.—ADR |
13,448 | 28,375 | ||||||
| American Express Co. |
10,180 | 1,119,087 | ||||||
| Atlantic Capital Bancshares, Inc.(a) |
3,243 | 58,796 | ||||||
| Banco BBVA Argentina SA—ADR |
27,333 | 110,152 | ||||||
| Banco Bilbao Vizcaya Argentaria SA—ADR |
192,723 | 917,361 | ||||||
| Banco Bradesco SA—ADR |
14,369 | 83,053 | ||||||
| Banco de Chile—ADR |
17,692 | 319,694 | ||||||
| Banco do Brasil SA—ADR |
24,341 | 256,798 | ||||||
| Banco Macro SA—ADR |
5,596 | 162,172 | ||||||
| Banco Santander Brasil SA—ADR(c) |
20,538 | 178,886 | ||||||
| Banco Santander Chile—ADR |
13,451 | 243,060 | ||||||
| Banco Santander SA—ADR |
96,406 | 352,846 | ||||||
| Bancorp, Inc.(a) |
18,274 | 222,395 | ||||||
| Bank Hapoalim BM—ADR |
25,297 | 962,804 | ||||||
| Bank Mandiri Persero Tbk PT—ADR(c) |
64,255 | 642,544 | ||||||
| Bank of East Asia Ltd.—ADR(c) |
182,645 | 374,422 | ||||||
| Bank Rakyat Indonesia Persero Tbk PT—ADR |
53,515 | 756,970 | ||||||
| Banner Corp. |
451 | 20,584 | ||||||
| BOC Hong Kong Holdings Ltd.—ADR |
14,504 | 996,715 | ||||||
| Capital One Financial Corp. |
16,227 | 1,432,195 | ||||||
| China Merchants Bank Co. Ltd.—ADR(c) |
14,105 | 334,415 | ||||||
| CIT Group, Inc. |
4,516 | 179,330 | ||||||
| Citigroup, Inc. |
36,608 | 2,323,143 | ||||||
| Commercial International Bank Egypt SAE—ADR(c) |
44,886 | 225,417 | ||||||
| Commonwealth Bank of Australia—ADR(c) |
28,528 | 1,492,299 | ||||||
| Danske Bank A/S—ADR |
91,127 | 703,500 | ||||||
| DBS Group Holdings Ltd.—ADR |
15,891 | 1,105,537 | ||||||
| DNB ASA—ADR |
94,776 | 1,574,229 | ||||||
| Encore Capital Group, Inc.(a) |
8,422 | 312,962 | ||||||
| Euronet Worldwide, Inc.(a) |
4,204 | 521,464 | ||||||
| Fifth Third Bancorp |
2,652 | 64,709 | ||||||
| FinVolution Group—ADR |
54,054 | 107,027 | ||||||
| First BanCorp/Puerto Rico(b) |
25,439 | 201,986 | ||||||
| First Financial Bankshares, Inc.(c) |
7,520 | 216,125 | ||||||
| First Financial Corp. |
2,362 | 94,362 | ||||||
| Fulton Financial Corp.(c) |
40,531 | 585,673 | ||||||
| Great Southern Bancorp, Inc. |
757 | 38,842 | ||||||
| Grupo Aval Acciones y Valores SA—ADR |
56,428 | 458,760 | ||||||
| Grupo Financiero Banorte SAB de CV—ADR |
6,881 | 187,163 | ||||||
| Grupo Financiero Galicia SA—ADR(c) |
9,549 | 120,699 | ||||||
| Hachijuni Bank Ltd.—ADR |
23,239 | 777,461 | ||||||
| Hancock Whitney Corp. |
8,125 | 272,188 | ||||||
| Hang Seng Bank Ltd.—ADR(c) |
45,523 | 949,155 | ||||||
| HDFC Bank Ltd.—ADR |
16,544 | 907,438 | ||||||
| Hilltop Holdings, Inc. |
15,391 | 320,595 | ||||||
| HSBC Holdings PLC—ADR |
4,062 | 136,361 | ||||||
| IBERIABANK Corp. |
7,507 | 451,846 | ||||||
| ICICI Bank Ltd.—ADR(c) |
43,737 | 606,632 | ||||||
| International Bancshares Corp. |
5,846 | 199,349 | ||||||
| Itau CorpBanca—ADR |
9,048 | 53,655 | ||||||
| JPMorgan Chase & Co. |
13,537 | 1,571,781 | ||||||
| KB Financial Group, Inc.—ADR |
5,428 | 175,162 | ||||||
The accompanying notes are an integral part of these financial statements.
47
| PMC DIVERSIFIED EQUITY FUND |
Schedule of Investments |
February 29, 2020 (Unaudited) (Continued)
| Shares |
Value |
|||||||
| LendingTree, Inc.(a)(c) |
431 | $ | 118,878 | |||||
| Malayan Banking Bhd—ADR |
6,805 | 27,188 | ||||||
| Mediobanca Banca di Credito Finanziario SpA—ADR |
86,657 | 777,313 | ||||||
| Mitsubishi Corp.—ADR |
10,568 | 520,051 | ||||||
| Mitsubishi UFJ Financial Group, Inc.—ADR |
226,080 | 1,101,010 | ||||||
| Mizuho Financial Group, Inc.—ADR |
177,076 | 469,251 | ||||||
| Mr Cooper Group, Inc.(a) |
7,460 | 95,712 | ||||||
| National Australia Bank Ltd.—ADR |
70,279 | 570,665 | ||||||
| Nedbank Group Ltd.—ADR(c) |
11,712 | 135,356 | ||||||
| Nelnet, Inc.—Class A |
2,510 | 133,281 | ||||||
| Nicolet Bankshares, Inc.(a) |
731 | 48,575 | ||||||
| OceanFirst Financial Corp. |
4,440 | 90,754 | ||||||
| OFG Bancorp(b) |
6,448 | 107,940 | ||||||
| On Deck Capital, Inc.(a) |
17,777 | 62,042 | ||||||
| OneMain Holdings, Inc. |
18,397 | 676,090 | ||||||
| ORIX Corp.—ADR |
25,924 | 2,070,808 | ||||||
| Oversea-Chinese Banking Corp. Ltd.—ADR |
32,333 | 487,582 | ||||||
| PennyMac Financial Services, Inc. |
9,975 | 351,719 | ||||||
| Piraeus Bank SA—ADR(a) |
2,503 | 10,763 | ||||||
| PNC Financial Services Group, Inc. |
1,328 | 167,859 | ||||||
| Popular, Inc.(b) |
10,203 | 489,540 | ||||||
| Provident Financial PLC—ADR |
17,796 | 93,607 | ||||||
| Provident Financial Services, Inc. |
5,131 | 102,517 | ||||||
| Regional Management Corp.(a) |
3,318 | 85,107 | ||||||
| Regions Financial Corp. |
7,352 | 99,399 | ||||||
| Republic Bancorp, Inc.—Class A |
1,708 | 61,044 | ||||||
| Royal Bank of Scotland Group PLC—ADR(c) |
80,108 | 370,900 | ||||||
| Sandy Spring Bancorp, Inc.(c) |
3,938 | 121,133 | ||||||
| Santander Consumer USA Holdings, Inc. |
21,994 | 536,654 | ||||||
| Sberbank of Russia PJSC—ADR |
77,911 | 1,108,674 | ||||||
| Shinhan Financial Group Co. Ltd.—ADR |
12,492 | 334,036 | ||||||
| Skandinaviska Enskilda Banken AB—ADR |
137,868 | 1,313,882 | ||||||
| Societe Generale SA—ADR |
68,138 | 381,573 | ||||||
| Standard Bank Group Ltd.—ADR |
18,152 | 173,533 | ||||||
| Sumitomo Mitsui Financial Group, Inc.—ADR |
201,360 | 1,282,663 | ||||||
| Sumitomo Mitsui Trust Holdings, Inc.—ADR(c) |
327,541 | 1,116,915 | ||||||
| Svenska Handelsbanken AB—ADR |
162,595 | 811,349 | ||||||
| Swedbank AB—ADR(c) |
53,902 | 815,537 | ||||||
| Turkiye Garanti Bankasi AS—ADR(a) |
122,469 | 183,483 | ||||||
| Turkiye Vakiflar Bankasi TAO—ADR(a) |
7,946 | 67,422 | ||||||
| U.S. Bancorp |
6,791 | 315,374 | ||||||
| UniCredit SpA—ADR |
139,827 | 871,122 | ||||||
| United Bankshares, Inc.(c) |
4,768 | 137,700 | ||||||
| United Overseas Bank Ltd.—ADR(c) |
19,083 | 671,149 | ||||||
| Univest Financial Corp. |
2,786 | 65,192 | ||||||
| Valley National Bancorp(c) |
45,751 | 425,484 | ||||||
| Washington Federal, Inc. |
1,080 | 32,389 | ||||||
| Waterstone Financial, Inc. |
3,625 | 60,284 | ||||||
| Wells Fargo & Co. |
12,004 | 490,363 | ||||||
| WesBanco, Inc. |
723 | 22,131 | ||||||
| Western Union Co. |
34,685 | 776,597 | ||||||
| Westpac Banking Corp.—ADR(c) |
149 | 2,269 | ||||||
| Woori Financial Group, Inc.—ADR(c) |
6,821 | 165,273 | ||||||
| 48,281,272 | ||||||||
The accompanying notes are an integral part of these financial statements.
48
| PMC DIVERSIFIED EQUITY FUND |
Schedule of Investments |
February 29, 2020 (Unaudited) (Continued)
| Shares |
Value |
|||||||
| Data Processing, Hosting and Related Services—0.79% |
||||||||
| 21Vianet Group, Inc.—ADR(a) |
3,629 | $ | 54,362 | |||||
| CSG Systems International, Inc. |
5,212 | 230,631 | ||||||
| EVERTEC, Inc.(b) |
9,067 | 269,109 | ||||||
| FactSet Research Systems, Inc.(c) |
657 | 174,755 | ||||||
| Hewlett Packard Enterprise Co. |
49,235 | 629,716 | ||||||
| Inovalon Holdings, Inc.—Class A(a) |
2,752 | 53,609 | ||||||
| JMU Ltd.—ADR(a) |
39,200 | 27,440 | ||||||
| Liberty TripAdvisor Holdings, Inc.—Class A(a) |
5,240 | 22,820 | ||||||
| Match Group, Inc.(a)(c) |
10,266 | 667,290 | ||||||
| Sify Technologies Ltd.—ADR |
4,345 | 4,432 | ||||||
| Sohu.com Ltd.—ADR(a) |
1,203 | 11,465 | ||||||
| The9 Ltd.—ADR(a) |
35,459 | 25,530 | ||||||
| Trivago NV—ADR(a) |
21,577 | 39,270 | ||||||
| Verisk Analytics, Inc. |
1,115 | 172,948 | ||||||
| Visa, Inc.(c) |
21,671 | 3,938,921 | ||||||
| Zai Lab Ltd.—ADR(a) |
1,201 | 66,019 | ||||||
| 6,388,317 | ||||||||
| Educational Services—0.23% |
||||||||
| ATA Creativity Global—ADR(a) |
21,057 | 21,268 | ||||||
| China Distance Education Holdings Ltd.—ADR(a) |
14,027 | 105,203 | ||||||
| Cogna Educacao—ADR |
13,872 | 30,241 | ||||||
| Graham Holdings Co.—Class B |
964 | 484,775 | ||||||
| K12, Inc.(a) |
5,808 | 115,463 | ||||||
| Laureate Education, Inc.—Class A(a) |
15,516 | 290,149 | ||||||
| New Oriental Education & Technology Group, Inc.—ADR(a) |
2,363 | 302,204 | ||||||
| TAL Education Group—ADR(a) |
4,736 | 257,591 | ||||||
| Tarena International, Inc.—ADR(a) |
4,761 | 14,759 | ||||||
| YDUQS Part—ADR(c) |
19,963 | 223,586 | ||||||
| 1,845,239 | ||||||||
| Electrical Equipment, Appliance, and Component Manufacturing—1.50% |
||||||||
| ABB Ltd.—ADR(c) |
153 | 3,311 | ||||||
| Acuity Brands, Inc. |
2,712 | 278,957 | ||||||
| Allegion PLC(b) |
3,601 | 414,079 | ||||||
| Alstom SA—ADR(c) |
66,977 | 324,838 | ||||||
| Arcelik AS—ADR(a) |
12,535 | 194,418 | ||||||
| Armstrong World Industries, Inc. |
1,089 | 109,063 | ||||||
| Atos SE—ADR |
12,749 | 189,954 | ||||||
| BYD Co. Ltd.—ADR(c) |
17,990 | 218,938 | ||||||
| Electrolux AB—Class B—ADR |
9,908 | 401,868 | ||||||
| Generac Holdings, Inc.(a)(c) |
6,244 | 643,070 | ||||||
| GrafTech International Ltd.(c) |
21,440 | 174,950 | ||||||
| Helen of Troy Ltd.(a)(b) |
1,641 | 270,109 | ||||||
| Hubbell, Inc. |
4,605 | 613,570 | ||||||
| Husqvarna AB—ADR |
18,656 | 247,565 | ||||||
| IPG Photonics Corp.(a) |
614 | 78,371 | ||||||
| iRobot Corp.(a)(c) |
2,156 | 103,466 | ||||||
| Koninklijke Philips NV(b)(c) |
29,751 | 1,276,319 | ||||||
| Mitsubishi Electric Corp.—ADR(c) |
36,124 | 898,043 | ||||||
| Murata Manufacturing Co. Ltd.—ADR(c) |
76,299 | 996,465 | ||||||
| Nidec Corp.—ADR(c) |
8,334 | 243,686 | ||||||
| Regal Beloit Corp. |
9,606 | 745,810 | ||||||
| Schneider Electric SE—ADR |
78,108 | 1,566,065 | ||||||
The accompanying notes are an integral part of these financial statements.
49
| PMC DIVERSIFIED EQUITY FUND |
Schedule of Investments |
February 29, 2020 (Unaudited) (Continued)
| Shares |
Value |
|||||||
| Siemens AG—ADR |
574 | $ | 29,498 | |||||
| Synaptics, Inc.(a) |
980 | 64,729 | ||||||
| Taiyo Yuden Co Ltd.—ADR |
5,785 | 633,573 | ||||||
| Whirlpool Corp.(c) |
7,182 | 918,291 | ||||||
| Woodward, Inc. |
985 | 101,652 | ||||||
| Yaskawa Electric Corp.—ADR |
7,229 | 441,475 | ||||||
| 12,182,133 | ||||||||
| Electronics and Appliance Stores—0.22% |
||||||||
| Aaron’s, Inc.(c) |
6,117 | 240,582 | ||||||
| Best Buy Co., Inc. |
14,270 | 1,079,526 | ||||||
| Conn’s, Inc.(a) |
3,276 | 26,699 | ||||||
| PC Connection, Inc. |
5,711 | 232,266 | ||||||
| Smartsheet, Inc.—Class A(a)(c) |
4,910 | 227,333 | ||||||
| 1,806,406 | ||||||||
| Fabricated Metal Product Manufacturing—0.49% |
||||||||
| ACCO Brands Corp. |
5,800 | 46,458 | ||||||
| Assa Abloy AB—ADR |
93,487 | 1,045,184 | ||||||
| Atkore International Group, Inc.(a) |
9,465 | 349,353 | ||||||
| Axon Enterprise, Inc.(a) |
6 | 464 | ||||||
| Crane Co. |
2,911 | 197,802 | ||||||
| Crown Holdings, Inc.(a) |
8,636 | 608,838 | ||||||
| Emerson Electric Co. |
4,689 | 300,612 | ||||||
| Helios Technologies, Inc. |
820 | 32,595 | ||||||
| Materion Corp. |
1,704 | 77,259 | ||||||
| Parker Hannifin Corp. |
3,137 | 579,624 | ||||||
| POSCO—ADR |
3,372 | 135,858 | ||||||
| Silgan Holdings, Inc. |
12,468 | 356,959 | ||||||
| Simpson Manufacturing Co, Inc. |
1,463 | 116,206 | ||||||
| Stanley Black & Decker, Inc. |
1,168 | 167,842 | ||||||
| 4,015,054 | ||||||||
| Fishing, Hunting and Trapping—0.10% |
||||||||
| Mowi ASA—ADR |
38,951 | 819,529 | ||||||
| Food and Beverage Stores—0.98% |
||||||||
| Aeon Co. Ltd.—ADR |
51,593 | 937,187 | ||||||
| Carrefour SA—ADR(c) |
235,210 | 809,122 | ||||||
| Casino Guichard Perrachon SA—ADR |
34,546 | 269,286 | ||||||
| Ingles Markets, Inc.—Class A |
4,537 | 162,288 | ||||||
| J Sainsbury PLC—ADR |
48,921 | 486,275 | ||||||
| Koninklijke Ahold Delhaize NV—ADR |
40,190 | 940,848 | ||||||
| Kroger Co. |
28,016 | 788,090 | ||||||
| Natural Grocers by Vitamin Cottage, Inc. |
6,677 | 46,071 | ||||||
| Seven & i Holdings Co. Ltd.—ADR(c) |
96,616 | 1,627,981 | ||||||
| Shoprite Holdings Ltd.—ADR |
3,103 | 21,858 | ||||||
| Sprouts Farmers Market, Inc.(a) |
20,394 | 325,896 | ||||||
| Tesco PLC—ADR |
102,686 | 900,556 | ||||||
| Wal-Mart de Mexico SAB de CV—ADR(c) |
7,832 | 220,392 | ||||||
| Wm Morrison Supermarkets PLC—ADR |
34,446 | 380,284 | ||||||
| 7,916,134 | ||||||||
| Food Manufacturing—2.03% |
||||||||
| Ajinomoto Co., Inc.—ADR |
50,619 | 834,454 | ||||||
| Archer-Daniels-Midland Co. |
10,428 | 392,614 | ||||||
The accompanying notes are an integral part of these financial statements.
50
| PMC DIVERSIFIED EQUITY FUND |
Schedule of Investments |
February 29, 2020 (Unaudited) (Continued)
| Shares |
Value |
|||||||
| BRF SA—ADR(a) |
1,802 | $ | 10,848 | |||||
| Bunge Ltd.(b) |
11,418 | 536,075 | ||||||
| Campbell Soup Co. |
4,223 | 190,542 | ||||||
| General Mills, Inc. |
7,804 | 382,396 | ||||||
| Hershey Co. |
6,649 | 957,389 | ||||||
| Hormel Foods Corp.(c) |
9,605 | 399,568 | ||||||
| Ingredion, Inc. |
2,929 | 243,986 | ||||||
| JM Smucker Co. |
2,540 | 261,595 | ||||||
| John B Sanfilippo & Son, Inc. |
2,069 | 145,223 | ||||||
| Kellogg Co. |
2,400 | 145,128 | ||||||
| Kraft Heinz Co. |
10,855 | 268,878 | ||||||
| Lamb Weston Holdings, Inc. |
3,125 | 271,531 | ||||||
| Marfrig Global Foods SA—ADR(a) |
15,043 | 40,661 | ||||||
| Mondelez International, Inc.—Class A |
8,769 | 463,004 | ||||||
| Nestle SA—ADR |
54,575 | 5,616,313 | ||||||
| Pilgrim’s Pride Corp.(a) |
17,964 | 380,118 | ||||||
| Post Holdings, Inc.(a)(c) |
1,648 | 166,876 | ||||||
| Simply Good Foods Co.(a) |
9,689 | 213,739 | ||||||
| Tate & Lyle PLC—ADR |
25,311 | 910,880 | ||||||
| Tiger Brands Ltd.—ADR |
1,632 | 16,908 | ||||||
| TreeHouse Foods, Inc.(a) |
5,413 | 206,289 | ||||||
| Tyson Foods, Inc.—Class A |
20,395 | 1,383,393 | ||||||
| Unilever NV(b)(c) |
27,692 | 1,461,031 | ||||||
| Wilmar International Ltd.—ADR |
19,270 | 545,100 | ||||||
| 16,444,539 | ||||||||
| Food Services and Drinking Places—0.55% |
||||||||
| Brinker International, Inc.(c) |
4,987 | 171,303 | ||||||
| Casey’s General Stores, Inc.(c) |
4,300 | 700,986 | ||||||
| Chipotle Mexican Grill, Inc.(a) |
523 | 404,582 | ||||||
| Compass Group PLC—ADR |
32,522 | 716,460 | ||||||
| McDonald’s Corp. |
5,400 | 1,048,518 | ||||||
| Starbucks Corp. |
9,224 | 723,438 | ||||||
| Texas Roadhouse, Inc. |
12 | 675 | ||||||
| Yum China Holdings, Inc. |
2,308 | 101,067 | ||||||
| Yum! Brands, Inc. |
6,646 | 593,156 | ||||||
| 4,460,185 | ||||||||
| Funds, Trusts, and Other Financial Vehicles—0.51% |
||||||||
| Enstar Group Ltd.(a)(b) |
624 | 111,315 | ||||||
| Franklin Resources, Inc.(c) |
26,580 | 578,381 | ||||||
| Garmin Ltd.(b) |
11,758 | 1,039,289 | ||||||
| Geberit AG—ADR |
14,163 | 704,893 | ||||||
| Magnolia Oil & Gas Corp.—Class A(a) |
19,330 | 145,168 | ||||||
| NN Group NV—ADR |
54,000 | 919,080 | ||||||
| Temenos AG—ADR(c) |
2,242 | 319,485 | ||||||
| Wheelock & Co Ltd.—ADR(c) |
1,767 | 132,808 | ||||||
| Woolworths Holdings Ltd.(b) |
86,745 | 196,911 | ||||||
| 4,147,330 | ||||||||
| Furniture and Home Furnishings Stores—0.14% |
||||||||
| Container Store Group, Inc.(a) |
6,856 | 25,916 | ||||||
| Haverty Furniture Companies, Inc. |
8,079 | 135,889 | ||||||
| RH(a)(c) |
788 | 142,943 | ||||||
| Ryohin Keikaku Co. Ltd.—ADR |
11,928 | 160,074 | ||||||
The accompanying notes are an integral part of these financial statements.
51
| PMC DIVERSIFIED EQUITY FUND |
Schedule of Investments |
February 29, 2020 (Unaudited) (Continued)
| Shares |
Value |
|||||||
| Switch, Inc.—Class A |
12,594 | $ | 180,598 | |||||
| Williams-Sonoma, Inc.(c) |
7,678 | 479,030 | ||||||
| 1,124,450 | ||||||||
| Furniture and Related Product Manufacturing—0.17% |
||||||||
| American Woodmark Corp.(a) |
1,711 | 143,330 | ||||||
| Ethan Allen Interiors, Inc. |
18,972 | 250,430 | ||||||
| Fortune Brands Home & Security, Inc. |
5,361 | 331,043 | ||||||
| Herman Miller, Inc. |
11,001 | 376,674 | ||||||
| HNI Corp. |
5,272 | 173,080 | ||||||
| Kimball International, Inc.—Class B |
5,824 | 94,232 | ||||||
| 1,368,789 | ||||||||
| General Merchandise Stores—1.06% |
||||||||
| BJ’s Wholesale Club Holdings, Inc.(a)(c) |
5,160 | 99,382 | ||||||
| Colruyt SA—ADR |
44,623 | 516,065 | ||||||
| Costco Wholesale Corp. |
6,914 | 1,943,801 | ||||||
| Dillard’s, Inc.—Class A(c) |
2,386 | 134,308 | ||||||
| Dollar General Corp. |
4,105 | 616,982 | ||||||
| Kohl’s Corp.(c) |
13,735 | 537,725 | ||||||
| Pan Pacific International Holdings Corp.—ADR |
35,840 | 572,723 | ||||||
| Target Corp. |
15,785 | 1,625,855 | ||||||
| Walmart, Inc. |
23,336 | 2,512,820 | ||||||
| 8,559,661 | ||||||||
| Health and Personal Care Stores—0.24% |
||||||||
| Aspen Pharmacare Holdings Ltd.—ADR(a) |
3,388 | 21,175 | ||||||
| Clicks Group Ltd.—ADR |
4,902 | 144,756 | ||||||
| CVS Health Corp. |
11,575 | 685,009 | ||||||
| OptimizeRx Corp.(a) |
1,856 | 15,498 | ||||||
| Sally Beauty Holdings, Inc.(a)(c) |
17,228 | 214,316 | ||||||
| Ulta Beauty, Inc.(a) |
1,221 | 313,907 | ||||||
| Walgreens Boots Alliance, Inc. |
12,470 | 570,627 | ||||||
| 1,965,288 | ||||||||
| Heavy and Civil Engineering Construction—0.39% |
||||||||
| Alliance Global Group, Inc.—ADR(a) |
7,174 | 70,413 | ||||||
| Atlantia SpA—ADR |
17,919 | 191,016 | ||||||
| Great Lakes Dredge & Dock Corp.(a) |
15,449 | 149,855 | ||||||
| JGC Holdings Corp.—ADR(c) |
13,234 | 319,204 | ||||||
| KBR, Inc. |
21,379 | 554,999 | ||||||
| MasTec, Inc.(a)(c) |
6,848 | 336,100 | ||||||
| MYR Group, Inc.(a) |
1,807 | 46,097 | ||||||
| Primoris Services Corp. |
1,988 | 37,732 | ||||||
| Skanska AB—ADR |
24,680 | 534,199 | ||||||
| Sterling Constuction Co. Inc.(a)(c) |
7,918 | 108,160 | ||||||
| Vinci SA—ADR |
30,217 | 760,864 | ||||||
| Xinyuan Real Estate Co. Ltd.—ADR |
13,725 | 39,665 | ||||||
| 3,148,304 | ||||||||
| Hospitals—0.28% |
||||||||
| Community Health Systems, Inc.(a)(c) |
18,364 | 90,535 | ||||||
| Encompass Health Corp. |
2,766 | 207,007 | ||||||
| HCA Healthcare, Inc. |
7,499 | 952,448 | ||||||
| Tenet Healthcare Corp.(a)(c) |
6,042 | 158,784 | ||||||
The accompanying notes are an integral part of these financial statements.
52
| PMC DIVERSIFIED EQUITY FUND |
Schedule of Investments |
February 29, 2020 (Unaudited) (Continued)
| Shares |
Value |
|||||||
| Universal Health Services, Inc.—Class B |
6,818 | $ | 843,659 | |||||
| 2,252,433 | ||||||||
| Insurance Carriers and Related Activities—6.49% |
||||||||
| Admiral Group PLC—ADR(c) |
18,037 | 498,362 | ||||||
| Aflac, Inc. |
21,325 | 913,776 | ||||||
| Ageas—ADR |
29,810 | 1,380,501 | ||||||
| AIA Group Ltd.—ADR |
53,565 | 2,127,066 | ||||||
| Alleghany Corp. |
593 | 398,644 | ||||||
| Allstate Corp. |
10,895 | 1,146,699 | ||||||
| American Equity Invesment Life Holding Co. |
1,669 | 42,192 | ||||||
| American International Group, Inc.(c) |
16,817 | 709,005 | ||||||
| American National Insurance Co. |
1,469 | 144,491 | ||||||
| Anthem, Inc. |
4,942 | 1,270,539 | ||||||
| Aon PLC(b) |
1,651 | 343,408 | ||||||
| Arch Capital Group Ltd.(a)(b) |
24,076 | 973,393 | ||||||
| Arthur J. Gallagher & Co. |
5,172 | 504,218 | ||||||
| Assured Guaranty Ltd.(b) |
10,994 | 448,665 | ||||||
| Athene Holding Ltd.—Class A(a)(b) |
12,868 | 530,805 | ||||||
| Aviva PLC—ADR |
122,832 | 1,114,086 | ||||||
| Berkshire Hathaway, Inc.—Class A(a) |
2 | 618,192 | ||||||
| Berkshire Hathaway, Inc.—Class B(a) |
16,267 | 3,356,534 | ||||||
| Centene Corp.(a) |
11,784 | 624,788 | ||||||
| Chubb Ltd.(b) |
673 | 97,605 | ||||||
| Cigna Corp. |
4,664 | 853,232 | ||||||
| Cincinnati Financial Corp. |
7,375 | 687,645 | ||||||
| CNA Financial Corp. |
4,498 | 187,027 | ||||||
| Direct Line Insurance Group PLC—ADR(c) |
44,947 | 684,093 | ||||||
| Employers Holdings, Inc. |
9,705 | 374,031 | ||||||
| Equitable Holdings, Inc. |
2,651 | 56,731 | ||||||
| Erie Indemnity Co.—Class A |
824 | 117,766 | ||||||
| Essent Group Ltd.(b) |
5,005 | 218,418 | ||||||
| Everest Re Group Ltd.(b) |
1,262 | 312,825 | ||||||
| Fanhua, Inc.—ADR(c) |
8,853 | 179,716 | ||||||
| FedNat Holding Co. |
1,823 | 23,772 | ||||||
| First American Financial Corp. |
6,594 | 376,517 | ||||||
| Gjensidige Forsikring ASA—ADR |
74,066 | 1,450,953 | ||||||
| Globe Life, Inc. |
1,360 | 126,018 | ||||||
| Hannover Rueck SE—ADR |
11,459 | 1,015,955 | ||||||
| Hanover Insurance Group, Inc. |
2,570 | 304,648 | ||||||
| Hartford Financial Services Group, Inc. |
21,400 | 1,068,930 | ||||||
| HCI Group, Inc. |
595 | 25,299 | ||||||
| Heritage Insurance Holdings, Inc. |
2,706 | 30,199 | ||||||
| Horace Mann Educators Corp. |
2,494 | 97,091 | ||||||
| Humana, Inc. |
2,251 | 719,600 | ||||||
| Kemper Corp. |
3,714 | 255,672 | ||||||
| Lincoln National Corp. |
4,948 | 224,590 | ||||||
| Loews Corp. |
21,577 | 984,559 | ||||||
| Markel Corp.(a) |
389 | 459,642 | ||||||
| Mercury General Corp. |
4,735 | 205,073 | ||||||
| MetLife, Inc. |
27,114 | 1,158,310 | ||||||
| MGIC Investment Corp. |
36,434 | 438,301 | ||||||
| Molina Healthcare, Inc.(a) |
3,120 | 382,356 | ||||||
| MS&AD Insurance Group Holdings, Inc.—ADR |
106,404 | 1,684,375 | ||||||
| Muenchener Rueckversicherungs-Gesellschaft AG—ADR |
82,682 | 2,110,871 | ||||||
The accompanying notes are an integral part of these financial statements.
53
| PMC DIVERSIFIED EQUITY FUND |
Schedule of Investments |
February 29, 2020 (Unaudited) (Continued)
| Shares |
Value |
|||||||
| National General Holdings Corp. |
10,390 | $ | 202,293 | |||||
| National Western Life Group, Inc.—Class A |
1,336 | 319,210 | ||||||
| NMI Holdings, Inc.—Class A(a) |
3,445 | 80,406 | ||||||
| Old Republic International Corp. |
48,594 | 958,274 | ||||||
| Ping An Insurance Group Co. of China Ltd.—ADR(c) |
42,251 | 950,225 | ||||||
| Principal Financial Group, Inc. |
3,928 | 174,364 | ||||||
| Progressive Corp. |
12,045 | 881,212 | ||||||
| Prudential Financial, Inc. |
4,359 | 328,887 | ||||||
| QBE Insurance Group Ltd.—ADR |
93,011 | 808,266 | ||||||
| Radian Group, Inc. |
11,130 | 236,401 | ||||||
| Reinsurance Group of America, Inc. |
1,701 | 207,573 | ||||||
| RenaissanceRe Holdings Ltd.(b) |
1,030 | 175,512 | ||||||
| Safety Insurance Group, Inc. |
3,650 | 287,401 | ||||||
| Sanlam Ltd.—ADR |
10,202 | 84,468 | ||||||
| SCOR SE—ADR(c) |
78,973 | 285,882 | ||||||
| Selective Insurance Group, Inc. |
2,589 | 144,414 | ||||||
| Suncorp Group Ltd.—ADR |
675 | 5,069 | ||||||
| T&D Holdings, Inc.—ADR |
187,474 | 868,005 | ||||||
| Tokio Marine Holdings, Inc.—ADR |
47,865 | 2,534,931 | ||||||
| Topdanmark A/S—ADR(c) |
192,206 | 863,870 | ||||||
| Travelers Companies, Inc. |
5,038 | 603,603 | ||||||
| Triple-S Management Corp.—Class B(a)(b)(c) |
3,705 | 55,538 | ||||||
| UnitedHealth Group, Inc. |
10,460 | 2,666,883 | ||||||
| Universal Insurance Holdings, Inc. |
896 | 18,538 | ||||||
| Voya Financial, Inc. |
14,821 | 780,177 | ||||||
| W.R. Berkley Corp. |
14,144 | 949,628 | ||||||
| White Mountains Insurance Group Ltd.(b) |
190 | 188,119 | ||||||
| Willis Towers Watson PLC(b) |
2,285 | 432,436 | ||||||
| Zurich Insurance Group AG—ADR |
64,946 | 2,506,916 | ||||||
| 52,655,685 | ||||||||
| Leather and Allied Product Manufacturing—0.38% |
||||||||
| adidas AG—ADR |
7,590 | 1,056,225 | ||||||
| Deckers Outdoor Corp.(a) |
2,009 | 349,164 | ||||||
| NIKE, Inc.—Class B |
8,879 | 793,605 | ||||||
| Rocky Brands, Inc. |
1,847 | 44,974 | ||||||
| Skechers U.S.A., Inc.—Class A(a) |
13,013 | 430,470 | ||||||
| Tapestry, Inc. |
16,788 | 393,679 | ||||||
| 3,068,117 | ||||||||
| Machinery Manufacturing—3.57% |
||||||||
| Advantest Corp.—ADR(c) |
22,908 | 1,029,302 | ||||||
| AGCO Corp. |
7,948 | 480,298 | ||||||
| Alamo Group, Inc.(c) |
1,179 | 130,598 | ||||||
| Applied Materials, Inc. |
24,207 | 1,406,911 | ||||||
| ASML Holding NV(b)(c) |
7,412 | 2,050,976 | ||||||
| Atlas Copco AB—Class A—ADR |
31,001 | 1,098,675 | ||||||
| Atlas Copco AB—Class B—ADR |
21,000 | 652,470 | ||||||
| Axcelis Technologies, Inc.(a) |
4,116 | 98,743 | ||||||
| Baker Hughes Co. |
5,249 | 84,456 | ||||||
| Belden, Inc. |
2,584 | 103,179 | ||||||
| Brooks Automation, Inc. |
2,522 | 87,034 | ||||||
| Canon, Inc.—ADR(c) |
30,345 | 763,177 | ||||||
| Caterpillar, Inc. |
6,912 | 858,746 | ||||||
| CECO Environmental Corp.(a)(c) |
3,546 | 23,936 | ||||||
The accompanying notes are an integral part of these financial statements.
54
| PMC DIVERSIFIED EQUITY FUND |
Schedule of Investments |
February 29, 2020 (Unaudited) (Continued)
| Shares |
Value |
|||||||
| Columbus McKinnon Corp. |
2,963 | $ | 92,120 | |||||
| CONMED Corp.(c) |
4,464 | 422,473 | ||||||
| CSW Industrials, Inc. |
1,693 | 111,467 | ||||||
| Cummins, Inc. |
8,710 | 1,317,736 | ||||||
| Daikin Industries Ltd.—ADR(c) |
113,567 | 1,519,526 | ||||||
| Deere & Co. |
4,314 | 675,055 | ||||||
| Fabrinet(a)(b) |
6,938 | 382,423 | ||||||
| FANUC Corp.—ADR |
45,093 | 737,271 | ||||||
| FUJIFILM Holdings Corp.—ADR |
31,244 | 1,496,587 | ||||||
| Gates Industrial Corp. PLC(a)(b)(c) |
24,261 | 253,770 | ||||||
| Glaukos Corp.(a)(c) |
2,095 | 92,138 | ||||||
| II-VI, Inc.(a)(c) |
2,972 | 88,239 | ||||||
| Illinois Tool Works, Inc. |
876 | 146,975 | ||||||
| Ingersoll-Rand PLC(b) |
5,962 | 769,336 | ||||||
| ITT, Inc. |
7,294 | 438,734 | ||||||
| Kennametal, Inc.(c) |
9,079 | 252,396 | ||||||
| Komatsu Ltd.—ADR |
39,398 | 787,960 | ||||||
| Konica Minolta, Inc.—ADR |
42,231 | 453,561 | ||||||
| Makita Corp.—ADR(c) |
14,451 | 491,189 | ||||||
| Metso OYJ—ADR |
31,385 | 250,766 | ||||||
| Mettler-Toledo International, Inc.(a) |
1,285 | 901,685 | ||||||
| NCR Corp.(a) |
3,700 | 93,240 | ||||||
| Nikon Corp.—ADR |
22,295 | 224,065 | ||||||
| Novanta, Inc.(a)(b) |
579 | 51,653 | ||||||
| NSK Ltd.—ADR |
31,078 | 453,117 | ||||||
| Olympus Corp.—ADR |
54,903 | 985,371 | ||||||
| Pitney Bowes, Inc. |
8,948 | 30,602 | ||||||
| Rheinmetall AG—ADR |
10,850 | 191,937 | ||||||
| Ricoh Co Ltd.—ADR |
60,991 | 537,392 | ||||||
| Sandvik AB—ADR |
57,723 | 951,853 | ||||||
| SMC Corp.—ADR(c) |
62,125 | 1,211,438 | ||||||
| Snap-on, Inc.(c) |
5,259 | 761,240 | ||||||
| Solaris Oilfield Infrastructure, Inc.—Class A(c) |
5,312 | 56,307 | ||||||
| Steelcase, Inc.—Class A |
17,743 | 287,791 | ||||||
| Techtronic Industries Co. Ltd.—ADR |
14,891 | 610,084 | ||||||
| THK Co. Ltd.—ADR |
48,167 | 518,277 | ||||||
| Tokyo Electron Ltd.—ADR |
23,035 | 1,204,039 | ||||||
| Weichai Power Co. Ltd.—ADR |
15,247 | 239,988 | ||||||
| 28,958,302 | ||||||||
| Management of Companies and Enterprises—0.62% |
||||||||
| Accenture PLC—Class A(b) |
9,592 | 1,732,219 | ||||||
| Asahi Kasei Corp.—ADR(c) |
25,605 | 417,874 | ||||||
| ATN International, Inc. |
1,049 | 56,541 | ||||||
| Discover Financial Services |
5,244 | 343,902 | ||||||
| Four Seasons Education Cayman, Inc.—ADR |
5,798 | 8,802 | ||||||
| Jupai Holdings Ltd.—ADR(a)(c) |
33,900 | 44,748 | ||||||
| Kitov Pharma Ltd.—ADR(a) |
33,093 | 19,839 | ||||||
| Legal & General Group PLC—ADR |
67,842 | 1,141,781 | ||||||
| Qudian, Inc.—ADR(a)(c) |
8,055 | 21,104 | ||||||
| Umpqua Holdings Corp. |
2,306 | 35,489 | ||||||
| Xerox Holdings Corp. |
38,215 | 1,230,523 | ||||||
| 5,052,822 | ||||||||
The accompanying notes are an integral part of these financial statements.
55
| PMC DIVERSIFIED EQUITY FUND |
Schedule of Investments |
February 29, 2020 (Unaudited) (Continued)
| Shares |
Value |
|||||||
| Materials—0.01% |
||||||||
| Olympic Steel, Inc. |
5,597 | $ | 67,444 | |||||
| Merchant Wholesalers, Durable Goods—2.21% |
||||||||
| Acorn International, Inc.—ADR |
8,464 | 108,847 | ||||||
| Allison Transmission Holdings, Inc. |
10,397 | 422,118 | ||||||
| Anixter International, Inc.(a) |
1,052 | 102,581 | ||||||
| Arrow Electronics, Inc.(a) |
1,530 | 102,602 | ||||||
| Astra International, Tbk PT—ADR(c) |
52,042 | 405,147 | ||||||
| Avnet, Inc.(c) |
15,546 | 476,951 | ||||||
| BrasilAgro—Co Brasileira de Propriedades Agricolas—ADR |
12,262 | 51,500 | ||||||
| Builders FirstSource, Inc.(a) |
19,803 | 449,727 | ||||||
| Coloplast A/S—ADR(c) |
57,113 | 760,745 | ||||||
| Copart, Inc.(a) |
8,144 | 688,006 | ||||||
| D’ieteren SA/NV—ADR |
7,872 | 230,256 | ||||||
| Dongfeng Motor Group Co. Ltd.—ADR |
1,159 | 43,602 | ||||||
| DXP Enterprises, Inc.(a)(c) |
1,664 | 47,241 | ||||||
| Entegris, Inc.(c) |
10,989 | 585,933 | ||||||
| Fastenal Co. |
4,174 | 142,834 | ||||||
| Ferguson PLC—ADR(c) |
103,514 | 893,326 | ||||||
| Foundation Building Materials, Inc.(a)(c) |
6,432 | 100,339 | ||||||
| Funko, Inc.—Class A(a)(c) |
3,600 | 29,196 | ||||||
| Geely Automobile Holdings Ltd.—ADR(c) |
11,393 | 406,274 | ||||||
| Genuine Parts Co.(c) |
1,160 | 101,198 | ||||||
| Glencore PLC—ADR |
130,792 | 639,573 | ||||||
| GMS, Inc.(a) |
9,181 | 209,786 | ||||||
| Henry Schein, Inc.(a)(c) |
16,152 | 984,303 | ||||||
| Hexcel Corp.(c) |
1,286 | 83,114 | ||||||
| Honeywell International, Inc. |
4,612 | 747,929 | ||||||
| Huntington Ingalls Industries, Inc. |
960 | 197,309 | ||||||
| Insight Enterprises, Inc.(a) |
6,630 | 365,247 | ||||||
| IntriCon Corp.(a)(c) |
1,560 | 23,213 | ||||||
| KAR Auction Services, Inc. |
17,716 | 341,033 | ||||||
| KLA Corp. |
6,220 | 956,077 | ||||||
| Knowles Corp.(a) |
15,018 | 249,599 | ||||||
| Kone OYJ—ADR(c) |
19,098 | 538,564 | ||||||
| La-Z-Boy, Inc. |
7,094 | 203,243 | ||||||
| Lenovo Group Ltd.—ADR |
7,159 | 89,631 | ||||||
| LKQ Corp.(a) |
10,266 | 303,668 | ||||||
| Marubeni Corp.—ADR |
3,853 | 250,927 | ||||||
| Mitsui & Co. Ltd.—ADR |
3,165 | 1,006,818 | ||||||
| MSC Industrial Direct Co, Inc.—Class A |
3,450 | 213,279 | ||||||
| Rush Enterprises, Inc.—Class B |
98 | 4,107 | ||||||
| Ryerson Holding Corp.(a) |
8,993 | 74,912 | ||||||
| Safran SA—ADR |
6,706 | 231,089 | ||||||
| Schnitzer Steel Industries, Inc.—Class A |
13,002 | 214,273 | ||||||
| Sims Ltd.—ADR |
22,463 | 137,024 | ||||||
| Smart Sand, Inc.(a)(c) |
29,545 | 48,158 | ||||||
| Spectrum Brands Holdings, Inc. |
9,700 | 522,733 | ||||||
| SYNNEX Corp. |
4,005 | 500,745 | ||||||
| Tactile Systems Technology, Inc.(a) |
1,280 | 64,525 | ||||||
| TE Connectivity Ltd.(b) |
5,602 | 464,238 | ||||||
| Trinity Industries, Inc.(c) |
6,092 | 123,972 | ||||||
| Unicharm Corp.—ADR |
186,912 | 1,196,236 | ||||||
| Volkswagen AG—ADR |
27,544 | 463,015 | ||||||
The accompanying notes are an integral part of these financial statements.
56
| PMC DIVERSIFIED EQUITY FUND |
Schedule of Investments |
February 29, 2020 (Unaudited) (Continued)
| Shares |
Value |
|||||||
| Warrior Met Coal, Inc. |
9,121 | $ | 161,624 | |||||
| Weibo Corp.—ADR(a)(c) |
415 | 17,488 | ||||||
| WESCO International, Inc.(a) |
3,006 | 121,953 | ||||||
| 17,897,828 | ||||||||
| Merchant Wholesalers, Nondurable Goods—2.45% |
||||||||
| Akzo Nobel NV—ADR |
7,209 | 191,832 | ||||||
| AmerisourceBergen Corp. |
2,288 | 192,924 | ||||||
| Arrowhead Pharmaceuticals, Inc.(a) |
7,546 | 266,827 | ||||||
| Ashland Global Holdings, Inc.(c) |
1,426 | 102,016 | ||||||
| Conagra Foods, Inc. |
14,762 | 393,998 | ||||||
| Core-Mark Holding Co, Inc. |
2,423 | 55,753 | ||||||
| Fresh Del Monte Produce, Inc.(b) |
2,284 | 62,627 | ||||||
| Hawkins, Inc. |
1,688 | 60,346 | ||||||
| ITOCHU Corp.—ADR |
33,787 | 1,515,685 | ||||||
| KOC Holding AS—ADR |
7,744 | 108,435 | ||||||
| Kunlun Energy Co. Ltd.—ADR |
15,909 | 111,443 | ||||||
| LyondellBasell Industries NV—Class A(b) |
1,019 | 72,818 | ||||||
| McKesson Corp.(c) |
5,723 | 800,419 | ||||||
| Nu Skin Enterprises, Inc.—Class A |
12,657 | 310,350 | ||||||
| Orkla ASA—ADR |
87,465 | 731,207 | ||||||
| Performance Food Group Co.(a) |
13,145 | 557,348 | ||||||
| Procter & Gamble Co. |
25,165 | 2,849,432 | ||||||
| Roche Holding AG—ADR |
154,313 | 6,155,545 | ||||||
| Suntory Beverage & Food Ltd.—ADR |
49,087 | 920,381 | ||||||
| Sysco Corp. |
21,914 | 1,460,568 | ||||||
| Tractor Supply Co. |
4,439 | 392,896 | ||||||
| Unilever PLC—ADR |
28,861 | 1,556,474 | ||||||
| United Natural Foods, Inc.(a) |
54 | 349 | ||||||
| Universal Corp. |
4,697 | 231,797 | ||||||
| US Foods Holding Corp.(a) |
14,184 | 477,150 | ||||||
| Vector Group Ltd. |
8,212 | 95,423 | ||||||
| Viking Therapeutics, Inc.(a)(c) |
9,776 | 57,874 | ||||||
| World Fuel Services Corp. |
5,099 | 144,199 | ||||||
| 19,876,116 | ||||||||
| Mining(except Oil and Gas)—0.50% |
||||||||
| Anglo American Platinum Ltd.—ADR |
17,119 | 188,309 | ||||||
| Anglo American PLC—ADR |
119,870 | 1,394,088 | ||||||
| AngloGold Ashanti Ltd.—ADR(c) |
618 | 10,784 | ||||||
| Arch Coal, Inc.—Class A(c) |
1,765 | 88,868 | ||||||
| BHP Group PLC—ADR |
24,151 | 876,681 | ||||||
| Cia de Minas Buenaventura SAA—ADR |
52 | 580 | ||||||
| Freeport-McMoRan, Inc. |
11,334 | 112,887 | ||||||
| Intrepid Potash, Inc.(a)(c) |
14,832 | 26,253 | ||||||
| Kumba Iron Ore Ltd.—ADR |
16,275 | 95,209 | ||||||
| Lynas Corp Ltd.—ADR(a) |
70,229 | 82,589 | ||||||
| Martin Marietta Materials, Inc. |
1,082 | 246,187 | ||||||
| Mechel PJSC—ADR(a) |
24,445 | 57,201 | ||||||
| Newcrest Mining Ltd.—ADR |
17,976 | 289,414 | ||||||
| Newmont Corp. |
6,738 | 300,717 | ||||||
| Peabody Energy Corp. |
3,112 | 18,174 | ||||||
| Royal Gold, Inc. |
1,569 | 151,361 | ||||||
| Vedanta Ltd.—ADR |
18,514 | 121,637 | ||||||
| 4,060,939 | ||||||||
The accompanying notes are an integral part of these financial statements.
57
| PMC DIVERSIFIED EQUITY FUND |
Schedule of Investments |
February 29, 2020 (Unaudited) (Continued)
| Shares |
Value |
|||||||
| Miscellaneous Manufacturing—1.83% |
||||||||
| Acushnet Holdings Corp. |
12,149 | $ | 309,192 | |||||
| Ansell Ltd.—ADR |
2,231 | 169,668 | ||||||
| Apyx Medical Corp.(a)(c) |
7,381 | 44,655 | ||||||
| Argenx SE—ADR(a)(c) |
1,778 | 251,374 | ||||||
| AtriCure, Inc.(a) |
5,027 | 193,137 | ||||||
| Baxter International, Inc. |
8,037 | 670,848 | ||||||
| BioTelemetry, Inc.(a)(c) |
3,525 | 150,588 | ||||||
| Brady Corp.—Class A |
9,214 | 436,191 | ||||||
| Cardiovascular Systems, Inc.(a) |
2,480 | 93,298 | ||||||
| Chow Tai Fook Jewellery Group Ltd.—ADR |
36,031 | 312,749 | ||||||
| Cie Financiere Richemont SA—ADR |
100,157 | 681,068 | ||||||
| Cochlear Ltd.—ADR |
4,469 | 298,038 | ||||||
| Conformis, Inc.(a) |
14,930 | 11,633 | ||||||
| ConvaTec Group PLC—ADR(c) |
6,041 | 63,189 | ||||||
| Cooper Cos., Inc. |
3,071 | 996,753 | ||||||
| CryoLife, Inc.(a)(c) |
3,346 | 85,758 | ||||||
| DENTSPLY SIRONA, Inc. |
15,194 | 748,153 | ||||||
| DexCom, Inc.(a) |
1,038 | 286,488 | ||||||
| Dover Corp. |
2,976 | 305,754 | ||||||
| Edwards Lifesciences Corp.(a) |
6,165 | 1,262,838 | ||||||
| Getinge AB—ADR |
19,513 | 326,452 | ||||||
| Haemonetics Corp.(a) |
3,986 | 431,803 | ||||||
| Hasbro, Inc. |
1,196 | 92,391 | ||||||
| Hill-Rom Holdings, Inc. |
4,252 | 408,405 | ||||||
| Inspire Medical Systems, Inc.(a) |
1,103 | 94,715 | ||||||
| Insulet Corp.(a) |
572 | 108,663 | ||||||
| Invacare Corp. |
7,863 | 59,602 | ||||||
| Merit Medical Systems, Inc.(a) |
2,778 | 100,036 | ||||||
| Nintendo Co., Ltd.—ADR(c) |
37,469 | 1,572,948 | ||||||
| NuVasive, Inc.(a) |
1,794 | 118,063 | ||||||
| Smith & Nephew PLC—ADR(c) |
19,947 | 899,211 | ||||||
| Sonova Holding AG—ADR |
13,460 | 640,158 | ||||||
| STAAR Surgical Co.(a)(c) |
2,409 | 75,594 | ||||||
| STERIS PLC(b) |
4,951 | 785,328 | ||||||
| Stryker Corp. |
4,173 | 795,332 | ||||||
| Tandem Diabetes Care, Inc.(a) |
2,924 | 218,306 | ||||||
| Wright Medical Group NV(a)(b) |
5,387 | 162,957 | ||||||
| Yamaha Corp.—ADR |
11,536 | 546,691 | ||||||
| 14,808,027 | ||||||||
| Miscellaneous Store Retailers—0.23% |
||||||||
| GNC Holdings, Inc.—Class A(a)(c) |
35,885 | 60,287 | ||||||
| L’Oreal SA—ADR |
28,945 | 1,543,636 | ||||||
| Rent-A-Center, Inc.(c) |
9,095 | 193,633 | ||||||
| Titan Machinery, Inc.(a) |
3,908 | 39,510 | ||||||
| 1,837,066 | ||||||||
| Motion Picture and Sound Recording Industries—0.11% |
||||||||
| Cinemark Holdings, Inc.(c) |
2,776 | 72,065 | ||||||
| Promotora de Informaciones SA—ADR(a) |
11,910 | 18,341 | ||||||
| Take-Two Interactive Software, Inc.(a) |
1,916 | 205,932 | ||||||
| ViacomCBS, Inc.—Class B |
10,945 | 269,356 | ||||||
| Vivendi SA—ADR |
12,743 | 325,711 | ||||||
| 891,405 | ||||||||
The accompanying notes are an integral part of these financial statements.
58
| PMC DIVERSIFIED EQUITY FUND |
Schedule of Investments |
February 29, 2020 (Unaudited) (Continued)
| Shares |
Value |
|||||||
| Motor Vehicle and Parts Dealers—0.65% |
||||||||
| Advance Auto Parts, Inc. |
768 | $ | 102,129 | |||||
| America’s Car-Mart, Inc.(a) |
1,112 | 114,280 | ||||||
| Asbury Automotive Group, Inc.(a) |
2,223 | 197,047 | ||||||
| Auto Trader Group PLC—ADR |
262,353 | 432,882 | ||||||
| AutoNation, Inc.(a)(c) |
3,194 | 136,480 | ||||||
| AutoZone, Inc.(a) |
877 | 905,510 | ||||||
| CarMax, Inc.(a)(c) |
8,904 | 777,409 | ||||||
| Carvana Co.(a) |
1,306 | 108,280 | ||||||
| Group 1 Automotive, Inc. |
4,054 | 345,522 | ||||||
| Lithia Motors, Inc.—Class A |
3,415 | 406,931 | ||||||
| Malibu Boats, Inc.—Class A(a) |
4,432 | 194,743 | ||||||
| MarineMax, Inc.(a) |
5,551 | 93,978 | ||||||
| Murphy USA, Inc.(a) |
2,701 | 263,348 | ||||||
| O’Reilly Automotive, Inc.(a) |
986 | 363,558 | ||||||
| Penske Automotive Group, Inc. |
3,576 | 164,568 | ||||||
| Peugeot SA – ADR |
24,941 | 480,364 | ||||||
| Sonic Automotive, Inc.—Class A(c) |
7,050 | 197,400 | ||||||
| 5,284,429 | ||||||||
| Nonmetallic Mineral Product Manufacturing—0.51% |
||||||||
| AGC, Inc.—ADR |
65,832 | 359,443 | ||||||
| Anhui Conch Cement Co. Ltd.—ADR |
12,810 | 475,981 | ||||||
| Caesarstone Ltd.(b) |
3,255 | 35,187 | ||||||
| CRH PLC—ADR(c) |
16,933 | 573,690 | ||||||
| HeidelbergCement AG—ADR |
33,696 | 401,319 | ||||||
| LafargeHolcim Ltd.—ADR |
73,553 | 679,631 | ||||||
| Loma Negra Cia Industrial Argentina SA—ADR(a) |
18,843 | 109,289 | ||||||
| Mohawk Industries, Inc.(a) |
1,770 | 214,436 | ||||||
| O-I Glass, Inc.(c) |
9,771 | 105,527 | ||||||
| Owens Corning |
6,837 | 386,222 | ||||||
| Semen Indonesia Persero Tbk PT—ADR |
9,689 | 140,151 | ||||||
| TOTO Ltd.—ADR |
10,626 | 393,161 | ||||||
| Wienerberger AG—ADR |
50,197 | 249,354 | ||||||
| 4,123,391 | ||||||||
| Nonstore Retailers—0.34% |
||||||||
| Amazon.com, Inc.(a) |
1,015 | 1,912,007 | ||||||
| Baozun, Inc.—ADR(a)(c) |
2,722 | 86,342 | ||||||
| Etsy, Inc.(a) |
3,669 | 212,105 | ||||||
| Jumei International Holding Ltd.—ADR(a) |
8,955 | 173,458 | ||||||
| MonotaRO Co. Ltd.—ADR(c) |
9,748 | 215,333 | ||||||
| Pinduoduo, Inc.—ADR(a)(c) |
2,769 | 99,075 | ||||||
| Systemax, Inc. |
1,200 | 25,032 | ||||||
| WW Grainger, Inc. |
269 | 74,658 | ||||||
| 2,798,010 | ||||||||
| Nursing and Residential Care Facilities—0.09% |
||||||||
| Brookdale Senior Living, Inc.(a) |
21,853 | 143,574 | ||||||
| Ensign Group, Inc. |
6,630 | 295,036 | ||||||
| National HealthCare Corp. |
2,116 | 157,028 | ||||||
| Omnicell, Inc.(a) |
1,803 | 146,890 | ||||||
| 742,528 | ||||||||
The accompanying notes are an integral part of these financial statements.
59
| PMC DIVERSIFIED EQUITY FUND |
Schedule of Investments |
February 29, 2020 (Unaudited) (Continued)
| Shares |
Value |
|||||||
| Oil and Gas Extraction—1.67% |
||||||||
| Apache Corp. |
7,054 | $ | 175,786 | |||||
| Berry Corp. |
5,558 | 35,404 | ||||||
| Bonanza Creek Energy, Inc.(a) |
3,734 | 60,827 | ||||||
| Cabot Oil & Gas Corp.(c) |
13,095 | 182,413 | ||||||
| California Resources Corp.(a)(c) |
13,915 | 88,360 | ||||||
| Callon Petroleum Co.(a) |
37,087 | 84,187 | ||||||
| Chesapeake Energy Corp.(a) |
232,766 | 64,011 | ||||||
| Cimarex Energy Co. |
10,326 | 341,274 | ||||||
| CNOOC Ltd.—ADR |
997 | 137,915 | ||||||
| Continental Resources, Inc. |
6,641 | 125,847 | ||||||
| Devon Energy Corp. |
19,220 | 312,133 | ||||||
| Ecopetrol SA—ADR(c) |
15,975 | 281,959 | ||||||
| EOG Resources, Inc.(c) |
7,192 | 454,966 | ||||||
| EQT Corp.(c) |
17,965 | 105,455 | ||||||
| Gazprom Neft PJSC—ADR |
6,891 | 206,730 | ||||||
| Gulfport Energy Corp.(a)(c) |
55,707 | 45,657 | ||||||
| HighPoint Resources Corp.(a) |
20,895 | 14,223 | ||||||
| Laredo Petroleum, Inc.(a) |
10,979 | 11,857 | ||||||
| Montage Resources Corp.(a) |
14,353 | 50,092 | ||||||
| Northern Oil and Gas, Inc.(a) |
18,387 | 26,661 | ||||||
| Parsley Energy, Inc.—Class A |
6,385 | 85,559 | ||||||
| PDC Energy, Inc.(a) |
5,912 | 112,505 | ||||||
| Penn Virginia Corp.(a) |
1,010 | 16,059 | ||||||
| Petroleo Brasileiro SA—ADR |
6,602 | 79,884 | ||||||
| Phillips 66 |
8,321 | 622,910 | ||||||
| Range Resources Corp.(a)(c) |
23,145 | 64,112 | ||||||
| Repsol SA—ADR |
2,001 | 22,551 | ||||||
| Royal Dutch Shell PLC—Class B—ADR(c) |
54,746 | 2,437,840 | ||||||
| Royal Dutch Shell PLC—Class A—ADR(c) |
66,227 | 2,915,975 | ||||||
| SandRidge Energy, Inc.(a) |
9,183 | 18,917 | ||||||
| Santos Ltd.—ADR |
36,803 | 163,774 | ||||||
| Sasol Ltd.—ADR(c) |
8,738 | 107,914 | ||||||
| Southwestern Energy Co.(a)(c) |
87,212 | 123,841 | ||||||
| Surgutneftegas PJSC—ADR |
56,590 | 320,865 | ||||||
| Tatneft PJSC—ADR |
7,947 | 471,257 | ||||||
| TOTAL SA—ADR(c) |
67,017 | 2,891,114 | ||||||
| W&T Offshore, Inc.(a) |
19,608 | 50,981 | ||||||
| Woodside Petroleum Ltd.—ADR |
4,297 | 76,787 | ||||||
| WPX Energy, Inc.(a)(c) |
16,143 | 150,614 | ||||||
| 13,539,216 | ||||||||
| Other Information Services—0.72% |
||||||||
| Alibaba Group Holding Ltd.—ADR(a) |
12,871 | 2,677,169 | ||||||
| CoStar Group, Inc.(a) |
776 | 518,050 | ||||||
| Facebook, Inc.—Class A(a) |
9,224 | 1,775,343 | ||||||
| j2 Global, Inc. |
5,573 | 486,690 | ||||||
| LiveRamp Holdings, Inc.(a) |
2,224 | 78,819 | ||||||
| NIC, Inc. |
5,434 | 99,388 | ||||||
| Phoenix New Media Ltd.—ADR |
2,999 | 5,218 | ||||||
| Twitter, Inc.(a) |
7,087 | 235,288 | ||||||
| 5,875,965 | ||||||||
| Paper Manufacturing—0.23% |
||||||||
| Avid Bioservices, Inc.(a) |
5,841 | 36,798 | ||||||
The accompanying notes are an integral part of these financial statements.
60
| PMC DIVERSIFIED EQUITY FUND |
Schedule of Investments |
February 29, 2020 (Unaudited) (Continued)
| Shares |
Value |
|||||||
| Domtar Corp.(c) |
13,390 | $ | 385,230 | |||||
| Greif, Inc.—Class A |
2,640 | 93,298 | ||||||
| Greif, Inc.—Class B |
164 | 6,562 | ||||||
| Packaging Corp. of America(c) |
3,855 | 349,340 | ||||||
| Sonoco Products Co. |
7,244 | 349,233 | ||||||
| Svenska Cellulosa AB SCA—ADR |
28,803 | 273,168 | ||||||
| Verso Corp.—Class A(a)(c) |
8,122 | 132,470 | ||||||
| WestRock Co. |
7,174 | 238,536 | ||||||
| 1,864,635 | ||||||||
| Performing Arts, Spectator Sports, and Related Industries—0.18% |
||||||||
| Electronic Arts, Inc.(a) |
5,666 | 574,362 | ||||||
| Flutter Entertainment PLC—ADR |
2,585 | 137,380 | ||||||
| Live Nation Entertainment, Inc.(a) |
7,730 | 469,752 | ||||||
| MultiChoice Group—ADR(a) |
52 | 299 | ||||||
| TEGNA, Inc.(c) |
19,192 | 274,829 | ||||||
| 1,456,622 | ||||||||
| Personal and Laundry Services—0.11% |
||||||||
| Cintas Corp. |
2,254 | 601,232 | ||||||
| Park24 Co. Ltd.—ADR |
13,780 | 263,336 | ||||||
| Regis Corp.(a)(c) |
4,684 | 59,768 | ||||||
| 924,336 | ||||||||
| Petroleum and Coal Products Manufacturing—1.41% |
||||||||
| BP PLC—ADR |
82,582 | 2,583,992 | ||||||
| Carlisle Cos, Inc. |
3,915 | 568,810 | ||||||
| Chevron Corp. |
26,472 | 2,470,896 | ||||||
| CVR Energy, Inc. |
2,410 | 68,492 | ||||||
| Delek US Holdings, Inc.(c) |
3,703 | 79,170 | ||||||
| Eni SpA—ADR(c) |
20,740 | 518,500 | ||||||
| Equinor ASA—ADR(c) |
18,515 | 287,908 | ||||||
| Exxon Mobil Corp. |
48,040 | 2,471,179 | ||||||
| HollyFrontier Corp. |
4,552 | 153,311 | ||||||
| Marathon Oil Corp. |
53,257 | 440,968 | ||||||
| Marathon Petroleum Corp. |
2,882 | 136,664 | ||||||
| Murphy Oil Corp.(c) |
26,420 | 498,017 | ||||||
| OMV AG—ADR |
10,283 | 431,783 | ||||||
| PBF Energy, Inc.—Class A |
4,712 | 105,502 | ||||||
| Quaker Chemical Corp.(c) |
971 | 153,000 | ||||||
| Sinopec Shanghai Petrochemical Co. Ltd.—ADR |
519 | 13,203 | ||||||
| Valero Energy Corp. |
6,258 | 414,593 | ||||||
| WD-40 Co. |
333 | 57,439 | ||||||
| 11,453,427 | ||||||||
| Pipeline Transportation—0.08% |
||||||||
| ENN Energy Holdings Ltd.—ADR |
13,530 | 597,755 | ||||||
| Transportadora de Gas del Sur SA—Class B—ADR |
8,008 | 44,925 | ||||||
| YPF SA—ADR |
2,548 | 20,359 | ||||||
| 663,039 | ||||||||
| Plastics and Rubber Products Manufacturing—0.22% |
||||||||
| Advanced Drainage Systems, Inc. |
776 | 32,483 | ||||||
| Berry Global Group, Inc.(a) |
4,662 | 176,970 | ||||||
| Bridgestone Corp.—ADR |
72,006 | 1,186,659 | ||||||
The accompanying notes are an integral part of these financial statements.
61
| PMC DIVERSIFIED EQUITY FUND |
Schedule of Investments |
February 29, 2020 (Unaudited) (Continued)
| Shares |
Value |
|||||||
| Newell Brands, Inc. |
15,017 | $ | 231,712 | |||||
| Tredegar Corp. |
5,766 | 98,368 | ||||||
| UFP Technologies, Inc.(a) |
644 | 31,769 | ||||||
| 1,757,961 | ||||||||
| Postal Service—0.02% |
||||||||
| Royal Mail PLC—ADR |
44,550 | 185,885 | ||||||
| Primary Metal Manufacturing—1.10% |
||||||||
| AK Steel Holding Corp.(a)(c) |
46,176 | 106,667 | ||||||
| Alcoa Corp.(a) |
6,723 | 93,248 | ||||||
| Allegheny Technologies, Inc.(a)(c) |
16,806 | 287,215 | ||||||
| APERAM SA(b) |
10,881 | 329,912 | ||||||
| ArcelorMittal SA(b)(c) |
21,624 | 309,223 | ||||||
| Arconic, Inc. |
31,038 | 910,965 | ||||||
| Carpenter Technology Corp. |
10,118 | 371,837 | ||||||
| Cia Siderurgica Nacional SA—ADR(c) |
40,738 | 100,215 | ||||||
| Commercial Metals Co. |
17,290 | 315,715 | ||||||
| Corning, Inc.(c) |
31,606 | 754,119 | ||||||
| DMC Global, Inc.(c) |
1,080 | 38,945 | ||||||
| Encore Wire Corp. |
8,882 | 434,952 | ||||||
| Gibraltar Industries, Inc.(a) |
593 | 30,047 | ||||||
| Grupo Simec SAB de CV—ADR |
984 | 9,397 | ||||||
| Kaiser Aluminum Corp.(c) |
1,309 | 123,766 | ||||||
| Kubota Corp.—ADR |
10,755 | 757,582 | ||||||
| MMC Norilsk Nickel PJSC—ADR |
11,399 | 345,618 | ||||||
| Nippon Steel Corp.—ADR |
41,355 | 444,794 | ||||||
| Nucor Corp. |
18,346 | 758,606 | ||||||
| Ossen Innovation Co. Ltd.—ADR(a) |
2,859 | 7,691 | ||||||
| Reliance Steel & Aluminum Co. |
12,441 | 1,272,590 | ||||||
| Steel Dynamics, Inc. |
10,696 | 284,834 | ||||||
| Sumitomo Metal Mining Co. Ltd.—ADR |
70,579 | 427,003 | ||||||
| SunCoke Energy, Inc. |
8,352 | 38,503 | ||||||
| Ternium SA—ADR(c) |
8,291 | 146,751 | ||||||
| United States Steel Corp.(c) |
20,726 | 166,223 | ||||||
| Usinas Siderurgicas de Minas Gerais SA Usiminas—ADR(c) |
16,982 | 29,549 | ||||||
| Viavi Solutions, Inc.(a) |
4,202 | 55,424 | ||||||
| 8,951,391 | ||||||||
| Printing and Related Support Activities—0.18% |
||||||||
| Centennial Resource Development, Inc.—Class A(a) |
58,948 | 139,707 | ||||||
| Dai Nippon Printing Co. Ltd.—ADR |
23,314 | 277,437 | ||||||
| Ennis, Inc.(c) |
14,430 | 290,043 | ||||||
| Toppan Printing Co. Ltd.—ADR |
83,453 | 716,026 | ||||||
| 1,423,213 | ||||||||
| Professional, Scientific, and Technical Services—3.57% |
||||||||
| AECOM(a) |
18,645 | 837,906 | ||||||
| AirNet Technology, Inc.—ADR(a) |
417 | 388 | ||||||
| Akari Therapeutics PLC—ADR(a) |
24,589 | 45,244 | ||||||
| Alteryx, Inc.—Class A(a)(c) |
2,556 | 356,869 | ||||||
| Amdocs Ltd.(b) |
5,739 | 365,861 | ||||||
| Avita Medical Ltd.—ADR(a)(c) |
39,608 | 304,586 | ||||||
| Booz Allen Hamilton Holding Corp. |
13,180 | 939,733 | ||||||
| CACI International, Inc.—Class A(a) |
3,624 | 887,952 | ||||||
| CBIZ, Inc.(a) |
1,862 | 48,486 | ||||||
The accompanying notes are an integral part of these financial statements.
62
| PMC DIVERSIFIED EQUITY FUND |
Schedule of Investments |
February 29, 2020 (Unaudited) (Continued)
| Shares |
Value |
|||||||
| CDW Corp. |
12,005 | $ | 1,371,210 | |||||
| Cerner Corp. |
8,603 | 595,930 | ||||||
| CGG SA—ADR(a) |
3,074 | 8,146 | ||||||
| Charles River Labratories International, Inc.(a) |
1,598 | 248,601 | ||||||
| Cheetah Mobile, Inc.—ADR |
25,466 | 74,106 | ||||||
| Codexis, Inc.(a) |
2,512 | 29,265 | ||||||
| Cognizant Technology Solutions Corp.—Class A |
11,332 | 690,459 | ||||||
| Collectors Universe, Inc. |
1,342 | 30,873 | ||||||
| Computer Programs & Systems, Inc.(c) |
2,356 | 63,094 | ||||||
| Cytokinetics, Inc.(a)(c) |
5,243 | 73,087 | ||||||
| Diebold Nixdorf, Inc.(a) |
2,814 | 19,754 | ||||||
| DXC Technology Co. |
15,490 | 373,464 | ||||||
| eBay, Inc. |
6,288 | 217,816 | ||||||
| Endava PLC—ADR(a) |
3,154 | 167,320 | ||||||
| EPAM Systems, Inc.(a) |
4,331 | 966,678 | ||||||
| Evotec SE—ADR(a) |
4,628 | 217,516 | ||||||
| Exact Sciences Corp.(a)(c) |
3,057 | 247,464 | ||||||
| Exelixis, Inc.(a) |
23,082 | 429,094 | ||||||
| Experian PLC—ADR |
19,078 | 638,922 | ||||||
| F5 Networks, Inc.(a) |
4,971 | 596,271 | ||||||
| FTI Consulting, Inc.(a)(c) |
4,740 | 533,677 | ||||||
| Fujitsu Ltd.—ADR |
40,559 | 835,515 | ||||||
| Galapagos NV—ADR(a)(c) |
2,201 | 465,204 | ||||||
| Genmab A/S—ADR(a) |
27,780 | 632,828 | ||||||
| Genpact Ltd.(b) |
14,640 | 563,054 | ||||||
| Gravity Co. Ltd.—ADR |
10,048 | 276,320 | ||||||
| H&R Block, Inc.(c) |
14,066 | 290,745 | ||||||
| Hong Kong Television Network Ltd.—ADR(a) |
19,710 | 218,978 | ||||||
| Imperial Holdings Ltd.—ADR |
25,076 | 72,094 | ||||||
| Industria de Diseno Textil SA—ADR |
22,076 | 344,165 | ||||||
| Infosys Ltd.—ADR |
43,791 | 440,975 | ||||||
| Insperity, Inc. |
1,352 | 90,949 | ||||||
| Intelligent Systems Corp.(a)(c) |
1,549 | 56,802 | ||||||
| International Business Machines Corp. |
5,834 | 759,295 | ||||||
| International Paper Co. |
10,748 | 397,246 | ||||||
| Invitae Corp.(a)(c) |
5,612 | 114,373 | ||||||
| Jacobs Engineering Group, Inc. |
11,573 | 1,068,651 | ||||||
| Jardine Strategic Holdings Ltd.—ADR |
156 | 2,254 | ||||||
| Leidos Holdings, Inc. |
13,887 | 1,425,501 | ||||||
| Materialise NV—ADR(a)(c) |
10,615 | 175,572 | ||||||
| MAXIMUS, Inc. |
5,943 | 374,528 | ||||||
| Midatech Pharma PLC—ADR(a) |
17,850 | 9,104 | ||||||
| Mitie Group PLC—ADR |
10,272 | 70,980 | ||||||
| Mobile Mini, Inc. |
210 | 8,188 | ||||||
| Momo, Inc.—ADR |
1,043 | 29,329 | ||||||
| MorphoSys AG—ADR(a) |
2,855 | 76,200 | ||||||
| NanoString Technologies, Inc.(a) |
1,984 | 70,749 | ||||||
| Naspers Ltd.—ADR |
19,608 | 611,181 | ||||||
| National CineMedia, Inc. |
5,944 | 45,709 | ||||||
| National Research Corp. |
795 | 43,717 | ||||||
| NeoGenomics, Inc.(a)(c) |
8,835 | 250,296 | ||||||
| NextGen Healthcare, Inc.(a) |
8,300 | 108,564 | ||||||
| Nice Ltd.—ADR(a) |
2,581 | 422,845 | ||||||
| NuCana PLC—ADR(a) |
1,394 | 5,729 | ||||||
The accompanying notes are an integral part of these financial statements.
63
| PMC DIVERSIFIED EQUITY FUND |
Schedule of Investments |
February 29, 2020 (Unaudited) (Continued)
| Shares |
Value |
|||||||
| Okta, Inc.(a) |
3,035 | $ | 388,662 | |||||
| Omnicom Group, Inc.(c) |
9,092 | 629,894 | ||||||
| Perficient, Inc.(a) |
11,757 | 481,684 | ||||||
| Pfenex, Inc.(a) |
3,916 | 45,426 | ||||||
| Resources Connection, Inc. |
12,063 | 151,149 | ||||||
| Rightmove PLC—ADR |
12,366 | 197,933 | ||||||
| ServiceNow, Inc.(a) |
2,309 | 752,942 | ||||||
| Summit Therapeutics PLC—ADR(a) |
3,313 | 4,572 | ||||||
| Sykes Enterprises, Inc.(a) |
5,820 | 184,378 | ||||||
| Syneos Health, Inc.(a)(c) |
5,244 | 332,207 | ||||||
| Telia Co. AB—ADR |
84,564 | 666,364 | ||||||
| Timken Co. |
14,828 | 664,888 | ||||||
| Trade Desk, Inc.—Class A(a)(c) |
1,215 | 349,009 | ||||||
| Travelzoo(a) |
4,788 | 39,166 | ||||||
| Ubiquiti, Inc.(c) |
2,010 | 272,677 | ||||||
| Unisys Corp.(a) |
11,943 | 185,475 | ||||||
| Verint Systems, Inc.(a) |
6,303 | 345,909 | ||||||
| VMware, Inc.—Class A(a)(c) |
2,067 | 249,115 | ||||||
| VTech Holdings Ltd.—ADR |
19,571 | 171,051 | ||||||
| Wipro Ltd.—ADR(c) |
90,853 | 313,443 | ||||||
| Yiren Digital Ltd.—ADR(a) |
11,261 | 46,846 | ||||||
| Zealand Pharma A/S—ADR(a)(c) |
13,995 | 464,214 | ||||||
| Zscaler, Inc.(a) |
4,823 | 250,748 | ||||||
| 28,925,164 | ||||||||
| Publishing Industries (except Internet)—3.76% |
||||||||
| Activision Blizzard, Inc. |
31,962 | 1,857,951 | ||||||
| Adobe, Inc.(a) |
1,311 | 452,452 | ||||||
| Akamai Technologies, Inc.(a) |
4,649 | 402,185 | ||||||
| ANSYS, Inc.(a) |
1,967 | 476,388 | ||||||
| Appfolio, Inc.—Class A(a)(c) |
2,921 | 359,195 | ||||||
| Avalara, Inc.(a) |
3,524 | 298,659 | ||||||
| Avid Technology, Inc.(a)(c) |
11,481 | 84,845 | ||||||
| Cadence Design System, Inc.(a) |
12,380 | 818,813 | ||||||
| Changyou.com Ltd.—ADR(c) |
15,404 | 165,747 | ||||||
| Citrix Systems, Inc. |
2,991 | 309,239 | ||||||
| Coupa Software, Inc.(a) |
1,305 | 195,424 | ||||||
| Fair Isaac Corp.(a) |
2,172 | 816,737 | ||||||
| Inseego Corp.(a)(c) |
7,833 | 54,361 | ||||||
| Intuit, Inc. |
2,012 | 534,890 | ||||||
| Konami Holdings Corp.—ADR |
13,812 | 485,768 | ||||||
| Manhattan Associates, Inc.(a)(c) |
3,243 | 218,448 | ||||||
| Meredith Corp.(c) |
6,477 | 170,669 | ||||||
| Microsoft Corp. |
77,084 | 12,488,380 | ||||||
| MiX Telematics Ltd.—ADR |
7,087 | 94,044 | ||||||
| New York Times Co.—Class A(c) |
24,093 | 902,524 | ||||||
| News Corp.—Class B(c) |
15,766 | 196,129 | ||||||
| NortonLifeLock, Inc. |
33,497 | 637,448 | ||||||
| Nuance Communications, Inc.(a)(c) |
23,606 | 510,362 | ||||||
| Opera Ltd.—ADR(a) |
3,063 | 24,749 | ||||||
| Oracle Corp. |
45,152 | 2,233,218 | ||||||
| Paycom Software, Inc.(a)(c) |
1,891 | 534,491 | ||||||
| RELX PLC—ADR(c) |
22,434 | 541,781 | ||||||
| Sage Group PLC—ADR |
19,524 | 700,131 | ||||||
| Scholastic Corp. |
4,387 | 140,779 | ||||||
The accompanying notes are an integral part of these financial statements.
64
| PMC DIVERSIFIED EQUITY FUND |
Schedule of Investments |
February 29, 2020 (Unaudited) (Continued)
| Shares |
Value |
|||||||
| Snap, Inc.—Class A(a) |
11,590 | $ | 164,230 | |||||
| SPS Commerce, Inc.(a) |
3,118 | 164,007 | ||||||
| SS&C Technologies Holdings, Inc. |
4,242 | 235,431 | ||||||
| Synopsys, Inc.(a) |
10,960 | 1,511,713 | ||||||
| Trend Micro, Inc.—ADR(c) |
7,204 | 353,572 | ||||||
| Veeva Systems, Inc.—Class A(a) |
5,813 | 825,272 | ||||||
| Vipshop Holdings Ltd.—ADR(a) |
11,988 | 153,806 | ||||||
| Wolters Kluwer NV—ADR |
5,051 | 368,571 | ||||||
| 30,482,409 | ||||||||
| Rail Transportation—0.59% |
||||||||
| Central Japan Railway Co.—ADR |
80,351 | 1,304,900 | ||||||
| CSX Corp.(c) |
1,606 | 113,143 | ||||||
| East Japan Railway Co.—ADR |
101,518 | 1,276,081 | ||||||
| Kansas City Southern |
1,151 | 173,433 | ||||||
| Norfolk Southern Corp. |
2,515 | 458,610 | ||||||
| Union Pacific Corp. |
2,954 | 472,079 | ||||||
| West Japan Railway Co.—ADR |
13,915 | 951,090 | ||||||
| 4,749,336 | ||||||||
| Real Estate—0.71% |
||||||||
| American Finance Trust, Inc. |
5,834 | 60,674 | ||||||
| Bank of America Corp. |
86,518 | 2,465,763 | ||||||
| CBRE Group, Inc.—Class A(a) |
16,552 | 929,230 | ||||||
| China Overseas Land & Investment Ltd.—ADR |
8,720 | 146,302 | ||||||
| Forestar Group, Inc.(a) |
1,102 | 19,715 | ||||||
| Gafisa SA—ADR |
140 | 434 | ||||||
| Hang Lung Properties Ltd.—ADR(c) |
4,069 | 44,840 | ||||||
| Henderson Land Development Co. Ltd.—ADR |
34,064 | 155,672 | ||||||
| IRSA Propiedades Comerciales SA—ADR |
2,564 | 30,383 | ||||||
| Jones Lang LaSalle, Inc. |
554 | 81,865 | ||||||
| Marcus & Millichap, Inc.(a) |
810 | 25,888 | ||||||
| Mitsubishi Estate Co. Ltd.—ADR |
54,764 | 919,487 | ||||||
| New World Development Co. Ltd.—ADR |
165,517 | 421,241 | ||||||
| Newmark Group, Inc. |
12,968 | 123,844 | ||||||
| Walker & Dunlop, Inc. |
5,506 | 357,064 | ||||||
| 5,782,402 | ||||||||
| Religious, Grantmaking, Civic, Professional, and Similar Organizations—0.02% |
||||||||
| HealthEquity, Inc.(a) |
2,799 | 198,701 | ||||||
| Rental and Leasing Services—0.65% |
||||||||
| Air Lease Corp. |
5,454 | 209,215 | ||||||
| Aircastle Ltd.(b) |
19,723 | 628,178 | ||||||
| Ally Financial, Inc.(c) |
54,299 | 1,361,276 | ||||||
| Brambles Ltd.—ADR(c) |
45,830 | 706,240 | ||||||
| Cerence, Inc.(a) |
2,096 | 45,504 | ||||||
| Fly Leasing Ltd.—ADR(a) |
21,811 | 372,968 | ||||||
| GATX Corp.(c) |
500 | 35,765 | ||||||
| Harsco Corp.(a) |
2,576 | 30,886 | ||||||
| Localiza Rent a Car SA—ADR |
4,344 | 47,226 | ||||||
| McGrath RentCorp. |
1,262 | 87,646 | ||||||
| Navient Corp. |
32,786 | 368,187 | ||||||
| Synchrony Financial |
32,234 | 938,010 | ||||||
| Triton International Ltd.(b) |
10,189 | 350,196 | ||||||
The accompanying notes are an integral part of these financial statements.
65
| PMC DIVERSIFIED EQUITY FUND |
Schedule of Investments |
February 29, 2020 (Unaudited) (Continued)
| Shares |
Value |
|||||||
| United Rentals, Inc.(a) |
1,018 | $ | 134,865 | |||||
| 5,316,162 | ||||||||
| Repair and Maintenance—0.10% |
||||||||
| SKF AB—ADR(c) |
45,518 | 809,765 | ||||||
| Securities, Commodity Contracts, and Other Financial Investments and Related Activities—2.41% |
|
|||||||
| Amarin Corp. PLC—ADR(a)(c) |
19,124 | 280,549 | ||||||
| Ameriprise Financial, Inc. |
6,291 | 888,918 | ||||||
| Aramark |
7,150 | 248,391 | ||||||
| Artisan Partners Asset Management, Inc.—Class A |
10,032 | 286,715 | ||||||
| BB Seguridade Participacoes SA—ADR |
18,575 | 132,068 | ||||||
| Bidvest Group Ltd.—ADR |
8,764 | 202,834 | ||||||
| BlackRock, Inc. |
491 | 227,338 | ||||||
| Blackstone Group, Inc.—Class A |
7,813 | 420,652 | ||||||
| Brightsphere Investment Group, Inc. |
14,791 | 138,296 | ||||||
| CK Hutchison Holdings Ltd.—ADR(c) |
38,020 | 330,394 | ||||||
| CME Group, Inc. |
2,002 | 398,038 | ||||||
| Cowen, Inc.—Class A(c) |
13,240 | 198,203 | ||||||
| Credit Agricole SA—ADR |
139,863 | 826,590 | ||||||
| Credit Suisse Group AG—ADR |
370 | 4,174 | ||||||
| Daiwa Securities Group, Inc.—ADR |
96,847 | 397,073 | ||||||
| Delek Group Ltd.—ADR(c) |
23,324 | 224,144 | ||||||
| Deutsche Boerse AG—ADR |
50,583 | 791,624 | ||||||
| Fidelity National Financial, Inc. |
12,045 | 466,864 | ||||||
| First Pacific Co. Ltd.—ADR |
330,256 | 450,139 | ||||||
| GDS Holdings Ltd.—ADR(a)(c) |
2,033 | 117,853 | ||||||
| Genting Bhd—ADR |
15,121 | 88,789 | ||||||
| Gilead Sciences, Inc. |
2,220 | 153,979 | ||||||
| Goldman Sachs Group, Inc. |
3,079 | 618,171 | ||||||
| Hexindai, Inc.—ADR(a) |
193 | 89 | ||||||
| Hong Kong Exchanges & Clearing Ltd.—ADR |
44,291 | 1,451,858 | ||||||
| Huami Corp.—ADR(a) |
9,440 | 134,048 | ||||||
| KKR & Co, Inc.—Class A |
15,713 | 449,392 | ||||||
| Legg Mason, Inc. |
9,768 | 486,642 | ||||||
| Leju Holdings Ltd.—ADR(a) |
35,863 | 64,557 | ||||||
| LexinFintech Holdings Ltd.—ADR(a)(c) |
10,325 | 120,183 | ||||||
| LPL Financial Holdings, Inc. |
11,877 | 943,984 | ||||||
| MarketAxess Holdings, Inc. |
1,703 | 552,334 | ||||||
| Morgan Stanley |
34,935 | 1,573,123 | ||||||
| MSCI, Inc. |
4,246 | 1,254,437 | ||||||
| NASDAQ, Inc. |
1,060 | 108,703 | ||||||
| Noah Holdings Ltd.—ADR(a) |
14 | 397 | ||||||
| OneSmart International Education Group Ltd.—ADR(a) |
4,412 | 24,001 | ||||||
| Oppenheimer Holdings, Inc.—Class A |
9,423 | 223,608 | ||||||
| Piper Jaffray Cos. |
3,609 | 252,919 | ||||||
| Raymond James Financial, Inc. |
5,018 | 419,655 | ||||||
| RISE Education Cayman Ltd.—ADR(a) |
9,517 | 52,724 | ||||||
| S&P Global, Inc. |
1,494 | 397,270 | ||||||
| Sea Ltd.—ADR(a)(c) |
8,479 | 382,064 | ||||||
| Secoo Holding Ltd.—ADR(a) |
4,316 | 23,738 | ||||||
| Sibanye Stillwater Ltd.—ADR |
8,915 | 75,421 | ||||||
| Singapore Exchange Ltd.—ADR |
9,230 | 841,730 | ||||||
| Southwest Airlines Co. |
3,345 | 154,506 | ||||||
The accompanying notes are an integral part of these financial statements.
66
| PMC DIVERSIFIED EQUITY FUND |
Schedule of Investments |
February 29, 2020 (Unaudited) (Continued)
| Shares |
Value |
|||||||
| Stifel Financial Corp. |
15,701 | $ | 854,761 | |||||
| T Rowe Price Group, Inc. |
4,032 | 475,816 | ||||||
| TD Ameritrade Holding Corp. |
2,394 | 101,099 | ||||||
| TechnoPro Holdings, Inc.—ADR(c) |
21,432 | 249,683 | ||||||
| WH Group Ltd.—ADR |
1,439 | 29,284 | ||||||
| 19,589,822 | ||||||||
| Specialty Trade Contractors—0.36% |
||||||||
| Comfort Systems USA, Inc. |
3,966 | 167,445 | ||||||
| EMCOR Group, Inc. |
8,437 | 648,974 | ||||||
| Legrand SA—ADR(c) |
11,695 | 178,115 | ||||||
| NetEase, Inc.—ADR |
2,554 | 813,985 | ||||||
| Quanta Services, Inc. |
29,094 | 1,109,354 | ||||||
| 2,917,873 | ||||||||
| Sporting Goods, Hobby, Musical Instrument, and Book Stores—0.06% |
||||||||
| Barnes & Noble Education, Inc.(a) |
24,403 | 80,774 | ||||||
| Dick’s Sporting Goods, Inc. |
9,165 | 333,698 | ||||||
| Sportsman’s Warehouse Holdings, Inc.(a) |
7,207 | 43,242 | ||||||
| 457,714 | ||||||||
| Support Activities for Agriculture and Forestry—0.00% |
||||||||
| VEON Ltd.—ADR |
8,600 | 17,028 | ||||||
| Support Activities for Mining—1.32% |
||||||||
| Antero Resources Corp.(a)(c) |
136,295 | 218,072 | ||||||
| BHP Group Ltd.—ADR(c) |
30,690 | 1,329,184 | ||||||
| China Shenhua Energy Co. Ltd.—ADR(c) |
1,501 | 10,357 | ||||||
| Cleveland-Cliffs, Inc.(c) |
23,748 | 137,976 | ||||||
| ConocoPhillips |
30,723 | 1,487,608 | ||||||
| Denbury Resources, Inc.(a)(c) |
47,688 | 35,880 | ||||||
| Extraction Oil & Gas, Inc.(a)(c) |
13,969 | 9,618 | ||||||
| Fortescue Metals Group Ltd.—ADR |
36,281 | 468,025 | ||||||
| Gazprom PJSC—ADR(c) |
136,672 | 833,699 | ||||||
| Helmerich & Payne, Inc. |
2,632 | 97,094 | ||||||
| Hess Corp. |
5,378 | 302,136 | ||||||
| Impala Platinum Holdings Ltd.—ADR(a) |
17,394 | 135,325 | ||||||
| Inpex Corp.—ADR |
43,746 | 361,342 | ||||||
| Liberty Oilfield Services, Inc.—Class A |
2,143 | 14,337 | ||||||
| LUKOIL PJSC—ADR |
12,047 | 1,040,138 | ||||||
| Mammoth Energy Services, Inc.(a) |
9,581 | 10,443 | ||||||
| Nabors Industries Ltd.(b) |
7,184 | 12,644 | ||||||
| NexTier Oilfield Solutions, Inc.(a) |
15,334 | 71,456 | ||||||
| Noble Energy, Inc. |
3,195 | 50,577 | ||||||
| ONE Gas, Inc. |
2,421 | 198,861 | ||||||
| Pampa Energia SA—ADR(a) |
2,636 | 31,237 | ||||||
| Patterson-UTI Energy, Inc. |
37,020 | 212,125 | ||||||
| PGS ASA—ADR(a) |
29,132 | 38,163 | ||||||
| Pioneer Natural Resources Co. |
2,498 | 306,704 | ||||||
| ProPetro Holding Corp.(a) |
13,645 | 119,530 | ||||||
| Rio Tinto PLC—ADR |
36,828 | 1,728,339 | ||||||
| South32 Ltd.—ADR |
62,980 | 445,269 | ||||||
| Targa Resources Corp. |
1,786 | 57,866 | ||||||
| Tullow Oil PLC—ADR |
50,158 | 9,901 | ||||||
| Vale SA—ADR |
23,587 | 231,624 | ||||||
The accompanying notes are an integral part of these financial statements.
67
| PMC DIVERSIFIED EQUITY FUND |
Schedule of Investments |
February 29, 2020 (Unaudited) (Continued)
| Shares |
Value |
|||||||
| Wesfarmers Ltd.—ADR(c) |
56,359 | $ | 732,667 | |||||
| 10,738,197 | ||||||||
| Support Activities for Transportation—0.24% |
||||||||
| CH Robinson Worldwide, Inc.(c) |
2,004 | 138,076 | ||||||
| DSV PANALPINA A/S—ADR |
12,115 | 611,686 | ||||||
| Grupo Aeroportuario del Centro Norte SAB de CV—ADR |
2,770 | 144,262 | ||||||
| Hub Group, Inc.—Class A(a) |
7,204 | 333,041 | ||||||
| Japan Airport Terminal Co. Ltd.—ADR |
11,258 | 215,140 | ||||||
| Matson, Inc. |
1,420 | 47,158 | ||||||
| Radiant Logistics, Inc.(a) |
32,967 | 145,055 | ||||||
| XPO Logistics, Inc.(a) |
4,518 | 334,196 | ||||||
| 1,968,614 | ||||||||
| Telecommunications—4.23% |
||||||||
| 58.com, Inc.—ADR(a)(c) |
3,402 | 187,688 | ||||||
| Acacia Communications, Inc.(a) |
1,365 | 93,516 | ||||||
| Advanced Info Service PCL—ADR |
704 | 4,460 | ||||||
| America Movil SAB de CV—Class A—ADR |
1,192 | 18,297 | ||||||
| America Movil SAB de CV—Class L—ADR |
12,341 | 195,975 | ||||||
| AT&T, Inc. |
114,634 | 4,037,408 | ||||||
| Broadcom, Inc. |
6,048 | 1,648,806 | ||||||
| CenturyLink, Inc.(c) |
57,303 | 691,647 | ||||||
| China Mobile Ltd.—ADR |
11,545 | 459,722 | ||||||
| China Telecom Corp. Ltd.—ADR(c) |
11,449 | 433,574 | ||||||
| China Unicom Hong Kong Ltd.—ADR(c) |
13,336 | 106,955 | ||||||
| Chorus Ltd.—ADR |
11,119 | 224,048 | ||||||
| Chunghwa Telecom Co. Ltd.—ADR |
7,640 | 268,622 | ||||||
| Cogent Communications Holdings, Inc. |
4,425 | 323,069 | ||||||
| Deutsche Telekom AG—ADR |
35,479 | 577,598 | ||||||
| Edenred—ADR |
4,517 | 119,980 | ||||||
| Fluent, Inc.(a) |
24,883 | 57,977 | ||||||
| GCI Liberty, Inc.—Class A(a)(c) |
13,920 | 962,011 | ||||||
| Gogo, Inc.(a) |
5,124 | 18,498 | ||||||
| Hellenic Telecommunications Organization SA—ADR |
22,389 | 154,484 | ||||||
| IDT Corp.—Class B(a) |
5,413 | 41,680 | ||||||
| Integer Holdings Corp.(a) |
5,443 | 490,795 | ||||||
| Iridium Communications, Inc.(a) |
2,558 | 69,245 | ||||||
| JD.com, Inc.—ADR(a) |
22,501 | 866,514 | ||||||
| JOYY, Inc.—ADR(a)(c) |
2,503 | 135,087 | ||||||
| KDDI Corp.—ADR |
89,899 | 1,258,586 | ||||||
| Koninklijke KPN NV—ADR |
195,901 | 477,998 | ||||||
| Magyar Telekom Telecommunications PLC—ADR |
26,554 | 174,805 | ||||||
| Mobile TeleSystems PJSC—ADR |
45,704 | 443,329 | ||||||
| MTN Group Ltd.—ADR |
55,655 | 263,248 | ||||||
| Nippon Telegraph & Telephone Corp.—ADR |
34,818 | 810,563 | ||||||
| NTT DOCOMO, Inc.—ADR(c) |
40,351 | 1,083,424 | ||||||
| Partner Communications Co. Ltd.—ADR(a) |
24,328 | 110,936 | ||||||
| PayPal Holdings, Inc.(a) |
9,334 | 1,007,979 | ||||||
| PCCW Ltd.—ADR |
76,939 | 457,787 | ||||||
| PLDT, Inc.—ADR |
8,053 | 153,007 | ||||||
| Renren, Inc.—ADR(a) |
43,107 | 55,393 | ||||||
| RingCentral, Inc.—Class A(a) |
393 | 92,650 | ||||||
| Rostelecom PJSC—ADR(a) |
41,777 | 302,883 | ||||||
| SK Telecom Co. Ltd.—ADR |
12,340 | 237,051 | ||||||
The accompanying notes are an integral part of these financial statements.
68
| PMC DIVERSIFIED EQUITY FUND |
Schedule of Investments |
February 29, 2020 (Unaudited) (Continued)
| Shares |
Value |
|||||||
| SoftBank Group Corp.—ADR |
85,651 | $ | 1,969,973 | |||||
| Spark New Zealand Ltd.—ADR |
2,115 | 29,589 | ||||||
| Swisscom AG—ADR |
9,515 | 508,101 | ||||||
| Telecom Argentina SA—ADR |
1,653 | 19,175 | ||||||
| Telefonica SA—ADR |
194,093 | 1,147,090 | ||||||
| Telekomunikasi Indonesia Persero Tbk PT—ADR(c) |
24,042 | 583,019 | ||||||
| Telenor ASA—ADR |
47,270 | 761,047 | ||||||
| Telephone & Data Systems, Inc. |
26,438 | 532,461 | ||||||
| Telstra Corp. Ltd.—ADR |
34,532 | 380,888 | ||||||
| Tencent Holdings Ltd.—ADR |
53,690 | 2,665,709 | ||||||
| T-Mobile US, Inc.(a) |
14,296 | 1,288,928 | ||||||
| Turkcell Iletisim Hizmetleri AS—ADR |
29,257 | 159,743 | ||||||
| Twilio, Inc.—Class A(a)(c) |
1,679 | 189,123 | ||||||
| United States Cellular Corp.(a) |
18,140 | 569,777 | ||||||
| Verizon Communications, Inc. |
66,087 | 3,579,272 | ||||||
| Vodacom Group Ltd.—ADR(c) |
8,358 | 59,760 | ||||||
| Vodafone Group PLC—ADR(c) |
24,031 | 420,543 | ||||||
| XL Axiata Tbk PT—ADR(a) |
26,727 | 92,208 | ||||||
| Zayo Group Holdings, Inc.(a) |
7,761 | 271,557 | ||||||
| 34,345,258 | ||||||||
| Textile Mills—0.01% |
||||||||
| Albany International Corp.—Class A |
1,171 | 75,026 | ||||||
| Textile Product Mills—0.09% |
||||||||
| Hermes International—ADR(c) |
9,273 | 650,223 | ||||||
| Tempur Sealy International, Inc.(a) |
1,280 | 95,680 | ||||||
| 745,903 | ||||||||
| Transportation Equipment Manufacturing—2.67% |
||||||||
| Airbus SE—ADR(c) |
24,451 | 726,684 | ||||||
| Aisin Seiki Co. Ltd.—ADR |
13,207 | 420,181 | ||||||
| Aptiv PLC(b) |
371 | 28,979 | ||||||
| Astronics Corp.(a) |
2,493 | 50,533 | ||||||
| Autohome, Inc.—ADR |
1,691 | 131,340 | ||||||
| BorgWarner, Inc.(c) |
22,174 | 700,698 | ||||||
| Brilliance China Automotive Holdings Ltd.—ADR |
3,034 | 25,819 | ||||||
| Commercial Vehicle Group, Inc.(a) |
10,453 | 45,575 | ||||||
| Dana, Inc. |
15,332 | 220,474 | ||||||
| Denso Corp.—ADR |
37,311 | 716,372 | ||||||
| Ford Motor Co.(c) |
42,304 | 294,436 | ||||||
| Ford Otomotiv Sanayi AS—ADR |
2,802 | 171,384 | ||||||
| Fox Factory Holding Corp.(a)(c) |
1,830 | 116,022 | ||||||
| General Dynamics Corp. |
1,140 | 182,047 | ||||||
| General Motors Co. |
29,507 | 899,964 | ||||||
| Gentex Corp. |
18,268 | 487,756 | ||||||
| Great Wall Motor Co. Ltd.—ADR |
36,116 | 260,035 | ||||||
| HEICO Corp.(c) |
2,255 | 243,202 | ||||||
| HEICO Corp.—Class A |
2,803 | 247,589 | ||||||
| Honda Motor Co. Ltd.—ADR |
24,990 | 641,243 | ||||||
| Isuzu Motors Ltd.—ADR |
31,571 | 289,822 | ||||||
| Kawasaki Heavy Industries Ltd.—ADR |
32,617 | 234,109 | ||||||
| LCI Industries |
1,128 | 108,908 | ||||||
| Lear Corp.(c) |
4,022 | 447,246 | ||||||
| Leonardo SpA—ADR |
66,362 | 333,801 | ||||||
The accompanying notes are an integral part of these financial statements.
69
| PMC DIVERSIFIED EQUITY FUND |
Schedule of Investments |
February 29, 2020 (Unaudited) (Continued)
| Shares |
Value |
|||||||
| Lockheed Martin Corp. |
3,034 | $ | 1,122,185 | |||||
| MasterCraft Boat Holdings, Inc.(a) |
4,228 | 68,367 | ||||||
| Mazda Motor Corp.—ADR |
62,710 | 210,706 | ||||||
| Meritor, Inc.(a) |
6,784 | 153,929 | ||||||
| Miller Industries, Inc. |
4,425 | 131,467 | ||||||
| Modine Manufacturing Co.(a) |
8,615 | 64,268 | ||||||
| MTU Aero Engines AG—ADR |
3,302 | 395,778 | ||||||
| Navistar International Corp.(a) |
4,220 | 153,228 | ||||||
| Oshkosh Corp. |
10,550 | 761,183 | ||||||
| PACCAR, Inc. |
15,902 | 1,063,844 | ||||||
| Shimano, Inc.—ADR(c) |
54,385 | 750,513 | ||||||
| Subaru Corp.—ADR(c) |
27,324 | 325,156 | ||||||
| Suzuki Motor Corp.—ADR(c) |
3,042 | 481,883 | ||||||
| Tata Motors Ltd.—ADR(a) |
17,742 | 162,517 | ||||||
| Tesla, Inc.(a) |
491 | 327,983 | ||||||
| Thor Industries, Inc.(c) |
2,265 | 170,804 | ||||||
| Toyota Industries Corp.—ADR |
10,515 | 532,269 | ||||||
| Toyota Motor Corp.—ADR |
32,323 | 4,226,231 | ||||||
| United Technologies Corp. |
5,733 | 748,671 | ||||||
| Volvo AB—ADR |
99,201 | 1,556,463 | ||||||
| Winnebago Industries, Inc.(c) |
4,675 | 242,586 | ||||||
| 21,674,250 | ||||||||
| Truck Transportation—0.17% |
||||||||
| ArcBest Corp. |
2,467 | 48,871 | ||||||
| Knight-Swift Transportation Holdings, Inc.(c) |
9,926 | 317,036 | ||||||
| Landstar System, Inc. |
3,982 | 402,063 | ||||||
| Old Dominion Freight Lines, Inc. |
1,422 | 275,584 | ||||||
| US Xpress Enterprises, Inc.—Class A(a) |
7,728 | 33,308 | ||||||
| Werner Enterprises, Inc. |
9,454 | 317,654 | ||||||
| 1,394,516 | ||||||||
| Utilities—3.27% |
||||||||
| AES Corp. |
48,811 | 816,608 | ||||||
| AGL Energy Ltd.—ADR(c) |
41,452 | 509,445 | ||||||
| Alliant Energy Corp. |
4,013 | 209,158 | ||||||
| Ameren Corp. |
8,699 | 687,221 | ||||||
| American Electric Power Co., Inc. |
5,318 | 474,685 | ||||||
| Atlantic Power Corp.(a)(b) |
22,804 | 51,765 | ||||||
| Avista Corp. |
3,564 | 168,043 | ||||||
| Black Hills Corp. |
7,215 | 520,923 | ||||||
| Central Puerto SA—ADR |
5,948 | 19,272 | ||||||
| Centrica PLC—ADR |
5,324 | 19,912 | ||||||
| Cia de Saneamento Basico do Estado de Sao Paulo—ADR |
7,818 | 101,869 | ||||||
| Cia Energetica de Minas Gerais—ADR |
2,338 | 7,365 | ||||||
| Cia Paranaense de Energia—ADR |
10,345 | 175,917 | ||||||
| CLP Holdings Ltd.—ADR(c) |
59,967 | 631,453 | ||||||
| Consolidated Edison, Inc. |
4,967 | 391,499 | ||||||
| DTE Energy Co. |
3,899 | 435,401 | ||||||
| Duke Energy Corp. |
6,006 | 550,750 | ||||||
| Électricité de France SA—ADR |
58,585 | 159,937 | ||||||
| Empresa Distribuidora Y Comercializadora Norte—ADR(a) |
5,315 | 23,705 | ||||||
| Enel Chile SA—ADR |
51,072 | 224,206 | ||||||
| Enel SpA—ADR |
284,839 | 2,398,343 | ||||||
| Engie SA—ADR |
79,519 | 1,325,581 | ||||||
The accompanying notes are an integral part of these financial statements.
70
| PMC DIVERSIFIED EQUITY FUND |
Schedule of Investments |
February 29, 2020 (Unaudited) (Continued)
| Shares |
Value |
|||||||
| Entergy Corp. |
4,234 | $ | 494,997 | |||||
| Evergy, Inc. |
4,839 | 316,229 | ||||||
| Eversource Energy |
6,810 | 588,793 | ||||||
| Exelon Corp. |
7,846 | 338,241 | ||||||
| FirstEnergy Corp. |
9,869 | 439,467 | ||||||
| Genie Energy Ltd.—Class B(c) |
13,839 | 95,766 | ||||||
| Hawaiian Electric Industries, Inc. |
23,589 | 1,010,552 | ||||||
| Hong Kong & China Gas Co. Ltd.—ADR |
600,971 | 1,147,855 | ||||||
| Iberdrola SA—ADR |
39,128 | 1,789,322 | ||||||
| Kinder Morgan, Inc. |
12,588 | 241,312 | ||||||
| National Fuel Gas Co.(c) |
3,365 | 123,193 | ||||||
| NextEra Energy, Inc. |
2,479 | 626,592 | ||||||
| NorthWestern Corp. |
9,794 | 688,910 | ||||||
| NRG Energy, Inc. |
23,109 | 767,450 | ||||||
| Otter Tail Corp. |
4,490 | 218,259 | ||||||
| PG&E Corp.(a) |
9,826 | 152,303 | ||||||
| Pinnacle West Capital Corp. |
6,514 | 582,938 | ||||||
| Portland General Electric Co. |
15,793 | 859,297 | ||||||
| Power Assets Holdings Ltd.—ADR |
14,879 | 103,722 | ||||||
| PPL Corp. |
27,413 | 822,664 | ||||||
| Sempra Energy |
3,202 | 447,576 | ||||||
| Snam SpA—ADR |
32,587 | 324,729 | ||||||
| Southern Co. |
33,469 | 2,020,188 | ||||||
| Spire, Inc. |
2,265 | 169,988 | ||||||
| Suez—ADR(c) |
79,924 | 629,800 | ||||||
| TerraForm Power, Inc.—Class A |
8,219 | 154,435 | ||||||
| Tokyo Gas Co. Ltd.—ADR |
46,804 | 460,551 | ||||||
| UGI Corp. |
2,143 | 77,234 | ||||||
| United Utilities Group PLC—ADR |
6,378 | 154,667 | ||||||
| Unitil Corp. |
2,576 | 145,132 | ||||||
| Vistra Energy Corp. |
20,139 | 387,273 | ||||||
| WEC Energy Group, Inc. |
1,235 | 114,028 | ||||||
| Xcel Energy, Inc. |
1,687 | 105,134 | ||||||
| 26,501,655 | ||||||||
| Waste Management and Remediation Services—0.29% |
||||||||
| Darling Ingredients, Inc.(a) |
10,162 | 261,163 | ||||||
| Republic Sevices, Inc. |
7,190 | 648,969 | ||||||
| Veolia Environnement SA—ADR |
25,797 | 737,279 | ||||||
| Waste Management, Inc. |
6,342 | 702,757 | ||||||
| 2,350,168 | ||||||||
| Water Transportation—0.25% |
||||||||
| Carnival Corp.(b)(c) |
10,751 | 359,728 | ||||||
| Norwegian Cruise Line Holdings Ltd.(a)(b) |
23,178 | 863,613 | ||||||
| Royal Caribbean Cruises Ltd.(b) |
9,471 | 761,563 | ||||||
| Teekay Tankers Ltd.—Class A(a)(b)(c) |
5,139 | 85,050 | ||||||
| 2,069,954 | ||||||||
| Wholesale Electronic Markets and Agents and Brokers—0.03% |
||||||||
| Prosus NV—ADR(a)(c) |
19,608 | 275,492 | ||||||
| Wood Product Manufacturing—0.22% |
||||||||
| Cavco Industries, Inc.(a) |
376 | 75,847 | ||||||
| Koppers Holdings, Inc.(a) |
2,130 | 46,562 | ||||||
| Louisiana-Pacific Corp. |
6,415 | 182,507 | ||||||
The accompanying notes are an integral part of these financial statements.
71
| PMC DIVERSIFIED EQUITY FUND |
Schedule of Investments |
February 29, 2020 (Unaudited) (Continued)
| Shares |
Value |
|||||||
| Masco Corp. |
24,935 | $ | 1,030,314 | |||||
| Universal Forest Products, Inc. |
9,089 | 425,910 | ||||||
| 1,761,140 | ||||||||
| Total Common Stocks (Cost $730,311,444) |
762,227,222 | |||||||
| Preferred Stocks—0.44% | ||||||||
| Administration of Economic Programs—0.01% |
||||||||
| Centrais Electricas Brasileiras SA—ADR |
6,409 | 49,990 | ||||||
| Air Transportation—0.00% |
||||||||
| Gol Linhas Aereas Inteligentes SA—ADR |
1,419 | 16,077 | ||||||
| Credit Intermediation and Related Activities—0.15% |
||||||||
| Banco Bradesco SA—ADR |
33,111 | 224,493 | ||||||
| Bancolombia SA—ADR |
11,293 | 536,192 | ||||||
| Itau Unibanco Holding SA—ADR |
64,290 | 454,530 | ||||||
| 1,215,215 | ||||||||
| Food and Beverage Stores—0.00% |
||||||||
| Cia Brasileira de Distribuicao—ADR |
1,207 | 19,614 | ||||||
| Management of Companies and Enterprises—0.05% |
||||||||
| Azul SA—ADR(a) |
1,229 | 36,256 | ||||||
| Porsche Automobil Holding SE—ADR |
54,309 | 334,543 | ||||||
| 370,799 | ||||||||
| Merchant Wholesalers, Durable Goods—0.11% |
||||||||
| Volkswagen AG—ADR |
54,054 | 888,107 | ||||||
| Oil and Gas Extraction—0.06% |
||||||||
| Petroleo Brasileiro SA—ADR |
18,070 | 203,468 | ||||||
| Surgutneftegas PJSC—ADR |
56,580 | 277,242 | ||||||
| 480,710 | ||||||||
| Primary Metal Manufacturing—0.01% |
||||||||
| Gerdau SA—ADR(c) |
28,654 | 107,166 | ||||||
| Telecommunications—0.03% |
||||||||
| Telefonica Brasil SA—ADR(c) |
20,911 | 249,468 | ||||||
| Utilities—0.02% |
||||||||
| Cia Energetica de Minas Gerais—ADR |
4,499 | 13,632 | ||||||
| Cia Paranaense de Energia—ADR |
11,700 | 185,562 | ||||||
| 199,194 | ||||||||
| Total Preferred Stocks (Cost $3,876,283) |
3,596,340 | |||||||
| Exchange-Traded Funds—1.01% | ||||||||
| iShares MSCI EAFE ETF |
45,532 | 2,833,912 | ||||||
| iShares Russell 1000 ETF(c) |
24,179 | 3,970,917 | ||||||
| iShares Russell 2000 ETF(c) |
6,310 | 923,342 | ||||||
| Vanguard FTSE Emerging Markets ETF |
11,502 | 466,061 | ||||||
| Total Exchange-Traded Funds (Cost $7,367,561) |
8,194,232 | |||||||
| Real Estate Investment Trusts—3.00% | ||||||||
| Accommodation—0.11% |
||||||||
| Chatham Lodging Trust |
6,400 | 89,216 | ||||||
| Service Properties Trust |
13,376 | 241,838 | ||||||
| Sunstone Hotel Investors, Inc. |
27,930 | 305,834 | ||||||
The accompanying notes are an integral part of these financial statements.
72
| PMC DIVERSIFIED EQUITY FUND |
Schedule of Investments |
February 29, 2020 (Unaudited) (Continued)
| Shares |
Value |
|||||||
| Xenia Hotels & Resorts, Inc. |
17,172 | $ | 256,893 | |||||
| 893,781 | ||||||||
| Credit Intermediation and Related Activities—0.03% |
||||||||
| Cherry Hill Mortgage Investment Corp. |
1,888 | 26,923 | ||||||
| Hannon Armstrong Sustainable Infrastructure Capital, Inc.(c) |
7,179 | 243,727 | ||||||
| 270,650 | ||||||||
| Foresty and Logging—0.01% |
||||||||
| Weyerhaeuser Co. |
4,420 | 114,832 | ||||||
| Funds, Trusts, and Other Financial Vehicles—0.14% |
||||||||
| Apollo Commercial Real Estate Finance, Inc. |
46,436 | 752,263 | ||||||
| Spirit Realty Capital, Inc. |
8,367 | 380,699 | ||||||
| 1,132,962 | ||||||||
| Heavy and Civil Engineering Construction—0.01% |
||||||||
| Cyrela Brazil Realty SA Empreendimentos e Participacoes—ADR |
9,201 | 59,622 | ||||||
| Professional, Scientific, and Technical Services—0.11% |
||||||||
| CoreCivic, Inc. |
4,199 | 62,187 | ||||||
| Extra Space Storage, Inc. |
1,781 | 178,741 | ||||||
| Lamar Advertising Co.—Class A |
2,844 | 238,157 | ||||||
| Outfront Media, Inc. |
16,639 | 438,271 | ||||||
| 917,356 | ||||||||
| Real Estate—2.30% |
||||||||
| Alexander & Baldwin, Inc. |
5,439 | 102,253 | ||||||
| Apartment Investment & Management Co.—Class A |
10,159 | 486,007 | ||||||
| Apple Hospitality REIT, Inc.(c) |
25,156 | 328,789 | ||||||
| Ares Commercial Real Estate Corp. |
27,943 | 426,410 | ||||||
| AvalonBay Communities, Inc. |
1,225 | 245,723 | ||||||
| Brixmor Property Group, Inc.(c) |
32,062 | 583,849 | ||||||
| CareTrust REIT, Inc. |
7,459 | 155,669 | ||||||
| CorEnergy Infrastructure Trust, Inc.(c) |
6,923 | 241,613 | ||||||
| Corporate Office Properties Trust |
8,366 | 211,994 | ||||||
| DiamondRock Hospitality Co. |
13,467 | 122,819 | ||||||
| Duke Realty Corp. |
4,084 | 132,607 | ||||||
| EastGroup Properties, Inc. |
26 | 3,269 | ||||||
| EPR Properties(c) |
7,310 | 433,044 | ||||||
| Equity Residential |
1,255 | 94,251 | ||||||
| Exantas Capital Corp. |
3,828 | 43,869 | ||||||
| Farmland Partners, Inc. |
5,351 | 31,624 | ||||||
| First Industrial Realty Trust, Inc. |
3,922 | 150,997 | ||||||
| Franklin Street Properties Corp.(c) |
17,321 | 123,499 | ||||||
| Gaming and Leisure Properties, Inc. |
25,240 | 1,127,471 | ||||||
| Gladstone Commercial Corp. |
3,623 | 68,366 | ||||||
| Global Medical REIT, Inc.(c) |
19,176 | 267,889 | ||||||
| Healthpeak Properties, Inc.(c) |
15,136 | 478,903 | ||||||
| Host Hotels & Resorts, Inc.(c) |
34,433 | 498,590 | ||||||
| Invesco Mortgage Capital, Inc. |
18,832 | 302,819 | ||||||
| Investors Real Estate Trust |
974 | 68,618 | ||||||
| Invitation Homes, Inc. |
9,966 | 285,925 | ||||||
| iStar, Inc.(c) |
24,364 | 368,627 | ||||||
| Jernigan Capital, Inc.(c) |
12,956 | 232,172 | ||||||
| Kimco Realty Corp. |
42,278 | 733,523 | ||||||
The accompanying notes are an integral part of these financial statements.
73
| PMC DIVERSIFIED EQUITY FUND |
Schedule of Investments |
February 29, 2020 (Unaudited) (Continued)
| Shares |
Value |
|||||||
| Kite Realty Group Trust |
7,956 | $ | 128,489 | |||||
| KKR Real Estate Finance Trust, Inc.(c) |
13,879 | 272,584 | ||||||
| Ladder Capital Corp. |
27,898 | 425,445 | ||||||
| Lexington Realty Trust |
149,951 | 1,554,992 | ||||||
| Life Storage, Inc. |
1,839 | 198,446 | ||||||
| LTC Properties, Inc. |
5,219 | 233,968 | ||||||
| Mack-Cali Realty Corp. |
6,759 | 128,286 | ||||||
| Mid-America Apartment Communities, Inc. |
3,756 | 485,501 | ||||||
| National Retail Properties, Inc. |
1,897 | 96,462 | ||||||
| Office Properties Income Trust |
3,690 | 107,490 | ||||||
| Omega Healthcare Investors, Inc.(c) |
10,537 | 417,265 | ||||||
| PennyMac Mortgage Investment Trust |
23,535 | 487,175 | ||||||
| Physicians Realty Trust |
13,112 | 247,292 | ||||||
| Piedmont Office Realty Trust, Inc.—Class A |
10,212 | 220,477 | ||||||
| Prologis, Inc. |
880 | 74,166 | ||||||
| PS Business Parks, Inc. |
740 | 109,927 | ||||||
| Ready Capital Corp.(c) |
19,093 | 276,849 | ||||||
| Realty Income Corp. |
1,428 | 103,373 | ||||||
| Retail Properties of America, Inc.—Class A |
23,154 | 242,422 | ||||||
| Retail Value, Inc. |
8,501 | 236,243 | ||||||
| RPT Realty |
9,056 | 117,366 | ||||||
| Ryman Hospitality Properties, Inc. |
839 | 58,319 | ||||||
| Simon Property Group, Inc. |
237 | 29,170 | ||||||
| SITE Centers Corp. |
30,604 | 352,252 | ||||||
| SL Green Realty Corp. |
1,346 | 105,580 | ||||||
| STORE Capital Corp. |
11,164 | 366,849 | ||||||
| Sun Communities, Inc. |
1,709 | 261,272 | ||||||
| TPG RE Finance Trust, Inc. |
14,389 | 276,557 | ||||||
| Urstadt Biddle Properties, Inc.—Class A |
1,386 | 28,565 | ||||||
| VEREIT, Inc. |
110,276 | 954,990 | ||||||
| VICI Properties, Inc.(c) |
12,603 | 315,831 | ||||||
| Vornado Realty Trust |
1,156 | 61,938 | ||||||
| Washington Prime Group, Inc.(c) |
50,861 | 139,868 | ||||||
| Weingarten Realty Investors(c) |
3,846 | 103,573 | ||||||
| Welltower, Inc.(c) |
6,553 | 490,295 | ||||||
| Western Asset Mortgage Capital Corp. |
19,324 | 193,626 | ||||||
| Whitestone REIT |
5,422 | 66,636 | ||||||
| WP Carey, Inc. |
3,922 | 303,602 | ||||||
| 18,624,330 | ||||||||
| Securities, Commodity Contracts, and Other Financial Investments and Related Activities—0.14% |
| |||||||
| Ellington Financial, Inc. |
5,193 | 85,840 | ||||||
| Granite Point Mortgage Trust, Inc. |
16,027 | 263,163 | ||||||
| Medical Properties Trust, Inc.(c) |
36,898 | 779,655 | ||||||
| 1,128,658 | ||||||||
| Social Assistance—0.02% |
||||||||
| GEO Group, Inc. |
11,050 | 161,772 | ||||||
| Telecommunications—0.13% |
||||||||
| American Tower Corp. |
4,164 | 944,395 | ||||||
| Equinix, Inc. |
166 | 95,085 | ||||||
| 1,039,480 | ||||||||
| Total Real Estate Investment Trusts (Cost $24,658,932) |
24,343,443 | |||||||
The accompanying notes are an integral part of these financial statements.
74
| PMC DIVERSIFIED EQUITY FUND |
Schedule of Investments |
February 29, 2020 (Unaudited) (Continued)
| Shares |
Value |
|||||||
| Investments Purchased With Collateral From Securities Lending—12.40% | ||||||||
| Money Market Fund—12.40% |
||||||||
| Mount Vernon Liquid Assets Portfolio, LLC, 1.760%(d) |
100,626,957 | $ | 100,626,957 | |||||
| Total Investments Purchased With Collateral From Securities Lending (Cost $100,626,957) |
100,626,957 | |||||||
| Short-Term Investments—1.61% | ||||||||
| First American Government Obligations Fund, Class X, 1.493%(d) |
13,022,586 | 13,022,586 | ||||||
| Total Short-Term Investments (Cost $13,022,586) |
13,022,586 | |||||||
| Total Investments (Cost $879,863,763)—112.42% | 912,010,780 | |||||||
| Liabilities in Excess of Other Assets—(12.42)% | (100,793,320 | ) | ||||||
| Total Net Assets—100.00% | $ | 811,217,460 | ||||||
Percentages are stated as a percent of net assets.
| (a) | Non-income producing security. |
| (b) | Foreign issued security. |
| (c) | All or portion of this security is out on loan as of February 29, 2020. Total value of securities out on loan is $96,851,240. |
| (d) | The rate shown represents the 7-day yield at February 29, 2020. |
| Abbreviations | ||
| AB | Aktiebolag is a Swedish term for a stock company. | |
| ADR | American Depositary Receipt | |
| AG | Aktiengesellschaft is a German term that refers to a corporation that is limited by shares, i.e. owned by shareholders. | |
| A/S | An abbreviation used by many countries to signify a stock company whereby shareholders have limited liability. | |
| ASA | Allmennaksjeselskap is a Norwegian term for a stock company. | |
| KGaA | Kommanditgesellschaft auf Aktien is a German term that refers to a Limited Partnership that has shares. | |
| NV | Naamloze Vennootschap is a Dutch term for publicly traded companies. | |
| OYJ | Julkinen osakeyhtio is a Finnish term for publicly-traded companies. | |
| PJSC | An abbreviation used by many countries to signify an open joint-stock company. | |
| PLC | Public Limited Company is a publicly traded company which signifies that shareholders have limited liability. | |
| SA | An abbreviation used by many countries to signify a publicly traded company. | |
| SAB de CV | Sociedad Anonima de Capital Variable is a Spanish term for an SA with variable capital. | |
| SE | Societas Europea is a term for a European Public Limited Liability Company. | |
| SpA | Soicieta per Azioni is an Italian term for limited share company. |
The accompanying notes are an integral part of these financial statements.
75
February 29, 2020 (Unaudited)
| Statements of Assets and Liabilities | ||||||||
| Core Fixed Income Fund |
Diversified Equity Fund |
|||||||
| Assets | ||||||||
| Investments, at value(1)(2) |
$ | 477,944,797 | $ | 912,010,780 | ||||
| Foreign currencies(3) |
3,249 | — | ||||||
| Receivables: |
||||||||
| Investments sold |
4,166,842 | 76,437,599 | ||||||
| Dividends and interest |
2,418,515 | 1,725,583 | ||||||
| Cash collateral held at broker for futures contracts |
1,047,132 | — | ||||||
| Fund shares sold |
749,798 | 1,881,328 | ||||||
| Securities lending |
5,014 | 136,767 | ||||||
| Other Assets |
28,660 | 39,642 | ||||||
| Total Assets |
486,364,007 | 992,231,699 | ||||||
| Liabilities | ||||||||
| Payables: |
||||||||
| Investments purchased |
6,359,773 | 77,824,456 | ||||||
| Fund shares redeemed |
573,511 | 1,805,164 | ||||||
| Collateral on securities loaned |
62,786,009 | 100,626,957 | ||||||
| Affiliates |
200,208 | 294,779 | ||||||
| Adviser |
163,332 | 385,039 | ||||||
| Distributor |
28,685 | 53,120 | ||||||
| Accrued expenses and other liabilities |
19,588 | 24,724 | ||||||
| Total Liabilities |
70,131,106 | 181,014,239 | ||||||
| Net Assets | $ | 416,232,901 | $ | 811,217,460 | ||||
| Net assets consist of: | ||||||||
| Paid-in capital |
$ | 392,596,092 | $ | 800,691,253 | ||||
| Total distributable earnings |
23,636,809 | 10,526,207 | ||||||
| Net assets | $ | 416,232,901 | $ | 811,217,460 | ||||
| Advisor Class Shares | ||||||||
| Net assets |
145,197,447 | 240,527,039 | ||||||
| Shares of beneficial interest outstanding (unlimited shares of $0.001 par value authorized) |
8,195,147 | 10,340,493 | ||||||
| Net asset value and redemption price per share |
$ | 17.72 | $ | 23.26 | ||||
| Institutional Class Shares | ||||||||
| Net assets |
271,035,454 | 570,690,421 | ||||||
| Shares of beneficial interest outstanding (unlimited shares of $0.001 par value authorized) |
15,343,384 | 24,591,503 | ||||||
| Net asset value and redemption price per share |
$ | 17.66 | $ | 23.21 | ||||
| (1) Cost of investments |
$ | 458,325,621 | $ | 879,863,763 | ||||
| (2) Includes loaned securities with a value of |
$ | 62,786,009 | $ | 100,626,957 | ||||
| (3) Cost of foreign currencies |
$ | 3,355 | — | |||||
The accompanying notes are an integral part of these financial statements.
76
For the Six Months Ended February 29, 2020 (Unaudited)
| Statements of Operations | ||||||||
| Core Fixed Income Fund |
Diversified Equity Fund |
|||||||
| Investment Income: | ||||||||
| Interest |
$ | 5,952,966 | $ | 73,489 | ||||
| Dividends |
199,668 | 7,948,995 | (1) | |||||
| Securities lending |
26,578 | 786,061 | ||||||
| 6,179,212 | 8,808,545 | |||||||
| Expenses: | ||||||||
| Investment management fees |
1,599,068 | 2,308,718 | ||||||
| Distribution fees—Advisor Class |
290,564 | 601,413 | ||||||
| Transfer agent fees and expenses |
150,603 | 203,772 | ||||||
| Fund administration fees |
106,536 | 201,977 | ||||||
| Fund accounting fees |
103,763 | 128,002 | ||||||
| Custody fees |
41,701 | 63,989 | ||||||
| Federal and state registration fees |
29,990 | 33,420 | ||||||
| Audit and tax fees |
21,239 | 18,485 | ||||||
| Reports to shareholders |
16,681 | 21,207 | ||||||
| Legal fees |
11,023 | 15,494 | ||||||
| Chief Compliance Officer fees |
10,556 | 5,555 | ||||||
| Trustees’ fees |
4,946 | 4,946 | ||||||
| Other expenses |
5,484 | 8,657 | ||||||
| Total expenses before waiver or recoupment |
2,392,154 | 3,615,635 | ||||||
| Recoupment or (waivers) by Adviser (Note 4) |
(602,464 | ) | 104,095 | |||||
| Net expenses |
1,789,690 | 3,719,730 | ||||||
| Net Investment Income | 4,389,522 | 5,088,815 | ||||||
| Realized and Unrealized Gain (Loss): | ||||||||
| Net realized gain (loss) on: |
||||||||
| Investments |
4,862,709 | (3,727,146 | ) | |||||
| Futures contracts |
(241,880 | ) | — | |||||
| Foreign currency translations |
— | 6 | ||||||
| 4,620,829 | (3,727,140 | ) | ||||||
| Net change in unrealized appreciation (depreciation) on: |
||||||||
| Investments |
2,619,402 | (8,824,107 | ) | |||||
| Futures contracts |
103,806 | — | ||||||
| Foreign currency translations |
11 | 4 | ||||||
| 2,723,219 | (8,824,103 | ) | ||||||
| Net gain (loss) on investments and foreign currency |
7,344,048 | (12,551,243 | ) | |||||
| Net Increase (Decrease) in Net Assets Resulting from Operations |
$ | 11,733,570 | $ | (7,462,428 | ) | |||
| (1) | Net of $625,237 in foreign withholding tax and ADR issuance fees. |
The accompanying notes are an integral part of these financial statements.
77
| Statements of Changes in Net Assets | ||||||||
| Core Fixed Income Fund |
||||||||
| Six Months Ended February 29, 2020 (Unaudited) |
Year Ended August 31, 2019 |
|||||||
| Operations: | ||||||||
| Net investment income |
$ | 4,389,522 | $ | 10,000,123 | ||||
| Net realized gain on investments, futures and foreign currency |
4,620,829 | 3,273,760 | ||||||
| Net change in unrealized appreciation |
2,723,219 | 22,715,370 | ||||||
| Net increase in net assets resulting from operations |
11,733,570 | 35,989,253 | ||||||
| Dividends and distributions to shareholders: | ||||||||
| Net dividends and distributions —Advisor Class |
(4,915,393 | ) | (9,356,313 | ) | ||||
| Net dividends and distributions —Institutional Class(1) |
(5,615,245 | ) | — | |||||
| Net decrease in net assets resulting from distributions paid |
(10,530,638 | ) | (9,356,313 | ) | ||||
| Fund share transactions: | ||||||||
| Shares sold—Advisor Class |
15,120,153 | 82,173,210 | ||||||
| Shares issued to holders in reinvestment of dividends—Advisor Class |
4,716,894 | 9,073,060 | ||||||
| Shares redeemed—Advisor Class |
(272,912,177 | ) | (116,578,765 | ) | ||||
| Shares sold—Institutional Class(1) |
274,548,339 | 500 | ||||||
| Shares issued to holders in reinvestment of dividends—Institutional Class(1) |
5,505,198 | — | ||||||
| Shares redeemed—Institutional Class(1) |
(11,337,998 | ) | — | |||||
| Net increase (decrease) in net assets from share transactions |
15,640,409 | (25,331,995 | ) | |||||
| Net increase in net assets |
16,843,341 | 1,300,945 | ||||||
| Net Assets: | ||||||||
| Beginning of period |
399,389,560 | 398,088,615 | ||||||
| End of period |
$ | 416,232,901 | $ | 399,389,560 | ||||
| Change in shares outstanding: | ||||||||
| Shares sold—Advisor Class |
863,228 | 4,935,947 | ||||||
| Shares issued to holders in reinvestment of dividends—Advisor Class |
274,397 | 562,147 | ||||||
| Shares redeemed—Advisor Class |
(15,567,932 | ) | (6,957,885 | ) | ||||
| Shares sold—Institutional Class(1) |
15,670,366 | 29 | ||||||
| Shares issued to holders in reinvestment of dividends—Institutional Class(1) |
321,377 | — | ||||||
| Shares redeemed—Institutional Class(1) |
(648,388 | ) | — | |||||
| Net increase (decrease) |
913,048 | (1,459,762 | ) | |||||
| (1) | Institutional Class shares commenced operations on July 1, 2019. |
The accompanying notes are an integral part of these financial statements.
78
PMC Funds
| Statements of Changes in Net Assets | ||||||||
| Diversified Equity Fund |
||||||||
| Six Months Ended February 29, 2020 (Unaudited) |
Year Ended August 31, 2019 |
|||||||
| Operations: | ||||||||
| Net investment income |
$ | 5,088,815 | $ | 11,139,880 | ||||
| Net realized loss on investments and foreign currency |
(3,727,140 | ) | (19,559,129 | ) | ||||
| Net change in unrealized depreciation |
(8,824,103 | ) | (38,893,809 | ) | ||||
| Net decrease in net assets resulting from operations |
(7,462,428 | ) | (47,313,058 | ) | ||||
| Dividends and distributions to shareholders: | ||||||||
| Net dividends and distributions—Advisor Class |
(5,075,723 | ) | (82,906,390 | ) | ||||
| Net dividends and distributions—Institutional Class(1) |
(7,480,435 | ) | — | |||||
| Net decrease in net assets resulting from distributions paid |
(12,556,158 | ) | (82,906,390 | ) | ||||
| Fund share transactions: | ||||||||
| Shares sold—Advisor Class |
23,624,951 | 177,320,573 | ||||||
| Shares issued to holders in reinvestment of dividends—Advisor Class |
4,734,212 | 79,212,511 | ||||||
| Shares redeemed—Advisor Class |
(625,362,319 | ) | (152,487,207 | ) | ||||
| Shares sold—Institutional Class(1) |
631,525,086 | 500 | ||||||
| Shares issued to holders in reinvestment of dividends—Institutional Class(1) |
7,321,829 | — | ||||||
| Shares redeemed—Institutional Class(1) |
(28,876,796 | ) | — | |||||
| Net increase in net assets from share transactions |
12,966,963 | 104,046,377 | ||||||
| Net decrease in net assets |
(7,051,623 | ) | (26,173,071 | ) | ||||
| Net Assets: | ||||||||
| Beginning of period |
818,269,083 | 844,442,154 | ||||||
| End of period |
$ | 811,217,460 | $ | 818,269,083 | ||||
| Change in shares outstanding: | ||||||||
| Shares sold—Advisor Class |
942,843 | 7,212,753 | ||||||
| Shares issued to holders in reinvestment of dividends—Advisor Class |
183,142 | 3,674,049 | ||||||
| Shares redeemed—Advisor Class |
(25,208,628 | ) | (6,202,244 | ) | ||||
| Shares sold—Institutional Class(1) |
25,441,845 | 20 | ||||||
| Shares issued to holders in reinvestment of dividends—Institutional Class(1) |
284,122 | — | ||||||
| Shares redeemed—Institutional Class(1) |
(1,134,484 | ) | — | |||||
| Net increase |
508,840 | 4,684,578 | ||||||
| (1) | Institutional Class shares commenced operations on July 1, 2019. |
The accompanying notes are an integral part of these financial statements.
79
PMC Core Fixed Income Fund—Advisor Class
| Financial Highlights | ||||||||||||||||||||||||
| Per Share Data for a Share Outstanding Throughout Each Year/Period | ||||||||||||||||||||||||
| Six Months Ended February 20, 2020 (Unaudited) |
Year Ended August 31, 2019 |
Year Ended August 31, 2018 |
Year Ended August 31, 2017 |
Year Ended August 31, 2016 |
Year Ended August 31, 2015 |
|||||||||||||||||||
| Net asset value, beginning of year/period |
$ | 17.65 | $ | 16.53 | $ | 17.05 | $ | 17.32 | $ | 16.73 | $ | 17.12 | ||||||||||||
| Income from investment operations: | ||||||||||||||||||||||||
| Net investment income(1) |
0.18 | 0.42 | 0.37 | 0.27 | 0.28 | 0.29 | ||||||||||||||||||
| Net realized and unrealized gain (loss) |
0.31 | 1.09 | (0.61 | ) | (0.14 | ) | 0.55 | (0.36 | ) | |||||||||||||||
| Total from investment operations |
0.49 | 1.51 | (0.24 | ) | 0.13 | 0.83 | (0.07 | ) | ||||||||||||||||
| Less distributions paid: | ||||||||||||||||||||||||
| Dividends from net investment income |
(0.40 | ) | (0.39 | ) | (0.28 | ) | (0.30 | ) | (0.23 | ) | (0.25 | ) | ||||||||||||
| Distributions from net realized gains |
(0.02 | ) | — | 0.00 | (4) | (0.10 | ) | (0.01 | ) | (0.07 | ) | |||||||||||||
| Total distributions paid |
(0.42 | ) | (0.39 | ) | (0.28 | ) | (0.40 | ) | (0.24 | ) | (0.32 | ) | ||||||||||||
| Net asset value, end of year/period |
$ | 17.72 | $ | 17.65 | $ | 16.53 | $ | 17.05 | $ | 17.32 | $ | 16.73 | ||||||||||||
| Total return(2) |
2.86 | % | 9.37 | % | -1.42 | % | 0.78 | % | 5.06 | % | -0.42 | % | ||||||||||||
| Ratios / supplemental data | ||||||||||||||||||||||||
| Net assets, end of year/period (000’s) |
$ | 145,197 | $ | 399,389 | $ | 398,089 | $ | 332,426 | $ | 274,686 | $ | 217,234 | ||||||||||||
| Ratio of expenses to average net assets before waiver and reimbursements(3) |
1.30 | % | 1.28 | % | 1.30 | % | 1.34 | % | 1.37 | % | 1.39 | % | ||||||||||||
| Ratio of expenses to average net assets after waiver and reimbursements(3)(5) |
1.00 | % | 1.00 | % | 1.00 | % | 1.00 | % | 1.00 | % | 1.00 | % | ||||||||||||
| Ratio of net investment income to average net assets before waiver and reimbursements(3) |
1.81 | % | 2.22 | % | 1.91 | % | 1.29 | % | 1.30 | % | 1.31 | % | ||||||||||||
| Ratio of net investment income to average net assets after waiver and reimbursements(3) |
2.11 | % | 2.50 | % | 2.21 | % | 1.63 | % | 1.67 | % | 1.70 | % | ||||||||||||
| Portfolio turnover rate(2) |
60.4 | % | 144.3 | % | 160.1 | % | 199.9 | % | 100.4 | % | 131.9 | % | ||||||||||||
| (1) | Per share net investment income was calculated using average shares outstanding. |
| (2) | Not annualized for periods less than one year. |
| (3) | Annualized for periods less than one year. |
| (4) | Round to less than 0.5 cent per share |
| (5) | Reflects expense cap of 0.75% (plus Rule 12b-1 fees of 0.25%). |
The accompanying notes are an integral part of these financial statements.
80
PMC Core Fixed Income Fund—Institutional Class
| Financial Highlights | ||||||||
| Per Share Data for a Share Outstanding Throughout Each Period | ||||||||
| Six Months Ended February 20, 2020 (Unaudited) |
Period Ended August 31, 2019 (1) |
|||||||
| Net asset value, beginning of period |
$ | 17.66 | $ | 17.23 | ||||
| Income from investment operations: | ||||||||
| Net investment income(2) |
0.20 | 0.07 | ||||||
| Net realized and unrealized gain |
0.30 | 0.36 | ||||||
| Total from investment operations |
0.50 | 0.43 | ||||||
| Less distributions paid: | ||||||||
| Dividends from net investment income |
(0.48 | ) | — | |||||
| Distributions from net realized gains |
(0.02 | ) | — | |||||
| Total distributions paid |
(0.50 | ) | — | |||||
| Net asset value, end of period |
$ | 17.66 | $ | 17.66 | ||||
| Total return(3) |
2.99 | % | 2.50 | % | ||||
| Ratios / supplemental data | ||||||||
| Net assets, end of period |
$ | 271,036 | $ | 512 | ||||
| Ratio of expenses to average net assets before waiver and reimbursements(4) |
1.05 | % | 0.75 | % | ||||
| Ratio of expenses to average net assets after waiver and reimbursements(4) |
0.75 | % | 0.75 | % | ||||
| Ratio of net investment income to average net assets before waiver and reimbursements(4) |
2.02 | % | 2.33 | % | ||||
| Ratio of net investment income to average net assets after waiver and reimbursements(4) |
2.32 | % | 2.33 | % | ||||
| Portfolio turnover rate(5) |
60.4 | % | 144.3 | % | ||||
| (1) | Institutional Class shares commenced operations on July 1, 2019. |
| (2) | Per share net investment income was calculated using average shares outstanding. |
| (3) | Not annualized for periods less than one year. |
| (4) | Annualized for periods less than one year. |
| (5) | Portfolio turnover rates are calculated at the Fund level (not by individual share class). |
The accompanying notes are an integral part of these financial statements.
81
PMC Diversified Equity Fund—Advisor Class
| Financial Highlights | ||||||||||||||||||||||||
| Per Share Data for a Share Outstanding Throughout Each Year/period | ||||||||||||||||||||||||
| Six Months Ended February 20, 2020 (Unaudited) |
Year Ended August 31, 2019 |
Year Ended August 31, 2018 |
Year Ended August 31, 2017 |
Year Ended August 31, 2016 |
Year Ended August 31, 2015 |
|||||||||||||||||||
| Net asset value, beginning of year/period |
$ | 23.77 | $ | 28.40 | $ | 26.68 | $ | 23.45 | $ | 23.25 | $ | 25.36 | ||||||||||||
| Income (loss) from investment operations: | ||||||||||||||||||||||||
| Net investment income(1) |
0.13 | 0.34 | 0.19 | 0.17 | 0.14 | 0.16 | ||||||||||||||||||
| Net realized and unrealized gain (loss) |
(0.33 | ) | (2.21 | ) | 3.08 | 3.22 | 0.95 | (1.23 | ) | |||||||||||||||
| Total from investment operations |
(0.20 | ) | (1.87 | ) | 3.27 | 3.39 | 1.09 | (1.07 | ) | |||||||||||||||
| Less distributions paid: | ||||||||||||||||||||||||
| Dividends from net investment income |
(0.31 | ) | (0.17 | ) | (0.17 | ) | (0.14 | ) | (0.09 | ) | (0.12 | ) | ||||||||||||
| Distributions from net realized gains |
— | (2.59 | ) | (1.38 | ) | (0.02 | ) | (0.80 | ) | (0.92 | ) | |||||||||||||
| Total distributions paid |
(0.31 | ) | (2.76 | ) | (1.55 | ) | (0.16 | ) | (0.89 | ) | (1.04 | ) | ||||||||||||
| Net asset value, end of year/period |
$ | 23.26 | $ | 23.77 | $ | 28.40 | $ | 26.68 | $ | 23.45 | $ | 23.25 | ||||||||||||
| Total return(2) |
-0.99 | % | -5.54 | % | 12.50 | % | 14.54 | % | 4.87 | % | -4.41 | % | ||||||||||||
| Ratios / supplemental data | ||||||||||||||||||||||||
| Net assets, end of year/period (000’s) |
$ | 240,527 | $ | 818,269 | $ | 844,442 | $ | 650,190 | $ | 489,239 | $ | 329,187 | ||||||||||||
| Ratio of expenses to average net assets before waiver, expense reimbursements or recoupment(3) |
0.94 | % | 0.94 | % | 1.26 | % | 1.41 | % | 1.45 | % | 1.45 | % | ||||||||||||
| Ratio of expenses to average net assets after waiver, expense reimbursements or recoupment(3) |
0.98 | %(4) | 0.98 | %(4) | 1.25 | % (5) | 1.36 | % (6) | 1.40 | % | 1.40 | % | ||||||||||||
| Ratio of net investment income to average net assets before waiver, expense reimbursements or recoupment(3) |
1.05 | % | 1.42 | % | 0.67 | % | 0.64 | % | 0.57 | % | 0.62 | % | ||||||||||||
| Ratio of net investment income to average net assets after waiver, expense reimbursements or recoupment(3) |
1.01 | % | 1.38 | % | 0.68 | % | 0.69 | % | 0.62 | % | 0.67 | % | ||||||||||||
| Portfolio turnover rate(2) |
9.8 | % | 111.4 | % | 104.3 | % | 139.4 | % | 48.8 | % | 66.7 | % | ||||||||||||
| (1) | Per share net investment income was calculated using average shares outstanding. |
| (2) | Not annualized for periods less than one year. |
| (3) | Annualized for periods less than one year. |
| (4) | Reflects expense cap of 0.73% (plus Rule 12b-1 fees of 0.25%). |
| (5) | Effective June 1, 2018 the expense limitation cap was reduced from 1.35% to 0.98%. This reflects the expense limitation cap of 1.10% from September 1, 2017 through May 31, 2018 (plus Rule 12b-1 fees of 0.25%) and 0.73% from June 1, 2018 through August 31, 2018 (plus Rule 12b-1 fees of 0.25%). |
| (6) | Effective November 1, 2016 the expense limitation cap was reduced from 1.40% to 1.35% (this includes Rule 12b-1 fees of 0.25%). |
The accompanying notes are an integral part of these financial statements.
82
PMC Diversified Equity Fund—Institutional Class
| Financial Highlights | ||||||||
| Per Share Data for a Share Outstanding Throughout Each Period | ||||||||
| Six Months Ended February 20, 2020 (Unaudited) |
Period Ended August 31, 2019 (1) |
|||||||
| Net asset value, beginning of period |
$ | 23.78 | $ | 24.69 | ||||
| Income from investment operations: | ||||||||
| Net investment income(2) |
0.17 | 0.06 | ||||||
| Net realized and unrealized loss |
(0.32 | ) | (0.97 | ) | ||||
| Total from investment operations |
(0.15 | ) | (0.91 | ) | ||||
| Less distributions paid: | ||||||||
| Dividends from net investment income |
(0.42 | ) | — | |||||
| Total distributions paid |
(0.42 | ) | — | |||||
| Net asset value, end of period |
$ | 23.21 | $ | 23.78 | ||||
| Total return(3) |
-0.82 | % | -3.69 | % | ||||
| Ratios / supplemental data | ||||||||
| Net assets, end of period |
$ | 570,690 | $ | 481 | ||||
| Ratio of expenses to average net assets(4) |
0.70 | % | 0.73 | % | ||||
| Ratio of net investment income to average net assets(4) |
1.36 | % | 1.42 | % | ||||
| Portfolio turnover rate(5) |
9.8 | % | 111.4 | % | ||||
| (1) | Institutional Class shares commenced operations on July 1, 2019. |
| (2) | Per share net investment income was calculated using average shares outstanding. |
| (3) | Not annualized for periods less than one year. |
| (4) | Annualized for periods less than one year. |
| (5) | Portfolio turnover rates are calculated at the Fund level (not by individual share class). |
The accompanying notes are an integral part of these financial statements.
83
PMC FUNDS
February 29, 2020 (Unaudited)
| (1) | Organization |
Trust for Professional Managers (the “Trust”) was organized as a Delaware statutory trust under a Declaration of Trust dated May 29, 2001. The Trust is registered under the Investment Company Act of 1940, as amended (the “1940 Act”), as an open-end management investment company. Each of the PMC Funds (each, a “Fund” and together, the “Funds”) represents a distinct series with its own investment objectives and policies within the Trust. The investment objective of the PMC Core Fixed Income Fund (the “Core Fixed Income Fund”) is to provide current income consistent with low volatility of principal. The investment objective of the PMC Diversified Equity Fund (the “Diversified Equity Fund”) is long-term capital appreciation. The Trust may issue an unlimited number of shares of beneficial interest at $0.001 par value. The Advisor Class of the Core Fixed Income Fund became effective and commenced operations on September 28, 2007. The Institutional Class of the Core Fixed Income Fund became effective and commenced operations on July 1, 2019. The Advisor Class of the Diversified Equity Fund became effective and commenced operations on August 26, 2009. The Institutional Class of the Diversified Equity Fund became effective and commenced operations on July 1, 2019. The Advisor Class shares are subject to a 0.25% Rule 12b-1 distribution fee. Each class of shares has identical rights and privileges except with respect to distribution fees and voting rights on matters affecting a single class of shares.
The Funds are investment companies and accordingly follow the investment company accounting and reporting guidance of the Financial Accounting Standards Board (FASB) Accounting Standard Codification Topic 946 “Financial Services-Investment Companies”.
| (2) | Significant Accounting Policies |
The following is a summary of significant accounting policies consistently followed by the Funds in the preparation of the financial statements. These policies are in conformity with accounting principles generally accepted in the United States of America (“GAAP”).
| (a) | Investment Valuation |
Each security owned by the Funds that is listed on a securities exchange is valued at its last sale price on that exchange on the date as of which assets are valued. If the security is listed on more than one exchange, the Funds will use the price of the exchange that the Funds generally consider to be the principal exchange on which the stock is traded.
Fund securities listed on the NASDAQ Stock Market, LLC (“NASDAQ”) will be valued at the NASDAQ Official Closing Price, which may not necessarily represent the last sale price. If there has been no sale on such exchange or on NASDAQ on such day, the security is valued at the mean between the bid and asked prices on such day or at the latest sale price on the Composite Market (defined as the consolidation of the trade information provided by national securities and foreign exchanges and over-the-counter markets as published by an approved pricing service (“Pricing Service”)).
Debt securities, including short-term debt instruments having a maturity of 60 days or less, are valued at the mean in accordance with prices supplied by an approved Pricing Service. Pricing Services may use various valuation methodologies such as the mean between the bid and the asked prices, matrix pricing and other analytical pricing models as well as market transactions and dealer quotations. If a price is not available from a Pricing Service, the most recent quotation obtained from one or more broker-dealers know to follow the issue will be obtained. Quotations will be valued at the mean between the bid and the offer. Any discount or premium is accreted or amortized using the constant yield method over the life of the security.
Money market funds, demand notes and repurchase agreements are valued at cost. If cost does not represent current market value the securities will be priced at fair value.
Redeemable securities issued by open-end, registered investment companies are valued at the NAVs of such companies for purchase and/or redemption orders placed on that day. All exchange-traded funds are valued at the last reported sale price on the exchange on which the security is principally traded.
84
PMC FUNDS
Notes to Financial Statements, continued
February 29, 2020 (Unaudited)
Futures contracts are valued at the last settlement price at the close of trading on the relevant exchange or board of trade. Futures contracts for which reliable market quotations are not readily available shall each be valued at a price, supplied by a Pricing Service approved by the Trust’s Board of Trustees (the “Board”) which is in the opinion of such Pricing Service representative of the market value of such positions at the time of determination of the NAV, it being the opinion of the Board that the valuations supplied by such Pricing Service accurately reflect the fair value of such position.
Forward foreign currency contracts are valued at the mean between the bid and asked prices.
If market quotations are not readily available, any security or other financial instrument is valued at its fair value as determined under fair value pricing procedures approved by the Board. These fair value procedures will also be used to price a security when corporate events, events in the securities market and/or world events cause the Adviser to believe that a security’s last sale price may not reflect its actual market value. The intended effect of using fair value pricing procedures is to ensure that the Funds are accurately priced. The Board will regularly evaluate whether the Funds’ fair value pricing procedures continue to be appropriate in light of the specific circumstances of each Fund and the quality of prices obtained through application of such procedures by the Trust’s valuation committee.
FASB Accounting Standards Codification, “Fair Value Measurement” Topic 820 (“ASC 820”), establishes an authoritative definition of fair value and sets out a hierarchy for measuring fair value. ASC 820 requires an entity to evaluate certain factors to determine whether there has been a significant decrease in volume and level of activity for the security such that recent transactions and quoted prices may not be determinative of fair value and further analysis and adjustment may be necessary to estimate fair value. ASC 820 also requires enhanced disclosure regarding the inputs and valuation techniques used to measure fair value in those instances as well as expanded disclosure of valuation levels for major security types. These inputs are summarized in the three broad levels listed below:
| • | Level 1—Quoted prices in active markets for identical securities. |
| • | Level 2—Other significant observable inputs (including quoted prices for similar securities, interest rates, prepayment speeds, credit risk, etc.). |
| • | Level 3—Significant unobservable inputs (including the Funds’ own assumptions in determining the fair value of investments). |
The inputs or methodology used for valuing securities are not necessarily an indication of the risk associated with investing in those securities. The following is a summary of the inputs used to value the Funds’ investments carried at fair value as of February 29, 2020:
Core Fixed Income Fund
| Level 1 |
Level 2 |
Level 3 |
Total |
|||||||||||||
| Fixed Income Securities | ||||||||||||||||
| Asset Backed Securities |
$ | — | $ | 26,388,948 | $ | — | $ | 26,388,948 | ||||||||
| Corporate Bonds* |
— | 96,871,810 | — | 96,871,810 | ||||||||||||
| Foreign Corporate Bonds* |
— | 29,512,385 | — | 29,512,385 | ||||||||||||
| Foreign Government Agency Issues |
— | 1,833,805 | — | 1,833,805 | ||||||||||||
| Foreign Government Notes/Bonds |
— | 26,188,272 | — | 26,188,272 | ||||||||||||
| Non-Agency Mortgage Backed Securities |
— | 29,740,466 | — | 29,740,466 | ||||||||||||
| Agency Mortgage Backed Securities |
— | 130,791,719 | — | 130,791,719 | ||||||||||||
| Municipal Bonds |
— | 3,979,245 | — | 3,979,245 | ||||||||||||
| U.S. Government Agency Issues |
— | 480,845 | — | 480,845 | ||||||||||||
| U.S. Government Notes/Bonds |
— | 63,481,178 | — | 63,481,178 | ||||||||||||
| Total Fixed Income Securities |
— | 409,268,673 | — | 409,268,673 | ||||||||||||
85
PMC FUNDS
Notes to Financial Statements, continued
February 29, 2020 (Unaudited)
| Level 1 |
Level 2 |
Level 3 |
Total |
|||||||||||||
| Exchange-Traded Funds |
3,830,394 | — | — | 3,830,394 | ||||||||||||
| Money Market Funds |
64,845,730 | — | — | 64,845,730 | ||||||||||||
| Total Investments in Securities |
$ | 68,676,124 | $ | 409,268,673 | $ | — | $ | 477,944,797 | ||||||||
| Other Financial Instruments(1) |
|
|||||||||||||||
| Futures |
$ | 89,447 | $ | — | $ | — | $ | 89,447 | ||||||||
| Total Other Financial Instruments |
$ | 89,447 | $ | — | $ | — | $ | 89,447 | ||||||||
| * | For further breakdown by industry, please refer to the Schedule of Investments. |
| (1) | Other financial instruments are futures contracts reflected in the Schedule of Open Futures Contracts. The amounts reflect the net unrealized appreciation (depreciation) on the contracts held. |
The Fund did not hold any Level 3 securities during the six months ended February 29, 2020.
Diversified Equity Fund
| Level 1 |
Level 2 |
Level 3 |
Total |
|||||||||||||
| Equity | ||||||||||||||||
| Common Stocks* |
$ | 753,034,657 | $ | 9,192,565 | $ | — | $ | 762,227,222 | ||||||||
| Preferred Stocks* |
3,596,340 | — | — | 3,596,340 | ||||||||||||
| Exchange-Traded Funds |
8,194,232 | — | — | 8,194,232 | ||||||||||||
| Real Estate Investment Trusts* |
24,343,443 | — | — | 24,343,443 | ||||||||||||
| Total Equity |
789,168,672 | 9,192,565 | — | 798,361,237 | ||||||||||||
| Money Market Funds |
113,649,543 | — | — | 113,649,543 | ||||||||||||
| Total Investments in Securities |
$ | 902,818,215 | $ | 9,192,565 | $ | — | $ | 912,010,780 | ||||||||
| * | For further breakdown by industry, please refer to the Schedule of Investments. |
The Fund did not hold any Level 3 securities during the six months ended February 29, 2020.
In the case of foreign securities, the occurrence of certain events after the close of foreign markets, but prior to the time a Fund’s NAV is calculated (such as a significant surge or decline in the U.S. or other markets) could result in an adjustment to the trading prices of foreign securities when foreign markets open on the following business day. To the extent that such events are significant, foreign securities will be priced in their local currencies as of the close of their primary exchange market or as of the valuation time or valuation date, whichever is earlier. Foreign securities, currencies and other assets denominated in foreign currencies are translated to U.S. dollars at the exchange rate of such currencies against the U.S. dollar using the applicable currency exchange rate as of the close of the New York Stock Exchange (“NYSE”), generally at 4:00 P.M., Eastern time. The Adviser anticipates that a Fund’s portfolio holdings will be fair valued only if market quotations for those holdings are considered unreliable.
The Funds may use certain options, futures and forward foreign currency contracts (collectively, “derivative instruments”) as a substitute for a comparable market position in the underlying security, to attempt to hedge or limit the exposure of a Fund’s position, to create a synthetic money market position, for certain tax-related purposes and to effect closing transactions.
Options and futures prices can diverge from the prices of their underlying instruments. Options and futures prices are affected by such factors as current and anticipated short-term interest rates, changes in volatility of the underlying instrument and the time remaining until expiration of the contract, which may not affect security
86
PMC FUNDS
Notes to Financial Statements, continued
February 29, 2020 (Unaudited)
prices the same way. Imperfect or no correlation also may result from differing levels of demand in the options and futures markets and the securities markets, from structural differences in how options and futures and securities are traded and from imposition of daily price fluctuation limits or trading halts.
The Diversified Equity Fund did not hold derivative instruments during the six months ended February 29, 2020.
Core Fixed Income Fund
| Asset Derivatives |
Liability Derivatives |
|||||||||||||||
| Derivatives not accounted for as hedging instruments |
Statement of Assets & Liabilities Location |
Value |
Statement of Assets & Liabilities Location |
Value |
||||||||||||
| Interest Rate Contracts—Futures |
|
Net Assets— Unrealized appreciation* |
|
$ | 388,784 | |
Net Assets— Unrealized depreciation* |
|
$ | 299,337 | ||||||
| Total |
$ | 388,784 | $ | 299,337 | ||||||||||||
| * | Reflects cumulative unrealized appreciation (depreciation) of futures contracts as reported in the Schedule of Open Futures Contracts. Only the current day’s variation margin is reflected in the Statement of Assets and Liabilities. |
The effect of derivative instruments on the Statement of Operations for the six months ended February 29, 2020:
| Amount of Realized Loss on Derivatives Recognized in Income |
||||||||
| Derivatives not accounted for as hedging instruments |
Futures Contracts |
Total |
||||||
| Interest Rate Contracts |
$ | (241,880 | ) | $ | (241,880 | ) | ||
| Total |
$ | (241,880 | ) | $ | (241,880 | ) | ||
| Change in Unrealized Appreciation on Derivatives Recognized in Income |
||||||||
| Derivatives not accounted for as hedging instruments |
Futures Contracts |
Total |
||||||
| Interest Rate Contracts |
$ | 103,806 | $ | 103,806 | ||||
| Total |
$ | 103,806 | $ | 103,806 | ||||
The Funds are not subject to any Master Netting Agreements, therefore the Funds do not offset any assets or liabilities.
| (b) | Foreign Securities and Currency |
Investment securities and other assets and liabilities denominated in foreign currencies are translated into U.S. dollar amounts at the date of valuation. Purchases and sales of investment securities and income and expense items denominated in foreign currencies are translated into U.S. dollar amounts on the respective dates of such transactions.
The Funds isolate the portion of the results of operations from changes in foreign exchange rates on investments from those resulting from changes in market prices of securities held. Reported net realized foreign exchange gains or losses arise from sales of portfolio securities, sales and maturities of short-term securities, sales of foreign currencies, currency gains or losses realized between the trade and settlement dates on securities transactions, and the difference between the amounts of dividends, interest and foreign withholding taxes recorded on the Funds’ books, and the U.S. dollar equivalent of the amounts actually
87
PMC FUNDS
Notes to Financial Statements, continued
February 29, 2020 (Unaudited)
received or paid. Net unrealized foreign exchange gains and losses arise from changes in the values of assets and liabilities, including investments in securities at fiscal period end, resulting from changes in the exchange rate.
Investments in foreign securities entail certain risks. There may be a possibility of nationalization or expropriation of assets, confiscatory taxation, political or financial instability, and diplomatic developments that could affect the value of the Funds’ investments in certain foreign countries. Since foreign securities normally are denominated and traded in foreign currencies, the value of the Funds’ assets may be affected favorably or unfavorably by currency exchange rates, currency exchange control regulations, foreign withholding taxes, and restrictions or prohibitions on the repatriation of foreign currencies. There may be less information publicly available about a foreign issuer than about a U.S. issuer, and foreign issuers are not generally subject to accounting, auditing, and financial reporting standards and practices comparable to those in the United States. The securities of some foreign issuers are less liquid and at times more volatile than securities of comparable U.S. issuers.
| (c) | Futures |
The Funds may enter into futures contracts traded on domestic exchanges, including stock index futures contracts, as a substitute for a comparable market position in the underlying security, to attempt to hedge or limit the exposure of a Fund’s position, to create a synthetic money market position, for certain tax-related purposes and to effect closing transactions. Upon entering into a contract, the Funds deposit and maintain as collateral such initial margin as required by the exchange on which the transaction is effected. Pursuant to the contract, the Funds agree to receive from or pay to the broker an amount of cash equal to the daily fluctuation in value of the contract. Such receipts or payments are known as variation margin and are recorded by the Funds as unrealized gains and losses. When the contract is closed, the Funds record a realized gain or loss equal to the difference between the value of the contract at the time it was opened and the value at the time it was closed. A stock index futures contract does not involve the physical delivery of the underlying stocks in the index. As collateral for futures contracts, the Funds are required to maintain assets consisting of cash, cash equivalents or liquid securities. This collateral is required to be adjusted daily to reflect the market value of the purchase obligation for long futures contracts or the market value of the instrument underlying the contract, but not less than the market price at which the futures contract was established, for short futures contracts. At February 29, 2020, the Core Fixed Income Fund had cash and equivalents deposited as collateral with the broker for futures contracts of $1,047,132. The average monthly notional amount of futures contracts during the period was as follows:
| Long Futures |
$ | 38,396,320 | ||
| Short Futures |
$ | 4,480,566 |
The risks inherent in the use of futures contracts include 1) adverse changes in the value of such instruments and 2) the possible absence of a liquid secondary market for any particular instrument at any time. Futures contracts may also expose the Funds to counterparty credit risk. The Funds will not enter into these contracts unless they own either 1) an offsetting position in the securities or 2) the position provides cash and liquid assets with a value marked-to-market daily, sufficient to cover the counter-party’s potential obligations.
| (d) | Forward Foreign Currency Contracts |
The Core Fixed Income Fund might purchase a particular currency or enter into a forward foreign currency contract to preserve the U.S. dollar price of securities it intends to or has contracted to purchase. Alternatively, it might sell a particular currency on either a spot or forward basis to hedge against an anticipated decline in the dollar value of securities it intends to or has contracted to sell. Although this strategy could minimize the risk of loss due to a decline in the value of the hedged currency, it could also limit any potential gain from an increase in the value of the currency. When entering into a forward foreign
88
PMC FUNDS
Notes to Financial Statements, continued
February 29, 2020 (Unaudited)
currency contract, the Fund agrees to receive or deliver a fixed quantity of foreign currency for an agreed-upon price at a future date. The market value of the contract fluctuates with changes in currency exchange rates. The contract is marked-to-market daily and the change in market value is recorded by the Fund as an unrealized gain or loss. The Fund records a realized gain or loss equal to the difference between the value of the contract at the time it was opened and the value at the time it was closed. The risks inherent in the use of currency forward exchange contracts include adverse changes in the value of such instruments and exposure to counterparty credit risk. Forward contracts are subject to the risks that the counterparty to such contract will default on its obligations. Since a forward foreign currency exchange contract is not guaranteed by an exchange or clearing house, a default on the contract would deprive the Fund of unrealized profits, transaction costs or the benefits of a currency hedge or force the Fund to cover its purchase or sale commitments, if any, at the current market price. The Fund did not enter into any forward foreign currency contracts during the six months ended February 29, 2020.
| (e) | Options |
The Core Fixed Income Fund may enter into written call options to hedge against changes in the value of equities. The writing of call options is intended to reduce the volatility of the portfolio and to earn premium income. Written call options expose the Fund to minimal counterparty credit risk since they are exchange traded and the exchange’s clearing house guarantees the options against default. The Fund may also purchase put options to provide protection against adverse price effects from anticipated changes in prices of securities. In addition, the Fund may enter into written put options to hedge against changes in the value of purchased put options.
The Fund may purchase and write call and put options on securities and indices and enter into related closing transactions.
When the Fund writes an option, an amount equal to the premium received by the Fund is recorded as a liability and is subsequently adjusted to the current fair value of the option written. Premiums received from writing options that expire unexercised are treated by the Fund on the expiration date as realized gains from options written. The difference between the premium and the amount paid on effecting a closing purchase transaction, including brokerage commissions, is also treated as a realized gain, or, if the premium is less than the amount paid for the closing purchase transaction, as a realized loss. If a call option is exercised, the premium is added to the proceeds from the sale of the underlying security or currency in determining whether the Fund has realized a gain or a loss. If a put option is exercised, the premium is deducted from the cost basis of the security purchased. The Fund, as writer of an option, bears the market risk of an unfavorable change in the price of the security underlying the written option.
When purchasing options, the Fund will recognize a realized loss equal to the premium paid to purchase the option, if the option expires unexercised. The difference between the proceeds received on effecting a closing sale transaction and the premium paid will be recognized as a realized gain or loss. If a put option is exercised, the premium paid is deducted from the proceeds on the sale of the underlying security in determining whether the Fund has a realized gain or loss.
| (f) | Security Loans |
When the Funds loan securities held in their portfolios, the Funds receive compensation in the form of fees, or retain a portion of the interest on the investment of any cash received as collateral. The loans are secured by collateral at least equal to: (i) 105% of the market value of the loaned securities that are foreign securities, or 102% of the market value of any other loaned securities, at the time the securities are loaned; and (ii) 100% of the market value of the loaned securities at all times. Gain or loss in the value of securities loaned that may occur during the term of the loan will be for the account of the Funds. The Funds have the right under the lending agreement to recover the securities from the borrower on demand.
89
PMC FUNDS
Notes to Financial Statements, continued
February 29, 2020 (Unaudited)
| (g) | Federal Income Taxes |
The Funds comply with the requirements of Subchapter M of the Internal Revenue Code of 1986, as amended, necessary to qualify as a regulated investment company and make the requisite distributions of income and capital gains to their shareholders sufficient to relieve them from all or substantially all federal income taxes. Therefore, no federal income tax provision has been provided.
| (h) | Distributions to Shareholders |
The Funds will distribute net investment income and net realized long- or short-term capital gains at least annually. Distributions from net realized gains for book purposes may include short-term capital gains. All short-term capital gains are included in ordinary income for tax purposes. Distributions to shareholders are recorded on the ex-dividend date. The Funds may also pay a special distribution at the end of the calendar year to comply with federal tax requirements.
| (i) | Use of Estimates |
The preparation of financial statements in conformity with GAAP requires management to make estimates and assumptions that affect the reported amounts of assets and liabilities and disclosure of contingent assets and liabilities at the date of the financial statements and the reported amounts of revenues and expenses during the reporting period. Actual results could differ from those estimates.
| (j) | Share Valuation |
The NAV per share of a Fund is calculated by dividing the sum of the value of the securities held by the Fund, plus cash or other assets, minus all liabilities (including estimated accrued expenses) by the total number of shares outstanding for the Fund, rounded to the nearest cent. The Funds’ shares will not be priced on the days on which the NYSE is closed for trading. The Funds no longer charge a redemption fee, therefore the offering and redemption price per share are equal to a Fund’s net asset value per share.
| (k) | Allocation of Income, Expenses and Gains/Losses |
Income, expenses (other than those deemed attributable to a specific share class), and gains and losses of each Fund are allocated daily to each class of shares based upon the ratio of net assets represented by each class as a percentage of the net assets of the Fund. Expenses deemed directly attributable to a class of shares are recorded by the specific class. Most expenses are allocated by class based on relative net assets. Distribution (Rule 12b-1) fees are expensed at 0.25% of average daily net assets of the Advisor Class shares of the Funds. Expenses associated with a specific fund in the Trust are charged to that fund. Common expenses are typically allocated evenly between the funds of the Trust or other equitable means.
| (l) | Other |
Investment transactions are recorded on the trade date. The Funds determine the gain or loss from investment transactions on the identified cost basis by comparing the original cost of the security lot sold with the net sale proceeds. Dividend income is recognized on the ex-dividend date, and interest income is recognized on an accrual basis.
90
PMC FUNDS
Notes to Financial Statements, continued
February 29, 2020 (Unaudited)
| (3) | Federal Tax Matters |
The tax character of distributions paid to shareholders were as follows:
| Core Fixed Income Fund |
Ordinary Income |
Long-Term Capital Gains |
||||||
| Year Ended August 31, 2019 |
$ | 9,356,313 | $ | — | ||||
| Year Ended August 31, 2018 |
5,812,230 | 4,399 | ||||||
| Diversified Equity Fund |
Ordinary Income |
Long-Term Capital Gains |
||||||
| Year Ended August 31, 2019 |
$ | 17,179,903 | $ | 65,726,487 | ||||
| Year Ended August 31, 2018 |
13,699,923 | 25,776,705 | ||||||
As of August 31, 2019, the components of accumulated earnings (losses) for income tax purposes were as follows:
| Core Fixed Income Fund |
Diversified Equity Fund |
|||||||
| Cost basis of investments for federal income tax purposes |
$ | 429,703,619 | $ | 937,399,954 | ||||
| Gross tax unrealized appreciation |
$ | 18,610,605 | $ | 87,228,287 | ||||
| Gross tax unrealized depreciation |
(1,654,128 | ) | (48,673,962 | ) | ||||
| Net tax unrealized appreciation |
$ | 16,956,477 | $ | 38,554,325 | ||||
| Undistributed ordinary income |
$ | 6,795,317 | $ | 11,441,933 | ||||
| Undistributed long-term capital gain |
— | — | ||||||
| Total distributable earnings |
$ | 6,795,317 | $ | 11,441,933 | ||||
| Other accumulated loss |
(1,317,917 | ) | (19,451,465 | ) | ||||
| Total accumulated earnings |
$ | 22,433,877 | $ | 30,544,793 | ||||
The difference between book-basis and tax-basis cost is attributable primarily to the tax deferral of losses on wash sale adjustments.
As of and for the year ended August 31, 2019, the Core Fixed Income Fund utilized short-term capital loss carryovers of $3,291,733, generated long-term capital loss carryovers of $163,778, and had long-term capital loss carryovers outstanding of $1,317,917. As of and for the year ended August 31, 2019, the Diversified Equity Fund generated short-term capital loss carryovers of $19,076,670. Capital loss carryovers are carried forward indefinitely to offset future realized capital gains. To the extent the Funds realize future net capital gains, taxable distributions to shareholders will be offset by any unused capital loss carryovers from the year ended August 31, 2019.
Additionally, GAAP requires that certain components of net assets relating to permanent differences be reclassified between financial and tax reporting. These reclassifications have no effect on net assets or net asset value per share. For the year ended August 31, 2019, the following table shows the reclassifications made:
| Core Fixed Income Fund |
Diversified Equity Fund |
|||||||
| Total distributable earnings |
$ | 1,464 | $ | — | ||||
| Paid In Capital |
$ | (1,464 | ) | $ | — | |||
The Funds had no material uncertain tax positions and have not recorded a liability for unrecognized tax benefits as of August 31, 2019. Also, the Funds had recognized no interest and penalties related to uncertain
91
PMC FUNDS
Notes to Financial Statements, continued
February 29, 2020 (Unaudited)
tax benefits in fiscal year 2019. At August 31, 2019, the fiscal years 2016 through 2019 remain open to examination in the Funds’ major tax jurisdictions.
| (4) | Investment Adviser |
The Trust has entered into an Investment Advisory Agreement (the “Agreement”), on behalf of the Funds, with the Adviser to furnish investment advisory services to the Funds. Under terms of the Agreement, the Trust, on behalf of the Funds, compensates the Adviser for its management services at the annual rate of 0.53% for the Diversified Equity Fund and 0.80% for the Core Fixed Income Fund of each Fund’s average daily net assets.
The Adviser has contractually agreed to waive its management fees and/or reimburse a Fund’s other expenses at least through December 29, 2020 to the extent necessary to ensure that the Fund’s total annual operating expenses (excluding front-end or contingent deferred sales loads, Rule 12b-1 plan fees, shareholder servicing plan fees, taxes, leverage, interest, brokerage commissions, expenses incurred in connections with any merger or reorganizations, acquired fund fees and expenses, or extraordinary expenses such as litigation) do not exceed 0.75% for the Core Fixed Income Fund and 0.73% for the Diversified Equity Fund (the “Expense Limitation Cap”) of each Fund’s average daily net assets.
Any such waiver or reimbursement is subject to later adjustment to allow the Adviser to recoup amounts waived or reimbursed to the extent actual fees and expenses for a fiscal period do not exceed the lesser of: (1) the Expense Limitation Cap in place at the time of the waiver or reimbursement or (2) the Expense Limitation Cap in place at the time of recoupment; provided, however, that the Adviser shall only be entitled to recoup such amounts over the following three year period from the date of the waiver or reimbursement. During the six months ended February 29, 2020, the Adviser recouped previously waived expenses of $104,095 related to the Diversified Equity Fund.
The following table shows the remaining waived or reimbursed expenses subject to potential recovery expiring by:
| Core Fixed Income Fund |
Diversified Equity Fund |
|||||||
| August 31, 2020 |
$ | 465,718 | $ | 111,655 | ||||
| August 31, 2021 |
$ | 1,083,011 | $ | 64,044 | ||||
| August 31, 2022 |
$ | 1,137,251 | $ | — | ||||
| February 28, 2023 |
$ | 602,464 | $ | — | ||||
Sub-advisory services are provided to the Core Fixed Income Fund, pursuant to agreements between the Adviser and the below listed sub-advisers. Under the terms of these sub-advisory agreements, the Adviser compensates the sub-advisers based on the Fund’s average daily net assets.
Core Fixed Income Fund
Neuberger Berman Investment Advisers LLC
Schroder Investment Management North America Inc.
| (5) | Distribution Plan |
The Trust has adopted a Distribution Plan pursuant to Rule 12b-1 under the 1940 Act (the “12b-1 Plan”), on behalf of the Funds, which authorizes the Trust to pay Foreside Fund Services, LLC (the “Distributor”), the Funds’ principal distributor, a distribution fee of 0.25% of each Fund’s average daily net assets of Advisor Class shares. During the six months ended February 29, 2020, the Funds incurred fees pursuant to the 12b-1 Plan as follows:
| Core Fixed Income Fund |
$ | 290,564 | ||
| Diversified Equity Fund |
$ | 601,413 |
92
PMC FUNDS
Notes to Financial Statements, continued
February 29, 2020 (Unaudited)
| (6) | Related Party Transactions |
U.S. Bancorp Fund Services, LLC (doing business as U.S. Bank Global Fund Services (“Fund Services”)) acts as the Funds’ Administrator under an Administration Agreement. Fund Services prepares various federal and state regulatory filings, reports and returns for the Funds; prepares reports and materials to be supplied to the Trustees; monitors the activities of the Funds’ custodian, transfer agent and accountants; coordinates the preparation and payment of the Funds’ expenses and reviews the Funds’ expense accruals. Fees incurred for the six months ended February 29, 2020, and owed as of February 29, 2020 are as follows:
| Incurred |
Owed |
|||||||
| Core Fixed Income Fund |
$ | 106,536 | $ | 53,493 | ||||
| Diversified Equity Fund |
$ | 201,977 | $ | 100,971 | ||||
Fund Services also serves as the fund accountant and transfer agent to the Funds. U.S. Bank, N.A. (“US Bank”), an affiliate of Fund Services, serves as each Fund’s custodian. Fees incurred for the year ended February 29, 2020, and owed as of February 29, 2020 are as follows:
| Fund Accounting |
Incurred |
Owed |
||||||
| Core Fixed Income Fund |
$ | 103,763 | $ | 51,782 | ||||
| Diversified Equity Fund |
$ | 128,002 | $ | 61,823 | ||||
| Transfer Agency |
Incurred |
Owed |
||||||
| Core Fixed Income Fund |
$ | 150,603 | $ | 68,296 | ||||
| Diversified Equity Fund |
$ | 203,772 | $ | 91,413 | ||||
| Custody |
Incurred |
Owed |
||||||
| Core Fixed Income Fund |
$ | 41,701 | $ | 21,358 | ||||
| Diversified Equity Fund |
$ | 63,989 | $ | 37,798 | ||||
The Funds each have a line of credit with US Bank (see Note 8).
Certain officers of the Funds are also employees of Fund Services. A Trustee of the Trust is affiliated with Fund Services and U.S. Bank.
The Trust’s Chief Compliance Officer is also an employee of Fund Services. Each Fund’s allocation of the Trust’s Chief Compliance Officer fee incurred for the six months ended February 29, 2020, and owed as of February 29, 2020 is as follows:
| Incurred |
Owed |
|||||||
| Core Fixed Income Fund |
$ | 10,556 | $ | 5,279 | ||||
| Diversified Equity Fund |
$ | 5,555 | $ | 2,774 | ||||
93
PMC FUNDS
Notes to Financial Statements, continued
February 29, 2020 (Unaudited)
| (7) | Investment Transactions |
Purchases and sales of investment securities (excluding short-term instruments) for the six months ended February 29, 2020 are summarized below.
| Core Fixed Income Fund |
Diversified Equity Fund |
|||||||
| Purchases: |
||||||||
| U.S. Government |
$ | 144,978,165 | $ | — | ||||
| Other |
102,936,802 | 82,664,767 | ||||||
| Total Purchases |
$ | 247,914,967 | $ | 82,664,767 | ||||
| Sales |
||||||||
| U.S. Government |
$ | 127,128,615 | $ | — | ||||
| Other |
115,998,984 | 85,422,587 | ||||||
| Total Sales |
$ | 243,127,599 | $ | 85,422,587 | ||||
| (8) | Line of Credit |
At February 29, 2020, the Core Fixed Income Fund and Diversified Equity Fund had secured lines of credit in the lessor amount of $20,000,000 and $35,000,000, respectively, or 33.33% of the fair value of unencumbered assets of each Fund, as defined, which both mature August 8, 2020. These secured lines of credit are intended to provide short-term financing, if necessary, subject to certain restrictions, in connection with shareholder redemptions. The Funds’ securities serve as collateral for the lines of credit. The credit facility is with the Funds’ custodian, US Bank. Interest was scheduled to be incurred at the bank’s prime rate of 5.25% from September 1, 2019 through September 18, 2019, 5.00% from September 19, 2019 through October 30, 2019, and 4.75% thereafter. The Funds did not borrow on the line of credit during the six months ended February 29, 2020.
| (9) | Securities Lending |
Pursuant to the terms of a securities lending agreement with the Funds’ custodian, each Fund may lend securities from its portfolio to brokers, dealers and financial institutions in order to increase the return on its portfolio, primarily through the receipt of borrowing fees and earnings on invested collateral. Any such loan must be continuously secured by collateral in cash or cash equivalents maintained on a current basis in an amount at least equal to the market value of the securities loaned by a Fund. During the time securities are on loan, the borrower will pay the applicable Fund any accrued income on those securities, and the Fund may invest the cash collateral and earn income or receive an agreed-upon fee from a borrower that has delivered cash-equivalent collateral. In determining whether or not to lend a security to a particular broker, dealer or financial institution, the Adviser considers all relevant facts and circumstances, including the size, creditworthiness and reputation of the broker, dealer or financial institution.
Securities lending involves the risk of a default or insolvency of the borrower. In either of these cases, a Fund could experience delays in recovering securities or collateral or could lose all or part of the value of the loaned securities. A Fund also could lose money in the event of a decline in the value of the collateral provided for loaned securities. Additionally, the loaned portfolio securities may not be available to a Fund on a timely basis and that Fund may therefore lose the opportunity to sell the securities at a desirable price. Any decline in the value of a security that occurs while the security is out on loan would continue to be borne by the applicable Fund.
94
PMC FUNDS
Notes to Financial Statements, continued
February 29, 2020 (Unaudited)
As of February 29, 2020, the market value of the securities on loan and value of collateral received for securities lending were as follows:
| Loaned Securities Market Value |
Value of Cash Collateral |
% of Net Assets |
||||||||||
| Core Fixed Income Fund |
$ | 62,198,507 | $ | 62,786,009 | 14.94 | % | ||||||
| Diversified Equity Fund |
$ | 96,851,240 | $ | 100,626,957 | 11.94 | % | ||||||
The Funds receive cash as collateral in return for securities lent as part of the securities lending program. The collateral is invested in the Mount Vernon Liquid Assets Portfolio, LLC. The Schedule of Investments for each Fund includes the particular cash collateral holding as of February 29, 2020. The remaining contractual maturity of all securities lending transactions is overnight and continuous.
The Funds are not subject to a master netting agreement with respect to securities lending; therefore, no additional disclosures regarding netting arrangements are required.
The fee and interest income earned by the Funds on investments of cash collateral received from borrowers for the securities loaned to them are reflected in the Funds’ Statements of Operations.
| (10) | Subsequent Event |
Recent Market Events Risk. U.S. and international markets have experienced significant periods of volatility in recent years due to a number of economic, political and global macro factors including the impact of the coronavirus (COVID-19) as a global pandemic and related public health issues, growth concerns in the U.S. and overseas, uncertainties regarding interest rates, trade tensions and the threat of tariffs imposed by the U.S. and other countries. These developments as well as other events, such as the U.S. presidential election, could result in further market volatility and negatively affect financial asset prices, the liquidity of certain securities and the normal operations of securities exchanges and other markets. As a result, the risk environment remains elevated. The Funds’ investment adviser will monitor developments and seek to manage each Fund in a manner consistent with achieving the Fund’s investment objective, but there can be no assurance that it will be successful in doing so.
95
Notice of Privacy Policy & Practices
We collect non-public personal information about you from the following sources:
| • | information we receive about you on applications or other forms; |
| • | information you give us orally; and |
| • | information about your transactions with us or others. |
We do not disclose any non-public personal information about our shareholders or former shareholders without the shareholder’s authorization, except as permitted by law or in response to inquiries from governmental authorities. We may share information with affiliated parties and unaffiliated third parties with whom we have contracts for servicing the Funds. We will provide unaffiliated third parties with only the information necessary to carry out their assigned responsibility. All shareholder records will be disposed of in accordance with applicable law. We maintain physical, electronic and procedural safeguards to protect your non-public personal information and require third parties to treat your non-public personal information with the same high degree of confidentiality.
In the event that you hold shares of the Funds through a financial intermediary, including, but not limited to, a broker-dealer, bank or trust company, the privacy policy of your financial intermediary would govern how your non-public personal information would be shared with unaffiliated third parties.
96
PMC FUNDS
(Unaudited)
Tax Information
For the fiscal year ended August 31, 2019, certain dividends paid by the Funds may be subject to a maximum tax rate of 15%, as provided for by the Jobs and Growth Tax Relief Reconciliation Act of 2003. The percentage of dividends declared from ordinary income designated as qualified dividend income was as follows:
| Core Fixed Income Fund |
0.00 | % | ||
| Diversified Equity Fund |
61.38 | % |
For corporate shareholders, the percent of ordinary income distributions qualifying for the corporate dividends received deduction for the fiscal year ended August 31, 2019 was as follows:
| Core Fixed Income Fund |
0.00 | % | ||
| Diversified Equity Fund |
30.95 | % |
For the fiscal year ended August 31, 2019, taxable ordinary income distributions are designated as short-term capital gain distributions under Internal Revenue Code Section 871(k)(2)(c) for the Funds as follows:
| Core Fixed Income Fund |
0.00 | % | ||
| Diversified Equity Fund |
70.25 | % |
Indemnification
Under the Trust’s organizational documents, its officers and Trustees are indemnified against certain liabilities arising out of the performance of their duties to the Funds. In addition, in the normal course of business, the Funds enter into contracts that provide general indemnifications to other parties. The Funds’ maximum exposure under these arrangements is unknown as this would involve future claims that may be made against the Funds that have not yet occurred. However, the Funds have not had prior claims or losses pursuant to these contracts and expect the risk of loss to be remote.
Information about Trustees
The business and affairs of the Trust are managed under the direction of the Trust’s Board of Trustees. Information pertaining to the Trustees of the Trust is set forth below. The Funds’ Statement of Additional Information includes additional information about the Trust’s Trustees and is available, without charge, upon request by calling (866) PMC-7338.
97
PMC Funds
Additional Information (Continued)
(Unaudited)
Independent Trustees
| Name, Address and |
Position(s) |
Term of |
Number of |
Principal Occupation(s) |
Other Directorships | |||||
| Michael D. Akers, Ph.D. 615 E. Michigan St. Milwaukee, WI 53202 Year of Birth: 1955 |
Trustee | Indefinite Term; Since August 22, 2001 | 19 |
Professor Emeritus, Department of Accounting (June 2019-present), Professor, Department of Accounting (2004-2019), Chair, Department of Accounting (2004-2017), Marquette University. | Independent Trustee, USA MUTUALS (an open-end investment company with two portfolios). | |||||
| Gary A. Drska 615 E. Michigan St. Milwaukee, WI 53202 Year of Birth: 1956 |
Trustee | Indefinite Term; Since August 22, 2001 | 19 |
Pilot, Frontier/Midwest Airlines, Inc. (airline company) (1986-present). | Independent Trustee, USA MUTUALS (an open-end investment company with two portfolios). | |||||
| Jonas B. Siegel 615 E. Michigan St. Milwaukee, WI 53202 Year of Birth: 1943 |
Trustee | Indefinite Term; Since October 23, 2009 | 19 | Retired (2011-present); Managing Director, Chief Administrative Officer (“CAO”) and Chief Compliance Officer (“CCO”), Granite Capital International Group, L.P. (an investment management firm) (1994-2011). | Independent Trustee, Gottex Trust (an open-end investment company) (2010-2016). | |||||
| Interested Trustee and Officers | ||||||||||
| Joseph C. Neuberger* 615 E. Michigan St. Milwaukee, WI 53202 Year of Birth: 1962 |
Chairperson and Trustee | Indefinite Term; Since August 22, 2001 | 19 |
President (2017-present), Chief Operating Officer (2016-present), Executive Vice President (1994-2017), U.S. Bancorp Fund Services, LLC. | Trustee, Buffalo Funds (an open-end investment company) (2003-2017); Trustee, USA MUTUALS (an open-end investment company) (2001-2018). | |||||
| John P. Buckel 615 E. Michigan St. Milwaukee, WI 53202 Year of Birth: 1957 |
President and Principal Executive Officer | Indefinite Term; Since January 24, 2013 | N/A | Vice President, U.S. Bancorp Fund Services, LLC (2004-present). | N/A | |||||
| Jennifer A. Lima 615 E. Michigan St. Milwaukee, WI 53202 Year of Birth: 1974 |
Vice President, Treasurer and Principal Financial and Accounting Officer | Indefinite Term; Since January 24, 2013 | N/A | Vice President, U.S. Bancorp Fund Services, LLC (2002-present). | N/A | |||||
98
PMC Funds
Additional Information (Continued)
(Unaudited)
| Name, Address and |
Position(s) |
Term of |
Number of |
Principal Occupation(s) |
Other Directorships | |||||
| Elizabeth B. Scalf 615 E. Michigan St. Milwaukee, WI 53202 Year of Birth: 1985 |
Chief Compliance Officer, Vice President and Anti-Money Laundering Officer | Indefinite Term; Since July 1, 2017 | N/A | Senior Vice President, U.S. Bancorp Fund Services, LLC (February 2017-present); Vice President and Assistant CCO, Heartland Advisors, Inc. (December 2016-January 2017); Vice President and CCO, Heartland Group, Inc. (May 2016-November 2016); Vice President, CCO and Senior Legal Counsel (May 2016-November 2016), Assistant CCO and Senior Legal Counsel (January 2016-April 2016), Senior Legal and Compliance Counsel (2013-2015), Heartland Advisors, Inc. | N/A | |||||
| Jay S. Fitton 615 E. Michigan St. Milwaukee, WI 53202 Year of Birth: 1970 |
Secretary | Indefinite Term; Since July 22, 2019 | N/A | Assistant Vice President, U.S. Bancorp Fund Services, LLC (2019-present); Partner, Practus, LLP (2018-2019); Counsel, Drinker Biddle & Reath LLP (2016-2018); Counsel, Huntington Bancshares, Inc. (2011-2015). | N/A | |||||
| Kelly A. Burns 615 E. Michigan St. Milwaukee, WI 53202 Year of Birth: 1987 |
Assistant Treasurer | Indefinite Term; Since April 23, 2015 | N/A | Assistant Vice President, U.S. Bancorp Fund Services, LLC (2011-present). | N/A | |||||
| Melissa Aguinaga 615 E. Michigan St. Milwaukee, WI 53202 Year of Birth: 1987 |
Assistant Treasurer | Indefinite Term; Since July 1, 2015 | N/A | Assistant Vice President, U.S. Bancorp Fund Services, LLC (2010-present). | N/A | |||||
| Laura Carroll 615 E. Michigan St. Milwaukee, WI 53202 Year of Birth: 1985 |
Assistant Treasurer | Indefinite Term; Since August 20, 2018 | N/A | Assistant Vice President, U.S. Bancorp Fund Services, LLC (2007-present). | N/A | |||||
| * | Mr. Neuberger is deemed to be an “interested person” of the Trust as defined by the 1940 Act due to his position and material business relationship with the Trust. |
99
A NOTE ON FORWARD LOOKING STATEMENTS
Except for historical information contained in this report for the Funds, the matters discussed in this report may constitute forward-looking statements made pursuant to the safe-harbor provisions of the Securities Litigation Reform Act of 1995. These include any Adviser, sub-adviser or portfolio manager predictions, assessments, analyses or outlooks for individual securities, industries, market sectors and/or markets. These statements involve risks and uncertainties. In addition to the general risks described for the Funds in the current Prospectus, other factors bearing on this report include the accuracy of the Adviser’s, sub-adviser’s or portfolio manager’s forecasts and predictions, and the appropriateness of the investment programs designed by the Adviser, sub-adviser or portfolio manager to implement their strategies efficiently and effectively. Any one or more of these factors, as well as other risks affecting the securities markets and investment instruments generally, could cause the actual results of the Funds to differ materially as compared to benchmarks associated with the Funds.
ADDITIONAL INFORMATION
The Funds have adopted proxy voting policies and procedures that delegate to the Adviser the authority to vote proxies. A description of the Funds’ proxy voting policies and procedures is available without charge, upon request, by calling the Funds toll free at (866) PMC-7338. A description of these policies and procedures is also included in the Funds’ Statement of Additional Information, which is available on the SEC’s website at http://www.sec.gov.
The Funds’ proxy voting record for the most recent 12-month period ended June 30 is available without charge, either upon request by calling the Funds toll free at (866) PMC-7338 or by accessing the SEC’s website at http://www.sec.gov.
The Funds file their complete schedule of portfolio holdings with the SEC for the first and third quarters of each fiscal year on Part F of Form N-PORT. Shareholders may view the Funds’ Part F of Form N-PORT on the SEC’s website at http://www.sec.gov.
HOUSEHOLDING
In an effort to decrease costs, the Funds intend to reduce the number of duplicate prospectuses and annual and semi-annual reports you receive by sending only one copy of each to those addresses shared by two or more accounts and to shareholders we reasonably believe are from the same family or household. Once implemented, if you would like to discontinue householding for your accounts, please call toll-free at (866) PMC-7338 to request individual copies of these documents. Once the Funds receive notice to stop householding, we will begin sending individual copies 30 days after receiving your request. This policy does not apply to account statements.
PMC FUNDS
| Investment Adviser |
Envestnet Asset Management, Inc. 35 East Wacker Drive, 24th Floor Chicago, Illinois 60601 | |
| Legal Counsel |
Godfrey & Kahn, S.C. 833 East Michigan Street, Suite 1800 Milwaukee, Wisconsin 53202 | |
| Independent Registered Public Accounting Firm |
Deloitte & Touche LLP 555 East Wells Street Milwaukee, Wisconsin 53202 | |
| Transfer Agent, Fund Accountant and Fund Administrator |
U.S. Bancorp Fund Services, LLC 615 East Michigan Street Milwaukee, Wisconsin 53202 | |
| Custodian |
U.S. Bank, N.A. Custody Operations 1555 North RiverCenter Drive Suite 302 Milwaukee, Wisconsin 53212 | |
| Distributor |
Foreside Fund Services, LLC 3 Canal Plaza, Suite 100 Portland, Maine 04101 | |
This report is intended for shareholders of the Funds and may not be used as sales literature unless preceded or accompanied by a current prospectus.
Item 2. Code of Ethics.
Not applicable for semi-annual reports.
Item 3. Audit Committee Financial Expert.
Not applicable for semi-annual reports.
Item 4. Principal Accountant Fees and Services.
Not applicable for semi-annual reports.
Item 5. Audit Committee of Listed Registrants.
Not applicable to registrants who are not listed issuers (as defined in Rule 10A-3 under the Securities Exchange Act of 1934).
Item 6. Investments.
|
(a) |
Schedule of Investments is included as part of the report to shareholders filed under Item 1 of this Form. |
|
(b) |
Not Applicable. |
Item 7. Disclosure of Proxy Voting Policies and Procedures for Closed-End Management Investment Companies.
Not applicable to open-end investment companies.
Item 8. Portfolio Managers of Closed-End Management Investment Companies.
Not applicable to open-end investment companies.
Item 9. Purchases of Equity Securities by Closed‑End Management Investment Company and Affiliated Purchasers.
Not applicable to open-end investment companies.
Item 10. Submission of Matters to a Vote of Security Holders.
There have been no material changes to the procedures by which shareholders may recommend nominees to the registrant’s board of trustees.
Item 11. Controls and Procedures.
|
(a) |
The Registrant’s President and Treasurer have reviewed the Registrant's disclosure controls and procedures (as defined in Rule 30a-3(c) under the Investment Company Act of 1940 (the “Act”)) as of a date within 90 days of the filing of this report, as required by Rule 30a-3(b) under the Act and Rules 13a-15(b) or 15d‑15(b) under the Securities Exchange Act of 1934. Based on their review, such officers have concluded that the disclosure controls and procedures are effective in ensuring that information required to be disclosed in this report is appropriately recorded, processed, summarized and reported and made known to them by others within the Registrant and by the Registrant’s service provider. |
|
(b) |
There were no changes in the Registrant's internal control over financial reporting (as defined in Rule 30a-3(d) under the Act) that occurred during the last fiscal half-year of the period covered by this report that has materially affected, or is reasonably likely to materially affect, the Registrant's internal control over financial reporting. |
Item 12. Disclosure of Securities Lending Activities for Closed-End Management Investment Companies.
Not applicable to open-end investment companies.
Item 13. Exhibits.
|
(a) |
(1) Any code of ethics or amendment thereto, that is the subject of the disclosure required by Item 2, to the extent that the registrant intends to satisfy Item 2 requirements through filing an exhibit. Incorporated by reference to previous Form N-CSR filed on November 9, 2009. |
(3) Any written solicitation to purchase securities under Rule 23c‑1 under the Act sent or given during the period covered by the report by or on behalf of the registrant to 10 or more persons. Not applicable to open-end investment companies.
(4) Change in the registrant’s independent public accountant. There was no change in the registrant’s independent public accountant for the period covered by this report.
SIGNATURES
Pursuant to the requirements of the Securities Exchange Act of 1934 and the Investment Company Act of 1940, the registrant has duly caused this report to be signed on its behalf by the undersigned, thereunto duly authorized.
(Registrant) Trust for Professional Managers
By (Signature and Title)* /s/ John Buckel
John Buckel, President
Date 4/30/20
Pursuant to the requirements of the Securities Exchange Act of 1934 and the Investment Company Act of 1940, this report has been signed below by the following persons on behalf of the registrant and in the capacities and on the dates indicated.
By (Signature and Title)*/s/ John Buckel
John Buckel, President
Date 4/30/20
By (Signature and Title)* /s/ Jennifer Lima
Jennifer Lima, Treasurer
Date 4/30/20
* Print the name and title of each signing officer under his or her signature.