Table of Contents
UNITED STATES
SECURITIES AND EXCHANGE COMMISSION
Washington, D.C. 20549
FORM N-CSR
CERTIFIED SHAREHOLDER REPORT OF REGISTERED
MANAGEMENT INVESTMENT COMPANIES
Investment Company Act file number 811-10401
Trust for Professional Managers
(Exact name of registrant as specified in charter)
615 East Michigan Street
Milwaukee, WI 53202
(Address of principal executive offices) (Zip code)
Jay Fitton
U.S. Bancorp Fund Services, LLC
615 East Michigan Street
Milwaukee, WI 53202
(Name and address of agent for service)
(513) 629-8104
Registrant’s telephone number, including area code
Date of fiscal year end: December 31, 2019
Date of reporting period: June 30, 2019
Table of Contents
| Item 1. | Reports to Stockholders. |
Table of Contents
Marketfield Fund
Semi-Annual Report

June 30, 2019
Investment Adviser
Marketfield Asset Management LLC
60 East 42nd Street
36th Floor
New York, New York 10165
www.marketfield.com
Beginning on January 1, 2021, as permitted by regulations adopted by the U.S. Securities and Exchange Commission, paper copies of the Fund’s annual and semi-annual shareholder reports will no longer be sent by mail, unless you specifically request paper copies of the reports from the Fund or from your financial intermediary (such as a broker-dealer or bank). Instead, the reports will be made available on a website, and you will be notified by mail each time a report is posted and provided with a website link to access the report.
If you already elected to receive shareholder reports electronically, you will not be affected by this change and you need not take any action. You may elect to receive shareholder reports and other communications from the Fund electronically by contacting your financial intermediary or, if you are a direct investor, by calling the Fund at 1-800-311-MKTD (6583).
You may elect to receive all future reports in paper free of charge. To request that you continue to receive paper copies of your shareholder reports, you can contact your financial intermediary if you invest through the financial intermediary, or if you invest directly with the Fund, you can call the Fund at 1-800-311-MKTD (6583). Your election to receive reports in paper form will apply to all funds held in your account with your financial intermediary.
Table of Contents
| 1 | ||||
| 6 | ||||
| 8 | ||||
| 11 | ||||
| 14 | ||||
| 15 | ||||
| 15 | ||||
| 16 | ||||
| 18 | ||||
| 19 | ||||
| 20 | ||||
| 24 | ||||
| 36 | ||||
| 37 | ||||
Table of Contents
The Class I shares of the Marketfield Fund (the “Fund”) generated a return of 7.60% in the first half of 2019 compared to a 18.54% return by the S&P 500® Index. We believe the U.S./China trade dispute was by far the greatest influence on portfolio performance over the period.
There was little variety across our various exposures with most contributing either small profits or losses towards the overall results. Homebuilding did continue its recovery from 2018 losses and continues to be a core focus for our U.S. exposure. Japan also did somewhat better than during the first quarter, mostly a reflection of single stock exposure within the portfolio.
The performance of commodity related exposure was mixed. The small Energy exposure continues to perform poorly even though oil prices were steady over the six-month period, and although the overall loss was not significant, we have yet to see any reason to engage further with this sector despite a relatively benign pricing environment for crude oil. There were some signs of life in gold, palladium, and iron ore, with stronger metal pricing feeding into the underlying equities and delivering strong gains. Thus, although we are not in a traditional reflationary environment, there are increasing pockets of strength within the commodity complex.
Our large emerging market exposure contributed a small gain, outperforming most broad emerging market indexes which showed a small loss for the six-month period. Within our portfolio, exposure to Russia, Brazil, and Taiwan were the strongest regions, with Chile, Korea and Mainland China were the weakest. Most of the above variances can be linked to sentiment over the trade dispute and the shift in investor flows that dominated the quarter.
On the short side of our portfolio, the NASDAQ 100 hedge hurt performance overall but did decline sharply during the May drawdown. Real Estate shorts contributed a small profit over the six-month period, with gains from office REITs more than covering losses in residential REITs.
Overall, the portfolio remains positioned towards a resumption of global growth that we anticipate will be helped by the considerable easing of global monetary policy and significant decline in global sovereign and credit yields. As we discuss below, although the latter has been viewed as evidence of a slowing global economy, it often leads to a pickup in performance of both data and economically sensitive sectors.
July 11, 2019
Michael Shaoul
Chairman, CEO & Portfolio Manager
Chief Investment Officer’s Report
Recent strength in bond markets is widely cited as a harbinger of impending economic weakness and a rationale for a turn back to easing by the Federal Reserve.
The idea that trends in bond prices carry some special prognostic signal about future economic conditions has gained traction in recent years.
The facts suggest otherwise. Energetic rallies in high-grade bonds (declines in yield) have occurred in the aftermath of weak financial conditions. Bonds had sharp rallies in 1971, 1976, 1980 and 1986, just prior to sharp accelerations in nominal Gross Domestic Product (GDP) and inflation.
1
Table of Contents
Bond market rallies in the 1990s in response to the Mexican financial crisis of 1994-95, the Asian currency crises of 1997-98 and the subsequent demise of Long Term Capital Management in 1998 all occurred on the cusp of accelerations in the economy and equity markets.
During the past two decades, bond yields plunged in the wake of the 2008 global panic and again in 2015-16 following the collapse in oil prices. Both instances set the stage for strong recoveries in activity and risk markets.
The ability of changes in borrowing costs to powerfully influence future economic conditions is often overlooked in citations of bond yields and interest rates as leading economic indicators. Dramatic rises or falls in interest rates across the yield curve produce important, if not determinative, changes in business conditions among sectors that are meaningfully affected by borrowing and refinancing costs.
Interest rate sensitivity in various portions of the overall economy changes from one cycle to the next, resulting in very different points of response to large moves in bond and money markets.
Rising rates in 1984 destroyed the Savings and Loan (S&L) industry and set in motion the final washout in energy markets and activity. Tightening in at the turn of the millennium undermined the entire technology and internet craze, while the subsequent easing set the housing boom in motion and reignited interest in emerging markets.
Price cycles in particular sectors or themes that develop reinforcing credit dynamics act as focal points of risk once interest rate and credit conditions become less accommodative. When margin lending dominated bank credit growth in the late 1920s, stocks were the beneficiaries in the expansion phase and the epicenter of risk once the credit cycle turned. The ensuing calamity metastasized through the banking system, ushering in an economic depression, deflation and a litany of regulation meant to prevent another credit cycle focused on heavily margined public equities.
Trends in government bond prices and other high-grade rates do not predict outcomes in the real economy as much as provoke them. Falling market rates in the absence of crisis do not indicate impending weakness, but do set the stage for more robust activity in parts of the economy that are sensitive to borrowing costs. By contrast, when market rates rise over the course of several quarters, depressive effects will emerge in sectors that have relied on supportive financing conditions.
In the post 2009 monetary cycle, abundant, cheap credit has been a crucial driver of large-scale asset price inflation. Luxury properties, art, equities and private venture capital-backed businesses have been prime beneficiaries. Prices have expanded to unprecedented heights across a far-reaching landscape of investable media.
Little of this shows forth in traditional inflation indices, but consumption goods have, at best, a tertiary sensitivity to monetary conditions. Central banks directly influence asset prices, which, oddly enough, are ignored in their calculations of inflation.
When credit-propelled asset inflations suffer their inevitable reversals, the ensuing deflation can undermine financial stability across capital markets and the banking system without registering any deflationary pressures on the measures that the Federal Reserve relies on to warn of impending deflation. This was the dynamic in 2008.
Credit expansions are built on collateral. Consumption goods are, in large part, insufficiently long-lived to serve as collateral for loans with durations beyond those found in money markets instruments. Credit expansions past the very front of the yield curve rely on long duration assets for collateral backing. Inflationary effects on favored collateral forms occur in a world apart from the main constituents of the indices that measure consumer prices.
2
Table of Contents
Current deflationary risks are concentrated in assets that have enjoyed the monetary inflation of the past decade. As mentioned above, these include luxury property, art, financial assets and start-up businesses backed by venture capital investors. Most of these markets have reached a point at which supply is functionally limitless. Prices are either stagnant or in the early stages of decline.
Deflation in any or all of these sectors will begin to close the gap in relative wealth that has dominated political discourse during the past decade. In that sense, there will be little popular pressure for rescue efforts by official bodies.
As deflation in “elite” asset markets takes hold, goods and services in the real economy look poised for an extensive cycle of absolute and relative expansion.
Every major geopolitical trend is, at present, supportive of inflation in the real economy.
With nominal GDP running at its fastest annual rate of change (5.1%) since the panic of 2008, the Federal Reserve seems intent upon loosening. At the very least they have abandoned the recent tightening bias.
High yield spreads are at the low end of long-term ranges. Flows are strong and high yield financing is widely accessible.
Trade policy in the U.S. is clearly intent on reducing or eliminating supplies of inexpensive imports that compete with more costly domestic production. Immigration as a method of satisfying demand for lower cost service and manual labor has effectively ended, just as domestic labor supplies are exhausted. Shortages are becoming more widespread, and substantial, long-term labor cost inflation is in the cards.
Political restrictions on energy infrastructure and mandated shifts to wind and solar power generation guarantee that residential energy costs will rise considerably over the intermediate term. The effect will be more severe should there be a meaningful disruption of global energy supplies.
Dollar strength has been a crucial factor suppressing inflation in the real economy. Although exchange rates are not officially with the Federal Reserve’s remit, they are well aware that relative variance in monetary policies among major central banks exerts tremendous influence in currency markets. With the President loudly decrying the relative strength of the dollar, the message is doubtlessly clear at the Federal Reserve and in the Treasury Department, the latter of which does have direct responsibility for foreign exchange policy.
With traditional inflation on the horizon, the question of the bond markets arises once more. What special insights does it reflect, and what do its trends foretell?
Not many and not much is the simple answer.
Demand for high-grade bond duration reflects a variety of structural and technical factors that are reactive rather than anticipatory. European investors have been driven out of shorter duration paper by negative deposit and money market rates among highly rated issuers. Managers of enormous pension schemes are focused on liability matching, which requires large allocations to long duration, top quality bonds. Germany is running a fiscal surplus, eliminating an important source of bond supply. Mortgage refinancing in the U.S. has forced a scramble to replace duration lost in pre-paid instruments.
Growing concerns about global economic prospects and the risks of all-out trade conflict has prompted incremental demand for fixed income. That allocation shift has been paralleled by inflows to low volatility, defensive and higher yielding equities, at the expense of more cyclical stocks.
3
Table of Contents
None of these flows are Delphic in their grasp of the future. Money managers receive funds and put them to work in the clearly defined areas to which they are assigned. Bond fund managers buy bonds when flows are positive. If their product is defined as investment grade, they focus their buying there. If they are charged with managing high-yield bonds, those are the instruments that will benefit when they see inflows. The amount of broad discretion to make important allocation shifts among asset types is a minuscule portion of the overall investment business.
Very few people are charged with the task of assessing broad, macroeconomic conditions and altering existing allocation parameters based on their judgment.
Major shifts away from bonds, equities or any subsets thereof take place after a long period of disappointing performance. That is what creates prolonged bottoming processes after unnerving declines. Foresight has little to do with it.
To the extent that equities were traditional harbingers of future fundamental developments, real privileged (now illegal) information was at the heart of the effect. Corporate officers and their advisors were free with actual, firsthand details of how companies were faring long before any formal, public announcements were available. The discipline of technical analysis grew around attempts to identify robust patterns of buying and selling among larger investors who, presumably, were privy to real-time information about company affairs.
Comparable inside facts with the power to move bond markets was and is extremely scarce. Direct knowledge of planned central bank moves before they are made public might have been one avenue within the broad category of early (i.e., illegal) access to government data releases.
At the moment, flows away from traditional savings instruments continue to support a wide range of investment markets. Their absolute and relative performances hold few, if any, insights into prospects for the real economy.
Benign financing conditions continue to support consumer and business activity. Disruptions produced by changes in trade flows and tariffs will, if anything, add to the likelihood of inflationary pressures in certain sectors of the global economy.
We have positioned the portfolio to attempt to benefit under conditions of rising nominal growth and inflation. About half of the assets are invested outside of the dollar sphere. To date, this posture has weighed on our results.
In recent weeks, we have seen the beginnings of stability and recovery in sectors that have suffered in the face of concerns about trade and global economic activity. Rhetorical changes from central bankers have supported our sense that global policy tendencies should remain accommodative long past the point of acceleration in nominal activity and prices.
July 11, 2019
Michael C. Aronstein
President, CIO & Portfolio Manager
The foregoing represents the opinions of the Chairman, CEO & Portfolio Manager and of the President, CIO & Portfolio Manager, respectively, and are not intended to be a forecast of future events, a guarantee of future results, or investment advice.
4
Table of Contents
Definitions:
The S&P 500® Index is a trademark of McGraw Hill Financial Inc. The S&P 500® Index is widely regarded as the standard index for measuring large-cap U.S. stock market performance. The securities holdings and volatility of the Fund differ significantly from the stocks that make up the S&P 500® Index. An investment cannot be made directly into an index.
The NASDAQ 100 Index is a market capitalization weighted index made up of the 100 largest companies listed on the Nasdaq group exchanges.
Duration measures how long it takes, in years, for an investor to be repaid the bond’s price by the bond’s total cash flows.
“Investment grade” refers to bonds that carry low to medium credit risk.
Past performance does not guarantee future results.
The Marketfield Fund is managed by Marketfield Asset Management LLC (the “Adviser”) and distributed by Quasar Distributors, LLC.
Must be preceded or accompanied by a current prospectus.
Mutual fund investing involves risk. Principal loss is possible. Before considering an investment in the Fund, you should understand that you could lose money.
The Fund regularly makes short sales of securities, which involves the risk that losses may exceed the original amount invested. The Fund may also use options and futures contracts, which have the risks of unlimited losses of the underlying holdings due to unanticipated market movements and failure to correctly predict the direction of securities prices, interest rates, and currency exchange rates. However, a mutual fund investor’s risk is limited to the amount invested in a fund. Investments in absolute return strategies are not intended to outperform stocks and bonds during strong market rallies. Investments in exchange-traded funds are subject to additional risks that do not apply to conventional mutual funds, including the risks that the market price of the shares may trade at a discount to its net asset value (“NAV”), an active secondary trading market may not develop or be maintained, or trading may be halted by the exchange in which they trade, which may impact the fund’s ability to sell its shares.
Foreign securities are subject to interest rate, currency exchange rate, economic, and political risks. These risks may be greater for emerging markets. Investing in smaller companies involves special risks, including higher volatility and lower liquidity. Investing in mid-cap stocks may carry more risk than investing in stocks of larger, more well-established companies. This risk is usually greater for longer- term debt securities. Investment by the Fund in lower rated and non-rated securities presents a greater risk of loss to principal and interest than higher-rated securities. Investments in asset-backed and mortgage-backed securities involve additional risks such as credit risk, prepayment risk, possible illiquidity and default, and increased susceptibility to adverse economic developments. Investing in the Fund involves the risk that the macroeconomic trends identified by portfolio management will not come to fruition and their advantageous duration may not last as long as portfolio management forecasts. The Fund may invest in derivatives, which may increase the volatility of the Fund’s NAV and may result in a loss to the Fund.
5
Table of Contents
MARKETFIELD FUND
(Unaudited)
| Example |
As a shareholder of the Fund, you incur two types of costs: (1) transaction costs, including sales charges (loads) on purchases (as applicable), and (2) ongoing costs, including management fees, distribution and/or service (12b-1) fees (as applicable), and other Fund expenses (as applicable). This example is intended to help you understand your ongoing costs (in dollars) of investing in the Fund and to compare these costs with the ongoing costs of investing in other funds. The example is based on an investment of $1,000 made at the beginning of the six-month period and held for the entire period from January 1, 2019 to June 30, 2019.
This example illustrates the Fund’s ongoing costs in two ways:
| Actual | Expenses |
The first lines of the following tables provide information about actual account values and actual expenses. If you purchase Class A shares of the Fund you will pay an initial sales charge of up to 5.50% when you invest. A contingent deferred sales charge (“CDSC”) may be imposed on certain redemptions of Class A shares redeemed within twelve months of purchase. Class C shares are subject to a CDSC of 1.00% for shares redeemed within twelve months of purchase. In addition, you will be assessed fees for outgoing wire transfers, returned checks and stop payment orders at prevailing rates charged by U.S. Bancorp Fund Services, LLC, the Fund’s transfer agent. If you request that a redemption be made by wire transfer, currently a $15.00 fee is charged by the Fund’s transfer agent. IRA accounts will be charged a $15.00 annual maintenance fee. To the extent the Fund invests in shares of exchange-traded funds or other investment companies as part of its investment strategy, you will indirectly bear your proportionate share of any fees and expenses charged by the underlying funds in which the Fund invests in addition to the expenses of the Fund. Actual expenses of the underlying funds are expected to vary among the various underlying funds. These expenses are not included in the example. The example includes, but is not limited to, management fees, fund administration and accounting, custody and transfer agent fees. You may use the information in these lines, together with the amount you invested, to estimate the expenses that you paid over the period. Simply divide your account value by $1,000 (for example, an $8,600 account value divided by $1,000 = 8.6), then multiply the result by the number in the fourth column under the heading entitled “Expenses Paid During Period” to estimate the expenses you paid on your account during this period.
| Hypothetical | Example for Comparison Purposes |
The second lines of the tables below provide information about hypothetical account values and hypothetical expenses based on the Fund’s actual expense ratio and an assumed rate of return of 5% per year before expenses, which is not the Fund’s actual return. The hypothetical account values and expenses may not be used to estimate the actual ending account balances or expenses you paid for the six-month period shown. You may use this information to compare the ongoing costs of investing in the Fund with the ongoing costs of investing in other funds. To do so, compare this 5% hypothetical example with the 5% hypothetical examples that appear in the shareholder reports of other funds.
Please note that the expenses shown in the tables are meant to highlight your ongoing costs only and do not reflect any transactional costs, such as sales charges (loads). Therefore, the second lines of the tables are useful in comparing ongoing costs only and will not help you determine the relative total costs of owning different funds. In addition, if these transactional costs were included, your costs would have been higher.
6
Table of Contents
MARKETFIELD FUND
Expense Example (continued)
(Unaudited)
| Class A |
||||||||||||
| Beginning Account Value January 1, 2019 |
Ending Account Value June 30, 2019 |
Expenses Paid During Period January 1, 2019 - June 30, 2019* |
||||||||||
| Actual |
$ | 1,000.00 | $ | 1,074.40 | $ | 13.53 | ||||||
| Hypothetical (5% return before expenses) |
$ | 1,000.00 | $ | 1,011.75 | $ | 13.12 | ||||||
| * | Expenses are equal to the Class A shares’ annualized expense ratio of 2.63%, multiplied by the average account value over the period, multiplied by 181/365 to reflect the one-half year period. |
| Class C |
||||||||||||
| Beginning Account Value January 1, 2019 |
Ending Account Value June 30, 2019 |
Expenses Paid During Period January 1, 2019 - June 30, 2019* |
||||||||||
| Actual |
$ | 1,000.00 | $ | 1,070.30 | $ | 17.45 | ||||||
| Hypothetical (5% return before expenses) |
$ | 1,000.00 | $ | 1,007.93 | $ | 16.93 | ||||||
| * | Expenses are equal to the Class C shares’ annualized expense ratio of 3.40%, multiplied by the average account value over the period, multiplied by 181/365 to reflect the one-half year period. |
| Class I |
||||||||||||
| Beginning Account Value January 1, 2019 |
Ending Account Value June 30, 2019 |
Expenses Paid During Period January 1, 2019 - June 30, 2019* |
||||||||||
| Actual |
$ | 1,000.00 | $ | 1,076.00 | $ | 12.20 | ||||||
| Hypothetical (5% return before expenses) |
$ | 1,000.00 | $ | 1,013.04 | $ | 11.83 | ||||||
| * | Expenses are equal to the Class I shares’ annualized expense ratio of 2.37%, multiplied by the average account value over the period, multiplied by 181/365 to reflect the one-half year period. |
| Class R6 |
||||||||||||
| Beginning Account Value January 1, 2019 |
Ending Account Value June 30, 2019 |
Expenses Paid During Period January 1, 2019 - June 30, 2019* |
||||||||||
| Actual |
$ | 1,000.00 | $ | 1,076.70 | $ | 11.74 | ||||||
| Hypothetical (5% return before expenses) |
$ | 1,000.00 | $ | 1,013.49 | $ | 11.38 | ||||||
| * | Expenses are equal to the Class R6 shares’ annualized expense ratio of 2.28%, multiplied by the average account value over the period, multiplied by 181/365 to reflect the one-half year period. |
7
Table of Contents
MARKETFIELD FUND
(Unaudited)
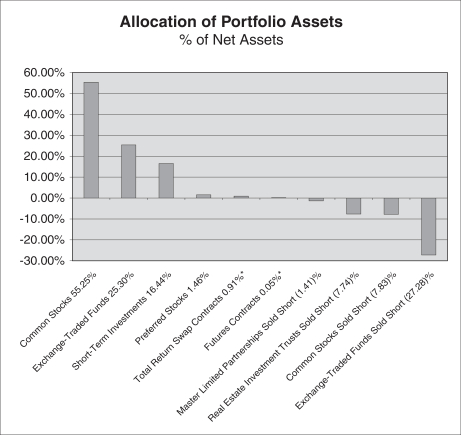
The investment objective of the Fund is capital appreciation. The Fund seeks to achieve its investment objective by allocating the Fund’s assets among investments in equity securities, fixed-income securities, and other investment companies, including exchange-traded funds (“ETFs”), in proportions consistent with Marketfield Asset Management LLC’s (the “Adviser”) evaluation of their expected risks and returns. In making these allocations, the Adviser considers various factors, including macroeconomic conditions, corporate earnings at a macroeconomic level, anticipated inflation and interest rates, consumer risk and the Adviser’s perception of the outlook of the capital markets as a whole. The Adviser may allocate the Fund’s investments between equity securities and fixed-income securities at its discretion, without limitation. The Fund’s allocation of portfolio assets as of June 30, 2019 is shown below.
| * | Valued at the net unrealized appreciation (depreciation). |
8
Table of Contents
MARKETFIELD FUND
Investment Highlights (continued)
(Unaudited)
Average Annual Total Returns as of June 30, 2019
| Class |
Sales Charge |
1 Year |
5 Years |
10 Years |
Since Inception (7/31/2007) |
|||||||||||||||
| Class A(1) |
Maximum 5.5% Initial Sales Charge | With sales charge | -8.40 | % | -3.18 | % | 4.24 | % | 3.50 | % | ||||||||||
| Excluding sales charge |
-3.08 | % | -2.07 | % | 4.83 | % | 3.99 | % | ||||||||||||
| Class C(1) |
Maximum 1% CDSC if Redeemed | With sales charge | -4.81 | % | -2.84 | % | 4.03 | % | 3.20 | % | ||||||||||
| within One Year of Purchase | Excluding sales charge | -3.85 | % | -2.84 | % | 4.03 | % | 3.20 | % | |||||||||||
| Class I(2) |
No Sales Charge | -2.86 | % | -1.85 | % | 5.08 | % | 4.24 | % | |||||||||||
| Class R6(3) |
No Sales Charge | -2.67 | % | -1.70 | % | 5.17 | % | 4.31 | % | |||||||||||
| S&P 500® Index |
10.42 | % | 10.71 | % | 14.70 | % | 8.37 | % | ||||||||||||
Performance data quoted represents past performance and does not guarantee future results. The investment return and principal value of an investment will fluctuate so that an investor’s shares, when redeemed, may be worth more or less than their original cost. Current performance of the Fund may be lower or higher than the performance quoted. Performance data current to the most recent month end may be obtained by calling (800) 311-MKTD (6583).
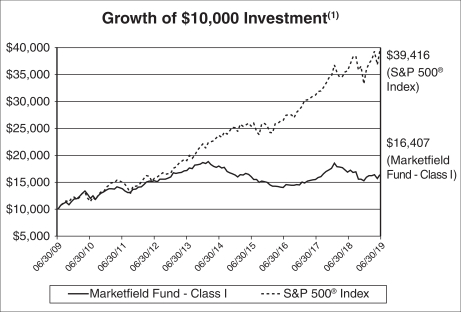
The returns shown assume reinvestment of Fund distributions and do not reflect the deduction of taxes that a shareholder would pay on Fund distributions or the redemption of Fund shares. The following graph illustrates performance of a hypothetical investment made in the Fund and certain broad-based securities indices on the Fund’s inception date. The graph does not reflect any future performance.
The S&P 500® Index is a broad-based measurement of changes in stock market conditions based on a capitalization-weighted average of 500 leading companies representing all major industries in the U.S. economy. It is not possible to invest directly in an index.
| (1) | Performance figures for Class A and Class C shares, first offered on October 5, 2012, include the historical performance of Class I shares through October 4, 2012 and are adjusted to reflect differences in fees and expenses. Performance data for the classes varies based on differences in their fee and expense structures. The Fund commenced operations on July 31, 2007. Unadjusted, the performance for the newer classes would likely have been different. |
| (2) | Performance figures for Class I shares prior to April 8, 2016 reflect the historical performance of the then-existing shares of the MainStay Marketfield Fund, a series of MainStay Funds Trust (the predecessor to the Fund, which was subject to a different fee structure, and for which the Adviser served as the investment sub-adviser) for periods from October 5, 2012 to April 8, 2016. The performance figures also reflect the historical performance of the then-existing shares of the predecessor fund to the MainStay Marketfield Fund (which was subject to a different fee structure, and for which a predecessor entity to the Adviser served as the investment adviser) for periods prior to October 5, 2012. |
| (3) | Performance figures for Class R6 shares, first offered on June 17, 2013, include the historical performance of Class I shares through June 16, 2013. Performance for Class R6 shares would likely have been different because of differences in certain expenses attributable to each share class. |
9
Table of Contents
MARKETFIELD FUND
Investment Highlights (continued)
(Unaudited)
| (1) | The minimum investment for Class I shares is $25,000 for individual investors. There is no minimum investment for Class I shares for institutional investors. The minimum investment for Class C shares is $2,500. The minimum investment for Class A shares is $2,500. The minimum investment for Class R6 shares is $250,000. |
10
Table of Contents
MARKETFIELD FUND
June 30, 2019 (Unaudited)
| Shares |
Value |
|||||||
| COMMON STOCKS — 55.25% | ||||||||
| Auto Components — 0.31% | ||||||||
| Continental AG(a) |
4,524 | $ | 659,595 | |||||
| Building Products — 1.01% | ||||||||
| TOTO Ltd.(a) |
54,686 | 2,158,224 | ||||||
| Chemicals — 2.67% | ||||||||
| Nutrien Ltd.(a) |
54,404 | 2,908,438 | ||||||
| The Sherwin-Williams Co.(b) |
6,165 | 2,825,358 | ||||||
| 5,733,796 | ||||||||
| Electrical Equipment — 1.23% | ||||||||
| Rockwell Automation, Inc. |
16,062 | 2,631,437 | ||||||
| Electronic Equipment, Instruments & Components — 2.48% | ||||||||
| Keyence Corp.(a) |
8,662 | 5,312,972 | ||||||
| Food & Staples Retailing — 3.00% | ||||||||
| Costco Wholesale Corp. |
24,340 | 6,432,088 | ||||||
| Health Care Equipment & Supplies — 2.19% | ||||||||
| Intuitive Surgical, Inc.(c) |
8,958 | 4,698,919 | ||||||
| Hotels, Restaurants & Leisure — 0.81% | ||||||||
| Dalata Hotel Group PLC(a) |
323,936 | 1,733,076 | ||||||
| Household Durables — 8.87% | ||||||||
| DR Horton, Inc.(b) |
131,471 | 5,670,344 | ||||||
| Lennar Corp. — Class A |
62,039 | 3,006,410 | ||||||
| PulteGroup, Inc. |
161,197 | 5,097,049 | ||||||
| Sony Corp. — ADR(b) |
100,053 | 5,241,777 | ||||||
| 19,015,580 | ||||||||
| Industrial Conglomerates — 2.03% | ||||||||
| Honeywell International, Inc. |
18,384 | 3,209,662 | ||||||
| Siemens AG(a) |
9,580 | 1,139,452 | ||||||
| 4,349,114 | ||||||||
| Machinery — 5.08% | ||||||||
| Caterpillar, Inc.(b) |
25,490 | 3,474,032 | ||||||
| Cummins, Inc.(b) |
23,808 | 4,079,263 | ||||||
| Deere & Co.(b) |
20,187 | 3,345,188 | ||||||
| 10,898,483 | ||||||||
| Metals & Mining — 11.29% | ||||||||
| Barrick Gold Corp.(b) |
293,840 | 4,633,857 | ||||||
| BHP Group Ltd. — ADR |
89,722 | 5,213,745 | ||||||
| Cia de Minas Buenaventura SAA — ADR(b) |
157,512 | 2,625,725 | ||||||
| Grupo Mexico SAB de CV(a) |
1,112,826 | 2,963,864 | ||||||
| MMC Norilsk Nickel PJSC — ADR |
149,381 | 3,392,443 | ||||||
| Southern Copper Corp. |
75,349 | 2,927,309 | ||||||
| Vale SA — ADR |
181,007 | 2,432,734 | ||||||
| 24,189,677 | ||||||||
| Oil, Gas & Consumable Fuels — 1.15% | ||||||||
| Devon Energy Corp. |
86,308 | 2,461,504 | ||||||
The accompanying notes are an integral part of these financial statements.
11
Table of Contents
MARKETFIELD FUND
Schedule of Investments (continued)
June 30, 2019 (Unaudited)
| Shares |
Value |
|||||||
| Real Estate Management & Development — 1.22% | ||||||||
| Cresud SACIF y A — ADR(c) |
97,342 | $ | 1,020,144 | |||||
| The St. Joe Co.(c) |
92,771 | 1,603,083 | ||||||
| 2,623,227 | ||||||||
| Road & Rail — 5.36% | ||||||||
| Norfolk Southern Corp.(b) |
32,281 | 6,434,572 | ||||||
| Union Pacific Corp.(b) |
29,940 | 5,063,153 | ||||||
| 11,497,725 | ||||||||
| Semiconductors & Semiconductor Equipment — 1.42% | ||||||||
| Intel Corp. |
63,529 | 3,041,133 | ||||||
| Software — 2.67% | ||||||||
| Microsoft Corp.(b) |
27,965 | 3,746,191 | ||||||
| Splunk, Inc.(c) |
15,713 | 1,975,910 | ||||||
| 5,722,101 | ||||||||
| Specialty Retail — 2.46% | ||||||||
| Ross Stores, Inc. |
53,220 | 5,275,166 | ||||||
| TOTAL COMMON STOCKS (Cost $74,869,669) |
118,433,817 | |||||||
| PREFERRED STOCKS — 1.46% | ||||||||
| Banks — 1.46% | ||||||||
| Itau Unibanco Holding SA — ADR, 6.615% |
331,844 | 3,125,970 | ||||||
| TOTAL PREFERRED STOCKS (Cost $2,713,929) |
3,125,970 | |||||||
| EXCHANGE-TRADED FUNDS — 25.30% | ||||||||
| iShares MSCI Chile ETF |
68,873 | 2,814,151 | ||||||
| iShares MSCI Emerging Markets ETF(b) |
319,610 | 13,714,465 | ||||||
| iShares MSCI Malaysia ETF(b) |
142,455 | 4,235,187 | ||||||
| iShares MSCI South Korea ETF(b) |
178,090 | 10,662,248 | ||||||
| iShares MSCI Taiwan ETF(b) |
210,383 | 7,354,990 | ||||||
| iShares U.S. Home Construction ETF(b) |
168,994 | 6,458,951 | ||||||
| SPDR S&P Homebuilders ETF(b) |
87,402 | 3,642,915 | ||||||
| SPDR S&P Oil & Gas Exploration & Production ETF(b) |
93,267 | 2,541,526 | ||||||
| VanEck Vectors Russia ETF |
118,641 | 2,803,487 | ||||||
| TOTAL EXCHANGE-TRADED FUNDS (Cost $47,881,486) |
54,227,920 | |||||||
| SHORT-TERM INVESTMENTS — 16.44% | ||||||||
| Money Market Fund — 16.44% | ||||||||
| First American Government Obligations Fund, Class X, 2.285%(d) |
35,241,588 | 35,241,588 | ||||||
| TOTAL SHORT-TERM INVESTMENTS (Cost $35,241,588) | 35,241,588 | |||||||
| Total Investments (Cost $160,706,672) — 98.45% | 211,029,295 | |||||||
| Other Assets in Excess of Liabilities — 1.55% |
3,319,101 | |||||||
| TOTAL NET ASSETS — 100.00% | $ | 214,348,396 | ||||||
| (a) | Foreign issued security. |
| (b) | All or a portion of this security is pledged as collateral for securities sold short, swap contracts and future contracts with an aggregate fair value of $81,784,494. |
| (c) | Non-income producing security. |
| (d) | Seven day yield as of June 30, 2019. |
The accompanying notes are an integral part of these financial statements.
12
Table of Contents
MARKETFIELD FUND
Schedule of Investments (continued)
June 30, 2019 (Unaudited)
Abbreviations:
| ADR | American Depositary Receipt | |
| AG | Aktiengesellschaft is a German term that refers to a corporation that is limited by shares, i.e. owned by shareholders. | |
| Ltd. | Limited is a term indicating a company is incorporated and shareholders have limited liability. | |
| PLC | Public Limited Company is a publicly traded company which signifies that shareholders have limited liability. | |
| SA | An abbreciation used by many countries to signify a stock company whereby shareholders have limited liability. | |
| SAB de CV | Sociedad Anonima de Capital Variable is a Spanish term for an SA with variable capital. |
The Global Industry Classification Standard (GICS®) was developed by and/or is the exclusive property of MSCI, Inc. and Standard & Poor Financial Services LLC (“S&P”). GICS is a service mark of MSCI and S&P and has been licensed for use by U.S. Bancorp Fund Services, LLC.
The accompanying notes are an integral part of these financial statements.
13
Table of Contents
MARKETFIELD FUND
Schedule of Securities Sold Short
June 30, 2019 (Unaudited)
| Shares |
Value |
|||||||
| SECURITIES SOLD SHORT — 44.26% | ||||||||
| COMMON STOCKS — 7.83% | ||||||||
| Banks — 0.86% | ||||||||
| Signature Bank/New York NY |
(15,264 | ) | $ | (1,844,502 | ) | |||
| Capital Markets — 2.70% | ||||||||
| Eaton Vance Corp. |
(25,049 | ) | (1,080,363 | ) | ||||
| Invesco Ltd.(a) |
(25,634 | ) | (524,472 | ) | ||||
| T Rowe Price Group, Inc. |
(7,937 | ) | (870,768 | ) | ||||
| The Goldman Sachs Group, Inc. |
(16,169 | ) | (3,308,178 | ) | ||||
| (5,783,781 | ) | |||||||
| IT Services — 1.95% | ||||||||
| International Business Machines Corp. |
(30,366 | ) | (4,187,471 | ) | ||||
| Wireless Telecommunication Services — 2.32% | ||||||||
| SoftBank Group Corp.(a) |
(103,600 | ) | (4,963,075 | ) | ||||
| TOTAL COMMON STOCKS (Proceeds $16,827,132) |
(16,778,829 | ) | ||||||
| EXCHANGE-TRADED FUNDS — 27.28% | ||||||||
| Consumer Staples Select Sector SPDR Fund |
(232,161 | ) | (13,481,589 | ) | ||||
| Invesco QQQ Trust Series 1 |
(209,891 | ) | (39,195,046 | ) | ||||
| Vanguard Real Estate ETF |
(66,403 | ) | (5,803,622 | ) | ||||
| TOTAL EXCHANGE-TRADED FUNDS (Proceeds $54,444,020) |
(58,480,257 | ) | ||||||
| MASTER LIMITED PARTNERSHIPS — 1.41% | ||||||||
| The Blackstone Group LP |
(67,859 | ) | (3,014,297 | ) | ||||
| TOTAL MASTER LIMITED PARTNERSHIPS (Proceeds $2,150,823) |
(3,014,297 | ) | ||||||
| REAL ESTATE INVESTMENT TRUSTS — 7.74% | ||||||||
| Apartment Investment & Management Co. |
(27,518 | ) | (1,379,202 | ) | ||||
| AvalonBay Communities, Inc. |
(8,417 | ) | (1,710,166 | ) | ||||
| Boston Properties, Inc. |
(26,901 | ) | (3,470,229 | ) | ||||
| Equity Residential |
(26,039 | ) | (1,976,881 | ) | ||||
| Essex Property Trust, Inc. |
(7,533 | ) | (2,199,109 | ) | ||||
| SL Green Realty Corp. |
(35,121 | ) | (2,822,675 | ) | ||||
| Vornado Realty Trust |
(47,336 | ) | (3,034,237 | ) | ||||
| TOTAL REAL ESTATE INVESTMENT TRUSTS (Proceeds $16,374,367) |
(16,592,499 | ) | ||||||
| Total Securities Sold Short (Proceeds $89,796,342) |
$ | (94,865,882 | ) | |||||
| (a) | Foreign issued security. |
The accompanying notes are an integral part of these financial statements.
14
Table of Contents
MARKETFIELD FUND
Schedule of Total Return Swaps(a)
June 30, 2019 (Unaudited)
| Counterparty |
Reference Entity(b) |
Termination Date |
Pay/Receive Total Return on Reference Entity |
Financing Rate |
Payment Frequency |
Notional Amount |
Unrealized Appreciation (Depreciation)(d) |
|||||||||||||||||||
| Long Total Return Swaps | ||||||||||||||||||||||||||
| Bank of America Merrill Lynch |
CSI300 Net Total Return Index |
10/09/2019 | Receive | 1.598 | %(c) | Monthly | $ | 10,594,677 | $ | 1,951,837 | ||||||||||||||||
| Total net unrealized appreciation on total return swaps |
|
$ | 1,951,837 | |||||||||||||||||||||||
| (a) | There were no upfront payments paid or received. |
| (b) | Foreign issued security. |
| (c) | Floating rate, adjusted monthly based on 1 month LIBOR -4.000%. |
| (d) | Based on the net swap value held at each counterparty, unrealized appreciation is a receivable and unrealized depreciation is a payable. Excludes any unrealized appreciation or depreciation of foreign currency. |
Schedule of Open Futures Contracts
June 30, 2019 (Unaudited)
| Number of Contracts |
Expiration Month |
Notional Amount |
Unrealized Appreciation (Depreciation) |
|||||||||||||
| FUTURE CONTRACTS PURCHASED | ||||||||||||||||
| Yen Denominated Nikkei 225 Index Future |
121 | September 2019 | $ | 11,955,224 | $ | 97,740 | ||||||||||
| TOTAL FUTURES CONTRACTS PURCHASED |
|
$ | 97,740 | |||||||||||||
The accompanying notes are an integral part of these financial statements.
15
Table of Contents
MARKETFIELD FUND
| Statement of Assets & Liabilities | ||
| June 30, 2019 (Unaudited) | ||
| Assets | ||||
| Investments in securities, at value (cost $160,706,672) |
$ | 211,029,295 | ||
| Restricted Cash |
17,600 | |||
| Receivables: |
||||
| Investments sold |
899,241 | |||
| Fund shares sold |
4,886 | |||
| Dividends and interest |
461,531 | |||
| Dividend tax reclaim |
408,018 | |||
| Swap dividend and interest receivable |
121,143 | |||
| Unrealized appreciation on open swap contracts |
1,951,837 | |||
| Variation margin on futures contracts |
53,309 | |||
| Deposits at brokers for derivative instruments(1) |
96,245,502 | |||
| Other assets |
26,414 | |||
| Total Assets |
311,218,776 | |||
| Liabilities | ||||
| Securities sold short, at value (proceeds received $89,796,342) |
94,865,882 | |||
| Payables: |
||||
| Investments purchased |
507,049 | |||
| Fund shares redeemed |
769,316 | |||
| To affiliates |
84,534 | |||
| To distributor |
46,297 | |||
| For shareholder servicing fees |
43,357 | |||
| To adviser |
189,952 | |||
| Dividends and interest on short positions |
273,697 | |||
| Accrued expenses and other liabilities |
90,296 | |||
| Total Liabilities |
96,870,380 | |||
| Net Assets | $ | 214,348,396 | ||
| Net assets consist of: |
||||
| Paid-in capital |
585,978,304 | |||
| Accumulated deficit |
(371,629,908 | ) | ||
| Net Assets | $ | 214,348,396 | ||
The accompanying notes are an integral part of these financial statements.
16
Table of Contents
MARKETFIELD FUND
| Statement of Assets & Liabilities (continued) | ||
| June 30, 2019 (Unaudited) | ||
| Class A | ||||
| Net assets |
$40,722,306 | |||
| Shares of beneficial interest outstanding (unlimited number of shares authorized, $0.001 par value) |
2,540,159 | |||
| Net asset value, minimum offering, and redemption price per share |
$16.03 | |||
| Maximum offering price per share (net asset value per share divided by 0.945)(2) |
$16.96 | |||
| Class C | ||||
| Net assets |
$47,228,620 | |||
| Shares of beneficial interest outstanding (unlimited number of shares authorized, $0.001 par value) |
3,101,927 | |||
| Net asset value, offering, and redemption price per share(3) |
$15.23 | |||
| Class I | ||||
| Net assets |
$124,804,958 | |||
| Shares of beneficial interest outstanding (unlimited number of shares authorized, $0.001 par value) |
7,664,874 | |||
| Net asset value, offering, and redemption price per share |
$16.28 | |||
| Class R6 | ||||
| Net assets |
$1,592,512 | |||
| Shares of beneficial interest outstanding (unlimited number of shares authorized, $0.001 par value) |
97,001 | |||
| Net asset value, offering, and redemption price per share |
$16.42 | |||
| (1) | Serves as collateral for securities sold short and derivative instruments including futures, swaps and options. |
| (2) | Reflects a maximum sales charge of 5.50%. |
| (3) | A contingent deferred sales charge (“CDSC”) of 1.00% may be charged on shares redeemed within twelve months of purchase. |
The accompanying notes are an integral part of these financial statements.
17
Table of Contents
MARKETFIELD FUND
| Statement of Operations | ||
| For the Six Months Ended June 30, 2019 (Unaudited) | ||
| Investment Income | ||||
| Dividend income(1) |
$ | 2,036,369 | ||
| Interest income |
1,539,388 | |||
| Total Investment Income |
3,575,757 | |||
| Expenses | ||||
| Management fees |
1,714,677 | |||
| Dividend expense |
1,003,639 | |||
| Distribution fees — Class C |
194,761 | |||
| Administration and accounting fees |
190,298 | |||
| Transfer agent fees and expenses |
180,141 | |||
| Shareholder servicing fees — Class C |
64,920 | |||
| Distribution fees — Class A |
54,950 | |||
| Reports to shareholders |
42,208 | |||
| Custody fees |
33,024 | |||
| Federal and state registration fees |
29,292 | |||
| Audit and tax fees |
22,082 | |||
| Legal fees |
13,228 | |||
| Trustees’ fees |
6,716 | |||
| Chief Compliance Officer fees |
5,973 | |||
| Pricing fees |
1,051 | |||
| Other expenses |
8,298 | |||
| Total Expenses |
3,565,258 | |||
| Less waivers and reimbursement by Adviser (Note 4) |
(336,974 | ) | ||
| Net Expenses |
3,228,284 | |||
| Net Investment Income | 347,473 | |||
| Realized And Unrealized Gain (Loss) on Investments and Foreign Currency | ||||
| Net realized gain (loss) on: |
||||
| Investments |
16,717,039 | |||
| Futures contracts |
47,002 | |||
| Swap contracts |
287,011 | |||
| Securities sold short |
(1,913,178 | ) | ||
| Foreign currency translations |
(18,810 | ) | ||
| 15,119,064 | ||||
| Net change in unrealized appreciation (depreciation) on: |
||||
| Investments |
13,641,768 | |||
| Futures contracts |
927,901 | |||
| Swap contracts |
2,902,716 | |||
| Securities sold short |
(14,438,767 | ) | ||
| Foreign currency translations |
24,595 | |||
| 3,058,213 | ||||
| Net Realized And Unrealized Gain on Investments and Foreign Currency | 18,177,277 | |||
| Net Increase In Net Assets From Operations | $ | 18,524,750 | ||
| (1) | Net of $79,853 in foreign withholding taxes and issuance fees. |
The accompanying notes are an integral part of these financial statements.
18
Table of Contents
MARKETFIELD FUND
The accompanying notes are an integral part of these financial statements.
19
Table of Contents
MARKETFIELD FUND — CLASS A
| (1) | Per share net investment gain (loss) was calculated using average shares outstanding. |
| (2) | Total return in the table represents the rate that the investor would have earned or lost on an investment in the Fund, assuming reinvestment of dividends. Based on net asset value, which does not reflect the applicable sales charges. |
| (3) | Not annualized for periods less than one year. |
| (4) | Annualized for periods less than one year. |
| (5) | Expense ratios of expenses to average net assets before waivers and reimbursements of expenses excluding dividend and interest expense on short positions were 2.08% for the six months ended June 30, 2019 and 2.01%, 1.98%, 1.87%, 1.80%, and 1.78% for the years ended December 31, 2018, 2017, 2016, 2015, and 2014, respectively. |
| (6) | Expense ratios of expenses to average net assets after waivers and reimbursements of expenses excluding dividend and interest expense on short positions were 1.80% for the six months ended June 30, 2019 and 1.80%, 1.80%, 1.83%, 1.80%, and 1.78% for the years ended December 31, 2018, 2017, 2016, 2015, and 2014, respectively. |
| (7) | The net investment gain (loss) ratios include dividend and interest expense on short positions. |
| (8) | Consists of long-term investments only; excludes securities sold short and derivative instruments. |
| (9) | Effective after the close of business on April 8, 2016, Class A shares were subject to an expense limitation cap of 1.80%. |
The accompanying notes are an integral part of these financial statements.
20
Table of Contents
MARKETFIELD FUND — CLASS C
| Financial Highlights (continued) | ||||||||||||||||||||||||
| Per Share Data for a Share Outstanding Throughout Each Year/Period | ||||||||||||||||||||||||
| Six Months Ended June 30, 2019 (Unaudited) |
Year Ended December 31, 2018 |
Year Ended December 31, 2017 |
Year Ended December 31, 2016 |
Year Ended December 31, 2015 |
Year Ended December 31, 2014 |
|||||||||||||||||||
| Net Asset Value, Beginning of Period | $ | 14.22 | $ | 16.56 | $ | 13.80 | $ | 14.43 | $ | 15.89 | $ | 18.30 | ||||||||||||
| Income (loss) from investment operations: | ||||||||||||||||||||||||
| Net investment loss(1) |
(0.03 | ) | (0.17 | ) | (0.22 | ) | (0.31 | ) | (0.28 | ) | (0.33 | ) | ||||||||||||
| Net realized and unrealized gain (loss) on investments and foreign currency |
1.04 | (2.17 | ) | 2.98 | (0.32 | ) | (1.18 | ) | (2.08 | ) | ||||||||||||||
| Total from investment operations |
1.01 | (2.34 | ) | 2.76 | (0.63 | ) | (1.46 | ) | (2.41 | ) | ||||||||||||||
| Net Asset Value, End of Period | $ | 15.23 | $ | 14.22 | $ | 16.56 | $ | 13.80 | $ | 14.43 | $ | 15.89 | ||||||||||||
| Total return(2)(3) | 7.03 | % | -14.13 | % | 20.00 | % | -4.37 | % | -9.19 | % | -13.17 | % | ||||||||||||
| Supplemental Data and Ratios: | ||||||||||||||||||||||||
| Net assets, end of period (000’s) |
$ | 47,229 | $ | 55,958 | $ | 92,518 | $ | 123,651 | $ | 315,894 | $ | 1,003,835 | ||||||||||||
| Ratio of expenses to average net assets:(4) |
||||||||||||||||||||||||
| Before waivers and reimbursements of expenses(5) |
3.66 | % | 3.49 | % | 3.48 | % | 3.65 | % | 3.29 | % | 3.38 | % | ||||||||||||
| After waivers and reimbursements of expenses(6) |
3.40 | % | 3.30 | % | 3.30 | % | 3.59 | %(9) | 3.29 | % | 3.38 | % | ||||||||||||
| Ratio of net investment loss to average net assets:(4)(7) |
||||||||||||||||||||||||
| Before waivers and reimbursements of expenses |
(0.73 | )% | (1.27 | )% | (1.67 | )% | (2.36 | )% | (1.84 | )% | (1.89 | )% | ||||||||||||
| After waivers and reimbursements of expenses |
(0.47 | )% | (1.08 | )% | (1.49 | )% | (2.30 | )% | (1.84 | )% | (1.89 | )% | ||||||||||||
| Portfolio turnover rate(3)(8) |
0 | % | 40 | % | 5 | % | 86 | % | 93 | % | 98 | % | ||||||||||||
| (1) | Per share net investment loss was calculated using average shares outstanding. |
| (2) | Total return in the table represents the rate that the investor would have earned or lost on an investment in the Fund, assuming reinvestment of dividends. Based on net asset value, which does not reflect the applicable sales charges. |
| (3) | Not annualized for periods less than one year. |
| (4) | Annualized for periods less than one year. |
| (5) | Expense ratios of expenses to average net assets before waivers and reimbursements of expenses excluding dividend and interest expense on short positions were 2.83% for the six months ended June 30, 2019 and 2.76% , 2.75%, 2.65%, 2.57%, and 2.53% for the years ended December 31, 2018, 2017, 2016, 2015, and 2014, respectively. |
| (6) | Expense ratios of expenses to average net assets after waivers and reimbursements of expenses excluding dividend and interest expense on short positions were 2.57% for the six months ended June 30, 2019 and 2.57%, 2.57%, 2.59%, 2.57%, and 2.53% for the years ended December 31, 2018, 2017, 2016, 2015, and 2014, respectively. |
| (7) | The net investment loss ratios include dividend and interest expense on short positions. |
| (8) | Consists of long-term investments only; excludes securities sold short and derivative instruments. |
| (9) | Effective after the close of business on April 8, 2016, Class C shares were subject to an expense limitation cap of 2.57%. |
The accompanying notes are an integral part of these financial statements.
21
Table of Contents
MARKETFIELD FUND — CLASS I
| Financial Highlights (continued) | ||||||||||||||||||||||||
| Per Share Data for a Share Outstanding Throughout Each Year/Period | ||||||||||||||||||||||||
| Six Months Ended June 30, 2019 (Unaudited) |
Year Ended December 31, 2018 |
Year Ended December 31, 2017 |
Year Ended December 31, 2016 |
Year Ended December 31, 2015 |
Year Ended December 31, 2014 |
|||||||||||||||||||
| Net Asset Value, Beginning of Period | $ | 15.14 | $ | 17.44 | $ | 14.39 | $ | 14.89 | $ | 16.24 | $ | 18.51 | ||||||||||||
| Income (loss) from investment operations: | ||||||||||||||||||||||||
| Net investment gain (loss)(1) |
0.04 | (0.02 | ) | (0.07 | ) | (0.19 | ) | (0.13 | ) | (0.16 | ) | |||||||||||||
| Net realized and unrealized gain (loss) on investments and foreign currency |
1.10 | (2.28 | ) | 3.12 | (0.31 | ) | (1.22 | ) | (2.11 | ) | ||||||||||||||
| Total from investment operations |
1.14 | (2.30 | ) | 3.05 | (0.50 | ) | (1.35 | ) | (2.27 | ) | ||||||||||||||
| Net Asset Value, End of Period | $ | 16.28 | $ | 15.14 | $ | 17.44 | $ | 14.39 | $ | 14.89 | $ | 16.24 | ||||||||||||
| Total return(2)(3) | 7.60 | % | -13.25 | % | 21.20 | % | -3.36 | % | -8.31 | % | -12.26 | % | ||||||||||||
| Supplemental Data and Ratios: | ||||||||||||||||||||||||
| Net assets, end of period (000’s) |
$ | 124,805 | $ | 163,260 | $ | 302,439 | $ | 376,791 | $ | 1,698,033 | $ | 7,062,935 | ||||||||||||
| Ratio of expenses to average net assets:(4) |
||||||||||||||||||||||||
| Before waivers and reimbursements of expenses(5) |
2.65 | % | 2.47 | % | 2.48 | % | 2.61 | % | 2.26 | % | 2.39 | % | ||||||||||||
| After waivers and reimbursements of expenses(6) |
2.37 | % | 2.27 | % | 2.30 | % | 2.56 | %(9) | 2.26 | % | 2.39 | % | ||||||||||||
| Ratio of net investment gain (loss) to average net assets:(4)(7) |
||||||||||||||||||||||||
| Before waivers and reimbursements of expenses |
0.26 | % | (0.29 | )% | (0.64 | )% | (1.38 | )% | (0.82 | )% | (0.90 | )% | ||||||||||||
| After waivers and reimbursements of expenses |
0.54 | % | (0.09 | )% | (0.46 | )% | (1.33 | )% | (0.82 | )% | (0.90 | )% | ||||||||||||
| Portfolio turnover rate(3)(8) |
0 | % | 40 | % | 5 | % | 86 | % | 93 | % | 98 | % | ||||||||||||
| (1) | Per share net investment gain (loss) was calculated using average shares outstanding. |
| (2) | Total return in the table represents the rate that the investor would have earned or lost on an investment in the Fund, assuming reinvestment of dividends. Based on net asset value. |
| (3) | Not annualized for periods less than one year. |
| (4) | Annualized for periods less than one year. |
| (5) | Expense ratios of expenses to average net assets before waivers and reimbursements of expenses excluding dividend and interest expense on short positions were 1.84% for the six months ended June 30, 2019 and 1.76%, 1.74%, 1.61%, 1.56%, and 1.53% for the years ended December 31, 2018, 2017, 2016, 2015, and 2014, respectively. |
| (6) | Expense ratios of expenses to average net assets after waivers and reimbursements of expenses excluding dividend and interest expense on short positions were 1.56% for the six months ended June 30, 2019 and 1.56%, 1.56%, 1.56%, 1.56%, and 1.53% for the years ended December 31, 2018, 2017, 2016, 2015, and 2014, respectively. |
| (7) | The net investment gain (loss) ratios include dividend and interest expense on short positions. |
| (8) | Consists of long-term investments only; excludes securities sold short and derivative instruments. |
| (9) | Effective after the close of business on April 8, 2016, Class I shares were subject to an expense limitation cap of 1.56%. |
The accompanying notes are an integral part of these financial statements.
22
Table of Contents
MARKETFIELD FUND — CLASS R6
| Financial Highlights (continued) | ||||||||||||||||||||||||
| Per Share Data for a Share Outstanding Throughout Each Year/Period | ||||||||||||||||||||||||
| Six Months Ended June 30, 2019 (Unaudited) |
Year Ended December 31, 2018 |
Year Ended December 31, 2017 |
Year Ended December 31, 2016 |
Year Ended December 31, 2015 |
Year Ended December 31, 2014 |
|||||||||||||||||||
| Net Asset Value, Beginning of Period | $ | 15.25 | $ | 17.55 | $ | 14.46 | $ | 14.94 | $ | 16.27 | $ | 18.53 | ||||||||||||
| Income (loss) from investment operations: | ||||||||||||||||||||||||
| Net investment gain (loss)(1) |
0.05 | 0.01 | (0.05 | ) | (0.17 | ) | (0.12 | ) | (0.13 | ) | ||||||||||||||
| Net realized and unrealized gain (loss) on investments and foreign currency |
1.12 | (2.31 | ) | 3.14 | (0.31 | ) | (1.21 | ) | (2.13 | ) | ||||||||||||||
| Total from investment operations |
1.17 | (2.30 | ) | 3.09 | (0.48 | ) | (1.33 | ) | (2.26 | ) | ||||||||||||||
| Net Asset Value, End of Period | $ | 16.42 | $ | 15.25 | $ | 17.55 | $ | 14.46 | $ | 14.94 | $ | 16.27 | ||||||||||||
| Total return(2)(3) | 7.67 | % | -13.11 | % | 21.37 | % | -3.21 | % | -8.17 | % | -12.20 | % | ||||||||||||
| Supplemental Data and Ratios: | ||||||||||||||||||||||||
| Net assets, end of period (000’s) |
$ | 1,593 | $ | 1,563 | $ | 2,567 | $ | 2,793 | $ | 5,749 | $ | 6,365 | ||||||||||||
| Ratio of expenses to average net assets:(4) |
||||||||||||||||||||||||
| Before waivers and reimbursements of expenses(5) |
2.69 | % | 2.49 | % | 2.45 | % | 2.64 | % | 2.25 | % | 2.34 | % | ||||||||||||
| After waivers and reimbursements of expenses(6) |
2.28 | % | 2.16 | % | 2.18 | % | 2.55 | %(9) | 2.25 | % | 2.34 | % | ||||||||||||
| Ratio of net investment gain (loss) to average net assets:(4)(7) |
||||||||||||||||||||||||
| Before waivers and reimbursements of expenses |
0.26 | % | (0.28 | )% | (0.62 | )% | (1.33 | )% | (0.78 | )% | (0.75 | )% | ||||||||||||
| After waivers and reimbursements of expenses |
0.67 | % | 0.05 | % | (0.35 | )% | (1.24 | )% | (0.78 | )% | (0.75 | )% | ||||||||||||
| Portfolio turnover rate(3)(8) |
0 | % | 40 | % | 5 | % | 86 | % | 93 | % | 98 | % | ||||||||||||
| (1) | Per share net investment gain (loss) was calculated using average shares outstanding. |
| (2) | Total return in the table represents the rate that the investor would have earned or lost on an investment in the Fund, assuming reinvestment of dividends. Based on net asset value. |
| (3) | Not annualized for periods less than one year. |
| (4) | Annualized for periods less than one year. |
| (5) | Expense ratios of expenses to average net assets before waivers and reimbursements of expenses excluding dividend and interest expense on short positions were 1.84% for the six months ended June 30, 2019 and 1.76%, 1.70%, 1.53%, 1.43%, and 1.42% for the years ended December 31, 2018, 2017, 2016, 2015, and 2014, respectively. |
| (6) | Expense ratios of expenses to average net assets after waivers and reimbursements of expenses excluding dividend and interest expense on short positions were 1.43% for the six months ended June 30, 2019 and 1.43%, 1.43%, 1.44%, 1.43%, and 1.42% for the years ended December 31, 2018, 2017, 2016, 2015, and 2014, respectively. |
| (7) | The net investment gain (loss) ratios include dividend and interest expense on short positions. |
| (8) | Consists of long-term investments only; excludes securities sold short and derivative instruments. |
| (9) | Effective after the close of business on April 8, 2016, Class R6 shares were subject to an expense limitation cap of 1.43%. |
The accompanying notes are an integral part of these financial statements.
23
Table of Contents
MARKETFIELD FUND
June 30, 2019 (Unaudited)
| (1) | Organization |
Trust for Professional Managers (the “Trust”) was organized as a Delaware statutory trust under a Declaration of Trust dated May 29, 2001. The Trust is registered under the Investment Company Act of 1940, as amended (the “1940 Act”), as an open-end management investment company. The Marketfield Fund (the “Fund”) represents a distinct series with its own investment objective and policies within the Trust. The investment objective of the Fund is capital appreciation. The Trust may issue an unlimited number of shares of beneficial interest at $0.001 par value. The assets of the Fund are segregated, and a shareholder’s interest is limited to the Fund in which shares are held.
The Fund currently offers four classes of shares. Class I shares commenced operations on July 31, 2007. Class A and Class C shares commenced operations on October 5, 2012. Class R6 shares commenced operations on June 17, 2013. Effective as of the close of business on August 15, 2016, the Fund converted its Investor Class shares into Class A shares of the Fund. Effective as of the close of business on August 15, 2016, the Fund converted its Class R2 and Class P shares into Class I shares of the Fund. Class A shares are subject to an initial maximum sales charge of 5.50% imposed at the time of purchase. The sales charge declines as the amount purchased increases in accordance with the Fund’s prospectus. A contingent deferred sales charge (“CDSC”) of 1.00% may be imposed on certain redemptions of Class A shares made within 12 months of the date of purchase of Class A shares. Class C shares are offered at NAV without an initial sales charge, although a 1.00% CDSC may be imposed on redemptions made within 12 months of the date of purchase of Class C shares. Class I and Class R6 shares are offered at NAV and are not subject to a sales charge. In addition, you generally may elect on a voluntary basis to convert your Class A or Class C shares that are no longer subject to a CDSC into Class A or Class I shares of the Fund, subject to satisfying the eligibility requirements of Class A or Class I shares, as applicable. Class C shares of the Fund automatically convert to Class A shares after 10 years. Also, you generally may elect on a voluntary basis to convert your Class A or Class C shares that are no longer subject to a CDSC, or Class I shares, into Class R6 shares of the Fund, subject to satisfying the eligibility requirements of Class R6 shares. The four classes of shares have the same voting (except for issues that relate solely to one class), dividend, liquidation and other rights, and the same terms and conditions, except that Class C shares are subject to higher distribution and/or service (Rule 12b-1) fee rates than Class A shares under a distribution plan pursuant to Rule 12b-1 under the 1940 Act. Class I and Class R6 shares are not subject to a distribution and/or service (Rule 12b-1) fee.
Pursuant to a reorganization that took place after the close of business on April 8, 2016 (the “Reorganization”), the Fund is the successor to the MainStay Marketfield Fund, a series of MainStay Funds Trust (the “Predecessor Fund”). The Predecessor Fund and the Fund have the same investment objectives and substantially the same strategies and investment policies.
The Fund is an investment company and accordingly follows the investment accounting and reporting guidance of the Financial Accounting Standards Board (FASB) Accounting Standard Codification Topic 946 “Financial Services — Investment Companies.”
| (2) | Significant Accounting Policies |
The following is a summary of significant accounting policies consistently followed by the Fund in the preparation of these schedules of investments. These policies are in conformity with generally accepted accounting principles in the United States of America (“GAAP”).
| (a) | Investment Valuation |
Each security owned by the Fund that is listed on a securities exchange, except securities listed on the NASDAQ Stock Market, LLC (“NASDAQ”), is valued at its last sale price on that exchange on the date as of which assets are valued. Swap agreements, such as credit default swaps, interest rate swaps and currency swaps, are priced by an approved independent pricing service (“Pricing Service”). Forward foreign currency contracts are valued at the mean between the bid and asked prices by Pricing Service. Commodities futures contracts and options thereon traded on a commodities exchange or board of trade are valued at the last sale price at the close of trading.
24
Table of Contents
MARKETFIELD FUND
Notes to Financial Statements, continued
June 30, 2019 (Unaudited)
If the security is listed on more than one exchange, the Fund will use the price of the exchange that the Fund generally considers to be the principal exchange on which the security is traded. Portfolio securities listed on NASDAQ will be valued at the NASDAQ Official Closing Price, which may not necessarily represent the last sale price. If there has been no sale on such exchange or on NASDAQ on such day, the security is valued at the mean between the most recent bid and ask prices at the close of the exchange on such day, or the security shall be valued at the latest sales price on the “composite market” for the day such security is being valued. The composite market is defined as a consolidation of the trade information provided by national securities and foreign exchanges and over-the-counter markets as published by a Pricing Service for the day such security is being valued.
If market quotations are not readily available, any security or other asset will be valued at its fair value as determined under fair value pricing procedures approved by the Board of Trustees. These fair value pricing procedures will also be used to price a security when corporate events, events in the securities market and/or world events cause the Adviser to believe that a security’s last sale price may not reflect its actual fair market value. The intended effect of using fair value pricing procedures is to ensure that the Fund’s shares are accurately priced. The Board of Trustees will regularly evaluate whether the Fund’s fair value pricing procedures continue to be appropriate in light of the specific circumstances of the Fund and the quality of prices obtained through the application of such procedures by the Trust’s valuation committee.
Redeemable securities issued by open-end, registered investment companies are valued at the NAVs of such companies for purchase and/or redemption orders placed on that day. If, on a particular day, a share of an investment company is not listed on NASDAQ, such security’s fair value will be determined as described above. All exchange-traded funds are valued at the last reported sale price on the exchange on which the security is principally traded. In the event market quotations are not readily available, such security’s fair value will be determined.
Debt securities, including short-term instruments having a maturity of 60 days or less, are valued at the mean in accordance with prices supplied by a Pricing Service. Pricing Services may use various valuation methodologies such as the mean between the bid and ask prices, matrix pricing method or other analytical pricing models as well as market transactions and dealer quotations. If a price is not available from a Pricing Service, the most recent quotation obtained from one or more broker-dealers known to follow the issue will be obtained. Quotations will be valued at the mean between the bid and the offer. Fixed income securities purchased on a delayed-delivery basis are typically marked to market daily until settlement at the forward settlement date. Any discount or premium is accreted or amortized using the constant yield method until maturity.
Money market funds, demand notes and repurchase agreements are valued at cost. If cost does not represent current market value the securities will be priced at fair value.
Exchange-traded options are valued at the composite price, using the National Best Bid and Offer quotes (“NBBO”). NBBO consists of the highest bid price and lowest ask price across any of the exchanges on which an option is quoted, thus providing a view across the entire U.S. options marketplace. Specifically, composite pricing looks at the last trades on the exchanges where the options are traded. If there are no trades for the option on a given business day, composite option pricing calculates the mean of the highest bid price and lowest ask price across the exchanges where the option is traded. Over-the-counter (“OTC”) option contracts on securities, currencies and other financial instruments with less than 180 days remaining until their expiration shall be valued at the evaluated price provided by the broker-dealer with which the option was traded. Option contracts on securities, currencies and other financial instruments traded in the OTC market with 180 days or more remaining until their expiration shall be valued at the prices provided by a recognized independent broker-dealer. Futures contracts and options thereon are valued at the last settlement price at the closing of trading on the relevant exchange or board of trade. Futures or options on futures positions for which reliable market quotations are not readily available shall be valued at a price supplied by a Pricing Service.
Swap agreements are generally traded over the counter and are valued by a Pricing Service using observable inputs. If a price provided by a Pricing Service differs from the price provided by an independent dealer by
25
Table of Contents
MARKETFIELD FUND
Notes to Financial Statements, continued
June 30, 2019 (Unaudited)
10% or more or the Adviser otherwise believes that the price provided by the Pricing Service is inaccurately stated, the Adviser shall price the swap using the average of two prices obtained by independent dealers. In the event the Adviser determines the price of a swap in this manner does not represent market value, the fair value of the subject swap shall be determined in accordance with the Trust’s fair value procedures.
FASB Accounting Standards Codification, “Fair Value Measurements” Topic 820 (“ASC 820”), establishes an authoritative definition of fair value and sets out a hierarchy for measuring fair value. ASC 820 requires an entity to evaluate certain factors to determine whether there has been a significant decrease in volume and level of activity for the security such that recent transactions and quoted prices may not be determinative of fair value and further analysis and adjustment may be necessary to estimate fair value. ASC 820 also requires enhanced disclosure regarding the inputs and valuation techniques used to measure fair value in those instances as well as expanded disclosure of valuation levels for major security types. These inputs are summarized in the three broad levels listed below:
Level 1 — Quoted prices in active markets for identical securities.
Level 2 — Other significant observable inputs (including quoted prices for similar securities, interest rates, prepayment speeds, credit risk, etc.).
Level 3 — Significant unobservable inputs (including the Fund’s own assumptions in determining the fair value of investments).
The inputs or methodology used for valuing securities are not necessarily an indication of the risk associated with investing in those securities. The following is a summary of the inputs used to value the Fund’s investments carried at fair value as of June 30, 2019:
| Level 1 |
Level 2 |
Level
3(3) |
Total |
|||||||||||||
| Assets: |
|
|||||||||||||||
| Common Stocks(1) |
$ | 118,433,817 | $ | — | $ | — | $ | 118,433,817 | ||||||||
| Exchange-Traded Funds |
54,227,920 | — | — | 54,227,920 | ||||||||||||
| Preferred Stocks |
3,125,970 | — | — | 3,125,970 | ||||||||||||
| Short-Term Investments |
35,241,588 | — | — | 35,241,588 | ||||||||||||
| Total Assets | $ | 211,029,295 | $ | — | $ | — | $ | 211,029,295 | ||||||||
| Liabilities: |
|
|||||||||||||||
| Securities Sold Short |
|
|||||||||||||||
| Common Stocks(1) |
$ | (16,778,829 | ) | $ | — | $ | — | $ | (16,778,829 | ) | ||||||
| Exchange-Traded Funds |
(58,480,257 | ) | — | — | (58,480,257 | ) | ||||||||||
| Master Limited Partnerships |
(3,014,297 | ) | — | — | (3,014,297 | ) | ||||||||||
| Real Estate Investment Trusts |
(16,592,499 | ) | — | — | (16,592,499 | ) | ||||||||||
| Total Securities Sold Short | (94,865,882 | ) | — | — | (94,865,882 | ) | ||||||||||
| Total Liabilities | $ | (94,865,882 | ) | $ | — | $ | — | $ | (94,865,882 | ) | ||||||
| Other Financial Instruments(2) |
|
|||||||||||||||
| Futures |
$ | 97,740 | $ | — | $ | — | $ | 97,740 | ||||||||
| Swaps |
— | 1,951,837 | — | 1,951,837 | ||||||||||||
| Total Other Financial Instruments | $ | 97,740 | $ | 1,951,837 | $ | — | $ | 2,049,577 | ||||||||
| (1) | See the Schedule of Investments for industry/geographic classifications. |
| (2) | Reflected at the net unrealized appreciation on the contracts held. |
| (3) | The Fund measures Level 3 activity as of the end of each financial reporting period. For the six months ended June 30, 2019, the Fund did not have unobservable inputs (Level 3 securities) used in determining fair value. Therefore, a reconciliation of assets and liabilities in which significant unobservable inputs (Level 3 securities) were used in determining fair value is not applicable. |
26
Table of Contents
MARKETFIELD FUND
Notes to Financial Statements, continued
June 30, 2019 (Unaudited)
| (b) | Foreign Securities and Currency Transactions |
Investment securities and other assets and liabilities denominated in foreign currencies are translated into U.S. dollar amounts at the date of valuation. Purchases and sales of investment securities and income and expense items denominated in foreign currencies are translated into U.S. dollar amounts on the respective dates of such transactions. The Fund does not isolate the portion of the results of operations from changes in foreign exchange rates on investments from the fluctuations arising from changes in market prices of securities held. Realized foreign exchange gains or losses arising from sales of portfolio securities and sales and maturities of short-term securities are reported within realized gain (loss) on investments. Net unrealized foreign exchange gains and losses arising from changes in the values of investments in securities from fluctuations in exchange rates are reported within unrealized gain (loss) on investments. The realized gain or loss and unrealized appreciation or depreciation resulting from all other transactions denominated in currency other than U.S. dollars are disclosed separately.
Investments in foreign securities entail certain risks. There may be a possibility of nationalization or expropriation of assets, confiscatory taxation, political or financial instability, and diplomatic developments that could affect the value of the Fund’s investments in certain foreign countries. Since foreign securities normally are denominated and traded in foreign currencies, the value of the Fund’s assets may be affected favorably or unfavorably by currency exchange rates, currency exchange control regulations, foreign withholding taxes, and restrictions or prohibitions on the repatriation of foreign currencies. There may be less information publicly available about a foreign issuer than about a U.S. issuer, and foreign issuers are not generally subject to accounting, auditing, and financial reporting standards and practices comparable to those in the United States. The securities of some foreign issuers are less liquid and at times more volatile than securities of comparable U.S. issuers.
| (c) | Derivative Instruments |
GAAP requires enhanced disclosure that enables investors to understand how and why an entity uses derivatives, how derivatives are accounted for, and how derivative instruments affect an entity’s results of operations and financial position.
The Fund invested in derivative instruments such as purchased options, written options, forward currency contracts, swap contracts and futures contracts during the period.
The fair value of derivative instruments as reported within the Statement of Assets and Liabilities as of June 30, 2019:
| Asset Derivatives |
Liability Derivatives |
|||||||||||
| Derivatives not accounted for
as |
Statement of Assets & Liabilities Location |
Value |
Statement of Assets & Liabilities Location |
Value |
||||||||
| Equity Contracts — Futures |
Net assets — Unrealized appreciation* |
$ | 97,740 | Net assets — Unrealized depreciation* |
$ | — | ||||||
| Equity Contracts — Swaps |
Unrealized appreciation on swap contracts |
1,951,837 | Unrealized depreciation on swap contracts |
— | ||||||||
| Total |
$ | 2,049,577 | $ | — | ||||||||
| * | Reflects cumulative unrealized appreciation (depreciation) of futures contracts as reported in the Schedule of Open Futures Contracts. Only the current day’s variation margin is reported separately within the Statement of Assets and Liabilities. |
27
Table of Contents
MARKETFIELD FUND
Notes to Financial Statements, continued
June 30, 2019 (Unaudited)
The effect of derivative instruments on the Statement of Operations for the six months ended June 30, 2019 was as follows:
| Amount of Realized Gain (Loss) on Derivatives Recognized in Income
|
||||||||||||
| Derivatives not accounted for |
Futures Contracts |
Swap Contracts |
Total |
|||||||||
| Equity Contracts |
$ | 47,002 | $ | 287,011 | $ | 334,013 | ||||||
| Interest Rate Contracts |
— | — | — | |||||||||
| Total |
$ | 47,002 | $ | 287,011 | $ | 334,013 | ||||||
| Change in Unrealized Appreciation (Depreciation) on Derivatives Recognized in Income |
||||||||||||
| Derivatives not accounted for |
Futures Contracts |
Swap Contracts |
Total |
|||||||||
| Equity Contracts |
$ | 927,901 | $ | 2,902,716 | $ | 3,830,617 | ||||||
| Interest Rate Contracts |
— | — | — | |||||||||
| Total |
$ | 927,901 | $ | 2,902,716 | $ | 3,830,617 | ||||||
Options
The Fund may write call and put options on securities and financial derivative instruments it owns or in which it may invest. Writing put options tends to increase the Fund’s exposure to decreases in the value of the underlying instrument. Writing covered call options tends to decrease the Fund’s exposure to the underlying instrument. Writing uncovered call options increases the Fund’s exposure to loss in the event of increase in value of the underlying instrument. When the Fund writes a call or put, an amount equal to the premium received is recorded as a liability and subsequently marked to market to reflect the current value of the option written. These liabilities are reflected as written options outstanding on the Statement of Assets and Liabilities. Premiums received from writing options which expire are treated as realized gains. Premiums received from writing options which are exercised or closed are added to the proceeds or offset against amounts paid on the underlying futures, swaps, security or currency transaction to determine the realized gain or loss. Certain options may be written with premiums to be determined on a future date. The Fund, as a writer of an option, has no control over whether the underlying instrument may be sold (call) or purchased (put) and as a result bears the market risk of an unfavorable change in the price of the instrument underlying the written option. There is the risk the Fund may not be able to enter into a closing transaction because of an illiquid market. Writing call options involves the risk of loss in excess of the related amounts reflected in the Statement of Assets and Liabilities.
The Fund may also purchase put and call options. Purchasing call options tends to increase the Fund’s exposure to the underlying instrument. Alternatively, purchasing put options tends to decrease the Fund’s exposure to the underlying instrument. The Fund pays a premium which is included on the Fund’s Statement of Assets and Liabilities as an investment and subsequently marked to market to reflect the current value of the option. Premiums paid for purchasing options which expire are treated as realized losses. Certain options may be purchased with premiums to be determined on a future date. The premiums for these options are based upon implied volatility parameters at specified terms. The risk associated with purchasing put and call options is limited to the premium paid. Premiums paid for purchasing options which are exercised or closed are added to the amounts paid or offset against the proceeds on the underlying investment transaction to determine the realized gain or loss when the underlying transaction is sold.
The Fund may purchase or write foreign currency options. Purchasing a foreign currency option gives the Fund the right, but not the obligation, to buy or sell a specified amount of the currency at a specified rate of exchange that may be exercised on or before the option’s expiration date. Writing a foreign currency option
28
Table of Contents
MARKETFIELD FUND
Notes to Financial Statements, continued
June 30, 2019 (Unaudited)
obligates the Fund to buy or sell a specified amount of foreign currency at a specified rate of exchange, and such option may be exercised on or before the option’s expiration date in exchange for an option premium. These options may be used as a short or long hedge against possible variations in foreign exchange rates or to gain exposure to foreign currencies. The risks associated with writing a foreign currency put option is that the Fund may incur a loss if the value of the referenced foreign currency decreases and the option is exercised. The risks associated with writing a foreign currency call option is that if the value of the referenced foreign currency increases, and if the option is exercised, the Fund must either acquire the referenced foreign currency at the then higher price for delivery or, if the Fund already owns the referenced foreign currency, forego the opportunity for profit with respect to such foreign currency.
| Futures | and Forward Foreign Currency Contracts |
The Fund may enter into foreign currency forward exchange contracts. When entering into a forward currency contract, the Fund agrees to receive or deliver a fixed quantity of foreign currency for an agreed-upon price at a future date. The market value of the contract fluctuates with changes in currency exchange rates. The contract is marked- to-market daily and the change in market value is recorded by the Fund as an unrealized gain or loss. The Fund records a realized gain or loss equal to the difference between the value of the contract at the time it was opened and the value at the time it was closed.
The Fund may enter into futures contracts traded on domestic and international exchanges, including stock index futures contracts. Upon entering into a contract, the Fund deposits and maintains as collateral such initial margin as required by the exchange on which the transaction is effected. Pursuant to the contract, the Fund agrees to receive from or pay to the broker an amount of cash equal to the daily fluctuation in value of the contract. Such receipts or payments are known as variation margin and are recorded by the Fund as unrealized gains and losses. When the contract is closed, the Fund records a realized gain or loss equal to the difference between the value of the contract at the time it was opened and the value at the time it was closed. As collateral for futures contracts, the Fund is required under the 1940 Act to maintain assets consisting of cash, cash equivalents or liquid securities. This collateral is required to be adjusted daily to reflect the market value of the obligations for futures contracts or the market value of the instrument underlying the contract.
The risks inherent in the use of futures contracts include 1) adverse changes in the value of such instruments and 2) the possible absence of a liquid secondary market for any particular instrument at any time. Futures contracts also expose the Fund to counterparty credit risk. The Fund will not enter into these contracts unless it owns either 1) an offsetting position in the securities or 2) cash and liquid assets, with a value marked-to-market daily, sufficient to cover its potential obligations.
The average monthly notional amounts during the six months ended June 30, 2019 were as follows:
| Futures Contracts |
||||
| Long |
$ | 11,884,429 | ||
| Short |
$ | — | ||
The Fund did not hold any forward foreign currency contracts during the period.
| Swap | Agreements |
The Fund is subject to equity price, foreign exchange rate, credit, and volatility risk in the normal course of pursuing its investment objective. The Fund may enter into various swap transactions for investment purposes to manage these risks. These would be two-party contracts entered into primarily to exchange the returns (or differentials in rates of returns) earned or realized on particular pre-determined investments or instruments. The gross returns to be exchanged or “swapped” between parties are calculated with respect to a notional amount, i.e., the return on or increase in value of a particular dollar amount invested at a particular interest rate, in a particular foreign currency, or in a “basket” of securities representing a particular index or market
29
Table of Contents
MARKETFIELD FUND
Notes to Financial Statements, continued
June 30, 2019 (Unaudited)
segment. Changes in the value of swap agreements are recognized as unrealized gains or losses in the “marking to market” on a daily basis to reflect the value of the swap agreement at the end of each trading day. Payments received or paid at the beginning of the agreement are referred to as upfront payments. The Fund amortizes upfront payments and/or accrues for the fixed payment stream on swap agreements on a daily basis with the net amount recorded as a component of unrealized gain or loss until contracts are closed or payments are received/paid and recognized as income. A liquidation payment received or made at the termination of the swap agreement is recorded as a realized gain or loss on the Statement of Operations. The Fund segregates liquid securities having a value at least equal to the amount of its current obligation under any swap transaction. Entering into these agreements involves, to varying degrees, lack of liquidity and elements of credit, market, and counterparty risk. The Fund’s maximum risk of loss from counterparty credit risk is the discounted net value of the cash flows to be received from/paid to the counterparty over the contract’s remaining life, to the extent that amount is positive.
The Fund may enter into credit default swaps to manage its exposure to the market or certain sectors of the market, to reduce its risk exposure to defaults of corporate issuers or indexes or to create exposure to corporate issuers or indexes to which it is not otherwise exposed. In a credit default swap, the protection buyer makes a stream of payments based on a fixed percentage applied to the contract notional amount to the protection seller in exchange for the right to receive a specified return upon the occurrence of a defined credit event on the reference obligation which may be either a single security or a basket of securities issued by corporate or sovereign issuers. Although contract-specific, credit events are generally defined as bankruptcy, failure to pay, restructuring, obligation acceleration, obligation default, or repudiation/moratorium. Upon the occurrence of a defined credit event, the difference between the value of the reference obligation and the swap’s notional amount is recorded as realized gain (for protection written) or loss (for protection sold) in the Statement of Operations. In the case of credit default swaps where the Fund is selling protection, the notional amount approximates the maximum loss.
For the six months ended June 30, 2019, the Fund recorded net realized gain of $287,011 resulting from swap activity. The average monthly notional amount of swaps during the period was $13,230,609 for long positions and $0 for short positions.
| (d) | Short Positions |
The Fund may sell a security it does not own in anticipation of a decline in the fair value of that security. When the Fund sells a security short, it must borrow the security sold short and deliver it to the broker-dealer through which it made the short sale. A gain, limited to the price at which the Fund sold the security short, or a loss, unlimited in size, will be recognized upon the termination of a short sale.
For financial statement purposes, an amount equal to the settlement amount is included in the Statement of Assets and Liabilities as a liability. The amount of the liability is subsequently marked-to-market to reflect the current value of the short positions. Subsequent fluctuations in the market prices of the securities sold, but not yet purchased, may require purchasing the securities at prices which could differ from the amount reflected in the Statement of Assets and Liabilities. The Fund is liable for any dividends or interest payable on securities while those securities are in a short position. Such amounts are recorded on the ex- dividend date as dividend or interest expense. As collateral for its short positions, the Fund is required under the 1940 Act to maintain segregated assets consisting of cash, cash equivalents or liquid securities. The segregated assets are valued consistent with Note 2a above. The amount of segregated assets is required to be adjusted daily to reflect changes in the fair value of the securities sold short.
| (e) | Counterparty Credit Risk |
In order to better define its contractual rights and to secure rights that will help the Fund mitigate its counterparty risk, the Fund may enter into an International Swaps and Derivatives Association, Inc. Master Agreement (“ISDA Master Agreement”) or similar agreement with its counterparties. An ISDA Master
30
Table of Contents
MARKETFIELD FUND
Notes to Financial Statements, continued
June 30, 2019 (Unaudited)
Agreement is a bilateral agreement between the Fund and a counterparty that governs certain OTC derivatives and typically contains collateral posting terms and netting provisions. Under an ISDA Master Agreement, the Fund may, under certain circumstances, offset with the counterparty certain derivative financial instruments’ payables and/or receivables with collateral held and/or posted and create one single net payment. The provisions of the ISDA Master Agreement typically permit a single net payment in the event of default including the bankruptcy or insolvency of the counterparty. Bankruptcy or insolvency laws of a particular jurisdiction may restrict or prohibit the right of offset in bankruptcy, insolvency or other events. In addition, certain ISDA Master Agreements may contain provisions for early termination of OTC derivative transactions in the event the net assets of the Fund decline below specific levels or if the Fund fails to meet the terms of its ISDA Master Agreements. The result would cause the Fund to accelerate payment of any net liability owed to the counterparty. For financial reporting purposes, the Fund does not offset derivative assets and derivative liabilities that are subject to netting arrangements, if any, in the Statement of Assets and Liabilities.
At June 30, 2019, the Fund had deposits with Bank of America Merrill Lynch, Barclays Bank PLC, and Citibank N.A. (the “Brokers”), which served as collateral for derivative instruments and securities sold short. The Adviser determined, based on information available at the time, that the creditworthiness of each Broker is satisfactory. However, there is no guarantee that the Adviser’s determination is correct or will remain accurate.
| (f) | Federal Income Taxes |
The Fund intends to comply with the requirements of Subchapter M of the Internal Revenue Code of 1986, as amended, necessary to qualify as a regulated investment company and to make the requisite distributions of income and capital gains to its shareholders sufficient to relieve it from all or substantially all federal income taxes. Therefore, no federal income tax provision has been provided.
As of and during the year ended December 31, 2018, the Fund did not have a liability for any unrecognized tax benefits. The Fund recognizes interest and penalties, if any, related to unrecognized tax benefits as income tax expense in the Statement of Operations. During the year ended December 31, 2018, the Fund did not incur any interest or penalties. The Fund is not subject to examination by U.S. taxing authorities for the tax periods prior to the year ended December 31, 2015.
| (g) | Distributions to Shareholders |
In general, the Fund will distribute any net investment income and any net realized long- or short-term capital gains at least annually. Distributions from net realized gains for book purposes may include short-term capital gains. All short-term capital gains are included in ordinary income for tax purposes. Distributions to shareholders are recorded on the ex-dividend date. The Fund may also pay a special distribution at the end of the calendar year to comply with federal tax requirements.
Income and capital gain distributions may differ from GAAP, primarily due to timing differences in the recognition of income and gains and losses by the Fund. To the extent that these differences are attributable to permanent book and tax accounting differences, they are reclassified in the components of net assets.
| (h) | Use of Estimates |
The preparation of financial statements in conformity with GAAP requires management to make estimates and assumptions that affect the reported amounts of assets and liabilities and disclosure of contingent assets and liabilities at the date of the financial statements and the reported amounts of revenues and expenses during the reporting period. Actual results could differ from those estimates.
| (i) | Share Valuation |
The NAV per share of the Fund is calculated by dividing the sum of the value of the securities held by the Fund, plus cash or other assets, minus all liabilities (including estimated accrued expenses) by the total
31
Table of Contents
MARKETFIELD FUND
Notes to Financial Statements, continued
June 30, 2019 (Unaudited)
number of shares outstanding for the Fund, rounded to the nearest cent. The Fund’s shares will not be priced on the days on which the New York Stock Exchange is closed for trading.
| (j) | Allocation of Income, Expenses and Gains/Losses |
Income, expenses (other than those deemed attributable to a specific share class), and gains and losses of the Fund are allocated daily to each class of shares based upon the ratio of net assets represented by each class as a percentage of the net assets of the Fund. Expenses deemed directly attributable to a class of shares are recorded by the specific class. Most Fund expenses are allocated by class based on relative net assets. Rule 12b-1 distribution and service fees are expensed at 0.25% of average daily net assets of the Class A shares and at 1.00% of average daily net assets of the Class C shares. Expenses associated with a specific fund in the Trust are charged to that fund. Common Trust expenses are typically allocated evenly between the funds of the Trust, or by other equitable means.
| (k) | Other |
Investment transactions are recorded on the trade date. The Fund determines the gain or loss from investment transactions on the identified cost basis by comparing original cost of the security lot sold with the net sale proceeds. Dividend income and expense, less net foreign withholding tax, are recognized on the ex-dividend date and interest income and expense are recognized on an accrual basis. Withholding taxes on foreign dividends and interest, net of any reclaims, have been provided for in accordance with the Fund’s understanding of the applicable country’s tax rules and rates. Payments received on securities in default are recorded as return of capital.
| (3) | Federal Tax Matters |
The tax character of distributions paid during the years ended December 31, 2017 and 2018 were as follows:
| Ordinary Income |
Long-Term Capital Gain |
|||||||
| December 31, 2017 |
$ | — | $ | — | ||||
| December 31, 2018 |
$ | — | $ | — | ||||
As of December 31, 2018, the components of accumulated earnings on a tax basis were as follows:
| Cost basis of investments for federal income tax purposes |
$ | 232,011,953 | ||
| Gross tax unrealized appreciation |
61,663,625 | |||
| Gross tax unrealized depreciation |
(16,373,377 | ) | ||
| Net tax unrealized appreciation |
45,290,248 | |||
| Undistributed ordinary income |
— | |||
| Undistributed long-term capital gain |
— | |||
| Total distributable earnings |
— | |||
| Other accumulated losses |
(435,444,906 | ) | ||
| Total accumulated losses |
$ | (390,154,658 | ) | |
The difference between book-basis and tax-basis unrealized appreciation (depreciation) is primarily due to wash sale adjustments, swaps and mark-to-market future contracts.
At December 31, 2018, the Fund had short-term capital losses of $435,536,013, which will be carried forward indefinitely to offset future realized capital gains. To the extent the Fund realizes future net capital gains, taxable distributions to its shareholders will be first offset by any unused capital loss carryovers from the year ended December 31, 2018.
32
Table of Contents
MARKETFIELD FUND
Notes to Financial Statements, continued
June 30, 2019 (Unaudited)
The Fund utilized $56,185,318 of short-term capital loss carryover during the year ended December 31, 2018.
Additionally, U.S. generally accepted accounting principles require that certain components of net assets relating to permanent differences be reclassified between financial and tax reporting. These reclassifications have no effect on net assets or net asset value per share. For the year ended December 31, 2018, the following table shows the reclassifications made:
| Accumulated Deficit |
Paid In Capital | |
| $2,333,238 |
$(2,333,238) |
The reclassifications for the Fund are primarily due to foreign currency gain (loss), net operating losses, swaps and short sales.
| (4) | Investment Adviser |
The Trust, on behalf of the Fund, has an Investment Advisory Agreement (the “Agreement”) with Marketfield Asset Management LLC (the “Adviser”) to furnish investment advisory services to the Fund. Under the terms of the Agreement, the Trust, on behalf of the Fund, compensates the Adviser for its investment advisory services at an annual rate of the Fund’s average daily net assets as follows: 1.40% up to $7.5 billion; 1.38% from $7.5 billion to $15 billion; and 1.36% in excess of $15 billion. For the six months ended June 30, 2019, the effective management fee rate (exclusive of any applicable waivers/reimbursements) was 1.40% and the Adviser earned fees in the amount of $1,714,677 from the Fund.
The Adviser has contractually agreed to waive its management fee and/or reimburse the Fund’s other expenses at least through April 30, 2020, at the discretion of the Adviser and the Board of Trustees, to the extent necessary to ensure that the Fund’s total operating expenses (exclusive of front-end or contingent deferred sales loads, taxes, leverage, interest, brokerage commissions, expenses incurred in connection with any merger or reorganization, dividends or interest expenses on short positions, acquired fund fees and expenses and extraordinary expenses such as litigation) do not exceed the Expense Limitation Cap as follows:
| Class A |
Class C |
Class I |
Class R6 | |||
| 1.80% |
2.57% | 1.56% | 1.43% |
Any such waiver or reimbursement is subject to later adjustment to allow the Adviser to recoup amounts waived or reimbursed to the extent actual fees and expenses for a fiscal period do not exceed the lesser of: (1) the Expense Limitation Cap in place at the time of the waiver or reimbursement; or (2) the Expense Limitation Cap in place at the time of the recoupment; provided, however, that the Adviser shall only be entitled to recoup such amounts over the following three year period from the date of the waiver or reimbursement.
The following table shows the waivers per class that are subject to potential recovery expiring on:
| Class A |
Class C |
Class I |
Class R6 | |||||
| December 31, 2019 |
$75,600 | $118,152 | $247,480 | $3,171 | ||||
| December 31, 2020 |
$160,479 | $182,839 | $593,693 | $7,040 | ||||
| December 31, 2021 |
$130,246 | $143,863 | $476,208 | $7,441 | ||||
| June 30, 2022 |
$62,621 | $68,763 | $202,390 | $3,200 |
| (5) | Distribution Plan |
The Trust has adopted a plan pursuant to Rule 12b-1 under the 1940 Act (the “12b-1 Plan”), on behalf of the Fund, which authorizes it to pay Quasar Distributors, LLC (the “Distributor”), the Fund’s distributor and
33
Table of Contents
MARKETFIELD FUND
Notes to Financial Statements, continued
June 30, 2019 (Unaudited)
principal underwriter. Pursuant to the 12b-1 Plan, the Distributor receives a distribution fee of 0.25% of the average daily net assets of the Class A shares for services to prospective Fund shareholders and distribution of Fund shares. Pursuant to the 12b-1 Plan, Class C shares pay the Distributor a distribution fee of 0.75% of the average daily net assets of the Class C shares, along with a shareholder servicing fee of 0.25% of the average daily net assets of the Class C shares, for a total 12b-1 fee of 1.00%. Class I and Class R6 are not subject to the 12b-1 Plan. As of and during the six months ended June 30, 2019, the Fund accrued and owed expenses related to the 12b-1 Plan as presented in the Statement of Operations and Statement of Assets and Liabilities, respectively, as follows:
| 12b-1 Fees |
Shareholder Servicing Fees |
|||||||||||||||
| Fees Expensed |
Fees Owed |
Fees Expensed |
Fees Owed |
|||||||||||||
| Class A |
$ | 54,950 | $ | 6,369 | N/A | N/A | ||||||||||
| Class C |
$ | 194,761 | $ | 39,928 | $ | 64,920 | $ | 43,357 | ||||||||
| (6) | Related Party Transactions |
U.S. Bancorp Fund Services, LLC doing business as U.S. Bank Global Fund Services (“Fund Services” or the “Administrator”), acts as the Fund’s Administrator under an Administration Agreement. The Administrator prepares various federal and state regulatory filings, reports and returns for the Fund; prepares reports and materials to be supplied to the Trustees; monitors the activities of the Fund’s custodian, transfer agent and accountants; coordinates the preparation and payment of the Fund’s expenses; and reviews the Fund’s expense accruals. Fund Services also serves as the fund accountant and transfer agent to the Fund. U.S. Bank National Association (“U.S. Bank”), an affiliate of Fund Services, serves as the Fund’s custodian. The following table details the fees expensed for each service during the six months ended June 30, 2019, as well as the fees owed as of June 30, 2019.
| Fees Expensed During Fiscal Period |
Fees Owed as of June 30, 2019 |
|||||||
| Administration and Fund Accounting |
$ | 190,298 | $ | 46,300 | ||||
| Pricing |
1,051 | 1,408 | ||||||
| Custody |
33,024 | 15,731 | ||||||
| Transfer Agent |
51,789 | (1) | 19,116 | |||||
| (1) | This amount does not include sub-transfer agency fees, and therefore it does not agree to the amount on the Statement of Operations. |
The Fund also has a line of credit with U.S. Bank (see Note 9).
The Distributor is an affiliate of Fund Services and U.S. Bank.
Certain officers of the Fund are also employees of Fund Services. A Trustee of the Trust is affiliated with Fund Services and U.S. Bank. This same Trustee is a board member and an interested person of the Distributor.
The Trust’s Chief Compliance Officer is also an employee of Fund Services. For the six months ended June 30, 2019, the Fund was allocated $5,973 of the Trust’s Chief Compliance Officer fee. At June 30, 2019, the Fund owed fees of $1,979 to Fund Services for Chief Compliance Officer’s services.
34
Table of Contents
MARKETFIELD FUND
Notes to Financial Statements, continued
June 30, 2019 (Unaudited)
| (7) | Capital Share Transactions |
Transactions in shares of the Funds were as follows:
| Class A | ||||||||
| Six Months Ended June 30, 2019 |
Year Ended December 31, 2018 |
|||||||
| Shares sold |
42,717 | 202,664 | ||||||
| Shares redeemed |
(598,010 | ) | (1,513,057 | ) | ||||
| Net decrease |
(555,293 | ) | (1,310,393 | ) | ||||
| Class C | ||||||||
| Shares sold |
3,120 | 35,325 | ||||||
| Shares redeemed |
(835,202 | ) | (1,688,962 | ) | ||||
| Net decrease |
(832,082 | ) | (1,653,637 | ) | ||||
| Class I | ||||||||
| Shares sold |
235,082 | 1,614,237 | ||||||
| Shares redeemed |
(3,356,931 | ) | (8,168,133 | ) | ||||
| Net decrease |
(3,121,849 | ) | (6,553,896 | ) | ||||
| Class R6 | ||||||||
| Shares sold |
1,840 | 5,168 | ||||||
| Shares redeemed |
(7,296 | ) | (48,952 | ) | ||||
| Net decrease |
(5,456 | ) | (43,784 | ) | ||||
| (8) | Investment Transactions |
The aggregate purchases and sales of securities, excluding short-term investments, securities sold short and derivative instruments for the Fund for the six months ended June 30, 2019 are detailed below.
| Purchases | ||||
| U.S. Government |
$ | 0 | ||
| Other |
0 | |||
| $ | 0 | |||
| Sales | ||||
| U.S. Government |
$ | 0 | ||
| Other |
67,317,545 | |||
| $ | 67,317,545 | |||
| (9) | Line of Credit |
The Fund has a line of credit with maximum borrowing for the lesser of 33.33% of the fair value of unencumbered net assets of the Fund or $80,000,000, which expires on August 9, 2019. This unsecured line of credit is intended to provide short-term financing, if necessary, in connection with shareholder redemptions, and subject to certain restrictions. Interest was accrued at the prime rate of 5.50% from January 1, 2019 through June 30, 2019. The credit facility is with the Fund’s custodian, U.S. Bank. The Fund did not borrow on the line of credit during the six months ended June 30, 2019.
35
Table of Contents
NOTICE OF PRIVACY POLICY & PRACTICES
We collect non-public personal information about you from the following sources:
| • | information we receive about you on applications or other forms; |
| • | information you give us orally; and |
| • | information about your transactions with us or others. |
We do not disclose any non-public personal information about our shareholders or former shareholders without the shareholder’s authorization, except as permitted by law or in response to inquiries from governmental authorities. We may share information with affiliated parties and unaffiliated third parties with whom we have contracts for servicing the Fund. We will provide unaffiliated third parties with only the information necessary to carry out their assigned responsibility. All shareholder records will be disposed of in accordance with applicable law. We maintain physical, electronic and procedural safeguards to protect your non-public personal information and require third parties to treat your non-public personal information with the same high degree of confidentiality.
In the event that you hold shares of the Fund through a financial intermediary, including, but not limited to, a broker-dealer, bank or trust company, the privacy policy of your financial intermediary would govern how your non-public personal information would be shared with unaffiliated third parties.
36
Table of Contents
Additional Information
(Unaudited)
Indemnifications
Under the Trust’s organizational documents, its officers and Trustees are indemnified against certain liabilities arising out of the performance of their duties to the Fund. In addition, in the normal course of business, the Fund enters into contracts that provide general indemnifications to other parties. The Fund’s maximum exposure under these arrangements is unknown as this would involve future claims that may be made against the Fund that have not yet occurred. However, the Fund has not had prior claims or losses pursuant to these contracts and expects the risk of loss to be remote.
Information about Trustees
The business and affairs of the Trust are managed under the direction of the Board of Trustees. Information pertaining to the Trustees of the Trust is set forth below. The Statement of Additional Information includes additional information about the Trustees and is available, without charge, upon request by calling 1-888-236-4298.
Independent Trustees
| Name, |
Position(s) |
Term of |
Number of Portfolios in Trust Overseen by Trustee |
Principal Occupation(s) |
Other | |||||
| Michael D. Akers, Ph.D. 615 E. Michigan St. Milwaukee, WI 53202 Year of Birth: 1955 |
Trustee | Indefinite Term; Since August 22, 2001 | 28 | Professor Emeritus, Department of Accounting (June 2019–Present), Professor, Department of Accounting (2004–May 2019), Chair, Department of Accounting (2004–2017), Marquette University. | Independent Trustee, USA MUTUALS (an open-end investment company with two portfolios). | |||||
| Gary A. Drska 615 E. Michigan St. Milwaukee, WI 53202 Year of Birth: 1956 |
Trustee | Indefinite Term; Since August 22, 2001 | 28 | Pilot, Frontier/Midwest Airlines, Inc. (airline company) (1986–present). | Independent Trustee, USA MUTUALS (an open-end investment company with two portfolios). | |||||
| Jonas B. Siegel 615 E. Michigan St. Milwaukee, WI 53202 Year of Birth: 1943 |
Trustee | Indefinite Term; Since October 23, 2009 | 28 | Retired (2011-present); Managing Director, Chief Administrative Officer (“CAO”) and Chief Compliance Officer (“CCO”), Granite Capital International Group, L.P. (an investment management firm) (1994–2011). | Independent Trustee, Gottex Trust (an open-end investment company) (2010-2016); Independent Manager, Ramius IDF fund complex (two closed-end investment companies) (2010–2015); Independent Trustee, Gottex Multi-Asset Endowment fund complex (three closed-end investment companies) (2010–2015); Independent Trustee, Gottex Multi-Alternatives fund complex (three closed-end investment companies) (2010–2015). | |||||
37
Table of Contents
MARKETFIELD FUND
Additional Information (continued)
(Unaudited)
Interested Trustee and Officers
| Name, |
Position(s) |
Term of |
Number of Portfolios in Trust Overseen by Trustee |
Principal Occupation(s) |
Other | |||||
| Joseph C. Neuberger* 615 E. Michigan St. Milwaukee, WI 53202 Year of Birth: 1962 |
Chairperson and Trustee | Indefinite Term; Since August 22, 2001 | 28 | President (2017–present), Chief Operating Officer (2016–present), Executive Vice President (1994–2017), U.S. Bancorp Fund Services, LLC. | Trustee, Buffalo Funds (an open-end investment company) (2003–2017); Trustee, USA MUTUALS (an open-end investment company) (2001–2018). | |||||
| John P. Buckel 615 E. Michigan St. Milwaukee, WI 53202 Year of Birth: 1957 |
President and Principal Executive Officer | Indefinite Term; Since January 24, 2013 | N/A | Vice President, U.S. Bancorp Fund Services, LLC (2004–present). | N/A | |||||
| Jennifer A. Lima 615 E. Michigan St. Milwaukee, WI 53202 Year of Birth: 1974 |
Vice President, Treasurer and Principal Financial and Accounting Officer | Indefinite Term; Since January 24, 2013 | N/A | Vice President, U.S. Bancorp Fund Services, LLC (2002–present). | N/A | |||||
| Elizabeth B. Scalf 615 E. Michigan St. Milwaukee, WI 53202 Year of Birth: 1985 |
Chief Compliance Officer, Vice President and Anti-Money Laundering Officer | Indefinite Term; Since July 1, 2017 |
N/A | Senior Vice President, U.S. Bancorp Fund Services, LLC (February 2017–present); Vice President and Assistant CCO, Heartland Advisors, Inc. (December 2016–January 2017); Vice President and CCO, Heartland Group, Inc. (May 2016–November 2016); Vice President, CCO and Senior Legal Counsel (May 2016–November 2016), Assistant CCO and Senior Legal Counsel (January 2016–April 2016), Senior Legal and Compliance Counsel (2013–2015), Heartland Advisors, Inc. | N/A | |||||
| Jay S. Fitton 615 E. Michigan St. Milwaukee, WI 53202 Year of Birth: 1970 |
Secretary | Indefinite Term; Since July 22, 2019 | N/A | Assistant Vice President, U.S. Bancorp Fund Services, LLC (2019–present); Partner, Practus, LLP (2018–2019); Counsel, Drinker Biddle & Reath (2016–2018); Counsel, Huntington Bancshares, Inc. (2011–2015). | N/A | |||||
| Kelly A. Burns 615 E. Michigan St. Milwaukee, WI 53202 Year of Birth: 1987 |
Assistant Treasurer | Indefinite Term; Since April 23, 2015 | N/A | Assistant Vice President, U.S. Bancorp Fund Services, LLC (2011–present). | N/A | |||||
38
Table of Contents
MARKETFIELD FUND
Additional Information (continued)
(Unaudited)
| Name, |
Position(s) |
Term of |
Number of Portfolios in Trust Overseen by Trustee |
Principal Occupation(s) |
Other | |||||
| Melissa Aguinaga 615 E. Michigan St. Milwaukee, WI 53202 Year of Birth: 1987 |
Assistant Treasurer | Indefinite Term; Since July 1, 2015 | N/A | Assistant Vice President, U.S. Bancorp Fund Services, LLC (2010–present). | N/A | |||||
| Laura A. Carroll 615 E. Michigan St. Milwaukee, WI 53202 Year of Birth: 1985 |
Assistant Treasurer | Indefinite Term; Since August 20, 2018 | N/A | Assistant Vice President, U.S. Bancorp Fund Services, LLC (2007–present). | N/A | |||||
| * | Mr. Neuberger is an “interested person” of the Trust as defined by the 1940 Act by virtue of the fact that he is a board member and an interested person of Quasar Distributors, LLC (the “Distributor”), the Fund’s principal underwriter. |
39
Table of Contents
A NOTE ON FORWARD LOOKING STATEMENTS (Unaudited)
Except for historical information contained in this report for the Fund, the matters discussed in this report may constitute forward-looking statements made pursuant to the safe-harbor provisions of the Private Securities Litigation Reform Act of 1995. These include any Adviser or portfolio manager predictions, assessments, analyses or outlooks for individual securities, industries, market sectors and/or markets. These statements involve risks and uncertainties. In addition to the general risks described for the Fund in the current Prospectus, other factors bearing on this report include the accuracy of the Adviser’s or portfolio manager’s forecasts and predictions, and the appropriateness of the investment programs designed by the Adviser or portfolio manager to implement their strategies efficiently and effectively. Any one or more of these factors, as well as other risks affecting the securities markets and investment instruments generally, could cause the actual results of the Fund to differ materially as compared to benchmarks associated with the Fund.
ADDITIONAL INFORMATION (Unaudited)
The Fund has adopted proxy voting policies and procedures that delegate to the Adviser the authority to vote proxies. A description of the Fund’s proxy voting policies and procedures is available without charge, upon request, by calling the Fund toll free at 1-800-311-6583. A description of these policies and procedures is also included in the Fund’s Statement of Additional Information, which is available on the SEC’s website at http://www.sec.gov.
The Fund’s proxy voting record for the most recent 12-month period ended June 30 is available without charge, upon request, by calling toll free, 1-800-311-6583, or by accessing the SEC’s website at http://www.sec.gov.
The Fund files its complete schedule of portfolio holdings with the SEC for the first and third quarters of each fiscal year on Form N-Q. Shareholders may view the Fund’s Forms N-Q on the SEC’s website at http://www.sec.gov.
HOUSEHOLDING (Unaudited)
In an effort to decrease costs, the Fund intends to reduce the number of duplicate prospectuses and annual and semiannual reports you receive by sending only one copy of each to those addresses shared by two or more accounts and to shareholders the Fund reasonably believes are from the same family or household. Once implemented, if you would like to discontinue householding for your accounts, please call the Fund toll-free at 1-855-772-4166 to request individual copies of these documents. Once the Fund receives notice to stop householding, the Fund will begin sending individual copies 30 days after receiving your request. This policy does not apply to account statements.
Table of Contents
MARKETFIELD FUND
| Investment Adviser |
Marketfield Asset Management LLC 60 East 42nd Street 36th Floor New York, New York 10165 | |
| Legal Counsel |
Godfrey & Kahn, S.C. 833 East Michigan Street, Suite 1800 Milwaukee, Wisconsin 53202 | |
| Independent Registered Public |
Deloitte & Touche LLP 555 East Wells Street Milwaukee, Wisconsin 53202 | |
| Transfer Agent, Fund Accountant |
U.S. Bancorp Fund Services, LLC 615 East Michigan Street Milwaukee, Wisconsin 53202 | |
| Custodian |
U.S. Bank National Association Custody Operations 1555 North River Center Drive Suite 302 Milwaukee, Wisconsin 53212 | |
| Distributor |
Quasar Distributors, LLC 777 East Wisconsin Avenue 6th Floor Milwaukee, Wisconsin 53202 | |
This report is intended for shareholders of the Fund and may not be used as sales literature unless preceded or accompanied by a current prospectus.
MJ SEMI ANNUAL
Table of Contents
| Item 2. | Code of Ethics. |
Not applicable for semi-annual reports.
| Item 3. | Audit Committee Financial Expert. |
Not applicable for semi-annual reports.
| Item 4. | Principal Accountant Fees and Services. |
Not applicable for semi-annual reports.
| Item 5. | Audit Committee of Listed Registrants. |
Not applicable to registrants who are not listed issuers (as defined in Rule 10A-3 under the Securities Exchange Act of 1934).
| Item 6. | Investments. |
| (a) | Schedule of Investments is included as part of the report to shareholders filed under Item 1 of this Form. |
| (b) | Not Applicable. |
| Item 7. | Disclosure of Proxy Voting Policies and Procedures for Closed-End Management Investment Companies. |
Not applicable to open-end investment companies.
| Item 8. | Portfolio Managers of Closed-End Management Investment Companies. |
Not applicable to open-end investment companies.
| Item 9. | Purchases of Equity Securities by Closed-End Management Investment Company and Affiliated Purchasers. |
Not applicable to open-end investment companies.
| Item 10. | Submission of Matters to a Vote of Security Holders. |
There have been no material changes to the procedures by which shareholders may recommend nominees to the registrant’s board of trustees.
Table of Contents
| Item 11. | Controls and Procedures. |
| (a) | The Registrant’s President and Treasurer have reviewed the Registrant’s disclosure controls and procedures (as defined in Rule 30a-3(c) under the Investment Company Act of 1940 (the “Act”)) as of a date within 90 days of the filing of this report, as required by Rule 30a-3(b) under the Act and Rules 13a-15(b) or 15d-15(b) under the Securities Exchange Act of 1934. Based on their review, such officers have concluded that the disclosure controls and procedures are effective in ensuring that information required to be disclosed in this report is appropriately recorded, processed, summarized and reported and made known to them by others within the Registrant and by the Registrant’s service provider. |
| (b) | There were no changes in the Registrant’s internal control over financial reporting (as defined in Rule 30a-3(d) under the Act) that occurred during the last fiscal half-year covered by this report that has materially affected, or is reasonably likely to materially affect, the Registrant’s internal control over financial reporting. |
| Item 12. | Disclosure of Securities Lending Activities for Closed-End Management Investment Companies |
Not applicable to open-end investment companies.
| Item 13. | Exhibits. |
| (a) | (1) Any code of ethics or amendment thereto, that is the subject of the disclosure required by Item 2, to the extent that the registrant intends to satisfy Item 2 requirements through filing an exhibit. Incorporated by reference to the Registrant’s Form N-CSR filed March 9, 2017. |
(2) A separate certification for each principal executive and principal financial officer pursuant to Section 302 of the Sarbanes-Oxley Act of 2002. Filed herewith.
(3) Any written solicitation to purchase securities under Rule 23c-1 under the Act sent or given during the period covered by the report by or on behalf of the registrant to 10 or more persons. Not applicable to open-end investment companies.
(4) Change in the registrant’s independent public accountant. There was no change in the registrant’s independent public accountant for the period covered by this report.
| (b) | Certifications pursuant to Section 906 of the Sarbanes-Oxley Act of 2002. Furnished herewith. |
Table of Contents
SIGNATURES
Pursuant to the requirements of the Securities Exchange Act of 1934 and the Investment Company Act of 1940, the registrant has duly caused this report to be signed on its behalf by the undersigned, thereunto duly authorized.
|
|
(Registrant) |
Trust for Professional Managers | ||||
| By (Signature and Title)* /s/ John Buckel | ||||||
| John Buckel, President | ||||||
| Date 9/4/19 | ||||||
Pursuant to the requirements of the Securities Exchange Act of 1934 and the Investment Company Act of 1940, this report has been signed below by the following persons on behalf of the registrant and in the capacities and on the dates indicated.
|
|
By (Signature and Title)* /s/ John Buckel | |||
|
John Buckel, President | ||||
| Date 9/4/19 | ||||
| By (Signature and Title)* /s/ Jennifer Lima | ||||
|
Jennifer Lima, Treasurer | ||||
| Date 9/4/19 | ||||
| * | Print the name and title of each signing officer under his or her signature. |