UNITED STATES
SECURITIES AND EXCHANGE COMMISSION
Washington, D.C. 20549
SECURITIES AND EXCHANGE COMMISSION
Washington, D.C. 20549
FORM N-CSR
CERTIFIED SHAREHOLDER REPORT OF REGISTERED
MANAGEMENT INVESTMENT COMPANIES
Investment Company Act file number: 811-10401
Trust for Professional Managers
(Exact name of registrant as specified in charter)
(Exact name of registrant as specified in charter)
615 East Michigan Street
Milwaukee, WI 53202
(Address of principal executive offices) (Zip code)
(Address of principal executive offices) (Zip code)
Jay S. Fitton
U.S. Bancorp Fund Services, LLC
615 East Michigan Street
Milwaukee, WI 53202
(Name and address of agent for service)
(Name and address of agent for service)
(513)-629-8104
Registrant's telephone number, including area code
Date of fiscal year end: November 30, 2021
Date of reporting period: May 31, 2021
Item 1. Reports to Stockholders.
Rockefeller Equity Allocation Fund
Rockefeller Core Taxable Bond Fund
Rockefeller Intermediate Tax Exempt
National Bond Fund
Rockefeller Intermediate Tax Exempt
New York Bond Fund
Semi-Annual Report
May 31, 2021
Investment Adviser
Rockefeller & Co. LLC
45 Rockefeller Plaza, 5th Floor
New York, New York 10111
Table of Contents
|
LETTER TO SHAREHOLDERS
|
3
|
||
|
EXPENSE EXAMPLES
|
7
|
||
|
INVESTMENT HIGHLIGHTS
|
9
|
||
|
SCHEDULES OF INVESTMENTS
|
19
|
||
|
STATEMENTS OF ASSETS AND LIABILITIES
|
38
|
||
|
STATEMENTS OF OPERATIONS
|
40
|
||
|
STATEMENTS OF CHANGES IN NET ASSETS
|
42
|
||
|
FINANCIAL HIGHLIGHTS
|
46
|
||
|
NOTES TO FINANCIAL STATEMENTS
|
54
|
||
|
STATEMENT REGARDING LIQUIDITY RISK MANAGEMENT
|
65
|
||
|
NOTICE OF PRIVACY POLICY & PRACTICES
|
66
|
||
|
ADDITIONAL INFORMATION
|
67
|
Dear Shareholder:
Over the past six months, global equities, as represented by the MSCI ACWI Index, returned 16.10%. As countries across the world raced to distribute vaccines, investors pivoted with the same haste out of both
‘stay-at-home’ and less cyclical stocks in favor of more economically sensitive Energy and Financials sectors. The results of the Georgia State Senate run-off elections added fuel to the fire as investors welcomed the outcome’s potential for enabling
additional stimulus, with control of spending now under one political party. Increasing globalization has clearly created certain challenges that have become more visible as we surpassed the one-year mark of the COVID-19 pandemic. There is now a
heightened sense of fragility given the interconnectedness of global supply chains, as recently evidenced by the ability of a mere gust of wind and a large container ship in the Suez Canal to shut down one of the world’s largest trade routes and
disrupt multiple global supply chains. Perhaps fiscal and monetary stimulus cannot solve all the world’s problems.
Global Economy
The rapid rollout of vaccinations in the U.S. and parts of Europe has led to some level of normalization, with Asia now feeling the impact of a slower vaccine rollout, and contending with the Delta variant, which is
hampering a full reopening of economies. This has led to divergence in terms of economic growth, and performance of equity markets too, as Asian markets lagged European and U.S. markets. The world is also contending with heightened inflationary
pressures, driven in part by the significant stimulus efforts to temper the negative impact from the pandemic, but also supply chain issues, and labor shortages. The bond markets have largely brushed this off, with the rise in inflation was dismissed
as ‘transitory’ in nature.
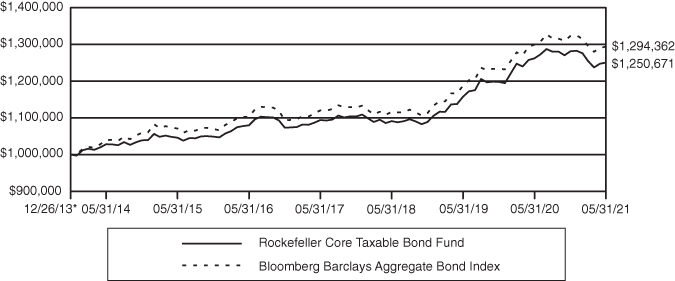
Rockefeller Core Taxable Bond Fund:
For the six months ended May 31, 2021, the Institutional Class shares of the Rockefeller Core Taxable Bond Fund had a return of -2.40% (net), underperforming the Bloomberg Barclays Aggregate Bond Index benchmark, which
returned -2.16%. The Fund’s modestly longer duration profile detracted from relative returns along with sector overweight to corporates. However, the sector overweight to taxable municipals contributed positively to relative performance.
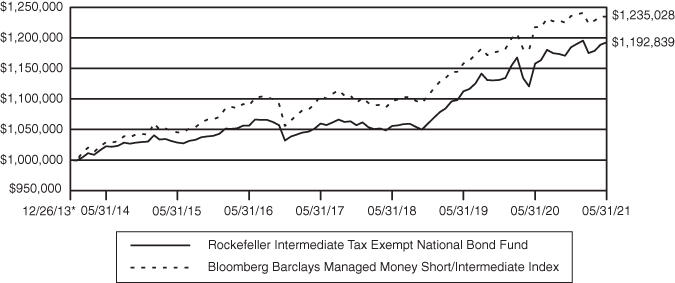
Rockefeller Intermediate Tax-Exempt National Bond Fund:
For the six months ended May 31, 2021, the Institutional Class shares of the Rockefeller Intermediate Tax-Exempt National Bond Fund had a return of +0.69% (net), while the Bloomberg Barclays Managed Money
Short/Intermediate Municipal Index returned -0.07%. A longer maturity profile and duration was a positive contributor along with the Fund’s overweight exposure to lower rated credits.
Rockefeller Intermediate Tax-Exempt New York Bond Fund:
For the six months ended May 31, 2021, the Institutional Class shares of the Rockefeller Intermediate Tax-Exempt New York Bond Fund had a return of +1.35% (net), while the Bloomberg Barclays Managed Money
Short/Intermediate Municipal Index returned -0.07%. A longer maturity profile and duration was a positive contributor along with the Fund’s overweight exposure to lower rated credits.
Rockefeller Equity Allocation Fund:
For the six months ended May 31, 2021, the Institutional Class shares of the Rockefeller Equity Allocation Fund returned +16.11% (net) vs. 16.10% for the MSCI ACWI Index. Industrials was the largest contributing
sector, while shares of Deutsche Post were the largest contributor: the company has benefitted from strong business to consumer volumes, in addition to higher pricing due to tightness in the availability of cargo space. Real Estate was the largest
detracting sector, as Vonovia, a German residential landlord,
3
detracted from relative performance. The shares were negatively impacted by the company announcing a planned acquisition of their largest competitor, Deutsche Wohnen. We continue to hold the shares as we believe there
is still a long-term growth opportunity for the company to raise rents through renovation of their underlying properties.
Looking Forward
We believe the rotation out of value stocks and into growth will reverse. We remain positioned in stocks that are positively exposed to rising inflation and higher rates, along with exposure to names we believe stand
to profit from new infrastructure initiatives, especially those required to transition to a lower carbon economy. This should benefit a number of our Industrial holdings, where an uptick in infrastructure spending could result in meaningful earnings
growth. The positive evidence surrounding the efficacy of the vaccine against serious illness should also benefit several of our holdings as economies reopen, including some of our Asia domiciled companies, and our life insurance holdings.
Federal Reserve Policy and the Bond Market:
As the world slowly emerges from the COVID crisis, the aftershock to the global economy is becoming increasingly evident, as cross currents have become more apparent across geographical regions. Overall, the global
economy remains on a path to recovery, but the performance of individual economies is varied. The U.S. economy continues to lead other developed markets and economic data remains encouraging with growth expectations for 2021 remaining very elevated
in the +6-8% range, with large fiscal stimulus and a big bounce in consumer spending driving growth as pandemic related restrictions ease. Year-over-year Inflation numbers are distorted due to the base effects from the pandemic-depressed 2020
numbers. However, the Fed views the current increase in inflation as transitory and expects it to recede as supply chain disruptions and base effect distortions ease over the next couple of quarters. Despite this view on inflation from the Fed, the
FOMC at the June meeting raised its inflation forecast considerably for 2021, with most members believing the risks to inflation are skewed to the upside. Concurrently, 7 of the 18 committee members expect that the fed funds rate will be higher at
the end of next year, and 13 members look for a higher fed funds rate at the end of 2023. The shift in the “dot plot” indicates that members have brought forward their expectations for an eventual tightening of monetary policy. The FOMC did maintain
the current pace of asset purchases which leaves its balance sheet approximately twice as large as compared to pre-pandemic levels. However, market participants are increasingly focused on the timing of an eventual “tapering” of asset purchases. In
our view, Fed policy makers have begun signaling that tapering is coming and we believe it will be formally communicated in the relatively near-term.
After a significant and rapid increase in 1Q21, long-term interest rates have moved materially lower of late as the bond market has begun to price in the view that the U.S. is past peak growth, inflation, monetary and
fiscal support. Coincidentally the 10-year U.S. Treasury peaked at the end of 1Q21 at 1.74% and has now declined by approximately 40bps to yield 1.35%.
Sincerely,

David P. Harris, CFA
Chief Investment Officer
Rockefeller Asset Management
4
Opinions expressed are those of Rockefeller Asset Management and are subject to change, are not guaranteed and should not be considered investment advice. Rockefeller Asset Management is a division of Rockefeller
& Co. LLC, the investment adviser to the Rockefeller Funds.
Must be preceded or accompanied by a current prospectus.
Past performance is no guarantee of future results.
Mutual fund investing involves risk. Principal loss is possible. The Funds are susceptible to adverse economic, political, tax, or regulatory changes which may magnify other risks. Income from
tax-exempt funds may become subject to state and local taxes and a portion of income may be subject to the federal alternative minimum tax for certain investors. Investments in debt securities typically decrease in value when interest rates rise.
This risk is usually greater for longer-term debt securities. Investment by the Funds in lower-rated and non-rated securities presents a greater risk of loss to principal and interest than higher-rated securities. Investing in the municipal
securities market is volatile and can be significantly affected by adverse tax, legislative or political changes and the financial condition of the issuers of municipal securities. Investments in asset-backed and mortgage-backed securities include
additional risks that investors should be aware of such as credit risk, prepayment risk, possible illiquidity and default, as well as increased susceptibility to adverse economic development. The Funds may invest in restricted securities or “private
placement” transactions. Private placement securities are not registered under the Securities Act of 1933, as amended, and are subject to restrictions on resale. As such they are often both difficult to sell and to value. The Funds may invest in
exchange traded funds (“ETFs”) which are subject to additional risks, including the risks that the market price of an ETF’s shares may trade at a discount to its net asset value (“NAV”), an active secondary trading market may not develop or be
maintained, or trading may be halted by the exchange in which they trade, which may impact a Fund’s ability to sell its shares. The Rockefeller Intermediate Tax-Exempt New York Bond Fund is non-diversified, meaning it concentrates its assets in
fewer individual holdings than a diversified fund, specifically in the State of New York issues. The Rockefeller Equity Allocation Fund is subject to small- and medium-capitalization company risks, which tend to have limited liquidity and greater
price volatility than large-capitalization companies. The Rockefeller Equity Allocation Fund and Rockefeller Core Taxable Bond Fund also invest in foreign securities which involve greater volatility and political, economic and currency risks and
differences in accounting methods. These risks are greater in emerging markets. Investing in commodities may subject a Fund to greater risks and volatility as commodity prices may be influenced by a variety of factors including unfavorable weather,
environmental factors, and changes in government regulations. Master limited partnerships (“MLPs”) in which the Rockefeller Equity Allocation Fund may invest are subject to certain risks inherent in the structure of MLPs, including complex tax
structure risks, the limited ability for election or removal of management, limited voting rights, potential dependence on parent companies or sponsors for revenues to satisfy obligations, and potential conflicts of interest between partners, members
and affiliates. Earnings growth is not representative of the Fund’s future performance.
The S&P 500 Index is a broad based unmanaged index of 500 stocks, which is widely recognized as representative of the equity market in general.
The Bloomberg Barclays Aggregate Bond Index is an unmanaged index which is widely regarded as a standard for measuring U.S. investment grade bond market performance.
The Bloomberg Barclays Managed Money Short/Intermediate Index is the 1-10 year component of the Barclays Managed Money Index, which is a rules-based, market-value-weighted index engineered for the tax-exempt municipal
bond market.
The MSCI All Country World Index (Net Dividends) (“MSCI ACWI”) is a free float-adjusted market capitalization weighted index that measures the equity performance of global developed and emerging markets. The MSCI ACWI
total return indices reinvest dividends after the deduction of withholding taxes, using (for international indices) a tax rate applicable to non-resident institutional investors who do not benefit from double taxation treaties.
One cannot invest directly in an index.
5
Basis point (bp) is a unit equal to 1/100th of 1% and is used to denote the change in a financial instrument.
Duration is a commonly used measure of the potential volatility of the price of a debt security, or the aggregate market value of a portfolio of debt securities, prior to maturity. Securities with a longer duration
generally have more volatile prices than securities of comparable quality with a shorter duration.
Yield Curve is a line that plots the interest rates, at a set point in time, of bonds having equal credit quality, but differing maturity dates. The most frequently reported yield curve compares the three-month,
two-year, five-year and 30-year U.S. Treasury debt. The curve is used to predict changes in economic output and growth.
Fund holdings and sector allocations are subject to change and are not recommendations to buy or sell any security. See the schedule of investments for complete holdings.
Gross domestic product (“GDP”) for a country is a monetary measure of the value of all final goods and services produced by the country in a specified period.
The Rockefeller Funds are distributed by Quasar Distributors, LLC.
6
Rockefeller Funds
Expense Examples
(Unaudited)
As a shareholder of the Funds, you incur two types of costs: (1) transaction costs, and (2) ongoing costs, including management fees, distribution and service (12b-1) fees and other Fund expenses. These Examples are
intended to help you understand your ongoing costs (in dollars) of investing in the Funds, and to compare these costs with the ongoing costs of investing in other mutual funds. The Examples are based on an investment of $1,000 invested at the
beginning of the period and held for the entire period (12/1/20 – 5/31/21).
Actual Expenses
The first line of each of the following tables provides information about actual account values and actual expenses. Although the Funds charge no sales load, you will be assessed fees for outgoing wire transfers,
returned checks and stop payment orders at prevailing rates charged by U.S. Bancorp Fund Services, LLC, the Funds’ transfer agent. If you request that a redemption be made by wire transfer, currently a $15.00 fee is charged by the Funds’ transfer
agent. Individual Retirement Accounts will be charged a $15.00 annual maintenance fee. To the extent the Funds invest in shares of exchange-traded funds or other investment companies as part of their investment strategies, you will indirectly bear
your proportionate share of any fees and expenses charged by the underlying funds in which the Funds invest in addition to the expenses of the Funds. Actual expenses of the underlying funds are expected to vary among the various underlying funds.
These expenses are not included in the Examples. The Examples include, but are not limited to, management fees, fund administration fees and accounting, custody and transfer agent fees. You may use the information in this line, together with the
amount you invested, to estimate the expenses that you paid over the period. Simply divide your account value by $1,000 (for example, an $8,600 account value divided by $1,000 = 8.6), then multiply the result by the number in the first line under the
heading entitled “Expenses Paid During Period” to estimate the expenses you paid on your account during this period.
Hypothetical Example for Comparison Purposes
The second line of each of the following tables provides information about hypothetical account values and hypothetical expenses based on the Funds’ actual expense ratios and an assumed rate of return of 5% per year
before expenses, which is not the Funds’ actual return. The hypothetical account values and expenses may not be used to estimate the actual ending account balance or expenses you paid for the period. You may use this information to compare the
ongoing costs of investing in the Funds and other funds. To do so, compare this 5% hypothetical example with the 5% hypothetical examples that appear in the shareholder reports of other funds. Please note that the expenses shown in the tables are
meant to highlight your ongoing costs only and do not reflect any transactional costs. Therefore, the second line of the table is useful in comparing ongoing costs only, and will not help you determine the relative total costs of owning different
funds. In addition, if these transactional costs were included, your costs would have been higher.
7
Rockefeller Funds
Expense Examples (Continued)
(Unaudited)
Rockefeller Equity Allocation Fund
|
Beginning
|
Ending
|
Expenses Paid
|
|
|
Account Value
|
Account Value
|
During Period
|
|
|
12/1/20
|
5/31/21
|
12/1/20 – 5/31/21*
|
|
|
Actual
|
$1,000.00
|
$1,161.10
|
$6.68
|
|
Hypothetical (5% return
|
|||
|
before expenses)
|
$1,000.00
|
$1,018.75
|
$6.24
|
|
*
|
Expenses are equal to the Fund’s annualized expense ratio of 1.24%, multiplied by the average account value over the period, multiplied by 182/365 (to reflect the one-half year period).
|
Rockefeller Core Taxable Bond Fund
|
Beginning
|
Ending
|
Expenses Paid
|
|
|
Account Value
|
Account Value
|
During Period
|
|
|
12/1/20
|
5/31/21
|
12/1/20 – 5/31/21*
|
|
|
Actual
|
$1,000.00
|
$ 976.00
|
$3.45
|
|
Hypothetical (5% return
|
|||
|
before expenses)
|
$1,000.00
|
$1,021.44
|
$3.53
|
|
*
|
Expenses are equal to the Fund’s annualized expense ratio of 0.70%, multiplied by the average account value over the period, multiplied by 182/365 (to reflect the one-half year period).
|
Rockefeller Intermediate Tax Exempt National Bond Fund
|
Beginning
|
Ending
|
Expenses Paid
|
|
|
Account Value
|
Account Value
|
During Period
|
|
|
12/1/20
|
5/31/21
|
12/1/20 – 5/31/21*
|
|
|
Actual
|
$1,000.00
|
$1,006.90
|
$3.35
|
|
Hypothetical (5% return
|
|||
|
before expenses)
|
$1,000.00
|
$1,021.59
|
$3.38
|
|
*
|
Expenses are equal to the Fund’s annualized expense ratio of 0.67%, multiplied by the average account value over the period, multiplied by 182/365 (to reflect the one-half year period).
|
Rockefeller Intermediate Tax Exempt New York Bond Fund
|
Beginning
|
Ending
|
Expenses Paid
|
|
|
Account Value
|
Account Value
|
During Period
|
|
|
12/1/20
|
5/31/21
|
12/1/20 – 5/31/21*
|
|
|
Actual
|
$1,000.00
|
$1,013.50
|
$3.92
|
|
Hypothetical (5% return
|
|||
|
before expenses)
|
$1,000.00
|
$1,021.04
|
$3.93
|
|
*
|
Expenses are equal to the Fund’s annualized expense ratio of 0.78%, multiplied by the average account value over the period, multiplied by 182/365 (to reflect the one-half year period).
|
8
Rockefeller Equity Allocation Fund
Investment Highlights
(Unaudited)
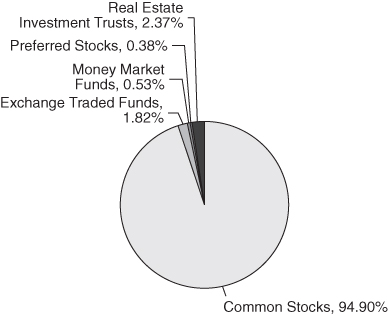
The Fund seeks to achieve its investment objective of long-term total return from capital appreciation and income by investing its assets globally in a range of equity asset classes and, to a lesser extent, in
fixed-income securities, real estate and commodity linked equities (such as real estate investment trusts and master limited partnerships), and currencies. Rockefeller & Co. LLC (the “Adviser”) will allocate the Fund’s assets across asset classes
taking into consideration both the Adviser’s longer-term strategic outlook as well as tactical views as to potential near-term opportunities. The Adviser considers a number of factors when making allocation decisions, including relative
attractiveness among equity market capitalizations and geographic regions, inflation risks and factors that influence commodity prices.
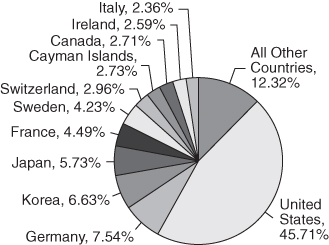
Allocation of Portfolio Holdings as of May 31, 2021*
(% of Investments)
 |
 |
|
*
|
For additional details on allocation of portfolio holdings by industry, please see the Schedule of Investments.
|
Average Annual Returns as of May 31, 2021
|
Rockefeller
|
MSCI All Country
|
|
|
Equity Allocation
|
World Index
|
|
|
Fund
|
(Net Dividends)
|
|
|
1 Year
|
40.27%
|
41.85%
|
|
5 Year
|
11.64%
|
14.18%
|
|
Since Inception (2/4/15)
|
9.05%
|
10.85%
|
Performance data quoted represents past performance and does not guarantee future results. The investment return and principal value of an investment will fluctuate so that an investor’s shares, when redeemed, may be
worth more or less than their original cost. Current performance of the Fund may be lower or higher than the performance quoted. Performance data current to the most recent month-end may be obtained by calling 855-369-6209.
Continued
9
Rockefeller Equity Allocation Fund
Investment Highlights (Continued)
(Unaudited)
Short-term performance, in particular, is not a good indication of the Fund’s future performance, and an investment should not be made based solely on historical returns.
Investment performance reflects fee waivers in effect. In the absence of such waivers, total return would be reduced.
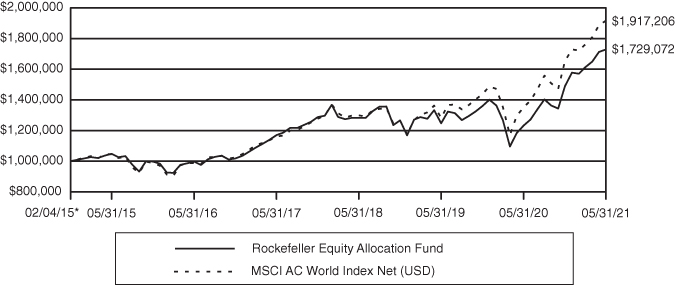
The returns shown assume reinvestment of Fund distributions and do not reflect the deduction of taxes that a shareholder would pay on Fund distributions or the redemption of Fund shares. The following chart illustrates
performance of a hypothetical investment made in the Fund and a broad-based securities index on the Fund’s inception date. The graph does not reflect any future performance.
The MSCI All Country World Index (Net Dividends) (“MSCI ACWI”) is a free float-adjusted market capitalization weighted index that measures the equity performance of global developed and emerging markets. The MSCI ACWI
total return indices reflect the reinvestment of dividends after the deduction of withholding taxes, using (for international indices) a tax rate applicable to non-resident institutional investors who do not benefit from double taxation treaties.
Growth of $1,000,000 Investment
|
*
|
Inception Date
|
10
Rockefeller Core Taxable Bond Fund
Investment Highlights
(Unaudited)
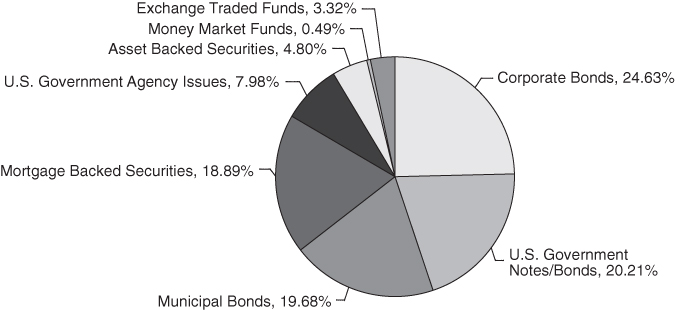
The Fund seeks to achieve its investment objective to generate current income consistent with the preservation of capital by investing under normal market conditions at least 80% of its net assets (plus any borrowings
for investment purposes) in taxable fixed-income securities. “Fixed-income securities” include corporate, government and municipal bonds, asset-backed and mortgage-backed securities, other investment companies and ETFs that will invest in
fixed-income securities, and other fixed-income instruments. The Fund invests primarily in investment grade fixed-income securities. Investment grade securities are fixed-income securities rated in the top four ratings categories by independent
rating organizations such as Standard & Poor’s Ratings Group (“S&P”) and Moody’s Investors Service, Inc. (“Moody’s”) or another nationally recognized statistical rating organization (“NRSRO”), or deemed by the Adviser to be of comparable
quality. The Adviser anticipates the Fund’s weighted average duration will be more than three years but less than ten years.
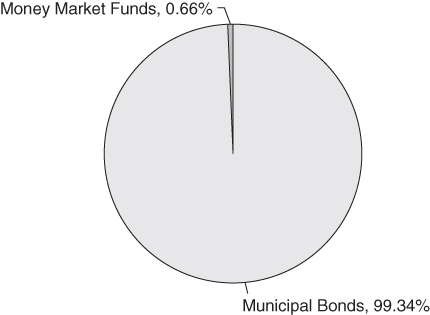
Allocation of Portfolio Holdings as of May 31, 2021
(% of Investments)
Average Annual Returns as of May 31, 2021
|
Bloomberg
|
||
|
Rockefeller
|
Barclays
|
|
|
Core Taxable
|
Aggregate
|
|
|
Bond Fund
|
Bond Index
|
|
|
1 Year
|
-0.93%
|
-0.40%
|
|
5 Year
|
2.98%
|
3.25%
|
|
Since Inception (12/26/13)
|
3.06%
|
3.53%
|
Performance data quoted represents past performance and does not guarantee future results. The investment return and principal value of an investment will fluctuate so that an investor’s shares, when redeemed, may be
worth more or less than their original cost. Current performance of the Fund may be lower or higher than the performance quoted. Performance data current to the most recent month-end may be obtained by calling 855-369-6209.
Continued
11
Rockefeller Core Taxable Bond Fund
Investment Highlights (Continued)
(Unaudited)
Short-term performance, in particular, is not a good indication of the Fund’s future performance, and an investment should not be made based solely on historical returns.
Investment performance reflects fee waivers in effect. In the absence of such waivers, total return would be reduced.
The returns shown assume reinvestment of Fund distributions and do not reflect the deduction of taxes that a shareholder would pay on Fund distributions or the redemption of Fund shares. The following chart illustrates
performance of a hypothetical investment made in the Fund and a broad-based securities index on the Fund’s inception date. The graph does not reflect any future performance.
The Bloomberg Barclays Aggregate Bond Index is an unmanaged index which is widely regarded as a standard for measuring U.S. investment grade bond market performance. An index is unmanaged and cannot be invested in
directly.
Growth of $1,000,000 Investment
|
*
|
Inception Date
|
12
Rockefeller Intermediate Tax Exempt National Bond Fund
Investment Highlights
(Unaudited)
The Fund seeks to achieve its investment objective to generate current income that is exempt from federal personal income tax consistent with the preservation of capital by investing under normal market conditions at
least 80% of its net assets (plus any borrowings for investment purposes) in municipal bonds and other fixed-income securities that generate income exempt from regular federal income tax, including the federal alternative minimum tax (“AMT”). The
Fund may invest in all types of municipal bonds, including, but not limited to, general obligation bonds and industrial development bonds. The Fund may also invest in asset-backed and mortgage-backed securities, other investment companies, ETFs and
the obligations of other issuers that pay interest that is exempt from regular federal income taxes. While the Fund will invest primarily in tax exempt securities, it is possible that up to 20% of the Fund’s total assets may be invested in
fixed-income securities that generate income that is not exempt from regular federal income tax, including the federal AMT. The Fund invests primarily in investment grade municipal bonds and other types of fixed-income securities. Investment grade
securities are fixed-income securities rated in the top four ratings categories by independent rating organizations such as S&P and Moody’s or another NRSRO, or, if unrated, deemed by the Adviser to be of comparable quality. While the Fund may
invest in securities of any duration, the Adviser anticipates the weighted average duration of the Fund’s portfolio will be more than three years but less than ten years.
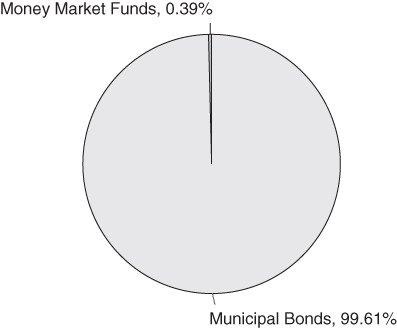
Allocation of Portfolio Holdings as of May 31, 2021
(% of Investments)
Continued
13
Rockefeller Intermediate Tax Exempt National Bond Fund
Investment Highlights (Continued)
(Unaudited)
Average Annual Returns as of May 31, 2021
|
Rockefeller
|
Bloomberg
|
|
|
Intermediate Tax
|
Barclays Managed
|
|
|
Exempt National
|
Money Short/
|
|
|
Bond Fund
|
Intermediate Index
|
|
|
1 Year
|
3.01%
|
1.41%
|
|
5 Year
|
2.46%
|
2.54%
|
|
Since Inception (12/26/13)
|
2.40%
|
2.88%
|
Performance data quoted represents past performance and does not guarantee future results. The investment return and principal value of an investment will fluctuate so that an investor’s shares, when redeemed, may be
worth more or less than their original cost. Current performance of the Fund may be lower or higher than the performance quoted. Performance data current to the most recent month end may be obtained by calling 855-369-6209.
Short-term performance, in particular, is not a good indication of the Fund’s future performance, and an investment should not be made based solely on historical returns.
Investment performance reflects fee waivers in effect. In the absence of such waivers, total return would be reduced.
The returns shown assume reinvestment of Fund distributions and do not reflect the deduction of taxes that a shareholder would pay on Fund distributions or the redemption of Fund shares. The following chart illustrates
performance of a hypothetical investment made in the Fund and a broad-based securities index on the Fund’s inception date. The graph does not reflect any future performance.
The Bloomberg Barclays Managed Money Short/Intermediate Index is the 1-10 year component of the Barclays Managed Money Index, which is a rules-based, market-value-weighted index engineered for the tax-exempt municipal
bond market.
Continued
14
Rockefeller Intermediate Tax Exempt National Bond Fund
Investment Highlights (Continued)
(Unaudited)
Growth of $1,000,000 Investment
|
*
|
Inception Date
|
15
Rockefeller Intermediate Tax Exempt New York Bond Fund
Investment Highlights
(Unaudited)
The Fund seeks to achieve its investment objective to generate current income that is exempt from federal, New York State and New York City personal income tax consistent with the preservation of capital by investing
under normal market conditions at least 80% of its net assets (plus any borrowings for investment purposes) in municipal bonds and other fixed-income securities that generate income exempt from regular federal, New York State and New York City
personal income tax, including the federal AMT. The Fund may invest in all types of municipal bonds, including, but not limited to, general obligation bonds, industrial development bonds, and other obligations issued by the State of New York, its
subdivisions, authorities, instrumentalities and corporations. The Fund may also invest in asset-backed and mortgage-backed securities, other investment companies, ETFs and the obligations of other issuers that pay interest that is exempt from
regular federal and New York State and New York City personal income tax. While the Fund will invest primarily in tax exempt securities, it is possible that up to 20% of the Fund’s total assets may be invested in fixed-income securities that
generate income that is not exempt from regular federal income tax, New York State and New York City personal income tax, including the federal AMT. The Fund invests primarily in investment grade fixed-income securities rated in the top four ratings
categories by independent rating organizations such as S&P and Moody’s or another NRSRO, or deemed by the Adviser to be of comparable quality. While the Fund may invest in securities of any duration, the Adviser anticipates the weighted average
duration of the Fund’s portfolio will be more than three years but less than ten years. The Fund is non-diversified.
Allocation of Portfolio Holdings as of May 31, 2021
(% of Investments)
Continued
16
Rockefeller Intermediate Tax Exempt New York Bond Fund
Investment Highlights (Continued)
(Unaudited)
Average Annual Returns as of May 31, 2021
|
Rockefeller
|
Bloomberg
|
|
|
Intermediate Tax
|
Barclays Managed
|
|
|
Exempt New York
|
Money Short/
|
|
|
Bond Fund
|
Intermediate Index
|
|
|
1 Year
|
3.65%
|
1.41%
|
|
5 Year
|
2.20%
|
2.54%
|
|
Since Inception (12/26/13)
|
2.14%
|
2.88%
|
Performance data quoted represents past performance and does not guarantee future results. The investment return and principal value of an investment will fluctuate so that an investor’s shares, when redeemed, may be
worth more or less than their original cost. Current performance of the Fund may be lower or higher than the performance quoted. Performance data current to the most recent month-end may be obtained by calling 855-369-6209.
Short-term performance, in particular, is not a good indication of the Fund’s future performance, and an investment should not be made based solely on historical returns.
Investment performance reflects fee waivers in effect. In the absence of such waivers, total return would be reduced.
The returns shown assume reinvestment of Fund distributions and do not reflect the deduction of taxes that a shareholder would pay on Fund distributions or the redemption of Fund shares. The following chart illustrates
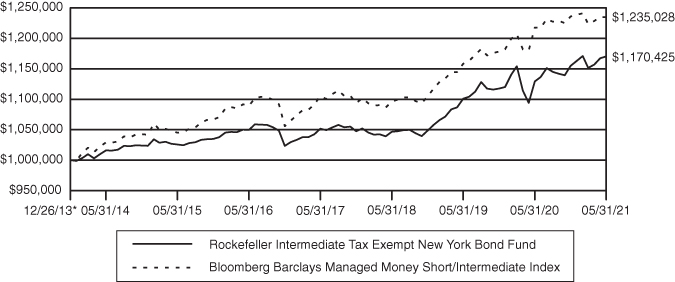
performance of a hypothetical investment made in the Fund and a broad-based securities index on the Fund’s inception date. The graph does not reflect any future performance.
The Bloomberg Barclays Managed Money Short/Intermediate Index is the 1-10 year component of the Barclays Managed Money Index, which is a rules-based, market-value-weighted index engineered for the tax-exempt municipal
bond market.
Continued
17
Rockefeller Intermediate Tax Exempt New York Bond Fund
Investment Highlights (Continued)
(Unaudited)
Growth of $1,000,000 Investment
|
*
|
Inception Date
|
18
Rockefeller Equity Allocation Fund
|
Schedule of Investments
|
May 31, 2021 (Unaudited)
|
Shares
|
Value
|
|||||||
|
Common Stocks – 93.66%
|
||||||||
|
Air Freight & Logistics – 2.70%
|
||||||||
|
Deutsche Post AG (a)
|
33,845
|
$
|
2,298,967
|
|||||
|
Application Software – 0.04%
|
||||||||
|
Outset Medical, Inc. (b)
|
679
|
32,775
|
||||||
|
Auto Components – 2.64%
|
||||||||
|
Continental AG (a)
|
7,464
|
1,106,686
|
||||||
|
Denso Corp. (a)
|
10,900
|
744,009
|
||||||
|
Gentherm, Inc. (b)
|
2,125
|
154,126
|
||||||
|
Hankook Tire & Technology Co. Ltd. (a)
|
4,590
|
198,679
|
||||||
|
Standard Motor Products, Inc.
|
1,003
|
45,155
|
||||||
|
2,248,655
|
||||||||
|
Banks – 10.01%
|
||||||||
|
Comerica, Inc.
|
1,055
|
82,807
|
||||||
|
First Horizon National Corp.
|
66,175
|
1,261,957
|
||||||
|
ICICI Bank Ltd. – ADR (a)(b)
|
85,955
|
1,548,050
|
||||||
|
KB Financial Group, Inc. – ADR (a)(b)
|
5,052
|
260,127
|
||||||
|
KB Financial Group, Inc. (a)
|
12,725
|
651,975
|
||||||
|
Lloyds Banking Group PLC (a)
|
2,044,862
|
1,445,922
|
||||||
|
Oversea-Chinese Banking Corp Ltd. (a)
|
92,400
|
872,850
|
||||||
|
Svenska Handelsbanken AB (a)
|
118,004
|
1,349,290
|
||||||
|
Swedbank AB (a)
|
57,443
|
1,054,518
|
||||||
|
8,527,496
|
||||||||
|
Biotechnology – 3.15%
|
||||||||
|
Alnylam Pharmaceuticals, Inc. (b)
|
3,159
|
448,546
|
||||||
|
BioMarin Pharmaceutical, Inc. (b)
|
6,070
|
469,211
|
||||||
|
Bridgebio Pharma, Inc. (b)
|
6,449
|
381,781
|
||||||
|
Ionis Pharmaceuticals, Inc. (b)
|
10,723
|
399,432
|
||||||
|
Neurocrine Biosciences, Inc. (b)
|
4,951
|
476,385
|
||||||
|
Regeneron Pharmaceuticals, Inc. (b)
|
1,017
|
510,971
|
||||||
|
2,686,326
|
||||||||
|
Building Products – 3.20%
|
||||||||
|
AAON, Inc.
|
1,251
|
82,879
|
||||||
|
Carrier Global Corp.
|
18,873
|
866,837
|
||||||
|
Cie de Saint-Gobain (a)
|
21,917
|
1,471,222
|
||||||
|
Lennox International, Inc.
|
319
|
111,628
|
||||||
|
Simpson Manufacturing Co., Inc.
|
1,603
|
180,049
|
||||||
|
2,712,615
|
||||||||
|
Chemicals – 0.81%
|
||||||||
|
Air Liquide SA (a)
|
4,080
|
693,871
|
||||||
The accompanying notes are an integral part of these financial statements.
19
Rockefeller Equity Allocation Fund
|
Schedule of Investments (Continued)
|
May 31, 2021 (Unaudited)
|
Shares
|
Value
|
|||||||
|
Commercial Services & Supplies – 0.41%
|
||||||||
|
Healthcare Services Group, Inc.
|
2,577
|
$
|
77,284
|
|||||
|
Stericycle, Inc. (b)
|
1,527
|
119,961
|
||||||
|
Tetra Tech, Inc.
|
1,293
|
154,475
|
||||||
|
351,720
|
||||||||
|
Construction & Engineering – 0.19%
|
||||||||
|
Quanta Services, Inc.
|
1,215
|
115,850
|
||||||
|
WillScot Mobile Mini Holdings Corp. (b)
|
1,651
|
47,879
|
||||||
|
163,729
|
||||||||
|
Construction Materials – 3.03%
|
||||||||
|
HeidelbergCement AG (a)
|
17,825
|
1,629,185
|
||||||
|
Martin Marietta Materials, Inc.
|
2,611
|
949,490
|
||||||
|
2,578,675
|
||||||||
|
Consumer Finance – 2.85%
|
||||||||
|
Discover Financial Services
|
18,988
|
2,226,533
|
||||||
|
FirstCash, Inc.
|
1,021
|
81,394
|
||||||
|
SLM Corp.
|
5,683
|
115,081
|
||||||
|
2,423,008
|
||||||||
|
Diversified Financial Services – 0.12%
|
||||||||
|
FactSet Research Systems, Inc.
|
314
|
104,989
|
||||||
|
Diversified Telecommunication Services – 0.47%
|
||||||||
|
KT Corp. – ADR (a)(b)
|
14,624
|
220,969
|
||||||
|
KT Corp. (a)
|
2,555
|
77,469
|
||||||
|
ORBCOMM, Inc. (b)
|
8,827
|
98,774
|
||||||
|
397,212
|
||||||||
|
Electric Utilities – 2.33%
|
||||||||
|
Enel S.p.A. (a)
|
200,250
|
1,985,946
|
||||||
|
Electrical Equipment – 2.43%
|
||||||||
|
ABB Ltd. – ADR (a)
|
4,022
|
137,311
|
||||||
|
Array Technologies, Inc. (b)
|
5,590
|
91,117
|
||||||
|
Schneider Electric SE (a)
|
8,038
|
1,279,328
|
||||||
|
TPI Composites, Inc. (b)
|
2,986
|
144,224
|
||||||
|
Vestas Wind Systems A/S (a)
|
10,760
|
420,638
|
||||||
|
2,072,618
|
||||||||
|
Electronic Equipment, Instruments & Components – 4.35%
|
||||||||
|
Badger Meter, Inc.
|
1,197
|
114,397
|
||||||
|
Cognex Corp.
|
612
|
48,587
|
||||||
|
Hitachi Ltd. (a)
|
17,100
|
900,985
|
||||||
|
II-VI, Inc. (b)
|
5,875
|
395,799
|
||||||
|
IPG Photonics Corp. (b)
|
835
|
174,732
|
||||||
The accompanying notes are an integral part of these financial statements.
20
Rockefeller Equity Allocation Fund
|
Schedule of Investments (Continued)
|
May 31, 2021 (Unaudited)
|
Shares
|
Value
|
|||||||
|
Electronic Equipment, Instruments & Components – 4.35% (Continued)
|
||||||||
|
Keysight Technologies, Inc. (b)
|
4,338
|
$
|
617,644
|
|||||
|
Littelfuse, Inc.
|
783
|
204,551
|
||||||
|
Samsung SDI Co. Ltd. (a)
|
115
|
66,006
|
||||||
|
TE Connectivity Ltd. – ADR (a)
|
7,083
|
961,022
|
||||||
|
Trimble, Inc. (b)
|
2,808
|
218,434
|
||||||
|
3,702,157
|
||||||||
|
Entertainment – 0.87%
|
||||||||
|
Nintendo Co. Ltd. (a)
|
1,200
|
743,059
|
||||||
|
Food & Staples Retailing – 0.11%
|
||||||||
|
Albertsons Cos, Inc.
|
4,750
|
91,152
|
||||||
|
Food Products – 0.09%
|
||||||||
|
Utz Brands, Inc.
|
3,479
|
80,365
|
||||||
|
Health Care Equipment & Supplies – 5.14%
|
||||||||
|
ABIOMED, Inc. (b)
|
511
|
145,420
|
||||||
|
Alcon, Inc. – ADR (a)
|
1
|
70
|
||||||
|
Becton Dickinson & Co.
|
6,433
|
1,556,079
|
||||||
|
Edwards Lifesciences Corp. (b)
|
983
|
94,270
|
||||||
|
Inogen, Inc. (b)
|
1,156
|
71,452
|
||||||
|
Insulet Corp. (b)
|
709
|
191,196
|
||||||
|
Integer Holdings Corp. (b)
|
1,056
|
95,536
|
||||||
|
Koninklijke Philips NV (a)
|
16,535
|
934,336
|
||||||
|
Masimo Corp. (b)
|
482
|
103,919
|
||||||
|
Medtronic PLC – ADR
|
6,787
|
859,167
|
||||||
|
Merit Medical Systems, Inc. (b)
|
3,060
|
184,640
|
||||||
|
ResMed, Inc.
|
713
|
146,771
|
||||||
|
4,382,856
|
||||||||
|
Health Care Providers & Services – 0.26%
|
||||||||
|
Chemed Corp.
|
382
|
187,691
|
||||||
|
Guardant Health, Inc. (b)
|
238
|
29,541
|
||||||
|
217,232
|
||||||||
|
Health Care Technology – 0.39%
|
||||||||
|
Omnicell, Inc. (b)
|
1,696
|
235,744
|
||||||
|
Vocera Communications, Inc. (b)
|
2,773
|
93,506
|
||||||
|
329,250
|
||||||||
|
Hotels, Restaurants & Leisure – 0.08%
|
||||||||
|
Compass Group PLC (a)
|
1
|
23
|
||||||
|
Wyndham Hotels & Resorts, Inc.
|
869
|
65,227
|
||||||
|
65,250
|
||||||||
The accompanying notes are an integral part of these financial statements.
21
Rockefeller Equity Allocation Fund
|
Schedule of Investments (Continued)
|
May 31, 2021 (Unaudited)
|
Shares
|
Value
|
|||||||
|
Household Durables – 2.62%
|
||||||||
|
Panasonic Corp. (a)
|
70,300
|
$
|
798,444
|
|||||
|
Sony Corp. (a)
|
14,400
|
1,431,887
|
||||||
|
2,230,331
|
||||||||
|
Industrial Conglomerates – 1.41%
|
||||||||
|
LG Corp. (a)
|
11,930
|
1,144,020
|
||||||
|
LX Holdings Corp. (a)(b)
|
5,785
|
63,543
|
||||||
|
1,207,563
|
||||||||
|
Insurance – 9.16%
|
||||||||
|
Aflac, Inc.
|
17,561
|
995,357
|
||||||
|
Arch Capital Group Ltd. – ADR (a)(b)
|
23,945
|
955,166
|
||||||
|
BRP Group, Inc. (b)
|
3,179
|
78,140
|
||||||
|
Globe Life, Inc.
|
11,164
|
1,176,909
|
||||||
|
Intact Financial Corp. (a)(b)
|
7,247
|
984,063
|
||||||
|
Progressive Corp.
|
599
|
59,349
|
||||||
|
Reinsurance Group of America, Inc.
|
15,050
|
1,896,752
|
||||||
|
SCOR SE (a)
|
10,205
|
332,211
|
||||||
|
Willis Towers Watson Plc – ADR (a)
|
5,042
|
1,317,777
|
||||||
|
7,795,724
|
||||||||
|
Interactive Media & Services – 0.21%
|
||||||||
|
Tencent Holdings Ltd. (a)
|
2,300
|
179,816
|
||||||
|
Internet & Catalog Retail – 0.98%
|
||||||||
|
Amazon.com, Inc. (b)
|
260
|
837,998
|
||||||
|
Internet & Direct Marketing Retail – 0.19%
|
||||||||
|
Trip.com Group Ltd. – ADR (b)
|
3,831
|
160,327
|
||||||
|
Internet Software & Services – 4.54%
|
||||||||
|
Alibaba Group Holding, Ltd. – ADR (a)(b)
|
7,770
|
1,662,469
|
||||||
|
Facebook, Inc. – Class A (b)
|
6,691
|
2,199,533
|
||||||
|
3,862,002
|
||||||||
|
IT Services – 2.40%
|
||||||||
|
Fidelity National Information Services, Inc.
|
7,251
|
1,080,254
|
||||||
|
Visa, Inc. – Class A
|
4,238
|
963,297
|
||||||
|
2,043,551
|
||||||||
|
Machinery – 2.53%
|
||||||||
|
Deere & Co.
|
4,543
|
1,640,478
|
||||||
|
Doosan Bobcat, Inc. (a)(b)
|
4,127
|
187,073
|
||||||
|
Epiroc AB (a)
|
8,041
|
183,421
|
||||||
|
Kubota Corp. (a)
|
4,400
|
101,216
|
||||||
|
Mueller Industries, Inc.
|
916
|
42,530
|
||||||
|
2,154,718
|
||||||||
The accompanying notes are an integral part of these financial statements.
22
Rockefeller Equity Allocation Fund
|
Schedule of Investments (Continued)
|
May 31, 2021 (Unaudited)
|
Shares
|
Value
|
|||||||
|
Metals & Mining – 1.71%
|
||||||||
|
Agnico Eagle Mines Ltd. – ADR (a)
|
15,998
|
$
|
1,147,856
|
|||||
|
Grupo Mexico SAB de CV (a)
|
32,633
|
156,628
|
||||||
|
Pan American Silver Corp. – ADR (a)
|
4,448
|
149,631
|
||||||
|
1,454,115
|
||||||||
|
Multiline Retail – 0.86%
|
||||||||
|
Kohl’s Corp.
|
13,231
|
734,188
|
||||||
|
Pharmaceuticals – 2.69%
|
||||||||
|
Eli Lilly and Co.
|
4,115
|
821,930
|
||||||
|
Novo Nordisk A/S – ADR (a)
|
943
|
74,403
|
||||||
|
Roche Holdings AG (a)
|
3,976
|
1,391,805
|
||||||
|
2,288,138
|
||||||||
|
Professional Services – 0.04%
|
||||||||
|
Mistras Group, Inc. (b)
|
3,444
|
35,852
|
||||||
|
Real Estate Management & Development – 1.53%
|
||||||||
|
Vonovia SE (a)
|
20,706
|
1,299,703
|
||||||
|
Semiconductors & Semiconductor Equipment – 5.37%
|
||||||||
|
Applied Materials, Inc.
|
8,734
|
1,206,427
|
||||||
|
First Solar, Inc. (b)
|
3,739
|
284,575
|
||||||
|
Samsung Electronics Co. Ltd. (a)
|
34,881
|
2,503,767
|
||||||
|
Taiwan Semiconductor Manufacturing Co. Ltd. – ADR (a)
|
4,550
|
533,988
|
||||||
|
Tokyo Electron Ltd. (a)
|
100
|
43,875
|
||||||
|
4,572,632
|
||||||||
|
Software – 4.27%
|
||||||||
|
Everbridge, Inc. (b)
|
1,195
|
140,413
|
||||||
|
Microsoft Corp.
|
11,794
|
2,944,726
|
||||||
|
New Relic, Inc. (b)
|
5,973
|
374,388
|
||||||
|
PROS Holdings, Inc. (b)
|
1,668
|
74,009
|
||||||
|
Varonis Systems, Inc. (b)
|
2,168
|
104,714
|
||||||
|
3,638,250
|
||||||||
|
Technology Hardware, Storage & Peripherals – 1.30%
|
||||||||
|
Apple, Inc.
|
8,542
|
1,064,418
|
||||||
|
Stratasys Ltd. – ADR (a)(b)
|
1,963
|
45,326
|
||||||
|
1,109,744
|
||||||||
|
Textiles, Apparel & Luxury Goods – 1.41%
|
||||||||
|
Carter’s, Inc.
|
1,469
|
150,191
|
||||||
|
Ralph Lauren Corp. (b)
|
6,059
|
751,800
|
||||||
|
Shenzhou International Group Holdings Ltd. (a)
|
11,200
|
295,237
|
||||||
|
1,197,228
|
||||||||
The accompanying notes are an integral part of these financial statements.
23
Rockefeller Equity Allocation Fund
|
Schedule of Investments (Continued)
|
May 31, 2021 (Unaudited)
|
Shares
|
Value
|
|||||||
|
Trading Companies & Distributors – 1.04%
|
||||||||
|
Ashtead Group Plc (a)
|
1,736
|
$
|
126,637
|
|||||
|
Herc Holdings, Inc. (b)
|
843
|
96,962
|
||||||
|
United Rentals, Inc. (b)
|
1,970
|
657,901
|
||||||
|
881,500
|
||||||||
|
Transportation Infrastructure – 0.93%
|
||||||||
|
Airports of Thailand PCL (a)
|
337,500
|
671,828
|
||||||
|
Grupo Aeroportuario del Sureste SAB de CV – ADR (a)(b)
|
681
|
120,285
|
||||||
|
792,113
|
||||||||
|
Wireless Telecommunication Services – 2.80%
|
||||||||
|
China Mobile Ltd. (a)
|
214,055
|
1,359,003
|
||||||
|
KDDI Corp. (a)
|
1,600
|
54,542
|
||||||
|
Tele2 AB (a)
|
71,142
|
969,020
|
||||||
|
2,382,565
|
||||||||
|
Total Common Stocks (Cost $53,080,939)
|
79,747,981
|
|||||||
|
Exchange Traded Funds – 1.80%
|
||||||||
|
iShares Core MSCI EAFE ETF
|
9,971
|
765,773
|
||||||
|
iShares Core S&P 500 ETF
|
1,817
|
766,138
|
||||||
|
Total Exchange Traded Funds (Cost $1,494,982)
|
1,531,911
|
|||||||
|
Preferred Stocks – 0.38%
|
||||||||
|
Banks – 0.15%
|
||||||||
|
Itau Unibanco Holding SA (a)(c), 2.06% (d)
|
21,731
|
123,867
|
||||||
|
Semiconductors & Semiconductor Equipment – 0.23%
|
||||||||
|
Samsung Electronics Co. Ltd. (a)(c), 4.15% (d)
|
3,041
|
196,739
|
||||||
|
Total Preferred Stocks (Cost $210,779)
|
320,606
|
|||||||
|
Real Estate Investment Trusts – 2.34%
|
||||||||
|
Healthcare REIT – 1.01%
|
||||||||
|
Medical Properties Trust, Inc.
|
40,729
|
862,233
|
||||||
|
Industrials REIT – 0.06%
|
||||||||
|
Rexford Industrial Realty, Inc.
|
938
|
51,806
|
||||||
|
Residential REIT – 0.06%
|
||||||||
|
American Campus Communities, Inc.
|
1,105
|
52,112
|
||||||
|
Retails REIT – 1.12%
|
||||||||
|
CapitaLand Mall Trust (a)
|
615,000
|
952,178
|
||||||
The accompanying notes are an integral part of these financial statements.
24
Rockefeller Equity Allocation Fund
|
Schedule of Investments (Continued)
|
May 31, 2021 (Unaudited)
|
Shares
|
Value
|
|||||||
|
Specialized REIT – 0.09%
|
||||||||
|
Iron Mountain, Inc.
|
1,723
|
$
|
75,019
|
|||||
|
Total Real Estate Investment Trusts (Cost $1,829,288)
|
1,993,348
|
|||||||
|
Money Market Funds – 0.52%
|
||||||||
|
Morgan Stanley Institutional Liquidity Funds –
|
||||||||
|
Treasury Portfolio – Institutional Class, 0.010% (e)
|
441,406
|
441,406
|
||||||
|
Total Money Market Funds (Cost $441,406)
|
441,406
|
|||||||
|
Total Investments (Cost $57,057,394) – 98.70%
|
84,035,252
|
|||||||
|
Other Assets in Excess of Liabilities – 1.30%
|
1,104,684
|
|||||||
|
Total Net Assets – 100.00%
|
$
|
85,139,936
|
||||||
Percentages are stated as a percent of net assets.
ADR American Depository Receipt.
REIT Real Estate Investment Trust.
|
(a)
|
Foreign issued security.
|
|
(b)
|
Non-income producing security.
|
|
(c)
|
Perpetual preferred stock with no stated maturity.
|
|
(d)
|
Dividend yield; the rate shown represents the rate at May 31, 2021.
|
|
(e)
|
Seven day yield; the rate shown represents the rate at May 31, 2021.
|
The Global Industry Classification Standard (GICS®) was developed by and/or is the exclusive property of MSCI, Inc. (“MSCI”) and Standard
& Poor’s Financial Services LLC (“S&P”). GICS is a service mark of MSCI and S&P and has been licensed for use by U.S. Bancorp Fund Services, LLC.
The accompanying notes are an integral part of these financial statements.
25
Rockefeller Core Taxable Bond Fund
|
Schedule of Investments
|
May 31, 2021 (Unaudited)
|
Principal
|
||||||||
|
Amount
|
Value
|
|||||||
|
Asset Backed Securities – 4.78%
|
||||||||
|
GM Financial Consumer Automobile Receivables Trust 2019-3
|
||||||||
|
A-3, 2.180%, 04/16/2024
|
$
|
569,188
|
$
|
576,373
|
||||
|
Nissan Auto Receivables 2020-B Owner Trust
|
||||||||
|
2020-B, 0.470%, 10/17/2022
|
366,750
|
367,009
|
||||||
|
Verizon Owner Trust
|
||||||||
|
2019-B, 2.330%, 12/20/2023
|
2,410,000
|
2,440,722
|
||||||
|
Total Asset Backed Securities (Cost $3,352,691)
|
3,384,104
|
|||||||
|
Corporate Bonds – 24.51%
|
||||||||
|
Aerospace & Defense – 1.00%
|
||||||||
|
The Boeing Co.
|
||||||||
|
2.196%, 02/04/2026
|
705,000
|
708,254
|
||||||
|
Diversified Banks – 5.76%
|
||||||||
|
Bank of America Corp.
|
||||||||
|
4.244% (3 Month LIBOR USD + 1.814%), 04/24/2038 (a)
|
790,000
|
924,223
|
||||||
|
Citigroup, Inc.
|
||||||||
|
3.980% (3 Month LIBOR USD + 1.338%), 03/20/2030 (a)
|
1,154,000
|
1,299,947
|
||||||
|
JPMorgan Chase & Co.
|
||||||||
|
4.493% (SOFR + 3.790%), 03/24/2031 (a)
|
1,587,000
|
1,852,558
|
||||||
|
4,076,728
|
||||||||
|
Health Care Services – 2.57%
|
||||||||
|
CVS Health Corp.
|
||||||||
|
3.250%, 08/15/2029
|
1,693,000
|
1,823,035
|
||||||
|
Home Improvement Retail – 2.76%
|
||||||||
|
The Home Depot, Inc.
|
||||||||
|
5.875%, 12/16/2036
|
1,402,000
|
1,952,430
|
||||||
|
Homebuilding – 2.00%
|
||||||||
|
NVR, Inc.
|
||||||||
|
3.950%, 09/15/2022
|
1,365,000
|
1,413,640
|
||||||
|
Integrated Telecommunication Services – 2.00%
|
||||||||
|
Verizon Communications, Inc.
|
||||||||
|
5.250%, 03/16/2037
|
1,107,000
|
1,414,343
|
||||||
|
Investment Banking & Brokerage – 2.63%
|
||||||||
|
Morgan Stanley
|
||||||||
|
4.431% (3 Month LIBOR USD + 1.628%), 01/23/2030 (a)
|
803,000
|
931,934
|
||||||
|
The Goldman Sachs Group, Inc.
|
||||||||
|
4.223% (3 Month LIBOR USD + 1.301%), 05/01/2029 (a)
|
818,000
|
929,303
|
||||||
|
1,861,237
|
||||||||
The accompanying notes are an integral part of these financial statements.
26
Rockefeller Core Taxable Bond Fund
|
Schedule of Investments (Continued)
|
May 31, 2021 (Unaudited)
|
Principal
|
||||||||
|
Amount
|
Value
|
|||||||
|
Regional Banks – 3.14%
|
||||||||
|
BB&T Corp.
|
||||||||
|
3.750%, 12/06/2023
|
$
|
2,058,000
|
$
|
2,225,146
|
||||
|
Systems Software – 2.65%
|
||||||||
|
Microsoft Corp.
|
||||||||
|
3.500%, 02/12/2035
|
1,660,000
|
1,875,383
|
||||||
|
Total Corporate Bonds (Cost $16,752,723)
|
17,350,196
|
|||||||
|
Mortgage Backed Securities – 18.80%
|
||||||||
|
Fannie Mae Pool
|
||||||||
|
2.500%, 07/01/2023
|
65,416
|
68,291
|
||||||
|
3.000%, 04/01/2032
|
765,259
|
809,564
|
||||||
|
2.000%, 12/01/2035
|
514,883
|
534,808
|
||||||
|
4.000%, 10/01/2048
|
1,451,205
|
1,588,132
|
||||||
|
3.500%, 05/01/2049
|
646,304
|
688,572
|
||||||
|
4.500%, 07/01/2049
|
918,969
|
996,717
|
||||||
|
2.500%, 01/01/2050
|
103,542
|
107,374
|
||||||
|
2.000%, 09/01/2050
|
1,679,030
|
1,702,949
|
||||||
|
2.500%, 11/01/2050
|
326,492
|
339,079
|
||||||
|
2.500%, 02/01/2051
|
1,683,970
|
1,746,642
|
||||||
|
3.000%, 04/01/2051
|
795,986
|
841,885
|
||||||
|
2.000%, 05/01/2051
|
522,539
|
528,735
|
||||||
|
3.000%, 05/01/2051
|
534,085
|
561,644
|
||||||
|
Freddie Mac Pool
|
||||||||
|
2.500%, 10/01/2032
|
646,043
|
680,196
|
||||||
|
2.500%, 10/01/2040
|
433,100
|
450,426
|
||||||
|
3.500%, 08/01/2049
|
359,723
|
383,303
|
||||||
|
2.500%, 07/01/2050
|
1,227,027
|
1,275,850
|
||||||
|
Total Mortgage Backed Securities (Cost $13,153,452)
|
13,304,167
|
|||||||
|
Municipal Bonds – 19.58%
|
||||||||
|
California – 1.48%
|
||||||||
|
Contra Costa Community College District
|
||||||||
|
6.504%, 08/01/2034
|
750,000
|
1,046,038
|
||||||
|
Colorado – 0.70%
|
||||||||
|
Regional Transportation District Sales Tax Revenue
|
||||||||
|
2.337%, 11/01/2036
|
500,000
|
494,764
|
||||||
|
Hawaii – 1.43%
|
||||||||
|
State of Hawaii
|
||||||||
|
2.065%, 08/01/2035
|
1,045,000
|
1,013,021
|
||||||
The accompanying notes are an integral part of these financial statements.
27
Rockefeller Core Taxable Bond Fund
|
Schedule of Investments (Continued)
|
May 31, 2021 (Unaudited)
|
Principal
|
||||||||
|
Amount
|
Value
|
|||||||
|
Iowa – 0.29%
|
||||||||
|
Iowa Finance Authority
|
||||||||
|
1.980%, 07/01/2022
|
$
|
205,000
|
$
|
208,451
|
||||
|
Maryland – 1.52%
|
||||||||
|
City of Baltimore MD
|
||||||||
|
2.814%, 07/01/2040
|
1,070,000
|
1,076,971
|
||||||
|
New York – 4.46%
|
||||||||
|
Metropolitan Transportation Authority
|
||||||||
|
6.734%, 11/15/2030
|
870,000
|
1,127,126
|
||||||
|
New York State Dormitory Authority
|
||||||||
|
4.850%, 07/01/2048
|
1,065,000
|
1,218,248
|
||||||
|
Port Authority of New York & New Jersey
|
||||||||
|
2.799%, 10/15/2021
|
800,000
|
807,577
|
||||||
|
3,152,951
|
||||||||
|
North Carolina – 1.97%
|
||||||||
|
University of North Carolina at Chapel Hill
|
||||||||
|
3.327%, 12/01/2036
|
1,240,000
|
1,391,205
|
||||||
|
Ohio – 0.55%
|
||||||||
|
Ohio Housing Finance Agency
|
||||||||
|
2.650%, 11/01/2041
|
378,000
|
389,944
|
||||||
|
Oregon – 1.48%
|
||||||||
|
State of Oregon
|
||||||||
|
3.975%, 05/01/2038
|
950,000
|
1,049,058
|
||||||
|
Texas – 5.70%
|
||||||||
|
North Texas Tollway Authority
|
||||||||
|
3.011%, 01/01/2043
|
575,000
|
576,070
|
||||||
|
Permanent University Fund – Texas A&M University System
|
||||||||
|
3.660%, 07/01/2047
|
2,500,000
|
2,714,210
|
||||||
|
Texas Transportation Commission
|
||||||||
|
2.562%, 04/01/2042
|
750,000
|
746,065
|
||||||
|
4,036,345
|
||||||||
|
Total Municipal Bonds (Cost $13,368,076)
|
13,858,748
|
|||||||
The accompanying notes are an integral part of these financial statements.
28
Rockefeller Core Taxable Bond Fund
|
Schedule of Investments (Continued)
|
May 31, 2021 (Unaudited)
|
Principal
|
||||||||
|
Amount
|
Value
|
|||||||
|
U.S. Government Agency Issues – 7.95%
|
||||||||
|
Federal Home Loan Banks
|
||||||||
|
0.625%, 11/27/2024
|
$
|
2,110,000
|
$
|
2,110,029
|
||||
|
1.020%, 05/19/2026
|
1,440,000
|
1,440,234
|
||||||
|
Ginnie Mae II Pool
|
||||||||
|
3.000%, 08/20/2045
|
681,793
|
723,457
|
||||||
|
3.500%, 03/20/2047
|
798,418
|
847,782
|
||||||
|
4.000%, 12/20/2047
|
468,694
|
502,699
|
||||||
|
Total U.S. Government Agency Issues (Cost $5,502,513)
|
5,624,201
|
|||||||
|
U.S. Government Notes/Bonds – 20.12%
|
||||||||
|
United States Treasury Note/Bond
|
||||||||
|
2.625%, 03/31/2025
|
2,980,000
|
3,220,030
|
||||||
|
1.625%, 09/30/2026
|
3,273,000
|
3,400,084
|
||||||
|
2.750%, 02/15/2028
|
3,298,000
|
3,631,021
|
||||||
|
2.500%, 02/15/2045
|
2,479,000
|
2,590,700
|
||||||
|
1.250%, 05/15/2050
|
1,795,000
|
1,395,858
|
||||||
|
Total U.S. Government Notes/Bonds (Cost $13,580,677)
|
14,237,693
|
|||||||
|
Shares
|
||||||||
|
Exchange Traded Funds – 3.30%
|
||||||||
|
Vanguard Mortgage-Backed Securities ETF
|
43,689
|
2,335,395
|
||||||
|
Total Exchange Traded Funds (Cost $2,355,073)
|
2,335,395
|
|||||||
|
Money Market Funds – 0.48%
|
||||||||
|
Morgan Stanley Institutional Liquidity Funds –
|
||||||||
|
Treasury Portfolio – Institutional Class, 0.010% (b)
|
341,633
|
341,633
|
||||||
|
Total Money Market Funds (Cost $341,633)
|
341,633
|
|||||||
|
Total Investments (Cost $68,406,838) – 99.52%
|
70,436,137
|
|||||||
|
Other Assets in Excess of Liabilities – 0.48%
|
339,780
|
|||||||
|
Total Net Assets – 100.00%
|
$
|
70,775,917
|
||||||
Percentages are stated as a percent of net assets.
|
(a)
|
Variable rate security; the rate shown represents the rate at May 31, 2021.
|
|
(b)
|
The rate shown represents the seven day yield as of May 31, 2021.
|
The accompanying notes are an integral part of these financial statements.
29
Rockefeller Intermediate Tax Exempt National Bond Fund
|
Schedule of Investments
|
May 31, 2021 (Unaudited)
|
Principal
|
||||||||
|
Amount
|
Value
|
|||||||
|
Municipal Bonds – 99.09%
|
||||||||
|
Alabama – 2.54%
|
||||||||
|
Southeast Energy Authority A Cooperative District
|
||||||||
|
4.000%, 11/01/2051 (a)
|
$
|
2,000,000
|
$
|
2,379,434
|
||||
|
Alaska – 3.45%
|
||||||||
|
Alaska Housing Finance Corp.
|
||||||||
|
5.000%, 12/01/2033
|
2,590,000
|
3,236,177
|
||||||
|
Arizona – 2.17%
|
||||||||
|
Salt River Project Agricultural Improvement & Power District
|
||||||||
|
5.000%, 01/01/2032
|
625,000
|
785,469
|
||||||
|
5.000%, 01/01/2036
|
1,000,000
|
1,246,395
|
||||||
|
2,031,864
|
||||||||
|
Colorado – 2.36%
|
||||||||
|
Colorado Educational & Cultural Facilities Authority
|
||||||||
|
5.000%, 03/01/2035
|
1,610,000
|
2,211,009
|
||||||
|
Connecticut – 0.52%
|
||||||||
|
Connecticut Housing Finance Authority
|
||||||||
|
2.850%, 11/15/2026
|
465,000
|
486,162
|
||||||
|
Florida – 2.42%
|
||||||||
|
Florida Housing Finance Corp.
|
||||||||
|
3.200%, 07/01/2030
|
545,000
|
565,784
|
||||||
|
Florida’s Turnpike Enterprise
|
||||||||
|
4.000%, 07/01/2033
|
1,500,000
|
1,699,003
|
||||||
|
2,264,787
|
||||||||
|
Illinois – 10.72%
|
||||||||
|
Chicago O’Hare International Airport
|
||||||||
|
5.000%, 01/01/2033
|
775,000
|
895,416
|
||||||
|
5.000%, 01/01/2036
|
2,000,000
|
2,444,440
|
||||||
|
5.000%, 01/01/2036
|
1,015,000
|
1,204,482
|
||||||
|
Illinois Finance Authority
|
||||||||
|
5.000%, 07/01/2036
|
1,300,000
|
1,691,440
|
||||||
|
Illinois Finance Authority – Ascension Health Credit Group
|
||||||||
|
4.000%, 02/15/2033
|
2,550,000
|
2,913,531
|
||||||
|
State of Illinois
|
||||||||
|
4.000%, 03/01/2022
|
875,000
|
899,076
|
||||||
|
10,048,385
|
||||||||
|
Kansas – 1.62%
|
||||||||
|
State of Kansas Department of Transportation
|
||||||||
|
5.000%, 09/01/2030
|
1,210,000
|
1,516,916
|
||||||
The accompanying notes are an integral part of these financial statements.
30
Rockefeller Intermediate Tax Exempt National Bond Fund
|
Schedule of Investments (Continued)
|
May 31, 2021 (Unaudited)
|
Principal
|
||||||||
|
Amount
|
Value
|
|||||||
|
Massachusetts – 7.81%
|
||||||||
|
Commonwealth of Massachusetts
|
||||||||
|
4.000%, 11/01/2035
|
$
|
2,000,000
|
$
|
2,484,806
|
||||
|
Massachusetts Development Finance Agency
|
||||||||
|
5.000%, 07/01/2050 (a)
|
750,000
|
979,421
|
||||||
|
Massachusetts Development Finance Agency –
|
||||||||
|
Dana-Farber Cancer Obligation
|
||||||||
|
5.000%, 12/01/2032
|
430,000
|
519,689
|
||||||
|
Massachusetts Development Finance Agency –
|
||||||||
|
Partners HealthCare System
|
||||||||
|
5.000%, 07/01/2030
|
2,660,000
|
3,336,860
|
||||||
|
7,320,776
|
||||||||
|
Minnesota – 1.89%
|
||||||||
|
Minneapolis-St. Paul Metropolitan Airports Commission
|
||||||||
|
5.000%, 01/01/2026
|
550,000
|
616,138
|
||||||
|
5.000%, 01/01/2030
|
1,040,000
|
1,160,205
|
||||||
|
1,776,343
|
||||||||
|
Nebraska – 0.84%
|
||||||||
|
Nebraska Investment Finance Authority
|
||||||||
|
3.350%, 09/01/2028
|
765,000
|
783,751
|
||||||
|
Nevada – 4.48%
|
||||||||
|
Clark County Water Reclamation District
|
||||||||
|
4.000%, 07/01/2034
|
1,175,000
|
1,349,493
|
||||||
|
County of Clark Department of Aviation
|
||||||||
|
5.000%, 07/01/2033
|
1,770,000
|
2,010,710
|
||||||
|
Las Vegas Valley Water District
|
||||||||
|
5.000%, 06/01/2030
|
700,000
|
844,315
|
||||||
|
4,204,518
|
||||||||
|
New Jersey – 1.96%
|
||||||||
|
New Jersey Turnpike Authority
|
||||||||
|
5.000%, 01/01/2036
|
1,500,000
|
1,835,457
|
||||||
|
New York – 16.23%
|
||||||||
|
City of New York, NY
|
||||||||
|
5.000%, 12/01/2034
|
500,000
|
634,429
|
||||||
|
Metropolitan Transportation Authority
|
||||||||
|
5.000%, 09/01/2022
|
2,000,000
|
2,117,701
|
||||||
|
5.000%, 11/15/2027
|
1,795,000
|
2,119,643
|
||||||
|
4.000%, 11/15/2035
|
1,000,000
|
1,141,954
|
||||||
|
New York City Transitional Finance Authority
|
||||||||
|
Future Tax Secured Revenue
|
||||||||
|
5.000%, 02/01/2036
|
1,695,000
|
2,237,488
|
||||||
The accompanying notes are an integral part of these financial statements.
31
Rockefeller Intermediate Tax Exempt National Bond Fund
|
Schedule of Investments (Continued)
|
May 31, 2021 (Unaudited)
|
Principal
|
||||||||
|
Amount
|
Value
|
|||||||
|
New York – 16.23% (Continued)
|
||||||||
|
New York State Dormitory Authority
|
||||||||
|
5.000%, 02/15/2033
|
$
|
1,090,000
|
$
|
1,267,405
|
||||
|
New York State Urban Development Corp.
|
||||||||
|
5.000%, 03/15/2029
|
750,000
|
812,936
|
||||||
|
Port Authority of New York & New Jersey
|
||||||||
|
5.000%, 11/15/2033
|
1,490,000
|
1,861,363
|
||||||
|
State of New York Mortgage Agency
|
||||||||
|
2.750%, 10/01/2028
|
400,000
|
428,915
|
||||||
|
3.125%, 10/01/2032
|
970,000
|
1,035,321
|
||||||
|
Triborough Bridge & Tunnel Authority
|
||||||||
|
5.000%, 11/15/2030
|
1,255,000
|
1,555,181
|
||||||
|
15,212,336
|
||||||||
|
Ohio – 3.41%
|
||||||||
|
Ohio Water Development Authority
|
||||||||
|
5.000%, 06/01/2028
|
750,000
|
933,115
|
||||||
|
5.000%, 12/01/2030
|
1,835,000
|
2,262,833
|
||||||
|
3,195,948
|
||||||||
|
Pennsylvania – 9.33%
|
||||||||
|
Commonwealth of Pennsylvania
|
||||||||
|
3.250%, 08/15/2026
|
1,560,000
|
1,732,762
|
||||||
|
Pennsylvania Economic Development Financing Authority
|
||||||||
|
5.000%, 02/01/2033
|
1,130,000
|
1,281,275
|
||||||
|
4.000%, 11/15/2035
|
1,480,000
|
1,723,318
|
||||||
|
Pennsylvania Housing Finance Agency
|
||||||||
|
2.375%, 10/01/2027
|
510,000
|
535,861
|
||||||
|
3.200%, 10/01/2031
|
2,065,000
|
2,179,041
|
||||||
|
Pennsylvania Turnpike Commission
|
||||||||
|
5.000%, 12/01/2035
|
1,040,000
|
1,296,311
|
||||||
|
8,748,568
|
||||||||
|
Texas – 15.56%
|
||||||||
|
Aldine Independent School District
|
||||||||
|
5.000%, 02/15/2028
|
1,000,000
|
1,161,957
|
||||||
|
Arlington Higher Education Finance Corp. –
|
||||||||
|
A.W. Brown Fellowship Leader
|
||||||||
|
5.000%, 08/15/2024
|
315,000
|
356,233
|
||||||
|
City of Houston, TX Combined Utility System Revenue
|
||||||||
|
1.862%, 12/01/2028 (b)
|
1,290,000
|
1,188,152
|
||||||
|
5.000%, 11/15/2033
|
825,000
|
1,103,347
|
||||||
|
Clifton Higher Education Finance Corp.
|
||||||||
|
4.000%, 08/15/2032
|
1,000,000
|
1,212,978
|
||||||
|
Dallas Independent School District
|
||||||||
|
5.000%, 02/15/2036 (a)
|
5,000
|
5,171
|
||||||
The accompanying notes are an integral part of these financial statements.
32
Rockefeller Intermediate Tax Exempt National Bond Fund
|
Schedule of Investments (Continued)
|
May 31, 2021 (Unaudited)
|
Principal
|
||||||||
|
Amount
|
Value
|
|||||||
|
Texas – 15.56% (Continued)
|
||||||||
|
North Texas Tollway Authority
|
||||||||
|
3.990%, 09/01/2037 (b)
|
$
|
2,035,000
|
$
|
1,134,201
|
||||
|
San Antonio Independent School District/TX
|
||||||||
|
4.000%, 08/15/2035
|
500,000
|
619,995
|
||||||
|
State of Texas
|
||||||||
|
5.000%, 10/01/2034
|
1,250,000
|
1,555,035
|
||||||
|
Tarrant Regional Water District
|
||||||||
|
5.000%, 03/01/2029
|
2,050,000
|
2,392,192
|
||||||
|
Tarrant Regional Water District Water Supply System Revenue
|
||||||||
|
5.000%, 03/01/2032
|
350,000
|
420,173
|
||||||
|
Texas Municipal Gas Acquisition and Supply Corp I
|
||||||||
|
6.250%, 12/15/2026
|
2,930,000
|
3,435,851
|
||||||
|
14,585,285
|
||||||||
|
Virginia – 1.66%
|
||||||||
|
FHLMC Multifamily VRD Certificates
|
||||||||
|
2.550%, 06/15/2035
|
1,475,000
|
1,556,202
|
||||||
|
Washington – 6.26%
|
||||||||
|
Central Puget Sound Regional Transit Authority
|
||||||||
|
5.000%, 11/01/2030
|
750,000
|
917,320
|
||||||
|
State of Washington
|
||||||||
|
5.000%, 07/01/2029
|
1,545,000
|
1,852,374
|
||||||
|
5.000%, 06/01/2032
|
1,300,000
|
1,701,044
|
||||||
|
Washington State Housing Finance Commission
|
||||||||
|
3.000%, 12/01/2031
|
1,325,000
|
1,396,883
|
||||||
|
5,867,621
|
||||||||
|
Wisconsin – 3.86%
|
||||||||
|
State of Wisconsin
|
||||||||
|
5.000%, 05/01/2032
|
1,015,000
|
1,148,142
|
||||||
|
5.000%, 11/01/2032
|
1,000,000
|
1,235,089
|
||||||
|
Wisconsin Department of Transportation
|
||||||||
|
5.000%, 07/01/2028
|
1,085,000
|
1,238,288
|
||||||
|
3,621,519
|
||||||||
|
Total Municipal Bonds (Cost $88,406,529)
|
92,883,058
|
|||||||
The accompanying notes are an integral part of these financial statements.
33
Rockefeller Intermediate Tax Exempt National Bond Fund
|
Schedule of Investments (Continued)
|
May 31, 2021 (Unaudited)
|
Shares
|
Value
|
|||||||
|
Money Market Funds – 0.66%
|
||||||||
|
Morgan Stanley Institutional Liquidity Funds –
|
||||||||
|
Treasury Portfolio – Institutional Class, 0.010% (c)
|
615,735
|
$
|
615,735
|
|||||
|
Total Money Market Funds (Cost $615,735)
|
615,735
|
|||||||
|
Total Investments (Cost $89,022,264) – 99.75%
|
93,498,793
|
|||||||
|
Other Assets in Excess of Liabilities – 0.25%
|
235,727
|
|||||||
|
Total Net Assets – 100.00%
|
$
|
93,734,520
|
||||||
Percentages are stated as a percent of net assets.
|
(a)
|
Adjustable rate security; the rate is determined by a Remarketing Agreement.
|
|
(b)
|
Zero coupon bond; effective yield is shown.
|
|
(c)
|
The rate shown represents the seven day yield as of May 31, 2021.
|
The accompanying notes are an integral part of these financial statements.
34
Rockefeller Intermediate Tax Exempt New York Bond Fund
|
Schedule of Investments
|
May 31, 2021 (Unaudited)
|
Principal
|
||||||||
|
Amount
|
Value
|
|||||||
|
Municipal Bonds – 98.76%
|
||||||||
|
Georgia – 2.94%
|
||||||||
|
City of Atlanta GA Airport Passenger Facility Charge
|
||||||||
|
5.000%, 07/01/2035
|
$
|
1,130,000
|
$
|
1,445,858
|
||||
|
Illinois – 1.35%
|
||||||||
|
State of Illinois
|
||||||||
|
4.000%, 03/01/2024
|
605,000
|
662,648
|
||||||
|
New York – 87.28%
|
||||||||
|
City of New York, NY
|
||||||||
|
4.000%, 08/01/2034
|
740,000
|
852,782
|
||||||
|
5.000%, 12/01/2035
|
1,230,000
|
1,556,699
|
||||||
|
City of Yonkers, NY
|
||||||||
|
4.000%, 05/01/2035
|
750,000
|
887,690
|
||||||
|
County of Dutchess, NY
|
||||||||
|
4.000%, 03/01/2032
|
500,000
|
582,953
|
||||||
|
County of Westchester, NY
|
||||||||
|
4.000%, 07/01/2022
|
5,000
|
5,016
|
||||||
|
4.000%, 12/01/2029
|
650,000
|
764,514
|
||||||
|
Metropolitan Transportation Authority
|
||||||||
|
5.000%, 11/15/2026
|
1,190,000
|
1,272,121
|
||||||
|
5.000%, 11/15/2028
|
355,000
|
447,434
|
||||||
|
5.000%, 11/15/2029
|
1,000,000
|
1,068,534
|
||||||
|
4.000%, 11/15/2032
|
1,000,000
|
1,155,366
|
||||||
|
4.000%, 11/15/2035
|
750,000
|
856,466
|
||||||
|
New York City Housing Development Corp.
|
||||||||
|
1.850%, 05/01/2026
|
250,000
|
260,702
|
||||||
|
2.850%, 11/01/2031
|
1,130,000
|
1,198,577
|
||||||
|
New York City Transitional Finance Authority Building Aid Revenue
|
||||||||
|
5.000%, 07/15/2030
|
1,465,000
|
1,729,321
|
||||||
|
New York City Transitional Finance Authority
|
||||||||
|
Future Tax Secured Revenue
|
||||||||
|
5.000%, 02/01/2034
|
1,000,000
|
1,224,654
|
||||||
|
5.000%, 02/01/2036
|
1,000,000
|
1,320,052
|
||||||
|
New York City Water & Sewer System
|
||||||||
|
5.000%, 06/15/2031
|
500,000
|
623,405
|
||||||
|
4.000%, 06/15/2036
|
1,190,000
|
1,421,960
|
||||||
|
New York State Dormitory Authority
|
||||||||
|
5.000%, 10/01/2032
|
1,000,000
|
1,211,553
|
||||||
|
4.000%, 03/15/2034
|
2,000,000
|
2,448,378
|
||||||
|
5.000%, 07/01/2034
|
1,000,000
|
1,174,502
|
||||||
|
5.000%, 03/15/2035
|
2,000,000
|
2,363,367
|
||||||
The accompanying notes are an integral part of these financial statements.
35
Rockefeller Intermediate Tax Exempt New York Bond Fund
|
Schedule of Investments (Continued)
|
May 31, 2021 (Unaudited)
|
Principal
|
||||||||
|
Amount
|
Value
|
|||||||
|
New York – 87.28% (Continued)
|
||||||||
|
New York State Dormitory Authority – New York University
|
||||||||
|
5.000%, 07/01/2033
|
$
|
1,090,000
|
$
|
1,281,653
|
||||
|
New York State Dormitory Authority – State University of New York
|
||||||||
|
5.000%, 07/01/2031
|
1,105,000
|
1,370,670
|
||||||
|
New York State Housing Finance Agency
|
||||||||
|
2.125%, 11/01/2023
|
400,000
|
404,607
|
||||||
|
2.900%, 11/01/2025
|
190,000
|
200,883
|
||||||
|
3.050%, 11/01/2027
|
1,000,000
|
1,021,177
|
||||||
|
New York State Thruway Authority
|
||||||||
|
5.000%, 01/01/2032
|
1,020,000
|
1,177,305
|
||||||
|
5.000%, 01/01/2035
|
1,000,000
|
1,189,210
|
||||||
|
New York State Thruway Authority Highway & Bridge Trust Fund
|
||||||||
|
5.000%, 04/01/2032
|
750,000
|
779,451
|
||||||
|
Port Authority of New York & New Jersey
|
||||||||
|
5.000%, 10/15/2033
|
1,250,000
|
1,485,699
|
||||||
|
5.000%, 11/15/2033
|
700,000
|
874,466
|
||||||
|
Sales Tax Asset Receivable Corp.
|
||||||||
|
5.000%, 10/15/2028
|
1,490,000
|
1,715,386
|
||||||
|
5.000%, 10/15/2029
|
695,000
|
799,878
|
||||||
|
State of New York Mortgage Agency
|
||||||||
|
2.300%, 10/01/2027
|
700,000
|
728,189
|
||||||
|
2.650%, 04/01/2029
|
500,000
|
529,098
|
||||||
|
Triborough Bridge & Tunnel Authority
|
||||||||
|
5.000%, 11/15/2029
|
425,000
|
526,876
|
||||||
|
2.795%, 11/15/2032 (a)
|
865,000
|
687,163
|
||||||
|
5.000%, 11/15/2034
|
1,000,000
|
1,270,667
|
||||||
|
Utility Debt Securitization Authority
|
||||||||
|
5.000%, 12/15/2028
|
835,000
|
1,000,134
|
||||||
|
5.000%, 12/15/2034
|
1,125,000
|
1,361,499
|
||||||
|
42,830,057
|
||||||||
|
Texas – 7.19%
|
||||||||
|
City of Houston, TX Combined Utility System Revenue
|
||||||||
|
5.000%, 11/15/2033
|
1,305,000
|
1,745,295
|
||||||
|
Texas Municipal Gas Acquisition and Supply Corp I
|
||||||||
|
6.250%, 12/15/2026
|
1,520,000
|
1,782,421
|
||||||
|
3,527,716
|
||||||||
|
Total Municipal Bonds (Cost $46,330,720)
|
48,466,279
|
|||||||
The accompanying notes are an integral part of these financial statements.
36
Rockefeller Intermediate Tax Exempt New York Bond Fund
|
Schedule of Investments (Continued)
|
May 31, 2021 (Unaudited)
|
Shares
|
Value
|
|||||||
|
Money Market Funds – 0.39%
|
||||||||
|
Morgan Stanley Institutional Liquidity Funds –
|
||||||||
|
Treasury Portfolio – Institutional Class, 0.010% (b)
|
190,341
|
$
|
190,341
|
|||||
|
Total Money Market Funds (Cost $190,341)
|
190,341
|
|||||||
|
Total Investments (Cost $46,521,061) – 99.15%
|
48,656,620
|
|||||||
|
Other Assets in Excess of Liabilities – 0.85%
|
414,894
|
|||||||
|
Total Net Assets – 100.00%
|
$
|
49,071,514
|
||||||
Percentages are stated as a percent of net assets.
|
(a)
|
Zero coupon bond; effective yield is shown.
|
|
(b)
|
The rate shown represents the seven day yield as of May 31, 2021.
|
The accompanying notes are an integral part of these financial statements.
37
Rockefeller Funds
|
Statements of Assets and Liabilities
|
Assets
Investments, at value (cost $57,057,394, $68,406,838, $89,022,264
and $46,521,061, respectively)
Dividends and interest receivable
Receivable for investment securities sold
Receivable for foreign currencies
Other assets
Total Assets
Liabilities
Payable to Adviser
Payable to affiliates
Payable for fund shares redeemed
Payable for investments purchased
Accrued expenses and other liabilities
Total Liabilities
Net Assets
Net Assets Consist of:
Paid-in capital
Total distributable earnings
Net Assets
Shares of beneficial interest outstanding (unlimited
number of shares authorized, $0.001 par value)
Net asset value, redemption price and offering price per share
The accompanying notes are an integral part of these financial statements.
38
May 31, 2021 (Unaudited)
|
Rockefeller
|
Rockefeller
|
Rockefeller
|
||||||||||||
|
Equity
|
Rockefeller
|
Intermediate
|
Intermediate
|
|||||||||||
|
Allocation
|
Core Taxable
|
Tax Exempt
|
Tax Exempt
|
|||||||||||
|
Fund
|
Bond Fund
|
National Bond Fund
|
New York Bond Fund
|
|||||||||||
|
$
|
84,035,252
|
$
|
70,436,137
|
$
|
93,498,793
|
$
|
48,656,620
|
|||||||
|
252,161
|
419,238
|
1,053,259
|
482,569
|
|||||||||||
|
929,102
|
—
|
—
|
—
|
|||||||||||
|
98,481
|
—
|
—
|
—
|
|||||||||||
|
11,021
|
8,848
|
11,240
|
6,952
|
|||||||||||
|
85,326,017
|
70,864,223
|
94,563,292
|
49,146,141
|
|||||||||||
|
61,163
|
21,036
|
27,856
|
14,561
|
|||||||||||
|
63,813
|
42,612
|
58,475
|
33,101
|
|||||||||||
|
20,659
|
—
|
100,000
|
—
|
|||||||||||
|
14,291
|
—
|
618,225
|
—
|
|||||||||||
|
26,155
|
24,658
|
24,216
|
26,965
|
|||||||||||
|
186,081
|
88,306
|
828,772
|
74,627
|
|||||||||||
|
$
|
85,139,936
|
$
|
70,775,917
|
$
|
93,734,520
|
$
|
49,071,514
|
|||||||
|
$
|
51,928,476
|
$
|
67,528,645
|
$
|
87,812,197
|
$
|
46,526,848
|
|||||||
|
33,211,460
|
3,247,272
|
5,922,323
|
2,544,666
|
|||||||||||
|
$
|
85,139,936
|
$
|
70,775,917
|
$
|
93,734,520
|
$
|
49,071,514
|
|||||||
|
5,878,148
|
6,732,352
|
8,803,565
|
4,639,109
|
|||||||||||
|
$
|
14.48
|
$
|
10.51
|
$
|
10.65
|
$
|
10.58
|
|||||||
The accompanying notes are an integral part of these financial statements.
39
Rockefeller Funds
|
Statements of Operations
|
Investment Income
Dividend income
Interest income
Total Investment Income
Expenses
Management fees
Administration and accounting fees
Custody fees
Audit and tax fees
Legal fees
Transfer agent fees & expenses
Pricing fees
Chief Compliance Officer fees
Federal & state registration fees
Trustees’ fees
Reports to shareholders
Insurance expense
Other expense
Total expenses
Net Investment Income
Realized and Unrealized Gain (Loss) on Investments
Net realized gain/(loss) from:
Investments
Foreign currency
Change in net unrealized appreciation/(depreciation) on:
Investments
Foreign currency
Net Realized and Unrealized Gain/(Loss) on Investments
Net Increase/(Decrease) in Net Assets from Operations
|
(1)
|
Net of $69,483 withholding taxes and issuance fees.
|
The accompanying notes are an integral part of these financial statements.
40
For the Period Ended May 31, 2021 (Unaudited)
|
Rockefeller
|
Rockefeller
|
Rockefeller
|
||||||||||||
|
Equity
|
Rockefeller
|
Intermediate
|
Intermediate
|
|||||||||||
|
Allocation
|
Core Taxable
|
Tax Exempt
|
Tax Exempt
|
|||||||||||
|
Fund
|
Bond Fund
|
National Bond Fund
|
New York Bond Fund
|
|||||||||||
|
$
|
941,599
|
(1)
|
$
|
15,414
|
$
|
—
|
$
|
—
|
||||||
|
89
|
743,518
|
1,004,605
|
490,081
|
|||||||||||
|
941,688
|
758,932
|
1,004,605
|
490,081
|
|||||||||||
|
361,069
|
125,348
|
170,528
|
86,363
|
|||||||||||
|
69,679
|
63,840
|
87,555
|
45,200
|
|||||||||||
|
26,925
|
2,558
|
2,829
|
2,121
|
|||||||||||
|
16,826
|
18,027
|
17,372
|
18,100
|
|||||||||||
|
10,334
|
9,771
|
11,083
|
8,820
|
|||||||||||
|
9,254
|
9,230
|
10,160
|
8,561
|
|||||||||||
|
8,878
|
3,577
|
7,184
|
4,937
|
|||||||||||
|
5,642
|
5,642
|
5,642
|
5,642
|
|||||||||||
|
5,486
|
3,921
|
6,242
|
2,647
|
|||||||||||
|
5,425
|
5,425
|
5,425
|
5,425
|
|||||||||||
|
1,811
|
1,086
|
1,533
|
821
|
|||||||||||
|
1,793
|
1,664
|
1,337
|
1,165
|
|||||||||||
|
1,726
|
1,421
|
1,530
|
1,461
|
|||||||||||
|
524,848
|
251,510
|
328,420
|
191,263
|
|||||||||||
|
416,840
|
507,422
|
676,185
|
298,818
|
|||||||||||
|
6,556,601
|
1,212,048
|
1,210,720
|
303,678
|
|||||||||||
|
(13,624
|
)
|
—
|
—
|
—
|
||||||||||
|
5,793,356
|
(3,483,233
|
)
|
(1,197,122
|
)
|
46,551
|
|||||||||
|
1,745
|
—
|
—
|
—
|
|||||||||||
|
12,338,078
|
(2,271,185
|
)
|
13,598
|
350,229
|
||||||||||
|
$
|
12,754,918
|
$
|
(1,763,763
|
)
|
$
|
689,783
|
$
|
649,047
|
||||||
The accompanying notes are an integral part of these financial statements.
41
Rockefeller Equity Allocation Fund
|
Statements of Changes in Net Assets
|
|
Six Months Ended
|
||||||||
|
May 31, 2021
|
Year Ended
|
|||||||
|
(Unaudited)
|
November 30, 2020
|
|||||||
|
From Operations
|
||||||||
|
Net investment income
|
$
|
416,840
|
$
|
620,712
|
||||
|
Net realized gain from investments
|
||||||||
|
and foreign currency translation
|
6,542,977
|
3,346,752
|
||||||
|
Net change in unrealized appreciation on
|
||||||||
|
investments and foreign currency translation
|
5,795,101
|
2,432,298
|
||||||
|
Net increase in net assets from operations
|
12,754,918
|
6,402,762
|
||||||
|
From Distributions
|
||||||||
|
Net dividends and distributions
|
(3,226,633
|
)
|
(3,384,004
|
)
|
||||
|
Net decrease in net assets
|
||||||||
|
resulting from distributions paid
|
(3,226,633
|
)
|
(3,384,004
|
)
|
||||
|
From Capital Share Transactions
|
||||||||
|
Proceeds from shares sold
|
876,771
|
10,288,993
|
||||||
|
Net asset value of shares issued
|
||||||||
|
to distributions declared
|
1,125,644
|
1,376,299
|
||||||
|
Costs of shares redeemed
|
(10,833,279
|
(40,043,474
|
)
|
|||||
|
Net decrease in net assets
|
||||||||
|
from capital share transactions
|
(8,830,864
|
)
|
(28,378,180
|
)
|
||||
|
Total Increase/(Decrease) in Net Assets
|
697,421
|
(25,359,422
|
)
|
|||||
|
Net Assets
|
||||||||
|
Beginning of period
|
84,442,515
|
109,801,937
|
||||||
|
End of period
|
$
|
85,139,936
|
$
|
84,442,515
|
||||
The accompanying notes are an integral part of these financial statements.
42
Rockefeller Core Taxable Bond Fund
|
Statements of Changes in Net Assets
|
|
Six Months Ended
|
||||||||
|
May 31, 2021
|
Year Ended
|
|||||||
|
(Unaudited)
|
November 30, 2020
|
|||||||
|
From Operations
|
||||||||
|
Net investment income
|
$
|
507,422
|
$
|
1,304,258
|
||||
|
Net realized gain from investments
|
1,212,048
|
1,044,294
|
||||||
|
Net change in unrealized
|
||||||||
|
appreciation/(depreciation) on investment
|
(3,483,233
|
)
|
2,547,530
|
|||||
|
Net increase/(decrease) in net
|
||||||||
|
assets from operations
|
(1,763,763
|
)
|
4,896,082
|
|||||
|
From Distributions
|
||||||||
|
Net dividends and distributions
|
(625,331
|
)
|
(1,552,674
|
)
|
||||
|
Net decrease in net assets
|
||||||||
|
resulting from distributions paid
|
(625,331
|
)
|
(1,552,674
|
)
|
||||
|
From Capital Share Transactions
|
||||||||
|
Proceeds from shares sold
|
2,002,978
|
5,299,190
|
||||||
|
Net asset value of shares issued
|
||||||||
|
to distributions declared
|
299,739
|
755,159
|
||||||
|
Costs of shares redeemed
|
(3,115,165
|
)
|
(8,022,807
|
)
|
||||
|
Net decrease in net assets
|
||||||||
|
from capital share transactions
|
(812,448
|
)
|
(1,968,458
|
)
|
||||
|
Total Increase/(Decrease) in Net Assets
|
(3,201,542
|
)
|
1,374,950
|
|||||
|
Net Assets
|
||||||||
|
Beginning of period
|
73,977,459
|
72,602,509
|
||||||
|
End of period
|
$
|
70,775,917
|
$
|
73,977,459
|
||||
The accompanying notes are an integral part of these financial statements.
43
Rockefeller Intermediate Tax Exempt National Bond Fund
|
Statements of Changes in Net Assets
|
|
Six Months Ended
|
||||||||
|
May 31, 2021
|
Year Ended
|
|||||||
|
(Unaudited)
|
November 30, 2020
|
|||||||
|
From Operations
|
||||||||
|
Net investment income
|
$
|
676,185
|
$
|
1,514,317
|
||||
|
Net realized gain from investments
|
1,210,720
|
663,049
|
||||||
|
Net change in unrealized
|
||||||||
|
appreciation/(depreciation) on investment
|
(1,197,122
|
)
|
2,499,535
|
|||||
|
Net increase in net assets from operations
|
689,783
|
4,676,901
|
||||||
|
From Distributions
|
||||||||
|
Net dividends and distributions
|
(1,396,215
|
)
|
(2,155,642
|
)
|
||||
|
Net decrease in net assets
|
||||||||
|
resulting from distributions paid
|
(1,396,215
|
)
|
(2,155,642
|
)
|
||||
|
From Capital Share Transactions
|
||||||||
|
Proceeds from shares sold
|
3,390,200
|
9,537,000
|
||||||
|
Net asset value of shares issued
|
||||||||
|
to distributions declared
|
501,559
|
647,160
|
||||||
|
Costs of shares redeemed
|
(14,438,051
|
)
|
(8,928,956
|
)
|
||||
|
Net increase/(decrease) in net assets
|
||||||||
|
from capital share transactions
|
(10,546,292
|
)
|
1,255,204
|
|||||
|
Total Increase/(Decrease) in Net Assets
|
(11,252,724
|
)
|
3,776,463
|
|||||
|
Net Assets
|
||||||||
|
Beginning of period
|
104,987,244
|
101,210,781
|
||||||
|
End of period
|
$
|
93,734,520
|
$
|
104,987,244
|
||||
The accompanying notes are an integral part of these financial statements.
44
Rockefeller Intermediate Tax Exempt New York Bond Fund
|
Statements of Changes in Net Assets
|
|
Six Months Ended
|
||||||||
|
May 31, 2021
|
Year Ended
|
|||||||
|
(Unaudited)
|
November 30, 2020
|
|||||||
|
From Operations
|
||||||||
|
Net investment income
|
$
|
298,818
|
$
|
678,526
|
||||
|
Net realized gain from investments
|
303,678
|
248,708
|
||||||
|
Net change in unrealized
|
||||||||
|
appreciation on investments
|
46,551
|
678,586
|
||||||
|
Net increase in net assets from operations
|
649,047
|
1,605,820
|
||||||
|
From Distributions
|
||||||||
|
Net dividends and distributions
|
(567,259
|
)
|
(891,326
|
)
|
||||
|
Net decrease in net assets
|
||||||||
|
resulting from distributions paid
|
(567,259
|
)
|
(891,326
|
)
|
||||
|
From Capital Share Transactions
|
||||||||
|
Proceeds from shares sold
|
1,996,000
|
4,536,800
|
||||||
|
Net asset value of shares issued
|
||||||||
|
to distributions declared
|
280,057
|
375,457
|
||||||
|
Costs of shares redeemed
|
(2,226,107
|
)
|
(6,740,410
|
)
|
||||
|
Net increase/(decrease) in net assets
|
||||||||
|
from capital share transactions
|
49,950
|
(1,828,153
|
)
|
|||||
|
Total Increase/(Decrease) in Net Assets
|
131,738
|
(1,113,659
|
)
|
|||||
|
Net Assets
|
||||||||
|
Beginning of period
|
48,939,776
|
50,053,435
|
||||||
|
End of period
|
$
|
49,071,514
|
$
|
48,939,776
|
||||
The accompanying notes are an integral part of these financial statements.
45
Rockefeller Equity Allocation Fund
|
Financial Highlights
|
|
Six Months
|
||||
|
Ended
|
||||
|
May 31, 2021
|
||||
|
(Unaudited)
|
||||
|
Net Asset Value, Beginning of Period / Year
|
$
|
12.96
|
||
|
Income from investment operations:
|
||||
|
Net investment income(1)
|
0.07
|
|||
|
Net realized and unrealized gain (loss) on investments
|
1.96
|
|||
|
Total from investment operations
|
2.03
|
|||
|
Less distributions paid:
|
||||
|
From net investment income
|
(0.02
|
)
|
||
|
From net realized gain on investments
|
(0.49
|
)
|
||
|
Total distributions paid
|
(0.51
|
)
|
||
|
Net Asset Value, End of Period / Year
|
$
|
14.48
|
||
|
Total Return(2)
|
16.11
|
%
|
||
|
Supplemental Data and Ratios:
|
||||
|
Net assets at end of period / year (000’s)
|
$
|
85,140
|
||
|
Ratio of expenses to average net assets:
|
||||
|
Before waiver, expense recoupment(3)
|
1.24
|
%
|
||
|
After waiver, expense recoupment(3)
|
1.24
|
%
|
||
|
Ratio of net investment income to average net assets:
|
||||
|
Before waiver, expense recoupment(3)
|
0.98
|
%
|
||
|
After waiver, expense recoupment(3)
|
0.98
|
%
|
||
|
Portfolio turnover rate(2)
|
25.22
|
%
|
||
|
(1)
|
Per share net investment income has been calculated using the daily average share method.
|
|
(2)
|
Not annualized for periods less than one year.
|
|
(3)
|
Annualized for periods less than one year.
|
The accompanying notes are an integral part of these financial statements.
46
Per Share Data for a Share Outstanding Throughout the Period / Year
|
Year Ended
|
Year Ended
|
Year Ended
|
Year Ended
|
Period Ended
|
||||||||||||||
|
November 30,
|
November 30,
|
November 30,
|
November 30,
|
November 30,
|
||||||||||||||
|
2020
|
2019
|
2018
|
2017
|
2016
|
||||||||||||||
|
$
|
12.20
|
$
|
12.11
|
$
|
12.61
|
$
|
10.05
|
$
|
9.94
|
|||||||||
|
0.08
|
0.11
|
0.07
|
0.09
|
0.09
|
||||||||||||||
|
1.05
|
0.68
|
(0.28
|
)
|
2.57
|
0.10
|
|||||||||||||
|
1.13
|
0.79
|
(0.21
|
)
|
2.66
|
0.19
|
|||||||||||||
|
(0.10
|
)
|
(0.11
|
)
|
(0.24
|
)
|
(0.10
|
)
|
(0.08
|
)
|
|||||||||
|
(0.27
|
)
|
(0.59
|
)
|
(0.05
|
)
|
—
|
—
|
|||||||||||
|
(0.37
|
)
|
(0.70
|
)
|
(0.29
|
)
|
(0.10
|
)
|
(0.08
|
)
|
|||||||||
|
$
|
12.96
|
$
|
12.20
|
$
|
12.11
|
$
|
12.61
|
$
|
10.05
|
|||||||||
|
9.54
|
%
|
7.38
|
%
|
-1.69
|
%
|
26.54
|
%
|
2.05
|
%
|
|||||||||
|
$
|
84,443
|
$
|
109,802
|
$
|
112,228
|
$
|
118,260
|
$
|
90,612
|
|||||||||
|
1.22
|
%
|
1.15
|
%
|
1.15
|
%
|
1.18
|
%
|
1.24
|
%
|
|||||||||
|
1.22
|
%
|
1.15
|
%
|
1.15
|
%
|
1.22
|
%
|
1.25
|
%
|
|||||||||
|
0.67
|
%
|
0.94
|
%
|
0.57
|
%
|
0.84
|
%
|
0.97
|
%
|
|||||||||
|
0.67
|
%
|
0.94
|
%
|
0.57
|
%
|
0.80
|
%
|
0.96
|
%
|
|||||||||
|
77.50
|
%
|
37.01
|
%
|
32.22
|
%
|
35.98
|
%
|
58.83
|
%
|
|||||||||
The accompanying notes are an integral part of these financial statements.
47
Rockefeller Core Taxable Bond Fund
|
Financial Highlights
|
|
Six Months
|
||||
|
Ended
|
||||
|
May 31, 2021
|
||||
|
(Unaudited)
|
||||
|
Net Asset Value, Beginning of Period / Year
|
$
|
10.86
|
||
|
Income from investment operations:
|
||||
|
Net investment income(1)
|
0.08
|
|||
|
Net realized and unrealized gain (loss) on investments
|
(0.34
|
)
|
||
|
Total from investment operations
|
(0.26
|
)
|
||
|
Less distributions paid:
|
||||
|
From net investment income
|
(0.09
|
)
|
||
|
From net realized gain on investments
|
—
|
|||
|
Total distributions paid
|
(0.09
|
)
|
||
|
Net Asset Value, End of Period / Year
|
$
|
10.51
|
||
|
Total Return(2)
|
-2.40
|
%
|
||
|
Supplemental Data and Ratios:
|
||||
|
Net assets at end of period / year (000’s)
|
$
|
70,776
|
||
|
Ratio of expenses to average net assets:
|
||||
|
Before waiver, expense recoupment(3)
|
0.70
|
%
|
||
|
After waiver, expense recoupment(3)
|
0.70
|
%
|
||
|
Ratio of net investment income to average net assets:
|
||||
|
Before waiver, expense recoupment(3)
|
1.42
|
%
|
||
|
After waiver, expense recoupment(3)
|
1.42
|
%
|
||
|
Portfolio turnover rate(2)
|
31.01
|
%
|
||
|
(1)
|
Per share net investment income has been calculated using the daily average share method.
|
|
(2)
|
Not annualized for periods less than one year.
|
|
(3)
|
Annualized for periods less than one year.
|
The accompanying notes are an integral part of these financial statements.
48
Per Share Data for a Share Outstanding Throughout the Period / Year
|
Year Ended
|
Year Ended
|
Year Ended
|
Year Ended
|
Year Ended
|
||||||||||||||
|
November 30,
|
November 30,
|
November 30,
|
November 30,
|
November 30,
|
||||||||||||||
|
2020
|
2019
|
2018
|
2017
|
2016
|
||||||||||||||
|
$
|
10.38
|
$
|
9.69
|
$
|
10.08
|
$
|
10.08
|
$
|
10.21
|
|||||||||
|
0.19
|
0.26
|
0.26
|
0.21
|
0.19
|
||||||||||||||
|
0.52
|
0.70
|
(0.40
|
)
|
0.08
|
0.04
|
|||||||||||||
|
0.71
|
0.96
|
(0.14
|
)
|
0.29
|
0.23
|
|||||||||||||
|
(0.23
|
)
|
(0.27
|
)
|
(0.25
|
)
|
(0.20
|
)
|
(0.19
|
)
|
|||||||||
|
—
|
—
|
—
|
(0.09
|
)
|
(0.17
|
)
|
||||||||||||
|
(0.23
|
)
|
(0.27
|
)
|
(0.25
|
)
|
(0.29
|
)
|
(0.36
|
)
|
|||||||||
|
$
|
10.86
|
$
|
10.38
|
$
|
9.69
|
$
|
10.08
|
$
|
10.08
|
|||||||||
|
6.95
|
%
|
10.05
|
%
|
-1.37
|
%
|
2.85
|
%
|
2.32
|
%
|
|||||||||
|
$
|
73,977
|
$
|
72,603
|
$
|
71,360
|
$
|
76,066
|
$
|
79,441
|
|||||||||
|
0.69
|
%
|
0.66
|
%
|
0.64
|
%
|
0.65
|
%
|
0.66
|
%
|
|||||||||
|
0.69
|
%
|
0.66
|
%
|
0.64
|
%
|
0.65
|
%
|
0.66
|
%
|
|||||||||
|
1.78
|
%
|
2.57
|
%
|
2.61
|
%
|
2.14
|
%
|
1.89
|
%
|
|||||||||
|
1.78
|
%
|
2.57
|
%
|
2.61
|
%
|
2.14
|
%
|
1.89
|
%
|
|||||||||
|
46.39
|
%
|
98.69
|
%
|
42.37
|
%
|
50.92
|
%
|
49.78
|
%
|
|||||||||
The accompanying notes are an integral part of these financial statements.
49
Rockefeller Intermediate Tax Exempt National Bond Fund
|
Financial Highlights
|
|
Six Months
|
||||
|
Ended
|
||||
|
May 31, 2021
|
||||
|
(Unaudited)
|
||||
|
Net Asset Value, Beginning of Period / Year
|
$
|
10.72
|
||
|
Income from investment operations:
|
||||
|
Net investment income(1)
|
0.07
|
|||
|
Net realized and unrealized gain (loss) on investments
|
0.01
|
|||
|
Total from investment operations
|
0.08
|
|||
|
Less distributions paid:
|
||||
|
From net investment income
|
(0.08
|
)
|
||
|
From net realized gain on investments
|
(0.07
|
)
|
||
|
Total distributions paid
|
(0.15
|
)
|
||
|
Net Asset Value, End of Period / Year
|
$
|
10.65
|
||
|
Total Return(3)
|
0.69
|
%
|
||
|
Supplemental Data and Ratios:
|
||||
|
Net assets at end of period / year (000’s)
|
$
|
93,735
|
||
|
Ratio of expenses to average net assets:
|
||||
|
Before waiver, expense recoupment(4)
|
0.67
|
%
|
||
|
After waiver, expense recoupment(4)
|
0.67
|
%
|
||
|
Ratio of net investment income to average net assets:
|
||||
|
Before waiver, expense recoupment(4)
|
1.39
|
%
|
||
|
After waiver, expense recoupment(4)
|
1.39
|
%
|
||
|
Portfolio turnover rate(3)
|
14.65
|
%
|
||
|
(1)
|
Per share net investment income has been calculated using the daily average share method.
|
|
(2)
|
Amount is less than $0.005.
|
|
(3)
|
Not annualized for periods less than one year.
|
|
(4)
|
Annualized for periods less than one year.
|
The accompanying notes are an integral part of these financial statements.
50
Per Share Data for a Share Outstanding Throughout the Period / Year
|
Year Ended
|
Year Ended
|
Year Ended
|
Year Ended
|
Year Ended
|
||||||||||||||
|
November 30,
|
November 30,
|
November 30,
|
November 30,
|
November 30,
|
||||||||||||||
|
2020
|
2019
|
2018
|
2017
|
2016
|
||||||||||||||
|
$
|
10.46
|
$
|
9.95
|
$
|
10.04
|
$
|
9.96
|
$
|
10.11
|
|||||||||
|
0.15
|
0.17
|
0.12
|
0.09
|
0.08
|
||||||||||||||
|
0.33
|
0.50
|
(0.10
|
)
|
0.15
|
(0.15
|
)
|
||||||||||||
|
0.48
|
0.67
|
0.02
|
0.24
|
(0.07
|
)
|
|||||||||||||
|
(0.16
|
)
|
(0.16
|
)
|
(0.11
|
)
|
(0.09
|
)
|
(0.07
|
)
|
|||||||||
|
(0.06
|
)
|
—
|
0.00
|
(2)
|
(0.07
|
)
|
(0.01
|
)
|
||||||||||
|
(0.22
|
)
|
(0.16
|
)
|
(0.11
|
)
|
(0.16
|
)
|
(0.08
|
)
|
|||||||||
|
$
|
10.72
|
$
|
10.46
|
$
|
9.95
|
$
|
10.04
|
$
|
9.96
|
|||||||||
|
4.73
|
%
|
6.77
|
%
|
0.24
|
%
|
2.43
|
%
|
-0.74
|
%
|
|||||||||
|
$
|
104,987
|
$
|
101,211
|
$
|
102,245
|
$
|
94,759
|
$
|
77,663
|
|||||||||
|
0.65
|
%
|
0.63
|
%
|
0.63
|
%
|
0.66
|
%
|
0.68
|
%
|
|||||||||
|
0.65
|
%
|
0.63
|
%
|
0.63
|
%
|
0.66
|
%
|
0.69
|
%
|
|||||||||
|
1.46
|
%
|
1.61
|
%
|
1.23
|
%
|
0.91
|
%
|
0.77
|
%
|
|||||||||
|
1.46
|
%
|
1.61
|
%
|
1.23
|
%
|
0.91
|
%
|
0.76
|
%
|
|||||||||
|
23.45
|
%
|
64.26
|
%
|
41.52
|
%
|
37.63
|
%
|
38.93
|
%
|
|||||||||
The accompanying notes are an integral part of these financial statements.
51
Rockefeller Intermediate Tax Exempt New York Bond Fund
|
Financial Highlights
|
|
Six Months
|
||||
|
Ended
|
||||
|
May 31, 2021
|
||||
|
(Unaudited)
|
||||
|
Net Asset Value, Beginning of Period / Year
|
$
|
10.56
|
||
|
Income from investment operations:
|
||||
|
Net investment income(1)
|
0.06
|
|||
|
Net realized and unrealized gain (loss) on investments
|
0.08
|
|||
|
Total from investment operations
|
0.14
|
|||
|
Less distributions paid:
|
||||
|
From net investment income
|
(0.07
|
)
|
||
|
From net realized gain on investments
|
(0.05
|
)
|
||
|
Total distributions paid
|
(0.12
|
)
|
||
|
Net Asset Value, End of Period / Year
|
$
|
10.58
|
||
|
Total Return(2)
|
1.35
|
%
|
||
|
Supplemental Data and Ratios:
|
||||
|
Net assets at end of period / year (000’s)
|
$
|
49,072
|
||
|
Ratio of expenses to average net assets:
|
||||
|
Before waiver, expense recoupment(3)
|
0.78
|
%
|
||
|
After waiver, expense recoupment(3)
|
0.78
|
%
|
||
|
Ratio of net investment income to average net assets:
|
||||
|
Before waiver, expense recoupment(3)
|
1.21
|
%
|
||
|
After waiver, expense recoupment(3)
|
1.21
|
%
|
||
|
Portfolio turnover rate(2)
|
17.29
|
%
|
||
|
(1)
|
Per share net investment income has been calculated using the daily average share method.
|
|
(2)
|
Not annualized for periods less than one year.
|
|
(3)
|
Annualized for periods less than one year.
|
The accompanying notes are an integral part of these financial statements.
52
Per Share Data for a Share Outstanding Throughout the Period / Year
|
Year Ended
|
Year Ended
|
Year Ended
|
Year Ended
|
Year Ended
|
||||||||||||||
|
November 30,
|
November 30,
|
November 30,
|
November 30,
|
November 30,
|
||||||||||||||
|
2020
|
2019
|
2018
|
2017
|
2016
|
||||||||||||||
|
$
|
10.40
|
$
|
9.89
|
$
|
9.98
|
$
|
9.94
|
$
|
10.13
|
|||||||||
|
0.14
|
0.15
|
0.11
|
0.07
|
0.05
|
||||||||||||||
|
0.20
|
0.50
|
(0.10
|
)
|
0.16
|
(0.17
|
)
|
||||||||||||
|
0.34
|
0.65
|
0.01
|
0.23
|
(0.12
|
)
|
|||||||||||||
|
(0.14
|
)
|
(0.14
|
)
|
(0.10
|
)
|
(0.07
|
)
|
(0.05
|
)
|
|||||||||
|
(0.04
|
)
|
—
|
—
|
(0.12
|
)
|
(0.02
|
)
|
|||||||||||
|
(0.18
|
)
|
(0.14
|
)
|
(0.10
|
)
|
(0.19
|
)
|
(0.07
|
)
|
|||||||||
|
$
|
10.56
|
$
|
10.40
|
$
|
9.89
|
$
|
9.98
|
$
|
9.94
|
|||||||||
|
3.34
|
%
|
6.59
|
%
|
0.10
|
%
|
2.35
|
%
|
-1.10
|
%
|
|||||||||
|
$
|
48,940
|
$
|
50,053
|
$
|
45,068
|
$
|
37,044
|
$
|
37,742
|
|||||||||
|
0.77
|
%
|
0.73
|
%
|
0.76
|
%
|
0.82
|
%
|
0.77
|
%
|
|||||||||
|
0.77
|
%
|
0.73
|
%
|
0.76
|
%
|
0.85
|
%
|
0.85
|
%
|
|||||||||
|
1.35
|
%
|
1.41
|
%
|
1.07
|
%
|
0.78
|
%
|
0.62
|
%
|
|||||||||
|
1.35
|
%
|
1.41
|
%
|
1.07
|
%
|
0.75
|
%
|
0.54
|
%
|
|||||||||
|
18.47
|
%
|
69.23
|
%
|
36.05
|
%
|
34.50
|
%
|
59.79
|
%
|
|||||||||
The accompanying notes are an integral part of these financial statements.
53
Rockefeller Funds
Notes to Financial Statements
May 31, 2021 (Unaudited)
|
(1)
|
Organization
|
|
Trust for Professional Managers (the “Trust”) was organized as a Delaware statutory trust under a Declaration of Trust dated May 29, 2001. The Trust is registered under the Investment Company Act of 1940, as
amended (the “1940 Act”), as an open-end management investment company. The Rockefeller Funds (the “Funds”) are comprised of the Rockefeller Equity Allocation Fund, Rockefeller Core Taxable Bond Fund, and Rockefeller Intermediate Tax Exempt
National Bond Fund (each of which represents a distinct, diversified series with its own investment objective and policies within the Trust), and the Rockefeller Intermediate Tax Exempt New York Bond Fund (which represents a distinct,
non-diversified series with its own investment objective and policies within the Trust). The investment objective of the Rockefeller Equity Allocation Fund is to seek long-term total return from capital appreciation and income. The investment
objective of the Rockefeller Core Taxable Bond Fund is to generate current income consistent with the preservation of capital. The investment objective of the Rockefeller Intermediate Tax Exempt National Bond Fund is to generate current
income that is exempt from federal personal income tax consistent with the preservation of capital. The investment objective of the Rockefeller Intermediate Tax Exempt New York Bond Fund is to generate current income that is exempt from
federal, New York State and New York City personal income tax consistent with the preservation of capital. The Trust may issue an unlimited number of shares of beneficial interest at $0.001 par value. The Rockefeller Core Taxable Bond Fund,
Rockefeller Intermediate Tax Exempt National Bond Fund and Rockefeller Intermediate Tax Exempt New York Bond Fund commenced operations on December 26, 2013 for Institutional Class shares. The Rockefeller Equity Allocation Fund commenced
operations on February 4, 2015 for Institutional Class shares. Advisor Class shares of the Funds are authorized but are not currently offered for purchase. Costs incurred by the Funds in connection with the organization, registration and
initial public offering of shares were borne by the Adviser.
|
|
|
(2)
|
Significant Accounting Policies
|
|
The following is a summary of significant accounting policies consistently followed by the Funds in the preparation of the financial statements. These policies are in conformity with accounting principles
generally accepted in the United States of America (“GAAP”).
|
|
(a) Investment Valuation
|
|
|
Each equity security owned by the Funds that is listed on a securities exchange, except for securities listed on the NASDAQ Stock Market LLC (“NASDAQ”), is valued at its last sale price at the close of that
exchange on the date as of which assets are valued. If a security is listed on more than one exchange, the Funds will use the price on the exchange that the Funds generally consider to be the principal exchange on which the security is
traded.
|
|
|
Fund securities, including common stocks, preferred stocks and exchange traded funds, listed on NASDAQ will be valued at the NASDAQ Official Closing Price, which may not necessarily represent the last sale
price. If, on a particular day, an exchange-listed or NASDAQ security does not trade, then: (i) the security is valued at the mean between the most recent quoted bid and asked prices at the close of the
|
54
Rockefeller Funds
Notes to Financial Statements (Continued)
May 31, 2021 (Unaudited)
|
exchange on such day; or (ii) the security is valued at the latest sales price on the Composite Market for the day such security is being valued. “Composite Market” means a consolidation of the trade
information provided by national securities and foreign exchanges and the over-the-counter markets as published by an approved independent pricing service (“Pricing Service”).
|
|
|
Foreign securities will be priced in their local currencies as of the close of their primary exchange or market or as of the time the Fund calculates its NAV, whichever is earlier. Foreign securities,
currencies and other assets denominated in foreign currencies are then translated into U.S. dollars at the exchange rate of such currencies against the U.S. dollar using the applicable currency exchange rates as of the close of the New York
Stock Exchange (“NYSE”), generally 4:00 p.m. Eastern Time.
|
|
|
Foreign securities are traded on foreign exchanges which typically close before the close of business on each day on which the NYSE is open. Each security trading on these exchanges may be valued utilizing a
systematic fair valuation model provided by a pricing service. The valuation of each security that meets certain criteria in relation to the valuation model is systematically adjusted to reflect the impact of movement in the U.S. market after
the foreign markets close and are classified as Level 2 securities. Securities that do not meet the criteria, or that are principally traded in other foreign markets, are valued as of the last reported sale price at the time the respective
Fund determines its NAV, or when reliable market prices or quotations are not readily available, at the mean between the most recent bid and asked quotations as of the close of the appropriate exchange or other designated time.
|
|
|
Debt securities, including short-term debt instruments having a maturity of 60 days or less, are generally valued at the mean in accordance with prices provided by a Pricing Service. Pricing Services may use
various valuation methodologies such as the mean between the bid and the asked prices, matrix pricing and other analytical pricing models as well as market transactions and dealer quotations. If a price is not available from a Pricing
Service, the most recent quotation obtained from one or more broker-dealers known to follow the issue will be obtained. Quotations will be valued at the mean between the bid and the offer. In the absence of available quotations, the
securities will be priced at fair value in accordance with the procedures approved by the Board of Trustees.
|
|
|
Municipal bonds are priced by a Pricing Service. A discounted cash flow methodology is employed using a benchmark yield and estimated cash flows for each bond, as well as an estimated discount for liquidity.
Additional inputs such as calls of bond principal by the issuer are considered in the estimate of fair value. To the extent the inputs are based on observable inputs, municipal bonds would be categorized in Level 2 of the fair value
hierarchy; otherwise, they would be generally categorized as Level 3.
|
|
|
U.S. government notes/bonds are normally valued by a Pricing Service using a model that incorporates market observable data such as reported sales of similar securities, broker quotes, yields, bids, offers, and
reference data. Certain securities are valued principally using dealer quotations. U.S. government notes/bonds are typically categorized in Level 2 of the fair value hierarchy.
|
55
Rockefeller Funds
Notes to Financial Statements (Continued)
May 31, 2021 (Unaudited)
|
When market quotations are not readily available, any security or other financial instrument is valued at its fair value as determined under procedures approved by the Trust’s Board of Trustees. These fair
value procedures will also be used to price a security when corporate events, events in the securities market and/or world events cause the Adviser to believe that a security’s last sale price may not reflect its actual fair market value.
The intended effect of using fair value pricing procedures is to ensure that the Funds are accurately priced. The Board of Trustees will regularly evaluate whether the Funds’ fair value pricing procedures continue to be appropriate in light
of the specific circumstances of the Funds and the quality of prices obtained by the Trust’s Valuation Committee.
|
|
|
The Funds have adopted Statement of Financial Accounting Standards, “Fair Value Measurements and Disclosures,” which requires the Funds to classify their securities based on a valuation method. These inputs are
summarized in the three broad levels listed below:
|
|
Level 1—
|
Quoted prices in active markets for identical securities.
|
|
|
Level 2—
|
Other significant observable inputs (including quoted prices for similar securities, interest rates, prepayment speeds, credit risk, etc.).
|
|
|
Level 3—
|
Significant unobservable inputs (including the Funds’ own assumptions in determining the fair value of investments).
|
|
The inputs or methodology used for valuing securities are not necessarily an indication of the risk associated with investing in those securities. The following is a summary of the inputs used to value the
Funds’ investments carried at fair value as of May 31, 2021:
|
|
Rockefeller Equity Allocation Fund
|
|||||||||||||||||
|
Level 1
|
Level 2
|
Level 3
|
Total
|
||||||||||||||
|
Assets:
|
|||||||||||||||||
|
Equities:
|
|||||||||||||||||
|
Common Stock
|
$
|
46,749,512
|
$
|
32,998,469
|
$
|
—
|
$
|
79,747,981
|
|||||||||
|
Preferred Stock
|
123,867
|
196,739
|
—
|
320,606
|
|||||||||||||
|
Real Estate Investment Trusts
|
1,041,170
|
952,178
|
—
|
1,993,348
|
|||||||||||||
|
Total Equity Securities
|
47,914,549
|
34,147,386
|
—
|
82,061,935
|
|||||||||||||
|
Exchange Traded Funds
|
1,531,911
|
—
|
—
|
1,531,911
|
|||||||||||||
|
Money Market Fund
|
441,406
|
—
|
—
|
441,406
|
|||||||||||||
|
Total Investments in Securities
|
$
|
49,887,866
|
$
|
34,147,386
|
$
|
—
|
$
|
84,035,252
|
|||||||||
56
Rockefeller Funds
Notes to Financial Statements (Continued)
May 31, 2021 (Unaudited)
|
Rockefeller Core Taxable Bond Fund
|
|||||||||||||||||
|
Level 1
|
Level 2
|
Level 3
|
Total
|
||||||||||||||
|
Assets:
|
|||||||||||||||||
|
Fixed Income Securities:
|
|||||||||||||||||
|
Asset-Backed Securities
|
$
|
—
|
$
|
3,384,104
|
$
|
—
|
$
|
3,384,104
|
|||||||||
|
Corporate Bonds
|
—
|
17,350,196
|
—
|
17,350,196
|
|||||||||||||
|
Mortgage Backed Securities
|
—
|
13,304,167
|
—
|
13,304,167
|
|||||||||||||
|
Municipal Bonds
|
—
|
13,858,748
|
—
|
13,858,748
|
|||||||||||||
|
U.S. Government Agency Issue
|
—
|
5,624,201
|
—
|
5,624,201
|
|||||||||||||
|
U.S. Government Note/Bond
|
—
|
14,237,693
|
—
|
14,237,693
|
|||||||||||||
|
Total Fixed Income Securities
|
—
|
67,759,109
|
—
|
67,759,109
|
|||||||||||||
|
Exchange Traded Funds
|
2,335,395
|
—
|
—
|
2,335,395
|
|||||||||||||
|
Money Market Fund
|
341,633
|
—
|
—
|
341,633
|
|||||||||||||
|
Total Investments in Securities
|
$
|
2,677,028
|
$
|
67,759,109
|
$
|
—
|
$
|
70,436,137
|
|||||||||
|
Rockefeller Intermediate Tax Exempt National Bond Fund
|
|||||||||||||||||
|
Level 1
|
Level 2
|
Level 3
|
Total
|
||||||||||||||
|
Assets:
|
|||||||||||||||||
|
Fixed Income Securities:
|
|||||||||||||||||
|
Municipal Bonds
|
$
|
—
|
$
|
92,883,058
|
$
|
—
|
$
|
92,883,058
|
|||||||||
|
Total Fixed Income Securities
|
—
|
92,883,058
|
—
|
92,883,058
|
|||||||||||||
|
Money Market Fund
|
615,735
|
—
|
—
|
615,735
|
|||||||||||||
|
Total Investments in Securities
|
$
|
615,735
|
$
|
92,883,058
|
$
|
—
|
$
|
93,498,793
|
|||||||||
|
Rockefeller Intermediate Tax Exempt New York Bond Fund
|
|||||||||||||||||
|
Level 1
|
Level 2
|
Level 3
|
Total
|
||||||||||||||
|
Assets:
|
|||||||||||||||||
|
Fixed Income Securities:
|
|||||||||||||||||
|
Municipal Bonds
|
$
|
—
|
$
|
48,466,279
|
$
|
—
|
$
|
48,466,279
|
|||||||||
|
Total Fixed Income Securities
|
—
|
48,466,279
|
—
|
48,466,279
|
|||||||||||||
|
Money Market Funds
|
190,341
|
—
|
—
|
190,341
|
|||||||||||||
|
Total Investments in Securities
|
$
|
190,341
|
$
|
48,466,279
|
$
|
—
|
$
|
48,656,620
|
|||||||||
|
The Funds held no Level 3 securities during the six months ended May 31, 2021. The Funds measure Level 3 activity as of the beginning and end of the six months. For the six months ended May 31, 2021, the
Funds did not have any significant unobservable inputs (Level 3 securities) used in determining fair value. Therefore, a reconciliation of assets in which significant unobservable inputs (Level 3) were used in determining fair value is not
applicable.
|
|
|
(b) Federal Income Taxes
|
|
|
The Funds comply with the requirements of Subchapter M of the Internal Revenue Code of 1986, as amended the (“Code”), necessary to qualify as regulated investment companies and make the requisite distributions
of income and capital gains to their shareholders sufficient to relieve them from all or substantially all federal income taxes. Therefore, no federal income tax provision has been provided.
|
57
Rockefeller Funds
Notes to Financial Statements (Continued)
May 31, 2021 (Unaudited)
|
(c) Distributions to Shareholders
|
|
|
The Funds will distribute net investment income and net capital gains, if any, at least annually. Distributions from net realized gains for book purposes may include short-term capital gains. All short-term
capital gains are included in ordinary income for tax purposes. Distributions to shareholders are recorded on the ex-dividend date. The Funds may make additional distributions if deemed to be desirable at another time during the year.
|
|
|
The amounts of dividends from net investment income and distributions from net realized gains are determined in accordance with federal income tax regulations, which may differ from GAAP. These differences are
either temporary or permanent in nature. To the extent these differences are permanent in nature, such amounts are reclassified within the composition of net assets based on their federal tax-basis treatment.
|
|
|
(d) Use of Estimates
|
|
|
The preparation of financial statements in conformity with GAAP requires management to make estimates and assumptions that affect the reported amounts of assets and liabilities and disclosure of contingent
assets and liabilities at the date of the financial statements and the reported amounts of revenues and expenses during the reporting period. Actual results could differ from those estimates.
|
|
|
(e) Share Valuation
|
|
|
The NAV per share of each Fund is calculated by dividing the sum of the value of the securities held by each Fund, plus cash or other assets, minus all liabilities (including estimated accrued expenses) by the
total number of shares outstanding for each Fund, rounded to the nearest cent. The Funds’ shares will not be priced on the days on which the NYSE is closed for trading. The offering and redemption price per share for each Fund is equal to
each Fund’s NAV per share
|
|
|
.
|
|
|
(f) Expenses
|
|
|
Expenses associated with a specific fund in the Trust are charged to that fund. Expenses are recognized on an accrual basis. Common expenses are typically allocated evenly between the series of the Trust, or
by other equitable means.
|
|
|
(g) Other
|
|
|
Investment transactions are recorded on the trade date. The Funds determine the gain or loss from investment transactions on a high amortized cost basis. Dividend income is recognized on the ex-dividend date
and interest income is recognized on an accrual basis. Distributions received from the Funds’ investments in REITs are comprised of ordinary income, capital gains and return of capital, as applicable. For financial statement purposes, the
Funds use estimates to characterize these distributions received as return of capital, capital gain or ordinary income. Such estimates are based on historical information available from each REIT and other industry sources. These estimates
may subsequently be revised based on information received for the security after the tax reporting periods are concluded, as the actual character of these distributions is not known until after the fiscal year end of the Funds. Changes to
estimates will be recorded in the period they are known. The distributions received from REIT securities that have been classified as income and
|
58
Rockefeller Funds
Notes to Financial Statements (Continued)
May 31, 2021 (Unaudited)
|
capital gains are included in dividend income and net realized gain on investments, respectively, on the Statement of Operations. The distributions received that are classified as return of capital reduced the
cost of investments on the Statement of Assets and Liabilities. Any discount or premium is accreted or amortized using the constant yield method until maturity, or where applicable, the first call date of the security. Constant yield
amortization takes into account the income that is produced on a debt security. This accretion/amortization type utilizes the discount rate used in computing the present value of all future principal and interest payments made by a debt
instrument and produces an amount equal to the cost of the debt instrument.
|
|
|
(3)
|
Federal Tax Matters
|
|
The tax character of distributions paid during the year ended November 30, 2020 was as follows:
|
|
Rockefeller
|
Rockefeller
|
||||||||||||||||
|
Rockefeller
|
Intermediate
|
Intermediate
|
|||||||||||||||
|
Equity
|
Rockefeller
|
Tax Exempt
|
Tax Exempt
|
||||||||||||||
|
Allocation
|
Core Taxable
|
National
|
New York
|
||||||||||||||
|
Distributions paid from:
|
Fund
|
Bond Fund
|
Bond Fund
|
Bond Fund
|
|||||||||||||
|
Ordinary Income
|
$
|
569,911
|
$
|
1,552,674
|
$
|
307,360
|
$
|
121,181
|
|||||||||
|
Tax-Exempt Income
|
—
|
—
|
1,523,143
|
692,065
|
|||||||||||||
|
Long Term Capital Gain
|
2,814,093
|
—
|
325,139
|
78,080
|
|||||||||||||
|
Total Distributions Paid
|
$
|
3,384,004
|
$
|
1,552,674
|
$
|
2,155,642
|
$
|
891,326
|
|||||||||
|
As of November 30, 2020, the components of accumulated earnings (losses) for income tax purposes were as follows:
|
|
Rockefeller
|
Rockefeller
|
||||||||||||||||
|
Rockefeller
|
Intermediate
|
Intermediate
|
|||||||||||||||
|
Equity
|
Rockefeller
|
Tax Exempt
|
Tax Exempt
|
||||||||||||||
|
Allocation
|
Core Taxable
|
National
|
New York
|
||||||||||||||
|
Fund
|
Bond Fund
|
Bond Fund
|
Bond Fund
|
||||||||||||||
|
Cost basis of investments for
|
|||||||||||||||||
|
federal income tax purposes
|
$
|
63,999,634
|
$
|
68,166,202
|
$
|
100,836,915
|
$
|
46,458,273
|
|||||||||
|
Gross tax unrealized appreciation
|
23,586,024
|
5,102,473
|
5,695,486
|
2,207,328
|
|||||||||||||
|
Gross tax unrealized depreciation
|
(3,001,266
|
)
|
400,716
|
(21,834
|
)
|
(118,320
|
)
|
||||||||||
|
Net tax unrealized appreciation
|
20,584,758
|
5,503,189
|
5,673,652
|
2,089,008
|
|||||||||||||
|
Undistributed ordinary income
|
—
|
248,070
|
77,838
|
84,375
|
|||||||||||||
|
Undistributed tax-exempt
|
|||||||||||||||||
|
ordinary income
|
—
|
—
|
292,130
|
125,194
|
|||||||||||||
|
Undistributed long-term gains
|
3,098,417
|
—
|
585,136
|
164,301
|
|||||||||||||
|
Total distributable earnings
|
3,098,417
|
248,070
|
955,104
|
373,870
|
|||||||||||||
|
Total other accumulated
|
|||||||||||||||||
|
gain/(loss)
|
—
|
(114,893
|
)
|
(1
|
)
|
—
|
|||||||||||
|
Total accumulated gains
|
$
|
23,683,175
|
$
|
5,636,366
|
$
|
6,628,755
|
$
|
2,462,878
|
|||||||||
|
The difference between book-basis and tax-basis unrealized appreciation is attributable primarily to the tax deferral of losses on wash sales and Passive Foreign Investment Company adjustments.
|
59
Rockefeller Funds
Notes to Financial Statements (Continued)
May 31, 2021 (Unaudited)
|
At November 30, 2020, the Rockefeller Core Taxable Bond Fund had capital losses of $114,893 remaining which will be carried forward indefinitely to offset future realized capital gains. To the extent the
Rockefeller Core Taxable Bond Fund realizes future net capital gains, taxable distributions to its shareholders will be first offset by any unused capital loss carryovers from the year ended November 30, 2020.
|
|
|
The Funds had no material uncertain tax positions and have not recorded a liability for unrecognized tax benefits as of November 30, 2020. Also, the Funds had recognized no interest and penalties related to
uncertain tax benefits in the fiscal year 2020. As of November 30, 2020, the tax years 2017, 2018, 2019 and 2020 remain open to examination for the Funds.
|
|
|
(4)
|
Investment Adviser
|
|
The Trust has an Investment Advisory Agreement (the “Agreement”) with the Adviser to furnish investment advisory services to the Funds. Under the terms of the Agreement, the Funds compensate the Adviser for its
management services at the annual rates of 0.85%, 0.35%, 0.35% and 0.35% of the average daily net assets of the Rockefeller Equity Allocation Fund, Rockefeller Core Taxable Bond Fund, Rockefeller Intermediate Tax Exempt National Bond Fund and
Rockefeller Intermediate Tax Exempt New York Bond Fund, respectively.
|
|
|
The Adviser has contractually agreed to waive its management fee and/or reimburse each Fund’s other expenses through the expiration date listed below to the extent necessary to ensure that each Fund’s total
annual operating expenses do not exceed each Fund’s Expense Limitation Cap, listed below, of the Fund’s average daily net assets (the “Expense Cap Limitation”).
|
|
Expense
|
|||
|
Limitation Cap
|
|||
|
Institutional Class
|
Expiration Date
|
||
|
Rockefeller Equity Allocation Fund
|
1.25%
|
March 30, 2022
|
|
|
Rockefeller Core Taxable Bond Fund
|
0.85%
|
March 30, 2022
|
|
|
Rockefeller Intermediate Tax Exempt
|
|||
|
National Bond Fund
|
0.85%
|
March 30, 2022
|
|
|
Rockefeller Intermediate Tax Exempt
|
|||
|
New York Bond Fund
|
0.85%
|
March 30, 2022
|
|
Any such waiver or reimbursement is subject to later adjustment to allow the Adviser to recover amounts waived or reimbursed to the extent actual fees and expenses for a fiscal period do not exceed the lesser
of: (1) the Expense Limitation Cap in place at the time of the waiver and/or reimbursement; or (2) the Expense Limitation Cap in place at the time of recovery; provided, however, that the Adviser shall only be entitled to recover such amounts
for a period of up to three years from the date such amount was waived or reimbursed. During the six months ended May 31, 2021, the Funds did not waive any expenses.
|
|
|
The Funds currently do not have any expenses eligible for recoupment.
|
|
|
(5)
|
Related Party Transactions
|
|
U.S. Bancorp Fund Services, LLC, doing business as U.S. Bank Global Fund Services (“Fund Services” or the “Administrator”), acts as the Funds’ Administrator under an
|
60
Rockefeller Funds
Notes to Financial Statements (Continued)
May 31, 2021 (Unaudited)
|
Administration Agreement. The Administrator prepares various federal and state regulatory filings, reports and returns for the Funds; prepares reports and materials to be supplied to the Trustees; monitors the
activities of the Funds’ custodian, transfer agent and accountants; coordinates the preparation and payment of the Funds’ expenses; and reviews the Funds’ expense accruals. Fund Services also serves as the fund accountant and transfer agent
to the Funds. U.S. Bank National Association (“US Bank”), an affiliate of Fund Services, serves as each Fund’s custodian. The Trust’s Chief Compliance Officer is also an employee of Fund Services. Fees and expenses incurred for the six
months ended May 31, 2021, and owed as of May 31, 2021, were as follows:
|
|
Administration and Accounting
|
Incurred
|
Owed
|
|||||||
|
Rockefeller Equity Allocation Fund
|
$
|
69,679
|
$
|
43,854
|
|||||
|
Rockefeller Core Taxable Bond Fund
|
$
|
63,840
|
$
|
32,208
|
|||||
|
Rockefeller Intermediate Tax Exempt National Bond Fund
|
$
|
87,555
|
$
|
45,208
|
|||||
|
Rockefeller Intermediate Tax Exempt New York Bond Fund
|
$
|
45,200
|
$
|
22,301
|
|||||
|
Pricing
|
Incurred
|
Owed
|
|||||||
|
Rockefeller Equity Allocation Fund
|
$
|
8,878
|
$
|
4,613
|
|||||
|
Rockefeller Core Taxable Bond Fund
|
$
|
3,577
|
$
|
1,814
|
|||||
|
Rockefeller Intermediate Tax Exempt National Bond Fund
|
$
|
7,184
|
$
|
4,011
|
|||||
|
Rockefeller Intermediate Tax Exempt New York Bond Fund
|
$
|
4,937
|
$
|
2,755
|
|||||
|
Transfer Agency
|
Incurred
|
Owed
|
|||||||
|
Rockefeller Equity Allocation Fund
|
$
|
9,254
|
$
|
4,410
|
|||||
|
Rockefeller Core Taxable Bond Fund
|
$
|
9,230
|
$
|
4,499
|
|||||
|
Rockefeller Intermediate Tax Exempt National Bond Fund
|
$
|
10,160
|
$
|
4,991
|
|||||
|
Rockefeller Intermediate Tax Exempt New York Bond Fund
|
$
|
8,561
|
$
|
4,233
|
|||||
|
Custody
|
Incurred
|
Owed
|
|||||||
|
Rockefeller Equity Allocation Fund
|
$
|
26,925
|
$
|
8,104
|
|||||
|
Rockefeller Core Taxable Bond Fund
|
$
|
2,558
|
$
|
1,261
|
|||||
|
Rockefeller Intermediate Tax Exempt National Bond Fund
|
$
|
2,829
|
$
|
1,435
|
|||||
|
Rockefeller Intermediate Tax Exempt New York Bond Fund
|
$
|
2,121
|
$
|
982
|
|||||
|
CCO
|
Incurred
|
Owed
|
|||||||
|
Rockefeller Equity Allocation Fund
|
$
|
5,642
|
$
|
2,832
|
|||||
|
Rockefeller Core Taxable Bond Fund
|
$
|
5,642
|
$
|
2,830
|
|||||
|
Rockefeller Intermediate Tax Exempt National Bond Fund
|
$
|
5,642
|
$
|
2,830
|
|||||
|
Rockefeller Intermediate Tax Exempt New York Bond Fund
|
$
|
5,642
|
$
|
2,830
|
|||||
|
The Funds each have a line of credit with US Bank (see Note 7).
|
|
|
Certain officers of the Funds are also employees of Fund Services. A Trustee of the Trust is affiliated with Fund Services and US Bank.
|
|
Rockefeller Equity Allocation Fund
|
|||||||||
|
Six Months Ended
|
Year Ended
|
||||||||
|
May 31, 2021
|
November 30, 2020
|
||||||||
|
Shares Sold
|
64,553
|
906,492
|
|||||||
|
Shares Reinvested
|
85,569
|
114,116
|
|||||||
|
Shares Redeemed
|
(789,114
|
)
|
(3,505,732
|
)
|
|||||
|
Net Decrease
|
(638,992
|
)
|
(2,485,124
|
)
|
|||||
61
Rockefeller Funds
Notes to Financial Statements (Continued)
May 31, 2021 (Unaudited)
|
Rockefeller Core Taxable Bond Fund
|
|||||||||
|
Six Months Ended
|
Year Ended
|
||||||||
|
May 31, 2021
|
November 30, 2020
|
||||||||
|
Shares Sold
|
187,310
|
497,016
|
|||||||
|
Shares Reinvested
|
28,135
|
71,524
|
|||||||
|
Shares Redeemed
|
(291,898
|
)
|
(755,902
|
)
|
|||||
|
Net Decrease
|
(76,453
|
)
|
(187,362
|
)
|
|||||
|
Rockefeller Intermediate Tax Exempt National Bond Fund
|
|||||||||
|
Six Months Ended
|
Year Ended
|
||||||||
|
May 31, 2021
|
November 30, 2020
|
||||||||
|
Shares Sold
|
318,906
|
902,642
|
|||||||
|
Shares Reinvested
|
47,136
|
62,548
|
|||||||
|
Shares Redeemed
|
(1,352,186
|
)
|
(853,484
|
)
|
|||||
|
Net Increase/(Decrease)
|
(986,144
|
)
|
111,706
|
||||||
|
Rockefeller Intermediate Tax Exempt New York Bond Fund
|
|||||||||
|
Six Months Ended
|
Year Ended
|
||||||||
|
May 31, 2021
|
November 30, 2020
|
||||||||
|
Shares Sold
|
188,843
|
434,051
|
|||||||
|
Shares Reinvested
|
26,620
|
36,553
|
|||||||
|
Shares Redeemed
|
(211,926
|
)
|
(646,933
|
)
|
|||||
|
Net Increase/(Decrease)
|
3,537
|
(176,329
|
)
|
||||||
|
(6)
|
Investment Transactions
|
|
The aggregate securities transactions, excluding short-term investments, for the Funds for the six months ended May 31, 2021 are listed below.
|
|
U.S.
|
U.S.
|
||||||||||||||||
|
Government
|
Government
|
||||||||||||||||
|
Securities
|
Securities
|
||||||||||||||||
|
Purchases
|
Sales
|
Purchases
|
Sales
|
||||||||||||||
|
Rockefeller Equity
|
|||||||||||||||||
|
Allocation Fund
|
$
|
20,684,246
|
$
|
32,688,615
|
$
|
—
|
$
|
—
|
|||||||||
|
Rockefeller Core
|
|||||||||||||||||
|
Taxable Bond Fund
|
$
|
16,635,295
|
$
|
18,169,686
|
$
|
5,245,844
|
$
|
4,321,983
|
|||||||||
|
Rockefeller Intermediate Tax
|
|||||||||||||||||
|
Exempt National Bond Fund
|
$
|
13,986,293
|
$
|
24,216,767
|
$
|
—
|
$
|
—
|
|||||||||
|
Rockefeller Intermediate Tax
|
|||||||||||||||||
|
Exempt New York Bond Fund
|
$
|
8,573,903
|
$
|
8,402,199
|
$
|
—
|
$
|
—
|
|||||||||
|
(7)
|
Line of Credit
|
|
As of May 31, 2021, the Rockefeller Equity Allocation Fund, Rockefeller Core Taxable Bond Fund, Rockefeller Intermediate Tax Exempt National Bond Fund, and Rockefeller Intermediate Tax Exempt New York Bond Fund
each had a line of credit in the amount of $10,000,000, $8,000,000, $8,500,000, and $4,000,000, respectively,
|
62
Rockefeller Funds
Notes to Financial Statements (Continued)
May 31, 2021 (Unaudited)
|
which all mature on August 7, 2021. These secured lines of credit are intended to provide short-term financing, if necessary, and subject to certain restrictions, in connection with shareholder redemptions. The
credit facility is with the Funds’ custodian, US Bank. Interest was accrued at the prime rate of 3.25%. The following table summarizes the line of credit activity for the Rockefeller Equity Allocation Fund and Rockefeller Intermediate Tax
Exempt New York Bond Fund during the six months ended May 31, 2021. The Rockefeller Core Taxable Bond Fund and Rockefeller Intermediate Tax Exempt National Bond Fund did not utilize their line of credit during the six months ended May 31,
2021. The Funds did not have any loans outstanding as of May 31, 2021.
|
|
Average
|
Maximum
|
Date of
|
||||||||||||||||
|
Days
|
Amount of
|
Interest
|
Amount of
|
Maximum
|
||||||||||||||
|
Utilized
|
Borrowing
|
Expense*
|
Borrowing
|
Borrowing
|
||||||||||||||
|
Rockefeller Equity
|
||||||||||||||||||
|
Allocation Fund
|
1
|
$
|
263,000
|
$
|
24
|
$
|
263,000
|
12/30/20
|
||||||||||
|
Rockefeller Intermediate
|
||||||||||||||||||
|
Tax Exempt New York
|
||||||||||||||||||
|
Bond Fund
|
1
|
$
|
1,251,000
|
$
|
113
|
$
|
1,251,000
|
12/8/20
|
||||||||||
|
* Interest Expense is included with “Other expenses” on the Statements of Operations.
|
|
|
(8)
|
Recent Market Events
|
|
U.S. and international markets have experienced significant periods of volatility in recent months and years due to a number of economic, political and global macro factors including the impact of the novel
coronavirus (COVID-19) as a global pandemic, which has resulted in related public health issues, business interruptions, growth concerns in the U.S. and overseas, temporary and permanent layoffs in the private sector, rising unemployment
claims, and reduced consumer spending, all of which may lead to a substantial economic downturn or recession in the U.S. and global economies. The recovery from the effects of COVID-19 is uncertain and may last for an extended period of
time. These developments as well as other events could result in further market volatility and negatively affect financial asset prices, the liquidity of certain securities and the normal operations of securities exchanges and other markets.
As a result, the risk environment remains elevated. The Adviser will monitor developments and seek to manage each Fund in a manner consistent with achieving the Fund’s investment objective, but there can be no assurance that it will be
successful in doing so.
|
|
|
(9)
|
LIBOR
|
|
The London Interbank Offered Rate (“LIBOR”) is an interest-rate average calculated from estimates submitted by the leading banks in London. LIBOR represents the rate which banks may obtain short-term borrowings
from each other. It is the primary interest rate benchmark for short-term interest rates around the world. Plans are underway to phase out the use of LIBOR between December 31, 2021 and June 30, 2023. As a result, it is possible that
commencing in 2022, LIBOR may no longer be available or no longer deemed an appropriate reference rate upon which to determine
|
63
Rockefeller Funds
Notes to Financial Statements (Continued)
May 31, 2021 (Unaudited)
|
the interest rate on certain investments of the Funds. The expected discontinuation of LIBOR could have a significant impact on the financial markets, and may present a risk for certain market participants,
including the risk that the transition from LIBOR to alternative interest rate benchmarks will not be orderly, will occur over various time periods or will have unintended consequences.
|
|
|
(10)
|
Subsequent Events
|
|
The Funds have evaluated events and transactions that have occurred subsequent to May 31, 2021 and determined there were no subsequent events that would require recognition or disclosure within the financial
statements other than as described below.
|
|
|
On June 22, 2021, the Funds declared and paid distributions from ordinary income to shareholders of record as of June 21, 2021, as follows:
|
|
Ordinary Income
|
||
|
Rockefeller Equity Allocation Fund
|
$313,817
|
|
|
Rockefeller Core Taxable Bond Fund
|
$269,521
|
|
|
Rockefeller Intermediate Tax Exempt National Bond Fund
|
$309,773
|
|
|
Rockefeller Intermediate Tax Exempt New York Bond Fund
|
$139,012
|
|
On June 30, 2021, Foreside Financial Group, LLC (“Foreside”), the ultimate parent company of Quasar Distributors, LLC (“Quasar”), the Fund’s distributor, and Lovell Minnick Partners, LLC (“LMP”) announced they
had entered into a definitive purchase and sale agreement with Genstar Capital (“Genstar”), a private equity firm specializing in financial and related business services companies. Genstar will acquire a majority stake in Foreside, and LMP
will exit its investment in Foreside. The transaction is anticipated to close, subject to any necessary governmental and regulatory approvals, in the third quarter of 2021. Quasar will remain the Funds’ distributor at the close of the
transaction, subject to Board approval.
|
64
Rockefeller Funds
Statement Regarding Liquidity Risk Management
(Unaudited)
In accordance with Rule 22e-4 under the Investment Company Act of 1940, as amended, Trust for Professional Managers (the “Trust”) has adopted and implemented a liquidity risk management program (the “Trust Program”).
As required under the Trust Program, Rockefeller & Co. LLC (“Rockefeller”), the investment adviser to the Rockefeller Core Taxable Bond Fund, Rockefeller Equity Allocation Fund, Rockefeller Intermediate Tax Exempt National Bond Fund and
Rockefeller Intermediate Tax Exempt New York Bond Fund (the “Funds”), each a series of the Trust, have adopted and implemented a liquidity risk management program tailored specifically to each Fund (the “Adviser Program”). The Adviser Program seeks
to promote effective liquidity risk management for each Fund and to protect Fund shareholders from dilution of their interests. The Board of Trustees (the “Board”) of the Trust has approved Rockefeller as the administrator for the Adviser Program
(the “Program Administrator”). The Program Administrator has further delegated administration of the Adviser Program to its Portfolio Analytics Group. The Program Administrator is required to provide a written annual report to the Board and the
Trust’s Chief Compliance Officer regarding the adequacy and effectiveness of the Adviser Program, including the operation of each Fund’s highly liquid investment minimum, if applicable, and any material changes to the Adviser Program.
On April 15, 2021, the Board reviewed the Program Administrator’s written annual report for the period July 1, 2020 through December 31, 2021 (the “Report”). The Report provided an assessment of each Fund’s liquidity
risk: the risk that a Fund could not meet requests to redeem shares issued by a Fund without significant dilution of the remaining investors’ interests in the Fund. The Adviser Program assesses liquidity risk under both normal and reasonably
foreseeable stressed market conditions. The Program Administrator has retained ICE Data Services, Inc., a third party vendor, to provide portfolio investment classification services, and the Report noted that the Funds primarily held investments that
were classified as highly liquid during the review period. The Report noted that the Funds’ portfolios are expected to continue to primarily hold highly liquid investments and the determination that the each Fund be designated as a “primarily highly
liquid fund” (as defined in Rule 22e-4) remains appropriate and the Funds can therefore continue to rely on the exclusion in Rule 22e-4 from the requirements to determine and review a highly liquid investment minimum for a Fund’s and to adopt
policies and procedures for responding to a highly liquid investment minimum shortfall. The Report noted that there were no breaches of the Funds’ restriction on holding illiquid investments exceeding 15% of its net assets during the review period.
The Report confirmed that each Fund’s investment strategy was appropriate for an open-end management investment company. The Report also indicated that no material changes had been made to the Adviser Program during the review period.
The Program Administrator determined that the Funds are reasonably likely to be able to meet redemption requests without adversely affecting non-redeeming Fund shareholders through significant dilution. The Program
Administrator concluded that the Adviser Program was adequately designed and effectively implemented during the review period.
65
Rockefeller Funds
Notice of Privacy Policy & Practices
We collect non-public personal information about you from the following sources:
|
•
|
information we receive about you on applications or other forms;
|
|
•
|
information you give us orally; and
|
|
•
|
information about your transactions with us or others.
|
We do not disclose any non-public personal information about our shareholders or former shareholders without the shareholder’s authorization, except as permitted by law or in response to inquiries from governmental
authorities. We may share information with affiliated parties and unaffiliated third parties with whom we have contracts for servicing the Funds. We will provide unaffiliated third parties with only the information necessary to carry out their
assigned responsibility. All shareholder records will be disposed of in accordance with applicable law. We maintain physical, electronic and procedural safeguards to protect your non-public personal information and require third parties to treat
your non-public personal information with the same high degree of confidentiality.
In the event that you hold shares of the Funds through a financial intermediary, including, but not limited to, a broker-dealer, bank or trust company, the privacy policy of your financial intermediary would govern how
your non-public personal information would be shared with unaffiliated third parties.
66
Rockefeller Funds
Additional Information
(Unaudited)
Tax Information
For the year ended November 30, 2020, certain dividends paid by the Funds may be subject to a maximum tax rate of 23.8%, as provided for by the Jobs and Growth Tax Relief Reconciliation Act of 2003. The percentage of
dividends declared from ordinary income designated as qualified dividend income was as follows:
|
Rockefeller Equity Allocation Fund
|
100.00
|
%
|
||
|
Rockefeller Core Taxable Bond Fund
|
0.00
|
%
|
||
|
Rockefeller Intermediate Tax Exempt National Bond Fund
|
0.00
|
%
|
||
|
Rockefeller Intermediate Tax Exempt New York Bond Fund
|
0.00
|
%
|
For corporate shareholders, the percentage of ordinary income distributions qualifying for the corporate dividends received deduction for the year ended November 30, 2020 was as follows:
|
Rockefeller Equity Allocation Fund
|
79.79
|
%
|
||
|
Rockefeller Core Taxable Bond Fund
|
0.00
|
%
|
||
|
Rockefeller Intermediate Tax Exempt National Bond Fund
|
0.00
|
%
|
||
|
Rockefeller Intermediate Tax Exempt New York Bond Fund
|
0.00
|
%
|
For the year ended November 30, 2020, the percentage of taxable ordinary income distributions designated as short-term capital gain distributions under Section 871(k)(2)(c) of the Code for the Funds was as follows:
|
Rockefeller Equity Allocation Fund
|
0.00
|
%
|
||
|
Rockefeller Core Taxable Bond Fund
|
0.00
|
%
|
||
|
Rockefeller Intermediate Tax Exempt National Bond Fund
|
97.04
|
%
|
||
|
Rockefeller Intermediate Tax Exempt New York Bond Fund
|
98.66
|
%
|
Foreign Tax Credit Pass Through
Pursuant to Section 853 of the Code, the Rockefeller Equity Allocation Fund designated the following amounts as foreign taxes paid for the year ended November 30, 2020. Foreign taxes paid for purposes of Section 853
may be less than actual foreign taxes paid for financial statement purposes.
|
Distribution Derived
|
|||
|
Creditable Foreign
|
Per Share
|
From Foreign
|
|
|
Tax Credit Paid
|
Amount
|
Sourced Income
|
|
|
Rockefeller Equity Allocation
|
142,574
|
0.021876819
|
71.62%
|
Foreign taxes paid or withheld should be included in taxable income with an offsetting deduction from gross income or as a credit for taxes paid to foreign governments.
Above figures may differ from those cited elsewhere in this report due to differences in the calculation of income and gains for GAAP purposes and Internal Revenue Service purposes.
Shareholders are strongly advised to consult their own tax advisers with respect to the tax consequences of their investments in the Funds.
67
Rockefeller Funds
Additional Information (Continued)
(Unaudited)
Indemnifications
Under the Trust’s organizational documents, its officers and Trustees are indemnified against certain liabilities arising out of the performance of their duties to the Funds. In addition, in the normal course of
business, the Funds enter into contracts that provide general indemnifications to other parties. The Funds’ maximum exposure under these arrangements is unknown as this would involve future claims that may be made against the Funds that have not yet
occurred. However, the Funds have not had prior claims or losses pursuant to these contracts and expect the risk of loss to be remote.
Information about Trustees
The business and affairs of the Trust are managed under the direction of the Board of Trustees. Information pertaining to the Trustees of the Trust is set forth below. The Statement of Additional Information includes
additional information about the Trustees and is available, without charge, upon request by calling 855-369-6209.
|
Other
|
|||||
|
Directorships
|
|||||
|
Term of
|
Number of
|
Principal
|
Held by
|
||
|
Office and
|
Portfolios
|
Occupation(s)
|
Trustee
|
||
|
Position(s)
|
Length
|
in Trust
|
During the
|
During the
|
|
|
Name, Address
|
Held with
|
of Time
|
Overseen
|
Past Five
|
Past Five
|
|
and Year of Birth
|
the Trust
|
Served
|
by Trustee
|
Years
|
Years
|
|
Independent Trustees
|
|||||
|
Michael D. Akers, Ph.D.
|
Trustee
|
Indefinite
|
22
|
Professor Emeritus
|
Trustee, Buffalo
|
|
615 E. Michigan St.
|
Term; Since
|
Department of
|
Funds
|
||
|
Milwaukee, WI 53202
|
August 22,
|
Accounting
|
an open-end
|
||
|
Year of Birth: 1955
|
2001
|
(June 2019–
|
investment
|
||
|
present), Professor,
|
company
|
||||
|
Department of
|
(2003–2017);
|
||||
|
Accounting
|
Independent
|
||||
|
(2004–May 2019),
|
Trustee, USA
|
||||
|
Chair, Department
|
MUTUALS
|
||||
|
of Accounting
|
(an open-end
|
||||
|
(2004–2017),
|
investment
|
||||
|
Marquette University.
|
company with
|
||||
|
two portfolios).
|
|||||
|
Gary A. Drska
|
Trustee
|
Indefinite
|
22
|
Pilot,
|
Independent
|
|
615 E. Michigan St.
|
Term; Since
|
Frontier/Midwest
|
Trustee, USA
|
||
|
Milwaukee, WI 53202
|
August 22,
|
Airlines, Inc.
|
MUTUALS
|
||
|
Year of Birth: 1956
|
2001
|
(airline company)
|
(an open-end
|
||
|
(1986–present).
|
investment
|
||||
|
company with
|
|||||
|
two portfolios).
|
68
Rockefeller Funds
Additional Information (Continued)
(Unaudited)
|
Other
|
|||||
|
Directorships
|
|||||
|
Term of
|
Number of
|
Principal
|
Held by
|
||
|
Office and
|
Portfolios
|
Occupation(s)
|
Trustee
|
||
|
Position(s)
|
Length
|
in Trust
|
During the
|
During the
|
|
|
Name, Address
|
Held with
|
of Time
|
Overseen
|
Past Five
|
Past Five
|
|
and Year of Birth
|
the Trust
|
Served
|
by Trustee
|
Years
|
Years
|
|
Interested Trustee and Officers
|
|||||
|
Joseph C. Neuberger*
|
Chairperson
|
Indefinite
|
22
|
President
|
Trustee, Buffalo
|
|
615 E. Michigan St.
|
and
|
Term; Since
|
(2017–present),
|
Funds (an
|
|
|
Milwaukee, WI 53202
|
Trustee
|
August 22,
|
Chief Operating
|
open-end
|
|
|
Year of Birth: 1962
|
2001
|
Officer (2016–
|
investment
|
||
|
2020), Executive
|
company)
|
||||
|
Vice President,
|
(2003–2017);
|
||||
|
(1994–2017),
|
Trustee, USA
|
||||
|
U.S. Bancorp
|
MUTUALS
|
||||
|
Fund Services,
|
(an open-end
|
||||
|
LLC.
|
investment
|
||||
|
company)
|
|||||
|
(2001–2018).
|
|||||
|
John P. Buckel
|
President
|
Indefinite
|
N/A
|
Vice President,
|
N/A
|
|
615 E. Michigan St.
|
and
|
Term; Since
|
U.S. Bancorp Fund
|
||
|
Milwaukee, WI 53202
|
Principal
|
January 24,
|
Services, LLC
|
||
|
Year of Birth: 1957
|
Executive
|
2013
|
(2004–present).
|
||
|
Officer
|
|||||
|
Jennifer A. Lima
|
Vice
|
Indefinite
|
N/A
|
Vice President,
|
N/A
|
|
615 E. Michigan St.
|
President,
|
Term; Since
|
U.S. Bancorp Fund
|
||
|
Milwaukee, WI 53202
|
Treasurer
|
January 24,
|
Services, LLC
|
||
|
Year of Birth: 1974
|
and
|
2013
|
(2002–present).
|
||
|
Principal
|
|||||
|
Financial
|
|||||
|
and
|
|||||
|
Accounting
|
|||||
|
Officer
|
69
Rockefeller Funds
Additional Information (Continued)
(Unaudited)
|
Other
|
|||||
|
Directorships
|
|||||
|
Term of
|
Number of
|
Principal
|
Held by
|
||
|
Office and
|
Portfolios
|
Occupation(s)
|
Trustee
|
||
|
Position(s)
|
Length
|
in Trust
|
During the
|
During the
|
|
|
Name, Address
|
Held with
|
of Time
|
Overseen
|
Past Five
|
Past Five
|
|
and Year of Birth
|
the Trust
|
Served
|
by Trustee
|
Years
|
Years
|
|
Elizabeth B. Scalf
|
Chief
|
Indefinite
|
N/A
|
Senior Vice President,
|
N/A
|
|
615 E. Michigan St.
|
Compliance
|
Term;
|
U.S. Bancorp Fund
|
||
|
Milwaukee, WI 53202
|
Officer,
|
Since
|
Services, LLC
|
||
|
Year of Birth: 1985
|
Vice
|
July 1,
|
(February 2017–
|
||
|
President
|
2017
|
present); Vice
|
|||
|
and
|
President
|
||||
|
Anti-Money
|
and Assistant CCO,
|
||||
|
Laundering
|
Heartland Advisors,
|
||||
|
Officer
|
Inc. (December 2016–
|
||||
|
January 2017); Vice
|
|||||
|
President and CCO,
|
|||||
|
Heartland Group, Inc.
|
|||||
|
(May 2016–November
|
|||||
|
2016); Vice President,
|
|||||
|
CCO and Senior Legal
|
|||||
|
Counsel (May 2016–
|
|||||
|
November 2016),
|
|||||
|
Heartland Advisors, Inc.
|
|||||
|
Jay S. Fitton
|
Secretary
|
Indefinite
|
N/A
|
Assistant Vice
|
N/A
|
|
615 E. Michigan St.
|
Term; Since
|
President,
|
|||
|
Milwaukee, WI 53202
|
July 22,
|
U.S. Bancorp Fund
|
|||
|
Year of Birth: 1970
|
2019
|
Services, LLC
|
|||
|
(2019–present);
|
|||||
|
Partner, Practus, LLP
|
|||||
|
(2018–2019);
|
|||||
|
Counsel, Drinker
|
|||||
|
Biddle & Reath LLP
|
|||||
|
(2016–2018).
|
70
Rockefeller Funds
Additional Information (Continued)
(Unaudited)
|
Other
|
|||||
|
Directorships
|
|||||
|
Term of
|
Number of
|
Principal
|
Held by
|
||
|
Office and
|
Portfolios
|
Occupation(s)
|
Trustee
|
||
|
Position(s)
|
Length
|
in Trust
|
During the
|
During the
|
|
|
Name, Address
|
Held with
|
of Time
|
Overseen
|
Past Five
|
Past Five
|
|
and Year of Birth
|
the Trust
|
Served
|
by Trustee
|
Years
|
Years
|
|
Kelly A. Burns
|
Assistant
|
Indefinite
|
N/A
|
Assistant Vice
|
N/A
|
|
615 E. Michigan St.
|
Treasurer
|
Term; Since
|
President, U.S.
|
||
|
Milwaukee, WI 53202
|
April 23,
|
Bancorp Fund
|
|||
|
Year of Birth: 1987
|
2015
|
Services, LLC
|
|||
|
(2011–present).
|
|||||
|
Melissa Aguinaga
|
Assistant
|
Indefinite
|
N/A
|
Assistant Vice
|
N/A
|
|
615 E. Michigan St.
|
Treasurer
|
Term; Since
|
President, U.S.
|
||
|
Milwaukee, WI 53202
|
July 1,
|
Bancorp Fund
|
|||
|
Year of Birth: 1987
|
2015
|
Services, LLC
|
|||
|
(2010–present).
|
|||||
|
Laura A. Caroll
|
Assistant
|
Indefinite
|
N/A
|
Assistant Vice
|
N/A
|
|
615 E. Michigan St.
|
Treasurer
|
Term; Since
|
President, U.S.
|
||
|
Milwaukee, WI 53202
|
August 20,
|
Bancorp Fund
|
|||
|
Year of Birth: 1985
|
2018
|
Services, LLC
|
|||
|
(2007–present).
|
|
*
|
Mr. Neuberger is deemed to be an “interested person” of the Trust as defined by the 1940 Act due to his position and material business relationship with the Trust.
|
71
A NOTE ON FORWARD LOOKING STATEMENTS (Unaudited)
Except for historical information contained in this report for the Funds, the matters discussed in this report may constitute forward-looking statements made pursuant to the safe-harbor provisions of the Private
Securities Litigation Reform Act of 1995. These include any adviser or portfolio manager predictions, assessments, analyses or outlooks for individual securities, industries, market sectors and/or markets. These statements involve risks and
uncertainties. In addition to the general risks described for the Funds in the current Prospectus, other factors bearing on this report include the accuracy of the Adviser’s or portfolio managers’ forecasts and predictions, and the appropriateness of
the investment programs designed by the Adviser or portfolio managers to implement their strategies efficiently and effectively. Any one or more of these factors, as well as other risks affecting the securities markets and investment instruments
generally, could cause the actual results of the Funds to differ materially as compared to benchmarks associated with the Funds.
ADDITIONAL INFORMATION (Unaudited)
The Funds have adopted proxy voting policies and procedures that delegate to the Adviser the authority to vote proxies. A description of the Funds’ proxy voting policies and procedures is available without charge, upon
request, by calling the Funds toll free at 855-369-6209. A description of these policies and procedures is also included in the Funds’ Statement of Additional Information, which is available on the SEC’s website at http://www.sec.gov.
The Funds’ proxy voting records for the most recent 12-month period ended June 30 are available without charge, either upon request by calling the Funds toll free at 855-369-6209 or by accessing the SEC’s website at http://www.sec.gov.
The Funds file their complete schedule of portfolio holdings with the SEC for the first and third quarters of each fiscal year on Part F of Form N-PORT. Shareholders may view the Part F of Form N-PORT reports, on the
SEC’s website at http://www.sec.gov.
HOUSEHOLDING (Unaudited)
In an effort to decrease costs, the Funds intend to reduce the number of duplicate prospectuses, supplements and certain other shareholder documents you receive by sending only one copy of each to those addresses
shared by two or more accounts and to shareholders the Funds reasonably believe are from the same family or household. Once implemented, if you would like to discontinue householding for your accounts, please call toll-free at 855-369-6209 to request
individual copies of these documents. Once the Funds receive notice to stop householding, the Funds will begin sending individual copies 30 days after receiving your request. This policy does not apply to account statements.
ROCKEFELLER FUNDS
|
Investment Adviser
|
Rockefeller & Co. LLC
|
|
45 Rockefeller Plaza, 5th Floor
|
|
|
New York, New York 10111
|
|
|
Legal Counsel
|
Godfrey & Kahn, S.C.
|
|
833 East Michigan Street
|
|
|
Suite 1800
|
|
|
Milwaukee, Wisconsin 53202
|
|
|
Independent Registered Public
|
Deloitte & Touche LLP
|
|
Accounting Firm
|
111 South Wacker Drive
|
|
Chicago, Illinois 60606
|
|
|
Transfer Agent, Fund Accountant and
|
U.S. Bancorp Fund Services, LLC
|
|
Fund Administrator
|
615 East Michigan Street
|
|
Milwaukee, Wisconsin 53202
|
|
|
Custodian
|
U.S. Bank National Association
|
|
Custody Operations
|
|
|
1555 North River Center Drive
|
|
|
Suite 302
|
|
|
Milwaukee, Wisconsin 53212
|
|
|
Distributor
|
Quasar Distributors, LLC
|
|
111 East Kilbourn Avenue
|
|
|
Suite 2200
|
|
|
Milwaukee, Wisconsin 53202
|
This report is intended for shareholders of the Funds and may not be used as sales literature unless preceded or accompanied by a current prospectus.
Item 2. Code of Ethics.
Not applicable for semi-annual reports.
Item 3. Audit Committee Financial Expert.
Not applicable for semi-annual reports.
Item 4. Principal Accountant Fees and Services.
Not applicable for semi-annual reports.
Item 5. Audit Committee of Listed Registrants.
Not applicable to registrants who are not listed issuers (as defined in Rule 10A-3 under the Securities Exchange Act of 1934).
Item 6. Investments.
Schedule of Investments is included as part of the report to shareholders filed under Item 1 of this Form.
Item 7. Disclosure of Proxy Voting Policies and Procedures for Closed-End Management Investment Companies.
Not applicable to open-end investment companies.
Item 8. Portfolio Managers of Closed-End Management Investment Companies.
Not applicable to open-end investment companies.
Item 9. Purchases of Equity Securities by Closed‑End Management Investment Company and Affiliated Purchasers.
Not applicable to open-end investment companies.
Item 10. Submission of Matters to a Vote of Security Holders.
There have been no material changes to the procedures by which shareholders may recommend nominees to the registrant’s board of [directors/trustees].
Item 11. Controls and Procedures.
|
(a)
|
The Registrant’s President and Treasurer have reviewed the Registrant's disclosure controls and procedures (as defined in Rule 30a-3(c) under the Investment Company Act of 1940 (the “Act”)) as of a date within 90 days of the filing of
this report, as required by Rule 30a-3(b) under the Act and Rules 13a-15(b) or 15d‑15(b) under the Securities Exchange Act of 1934. Based on their review, such officers have concluded that the disclosure controls and procedures are
effective in ensuring that information required to be disclosed in this report is appropriately recorded, processed, summarized and reported and made known to them by others within the Registrant and by the Registrant’s service provider.
|
|
(b)
|
There were no changes in the Registrant's internal control over financial reporting (as defined in Rule 30a-3(d) under the Act) that occurred during the last fiscal half-year of the period covered by this report that has materially
affected, or is reasonably likely to materially affect, the Registrant's internal control over financial reporting.
|
Item 12. Disclosure of Securities Lending Activities for Closed-End Management Investment Companies
Not applicable to open-end investment companies.
Item 13. Exhibits.
|
(a)
|
(1) Any code of ethics or amendment thereto, that is the subject of the disclosure required by Item 2, to the extent that the registrant intends to satisfy Item 2 requirements through filing an
exhibit. Not Applicable.
|
(3) Any written solicitation to purchase securities under Rule 23c‑1 under the Act sent or given during the period covered by the report by or on behalf of the registrant to 10 or
more persons. Not applicable to open-end investment companies.
(4) Change in the registrant’s independent public accountant. There was no change in the registrant’s independent public accountant for the period covered by this report.
SIGNATURES
Pursuant to the requirements of the Securities Exchange Act of 1934 and the Investment Company Act of 1940, the registrant has duly caused this report to be signed on its behalf by the undersigned, thereunto duly
authorized.
(Registrant) Trust for Professional Managers
By (Signature and Title)* /s/ John Buckel
John Buckel, President
Date August 9, 2021
Pursuant to the requirements of the Securities Exchange Act of 1934 and the Investment Company Act of 1940, this report has been signed below by the following persons on behalf of the registrant and in the capacities
and on the dates indicated.
By (Signature and Title)* /s/ John Buckel
John Buckel, President
Date August 9, 2021
By (Signature and Title)* /s/ Jennifer Lima
Jennifer Lima, Treasurer
Date August 9, 2021
* Print the name and title of each signing officer under his or her signature.