UNITED STATES
SECURITIES AND EXCHANGE COMMISSION
Washington, D.C. 20549
SECURITIES AND EXCHANGE COMMISSION
Washington, D.C. 20549
FORM N-CSR
CERTIFIED SHAREHOLDER REPORT OF REGISTERED
MANAGEMENT INVESTMENT COMPANIES
Investment Company Act file number 811-10401
Trust for Professional Managers
(Exact name of registrant as specified in charter)
(Exact name of registrant as specified in charter)
615 East Michigan Street
Milwaukee, WI 53202
(Address of principal executive offices) (Zip code)
(Address of principal executive offices) (Zip code)
Jay Fitton
U.S. Bancorp Fund Services, LLC
615 East Michigan Street
Milwaukee, WI 53202
(Name and address of agent for service)
(Name and address of agent for service)
(513) 629-8104
Registrant's telephone number, including area code
Date of fiscal year end: November 30, 2020
Date of reporting period: November 30, 2020
Item 1. Reports to Stockholders.
Annual Report
Convergence Long/Short Equity Fund
November 30, 2020
Investment Adviser
Convergence Investment Partners, LLC
3801 PGA Boulevard
Suite 1001
Palm Beach Gardens, Florida 33410
Phone: 877-677-9414
Table of Contents
|
LETTER TO SHAREHOLDERS
|
3
|
||
|
EXPENSE EXAMPLES
|
7
|
||
|
INVESTMENT HIGHLIGHTS
|
9
|
||
|
SCHEDULE OF INVESTMENTS
|
11
|
||
|
SCHEDULE OF SECURITIES SOLD SHORT
|
18
|
||
|
STATEMENT OF ASSETS AND LIABILITIES
|
26
|
||
|
STATEMENT OF OPERATIONS
|
27
|
||
|
STATEMENTS OF CHANGES IN NET ASSETS
|
28
|
||
|
STATEMENT OF CASH FLOWS
|
29
|
||
|
FINANCIAL HIGHLIGHTS
|
30
|
||
|
NOTES TO FINANCIAL STATEMENTS
|
32
|
||
|
REPORT OF INDEPENDENT REGISTERED
|
|||
|
PUBLIC ACCOUNTING FIRM
|
41
|
||
|
BASIS FOR TRUSTEES’ APPROVAL
|
|||
|
OF INVESTMENT ADVISORY AGREEMENT
|
42
|
||
|
STATEMENT REGARDING LIQUIDITY RISK MANAGEMENT PROGRAM
|
46
|
||
|
NOTICE OF PRIVACY POLICY & PRACTICES
|
47
|
||
|
ADDITIONAL INFORMATION
|
48
|
Convergence Investment Partners
2020 Annual Shareholder Report
Convergence Long/Short Equity Fund (MARNX)
Shareholder Letter (Unaudited)
Dear Shareholder:
We are pleased to provide to you the annual report of the Convergence Long/Short Equity Fund (the “Fund”) for the period ended November 30, 2020. We have been managing the Fund, incepted December 29, 2009, for over a
decade. The Fund employs the Convergence systematic long/short investment approach which seeks to benefit from fundamentally strong companies outperforming their weaker fundamental counterparts. Over the long term, our Fund strives for strong total
returns with the potential for downside risk mitigation through an active short. Moreover, our Fund utilizes the Convergence proprietary stock ranking process which analyzes the domestic investment universe and helps to identify, quantify, and rank
strong and weak characteristics. We manage our Fund with the philosophy that over the long term, strong outperforms weak fundamentals.
Our long-term investors know that we utilize numerous factors grouped into factor composites like Traditional Value and Accelerating Sales. We monitor the performance of these composites to learn what the market is
rewarding or punishing. Over the twelve months ended November 30, 2020, we see that much of the positive spread or differentiation in stocks has been a combination of strong price momentum, high expectations for future growth and strong earnings
momentum. Conversely, there was negative contribution from fundamental tilts to companies with reasonable valuations, strong and improving profitability and stable earnings. As we have stated before, this demonstrates the benefit of the fundamental
factor diversification that we employ at Convergence. While there will be certain periods where poorly run companies outperform ones that are industry leaders, we believe, and have seen, that companies managed efficiently and producing strong
earnings will provide sustainable wealth in the long run.
Digging a bit deeper into the performance of the past twelve months, our Fund underperformed its benchmark, the Russell 3000 Total Return Index (the “Russell 3000 Index”), with the bulk of this underperformance
occurring in the rapid recovery from the COVID induced bear market of March 2020. During this blistering recovery, many of the usual heuristics that rational market participants employ in stock selection were out of favor: Valuation, Quality and
Leverage, just to name a few. The rapid appreciation of stocks was fueled by rampant speculation, ignoring the murky outlooks for these companies given the uncertainty regarding a global pandemic. Such periods of inverted fundamentals are always
challenging for investors like Convergence, who focus on fundamentally strong companies. Given the environment of the last 12 months, we were unsurprised that our Fund had negative long-short spread for the year. For the fiscal year ended November
30, 2020, both the long and the short positions contributed negatively to spread performance. Over the trailing 6-months, the long positions nearly kept pace with the benchmark while the short positions notably outperformed the Russell 3000 Index,
which is undesirable for short positions.
At Convergence, we understand that our long (short) positions will not outperform (underperform) in every consecutive month, quarter, or year. We do, however, firmly believe that investment decisions based on a sound
and logical philosophy, paired with a quantitative and systematic long-term approach, can deliver superior results. Buying
3
reasonably valued stocks with strong earnings and sales growth, while shorting unprofitable stocks with wild valuations, has been a recipe for success for us at Convergence and we expect it to be in the future.
Convergence Long/Short Equity Fund Performance
The objective of the Fund is to achieve long-term capital growth. The Fund seeks to realize its investment objective by establishing long and short positions in equity securities of domestic companies with medium and
large market capitalizations. The Fund will hold long (purchase) securities that Convergence believes will outperform the market, and it will sell short securities expected to underperform the market. Convergence constructs the portfolio as an
actively managed equity strategy that adapts to ever changing market dynamics through a market cycle. The Fund intends to maintain a net long exposure (the market value of long positions minus the market value of short positions) of approximately 50%
to 100% of the Fund’s total assets. Under normal market conditions, the Fund’s long positions may range from 90% to 150% of the Fund’s total assets, and its short positions may range from 20% to 70% of the Fund’s total assets. In making investment
decisions for the Fund, Convergence utilizes a bottom-up approach that focuses on the individual strengths of the underlying companies and the relative and absolute attractiveness of the companies within each industry group.
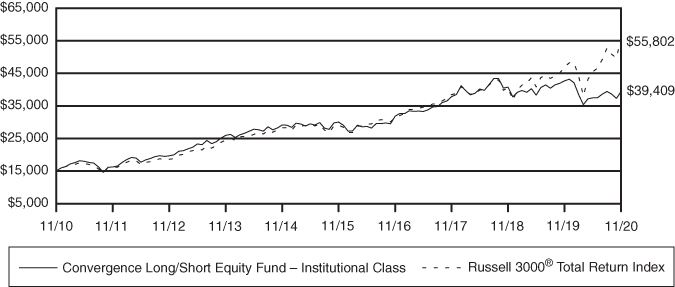
In the fiscal year ended November 30, 2020, the Fund returned -7.68%, versus the Russell 3000® Total Return Index at 19.02%. The
Convergence Long/Short Equity Fund has advanced cumulatively 198.46% net of fees from December 29, 2009 (its inception) through November 30, 2020, versus the Russell 3000®
Total Return Index at 303.24%.
Average Annual Total Returns (net of fees)
|
Since
|
||||||||
|
Through
|
One
|
Three
|
One
|
Three
|
Five
|
Ten
|
Inception
|
|
|
November 30, 2020
|
Month
|
Month
|
YTD
|
Year
|
Year
|
Year
|
Year
|
Annualized
|
|
Convergence Long/
|
||||||||
|
Short Equity
|
||||||||
|
Institutional
|
||||||||
|
Class (MARNX)
|
5.65%
|
-0.07%
|
-8.78%
|
-7.68%
|
1.35%
|
5.58%
|
10.14%
|
10.53%
|
|
Russell 3000®
|
||||||||
|
Total Return
|
12.17%
|
5.75%
|
15.68%
|
19.02%
|
13.20%
|
13.95%
|
14.04%
|
13.62%
|
Fund inception = 12/29/2009
Performance data quoted represents past performance and does not guarantee future results. The investment return and principal value of an investment will fluctuate so that an investor’s shares, when
redeemed, may be worth more or less than their original cost. Current performance of the Fund may be lower or higher than the performance quoted. Performance data current to the most recent month-end may be obtained by calling 1-877-677-9414.
Gross Expense Ratio on the Fund applicable to investors is 2.18%, the Expense Ratio excluding dividends and interest on short positions is 1.32%. Please see the Financial Highlights in this report for the most recent
expense ratio. Pursuant to an operating expense limitation agreement between Convergence and the Fund, Convergence has agreed to contractually waive its management fees and/or reimburse Fund expenses to ensure that total annual fund operating
expenses (exclusive of dividends or interest expenses on short positions, acquired fund fees and expenses, leverage expenses
4
(i.e., any expenses incurred in connection with borrowings made by the Fund), tax expenses, brokerage commissions, and extraordinary expenses) do not exceed 1.50% of the average net assets of the Fund through March 31,
2022.
Periods less than 12 months are not annualized.
The Convergence fundamental stock picking methodology is geared toward long holdings with strong cash flow, earnings, profits, and other desirable financial characteristics. We strive to achieve these favorable
portfolio statistics while never overpaying in terms of valuation. Our research has shown that, over time, companies with these characteristics have rewarded investors, since these are signs of healthy and growing companies with competitively strong
business models. The Convergence process separately seeks to identify companies with weak or declining fundamentals. Our research has shown this to be effective in sourcing alpha from shorting.
In closing, as we always say: Stay Fundamental.
Thank you for your support.
|
David J. Abitz, CFA
|
Justin Neuberg, CFA
|
|
President & Chief Investment Officer
|
Co-Portfolio Manager
|
|
Convergence Investment Partners, LLC
|
Convergence Investment Partners, LLC
|
Disclosures
Past performance is not indicative of future results.
This commentary is for informational purposes only and should not be viewed as a recommendation to buy or sell any security. Investors should seek financial advice regarding the appropriateness of investing in any
securities or investment strategies discussed in this documentation and should understand that statements regarding future prospects may not be realized. Investors should note that income from such securities may fluctuate and that each security’s
price or value may rise or fall. Accordingly, investors may receive back less than originally invested. There is no guarantee that the views expressed will come to pass.
Mutual fund investing involves risk. Principal loss is possible. Investments in small, micro and midcap companies involve additional risks such as limited liquidity and greater volatility than larger
capitalization companies. The Fund invests in foreign securities which involve greater volatility and political, economic and currency risks and differences in accounting methods. The Fund regularly makes short sales of securities, which involves
unlimited risk including the possibility that losses may exceed the original amount invested. However, a mutual fund investor’s risk is limited to one’s amount of investment in a mutual fund.
Must be preceded or accompanied by a prospectus.
Diversification does not assure a profit nor protect against loss in a declining market.
The Fund is distributed by Quasar Distributors, LLC.
Alpha – The excess return of an investment relative to the return of a benchmark index is the investment’s alpha.
5
The Russell 3000 Total Return Index measures the performance of the largest 3000 Total Return U.S. companies representing approximately 98% of the investable U.S. equity market. You cannot invest directly in an index.
The volatility of an index may be materially different from that of the strategy due to varying degrees of diversification and other factors. Index returns do not reflect the deduction of any fees.
6
CONVERGENCE LONG/SHORT EQUITY FUND
Expense Examples
(Unaudited)
As a shareholder of the Fund, you incur two types of costs: (1) transaction costs, and (2) ongoing costs, including management fees and other fund expenses. This Example is intended to help you understand your ongoing
costs (in dollars) of investing in the Fund, and to compare these costs with the ongoing costs of investing in other mutual funds. The Example is based on an investment of $1,000 invested at the beginning of the period and held for the entire period
(6/1/20 – 11/30/20).
Actual Expenses
The first line of the following table provides information about actual account values and actual expenses. In addition, you will be assessed fees for outgoing wire transfers, returned checks and stop payment orders at
prevailing rates charged by U.S. Bancorp Fund Services, LLC, the Fund’s transfer agent. If you request that a redemption be made by wire transfer, currently a $15.00 fee is charged by the Fund’s transfer agent. IRA accounts will be charged a $15.00
annual maintenance fee. To the extent the Fund invests in shares of exchange-traded funds or other investment companies as part of its investment strategy, you will indirectly bear your proportionate share of any fees and expenses charged by the
underlying funds in which the Fund invests in addition to the expenses of the Fund. Actual expenses of the underlying funds are expected to vary among the various underlying funds. These expenses are not included in the example. The example includes,
but is not limited to, management fees, fund administration and accounting, custody and transfer agent fees. You may use the information in this line, together with the amount you invested, to estimate the expenses that you paid over the period.
Simply divide your account value by $1,000 (for example, an $8,600 account value divided by $1,000 = 8.6), then multiply the result by the number in the first line under the heading titled “Expenses Paid During Period” to estimate the expenses you
paid on your account during this period.
Hypothetical Example for Comparison Purposes
The second line of the following table provides information about hypothetical account values and hypothetical expenses based on the Fund’s actual expense ratios and an assumed rate of return of 5% per year before
expenses, which is not the Fund’s actual return. The hypothetical account values and expenses may not be used to estimate the actual ending account balance or expenses you paid for the period. You may use this information to compare the ongoing costs
of investing in the Fund and other funds. To do so, compare this 5% hypothetical example with the 5% hypothetical examples that appear in the shareholder reports of other funds. Please note that the expenses shown in the table are meant to highlight
your ongoing costs only and do not reflect any transactional costs, such as sales charges (loads), redemption fees or exchange fees. Therefore, the second line of the table is useful in comparing ongoing costs only, and will not help you determine
the relative total costs of owning different funds.
7
CONVERGENCE LONG/SHORT EQUITY FUND
Expense Examples (Continued)
(Unaudited)
|
Institutional Class
|
|||
|
Beginning
|
Ending
|
Expenses Paid
|
|
|
Account Value
|
Account Value
|
During Period
|
|
|
6/1/20
|
11/30/20
|
6/1/20 – 11/30/20*
|
|
|
Actual**
|
$1,000.00
|
$1,051.70
|
$12.11
|
|
Hypothetical (5% return
|
|||
|
before expenses)***
|
$1,000.00
|
$1,013.20
|
$11.88
|
|
*
|
Expenses are equal to the Fund’s annualized expense ratio of 2.36%, multiplied by the average account value over the period, multiplied by 183/366 (to reflect the one-half year period). Excluding dividends on
short positions, interest and broker expenses, the Fund’s annualized expense ratio would be 1.50%.
|
|
|
**
|
Excluding dividends on short positions, interest and broker expenses, your actual cost of investing in the Fund would be $7.69.
|
|
|
***
|
Excluding dividends on short positions, interest and broker expenses, your hypothetical cost of investing in the Fund would be $7.57.
|
8
CONVERGENCE LONG/SHORT EQUITY FUND
Investment Highlights
(Unaudited)
The investment objective of the Fund is to seek long-term capital growth. The Fund seeks to achieve its investment objective by investing, under normal market conditions, at least 80% of its net assets (plus any
borrowings for investment purposes) in long and short positions in equity securities of domestic companies. The Fund focuses primarily on companies with medium and large market capitalizations, although the Fund may establish long and short positions
in companies of any market capitalization. The Fund generally considers companies with medium and large market capitalizations to be those companies that comprise the upper half of the Russell 3000® Total Return Index. As of December 31, 2019, the market capitalization range of the upper half of the Russell 3000® Total Return Index was
between $1.4 billion and $1,304.8 billion. The Fund will hold long (purchase) securities that the Adviser believes will outperform the market, and will sell short securities expected to underperform the market.
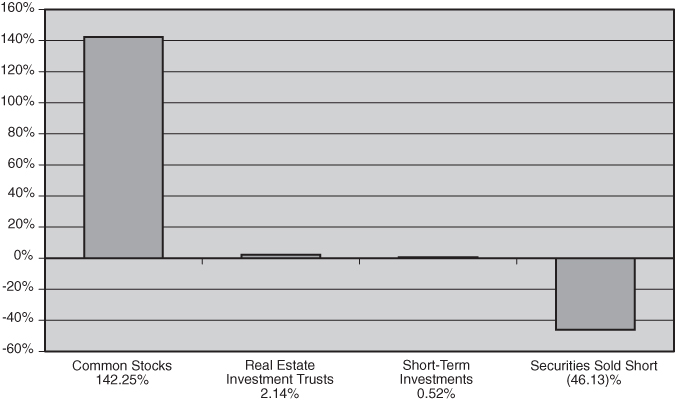
Allocation of Portfolio Holdings
(as a percentage of net assets)
Continued
9
CONVERGENCE LONG/SHORT EQUITY FUND
Investment Highlights (Continued)
(Unaudited)
Average Annual Total Returns as of November 30, 2020
|
Russell 3000®
|
||
|
Institutional
|
Total Return
|
|
|
Class Shares
|
Index
|
|
|
One Year
|
-7.68%
|
19.02%
|
|
Three Year
|
1.35%
|
13.20%
|
|
Five Year
|
5.58%
|
13.95%
|
|
Ten Year
|
10.14%
|
14.04%
|
Performance data quoted represents past performance and does not guarantee future results. The investment return and principal value of an investment will fluctuate so that an investor’s shares, when
redeemed, may be worth more or less than their original cost. Current performance of the Fund may be lower or higher than the performance quoted. Performance data current to the most recent month- end may be obtained by calling 877-677-9414.
Investment performance reflects fee waivers in effect. In the absence of such waivers, total returns would be reduced.
The returns shown assume reinvestment of Fund distributions and do not reflect the deduction of taxes that a shareholder would pay on Fund distributions or the redemption of Fund shares. The following graph illustrates
performance of a hypothetical investment made in the Fund and a broad-based securities index on the Fund’s inception date for Institutional Class shares. The graph does not reflect any future performance.
The Russell 3000® Total Return Index measures the performance of the largest 3,000 U.S. companies representing approximately 98% of the
investable U.S. equity market.
One cannot invest directly in an index.
Growth of $15,000 Investment
|
*
|
Inception Date
|
10
CONVERGENCE LONG/SHORT EQUITY FUND
|
Schedule of Investments
|
November 30, 2020
|
Shares
|
Value
|
|||||||
|
COMMON STOCKS* 142.25%
|
||||||||
|
Accommodation 0.92%
|
||||||||
|
Penn National Gaming, Inc. (a)
|
1,195
|
$
|
83,650
|
|||||
|
Wyndham Destinations, Inc.
|
2,961
|
124,539
|
||||||
|
208,189
|
||||||||
|
Administrative and Support Services 0.97%
|
||||||||
|
Baker Hughes Co.
|
9,078
|
169,940
|
||||||
|
CoreLogic, Inc.
|
635
|
49,213
|
||||||
|
219,153
|
||||||||
|
Ambulatory Health Care Services 1.69%
|
||||||||
|
Laboratory Corp. of America Holdings (a)
|
1,142
|
228,217
|
||||||
|
Quest Diagnostics, Inc.
|
1,230
|
152,495
|
||||||
|
380,712
|
||||||||
|
Beverage and Tobacco Product Manufacturing 1.51%
|
||||||||
|
National Beverage Corp. (a)
|
3,460
|
339,184
|
||||||
|
Building Material and Garden Equipment
|
||||||||
|
and Supplies Dealers 5.54%
|
||||||||
|
Home Depot, Inc.
|
3,360
|
932,098
|
||||||
|
Lowe’s Companies, Inc.
|
2,034
|
316,938
|
||||||
|
1,249,036
|
||||||||
|
Chemical Manufacturing 10.07%
|
||||||||
|
AbbVie, Inc.
|
2,939
|
307,360
|
||||||
|
Alexion Pharmaceuticals, Inc. (a)
|
2,271
|
277,311
|
||||||
|
Alkermes, PLC (a)(c)
|
12,918
|
235,883
|
||||||
|
Dow, Inc.
|
1,790
|
94,888
|
||||||
|
Freeport-McMoRan, Inc.
|
7,333
|
171,519
|
||||||
|
Gilead Sciences, Inc.
|
3,947
|
239,464
|
||||||
|
Merck & Co, Inc.
|
2,909
|
233,855
|
||||||
|
Mosaic Co.
|
4,978
|
109,317
|
||||||
|
Pfizer, Inc.
|
6,577
|
251,965
|
||||||
|
Procter & Gamble Co.
|
2,501
|
347,314
|
||||||
|
2,268,876
|
||||||||
|
Computer and Electronic Product Manufacturing 24.40%
|
||||||||
|
Alphabet, Inc. – Class A (a)
|
374
|
656,146
|
||||||
|
Alphabet, Inc. – Class C (a)
|
373
|
656,755
|
||||||
|
Amkor Technology, Inc.
|
26,478
|
390,286
|
||||||
|
Apple, Inc. (b)
|
5,740
|
683,347
|
||||||
The accompanying notes are an integral part of these financial statements.
11
CONVERGENCE LONG/SHORT EQUITY FUND
|
Schedule of Investments (Continued)
|
November 30, 2020
|
Shares
|
Value
|
|||||||
|
Computer and Electronic Product Manufacturing 24.40% (Continued)
|
||||||||
|
Cisco Systems, Inc. (b)
|
9,369
|
$
|
403,054
|
|||||
|
Hologic, Inc. (a)
|
4,015
|
277,557
|
||||||
|
IDEXX Laboratories, Inc. (a)
|
651
|
300,098
|
||||||
|
Jabil, Inc.
|
8,002
|
305,836
|
||||||
|
Pacific Biosciences of California, Inc. (a)
|
15,422
|
243,822
|
||||||
|
PerkinElmer, Inc.
|
2,140
|
284,620
|
||||||
|
Square, Inc. – Class A (a)(b)
|
2,499
|
527,189
|
||||||
|
Teradyne, Inc.
|
3,357
|
370,411
|
||||||
|
Texas Instruments, Inc.
|
2,500
|
403,125
|
||||||
|
5,502,246
|
||||||||
|
Construction of Buildings 1.96%
|
||||||||
|
Avantor, Inc. (a)
|
12,324
|
336,199
|
||||||
|
TRI Pointe Group, Inc. (a)
|
6,002
|
104,915
|
||||||
|
441,114
|
||||||||
|
Couriers and Messengers 1.52%
|
||||||||
|
FedEx Corp.
|
582
|
166,790
|
||||||
|
United Parcel Service, Inc. – Class B
|
1,018
|
174,149
|
||||||
|
340,939
|
||||||||
|
Credit Intermediation and Related Activities 6.53%
|
||||||||
|
Bank of America Corp.
|
12,301
|
346,396
|
||||||
|
Citigroup, Inc.
|
5,450
|
300,132
|
||||||
|
Hilltop Holdings, Inc.
|
3,977
|
95,806
|
||||||
|
JPMorgan Chase & Co.
|
2,665
|
314,150
|
||||||
|
OneMain Holdings, Inc.
|
10,581
|
412,553
|
||||||
|
1,469,037
|
||||||||
|
Data Processing, Hosting and Related Services 0.59%
|
||||||||
|
Upwork, Inc. (a)
|
4,061
|
132,876
|
||||||
|
Electrical Equipment, Appliance,
|
||||||||
|
and Component Manufacturing 3.95%
|
||||||||
|
Generac Holdings, Inc. (a)
|
839
|
180,888
|
||||||
|
Rockwell Automation, Inc.
|
684
|
174,803
|
||||||
|
Synaptics, Inc. (a)
|
4,373
|
340,089
|
||||||
|
Whirlpool Corp.
|
997
|
194,026
|
||||||
|
889,806
|
||||||||
|
Electronics and Appliance Stores 1.31%
|
||||||||
|
Best Buy Company, Inc.
|
2,712
|
295,066
|
||||||
The accompanying notes are an integral part of these financial statements.
12
CONVERGENCE LONG/SHORT EQUITY FUND
|
Schedule of Investments (Continued)
|
November 30, 2020
|
Shares
|
Value
|
|||||||
|
Food and Beverage Stores 0.74%
|
||||||||
|
Kroger Co.
|
5,025
|
$
|
165,825
|
|||||
|
Food Manufacturing 1.86%
|
||||||||
|
Kellogg Co.
|
2,599
|
166,102
|
||||||
|
Kraft Heinz Co.
|
7,695
|
253,473
|
||||||
|
419,575
|
||||||||
|
Food Services and Drinking Places 0.35%
|
||||||||
|
Papa John’s International, Inc.
|
971
|
78,030
|
||||||
|
General Merchandise Stores 4.28%
|
||||||||
|
Target Corp.
|
2,338
|
419,741
|
||||||
|
Wal-Mart, Inc.
|
3,566
|
544,849
|
||||||
|
964,590
|
||||||||
|
Heavy and Civil Engineering Construction 0.75%
|
||||||||
|
Dycom Industries, Inc. (a)
|
2,677
|
168,276
|
||||||
|
Hospitals 1.43%
|
||||||||
|
HCA Healthcare, Inc.
|
2,152
|
323,037
|
||||||
|
Insurance Carriers and Related Activities 3.96%
|
||||||||
|
Arch Capital Group Ltd. (a)(c)
|
3,850
|
123,951
|
||||||
|
Chubb Ltd. (c)
|
909
|
134,376
|
||||||
|
MGIC Investment Corp.
|
10,562
|
126,322
|
||||||
|
Prudential Financial, Inc.
|
1,767
|
133,621
|
||||||
|
Radian Group, Inc.
|
6,459
|
121,946
|
||||||
|
Travelers Companies, Inc.
|
1,019
|
132,113
|
||||||
|
W. R. Berkley Corp.
|
1,859
|
121,077
|
||||||
|
893,406
|
||||||||
|
Machinery Manufacturing 2.19%
|
||||||||
|
AGCO Corp.
|
2,147
|
198,619
|
||||||
|
Brunswick Corp.
|
1,628
|
121,514
|
||||||
|
Deere & Co.
|
659
|
172,408
|
||||||
|
492,541
|
||||||||
|
Management of Companies and Enterprises 1.40%
|
||||||||
|
Capital One Financial Corp.
|
3,682
|
315,326
|
||||||
The accompanying notes are an integral part of these financial statements.
13
CONVERGENCE LONG/SHORT EQUITY FUND
|
Schedule of Investments (Continued)
|
November 30, 2020
|
Shares
|
Value
|
|||||||
|
Merchant Wholesalers, Durable Goods 6.10%
|
||||||||
|
Arrow Electronics, Inc. (a)
|
5,495
|
$
|
503,617
|
|||||
|
Avnet, Inc.
|
9,946
|
301,861
|
||||||
|
Builders FirstSource, Inc. (a)
|
5,660
|
211,741
|
||||||
|
ChampionX Corp. (a)
|
14,031
|
166,688
|
||||||
|
Mohawk Industries, Inc. (a)
|
1,517
|
190,884
|
||||||
|
1,374,791
|
||||||||
|
Merchant Wholesalers, Nondurable Goods 2.36%
|
||||||||
|
Cardinal Health, Inc.
|
3,787
|
206,732
|
||||||
|
McKesson Corp.
|
1,805
|
324,738
|
||||||
|
531,470
|
||||||||
|
Mining (except Oil and Gas) 0.74%
|
||||||||
|
Southern Copper Corp.
|
2,790
|
165,643
|
||||||
|
Nonmetallic Mineral Product Manufacturing 0.74%
|
||||||||
|
3M Co.
|
966
|
166,857
|
||||||
|
Nonstore Retailers 4.72%
|
||||||||
|
Amazon.com, Inc. (a)
|
336
|
1,064,461
|
||||||
|
Other Information Services 4.54%
|
||||||||
|
Facebook, Inc. – Class A (a)
|
1,078
|
298,574
|
||||||
|
Pinterest, Inc. – Class A (a)
|
10,346
|
724,427
|
||||||
|
1,023,001
|
||||||||
|
Paper Manufacturing 1.72%
|
||||||||
|
International Paper Co.
|
2,600
|
128,648
|
||||||
|
Kimberly-Clark Corp.
|
1,171
|
163,132
|
||||||
|
Westrock Co.
|
2,271
|
95,859
|
||||||
|
387,639
|
||||||||
|
Performing Arts, Spectator Sports, and Related Industries 2.56%
|
||||||||
|
Activision Blizzard, Inc.
|
3,488
|
277,226
|
||||||
|
Boyd Gaming Corp.
|
4,002
|
154,037
|
||||||
|
Electronic Arts, Inc.
|
1,141
|
145,763
|
||||||
|
577,026
|
||||||||
|
Petroleum and Coal Products Manufacturing 0.92%
|
||||||||
|
Renewable Energy Group, Inc. (a)
|
3,573
|
207,520
|
||||||
The accompanying notes are an integral part of these financial statements.
14
CONVERGENCE LONG/SHORT EQUITY FUND
|
Schedule of Investments (Continued)
|
November 30, 2020
|
Shares
|
Value
|
|||||||
|
Primary Metal Manufacturing 0.57%
|
||||||||
|
Nucor Corp.
|
2,394
|
$
|
128,558
|
|||||
|
Professional, Scientific, and Technical Services 6.59%
|
||||||||
|
Digital Turbine, Inc. (a)
|
12,688
|
570,705
|
||||||
|
H&R Block, Inc.
|
8,150
|
153,220
|
||||||
|
Insperity, Inc.
|
1,425
|
121,838
|
||||||
|
Timken Co.
|
2,947
|
216,428
|
||||||
|
VMware, Inc. – Class A (a)(b)
|
3,021
|
422,608
|
||||||
|
1,484,799
|
||||||||
|
Publishing Industries (except Internet) 14.12%
|
||||||||
|
Adobe Systems, Inc. (a)
|
889
|
425,360
|
||||||
|
Autodesk, Inc. (a)
|
1,651
|
462,660
|
||||||
|
Cadence Design Systems, Inc. (a)
|
4,131
|
480,435
|
||||||
|
Citrix Systems, Inc.
|
2,346
|
290,716
|
||||||
|
Microsoft Corp. (b)
|
2,219
|
475,021
|
||||||
|
Oracle Corp.
|
5,042
|
291,024
|
||||||
|
SPS Commerce, Inc. (a)
|
5,017
|
517,102
|
||||||
|
Veeva Systems, Inc. – Class A (a)
|
875
|
242,261
|
||||||
|
3,184,579
|
||||||||
|
Real Estate 0.61%
|
||||||||
|
CBRE Group, Inc. – Class A (a)
|
2,261
|
138,238
|
||||||
|
Securities, Commodity Contracts, and Other Financial
|
||||||||
|
Investments and Related Activities 3.09%
|
||||||||
|
Artisan Partners Asset Management, Inc. – Class A
|
7,516
|
338,220
|
||||||
|
Interactive Brokers Group, Inc. – Class A
|
2,313
|
122,034
|
||||||
|
MarketAxess Holdings, Inc.
|
440
|
237,239
|
||||||
|
697,493
|
||||||||
|
Specialty Trade Contractors 0.86%
|
||||||||
|
Quanta Services, Inc.
|
2,841
|
194,154
|
||||||
|
Support Activities for Mining 0.68%
|
||||||||
|
Schlumberger Ltd. (c)
|
7,403
|
153,908
|
||||||
|
Support Activities for Transportation 0.82%
|
||||||||
|
CH Robinson Worldwide, Inc.
|
1,972
|
185,309
|
||||||
The accompanying notes are an integral part of these financial statements.
15
CONVERGENCE LONG/SHORT EQUITY FUND
|
Schedule of Investments (Continued)
|
November 30, 2020
|
Shares
|
Value
|
|||||||
|
Telecommunications 4.05%
|
||||||||
|
Verizon Communications, Inc.
|
8,293
|
$
|
500,980
|
|||||
|
Zoom Video Communications, Inc. – Class A (a)
|
862
|
412,346
|
||||||
|
913,326
|
||||||||
|
Transportation Equipment Manufacturing 4.73%
|
||||||||
|
Ford Motor Co.
|
49,754
|
451,766
|
||||||
|
Lockheed Martin Corp.
|
367
|
133,955
|
||||||
|
Tesla, Inc. (a)
|
847
|
480,758
|
||||||
|
1,066,479
|
||||||||
|
Truck Transportation 0.72%
|
||||||||
|
Landstar System, Inc.
|
1,236
|
162,435
|
||||||
|
Utilities 2.28%
|
||||||||
|
MDU Resources Group, Inc.
|
6,826
|
170,240
|
||||||
|
NRG Energy, Inc.
|
5,298
|
173,510
|
||||||
|
Vistra Corp.
|
9,056
|
169,166
|
||||||
|
512,916
|
||||||||
|
Wood Product Manufacturing 0.81%
|
||||||||
|
UFP Industries, Inc.
|
3,403
|
182,571
|
||||||
|
TOTAL COMMON STOCKS (Cost $24,385,633)
|
32,060,013
|
|||||||
|
REAL ESTATE INVESTMENT TRUSTS* 2.14%
|
||||||||
|
Forestry and Logging 0.64%
|
||||||||
|
Weyerhaeuser Co.
|
4,983
|
144,706
|
||||||
|
Professional, Scientific, and Technical Services 0.66%
|
||||||||
|
Lamar Advertising Co. – Class A
|
1,844
|
146,801
|
||||||
|
Real Estate 0.38%
|
||||||||
|
Mid-America Apartment Communities, Inc.
|
685
|
86,420
|
||||||
|
Telecommunications 0.46%
|
||||||||
|
Uniti Group, Inc.
|
10,071
|
103,530
|
||||||
|
TOTAL REAL ESTATE INVESTMENT TRUSTS
|
||||||||
|
(Cost $395,406)
|
481,457
|
|||||||
The accompanying notes are an integral part of these financial statements.
16
CONVERGENCE LONG/SHORT EQUITY FUND
|
Schedule of Investments (Continued)
|
November 30, 2020
|
Shares
|
Value
|
|||||||
|
SHORT-TERM INVESTMENTS 0.52%
|
||||||||
|
First American Government Obligations Fund –
|
||||||||
|
Class X, 0.046% (b)(d)
|
117,278
|
$
|
117,278
|
|||||
|
TOTAL SHORT-TERM INVESTMENTS (Cost $117,278)
|
117,278
|
|||||||
|
Total Investments (Cost $24,898,317) 144.91%
|
32,658,748
|
|||||||
|
Liabilities in Excess of Other Assets (44.91)%
|
(10,121,886
|
)
|
||||||
|
TOTAL NET ASSETS 100.00%
|
$
|
22,536,862
|
||||||
Percentages are stated as a percent of net assets.
|
*
|
Unless otherwise noted, all or a portion of these securities, totaling $29,725,610 are pledged as collateral for securities sold short.
|
|
(a)
|
Non-income producing security.
|
|
(b)
|
This security is not pledged as collateral for securities sold short.
|
|
(c)
|
Foreign issued security.
|
|
(d)
|
Seven day yield as of November 30, 2020.
|
Abbreviations:
|
Ltd.
|
Limited Liability Company.
|
|
PLC
|
Public Limited Company.
|
The accompanying notes are an integral part of these financial statements.
17
CONVERGENCE LONG/SHORT EQUITY FUND
|
Schedule of Securities Sold Short
|
November 30, 2020
|
Shares
|
Value
|
|||||||
|
SECURITIES SOLD SHORT (46.13)%
|
||||||||
|
COMMON STOCKS (44.13)%
|
||||||||
|
Accommodation (0.46)%
|
||||||||
|
Caesars Entertainment, Inc.
|
(374
|
)
|
$
|
(25,477
|
)
|
|||
|
Extended Stay America, Inc.
|
(3,045
|
)
|
(41,747
|
)
|
||||
|
MGM Resorts International
|
(1,341
|
)
|
(37,883
|
)
|
||||
|
(105,107
|
)
|
|||||||
|
Administrative and Support Services (1.74)%
|
||||||||
|
ADT, Inc.
|
(3,668
|
)
|
(28,500
|
)
|
||||
|
Dun & Bradstreet Holdings, Inc.
|
(1,026
|
)
|
(27,507
|
)
|
||||
|
IHS Markit Ltd. (a)
|
(231
|
)
|
(22,975
|
)
|
||||
|
Perspecta, Inc.
|
(5,411
|
)
|
(121,316
|
)
|
||||
|
R1 RCM, Inc.
|
(3,036
|
)
|
(61,570
|
)
|
||||
|
US Ecology, Inc.
|
(1,087
|
)
|
(36,838
|
)
|
||||
|
WEX, Inc.
|
(545
|
)
|
(94,416
|
)
|
||||
|
(393,122
|
)
|
|||||||
|
Air Transportation (0.61)%
|
||||||||
|
American Airlines Group, Inc.
|
(2,294
|
)
|
(32,414
|
)
|
||||
|
JetBlue Airways Corp.
|
(2,112
|
)
|
(31,870
|
)
|
||||
|
Spirit Airlines, Inc.
|
(3,117
|
)
|
(70,538
|
)
|
||||
|
(134,822
|
)
|
|||||||
|
Ambulatory Health Care Services (0.37)%
|
||||||||
|
Axsome Therapeutics, Inc.
|
(509
|
)
|
(36,897
|
)
|
||||
|
Y-mAbs Therapeutics, Inc.
|
(902
|
)
|
(45,885
|
)
|
||||
|
(82,782
|
)
|
|||||||
|
Animal Production and Aquaculture (0.21)%
|
||||||||
|
Cal-Maine Foods, Inc.
|
(1,225
|
)
|
(47,934
|
)
|
||||
|
Apparel Manufacturing (0.15)%
|
||||||||
|
VF Corp.
|
(398
|
)
|
(33,193
|
)
|
||||
|
Beverage and Tobacco Product Manufacturing (0.34)%
|
||||||||
|
Keurig Dr Pepper, Inc.
|
(2,507
|
)
|
(76,338
|
)
|
||||
|
Broadcasting (except Internet) (3.14)%
|
||||||||
|
Cable One, Inc.
|
(58
|
)
|
(114,879
|
)
|
||||
|
Liberty Latin America Ltd. – Class C (a)
|
(7,203
|
)
|
(81,466
|
)
|
||||
|
Liberty Media Corp. Formula One – Class C
|
(2,541
|
)
|
(106,163
|
)
|
||||
The accompanying notes are an integral part of these financial statements.
18
CONVERGENCE LONG/SHORT EQUITY FUND
|
Schedule of Securities Sold Short (Continued)
|
November 30, 2020
|
Shares
|
Value
|
|||||||
|
Broadcasting (except Internet) (3.14)% (Continued)
|
||||||||
|
Liberty Media Corp. Liberty SiriusXM – Class A
|
(1,861
|
)
|
$
|
(76,189
|
)
|
|||
|
Madison Square Garden Co.
|
(598
|
)
|
(101,301
|
)
|
||||
|
Sirius XM Holdings, Inc.
|
(16,578
|
)
|
(107,591
|
)
|
||||
|
Walt Disney Co.
|
(812
|
)
|
(120,183
|
)
|
||||
|
(707,772
|
)
|
|||||||
|
Chemical Manufacturing (3.93)%
|
||||||||
|
Acceleron Pharma, Inc.
|
(384
|
)
|
(45,339
|
)
|
||||
|
Albemarle Corp.
|
(349
|
)
|
(47,454
|
)
|
||||
|
Arena Pharmaceuticals, Inc.
|
(497
|
)
|
(32,737
|
)
|
||||
|
Bridgebio Pharma, Inc.
|
(1,089
|
)
|
(54,711
|
)
|
||||
|
CF Industries Holdings, Inc.
|
(1,366
|
)
|
(50,952
|
)
|
||||
|
CMC Materials, Inc.
|
(239
|
)
|
(36,873
|
)
|
||||
|
Deciphera Pharmaceuticals, Inc.
|
(424
|
)
|
(26,203
|
)
|
||||
|
Edgewell Personal Care Co.
|
(2,135
|
)
|
(74,191
|
)
|
||||
|
Energizer Holdings, Inc.
|
(2,243
|
)
|
(93,959
|
)
|
||||
|
Global Blood Therapeutics, Inc.
|
(756
|
)
|
(34,708
|
)
|
||||
|
Intra-Cellular Therapies, Inc.
|
(1,675
|
)
|
(39,597
|
)
|
||||
|
Iovance Biotherapeutics, Inc.
|
(914
|
)
|
(35,472
|
)
|
||||
|
Karuna Therapeutics, Inc.
|
(392
|
)
|
(39,110
|
)
|
||||
|
Linde PLC (a)
|
(157
|
)
|
(40,258
|
)
|
||||
|
Revance Therapeutics, Inc.
|
(921
|
)
|
(22,233
|
)
|
||||
|
Rocket Pharmaceuticals, Inc.
|
(1,298
|
)
|
(40,186
|
)
|
||||
|
Sage Therapeutics, Inc.
|
(614
|
)
|
(45,491
|
)
|
||||
|
TG Therapeutics, Inc.
|
(1,512
|
)
|
(44,362
|
)
|
||||
|
Turning Point Therapeutics, Inc.
|
(397
|
)
|
(42,281
|
)
|
||||
|
Zogenix, Inc.
|
(1,861
|
)
|
(39,881
|
)
|
||||
|
(885,998
|
)
|
|||||||
|
Clothing and Clothing Accessories Stores (0.56)%
|
||||||||
|
Ross Stores, Inc.
|
(1,169
|
)
|
(125,691
|
)
|
||||
|
Computer and Electronic Product Manufacturing (4.94)%
|
||||||||
|
Coherent, Inc.
|
(1,345
|
)
|
(163,795
|
)
|
||||
|
Cubic Corp.
|
(756
|
)
|
(44,271
|
)
|
||||
|
Fortive Corp.
|
(726
|
)
|
(50,914
|
)
|
||||
|
Intel Corp.
|
(2,912
|
)
|
(140,795
|
)
|
||||
|
L3Harris Technologies, Inc.
|
(285
|
)
|
(54,717
|
)
|
||||
|
MaxLinear, Inc.
|
(2,702
|
)
|
(84,438
|
)
|
||||
|
Micron Technology, Inc.
|
(1,748
|
)
|
(112,029
|
)
|
||||
|
SolarEdge Technologies, Inc.
|
(492
|
)
|
(136,766
|
)
|
||||
|
Sonos, Inc.
|
(925
|
)
|
(20,572
|
)
|
||||
The accompanying notes are an integral part of these financial statements.
19
CONVERGENCE LONG/SHORT EQUITY FUND
|
Schedule of Securities Sold Short (Continued)
|
November 30, 2020
|
Shares
|
Value
|
|||||||
|
Computer and Electronic Product Manufacturing (4.94)% (Continued)
|
||||||||
|
ViaSat, Inc.
|
(5,370
|
)
|
$
|
(182,580
|
)
|
|||
|
Xperi Holding Corp.
|
(6,501
|
)
|
(124,039
|
)
|
||||
|
(1,114,916
|
)
|
|||||||
|
Credit Intermediation and Related Activities (2.20)%
|
||||||||
|
Ameris Bancorp
|
(1,727
|
)
|
(58,735
|
)
|
||||
|
CVB Financial Corp.
|
(2,181
|
)
|
(41,417
|
)
|
||||
|
Euronet Worldwide, Inc.
|
(945
|
)
|
(127,046
|
)
|
||||
|
First Republic Bank
|
(315
|
)
|
(40,811
|
)
|
||||
|
FNB Corp.
|
(4,424
|
)
|
(39,064
|
)
|
||||
|
Fulton Financial Corp.
|
(2,664
|
)
|
(32,820
|
)
|
||||
|
Independent Bank Corp.
|
(540
|
)
|
(36,526
|
)
|
||||
|
Independent Bank Group, Inc.
|
(670
|
)
|
(37,594
|
)
|
||||
|
Truist Financial Corp.
|
(891
|
)
|
(41,360
|
)
|
||||
|
Wintrust Financial Corp.
|
(669
|
)
|
(36,454
|
)
|
||||
|
(491,827
|
)
|
|||||||
|
Data Processing, Hosting and Related Services (0.52)%
|
||||||||
|
Fidelity National Information Services, Inc.
|
(796
|
)
|
(118,134
|
)
|
||||
|
Electrical Equipment, Appliance,
|
||||||||
|
and Component Manufacturing (0.22)%
|
||||||||
|
Armstrong World Industries, Inc.
|
(630
|
)
|
(48,548
|
)
|
||||
|
Fabricated Metal Product Manufacturing (0.25)%
|
||||||||
|
Axon Enterprise, Inc.
|
(447
|
)
|
(56,183
|
)
|
||||
|
Food and Beverage Stores (0.41)%
|
||||||||
|
Grocery Outlet Holding Corp.
|
(2,377
|
)
|
(91,800
|
)
|
||||
|
Food Manufacturing (0.86)%
|
||||||||
|
Hostess Brands, Inc.
|
(3,414
|
)
|
(46,260
|
)
|
||||
|
McCormick & Company, Inc.
|
(413
|
)
|
(77,223
|
)
|
||||
|
Simply Good Foods Co.
|
(3,222
|
)
|
(70,046
|
)
|
||||
|
(193,529
|
)
|
|||||||
|
Food Services and Drinking Places (0.42)%
|
||||||||
|
Casey’s General Stores, Inc.
|
(322
|
)
|
(58,501
|
)
|
||||
|
Starbucks Corp.
|
(362
|
)
|
(35,483
|
)
|
||||
|
(93,984
|
)
|
|||||||
The accompanying notes are an integral part of these financial statements.
20
CONVERGENCE LONG/SHORT EQUITY FUND
|
Schedule of Securities Sold Short (Continued)
|
November 30, 2020
|
Shares
|
Value
|
|||||||
|
Funds, Trusts, and Other Financial Vehicles (0.48)%
|
||||||||
|
Carlyle Group, Inc.
|
(2,419
|
)
|
$
|
(68,724
|
)
|
|||
|
Renaissancere Holdings Ltd. (a)
|
(250
|
)
|
(41,160
|
)
|
||||
|
(109,884
|
)
|
|||||||
|
Furniture and Home Furnishings Stores (1.09)%
|
||||||||
|
Floor & Decor Holdings, Inc. – Class A
|
(1,618
|
)
|
(129,586
|
)
|
||||
|
Switch, Inc. – Class A
|
(7,398
|
)
|
(116,814
|
)
|
||||
|
(246,400
|
)
|
|||||||
|
General Merchandise Stores (1.40)%
|
||||||||
|
Burlington Stores, Inc.
|
(773
|
)
|
(168,932
|
)
|
||||
|
Five Below, Inc.
|
(928
|
)
|
(145,139
|
)
|
||||
|
(314,071
|
)
|
|||||||
|
Health and Personal Care Stores (0.67)%
|
||||||||
|
Ulta Beauty, Inc.
|
(551
|
)
|
(151,745
|
)
|
||||
|
Insurance Carriers and Related Activities (0.63)%
|
||||||||
|
American Equity Investment Life Holding Co.
|
(1,281
|
)
|
(33,665
|
)
|
||||
|
American National Group, Inc.
|
(378
|
)
|
(32,047
|
)
|
||||
|
eHealth, Inc.
|
(607
|
)
|
(46,126
|
)
|
||||
|
Kemper Corp.
|
(431
|
)
|
(32,303
|
)
|
||||
|
(144,141
|
)
|
|||||||
|
Leather and Allied Product Manufacturing (0.27)%
|
||||||||
|
Skechers U.S.A., Inc. – Class A
|
(902
|
)
|
(30,190
|
)
|
||||
|
Steven Madden Ltd.
|
(1,000
|
)
|
(31,470
|
)
|
||||
|
(61,660
|
)
|
|||||||
|
Management of Companies and Enterprises (0.46)%
|
||||||||
|
Cannae Holdings, Inc.
|
(1,725
|
)
|
(68,000
|
)
|
||||
|
Simmons First National Corp. – Class A
|
(1,872
|
)
|
(36,504
|
)
|
||||
|
(104,504
|
)
|
|||||||
|
Merchant Wholesalers, Durable Goods (1.41)%
|
||||||||
|
Hexcel Corp.
|
(965
|
)
|
(47,787
|
)
|
||||
|
InterDigital, Inc.
|
(1,231
|
)
|
(73,749
|
)
|
||||
|
New Relic, Inc.
|
(2,000
|
)
|
(119,460
|
)
|
||||
|
Silk Road Medical, Inc.
|
(1,344
|
)
|
(77,011
|
)
|
||||
|
(318,007
|
)
|
|||||||
The accompanying notes are an integral part of these financial statements.
21
CONVERGENCE LONG/SHORT EQUITY FUND
|
Schedule of Securities Sold Short (Continued)
|
November 30, 2020
|
Shares
|
Value
|
|||||||
|
Merchant Wholesalers, Nondurable Goods (0.36)%
|
||||||||
|
Allakos, Inc.
|
(416
|
)
|
$
|
(44,524
|
)
|
|||
|
Livent Corp.
|
(2,368
|
)
|
(35,923
|
)
|
||||
|
(80,447
|
)
|
|||||||
|
Mining (except Oil and Gas) (0.20)%
|
||||||||
|
Novagold Resources, Inc. (a)
|
(4,519
|
)
|
(45,009
|
)
|
||||
|
Miscellaneous Manufacturing (1.80)%
|
||||||||
|
AtriCure, Inc.
|
(1,999
|
)
|
(86,916
|
)
|
||||
|
Baxter International, Inc.
|
(812
|
)
|
(61,769
|
)
|
||||
|
Cardiovascular Systems, Inc.
|
(2,152
|
)
|
(74,158
|
)
|
||||
|
DexCom, Inc.
|
(209
|
)
|
(66,813
|
)
|
||||
|
Hasbro, Inc.
|
(356
|
)
|
(33,119
|
)
|
||||
|
Tandem Diabetes Care, Inc.
|
(888
|
)
|
(83,365
|
)
|
||||
|
(406,140
|
)
|
|||||||
|
Miscellaneous Store Retailers (0.29)%
|
||||||||
|
KKR & Co, Inc.
|
(1,727
|
)
|
(65,505
|
)
|
||||
|
Motion Picture and Sound Recording Industries (0.23)%
|
||||||||
|
Cinemark Holdings, Inc.
|
(3,350
|
)
|
(51,758
|
)
|
||||
|
Oil and Gas Extraction (0.24)%
|
||||||||
|
Apache Corp.
|
(4,179
|
)
|
(53,867
|
)
|
||||
|
Other Information Services (0.35)%
|
||||||||
|
Twitter, Inc.
|
(1,676
|
)
|
(77,951
|
)
|
||||
|
Performing Arts, Spectator Sports, and Related Industries (0.66)%
|
||||||||
|
Churchill Downs, Inc.
|
(195
|
)
|
(35,084
|
)
|
||||
|
Live Nation Entertainment, Inc.
|
(1,715
|
)
|
(112,590
|
)
|
||||
|
(147,674
|
)
|
|||||||
|
Petroleum and Coal Products Manufacturing (0.19)%
|
||||||||
|
Quaker Chemical Corp.
|
(177
|
)
|
(43,719
|
)
|
||||
|
Primary Metal Manufacturing (1.20)%
|
||||||||
|
Allegheny Technologies, Inc.
|
(2,728
|
)
|
(36,801
|
)
|
||||
|
Howmet Aerospace, Inc.
|
(2,025
|
)
|
(47,507
|
)
|
||||
|
Viavi Solutions, Inc.
|
(13,781
|
)
|
(186,664
|
)
|
||||
|
(270,972
|
)
|
|||||||
The accompanying notes are an integral part of these financial statements.
22
CONVERGENCE LONG/SHORT EQUITY FUND
|
Schedule of Securities Sold Short (Continued)
|
November 30, 2020
|
Shares
|
Value
|
|||||||
|
Professional, Scientific, and Technical Services (3.59)%
|
||||||||
|
Allogene Therapeutics, Inc.
|
(1,421
|
)
|
$
|
(44,122
|
)
|
|||
|
Alteryx, Inc. – Class A
|
(930
|
)
|
(111,451
|
)
|
||||
|
Axonics Modulation Technologies, Inc.
|
(1,717
|
)
|
(75,359
|
)
|
||||
|
Epizyme, Inc.
|
(3,709
|
)
|
(50,962
|
)
|
||||
|
F5 Networks, Inc.
|
(605
|
)
|
(98,500
|
)
|
||||
|
International Business Machines Corp.
|
(1,005
|
)
|
(124,138
|
)
|
||||
|
Pluralsight, Inc. – Class A
|
(7,268
|
)
|
(119,050
|
)
|
||||
|
Proofpoint, Inc.
|
(1,103
|
)
|
(114,149
|
)
|
||||
|
RealPage, Inc.
|
(564
|
)
|
(38,910
|
)
|
||||
|
Viela Bio, Inc.
|
(858
|
)
|
(32,896
|
)
|
||||
|
(809,537
|
)
|
|||||||
|
Publishing Industries (except Internet) (0.54)%
|
||||||||
|
PROS Holdings, Inc.
|
(2,848
|
)
|
(122,151
|
)
|
||||
|
Real Estate (0.12)%
|
||||||||
|
Kennedy-Wilson Holdings, Inc.
|
(1,622
|
)
|
(25,920
|
)
|
||||
|
Religious, Grantmaking, Civic, Professional,
|
||||||||
|
and Similar Organizations (0.40)%
|
||||||||
|
HealthEquity, Inc.
|
(1,253
|
)
|
(89,828
|
)
|
||||
|
Rental and Leasing Services (0.38)%
|
||||||||
|
Air Lease Corp.
|
(1,073
|
)
|
(39,240
|
)
|
||||
|
GATX Corp.
|
(597
|
)
|
(47,616
|
)
|
||||
|
(86,856
|
)
|
|||||||
|
Securities, Commodity Contracts, and Other Financial
|
||||||||
|
Investments and Related Activities (0.73)%
|
||||||||
|
Apollo Global Management, Inc.
|
(1,550
|
)
|
(67,611
|
)
|
||||
|
Brighthouse Financial, Inc.
|
(951
|
)
|
(33,380
|
)
|
||||
|
CME Group, Inc.
|
(361
|
)
|
(63,186
|
)
|
||||
|
(164,177
|
)
|
|||||||
|
Support Activities for Mining (0.49)%
|
||||||||
|
Diamondback Energy, Inc.
|
(1,560
|
)
|
(62,338
|
)
|
||||
|
Hess Corp.
|
(1,009
|
)
|
(47,605
|
)
|
||||
|
(109,943
|
)
|
|||||||
The accompanying notes are an integral part of these financial statements.
23
CONVERGENCE LONG/SHORT EQUITY FUND
|
Schedule of Securities Sold Short (Continued)
|
November 30, 2020
|
Shares
|
Value
|
|||||||
|
Telecommunications (0.88)%
|
||||||||
|
8x8, Inc.
|
(6,390
|
)
|
$
|
(126,330
|
)
|
|||
|
Telephone and Data Systems, Inc.
|
(3,774
|
)
|
(71,631
|
)
|
||||
|
(197,961
|
)
|
|||||||
|
Textile Mills (0.23)%
|
||||||||
|
Albany International Corp. – Class A
|
(757
|
)
|
(51,877
|
)
|
||||
|
Transit and Ground Passenger Transportation (0.37)%
|
||||||||
|
Lyft, Inc. – Class A
|
(2,209
|
)
|
(84,318
|
)
|
||||
|
Transportation Equipment Manufacturing (1.47)%
|
||||||||
|
Adient PLC (a)
|
(2,766
|
)
|
(86,548
|
)
|
||||
|
Boeing Co.
|
(293
|
)
|
(61,738
|
)
|
||||
|
HEICO Corp. – Class A
|
(408
|
)
|
(45,186
|
)
|
||||
|
Lear Corp.
|
(603
|
)
|
(86,199
|
)
|
||||
|
Westinghouse Air Brake Technologies Corp.
|
(713
|
)
|
(52,263
|
)
|
||||
|
(331,934
|
)
|
|||||||
|
Utilities (1.51)%
|
||||||||
|
ALLETE, Inc.
|
(1,040
|
)
|
(58,490
|
)
|
||||
|
Antero Midstream Corp.
|
(9,041
|
)
|
(60,936
|
)
|
||||
|
Atmos Energy Corp.
|
(510
|
)
|
(48,904
|
)
|
||||
|
Essential Utilities, Inc.
|
(1,018
|
)
|
(46,095
|
)
|
||||
|
New Jersey Resources Corp.
|
(525
|
)
|
(17,341
|
)
|
||||
|
SJW Group
|
(751
|
)
|
(49,266
|
)
|
||||
|
South Jersey Industries, Inc.
|
(2,572
|
)
|
(59,207
|
)
|
||||
|
(340,239
|
)
|
|||||||
|
Water Transportation (0.16)%
|
||||||||
|
Norwegian Cruise Line Holdings Ltd. (a)
|
(1,615
|
)
|
(36,935
|
)
|
||||
|
TOTAL COMMON STOCKS (Proceeds $10,126,792)
|
(9,946,810
|
)
|
||||||
The accompanying notes are an integral part of these financial statements.
24
CONVERGENCE LONG/SHORT EQUITY FUND
|
Schedule of Securities Sold Short (Continued)
|
November 30, 2020
|
Shares
|
Value
|
|||||||
|
REAL ESTATE INVESTMENT TRUSTS (2.00)%
|
||||||||
|
Accommodation (0.14)%
|
||||||||
|
Sunstone Hotel Investors, Inc.
|
(2,910
|
)
|
$
|
(30,555
|
)
|
|||
|
Real Estate (1.86)%
|
||||||||
|
AGNC Investment Corp.
|
(4,482
|
)
|
(68,485
|
)
|
||||
|
Chimera Investment Corp.
|
(7,666
|
)
|
(78,653
|
)
|
||||
|
Equity Commonwealth
|
(1,461
|
)
|
(38,731
|
)
|
||||
|
Healthpeak Properties, Inc.
|
(1,295
|
)
|
(37,374
|
)
|
||||
|
Host Hotels & Resorts, Inc.
|
(2,459
|
)
|
(34,500
|
)
|
||||
|
PS Business Parks, Inc.
|
(286
|
)
|
(37,695
|
)
|
||||
|
Rexford Industrial Realty, Inc.
|
(595
|
)
|
(28,512
|
)
|
||||
|
UDR, Inc.
|
(984
|
)
|
(37,854
|
)
|
||||
|
VEREIT, Inc.
|
(4,059
|
)
|
(28,778
|
)
|
||||
|
Vornado Realty Trust
|
(749
|
)
|
(29,144
|
)
|
||||
|
(419,726
|
)
|
|||||||
|
TOTAL REAL ESTATE INVESTMENT TRUSTS
|
||||||||
|
(Proceeds $474,023)
|
(450,281
|
)
|
||||||
|
Total Securities Sold Short (Proceeds $10,600,815)
|
$
|
(10,397,091
|
)
|
|||||
|
(a)
|
Foreign issued security.
|
Abbreviations:
|
Ltd.
|
Limited Liability Company.
|
|
PLC
|
Public Limited Company.
|
The accompanying notes are an integral part of these financial statements.
25
CONVERGENCE LONG/SHORT EQUITY FUND
|
Statement of Assets and Liabilities
|
November 30, 2020
|
Assets
|
||||
|
Investments, at value (cost $24,898,317)
|
$
|
32,658,748
|
||
|
Deposit for short sales at broker
|
503,257
|
|||
|
Dividends and interest receivable
|
32,743
|
|||
|
Receivable for Fund shares sold
|
1,040
|
|||
|
Other assets
|
13,113
|
|||
|
Total Assets
|
33,208,901
|
|||
|
Liabilities
|
||||
|
Securities sold short, at value (proceeds $10,600,815)
|
10,397,091
|
|||
|
Payable for Fund shares redeemed
|
200,602
|
|||
|
Dividends payable on short positions
|
6,867
|
|||
|
Payable to broker for interest expense
|
2,614
|
|||
|
Payable to Adviser
|
9,056
|
|||
|
Payable to affiliates
|
29,855
|
|||
|
Accrued expenses and other liabilities
|
25,954
|
|||
|
Total Liabilities
|
10,672,039
|
|||
|
Net Assets
|
$
|
22,536,862
|
||
|
Net Assets Consist Of:
|
||||
|
Paid-in capital
|
14,867,567
|
|||
|
Total Distributable Earnings
|
7,669,295
|
|||
|
Net Assets
|
$
|
22,536,862
|
||
|
Institutional Class Shares
|
||||
|
Net Assets
|
$
|
22,536,862
|
||
|
Shares of beneficial interest outstanding (unlimited number of
|
||||
|
shares authorized, $0.001 par value)
|
1,606,299
|
|||
|
Net asset value, redemption price and offering price per share
|
$
|
14.03
|
||
The accompanying notes are an integral part of these financial statements.
26
CONVERGENCE LONG/SHORT EQUITY FUND
|
Statement of Operations
|
For the Year Ended November 30, 2020
|
Investment Income
|
||||
|
Dividend income
|
$
|
943,143
|
||
|
Interest income
|
200
|
|||
|
Total Investment Income
|
943,343
|
|||
|
Expenses
|
||||
|
Management fees
|
385,227
|
|||
|
Dividends on short positions
|
210,490
|
|||
|
Interest and broker expenses
|
135,363
|
|||
|
Administration fees
|
99,850
|
|||
|
Transfer agent fees and expenses
|
35,942
|
|||
|
Federal and state registration fees
|
23,526
|
|||
|
Legal fees
|
20,425
|
|||
|
Audit and tax fees
|
19,512
|
|||
|
Custody fees
|
14,748
|
|||
|
Chief Compliance Officer fees
|
12,820
|
|||
|
Trustees’ fees
|
11,787
|
|||
|
Fund accounting fees
|
10,121
|
|||
|
Reports to shareholders
|
5,272
|
|||
|
Insurance fees
|
3,733
|
|||
|
Other expenses
|
5,103
|
|||
|
Total Expenses
|
993,919
|
|||
|
Expense reimbursement due from Adviser (Note 4)
|
(71,496
|
)
|
||
|
Net Expenses
|
922,423
|
|||
|
Net Investment Income
|
20,920
|
|||
|
Realized and Unrealized Gain (Loss) on Investments
|
||||
|
Net realized gain (loss) from:
|
||||
|
Investments
|
5,918,578
|
|||
|
Short transactions
|
(4,756,954
|
)
|
||
|
Change in net unrealized appreciation (depreciation) on:
|
||||
|
Investments
|
(6,139,469
|
)
|
||
|
Short transactions
|
26,610
|
|||
|
Realized and Unrealized Loss on Investments
|
(4,951,235
|
)
|
||
|
Net Decrease in Net Assets from Operations
|
$
|
(4,930,315
|
)
|
|
The accompanying notes are an integral part of these financial statements.
27
CONVERGENCE LONG/SHORT EQUITY FUND
|
Statements of Changes in Net Assets
|
|
Year Ended
|
Year Ended
|
|||||||
|
November 30,
|
November 30,
|
|||||||
|
2020
|
2019
|
|||||||
|
From Operations
|
||||||||
|
Net investment income
|
$
|
20,920
|
$
|
700,498
|
||||
|
Net realized gain (loss) from:
|
||||||||
|
Investments
|
5,918,578
|
17,836,254
|
||||||
|
Short transactions
|
(4,756,954
|
)
|
5,477,679
|
|||||
|
Change in net unrealized
|
||||||||
|
appreciation (depreciation) on:
|
||||||||
|
Investments
|
(6,139,469
|
)
|
(11,657,784
|
)
|
||||
|
Short transactions
|
26,610
|
(10,267,477
|
)
|
|||||
|
Net decrease in net assets from operations
|
(4,930,315
|
)
|
2,089,170
|
|||||
|
From Distributions
|
||||||||
|
Net dividend and distributions
|
(15,480,309
|
)
|
(4,715,158
|
)
|
||||
|
Net decrease in net assets resulting
|
||||||||
|
from distributions paid
|
(15,480,309
|
)
|
(4,715,158
|
)
|
||||
|
From Capital Share Transactions
|
||||||||
|
Proceeds from shares sold – Institutional Class
|
2,181,815
|
10,685,731
|
||||||
|
Net asset value of shares issued in
|
||||||||
|
reinvestment of distributions to shareholders –
|
||||||||
|
Institutional Class
|
10,315,411
|
3,301,834
|
||||||
|
Payments for shares redeemed –
|
||||||||
|
Institutional Class
|
(37,290,525
|
)
|
(56,482,086
|
)
|
||||
|
Net decrease in net assets from capital
|
||||||||
|
share transactions
|
(24,793,299
|
)
|
(42,494,521
|
)
|
||||
|
Total Decrease In Net Assets
|
(45,203,923
|
)
|
(45,120,509
|
)
|
||||
|
Net Assets
|
||||||||
|
Beginning of year
|
67,740,785
|
112,861,294
|
||||||
|
End of year
|
$
|
22,536,862
|
$
|
67,740,785
|
||||
The accompanying notes are an integral part of these financial statements.
28
CONVERGENCE LONG/SHORT EQUITY FUND
|
Statement of Cash Flows
|
For the Year Ended November 30, 2020
|
CASH FLOWS FROM OPERATING ACTIVITIES:
|
||||
|
Net increase (decrease) in net assets resulting from operations
|
$
|
(4,930,315
|
)
|
|
|
Adjustments to reconcile net increase (decrease) in net assets from
|
||||
|
operations to net cash provided by operating activities:
|
||||
|
Purchases of investments
|
(127,287,517
|
)
|
||
|
Purchases of short-term investments, net
|
(104,294
|
)
|
||
|
Proceeds from sales of long-term investments
|
186,479,644
|
|||
|
Return of capital distributions provided by underlying investments
|
(29,782
|
)
|
||
|
Decrease in dividends and interest receivable
|
132,384
|
|||
|
Decrease in other assets
|
3,083
|
|||
|
Proceeds from securities sold short
|
74,213,620
|
|||
|
Purchases to cover securities sold short
|
(104,499,920
|
)
|
||
|
Decrease in dividends payable on short positions
|
(26,536
|
)
|
||
|
Decrease in payable to broker for interest expense
|
(3,578
|
)
|
||
|
Decrease in payable to Adviser
|
(47,322
|
)
|
||
|
Decrease in payable to affiliates, accrued expenses and other liabilities
|
(4,700
|
)
|
||
|
Unrealized depreciation on investments
|
6,139,469
|
|||
|
Unrealized appreciation on short transactions
|
(26,610
|
)
|
||
|
Net realized gain on investments
|
(5,918,578
|
)
|
||
|
Net realized loss on short transactions
|
4,756,954
|
|||
|
Net cash provided by operating activities
|
28,846,002
|
|||
|
CASH FLOWS FROM FINANCING ACTIVITIES:
|
||||
|
Proceeds from shares sold
|
2,180,775
|
|||
|
Payment on shares redeemed
|
(37,089,923
|
)
|
||
|
Cash distributions paid to shareholders
|
(5,164,898
|
)
|
||
|
Net cash used in financing activities
|
(40,074,046
|
)
|
||
|
Net change in cash
|
$
|
(11,228,044
|
)
|
|
|
CASH:
|
||||
|
Beginning Balance
|
11,731,301
|
|||
|
Ending Balance
|
$
|
503,257
|
||
|
SUPPLEMENTAL DISCLOSURES:
|
||||
|
Cash paid for interest
|
138,941
|
|||
|
Non-cash financing activities – distributions reinvested
|
10,315,411
|
|||
|
Non-cash financing activities – decrease in receivable for Fund shares sold
|
1,040
|
|||
|
Non-cash financing activities – decrease in payable for Fund shares redeemed
|
(200,602
|
)
|
||
|
RECONCILIATION OF RESTRICTED AND UNRESTRICTED CASH AT THE
|
||||
|
BEGINNING OF YEAR TO THE STATEMENT OF ASSETS AND LIABILITIES
|
||||
|
Cash
|
—
|
|||
|
Deposit for short sales at broker
|
11,731,301
|
|||
|
RECONCILIATION OF RESTRICTED AND UNRESTRICTED CASH AT THE
|
||||
|
END OF YEAR TO THE STATEMENT OF ASSETS AND LIABILITIES
|
||||
|
Cash
|
—
|
|||
|
Deposit for short sales at broker
|
503,257
|
|||
The accompanying notes are an integral part of these financial statements.
29
CONVERGENCE LONG/SHORT EQUITY FUND
|
Financial Highlights – Institutional Class
|
Net Asset Value, Beginning of Year
Income from investment operations:
Net investment income(1)
Net realized and unrealized gain on investments
Total from investment operations
Less distributions paid:
From net investment income
From net realized gains
Total distributions paid
Net Asset Value, End of Year
Total Return(2)
Supplemental Data and Ratios:
Net assets at end of year (000’s)
Ratio of expenses to average net assets:
Before waiver, expense reimbursement(3)
After waiver, expense reimbursement(3)
Ratio of net investment income to average net assets:
Before waiver, expense reimbursement
After waiver, expense reimbursement
Portfolio turnover rate
|
(1)
|
Per share net investment income was calculated using the daily average shares outstanding method.
|
|
(2)
|
Total return in the table represents the rate that the investor would have earned or lost on an investment in the Fund, assuming reinvestment of dividends.
|
|
(3)
|
The ratio of expenses to average net assets includes dividends on short positions, interest and broker expenses. The annualized before waiver, expense reimbursement and after waiver, expense reimbursement
ratios excluding dividends on short positions, interest and broker expenses were 1.69% and 1.50%, 1.32% and 1.32%, 1.27% and 1.27%, 1.28% and 1.28%, 1.31% and 1.31% for the periods ended November 30, 2020, November 30, 2019, November 30,
2018, November 30, 2017, November 30, 2016, respectively.
|
The accompanying notes are an integral part of these financial statements.
30
Per Share Data for a Share Outstanding Throughout Each Year
|
Year Ended November 30,
|
||||||||||||||||||
|
2020
|
2019
|
2018
|
2017
|
2016
|
||||||||||||||
|
$
|
19.76
|
$
|
19.83
|
$
|
21.03
|
$
|
18.47
|
$
|
18.63
|
|||||||||
|
0.01
|
0.14
|
0.01
|
0.04
|
0.11
|
||||||||||||||
|
(1.11
|
)
|
0.65
|
1.47
|
3.32
|
0.93
|
|||||||||||||
|
(1.10
|
)
|
0.79
|
1.48
|
3.36
|
1.04
|
|||||||||||||
|
(0.13
|
)
|
(0.07
|
)
|
(0.04
|
)
|
(0.18
|
)
|
(0.07
|
)
|
|||||||||
|
(4.50
|
)
|
(0.79
|
)
|
(2.64
|
)
|
(0.62
|
)
|
(1.13
|
)
|
|||||||||
|
(4.63
|
)
|
(0.86
|
)
|
(2.68
|
)
|
(0.80
|
)
|
(1.20
|
)
|
|||||||||
|
$
|
14.03
|
$
|
19.76
|
$
|
19.83
|
$
|
21.03
|
$
|
18.47
|
|||||||||
|
-7.68
|
%
|
4.72
|
%
|
7.69
|
%
|
18.81
|
%
|
6.04
|
%
|
|||||||||
|
$
|
22,537
|
$
|
67,741
|
$
|
112,861
|
$
|
128,565
|
$
|
125,815
|
|||||||||
|
2.58
|
%
|
2.18
|
%
|
2.20
|
%
|
2.11
|
%
|
2.21
|
%
|
|||||||||
|
2.39
|
%
|
2.18
|
%
|
2.20
|
%
|
2.11
|
%
|
2.21
|
%
|
|||||||||
|
(0.13
|
)%
|
0.76
|
%
|
0.03
|
%
|
0.20
|
%
|
0.65
|
%
|
|||||||||
|
0.06
|
%
|
0.76
|
%
|
0.03
|
%
|
0.20
|
%
|
0.65
|
%
|
|||||||||
|
251.72
|
%
|
239.08
|
%
|
193.55
|
%
|
214.61
|
%
|
260.81
|
%
|
|||||||||
The accompanying notes are an integral part of these financial statements.
31
CONVERGENCE LONG/SHORT EQUITY FUND
Notes to Financial Statements
November 30, 2020
|
(1)
|
Organization
|
|
Trust for Professional Managers (the “Trust”) was organized as a Delaware statutory trust under a Declaration of Trust dated May 29, 2001. The Trust is registered under the Investment Company Act of 1940, as
amended (the “1940 Act”), as an open-end management investment company. The Convergence Long/Short Equity Fund (the “Fund”) (formerly known as the Convergence Core Plus Fund) represents a distinct diversified series with its own investment
objectives and policies within the Trust. The investment objective of the Fund is long-term capital growth. The Trust may issue an unlimited number of shares of beneficial interest at $0.001 par value. The Fund became effective on December
29, 2009 and commenced operations on December 29, 2009. Costs incurred by the Fund in connection with the organization, registration and the initial public offering of shares were paid by Convergence Investment Partners, LLC (the “Adviser”),
the Fund’s investment adviser.
|
|
|
The Fund is an investment company and accordingly follows the investment company accounting and reporting guidance of the Financial Accounting Standards Board (“FASB”) Accounting Standard Codification Topic 946
“Financial Services–Investment Companies.”
|
|
|
(2)
|
Significant Accounting Policies
|
|
The following is a summary of significant accounting policies consistently followed by the Fund in the preparation of the financial statements. These policies are in conformity with generally accepted
accounting principles in the United States of America (“GAAP”).
|
|
|
(a) Investment Valuation
|
|
|
Each security owned by the Fund, including long and short positions of common stock and real estate investment trusts, that is listed on a securities exchange, except those listed on the NASDAQ Stock Market LLC
(“NASDAQ”), is valued at its last sale price on that exchange on the date as of which assets are valued. When the security is listed on more than one exchange, the Fund will use the price of the exchange that the Fund generally consider to
be the principal exchange on which the stock is traded.
|
|
|
Fund securities listed on NASDAQ will be valued at the NASDAQ Official Closing Price, which may not necessarily represent the last sale price. If there has been no sale on such exchange or on NASDAQ on such
day, the security shall be valued at, (i) the mean between the most recent quoted bid and asked prices at the close of the exchange on such day or (ii) the last sales price on the Composite Market for the day such security is being valued.
“Composite Market” means a consolidation of the trade information provided by national securities and foreign exchanges and over-the-counter markets, as published by an approved independent pricing service (“Pricing Service”).
|
|
|
Debt securities, including short-term debt instruments having a maturity of 60 days or less, are valued at the mean in accordance with prices supplied by a Pricing Service. Pricing Services may use various
valuation methodologies such as the mean between the bid and the asked prices, matrix pricing and other analytical pricing models as well as market transactions and dealer quotations. If a price is not available from a Pricing Service, the
most recent quotation obtained from one or more
|
32
CONVERGENCE LONG/SHORT EQUITY FUND
Notes to Financial Statements (Continued)
November 30, 2020
|
broker-dealers known to follow the issue will be obtained. Quotations will be valued at the mean between the bid and the offer. In the absence of available quotations, the securities will be priced at fair
value, as described below. Any discount or premium is accreted or amortized using the constant yield method until maturity.
|
|
|
Redeemable securities issued by open-end, registered investment companies are valued at the net asset value (“NAV”) of such companies for purchase and/or redemption orders placed on that day. If, on a
particular day, a share of an investment company is not listed on NASDAQ, such security’s fair value will be determined as described below. Money market mutual funds are valued at cost. If cost does not represent current market value the
securities will be priced at fair value.
|
|
|
When market quotations are not readily available, any security or other asset is valued at its fair value as determined under procedures approved by the Trust’s Board of Trustees. These fair value procedures
will also be used to price a security when corporate events, events in the securities market or world events cause the Adviser to believe that a security’s last sale price may not reflect its actual fair market value. The intended effect of
using fair value pricing procedures is to ensure that the Fund is accurately priced.
|
|
|
FASB Accounting Standards Codification, “Fair Value Measurements and Disclosures” Topic 820 (“ASC 820”), establishes an authoritative definition of fair value and sets out a hierarchy for measuring fair value.
ASC 820 requires an entity to evaluate certain factors to determine whether there has been a significant decrease in volume and level of activity for the security such that recent transactions and quoted prices may not be determinative of
fair value and further analysis and adjustment may be necessary to estimate fair value. ASC 820 also requires enhanced disclosures regarding the inputs and valuation techniques used to measure fair value in those instances as well as
expanded disclosure of valuation levels for each class of investments. These inputs are summarized in the three broad levels listed below:
|
|
Level 1—
|
Quoted prices in active markets for identical securities.
|
||
|
Level 2—
|
Other significant observable inputs (including quoted prices for similar securities, interest rates, prepayment speeds, credit risk, etc.).
|
||
|
Level 3—
|
Significant unobservable inputs (including a Fund’s own assumptions in determining the fair value of investments).
|
33
CONVERGENCE LONG/SHORT EQUITY FUND
Notes to Financial Statements (Continued)
November 30, 2020
|
The inputs or methodology used for valuing securities are not necessarily an indication of the risk associated with investing in those securities. The following is a summary of the inputs used to value the
Fund’s investments carried at fair value as of November 30, 2020:
|
|
Level 1
|
Level 2
|
Level 3
|
Total
|
||||||||||||||
|
Assets(1):
|
|||||||||||||||||
|
Investments
|
|||||||||||||||||
|
Common Stocks
|
$
|
32,060,013
|
$
|
—
|
$
|
—
|
$
|
32,060,013
|
|||||||||
|
Real Estate Investment Trusts
|
481,457
|
—
|
—
|
481,457
|
|||||||||||||
|
Short-Term Investments
|
117,278
|
—
|
—
|
117,278
|
|||||||||||||
|
Total Investments
|
32,658,748
|
—
|
—
|
32,658,748
|
|||||||||||||
|
Total Assets
|
$
|
32,658,748
|
$
|
—
|
$
|
—
|
$
|
32,658,748
|
|||||||||
|
Liabilities:
|
|||||||||||||||||
|
Securities Sold Short
|
|||||||||||||||||
|
Common Stocks
|
$
|
(9,946,810
|
)
|
$
|
—
|
$
|
—
|
$
|
(9,946,810
|
)
|
|||||||
|
Real Estate Investment Trusts
|
(450,281
|
)
|
—
|
—
|
(450,281
|
)
|
|||||||||||
|
Total Securities Sold Short
|
(10,397,091
|
)
|
—
|
—
|
(10,397,091
|
)
|
|||||||||||
|
Total Liabilities
|
$
|
(10,397,091
|
)
|
$
|
—
|
$
|
—
|
$
|
(10,397,091
|
)
|
|||||||
|
(1)
|
See the Schedule of Investments for industry classifications.
|
|
The Fund measures Level 3 activity as of the end of the period. For the year ended November 30, 2020, the Fund did not have any significant unobservable inputs (Level 3 securities) used in determining fair
value. Therefore, a reconciliation of assets in which significant unobservable inputs (Level 3) were used in determining fair value is not applicable.
|
|
|
The Fund did not invest in derivative securities or engage in hedging activities during the year ended November 30, 2020.
|
|
|
(b) Short Positions
|
|
|
The Fund may sell a security it does not own in anticipation of a decline in the fair value of that security. When a fund sells a security short, it must borrow the security sold short and deliver it to the
broker-dealer through which it made the short sale. A gain, limited to the price at which a fund sold the security short, or a loss, unlimited in size, will be recognized upon the termination of a short sale. For financial statement
purposes, an amount equal to the settlement amount is included in the Statement of Assets and Liabilities as a liability. The amount of the liability is subsequently marked-to-market to reflect the current value of the short positions.
Subsequent fluctuations in the market prices of the securities sold, but not yet purchased, may require purchasing the securities at prices which could differ from the amount reflected in the Statement of Assets and Liabilities. The Fund is
liable for any dividends or interest payable on securities while those securities are in a short position. Such amounts are recorded on the ex-dividend date as a dividend expense, and interest expense is accrued daily. As collateral for its
short positions, the Fund is required under the 1940 Act to maintain
|
34
CONVERGENCE LONG/SHORT EQUITY FUND
Notes to Financial Statements (Continued)
November 30, 2020
|
segregated assets consisting of cash, cash equivalents or liquid securities. The segregated assets are valued consistent with Note 2a above. The amount of segregated assets is required to be adjusted daily to
the extent additional collateral is required based on the change in fair value of the securities sold short. The Fund’s securities sold short and deposits for short sales are held with one major securities broker-dealer. The Fund does not
require this broker-dealer to maintain collateral in support of the receivable for proceeds on securities sold short.
|
|
|
(c) Federal Income Taxes
|
|
|
The Fund complies with the requirements of Subchapter M of the Internal Revenue Code, as amended, necessary to qualify as a regulated investment company and make the requisite distributions of income and
capital gains to their shareholders sufficient to relieve them from all or substantially all federal income taxes. Therefore, no federal income tax provision has been provided.
|
|
|
As of and during the year ended November 30, 2020, the Fund did not have a liability for any unrecognized tax benefits. The Fund recognizes interest and penalties, if any, related to unrecognized tax benefits
as income tax expense in the Statement of Operations. During the year ended November 30, 2020, the Fund did not incur any interest or penalties. The Fund is not subject to examination by U.S. taxing authorities for the tax periods prior to
the year ended November 30, 2017.
|
|
|
(d) Distributions to Shareholders
|
|
|
The Fund will distribute any net investment income and any net capital gains at least annually. Distributions from net realized gains for book purposes may include short-term capital gains. All short-term
capital gains are included in ordinary income for tax purposes. Distributions to shareholders are recorded on the ex-dividend date. The Fund may also pay a special distribution at the end of the calendar year to comply with federal tax
requirements.
|
|
|
(e) Use of Estimates
|
|
|
The preparation of financial statements in conformity with GAAP requires management to make estimates and assumptions that affect the reported amounts of assets and liabilities and disclosure of contingent
assets and liabilities at the date of the financial statements and the reported amounts of revenues and expenses during the reporting period. Actual results could differ from those estimates.
|
|
|
(f) Share Valuation
|
|
|
The NAV per share of the Fund is calculated by dividing the sum of the fair value of the securities held by the Fund, plus cash or other assets, minus all liabilities (including estimated accrued expenses) by
the total number of shares outstanding for the Fund, rounded to the nearest cent. The Fund’s shares will not be priced on the days on which the New York Stock Exchange is closed for trading. The Fund does not charge a redemption fee, and
therefore the offering and redemption price per share are equal to a Fund’s NAV per share.
|
35
CONVERGENCE LONG/SHORT EQUITY FUND
Notes to Financial Statements (Continued)
November 30, 2020
|
|
(g) Allocation of Income, Expenses and Gains/Losses
|
|
Expenses associated with a specific fund in the Trust are charged to that Fund. Common Trust expenses are typically allocated evenly between the funds of the Trust, or by other equitable means.
|
|
|
|
(h) Other
|
|
Investment transactions are recorded on the trade date. The Fund determines the gain or loss from investment transactions on the identified cost basis by comparing original cost of the security lot sold with
the net sale proceeds. Dividend income and expense is recognized on the ex-dividend date and interest income and expense is recognized on an accrual basis. Dividend income from real estate investment trusts (“REITs”) is recognized on the
ex-date and included in dividend income. The calendar year-end classification of distributions received from REITs during the fiscal year are reported subsequent to year end; accordingly, the Fund estimates the character of REIT
distributions based on the most recent information available and adjusts for actual classifications in the calendar year the information is reported.
|
|
|
Withholding taxes on foreign dividends, net of any reclaims, have been provided for in accordance with the Fund’s understanding of the applicable country’s tax rules and rates.
|
|
|
(3)
|
Federal Tax Matters
|
|
The tax character of distributions paid by the Fund during the fiscal years ended November 30, 2020 and November 30, 2019 was as follows:
|
|
November 30, 2020
|
November 30, 2019
|
||||||||
|
Ordinary Income
|
$
|
8,367,012
|
$
|
392,874
|
|||||
|
Long-Term Capital Gain
|
$
|
7,113,297
|
$
|
4,322,284
|
|||||
|
The Fund designated as long-term capital gain dividend, pursuant to Internal Revenue Code Section 852(b)(3), the amount necessary to reduce the earnings and profits of the Fund related to net capital gain to
zero for the tax year ended November 30, 2020. The Fund utilized earnings and profits distributed to shareholders on redemption of shares as part of the dividend paid deduction. The amounts designated as gain for the fiscal years ended
November 30, 2020 and 2019 were as follows:
|
|
November 30, 2020
|
November 30, 2019
|
||||||||
|
Long-term
|
$
|
1,075,752
|
$
|
8,405,679
|
|||||
36
CONVERGENCE LONG/SHORT EQUITY FUND
Notes to Financial Statements (Continued)
November 30, 2020
|
As of November 30, 2020, the components of distributable earnings on a tax basis were as follows:
|
|
Cost basis of investments for federal income tax purposes(1)
|
$
|
14,631,731
|
|||
|
Gross tax unrealized appreciation
|
$
|
8,523,078
|
|||
|
Gross tax unrealized depreciation
|
(875,152
|
)
|
|||
|
Net tax unrealized appreciation
|
7,647,926
|
||||
|
Undistributed ordinary income
|
24,835
|
||||
|
Undistributed long-term capital gain
|
—
|
||||
|
Total distributable earnings
|
24,835
|
||||
|
Other accumulated losses
|
(3,466
|
)
|
|||
|
Total distributable earnings
|
$
|
7,669,295
|
|||
|
(1) Includes securities sold short.
|
|
The tax basis of distributable earnings for tax and financial reporting purposes differs principally due to the deferral of losses on wash sales.
|
|
|
Income and capital gains distributions may differ from GAAP, primarily due to timing differences in the recognition of income, gains and losses, and equalization by the Fund. To the extent that these
differences are attributable to permanent book and tax accounting differences, the components of net assets have been adjusted.
|
|
|
Additionally, GAAP requires that certain components of net assets relating to permanent differences be reclassified between financial and tax reporting. These reclassifications are due to equalization and have
no effect on net assets or NAV per share. For the year ended November 30, 2020, the following table shows the reclassifications made:
|
|
Paid-in capital
|
$
|
1,075,752
|
|||
|
Total distributable earnings
|
$
|
(1,075,752
|
)
|
|
(4)
|
Investment Adviser
|
|
The Trust has an Investment Advisory Agreement (the “Agreement”) with the Adviser to furnish investment advisory services to the Fund. Under the terms of the Agreement, the Fund compensates the Adviser for its
management services at the annual rate of 1.00% of the Fund’s average daily net assets.
|
|
|
The Adviser has contractually agreed to waive its management fee and/or reimburse the Fund’s other expenses at least through the expiration dates listed below, at the discretion of the Adviser and the Board of
Trustees, to the extent necessary to ensure that the Fund’s operating expenses (exclusive of front-end or contingent deferred loads, Rule 12b-1 plan fees, shareholder servicing plan fees, taxes, leverage (i.e., any expenses incurred in
connection with borrowings made by the Fund), interest (including interest incurred in connection with bank and custody overdrafts), brokerage commissions and other transactional expenses, expenses incurred in connection with any merger or
reorganization, dividends or interest on short positions, acquired fund
|
37
CONVERGENCE LONG/SHORT EQUITY FUND
Notes to Financial Statements (Continued)
November 30, 2020
|
fees and expenses or extraordinary expenses such as litigation) do not exceed the expense limitation cap listed below of the Fund’s average daily net assets.
|
|
Expiration Date
|
Expense Limitation Cap
|
||
|
Institutional Class
|
March 30, 2022
|
1.50%
|
|
Any such waiver or reimbursement is subject to later adjustment to allow the Adviser to recoup amounts waived or reimbursed to the extent actual fees and expenses for a fiscal period do not exceed the lesser
of: (1) the Expense Limitation Cap in place at the time of the waiver or reimbursement; or (2) the Expense Limitation Cap in place at the time of the recoupment; provided, however, that the Adviser shall only be entitled to recoup such
amounts over the following three year period from the date of the waiver or reimbursement.
|
|
|
The following table shows the remaining waived or reimbursed expenses subject to potential recovery expiring during the fiscal period ending:
|
|
November 30, 2021
|
$
|
—
|
|||
|
November 30, 2022
|
—
|
||||
|
November 30, 2023
|
71,496
|
|
(5)
|
Related Party Transactions
|
|
U.S. Bancorp Fund Services, LLC, doing business as U.S. Bank Global Fund Services (“Fund Services” or the “Administrator”), acts as the Fund’s administrator under an Administration Agreement. The Administrator
prepares various federal and state regulatory filings, reports and returns for the Fund; prepares reports and materials to be supplied to the Trustees; monitors the activities of the Fund’s custodian, transfer agent and accountants;
coordinates the preparation and payment of the Fund’s expenses and reviews the Fund’s expense accruals. Fees incurred for the year ended November 30, 2020, and owed as of November 30, 2020 are as follows:
|
|
Incurred
|
Owed
|
||
|
$99,850
|
$17,089
|
|
Fund Services also serves as the fund accountant and transfer agent to the Fund. U.S. Bank National Association (“U.S. Bank”), an affiliate of Fund Services, serves as the Fund’s custodian. The Trust’s Chief
Compliance Officer is also an employee of Fund Services. Fees incurred for the year ended November 30, 2020, and owed as of November 30, 2020 are as follows:
|
|
Incurred
|
Owed
|
||||||||
|
Fund Accounting
|
$
|
10,121
|
$
|
1,697
|
|||||
|
Transfer Agency
|
$
|
35,942
|
$
|
5,340
|
|||||
|
Custody
|
$
|
14,748
|
$
|
3,607
|
|||||
|
Chief Compliance Officer
|
$
|
12,820
|
$
|
2,122
|
|||||
|
The Fund has a line of credit with U.S. Bank (see Note 9).
|
38
CONVERGENCE LONG/SHORT EQUITY FUND
Notes to Financial Statements (Continued)
November 30, 2020
|
The Fund previously entered into a securities lending agreement with US Bank. The agreement was terminated effective May 28, 2020.
|
|
|
Quasar Distributors, LLC (“Quasar” or the “Distributor”) acts as the Fund’s principal underwriter in a continuous public offering of the Fund’s shares. The Distributor was an affiliate of Fund Services and U.S.
Bank through March 30, 2020. Effective March 31, 2020, Foreside Financial Group, LLC (“Foreside”) acquired Quasar, from U.S. Bancorp. As a result of the acquisition, Quasar became a wholly-owned broker-dealer subsidiary of Foreside and is no
longer affiliated with U.S. Bancorp. The Trust’s Board of Trustees has approved a new Distribution Agreement to enable Quasar to continue serving as the Fund’s distributor.
|
|
|
Certain officers of the Fund are also employees of Fund Services. A Trustee of the Trust is affiliated with Fund Services and U.S. Bank.
|
|
|
(6)
|
Capital Share Transactions
|
|
Transactions in Institutional Class shares of the Fund was as follows:
|
|
Year Ended
|
Year Ended
|
||||||||
|
November 30, 2020
|
November 30, 2019
|
||||||||
|
Shares sold
|
162,978
|
572,917
|
|||||||
|
Shares reinvested
|
668,963
|
195,029
|
|||||||
|
Shares redeemed
|
(2,653,782
|
)
|
(3,030,259
|
)
|
|||||
|
Net decrease
|
(1,821,841
|
)
|
(2,262,313
|
)
|
|||||
|
(7)
|
Investment Transactions
|
|
The aggregate purchases and sales of securities, excluding short-term investments and securities sold short, for the Fund for the year ended November 30, 2020 is summarized below. There were no purchases or
sales of U.S. government securities for the Fund.
|
|
Purchases
|
$
|
127,287,517
|
|||
|
Sales
|
$
|
186,478,960
|
|
(8)
|
Beneficial Ownership
|
|
The beneficial ownership, either directly or indirectly, of more than 25% of the voting securities of a fund creates a presumption of control of the fund, under Section 2(a)(9) of the 1940 Act. At November 30,
2020, Exclusive Company Corp., and National Financial Services, LLC, for the benefit of others, held 33.44% and 28.33%, respectively, of the Convergence Long/Short Equity Fund’s outstanding shares.
|
|
|
(9)
|
Line of Credit
|
|
At November 30, 2020, the Convergence Long/Short Equity Fund had a line of credit in the amount of the lesser of 33.33% of the fair value of unencumbered assets of the Fund or $4,000,000 which matures August 7,
2021. Prior to August 8, 2020, the Fund had a line of credit in the amount of the lesser of 33.33% of the fair value of
|
39
CONVERGENCE LONG/SHORT EQUITY FUND
Notes to Financial Statements (Continued)
November 30, 2020
|
unencumbered assets of the Fund or $13,000,000. The unsecured line of credit is intended to provide short-term financing, if necessary, subject to certain restrictions, in connection with shareholder
redemptions. The credit facility is with the Fund’s custodian, U.S. Bank. Interest was accrued at the prime rate of 4.75% from January 1, 2020 through March 3, 2020, 4.25% from March 4, 2020 through March 15, 2020, and 3.25% thereafter. There
were no loans outstanding for the Fund as of November 30, 2020. The following table provides information regarding usage of the line of credit for the year ended November 30, 2020.
|
|
Average
|
Maximum
|
Maximum
|
||
|
Days
|
Amount of
|
Interest
|
Amount of
|
Borrowing
|
|
Utilized
|
Borrowing
|
Expense*
|
Borrowing
|
Dates
|
|
12/31/2019 &
|
||||
|
36
|
$126,278
|
$454
|
$404,000
|
1/1/2020
|
|
*
|
Interest expense is included within other expenses on the Statement of Operations.
|
|
(10)
|
Recent Market Events
|
|
U.S. and international markets have experienced significant periods of volatility in recent years due to a number of economic, political and global macro factors including the impact of the coronavirus
(“COVID-19”) as a global pandemic, which has resulted in related public health issues, growth concerns in the U.S. and overseas, temporary and permanent layoffs in the private sector, rising unemployment claims, and reduced consumer spending,
all of which may lead to a substantial economic downturn or recession in the U.S. and global economies. The recovery from the effects of COVID-19 is uncertain and may last for an extended period of time. These developments as well as other
events, could result in further market volatility and negatively affect financial asset prices, the liquidity of certain securities and the normal operations of securities exchanges and other markets. As a result, the risk environment remains
elevated. The Fund’s investment adviser will monitor developments and seek to manage the Fund in a manner consistent with achieving the Fund’s investment objective, but there can be no assurance that it will be successful in doing so.
|
|
|
(11)
|
Subsequent Events
|
|
On December 18, 2020, the Fund declared and paid distributions to shareholders of record as of December 17, 2020, from ordinary income in the amount of $62,000.
|
40
CONVERGENCE LONG/SHORT EQUITY FUND
Report of Independent Registered Public Accounting Firm
To the Shareholders of Convergence Long/Short Equity Fund and
Board of Trustees of Trust for Professional Managers
Opinion on the Financial Statements
We have audited the accompanying statement of assets and liabilities, including the schedules of investments and securities sold short, of Convergence Long/Short Equity Fund (the “Fund”), a series of Trust for
Professional Managers, as of November 30, 2020, the related statements of operations and cash flows for the year then ended, the statements of changes in net assets for each of the two years in the period then ended, the related notes, and the
financial highlights for each of the five years in the period then ended (collectively referred to as the “financial statements”). In our opinion, the financial statements present fairly, in all material respects, the financial position of the Fund
as of November 30, 2020, the results of its operations and its cash flows for the year then ended, the changes in net assets for each of the two years in the period then ended, and the financial highlights for each of the five years in the period
then ended, in conformity with accounting principles generally accepted in the United States of America.
Basis for Opinion
These financial statements are the responsibility of the Fund’s management. Our responsibility is to express an opinion on the Fund’s financial statements based on our audits. We are a public accounting firm
registered with the Public Company Accounting Oversight Board (United States) (“PCAOB”) and are required to be independent with respect to the Fund in accordance with the U.S. federal securities laws and the applicable rules and regulations of the
Securities and Exchange Commission and the PCAOB.
We conducted our audits in accordance with the standards of the PCAOB. Those standards require that we plan and perform the audit to obtain reasonable assurance about whether the financial statements are free of
material misstatement, whether due to error or fraud.
Our audits included performing procedures to assess the risks of material misstatement of the financial statements, whether due to error or fraud, and performing procedures that respond to those risks. Such procedures
included examining, on a test basis, evidence regarding the amounts and disclosures in the financial statements. Our procedures included confirmation of securities owned as of November 30, 2020, by correspondence with the custodian and brokers. Our
audits also included evaluating the accounting principles used and significant estimates made by management, as well as evaluating the overall presentation of the financial statements. We believe that our audits provide a reasonable basis for our
opinion.
We have served as the Fund’s auditor since 2009.

COHEN & COMPANY, LTD.
Cleveland, Ohio
January 28, 2021
41
CONVERGENCE LONG/SHORT EQUITY FUND
Basis for Trustees’ Approval of Investment Advisory Agreement
(Unaudited)
The Board of Trustees (the “Trustees”) of Trust for Professional Managers (the “Trust”) met on August 18, 2020 to consider the renewal of the Investment Advisory Agreement (the “Agreement”) between the Trust, on behalf
of the Convergence Long/Short Equity Fund (the “Fund” ), a series of the Trust, and Convergence Investment Partners, LLC, the Fund’s investment adviser (the “Adviser”). The Trustees also met at a prior meeting held on June 25, 2020 (the “June 25,
2020 Meeting”) to review materials related to the renewal of the Agreement. Prior to these meetings, the Trustees requested and received materials to assist them in considering the renewal of the Agreement. The materials provided contained
information with respect to the factors enumerated below, including a copy of the Agreement, a memorandum prepared by the Trust’s outside legal counsel discussing in detail the Trustees’ fiduciary obligations and the factors they should assess in
considering the renewal of the Agreement, detailed comparative information relating to the Fund’s performance, as well as the management fees and other expenses of the Fund, due diligence materials relating to the Adviser (including a due diligence
questionnaire completed on behalf of the Fund by the Adviser, the Adviser’s Form ADV, select financial statements of the Adviser, bibliographic information of the Adviser’s key management and compliance personnel, comparative fee information for the
Fund and a summary detailing key provisions of the Adviser’s written compliance program, including its code of ethics) and other pertinent information. The Trustees also received information periodically throughout the year that was relevant to the
Agreement renewal process, including performance, management fee and other expense information. Based on their evaluation of the information provided by the Adviser, in conjunction with the Fund’s other service providers, the Trustees, by a
unanimous vote (including a separate vote of the Trustees who are not “interested persons,” as that term is defined in the Investment Company Act of 1940, as amended (the “Independent Trustees”)), approved the continuation of the Agreement for an
additional one-year term ending August 31, 2021.
DISCUSSION OF FACTORS CONSIDERED
In considering the approval of the Agreement and reaching their conclusions, the Trustees reviewed and analyzed various factors that they determined were relevant, including the factors enumerated below.
1. NATURE, EXTENT AND QUALITY OF SERVICES PROVIDED TO THE FUND
The Trustees considered the nature, extent and quality of services provided by the Adviser to the Fund and the amount of time devoted by the Adviser’s staff to the Fund’s operations. The Trustees considered the
Adviser’s specific responsibilities in all aspects of day-to-day management of the Fund, as well as the qualifications, experience and responsibilities of David J. Abitz and Justin Neuberg, the Fund’s portfolio managers, and other key personnel at
the Adviser involved in the day-to-day activities of the Fund. The Trustees noted that the Adviser does not manage any other accounts that utilize strategies similar to those employed by the Fund. The Trustees reviewed information provided by the
Adviser in a due diligence summary, including the structure of the Adviser’s compliance program and discussed the Adviser’s marketing activities and its continuing commitment to the Fund. The Trustees noted that during the course of the prior year
they
42
CONVERGENCE LONG/SHORT EQUITY FUND
Basis for Trustees’ Approval of Investment Advisory Agreement
(Unaudited) (Continued)
had met with the Adviser to discuss various performance, marketing and compliance issues. The Trustees also noted any services that extended beyond portfolio management, and they considered the brokerage practices of
the Adviser. The Trustees discussed the Adviser’s handling of compliance matters, including the reports of the Trust’s chief compliance officer to the Trustees on the effectiveness of the Adviser’s compliance program. The Trustees also considered
the Adviser’s overall financial condition, as well as the implementation and operational effectiveness of the Adviser’s business continuity plan in response to the novel coronavirus (COVID-19) pandemic and challenges to day-to-day operations in a
predominately work-from-home environment. The Trustees concluded that the Adviser had sufficient quality and depth of personnel, resources, investment methods and compliance policies and procedures essential to performing its duties under the
Advisory Agreement and that the nature, overall quality and extent of the management services provided to the Fund, as well as the Adviser’s compliance program, were satisfactory and reliable.
2. INVESTMENT PERFORMANCE OF THE FUND AND THE ADVISER
The Trustees discussed the performance of the Fund for the quarter, one-year, three-year, five-year, ten-year and since inception periods ended March 31, 2020. In assessing the quality of the portfolio management
services provided by the Adviser, the Trustees also compared the short-term and longer-term performance of the Fund on both an absolute basis and in comparison to the Fund’s benchmark index, the Russell 3000 Total Return Index, and in comparison to a
peer group of U.S. open-end long-short equity funds in the Fund’s current Morningstar category as constructed by data presented by Morningstar Direct (the “Morningstar Peer Group”).
The Trustees noted that for each of the three-year and five-year periods ended March 31, 2020, the Fund’s performance was above the Morningstar Peer Group median. The Trustees noted that for each of the quarter and
one-year period ended March 31, 2020, the Fund’s performance was below the Morningstar Peer Group median for long-short equity funds. The Trustees also noted that for the quarter ended March 31, 2020, the Fund had outperformed the Russell 3000 Total
Return Index. The Trustees noted the Fund had underperformed the Russell 3000 Total Return Index for the one-year, three-year, five-year, ten-year and since inception periods ended March 31, 2020.
3. COSTS OF SERVICES PROVIDED AND PROFITS REALIZED BY THE ADVISER
The Trustees considered the cost of services and the structure of the Adviser’s fees, including a review of the expense analyses and other pertinent material with respect to the Fund. The Trustees reviewed the related
statistical information and other materials provided, including the comparative expenses, expense components and peer group selection. The Trustees also considered the cost structure of the Fund relative to the Morningstar Peer Group.
43
CONVERGENCE LONG/SHORT EQUITY FUND
Basis for Trustees’ Approval of Investment Advisory Agreement
(Unaudited) (Continued)
The Trustees also considered the overall profitability of the Adviser, reviewing the Adviser’s financial information and noted that the Adviser was providing subsidies for the Fund’s operations in the form of
management fee waivers. The Trustees also examined the level of profits realized by the Adviser from the fees payable under the Advisory Agreement and the expense subsidization undertaken by the Adviser with respect to the Fund, as well as the
Fund’s brokerage commissions and use of soft dollars by the Adviser. These considerations were based on materials requested by the Trustees and the Fund’s administrator specifically for the June 25, 2020 meeting and the August 18, 2020 meeting at
which the Advisory Agreement was formally considered, as well as the reports prepared by the Adviser over the course of the year.
The Trustees noted that the Fund’s contractual management fee of 1.00% was below the Morningstar Peer Group average of 1.14%. The Trustees noted that the Fund’s total expense ratio of 2.58% (which includes dividends
and interest expense on short positions) was above the Morningstar Peer Group average (which excludes Rule 12b-1 fees but includes dividends and interest expense on short positions) of 1.89%.
The Trustees concluded that the Fund’s expenses and the management fees paid to the Adviser were fair and reasonable in light of the comparative performance, expense and management fee information. The Trustees noted,
based on a profitability analysis prepared by the Adviser, that the Adviser’s profit from sponsoring the Fund had not been, and currently was not, excessive and the Adviser maintained adequate profit levels to support its services to the Fund from
the revenues of its overall investment advisory business.
4. EXTENT OF ECONOMIES OF SCALE AS THE FUND GROW
The Trustees compared the Fund’s expenses relative to its peer group and discussed realized and potential economies of scale. The Trustees also reviewed the structure of the Fund’s management fee and whether the Fund
was large enough to generate economies of scale for shareholders or whether economies of scale would be expected to be realized as Fund assets grow (and if so, how those economies of scale were being or would be shared with shareholders). The
Trustees noted that the Fund’s management fee structure did not contain any breakpoint reductions as the Fund’s assets grow in size, but that the feasibility of incorporating breakpoints would continue to be reviewed on a regular basis. With respect
to the Adviser’s fee structure, the Trustees concluded that the current fee structure was reasonable and reflected a sharing of economies of scale between the Adviser and the Fund at the Fund’s current asset levels.
5. BENEFITS DERIVED FROM THE RELATIONSHIP WITH THE FUND
The Trustees considered the direct and indirect benefits that could be realized by the Adviser from its association with the Fund. The Trustees examined the brokerage and commissions of the Adviser with respect to the
Fund. The Trustees concluded that the benefits the Adviser may receive, such as greater name recognition and increased ability to obtain research or brokerage services or attract additional investor assets, appear to be reasonable, and in many cases
may benefit the Fund.
44
CONVERGENCE LONG/SHORT EQUITY FUND
Basis for Trustees’ Approval of Investment Advisory Agreement
(Unaudited) (Continued)
CONCLUSIONS
The Trustees considered all of the foregoing factors. In considering the renewal of the Advisory Agreement, the Trustees did not identify any one factor as all-important, but rather considered these factors
collectively in light of the Fund’s surrounding circumstances. Based on this review, the Trustees, including a majority of the Independent Trustees, approved the continuation of the Advisory Agreement for an additional term ending August 31, 2021 as
being in the best interests of the Fund and its shareholders.
45
CONVERGENCE LONG/SHORT EQUITY FUND
Statement Regarding Liquidity Risk Management Program
In accordance with Rule 22e-4 under the Investment Company Act of 1940, as amended, Trust for Professional Managers (the “Trust”) has adopted and implemented a liquidity risk management program (the “Trust Program”).
As required under the Trust Program, Convergence Investment Partners, LLC (“Convergence”), the investment adviser to the Convergence Long/Short Equity Fund (the “Fund”), a series of the Trust, has adopted and implemented a liquidity risk management
program tailored specifically to the Fund (the “Adviser Program”). The Adviser Program seeks to promote effective liquidity risk management for the Fund and to protect Fund shareholders from dilution of their interests. The Board of Trustees (the
“Board”) of the Trust has approved Convergence as the administrator for the Adviser Program (the “Program Administrator”). The Program Administrator has further delegated administration of the Adviser Program to its Liquidity Risk Management
Committee, as may be constituted from time to time and which will be comprised of at least one Portfolio Manager, the Director of Operations and the Chief Compliance Officer. The Program Administrator is required to provide a written annual report to
the Board and the Trust’s chief compliance officer regarding the adequacy and effectiveness of the Adviser Program, including the operation of the Fund’s highly liquid investment minimum, if applicable, and any material changes to the Adviser
Program.
On October 14, 2020, the Board reviewed the Program Administrator’s written annual report for the period December 1, 2019 through June 30, 2020 (the “Report”). The Report provided an assessment of the Fund’s liquidity
risk: the risk that the Fund could not meet requests to redeem shares issued by the Fund without significant dilution of the remaining investors’ interests in the Fund. The Adviser Program assesses liquidity risk under both normal and reasonably
foreseeable stressed market conditions. The Program Administrator provides portfolio investment classification services, and the Report noted that the Fund primarily held investments that were classified as highly liquid during the review period. The
Report noted that the Fund’s portfolios are expected to continue to primarily hold highly liquid investments and the determination that the Fund be designated as a “primarily highly liquid fund” (as defined in Rule 22e-4) remains appropriate and the
Fund can therefore continue to rely on the exclusion in Rule 22e-4 from the requirements to determine and review a highly liquid investment minimum for the Fund and to adopt policies and procedures for responding to a highly liquid investment minimum
shortfall. The Report noted that there were no breaches of the Fund’s restriction on holding illiquid investments exceeding 15% of its net assets during the review period. The Report confirmed that the Fund’s investment strategy was appropriate for
an open-end management investment company. The Report also indicated that no material changes had been made to the Adviser Program during the review period.
The Program Administrator determined that the Fund is reasonably likely to be able to meet redemption requests without adversely affecting non-redeeming Fund shareholders through significant dilution. The Program
Administrator concluded that the Adviser Program was adequately designed and effectively implemented during the review period.
46
CONVERGENCE LONG/SHORT EQUITY FUND
Notice of Privacy Policy & Practices
(Unaudited)
We collect non-public personal information about you from the following sources:
|
•
|
information we receive about you on applications or other forms;
|
|
•
|
information you give us orally; and
|
|
•
|
information about your transactions with us or others.
|
We do not disclose any non-public personal information about our shareholders or former shareholders without the shareholder’s authorization, except as permitted by law or in response to inquiries from governmental
authorities. We may share information with affiliated parties and unaffiliated third parties with whom we have contracts for servicing the Fund. We will provide unaffiliated third parties with only the information necessary to carry out their
assigned responsibility. All shareholder records will be disposed of in accordance with applicable law. We maintain physical, electronic and procedural safeguards to protect your non-public personal information and require third parties to treat
your non-public personal information with the same high degree of confidentiality.
In the event that you hold shares of the Fund through a financial intermediary, including, but not limited to, a broker-dealer, bank or trust company, the privacy policy of your financial intermediary would govern how
your non-public personal information would be shared with unaffiliated third parties.
47
CONVERGENCE LONG/SHORT EQUITY FUND
Additional Information
(Unaudited)
Tax Information
For the year ended November 30, 2020, the Fund designated 27.97% of its ordinary income distribution as qualified dividend income under the Jobs and Growth Tax Relief Reconciliation Act of 2003.
For the year ended November 30, 2020, 28.42% of dividends paid from net ordinary income for the Fund qualified for the dividends received deduction available to corporate shareholders.
For the fiscal year ended November 30, 2020, the Fund designated 94.67% of its taxable ordinary income distributions as short-term capital gain distributions under Internal Revenue Code Section 871(k)(2)(c).
Indemnifications
Under the Trust’s organizational documents, its officers and Trustees are indemnified against certain liabilities arising out of the performance of their duties to the Fund. In addition, in the normal course of
business, the Fund enters into contracts that provide general indemnifications to other parties. The Fund’s maximum exposure under these arrangements is unknown as this would involve future claims that may be made against the Fund that have not yet
occurred. However, the Fund has not had prior claims or losses pursuant to these contracts and expect the risk of loss to be remote.
48
CONVERGENCE LONG/SHORT EQUITY FUND
Additional Information (Continued)
(Unaudited)
Information about Trustees
The business and affairs of the Trust are managed under the direction of the Board of Trustees. Information pertaining to the Trustees of the Trust is set forth below. The Statement of Additional Information includes
additional information about the Trustees and is available, without charge, upon request by calling 877-677-9414.
|
Other
|
|||||
|
Directorships
|
|||||
|
Term of
|
Number of
|
Principal
|
Held by
|
||
|
Office and
|
Portfolios
|
Occupation(s)
|
Trustee
|
||
|
Position(s)
|
Length
|
in Trust
|
During the
|
During the
|
|
|
Name, Address
|
Held with
|
of Time
|
Overseen
|
Past Five
|
Past Five
|
|
and Year of Birth
|
the Trust
|
Served
|
by Trustee
|
Years
|
Years
|
|
Independent Trustees
|
|||||
|
Michael D. Akers, Ph.D.
|
Trustee
|
Indefinite
|
20
|
Professor Emeritus,
|
Independent
|
|
615 E. Michigan St.
|
Term; Since
|
Department
|
Trustee, USA
|
||
|
Milwaukee, WI 53202
|
August 22,
|
of Accounting,
|
MUTUALS
|
||
|
Year of Birth: 1955
|
2001
|
(June 2019–
|
(an open-end
|
||
|
present), Professor,
|
investment
|
||||
|
Department
|
company with
|
||||
|
of Accounting,
|
two
|
||||
|
(2004–May 2019),
|
portfolios).
|
||||
|
Chair, Department
|
|||||
|
of Accounting
|
|||||
|
(2004–2017),
|
|||||
|
Marquette University.
|
|||||
|
Gary A. Drska
|
Trustee
|
Indefinite
|
20
|
Pilot,
|
Independent
|
|
615 E. Michigan St.
|
Term; Since
|
Frontier/Midwest
|
Trustee, USA
|
||
|
Milwaukee, WI 53202
|
August 22,
|
Airlines, Inc.
|
MUTUALS
|
||
|
Year of Birth: 1956
|
2001
|
(airline company)
|
(an open-end
|
||
|
(1986–present).
|
investment
|
||||
|
company with
|
|||||
|
two
|
|||||
|
portfolios).
|
49
CONVERGENCE LONG/SHORT EQUITY FUND
Additional Information (Continued)
(Unaudited)
|
Other
|
|||||
|
Directorships
|
|||||
|
Term of
|
Number of
|
Principal
|
Held by
|
||
|
Office and
|
Portfolios
|
Occupation(s)
|
Trustee
|
||
|
Position(s)
|
Length
|
in Trust
|
During the
|
During the
|
|
|
Name, Address
|
Held with
|
of Time
|
Overseen
|
Past Five
|
Past Five
|
|
and Year of Birth
|
the Trust
|
Served
|
by Trustee
|
Years
|
Years
|
|
Jonas B. Siegel
|
Trustee
|
Indefinite
|
20
|
Retired
|
Independent
|
|
615 E. Michigan St.
|
Term; Since
|
(2011–present);
|
Trustee,
|
||
|
Milwaukee, WI 53202
|
October 23,
|
Managing Director,
|
Gottex Trust
|
||
|
Year of Birth: 1943
|
2009
|
Chief Administrative
|
(an open-end
|
||
|
Officer (“CAO”) and
|
investment
|
||||
|
Chief Compliance
|
company)
|
||||
|
Officer (“CCO”),
|
(2010–2016);
|
||||
|
Granite Capital
|
Independent
|
||||
|
International Group,
|
Manager,
|
||||
|
L.P. (an investment
|
Ramius IDF
|
||||
|
management firm)
|
fund complex
|
||||
|
(1994–2011).
|
(two closed-
|
||||
|
end investment
|
|||||
|
companies)
|
|||||
|
(2010–2015);
|
|||||
|
Independent
|
|||||
|
Trustee, Gottex
|
|||||
|
Multi-Asset
|
|||||
|
Endowment
|
|||||
|
fund complex
|
|||||
|
(three closed-
|
|||||
|
end investment
|
|||||
|
companies)
|
|||||
|
(2010–2015);
|
|||||
|
Independent
|
|||||
|
Trustee,
|
|||||
|
Gottex Multi-
|
|||||
|
Alternatives
|
|||||
|
fund complex
|
|||||
|
(three closed-
|
|||||
|
end investment
|
|||||
|
companies)
|
|||||
|
(2010–2015).
|
50
CONVERGENCE LONG/SHORT EQUITY FUND
Additional Information (Continued)
(Unaudited)
|
Other
|
|||||
|
Directorships
|
|||||
|
Term of
|
Number of
|
Principal
|
Held by
|
||
|
Office and
|
Portfolios
|
Occupation(s)
|
Trustee
|
||
|
Position(s)
|
Length
|
in Trust
|
During the
|
During the
|
|
|
Name, Address
|
Held with
|
of Time
|
Overseen
|
Past Five
|
Past Five
|
|
and Year of Birth
|
the Trust
|
Served
|
by Trustee
|
Years
|
Years
|
|
Interested Trustee and Officers
|
|||||
|
Joseph C. Neuberger*
|
Chairperson
|
Indefinite
|
20
|
President
|
Trustee, Buffalo
|
|
615 E. Michigan St.
|
and
|
Term; Since
|
(2017–present),
|
Funds (an
|
|
|
Milwaukee, WI 53202
|
Trustee
|
August 22,
|
Chief Operating
|
open-end
|
|
|
Year of Birth: 1962
|
2001
|
Officer (2016–
|
investment
|
||
|
2020), Executive
|
company)
|
||||
|
Vice President
|
(2003–2017);
|
||||
|
(1994–2017), U.S.
|
Trustee, USA
|
||||
|
Bancorp Fund
|
MUTUALS
|
||||
|
Services, LLC.
|
(an open-end
|
||||
|
investment
|
|||||
|
company)
|
|||||
|
(2001–2018).
|
|||||
|
John P. Buckel
|
President
|
Indefinite
|
N/A
|
Vice President,
|
N/A
|
|
615 E. Michigan St.
|
and
|
Term; Since
|
U.S. Bancorp Fund
|
||
|
Milwaukee, WI 53202
|
Principal
|
January 24,
|
Services, LLC
|
||
|
Year of Birth: 1957
|
Executive
|
2013
|
(2004–present).
|
||
|
Officer
|
|||||
|
Jennifer A. Lima
|
Vice
|
Indefinite
|
N/A
|
Vice President,
|
N/A
|
|
615 E. Michigan St.
|
President,
|
Term; Since
|
U.S. Bancorp Fund
|
||
|
Milwaukee, WI 53202
|
Treasurer
|
January 24,
|
Services, LLC
|
||
|
Year of Birth: 1974
|
and
|
2013
|
(2002–present).
|
||
|
Principal
|
|||||
|
Financial
|
|||||
|
and
|
|||||
|
Accounting
|
|||||
|
Officer
|
51
CONVERGENCE LONG/SHORT EQUITY FUND
Additional Information (Continued)
(Unaudited)
|
Other
|
|||||
|
Directorships
|
|||||
|
Term of
|
Number of
|
Principal
|
Held by
|
||
|
Office and
|
Portfolios
|
Occupation(s)
|
Trustee
|
||
|
Position(s)
|
Length
|
in Trust
|
During the
|
During the
|
|
|
Name, Address
|
Held with
|
of Time
|
Overseen
|
Past Five
|
Past Five
|
|
and Year of Birth
|
the Trust
|
Served
|
by Trustee
|
Years
|
Years
|
|
Elizabeth B. Scalf
|
Chief
|
Indefinite
|
N/A
|
Senior Vice
|
N/A
|
|
615 E. Michigan St.
|
Compliance
|
Term; Since
|
President,
|
||
|
Milwaukee, WI 53202
|
Officer,
|
July 1,
|
U.S. Bancorp Fund
|
||
|
Year of Birth: 1985
|
Vice
|
2017
|
Services,
|
||
|
President
|
LLC (February
|
||||
|
and
|
2017–present);
|
||||
|
Anti-Money
|
Vice President and
|
||||
|
Laundering
|
Assistant CCO,
|
||||
|
Officer
|
Heartland Advisors,
|
||||
|
Inc. (December 2016–
|
|||||
|
January 2017);
|
|||||
|
Vice President and
|
|||||
|
CCO, Heartland
|
|||||
|
Group, Inc. (May
|
|||||
|
2016–November
|
|||||
|
2016); Vice
|
|||||
|
President, CCO and
|
|||||
|
Senior Legal Counsel
|
|||||
|
(May 2016–November
|
|||||
|
2016), Assistant CCO
|
|||||
|
and Senior Legal
|
|||||
|
Counsel (January
|
|||||
|
2016–April 2016),
|
|||||
|
Senior Legal and
|
|||||
|
Compliance Counsel
|
|||||
|
(2013–2015),
|
|||||
|
Heartland Advisors, Inc.
|
|||||
|
Jay S. Fitton
|
Secretary
|
Indefinite
|
N/A
|
Assistant Vice
|
N/A
|
|
615 E. Michigan St.
|
Term; Since
|
President, U.S.
|
|||
|
Milwaukee, WI 53202
|
July 22, 2019
|
Bancorp Fund
|
|||
|
Year of Birth: 1970
|
Services, LLC
|
||||
|
(2019–present);
|
|||||
|
Partner, Practus, LLP
|
|||||
|
(2018–2019);
|
|||||
|
Counsel, Drinker
|
|||||
|
Biddle & Reath
|
|||||
|
(2016–2018);
|
|||||
|
Counsel, Huntington
|
|||||
|
Bancshares Inc.
|
|||||
|
(2011–2015).
|
52
CONVERGENCE LONG/SHORT EQUITY FUND
Additional Information (Continued)
(Unaudited)
|
Other
|
|||||
|
Directorships
|
|||||
|
Term of
|
Number of
|
Principal
|
Held by
|
||
|
Office and
|
Portfolios
|
Occupation(s)
|
Trustee
|
||
|
Position(s)
|
Length
|
in Trust
|
During the
|
During the
|
|
|
Name, Address
|
Held with
|
of Time
|
Overseen
|
Past Five
|
Past Five
|
|
and Year of Birth
|
the Trust
|
Served
|
by Trustee
|
Years
|
Years
|
|
Kelly A. Burns
|
Assistant
|
Indefinite
|
N/A
|
Assistant Vice
|
N/A
|
|
615 E. Michigan St.
|
Treasurer
|
Term; Since
|
President, U.S.
|
||
|
Milwaukee, WI 53202
|
April 23,
|
Bancorp Fund
|
|||
|
Year of Birth: 1987
|
2015
|
Services, LLC
|
|||
|
(2011–present).
|
|||||
|
Melissa Aguinaga
|
Assistant
|
Indefinite
|
N/A
|
Assistant Vice
|
N/A
|
|
615 E. Michigan St.
|
Treasurer
|
Term; Since
|
President, U.S.
|
||
|
Milwaukee, WI 53202
|
July 1,
|
Bancorp Fund
|
|||
|
Year of Birth: 1987
|
2015
|
Services, LLC
|
|||
|
(2010–present).
|
|||||
|
Laura A. Carroll
|
Assistant
|
Indefinite
|
N/A
|
Assistant Vice
|
N/A
|
|
615 E. Michigan St.
|
Treasurer
|
Term; Since
|
President, U.S.
|
||
|
Milwaukee, WI 53202
|
August 20,
|
Bancorp Fund
|
|||
|
Year of Birth: 1985
|
2018
|
Services, LLC
|
|||
|
(2007–present).
|
|
*
|
Mr. Neuberger is deemed to be an “interested person” of the Trust as defined by the 1940 Act due to his position and material business relationship with the Trust.
|
53
A NOTE ON FORWARD LOOKING STATEMENTS (Unaudited)
Except for historical information contained in this report for the Fund, the matters discussed in this report may constitute forward-looking statements made pursuant to the safe-harbor provisions of the Private
Securities Litigation Reform Act of 1995. These include any adviser or portfolio manager predictions, assessments, analyses or outlooks for individual securities, industries, market sectors and/or markets. These statements involve risks and
uncertainties. In addition to the general risks described for the Fund in the current Prospectus, other factors bearing on this report include the accuracy of the Adviser’s or portfolio managers’ forecasts and predictions, and the appropriateness of
the investment programs designed by the Adviser or portfolio managers to implement their strategies efficiently and effectively. Any one or more of these factors, as well as other risks affecting the securities markets and investment instruments
generally, could cause the actual results of the Fund to differ materially as compared to benchmarks associated with the Fund.
ADDITIONAL INFORMATION (Unaudited)
The Fund has adopted proxy voting policies and procedures that delegate to the Adviser the authority to vote proxies. A description of the Fund’s proxy voting policies and procedures is available without charge, upon
request, by calling the Fund toll free at 1-877-677-9414. A description of these policies and procedures is also included in the Fund’s Statement of Additional Information, which is available on the SEC’s website at http://www.sec.gov.
The Fund’s proxy voting record for the most recent 12-month period ended June 30 is available without charge, upon request, by calling, toll free, 1-877-677-9414, or by accessing the SEC’s website at http://www.sec.gov.
The Fund files its complete schedules of portfolio holdings with the SEC for the first and third quarters of each fiscal year on Part F of Form N-PORT. Shareholders may view the Fund’s Form N-PORT reports on the SEC’s
website at www.sec.gov.
HOUSEHOLDING (Unaudited)
In an effort to decrease costs, the Fund intends to reduce the number of duplicate prospectuses and annual and semi-annual reports you receive by sending only one copy of each to those addresses shared by two or more
accounts and to shareholders the Fund reasonably believes are from the same family or household. Once implemented, if you would like to discontinue householding for your accounts, please call the Fund toll-free at 1-877-677-9414 to request individual
copies of these documents. Once the Fund receives notice to stop householding, the Fund will begin sending individual copies 30 days after receiving your request. This policy does not apply to account statements.
CONVERGENCE LONG/SHORT EQUITY FUND
|
Investment Adviser
|
Convergence Investment Partners, LLC
|
|
3801 PGA Boulevard
|
|
|
Suite 1001
|
|
|
Palm Beach Gardens, Florida 33410
|
|
|
Legal Counsel
|
Godfrey & Kahn, S.C.
|
|
833 East Michigan Street
|
|
|
Suite 1800
|
|
|
Milwaukee, Wisconsin 53202
|
|
|
Independent Registered Public
|
Cohen & Company, Ltd.
|
|
Accounting Firm
|
1350 Euclid Avenue
|
|
Suite 800
|
|
|
Cleveland, Ohio 44115
|
|
|
Transfer Agent, Fund Accountant and
|
U.S. Bancorp Fund Services, LLC
|
|
Fund Administrator
|
615 East Michigan Street
|
|
|
Milwaukee, Wisconsin 53202
|
|
Custodian
|
U.S. Bank National Association
|
|
Custody Operations
|
|
|
1555 North River Center Drive
|
|
|
Milwaukee, Wisconsin 53212
|
|
|
Distributor
|
Quasar Distributors, LLC
|
|
111 East Kilbourn Avenue
|
|
|
Suite 2200
|
|
|
Milwaukee, Wisconsin 53202
|
|
This report is intended for shareholders of the Fund and may not be used as sales literature unless preceded or accompanied by a current prospectus.
MN-ANNUAL
Item 2. Code of Ethics.
The registrant has adopted a code of ethics that applies to the registrant’s principal executive officer and principal financial officer. The registrant has not made any substantive amendments to its code of ethics during the period covered by
this report. The registrant has not granted any waivers from any provisions of the code of ethics during the period covered by this report. Incorporated by reference to the registrant’s Form N-CSR filed on
February 3, 2017.
Item 3. Audit Committee Financial Expert.
The registrant’s board of trustees has determined that there is at least one audit committee financial expert serving on its audit committee. Dr. Michael Akers is the “audit committee financial expert” and is considered to be “independent” as
each term is defined in Item 3 of Form N‑CSR. Dr. Akers holds a Ph.D. in accountancy and is a professor Emeritus of accounting at Marquette University in Milwaukee, Wisconsin.
Item 4. Principal Accountant Fees and Services.
The registrant has engaged its principal accountant to perform audit services, audit-related services, tax services and other services during the past two fiscal years. “Audit services” refer to performing an audit of the registrant's annual
financial statements or services that are normally provided by the accountant in connection with statutory and regulatory filings or engagements for those fiscal years. “Audit-related services” refer to the assurance and related services by the
principal accountant that are reasonably related to the performance of the audit. “Tax services” refer to professional services rendered by the principal accountant for tax compliance, tax advice, and tax planning. The following table details the
aggregate fees billed or expected to be billed for each of the last two fiscal years for audit fees, audit-related fees, tax fees and other fees by the principal accountant.
|
FYE 11/30/2020
|
FYE 11/30/2019
|
|
|
Audit Fees
|
$16,500
|
$33,000
|
|
Audit-Related Fees
|
$0
|
$750
|
|
Tax Fees
|
$3,000
|
$6,000
|
|
All Other Fees
|
$0
|
$0
|
The audit committee has adopted pre-approval policies and procedures that require the audit committee to pre‑approve all audit and non‑audit services of the registrant, including services provided to any entity affiliated with the registrant.
The percentage of fees billed by Cohen & Company, Ltd. applicable to non-audit services pursuant to waiver of pre-approval
requirement were as follows:
|
FYE 11/30/2020
|
FYE 11/30/2019
|
|
|
Audit-Related Fees
|
0%
|
0%
|
|
Tax Fees
|
0%
|
0%
|
|
All Other Fees
|
0%
|
0%
|
All of the principal accountant’s hours spent on auditing the registrant’s financial statements were attributed to work performed by full‑time permanent employees of the principal accountant.
The following table indicates the non-audit fees billed or expected to be billed by the registrant’s accountant for services to the registrant and to the registrant’s investment adviser (and any other
controlling entity, etc.—not sub-adviser) for the last two years. The audit committee of the board of trustees/directors has considered whether the provision of non-audit services that were rendered to the registrant's investment adviser is
compatible with maintaining the principal accountant's independence and has concluded that the provision of such non-audit services by the accountant has not compromised the accountant’s independence.
|
Non-Audit Related Fees
|
FYE 11/30/2020
|
FYE 11/30/2019
|
|
Registrant
|
0
|
0
|
|
Registrant’s Investment Adviser
|
0
|
0
|
Item 5. Audit Committee of Listed Registrants.
Not applicable to registrants who are not listed issuers (as defined in Rule 10A-3 under the Securities Exchange Act of 1934).
Item 6. Investments.
|
(a)
|
Schedule of Investments is included as part of the report to shareholders filed under Item 1 of this Form.
|
|
(b)
|
Not Applicable.
|
Item 7. Disclosure of Proxy Voting Policies and Procedures for Closed-End Management Investment Companies.
Not applicable to open-end investment companies.
Item 8. Portfolio Managers of Closed-End Management Investment Companies.
Not applicable to open-end investment companies.
Item 9. Purchases of Equity Securities by Closed‑End Management Investment Company and Affiliated Purchasers.
Not applicable to open-end investment companies.
Item 10. Submission of Matters to a Vote of Security Holders.
There have been no material changes to the procedures by which shareholders may recommend nominees to the registrant’s board of trustees.
Item 11. Controls and Procedures.
|
(a)
|
The Registrant’s President and Treasurer have reviewed the Registrant's disclosure controls and procedures (as defined in Rule 30a-3(c) under the Investment Company Act of 1940 (the “Act”)) as of a date within 90 days of the filing of
this report, as required by Rule 30a-3(b) under the Act and Rules 13a-15(b) or 15d‑15(b) under the Securities Exchange Act of 1934. Based on their review, such officers have concluded that the disclosure controls and procedures are
effective in ensuring that information required to be disclosed in this report is appropriately recorded, processed, summarized and reported and made known to them by others within the Registrant and by the Registrant’s service provider.
|
|
(b)
|
There were no changes in the Registrant's internal control over financial reporting (as defined in Rule 30a-3(d) under the Act) that occurred during the second fiscal quarter of the period covered by this report that have materially
affected, or are reasonably likely to materially affect, the Registrant's internal control over financial reporting.
|
Item 12. Disclosure of Securities Lending Activities for Closed-End Management Investment Companies
Not applicable to open-end investment companies.
Item 13. Exhibits.
(3) Any written solicitation to purchase securities under Rule 23c‑1 under the Act sent or given during the period covered by the report by or on behalf of the registrant to 10 or
more persons. Not applicable to open-end investment companies.
(4) Change in the registrant’s independent public accountant. There was no change in the registrant’s independent public accountant for the period covered by this report.
SIGNATURES
Pursuant to the requirements of the Securities Exchange Act of 1934 and the Investment Company Act of 1940, the registrant has duly caused this report to be signed on its behalf by the undersigned, thereunto duly
authorized.
(Registrant) Trust for Professional Managers
By (Signature and Title)* /s/ John Buckel
John Buckel, President
Date 2/2/2021
Pursuant to the requirements of the Securities Exchange Act of 1934 and the Investment Company Act of 1940, this report has been signed below by the following persons on behalf of the registrant and in the capacities
and on the dates indicated.
By (Signature and Title)* /s/ John Buckel
John Buckel, President
Date 2/2/2021
By (Signature and Title)* /s/ Jennifer Lima
Jennifer Lima, Treasurer
Date 2/2/2021
* Print the name and title of each signing officer under his or her signature.