UNITED STATES
SECURITIES AND EXCHANGE COMMISSION
Washington, D.C. 20549
SECURITIES AND EXCHANGE COMMISSION
Washington, D.C. 20549
FORM N-CSR
CERTIFIED SHAREHOLDER REPORT OF REGISTERED
MANAGEMENT INVESTMENT COMPANIES
Investment Company Act file number 811-10401
Trust for Professional Managers
(Exact name of registrant as specified in charter)
(Exact name of registrant as specified in charter)
615 East Michigan Street
Milwaukee, WI 53202
(Address of principal executive offices) (Zip code)
(Address of principal executive offices) (Zip code)
Jay Fitton
U.S. Bancorp Fund Services, LLC
615 East Michigan Street
Milwaukee, WI 53202
(Name and address of agent for service)
(Name and address of agent for service)
(513) 629-8104
Registrant's telephone number, including area code
Date of fiscal year end: May 31, 2020
Date of reporting period: November 30, 2019
Item 1. Reports to Stockholders.
Semi-Annual Report
M.D. Sass Equity Income Plus Fund
M.D. Sass Short Term U.S. Government Agency Income Fund
November 30, 2019
Investment Advisers
M.D. Sass Investors Services, Inc.
M.D. Sass, LLC
55 West 46th Street
28th Floor
New York, New York 10036
Phone: 1-855-MDS-FUND (1-855-637-3863)
Beginning on January 1, 2021, as permitted by regulations adopted by the U.S. Securities and Exchange Commission, paper copies of the Funds’ annual and semi-annual shareholder reports will no longer be sent by mail,
unless you specifically request paper copies of the reports from the Funds or from your financial intermediary (such as a broker-dealer or bank). Instead, the reports will be made available on a website, and you will be notified by mail each time a
report is posted and provided with a website link to access the report.
If you already elected to receive shareholder reports electronically, you will not be affected by this change and you need not take any action. You may elect to receive shareholder reports and other communications from
the Funds electronically by contacting your financial intermediary or, if you are a direct investor, by calling the Funds at 1-855-637-3863.
You may elect to receive all future reports in paper free of charge. If you invest through a financial intermediary, you can contact your financial intermediary to request that you continue to receive paper copies of your shareholder reports; if
you invest directly with the Funds, you can call the Funds at 1-855-637-3863. Your election to receive reports in paper form will apply to all funds held in your account with your financial intermediary or, if you invest directly, to all M.D. Sass
Funds you hold.
Table of Contents
|
LETTERS TO SHAREHOLDERS
|
3
|
||
|
EXPENSE EXAMPLES
|
5
|
||
|
INVESTMENT HIGHLIGHTS
|
7
|
||
|
SCHEDULES OF INVESTMENTS
|
12
|
||
|
SCHEDULE OF WRITTEN OPTIONS
|
15
|
||
|
STATEMENTS OF ASSETS AND LIABILITIES
|
21
|
||
|
STATEMENTS OF OPERATIONS
|
22
|
||
|
STATEMENTS OF CHANGES IN NET ASSETS
|
23
|
||
|
FINANCIAL HIGHLIGHTS
|
25
|
||
|
NOTES TO FINANCIAL STATEMENTS
|
28
|
||
|
BASIS FOR TRUSTEES’ APPROVAL OF INVESTMENT ADVISORY AGREEMENTS
|
39
|
||
|
NOTICE OF PRIVACY POLICY & PRACTICES
|
45
|
||
|
ADDITIONAL INFORMATION
|
46
|
Dear Shareholder of the M.D. Sass Equity Income Plus Fund (the “Fund” or “MDEIX” or “MDEPX”),
Performance Review:
MDEIX returned +6.60% for the 6-month period ended November 30, 2019 (MDEPX returned +6.55% over the same period). The CBOE S&P 500 BuyWrite Index (BXM) returned +9.21% over the same time period.
As the market rose sharply during the period, our written calls being closer to at the money detracted value as did our market hedge via S&P 500 puts. In addition, stock positions such as EQM Midstream Partners
(EQM), Gildan Activewear (GIL), and Ball Corp. (BLL) negatively impacted performance. On the positive side, positions in Fortune Brands Home & Security Inc. (FBHS), Apollo Global Management (APO), and Northern Trust (NTRS) added value.
Market Outlook:
While market valuations are elevated in absolute terms, we think they are still reasonable relative to interest rates and the bull market of 2019 is not cause for concern when looking at it relative to longer term
market performance. In that context, we continue to focus the portfolio on stocks we believe will maintain positive earnings trajectory in a lower growth environment. Companies with strong balance sheets and less cyclical business models continue
to make up the bulk of our portfolio.
Organizational Update:
Please note that the Agreement and Plan of Reorganization for the Fund as previously communicated was approved at the Joint Special Meeting of Shareholders on November 15, 2019. As such, the Fund will reorganize into
the Integrity Dividend Harvest Fund, an existing series of The Integrity Funds, an open-end registered investment management company, on or about January 17, 2020. After the Reorganization, M.D. Sass, LLC will have no involvement in the management
of the Integrity Dividend Harvest Fund.
Past performance is not a guarantee of future results. Investment performance reflects fee waivers in effect. In the absence of such waivers, total return would be reduced.
Opinions expressed are those of the Fund, are subject to change, are not guaranteed and should not be considered investment advice. Growth stocks typically are more volatile than value stocks; however, value stocks
have a lower expected growth rate in earnings and sales. This report must be preceded or accompanied by a prospectus.
Mutual fund investing involves risk. Principal loss is possible. The Fund invests in mid-cap companies, which involves additional risks such as limited liquidity and greater volatility than large
capitalization companies. The Fund invests in options, which may be more volatile than investments directly in the underlying securities, involve additional costs and may involve a small initial investment relative to the risk assumed. When the
Fund writes a call option, its ability to participate in the capital appreciation of the underlying obligation is limited. There is no assurance that a closing transaction on a call option can be affected at a favorable price. During the option
period, the covered call writer has, in return for the premium received, given up the opportunity for capital appreciation above the exercise price should the market price of the underlying security increase, but has retained the risk of loss should
the price of the underlying security decline. If the Fund has purchased an index option and exercises it before the closing index value for that day is available, it runs the risk that the level of the underlying index may subsequently change. If
such a change causes the exercised option to fall out-of-the-money, the Fund will be required to pay the difference between the closing index value and the exercise price of the option (times the applicable multiplier) to the assigned writer. If an
index put option purchased by the Fund were permitted to expire without being exercised, its premium would represent a loss realized by the Fund. When the Fund invests in other investment companies, including exchange-traded funds (“ETFs”), it will
bear additional expenses based on its pro rata share of the other investment company’s or ETF’s operating expenses, including the potential duplication of management fees. The risk of owning an ETF generally reflects the risks of owning the
underlying investments the ETF holds. The Fund may participate in initial public offerings (“IPOs”) or secondary offerings which may result in a magnified impact on the performance of the Fund. IPOs and secondary offerings are frequently volatile in
price and may increase the turnover of the Fund, which may lead to increased expenses. The Fund invests in foreign securities which involve greater volatility and political, economic and currency risks and differences in accounting methods. These
risks are greater in emerging markets.
CBOE S&P 500 BuyWrite Index (BXM): The CBOE S&P 500 BuyWrite Index is a benchmark index designed to track the performance of a hypothetical buy-write strategy on the
S&P 500 Index. It is not possible to invest in an index.
Written call: Writing a call option means that one is selling a call option. If one sells a call, then you are obliged to sell stock at the strike price. A call written close to
or at the money has a strike price near the current price of the underlying stock.
Fund holdings and sector allocations are subject to change and should not be considered a recommendation to buy or sell any security.
References to other mutual funds or products should not be considered an offer of those securities.
For a complete list of Fund holdings please refer to the Schedule of Investments included in this report.
This Fund is distributed by Quasar Distributors, LLC through 1/17/2020.
3
Dear Shareholder of the M.D. Sass Short Term U.S. Government Agency Income Fund (the “Fund” or “MDSIX”),
Performance Review:
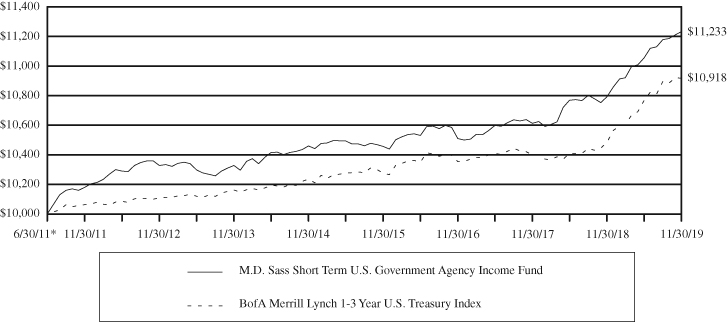
For the six-month period ended November 30, 2019, MDSIX returned +1.62%, while the BofA Merrill Lynch 1-3 Year U.S. Treasury Index returned +1.40%. During the period, interest rates fell spurring the Fund’s absolute
performance. In addition, our security selection within the Agency Mortgage Backed Securities space added value relative to the benchmark.
At the beginning of the period, Treasury yields declined significantly across the term structure as global growth forecasts decreased and expectations of easing monetary policy across major central banks continued.
Thereafter, the yield curve steepened and reversed the inversion of the 3-month and 10-year Treasury yields at the beginning of the period reflecting growing expectation of a truce in trade wars (in particular the one between U.S. and China), an
improving global economic outlook, and continuing accommodative monetary policy.
In July, the Federal Open Market Committee (“FOMC”) cut interest rates for the first time since the Global Financial Crisis, and subsequently cut the target Fed Funds rate another two times to 1.5-1.75%. The Fed noted
that the cuts were intended to ensure against downside risks from weak global growth and trade policy uncertainty, and to accelerate the return of inflation to the 2% target. However, Chair Powell noted that the Fed did not see “real economic
weakness” and tempered market expectations for an extended rate cutting cycle.
Risk assets performed well, bolstered by declining geopolitical risks and investors search for yield. In Europe, the Central Bank resumed its Corporate Sector Purchase Program. In Japan, the government announced a
significant fiscal stimulus package. In addition, the announcement of a Phase One trade deal between the U.S. and China all contributed to improving risk sentiment.
Market Outlook:
As the FOMC kept the target funds rate unchanged at 1.5%-1.75% at its December meeting, and indicated no hikes in 2020 for the funds rate projection, the short end of the yield curve should remain stable in the near
term. As for the intermediate and long end of the yield curve, lesser geopolitical risks and steady U.S. economic growth support higher yield levels, but are limited by low realized and expected inflation.
In our view, U.S. Government and Agency Mortgage Backed Securities yields remain a compelling standout amidst the spectrum of alternative high credit quality global alternatives, where the existence of negative rates
continues in many countries. In addition, we remain confident in the potential benefits of our high quality bond strategy as it continues to aim to be an effective vehicle to buffer against adverse market volatility.
Organizational Update:
The Agreement and Plan of Reorganization for the Fund as previously communicated was approved at the Joint Special Meeting of Shareholders on November 15, 2019. As such, the Fund will reorganize into the Integrity
Short Term Government Fund (the “New Fund”), a corresponding new series of The Integrity Funds, an open-end registrered investment management company, on or about January 17, 2020. After the Reorganization, Viking Fund Management, LLC will serve as
investment adviser for the New Fund and M.D. Sass Investors Services, Inc. will serve as sub-adviser for the New Fund. The New Fund will be managed pursuant to substantially the same investment policies and strategies as are currently set forth in
the Fund’s Prospectus and Statement of Additional Information.
Past performance is not a guarantee of future results.
Opinions expressed are those of the Fund, are subject to change, are not guaranteed and should not be considered investment advice.
Mutual fund investing involves risk. Principal loss is possible. Investments in debt securities typically decrease in value when interest rates rise. This risk is usually greater for longer-term
debt securities. However, the Fund only intends to invest in 1- to 3-year duration securities. Investments in U.S. Agency Mortgage Backed Securities include additional risks that investors should be aware of such as prepayment risk, extension risk,
and possible illiquidity. The federal government guarantees interest payments from government securities while the Fund offers no such guarantee. Government securities, if held to maturity, guarantee the timely payment of principal and interest.
Fund holdings and sector allocations are subject to change and should not be considered a recommendation to buy or sell any security. For a complete list of Fund holdings please refer to the Schedule of Investments
included in this report.
BofA Merrill Lynch 1-3 Year U.S. Treasury Index: An unmanaged index that tracks the performance of the direct sovereign debt of the U.S. Government having a maturity of at least
one year and less than three years. It is not possible to invest in an index.
References to other mutual funds or products should not be considered an offer of those securities.
This Fund is distributed by Quasar Distributors, LLC through 1/17/2020.
This report must be preceded or accompanied by a prospectus.
4
M.D. Sass Funds
Expense Examples
(Unaudited)
As a shareholder of the Funds, you incur two types of costs: (1) transaction costs and (2) ongoing costs, including management fees, distribution (12b-1) fees (Investor Class shares of the M.D. Sass Equity Income Plus
Fund only), shareholder servicing fees (Investor Class shares of the M.D. Sass Equity Income Plus Fund only) and other Fund expenses. These Examples are intended to help you understand your ongoing costs (in dollars) of investing in the Funds, and to
compare these costs with the ongoing costs of investing in other mutual funds. The Examples are based on an investment of $1,000 invested at the beginning of the period and held for the entire period (June 1, 2019 – November 30, 2019).
Actual Expenses
The first line under each share class in the following tables provides information about actual account values and actual expenses. Although the Funds charge no sales load, you will be assessed fees for outgoing wire
transfers, returned checks and stop payment orders at prevailing rates charged by U.S. Bancorp Fund Services, LLC, the Funds’ transfer agent. If you request that a redemption be made by wire transfer, currently a $15.00 fee is charged by the Funds’
transfer agent. Individual retirement accounts (“IRAs”) will be charged a $15.00 annual maintenance fee. To the extent the Funds invest in shares of exchange-traded funds or other investment companies as part of their investment strategy, you will
indirectly bear your proportionate share of any fees and expenses charged by the underlying funds in which the Funds invest in addition to the expenses of the Funds. Actual expenses of the underlying funds are expected to vary among the various
underlying funds. These Expenses are not included in the Examples. The Examples include, but are not limited to, advisory fees, fund administration and accounting, custody and transfer agent fees. You may use the information in this line, together
with the amount you invested, to estimate the expenses that you paid over the period. Simply divide your account value by $1,000 (for example, an $8,600 account value divided by $1,000 = 8.6), then multiply the result by the number in the first line
under the heading entitled “Expenses Paid During Period” to estimate the expenses you paid on your account during this period.
Hypothetical Example for Comparison Purposes
The second line under each share class in the following tables provides information about hypothetical account values and hypothetical expenses based on the Funds’ actual expense ratio and an assumed rate of return of
5% per year before expenses, which is not the Funds’ actual return. The hypothetical account values and expenses may not be used to estimate the actual ending account balance or expenses you paid for the period. You may use this information to
compare the ongoing costs of investing in the Funds and other funds. To do so, compare this 5% hypothetical Example with the 5% hypothetical examples that appear in the shareholder reports of other funds. Please note that the expenses shown in the
table are meant to highlight your ongoing costs only and do not reflect any transactional costs, such as sales charges (loads), redemption fees or exchange fees. Therefore, the second line under each share class in the following tables is useful in
comparing ongoing costs only, and will not help you determine the relative total costs of owning different funds. In addition, if these transactional costs were included, your costs would have been higher.
M.D. Sass Equity Income Plus Fund
|
Beginning
|
Ending
|
Expenses Paid
|
|
|
Account Value
|
Account Value
|
During Period(1)(2)
|
|
|
Institutional Class
|
|||
|
Actual
|
$1,000.00
|
$1,066.00
|
$3.87
|
|
Hypothetical (5% return before expenses)
|
$1,000.00
|
$1,021.25
|
$3.79
|
|
Investor Class
|
|||
|
Actual
|
$1,000.00
|
$1,065.50
|
$5.16
|
|
Hypothetical (5% return before expenses)
|
$1,000.00
|
$1,020.00
|
$5.05
|
|
(1)
|
The period is June 1, 2019 – November 30, 2019.
|
|
(2)
|
Expenses for the Institutional Class and Investor Class are equal to the annualized expense ratio of 0.75% and 1.00%, respectively, multiplied by the average account value over the period, multiplied by
183/366.
|
5
M.D. Sass Funds
Expense Examples (Continued)
(Unaudited)
M.D. Sass Short Term U.S. Government Agency Income Fund
|
Beginning
|
Ending
|
Expenses Paid
|
|
|
Account Value
|
Account Value
|
During Period(1)(2)
|
|
|
Institutional Class
|
|||
|
Actual
|
$1,000.00
|
$1,016.20
|
$2.77
|
|
Hypothetical (5% return before expenses)
|
$1,000.00
|
$1,022.25
|
$2.78
|
|
(1)
|
The period is June 1, 2019 – November 30, 2019.
|
|
(2)
|
Expenses for the Institutional Class are equal to the annualized expense ratio of 0.55%, multiplied by the average account value over the period, multiplied by 183/366.
|
6
M.D. Sass Equity Income Plus Fund
Investment Highlights
(Unaudited)
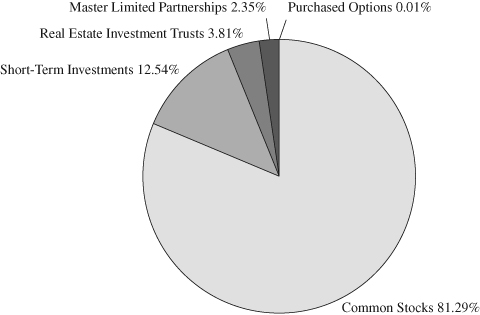
The Fund seeks to generate income as well as capital appreciation, while emphasizing downside protection. To achieve its investment objective, the Fund will normally invest in a diversified portfolio of rigorously
researched, dividend paying, common stocks that the Fund’s investment adviser believes are undervalued. The Fund’s investment adviser will also seek to enhance equity returns by writing (selling) covered call options with exercise prices that are
generally above the current market prices of the underlying stocks. Additionally, for hedging purposes, to protect the Fund from significant market declines that may occur before the expiration of the put option, the Fund will periodically buy put
options on equity security indices. The Fund’s allocation of portfolio holdings as of November 30, 2019 is shown below.
Allocation of Portfolio Holdings
(as a percentage of total investments)*
|
*
|
Written Options (6.62)%
|
Continued
7
M.D. Sass Equity Income Plus Fund – Institutional Class
Investment Highlights (Continued)
(Unaudited)
Total Returns – As of November 30, 2019
|
Annualized
|
|||||
|
Since
|
|||||
|
Six
|
One
|
Three
|
Five
|
Inception
|
|
|
Months
|
Year
|
Year
|
Year
|
(6/28/13)
|
|
|
M.D. Sass Equity Income Plus Fund –
|
|||||
|
Institutional Class
|
6.60%
|
8.56%
|
4.79%
|
2.65%
|
4.71%
|
|
CBOE S&P 500 BuyWrite Index
|
9.21%
|
5.77%
|
7.29%
|
7.05%
|
7.44%
|
|
S&P 500 Index
|
15.26%
|
16.11%
|
14.88%
|
10.98%
|
13.31%
|
Performance data quoted represents past performance and does not guarantee future results. The investment return and principal value of an investment will fluctuate so that an investor’s shares,
when redeemed, may be worth more or less than their original cost. Current performance of the Fund may be lower or higher than the performance quoted. Performance data current to the most recent month-end may be obtained by calling 1-855-MDS-FUND
(1-855-637-3863).
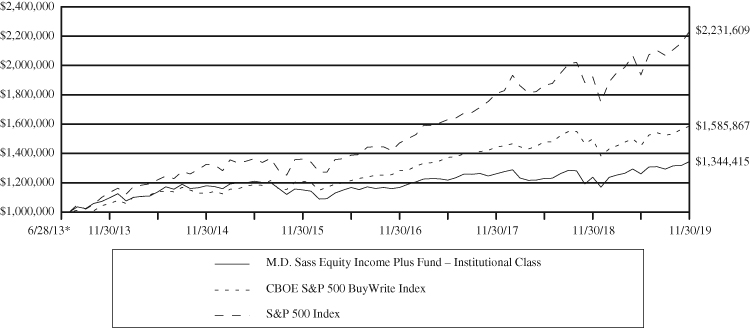
The returns shown assume reinvestment of Fund distributions and do not reflect the deduction of taxes that a shareholder would pay on Fund distributions or the redemption of Fund shares. The following graph
illustrates performance of a hypothetical investment made in the Fund and a broad-based securities index on the Fund’s inception date. The graph does not reflect any future performance.
The CBOE S&P 500 BuyWrite Index is designed to track the performance of a hypothetical buy-write strategy on the S&P 500 Index. The S&P 500 Index is a market-value weighted index consisting of 500 stocks
chosen for market size, liquidity, and industry group representation.
One cannot invest directly in an index.
|
|
| Growth of $1,000,000 Investment |
|
|
 |
|
|
|
*
|
Inception Date
|
8
M.D. Sass Equity Income Plus Fund – Investor Class
Investment Highlights (Continued)
(Unaudited)
Total Returns – As of November 30, 2019
|
Annualized
|
|||||
|
Since
|
|||||
|
Six
|
One
|
Three
|
Five
|
Inception
|
|
|
Months
|
Year
|
Year
|
Year
|
(6/28/13)
|
|
|
M.D. Sass Equity Income Plus Fund – Investor Class
|
6.55%
|
8.27%
|
4.50%
|
2.33%
|
4.41%
|
|
CBOE S&P 500 BuyWrite Index
|
9.21%
|
5.77%
|
7.29%
|
7.05%
|
7.44%
|
|
S&P 500 Index
|
15.26%
|
16.11%
|
14.88%
|
10.98%
|
13.31%
|
Performance data quoted represents past performance and does not guarantee future results. The investment return and principal value of an investment will fluctuate so that an investor’s shares,
when redeemed, may be worth more or less than their original cost. Current performance of the Fund may be lower or higher than the performance quoted. Performance data current to the most recent month-end may be obtained by calling 1-855-MDS-FUND
(1-855-637-3863).
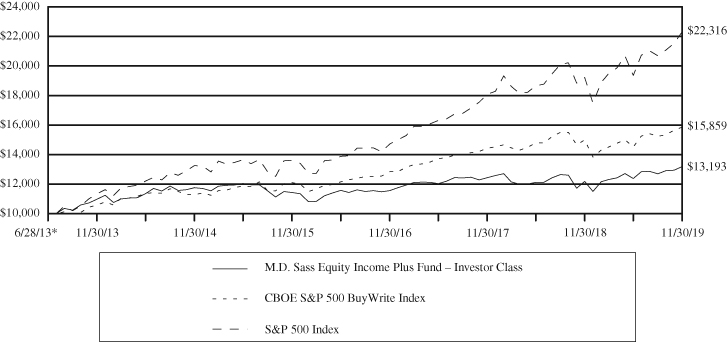
The returns shown assume reinvestment of Fund distributions and do not reflect the deduction of taxes that a shareholder would pay on Fund distributions or the redemption of Fund shares. The following graph
illustrates performance of a hypothetical investment made in the Fund and a broad-based securities index on the Fund’s inception date. The graph does not reflect any future performance.
The CBOE S&P 500 BuyWrite Index is designed to track the performance of a hypothetical buy-write strategy on the S&P 500 Index. The S&P 500 Index is a market-value weighted index consisting of 500 stocks
chosen for market size, liquidity, and industry group representation.
One cannot invest directly in an index.
|
|
| Growth of $10,000 Investment |
|
|
 |
|
|
|
*
|
Inception Date
|
9
M.D. Sass Short Term U.S. Government Agency Income Fund
Investment Highlights
(Unaudited)
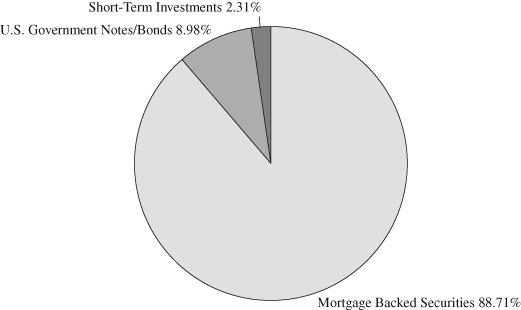
The Fund’s investment objective seeks to achieve a high and stable rate of total return, when and as opportunities are available in the context of preserving capital in adverse markets. To achieve its investment
objective, the Fund invests at least 95% of its assets in U.S. Government and agency mortgage backed securities (“Agency MBS”) and other securities issued or guaranteed by the U.S. Government, its agencies or instrumentalities (including Ginnie Mae,
Fannie Mae and Freddie Mac), and collateralized mortgage obligations (“CMOs”), backed by Agency MBS. Some of the Fund’s investments may be backed by the full faith and credit of the U.S. Government, while others may be supported only by the
discretionary authority of the U.S. Government or only by the credit of the issuing agency or instrumentality. The Fund’s allocation of portfolio holdings as of November 30, 2019 is shown below.
Allocation of Portfolio Holdings
(as a percentage of total investments)
Continued
10
M.D. Sass Short Term U.S. Government Agency Income Fund
Investment Highlights (Continued)
(Unaudited)
Total Returns – As of November 30, 2019
|
Annualized
|
|||||
|
Since
|
|||||
|
Six
|
One
|
Three
|
Five
|
Inception
|
|
|
Months
|
Year
|
Year
|
Year
|
(6/30/11)
|
|
|
M.D. Sass Short Term U.S. Government
|
|||||
|
Agency Income Fund
|
1.62%
|
4.09%
|
2.24%
|
1.44%
|
1.39%
|
|
BofA Merrill Lynch 1-3 Year U.S. Treasury Index
|
1.40%
|
4.15%
|
1.78%
|
1.30%
|
1.05%
|
Performance data quoted represents past performance and does not guarantee future results. The investment return and principal value of an investment will fluctuate so that an investor’s shares,
when redeemed, may be worth more or less than their original cost. Current performance of the Fund may be lower or higher than the performance quoted. Performance data current to the most recent month-end may be obtained by calling 1-855-MDS-FUND
(1-855-637-3863).
The returns shown assume reinvestment of Fund distributions and do not reflect the deduction of taxes that a shareholder would pay on Fund distributions or the redemption of Fund shares. The following graph
illustrates performance of a hypothetical investment made in the Fund and a broad-based securities index on the Fund’s inception date. The graph does not reflect any future performance.
The BofA Merrill Lynch 1-3 Year U.S. Treasury Index is an unmanaged index that tracks the performance of the direct sovereign debt of the U.S. Government having a maturity of at least one year and less than three
years.
One cannot invest directly in an index.
|
|
| Growth of $10,000 Investment |
|
|
 |
|
|
|
*
|
Inception Date
|
11
M.D. Sass Equity Income Plus Fund
|
Schedule of Investments
|
November 30, 2019 (Unaudited)
|
Shares
|
Value
|
|||||||
|
COMMON STOCKS* – 85.86%
|
||||||||
|
Aerospace & Defense – 3.25%
|
||||||||
|
Raytheon Co.
|
4,400
|
$
|
956,648
|
|||||
|
Banks – 4.60%
|
||||||||
|
Webster Financial Corp.
|
27,800
|
1,353,582
|
||||||
|
Building Products – 0.15%
|
||||||||
|
Fortune Brands Home & Security, Inc.
|
700
|
44,282
|
||||||
|
Capital Markets – 5.34%
|
||||||||
|
Apollo Global Management, Inc.
|
400
|
17,520
|
||||||
|
Northern Trust Corp.
|
14,500
|
1,554,980
|
||||||
|
1,572,500
|
||||||||
|
Chemicals – 4.09%
|
||||||||
|
Air Products & Chemicals, Inc.
|
5,100
|
1,205,283
|
||||||
|
Construction Materials – 2.60%
|
||||||||
|
Vulcan Materials Co.
|
5,400
|
766,098
|
||||||
|
Containers & Packaging – 3.48%
|
||||||||
|
Ball Corp.
|
15,500
|
1,023,930
|
||||||
|
Electrical Equipment – 3.55%
|
||||||||
|
Acuity Brands, Inc.
|
8,000
|
1,046,240
|
||||||
|
Entertainment – 3.76%
|
||||||||
|
Walt Disney Co.
|
7,300
|
1,106,534
|
||||||
|
Health Care Providers & Services – 2.93%
|
||||||||
|
Quest Diagnostics, Inc.
|
8,100
|
863,055
|
||||||
|
Hotels, Restaurants & Leisure – 6.85%
|
||||||||
|
Carnival Corp. (a)
|
19,200
|
865,536
|
||||||
|
Royal Caribbean Cruises Ltd. (a)
|
9,600
|
1,152,192
|
||||||
|
2,017,728
|
||||||||
|
Household Durables – 3.34%
|
||||||||
|
Lennar Corp.
|
16,500
|
984,225
|
||||||
|
Independent Power and Renewable Electricity Producers – 3.16%
|
||||||||
|
NRG Energy, Inc.
|
23,400
|
929,682
|
||||||
|
Insurance – 7.84%
|
||||||||
|
Chubb Ltd. (a)
|
6,400
|
969,472
|
||||||
|
MetLife, Inc.
|
26,800
|
1,337,588
|
||||||
|
2,307,060
|
||||||||
|
IT Services – 4.49%
|
||||||||
|
Sabre Corp.
|
58,900
|
1,321,127
|
||||||
The accompanying notes are an integral part of these financial statements.
12
M.D. Sass Equity Income Plus Fund
|
Schedule of Investments (Continued)
|
November 30, 2019 (Unaudited)
|
Shares
|
Value
|
|||||||
|
COMMON STOCKS* – 85.86% (Continued)
|
||||||||
|
Media – 3.90%
|
||||||||
|
Comcast Corp.
|
26,000
|
$
|
1,147,900
|
|||||
|
Multiline Retail – 5.14%
|
||||||||
|
Target Corp.
|
12,100
|
1,512,621
|
||||||
|
Pharmaceuticals – 4.03%
|
||||||||
|
Pfizer, Inc.
|
30,800
|
1,186,416
|
||||||
|
Semiconductors & Semiconductor Equipment – 2.87%
|
||||||||
|
NXP Semiconductors NV (a)
|
7,300
|
843,734
|
||||||
|
Software – 4.47%
|
||||||||
|
Microsoft Corp.
|
8,700
|
1,317,006
|
||||||
|
Textiles, Apparel & Luxury Goods – 2.47%
|
||||||||
|
Gildan Activewear, Inc. (a)
|
25,000
|
727,750
|
||||||
|
Tobacco – 3.55%
|
||||||||
|
Altria Group, Inc.
|
21,000
|
1,043,700
|
||||||
|
TOTAL COMMON STOCKS (Cost $22,365,105)
|
25,277,101
|
|||||||
|
MASTER LIMITED PARTNERSHIPS* – 2.48%
|
||||||||
|
Oil, Gas & Consumable Fuels – 2.48%
|
||||||||
|
EQM Midstream Partners LP
|
31,500
|
729,855
|
||||||
|
TOTAL MASTER LIMITED PARTNERSHIPS (Cost $1,777,894)
|
729,855
|
|||||||
|
REAL ESTATE INVESTMENT TRUSTS* – 4.02%
|
||||||||
|
VICI Properties, Inc.
|
47,900
|
1,184,567
|
||||||
|
TOTAL REAL ESTATE INVESTMENT TRUSTS (Cost $989,580)
|
1,184,567
|
|||||||
|
Notional
|
|||||||||||
|
Contracts
|
Value
|
||||||||||
|
PURCHASED OPTIONS – 0.01%
|
|||||||||||
|
EXCHANGE TRADED OR CENTRALLY CLEARED PUT OPTIONS
|
|||||||||||
|
SPDR S&P 500 ETF Trust
|
|||||||||||
|
Expiration: December 2019, Exercise Price: $283.00
|
150
|
$
|
4,714,650
|
3,450
|
|||||||
|
TOTAL PURCHASED OPTIONS (Cost $74,785)
|
3,450
|
||||||||||
The accompanying notes are an integral part of these financial statements.
13
M.D. Sass Equity Income Plus Fund
|
Schedule of Investments (Continued)
|
November 30, 2019 (Unaudited)
|
Shares
|
Value
|
|||||||
|
SHORT-TERM INVESTMENTS – 13.24%
|
||||||||
|
First American Government Obligations Fund, Class X, 1.559% (b)
|
3,898,470
|
$
|
3,898,470
|
|||||
|
TOTAL SHORT-TERM INVESTMENTS (Cost $3,898,470)
|
3,898,470
|
|||||||
|
Total Investments (Cost $29,105,834) – 105.61%
|
31,093,443
|
|||||||
|
Liabilities in Excess of Other Assets – (5.61)%
|
(1,652,142
|
)
|
||||||
|
TOTAL NET ASSETS – 100.00%
|
$
|
29,441,301
|
||||||
Percentages are stated as a percent of net assets.
|
*
|
All or a portion of these securities may be subject to call options written.
|
|
(a)
|
Foreign issued security.
|
|
(b)
|
Seven day yield as of November 30, 2019.
|
The Schedule of Investments incorporates the Global Industry Classification Standard (GICS®). GICS was developed by and/or is the
exclusive property of MSCI, Inc. and Standard & Poors Financial Services LLC (“S&P”). GICS is a service mark of MSCI and S&P and has been licensed for use by U.S. Bancorp Fund Services, LLC.
The accompanying notes are an integral part of these financial statements.
14
M.D. Sass Equity Income Plus Fund
|
Schedule of Written Options
|
November 30, 2019 (Unaudited)
|
Notional
|
||||||||||||
|
Contracts
|
Amount
|
Value
|
||||||||||
|
EXCHANGE TRADED OR CENTRALLY CLEARED CALL OPTIONS
|
||||||||||||
|
Acuity Brands, Inc.
|
||||||||||||
|
Expiration: December 2019, Exercise Price: $120.00
|
(80
|
)
|
$
|
(1,046,240
|
)
|
$
|
(96,800
|
)
|
||||
|
Air Products & Chemicals, Inc.
|
||||||||||||
|
Expiration: December 2019, Exercise Price: $220.00
|
(51
|
)
|
(1,205,283
|
)
|
(87,720
|
)
|
||||||
|
Altria Group, Inc.
|
||||||||||||
|
Expiration: January 2020, Exercise Price: $50.00
|
(210
|
)
|
(1,043,700
|
)
|
(22,890
|
)
|
||||||
|
Apollo Global Management, Inc.
|
||||||||||||
|
Expiration: December 2019, Exercise Price: $40.00
|
(4
|
)
|
(17,520
|
)
|
(1,580
|
)
|
||||||
|
Ball Corp.
|
||||||||||||
|
Expiration: January 2020, Exercise Price: $62.50
|
(155
|
)
|
(1,023,930
|
)
|
(71,300
|
)
|
||||||
|
Carnival Corp. (a)
|
||||||||||||
|
Expiration: January 2020, Exercise Price: $47.50
|
(192
|
)
|
(865,536
|
)
|
(15,360
|
)
|
||||||
|
Chubb Ltd. (a)
|
||||||||||||
|
Expiration: January 2020, Exercise Price: $145.00
|
(64
|
)
|
(969,472
|
)
|
(48,320
|
)
|
||||||
|
Comcast Corp.
|
||||||||||||
|
Expiration: December 2019, Exercise Price: $47.50
|
(260
|
)
|
(1,147,900
|
)
|
(520
|
)
|
||||||
|
EQM Midstream Partners LP
|
||||||||||||
|
Expiration: April 2020, Exercise Price: $30.00
|
(315
|
)
|
(729,855
|
)
|
(14,175
|
)
|
||||||
|
Fortune Brands Home & Security, Inc.
|
||||||||||||
|
Expiration: December 2019, Exercise Price: $55.00
|
(7
|
)
|
(44,282
|
)
|
(5,950
|
)
|
||||||
|
Gildan Activewear, Inc. (a)
|
||||||||||||
|
Expiration: December 2019, Exercise Price: $35.00
|
(250
|
)
|
(727,750
|
)
|
(500
|
)
|
||||||
|
Lennar Corp.
|
||||||||||||
|
Expiration: January 2020, Exercise Price: $55.00
|
(165
|
)
|
(984,225
|
)
|
(95,040
|
)
|
||||||
|
MetLife, Inc.
|
||||||||||||
|
Expiration: January 2020, Exercise Price: $47.50
|
(268
|
)
|
(1,337,588
|
)
|
(83,080
|
)
|
||||||
|
Microsoft Corp.
|
||||||||||||
|
Expiration: December 2019, Exercise Price: $140.00
|
(87
|
)
|
(1,317,006
|
)
|
(104,487
|
)
|
||||||
|
Northern Trust Corp.
|
||||||||||||
|
Expiration: January 2020, Exercise Price: $100.00
|
(145
|
)
|
(1,554,980
|
)
|
(115,275
|
)
|
||||||
|
NRG Energy, Inc.
|
||||||||||||
|
Expiration: December 2019, Exercise Price: $40.00
|
(234
|
)
|
(929,682
|
)
|
(17,550
|
)
|
||||||
|
NXP Semiconductors NV (a)
|
||||||||||||
|
Expiration: January 2020, Exercise Price: $105.00
|
(73
|
)
|
(843,734
|
)
|
(88,148
|
)
|
||||||
|
Pfizer, Inc.
|
||||||||||||
|
Expiration: December 2019, Exercise Price: $40.00
|
(308
|
)
|
(1,186,416
|
)
|
(4,004
|
)
|
||||||
|
Quest Diagnostics, Inc.
|
||||||||||||
|
Expiration: January 2020, Exercise Price: $95.00
|
(81
|
)
|
(863,055
|
)
|
(90,720
|
)
|
||||||
|
Raytheon Co.
|
||||||||||||
|
Expiration: January 2020, Exercise Price: $180.00
|
(44
|
)
|
(956,648
|
)
|
(166,760
|
)
|
||||||
|
Royal Caribbean Cruises Ltd. (a)
|
||||||||||||
|
Expiration: December 2019, Exercise Price: $105.00
|
(96
|
)
|
(1,152,192
|
)
|
(147,360
|
)
|
||||||
|
Sabre Corp.
|
||||||||||||
|
Expiration: January 2020, Exercise Price: $20.00
|
(589
|
)
|
(1,321,127
|
)
|
(159,030
|
)
|
||||||
|
Target Corp.
|
||||||||||||
|
Expiration: January 2020, Exercise Price: $105.00
|
(121
|
)
|
(1,512,621
|
)
|
(250,470
|
)
|
||||||
|
VICI Properties, Inc.
|
||||||||||||
|
Expiration: December 2019, Exercise Price: $22.50
|
(479
|
)
|
(1,184,567
|
)
|
(107,775
|
)
|
||||||
The accompanying notes are an integral part of these financial statements.
15
M.D. Sass Equity Income Plus Fund
|
Schedule of Written Options (Continued)
|
November 30, 2019 (Unaudited)
|
Notional
|
||||||||||||
|
Contracts
|
Amount
|
Value
|
||||||||||
|
EXCHANGE TRADED OR CENTRALLY CLEARED CALL OPTIONS (Continued)
|
||||||||||||
|
Vulcan Materials Co.
|
||||||||||||
|
Expiration: January 2020, Exercise Price: $130.00
|
(54
|
)
|
$
|
(766,098
|
)
|
$
|
(70,470
|
)
|
||||
|
Walt Disney Co.
|
||||||||||||
|
Expiration: December 2019, Exercise Price: $130.00
|
(73
|
)
|
(1,106,534
|
)
|
(160,381
|
)
|
||||||
|
Webster Financial Corp.
|
||||||||||||
|
Expiration: January 2020, Exercise Price: $50.00
|
(278
|
)
|
(1,353,582
|
)
|
(34,055
|
)
|
||||||
|
TOTAL WRITTEN OPTIONS (Premiums received $1,582,318)
|
$ | (2,059,720 | ) | |||||||||
|
(a)
|
Foreign issued security.
|
The accompanying notes are an integral part of these financial statements.
16
M.D. Sass Short Term U.S. Government Agency Income Fund
|
Schedule of Investments
|
November 30, 2019 (Unaudited)
|
Principal
|
||||||||
|
Amount
|
Value
|
|||||||
|
MORTGAGE BACKED SECURITIES – 88.92%
|
||||||||
|
Fannie Mae Pool
|
||||||||
|
890156, 5.000%, 05/01/2023
|
$
|
4,818
|
$
|
4,987
|
||||
|
995865, 4.500%, 07/01/2024
|
72,722
|
75,937
|
||||||
|
AL9541, 3.500%, 12/01/2026
|
177,913
|
184,378
|
||||||
|
47935, 4.844% (11th District Cost of Funds Index + 1.250%), 05/01/2027 (a)
|
1,209
|
1,239
|
||||||
|
AL8046, 3.500%, 01/01/2028
|
706,763
|
732,409
|
||||||
|
AL6206, 3.500%, 06/01/2028
|
355,419
|
370,657
|
||||||
|
252284, 6.500%, 01/01/2029
|
71,161
|
80,561
|
||||||
|
323591, 6.500%, 03/01/2029
|
16,949
|
18,880
|
||||||
|
AL5259, 3.500%, 05/01/2029
|
265,261
|
276,045
|
||||||
|
BM4202, 3.500%, 12/01/2029
|
173,610
|
180,634
|
||||||
|
AL9858, 3.000%, 03/01/2030
|
286,024
|
294,237
|
||||||
|
BM1231, 3.500%, 11/01/2031
|
421,053
|
436,441
|
||||||
|
MA0949, 3.500%, 01/01/2032
|
110,657
|
115,540
|
||||||
|
555326, 5.500%, 04/01/2033
|
153,133
|
172,651
|
||||||
|
555531, 5.500%, 06/01/2033
|
135,310
|
151,175
|
||||||
|
555592, 5.500%, 07/01/2033
|
36,789
|
41,284
|
||||||
|
748375, 3.789% (12 Month LIBOR USD + 1.117%), 08/01/2033 (a)
|
1,542
|
1,621
|
||||||
|
888073, 5.500%, 02/01/2035
|
26,397
|
29,496
|
||||||
|
745751, 5.500%, 09/01/2035
|
33,839
|
38,145
|
||||||
|
FM1487, 4.000%, 09/01/2039
|
88,499
|
92,656
|
||||||
|
MA3027, 4.000%, 06/01/2047
|
468,882
|
492,022
|
||||||
|
Fannie Mae REMICS
|
||||||||
|
2005-62, 4.750%, 07/25/2035
|
3,782
|
3,833
|
||||||
|
Fannie Mae-Aces
|
||||||||
|
2013-M13, 2.447%, 09/25/2020 (b)
|
437,791
|
437,563
|
||||||
|
2011-M4, 3.726%, 06/25/2021
|
237,088
|
241,645
|
||||||
|
2011-M8, 2.922%, 08/25/2021
|
222,942
|
225,147
|
||||||
|
FHLMC-GNMA
|
||||||||
|
G023, 2.158% (1 Month LIBOR USD + 0.450%), 11/25/2023 (a)
|
62,830
|
63,136
|
||||||
|
Freddie Mac Gold Pool
|
||||||||
|
G1-3272, 4.500%, 08/01/2020
|
316
|
327
|
||||||
|
G1-1838, 6.000%, 08/01/2020
|
187
|
187
|
||||||
|
G1-4904, 4.500%, 12/01/2021
|
3,789
|
3,917
|
||||||
|
G1-3007, 5.000%, 03/01/2023
|
28,431
|
29,565
|
||||||
|
G1-3390, 6.000%, 01/01/2024
|
21,557
|
22,327
|
||||||
|
G1-4160, 6.000%, 01/01/2024
|
1,031
|
1,038
|
||||||
|
G1-3610, 5.500%, 02/01/2024
|
19,648
|
20,428
|
||||||
|
G1-3692, 5.500%, 02/01/2024
|
10,719
|
11,108
|
||||||
|
J1-2635, 4.000%, 07/01/2025
|
48,907
|
51,063
|
||||||
|
G3-0289, 7.000%, 09/01/2025
|
73,193
|
75,742
|
||||||
|
J1-3273, 3.500%, 10/01/2025
|
78,399
|
81,288
|
||||||
|
G1-4350, 4.000%, 12/01/2026
|
78,165
|
81,825
|
||||||
|
G1-4441, 4.000%, 03/01/2027
|
184,664
|
194,482
|
||||||
The accompanying notes are an integral part of these financial statements.
17
M.D. Sass Short Term U.S. Government Agency Income Fund
|
Schedule of Investments (Continued)
|
November 30, 2019 (Unaudited)
|
Principal
|
||||||||
|
Amount
|
Value
|
|||||||
|
MORTGAGE BACKED SECURITIES – 88.92% (Continued)
|
||||||||
|
Freddie Mac Gold Pool (Continued)
|
||||||||
|
G1-6406, 3.000%, 01/01/2028
|
$
|
195,500
|
$
|
201,259
|
||||
|
G1-8601, 3.000%, 05/01/2031
|
458,744
|
472,237
|
||||||
|
G1-8702, 3.500%, 08/01/2033
|
157,251
|
163,259
|
||||||
|
G0-1584, 5.000%, 08/01/2033
|
66,146
|
73,119
|
||||||
|
G0-4913, 5.000%, 03/01/2038
|
60,564
|
66,960
|
||||||
|
H0-9207, 6.500%, 08/01/2038
|
23,099
|
26,167
|
||||||
|
Freddie Mac Multifamily Structured Pass Through Certificates
|
||||||||
|
K-714, 0.793%, 10/25/2020 (b)(c)
|
10,708,586
|
29,514
|
||||||
|
Q-001, 1.701%, 04/25/2021
|
260,035
|
259,118
|
||||||
|
K-J18, 2.455%, 03/25/2022
|
156,839
|
157,989
|
||||||
|
K-720, 0.640%, 06/25/2022 (b)(c)
|
9,156,901
|
98,473
|
||||||
|
K-023, 1.368%, 08/25/2022 (b)(c)
|
4,439,012
|
128,881
|
||||||
|
KI01, 1.945% (1 Month LIBOR USD + 0.160%), 09/25/2022 (a)
|
102,038
|
101,901
|
||||||
|
K-724, 0.382%, 11/25/2023 (b)(c)
|
4,972,991
|
47,517
|
||||||
|
K-J27, 2.092%, 07/25/2024
|
150,000
|
149,871
|
||||||
|
K-057, 1.325%, 07/25/2026 (b)(c)
|
2,669,612
|
172,902
|
||||||
|
Q-004, 2.957%, 01/25/2046 (b)
|
726,995
|
732,270
|
||||||
|
Q-007, 2.984%, 10/25/2047 (b)
|
178,041
|
181,667
|
||||||
|
Freddie Mac Pool
|
||||||||
|
ZS-8598, 3.000%, 02/01/2031
|
190,038
|
195,525
|
||||||
|
ZS-8686, 3.000%, 02/01/2033
|
336,332
|
345,442
|
||||||
|
RB-5012, 3.500%, 10/01/2039
|
99,362
|
102,998
|
||||||
|
Freddie Mac REMICS
|
||||||||
|
3414, 4.000%, 12/15/2019
|
0
|
0
|
||||||
|
3033, 4.500%, 09/15/2020
|
993
|
996
|
||||||
|
2649, 3.500%, 07/15/2023
|
6,696
|
6,714
|
||||||
|
2824, 5.000%, 07/15/2024
|
3,365
|
3,525
|
||||||
|
3784, 4.000%, 01/15/2026
|
21,770
|
22,428
|
||||||
|
2344, 6.500%, 08/15/2031
|
18,581
|
21,878
|
||||||
|
Freddie Mac Structured Pass-Through Certificates
|
||||||||
|
2017-SR01, 2.750%, 11/25/2022
|
250,000
|
254,012
|
||||||
|
FRESB Mortgage Trust
|
||||||||
|
2015-SB2, 2.086% (1 Month LIBOR USD + 2.086%), 07/25/2035 (a)
|
422,202
|
421,651
|
||||||
|
2015-SB7, 2.370% (1 Month LIBOR USD + 2.370%), 09/25/2035 (a)
|
502,463
|
502,673
|
||||||
|
2016-SB13, 2.060% (1 Month LIBOR USD + 2.060%), 01/25/2036 (a)
|
359,238
|
359,275
|
||||||
|
2016-SB16, 2.130% (1 Month LIBOR USD + 2.130%), 05/25/2036 (a)
|
372,631
|
373,243
|
||||||
|
2019-SB60, 3.070% (1 Month LIBOR USD + 3.070%), 01/25/2039 (b)
|
498,789
|
510,788
|
||||||
|
2015-SB3, 2.012% (1 Month LIBOR USD + 2.012%), 08/25/2042 (a)
|
36,236
|
36,199
|
||||||
|
Ginnie Mae I Pool
|
||||||||
|
782618X, 4.500%, 04/15/2024
|
179,959
|
185,607
|
||||||
|
741854X, 4.000%, 05/15/2025
|
96,052
|
100,086
|
||||||
The accompanying notes are an integral part of these financial statements.
18
M.D. Sass Short Term U.S. Government Agency Income Fund
|
Schedule of Investments (Continued)
|
November 30, 2019 (Unaudited)
|
Principal
|
||||||||
|
Amount
|
Value
|
|||||||
|
MORTGAGE BACKED SECURITIES – 88.92% (Continued)
|
||||||||
|
Government National Mortgage Association
|
||||||||
|
2013-101, 0.514%, 05/16/2035
|
$
|
208,387
|
$
|
206,081
|
||||
|
2013-55, 1.579%, 12/16/2042
|
363,040
|
358,931
|
||||||
|
2015-97, 2.400%, 04/16/2043
|
516,075
|
516,186
|
||||||
|
2011-6, 3.474%, 10/16/2044 (b)
|
30,850
|
30,832
|
||||||
|
2013-107, 0.422%, 11/16/2047 (b)(c)
|
4,144,043
|
66,559
|
||||||
|
2013-15, 0.584%, 08/16/2051 (b)(c)
|
5,204,610
|
204,221
|
||||||
|
2013-07, 0.351%, 05/16/2053 (b)(c)
|
7,267,035
|
160,273
|
||||||
|
2013-01, 0.656%, 02/16/2054 (b)(c)
|
4,577,938
|
148,756
|
||||||
|
2013-105, 0.454%, 06/16/2054 (b)(c)
|
3,435,897
|
53,915
|
||||||
|
2013-17, 0.750%, 06/16/2054 (b)(c)
|
6,197,043
|
177,920
|
||||||
|
2013-40, 0.764%, 06/16/2054 (b)(c)
|
4,141,692
|
150,211
|
||||||
|
2013-101, 0.541%, 10/16/2054 (b)(c)
|
4,782,144
|
130,990
|
||||||
|
2013-156, 0.707%, 06/16/2055 (b)(c)
|
5,202,149
|
158,131
|
||||||
|
2014-155, 1.123%, 08/16/2055 (b)(c)
|
1,501,850
|
81,588
|
||||||
|
2014-01, 0.349%, 09/16/2055 (b)(c)
|
6,463,868
|
140,576
|
||||||
|
2014-54, 0.435%, 09/16/2055 (b)(c)
|
5,327,742
|
146,294
|
||||||
|
2014-73, 0.610%, 04/16/2056 (b)(c)
|
5,495,168
|
170,492
|
||||||
|
2014-120, 0.690%, 04/16/2056 (b)(c)
|
2,322,967
|
80,731
|
||||||
|
2014-138, 0.741%, 04/16/2056 (b)(c)
|
1,870,202
|
89,357
|
||||||
|
2015-130, 0.863%, 07/16/2057 (b)(c)
|
2,788,466
|
127,728
|
||||||
|
Seasoned Credit Risk Transfer Trust Series
|
||||||||
|
2018-3, 3.500%, 08/27/2057
|
126,700
|
131,747
|
||||||
|
TOTAL MORTGAGE BACKED SECURITIES (Cost $17,337,586)
|
15,173,279
|
|||||||
|
U.S. GOVERNMENT NOTES/BONDS – 9.00%
|
||||||||
|
United States Treasury Inflation Indexed Bonds
|
||||||||
|
0.125%, 04/15/2020
|
361,815
|
360,803
|
||||||
|
0.625%, 04/15/2023
|
1,064,701
|
1,075,166
|
||||||
|
United States Treasury Notes/Bonds
|
||||||||
|
2.000%, 01/31/2020
|
100,000
|
100,054
|
||||||
|
TOTAL U.S. GOVERNMENT NOTES/BONDS (Cost $1,534,894)
|
1,536,023
|
|||||||
The accompanying notes are an integral part of these financial statements.
19
M.D. Sass Short Term U.S. Government Agency Income Fund
|
Schedule of Investments (Continued)
|
November 30, 2019 (Unaudited)
|
Shares
|
Value
|
|||||||
|
SHORT-TERM INVESTMENTS – 2.31%
|
||||||||
|
First American U.S. Treasury Money Market Fund, Class Z, 1.494% (d)
|
394,672
|
$
|
394,672
|
|||||
|
TOTAL SHORT-TERM INVESTMENTS (Cost $394,672)
|
394,672
|
|||||||
|
Total Investments (Cost $19,267,152) – 100.23%
|
17,103,974
|
|||||||
|
Liabilities in Excess of Other Assets – (0.23)%
|
(38,926
|
)
|
||||||
|
TOTAL NET ASSETS – 100.00%
|
$
|
17,065,048
|
||||||
Percentages are stated as a percent of net assets.
|
(a)
|
Variable rate security; the rate shown represents the rate at November 30, 2019.
|
|
(b)
|
Variable rate security; the rate shown represents the rate at November 30, 2019. The coupon is based on an underlying pool of loans.
|
|
(c)
|
Represents an interest-only security that entitles holders to receive only interest payments on underlying mortgages.
|
|
(d)
|
Seven day yield as of November 30, 2019.
|
The accompanying notes are an integral part of these financial statements.
20
M.D. Sass Funds
|
Statements of Assets and Liabilities
|
November 30, 2019 (Unaudited)
|
Short Term
|
||||||||
|
Equity
|
U.S. Government
|
|||||||
|
Income
|
Agency
|
|||||||
|
Plus Fund
|
Income Fund
|
|||||||
|
ASSETS
|
||||||||
|
Investments, at value (cost $29,105,834 and $19,267,152, respectively)
|
$
|
31,093,443
|
$
|
17,103,974
|
||||
|
Cash
|
1,326,774
|
—
|
||||||
|
Dividend receivable
|
54,354
|
—
|
||||||
|
Interest receivable
|
3,167
|
89,826
|
||||||
|
Receivable for fund shares sold
|
112,498
|
—
|
||||||
|
Receivable from Adviser
|
3,298
|
7,919
|
||||||
|
Other assets
|
17,140
|
12,816
|
||||||
|
TOTAL ASSETS
|
32,610,674
|
17,214,535
|
||||||
|
LIABILITIES
|
||||||||
|
Written options, at value (premiums received of $1,582,318 and $—, respectively)
|
2,059,720
|
—
|
||||||
|
Payable for investments purchased
|
1,044,643
|
100,741
|
||||||
|
Payable to affiliates
|
39,951
|
30,150
|
||||||
|
Payable for distribution (Rule 12b-1) fees
|
1,334
|
—
|
||||||
|
Payable for shareholder servicing fees
|
2,054
|
—
|
||||||
|
Accrued expenses and other liabilities
|
21,671
|
18,596
|
||||||
|
TOTAL LIABILITIES
|
3,169,373
|
149,487
|
||||||
|
NET ASSETS
|
$
|
29,441,301
|
$
|
17,065,048
|
||||
|
Net Assets Consist Of:
|
||||||||
|
Paid-in capital
|
$
|
35,482,403
|
$
|
24,007,459
|
||||
|
Accumulated deficit
|
(6,041,102
|
)
|
(6,942,411
|
)
|
||||
|
Net Assets
|
$
|
29,441,301
|
$
|
17,065,048
|
||||
|
Institutional Class Shares
|
||||||||
|
Net assets
|
29,297,525
|
17,065,048
|
||||||
|
Shares of beneficial interest outstanding
|
||||||||
|
(unlimited number of shares authorized, $0.001 par value)
|
2,588,284
|
1,843,804
|
||||||
|
Net asset value, offering price and redemption price per share
|
$
|
11.32
|
$
|
9.26
|
||||
|
Investor Class Shares
|
||||||||
|
Net assets
|
143,776
|
N/A
|
||||||
|
Shares of beneficial interest outstanding
|
||||||||
|
(unlimited number of shares authorized, $0.001 par value)
|
12,733
|
N/A
|
||||||
|
Net asset value, offering price and redemption price per share
|
$
|
11.29
|
$
|
N/A
|
||||
The accompanying notes are an integral part of these financial statements.
21
M.D. Sass Funds
|
Statements of Operations
|
For the Six Months Ended November 30, 2019 (Unaudited)
|
Short Term
|
||||||||
|
Equity
|
U.S. Government
|
|||||||
|
Income
|
Agency
|
|||||||
|
Plus Fund
|
Income Fund
|
|||||||
|
INVESTMENT INCOME
|
||||||||
|
Dividend income
|
$
|
296,414
|
(1)
|
$
|
—
|
|||
|
Interest income (net of amortization and paydown gains and losses)
|
12,507
|
373,693
|
||||||
|
TOTAL INVESTMENT INCOME
|
308,921
|
373,693
|
||||||
|
EXPENSES
|
||||||||
|
Management fees
|
118,152
|
25,749
|
||||||
|
Administration and accounting fees
|
48,217
|
27,459
|
||||||
|
Transfer agent fees and expenses
|
24,971
|
10,756
|
||||||
|
Federal and state registration fees
|
16,120
|
10,349
|
||||||
|
Audit and tax fees
|
10,056
|
9,239
|
||||||
|
Legal fees
|
8,498
|
8,498
|
||||||
|
Chief Compliance Officer fees
|
6,039
|
6,039
|
||||||
|
Custody fees
|
4,525
|
4,312
|
||||||
|
Trustees’ fees
|
4,430
|
4,430
|
||||||
|
Reports to shareholders
|
2,867
|
967
|
||||||
|
Pricing expenses
|
1,201
|
7,123
|
||||||
|
Distribution (Rule 12b-1) fees – Investor Class
|
256
|
—
|
||||||
|
Other expenses
|
3,589
|
3,152
|
||||||
|
TOTAL EXPENSES
|
248,921
|
118,073
|
||||||
|
Less waivers and reimbursement by Adviser (Note 4)
|
(130,513
|
)
|
(70,866
|
)
|
||||
|
NET EXPENSES
|
118,408
|
47,207
|
||||||
|
NET INVESTMENT INCOME
|
190,513
|
326,486
|
||||||
|
REALIZED AND UNREALIZED GAIN (LOSS) ON INVESTMENTS
|
||||||||
|
Net realized gain (loss) from:
|
||||||||
|
Investments and purchased options
|
1,709,023
|
(14,759
|
)
|
|||||
|
Written options
|
(93,270
|
)
|
—
|
|||||
|
Change in net unrealized appreciation (depreciation) on:
|
||||||||
|
Investments and purchased options
|
1,349,283
|
(46,148
|
)
|
|||||
|
Written options
|
(1,067,945
|
)
|
—
|
|||||
|
NET REALIZED AND UNREALIZED GAIN (LOSS) ON INVESTMENTS
|
1,897,091
|
(60,907
|
)
|
|||||
|
NET INCREASE IN NET ASSETS FROM OPERATIONS
|
$
|
2,087,604
|
$
|
265,579
|
||||
|
(1)
|
Net of $1,416 in foreign withholding tax.
|
The accompanying notes are an integral part of these financial statements.
22
M.D. Sass Equity Income Plus Fund
|
Statements of Changes in Net Assets
|
|
Six Months Ended
|
||||||||
|
November 30, 2019
|
Year Ended
|
|||||||
|
(Unaudited)
|
May 31, 2019
|
|||||||
|
FROM OPERATIONS
|
||||||||
|
Net investment income
|
$
|
190,513
|
$
|
764,079
|
||||
|
Net realized gain (loss) from:
|
||||||||
|
Investments and purchased options
|
1,709,023
|
858,614
|
||||||
|
Written options
|
(93,270
|
)
|
111,402
|
|||||
|
Change in net unrealized appreciation (depreciation) on:
|
||||||||
|
Investments and purchased options
|
1,349,283
|
(789,831
|
)
|
|||||
|
Written options
|
(1,067,945
|
)
|
62,456
|
|||||
|
Net increase in net assets from operations
|
2,087,604
|
1,006,720
|
||||||
|
FROM DISTRIBUTIONS
|
||||||||
|
Net dividends and distributions – Institutional Class
|
(361,014
|
)
|
(1,036,314
|
)
|
||||
|
Net dividends and distributions – Investor Class
|
(2,787
|
)
|
(8,297
|
)
|
||||
|
Net decrease in net assets resulting from dividends and distributions paid
|
(363,801
|
)
|
(1,044,611
|
)
|
||||
|
FROM CAPITAL SHARE TRANSACTIONS
|
||||||||
|
Proceeds from shares sold – Institutional Class
|
778,734
|
2,928,349
|
||||||
|
Proceeds from shares sold – Investor Class
|
—
|
400
|
||||||
|
Shares issued in reinvestment of distributions – Institutional Class
|
357,545
|
977,399
|
||||||
|
Shares issued in reinvestment of distributions – Investor Class
|
2,582
|
8,060
|
||||||
|
Payments for shares redeemed – Institutional Class
|
(7,841,566
|
)
|
(24,759,105
|
)
|
||||
|
Payments for shares redeemed – Investor Class
|
(148,315
|
)
|
(560,581
|
)
|
||||
|
Net decrease in net assets from capital share transactions
|
(6,851,020
|
)
|
(21,405,478
|
)
|
||||
|
TOTAL DECREASE IN NET ASSETS
|
(5,127,217
|
)
|
(21,443,369
|
)
|
||||
|
NET ASSETS:
|
||||||||
|
Beginning of period
|
34,568,518
|
56,011,887
|
||||||
|
End of period
|
$
|
29,441,301
|
$
|
34,568,518
|
||||
The accompanying notes are an integral part of these financial statements.
23
M.D. Sass Short Term U.S. Government Agency Income Fund
|
Statements of Changes in Net Assets
|
|
Six Months Ended
|
||||||||
|
November 30, 2019
|
Year Ended
|
|||||||
|
(Unaudited)
|
May 31, 2019
|
|||||||
|
FROM OPERATIONS
|
||||||||
|
Net investment income
|
$
|
326,486
|
$
|
606,470
|
||||
|
Net realized gain (loss) from investments
|
(14,759
|
)
|
5,547
|
|||||
|
Change in net unrealized depreciation on investments
|
(46,148
|
)
|
(123,497
|
)
|
||||
|
Net increase in net assets from operations
|
265,579
|
488,520
|
||||||
|
FROM DISTRIBUTIONS
|
||||||||
|
Net dividends and distributions
|
(344,191
|
)
|
(646,655
|
)
|
||||
|
Net decrease in net assets resulting from dividends and distributions paid
|
(344,191
|
)
|
(646,655
|
)
|
||||
|
FROM CAPITAL SHARE TRANSACTIONS
|
||||||||
|
Proceeds from shares sold
|
2,083,556
|
403,802
|
||||||
|
Shares issued in reinvestment of distributions
|
330,931
|
581,346
|
||||||
|
Payments for shares redeemed
|
(2,688,469
|
)
|
(6,838,074
|
)
|
||||
|
Net decrease in net assets from capital share transactions
|
(273,982
|
)
|
(5,852,926
|
)
|
||||
|
TOTAL DECREASE IN NET ASSETS
|
(352,594
|
)
|
(6,011,061
|
)
|
||||
|
NET ASSETS:
|
||||||||
|
Beginning of period
|
17,417,642
|
23,428,703
|
||||||
|
End of period
|
$
|
17,065,048
|
$
|
17,417,642
|
||||
The accompanying notes are an integral part of these financial statements.
24
M.D. Sass Equity Income Plus Fund – Institutional Class
|
Financial Highlights
|
Per Share Data for a Share Outstanding Throughout Each Year/Period
|
Six Months
|
||||||||||||||||||||||||
|
Ended
|
||||||||||||||||||||||||
|
November 30,
|
Year Ended
|
Year Ended
|
Year Ended
|
Year Ended
|
Year Ended
|
|||||||||||||||||||
|
2019
|
May 31,
|
May 31,
|
May 31,
|
May 31,
|
May 31,
|
|||||||||||||||||||
|
(Unaudited)
|
2019
|
2018
|
2017
|
2016
|
2015
|
|||||||||||||||||||
|
Net Asset Value,
|
||||||||||||||||||||||||
|
Beginning of Year/Period
|
$
|
10.73
|
$
|
10.70
|
$
|
10.72
|
$
|
10.45
|
$
|
11.54
|
$
|
11.15
|
||||||||||||
|
Income (loss) from
|
||||||||||||||||||||||||
|
investment operations:
|
||||||||||||||||||||||||
|
Net investment income(1)(2)
|
0.07
|
0.18
|
0.11
|
0.14
|
0.16
|
0.22
|
||||||||||||||||||
|
Net realized and unrealized
|
||||||||||||||||||||||||
|
gain (loss) on investments(6)
|
0.64
|
0.09
|
(0.01
|
)
|
0.31
|
(0.58
|
)
|
0.48
|
||||||||||||||||
|
Total from investment operations
|
0.71
|
0.27
|
0.10
|
0.45
|
(0.42
|
)
|
0.70
|
|||||||||||||||||
|
Less distributions paid:
|
||||||||||||||||||||||||
|
From net investment income
|
(0.12
|
)
|
(0.24
|
)
|
(0.12
|
)
|
(0.18
|
)
|
(0.22
|
)
|
(0.22
|
)
|
||||||||||||
|
From realized gain
|
—
|
—
|
—
|
—
|
(0.45
|
)
|
(0.09
|
)
|
||||||||||||||||
|
Total distributions paid
|
(0.12
|
)
|
(0.24
|
)
|
(0.12
|
)
|
(0.18
|
)
|
(0.67
|
)
|
(0.31
|
)
|
||||||||||||
|
Net Asset Value, End of Year/Period
|
$
|
11.32
|
$
|
10.73
|
$
|
10.70
|
$
|
10.72
|
$
|
10.45
|
$
|
11.54
|
||||||||||||
|
Total Return(3)(5)
|
6.60
|
%
|
2.55
|
%
|
0.95
|
%
|
4.29
|
%
|
-3.52
|
%
|
6.37
|
%
|
||||||||||||
|
Supplemental Data and Ratios:
|
||||||||||||||||||||||||
|
Net assets at end of year/period (000’s)
|
$
|
29,297
|
$
|
34,289
|
$
|
55,188
|
$
|
64,908
|
$
|
132,523
|
$
|
159,725
|
||||||||||||
|
Ratio of expenses to average net assets(4)
|
||||||||||||||||||||||||
|
Before waivers and
|
||||||||||||||||||||||||
|
reimbursements of expenses
|
1.58
|
%
|
1.35
|
%
|
1.17
|
%
|
1.09
|
%
|
1.03
|
%
|
1.05
|
%
|
||||||||||||
|
After waivers and
|
||||||||||||||||||||||||
|
reimbursements of expenses
|
0.75
|
%
|
0.75
|
%
|
0.75
|
%
|
0.75
|
%
|
0.75
|
%
|
0.75
|
%
|
||||||||||||
|
Ratio of net investment income
|
||||||||||||||||||||||||
|
to average net assets(4)
|
||||||||||||||||||||||||
|
Before waivers and
|
||||||||||||||||||||||||
|
reimbursements of expenses
|
0.38
|
%
|
1.11
|
%
|
0.57
|
%
|
0.95
|
%
|
1.95
|
%
|
1.61
|
%
|
||||||||||||
|
After waivers and
|
||||||||||||||||||||||||
|
reimbursements of expenses
|
1.21
|
%
|
1.71
|
%
|
0.99
|
%
|
1.29
|
%
|
2.23
|
%
|
1.91
|
%
|
||||||||||||
|
Portfolio turnover rate(3)
|
17.72
|
%
|
71.47
|
%
|
93.98
|
%
|
77.33
|
%
|
63.55
|
%
|
87.20
|
%
|
||||||||||||
|
(1)
|
Per share net investment income has been calculated using the daily average shares outstanding method.
|
|
(2)
|
Net investment income per share is calculated using the ending balances prior to consideration or adjustment for permanent book to tax differences.
|
|
(3)
|
Not annualized for periods less than one year.
|
|
(4)
|
Annualized for periods less than one year.
|
|
(5)
|
Total return in the table represents the rate that the investor would have earned or lost on an investment in the Fund, assuming reinvestment of dividends.
|
|
(6)
|
Realized and unrealized gains and losses per share in this caption are balancing amounts necessary to reconcile the change in net asset value per share for the period, and may not reconcile with the aggregate
gains and losses in the Statements of Operations due to share transactions for the period.
|
The accompanying notes are an integral part of these financial statements.
25
M.D. Sass Equity Income Plus Fund – Investor Class
|
Financial Highlights
|
Per Share Data for a Share Outstanding Throughout Each Year/Period
|
Six Months
|
||||||||||||||||||||||||
|
Ended
|
||||||||||||||||||||||||
|
November 30,
|
Year Ended
|
Year Ended
|
Year Ended
|
Year Ended
|
Year Ended
|
|||||||||||||||||||
|
2019
|
May 31,
|
May 31,
|
May 31,
|
May 31,
|
May 31,
|
|||||||||||||||||||
|
(Unaudited)
|
2019
|
2018
|
2017
|
2016
|
2015
|
|||||||||||||||||||
|
Net Asset Value,
|
||||||||||||||||||||||||
|
Beginning of Year/Period
|
$
|
10.71
|
$
|
10.68
|
$
|
10.69
|
$
|
10.43
|
$
|
11.53
|
$
|
11.14
|
||||||||||||
|
Income (loss) from
|
||||||||||||||||||||||||
|
investment operations:
|
||||||||||||||||||||||||
|
Net investment income(1)(2)
|
0.05
|
0.15
|
0.08
|
0.11
|
0.12
|
0.18
|
||||||||||||||||||
|
Net realized and unrealized
|
||||||||||||||||||||||||
|
gain (loss) on investments(8)
|
0.64
|
0.09
|
(0.00
|
)(6)
|
0.30
|
(0.58
|
)
|
0.49
|
||||||||||||||||
|
Total from investment operations
|
0.69
|
0.23
|
0.08
|
0.41
|
(0.46
|
)
|
0.67
|
|||||||||||||||||
|
Less distributions paid:
|
||||||||||||||||||||||||
|
From net investment income
|
(0.11
|
)
|
(0.21
|
)
|
(0.09
|
)
|
(0.15
|
)
|
(0.19
|
)
|
(0.19
|
)
|
||||||||||||
|
From realized gain
|
—
|
—
|
—
|
—
|
(0.45
|
)
|
(0.09
|
)
|
||||||||||||||||
|
Total distributions paid
|
(0.11
|
)
|
(0.21
|
)
|
(0.09
|
)
|
(0.15
|
)
|
(0.64
|
)
|
(0.28
|
)
|
||||||||||||
|
Net Asset Value, End of Year/Period
|
$
|
11.29
|
$
|
10.71
|
$
|
10.68
|
$
|
10.69
|
$
|
10.43
|
$
|
11.53
|
||||||||||||
|
Total Return(3)(5)
|
6.55
|
%
|
2.15
|
%
|
0.71
|
%
|
3.92
|
%
|
-3.88
|
%
|
6.09
|
%
|
||||||||||||
|
Supplemental Data and Ratios:
|
||||||||||||||||||||||||
|
Net assets at end of year/period (000’s)
|
$
|
144
|
$
|
280
|
$
|
824
|
$
|
1,114
|
$
|
2,348
|
$
|
2,330
|
||||||||||||
|
Ratio of expenses to average net assets(4)
|
||||||||||||||||||||||||
|
Before waivers and
|
||||||||||||||||||||||||
|
reimbursements of expenses
|
1.81
|
%
|
1.59
|
%
|
1.42
|
%
|
1.44
|
%
|
1.38
|
%
|
1.40
|
%
|
||||||||||||
|
After waivers and
|
||||||||||||||||||||||||
|
reimbursements of expenses
|
1.00
|
%(7)
|
1.00
|
%(7)
|
1.00
|
%(7)
|
1.10
|
%
|
1.10
|
%
|
1.10
|
%
|
||||||||||||
|
Ratio of net investment income
|
||||||||||||||||||||||||
|
to average net assets(4)
|
||||||||||||||||||||||||
|
Before waivers and
|
||||||||||||||||||||||||
|
reimbursements of expenses
|
0.14
|
%
|
0.84
|
%
|
0.33
|
%
|
0.69
|
%
|
1.60
|
%
|
1.31
|
%
|
||||||||||||
|
After waivers and
|
||||||||||||||||||||||||
|
reimbursements of expenses
|
0.95
|
%
|
1.43
|
%
|
0.75
|
%
|
1.03
|
%
|
1.88
|
%
|
1.61
|
%
|
||||||||||||
|
Portfolio turnover rate(3)
|
17.72
|
%
|
71.47
|
%
|
93.98
|
%
|
77.33
|
%
|
63.55
|
%
|
87.20
|
%
|
||||||||||||
|
(1)
|
Per share net investment income has been calculated using the daily average shares outstanding method.
|
|
(2)
|
Net investment income per share is calculated using the ending balances prior to consideration or adjustment for permanent book to tax differences.
|
|
(3)
|
Not annualized for periods less than one year.
|
|
(4)
|
Annualized for periods less than one year.
|
|
(5)
|
Total return in the table represents the rate that the investor would have earned or lost on an investment in the Fund, assuming reinvestment of dividends. Excludes the effect of applicable sales charges.
|
|
(6)
|
Less than 0.05 cents per share.
|
|
(7)
|
Reflects expense cap of 0.75% plus Rule 12b-1 fees of 0.25%. The Fund did not accrue 0.10% allowable under the shareholder servicing plan for the years ended May 31, 2018 or May 31, 2019 or the six months ended
November 30, 2019.
|
|
(8)
|
Realized and unrealized gains and losses per share in this caption are balancing amounts necessary to reconcile the change in net asset value per share for the period, and may not reconcile with the aggregate
gains and losses in the Statements of Operations due to share transactions for the period.
|
The accompanying notes are an integral part of these financial statements.
26
M.D. Sass Short Term U.S. Government Agency Income Fund – Institutional Class
|
Financial Highlights
|
Per Share Data for a Share Outstanding Throughout Each Year/Period
|
Six Months
|
||||||||||||||||||||||||
|
Ended
|
||||||||||||||||||||||||
|
November 30,
|
Year Ended
|
Year Ended
|
Year Ended
|
Year Ended
|
Year Ended
|
|||||||||||||||||||
|
2019
|
May 31,
|
May 31,
|
May 31,
|
May 31,
|
May 31,
|
|||||||||||||||||||
|
(Unaudited)
|
2019
|
2018
|
2017
|
2016
|
2015
|
|||||||||||||||||||
|
Net Asset Value,
|
||||||||||||||||||||||||
|
Beginning of Year/Period
|
$
|
9.30
|
$
|
9.36
|
$
|
9.51
|
$
|
9.75
|
$
|
9.91
|
$
|
10.06
|
||||||||||||
|
Income (loss) from
|
||||||||||||||||||||||||
|
investment operations:
|
||||||||||||||||||||||||
|
Net investment income(1)(2)
|
0.18
|
0.29
|
0.26
|
0.25
|
0.15
|
0.15
|
||||||||||||||||||
|
Net realized and unrealized
|
||||||||||||||||||||||||
|
loss on investments
|
(0.03
|
)
|
(0.05
|
)
|
(0.11
|
)
|
(0.19
|
)
|
(0.11
|
)
|
(0.08
|
)
|
||||||||||||
|
Total from investment operations
|
0.15
|
0.24
|
0.15
|
0.06
|
0.04
|
0.07
|
||||||||||||||||||
|
Less distributions paid:
|
||||||||||||||||||||||||
|
From net investment income
|
(0.19
|
)
|
(0.30
|
)
|
(0.30
|
)
|
(0.30
|
)
|
(0.20
|
)
|
(0.22
|
)
|
||||||||||||
|
Total distributions paid
|
(0.19
|
)
|
(0.30
|
)
|
(0.30
|
)
|
(0.30
|
)
|
(0.20
|
)
|
(0.22
|
)
|
||||||||||||
|
Net Asset Value, End of Year/Period
|
$
|
9.26
|
$
|
9.30
|
$
|
9.36
|
$
|
9.51
|
$
|
9.75
|
$
|
9.91
|
||||||||||||
|
Total Return(3)(4)
|
1.62
|
%
|
2.66
|
%
|
1.60
|
%
|
0.64
|
%
|
0.35
|
%
|
0.75
|
%
|
||||||||||||
|
Supplemental Data and Ratios:
|
||||||||||||||||||||||||
|
Net assets at end of year/period (000’s)
|
$
|
17,065
|
$
|
17,418
|
$
|
23,429
|
$
|
36,394
|
$
|
97,164
|
$
|
83,678
|
||||||||||||
|
Ratio of expenses to average net assets(5)
|
||||||||||||||||||||||||
|
Before waivers and
|
||||||||||||||||||||||||
|
reimbursements of expenses
|
1.38
|
%
|
1.24
|
%
|
0.90
|
%
|
0.64
|
%
|
0.59
|
%
|
0.65
|
%
|
||||||||||||
|
After waivers and
|
||||||||||||||||||||||||
|
reimbursements of expenses
|
0.55
|
%
|
0.55
|
%
|
0.55
|
%
|
0.55
|
%
|
0.58
|
%
|
0.66
|
%
|
||||||||||||
|
Ratio of net investment income
|
||||||||||||||||||||||||
|
to average net assets(5)
|
||||||||||||||||||||||||
|
Before waivers and
|
||||||||||||||||||||||||
|
reimbursements of expenses
|
2.98
|
%
|
2.42
|
%
|
2.36
|
%
|
2.50
|
%
|
1.50
|
%
|
1.52
|
%
|
||||||||||||
|
After waivers and
|
||||||||||||||||||||||||
|
reimbursements of expenses
|
3.81
|
%
|
3.11
|
%
|
2.71
|
%
|
2.59
|
%
|
1.51
|
%
|
1.51
|
%
|
||||||||||||
|
Portfolio turnover rate(4)
|
20.84
|
%
|
15.24
|
%
|
98.95
|
%
|
164.31
|
%
|
182.08
|
%
|
99.63
|
%
|
||||||||||||
|
(1)
|
Per share net investment income has been calculated using the daily average shares outstanding method.
|
|
(2)
|
Net investment income per share is calculated using the ending balances prior to consideration or adjustment for permanent book to tax differences.
|
|
(3)
|
Total return in the table represents the rate that the investor would have earned or lost on an investment in the Fund, assuming reinvestment of dividends.
|
|
(4)
|
Not annualized for periods less than one year.
|
|
(5)
|
Annualized for periods less than one year.
|
The accompanying notes are an integral part of these financial statements.
27
M.D. Sass Funds
Notes to Financial Statements
November 30, 2019 (Unaudited)
|
(1)
|
Organization
|
|
Trust for Professional Managers (the “Trust”) was organized as a Delaware statutory trust under a Declaration of Trust dated May 29, 2001. The Trust is registered under the Investment Company Act of 1940, as
amended (the “1940 Act”), as an open-end management investment company. The M.D. Sass Funds (the “Funds”) each represent a distinct diversified series with their own investment objectives and policies within the Trust. The investment
objective of the M.D. Sass Short Term U.S. Government Agency Income Fund (the “Short Term U.S. Government Agency Income Fund”) is to achieve a high and stable rate of total return, when and as opportunities are available in the context of
preserving capital in adverse markets. The investment objective of the M.D. Sass Equity Income Plus Fund (the “Equity Income Plus Fund”) is to generate income as well as capital appreciation, while emphasizing downside protection. The Trust
may issue an unlimited number of shares of beneficial interest at $0.001 par value. The assets of the Funds are segregated, and a shareholder’s interest is limited to the Fund in which shares are held. The Short Term U.S. Government Agency
Income Fund currently offers one class of shares, the Institutional Class. Effective February 20, 2014, the Short Term U.S. Government Agency Income Fund ceased offering its StoneCastle Treasurer Class. Effective September 1, 2015, the
Short Term U.S. Government Agency Income Fund converted its Retail Class shares to Institutional Class shares and ceased offering its Retail Class. The Equity Income Plus Fund currently offers two classes of shares, the Institutional Class
and the Investor Class. Effective February 29, 2016, the Equity Income Plus Fund converted its Class C shares to Retail Class shares and ceased offering its Class C shares, and the Retail Class was renamed to the Investor Class. The Investor
Class shares are subject to a 0.25% distribution (Rule 12b-1) fee and a shareholder servicing fee not to exceed 0.10%. Each class of shares in both Funds have identical rights and privileges except with respect to the Rule 12b-1 and
shareholder servicing fees and voting rights on matters affecting a single class of shares. The Short Term U.S. Government Agency Income Fund’s registration statement became effective on June 22, 2011. The Institutional Class shares
commenced operations on June 30, 2011. The Equity Income Plus Fund’s registration statement became effective on June 28, 2013 at which time the Institutional and Investor Classes commenced operations. Costs incurred by the Funds in
connection with the organization, registration and the initial public offering of shares were paid by M.D. Sass Investors Services, Inc. and M.D. Sass, LLC (the “Advisers”), investment advisers to the Short Term U.S. Government Agency Income
Fund and Equity Income Plus Fund, respectively. The Funds are each an investment company and accordingly follow the investment company accounting and reporting guidance of the Financial Accounting Standards Board (“FASB”) Accounting Standard
Codification Topic 946 “Financial Services — Investment Companies”.
|
|
|
(2)
|
Significant Accounting Policies
|
|
The following is a summary of significant accounting policies consistently followed by the Funds in the preparation of the financial statements. These policies are in conformity with generally accepted
accounting principles in the United States of America (“GAAP”).
|
|
(a)
|
Investment Valuation
|
|
Each security owned by the Funds that is listed on a securities exchange is valued at its last sale price on that exchange on the date as of which assets are valued. When the security is listed on more than
one exchange, the Funds will use the price of the exchange that the Funds generally consider to be the principal exchange on which the security is traded.
|
|
|
Fund securities listed on the NASDAQ Stock Market, LLC (“NASDAQ”) will be valued at the NASDAQ Official Closing Price (“NOCP”), which may not necessarily represent the last sale price. If the NOCP is not
available, such securities shall be valued at the last sale price on the day of valuation. If there has been no sale on such exchange or on NASDAQ on such day, the security is valued at the mean between the bid and asked prices on such day
or will be valued at the later sale price on the composite market (defined as a consolidation of the trade information provided by national securities and foreign exchanges and over-the-counter markets as published by a pricing service).
When market quotations are not readily available, any security or other asset is valued at its fair value as determined under procedures approved by the Trust’s Board of Trustees. These fair value procedures will also be used to price a
|
28
M.D. Sass Funds
Notes to Financial Statements (Continued)
November 30, 2019 (Unaudited)
|
security when corporate events, events in the securities market and/or world events cause the Advisers to believe that a security’s last sale price may not reflect its actual fair value. The intended effect of
using fair value pricing procedures is to ensure that the Funds are accurately priced.
|
|
|
Debt securities, including U.S. Government and Agency Securities, corporate securities, municipal securities, mortgage- and asset-backed securities, commercial paper, banker’s acceptances, certificates of
deposit, time deposits and U.S. Treasury Bills, including short-term debt instruments having a maturity of 60 days or less, are valued at the mean by pricing service providers. Pricing services may use various valuation methodologies such as
broker-dealer quotations or valuation estimates from their internal pricing models. The pricing models for these securities usually consider tranche-level attributes, estimated cash flows and market-based yield spreads for each tranche,
current market data and incorporate deal collateral performance, as available. Pricing Services generally value debt securities assuming orderly transactions of an institutional round lot size, but such securities may be held or transactions
may be conducted in such securities in smaller, odd lot sizes. Odd lots often trade at lower prices than institutional round lots. If a price is not available from a pricing service, the most recent quotation obtained from one or more
brokers known to follow the issue will be obtained. Quotations will be valued at the mean between the bid and the offer. Debt securities that use similar valuation techniques and inputs as described above are typically categorized as Level 2
of the fair value hierarchy. Debt securities purchased on a delayed delivery basis are typically marked to market daily until settlement at the forward settlement date. Any discount or premium is accreted or amortized using the constant
yield method until maturity.
|
|
|
Exchange-traded options are valued at the composite price, using the National Best Bid and Offer quotes (“NBBO”). NBBO consists of the highest bid price and lowest ask price across any of the exchanges on which
an option is quoted, thus providing a view across the entire U.S. options marketplace. Specifically, composite pricing looks at the last trades on the exchanges where the options are traded. If there are no trades for the option on a given
business day, composite option pricing calculates the mean of the highest bid price and lowest ask price across the exchanges where the option is traded and the option will generally be classified as Level 2.
|
|
|
Money market funds, demand notes and repurchase agreements are valued at cost. If cost does not represent current market value the securities will be priced at fair value.
|
|
|
Redeemable securities issued by open-end, registered investment companies are valued at the net asset value (“NAV”) of such companies for purchase and/or redemption orders placed on that day.
|
|
|
FASB Accounting Standards Codification, “Fair Value Measurements and Disclosures” Topic 820 (“ASC 820”), establishes an authoritative definition of fair value and sets out a hierarchy for measuring fair value.
ASC 820 requires an entity to evaluate certain factors to determine whether there has been a significant decrease in volume and level of activity for the security such that recent transactions and quoted prices may not be determinative of
fair value and further analysis and adjustment may be necessary to estimate fair value. ASC 820 also requires enhanced disclosures regarding the inputs and valuation techniques used to measure fair value in those instances as well as
expanded disclosure of valuation levels for each class of investments. These inputs are summarized in the three broad levels listed below:
|
|
Level 1—
|
Quoted prices in active markets for identical securities.
|
|
|
Level 2—
|
Other significant observable inputs (including quoted prices for similar securities, interest rates, prepayment speeds, credit risk, etc.).
|
|
|
Level 3—
|
Significant unobservable inputs (including the Funds’ own assumptions in determining the fair value of investments).
|
|
The inputs or methodology used for valuing securities are not necessarily an indication of the risk associated with investing in those securities. The following is a summary of the inputs used to value the
Funds’ investments carried at fair value as of November 30, 2019:
|
29
M.D. Sass Funds
Notes to Financial Statements (Continued)
November 30, 2019 (Unaudited)
|
Equity Income Plus Fund
|
|||||||||||||||||
|
Level 1
|
Level 2
|
Level 3
|
Total
|
||||||||||||||
|
Assets:
|
|||||||||||||||||
|
Common Stocks(1)
|
$
|
25,277,101
|
$
|
—
|
$
|
—
|
$
|
25,277,101
|
|||||||||
|
Master Limited Partnerships
|
729,855
|
—
|
—
|
729,855
|
|||||||||||||
|
Real Estate Investment Trusts
|
1,184,567
|
—
|
—
|
1,184,567
|
|||||||||||||
|
Purchased Options
|
3,450
|
—
|
—
|
3,450
|
|||||||||||||
|
Total Assets
|
$
|
27,194,973
|
$
|
—
|
$
|
—
|
$
|
27,194,973
|
|||||||||
|
Short-Term Investments
|
$
|
3,898,470
|
$
|
—
|
$
|
—
|
$
|
3,898,470
|
|||||||||
|
Total Investments in Securities
|
$
|
31,093,443
|
$
|
—
|
$
|
—
|
$
|
31,093,443
|
|||||||||
|
Liabilities:
|
|||||||||||||||||
|
Written Options
|
$
|
(671,202
|
)
|
$
|
(1,388,518
|
)
|
$
|
—
|
$
|
(2,059,720
|
)
|
||||||
|
Total Liabilities
|
$
|
(671,202
|
)
|
$
|
(1,388,518
|
)
|
$
|
—
|
$
|
(2,059,720
|
)
|
||||||
|
(1) See the Schedule of Investments for industry classifications.
|
|||||||||||||||||
|
Short Term U.S. Government Agency Income Fund
|
|||||||||||||||||
|
Level 1
|
Level 2
|
Level 3
|
Total
|
||||||||||||||
|
Fixed Income:
|
|||||||||||||||||
|
Mortgage Backed Securities
|
$
|
—
|
$
|
15,173,279
|
$
|
—
|
$
|
15,173,279
|
|||||||||
|
U.S. Government Notes/Bonds
|
—
|
1,536,023
|
—
|
1,536,023
|
|||||||||||||
|
Total Fixed Income
|
$
|
—
|
$
|
16,709,302
|
$
|
—
|
$
|
16,709,302
|
|||||||||
|
Short-Term Investments
|
$
|
394,672
|
$
|
—
|
$
|
—
|
$
|
394,672
|
|||||||||
|
Total Investments in Securities
|
$
|
394,672
|
$
|
16,709,302
|
$
|
—
|
$
|
17,103,974
|
|||||||||
|
The Funds measure Level 3 activity as of the end of the period. For the six months ended November 30, 2019, the Funds did not have any significant unobservable inputs (Level 3 securities) used in determining
fair value. Therefore, a reconciliation of assets in which significant unobservable inputs (Level 3) were used in determining fair value is not applicable.
|
|
(b)
|
Derivative Instruments
|
|
The Short Term U.S. Government Agency Income Fund did not hold any financial derivative instruments during the six months ended November 30, 2019.
|
|
|
The Equity Income Plus Fund invested in derivative instruments, such as purchased and written options, during the six months ended November 30, 2019.
|
|
|
The following sets forth the fair value of derivative instruments as reported for the Equity Income Plus Fund within the Statements of Assets and Liabilities as of November 30, 2019:
|
|
Asset Derivatives
|
Liability Derivatives
|
||||||||||
|
Derivatives not
|
|||||||||||
|
accounted for as
|
Statements of Assets &
|
Statements of Assets &
|
|||||||||
|
hedging instruments
|
Liabilities Location
|
Value
|
Liabilities Location
|
Value
|
|||||||
|
Equity Contracts –
|
Investments,
|
Written Options,
|
|||||||||
|
Options
|
at value
|
$
|
3,450
|
at value
|
$
|
2,059,720
|
|||||
|
Total
|
$
|
3,450
|
$
|
2,059,720
|
|||||||
30
M.D. Sass Funds
Notes to Financial Statements (Continued)
November 30, 2019 (Unaudited)
|
The effect of derivative instruments for the Equity Income Plus Fund on the Statements of Operations for the six months ended November 30, 2019:
|
|
Amount of Net Realized Loss on Derivatives Recognized in Income
|
|||||||||||||
|
Derivatives not accounted for
|
Purchased
|
Written
|
|||||||||||
|
as hedging instruments
|
Options(1)
|
Options
|
Total
|
||||||||||
|
Equity Contracts
|
$
|
(113,635
|
)
|
$
|
(93,270
|
)
|
$
|
(206,905
|
)
|
||||
|
Total
|
$
|
(113,635
|
)
|
$
|
(93,270
|
)
|
$
|
(206,905
|
)
|
||||
|
Change in Net Unrealized Depreciation on Derivatives Recognized in Income
|
|||||||||||||
|
Derivatives not accounted for
|
Purchased
|
Written
|
|||||||||||
|
as hedging instruments
|
Options(1)
|
Options
|
Total
|
||||||||||
|
Equity Contracts
|
$
|
(75,696
|
)
|
$
|
(1,067,945
|
)
|
$
|
(1,143,641
|
)
|
||||
|
Total
|
$
|
(75,696
|
)
|
$
|
(1,067,945
|
)
|
$
|
(1,143,641
|
)
|
||||
|
(1) Reflected within investments and purchased options on the Statements of Operations.
|
|
As of November 30, 2019, the fair value of long positions which served as collateral for call options written was $27,191,523.
|
|
|
The average monthly notional amount outstanding for purchased and written options during the six months ended November 30, 2019 were $7,193,608 and $(30,745,216), respectively.
|
|
|
Accounting Standards Update (ASU) 2011-11 “Disclosures about Offsetting Assets and Liabilities” deals with offsetting assets and liabilities on the Statements of Assets and Liabilities with respect to
derivative instruments. The Equity Income Plus Fund is not subject to any Master Netting Arrangements, therefore the Equity Income Plus Fund was not required to offset any assets or liabilities.
|
|
|
Options
|
|
|
GAAP requires enhanced disclosures about the Equity Income Plus Fund’s derivative activities, including how such activities are accounted for and their effect on the Equity Income Plus Fund’s financial position
and results of operations.
|
|
|
The Equity Income Plus Fund is subject to equity price risk in the normal course of pursuing its investment objectives. The Equity Income Plus Fund enters into written call options to reduce volatility of the
portfolio and/or earn premium income. Additionally, for hedging purposes, the Equity Income Plus Fund will periodically buy put options on equity securities indices. The Equity Income Plus Fund’s option component of its overall investment
strategy is often referred to as a “buy-write” strategy (also called a “covered call” strategy), in which the Adviser writes (sells) a call option contract while at the same time owning an equivalent number of shares of the underlying stock
to generate moderate current income. The writing of call options is intended to reduce the volatility of the portfolio and to earn premium income. Written call options expose the Equity Income Plus Fund to minimal counterparty credit risk
since they are exchange traded and the exchange’s clearing house guarantees the options against default.
|
|
|
The Equity Income Plus Fund may purchase put options on indices and enter into related closing transactions. As a holder of a put option, the Equity Income Plus Fund has the right, but not the obligation, to
sell a security at the exercise price during the exercise period.
|
|
|
When the Equity Income Plus Fund writes an option, an amount equal to the premium received by the Equity Income Plus Fund is recorded as a liability and is subsequently adjusted to the current fair value of the
option written. Premiums received from writing options that expire unexercised are treated by the Equity Income Plus Fund on the expiration date as realized gains from options written. The difference between the premium and the amount paid
on effecting a closing purchase transaction, including brokerage commissions, is also treated as a realized gain, or, if the premium is less than the amount paid for the closing purchase transaction, as a realized loss. If a call option is
exercised, the premium is added to the proceeds from the sale of the underlying security or currency in
|
31
M.D. Sass Funds
Notes to Financial Statements (Continued)
November 30, 2019 (Unaudited)
|
determining whether the Equity Income Plus Fund has realized a gain or a loss. If a put option is exercised, the premium is deducted from the cost basis of the security purchased. The Equity Income Plus Fund,
as writer of an option, bears the market risk of an unfavorable change in the price of the security underlying the written option.
|
|
|
When purchasing options, the Equity Income Plus Fund will recognize a realized loss equal to the premium paid to purchase the option, if the option expires unexercised. The difference between the proceeds
received on effecting a closing sale transaction and the premium paid will be recognized as a realized gain or loss. If a put option is exercised, the premium paid is deducted from the proceeds on the sale of the underlying security in
determining whether the Equity Income Plus Fund has a realized gain or loss.
|
|
(c)
|
Federal Income Taxes
|
|
The Funds comply with the requirements of Subchapter M of the Internal Revenue Code of 1986, as amended, necessary to qualify as regulated investment companies and make the requisite distributions of income and
capital gains to their shareholders sufficient to relieve them from all or substantially all federal income taxes. Therefore, no federal income tax provision has been provided.
|
|
|
As of and during the year ended May 31, 2019, the Funds did not have a liability for any unrecognized tax benefits. The Funds recognize interest and penalties, if any, related to unrecognized tax benefits as
income tax expense in the Statements of Operations. During the year ended May 31, 2019, the Funds did not incur any interest or penalties. The Funds are not subject to examination by U.S. taxing authorities for tax periods prior to the year
ended May 31, 2016.
|
|
(d)
|
Distributions to Shareholders
|
|
The Funds will distribute any net investment income and any net realized long- or short-term capital gains at least annually. Distributions from net realized gains for book purposes may include short-term
capital gains. All short-term capital gains are included in ordinary income for tax purposes. Distributions to shareholders are recorded on the ex-dividend date. The Funds may also pay a special distribution at the end of the calendar year
to comply with federal tax requirements. Income and capital gains distributions may differ from GAAP, primarily due to timing differences in the recognition of income, gains and losses by the Funds. To the extent that these differences are
attributable to permanent book and tax accounting differences, the components of net assets have been adjusted.
|
|
(e)
|
Use of Estimates
|
|
The preparation of financial statements in conformity with GAAP requires management to make estimates and assumptions that affect the reported amounts of assets and liabilities and disclosure of contingent
assets and liabilities at the date of the financial statements and the reported amounts of revenues and expenses during the reporting period. Actual results could differ from those estimates.
|
|
(f)
|
Share Valuation
|
|
The NAV per share of each Fund is calculated by dividing the sum of the value of the securities held by each Fund, plus cash or other assets, minus all liabilities (including estimated accrued expenses) by the
total number of shares outstanding for each Fund, rounded to the nearest cent. The Funds’ shares will not be priced on the days on which the New York Stock Exchange is closed for trading.
|
|
(g)
|
Allocation of Income, Expenses and Gains/Losses
|
|
Income, expenses (other than those deemed attributable to a specific share class), and gains and losses of the Funds are allocated daily to each class of shares based upon the ratio of net assets represented by
each class as a percentage of the net assets of the Fund. Expenses deemed directly attributable to a class of shares are recorded by the specific class. Most Fund expenses are allocated by class based on relative net assets. Rule 12b-1 fees
are expensed at 0.25% of average daily net assets of the Investor Class shares of the Equity Income Plus Fund. Shareholder servicing fees are expensed at an amount not to exceed 0.10% of average daily net assets of the Investor Class shares
of the Equity Income Plus Fund. Expenses associated with a specific fund in the Trust are charged to that fund. Common Trust expenses are typically allocated evenly between the funds of the Trust or by other equitable means.
|
32
M.D. Sass Funds
Notes to Financial Statements (Continued)
November 30, 2019 (Unaudited)
|
(h)
|
Other
|
|
Investment transactions are recorded on the trade date. The Funds determine the gain or loss from investment transactions using the first in-first out (FIFO) method by comparing the original cost of the
security lot sold with the net sale proceeds. Dividend income and expense, less foreign withholding tax, is recognized on the ex-dividend date and interest income and expense are recognized on an accrual basis. Withholding taxes on foreign
dividends and interest, net of any reclaims, have been provided for in accordance with the Funds’ understanding of the applicable country’s tax rules and rates. Non-cash dividends are recorded at fair market value of the securities
received. Return of capital distributions received from the Funds’ investments in master limited partnerships (“MLPs”) and real estate investment trusts (“REITs”) are recorded as an adjustment to the cost of the security and thus may impact
unrealized or realized gains or losses on the security. Discounts, premiums and interest only strips are accreted or amortized over the expected life of the respective securities using the constant yield method. Gains and losses on
principal payments of mortgage-backed securities (paydowns gains and losses) are included as an adjustment to interest income in the Statements of Operations.
|
|
(3)
|
Federal Tax Matters
|
|
The tax character of distributions paid during the years ended May 31, 2019 and May 31, 2018 were as follows:
|
|
Equity Income Plus Fund
|
|||||||||
|
May 31, 2019
|
May 31, 2018
|
||||||||
|
Ordinary Income
|
$
|
1,044,611
|
$
|
689,176
|
|||||
|
Long-Term Capital Gain
|
—
|
—
|
|||||||
|
Short Term U.S. Government Agency Income Fund
|
|||||||||
|
May 31, 2019
|
May 31, 2018
|
||||||||
|
Ordinary Income
|
$
|
646,655
|
$
|
1,021,525
|
|||||
|
Long-Term Capital Gain
|
—
|
—
|
|||||||
|
As of May 31, 2019, the components of accumulated earnings (losses) on a tax basis were as follows:
|
|
|
Short Term
|
||||||||
|
Equity
|
U.S. Government
|
||||||||
|
Income
|
Agency
|
||||||||
|
Plus Fund
|
Income Fund
|
||||||||
|
Cost basis of investments for federal income tax purposes
|
$
|
33,533,941
|
$
|
19,973,449
|
|||||
|
Gross tax unrealized appreciation
|
3,692,282
|
434,751
|
|||||||
|
Gross tax unrealized depreciation
|
(2,615,168
|
)
|
(2,551,781
|
)
|
|||||
|
Net tax unrealized appreciation (depreciation)
|
1,077,114
|
(2,117,030
|
)
|
||||||
|
Undistributed ordinary income
|
179,422
|
1,119
|
|||||||
|
Undistributed long-term capital gain
|
—
|
—
|
|||||||
|
Total distributable earnings
|
179,422
|
1,119
|
|||||||
|
Other accumulated losses
|
(9,021,441
|
)
|
(4,747,888
|
)
|
|||||
|
Total accumulated losses
|
$
|
(7,764,905
|
)
|
$
|
(6,863,799
|
)
|
|||
|
The difference between book-basis and tax-basis unrealized appreciation is attributable primarily to basis adjustments related to investments in partnerships and the deferral of losses on wash sales and
straddle adjustments.
|
|
|
At May 31, 2019, the Equity Income Plus Fund had short-term capital loss carryovers of $8,657,510. At May 31, 2019, the Short Term U.S. Government Agency Income Fund had short-term capital loss carryovers of
$3,934,738 and had long-term capital loss carryovers of $813,150. These losses will be carried forward indefinitely to offset future realized capital gains. To the extent the Funds’ realize future net capital gains, taxable distributions to
their shareholders will be offset by any unused capital loss carryovers.
|
33
M.D. Sass Funds
Notes to Financial Statements (Continued)
November 30, 2019 (Unaudited)
|
GAAP requires that certain components of net assets relating to permanent differences be reclassified between financial and tax reporting. These reclassifications have no effect on net assets or net asset value
per share. For the year ended May 31, 2019, the following reclassifications were made for permanent tax differences on the Statements of Assets and Liabilities:
|
|
Equity Income Plus Fund
|
|||||
|
Undistributed Net Investment Income/(Loss)
|
$
|
98,227
|
|||
|
Accumulated Net Realized Gain/(Loss)
|
$
|
(98,227
|
)
|
||
|
Short Term U.S. Government Agency Income Fund
|
|||||
|
Undistributed Net Investment Income/(Loss)
|
$
|
38,485
|
|||
|
Accumulated Net Realized Gain/(Loss)
|
$
|
(38,485
|
)
|
||
|
The permanent adjustments for the Equity Income Plus Fund and Short Term U.S. Government Agency Income Fund relate to partnership and paydowns adjustments, respectively.
|
|
|
(4)
|
Investment Advisers
|
|
The Trust has Investment Advisory Agreements (collectively, the “Agreement”) with the Advisers to furnish investment advisory services to the Funds. Under the terms of the Agreement, the Funds compensate the
Advisers for their management services at the annual rate of 0.30% and 0.75% of the Funds’ average daily net assets for the Short Term U.S. Government Agency Income Fund and Equity Income Plus Fund, respectively.
|
|
|
The Advisers have contractually agreed to waive their management fee and/or reimburse the Funds’ other expenses at least through the expiration dates listed below, to the extent necessary to ensure that the
Funds’ operating expenses (excluding any front end or contingent deferred load, Rule 12b-1 plan fees, shareholder servicing plan fees, taxes, leverage, interest, brokerage commissions, expenses incurred in connection with any merger or
reorganization, dividends or interest expense on short positions, acquired fund fees and expenses or extraordinary expenses) do not exceed the expense limitation caps listed below of each Fund’s average daily net assets.
|
|
Expiration Date
|
Expense Limitation Cap
|
||
|
Equity Income Plus Fund
|
September 28, 2020
|
0.75%
|
|
|
Short Term U.S. Government Agency Income Fund
|
September 28, 2020
|
0.55%
|
|
Any such waiver or reimbursement is subject to later adjustment to allow the Adviser to recoup amounts waived or reimbursed to the extent actual fees and expenses for a fiscal period do not exceed the lesser
of: (1) the Expense Limitation Cap in place at the time of the waiver or reimbursement or (2) the Expense Limitation Cap in place at the time of recoupment; provided, however, that the Adviser shall only be entitled to recoup such amounts
over the following three year period from the date of the waiver or reimbursement. The following table details the remaining waived or reimbursed expenses subject to potential recovery expiring during the fiscal period ending:
|
|
November 30, 2022
|
May 31, 2022
|
May 31, 2021
|
May 31, 2020
|
||||||||||||||
|
Equity Income Plus Fund
|
|||||||||||||||||
|
Institutional Class
|
$
|
129,675
|
$
|
265,883
|
$
|
253,672
|
$
|
113,141
|
|||||||||
|
Investor Class
|
838
|
2,430
|
3,672
|
2,227
|
|||||||||||||
|
Short Term U.S. Government
|
|||||||||||||||||
|
Agency Income Fund
|
|||||||||||||||||
|
Institutional Class
|
70,866
|
134,752
|
118,383
|
45,381
|
|||||||||||||
34
M.D. Sass Funds
Notes to Financial Statements (Continued)
November 30, 2019 (Unaudited)
|
(5)
|
Distribution Plan and Shareholder Servicing Plan
|
|
The Trust has adopted a plan pursuant to Rule 12b-1 (the “12b-1 Plan”), on behalf of the Equity Income Plus Fund, which authorizes the payment to Quasar Distributors, LLC (the “Distributor”) of a distribution
(Rule 12b-1) fee of 0.25% of the Fund’s average daily net assets of Investor Class shares for services to prospective Fund shareholders and distribution. During the six months ended November 30, 2019, the Fund accrued fees of $256 pursuant to
the 12b-1 Plan. As of November 30, 2019, the Fund owed the Distributor $1,334 in fees.
|
|
|
The Trust has adopted a shareholder servicing plan, on behalf of the Equity Income Plus Fund, which authorizes payment of a shareholder servicing fee not to exceed 0.10% of the average daily net assets of the
Investor Class shares for the Equity Income Plus Fund. During the six months ended November 30, 2019, the Equity Income Plus Fund did not accrue shareholder servicing fees, but was able to pay shareholder servicing fees incurred of $126
through November 30, 2019 from prior year balances.
|
|
|
(6)
|
Related Party Transactions
|
|
U.S. Bancorp Fund Services, LLC (“Fund Services,” or the “Administrator”), doing business as U.S. Bank Global Fund Services, acts as the Funds’ Administrator under an Administration Agreement. The Administrator
prepares various federal and state regulatory filings, reports and returns for the Funds; prepares reports and materials to be supplied to the Trustees; monitors the activities of the Funds’ custodian, transfer agent and accountants;
coordinates the preparation and payment of the Funds’ expenses and reviews the Funds’ expense accruals. Fees incurred for the six months ended November 30, 2019, and owed as of November 30, 2019, are as follows:
|
|
Incurred
|
Owed
|
||||||||
|
Equity Income Plus Fund
|
$
|
48,217
|
$
|
22,211
|
|||||
|
Short Term U.S. Government Agency Income Fund
|
27,459
|
16,244
|
|||||||
|
Fund Services also serves as the fund accountant and transfer agent to the Funds. U.S. Bank, N.A. (“U.S. Bank”), an affiliate of Fund Services, serves as each Funds’ custodian. Fees incurred for the six months
ended November 30, 2019, and owed as of November 30, 2019, are as follows:
|
|
Pricing Expenses
|
Incurred
|
Owed
|
|||||||
|
Equity Income Plus Fund
|
$
|
1,201
|
$
|
529
|
|||||
|
Short Term U.S. Government Agency Income Fund
|
7,123
|
3,870
|
|||||||
|
Transfer Agency
|
Incurred
|
Owed
|
|||||||
|
Equity Income Plus Fund
|
$
|
24,971
|
$
|
12,607
|
|||||
|
Short Term U.S. Government Agency Income Fund
|
10,756
|
4,885
|
|||||||
|
Custody
|
Incurred
|
Owed
|
|||||||
|
Equity Income Plus Fund
|
$
|
4,525
|
$
|
1,565
|
|||||
|
Short Term U.S. Government Agency Income Fund
|
4,312
|
2,115
|
|||||||
|
Each Fund has a line of credit with U.S. Bank (see Note 10).
|
|
|
The Distributor acts as the Funds’ principal underwriter in a continuous public offering of the Funds’ shares. The Distributor is an affiliate of Fund Services and U.S. Bank.
|
|
|
Certain officers of the Funds are also employees of Fund Services. A Trustee of the Trust is affiliated with Fund Services and U.S. Bank. This same Trustee is a board member and an interested person of the
Distributor.
|
|
|
The Trust’s Chief Compliance Officer is also an employee of Fund Services. Each Fund’s allocation of the Trust’s Chief Compliance Officer fee incurred for the six months ended November 30, 2019, and owed as of
November 30, 2019, are as follows:
|
|
Incurred
|
Owed
|
||||||||
|
Equity Income Plus Fund
|
$
|
6,039
|
$
|
3,039
|
|||||
|
Short Term U.S. Government Agency Income Fund
|
6,039
|
3,036
|
|||||||
35
M.D. Sass Funds
Notes to Financial Statements (Continued)
November 30, 2019 (Unaudited)
|
(7)
|
Capital Share Transactions
|
|
Transactions in shares of the Equity Income Plus Fund were as follows:
|
|
Institutional Class
|
|||||||||
|
Six Months Ended
|
Year Ended
|
||||||||
|
November 30, 2019
|
May 31, 2019
|
||||||||
|
Shares sold
|
70,426
|
276,037
|
|||||||
|
Shares reinvested
|
32,652
|
92,269
|
|||||||
|
Shares redeemed
|
(711,043
|
)
|
(2,327,819
|
)
|
|||||
|
Net decrease
|
(607,965
|
)
|
(1,959,513
|
)
|
|||||
|
Investor Class
|
|||||||||
|
Six Months Ended
|
Year Ended
|
||||||||
|
November 30, 2019
|
May 31, 2019
|
||||||||
|
Shares sold
|
—
|
37
|
|||||||
|
Shares reinvested
|
236
|
762
|
|||||||
|
Shares redeemed
|
(13,631
|
)
|
(51,880
|
)
|
|||||
|
Net decrease
|
(13,395
|
)
|
(51,081
|
)
|
|||||
|
Transactions in shares of the Short Term U.S. Government Agency Income Fund were as follows:
|
|
|
Institutional Class
|
|
Six Months Ended
|
Year Ended
|
||||||||
|
November 30, 2019
|
May 31, 2019
|
||||||||
|
Shares sold
|
224,255
|
43,403
|
|||||||
|
Shares reinvested
|
35,665
|
62,710
|
|||||||
|
Shares redeemed
|
(289,015
|
)
|
(736,789
|
)
|
|||||
|
Net decrease
|
(29,095
|
)
|
(630,676
|
)
|
|||||
|
(8)
|
Investment Transactions
|
|
Purchases and sales of investment securities (excluding short-term investments) for the Funds for the six months ended November 30, 2019 are summarized below:
|
|
Short Term
|
|||||||||
|
Equity
|
U.S. Government
|
||||||||
|
Income
|
Agency
|
||||||||
|
Plus Fund
|
Income Fund
|
||||||||
|
Purchases:
|
|||||||||
|
U.S. Government
|
$
|
—
|
$
|
4,412,512
|
|||||
|
Other
|
5,536,035
|
—
|
|||||||
|
Sales:
|
|||||||||
|
U.S. Government
|
$
|
—
|
$
|
3,323,288
|
|||||
|
Other
|
15,279,984
|
—
|
|||||||
36
M.D. Sass Funds
Notes to Financial Statements (Continued)
November 30, 2019 (Unaudited)
|
(9)
|
Beneficial Ownership
|
|
The benefical ownership, either directly or indirectly, of more than 25% of the voting securities of a fund creates a presumption of control of the fund, under Section 2(a)(9) of the 1940 Act. At November 30,
2019, the following shareholders held over 25% of a Fund’s shares outstanding:
|
|
Equity Income Plus Fund
|
|||||
|
Institutional Class
|
|||||
|
National Financial Services, LLC
|
44.93
|
%
|
|||
|
Short Term U.S. Government Agency Income Fund
|
|||||
|
Institutional Class
|
|||||
|
National Financial Services, LLC
|
34.61
|
%
|
|||
|
Marc Brownstein
|
32.24
|
%
|
|||
|
(10)
|
Line of Credit
|
|
At November 30, 2019, the Equity Income Plus Fund had a line of credit with a maximum amount of borrowing for the lessor of $5,000,000 or 33.33% of the market value of unencumbered assets and the Short Term
U.S. Government Agency Income Fund had a line of credit with a maximum amount of borrowing for the lessor of $2,500,000, 20% of the gross market value of the Fund, or 33.33% of the market value of unencumbered assets of the Fund which mature
August 8, 2020. These unsecured lines of credit are intended to provide short-term financing, if necessary, subject to certain restrictions, in connection with shareholder redemptions. The credit facility is with the Funds’ custodian, U.S.
Bank. For the six months ended November 30, 2019, the interest rate under the lines of credit was 5.50% from June 1, 2019 through July 31, 2019, 5.25% from August 1, 2019 through September 18, 2019, 5.00% from September 19, 2019 through
October 30, 2019, and 4.75% thereafter. The Funds did not borrow on the line of credit during the six months ended November 30, 2019.
|
|
|
(11)
|
Results of Shareholder Meeting
|
|
A Joint Special Meeting of Shareholders of the Funds was held November 15, 2019 at the offices of U.S. Bancorp Fund Services, LLC, 615 East Michigan Avenue, Milwaukee, Wisconsin, pursuant to notice given to all
shareholders of record of the Funds at the close of business on September 6, 2019. At the Special Meeting, shareholders were asked to approve the following:
|
|
|
To approve the Agreement and Plan of Reorganization providing for (i) the transfer of all the assets of M.D. Sass Equity Income Plus Fund, a series of Trust for Professional Managers (the “Target Fund”) to
Integrity Dividend Harvest Fund, a series of The Integrity Funds (the “Acquiring Fund”) in exchange solely for shares of the Acquiring Fund and the assumption by the Acquiring Fund of the liabilities of the Target Fund; and (ii) the pro rata
distribution to the Target Fund’s shareholders of such Acquiring Fund shares.
|
|
|
The tabulation of the shareholder votes rendered the following results:
|
|
Votes For
|
Votes Against
|
Abstained
|
||
|
1,877,921
|
0
|
734
|
|
To approve the Agreement and Plan of Reorganization providing for (i) the transfer of all the assets of M.D. Sass Short Term U.S. Government Agency Income Fund, a series of Trust for Professional Managers (the
“Target Fund”) to Integrity Short Term Government Fund, a series of The Integrity Funds (the “Acquiring Fund”) in exchange solely for shares of the Acquiring Fund and the assumption by the Acquiring Fund of the liabilities of the Target Fund;
and (ii) the pro rata distribution to the Target Fund’s shareholders of such Acquiring Fund shares.
|
|
|
The tabulation of the shareholder votes rendered the following results:
|
|
Votes For
|
Votes Against
|
Abstained
|
||
|
1,101,736
|
0
|
3,103
|
37
M.D. Sass Funds
Notes to Financial Statements (Continued)
November 30, 2019 (Unaudited)
|
(12)
|
Subsequent Events
|
|
On December 30, 2019, the Equity Income Plus Fund declared and paid a distribution from ordinary income of $34,587 to the shareholders of record on December 27, 2019 of the Institutional Class.
|
|
|
On December 30, 2019, the Short Term U.S. Government Agency Income Fund declared and paid a distribution from ordinary income of $48,000 to the shareholders of record on December 27, 2019.
|
|
|
On January 13, 2020, the Equity Income Plus Fund declared and paid a distribution from ordinary income of $5,414 and $18 to the shareholders of record on January 10, 2020 of the Institutional Class and Investor
Class, respectively.
|
|
|
As a result of the Joint Special Meeting of Shareholders on November 15, 2019, the Funds reorganized into The Integrity Funds effective the close of business January 17, 2020.
|
|
|
(13)
|
Regulatory Updates
|
|
In March 2017, the FASB issued ASU No. 2017-08, Receivables—Nonrefundable Fees and Other Costs (Subtopic 310-20): Premium Amortization on Purchased Callable Debt Securities. The amendments in the ASU shorten
the amortization period for certain callable debt securities, held at a premium, to be amortized to the earliest call date. The ASU does not require an accounting change for securities held at a discount; which continues to be amortized to
maturity. The ASU is effective for fiscal years and interim periods within those fiscal years beginning after December 15, 2018. Management does not expect an impact based upon the current amortization methodology.
|
38
M.D. Sass Equity Income Plus Fund
Basis for Trustees’ Approval of Investment Advisory Agreement
The Board of Trustees (the “Trustees”) of Trust for Professional Managers (the “Trust”) met on July 22, 2019 to consider the renewal of the Investment Advisory Agreement (the “Agreement”) between the Trust, on behalf
of the M.D. Sass Equity Income Plus Fund (the “Fund”), a series of the Trust, and M.D. Sass, LLC, the Fund’s investment adviser (the “Adviser”). The Trustees also met at a prior meeting held on June 13, 2019 (the “June 13, 2019 Meeting”) to review
materials related to the renewal of the Agreement. Prior to these meetings, the Trustees requested and received materials to assist them in considering the renewal of the Agreement. The materials provided contained information with respect to the
factors enumerated below, including a copy of the Agreement, a memorandum prepared by the Trust’s outside legal counsel discussing in detail the Trustees’ fiduciary obligations and the factors they should assess in considering the renewal of the
Agreement, detailed comparative information relating to the Fund’s performance, as well as the management fees and other expenses of the Fund, due diligence materials relating to the Adviser (including a due diligence questionnaire completed on
behalf of the Fund by the Adviser, the Adviser’s Form ADV, select financial statements of the Adviser, bibliographic information of the Adviser’s key management and compliance personnel, comparative fee information for the Fund and the Adviser’s
other separately-managed accounts and a summary detailing key provisions of the Adviser’s written compliance program, including its code of ethics) and other pertinent information. The Trustees also received information periodically throughout the
year that was relevant to the Agreement renewal process, including performance, management fee and other expense information. Based on their evaluation of the information provided by the Adviser, in conjunction with the Fund’s other service
providers, the Trustees, by a unanimous vote (including a separate vote of the Trustees who are not “interested persons,” as that term is defined in the Investment Company Act of 1940, as amended (the “Independent Trustees”)), approved the
continuation of the Agreement for an additional one-year term ending August 31, 2020.
DISCUSSION OF FACTORS CONSIDERED
In considering the renewal of the Agreement and reaching their conclusions, the Trustees reviewed and analyzed various factors that they determined were relevant, including the factors enumerated below.
|
1.
|
NATURE, EXTENT AND QUALITY OF SERVICES PROVIDED TO THE FUND
|
The Trustees considered the nature, extent and quality of services provided by the Adviser to the Fund and the amount of time devoted by the Adviser’s staff to the Fund’s operations. The Trustees considered the
Adviser’s specific responsibilities in all aspects of day-to-day management of the Fund, as well as the qualifications, experience and responsibilities of Martin D. Sass and Ari Sass, the Fund’s portfolio managers, and other key personnel at the
Adviser involved in the day-to-day activities of the Fund. The Trustees reviewed information provided by the Adviser in a due diligence summary, including the structure of the Adviser’s compliance program and discussed the Adviser’s marketing
activities and its continuing commitment to the Fund. The Trustees noted that during the course of the prior year they had met with the Adviser in person to discuss various performance, marketing and compliance issues. The Trustees also noted any
services that extended beyond portfolio management, and they considered the brokerage practices of the Adviser. The Trustees discussed in detail the Adviser’s handling of compliance matters, including the reports of the Trust’s chief compliance
officer to the Trustees on the effectiveness of the Adviser’s compliance program. The Trustees concluded that the Adviser had sufficient quality and depth of personnel, resources, investment methods and compliance policies and procedures essential
to performing its duties under the Agreement and that the nature, overall quality and extent of the management services provided to the Fund, as well as the Adviser’s compliance program, were satisfactory and reliable.
|
2.
|
INVESTMENT PERFORMANCE OF THE FUND AND THE ADVISER
|
The Trustees discussed the performance of the Fund’s Institutional Class shares for the year-to-date, one-year, three-year and five-year periods ended April 30, 2019. In assessing the quality of the portfolio
management services provided by the Adviser, the Trustees also compared the performance of the Fund’s Institutional Class shares on both an absolute basis and in comparison to a benchmark index, the CBOE S&P 500 Buy Write Index, and in comparison
to a peer group of U.S. open-end options-based funds in the Fund’s current Morningstar category as constructed by data presented by Morningstar Direct (the “Morningstar Peer Group”). The Trustees also reviewed information on the historical
performance of the Adviser’s separately-managed accounts that are similar to the Fund in terms of investment strategy.
39
M.D. Sass Equity Income Plus Fund
Basis for Trustees’ Approval of Investment Advisory Agreement (Continued)
The Trustees noted that for the year-to-date and one-year periods ended April 30, 2019, the Fund’s performance for Institutional Class shares ranked above the Morningstar Peer Group median. The Trustees further noted
that for the three-year period ended April 30, 2019, the Fund’s performance for Institutional Class shares ranked below the Morningstar Peer Group median and for the five-year period ended April 30, 2019, the Fund’s performance for Institutional
Class shares was in line with the Morningstar Peer Group median. The Trustees also noted that for the year-to-date and one-year periods ended March 31, 2019, the Fund’s Institutional Class shares had outperformed the benchmark index, and, for the
three-year, five-year and since inception periods, had underperformed the benchmark index.
After considering all of the information, the Trustees concluded that the performance obtained by the Adviser for the Fund was satisfactory under current market conditions. Although past performance is not a guarantee
or indication of future results, the Trustees determined that the Fund and its shareholders were likely to benefit from the Adviser’s continued management.
|
3.
|
COSTS OF SERVICES PROVIDED AND PROFITS REALIZED BY THE ADVISER
|
The Trustees considered the cost of services and the structure of the Adviser’s fees, including a review of the expense analyses and other pertinent material with respect to the Fund. The Trustees reviewed the related
statistical information and other materials provided, including the comparative expenses, expense components and peer group selection. The Trustees also considered the cost structure of the Fund relative to the Morningstar Peer Group.
The Trustees also considered the overall profitability of the Adviser, reviewing the Adviser’s financial information and noted that the Adviser had subsidized the Fund’s operations since the Fund’s inception and had
not recouped those subsidies. The Trustees also examined the level of profits realized by the Adviser from the fees payable under the Agreement, as well as the Fund’s brokerage practices. These considerations were based on materials requested by
the Trustees and the Fund’s administrator specifically for the July 22, 2019 meeting at which the Agreement was formally considered, as well as the reports made by the Adviser over the course of the year.
The Trustees noted that the Fund’s contractual management fee of 0.75% was below the Morningstar Peer Group average of 0.76%. The Trustees observed that the Fund’s total expense ratio (net of fee waivers and expense
reimbursements) of 0.75% for Institutional Class shares was below the Morningstar Peer Group average (which excludes Rule 12b-1 fees) of 1.17%. The Trustees then compared the management fees paid by the Fund to the fees paid by separately-managed
accounts of the Adviser with similar investment strategies.
The Trustees concluded that the Fund’s expenses and the management fees paid to the Adviser were fair and reasonable in light of the comparative performance, expense and management fee information. The Trustees noted,
based on a profitability analysis prepared by the Adviser, that the Fund was not profitable to the Adviser, but the Adviser maintained adequate profit levels to support its services to the Fund from the revenues of its overall investment advisory
business, despite its subsidies to support the Fund’s operations.
|
4.
|
EXTENT OF ECONOMIES OF SCALE AS THE FUND GROWS
|
The Trustees compared the Fund’s expenses relative to its peer group and discussed realized and potential economies of scale. The Trustees also reviewed the structure of the Fund’s management fee and whether the Fund
was large enough to generate economies of scale for shareholders or whether economies of scale would be expected to be realized as Fund assets grow (and if so, how those economies of scale were being or would be shared with shareholders). The
Trustees noted the fee waivers and expense reimbursements by the Adviser with respect to the Fund. The Trustees noted that the Fund’s management fee structure did not contain any breakpoint reductions as the Fund’s assets grow in size, but that the
feasibility of incorporating breakpoints would continue to be reviewed on a regular basis. With respect to the Adviser’s fee structure, the Trustees concluded that the current fee structure was reasonable and reflected a sharing of economies of
scale between the Adviser and the Fund at the Fund’s current asset level.
|
5.
|
BENEFITS DERIVED FROM THE RELATIONSHIP WITH THE FUND
|
The Trustees considered the direct and indirect benefits that could be realized by the Adviser from its association with the Fund. The Trustees examined the brokerage practices of the Adviser with respect to the
Fund. The Trustees concluded that the benefits the Adviser may receive, such as greater name recognition or the ability to attract additional investor assets appear to be reasonable, and in many cases may benefit the Fund.
40
M.D. Sass Equity Income Plus Fund
Basis for Trustees’ Approval of Investment Advisory Agreement (Continued)
CONCLUSIONS
The Trustees considered all of the foregoing factors. In considering the renewal of the Advisory Agreement, the Trustees did not identify any one factor as all-important, but rather considered these factors
collectively in light of the Fund’s surrounding circumstances. Based on this review, the Trustees, including a majority of the Independent Trustees, approved the continuation of the Advisory Agreement for an additional term ending August 31, 2020 as
being in the best interests of the Fund and its shareholders.
41
M.D. Sass Short Term U.S. Government Agency Income Fund
Basis for Trustees’ Approval of Investment Advisory Agreement
The Board of Trustees (the “Trustees”) of Trust for Professional Managers (the “Trust”) met on July 22, 2019 to consider the renewal of the Investment Advisory Agreement (the “Agreement”) between the Trust, on behalf
of the M.D. Sass Short Term U.S. Government Agency Income Fund (the “Fund”), a series of the Trust, and M.D. Sass Investors Services, Inc., the Fund’s investment adviser (the “Adviser”). The Trustees also met at a prior meeting held on June 13, 2019
(the “June 13, 2019 Meeting”) to review materials related to the renewal of the Agreement. Prior to these meetings, the Trustees requested and received materials to assist them in considering the renewal of the Agreement. The materials provided
contained information with respect to the factors enumerated below, including a copy of the Agreement, a memorandum prepared by the Trust’s outside legal counsel discussing in detail the Trustees’ fiduciary obligations and the factors they should
assess in considering the renewal of the Agreement, detailed comparative information relating to the Fund’s performance, as well as the management fees and other expenses of the Fund, due diligence materials relating to the Adviser (including a due
diligence questionnaire completed on behalf of the Fund by the Adviser, the Adviser’s Form ADV, select financial statements of the Adviser, bibliographic information of the Adviser’s key management and compliance personnel, comparative fee
information for the Fund and the Adviser’s other separately-managed accounts and a summary detailing key provisions of the Adviser’s written compliance program, including its code of ethics) and other pertinent information. The Trustees also
received information periodically throughout the year that was relevant to the Agreement renewal process, including performance, management fee and other expense information. Based on their evaluation of the information provided by the Adviser, in
conjunction with the Fund’s other service providers, the Trustees, by a unanimous vote (including a separate vote of the Trustees who are not “interested persons,” as that term is defined in the Investment Company Act of 1940, as amended (the
“Independent Trustees”)), approved the continuation of the Agreement for an additional one-year term ending August 31, 2020.
DISCUSSION OF FACTORS CONSIDERED
In considering the renewal of the Agreement and reaching their conclusions, the Trustees reviewed and analyzed various factors that they determined were relevant, including the factors enumerated below.
|
1.
|
NATURE, EXTENT AND QUALITY OF SERVICES PROVIDED TO THE FUND
|
The Trustees considered the nature, extent and quality of services provided by the Adviser to the Fund and the amount of time devoted by the Adviser’s staff to the Fund’s operations. The Trustees considered the
Adviser’s specific responsibilities in all aspects of day-to-day management of the Fund, as well as the qualifications, experience and responsibilities of Dominic Bruno, Nancy Persoons, Lipkee Lu and Steve Clancy, the Fund’s portfolio managers, and
other key personnel at the Adviser involved in the day-to-day activities of the Fund. The Trustees reviewed information provided by the Adviser in a due diligence summary, including the structure of the Adviser’s compliance program and discussed the
Adviser’s marketing activities and its continuing commitment to the Fund. The Trustees noted that during the course of the prior year they had met with the Adviser in person to discuss various performance, marketing and compliance issues. The
Trustees also noted any services that extended beyond portfolio management, and they considered the brokerage practices of the Adviser. The Trustees discussed in detail the Adviser’s handling of compliance matters, including the reports of the
Trust’s chief compliance officer to the Trustees on the effectiveness of the Adviser’s compliance program. The Trustees concluded that the Adviser had sufficient quality and depth of personnel, resources, investment methods and compliance policies
and procedures essential to performing its duties under the Agreement and that the nature, overall quality and extent of the management services provided to the Fund, as well as the Adviser’s compliance program, were satisfactory and reliable.
|
2.
|
INVESTMENT PERFORMANCE OF THE FUND AND THE ADVISER
|
The Trustees discussed the performance of the Fund’s Institutional Class shares for the year-to-date, one-year, three-year and five-year periods ended April 30, 2019. In assessing the quality of the portfolio
management services provided by the Adviser, the Trustees also compared the short-term and longer-term performance of the Fund’s Institutional Class shares on both an absolute basis and in comparison to a benchmark index, the BofA Merrill Lynch 1-3
Year U.S. Treasury Index, and in comparison to a peer group of U.S. open-end short government funds in the Fund’s current Morningstar category as constructed by data presented by Morningstar Direct (the “Morningstar Peer Group”). The Trustees also
reviewed information on the historical performance of the Adviser’s separately-managed accounts that are similar to the Fund in terms of investment strategy.
42
M.D. Sass Short Term U.S. Government Agency Income Fund
Basis for Trustees’ Approval of Investment Advisory Agreement (Continued)
The Trustees noted that for each of the year-to-date, three-year and five-year periods ended April 30, 2019, the Fund’s performance for Institutional Class shares ranked above the Morningstar Peer Group median, and,
for the three-year period was the best performing fund in the Morningstar Peer Group. The Trustees further noted that for the one-year period ended April 30, 2019, the Fund’s performance for Institutional Class shares ranked below the Morningstar
Peer Group median. The Trustees also noted that for the year-to-date, one-year, three-year, five-year and since inception periods ended March 31, 2019, the Fund’s Institutional Class shares had outperformed the BofA Merrill Lynch 1-3 Year U.S.
Treasury Index. The Trustees further noted the Fund’s performance for all periods was generally in alignment with performance of the Adviser’s separately-managed accounts that are similar to the Fund in terms of investment strategy.
After considering all of the information, the Trustees concluded that the performance obtained by the Adviser for the Fund was satisfactory under current market conditions. Although past performance is not a guarantee
or indication of future results, the Trustees determined that the Fund and its shareholders were likely to benefit from the Adviser’s continued management.
|
3.
|
COSTS OF SERVICES PROVIDED AND PROFITS REALIZED BY THE ADVISER
|
The Trustees considered the cost of services and the structure of the Adviser’s fees, including a review of the expense analyses and other pertinent material with respect to the Fund. The Trustees reviewed the related
statistical information and other materials provided, including the comparative expenses, expense components and peer group selection. The Trustees also considered the cost structure of the Fund relative to the Morningstar Peer Group.
The Trustees also considered the overall profitability of the Adviser, reviewing the Adviser’s financial information and noted that the Adviser had subsidized the Fund’s operations since the Fund’s inception but had
not yet fully recouped those subsidies. The Trustees also examined the level of profits realized by the Adviser from the fees payable under the Agreement, as well as the Fund’s brokerage practices. These considerations were based on materials
requested by the Trustees and the Fund’s administrator specifically for the July 22, 2019 meeting at which the Agreement was formally considered, as well as the reports made by the Adviser over the course of the year.
The Trustees noted that the Fund’s contractual management fee of 0.30% was below its Morningstar Peer Group average of 0.41%. The Trustees observed that the Fund’s total expense ratio (net of fee waivers and expense
reimbursements) of 0.55% for Institutional Class shares was below the Morningstar Peer Group average (which excludes Rule 12b-1 fees) of 0.66%. The Trustees then compared the management fees paid by the Fund to the fees paid by separately-managed
accounts of the Adviser with similar investment strategies.
The Trustees concluded that the Fund’s expenses and the management fees paid to the Adviser were fair and reasonable in light of the comparative performance, expense and management fee information. The Trustees
further concluded, based on a profitability analysis prepared by the Adviser, that the Fund was not profitable to the Adviser, but the Adviser maintained adequate profit levels to support its services to the Fund from the revenues of its overall
investment advisory business, despite its subsidies to support the Fund’s operations.
|
4.
|
EXTENT OF ECONOMIES OF SCALE AS THE FUND GROWS
|
The Trustees compared the Fund’s expenses relative to its peer group and discussed realized and potential economies of scale. The Trustees also reviewed the structure of the Fund’s management fee and whether the Fund
was large enough to generate economies of scale for shareholders or whether economies of scale would be expected to be realized as Fund assets grow (and if so, how those economies of scale were being or would be shared with shareholders). The
Trustees noted the fee waivers and expense reimbursements by the Adviser with respect to the Fund. The Trustees noted that the Fund’s management fee structure did not contain any breakpoint reductions as the Fund’s assets grow in size, but that the
feasibility of incorporating breakpoints would continue to be reviewed on a regular basis. With respect to the Adviser’s fee structure, the Trustees concluded that the current fee structure was reasonable and reflected a sharing of economies of
scale between the Adviser and the Fund at the Fund’s current asset level.
|
5.
|
BENEFITS DERIVED FROM THE RELATIONSHIP WITH THE FUND
|
The Trustees considered the direct and indirect benefits that could be realized by the Adviser from its association with the Fund. The Trustees concluded that the benefits the Adviser may receive, such as greater name
recognition or the ability to attract additional investor assets appear to be reasonable, and in many cases may benefit the Fund.
43
M.D. Sass Short Term U.S. Government Agency Income Fund
Basis for Trustees’ Approval of Investment Advisory Agreement (Continued)
CONCLUSIONS
The Trustees considered all of the foregoing factors. In considering the renewal of the Advisory Agreement, the Trustees did not identify any one factor as all-important, but rather considered these factors
collectively in light of the Fund’s surrounding circumstances. Based on this review, the Trustees, including a majority of the Independent Trustees, approved the continuation of the Advisory Agreement for an additional term ending August 31, 2020 as
being in the best interests of the Fund and its shareholders.
44
M.D. Sass Funds
Notice of Privacy Policy & Practices
We collect non-public personal information about you from the following sources:
|
•
|
information we receive about you on applications or other forms;
|
|
•
|
information you give us orally; and
|
|
•
|
information about your transactions with us or others.
|
We do not disclose any non-public personal information about our shareholders or former shareholders without the shareholder’s authorization, except as permitted by law or in response to inquiries from governmental
authorities. We may share information with affiliated parties and unaffiliated third parties with whom we have contracts for servicing the Funds. We will provide unaffiliated third parties with only the information necessary to carry out their
assigned responsibility. All shareholder records will be disposed of in accordance with applicable law. We maintain physical, electronic and procedural safeguards to protect your non-public personal information and require third parties to treat
your non-public personal information with the same high degree of confidentiality.
In the event that you hold shares of the Funds through a financial intermediary, including, but not limited to, a broker-dealer, bank or trust company, the privacy policy of your financial intermediary would govern how
your non-public personal information would be shared with unaffiliated third parties.
45
M.D. Sass Funds
Additional Information
(Unaudited)
Indemnifications
Under the Trust’s organizational documents, its officers and Trustees are indemnified against certain liabilities arising out of the performance of their duties to the Funds. In addition, in the normal course of
business, the Funds enter into contracts that provide general indemnifications to other parties. The Funds’ maximum exposure under these arrangements is unknown as this would involve future claims that may be made against the Funds that have not yet
occurred. However, the Funds have not had prior claims or losses pursuant to these contracts and expects the risk of loss to be remote.
Information about Trustees
The business and affairs of the Trust are managed under the direction of the Board of Trustees of the Trust (the “Board”). Information pertaining to the Trustees of the Trust is set forth below. The Statement of
Additional Information includes additional information about the Trustees and is available, without charge, upon request by calling 1-855-MDS-FUND (1-855-637-3863).
|
Number of
|
|||||
|
Term of
|
Portfolios
|
Other Directorships
|
|||
|
Position(s)
|
Office and
|
in Trust
|
Held by Trustee
|
||
|
Name, Address
|
Held with
|
Length of
|
Overseen
|
Principal Occupation(s)
|
During the
|
|
and Year of Birth
|
the Trust
|
Time Served
|
by Trustee
|
During the Past Five Years
|
Past Five Years
|
|
Independent Trustees
|
|||||
|
Michael D. Akers, Ph.D.
|
Trustee
|
Indefinite
|
26
|
Professor Emeritus of
|
Independent Trustee,
|
|
615 E. Michigan St.
|
Term; Since
|
Accounting, Marquette
|
USA MUTUALS (an
|
||
|
Milwaukee, WI 53202
|
August 22,
|
University (June 2019-
|
open-end investment
|
||
|
Year of Birth: 1955
|
2001
|
present); Professor,
|
company with two
|
||
|
Department of Accounting,
|
portfolios).
|
||||
|
Marquette University
|
|||||
|
(2004-May 2019);
|
|||||
|
Chair, Department of
|
|||||
|
Accounting, Marquette
|
|||||
|
University (2004-2017).
|
|||||
|
Gary A. Drska
|
Trustee
|
Indefinite
|
26
|
Pilot, Frontier/Midwest Airlines,
|
Independent Trustee,
|
|
615 E. Michigan St.
|
Term; Since
|
Inc. (airline company)
|
USA MUTUALS (an
|
||
|
Milwaukee, WI 53202
|
August 22,
|
(1986-present).
|
open-end investment
|
||
|
Year of Birth: 1956
|
2001
|
company with two
|
|||
|
portfolios).
|
|||||
|
Jonas B. Siegel
|
Trustee
|
Indefinite
|
26
|
Retired (2011-present);
|
Independent Trustee,
|
|
615 E. Michigan St.
|
Term; Since
|
Managing Director, Chief
|
Gottex Trust (an open-end
|
||
|
Milwaukee, WI 53202
|
October 23,
|
Administrative Officer (“CAO”)
|
investment company)
|
||
|
Year of Birth: 1943
|
2009
|
and Chief Compliance Officer
|
(2010-2016); Independent
|
||
|
(“CCO”), Granite Capital
|
Manager, Ramius IDF
|
||||
|
International Group, L.P.
|
fund complex (two
|
||||
|
(an investment management
|
closed-end investment
|
||||
|
firm) (1994-2011).
|
companies) (2010-2015);
|
||||
|
Independent Trustee,
|
|||||
|
Gottex Multi-Asset
|
|||||
|
Endowment fund complex
|
|||||
|
(three closed-end
|
|||||
|
investment companies)
|
|||||
|
(2010-2015); Independent
|
|||||
|
Trustee, Gottex Multi-
|
|||||
|
Alternatives fund complex
|
|||||
|
(three closed-end
|
|||||
|
investment companies)
|
|||||
|
(2010-2015).
|
46
M.D. Sass Funds
Additional Information (Continued)
(Unaudited)
|
Number of
|
|||||
|
Term of
|
Portfolios
|
Other Directorships
|
|||
|
Position(s)
|
Office and
|
in Trust
|
Held by Trustee
|
||
|
Name, Address
|
Held with
|
Length of
|
Overseen
|
Principal Occupation(s)
|
During the
|
|
and Year of Birth
|
the Trust
|
Time Served
|
by Trustee
|
During the Past Five Years
|
Past Five Years
|
|
Interested Trustee and Officers
|
|||||
|
Joseph C. Neuberger*
|
Chairperson
|
Indefinite
|
26
|
President (2017-present),
|
Trustee; USA MUTUALS
|
|
615 E. Michigan St.
|
and
|
Term; Since
|
Chief Operating Officer
|
(an open-end investment
|
|
|
Milwaukee, WI 53202
|
Trustee
|
August 22,
|
(2016-present), Executive
|
company) (2001-2018);
|
|
|
Year of Birth: 1962
|
2001
|
Vice President (1994-2017),
|
Trustee, Buffalo
|
||
|
U.S. Bancorp Fund
|
Funds (an open-end
|
||||
|
Services, LLC.
|
investment company)
|
||||
|
|
(2003-2017).
|
||||
|
John P. Buckel
|
President
|
Indefinite
|
N/A
|
Vice President, U.S. Bancorp Fund
|
N/A
|
|
615 E. Michigan St.
|
and
|
Term; Since
|
Services, LLC (2004-present).
|
||
|
Milwaukee, WI 53202
|
Principal
|
January 24,
|
|||
|
Year of Birth: 1957
|
Executive
|
2013
|
|||
|
Officer
|
|||||
|
Jennifer A. Lima
|
Vice
|
Indefinite
|
N/A
|
Vice President, U.S. Bancorp Fund
|
N/A
|
|
615 E. Michigan St.
|
President,
|
Term; Since
|
Services, LLC (2002-present).
|
||
|
Milwaukee, WI 53202
|
Treasurer
|
January 24,
|
|||
|
Year of Birth: 1974
|
and
|
2013
|
|||
|
Principal
|
|||||
|
Financial and
|
|||||
|
Accounting
|
|||||
|
Officer
|
|||||
|
Elizabeth B. Scalf
|
Chief
|
Indefinite
|
N/A
|
Senior Vice President, U.S.
|
N/A
|
|
615 E. Michigan St.
|
Compliance
|
Term; Since
|
Bancorp Fund Services, LLC
|
||
|
Milwaukee, WI 53202
|
Officer,
|
July 1,
|
(February 2017-present);
|
||
|
Year of Birth: 1985
|
Vice
|
2017
|
Vice President and Assistant
|
||
|
President and
|
CCO, Heartland Advisors, Inc.
|
||||
|
Anti-Money
|
(December 2016-January 2017);
|
||||
|
Laundering
|
Vice President and CCO,
|
||||
|
Officer
|
Heartland Group, Inc.
|
||||
|
(May 2016-November 2016);
|
|||||
|
Vice President, CCO and
|
|||||
|
Senior Legal Counsel
|
|||||
|
(May 2016-November 2016),
|
|||||
|
Assistant CCO and Senior Legal
|
|||||
|
Counsel (January 2016-April 2016),
|
|||||
|
Senior Legal and Compliance
|
|||||
|
Counsel (2013-2015), Heartland
|
|||||
|
Advisors, Inc.
|
|||||
|
Jay S. Fitton
|
Secretary
|
Indefinite
|
N/A
|
Assistant Vice President,
|
N/A
|
|
615 E. Michigan St.
|
Term; Since
|
U.S. Bancorp Fund Services,
|
|||
|
Milwaukee, WI 53202
|
July 22,
|
LLC (2019-present); Partner,
|
|||
|
Year of Birth: 1970
|
2019
|
Practus, LLP (2018-2019);
|
|||
|
Counsel, Drinker Biddle &
|
|||||
|
Reath (2016-2018); Counsel,
|
|||||
|
Huntington Bancshares Inc.
|
|||||
|
(2011-2015).
|
|||||
|
*
|
Mr. Neuberger is an “interested person” of the Trust as defined by the 1940 Act by virtue of the fact that he is a board member and an interested person of Quasar Distributors, LLC (the “Distributor”), the
Funds’ principal underwriter.
|
47
M.D. Sass Funds
Additional Information (Continued)
(Unaudited)
|
Number of
|
|||||
|
Term of
|
Portfolios
|
Other Directorships
|
|||
|
Position(s)
|
Office and
|
in Trust
|
Held by Trustee
|
||
|
Name, Address
|
Held with
|
Length of
|
Overseen
|
Principal Occupation(s)
|
During the
|
|
and Year of Birth
|
the Trust
|
Time Served
|
by Trustee
|
During the Past Five Years
|
Past Five Years
|
|
Kelly A. Burns
|
Assistant
|
Indefinite
|
N/A
|
Assistant Vice President, U.S.
|
N/A
|
|
615 E. Michigan St.
|
Treasurer
|
Term; Since
|
Bancorp Fund Services, LLC
|
||
|
Milwaukee, WI 53202
|
April 23,
|
(2011-present).
|
|||
|
Year of Birth: 1987
|
2015
|
||||
|
Melissa Aguinaga
|
Assistant
|
Indefinite
|
N/A
|
Assistant Vice President, U.S.
|
N/A
|
|
615 E. Michigan St.
|
Treasurer
|
Term; Since
|
Bancorp Fund Services, LLC
|
||
|
Milwaukee, WI 53202
|
July 1,
|
(2010-present).
|
|||
|
Year of Birth: 1987
|
2015
|
||||
|
Laura A. Carroll
|
Assistant
|
Indefinite
|
N/A
|
Assistant Vice President, U.S.
|
N/A
|
|
615 E. Michigan St.
|
Treasurer
|
Term; Since
|
Bancorp Fund Services, LLC
|
||
|
Milwaukee, WI 53202
|
August 20,
|
(2007-present).
|
|||
|
Year of Birth: 1985
|
2018
|
48
FEDERAL TAX INFORMATION (Unaudited)
For the fiscal year ended May 31, 2019, certain dividends paid by the Funds may be subject to a maximum tax rate of 15%, as provided for by the Jobs and Growth Tax Relief Reconciliation Act of 2003. The percentage of
dividends declared from ordinary income designated as qualified dividend income was as follows:
| M.D. Sass Equity Income Plus Fund |
100.00%
|
|
For corporate shareholders, the percent of ordinary income distributions qualifying for the corporate dividends received deduction for the fiscal year ended May 31, 2019 was as follows:
| M.D. Sass Equity Income Plus Fund |
97.98%
|
|
A NOTE ON FORWARD LOOKING STATEMENTS (Unaudited)
Except for historical information contained in this report for the Funds, the matters discussed in this report may constitute forward-looking statements made pursuant to the safe-harbor provisions of the Private
Securities Litigation Reform Act of 1995. These include any adviser or portfolio manager predictions, assessments, analyses or outlooks for individual securities, industries, market sectors and/or markets. These statements involve risks and
uncertainties. In addition to the general risks described for the Funds in the current Prospectus, other factors bearing on this report include the accuracy of the adviser’s or portfolio managers’ forecasts and predictions, and the appropriateness
of the investment programs designed by the adviser or portfolio managers to implement their strategies efficiently and effectively. Any one or more of these factors, as well as other risks affecting the securities markets and investment instruments
generally, could cause the actual results of the Funds to differ materially as compared to benchmarks associated with the Funds.
ADDITIONAL INFORMATION (Unaudited)
The Funds have adopted proxy voting policies and procedures that delegate to the Advisers the authority to vote proxies. A description of the Funds’ proxy voting policies and procedures is available without charge,
upon request, by calling the Funds toll free at 1-855-MDS-FUND (1-855-637-3863). A description of these policies and procedures is also included in the Funds’ Statement of Additional Information, which is available on the SEC’s website at http://www.sec.gov.
The Funds’ proxy voting record for the most recent 12-month period ended June 30 is available without charge, upon request, by calling, toll free, 1-855-MDS-FUND (1-855-637-3863), or by accessing the SEC’s website at http://www.sec.gov.
The Funds file a complete schedule of portfolio holdings with the SEC for the first and third quarters of each fiscal year on Form N-Q (through the quarter ended February 29, 2020) or Part F of Form N-PORT (beginning
with filings thereafter). Shareholders may view the Funds’ Forms N-PORT and N-Q on the SEC’s website at http://www.sec.gov.
HOUSEHOLDING (Unaudited)
In an effort to decrease costs, the Funds intend to reduce the number of duplicate prospectuses and annual and semi-annual reports you receive by sending only one copy of each to those addresses shared by two or more
accounts and to shareholders the Funds reasonably believe are from the same family or household. Once implemented, if you would like to discontinue householding for your accounts, please call toll-free at 1-855-MDS-FUND (1-855-637-3863) to request
individual copies of these documents. Once the Funds receive notice to stop householding, the Funds will begin sending individual copies 30 days after receiving your request. This policy does not apply to account statements.
49
(This Page Intentionally Left Blank.)
M.D. SASS FUNDS
|
Investment Advisers
|
Equity Income Plus Fund
|
|
M.D. Sass, LLC
|
|
|
55 West 46th Street, 28th Floor
|
|
|
New York, New York 10036
|
|
|
Short Term U.S. Government Agency Income Fund
|
|
|
M.D. Sass Investors Services, Inc.
|
|
|
55 West 46th Street, 28th Floor
|
|
|
New York, New York 10036
|
|
|
Legal Counsel
|
Godfrey & Kahn, S.C.
|
|
833 East Michigan Street, Suite 1800
|
|
|
Milwaukee, Wisconsin 53202
|
|
|
Independent Registered Public
|
Cohen & Company, Ltd.
|
|
Accounting Firm
|
1350 Euclid Avenue
|
|
Suite 800
|
|
|
Cleveland, Ohio 44115
|
|
|
Transfer Agent, Fund Accountant and
|
U.S. Bancorp Fund Services, LLC
|
|
Fund Administrator
|
615 East Michigan Street
|
|
Milwaukee, Wisconsin 53202
|
|
|
Custodian
|
U.S. Bank, N.A.
|
|
Custody Operations
|
|
|
1555 North RiverCenter Drive
|
|
|
Milwaukee, Wisconsin 53212
|
|
|
Distributor
|
Quasar Distributors, LLC
|
|
777 East Wisconsin Avenue, 6th Floor
|
|
|
Milwaukee, Wisconsin 53202
|
This report is intended for shareholders of the Funds and may not be used as sales literature unless preceded or accompanied by a current prospectus.
Item 2. Code of Ethics.
Not applicable for semi-annual reports.
Item 3. Audit Committee Financial Expert.
Not applicable for semi-annual reports.
Item 4. Principal Accountant Fees and Services.
Not applicable for semi-annual reports.
Item 5. Audit Committee of Listed Registrants.
Not applicable to registrants who are not listed issuers (as defined in Rule 10A-3 under the Securities Exchange Act of 1934).
Item 6. Investments.
|
(a)
|
Schedule of Investments is included as part of the report to shareholders filed under Item 1 of this Form.
|
|
(b)
|
Not Applicable.
|
Item 7. Disclosure of Proxy Voting Policies and Procedures for Closed-End Management Investment Companies.
Not applicable to open-end investment companies.
Item 8. Portfolio Managers of Closed-End Management Investment Companies.
Not applicable to open-end investment companies.
Item 9. Purchases of Equity Securities by Closed‑End Management Investment Company and Affiliated Purchasers.
Not applicable to open-end investment companies.
Item 10. Submission of Matters to a Vote of Security Holders.
There have been no material changes to the procedures by which shareholders may recommend nominees to the registrant’s board of trustees.
Item 11. Controls and Procedures.
|
(a)
|
The Registrant’s President and Treasurer have reviewed the Registrant's disclosure controls and procedures (as defined in Rule 30a-3(c) under the Investment Company Act of 1940 (the “Act”)) as of a date within 90 days of the filing of
this report, as required by Rule 30a-3(b) under the Act and Rules 13a-15(b) or 15d‑15(b) under the Securities Exchange Act of 1934. Based on their review, such officers have concluded that the disclosure controls and procedures are
effective in ensuring that information required to be disclosed in this report is appropriately recorded, processed, summarized and reported and made known to them by others within the Registrant and by the Registrant’s service provider.
|
|
(b)
|
There were no changes in the Registrant's internal control over financial reporting (as defined in Rule 30a-3(d) under the Act) that occurred during the last fiscal half-year covered by this report that has materially affected, or is
reasonably likely to materially affect, the Registrant's internal control over financial reporting.
|
Item 12. Disclosure of Securities Lending Activities for Closed-End Management Investment Companies.
Not applicable to open-end investment companies.
Item 13. Exhibits.
|
(a)
|
(1) Any code of ethics or amendment thereto, that is the subject of the disclosure required by Item 2, to the extent that the registrant intends to satisfy Item 2 requirements through filing an
exhibit. Not Applicable.
|
(2) A separate certification for each principal executive and principal financial officer pursuant to Section 302 of the Sarbanes-Oxley Act of 2002. Filed herewith.
(3) Any written solicitation to purchase securities under Rule 23c‑1 under the Act sent or given during the period covered by the report by or on behalf of the registrant to 10 or
more persons. Not applicable to open-end investment companies.
(4) Change in the registrant’s independent public accountant. There was no change in the registrant’s independent public accountant for the period covered by this report.
|
(b)
|
Certifications pursuant to Section 906 of the Sarbanes‑Oxley Act of 2002. Furnished herewith.
|
SIGNATURES
Pursuant to the requirements of the Securities Exchange Act of 1934 and the Investment Company Act of 1940, the registrant has duly caused this report to be signed on its behalf by the undersigned, thereunto duly
authorized.
(Registrant) Trust for Professional Managers
By (Signature and Title)* /s/ John Buckel
John Buckel, President
Date 1/29/2020
Pursuant to the requirements of the Securities Exchange Act of 1934 and the Investment Company Act of 1940, this report has been signed below by the following persons on behalf of the registrant and in the capacities
and on the dates indicated.
By (Signature and Title)* /s/ John Buckel
John Buckel, President
Date 1/29/2020
By (Signature and Title)* /s/ Jennifer Lima
Jennifer Lima, Treasurer
Date 1/29/2020
* Print the name and title of each signing officer under his or her signature.