2021
Annual Report
on Form 20 -F
Equinor, Annual Report on Form 20-F 2021 1
RUNITED STATES
SECURITIES AND EXCHANGE COMMISSION
WASHINGTON, DC 20549
FORM
(Mark One)
REGISTRATION STATEMENT PURSUANT TO SECTION 12(b) OR 12(g) OF THE SECURITIES EXCHANGE ACT OF
1934
OR
ANNUAL REPORT PURSUANT TO SECTION 13 OR 15(d) OF THE SECURITIES EXCHANGE ACT OF 1934
For the fiscal year ended
OR
TRANSITION REPORT PURSUANT TO SECTION 13 OR 15(d) OF THE SECURITIES EXCHANGE ACT OF 1934
For the transition period from to
OR
☐
SHELL COMPANY REPORT PURSUANT TO SECTION 13 OR 15(d) OF THE SECURITIES EXCHANGE ACT OF 1934
Date of event requiring this shell company report
Commission file number
(Exact Name of Registrant as Specified in Its Charter)
N/A
(Translation of Registrant’s Name Into English)
(Jurisdiction of Incorporation or Organization)
,
,
,
(Address of Principal Executive Offices)
Chief Financial Officer
Equinor ASA
,
,
Telephone No.: 011-47-
Fax No.: 011-
-
(Name, Telephone, E-mail and/or Facsimile number and Address of Company Contact Person)
Securities registered or to be registered pursuant to Section 12(b) of the Act:
Title of Each Class
Trading Symbol(s)
Name of Each Exchange On Which Registered
each
*
*Listed, not for trading, but only in connection with the registration of American Depositary Shares, pursuant to the requirements
of the Securities and Exchange Commission
Securities registered or to be registered pursuant to Section 12(g) of the Act:
Securities for which there is a reporting obligation pursuant to Section 15(d) of the Act:
2 Equinor, Annual Report on Form 20-F 2021
Indicate the number of outstanding shares of each of the issuer’s classes of capital or common stock as of the close of the period covered by
the annual report.
Ordinary shares of NOK 2.50 each
Indicate by check mark if the registrant is a well-known seasoned issuer, as defined in Rule 405 of the Securities Act.
☒
Yes
☐
No
If this report is an annual or transition report, indicate by check mark if the registrant is not required to file reports pursuant to Section 13 or
15(d) of the Securities Exchange Act of 1934.
☐
☒
No
Note – Checking the box above will not relieve any registrant required to file reports pursuant to Section 13 or 15(d) of the
Securities Exchange Act of 1934 from their obligations under those Sections.
Indicate by check mark whether the registrant: (1) has filed all reports required to be filed by Section 13 or 15(d) of the Securities Exchange
Act of 1934 during the preceding 12 months (or for such shorter period that the registrant was required to file such reports), and (2) has
been subject to such filing requirements for the past 90 days.
☒
Yes
☐
No
Yes
No
Indicate by check mark whether the registrant has submitted electronically Interactive Data File required to be submitted pursuant to Rule
405 of Regulation S-T (§232.405 of this chapter) during the preceding 12 months (or for such shorter period that the registrant was required
to submit and post such files)
☒
Yes
☐
No
Indicate by check mark whether the registrant is a large accelerated filer, an accelerated filer, a non-accelerated filer, or an emerging growth
company. See the definitions of “large accelerated filer,” “accelerated filer,” and “emerging growth company” in Rule 12b-2 of the
Exchange Act. (Check one):
☒
Accelerated filer
☐
Non-accelerated filer
☐
Emerging growth company
If an emerging growth company that prepares its financial statements in accordance with U.S. GAAP, indicate by check mark if the
registrant has elected not to use the extended transition period for complying with any new or revised financial accounting standards†
provided pursuant cat
† The term “new or revised financial accounting standard” refers to any update issued by the Financial Accounting Standards Board to its
Accounting Standards Codification after April 5, 2012.
Indicate by check mark whether the registrant has filed a report on and attestation to its management’s assessment of the effectiveness of its
internal control over financial reporting under Section 404(b) of the Sarbanes-Oxley Act (15 U.S.C. 762(b)) by the registered public
accounting firm that prepared or issued its audit report.
Indicate by check mark which basis of accounting the registrant has used to prepare the financial statements included in this filing:
U.S. GAAP
☐
by the International Accounting Standards Board
☒
☐
If “Other” has been checked in response to the previous question, indicate by check mark which financial statement item the registrant has
elected to follow.
Item 17
☐
Item 18
☐
If this is an annual report, indicate by check mark whether the registrant is a shell company (as defined in Rule 12b-2 of the
Exchange Act).
☐
☒
No
Equinor, Annual Report on Form 20-F 2021 3
We are Equinor
We are an international energy company
committed to playing a leading role in the
energy transition – providing for continued
value creation in a net zero future.
We energise the lives of 170 million people.
Every day.

4 Equinor, Annual Report on Form 20-F 2021
We continue to pursue our strategy of always safe, high value and low carbon. To position ourselves
as a leading company in the energy transition, we are accelerating profitable growth in renewable energy,
positioning for low carbon solutions and focusing and optimising our oil and gas business.
Below are some key figures from 2021.
Equinor, Annual Report on Form 20-F 2021 5
2021 highlights
January:
Awarded 17 new production licences on the Norwegian continental shelf (NCS). Started constructing the onshore facilities for Northern Lights
CO2 transport and storage.
February:
Plan for partial electrification of the Sleipner field centre in the North Sea was approved, to cut CO2 emissions by more than 150,000 tonnes
per year. Entered into agreement to divest interests in the Bakken field in the USA.
March:
Public funding confirmed for all three of Equinor’s projects to deliver deep cuts in CO2 emissions from industries and support clean growth on
the UK’s east coast. Important progress to create the world’s first net zero industrial cluster by 2040. Decided to develop Åsgard B low
pressure, a project to secure increased recovery from the Åsgard field in the Norwegian Sea.
April:
Decided to develop Askeladd West, increasing the resource base and extending plateau production for Hammerfest LNG.
May:
Achieved milestone in Polish renewables with award of contracts for difference to Bałtyk 2 and Bałtyk 3 projects and acquisition of the Polish
onshore developer Wento. Entered into collaboration agreements with solid partners for future development of offshore wind at Utsira North
and the North Sea on the NCS.
June:
Presented on capital markets day an updated strategy for accelerating the transition to a broad energy company while growing cashflow and
returns. Made final investment decision for Bacalhau phase 1 in Brazil. Submitted development plan for Kristin South in the Norwegian Sea.
Plan approved February 2022. Plan for the Breidablikk field in the North Sea was approved by the Norwegian authorities. The Martin Linge
field came on stream, powered from shore. The is the first platform on the NCS to be brought on stream operated from its onshore control
room.
July – August:
The Guañizuil 2A solar plant in Argentina was brought in commercial production. Troll phase 3 came on line, producing gas and extending the
plateau production of Troll gas. New wells have been tied in to Troll A.
September:
Taking action to increase gas supply as demand for gas in Europe rose to unprecedented levels, Equinor scaled up production from Troll and
Oseberg, and suspended gas injection at Gina Krog to export the gas. Coupled with a high production efficiency, this boosted Equinor's gas
supply to Europe in the fourth quarter by 16.5% compared to 2020.
October:
Selected our preferred supplier of 15 MW wind turbine generators for Empire Wind 1 and 2 outside New York. A total of 138 turbines, with a
combined generating capacity of around 2 GW, to be delivered.
November:
Submitted plan for investing further in Oseberg to increase gas production and reduce CO2 emissions. Made final investment decision for
Dogger Bank C, the third phase of the world’s largest windfarm development off the east coast of the UK. The first and second phases are
under construction.
December:
Increased stake in the Statfjord field. Plan for electrification of Troll C and a partial electrification of Troll B approved, to cut emissions by
almost half a million tonnes CO2 annually. Launched Hydrogen to Belgium, a project for developing production of low-carbon hydrogen from
natural gas in Belgium. Made eight commercial discoveries on the NCS in 2021, several close to existing infrastructure.
6 Equinor, Annual Report on Form 20-F 2021
ABOUT THE REPORT
This document constitutes the Annual report on Form 20-F pursuant to the US Securities Exchange Act of 1934 as applicable to
foreign private issuers, for Equinor ASA for the year ended 31 December 2021. Cross references to the Form 20-F requirements are
set out in section 5.11 in this report. The Annual report on Form 20-F and other related documents are filed with the US Securities
and Exchange Commission (the SEC). The (statutory) Annual report (and Form 20-F) are filed with the Norwegian Register of
company accounts.
The Equinor Annual report and Form 20-F may be downloaded from Equinor’s website at
www.equinor.com/reports
. References in
this document or other documents to Equinor’s website are included as an aid to their location and are not incorporated by reference
into this document. All SEC filings made available electronically by Equinor may be found at
www.sec.gov
.
Table of contents
2021 highlights
5
About the report
6
INTRODUCTION
Message from the chair of the board
9
Chief executive letter
12
STRATEGIC REPORT
2.1 Strategy and market overview
13
2.2 Business overview
21
2.3 Exploration & Production Norway
32
2.4 Exploration & Production International
41
2.5 Exploration & Production USA
49
2.6 Marketing, Midstream & Processing
54
2.7 Renewables
59
2.8 Other group
63
2.9 Corporate
65
2.10 Operational performance
75
2.11 Financial review
94
2.12 Liquidity and capital resources
104
2.13 Risk review
112
2.14 Safety, security and sustainability
126
2.15 Our people
136
CORPORATE GOVERNANCE
3.1 Introduction
145
3.2 General meeting of shareholders
148
3.3 Nomination committee
150
3.4 Corporate assembly
150
3.5 Board of directors
154
3.6 Management
165
3.7 Compensation to governing bodies
3.8 Share ownership
182
3.9 External auditor
183
3.10 Risk management and internal control
184
FINANCIAL STATEMENTS AND SUPPLEMENTS
4.1 Consolidated financial statements of the Equinor group
187
4.2 Supplementary oil and gas information (unaudited)
266
ADDITIONAL INFORMATION
5.1 Shareholder information
279
5.2 Non-GAAP financial measures
289
5.3 Legal proceedings
294
5.7 Terms and abbreviations
295
Equinor, Annual Report on Form 20-F 2021 7
5.8 Forward-looking statements
298
5.9 Signature page
300
5.10 Exhibits
301
5.11 Cross reference of Form 20-F
315
8 Equinor, Annual Report on Form 20-F 2021
In September 2022, Equinor celebrates its
50-year anniversary. The company has
created value as an early mover and industry
shaper for decades, and we are proud of this
legacy and our purpose to turn natural
resources into energy for people and progress
for society.
Jon Erik Reinhardsen
Equinor, Annual Report on Form 20-F 2021 9
Message from the chair of the board
Dear fellow investors,
At the time of publishing this annual report, we are deeply concerned for the people suffering from the invasion of Ukraine. Equinor
has made swift decisions to stop trading Russian oil and investments into Russia and has started the process of exiting the
company’s joint ventures in the country. We are committed to complying with relevant sanctions and continue to take actions to
protect our people and operations.
In the situation we are in, Equinor holds an important role as a reliable provider of energy. In September 2022, Equinor celebrates its
50-year anniversary. The company has created value as an early mover and industry shaper for decades, and we are proud of this
legacy and our purpose to turn natural resources into energy for people and progress for society. Looking ahead, we have a strategy
to drive the energy transition and capture the opportunities that lie in front of us.
Safety is the highest priority for the company and the board of directors. Last year, our serious incident frequency improved
compared to 2020, but we still have too many personal injuries related to our activities. The board is therefore working closely with
the administration to turn the trend. Strong collaboration with employee representatives, partners and suppliers is key to further
improve our safety performance.
In 2021, we have seen a significant increase in commodity prices compared to 2020, with a surge in natural gas prices that had a
direct impact on people and societies. This is an important reminder of the significance of our industry, underlining the need for a
reliable and affordable supply of energy through the transition.
At our capital markets day in June 2021, we launched our updated strategy to accelerate our transition while growing cashflow and
returns. With our highly valuable upstream portfolio and our premium project pipeline we have an advantaged starting point. This
gives us a solid platform for funding profitable growth in renewables and shaping new markets within low carbon solutions. All to
build the company and the industry of tomorrow.
In line with our strategy and ambitions, we launched the Norway energy hub. This is an industrial plan for Norway as an energy
nation. Equinor invites partners and governments to collaborate on creating the energy systems of the future. We aim to decarbonise
oil and gas, industrialise offshore wind and hydrogen, and provide commercial carbon capture and storage. This will build new value
chains and facilitate industrial development, investments, and jobs.
During 2021, Equinor reached important milestones. We made the final investment decision for the projects Bacalhau in Brazil and
Troll West electrification in Norway. We have also focused the international oil and gas portfolio by exiting several assets and
countries. This improves robustness and profitability and enables us to capitalise on our legacy business while transitioning to new
activities.
Equinor delivered strong financial results in 2021, as a result of higher commodity prices, continued improvements, and strict capital
discipline. We achieved a total shareholder return of 62%, bringing us to the first quartile in our peer group
1
. Our net income was
around USD 8.6 billion, compared to negative USD 5.5 billion in 2020. Driven by high cashflow we have improved our adjusted net
debt ratio from 32% in 2020 to below zero in 2021.
During the year we have increased our cash dividend, from USD 0.15 per share in the first quarter to USD 0.18 per share in the
third. In addition, we have executed our share buyback programme as part of our capital distribution. For the fourth quarter of the
year, the board proposes to the AGM a cash dividend of USD 0.20 per share, and an extraordinary quarterly dividend of the same
amount.
Last year, we announced that we will submit our energy transition plan for advisory vote to shareholders at the annual general
meeting in May 2022. Sustainability has been integrated in our business for many years, and this plan outlines how we will progress
our efforts towards 2030 and beyond. At our capital markets update in February 2022, we announced a step-up in our climate
ambitions, as we aim to reduce our groupwide net emissions by 50% within 2030.
Equinor’s transition is well underway. We have taken important steps to deliver on our 2050 net zero ambition, while continuing to
create high value. I would like to express my appreciation for our employees’ hard work and dedication and thank our shareholders
for their continued investment.
Jon Erik Reinhardsen
1
10 Equinor, Annual Report on Form 20-F 2021
Chair of the board

Equinor, Annual Report on Form 20-F 2021 11
Throughout our history, we have been a
partner for governments and society,
pioneering the field of offshore energy
production. We will build upon this legacy as
a key industrial company when we progress
on our ambition to become a net-zero
company by 2050.
Opedal
12 Equinor, Annual Report on Form 20-F 2021
Chief executive letter
Dear fellow shareholder,
We submit our annual report at a time when the situation in Europe, and the markets we operate in, have changed significantly. Our
thoughts are with all those suffering the consequences from the invasion of Ukraine. The safety and security of our people and
ensuring stable deliveries of energy to Europe under these circumstances are our top priorities. The conditions for civilians are
devastating, and Equinor has committed to contributing to the humanitarian efforts in the region. The invasion and subsequent
sanctions from the international community will affect the global economy and energy markets going forward. It is, however, too early
to foresee the total effects.
In 2021, Equinor laid the foundation for long-term value-creation and continued growth. We launched our updated strategy to
capitalise on an advantaged oil and gas portfolio, accelerate high value growth in renewables, and shape new markets within low
carbon solutions. The strategy will enable us to develop the industrial solutions needed to support societies towards a low carbon
future, and to position Equinor as a leading company in the energy transition.
Last year, the world saw increased economic activity, growing demand for energy and rising commodity prices. Regrettably, we also
had recurring waves of Covid-19 infections affecting people and societies.
My number one priority during the year was to keep everyone working for Equinor safe. It is encouraging to see a declining trend in
the serious incident frequency compared to 2020. However, we have seen a slight increase in the total injury frequency. Going
forward, we will continue working systematically to improve these results and ensure the safety of everyone working for us. In 2021,
we launched a new framework for major accident prevention, representing a key milestone in the way we work to safeguard our
people, assets, and the environment.
We have delivered forcefully on our strategy and ambitions in 2021. In the North Sea, we brought new gas with low CO
2
on stream from the Troll phase 3 project. The asset has large recoverable volumes, a breakeven price below USD 10 per barrel, and
will extend the field’s life by decades. Driven by our purpose of turning natural resources into energy for people and progress for
society, Equinor was a reliable supplier of gas to Europe during the year, increasing production to meet rising demand.
In 2021, we continued the development of Equinor as a leading company within renewables. We booked substantial capital gains of
USD 1.4 billion, demonstrating how we add value through early access, project maturation and divestments. Our largest project
under construction is now Dogger Bank, the giant wind farm. The full development will have capacity of around 3.6 gigawatt, about
5% of the total UK power demand.
Within low carbon solutions, we are contributing to decarbonisation of industries and sustainable growth. In Norway, construction
started on the onshore facilities for Northern Lights CO
2
solution as a service to industrial customers and demonstrates our ability to develop full scale systems. On the UK east coast, we
are building a net zero industrial cluster in collaboration with authorities, customers, partners, and suppliers. Together, we will deliver
hydrogen and carbon capture and storage for a low carbon future.
Our investments in renewables and low carbon solutions increased from 4% to 11% of gross capex
2
, demonstrating our commitment
to drive the energy transition. We expect a further increase to more than 30% in 2025, and above 50% in 2030. We also have a
profitable pipeline of oil and gas projects coming on stream by 2030, with low emissions, short payback time, and average
breakeven price below USD 35 per barrel.
In 2021, we demonstrated Equinor’s ability to generate value for our shareholders and for the societies where we operate. We
delivered strong financial results, with a net operating income of USD 34 billion. Return on average capital employed increased from
2% to 23% compared to the previous year, and the rebased production growth of oil and gas increased by around 3%. The adjusted
earnings were USD 33 billion before tax, and USD 10 billion after tax
2
.
We have maintained a continuous cost focus and captured higher prices through solid operating performance. I am deeply thankful
and proud of the work our people have done to achieve this.
In 2022, it is 50 years since Equinor was founded. Throughout our history, we have been a partner for governments and society,
pioneering the field of offshore energy production. We will build upon this legacy as a key industrial company when we progress on
our ambition to become a net-zero company by 2050.
Anders Opedal
President and CEO
2
Equinor, Annual Report on Form 20-F 2021 13
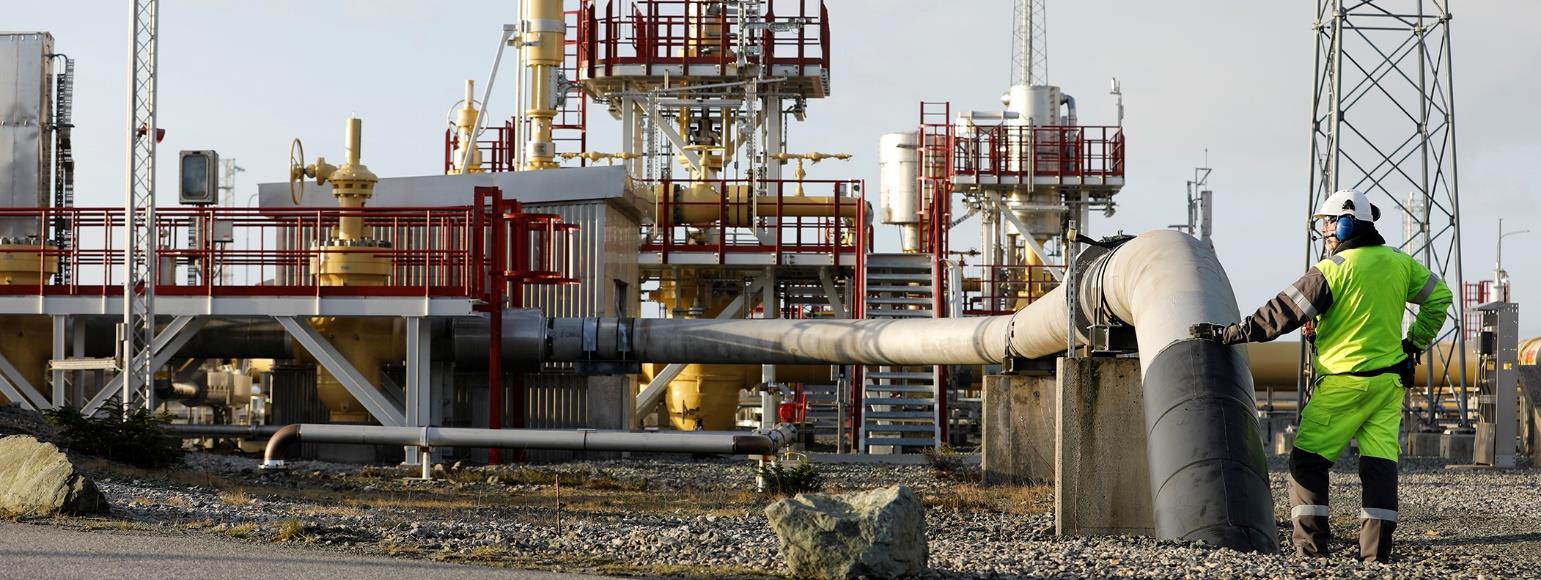
2.1
Strategy and market overview
Landfall at Kalstø of gas condensate pipeline from Sleipner – Sverre Rønnevig
Equinor’s business environment
Market overview
The global economy rebounded strongly in 2021, following the deep pandemic-driven fall in 2020. During 2021 further steps were
taken on the path from recovery to expansion, and the economic growth for the full year was 5.6% year on year according to IMF
3
.
However, the rapid demand recovery generated significant imbalances in several markets, resulting in climbing inflation across
countries. Moreover, supply shortages and transport bottlenecks triggered by the pandemic response proved far more persistent than
anticipated, and labour shortages and a confluence of other factors evoked surging energy prices.
Despite ongoing concerns about new Covid variants, comprehensive vaccination programmes in western economies allowed for
economies to open and growth to pick up. A sharp recovery, particularly in the first half of the year was led by an upswing in
aggregate demand boosted by households’ release of excess savings and pent-up demand for goods and services. Entering the
autumn, the built-up imbalances became more evident, and threats of new Covid variants were looming. In 3Q 2021 the global
expansion weakened, due to the Delta variant disruptions, rising inflation and broadening supply shortages slowing the activity level in
the industrial sector.
Amidst record high inflation, increasing labour market tightness and fiscal policy hurdles, the US economy rebounded sharply, and
2021 GDP growth was at 5.6% year on year. The Eurozone’s 2021 GDP growth was at 5.2% year on year, backed by solid increase
in demand, but the energy crisis and mobility restrictions during the autumn dampened growth. China’s growth rate for 2021 was 8.1%
year on year, but economic activity abated during the year, faced with headwinds from the real estate sector, an energy crunch and
intermediate goods shortages limiting manufacturing output and growth.
Economic development in 2021 was strong, but major uncertainties remain as the pandemic still maintains its grip. Furthermore, the
energy crisis seen during the year may reflect conflicting objectives of the energy transition. Current renewable energy generation
capacity has not yet proven to be of sufficient size to meet demand, and that potentially points to higher and more energy inflation
ahead. Given the softer pace of growth in 4Q 2021 the handoff to 2022 was weak. Broad price pressures continue to eat into
purchasing power and could spill over to wage rises in tight labour markets. Inflationary concerns have led major central banks
towards faster monetary tightening, and the pace of US monetary tightening could have widespread impact on global financial
markets and economic growth. The near-term outlook hinges on the spread of Omicron and corresponding restrictions on economic
activity, with China’s zero Covid-tolerance being a potential threat to growth with international repercussions. Despite expectations of
3
14 Equinor, Annual Report on Form 20-F 2021
gradual easing, continued upward inflationary pressures from supply chain disruptions and elevated energy prices could also dampen
growth momentum. Global growth in 2022 is expected to be 4.2% year on year, with risks skewed towards the downside.
Oil prices and refinery margins
Oil prices were on a rising trend throughout 2021, although not a smooth and steady one. Dated Brent rose from 50 USD/ barrel in
early January to 77 USD/barrel by the end of December, with a peak of 86 USD/barrel in late October. The annual average price rose
from 41.7 USD/barrel in 2020 to 70.7 USD/barrel in 2021. Global crude oil balances were generally in deficit throughout the year. The
IEA shows the deficit at -1.1 million barrels/day, or -400 million barrels throughout the year. This resulted in the large storage build-up
during 2020, gradually being reversed. By the end of the year, global stocks were at the low end of a 5-year range, and the oil market
was perceived to be tight.
A main contribution to the tightness was that Opec+ agreed in July to keep raising their output level by 0.4 million barrels/day each
month through September 2022, when output is expected to return to the same level as in October 2018. Opec+ is the co-operation
between Opec and Russia, plus nine other states. As part of the agreement, monthly meetings were held to evaluate the need for
changes to this plan based on market developments. This brought some predictability to the market, resulting in less volatility when
compared to 2020. Another contribution was that US shale oil companies were under pressure from their shareholders to use their
higher cashflow to pay debt and dividends, rather than to drill more wells and increase production.
In 1Q 2021, prices rose in January as Saudi Arabia announced an extra voluntary cut of 1 million barrels/day. This led to a scramble
for alternative supply. Much ended up being taken from the US, leading to additional stock draws. However, prices stalled at 55
USD/barrel as the joint comprehensive plan of action (JCPOA) talks regarding Iran’s nuclear program resumed, leading to increased
likelihood over an immediate end to US sanctions on Iranian oil exports and significant supply returning to market. The round of
negotiations ended without result, but Iran was seen to raise crude oil supply to China anyway without obvious impact on prices. In
February, prices continued to rise as vaccination programs started in earnest and expectations of an end to mobility restrictions. Along
with further cuts announced by Saudi Arabia in early March, this pushed the price up to 69 USD/ barrel. However, in late March, news
of potential problems with the AstraZeneca vaccine and a dip in Chinese buying led to a drop to 64 USD/ barrel.
In 2Q 2021, prices rose again, reaching 70 USD/ barrel by mid-May. Demand rose while Opec and Russian supply remained
restricted. However, market concerns persisted, with new virus outbreaks in Asia, and a new round of JCPOA talks leading again to
expectations of additional crude oil from Iran returning to market. The level at 70 USD/ barrel was largely related to investor’s
positions, but as prices did not break the 70 USD/ barrel mark, the underlying futures contracts were sold, leading to a drop to 66
USD/ barrel in late May. Also, the Colonial pipeline, the main product pipeline from Houston to New York suffered a hacker attack,
leading to stock builds on the Gulf Coast. In June, easing of mobility restrictions led to a demand rise that was higher than the
restricted supply growth from Saudi Arabia and Russia, taking prices up to 76 USD/ barrel by end of June. The tight market led the
Biden Administration to ask Opec to raise output just after the IEA released their Net Zero Emission report.
In 3Q 2021, prices fell gradually back to 66 USD/ barrel in mid-August, before rising again to 78 USD/ barrel by end-September. In
early July, the Opec+ cooperation was formalized, saying that output from the group each month would rise by 0.4 million barrel/d.
The fall in price to 66 USD/ barrel was largely due to uncertainty over demand, caused by the outbreak of the Covid-19 Delta variant.
Adding to the weakness, China started to restrict product export quotas, leading to lower crude oil intake. In late August, the hurricane
Ida hit the US Gulf coast, leading to a loss of around 30 million barrels of Gulf of Mexico production. Along with stagnant shale oil
production, this led to low stocks in the US. European stocks had fallen to 2019 levels at the end of the quarter, supporting a price rise
in September. Gas prices saw a significant increase to levels above those for oil products. This led to expectations for a shift in
demand from gas to oil in power plants and for heating.
In 4Q 2021, prices first rose to 86 USD/ barrel in late October, then tapered off, before falling to below 70 USD/ barrel in late
December, finally ending the volatile year at 77 USD/ barrel. The rise was caused by concern that several Opec countries appeared to
no longer have the production capacity that the Opec+ production quota increase was based on. This was mainly due to low field
investments and maintenance issues. Even Russia was seen close to actual capacity. That raised questions over where supply in
2022 should come from. Price reactions were still muted by expectations for a strong rise in US shale oil supply at this price level. On
November 25, news of the Omicron virus emerged. The next day, oil prices had their largest single-day drop ever, by 9 USD/ barrel.
Prices stayed low in December on fears of new lockdowns which would reduce demand. The rise at year-end was a paper market
effect. Investors who held equities and bonds feared that the high inflation in the US would lead to rising interest rates, which would
reduce values of equities and fixed-rate bonds. They therefore shifted portfolios toward commodities that would follow or drive
inflation, including oil.
Refinery margins
Refinery margins in North-West Europe stayed low in 1Q 2021 and moderate in 2Q 2021. They then rose sharply throughout 3Q
2021, while the level in 4Q 2021 was the highest for at least the past 10 years. The development largely followed the growth in
products demand, as virus restrictions were eased and vaccination programs gained speed. IEA shows global demand rising by 5.7
million barrels per day from 93.3 in 1Q 2021 to 99.0 in 4Q 2021. Refinery intake only rose by 4.5 million barrels per day. A reason for
the lower intake growth was developments in China. In June, authorities put taxes on imports of gasoline and diesel components,
Equinor, Annual Report on Form 20-F 2021 15
which had earlier let independent refineries have a margin advantage on such components. In 4Q 2021, they also reduced the crude
import and product export quotas for domestic refineries as part of efforts to reduce carbon emissions. As a result, Chinese refinery
intake did not rise from 1Q 2021 to 4Q 2021, despite the start-up of two large new refineries. US Gulf Coast capacity was also hit first
by a cold snap in February and then by Hurricane Ida in September, both leading to periods of outage.
The very high margins in 4Q 2021 mask a much higher operating cost level. Gas prices rose sharply, and many refineries are fuelled
with grid gas. Many also use gas to produce hydrogen, which is used for desulphurisation of products, and in certain upgrading units.
High gas prices also led to higher prices of electricity and for carbon emission allowances, as more of the electricity came from coal-
fired plants. Effects were then individual to each refinery, also depending on to what extent it had hedged gas prices, but in general it
appears that these extra costs were passed on to consumers. The cost level led to a preference for light, low-sulphur crudes that
require little hydrogen use. Margins peaked in October, as the emergence of the Omicron virus in late November led to concerns
about demand ahead.
Natural gas prices
Gas prices – Europe
The European gas market experienced an unprecedented price rally in 2021 only a year after a strong drop in demand and an
oversupplied market. The average gas price in 2021 rallied to 15.8 USD/mmBtu TTF, which is five times higher than the average gas
price in 2020 of 3.2 USD/mmBtu. The combination of robust demand growth as economies recovered from the Covid pandemic,
prolonged winter, dry summer, and unplanned supply outages led to tight markets. The continuation of strong Asian and South
American demand for LNG in the summer, combined with continued supply constraints for LNG and European production, meant that
Europe was unable to restock at anywhere near a normal rate, thus putting upward pressure on gas prices. The real shock for the
market came, however, in Q4 2021 when Russian pipeline supply via the Yamal-Europe route dropped sharply to less than a third of
normal levels. In the second part of December, the shipments via the Yamal-Europe switched to reverse flows from Germany to
Poland. That, together with French nuclear issues, and below than normal temperatures drew European storage stocks significantly
down below their 5-year average in mid-December and resulted in a record gas price of above 60 USD/mmBtu on 21 December 2021.
Gas prices – North America
The Henry Hub spot price averaged 3.9 USD/mmBtu for the year, nearly doubling from 2.0 USD/mmBtu in 2020. Modest production
growth, resilient demand and strong LNG exports were key factors driving the price increase. Despite higher oil and gas prices,
producers kept focus on free cash flow and balance sheet repairs rather than production growth. Drilling activity increased in 4Q21,
but overall growth remained below 2% year-over-year. On the demand side, low coal inventory forced the thermal power market to
burn more natural gas than coal-to-gas switching economics would normally incentivise. Residential, commercial, and industrial
demand remained unchanged. US LNG exports grew by 50% year-over-year, from 64 Bcm to 96 Bcm. In addition to new export
capacity on the US Gulf Coast, favorable international gas prices
,
exports to record highs
Global LNG prices
The global LNG market has seen extraordinary high prices during 2021. This was caused by a cold winter with power shortages in the
Far East as well as strong Chinese buying during the spring months, which are usually a period with seasonally low imports, as well
as a series of both planned and unforeseen outages (Australia, Indonesia, Malaysia, Norway and the US). While around 170 to 180
cargoes were cancelled in 2020 as prompt price fell below what was needed to cover marginal cost of production, none were
cancelled in 2021 for that reason. It has been a year of extreme price movements, with the lowest reported price at 5.56 USD/mmBtu
and the highest reported price at 56.33 USD/mmBtu, with an average of 18.6 USD/mmBtu. It was the year when natural gas became
a premium product compared to crude oil as gas overtook oil in price per energy content. A key market driver of price has been the
volatility in the European gas markets as the Far East and Europe compete for the same cargoes globally. As an effect, European
price shocks have filtered into the Asian LNG price.
European electric power and CO
2
Electric power prices in the major Western European markets (UK, France, Germany, Belgium, Netherlands, Spain and Italy)
averaged 112.5 EUR/MWh in 2021, more than a trebling compared to 2020. While the Covid-19 crisis dampened demand and prices
in 2020, 2021 was characterised by surging commodity and EU ETS prices, lower than expected wind output and recovering electric
power demand as Covid-19 measures eased. Power prices were relatively stable in the first half of the year, before skyrocketing after
the summer. December ended up with a staggering average price of 256 EUR/MWh, more than a quadrupling since January. Gas
prices saw a similar increase as power in the same period, while the EU ETS price more than doubled. The EU ETS reached record
highs in 2021, with the price reaching a peak of 90 EUR/t on 8 December. The surge in allowance prices was driven by several
factors, including 1) reduced number of allowances through the market stability reserve mechanism, 2) expectations of future market
tightness through the EU “Fit-for-55” package, and 3) fuel-switching to more carbon intensive coal due to high gas prices, thus
increasing emissions and the demand for allowances. The German electricity sector emissions rose for the first time since 2013
causing them to miss 2021 climate targets, even if more than 40% of the sector’s electric power generation came from renewables. In
the EU, installations of new renewable capacity were record high in 2021, adding 24 GW of solar and 17 GW of wind capacity.
16 Equinor, Annual Report on Form 20-F 2021
Equinor’s corporate strategy
Equinor is an international energy company committed to long term value creation in a low carbon future. Equinor is inspired by its
vision of being a leading company in the energy transition on a path to net zero. Therefore:
Equinor’s updated strategy is to create value as a leader in the energy transition by pursuing high-value growth in
renewables and new markets opportunities in low carbon solutions at the same time as it optimises its oil and gas
portfolio. Equinor’s strategy continues to be guided by the three strategic pillars:
Always safe, High value, Low
carbon.
Equinor is changing from a position of strength. With a highly competent organisation, our values at the core and a long history of
technology and innovation, Equinor is in a unique position to become a leading company in the energy transition. Nevertheless,
Equinor recognises that climate change has become the major challenge in the energy context which remains volatile. The world’s
energy systems are in rapid transition to meet the challenge. The journey towards net zero creates new industry opportunities, and
Equinor is ready to seize these opportunities. As Equinor transforms, it must strike the right balance between generating cashflow to
enable the transition, supporting our core business, growing in new energy areas and continuing as an attractive investment for our
shareholders. To do so, Equinor is concentrating its strategy realisation and development around the following areas:
●
Optimised oil and gas portfolio
– strengthening competitiveness and value creation with reducing emissions from operations as
top priority. New exploration acreage will be focused on areas with existing infrastructure, limiting our frontier exploration.
●
High value growth in renewables
regional synergies, project financing, strategic farm downs to be among the top global players in offshore wind and test future
business in selected onshore markets.
●
New market opportunities in low carbon solutions
and storage at Sleipner and Snøhvit to develop low carbon solutions and value chains aiming for a leadership position in the
European CCS market with a market share above 25%.
While concentrating on the areas above to develop and realise its strategy, Equinor’s strategic pillars remain firm and continue to
guide our business.
Always safe
employees and those of our suppliers. Everyone working for Equinor should return safely from work and Equinor will step up its safety
performance through a One Equinor culture, more proactive safety leadership and forceful implementation of the “I am Safety”
Roadmap.
High value
gas cashflow will enable the transformation and ensure value creation for Equinor’s shareholders and society. NCS assets are
expected to generate substantial cashflow during the coming decade. The portfolio is resilient to low prices, has fast return on
investments and world-class breakevens. We are growing cashflow from our international portfolio, making it more robust towards
lower prices. Projects in Brazil and the Gulf of Mexico, coming onstream from the mid-2020s, will contribute significantly. Through our
positions in the offshore wind market and European low carbon solutions, we will build a pipeline of future projects. We will utilise our
trading and midstream capabilities to optimise the portfolio of commodities that we provide to our customers, together with new
products and services from low carbon solutions.
Low carbon
portfolio, to establish a pathway to net zero. Equinor aims to reduce its group-wide emissions by 50% by 2030, reinforcing its
commitment to reduce net carbon intensity for the energy provided by 20% by 2030 and 40% by 2035. Those ambitions are backed
by actions such as: Reducing emissions from our oil and gas operations, increasing renewables capacity, establishing value chains in
CCS and hydrogen, increasing the share of non-combusted products from hydrocarbons, and using high-quality carbon sinks. In the
longer term, a decline in oil and gas production will also drive reductions in net carbon intensity towards net zero in 2050.
With its clear ambition to become a net zero energy company by 2050, Equinor maintains its advantage as a leading company in
carbon-efficient oil and gas production while building a low carbon business to capture new opportunities in the energy transition.
Equinor believes a lower carbon footprint will make it more competitive in the future and sustainability is integrated in Equinor’s
strategic work. Our four sustainability priorities are closely linked with our strategic pillars and focus areas. Further information can be
found in section 2.14 Safety, security and sustainability and in the 2021 Sustainability report.
To deliver on the strategy, Equinor has four key strategic enablers that strengthen the company’s competitiveness:
●
Safety, security, and sustainability (SSU)
is focused on taking care of people, the environment and assets while enabling
Equinor’s accelerated transition. Stakeholder expectations on safety, security and sustainability are ever increasing and Equinor
aims to meet them. We are improving our capabilities to respond to and truly understand the business risks and opportunities
Equinor, Annual Report on Form 20-F 2021 17
connected to climate, human rights and social responsibilities, and the environment. We are strengthening our management of
evolving security threats and interconnected cyber, physical and insider risks. We always strive to learn from previous incidents
to further improve the safety work in Equinor. Higher risk awareness, better exchange of learning from incidents and faster
implementation of findings will be areas to strengthen as we continue to improve the development of our safety performance in
the coming years. The extensive use of competence centres will enable us to efficiently prioritise and mobilise behind the most
important tasks for Equinor, whilst developing skills and capabilities for the future within the SSU community.
●
High quality execution of activities
in close collaboration with suppliers to maximise value creation. Our portfolio represents a
large opportunity set within Oil & Gas, Renewables and Low Carbon Solutions, and our execution excellence creates synergies
across the different disciplines. Our offshore pioneering position has been demonstrated by world class project and drilling
executions, highlighted by both the benchmark agency Rushmore and Independent Project Analysis (IPA). In addition, Equinor is
delivering a large improvement agenda to ensure that our execution capabilities continue to be in the top of international
benchmarks. It includes new technology, digital advances and new ways of working both internally and with our suppliers.
●
Technology and innovation powerhouse
to unlock new opportunities and enhance value creation. We have transformed many
times over the past five decades and technology and innovation advances have always been a part of our DNA. Shaping the next
generation solutions together with the external ecosystem is our vision, and we strongly believe in continuing to strengthen our
competitive advantage outside the current position. An increased focus on potential pace and scale across the company have
been established, to make sure that we prioritise our focus on the energy transition opportunities where it would matter the most.
●
Our people
are our most valuable asset, and it is their collective competence that enables us to deliver on our strategy. To
deliver on the energy transition we are adapting, expanding and replenishing our competence and capacity to meet new business
challenges. We are building on strong core competencies and we are investing in learning to support our employees in
accelerating the development of their skillsets. This also means attracting and retaining key talent in a highly competitive market
and we are further strengthening our talent attraction and retention efforts, creating engagement and pride around our purpose
and strategy. Our focus on flexibility, collaboration and inclusiveness will continue, along with the evolution of our operating
model and ways of working to further strengthen our competitiveness.
With the updated strategy focusing on leadership and value creation in the energy transition and supported by its existing pillars and
updated enablers, the Business Areas (BAs) are well on the way with their response to realise and execute on Equinor’s new strategy.
Transforming the Norwegian continental shelf (NCS) to deliver value for decades
For 50 years, Equinor has explored, developed and produced oil and gas from the NCS. It represents approximately 65% of Equinor’s
equity production at more than 1.35 mmboe per day in 2021. The cashflow from NCS in 2021 reached a record high of more than
USD 20 billion. We expect that NCS cash flow and value generation capacity will continue to be substantial going forward.
Equinor is continuing to add highly profitable barrels through exploration and increased oil and gas recovery. In 2021 Equinor made
eight commercial discoveries in areas close to existing infrastructure. The production outlook for the next decade has been further
strengthened with an expected production growth towards 2026 and a 2030 forecast at current production level.
In 2021 several important projects were approved, and new projects came on stream. The partners in the Åsgard licence decided to
invest approximately NOK 1.4 billion to further develop the field and implement the Åsgard B low-pressure project. The plan for
developing the Breidablikk field was approved. Both Martin Linge and Troll phase 3 came on stream. With a breakeven price of less
than USD 10 per barrel oil equivalents, Troll phase 3 is one of the most profitable projects in Equinor's history. The gas is also
produced with record-low CO
2
emissions, less than 0.1 kilo per barrel oil equivalent.
Equinor is continuing to improve the efficiency, reliability, carbon emissions and lifespan of fields already in production
- with all time
high Production Efficiency for EPN assets and all-time low maintenance backlog.
The unit for late life assets (FLX) has continued to
develop new ways of working to realize the full potential of our late life fields. The results from FLX so far are promising with realized
improvements on safety indicators, operational performance, and financial results
.
Our efforts to reduce CO
2
current and near-term emissions. The CO
2
approved by the authorities during 2021 while the PDO for Oseberg gas capacity upgrade and partial electrification was submitted to
the authorities in November 2021.
In 3Q 2021 Equinor launched Norway energy hub, an industrial plan for the energy nation Norway, pointing at steps to be taken during
the next decade. The plan is both an invitation to collaborate and a specification of what it takes to create new sustainable energy
value chains for a net-zero future. The purpose is to contribute to the transition Norway will go through during the next decades. The
plan outlines how Norway can maintain its position as an energy nation through investment in new renewable and low carbon
industries. It shows what is needed to decarbonise oil and gas production, industrialise offshore wind, commercialise transport and
storage of CO
2
investments. It is not a plan for Equinor alone, rather an invitation to facilitate cooperation between Norwegian companies, the State
and other organisations. This broad collaboration is necessary to ensure that Norway meets its climate goals, further develops
expertise, creates new industrial jobs, provides stable access to more renewable energy and maintains the position as a reliable
provider of clean energy.
18 Equinor, Annual Report on Form 20-F 2021
Transforming the value of international oil and gas
Equinor has built its international oil and gas portfolio over the past 30 years, representing approximately 35% of Equinor’s equity
production at 0.7 million boe per day in 2021.
In 2021, Equinor made significant progress to focus and optimise its oil and gas portfolio with country exits from: Australia, Ireland
(Corrib divestment to be completed in 2022), Kazakhstan, Mexico, Nicaragua, and South Africa. Further, the following assets were
divested within established country positions: Bakken and Austin Chalk (US onshore), Terra Nova (Canada) and Bajo del Toro Este /
Aguila Mora Noreste (Argentina onshore).
Equinor continues to optimise its strong set of development projects, and in 2021, made the final investment decision for Phase 1 of
its operated Bacalhau field, off the Brazilian coast. Two satellites to block 17 in Angola came onstream. Aligned with its focused
exploration strategy, Equinor is appraising the operated Monument discovery in the US Gulf of Mexico.
On the climate front, Equinor is assessing the potential for low carbon value chains around key international upstream assets. In the
US northeast, Equinor is collaborating with partners and major industrial players to assess blue hydrogen and CCS around its onshore
natural gas position.
Renewables - Developing a high value business
The renewable industry is changing and growing at an unprecedented pace, presenting opportunities for decades of growth. Equinor
has a strong renewable development portfolio, and we are leveraging our core competencies in managing complex oil and
gas projects when growing in offshore wind. By 2026 Equinor expects to significantly increase installed capacity from renewable
projects under development, mainly based on the current project portfolio. Towards 2030, Equinor expects to increase installed
renewables capacity further to between 12 and 16 GW
4
, depending on availability of attractive project opportunities.
Becoming a global offshore wind major
Equinor has the last year continued to develop and optimise its offshore wind portfolio. The two first Dogger Bank projects are under
construction and the last phase of the development, Dogger Bank C (1.2 GW), has been brough to investment decision in 2021.
Equinor also adjusted the equity share by farming down a 10% stake to ENI in 4Q the same year to realise value. Dogger Bank will
be the world’s largest offshore wind farm development with an installed capacity of 3.6 GW - enough to supply 5% of UK electricity
demand.
In the beginning of the year Equinor and bp completed their previously announced transaction in the US, whereby Equinor has sold a
50% interest in both the Empire Wind and Beacon Wind assets on the US east coast. The transaction was the first step in the
strategic partnership in offshore wind where Equinor and bp are combining strengths to enable profitable growth in offshore wind in
the US. Equinor will remain the operator of the projects in these leases through the development, construction and operations phases,
and the wind farms will be equally staffed in operations.
In South Korea, Equinor continues to develop its position by developing an offshore wind portfolio and building local partnerships. In
4Q 2021 Equinor signed a memorandum of understanding with Korea East-West Power (EWP), one of South Korea’s state-owned
power generation companies, to cooperate on 3 gigawatts of offshore wind projects in the country. The partnership with EWP provides
a strong basis for Equinor to develop a leading role in developing a pipeline of offshore wind projects needed in South Korea’s
ongoing energy transition. Equinor has also strengthened its position in the future Norwegian offshore wind market by entering into a
collaboration agreement with Vårgrønn, a Norwegian renewable energy company established by HitecVision and Eni. The
collaboration aims to jointly prepare and submit an application to the Norwegian authorities to develop floating offshore wind at Utsira
North in the Norwegian North Sea.
Another collaboration agreement between Equinor, RWE Renewables and Hydro REIN was also signed early in 2021 for offshore
wind in Norway. The three partners agreed to jointly prepare and submit an application to the Norwegian authorities to develop a
large-scale bottom-fixed offshore wind farm in the Southern North Sea 2 area in the Norwegian North Sea. The partnership represents
a strong combination of experience and expertise from offshore wind development, energy market insight and large-scale industrial
project execution.
In the floating part of the offshore wind industry, Equinor continued the construction of Hywind Tampen, which will be the first floating
windfarm connected to an oil and gas installation. Equinor believes floating wind has a large potential as up to 80% of the world’s
offshore wind potential will likely require floating solutions and continues to develop the portfolio as well as its efforts to reduce cost
and risks to improve the attractiveness of this technology globally. Our ambition is to bring floating wind towards commerciality by
2030.
Maturing opportunities in onshore renewables
4
Equinor, Annual Report on Form 20-F 2021 19
Equinor believes in diversifying its renewable business and pursuing additional growth options in new markets and geographies.
Having a flexible portfolio gives us the ability to provide power from numerous renewable energy sources including offshore wind,
energy storage, solar and onshore wind. Over time we expect to build a profitable onshore growth platform in selected power markets.
Last year Equinor expanded is activities by the acquisition of 100% of the shares in Polish onshore renewables developer Wento from
the private equity firm Enterprise Investors. The transaction strengthened and diversified our portfolio in Poland. It gives Equinor an
onshore growth platform in a transition market set for significant renewables growth.
Equinor sees a solid opportunity to create profitable businesses by deploying batteries and storage assets to satisfy the growing need
to stabilize power markets, either as a part of offshore or onshore renewable assets or as separate units suppling services to the grid.
In addition, Equinor is exploring opportunities and cooperation within the green hydrogen sector to build new and supporting value
chain. Hydrogen is expected to become an integrated part of the future energy system and Equinor is taking positions adding clean
hydrogen as an enabler for transport and storage of clean energy produced by renewables.
Midstream, marketing and processing (MMP) – Secure premium market access, grow value creation through cycles and
build a low carbon business
MMP works to maximise the value creation in Equinor’s global mid- and downstream positions. The business area is responsible for
global marketing and trading of crude and petroleum products, natural gas, electric power and green certificates. This also includes
marketing of the Norwegian state’s natural gas and crude on the Norwegian continental shelf. MMP is also responsible for onshore
plants, transportation and for the development of value chains to ensure flow assurance for Equinor’s upstream production and to
maximise value creation.
As part of the Equinor group, Danske Commodities, one of Europe’s largest electricity traders, supports Equinor’s strategy to build a
profitable renewables business. In addition, MMP is responsible for developing low carbon value chains for Equinor, with key focus on
transforming natural gas to clean hydrogen and developing carbon capture, usage and storage (CCUS) projects.
In 2021, MMP has made significant progress on developing low carbon solutions for a net zero future:
●
The Northern Lights (Equinor 33.33%, operator) which is part of the Norwegian full-scale CCS Longship project is under
development and expected to be operational in 2024. This is a milestone for commercial CCS in Europe.
●
concentrating its refining position around Mongstad, Norway, where the company can leverage its integrated industrial cluster,
expand the portfolio of low carbon energy products provided and contribute to Equinor’s efforts in the energy transition.
●
The East Coast Cluster (ECC), formed by Equinor and partners, has been selected by the British government as one of the first
two carbon capture, usage, and storage (CCUS) clusters with deployment by the mid-2020s in the UK.
●
Northern Endurance Partnership is the offshore CO
2
together with four other energy companies and holds the CO
2
●
Equinor’s H2H Saltend project is a part of the ECC and will produce blue hydrogen at industrial scale. Phase 2 of the cluster
sequencing process, where emitter projects will submit their bid to connect to the ECC infrastructure is now ongoing. Equinor is
submitting bids for Hydrogen to Humber Saltend in addition to three clean power projects in the phase 2 process.
●
Applications for new CO
2
●
Barents Blue Ammonia, where Equinor is partner with Horisont Energi and Vår Energi, was awarded funding from Enova to
establish a blue ammonia production plant in Finnmark.
●
Progressed a plan to partially electrify the Norwegian Kårstø gas processing plant, reducing emissions by 0.5 MT CO
2
.

20 Equinor, Annual Report on Form 20-F 2021
Modules for the Johan Castberg FPSO leaving Aker Solutions in Egersund in September 2021, headed for Stord.
Group outlook
●
Organic capital expenditures
5
average of around USD 12 billion for 2024-2025
6
.
●
Production
7
●
unit of production cost
●
Scheduled maintenance activity
These forward-looking statements reflect current views about future events and are, by their nature, subject to significant risks and
uncertainties because they relate to events and depend on circumstances that will occur in the future. Deferral of production to create
future value, gas off-take, timing of new capacity coming on stream, operational regularity, the ongoing impact of Covid-19, Russia’s
invasion of Ukraine and our subsequent decision to stop new investments into Russia and to start the process of exiting our Russian
joint ventures represent the most significant risks related to the foregoing production guidance. Our future financial performance,
including cash flow and liquidity, will be affected by the extent and duration of the current market conditions, the development in
realised prices, including price differentials and other factors discussed elsewhere in the. For further information, see section 5.8
Forward-looking statements.
5
6
7
(SEC) guidelines and additional production from other reserves not included in proved reserves estimates. The growth percentage is based on
historical production numbers, adjusted for portfolio measures.
Equinor, Annual Report on Form 20-F 2021 21
2.2
Business overview
History in brief
18 September 1972
Equinor, formerly Statoil, was formed by a decision of the Norwegian parliament and incorporated as a limited liability company under
the name Den norske stats oljeselskap AS. At the time owned 100% by the Norwegian State, Equinor's initial role was to be the
government's commercial instrument in the development of the oil and gas industry in Norway. Growing in parallel with the Norwegian
oil and gas industry, Equinor’s operations were primarily focused on exploration, development and production of oil and gas on the
Norwegian continental shelf (NCS).
1979 – 1981
The
Statfjord
field was discovered in the North Sea and commenced production. In 1981 Equinor was the first Norwegian company to
be given operatorship for a field, at
Gullfaks
1980s and 1990s
Equinor grew substantially through the development of the NCS (Statfjord, Gullfaks,
and others). In the 1990s,
Equinor started to grow internationally. Equinor also became a major player in the European gas market by entering into large sales
contracts for the development and operation of gas transport systems and terminals. During these decades, Equinor was also
involved in manufacturing and marketing in Scandinavia and established a comprehensive network of service stations. This line of
business was fully divested in 2012.
2001
Equinor was listed on the Oslo and New York stock exchanges and became a public limited company under the name Statoil ASA,
now Equinor ASA, with a 67% majority stake owned by the Norwegian State.
2007 - 2018
Equinor’s ability to fully realise the potential of the NCS and grow internationally was strengthened through the merger with Norsk
Hydro's oil and gas division on 1 October 2007. Equinor’s business grew as a result of substantial investments on the NCS and
internationally. Equinor delivered the world’s longest multiphase pipelines on the
Ormen Lange
Snøhvit
Ormen Lange development project was completed in 2007.
By 2007, Equinor had expanded into Algeria, Angola, Azerbaijan, Brazil, Nigeria, UK, and the US Gulf of Mexico, amongst others.
2018 and 2019
Statoil ASA changed its name to Equinor ASA, following approval of the name change by the company’s annual general meeting on
15 May 2018. The name supports the company’s strategy and development as a broad energy company in addition to reflecting
Equinor’s evolution and identity as a company for the generations to come.
The record-breaking
Johan Sverdrup
the most carbon-efficient fields worldwide.
2020-2021
Equinor sets an ambition be a leading company in the energy transition and to become
a net-zero company by 2050,
emissions from production to final energy consumption.
Equinor announced changes to the reporting segments, corporate structure and the corporate executive committee (CEC) to further
strengthen its ability to deliver on Equinor’s always safe, high value, low-carbon strategy. The changes will support improved value
creation from Equinor’s world-class oil and gas portfolio, accelerated profitable growth within renewables and the development of low-
carbon solutions.
In January 2021, civil works began at the
Northern Lights
investment decision was made for the first phase of the development of the
Bacalhau
Martin Linge
stream in June 2021, driven by electric power from shore. The third phase of the
Troll
2021, producing from the Troll West gas cap. The electrification of
Troll West
is underway. In November 2021, the decision was
made to develop the third phase of the
Dogger Bank
scaled up gas
production
22 Equinor, Annual Report on Form 20-F 2021
Current activities
Equinor’s access to crude oil in the form of equity, governmental and third-party volumes makes Equinor a large seller of crude oil,
and Equinor is the second largest supplier of natural gas to the European market. Processing, refining, offshore wind and carbon
capture and storage are also part of our operations.
In recent years, Equinor has utilised its expertise to design and manage operations in various environments to grow upstream
activities outside the traditional area of offshore production.
Equinor operates in around 30 countries and as per 31 December 2021 employs 21,126 people worldwide. Equinor’s head office is
located at Forusbeen 50, 4035 Stavanger, Norway. The telephone number of its registered office is +47 51 99 00 00.
Equinor, Annual Report on Form 20-F 2021 23
The following tables display major projects operated by Equinor, as well as projects operated by Equinor’s licence partners.
More information about ongoing projects is provided in the E&P Norway, E&P International, E&P USA, MMP and REN sections.
In our portfolio, an additional 30-35 projects are in the early phase, maturing towards sanction.
Project startups and completions 2021
Name of project
Equinor's
interest
Operator
Area
Type
Vigdis boosting station
41.50%
Equinor Energy AS
North Sea
Oil
Zinia phase 2, block 17 satellite
22.15%
Total E&P Angola Block 17
Congo basin, Angola
Oil
Martin Linge
70.00%
Equinor Energy AS
North Sea
Oil and gas
Guañizuil 2A solar power project
1)
50.00%
Scatec Solar Argentina B.V.
San Juan, Argentina
Solar
Troll phase 3, tie-in to Troll A
30.58%
Equinor Energy AS
North Sea
Gas and oil
Ærfugl 2
36.17%
Aker BP ASA
Norwegian Sea
Gas and condensate
CLOV phase 2, block 17 satellite
22.15%
Total E&P Angola Block 17
Congo basin, Angola
Oil
Ongoing projects with expected startups and completions 2022-2026
2)
Name of project
Equinor's
interest
Operator
Area
Type
Gudrun phase 2
36.00%
Equinor Energy AS
North Sea
Oil and gas
Peregrino phase 2
60.00%
Equinor Brasil Energia Ltd
Campos basin, Brazil
Oil
Askeladd, tie-in to Snøhvit
36.79%
Equinor Energy AS
Barents Sea
Gas and condensate
Njord future
27.50%
Equinor Energy AS
Norwegian Sea
Oil
Bauge, tie-in to Njord A
42.50%
Equinor Energy AS
Norwegian Sea
Oil and gas
Hywind Tampen, Snorre field
33.28%
Equinor Energy AS
North Sea
Floating offshore wind
Hywind Tampen, Gullfaks field
51.00%
Equinor Energy AS
North Sea
Floating offshore wind
Johan Sverdrup phase 2
42.63%
Equinor Energy AS
North Sea
Oil and associated gas
Dalia phase 3, block 17 satellite
22.15%
TotalEnergies E&P Angola S.A.
Congo basin, Angola
Oil
Vito
36.89%
Shell Offshore Inc
US Gulf of Mexico
Oil
Åsgard B low pressure
34.57%
Equinor Energy AS
Norwegian Sea
Oil and gas
North Komsomolskoye
3)
33.33%
SevKomNeftegaz LLC
West Siberia
Oil and gas
Ekofisk removal campaign 3
7.60%
ConocoPhillips Skandinavia AS
North Sea
Field decommissioning
Azeri Central East
7.27%
BP Exploration (Caspian Sea) Ltd
Caspian Sea
Oil
Breidablikk
39.00%
Equinor Energy AS
North Sea
Oil
Kristin South
54.82%
Equinor Energy AS
Norwegian Sea
Oil and gas
Northern Lights
33.33%
Northern Lights JV DA
North Sea
Carbon storage
Johan Castberg
50.00%
Equinor Energy AS
Barents Sea
Oil
Bacalhau phase 1
40.00%
Equinor Energy AS
Santos basin, Brazil
Oil and gas
Dogger Bank A, B and C
4)
40.00%
SSE Renewables
North Sea, UK
Offshore wind
Troll West electrification
30.58%
Equinor Energy AS
North Sea
Power from shore
Askeladd West, Snøhvit satellite
36.79%
Equinor Energy AS
Barents Sea
Gas and condensate
1) Technical service provider is Scatec Equinor Solutions Argentina SA.
2) Covid-19 creates considerable uncertainty, and we are unable to predict the course of the pandemic or the impact.
3) In February 2022, Equinor announced its intention to exit its business activities in Russia. See note 27 Subsequent events to the
consolidated financial statements.
4) Equinor assumes operatorship when wind farms come on stream. Percentage is after Dogger Bank C divestment, closed in February
2022.

24 Equinor, Annual Report on Form 20-F 2021
Research and development
Technology and innovation are identified as enablers to deliver on Equinor’s strategy. Equinor continually researches, develops and
implements innovative technologies to create opportunities and enhance the value of its current and future assets. A new technology
strategy is being set out, to enable Equinor to stay at the forefront of the energy transition and create long-lasting value.
Equinor’s technology strategy sets the direction for technology development and implementation to meet Equinor’s ambitions. Equinor
prioritises and accelerates high-value technologies for broad implementation in existing and new value chains to:
●
Optimise production from existing and near field resources
●
Develop low carbon solutions for oil and gas
●
Develop renewable energy opportunities
Equinor utilises a range of tools for the development of new technologies:
●
In-house research and development
●
Cooperation with academia, research institutes and suppliers
●
Project-related development as part of field development activities
●
Direct investment in technology start-up companies through Equinor Ventures’ investment activities
●
Invitation to open innovation challenges as part of Equinor Innovate
For additional information, see note 8 Other expenses to the Consolidated financial statements.
Slipforming at Dommersnes in July 2021, of substructures for Hywind Tampen floating offshore wind farm.
Equinor, Annual Report on Form 20-F 2021 25
Equinor’s competitive position
Equinor is an energy company with a portfolio dominated by oil and gas, but with an increasing share of renewable energy sources
like offshore wind. Key factors affecting competition in all these segments are internal factors like costs, operational excellence,
project execution, and technology development, and external factors like environmental and governmental regulations and access to
acreage and leases.
When acquiring assets and licences for development of energy either from oil and gas, or from renewable energy sources, Equinor
competes with other integrated oil and gas companies as well as other energy companies. Equinor also competes with these
companies when marketing and trading crude oil, natural gas and related products, and power from renewable energy sources.
Equinor continues to optimise the oil and gas portfolio and explore new business opportunities in offshore wind, solar, hydrogen and
carbon capture, usage, and storage (CCUS). Improvements in cost and technology for renewables have rapidly changed the
landscape in the recent years. Ambitious goals have been set for a low carbon energy business supporting Equinor’s strategy; always
safe, high value, low carbon and the commitment to contribute to a sustainable energy future and a net zero emission society.
Equinor's ability to remain competitive will depend, among other things, on continuous focus on reducing costs and improving
efficiency, but also the ability to seize opportunities in new business areas, apply new and digital technologies, and reduce CO
2
emissions from operations.
The information about Equinor's competitive position in the strategic report is based on several sources such as investment analyst
reports, independent market studies, and internal assessments of market share based on publicly available information about the
financial results and performance of market players.

26 Equinor, Annual Report on Form 20-F 2021
Equinor’s value chain
Corporate structure
Equinor is a broad international energy company and its value chain includes most phases from exploration of hydrocarbons through
development, production and manufacturing, marketing and trading, and a growing renewables business.
Effective 1 June 2021, Equinor made changes to the corporate structure and the corporate executive committee (CEC) to further
strengthen its ability to deliver on Equinor’s always safe, high value, low carbon strategy. The changes are intended to support
improved value creation from Equinor’s world-class oil and gas portfolio, accelerated profitable growth within renewables and the
development of low carbon solutions. The new corporate structure consists of seven business areas and five corporate centre units.
Equinor’s operations are managed through the following business areas: Exploration & Production Norway (EPN), Exploration &
Production International (EPI), Exploration & Production USA (EPUSA), Marketing, Midstream & Processing (MMP), Renewables
(REN), Projects, Drilling & Procurement (PDP) and Technology, Digital & Innovation (TDI).
Exploration & Production Norway (EPN)
Managing Equinor’s upstream activities on the NCS, EPN explores for and extracts crude oil, natural gas and natural gas liquids in the
North Sea, the Norwegian Sea and the Barents Sea. EPN aims to ensure safe and efficient operations and transform the NCS to
deliver sustainable value for many decades. EPN is shaping the future of the NCS with a digital transformation and solutions to
achieve a lower carbon footprint and high recovery rates.
Before 1 June 2021, EPN was referred to as Development & Production Norway (DPN).
Exploration & Production International (EPI)
EPI manages Equinor’s worldwide upstream activities in all countries outside Norway and the USA. EPI operates across six
continents covering offshore and onshore exploration and extraction of crude oil, natural gas and natural gas liquids; and
implementing rigorous safety standards, technological innovations and environmental awareness. EPI's intent is to build and grow a
competitive international portfolio - always safe, high value and low carbon.
Equinor, Annual Report on Form 20-F 2021 27
Before 1 June 2021, EPI was referred to as Development & Production International (DPI). Additionally, from 1 June 2021, the former
Development and production Brazil (DPB) is included in EPI and is no longer a separate business area.
Exploration & Production USA (EPUSA)
EPUSA manages Equinor’s upstream activities in the US and US Gulf of Mexico, both onshore and offshore exploration, development
and production of oil and gas. Equinor has been present in the US since 1987. EPUSA’s ambition is to develop a competitive portfolio
in the US. EPUSA produced around 18% of Equinor’s total equity production of oil and gas in 2021.
Before 1 June 2021, EPUSA was referred to as Development & Production USA (DPUSA).
Marketing, Midstream & Processing (MMP)
MMP works to maximise value creation in Equinor’s global midstream and downstream positions. MMP is responsible for global
marketing and trading of crude, petroleum products, natural gas and electric power, including marketing of the Norwegian State’s
natural gas and crude on the NCS. MMP is responsible for onshore plants and transportation in addition to the development of value
chains to ensure flow assurance for Equinor’s upstream production and to maximise value creation. Low-carbon solutions such as
carbon capture and storage and other low-carbon energy solutions, are also a part of MMP’s responsibility.
Renewables (REN)
REN reflects Equinor’s long-term goal to complement Equinor’s oil and gas portfolio with profitable renewable energy. REN is
responsible for wind farms, solar as well as other forms of renewable energy and energy storage. REN aims to do this by combining
Equinor’s oil and gas competence, project delivery capacities and ability to integrate technological solutions.
Before 1 June 2021, REN was referred to as New Energy Solutions (NES).
Projects, Drilling & Procurement (PDP)
PDP is responsible for field development, well deliveries and procurement in Equinor and aims to deliver safe, secure and efficient
field development, including well construction, founded on world-class project execution and technology excellence. PDP utilises
innovative technologies, digital solutions and carbon-efficient concepts to shape a competitive project portfolio at the forefront of the
energy industry transformation. Sustainable value is being created together with suppliers through a simplified and standardised fit-
for-purpose approach.
From 1 June 2021, PDP is a separate business area, while Research & Technology is part of the new business area Technology,
Digital & Innovation (TDI).
From 1 June 2021, Exploration is part of EPN, EPI and EPUSA, based on the location of the exploration activities, and is no longer a
separate business area.
From 1 June 2021, Global Strategy and Business development (GSB) no longer is a separate business area, and its tasks are
covered by other corporate units.
Presentation
In the following sections in the report, the operations are reported according to the reporting segment. Underlying activities or
business clusters are presented according to how the reporting segment organises its operations. See note 4 Segments to the
Consolidated financial statements for further details.
As required by the SEC, Equinor prepares its disclosures about oil and gas reserves and certain other supplementary oil and gas
disclosures based on geographic areas. Equinor’s geographical areas are defined by country and continent and consist of Norway,
Eurasia excluding Norway, Africa, USA and Americas excluding USA. For more information, see section 4.2 Supplementary oil and
gas information (unaudited) in the Financial statements and supplements chapter.
Segment reporting
The reporting segments Exploration & Production Norway (E&P Norway), Exploration & Production International (E&P International),
Exploration & Production USA (E&P USA), Marketing, Midstream & Processing (MMP) and Renewables (REN) consist of the
business areas EPN, EPI, EPUSA, MMP and REN respectively. The operating segments, PDP, TDI and corporate staffs and
functions are aggregated into the reporting segment “Other” due to the immateriality of these operating segments. Most of the costs
within the operating segments PDP and TDI are allocated to the E&P Norway, E&P International, E&P USA, MMP and REN reporting
segments.
Equinor’s upstream activities in the USA are a separate reporting segment since the second quarter of 2020. As from the first quarter
of 2021, Equinor changed its reporting as REN became a separate reporting segment. Previously the activities in REN were reported
28 Equinor, Annual Report on Form 20-F 2021
in the segment “Other”. The new reporting structure has been applied retrospectively with comparable figures reclassified. The change
has its basis in the increased strategic importance of the renewable business for Equinor and that the information is regarded useful
for the readers of the financial statements.
Internal transactions in oil and gas volumes occur between reporting segments before such volumes are sold in the market. Equinor
has established a market-based transfer pricing methodology for the oil and natural gas intercompany sales and purchases that meets
the requirements of applicable laws and regulations. For further information, see section 2.10 Operational performance under
Production volumes and prices.
Equinor eliminates intercompany sales when combining the results of reporting segments. Intercompany sales include transactions
recorded in connection with oil and natural gas production in the E&P reporting segments, and in connection with the sale,
transportation or refining of oil and natural gas production in the MMP reporting segment. Certain types of transportation costs are
reported in both the MMP, E&P USA and the E&P International segments.
The E&P Norway segment produces oil and natural gas which is sold internally to the MMP segment. A large share of the oil produced
by the E&P USA and E&P International segments is also sold through the MMP segment. The remaining oil and gas from the E&P
International and E&P USA segments are sold directly in the market. In 2021, the average transfer price for natural gas for E&P
Norway was 14.43 USD/mmbtu. The average transfer price was 2.26 USD/mmbtu in 2020. For the oil sold from the E&P Norway
reporting segment to the MMP reporting segment, the transfer price is the applicable market-reflective price minus a cost recovery
rate.
Equinor, Annual Report on Form 20-F 2021 29
The following table shows certain financial information for the five reporting segments, including intercompany eliminations for the two-
year period ended 31 December 2021.
For additional information, see note 4 Segments to the Consolidated financial statements.
Segment performance
December
(in USD million)
2021
2020
Exploration & Production Norway
Total revenues and other income
39,241
11,895
Net operating income/(loss)
30,471
3,097
Non-current segment assets
1)
35,301
37,733
Exploration & Production International
Total revenues and other income
5,558
3,489
Net operating income/(loss)
326
(3,565)
Non-current segment assets
1)
15,358
17,835
Exploration & Production USA
Total revenues and other income
4,149
2,615
Net operating income/(loss)
1,150
(3,512)
Non-current segment assets
1)
11,406
12,586
Marketing, Midstream & Processing
Total revenues and other income
87,368
44,945
Net operating income/(loss)
1,141
359
Non-current segment assets
1)
3,019
4,368
Renewables
2)
Total revenues and other income
1,411
181
Net operating income/(loss)
1,245
(35)
Non-current segment assets
1)
(45)
(0)
Other
2)
Total revenues and other income
497
241
Net operating income/(loss)
(210)
(63)
Non-current segment assets
1)
3,288
4,132
Eliminations
3)
Total revenues and other income
(47,300)
(17,547)
Net operating income/(loss)
(461)
296
Non-current segment assets
1)
-
-
Equinor group
Total revenues and other income
90,924
45,818
Net operating income/(loss)
33,663
(3,423)
Non-current assets
1)
68,527
76,657
1)
Equity accounted investments, deferred tax assets, pension assets and non-current financial assets are not allocated to segments. Right
of use assets according to IFRS16 are included in Other segment.
2)
REN is a separate reporting segment from 1 January 2021. Previously, the activities in REN were reported in the segment 'Other'. The
new reporting structure has been applied retrospectively with comparable figures reclassified.
3)
Includes elimination of inter-segment sales and related unrealised profits, mainly from the sale of crude oil and products.
Inter-segment revenues are based upon estimated market prices.
30 Equinor, Annual Report on Form 20-F 2021
The following tables show total revenues and other income by country.
2021 Total revenues and other income by country
Crude oil
Natural gas
Natural gas
liquids
Refined
products
Other
Total
(in USD million)
Norway
30,731
25,419
7,250
7,075
1,652
72,127
US
7,370
1,786
1,240
1,133
1,191
12,719
Denmark
0
259
0
3,264
852
4,376
Brazil
0
15
0
0
9
25
Other
206
572
0
0
641
1,419
Total revenues and other income
1)
38,307
28,050
8,490
11,473
4,345
90,665
1) Excluding net income (loss) from equity accounted investments.
2020 Total revenues and other income by country
Crude oil
Natural gas
Natural gas
liquids
Refined
products
Other
Total
(in USD million)
Norway
20,684
5,871
4,341
4,293
1,465
36,555
US
3,636
1,013
728
613
474
6,564
Denmark
0
66
0
1,628
382
2,076
Brazil
76
11
0
0
7
95
Other
112
251
0
0
112
475
Total revenues and other income
1)
24,509
7,213
5,069
6,534
2,441
45,765
Equinor, Annual Report on Form 20-F 2021 31
Key figures
(in USD million, unless stated otherwise)
2021
2020
2019
2018
2017
Financial information
Total revenues and other income
90,924
45,818
64,357
79,593
61,187
Total operating expenses
(57,261)
(49,241)
(55,058)
(59,456)
(47,416)
Net operating income/(loss)
33,663
(3,423)
9,299
20,137
13,771
Net income/(loss)
8,576
(5,496)
1,851
7,538
4,598
Non-current finance debt
27,404
29,118
21,754
22,889
23,763
Net interest-bearing debt before adjustments
867
19,493
16,429
11,130
15,437
Total assets
147,120
124,809
119,861
112,508
111,100
Total equity
39,024
33,892
41,159
42,990
39,885
Net debt to capital employed ratio
1)
2.2%
36.5%
28.5%
27.9%
27.9%
Net debt to capital employed ratio adjusted
1)
(0.8%)
31.7%
23.8%
29.0%
29.0%
ROACE
2)
22.7%
1.8%
9.0%
12.0%
8.2%
Operational data
Equity oil and gas production (mboe/day)
2,079
2,070
2,074
2,111
2,080
Proved oil and gas reserves (mmboe)
5,356
5,260
6,004
6,175
5,367
Reserve replacement ratio (annual)
1.13
(0.05)
0.75
2.13
1.50
Reserve replacement ratio (three-year average)
0.61
0.95
1.47
1.53
1.00
Production cost equity volumes (USD/boe)
5.4
4.8
5.3
5.2
4.8
Average Brent oil price (USD/bbl)
70.7
41.7
64.3
71.1
54.2
Share information
3)
Diluted earnings per share (in USD)
2.64
(1.69)
0.55
2.27
1.40
Share price at OSE (Norway) on 31 December (in NOK)
4)
235.90
144.95
175.50
183.75
175.20
Share price at NYSE (USA) on 31 December (in USD)
26.33
16.42
19.91
21.17
21.42
Dividend paid per share (in USD)
5)
0.56
0.71
1.01
0.91
0.88
Weighted average number of ordinary shares outstanding (in
millions)
3,254
3,269
3,326
3,326
3,268
1)
See section 5.2 Use and reconciliation of non-GAAP financial measures for net debt to capital employed ratio.
2)
See section 5.2 Use and reconciliation of non-GAAP financial measures for return on average capital employed (ROACE).
3)
See section 5.1 Shareholder information for a description of how dividends are determined and information on share repurchases.
4)
Last day of trading on Oslo Børs was 30 December in 2021 and 31 December in 2020.
5)
For 2021, dividends for the third and for the fourth quarters of 2020 and dividend for the first and second quarters of 2021 were paid. For
2020, dividends for the third and for the fourth quarters of 2019 and dividend for the first and second quarters of 2020 were paid.

32 Equinor, Annual Report on Form 20-F 2021
2.3
Exploration & Production Norway
(E&P Norway)
Martin Linge, North Sea.
Overview
The Exploration & Production Norway segment covers exploration, field development and operations on the NCS, which includes the
North Sea, the Norwegian Sea and the Barents Sea. E & P Norway aims to ensure safe and efficient operations, maximising the value
potential from the NCS. E & P Norway transforms the NCS using digital and carbon-efficient solutions and considers electrification of
several offshore installations.
For 2021, Equinor reports production on the NCS from 43 Equinor-operated fields and nine partner-operated fields.
Key events and portfolio developments in 2021 and early 2022:
◾
Equinor’s production on the NCS remained largely unaffected by Covid-19 precautionary measures, such as manning limitations
and quarantining.
◾
To meet the growing demand, Equinor and its licence partners scaled up gas production in 2021, e.g. from the
Gina Krog
,
Oseberg
and
3
a day from 15 October.
For more details, see section 2.6 MMP.
◾
Oil production from the
Johan Sverdrup
higher than anticipated at production start in October 2019.
◾
Gas production from the
Snøhvit
will resume when the refurbished Melkøya plant comes on line, expected in May 2022.
◾
Equinor and its licence partners made
eight commercial discoveries
◾
On 19 January, Equinor was awarded
17
10
Awards for predefined areas
round
2020
.
◾
On 11 February, the MPE approved the plan for development and operation of a partial electrification of the
Sleipner
Planned investments are around NOK 850 million, and the field centre is expected to connect to the
Utsira high power hub
towards the end of 2022.
◾
On 4 March, Equinor and its licence partners decided to further develop the Åsgard field in the Norwegian Sea, investing around
NOK 1.4 billion in
Åsgard B low pressure
. The platform is being modified to reduce inlet pressure, by replacing the reinjection
compressors and rebuilding parts of the processing facility. The low-pressure production is expected to begin in 2023.
Equinor, Annual Report on Form 20-F 2021 33
◾
On 22 April, the 11 foundations for the
Hywind Tampen
and mechanical outfitting. The Hywind Tampen floating wind farm is taking shape, expected on stream in the third quarter of
2022.
◾
On 23 April, Equinor and its licence partners decided to develop
Askeladd West
, a satellite to the Snøhvit gas field in the
southern Barents Sea. Investments are estimated to be NOK 3.2 billion. Askeladd West is planned to be ready for first gas in the
fourth quarter of 2025.
◾
On 17 June, Equinor and its licence partners decided to extend
Heimdal field life
Valemon
is being
processed at the Heimdal facilities, rendering a field life extension financially viable.
◾
On 23 June, Equinor was awarded
two
25
th
◾
On 23 June, crane vessel
Sleipnir
field. The second phase of the Johan Sverdrup field development advances towards production start in fourth quarter 2022.
◾
On 29 June, the MPE approved the plans for development and operation of
Breidablikk
oil field
.
The unitisation agreement was
approved on 15 September, establishing a 39% share for Equinor
.
Approximately NOK 18.6 billion is planned to be invested in
the field development. Production start is scheduled for the first half of 2024.
◾
On 30 June, the
Martin Linge
development were approximately NOK 63 billion. Energised in 2018, Martin Linge was the first field development on the NCS to
be supplied with onshore power, considerably reducing its carbon footprint. The field was officially opened on 27 January 2022.
◾
On 27 August, the third phase of the Troll field development in the North Sea was brought on stream.
Troll phase 3
gas cap of Troll West. The development uses existing infrastructure and investments were around NOK 8 billion.
◾
On 3 November, the second phase of the partner-operated
Ærfugl
subsea development six wells have been tied in to the Skarv FPSO in the Norwegian Sea, around 210 km west of Sandnessjøen.
◾
On 26 November, Equinor and its licence partners submitted to the MPE the plan for development and operation for
further
developing the Oseberg field
. The plan comprises installation of two new compressors to boost recoverable gas volumes, and
a partial electrification of the Oseberg field centre and Oseberg South platform.
◾
On 5 December, the refurbished vessel Njord Bravo
was towed from Haugesund to Kristiansund. Once
Njord future
stream in the fourth quarter of 2022, the vessel will process and store oil and gas from the Njord A platform. Following the
upgrade, the storage vessel is expected to be operational until 2040.
◾
On 7 December, Equinor entered into an agreement with Spirit Energy to acquire the company’s production licences in the
Statfjord
date of 1 January 2021 and is expected to be completed in the first half of 2022. Equinor plans to extend Statfjord’s field life to
2040.
◾
On 17 December, the MPE
approved the plan for development and operation of
Troll West
electrification
. Troll B is planned to
be partly electrified by 2024, and Troll C is expected to be fully electrified by 2026. Approximately NOK 7.9 billion is planned to be
invested, and the Norwegian NO
x
stream in 1996, was the first electrified installation on the NCS.
◾
On 18 January 2022, Equinor was awarded
26
12
Awards for predefined areas
2021
.
◾
On 1 February 2022, Equinor and its licence partners presented the impact assessment for
Wisting
.
Since 1 December 2019,
Equinor is operator of the Wisting field development, maturing towards sanction. On 17 December, Equinor agreed with Lundin
Energy that Equinor assumes operatorship of the Wisting field also during the operational phase.
◾
On 2 February 2022, the MPE approved the plan for development and operation of
Kristin South
oil and gas field at
Haltenbanken in the Norwegian Sea. The field will be developed in a subsea solution tied back to the Kristin platform.
Investments in the first phase of the development are estimated to NOK 6.5 billion, and production is scheduled to start in 2024.
The estimated life expectancy of the Kristin platform is 2034 and may be extended to 2042.
◾
On 17 February 2022, the
Johan Castberg
Boka Vanguard
,
headed for Stord yard, a 50-day voyage. First oil is scheduled for the fourth quarter of 2024.

34 Equinor, Annual Report on Form 20-F 2021
Major producing fields and field developments operated by Equinor and Equinor’s licence partners
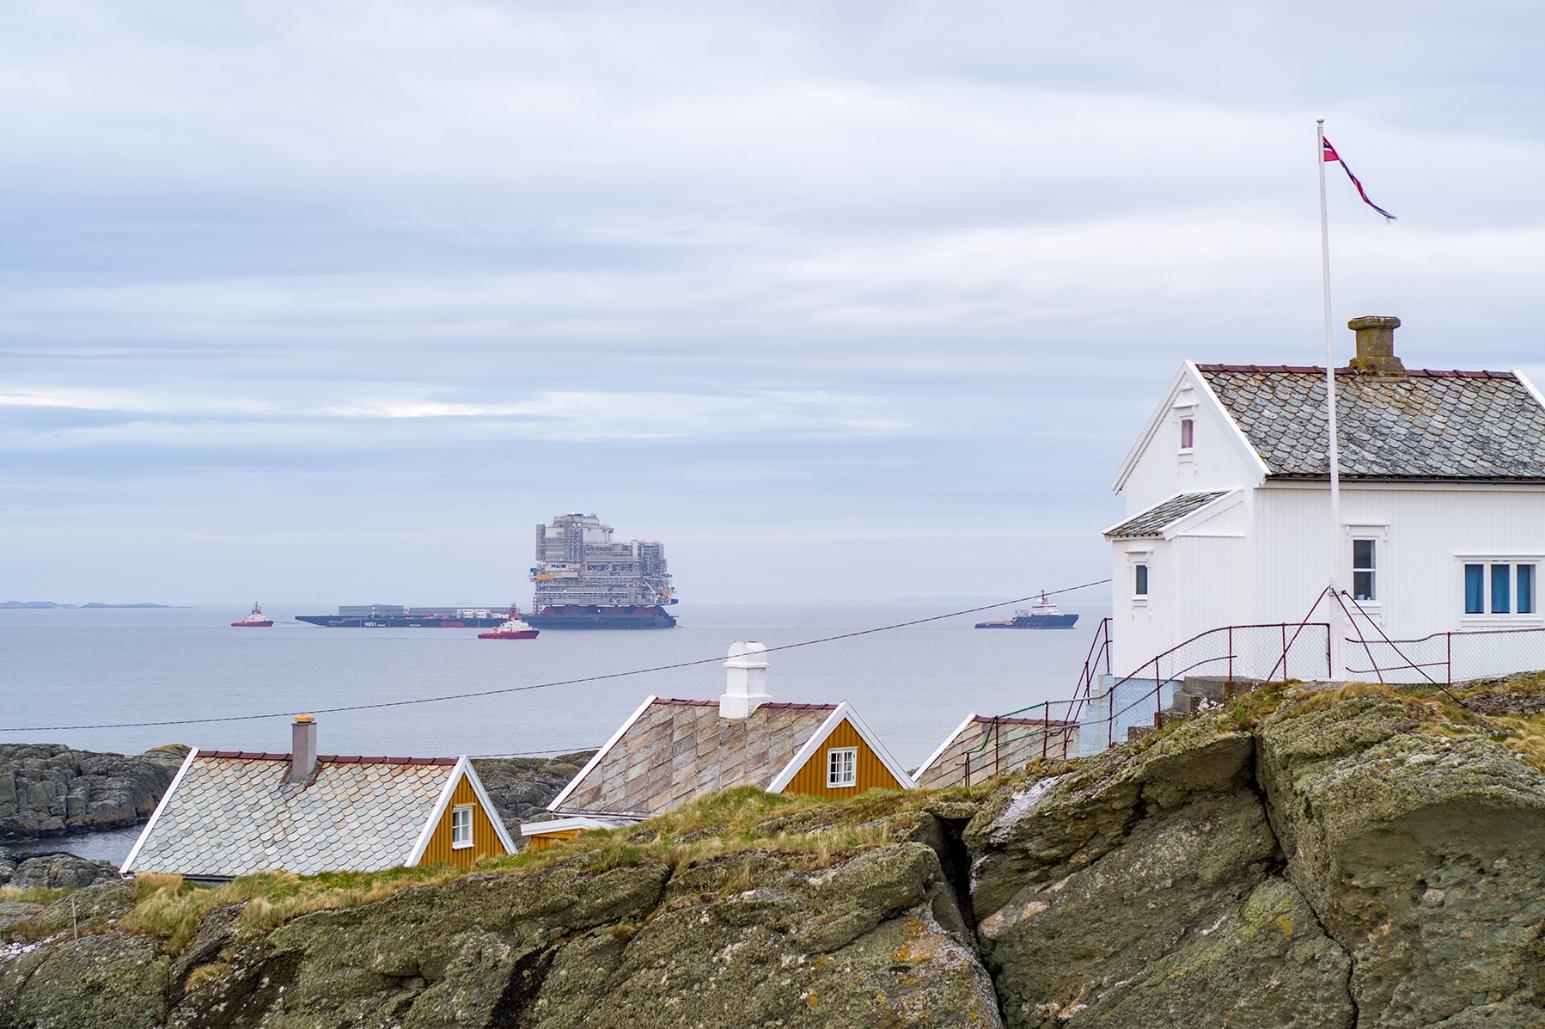
Equinor, Annual Report on Form 20-F 2021 35
Fields in production on the NCS
The table below shows E&P Norway's average daily entitlement production for the years ending 31 December 2021, 2020 and 2019.
Production in 2021 increased due to the ramp-up of Johan Sverdrup and Martin Linge, a higher flexible gas outtake from Oseberg and
Troll, and new wells on Snorre and Skarv, partially offset by shutdown at Snøhvit and natural decline.
Average daily entitlement production
2021
2020
2019
Oil and NGL
Natural gas
Oil and NGL
Natural gas
Oil and NGL
Natural gas
Area production
mbbl/day
mmcm/day
mboe/day
mbbl/day
mmcm/day
mboe/day
mbbl/day
mmcm/day
mboe/day
Equinor operated fields
Partner operated fields
Equity accounted
production
Total
Topside for the fifth Johan Sverdrup platform under tow to Haugesund 13-14 May 2021.
36 Equinor, Annual Report on Form 20-F 2021
The following tables show the NCS entitlement production by fields in which Equinor was participating during the year ended
31 December 2021.
Equinor operated fields, average daily entitlement production
Geographical area
Equinor's
equity
interest in %
On
stream
Licence expiry
date
Average
production in
2021 mboe/day
Field
Johan Sverdrup
The North Sea
42.63
2019
2036-2037
231
Troll Phase 1 (Gas)
The North Sea
30.58
1996
2030
198
Oseberg
The North Sea
49.30
1988
2031
126
Gullfaks
The North Sea
51.00
1986
2036
88
Aasta Hansteen
The Norwegian Sea
51.00
2018
2041
76
Visund
The North Sea
53.20
1999
2034
68
Åsgard
The Norwegian Sea
34.57
1999
2027
49
Tyrihans
The Norwegian Sea
58.84
2009
2029
39
Snorre
The North Sea
33.28
1992
2040
34
Kvitebjørn
The North Sea
39.55
2004
2031
30
Grane
The North Sea
36.61
2003
2030
23
Martin Linge
The North Sea
70.00
2021
2027
23
Statfjord Unit
The North Sea
44.34
1979
2026
22
Troll Phase 2 (Oil)
The North Sea
30.58
1995
2030
22
Sleipner West
The North Sea
58.35
1996
2028
21
Fram
The North Sea
45.00
2003
2024
20
Gina Krog
The North Sea
58.70
2017
2032
18
Gudrun
The North Sea
36.00
2014
2032
16
Mikkel
The Norwegian Sea
43.97
2003
2028
15
Heidrun
The Norwegian Sea
13.04
1995
2024-2025
11
Kristin
The Norwegian Sea
54.82
2005
2027-2033
10
Vigdis area
The North Sea
41.50
1997
2040
10
Trestakk
The Norwegian Sea
59.10
2019
2029
10
Norne
The Norwegian Sea
39.10
1997
2026
10
Tordis area
The North Sea
41.50
1994
2040
9
Valemon
The North Sea
66.78
2015
2031
8
Morvin
The Norwegian Sea
64.00
2010
2027
6
Alve
The Norwegian Sea
53.00
2009
2029
5
Utgard
The North Sea
38.44
1)
2019
2028
5
Sleipner East
The North Sea
59.60
1993
2028
4
Urd
The Norwegian Sea
63.95
2005
2026
4
Gungne
The North Sea
62.00
1996
2028
3
Statfjord North
The North Sea
21.88
1995
2026
2
Statfjord East
The North Sea
31.69
1994
2026-2040
1
Tune
The North Sea
50.00
2002
2025-2032
1
Sigyn
The North Sea
60.00
2002
2022
1
Byrding
The North Sea
70.00
2017
2024-2035
1
Veslefrikk
The North Sea
18.00
1989
2025-2031
1
Sygna
The North Sea
30.71
2000
2026-2040
1
Sindre
The North Sea
72.91
2017
2023-2034
0
Gimle
The North Sea
75.81
2006
2023-2034
0
Snøhvit
The Barents Sea
36.79
2007
2035
0
Heimdal
The North Sea
29.44
1985
2023
0
Total Equinor operated fields
1,223
Partner operated fields, average daily entitlement production
Equinor, Annual Report on Form 20-F 2021 37
Geographical area
Equinor's
equity
interest in %
Operator
On
stream
Licence expiry
date
Average
production in
2021 mboe/day
Field
Ormen Lange
The Norwegian Sea
25.35
A/S Norske Shell
2007
2040-2041
51
Skarv
The Norwegian Sea
36.17
Aker BP ASA
2013
2029-2036
42
Ivar Aasen
The North Sea
41.47
Aker BP ASA
2016
2029-2036
19
Goliat
The Barents Sea
35.00
Vår Energi AS
2016
2042
12
Ekofisk area
The North Sea
7.60
ConocoPhillips Skandinavia
AS
1971
2028
12
Marulk
The Norwegian Sea
33.00
Vår Energi AS
2012
2025
4
Tor II
The North Sea
6.64
ConocoPhillips Skandinavia
AS
2020
2028
1
Ærfugl Nord
The Norwegian Sea
30.00
Aker BP ASA
2021
2033
0
Enoch
The North Sea
11.78
Repsol Sinopec North Sea Ltd.
2007
2024
0
Total partner operated fields
141
Total E&P Norway including share of equity accounted production
1,364
1) The Utgard field in the North Sea spans the boundary between the Norw egian and UK continental shelves. The volumes pertain to the
Equinor 38.44% share of Utgard on the NCS. For the volumes pertaining to the Equinor 38% share of Utgard on the UKCS, please see
section 2.4 E&P International.
Main producing fields on the NCS
Equinor-operated fields
Johan Sverdrup
(Equinor 42.63%) is a major oil field with associated gas in the North Sea, developed with four platforms: a
processing platform, a drilling platform, a riser platform and a living quarter platform. Crude oil is exported to Mongstad through a 283-
km designated pipeline, and gas is exported to the gas processing facility at Kårstø through a 156-km pipeline via a subsea
connection to the Statpipe pipeline.
First oil was achieved in October 2019.
The second phase of the Johan Sverdrup field is under development and includes a new processing platform linked to the field centre,
and five new subsea templates.
Troll
to the Troll A, B and C platforms. Troll gas is produced mainly at Troll A, and oil mainly at Troll B and C. Fram, Fram H Nord and
Byrding are tie-ins to Troll C.
New compressors have increased the gas processing capacity: one compressor was brought on stream at Troll B in September 2018,
and one at Troll C in January 2020. In August 2021, the third phase of the Troll field development was brought on stream, producing
from the Troll West gas cap.
A partial electrification of Troll B and a full electrification of Troll C are underway. The Troll A platform, brought on stream in 1996, was
the first electrified installation on the NCS.
The
Gullfaks
Gullfaks in 1986, several satellite fields have been developed with subsea wells which are remotely controlled from the Gullfaks A and
C platforms.
The
Oseberg
Oseberg C, Oseberg East and Oseberg South production platforms. Oil and gas from the satellites are transported to the Oseberg
field centre for processing and transportation. Oseberg Vestflanken 2 came on stream in October 2018 and is Norway’s first
unmanned platform, remotely controlled from the Oseberg field centre.
38 Equinor, Annual Report on Form 20-F 2021
The
Åsgard
ship for oil, the Åsgard B semi-submersible floating production platform for gas and condensate, and the Åsgard C storage vessel for
oil and condensate. Åsgard C is also storage for oil produced at Kristin and Tyrihans. In 2015 Equinor started the world’s first subsea
gas compression train on Åsgard. The Trestakk field is tied back to Åsgard A.
The
Martin Linge
with an integrated wellhead, production and accommodation platform and a permanently anchored oil storage vessel. The gas is
piped to St Fergus, Scotland, and the oil is shipped in shuttle tankers, after being processed on board the storage vessel. The field is
operated from shore. In 2018, the field development was energised with onshore power.
Visund
(Equinor 53.20%, operator) oil and gas field in the North Sea is developed with Visund A semisubmersible integrated living
quarter, drilling and processing unit, and a subsea installation in the northern part of the field. Visund North improved oil recovery, a
subsea development with two new wells in a new subsea template, was brought on stream in September 2018.
The
Aasta Hansteen
platform and two subsea templates. With the Snefrid North well at 1309 metres beneath the ocean’s surface, the field development is
the deepest ever on the NCS.
The
Tyrihans
Kristin.
The
Snøhvit
field development in the Barents Sea and is connected to the liquefied natural gas processing facilities at Melkøya near Hammerfest
through a 160-km long pipeline.
Askeladd phase 1
, the next plateau extender of Snøhvit, is under development. Following a fire at
the Melkøya plant in Hammerfest in September 2020, first gas from Askeladd phase 1 has been rescheduled and is now expected in
the second half of 2022. The refurbished Melkøya plant is expected to come back on line in May 2022.
Askeladd West
, a satellite to
Snøhvit, is under development.
Partner-operated fields
Ormen Lange
transported to an onshore processing and export plant at Nyhamna. Gassco became operator of Nyhamna from
1 October 2017, with Shell as technical service provider.
Skarv
floating production, storage and offloading vessel and five subsea multi-well installations.
Ærfugl
Snadd Outer fields in the Norwegian Sea, near the Skarv field, around 200 km west of Sandnessjøen. The field is tied into the Skarv
floating production, storage and offloading vessel for processing and storage.
Ivar Aasen
steel jacket with partial processing and living quarters tied in as a satellite to Edvard Grieg for further processing and export.
Goliat
field consists of subsea wells tied back to a circular floating production, storage and offloading vessel. The oil is offloaded to shuttle
tankers.
Ekofisk area
Marulk
to the Norne FPSO.
Exploration on the NCS
Equinor holds exploration acreage and actively explores for new resources in all three regions on the NCS, the Norwegian Sea, the
North Sea and the Barents Sea. The North Sea and Norwegian Sea continue to be the most important areas for exploration, whereas
the exploration activity in the Barents Sea is expected to decrease and become more focused close to existing infrastructure.
Equinor was awarded
26
12
completed several farm-in transactions with other companies.
Equinor, Annual Report on Form 20-F 2021 39
In 2021, Equinor and its partners have completed
18
8
Exploratory wells drilled
1)
December
2021
2020
2019
North Sea
Equinor operated
10
10
5
Partner operated
2
2
2
Norwegian Sea
Equinor operated
2
4
4
Partner operated
0
6
4
Barents Sea
Equinor operated
2
4
2
Partner operated
2
0
1
Total (gross)
18
26
18
1) Wells completed during the year, including appraisals of
earlier discoveries.
Fields and projects under development on the NCS
Equinor’s major development projects on the NCS as of
31 December 2021:
Askeladd
sanctioned in March 2018. The development includes two subsea templates, a 42-km tie-back to
Snøhvit
producers. Following the fire at the Melkøya plant in September 2020, first gas has been rescheduled and is expected in the second
half of 2022.
Askeladd West
Snøhvit
gas field in the Barents Sea. The project was
sanctioned in April 2021. The projected subsea development is 195 kilometres from the Melkøya plant and will include a subsea
template tied in to
Askeladd
. The project is expected to be ready for first gas in the fourth quarter of 2025.
Breidablikk
(Equinor 39.00%, operator) is an oil field in the North Sea. The MPE approved the plan for development and operation of
the field on 29 June 2021. The field is being developed with a subsea solution tied back to the
Grane
at Grane, produced oil will be transported to the Sture terminal. Offshore modification work began March 2021 and the subsea
templates are expected be installed in March 2022. First oil is planned for first half of 2024.
Hywind Tampen
provide wind power to the
Snorre
and
Gullfaks
development and operation on 8 April 2020. The planned 11 wind turbines, based on the Hywind technology developed by Equinor,
are expected to meet around 35% of the annual power need of the five offshore platforms Snorre A, B and C and Gullfaks A and B.
Construction started in October 2020, and in April 2021, the 11 substructures were complete and towed to Vindafjord for further
slipforming and mechanical outfitting. The wind farm is expected to be brought on stream in fourth quarter of 2022.
Johan Castberg
around 240 kilometres northwest of Hammerfest in the Barents Sea. The MPE approved the plan for development and operation of
the field on 28 June 2018. The development includes a production vessel and a subsea development with 30 wells, ten subsea
templates and two satellite structures. The new FPSO hull sailed from Singapore in February 2022, headed for the Stord yard. Covid-
19 precautionary measures, such as manning limitations and quarantining, have affected progress, and first oil has been rescheduled
to the fourth quarter of 2024.
Johan Sverdrup, second phase
development and operation for the second phase of the Johan Sverdrup field on 19 May 2019. The development includes a new
processing platform linked to the field centre, five new subsea templates and 28 wells. Around one fourth of the oil from the Johan
Sverdrup full field will be produced in the second phase. In June 2021, the substructure of the new processing platform was installed
at the field. The three platform topsides were mated at Gismarvik and towed to Haugesund in May 2021. The topside was mated onto
the substructure at the field on 8 March 2022. The project moves ahead as planned, despite a somewhat lower progress at Norwegian
40 Equinor, Annual Report on Form 20-F 2021
yards caused by Covid-19 precautionary measures, such as manning limitations and quarantining. First oil is expected in the fourth
quarter 2022.
Kristin South
(Equinor 54.82%, operator) is a development of the Kristin Q segment and Lavrans discovery in the Norwegian Sea.
The MPE approved the plan for development and operation of the Kristin South oil and gas field on 2 February 2022. The field is
being developed in a subsea solution with two subsea templates tied back to the Kristin platform. Production start is scheduled for
2024.
Njord future
discoveries through to 2040. The MPE approved the plan for development and operation of the field on 20 June 2017. The
development includes an upgrade of the Njord A floating platform, an optimal oil export solution and drilling of ten new wells. As part
of the upgrade, the platform is being prepared to bring the nearby fields Bauge and Fenja on stream. In December 2021, Njord Bravo
was towed from the Haugesund yard to Kristiansund, where the remaining work is carried out. At Stord, Njord A is being prepared for
towout to the field in the Norwegian Sea. Due to Covid-19 precautionary measures, increased scope of work and a prolonged project
execution period, the start of oil production has been rescheduled to the fourth quarter of 2022.
Troll West electrification
high-tension cable from from Kollsnes in Øygarden. T
he MPE
approved the plan for development and operation of Troll West
electrification on 17 December 2021.
Troll B
Troll C
is expected to be fully electrified
by 2026.
Decommissioning on the NCS
Under the Petroleum Act, the Norwegian government has imposed strict regulations for removal and disposal of offshore oil and gas
installations. The Oslo-Paris convention for the protection of the marine environment of the Northeast Atlantic (OSPAR), which
Norway has committed to, gives requirements with respect to how disused offshore oils and gas installations are to be disposed.
Heimdal
(Equinor 29.40%, operator) is planning for cease of production in 2023. The Heimdal main platform and Gassco/Gassled’s
riser platform are scheduled to be removed during the years 2025-2027. The platforms will be brought to shore at Eldøyane, Stord, for
demolition and recycling.
Veslefrikk
to be completed by the first quarter of 2022. Veslefrikk B will be towed to shore for dismantling and recycling at MARS in
Fredrikshavn, Denmark, in the autumn of 2022, and Veslefrikk A is scheduled to be removed in 2025/2026. Veslefrikk A will be
brought to Eldøyane, Stord, for demolition and recycling.
Ekofisk
removed in 2021. Outstanding in this campaign is the Tor 2/4 E platform, scheduled to be removed in 2024.
For further information about decommissioning, see note 2 Significant accounting policies to the Consolidated financial statements.
Equinor, Annual Report on Form 20-F 2021 41
2.4
Exploration & Production International
(E&P International)
Peregrino wellhead platform B, Brazil.
Overview
Equinor is present in several oil and gas provinces in the world. The E&P International reporting segment covers exploration,
development and production of oil and gas outside the NCS and the US.
E&P International is present in nearly 15 countries and had production in 12 countries in 2021. E&P International produced around
16% of Equinor’s total equity production of oil and gas in 2021, compared to 17% in 2020.
For information about proved reserves development see section 2.10 Operational Performance under Proved oil and gas reserves.
Key events and portfolio developments in 2021 and early 2022:
●
maintenance activities in Peregrino producing field as wells as activities in the Peregrino phase 2 project. Equinor’s production in
other E&P International assets remained largely unaffected.
●
interest in the
CAN 100 block offshore Argentina
. After the transaction, Equinor holds a 35% interest in the block.
42 Equinor, Annual Report on Form 20-F 2021
●
Bressay
development on the UK continental shelf to EnQuest Heather Ltd.
●
Block 2
licence in
Tanzania
.
●
Barnacle
Exploration and Production UK Limited.
●
Bacalhau
and gas field, with first oil planned for 2024.
●
non-operated interest in the
Petrocedeño project onshore Venezuela
company.
●
Terra Nova
Canada.
●
the
Corrib
●
Statfjord
including
Barnacle
in the UK sector of the North Sea. The transaction has a commercial effective date of 1 January 2021, and
after completion of the transaction Equinor will hold a 100% interest in the Barnacle field.
●
Peregrino
oil field is nearing completion. On 9 May, the Peregrino 2 living quarters
were occupied. On 14 December, the Brazilian Agency for petroleum natural gas and biofuels (ANP) granted permission for
operating the gas pipeline.
●
Mariner
revision is linked to an updated seismic interpretation and experience from production of the Maureen reservoir which led to a
revised reservoir model. The revision was reflected in IFRS net operating income in fourth quarter 2021 results.
●
Russia
. For more information, see note 27
Subsequent events to the Consolidated financial statements.
For more information about the transactions included above see note 5 Acquisitions and disposals to the Consolidated financial
statements.
International production
In production sharing agreements (PSAs) and production sharing contracts (PSCs), entitlement production differs from equity
production. Equity production in PSAs and PSCs represent Equinor’s percentage ownership in a particular field, whereas entitlement
production represents Equinor’s share of the volumes distributed to the partners in the field, which is subject to several deductions
including but not limited to royalties and the host government's share of profit oil (see section 5.7 Terms and abbreviations).
Equinor's entitlement production outside Norway and the US was 13% of Equinor's total entitlement production in 2021.
The following table shows E&P International's average daily entitlement production of liquids and natural gas for the years ended 31
December 2021, 2020, and 2019.
Average daily entitlement production
For the year ended 31 December
2021
2020
2019
Oil and NGL
Natural gas
Oil and NGL
Natural gas
Oil and NGL
Natural gas
Production area
mboe/day
mmcm/day
mboe/day
mboe/day
mmcm/day
mboe/day
mboe/day
mmcm/day
mboe/day
Americas (excluding
US)
1)
Africa
Eurasia
Equity accounted
production
Total
Equinor, Annual Report on Form 20-F 2021 43
1) In 2019, the entitlement production numbers have been restated to reflect change to segment. For US entitlement production volumes, see
section 2.5 E&P USA.
44 Equinor, Annual Report on Form 20-F 2021
The table below provides information about the fields that contributed to production in 2021, including average equity production per
field.
Average daily equity production
Field
Country
Equinor's
equity
interest in %
Operator
On
stream
Licence
expiry date
Average daily
equity
production in
2021 mboe/day
Americas (excluding US)
56
Roncador
Brazil
25.00
1999
2052
37
Hebron
Canada
9.01
2017
HPB
1)
12
Hibernia/Hibernia Southern
Extension
2)
Canada
Varies
Corporation Ltd.
1997
HPB
1)
7
Peregrino
Brazil
60.00
2011
2040
Africa
187
Block 17
Angola
22.15
TotalEnergies E&P Angola S.A.
2001
2045
81
In Salah
Algeria
31.85
Sonatrach
3)
2004
2027
32
BP Exploration (El Djazair) Limited
Equinor In Salah AS
Agbami
Nigeria
20.21
Star Deep Water Petroleum Limited
(an affiliate of Chevron in Nigeria)
2008
2024
25
Block 15
Angola
12.00
Esso Exploration Angola Block 15 Limited
2004
2032
18
In Amenas
Algeria
45.90
Sonatrach
3)
2006
2027
15
BP Amoco Exploration (In Amenas) Limited
Equinor In Amenas AS
Murzuq
Libya
10.00
Akakus Oil Operations
2003
2037
9
Block 31
Angola
13.33
BP Exploration Angola Limited
2012
2031
7
Eurasia
78
ACG
Azerbaijan
7.27
BP Exploration (Caspian Sea) Limited
1997
2049
33
Mariner
UK
65.11
2019
HBP
1)
19
Kharyaga
4)
Russia
30.00
1999
2031
10
Corrib
Ireland
36.50
Ireland Limited
2015
2031
10
Utgard
5)
UK
38.00
2019
HBP
1)
5
Barnacle
UK
65.70
2019
HBP
1)
1
Total E&P International
321
Equity accounted production
21
North Danilovskoye
4)
Russia
49.00
2020
2031
11
Bandurria Sur
Argentina
30.00
Yacimientos Petrolíferos Fiscales S.A.
2015
2050
6
North Komsomolskoye
4)
Russia
33.33
2018
2112
5
Total E&P International including share of equity accounted production
342
1)
Held by Production (HBP): A leasehold interest that is perpetuated beyond its primary term as long as there is production in paying
quantities from well(s) on the lease or lease(s) pooled therewith.
2)
Equinor's equity interests are 5.0% in Hibernia and 9.26% in Hibernia Southern Extension.
3)
The complete name for Sonatrach is Société nationale de transport et de commercialisation d’hydrocarbures.
4)
In February 2022, Equinor announced its intention to exit its business activities in Russia. See note 27 Subsequent events to the
Consolidated financial statements.
5)
The Utgard field spans the boundary between the Norwegian and UK continental shelves. In this section we report only volumes
pertaining to the Equinor 38% share in UKCS.
Equinor, Annual Report on Form 20-F 2021 45
Americas (excluding US)
Argentina
The
Bandurria Sur
onshore block is in Argentina’s Neuquén province in the core area of the prolific Vaca Muerta play. Equinor
entered the license in 2020. The block is currently producing from 50 producer wells. Future development includes drilling 300-500
additional wells and building an oil central processing facility with capacity of 75 mboe of oil per day (100%).
Brazil
The
Peregrino
wellhead platforms with drilling capability, processed on the FPSO Peregrino and offloaded to shuttle tankers.
Production from Peregrino started in 2011. As part of the second phase of the Peregrino field development, a third wellhead platform
was constructed and installation activities are being conducted, extending field life.
In April 2020, production in Peregrino field was shut down for unplanned maintenance of the subsea equipment. Technical challenges
and Covid-19 infection control measures have affected the progress of the maintenance activities. Production is expected to resume
in northern hemisphere summer 2022.
Equinor has interests in the
Roncador
in production since 1999. The hydrocarbons are produced from two semi-submersibles and two FPSOs. The oil is offloaded to shuttle
tankers, and the gas is drained out through pipelines to shore.
Canada
Equinor has interests in the
Jeanne d'Arc
producing oil fields
In September 2021 Equinor finalized the exit from the
Terra Nova
Africa
Algeria
In Salah
operating since 2016 and
are tied back into the Northern fields facilities.
In Amenas
is an onshore gas development which contains significant liquid volumes. The In Amenas infrastructure includes a gas
processing plant with three trains. The production facility is connected to the Sonatrach distribution system.
Separate PSAs including mechanisms for revenue sharing, govern the rights and obligations of the parties and establish joint
operatorships between Sonatrach, bp and Equinor for In Salah and In Amenas.
Angola
The deep-water blocks 17, 15 and 31 contributed 36% of Equinor’s equity liquid production outside the NCS and the US in 2021. Each
block is governed by a PSA which sets out the rights and obligations of the participants, including mechanisms for sharing of the
production with the Angolan state oil company Sonangol.
Block 17
developed to stem decline. The Zinia phase 2 and CLOV phase 2 projects came on stream during 2021.
Block 15
Block 31
The FPSOs serve as production hubs and each receives oil from more than one field through multiple wells.
Libya
Equinor has ownership interest in two oil fields onshore in Libya,
Murzuq
Mabruk.
commenced towards end of 2020 after being shut down for nearly nine months and has remained stable throughout 2021. Plans are
underway to redevelop the Mabruk field, which was damaged during the conflicts in Libya in 2015.
Nigeria
The
Agbami
licences OML 127 and OML 128 and is operated by Chevron under a Unit Agreement. The Agbami field is governed by a PSC.
46 Equinor, Annual Report on Form 20-F 2021
For information related to the Agbami redetermination process and the dispute between the Nigerian National Petroleum Corporation
and the partners in OML 128 concerning certain terms of the OML 128 PSC, see note 24 Other commitments, contingent liabilities
and contingent assets to the Consolidated financial statements.
The government of Nigeria approved and implemented a new Petroleum Industry Act during 2021 which governs new leases as well
as renewal of existing leases.
Eurasia
Azerbaijan
Azeri-Chirag-Gunashli (ACG)
processed prior to export. The Baku-Tbilisi-Ceyhan (BTC) pipeline is the main export route, in which Equinor holds 8.71%. The
development of the
Azeri Central East (ACE)
platform is expected to come on stream in 2023.
Ireland
Equinor holds an interest in the
Corrib
Vermilion Energy Inc to sell Equinor’s non-operated equity position in the Corrib gas field offshore Ireland. The effective date for the
transaction is 1 January 2022. Closing is expected during 2022.
For more information about the transaction see note 5 Acquisitions and disposals to the Consolidated financial statements.
Russia
Equinor holds an interest in the
Kharyaga
governed by a PSA.
Equinor holds an interest in the
North Danilovskoye
Region, Eastern Siberia. The field is under development and was brought on early-phase production in 2020.
In 2020, Equinor increased its onshore presence in Russia by signing an agreement with Rosneft to acquire a 49% interest in the
limited liability company KrasGeoNaC LLC (renamed to AngaraOil LLC in 2021) which holds twelve conventional onshore exploration
and production licences in Eastern Siberia, including the producing North Danilovskoye oil field. All other licenses are at various
stages of exploration maturity.
In February 2022, Equinor announced its intention to exit its business activities in Russia. For more information see note 27
Subsequent events to the Consolidated financial statements and section 2.13 Risk review under “Risks related to our business”.
United Kingdom
Mariner
production, drilling and living quarter platform based on a steel jacket. Oil is exported by offshore loading from a floating storage unit.
Production from the field started in August 2019.
Utgard
shelves. Production from the field started in September 2019 and it is remotely operated from the Norwegian Sleipner field. For more
information, please see section 2.3 Exploration and Production Norway.
Barnacle
continental shelves and consists of one well tied back to the Statfjord B platform. Production from the field started in December 2019.
In December 2021, Equinor entered into an agreement to acquire all of Spirit Energy’s production licences in the Statfjord area with an
effective date of 1 January 2021.
International exploration
Equinor has throughout 2021 continued its exploration activity outside Norway and the US, and drilled offshore wells in Brazil and the
UK and onshore wells in Argentina and Russia. Equinor has continued shaping the portfolio and made decisions to exit countries that
will no longer be prioritized for exploration while focusing activity in areas with high value potential. In 2021 Equinor decided to exit
Mexico and Nicaragua. Equinor also exited Bajo del Toro Este and Aguila Mora Noreste assets in Argentina (two neighbouring blocks
to Bajo del Toro block in Vaca Muerta play) in 2021.
In
Equinor and partners completed two wells, and Equinor intends to continue exploration activity in 2022.
In
Angola,
Sonangol.
Equinor, Annual Report on Form 20-F 2021 47
In
Russia
, Equinor drilled six exploration wells in several licenses, all in associated companies. In February 2022, Equinor announced
its intention to exit its business activities in Russia. For more information see note 27 Subsequent events to the Consolidated financial
statements and section 2.13 Risk review under “Risks related to our business”.
In
Argentina
onshore, Equinor drilled six appraisal wells which are expected to be completed in 2022 and obtained exploitation
concession for Bajo del Toro in the Vaca Muerta play.
In
Argentina
offshore, Equinor intends to continue exploration activities in 2022.
During 2021, Equinor and its partners completed three exploratory wells.
Exploratory wells
drilled
1)
2021
2020
2019
Americas (excluding US)
Equinor operated
0
3
2
Partner operated
2
3
3
Africa
Equinor operated
0
0
0
Partner operated
0
1
0
Other regions
Equinor operated
1
0
4
Partner operated
2)
0
4
5
Total (gross)
3
11
14
1) Wells completed during the year, including appraisals of
earlier discoveries.
2) Equinor drilled six exploration wells in Russia, all in associated
companies.
Fields under development internationally
Americas (excluding US)
Brazil
Bacalhau (formerly Carcará)
(Equinor 40%, operator) oil and gas discovery straddles
BM-S-8
Bacalhau North
in the Santos
basin, 185 km off the coast of the state of São Paulo.
The investment decision for Bacalhau phase 1 was made in June 2021. The field is being developed with subsea wells tied back to an
FPSO, and first oil is scheduled for 2024.
A second phase of the Bacalhau field development is being considered to fully exploit the value potential.
Peregrino phase 2
km off the coast of the state of Rio de Janeiro. Peregrino phase 1 was brought on stream in 2011, and the second phase of the
development will prolong the field’s productive life. The licence runs until 2040. Oil producers and water injectors will be drilled in the
new area from a third wellhead platform, to be tied back to the existing floating production, storage, and offloading vessel.
In mid-January 2020, the third Peregrino wellhead platform was in place at the field. The flotel Olympia was connected, and the
platform is being prepared for operations.
Once on stream, Peregrino C will provide 350 offshore and onshore jobs in Brazil.
Covid-19 and infection control measures have affected progress, and first oil has been rescheduled to northern hemisphere summer
2022, after Peregrino main resumes operations.
Eurasia
48 Equinor, Annual Report on Form 20-F 2021
Russia
North Komsomolskoye
The investment decision for the first phase was made in 2019.
In February 2022, Equinor announced its intention to exit its business activities in Russia. For more information see note 27
Subsequent events to the Consolidated financial statements and section 2.13 Risk review under Risks related to our business.
Discoveries with potential development
Americas (excluding US)
Brazil
BM-C-33
Pão de Açúcar
,
Gávea
and
the Campos basin, off the coast of the state of Rio de Janeiro, Brazil. The project is maturing towards sanction. A gas export solution
is under consideration.
Canada
Bay du Nord
discovered by Equinor in 2013. The field is around 500 km northeast of St. John’s in Newfoundland and Labrador, Canada.
Developing Bay du Nord and nearby discoveries in a subsea solution tied back to an FPSO is under consideration.
Africa
Tanzania
Block 2
during 2012-2015. The partners of blocks 2 (Equinor, operator) and blocks 1 and 4 (Shell, operator) are collaborating on the future
development of the discoveries. The government of Tanzania has invited the operators and partners to start negotiations on a suitable
legal, commercial, and fiscal framework for developing the discoveries. These negotiations are ongoing.
Eurasia
Azerbaijan
The
Karabagh
)
Equinor entered into an agreement with SOCAR (the Azerbaijani state oil company) to enter the Karabagh and Ashrafi-Dan Ulduzu-
Aypara (ADUA) exploration licences with a 50% share in each.
In 2020 Equinor drilled an appraisal well on the Karabagh licence confirming the hydrocarbon resources. A joint operating company
has been formed and has started working on the field development solution.
United Kingdom
The
Rosebank
continental shelf. Equinor and its licence partners continue to mature and improve the business case for development of the oil and
gas field.

Equinor, Annual Report on Form 20-F 2021 49
2.5
Exploration & Production USA (E&P USA)
Drone technology (SeekOps) being used in methane detection, Appalachian basin in Ohio, USA.
Overview
Equinor has been present in the USA since 1987. The E&P USA reporting segment covers both onshore and offshore exploration,
development and production of oil and gas in the United States of America (USA). E&P USA produced around 18% of Equinor’s total
equity production of oil and gas in 2021, compared to 19% in 2020.
For information about proved reserves development see section 2.10 Operational Performance under Proved oil and gas reserves.
Key events and portfolio developments in 2021 and early 2022:
●
Bakken assets
●
Austin Chalk
remaining non-operated position to Marathon (the operator).
US production
Entitlement production differs from equity production in the USA where entitlement production is expressed net of royalty interests.
Equity production represents volumes that correspond to Equinor’s percentage ownership in a particular field and is larger than
Equinor’s entitlement production where the royalties are excluded from entitlement production.
Equinor's entitlement production in the USA was 17% of Equinor's total entitlement production in 2021.
The following table shows E&P USAs average daily entitlement production of liquids and natural gas for the years ended 31
December 2021, 2020, and 2019.
Average daily entitlement production
For the year ended 31 December
2021
2020
2019
Oil and NGL
Natural gas
Oil and NGL
Natural gas
Oil and NGL
Natural gas
Production area
mboe/day
mmcm/day
mboe/day
mboe/day
mmcm/day
mboe/day
mboe/day
mmcm/day
mboe/day
50 Equinor, Annual Report on Form 20-F 2021
USA
Equinor, Annual Report on Form 20-F 2021 51
The table below provides information about the fields that contributed to production in 2021, including average equity production per
field.
Average daily equity production
Field
Country
Equinor's equity
interest in %
Operator
On
stream
Licence
expiry date
Average daily
equity
production in
2021 mboe/day
Appalachian (APB)
1)
US
Varies
2)
Equinor/others
3)
2008
HBP
5)
Caesar Tonga
US
46.00
2012
HBP
5)
Tahiti
US
25.00
2009
HBP
5)
Bakken
US
Varies
2) 4)
Equinor/others
4)
2011
HBP
5)
Julia
US
50.00
2016
HBP
5)
St. Malo
US
21.50
2014
HBP
5)
Jack
US
25.00
2014
HBP
5)
Big Foot
US
27.50
2018
HBP
5)
Stampede
US
25.00
2018
HBP
5)
Titan
US
100.00
2018
HBP
5)
Heidelberg
US
12.00
2016
HBP
5)
Total E&P USA
1)
Appalachian basin contains Marcellus and Utica formations.
2)
Equinor’s actual equity interest varies depending on wells and area.
3)
Operators are Equinor USA Onshore Properties Inc, Chesapeake Operating LLC, Southwestern Production Company, Chief Oil &
Gas LLC, and several other operators.
4)
On 26 April 2021, Equinor completed the sale of its Bakken assets to Grayson Mill Energy.
5)
Held by Production (HBP): A leasehold interest that is perpetuated beyond its primary term as long as there is production in paying
quantities from well(s) on the lease(s) pooled therewith.
52 Equinor, Annual Report on Form 20-F 2021
Offshore Gulf of Mexico
The
Titan
The
Tahiti, Heidelberg, Caesar Tonga and Stampede
Tahiti
Heidelberg
Caesar Tonga
operated Constitution spar host. The
Stampede
The
Jack, St. Malo, Julia
Big Foot
and
Julia
Big Foot
producing through a dry tree tension-leg platform with a drilling rig.
Onshore portfolio
Since its entry into US shale in 2008, Equinor has continued to optimise its portfolio through acreage acquisitions and divestments.
Following the commodity price decline in early 2020, Equinor halted its US onshore operated drilling and completions activities. In
April 2021, Equinor completed its divestment of the
Bakken
operated activities.
Equinor has an ownership interest in the
Marcellus
Appalachian
is mostly partner operated. Since 2012, Equinor has also been an operator in the Appalachian region in the state of Ohio, developing
Marcellus and Utica formations.
In addition, Equinor participates in natural gas gathering system and gas treatment and processing facilities in Appalachian basin
assets to provide flow assurance for Equinor's upstream production.
US exploration
Throughout 2021, Equinor has continued its activity in US Gulf of Mexico, one of its core areas for exploration.
Equinor began drilling an operated appraisal well located in the Walker Ridge area of the
US Gulf of Mexico
completed in 2022. In addition, Equinor was awarded one lease in 2021.
Exploratory wells
drilled
1)
2021
2020
2019
US
Equinor operated
0
1
0
Partner operated
0
2
2
Total (gross)
0
3
2
1) Wells completed during the year, including appraisals of
earlier discoveries.
Fields under development in US
Offshore Gulf of Mexico
The
Vito development project
(Equinor 36.89%, operated by Shell) is a Miocene oil discovery located in the Mississippi Canyon
area. The development project consists of a light-weight semisubmersible platform with a single eight-well subsea manifold. The
project was sanctioned for development in April 2018. In January 2022, the Vito platform sailed away from Singapore towards the Gulf
of Mexico and is on track for production start early 2023.
The
St. Malo water injection project
Currently both production wells are online, and two injector wells are drilled. Both injector completions and last injector conversion are
expected in the second half of 2022.
Equinor, Annual Report on Form 20-F 2021 53
Discoveries with potential development
Offshore Gulf of Mexico
North Platte
since its discovery with three drilled wells and three sidetracks. In February 2022, the operator notified Equinor and the relevant
authorities about its decision to withdraw from the North Platte project. Equinor is working with the operator on an orderly transition.

54 Equinor, Annual Report on Form 20-F 2021
2.6
Marketing, Midstream & Processing (MMP)
Kollsnes gas processing plant at Øygarden, Norway.
Overview
The Marketing, Midstream & Processing reporting segment is responsible for the marketing, trading, processing and transportation of
crude oil and condensate, natural gas, NGL and refined products, including the operation of the Equinor-operated refineries, terminals
and processing plants. MMP is also responsible for power and emissions trading and for developing transportation solutions for
natural gas, liquids and crude oil from Equinor assets, including pipelines, shipping, trucking and rail. In addition, MMP is responsible
for low carbon solutions in Equinor.
The business activities within MMP are organised in the following business clusters: Crude, Products and Liquids (CPL), Gas and
Power (G&P), Operating Plants (OPL), Data improvements, shipping & commercial operations (DISC) and Low Carbon Solutions
(LCS).
MMP markets, trades and transports approximately 59% of all Norwegian liquids export, including Equinor equity, the Norwegian
State’s direct financial interest (SDFI) equity production of crude oil and NGL, and third-party volumes. MMP is also responsible for the
marketing, trading and transportation of Equinor’s and SDFI’s dry gas and LNG together with third-party gas. This represents
approximately 70% of all Norwegian gas exports. For more information, see note 2 Significant accounting policies to the Consolidated
financial statements for Transactions with the Norwegian State, and section 2.9 Corporate, Applicable laws and regulations for the
Norwegian State’s participation and SDFI oil and gas marketing and sale.
Key events in 2021 and early 2022:
Equinor, Annual Report on Form 20-F 2021 55
●
Northern Lights:
CO
2
. The project is part of
Longship
, the Norwegian authorities’ project for full-scale carbon capture, transport and storage in
Norway. Longship was passed unanimously in the Norwegian Parliament on 21 January 2021, and the Northern Lights PDO was
officially approved on 26 February 2021. Civil works began at Øygarden in January 2021, and the project is expected to come on
stream in 2024.
●
Tjeldbergodden resumed activities in February 2021, and the refurbished Hammerfest LNG is expected to resume activities in
May 2022.
●
challenge fund (ISCF) were selected for funding. These were Zero Carbon Humber, Northern Endurance Partnership (NEP) and
Net Zero Teesside.
●
agreement covers the Equinor Refining Denmark A/S (ERD) company consisting of the Kalundborg refinery and terminal in the
northwest of Zealand, the Hedehusene terminal near Copenhagen as well as associated infrastructure and industrial property.
The legal transfer of ownership was completed on 31 December 2021.
●
charter contracts have been entered into for a total of six newbuild LPG dual-fuelled gas carriers for delivery in 2022/2023; Two
very large size gas carriers (VLGC) and four medium size gas carriers (MGC).
●
continental shelf to supply the tight European market. Production permits for the Oseberg and Troll fields have each been
increased by 1 billion cubic meters (bcm) for the gas year starting 1 October.
●
setting the development of NEP and CO
2
●
injection at Gina Krog. Following a dialogue with licence partners and authorities, the MPE granted a permit to temporarily halt gas
injection up to 31 December 2021. For 2022, a new application for continued halt in gas injection has been granted up to 31
March 2022.
●
●
production record in October.
Marketing and trading of gas, LNG and power
MMP is responsible for the sale of Equinor’s and SDFI’s (Norwegian State’s direct financial interest) dry gas and LNG. Equinor’s gas
marketing and trading business is conducted from Norway and from offices in Belgium, the UK, Germany and the US. As Owner of
Danske Commodities (DC), a trading company for power and gas, MMP has strengthened Equinor´s energy trading business, also
supporting our investment within Renewables. DC is primarily active in Europe but also has power activities in US and Australia.
Europe
The major export markets for natural gas produced from the Norwegian continental shelf (NCS) are the UK, Germany, France, the
Netherlands and Belgium. LNG from the Snøhvit field
8
, combined with third-party LNG cargoes, allows Equinor to reach global gas
markets. The gas is sold to counterparties through bilateral sales agreements and over the trading desk. Some of Equinor’s long-term
gas contracts have price review clauses which can be triggered by the parties.
For ongoing price reviews, Equinor provides in its financial statements for probable liabilities based on Equinor’s best judgement. For
further information, see note 24 Other commitments, contingent liabilities and contingent assets to the Consolidated financial
statements.
Equinor is active on both the physical and exchange markets, such as the Intercontinental Exchange (ICE) and Trayport. Equinor
expects to continue to optimise the value of the gas volumes through a mix of bilateral contracts and over the trading desk, via its
production and transportation systems and downstream assets. MMP receives a marketing fee from EPN for the Norwegian gas sold
on behalf of the company.
DC is active on both the physical and exchange markets for both gas and power as a separate entity. All trading and optimisation of
power in Equinor is performed by DC.
USA
Equinor Natural Gas LLC (ENG), a wholly owned subsidiary, has a gas marketing and trading organisation in Stamford, Connecticut
that markets natural gas to local distribution companies, industrial customers, power generators and other gas trading counterparties.
ENG also markets equity production volumes from the Gulf of Mexico and the Appalachian Basin and transports some of the
8
resume when the refurbished Melkøya plant comes on line, expected in May 2022.
56 Equinor, Annual Report on Form 20-F 2021
Appalachian production to New York City and into Canada to the greater Toronto area. In addition, ENG has capacity contracts at the
Cove Point LNG re-gasification terminal.
Marketing and trading of liquids
MMP is responsible for the sale of Equinor’s and SDFI’s crude oil and NGL produced at the Norwegian Continental Shelf, in addition
to the operation and commercial optimisation of the refineries and terminals. MMP also markets the equity volumes from the
Company´s assets located in the US, Brazil, Canada, Angola, Nigeria, Algeria, Azerbaijan and the UK, as well as third-party volumes.
The value is maximised through marketing, physical and financial trading and through the optimisation of owned and leased capacity
such as refineries, processing, terminals, storages, pipelines, railcars and vessels.
The liquids marketing and trading business is conducted from Norway, the UK, Singapore, the US and Canada. The main crude oil
market for Equinor is Northwest Europe.
Manufacturing
Equinor owns and operates the Mongstad refinery in Norway, including a combined heat and power plant (CHP). The refinery is a
medium-sized refinery built in 1975, with a crude oil and condensate distillation capacity of 226,000 barrels per day. The refinery is
supplied via the Mongstad Terminal DA linked to offshore fields through three crude oil pipelines, a pipeline for NGL’s connecting
to Kollsnes and Sture (the Vestprosess
pipeline) and to Kollsnes by a gas pipeline. The CHP produces heat and power from gas received from Kollsnes and from the refinery.
It was designed with a generating capacity of approximately 280 megawatts of electric power and 350 megawatts of process heat.
Equinor has decided to cease the operation and redesign a part of the CHP to a new heater for process heat planned to be
operational in the second quarter of 2022. The CHP will continue operation until the new heater comes into service.
Equinor holds an ownership interest in Vestprosess (34%), which transports and processes NGL and condensate. The operatorship
of Vestprosess was transferred to Gassco as of 1 January 2018, with Equinor as the technical service provider.
Equinor Refining Denmark A/S owned a refinery and two terminals. The refinery processes about 5.5 million tonnes of crude oil,
condensate and feedstock per year. Total capacity per day is 108.000 barrels. The product terminal in Kalundborg is located next to
the refinery. The terminal in Hedehusene (close to Copenhagen) is supplied 100% via two pipelines, which are connected to the
refinery. The pipelines are owned by Danish Central Oil Stockholding (FDO). The majority of the refined products are sold locally in
Denmark and Scandinavia. The legal transfer and sale of 100% of the shares of Equinor Refining Denmark A/S to Klesch Group was
completed on 31 December 2021.
Equinor holds an ownership interest in the methanol plant at Tjeldbergodden (82 %). The plant receives natural gas from fields in the
Norwegian Sea through the Haltenpipe pipeline. In addition, Equinor holds an ownership interest in the air separation
unit Tjeldbergodden Luftgassfabrikk DA (50.9%).
The following table shows the operating statistics for the plants at Mongstad, Kalundborg and Tjeldbergodden. Refinery margins
increased in 2021 after the Covid-19 pandemic market collapse in 2020. The higher throughput for Mongstad in 2021 was mainly due
to increased utilisation rate as a result of higher margins in addition to better refinery performance. The increase in on stream factor at
Mongstad is due to few unplanned shutdowns and fewer planned shutdowns in 2021 than in 2020.
The lower throughput
for Tjeldbergodden in 2021 was mainly influenced by more unplanned shutdowns compared to 2020. Reduced on-stream factor and
utilisation rate compared to 2020 are influenced by higher number of days with shutdown for Tjeldbergodden. In
addition, Tjeldbergodden had one planned shutdown in 2021. On-stream factor in 2021 is higher than previous year, resulting in higher
throughput than last year.
Throughput
1)
Distillation capacity
2)
On stream factor %
3)
Utilisation rate %
4)
Refinery
2021
2020
2019
2021
2020
2019
2021
2020
2019
2021
2020
2019
Mongstad
11.1
9.7
10.5
9.3
9.3
9.3
98.2
82.5
79.0
93.3
81.4
87.7
Kalundborg
4.9
4.5
5.0
5.4
5.4
5.4
99.0
92.1
98.0
83.0
84.4
85.4
5)
Tjeldbergodden
0.6
0.9
0.9
0.7
1.0
1.0
71.4
86.8
93.9
90.0
86.8
93.9
1)
Actual throughput of crude oils, condensates and other feed, measured in million tonnes.
Throughput may be higher than the distillation capacity for the plants because the volumes of fuel oil etc. may not go through the
crude-/condensate distillation unit.
2)
Nominal crude oil and condensate distillation capacity, and methanol production capacity, measured in million tonnes.
3)
Composite reliability factor for all processing units, excluding turnarounds.
Equinor, Annual Report on Form 20-F 2021 57
4)
Composite utilisation rate for all processing units, based on throughput and capacity (per stream day).
5)
Equinor completed the sale of Kalundborg 31 December 2021.
Terminals and storage
Equinor operates the Mongstad crude oil terminal (Equinor 65%). The crude oil is landed at Mongstad through pipelines from the NCS
and by crude tankers from the market. The Mongstad terminal has a storage capacity of 9.4 million barrels of crude oil.
Equinor operates the Sture crude oil terminal. The crude oil is landed at Sture through pipelines from the North Sea. The terminal is
part of the Oseberg Transportation System (Equinor 36.2%). The processing facilities at Sture stabilise the crude oil and recover an
LPG mix (propane and butane) and naphtha.
Equinor operates the South Riding Point Terminal (SRP), which is located on the Grand Bahamas Island and consists of two shipping
berths and ten storage tanks, with a storage capacity of 6.75 million barrels of crude oil. The terminal has facilities to blend crude oils,
including heavy oils. In September 2019, SRP was struck by Hurricane Dorian causing damage to the facility and an oil spill on land.
Clean-up activities at and around the terminal were completed in 2021. Rebuild of the terminal is planned to commence in 2022.
Equinor UK holds an interest in the Aldbrough Gas Storage (Equinor 33.3%) in the UK, which is operated by SSE Hornsea Ltd.
Equinor Deutschland Storage GmbH holds an interest in the Etzel Gas Lager (Equinor 23.7%) in the northern part of Germany which
has a total of 19 caverns and secures the regularity for gas deliveries from the NCS.
Low-carbon solutions
●
carbon capture and storage
has continued to develop competence through research engagement at Technology Centre Mongstad, the world’s largest facility
for testing and improving CO
2
reduce carbon dioxide emissions from several sources and to drive new opportunities, including enhanced oil recovery
possibilities and carbon neutral value chains based on hydrogen.
●
Northern Lights
storage on the NCS of CO
2
around 1.5 million tons CO
2
2
2
to reaching the climate goal of the Paris agreement, and the project is part of Longship, the Norwegian authorities’ project for full-
scale carbon capture, transport and storage in Norway. The Norwegian government announced its funding decision for Northern
Lights in December 2020. The Northern Lights infrastructure will enable transport of CO
2
terminal in Øygarden for intermediate storage, before transport by pipeline for permanent storage in a reservoir 2,600 metres
under the seabed. Equinor, Shell and Total made their conditional investment decision in May 2020. The three companies formed
a joint venture Northern Lights JV DA in March 2021, and the new company has assumed operatorship of the storage licence.
Longship was passed unanimously in the Norwegian Parliament (St prop 33/2020) on 21 January 2021, and the Northern Lights
PDO was officially approved on 26 February 2021. A confirmation well was completed in 2020, and civil works began
at Øygarden in January 2021. A second well is drilled summer 2022. The project is expected to come on stream in 2024.
In March 2020,
Northern Lights
2
field in the North Sea. The well is intended for injection and storage of CO
₂
. To stimulate the development of future carbon capture
and storage projects, Equinor and its partners have shared the well data with external parties without charge.
In parallel with Northern Lights, Equinor is looking to
provide CCS capacity in the UK
companies. This partnership is called the
Northern Endurance Partnership
(NEP). The consortium is developing a CO
2
transport and storage infrastructure in the UK, which will serve the proposed Net Zero Teesside project (led by bp with Equinor as a
partner) and Zero Carbon Humber project (led by Equinor) with the aim of decarbonising these industrial clusters. In 2020 Equinor
became a CO
2
partnership submitted a bid for funding further project development of the CO
2
government’s industrial decarbonisation challenge.
In July 2020, Equinor launched the
Hydrogen 2 Humber (H2H) Saltend project
the low-carbon infrastructure in the area and a fuel switch in the Saltend chemical park. Established hydrogen pipelines will be
expanded across the Humber, transporting hydrogen for use by multiple industry and power customers.
Equinor and partners Air Liquide (operator) and BKK are developing a
liquid hydrogen project
a full value chain for decarbonising the maritime sector (
Liquid to hydrogen project LH2
). In May 2020, the consortium with
58 Equinor, Annual Report on Form 20-F 2021
representatives from the whole value chain was established. Mongstad Industripark was chosen as the location for liquid hydrogen
production based on the opportunities for infrastructure synergies between existing and future plants in the area. This project is part of
the Equinor’s maritime climate strategy, which is well aligned with the political strategy set out by the Norwegian government for
decarbonisation of the maritime sector.
Pipelines
Equinor is a significant shipper in the NCS gas pipeline system. Most of the gas pipelines on the NCS that are accessed by third-party
customers are owned by a single joint venture, Gassled (Equinor 5%), with regulated third-party access. The Gassled system is
operated by the independent system operator Gassco AS, which is wholly owned by the Norwegian State. See Gas sales and
transportation from the NCS in section 2.9 Corporate for further information.
Equinor is technical service provider (TSP) for the Kårstø and Kollsnes gas processing plants in accordance with the technical service
agreement between Equinor and Gassco AS, included as Exhibit 4(a)(i) to the Form 20-F. Equinor also performs the TSP role for the
majority of the Gassco-operated gas pipeline infrastructure.
In addition, MMP manages Equinor’s ownership in the following pipelines in the Norwegian oil and gas transportation system:
The Grane oil pipeline (Equinor 23.5%), the Kvitebjørn oil pipeline (Equinor 39.6%), the Troll oil pipeline I and II (Equinor 30.6%), the
Edvard Grieg oil pipeline (Equinor 16.6%), the Utsira High gas pipeline (Equinor 24.9%), the Valemon rich gas pipeline (Equinor 66.8
%), the Haltenpipe pipeline (Equinor 19.1%), Norpipe gas pipeline (Equinor 5%), Vestprosess pipeline and processing plant (Equinor
34%) and Mongstad gas pipeline (Equinor 30.6%).
Equinor holds an interest in the Nyhamna gas processing plant (Equinor 30.1%) in Aukra via the Nyhamna Joint Venture. The venture
is operated by Gassco.
The Polarled pipeline (Equinor 37.1%), operated by Gassco, connects fields in the Norwegian Sea with the Nyhamna gas processing
plant.
The Johan Sverdrup pipelines (owned by the Johan Sverdrup licence partners) export oil and gas from the Johan Sverdrup field. The
crude oil is exported from Johan Sverdrup to the Mongstad terminal through a 283 km, 36-inch pipeline. The gas is transported to the
gas processing facility at Kårstø through a 156 km long, 18-inch pipeline with a subsea connection to the Statpipe pipeline.

Equinor, Annual Report on Form 20-F 2021 59
2.7
Renewables (REN)
The Dudgeon offshore windfarm off the east coast of the UK.
Overview
In the first quarter of 2021, Equinor changed its reporting as REN became a separate reporting segment. Previously the activities in
REN were reported in the segment Other. The change has its basis in the increased strategic importance of the renewable business
for Equinor and that the information is regarded useful for the readers of the financial statements.
Equinor aims to be a leader in the energy transition and is building a material position in renewable energy, focusing on offshore wind,
and integrated solutions for onshore renewables.
We are developing as a global offshore wind major, powering European homes with renewable electricity from offshore wind farms in
the UK and Germany and building material clusters in the North Sea, the US East coast and in the Baltic Sea. In parallel, we are
actively positioning ourselves to access emerging markets globally. The core of Equinor’s renewable strategy is creating value from
scale within established clusters and developing growth options in prioritised markets.
Equinor sees potential for floating offshore wind projects in Norway, Europe, the US and Asia and is accelerating the development of
this technology to uphold its leading position. Floating wind is still at an early development phase compared to other renewable energy
sources. However, through technology improvements, increased scale and industrialisation, it represents the next wave of scalable
renewables. Floating wind farms can capture higher winds, are more flexible on location and could be built in areas where there are
few alternatives due to limited onshore or nearshore acreage like outside large coastal cities.
Equinor is also gradually growing its presence in onshore renewables in selected power markets with increasing demand for solar,
wind and storage solutions as integrated parts of the energy system.
Key events in 2021 and early 2022:
60 Equinor, Annual Report on Form 20-F 2021
●
Empire Wind
Beacon
Wind
1.1 billion for the divested portion.
●
Dogger Bank Wind Farm A and B
assets in the UK for a total consideration of GBP 206.4 million (USD 285 million), resulting in a gain of GBP 202.8 million (USD
280 million).
●
Wento
, a Polish onshore renewables developer,
from the private equity firm Enterprise Investors for a cash consideration of EUR 98 million (USD 117 million) after net cash
adjustments.
●
Norway for the
Utsira North
●
operations and maintenance (O&M)
base
offshore wind maintenance port in Poland together with the joint venture partner Polenergia.
●
Guañizuil IIA
solar power plant (Equinor 50%, operated by Scatec) in the Province of San Juan in the northwest of
Argentina started production in July.
●
Océole
, a partnership dedicated to developing floating offshore wind in France.
●
Dogger Bank Wind Farm C
the UK. The transaction closed on 10 February 2022. Further, in December 2021, the owners of the wind farm development,
Equinor and SSE Renewables, announced the financial close (reaching project financing) for Dogger Bank C.
●
cooperate on 3 GW of offshore wind projects in South Korea.
Donghae
and
licence (EBL) from the South Korean authorities in 2021.
●
the United Kingdom focusing on the engineering and project development of utility scale storage and stability services. The
agreement includes the acquisition of a 45% stake in
Noriker
.
●
York State Energy Research and Development Authority (NYSERDA) for
Empire Wind 2
Beacon Wind 1
.
Offshore wind
Assets in production
The
Sheringham Shoal
offshore wind farm (Equinor 40%, operator) located off the coast of Norfolk, UK, has been in operation since
September 2012. The wind farm is in full production with 88 turbines and an installed capacity of 317 megawatts (MW). The wind
farm's annual production is approximately 1.1 terawatt hours (TWh).
The
Dudgeon
offshore wind farm (Equinor 35%, operator) lies in the Greater Wash area off the English east coast, a short distance
from Sheringham Shoal. The wind farm has been in operation since November 2017, with an annual production of approximately 1.7
TWh from 67 turbines. The capital expenditure is financed through project finance. At year-end 2021, Equinor’s share of the project
financing debt for the project amounted to 0.5 billion USD.
The
Hywind Scotland
owned by Equinor. The wind farm is placed at Buchan Deep, approximately 25 km off Peterhead on the east coast of Scotland, UK.
Equinor completed the project during 2017 and has installed five 6 MW turbines. Production is around 0.14 TWh per year.
The
Arkona
and maintenance base is in Port Mukran on the island of Rügen in Mecklenburg-Vorpommern. The wind farm has 60 turbines and a
capacity of 385 MW and has been in full operation from early 2019. The wind farm's annual production is approximately 1.6 TWh.
Projects under development
The
Hywind Tampen
floating offshore wind project is described in section 2.3 Exploration & Production Norway.
The
Dogger Bank
wind farms (Equinor 40%, operated by SSE Renewables during the development phase. Equinor assumes
operatorship when the windfarms come on stream) are three 1,200 MW offshore wind farms, Dogger Bank A, B and C, being
developed 130 km off the coast of Yorkshire, UK. This is the world’s largest offshore wind farm development with a total planned
capacity of 3,600 MW. All three projects have been awarded a Contract for Difference (CfD), a government financial support
mechanism providing the projects a long-term predictable revenue stream. Each project will require a total capital expenditure of
around GBP 3 billion, including the capex for the offshore transmission system. A state-of-the-art Operations and Maintenance (O&M)
Base is under construction in the Port of Tyne.
Equinor, Annual Report on Form 20-F 2021 61
Final investment decision for Dogger Bank A and B was made in 2020. The third project, Dogger Bank C, reached final investment
decision in November 2021. The capital expenditure is partially financed through project finance for all three projects. At year-end
2021, Equinor’s share of the project financing debt for the three projects amounted to 1.2 billion USD. First power is expected in 2023
for Dogger Bank A, 2024 for Dogger Bank B and 2025 for Dogger Bank C. Equinor and SSE have entered into an agreement to sell
10% each in Dogger Bank C to Eni. The transaction closed on 10 February 2022 and Equinor now holds a 40% interest in all three
projects.
Early phase developments
Offshore wind
Equinor is developing the
Empire Wind
(Equinor 50%, operator) and
Beacon Wind
(Equinor 50%, operator) assets off the US east
coast together with bp. The agreement with bp to sell 50% non-operated interests in these assets was closed on 29 January 2021.
The Empire Wind site extends 24-48 km (15-30 miles) southeast of Long Island, spans 324 km
2
depths between 20 and 40 metres (65 and 131 feet). Empire Wind's lease area could have the capacity to produce up to 2,000
megawatts of electricity, enough to power more than 1 million homes. Beacon Wind is located 65 km south of Cape Cod,
Massachusetts, and 110 km east of Long Island, New York, and is large enough to support one or several windfarms with a total
capacity above 2,000 MW.
On 14 January 2022, Equinor and bp announced the finalisation of the Purchase and Sale Agreements (PSAs)
with the New York
State Energy Research and
Development Authority (NYSERDA) for Empire Wind 2 and Beacon Wind 1. Equinor and bp will provide
generation capacity of 1,260 megawatts (MW) renewable offshore wind power from Empire Wind 2, and another 1,230 MW of power
from Beacon Wind 1 – adding to the existing commitment to provide New York with 816 MW of renewable power from Empire Wind 1
– totalling 3.3 gigawatts (GW) of power to the State. Empire Wind 1 is planned to be in operation in the mid 2020’s.
Equinor and partners were awarded an Agreement for Lease to double the capacity of
Dudgeon
(Equinor 35%, operator) and
Sheringham Shoal
(Equinor 40%, operator)
wind farms offshore Norfolk in the UK. The maximum total capacity for the combined
projects will be 719 MW and Equinor is seeking to develop the two projects as a Tandem project. Both extension projects secured a
grid connection and commenced a joint consenting process. The projects are named
Dudgeon extension project
Sheringham
Shoal extension project.
The
Bałtyk I, II
III
are offshore wind development projects
in Poland (Equinor 50%, operator).
Bałtyk II
III
capacity of up to 1,440 MW and will supply more than 2 million households with electricity. They are located between 27 and 40
kilometres from shore in water depths of 20-40 meters. The final investment decisions are subject to obtaining necessary permits. The
Bałtyk I
project is located around 80 km from the shore on the border of the Polish exclusive economic zone and will have a capacity
of up to 1,560 MW. It holds location permits and grid connection conditions from the transmission system operator. During 2021,
Equinor and Polenergia’s Bałtyk II and Bałtyk III projects were awarded contracts for difference (CfD) under the first phase of Poland’s
offshore wind development scheme.
Onshore renewables
Assets in production
The
Apodi
with an installed capacity of 162 MW, started commercial operations in November 2018. The capital expenditure is financed through
project financing.
The
Guanizul
2A
operations in July 2021 and has an installed capacity of 117 MW.
As of end 2021, Equinor ASA owns 20,776,200 shares in
Scatec ASA
, corresponding to 13.12% of the total shares and voting power
in an integrated independent solar power producer. This financial investment is included in the Other Group reporting segment.

62 Equinor, Annual Report on Form 20-F 2021
Early phase development and project development
In 2021, Equinor acquired the Polish onshore renewables developer Wento, providing a strong platform for growth in onshore
renewables in the country. Wento develops and sells renewable energy projects. Two solar PV plant projects are currently under
construction in Poland (120 MW) and commercial operations expected in 2022/2023.
In 2021, Equinor also acquired a 45% stake in Noriker Power Limited, a leading battery storage developer in the United Kingdom
focusing on the engineering and project development of utility scale storage and stability services.
Guanizul 2A solar plant in San Juan, Argentina.
Equinor, Annual Report on Form 20-F 2021 63
2.8
Other group
Overview
The Other reporting segment includes activities in Projects, Drilling and Procurement (PDP), the business area Technology, Digital &
Innovation (TDI) and corporate staffs and support functions. In addition, IFRS 16 lease contracts are presented within the Other
segment.
From the first quarter of 2021, REN (NES) is a separate reporting segment.
Effective 1 June 2021, Equinor made changes to the corporate structure. NES has been renamed to Renewables (REN) and
continues as a business area, aiming to accelerate profitable growth within renewables. Research & Technology is part of the new
business area Technology, Digital & Innovation, while Projects, Drilling & Procurement (PDP) make up another business area. Global
Strategy & Business Development (GSB) is no longer a separate business area, and its tasks are covered by other corporate units.
Corporate staffs and support functions
Corporate staffs and support functions comprise the non-operating activities supporting Equinor, and include head office and central
functions that provide business support such as finance and control, corporate communication, safety, audit, legal services and
people and leadership.
Effective 1 June 2021, the corporate finance organisation includes units for strategy, mergers and acquisitions and business
development. Safety, security and sustainability has been established as a new functional area.
Technology, Digital & Innovation (TDI)
Intending to strengthen the development of technologies, digital solutions and innovation, Equinor has gathered the activities in a new
business area, Technology, Digital & Innovation (TDI) since June 2021. Technology development is part of the new TDI.
TDI brings together research, technology development, specialist advisory services, digitisation, IT, improvement, innovation, ventures
and future business to one technology powerhouse. TDI is accountable for safe and efficient development and operation of their
assets; and for providing expertise, projects and products across the company.
64 Equinor, Annual Report on Form 20-F 2021
Digital twin being used in daily operations of Johan Sverdrup.
Projects, Drilling and Procurement (PDP)
The Projects, Drilling and Procurement business area is responsible for field development, well deliveries and procurement in Equinor.
Project development
decommissioning projects where Equinor is the operator.
Drilling and well
for US onshore).
Procurement and supplier relations
with our extensive portfolio of suppliers.
Equinor, Annual Report on Form 20-F 2021 65
2.9
Corporate
Applicable laws and regulations
Equinor operates in around 30 countries and is exposed and committed to compliance with numerous laws and regulations globally.
This section gives a general description on the legal and regulatory framework in the various jurisdictions where Equinor operates and
in particular in the countries of Equinor’s core activities.
For further information about the jurisdictions in which Equinor operates, see sections 2.2 Business overview and 2.13 Risk review.
Further, see chapter 3 Governance for information about the domicile and legal form of Equinor, including the current articles of
association, information on listing on the Oslo Børs and New York Stock Exchange (NYSE) and corporate governance.
Regulatory framework for upstream oil and gas operations
Currently, Equinor is subject to two main regimes applicable to petroleum activities worldwide:
●
●
Equinor is also subject to a wide variety of health, safety and environmental (HSE) laws and regulations concerning its products,
operations and activities. Relevant laws and regulations include jurisdiction specific laws and regulations, international regulations,
conventions or treaties, as well as EU directives and regulations.
Concession regimes
Under a concession regime, companies are granted licences by the government to extract petroleum. This is similar to the Norwegian
system described below. Typically, the licensees are offered to pre-qualified companies following bidding rounds. The criteria for the
evaluation of bidding offers under these regimes can be the level of offered signature bonus (bid amount), minimum exploration
programme, and local content. In exchange for those commitments, the successful bidder(s) receive a right to explore, develop and
produce petroleum within a specified geographical area for a limited period of time. The terms of the licences are usually not
negotiable. The fiscal regime may entitle the relevant jurisdiction to royalties, profit tax or special petroleum tax.
PSA regimes
PSAs are normally awarded to the contractor parties after bidding rounds announced by the government. Main bid parameters are a
minimum exploration programme and signature bonuses, and allocation of profit oil and tax may also be a bid parameter.
Under a PSA, the host government typically retains the right to the hydrocarbons in place. The contractor receives a share of the
production for services performed. Normally, the contractor carries the exploration and development costs and risk prior to a
commercial discovery and is then entitled to recover those costs during the production phase. The remaining share of the production -
the profit share, is split between the government and the contractor according to a mechanism set out in the PSA. The contractor is
usually subject to income tax on its own share of the profit oil. Fiscal provisions in a PSA are to a large extent negotiable and are
unique to each PSA.
Norway
The principal laws governing Equinor’s petroleum activities in Norway and on the NCS are the Norwegian Petroleum Act of 29
November 1996 (the Petroleum Act) and the regulations issued thereunder, and the Norwegian Petroleum Taxation Act of 13 June
1975 (the Petroleum Taxation Act).
Norway is not a member of the European Union (EU) but is a member of the European Free Trade Association (EFTA). The EU and
the EFTA Member States have entered into the Agreement on the European Economic Area, referred to as the EEA Agreement,
which provides for the inclusion of EU legislation in the national law of the EFTA Member States (except Switzerland). Equinor’s
business activities are subject to both the EFTA Convention and EU laws and regulations adopted pursuant to the EEA Agreement.
Under the Petroleum Act, the Norwegian Ministry of Petroleum and Energy (MPE) is responsible for resource management and for
administering petroleum activities on the NCS. The main task of the MPE is to ensure that petroleum activities are conducted in
accordance with the applicable legislation, the policies adopted by the Norwegian Parliament (the Storting) and relevant decisions of
the Norwegian State.
66 Equinor, Annual Report on Form 20-F 2021
The Storting’s role in relation to major policy issues in the petroleum sector can affect Equinor in two ways: first, when the Norwegian
State acts in its capacity as majority owner of Equinor shares and, second, when the Norwegian State acts in its capacity as regulator:
●
normally decide how the Norwegian State will vote on proposals submitted to general meetings of the shareholders. However, in
certain exceptional cases, it may be necessary for the Norwegian State to seek approval from the Storting before voting on a
certain proposal. This will normally be the case if Equinor issues additional shares and such issuance would significantly dilute
the Norwegian State’s holding, or if such issuance would require a capital contribution from the Norwegian State in excess of
government mandates. A vote by the Norwegian State against an Equinor proposal to issue additional shares would prevent
Equinor from raising additional capital in this manner and could adversely affect Equinor’s ability to pursue business
opportunities. For more information about the Norwegian State’s ownership, see Risks related to state ownership in section 2.13
Risk review, chapter 3 Governance, and Major shareholders in section 5.1 Shareholder information.
●
the NCS. As part of its business, Equinor or the partnerships to which Equinor is a party, frequently need to apply for licences
and other approvals from the Norwegian State. Although Equinor is majority-owned by the Norwegian State, it does not receive
preferential treatment with respect to licences granted by or under any other regulatory rules enforced by the Norwegian State.
The Petroleum Act sets out the principle that the Norwegian State is the owner of all subsea petroleum on the NCS, that exclusive
right to resource management is vested in the Norwegian State and that the Norwegian State alone is authorised to award licences for
petroleum activities as well as determine their terms. Licensees are required to submit a plan for development and operation (PDO) to
the MPE for approval. For fields of a certain size, the Storting has to accept the PDO before it is formally approved by the MPE.
Equinor is dependent on the Norwegian State for approval of its NCS exploration and development projects and its applications for
production rates for individual fields.
Production licences are the most important type of licence awarded under the Petroleum Act. A production licence grants the holder
an exclusive right to explore for and produce petroleum within a specified geographical area. The licensees become the owners of the
petroleum produced from the field covered by the licence. Production licences are normally awarded for an initial exploration period,
which is typically six years, but which can be shorter. The maximum period is ten years. During this exploration period, the licensees
must meet a specified work obligation set out in the licence. If the licensees fulfil the obligations set out in the initial licence period,
they are entitled to require that the licence be extended for a period specified at the time when the licence is awarded, typically 30
years.
The terms of the production licences are decided by the MPE. Production licences are awarded to group of companies forming a joint
venture at the MPE’s discretion. The members of the joint venture are jointly and severally liable to the Norwegian State for obligations
arising from petroleum operations carried out under the licence. The MPE decides the form of the joint operating agreements and
accounting agreements.
The governing body of the joint venture is the management committee. In licences awarded since 1996 where the State’s direct
financial interest (SDFI) holds an interest, the Norwegian State, acting through Petoro AS, may veto decisions made by the joint
venture management committee, which, in the opinion of the Norwegian State, would not be in compliance with the obligations set
forth in the licence with respect to the Norwegian State’s exploitation policies or financial interests. This power of veto has never been
used.
Interests in production licences may be transferred directly or indirectly subject to the consent of the MPE and the approval of the
Ministry of Finance of the tax treatment. In most licences, there are no pre-emption rights in favour of the other licensees. However,
the SDFI, or the Norwegian State, as appropriate, still hold pre-emption rights in all licences.
The day-to-day management of a field is the responsibility of an operator appointed by the MPE. The operator is in practice always a
member of the joint venture holding the production licence, although this is not legally required. The terms of engagement of the
operator are set out in the joint operating agreement.
If important public interests are at stake, the Norwegian State may instruct the operators on the NCS to reduce the production of
petroleum. An example of this occurred in 2020, when the Norwegian State in May imposed a reduction in oil production for the rest of
the year, due to the Covid-19 pandemic that led to a lower demand for oil and gas. The reduction in production was distributed
between all fields on a pro rata basis.
A licence from the MPE is also required in order to establish facilities for the transportation and utilisation of petroleum. Ownership of
most facilities for the transportation and utilisation of petroleum in Norway and on the NCS is organised in the form of joint ventures.
The participants’ agreements are similar to joint operating agreements for production.
Licensees are required to prepare a decommissioning plan before a production licence or a licence to establish and use facilities for
the transportation and utilisation of petroleum expires or is relinquished, or the use of a facility ceases. On the basis of the
decommissioning plan, the MPE makes a decision as to the disposal of the facilities.
Equinor, Annual Report on Form 20-F 2021 67
For an overview of Equinor’s activities and shares in Equinor’s production licences on the NCS, see section 2.3 E&P Norway.
Gas sales and transportation from the NCS
Equinor markets gas from the NCS on its own behalf and on the Norwegian State’s behalf. Dry gas is mainly transported through the
Norwegian gas transport system (Gassled) to customers in the UK and mainland Europe, while liquified natural gas is transported by
vessels to worldwide destinations.
The Norwegian gas transport system, consisting of the pipelines and terminals through which licensees on the NCS transport their
gas, is owned by a joint venture called Gassled. The Norwegian Petroleum Act of 29 November 1996 and the pertaining Petroleum
Regulation establish the basis for non- discriminatory third-party access to the Gassled transport system.
The tariffs for the use of capacity in the transport system are determined by applying a formula set out in separate tariff regulations
stipulated by the MPE. The tariffs are paid for booked capacity rather than the volumes actually transported.
For further information, see section 2.6 Marketing, Midstream & Processing (MMP).
The Norwegian State's participation
In 1985, the Norwegian State established the State’s direct financial interest (SDFI) through which the Norwegian State has direct
participating interests in licences and petroleum facilities on the NCS. As a result, the Norwegian State holds interests in a number of
licences and petroleum facilities in which Equinor also holds interests. Petoro AS, a company wholly owned by the Norwegian State,
was formed in 2001 to manage the SDFI assets.
The Norwegian State has a coordinated ownership strategy aimed at maximising the aggregate value of its ownership interests in
Equinor and the Norwegian State’s oil and gas. This is reflected in the Owner’s Instruction described below, which contains a general
requirement that, Equinor, in its activities on the NCS, take account of these ownership interests in decisions that may affect the
execution of this marketing arrangement.
SDFI oil and gas marketing and sale
Equinor markets and sells the Norwegian State’s oil and gas together with Equinor’s own production. The arrangement has been
implemented by the Norwegian State through a separate instruction (the Owner’s Instruction) adopted by an extraordinary
shareholder meeting in 2001, with the Norwegian State as sole shareholder at the time. The Owner’s Instruction sets out the specific
terms for the marketing and sale of the Norwegian State’s oil and gas.
Equinor is obliged under the Owner’s Instruction to jointly market and sell the Norwegian State’s oil and gas as well as Equinor’s own
oil and gas. The overall objective of the marketing arrangement is to obtain the highest possible total value for Equinor’s oil and gas
and the Norwegian State’s oil and gas, and to ensure an equitable distribution of the total value creation between the Norwegian State
and Equinor.
The Norwegian State may at any time utilise its position as majority shareholder of Equinor to withdraw or amend the Owner’s
Instruction.
US
Petroleum activities in the US are extensively regulated by multiple agencies in the US federal government, and by tribal, state and
local regulation. The US government directly regulates development of hydrocarbons on federal lands, in the US Gulf of Mexico, and
in other offshore areas. Different federal agencies directly regulate portions of the industry, and other general regulations related to
environmental, safety, and physical controls apply to all aspects of the industry. In addition to regulation by the US federal
government, any activities on US tribal lands (indigenous persons’ semi-sovereign territory) are regulated by governments and
agencies in those areas. Significantly for Equinor’s US onshore interests, each individual state has its own regulations of all aspects of
hydrocarbon development within its borders. A recent trend also includes local municipalities adopting their own hydrocarbon
regulations.
In the US, hydrocarbon interests are considered a private property right. In areas owned by the US government, that means that the
government owns the minerals in its capacity as landowner. The federal government, and each tribal and state government,
establishes the terms of its own leases, including the length of time of the lease, the royalty rate, and other terms. The vast majority of
onshore minerals, including hydrocarbons, in every state in which Equinor has onshore interests, belong to private individuals.
In order to explore for or develop hydrocarbons, a company must enter into a lease agreement from the applicable governmental
agency for federal, state or tribal land, and for private lands, from each owner of the minerals the company wishes to develop. In each
lease, the lessor retains a royalty interest in the production (if any) from the leased area. The lessee owns a working interest and has
the right to explore and produce oil and gas. The lessee incurs all the costs and liabilities but will share only the portion of the revenue
that is net of costs and expenses and not reserved to the lessor through its royalty interest.
Leases typically have a primary term for a specified number of years (from one to ten years) and a conditional secondary term that is
tied to the production life of the properties. If oil and gas is being produced in paying quantities at the end of the primary term, or the
68 Equinor, Annual Report on Form 20-F 2021
operator satisfies other obligations specified in the agreement, the lease typically continues beyond the primary term (Held by
Production). Leases typically involve paying the lessor both a signing bonus based on the number of leased acres and a royalty
payment based on the production.
Each state has its own agencies that regulate the development, exploration, and production of oil and gas activities. These state
agencies issue drilling permits and control pipeline transportation within state boundaries. The state agencies particularly relevant to
Equinor’s US onshore activities include: (a) Pennsylvania Department of Environmental Protection’s Office of Oil and Gas
Management, (b) Ohio Department of Natural Resources, Division of Oil and Gas, and (c) West Virginia Department of Environmental
Protection. In addition, some state utility departments handle pipeline transportation within state boundaries, and each state also has
its own department regulating environmental, health, and safety issues arising from oil and gas operations.
Brazil
In Brazil, licences are mainly awarded according to a concession regime or a production sharing regime (the latter specifically for
areas within the pre-salt polygon area or strategic areas) by the Federal Government. All state-owned and private oil companies may
participate in the bidding rounds provided they follow the bidding rules and meet the qualification criteria. The tender protocol issued
for each bidding round contains the draft of the concession agreement or the production sharing agreement that the winners must
adhere to without the possibility of negotiating its terms, i.e., all the agreements signed under a certain bidding round contain the
same general provisions and only differ in the particular items presented in the offers. There is no restriction on foreign participation,
provided that the foreign investor incorporates a company under the Brazilian law for signing the agreement and complies with the
requirements established by the Brazilian National Agency of Petroleum, Natural Gas and Biofuels (ANP).
The current criteria for the evaluation of bidding offers under the concession regime are: (a) signature bonus; and (b) minimum
exploration program. However, in past bidding rounds the participants also had to offer a local content percentage as a firm
commitment. Companies can bid individually or in consortium always observing the qualification criteria for operator and non-
operators.
The concession agreements are signed by ANP on behalf of the Federal Government. Generally, concessions are granted for a total
period of 35 years and typically the exploration phase lasts from two to eight years, while the production phase may last 27 years from
the declaration of commerciality. Concessionaires are entitled to request the extension of each of these phases, subject to ANP
approval.
In bidding rounds involving the production sharing regime, the law grants to the Brazilian government-controlled company Petroleo
Brasileiro S.A. – Petrobras, a right of preference to be the sole operator in the pre-salt fields with a minimum 30% of participating
interest. If this right is exercised, Petrobras may still participate in the bidding round and present offers for the remaining 70% under
the same conditions applicable to other participants. Likewise, in the concession bidding rounds, companies may bid individually or
together with other companies. The winners are required to form a consortium with Pre-Sal Petroleo S.A. (PPSA), a Brazilian state-
owned company, which is responsible for managing the production sharing agreement and selling the production allocated to the
Government under the profit oil. PPSA appoints 50% of the members of the operating committee, including the chairperson, in
addition to certain veto rights and casting vote.
The current criteria for the evaluation of bidding offers under the production sharing regime is the offered percentage of profit oil. The
winner will be the company which offers the highest percentage to the government in accordance with the technical and economic
parameters established for each block in the tender documents under a certain bidding round.
Production sharing contracts are signed by the Ministry of Mines and Energy on behalf of the Federal Government. Generally, the
contracts are valid for a period of 35 years which, in accordance with the law, cannot be extended. Of the two phases of the contract –
exploration and production – the exploration phase can be extended provided that the total period of the contract remains as 35 years.
In order to perform the exploration and exploitation of oil and gas reserves, the companies must obtain an environmental license
granted by the Brazilian Institute of Environment and Renewable Natural Resources (IBAMA), which, together with ANP, is
responsible for the safety and environmental regulations regarding upstream activities.
HSE regulation relevant for the Norwegian upstream oil and gas activities in Norway
Equinor’s oil and gas operations in Norway must be conducted in compliance with a reasonable standard of care, taking into
consideration the safety of workers, the environment and the economic values represented by installations and vessels. The
Petroleum Act specifically requires that petroleum operations be carried out in such a manner that a high level of safety is maintained
and developed in step with technological developments. Equinor is also required at all times to have a plan to deal with emergency
situations in Equinor’s petroleum operations. During an emergency, the Norwegian Ministry of Labour and Social Inclusion/Norwegian
Ministry of Transport/Norwegian Coastal Administration may decide that other parties should provide the necessary resources, or
otherwise adopt measures to obtain the necessary resources, to deal with the emergency for the licensees’ account.
Equinor, Annual Report on Form 20-F 2021 69
Liability for pollution damage
The Norwegian Petroleum Act imposes strict liability for pollution damage regardless of fault. Accordingly, as a holder of licences on
the NCS, Equinor is subject to statutory strict liability under the Petroleum Act as a result of pollution caused by spills or discharges of
petroleum from petroleum facilities in any of Equinor’s licences.
A claim against the license holders for compensation relating to pollution damage shall initially be directed to the operator, which in
accordance with the terms of the joint operating agreement, will distribute the claim to the other licensees in accordance with their
participating interest in the licences.
Discharge permits
Emissions and discharges from Norwegian petroleum activities are regulated through several acts, including the Petroleum Act, the
CO
2
chemicals in relation to exploration, development and production of oil and natural gas are regulated under the Pollution Control Act.
In accordance with the provisions of this Act, an operator must apply for a discharge permit from relevant authorities on behalf of the
licence group in order to discharge any pollutants into water. Further, the Petroleum Act states that burning of gas in flares beyond
what is necessary for safety reasons to ensure normal operations is not permitted without approval from the MPE. All operators on the
NSC have an obligation, and are responsible, for establishing sufficient procedures for the monitoring and reporting of any discharge
into the sea. The Environment Agency, the Norwegian Petroleum Directorate and the Norwegian Oil Industry Association have
established a joint database for reporting emissions to air and discharges to sea from the petroleum activities, the Environmental Web
(EW). All operators on the NCS report emission and discharge data directly into the database.
Regulations on reduction of carbon emissions and CO
2
Equinor’s operations in Norway are subject to emissions taxes as well as emissions allowances granted for Equinor’s larger European
operations under the emissions trading scheme. The agreed strengthening of the EU’s emission trading scheme may result in a
significant reduction in the total emissions from relevant energy and industry installations, which include Equinor’s installations at the
NCS. The price of emissions allowances has increased significantly and is expected to increase further towards 2030.
The Norwegian Climate Act promotes the implementation of Norway's climate targets as part of the transition to a low-emission
society in Norway in 2050. This act may influence our activities through plans and actions implemented to achieve these targets and
reference is made to the Climate Plan 2021-2030 launched 8 January 2021 by the Norwegian Government for achievement of at least
50% and towards 55% reduction in GHG emissions in 2030 compared to 1990 levels. The plan states that the carbon cost for offshore
oil & gas production in Norway will increase to 2000 NOK/t CO
2
The EU directive 2009/31/EU on storage of CO
2
adopted under the Petroleum Act. The CO
2
Lights project are governed by these regulations. More storage locations are currently being applied for.
HSE regulation of upstream oil and gas activities in the US
Equinor’s upstream activities in the US are heavily regulated at multiple levels, including federal, state, and local municipal regulation.
Equinor is subject to those regulations as a part of its activities in the US onshore (including Equinor’s assets in Ohio, Pennsylvania
and West Virginia), and activities in the US Gulf of Mexico.
The National Environmental Policy Act of 1969 is an umbrella procedural statute that requires federal agencies to consider the
environmental impacts of their actions. Several substantive US federal statutes specifically cover certain potential environmental
effects of hydrocarbon extraction activities. Those include: the Clean Air Act, which regulates air quality and emissions; the Federal
Water Pollution Control Act (commonly known as the Clean Water Act), which regulates water quality and discharges; the Safe
Drinking Water Act, which establishes drinking water standards for tap water and underground injection rules; the Resource
Conservation and Recovery Act of 1976, which regulates hazardous and solid waste management; the Comprehensive Environmental
Response, Compensation and Liability Act of 1980, which addresses remediation of legacy disposal sites and release reporting; and
the Oil Pollution Act, which provides for oil spill prevention and response.
Other US federal statutes are resource-specific. The Endangered Species Act of 1973 protects listed endangered and threatened
species and critical habitat. Other statutes protect certain species, including the Migratory Bird Treaty Act, the Bald and Golden Eagle
Protection Act and the Marine Mammal Protection Act of 1972. Other statutes govern natural resource planning and development on
federal lands onshore and on the Outer Continental Shelf, including: the Mineral Leasing Act; the Outer Continental Shelf Lands Act;
the Federal Land Policy and Management Act of 1976; the Mining Law of 1872; the National Forest Management Act of 1976; the
National Park Service Organic Act; the Wild and Scenic Rivers Act; the National Wildlife Refuge System Administration Act of 1966;
the Rivers and Harbors Appropriation Act; and the Coastal Zone Management Act of 1972.
The federal government regulates offshore exploration and production for the Outer Continental Shelf (OCS), which extends from the
edge of state waters (either 3 or 9 nautical miles from the coast, depending on the state) out to the edge of national jurisdiction, 200
nautical miles from shore. The Bureau of Ocean Energy Management (BOEM) manages federal OCS leasing programs, conducts
resource assessments, and licences seismic surveys. The Bureau of Safety and Environmental Enforcement (BSEE) regulates all
70 Equinor, Annual Report on Form 20-F 2021
OCS oil and gas drilling and production. The Office of Natural Resources Revenue (ONRR) collects and disburses rents and royalties
from offshore and onshore federal and Native American lands.
Additional federal statutes cover certain products or wastes, and focus on human health and safety: the Toxic Substances Control Act
regulates new and existing chemicals and products that contain these chemicals; the Hazardous Materials Transportation Act
regulates transportation of hazardous materials; the Occupational Safety and Health Act of 1970 regulates hazards in the workplace;
the Emergency Planning and Community Right-to-Know Act of 1986 provides emergency planning and notification for hazardous and
toxic chemicals.
The federal and state governments share authority to administer some federal environmental programs (e.g., the Clean Air Act and
Clean Water Act). States also have their own, sometimes more stringent, environmental laws. Counties, cities and other local
government entities may have their own requirements as well.
Equinor continually monitors regulatory and legislative changes at all levels and engages in the stakeholder process through trade
associations and direct comments to suggested regulatory and legislative regimes, to ensure that its operations remain in compliance
with all applicable laws and regulations. In particular, BSEE drilling and production regulations were extensively revised in response to
the 2010 Deepwater Horizon blowout and oil spill. The revised regulatory regime includes requirements for enhanced well design,
improved blowout preventer design, testing and maintenance, and an increased number of trained inspectors. The Biden
Administration is expected to review and revise these regulations, and Equinor is engaged with relevant governmental and industry
stakeholders to ensure that Equinor’s operations remain in compliance.
HSE regulation of upstream oil and gas activities in Brazil
Equinor’s oil and gas operations in Brazil must be conducted in compliance with a reasonable standard of care, taking into
consideration the safety and health of workers and the environment. The Brazilian Petroleum Law (Law No. 9,478/97) describes the
government’s policy objectives for the rational use of the country’s energy resources, including the protection of the environment. In
addition to the Petroleum Law, Equinor is also subject to many other laws and regulations issued by different authorities, including
ANP, IBAMA, Federal Environmental Council (CONAMA) and Brazilian Navy. All those authorities have the power to impose fines in
case of non-compliance with the respective rules. The concession and production sharing contracts also impose obligations on
operators and consortium members, who are jointly and severally liable. They must, at their own account and risk, assume and fully
respond to all losses and damages caused directly or indirectly by the applicable consortium’s operations and their performance
irrespective of fault, to the ANP, the Federal Government and third parties.
The exploration, drilling and production of oil and gas depend on environmental licences which define the conditions for the
implementation of the project and compliance measures to mitigate and control environment impact. Equinor is subject to fines and
even licence suspension and/or cancellation in case of non-compliance with such conditions.
In Brazil, Equinor is also required to have an emergency response system as per ANP Ordinance 44/2009 to deal with emergency
situations in its petroleum operations, as well as an oil spill response plan for each asset to minimise the environmental impact of any
environmental unexpected situation that may generate spill of oil or chemical to sea.
Discharge permits
Discharges from Brazilian petroleum activities are regulated through several acts, including the CONAMA Resolution 393/2007 for
produced water, CONAMA Resolution No. 357/2005 and CONAMA Resolution No. 430/2011 for effluents (sewage, etc) and IBAMA
technical instructions for drilling waste. According to Environmental Ministry Ordinance No. 422/2011, the discharge of chemicals in
connection with exploration, development and production of oil and natural gas is assessed as part of the permitting process and the
operator must apply for any discharge permit from relevant authorities on behalf of the licence group in order to discharge any
pollutants into the water.
Regulations on reduction of carbon emissions
Although Equinor’s operations in Brazil are not subject to emissions taxes (CO
2
congress for the establishment of a carbon market. At this point it is unclear if and when these initiatives will be turned into law.
The CONAMA Regulation No. 382/06 regulates air emissions limits for pollutant gases (e.g. NOx) from all fixed sources that have total
power consumption higher than 100MW.
Gas flares must be authorised by the ANP under ANP Resolution No. 806/2020, which also sets out cases in which ANP authorisation
is not necessary.
The Brazilian government signed the Paris Agreement in 2015. During COP26, Brazil updated its ambition to reduce its greenhouse
gas emissions by 37% until 2025 and 50% until 2030, compared to 2005 levels. Because of the desire to boost the economy and an
expected growing energy demand, the focus on emissions reduction is on improved control of Forests and Land Use and for that
Brazil continue to adhere to the Forest for Deal agreement, committing to take actions to reduce illegal deforestation until 2030. The
country also adheres to the Global Methane Pledge.
Equinor, Annual Report on Form 20-F 2021 71
To meet the growing energy demand challenge, the Brazilian government has indicated acceptance for an increase in total emissions
in the short term from the industrial and power generation sectors, although the efficiency in power generation and usage will certainly
be an important part of the Brazilian government’s future approach to the issue.
Regulatory framework for renewable energy operations
Equinor’s renewables positions currently mainly consist of offshore wind farms in operation and development in the UK, the state of
New York and Poland. In these jurisdictions the legislation is structured around a lease where permission to develop is granted
following a series of approvals relating largely to environmental and social impact assessments. The government separately auctions
a subsidized power purchase price either through renewable offtake certificates or contracts for difference. In both cases, Equinor and
its partners take the risk for developing, constructing and operating the wind farms within a fixed timeframe.
Norwegian continental shelf.
72 Equinor, Annual Report on Form 20-F 2021
Taxation of Equinor
Norway
Equinor’s profits, both from offshore oil and natural gas activities and from onshore activities, are subject to Norwegian corporate
income tax. The standard corporate income tax rate is 22%. In addition, a special petroleum tax is levied on profits from petroleum
production and pipeline transportation on the NCS. The special petroleum tax rate is 56%. The special petroleum tax rate is applied to
relevant income in addition to the standard income tax rate, resulting in a 78% marginal tax rate. For further information, see note 10
Income taxes to the Consolidated financial statements.
In June 2020, the Norwegian Parliament enacted temporary targeted changes to Norway’s petroleum tax system for investments
incurred in 2020 and 2021 and beyond 2021 for certain projects. The changes were effective from 1 January 2020 and provide
companies with an immediate tax deduction in the special petroleum tax (56% rate) instead of tax depreciation over six years. In
addition, the tax uplift, which has been increased from 20.8% to 24%, will be allowed in the first year instead of over four years. Tax
depreciation towards the corporate tax rate (22% tax rate) will continue to be over six years. See also note 10 Income taxes to the
Consolidated financial statements.
On 3 September 2021, the Norwegian Ministry of Finance circulated a consultation paper for a cashflow-based petroleum tax system
for the special tax of 56%. The combined tax rate of 78% is maintained and the temporary 2020-rules are upheld for qualified future
investments. Investments that are not covered by the temporary 2020-rules will be 100% deductible in the special tax base, but with
no right for uplift. The corporate tax of 22% is deductible in the special tax base and the special tax rate is increased to 71.8% to
maintain the marginal tax rate of 78%. Tax treatment of future investment costs in the ordinary tax base (22%) will continue to be
depreciated over six years. The new rules are proposed to be implemented from 1 January 2022. The deadline for consultation on the
proposal was 3 December 2021 and the new Government, which has expressed support to the main content of the proposal, will now
draft a bill to the parliament (Storting).
Equinor’s international petroleum activities are subject to tax pursuant to local legislation.
US
Equinor’s operations in the US are subject generally to corporate income, severance and production, ad valorem and transaction
taxes levied by the federal, state and local tax authorities, and to royalties payable to federal, state and local authorities and, in some
cases, private landowners. The federal corporate income tax rate in the US is 21%. The current administration is proposing several
major legislative changes to the US tax code, including the imposition of a 15% minimum tax on corporate book income for
corporations with profits over USD 1 billion, effective for tax years beginning after 31 December 2022.
Brazil
Regardless of the applicable regime for oil and gas activities, corporate income tax and social contribution are levied on taxable
income at a combined rate of 34%. A simplified tax regime with a lower effective tax rate is available for activities with gross revenues
below a threshold of 78 million Brazilian reais per year. In addition, there are several indirect taxes but exports are exempt. There is a
Bill of Law aiming to establish a tax on export of crude oil expected to be voted in 2022.
Imports of assets are subject to several customs duties, but a special regime is available for certain assets used in the oil and gas
activities allowing suspension of the federal duties and reduction of state duties.
The concession regime usually includes a 10% royalty, and special participation tax that varies based on time, location and production
between 10% and 40%. PSA regime usually includes a 15% royalty, an annual 80% cost recovery ceiling, and a biddable government
profit share.
Equinor, Annual Report on Form 20-F 2021 73
Subsidiaries and properties
Significant subsidiaries
The following table shows significant subsidiaries and significant equity accounted companies within the Equinor group as of
31 December 2021.
Significant subsidiaries and significant equity accounted
companies
Name
in %
Country of
incorporation
Name
in %
Country of
incorporation
Danske Commodities A/S
100
Denmark
Equinor Natural Gas LLC
100
USA
Equinor Angola Block 15 AS
100
Norway
Equinor New Energy AS
100
Norway
Equinor Angola Block 17 AS
100
Norway
Equinor Nigeria Energy Company Ltd.
100
Nigeria
Equinor Angola Block 31 AS
100
Norway
Equinor Refining Norway AS
100
Norway
Equinor Apsheron AS
100
Norway
Equinor Russia AS
1
100
Norway
Equinor Argentina AS
100
Norway
Equinor Russia Holding AS
1
100
Norway
Equinor Brasil Energia Ltda.
100
Brazil
Equinor UK Ltd. (Group)
100
United Kingdom
Equinor BTC (Group)
100
Norway
Equinor US Holding Inc. (Group)
100
USA
Equinor Canada Ltd. (Group)
100
Canada
Equinor Ventures AS
100
Norway
Equinor Danmark (Group)
100
Denmark
Equinor Wind US LLC
100
USA
Equinor Dezassete AS
100
Norway
Statholding AS (Group)
100
Norway
Equinor Energy AS
100
Norway
Statoil Kharyaga AS
1
100
Norway
Equinor Energy do Brasil Ltda.
100
Brazil
Equinor Wind Power AS
100
Norway
Equinor Energy International AS
100
Norway
AngaraOil LLC
1, 2
49
Russia
Equinor Energy Ireland Ltd.
100
Ireland
AWE-Arkona-Windpark Entwicklungs-
GmbH
2
25
Germany
Equinor Holding Netherlands BV
100
Netherlands
Bandurria Sur Investment SA
2
50
Argentina
Equinor In Amenas AS
100
Norway
Hywind (Scotland) Ltd.
2
75
United Kingdom
Equinor In Salah AS
100
Norway
SCIRA Offshore Energy Ltd.
2
40
United Kingdom
Equinor Insurance AS
100
Norway
SevKomNeftegas LLC
2
33
Russia
Equinor International Netherlands BV
100
Netherlands
1) In February 2022, Equinor announced its intention to exit its business activities in Russia. See note 27 Subsequent events to the consolidated
financial statements.
2) Equity accounted entities.
Property, plants and equipment
Equinor has interests in real estate in many countries throughout the world. However, no individual property is significant.
The largest
office buildings are the
Equinor's head office located at Forusbeen 50, NO-4035, Stavanger, Norway which comprises approximately
135,000 square meters of office space, and the 65,500 square metre office building located at Fornebu on the outskirts of Norway's
capital, Oslo. Both office buildings are leased.
For a description of significant reserves and sources of oil and natural gas, see Proved oil and gas reserves in section 2.10
Operational performance and section 4.2 Supplementary oil and gas information (unaudited) later in this report. For a description of
operational refineries, terminals and processing plants, see section 2.6 Marketing, Midstream & Processing (MMP).
For more information, see note 11 Property, plant and equipment to the Consolidated financial statements.
Related party transactions
See note 25 Related parties to the Consolidated financial statements. See also chapter 3 Governance in section 3.4 Equal treatment
of shareholders and transactions with close associates.
74 Equinor, Annual Report on Form 20-F 2021
Insurance
Equinor maintains insurance coverage that includes coverage for physical damage to its properties, third-party liability, workers'
compensation and employers' liability, general liability, sudden pollution and other coverage. See also section 2.13 Risk review under
Risk factors.
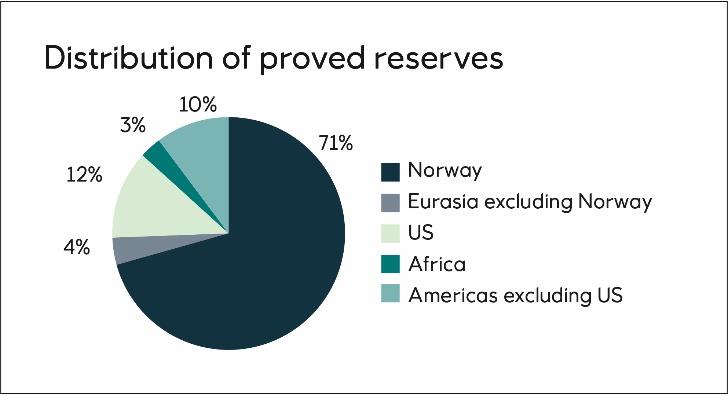
Equinor, Annual Report on Form 20-F 2021 75
2.10
Operational performance
Proved oil and gas reserves
Proved oil and gas reserves were estimated to be 5,356 million boe at year end 2021, compared to 5,260 million boe at the end of
2020.
Changes in proved reserves estimates are most commonly the result of revisions of estimates due to observed production
performance or changes in prices or costs, extensions of proved areas through drilling activities or the inclusion of proved reserves in
new discoveries through the sanctioning of new development projects. These are the result of continuous business processes and
can be expected to continue to add reserves in the future.
Proved reserves can also be added or subtracted through the acquisition or divestment of assets or due to other factors outside
management control.
Changes in oil and gas prices can affect the quantities of oil and gas that can be recovered from the accumulations. Higher oil and
gas prices will normally allow more oil and gas to be recovered, while lower prices will normally result in reductions. However, for
fields with PSAs and similar contracts, increased prices may result in lower entitlement to produced volumes and lower prices may
increase entitlement to produced volumes. These described changes are included in the revisions category.
The principles for booking proved gas reserves are limited to contracted gas sales or gas with access to a robust gas market.
In Norway, the UK and Ireland, Equinor recognises reserves as proved when a development plan is submitted, as there is reasonable
certainty that such a plan will be approved by the regulatory authorities. Outside these territories, reserves are generally booked as
proved when regulatory approval is received, or when such approval is imminent. Undrilled well locations in onshore fields in the USA
are generally booked as proved undeveloped reserves when a development plan has been adopted and the well locations are
scheduled to be drilled within five years.
Approximately 85% of Equinor’s proved reserves are located in OECD countries. Norway is by far the most important contributor in
this category, followed by USA and Canada. Of Equinor's total proved reserves, 6% are related to PSAs in non-OECD countries such

76 Equinor, Annual Report on Form 20-F 2021
as Angola, Algeria, Azerbaijan, Brazil, Libya, Nigeria and Russia
9
. Other non-OECD reserves are related to concessions in Argentina,
Brazil and Russia
1
, representing all together 9% of Equinor's total proved reserves.
9
by 88 million boe. See note 27 Subsequent event to the Consolidated financial statements.
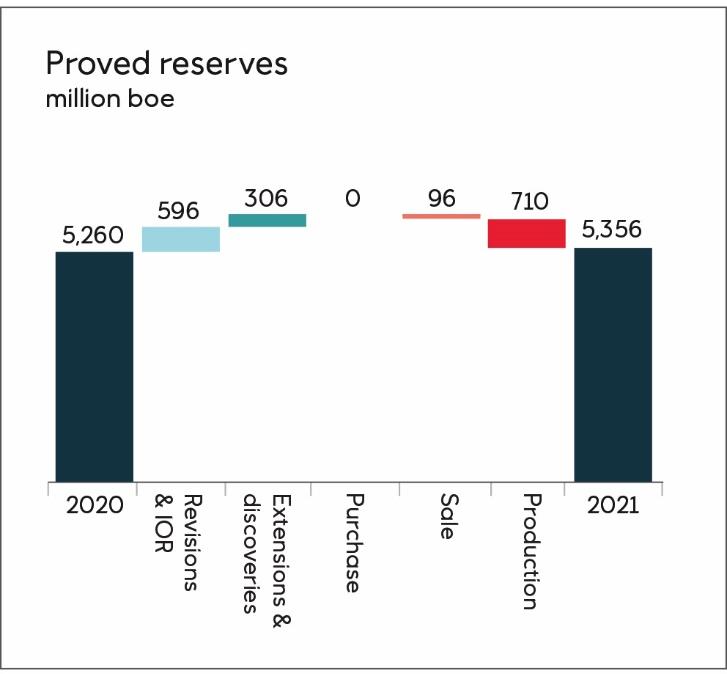
Equinor, Annual Report on Form 20-F 2021 77
Changes in proved reserves in 2021
The total volume of proved reserves increased by 96 million boe in 2021.
Change in proved reserves
For the year ended 31 December
(million boe)
2021
2020
2019
Revisions and improved recovery (IOR)
596
(171)
327
Extensions and discoveries
306
131
253
Purchase of petroleum-in-place
-
6
72
Sales of petroleum-in-place
(96)
-
(125)
Total reserve additions
806
(34)
527
Production
(710)
(710)
(698)
Net change in proved reserves
96
(744)
(171)
Revisions and IOR
Revisions of previously booked reserves, including the effect of improved recovery, increased the proved reserves by
net 596 million boe in 2021. This is the net result of 746 million boe in positive revisions and increased recovery and 150 million boe in
negative revisions. Many producing fields had positive revisions due to better performance, new drilling targets and improved recovery
measures, as well as reduced uncertainty due to further drilling and production experience. The positive revisions also included a
direct effect of higher commodity prices, increasing the proved reserves by approximately 275 million boe through increased economic
lifetime on several fields. The negative revisions were related to lower entitlement volumes from several fields with PSAs, and to
unforeseen events and operational challenges resulting in reduced production potential on some fields.
Extensions and discoveries
A total of 306 million boe of new proved reserves were added through extensions and discoveries. The Bacalhau field in Brazil is the
main contributor in this category and is included in the proved reserves for the first time. In addition, this category includes extensions
of proved areas through drilling of new wells in previously undrilled areas in the onshore plays in the US and in Argentina, and at fields
in Norway and UK.
Purchase and sale of reserves
There were no purchase of proved reserves in 2021.
A total of 96 million boe of sale of reserves in place are related to divestment of our Bakken assets in the US and the Terra Nova field
offshore Canada.
Production
78 Equinor, Annual Report on Form 20-F 2021
The 2021 entitlement production was 710 million boe, unchanged from 2020.
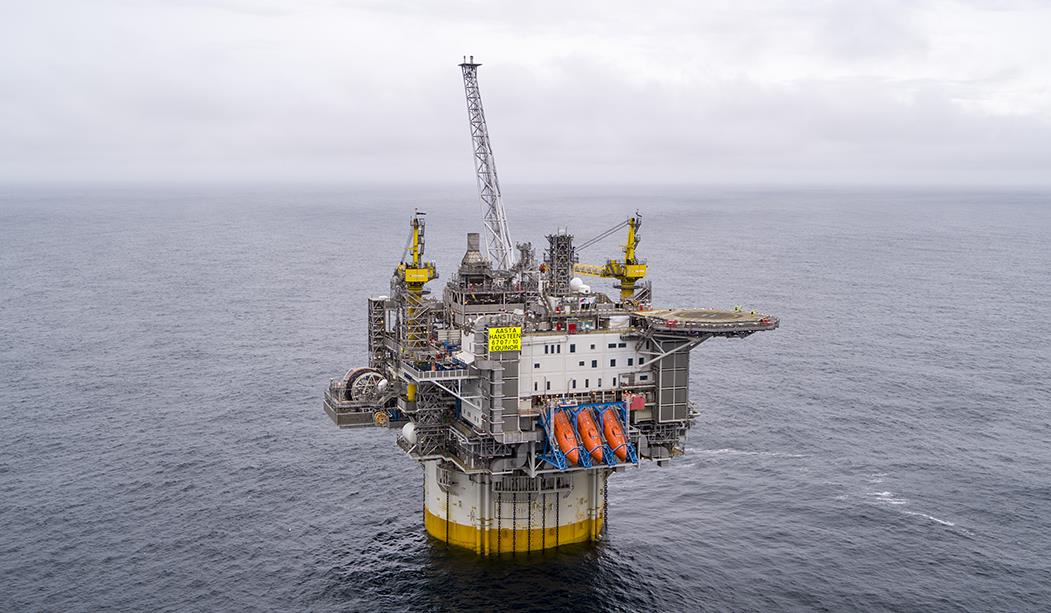
Equinor, Annual Report on Form 20-F 2021 79
Aasta Hansteen spar platform, Norwegian Sea.
Development of reserves
In 2021, 881 million boe were matured from proved undeveloped to proved developed reserves. Production start of the Troll Phase 3
project and the Martin Linge field added more than 600 million boe to the proved developed reserves. Continued drilling in the
Appalachian basin in the US and in the Oseberg, Johan Sverdrup, and Snorre fields in Norway increased the proved developed
reserves by 180 million boe during 2021. The remaining 100 million boe of the matured volume is related to a wide range of activities
on assets world-wide. The positive revisions of both proved developed reserves of 471 million boe and proved undeveloped reserves
of 125 million boe are related to the increased commodity prices, increasing economic lifetime at some fields, as well as higher activity
levels.
Undeveloped extensions and discoveries of 269 million boe are dominated by the onshore assets in the Appalachian basin and in
Argentina, together with the Bacalhau field in Brazil and the Johan Castberg field in Norway.
In 2020, 250 million boe were matured from proved undeveloped to proved developed reserves. Continued drilling in the Appalachian
basin in the US and in the Johan Sverdrup, Ærfugl and Oseberg fields in Norway, increased the proved developed reserves by 200
million boe during 2020. The remaining 50 million boe of the matured volume was related to a wide range of activities on assets world-
wide. The negative revision of proved undeveloped reserves of 131 million boe was both related to the reduced commodity prices,
decreasing economic lifetime at some fields, as well as reduced activity levels and operational challenges This resulted in a reduction
of proved undeveloped reserves, particularly in the onshore assets in the US, in fields in Brazil and in the UK.
In 2019, 426 million boe were matured from proved undeveloped to proved developed reserves. Start of production from the Johan
Sverdrup, Trestakk and Utgard fields in Norway and in the UK, increased the proved developed reserves by 305 million boe. The
remaining 121 million boe of the matured volume was related to activities on developed assets in several countries. Sanctioning of the
North Komsomolskoye field development in Russia
10
, and extension of the proved areas in our onshore assets in the US, were the
main reasons for the 188 million boe of proved undeveloped reserves added as extensions and discoveries. The net positive revisions
of 149 million boe were the result of several smaller revisions on most fields in our portfolio.
Over the last five years, Equinor has matured 2,406 million boe of proved undeveloped reserves to proved developed reserves.
10
Norway by 88 million boe. See note 27 Subsequent events to the Consolidated financial statements.
80 Equinor, Annual Report on Form 20-F 2021
Development of proved reserves
2021
2020
2019
(million boe)
Total
proved
reserves
Developed
Undeveloped
Total
proved
reserves
Developed
Undeveloped
Total
proved
reserves
Developed
Undeveloped
At 1 January
5,260
3,222
2,038
6,004
3,679
2,325
6,175
3,733
2,442
Revisions and improved
recovery
596
471
125
(171)
(40)
(131)
327
178
149
Extensions and discoveries
306
37
269
131
37
94
253
65
188
Purchase of reserves-in-place
-
-
-
6
6
0
72
15
57
Sales of reserves-in-place
(96)
(83)
(13)
-
-
-
(125)
(40)
(85)
Production
(710)
(710)
-
(710)
(710)
-
(698)
(698)
-
Moved from undeveloped to
developed
-
881
(881)
-
250
(250)
-
426
(426)
At 31 December
5,356
3,818
1,538
5,260
3,222
2,038
6,004
3,679
2,325
Proved developed and undeveloped reserves
As of 31 December 2021
Oil and
condensate
NGL
Natural gas
Total oil and
gas
(mmboe)
(mmboe)
(mmmcf)
(mmboe)
Developed
Norway
702
160
11,145
2,847
Eurasia excluding Norway
68
0
94
85
Africa
104
12
145
141
USA
161
37
1,845
527
Americas excluding USA
215
-
14
217
Total developed proved reserves
1,249
209
13,244
3,818
Undeveloped
Norway
594
42
1,667
934
Eurasia excluding Norway
109
-
59
119
Africa
13
2
17
18
USA
56
8
387
133
Americas excluding USA
334
-
5
335
Total undeveloped proved reserves
1,105
52
2,136
1,538
Total proved reserves
2,355
261
15,381
5,356

Equinor, Annual Report on Form 20-F 2021 81
Johan Castberg FPSO being prepared for the voyage from Singapore to Stord, 8 February 2022.
As of 31 December 2021, the total proved undeveloped reserves amounted to 1,538 million boe, 61% of which are related to fields in
Norway. The Johan Sverdrup and Snøhvit fields, which have continuous development activities, together with fields not yet in
production, such as Johan Castberg, have the largest proved undeveloped reserves in Norway. The largest assets with proved
undeveloped reserves outside Norway, are Bacalhau and Peregrino in Brazil, North Komsomolskoye in Russia
11
, the Appalachian
basin and Vito in the US, Mariner in the UK, and ACG in Azerbaijan.
All these fields are either producing or will start production within
the next three years.
For fields with proved reserves where production has not yet started, investment decisions have already been sanctioned and
investments in infrastructure and facilities have commenced. There are no material development projects, which would require a
separate future investment decision by management, included in our proved reserves. Some development activities will take place
more than five years from the disclosure date on many fields, but these are mainly related to incremental type of spending, such as
drilling of additional wells from existing facilities, in order to secure continued production.
For projects under development, the Covid-19 pandemic has impacted progress due to personnel limitations on offshore and onshore
facilities and yards. This has delayed production start at the Martin Linge and Johan Castberg fields in Norway. At Martin Linge, where
development has now been going on for more than five years, first oil was planned in 2020. First oil occurred in 2021. The Johan
Castberg field was originally planned to start production in 2022, four years after the field development was sanctioned. This is now
delayed to 2024.
For our onshore assets, all proved undeveloped reserves are limited to wells that are scheduled to be drilled within five years.
In 2021, Equinor incurred USD 7.0 billion in development costs relating to assets carrying proved reserves, of which USD 6.0 billion
was related to proved undeveloped reserves.
Additional information about proved oil and gas reserves is provided in section 4.2 Supplementary oil and gas information (unaudited).
Reserves replacement
The reserves replacement ratio is defined as the net amount of proved reserves added divided by produced volumes in any given
period. The table below presents the changes in reserves for each category relating to the reserve replacement ratio for the years
2021, 2020 and 2019.
The 2021 reserves replacement ratio was 113% and the corresponding three-year average was 61%.
The reserves replacement ratio excluding equity accounted entities was 115% in 2021.
The organic reserves replacement ratio, excluding sales and purchases, was 127% in 2021 compared to negative 6% in 2020. The
organic average three-year replacement ratio was 68% at the end of 2021.
For additional information regarding proved reserves changes and the reliability of proved reserves estimates, see the sections 4.2
Supplementary oil and gas information and 2.13 Risk review, respectively.
11
Equinor’s intention to exit its business activities in Russia is expected to reduce the total proved undeveloped reserves in Eurasia
excluding Norway by 54 million boe. See note 27 Subsequent event to the Consolidated financial statements.
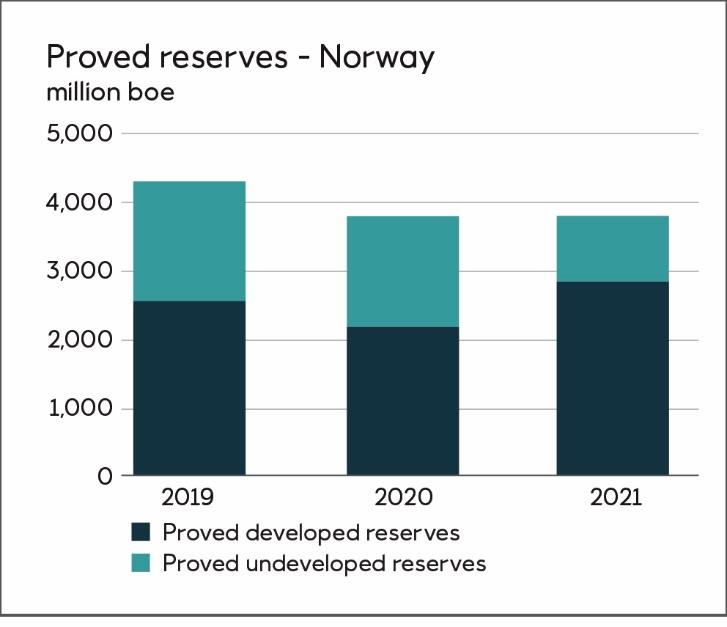
82 Equinor, Annual Report on Form 20-F 2021
Reserves replacement ratio
For the year ended 31 December
2021
2020
2019
Annual
113 %
(5 %)
75 %
Three-year-average
61 %
95 %
147 %
Proved reserves by region
Proved reserves in Norway
A total of 3,781 million boe was recognised as proved reserves in 58 fields and field development projects on the Norwegian
continental shelf (NCS), representing 71% of Equinor's total proved reserves. Of these, 53 fields and field areas are currently in
production, 41
12
Production experience, further drilling and improved recovery on many of Equinor’s producing fields in Norway contributed with
positive revisions of 465 million boe in 2021. Negative revisions totalled 42 million boe and were related to operational challenges.
The higher commodity prices increased the proved reserves in Norway by 144 million boe (2.2%).
Inclusion of new segments to several fields contributed to extensions and discoveries which totalled 19 million boe in 2021.
Of total proved reserves on the NCS, 2,847 million boe (75%) are proved developed reserves. Of the total proved reserves in this
area, 60% are gas reserves related to large gas fields such as Troll, Oseberg, Snøhvit, Ormen Lange, Aasta Hansteen, Martin Linge,
Tyrihans and Visund, and 40% are liquid reserves.
Proved reserves in Eurasia, excluding Norway
Equinor has proved reserves of 204 million boe related to seven fields in Russia
13
, Azerbaijan, United Kingdom and Ireland. Net
negative revisions related mainly to operational challenges on fields in the UK and in Russia
1
by 23 million boe. Eurasia excluding Norway represents 4% of Equinor's total proved reserves. All fields in this area are now
producing. Of the proved reserves in Eurasia, 85 million boe (42%) are proved developed reserves.
Of the total proved reserves in this area, 87% are liquid reserves and 13% are gas reserves.
12
E&P Norway may be different depending on how production is allocated and reported
13
Equinor’s intention to exit its business activities in Russia is expected to reduce the net proved reserves in Eurasia excluding
Norway by 88 million boe. See note 27 Subsequent event to the Consolidated financial statements.

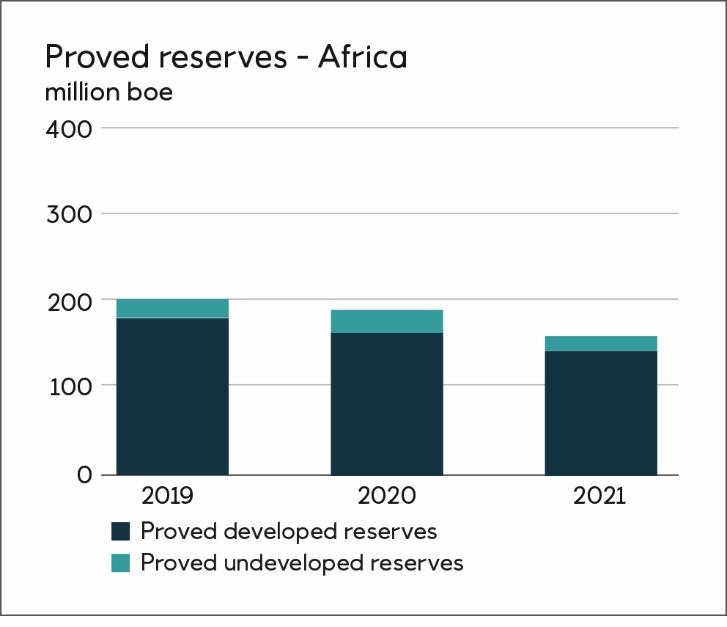
Equinor, Annual Report on Form 20-F 2021 83
Proved reserves in Africa
Equinor recognised proved reserves of 159 million boe in producing assets in the West and North African countries Angola, Algeria,
Nigeria and Libya. Africa represents 3% of Equinor's total proved reserves. Angola and Algeria are the primary contributors to the
proved reserves in this area. Most of the fields in Africa are mature and on decline. Net positive revisions increased the proved
reserves by 13 million boe, mainly related to positive reservoir performance.
For information related to the Agbami redetermination process and the dispute between the Nigerian National Petroleum Corporation
and the partners in Oil Mining Lease (OML) 128 concerning certain terms of the OML 128 Production Sharing Contract (PSC), see
note 24 Other commitments, contingent liabilities and contingent assets to the Consolidated financial statements. The effect of this
redetermination on the proved reserves, which is estimated to be immaterial, is not yet included.
Of the total proved reserves in Africa, 141 million boe, or 89%, are proved developed reserves. Of the total proved reserves in this
area, 82% are liquid reserves and 18% are gas reserves.
Proved reserves USA
In the US, Equinor has proved reserves equal to 660 million boe in assets in the Gulf of Mexico as well as in onshore tight reservoirs.
Vito, which was sanctioned in 2019, is the only field in this area that is not yet producing.
The proved reserves in the US were subject to a net positive revision of 78 million boe in 2021, mainly due to increased commodity
prices and activity levels.
New wells extending the proved areas in the US onshore assets, added a total of 61 million boe in the extensions and discoveries
category.
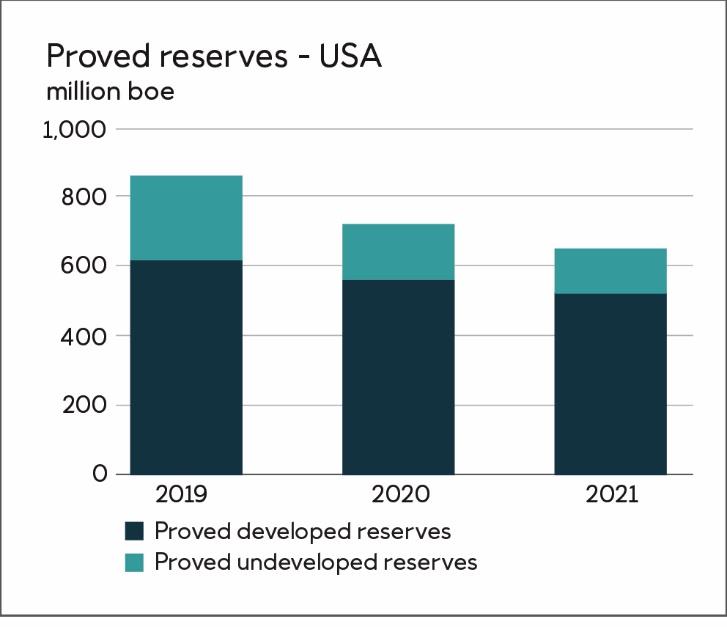
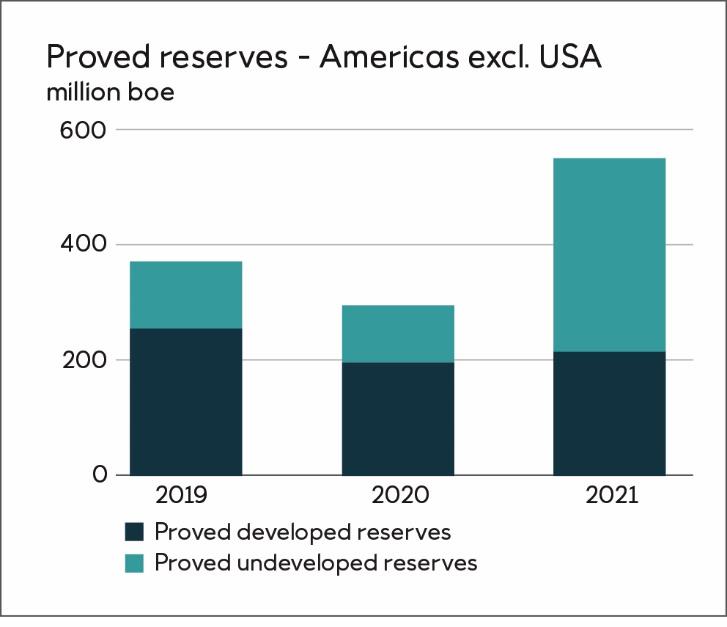
84 Equinor, Annual Report on Form 20-F 2021
The divestment of our interests in the Bakken field in the USA in 2021 resulted in a reduction of proved reserves of 89 million boe.
Of the total proved reserves in the US at year-end 2021, 527 million boe or 80% are proved developed reserves. Liquid reserves are
40% and gas reserves are 60%.
Proved reserves in the US now represent 12% of total proved reserves in Equinor.
Proved reserves in the Americas excluding USA
In the Americas excluding USA, Equinor has proved reserves equal to 552 million boe in a total of seven fields. Three fields are
located offshore Canada, three offshore Brazil, and one field onshore in Argentina. Six of these are producing.
Our interests in the Terra Nova field in Canada were divested during 2021 resulting in a reduction of 6 million boe.
Revisions of the proved reserves in this area are positive increasing the proved reserves by a net volume of 63 million boe. This is
related to continued drilling and increased commodity prices, resulting in longer economic lifetime of fields.
Sanctioning of the Bacalhau field, offshore Brazil, and activities in new areas in Bandurria Sur in Argentina added a total of 224 million
boe to the extensions and discoveries category.
Of the total proved reserves in the Americas excluding USA, 217 million boe, or 39% are proved developed reserves. Less than 1% of
the proved reserves in this area are gas reserves.
Equinor, Annual Report on Form 20-F 2021 85
Preparation of reserves estimates
Equinor's annual reporting process for proved reserves is coordinated by a central corporate reserves management (CRM) team
consisting of qualified professionals in geosciences, reservoir and production technology and financial evaluation. The team has an
average of more than 25 years' experience in the oil and gas industry. CRM reports to the senior vice president of accounting and
financial compliance in the Chief financial officer organisation and is independent of the exploration and production business areas. All
the reserves estimates have been prepared by Equinor's technical staff.
Although the CRM team reviews the information centrally, each asset team is responsible for ensuring compliance with the
requirements of the SEC and Equinor's corporate standards. Information about proved oil and gas reserves, standardised measures
of discounted net cash flows related to proved oil and gas reserves and other information related to proved oil and gas reserves, is
collected from the local asset teams and checked by CRM for consistency and conformity with applicable standards. The final
numbers for each asset are quality-controlled and approved by the responsible asset managers, before aggregation to the required
reporting level by CRM.
The person with primary responsibility for overseeing the preparation of the reserves estimates is the manager of the CRM team. The
person who currently holds this position has a bachelor's degree in earth sciences from the University of Gothenburg, and a master's
degree in petroleum exploration and exploitation from Chalmers University of Technology in Gothenburg, Sweden. She has 36 years'
experience in the oil and gas industry, 35 of them with Equinor. She is a member of the Society of Petroleum Engineering (SPE) and
of the Technical Advisory Group to the UNECE Expert Group on Resource Management (EGRM).
DeGolyer and MacNaughton report
Petroleum engineering consultants DeGolyer and MacNaughton have carried out an independent evaluation of Equinor’s proved
reserves as of 31 December 2021 using data provided by Equinor. The evaluation accounts for 100% of Equinor's proved reserves
including equity accounted entities. The aggregated net proved reserves estimates prepared by DeGolyer and MacNaughton do not
differ materially from those prepared by Equinor when compared on the basis of net equivalent barrels.
A reserves audit report summarising this evaluation is included as Exhibit 15 (a)(iv).
Net proved reserves
Oil and
condensate
NGL/LPG
Natural gas
Oil equivalent
At 31 December 2021
(mmboe)
(mmboe)
(mmmcf)
(mmboe)
Estimated by Equinor
2,355
261
15,381
5,356
Estimated by DeGolyer and MacNaughton
2,451
283
15,449
5,487
86 Equinor, Annual Report on Form 20-F 2021
Operational statistics
Total developed and undeveloped oil and gas acreage, in which Equinor had interests at 31 December 2021, are presented in the
table below.
Developed and undeveloped oil and gas acreage
At 31 December 2021 (in thousands of acres)
Norway
Eurasia
excluding
Norway
Africa
USA
Americas
excluding
USA
Total
Developed acreage
- gross
1)
953
187
834
357
311
2,643
- net
2)
373
77
265
88
67
871
Undeveloped acreage
- gross
1)
15,072
21,289
7,027
1,517
33,724
78,630
- net
2)
6,765
9,831
2,123
637
14,321
33,676
1) A gross value reflects the acreage in which Equinor has a working interest.
2) The net value corresponds to the sum of the fractional working interests owned by Equinor in the same acreage.
Equinor’s largest concentrations of net developed acreage in Norway are in the Troll, Oseberg, Skarv Unit, Snøhvit, Ormen Lange and
Johan Sverdrup fields. In Africa, the Algerian gas development projects In Amenas and In Salah represent the largest concentrations
of net developed acreage. In the Americas, the Appalachian basin assets in the US have the largest net developed acreage.
The largest concentration of net undeveloped acreage is in Russia
14
undeveloped acreage, followed by Norway and Argentina.
The largest net undeveloped acreage in the Americas, is in Argentina, Canada and Colombia.
At 31 December 2021, Equinor no longer holds acreage in Australia, Nicaragua, South Africa and Uruguay.
Equinor holds acreage in numerous concessions, blocks and leases. The terms and conditions regarding expiration dates vary
significantly from property to property. Work programmes are designed to ensure that the exploration potential of any property is fully
evaluated before expiration.
Acreage related to several of these concessions, blocks and leases are scheduled to expire within the next three years. Any acreage
which has already been evaluated to be non-profitable may be relinquished prior to the current expiration date. In other cases,
Equinor may decide to apply for an extension if more time is needed in order to fully evaluate the potential of the properties.
Historically, Equinor has generally been successful in obtaining such extensions.
Most of the undeveloped acreage that will expire within the next three years, is related to early exploration activities where no
production is expected in the foreseeable future. The expiration of these leases, blocks and concessions will therefore not have any
material impact on our proved reserves.
14
Consolidated financial statements.
Equinor, Annual Report on Form 20-F 2021 87
Productive oil and gas wells
The number of gross and net productive oil and gas wells, in which Equinor had interests at 31 December 2021, is shown in the table
below.
The gross number of oil wells has decreased from last year mainly due to the sale of Bakken onshore assets in the US. The gross and
net number of gas wells has increased from last year mainly due to continued drilling at the Appalachian basin onshore assets in the
US.
The total gross number of productive wells as of end 2021 includes 415 oil wells and 12 gas wells with multiple completions or wells
with more than one branch.
Number of productive oil and gas wells
At 31 December 2021
Norway
Eurasia
excluding
Norway
Africa
USA
Americas
excluding
USA
Total
Oil wells
- gross
1)
963
296
432
75
198
1,964
- net
2)
321.2
69.9
66.3
23.9
56.3
537.7
Gas wells
- gross
1)
215
6
113
2,266
-
2,600
- net
2)
93.5
2.2
43.4
442.0
-
581.1
1) A gross value reflects the number of wells in which Equinor owns a working interest.
2) The net value corresponds to the sum of the fractional working interests owned by Equinor in the same gross wells.
88 Equinor, Annual Report on Form 20-F 2021
Net productive and dry oil and gas wells drilled
The following tables show the number of net productive and dry exploratory and development oil and gas wells completed or
abandoned by Equinor over the past three years. Productive wells include exploratory wells in which hydrocarbons were discovered,
and where drilling or completion has been suspended pending further evaluation. A dry well is a well found to be incapable of
producing sufficient quantities to justify completion as an oil or gas well. Dry development wells are mainly injector wells but does also
include drilled and permanently abandoned wells.
Number of net productive and dry oil and gas wells drilled
1)
Norway
Eurasia
excluding
Norway
Africa
USA
Americas
excluding
USA
Total
Year 2021
Net productive and dry exploratory wells drilled
7.4
0.5
-
-
0.6
8.5
- Net dry exploratory wells
4.0
0.5
-
-
0.6
5.0
- Net productive exploratory wells
3.5
-
-
-
-
3.5
Net productive and dry development wells drilled
38.8
26.6
2.0
19.7
8.5
95.6
- Net dry development wells
8.3
8.6
0.4
-
0.4
17.8
- Net productive development wells
30.5
18.0
1.5
19.7
8.1
77.8
Year 2020
Net productive and dry exploratory wells drilled
8.2
2.0
-
1.1
2.7
14.0
- Net dry exploratory wells
4.7
1.0
-
0.4
0.9
6.9
- Net productive exploratory wells
3.6
1.0
-
0.7
1.8
7.0
Net productive and dry development wells drilled
27.6
22.1
1.6
48.2
8.7
108.2
- Net dry development wells
4.0
3.9
-
-
0.7
8.6
- Net productive development wells
23.6
18.2
1.6
48.2
8.0
99.6
Year 2019
Net productive and dry exploratory wells drilled
11.0
5.0
-
0.4
2.1
18.5
- Net dry exploratory wells
5.9
4.0
-
-
0.3
10.2
- Net productive exploratory wells
5.1
1.0
-
0.4
1.8
8.3
Net productive and dry development wells drilled
30.7
13.4
2.0
121.6
3.5
171.1
- Net dry development wells
5.1
1.4
-
0.5
0.8
7.8
- Net productive development wells
25.6
12.0
2.0
121.1
2.6
163.3
1) The net value corresponds to the sum of the fractional working interests owned by Equinor in the same gross wells.
Equinor, Annual Report on Form 20-F 2021 89
Exploratory and development drilling in process
The following table shows the number of exploratory and development oil and gas wells in the process of being drilled, or drilled but
not yet put on stream by Equinor at 31 December 2021.
Number of wells in progress
At 31 December 2021
Norway
Eurasia
excluding
Norway
Africa
USA
Americas
excluding
USA
Total
Development wells
- gross
1)
37
18
16
23
12
106
- net
2)
16.7
6.2
3.7
6.7
3.9
37.2
Exploratory wells
- gross
1)
4
-
-
1
6
11
- net
2)
1.7
-
-
0.5
3.0
5.2
1) A gross value reflects the number of wells in which Equinor owns a working interest.
2) The net value corresponds to the sum of the fractional working interests owned by Equinor in the same gross wells.
Delivery commitments
Equinor is responsible for managing, transporting and selling the Norwegian State's oil and gas from the NCS on behalf of the
Norwegian State's direct financial interest (SDFI). These reserves are sold in conjunction with Equinor’s own reserves. As part of this
arrangement, Equinor delivers gas to customers under various types of sales contracts. In order to meet the commitments, a field
supply schedule is utilised to ensure the highest possible total value for Equinor and SDFI's joint portfolio of oil and gas.
Equinor’s and SDFI's delivery commitments under bilateral agreements for the calendar years 2022, 2023, 2024 and 2025 expressed
as the sum of expected gas off-take, are equal to 45.7, 32.5, 21.3 and 16.4 bcm, respectively. The number of bilateral agreements is
steadily declining as our customers are increasingly requesting more and more short-term contracts and higher volumes are traded on
the spot market.
Equinor’s currently developed gas reserves on the NCS are more than sufficient to meet our share of these commitments for the next
four years.
Any remaining volumes after covering our delivery commitments under the bilateral agreements, will be sold by trading activities at the
hubs.
Production volumes and prices
The business overview is presented based on our segment's operations as of 31 December 2021, whereas certain disclosures on oil
and gas reserves are based on geographical areas as required by the SEC. For further information about extractive activities, see
sections 2.3 E&P Norway, 2.4 E&P International and 2.5 E&P USA.
Equinor prepares its disclosures for oil and gas reserves and certain other supplemental oil and gas disclosures by geographical area,
as required by the SEC. The geographical areas are defined by country and continent. These are Norway, Eurasia excluding Norway,
Africa, the US and the Americas excluding US.
For further information about disclosures concerning oil and gas reserves and certain other supplemental disclosures based on
geographical areas as required by the SEC, see section 4.2 Supplementary oil and gas information (unaudited).
90 Equinor, Annual Report on Form 20-F 2021
Entitlement production
The following table shows Equinor's Norwegian and international entitlement production of oil and natural gas for the periods
indicated. The stated production volumes are the volumes to which Equinor is entitled, pursuant to conditions laid down in licence
agreements and production sharing agreements. The production volumes are net of royalty oil paid in-kind, and of gas used for fuel
and flaring. Production is based on proportionate participation in fields with multiple owners and does not include production of the
Norwegian State's oil and natural gas. NGL includes both LPG and naphtha. For further information on production volumes see
section 5.7 Terms and abbreviations.
Entitlement production
Consolidated companies
Equity accounted
Total
Norway
Eurasia
excluding
Norway
Africa
US
Americas
excluding
US
Subtotal
Norway
Eurasia
excluding
Norway
Americas
excluding
US
Subtotal
Oil and Condensate (mmboe)
2021
200
15
32
37
19
303
-
5
2
7
310
2020
193
15
39
48
25
320
-
1
1
2
322
2019
151
9
47
54
36
296
3
1
-
4
300
NGL (mmboe)
2021
38
0
3
9
-
49
-
-
-
-
49
2020
40
0
3
11
-
54
-
-
-
-
54
2019
41
-
3
12
-
57
-
-
-
-
57
Natural gas (mmmcf)
2021
1,500
20
41
396
8
1,966
-
3
1
5
1,971
2020
1,425
26
42
373
9
1,874
-
3
1
3
1,878
2019
1,447
31
57
363
9
1,907
2
4
-
6
1,913
Combined oil, condensate, NGL and gas (mmboe)
2021
505
18
42
117
20
703
-
6
2
8
710
2020
486
20
49
126
26
708
-
2
1
3
710
2019
450
15
60
131
38
693
3
1
-
5
698
The Troll field in Norway is the only field containing more than 15% of total proved reserves based on barrels of oil equivalent.
Troll entitlement production
2021
2020
2019
Troll field
1)
Oil and Condensate (mmboe)
8
9
12
NGL (mmboe)
2
2
2
Natural gas (mmmcf)
403
378
341
Combined oil, condensate, NGL and gas (mmboe)
82
79
74
1) Troll is included in the Norway region.
Equinor, Annual Report on Form 20-F 2021 91
Operational data
The following table presents operational data for 2021, 2020 and 2019.
For the year ended 31 December
Operational data
2021
2020
2019
21-20 change
20-19 change
Prices
Average Brent oil price (USD/bbl)
70.7
41.7
64.3
70%
(35%)
E&P Norway average liquids price (USD/bbl)
67.6
37.4
57.4
81%
(35%)
E&P International average liquids price (USD/bbl)
67.6
38.1
59.1
77%
(36%)
E&P USA average liquids price (USD/bbl)
58.3
31.3
48.4
86%
(35%)
Group average liquids price (USD/bbl)
66.3
36.5
56.0
82%
(35%)
Group average liquids price (NOK/bbl)
570
343
493
66%
(30%)
E&P Norway average internal gas price (USD/mmbtu)
14.43
2.26
4.46
>100%
(49%)
E&P USA average internal gas price (USD/mmbtu)
2.89
1.32
2.17
>100%
(39%)
Average invoiced gas prices - Europe (USD/mmbtu)
14.60
3.58
5.79
>100%
(38%)
Average invoiced gas prices - North America (USD/mmbtu)
3.22
1.72
2.43
87%
(29%)
Refining reference margin (USD/bbl)
4.0
1.5
4.1
>100%
(64%)
Entitlement production (mboe per day)
E&P Norway entitlement liquids production
643
630
535
2%
18%
E&P International entitlement liquids production
207
236
267
(12%)
(12%)
E&P USA entitlement liquids production
128
163
181
(22%)
(10%)
Group entitlement liquids production
978
1,029
983
(5%)
5%
E&P Norway entitlement gas production
721
685
700
5%
(2%)
E&P International entitlement gas production
40
42
50
(6%)
(17%)
E&P USA entitlement gas production
193
181
178
6%
2%
Group entitlement gas production
954
908
928
5%
(2%)
Total entitlement liquids and gas production
1,931
1,938
1,911
(0%)
1%
Equity production (mboe per day)
E&P Norway equity liquids production
643
630
535
2%
18%
E&P International equity liquids production
291
303
354
(4%)
(14%)
E&P USA equity liquids production
142
187
210
(24%)
(11%)
Group equity liquids production
1,076
1,120
1,099
(4%)
2%
E&P Norway equity gas production
721
685
700
5%
(2%)
E&P International equity gas production
51
49
62
5%
(21%)
E&P USA equity gas production
231
216
213
7%
1%
Group equity gas production
1,003
950
975
6%
(3%)
Total equity liquids and gas production
2,079
2,070
2,074
0%
(0%)
Liftings (mboe per day)
Liquids liftings
980
1,050
994
(7%)
6%
Gas liftings
989
941
962
5%
(2%)
Total liquids and gas liftings
1,969
1,991
1,955
(1%)
2%
Production cost (USD/boe)
Production cost entitlement volumes
5.8
5.1
5.8
14%
(12%)
Production cost equity volumes
5.4
4.8
5.3
13%
(11%)
REN equity power generation
Equity power generation (GWh)
1,562
1,662
1,754
(6%)
(5%)
92 Equinor, Annual Report on Form 20-F 2021
Sales prices
The following table presents realised sales prices.
Realised sales prices
Norway
Eurasia
excluding
Norway
Africa
Americas
Year ended 31 December 2021
Average sales price oil and condensate in USD per bbl
70.0
67.0
71.0
65.7
Average sales price NGL in USD per bbl
52.5
51.8
48.9
29.5
Average sales price natural gas in USD per mmBtu
14.6
15.4
6.9
3.2
Year ended 31 December 2020
Average sales price oil and condensate in USD per bbl
39.7
37.4
41.1
36.1
Average sales price NGL in USD per bbl
25.6
30.3
23.3
11.8
Average sales price natural gas in USD per mmBtu
3.6
3.2
3.9
1.7
Year ended 31 December 2019
Average sales price oil and condensate in USD per bbl
64.0
61.1
64.3
55.9
Average sales price NGL in USD per bbl
33.0
-
30.1
16.6
Average sales price natural gas in USD per mmBtu
5.8
4.6
5.5
2.4
Equinor, Annual Report on Form 20-F 2021 93
Sales volumes
Sales volumes include lifted entitlement volumes, the sale of SDFI volumes and marketing of third-party volumes. In addition to
Equinor’s own volumes, we market and sell oil and gas owned by the Norwegian State through the Norwegian State's share in
production licences. This is known as the State's Direct Financial Interest or SDFI. For additional information, see section 2.9
Corporate under SDFI oil and gas marketing and sale.
The following table shows the SDFI and Equinor sales volume information on crude oil and natural gas for the periods indicated.
Sales Volumes
2021
2020
2019
Equinor
1)
Crude oil (mmbbls)
2)
358
384
363
Natural gas (bcm)
57.4
54.8
55.8
Combined oil and gas (mmboe)
719
729
714
Third-party volumes
3)
Crude oil (mmbbls)
2)
286
318
325
Natural gas (bcm)
7.0
8.1
7.3
Combined oil and gas (mmboe)
330
369
371
SDFI assets owned by the Norwegian State
4)
Crude oil (mmbbls)
2)
143
132
122
Natural gas (bcm)
41.7
38.4
38.0
Combined oil and gas (mmboe)
406
374
360
Total
Crude oil (mmbbls)
2)
787
835
809
Natural gas (bcm)
106.2
101.3
101.0
Combined oil and gas (mmboe)
1,455
1,472
1,445
1)
The Equinor volumes included in the table above are based on the assumption that volumes sold were equal to lifted volumes in the
relevant year. Volumes lifted by E&P International or E&P USA but not sold by MMP, and volumes lifted by E&P Norway, E&P
International or E&P USA and still in inventory or in transit may cause these volumes to differ from the sales volumes reported elsewhere
in this report by MMP.
2)
Sales volumes of crude oil include NGL and condensate. All sales volumes reported in the table above include internal deliveries to our
manufacturing facilities.
3)
Third-party volumes of crude oil include both volumes purchased from partners in our upstream operations and other cargos purchased
in the market. The third-party volumes are purchased either for sale to third parties or for our own use. Third party volumes of natural
gas include third-party LNG volumes related to our activities at the Cove Point regasification terminal in the US.
4)
The line item SDFI assets owned by the Norwegian State includes sales of both equity production and third-party.
94 Equinor, Annual Report on Form 20-F 2021
2.
11
Financial review
A discussion of financial performance of the group in respect of 2019 may be found in our Annual Report on Form 20-F for the year
ended 31 December 2020, filed with the SEC on 19 March 2021.
Group financial performance
The Group’s financial results in 2021 were largely affected by the significant increase in gas and liquid prices. Average invoiced gas
prices for Europe and North America were up over 100% and 87% respectively, and average liquids prices were up 82%. Net
impairments and exploration expenses were lower in 2021. Equinor delivered an entitlement production of 1,931 mboe per day, a
minor decrease from 2020. Net income was positive USD 8.6 billion, up from negative USD 5.5 billion in 2020.
Total equity liquids and gas production
increase in total equity production was mainly due to new fields on stream on the NCS and higher gas outtake, partially offset by the
divestment of an unconventional US onshore asset in the second quarter of 2021, expected natural decline and the continued
shutdown of Hammerfest LNG plant.
Total entitlement liquids and gas production
was influenced by the factors mentioned above in addition to lower entitlements from production sharing agreements (PSA) and lower
US royalty volumes. The combined effect of PSA and US royalties was 148 mboe and 133 mboe per day in 2021 and 2020,
respectively.
Over time, the volumes lifted and sold will equal the entitlement production, but they may be higher or lower in any period due to
differences between the capacity and timing of the vessels lifting our volumes and the actual entitlement production during the period.
Condensed income statement under IFRS
For the year ended 31 December
(in USD million)
2021
2020
Change
Revenues
88,744
45,753
94%
Net income/(loss) from equity accounted investments
259
53
>100%
Other income
1,921
12
>100%
Total revenues and other income
90,924
45,818
98%
Purchases [net of inventory variation]
(35,160)
(20,986)
68%
Operating, selling, general and administrative expenses
(9,378)
(9,537)
(2%)
Depreciation, amortisation and net impairment losses
(11,719)
(15,235)
(23%)
Exploration expenses
(1,004)
(3,483)
(71%)
Net operating income/(loss)
33,663
(3,423)
N/A
Net financial items
(2,080)
(836)
>(100%)
Income/(loss) before tax
31,583
(4,259)
N/A
Income tax
(23,007)
(1,237)
>100%
Net income/(loss)
8,576
(5,496)
N/A
Equinor, Annual Report on Form 20-F 2021 95
Total revenues and other income
Revenues are generated from both the sale of lifted crude oil, natural gas and refined products produced and marketed by Equinor,
and from the sale of liquids and gas purchased from third parties. In addition, Equinor markets and sells the Norwegian State's share
of liquids from the NCS. All purchases and sales of the Norwegian State's production of liquids are recorded as purchases [net of
inventory variations] and revenues, respectively, while sales of the Norwegian State's share of gas from the NCS are recorded net.
For additional information regarding sales, see the Sales volume table in section 2.10 above in this report.
Revenues
prices for all products. Higher entitlement gas production added to the increase, partially offset by decreased entitlement liquids
production and a reduction in sales of third party gas.
Net income from equity accounted investments
increase in net income from Angara Oil. For further information, see note 13 Equity accounted investments to the Consolidated
financial statements.
Other income
gain from divestment in Beacon and Empire Wind and Dogger Bank, Snøhvit insurance proceeds and gain from effects related to the
sale of shares in an Equinor refinery. In 2020, other income was positively impacted by gain on sale of assets mainly related to
Kvitebjørn pipeline and minor joint venture assets.
Due of the factors explained above,
total revenue and other income
Purchases [net of inventory variation]
Owner's instruction, and the cost of liquids and gas purchased from third parties. See SDFI oil and gas marketing and sale in section
2.9 Corporate for more details. Purchases [net of inventory variation] amounted to USD 35,160 million in 2021 compared to USD
20,986 million in 2020. The 68% increase in 2021 was mainly due to significantly higher average prices for gas and liquids, partially
offset by decreased third party sales of gas.
Operating, selling, general and administrative expenses
2020. The 2% decrease from 2020 to 2021 was mainly due to lower transportation costs on liquids due to lower volumes and lower
freight rates. The decrease was partially offset by the NOK/USD exchange rate development, increased operation and maintenance
activities in addition to increased royalties in the E&P International segment.
Depreciation, amortisation and net impairment losses
amounted to USD 11,719 million compared to USD 15,235 million in 2020.
The 23% decrease was mainly due to lower net impairments primarily related to increased price assumptions in addition to the effect
on depreciation of upward revision of reserves. The NOK/USD exchange rate development, investments and ramp-up of new fields
especially on the NCS offset the decrease.
Included in the total for 2021 was net impairments of USD 1,287 million, mainly related to negative reserve updates of an oil producing
asset in Europe and increased cost estimates related to CO
2
reserves estimates on assets on Norwegian continental shelf and price assumptions.
Included in the total for 2020 were net impairments of USD 5,720 million, the majority of which related to decreased price assumptions
in addition to downward reserves revisions. Other elements were reduced refinery margin estimates, increased cost estimates in
addition to reduced volume-estimates from processing and change to fair value less cost of disposal valuation in relation to a sales
transaction.
For further information, see note 4 Segments and note 11 Property, plant and equipment to the Consolidated financial statements.
Exploration expenses
For the year ended 31 December
(in USD million)
2021
2020
Change
Exploration expenditures
1,027
1,371
(25%)
Expensed, previously capitalised exploration expenditures
19
1,169
(98%)
Capitalised share of current period's exploration activity
(194)
(394)
(51%)
Net impairments / (reversals)
152
1,337
(89%)
96 Equinor, Annual Report on Form 20-F 2021
Total exploration expenses
1,004
3,483
(71%)
In 2021,
exploration expenses
were USD 1,004 million, a 71% decrease compared to USD 3,483 million in 2020.
The 71% decrease in exploration expenses in 2021 is mainly due to lower impairments of exploration prospects and signature
bonuses, write down of previously capitalised well costs of USD 982 million related to the Tanzania LNG project in 2020, lower drilling
costs compared to 2020 and previously expensed wells being recapitalised due to related projects being matured in 2021. The
decrease was partially offset by a lower portion of exploration expenditure being capitalised in 2021 and higher field development and
seismic costs compared to 2020.
In 2021, there was exploration activity in 31 wells compared to 46 wells in 2020. 21 wells were completed with 8 commercial
discoveries in 2021 compared to 34 wells completed with 16 commercial discoveries in 2020.
Net operating income
development in revenues and costs discussed above, the increase in 2021 was primarily driven by higher gas and liquid prices and
lower net impairments.
Net financial items
development of USD 1,244 million was mainly due to negative fair value development on non-current financial derivatives of USD 708
million in 2021, compared to positive fair value developments of USD 448 million in 2020. The negative fair value development in
2021 was mainly a result of an upward shift in both short term and long term interest rates.
Income taxes
in 2020, equivalent to an effective negative tax rate of 29.0%. The
effective tax rate
operating income from the NCS with higher than average effective tax rate and losses recognised in countries with lower than average
effective tax rates, partially offset by positive income in countries with unrecognised deferred tax assets. The effective tax rate was
also influenced by currency effects in entities that are taxable in other currencies than the functional currency. For further information,
see note 10 Income taxes to the Consolidated financial statements.
The effective tax rate in 2020 was primarily influenced by losses recognised in countries without recognised taxes or in countries with
lower than average tax rates. The effective tax rate was also influenced by currency effects in entities that are taxable in other
currencies than the functional currency, partially offset by the temporary changes to Norway’s petroleum tax system and changes in
estimates for uncertain tax positions.
The effective tax rate is calculated as income taxes divided by income before taxes. Fluctuations in the effective tax rates from year to
year are principally the result of non-taxable items (permanent differences) and changes in the relative composition of income
between Norwegian oil and gas production, taxed at a marginal rate of 78%, and income from other tax jurisdictions. Other Norwegian
income, including the onshore portion of net financial items, is taxed at 22%, and income in other countries is taxed at the applicable
income tax rates in the various countries.
In 2021,
net income
The significant increase in 2021 was mainly a result of the increase in net operating income partially offset by the negative change in
net financial items and by higher income taxes, as explained above.
The board of directors proposes to the AGM a cash dividend of USD 0.20 per share for the fourth quarter of 2021 and to introduce an
extraordinary quarterly cash dividend of USD 0.20 per share for the fourth quarter of 2021 and for the first three quarters of 2022.
The
annual ordinary dividends
million. Considering the proposed dividend,
USD 5,223 million will be allocated to retained earnings in the parent company.
For 2020, annual ordinary dividends amounted to an aggregated total of USD 1,331 million.
For further information, see note 18 Shareholders’ equity and dividends to the Consolidated financial statements.
In accordance with §3-3a of the Norwegian Accounting Act, the board of directors confirms that the going concern assumption on
which the financial statements have been prepared, is appropriate.
Balance sheet information:
the year ending 31 December 2021, compared to USD 78,919 million for the year ending 31 December 2020.
Equinor, Annual Report on Form 20-F 2021 97
Segments financial performance
E&P Norway profit and loss analysis
Net operating income
from 2020 to 2021 was primarily driven by higher gas transfer price and liquids price.
Balance sheet information:
the year ended 31 December 2021, compared to USD 37,735 million for the year ended 31 December 2020.
The average daily production of liquids and gas
The increase
was mainly due to the ramp-up of Johan Sverdrup and Martin Linge, a higher flexible gas outtake from Oseberg and Troll and new
wells on Snorre and Skarv, partially offset by shutdown at Snøhvit and natural decline.
Over time, the volumes lifted and sold will equal entitlement production, but may be higher or lower in any period due to differences
between the capacities and timing of the vessels lifting the volumes and the actual entitlement production during the period.
98 Equinor, Annual Report on Form 20-F 2021
E&P Norway - condensed income statement under IFRS
For the year ended 31 December
(in USD million)
2021
2020
Change
Revenues
38,696
11,890
>100%
Other income
546
5
>100%
Total revenues and other income
39,241
11,895
>100%
Operating, selling, general and administrative expenses
(3,729)
(2,829)
32%
Depreciation, amortisation and net impairment losses
(4,678)
(5,546)
(16%)
Exploration expenses
(363)
(423)
(14%)
Net operating income/(loss)
30,471
3,097
>100%
Total revenues and other income
were USD 39,241 million in 2021 and USD 11,895 million in 2020.
The 230% increase in revenue
in 2021 was mainly due to higher gas transfer price and liquids price.
Other income
2020, other income was impacted by gain from the sale of an exploration asset of USD 3 million.
Operating expenses and selling, general and administrative expenses
million in 2020. The increase was mainly due to the NOK/USD exchange rate development, higher Gassled removal costs and ramp-
up of new fields. Higher environmental taxes, increased maintenance and higher electricity prices added to the increase.
Depreciation, amortisation and net impairment
The decrease was mainly due reversal of impairments. The NOK/USD exchange rate development, ramp-up of new fields,
investments, higher field specific production, decreased proved reserves on several fields and increased depreciation of the asset
retirement obligation (ARO) assets partially offset the decrease.
Exploration expenses
primarily due to previously expensed wells being recapitalised due to related projects being matured, partially offset by higher field
development and seismic costs. In 2021 there was exploration activity in 21 wells with 18 wells completed, compared to activity in 23
wells with 20 wells completed in 2020.
E&P International profit and loss analysis
Net operating income
in 2021 was positive USD 326 million, compared to negative USD 3,565 million in 2020. The increase from
2020 to 2021 was primarily due to higher liquids and gas prices, and the write down of previously capitalised well costs of USD 982
million related to the Tanzania LNG project in 2020. Lower depreciations, higher result from associated companies, and lower
impairment losses in 2021 added to the increase.
Balance sheet information:
the year ended 31 December 2021, compared to USD 18,961 million for the year ended 31 December 2020.
The average daily equity liquids and gas production
decrease of 3% from 2020 to 2021 was driven by natural decline, primarily at mature fields in Angola, production halt on Peregrino in
Brazil due to repairs, partially offset by higher field specific production in Russia
15
.
The average daily entitlement liquids and gas production
The 11% decrease from 2020 to 2021 was due to lower equity production as described above, and higher effect from PSAs primarily
driven by higher prices. The net effect of PSAs was 96 mboe per day in 2021 and 74 mboe per day in 2020.
Over time, the volumes lifted and sold will equal to our entitlement production, but they may be higher or lower in any period due to
differences between the capacity and timing of the vessels lifting our volumes and the actual entitlement production during the period.
For more information about equity and entitlement production see section 5.7 Terms and abbreviations.
15
Consolidated financial statements.
Equinor, Annual Report on Form 20-F 2021 99
E&P International - condensed income statement under IFRS
For the year ended 31 December
(in USD million)
2021
2020
21-20 change
Revenues
5,338
3,636
47%
Net income/(loss) from equity accounted investments
214
(146)
N/A
Other income
5
(2)
N/A
Total revenues and other income
5,558
3,489
59%
Purchases [net of inventory]
(58)
(72)
(19%)
Operating, selling, general and administrative expenses
(1,466)
(1,439)
2%
Depreciation, amortisation and net impairment losses
(3,257)
(3,471)
(6%)
Exploration expenses
(451)
(2,071)
(78%)
Net operating income/(loss)
326
(3,565)
N/A
E&P International generated
total revenues and other income
of USD 5,558 million in 2021, compared to USD 3,489 million in
2020.
Revenues
Net income/(loss) from equity accounted investments
million in 2020. The increase from 2020 to 2021 was primarily related to associated companies in Russia and Argentina. In 2020, the
result included the expensing of well commitments in offshore Russia in connection with the purchase of shares in the KrasGeoNac
limited liability company (renamed to AngaraOil limited liability company in 2021)
16
.
Other income
related to a gain from the sale of an asset in Canada. In 2020, other income was mainly related to a settlement connected to the sale
of an asset in UK.
As a result of the factors explained above,
total revenues and other income
Operating, selling, general and administrative expenses
were USD 1,466 million in 2021, compared to USD 1,439 million in 2020.
The 2% increase from 2020 to 2021 was mainly due to higher royalties and production fees driven by higher prices.
Depreciation, amortisation and net impairment losses
were USD 3,257 million in 2021, compared to USD 3,471 million in 2020.
The 6% decrease from 2020 to 2021 was primarily caused by lower depreciation expenses due to increased reserve estimates, lower
entitlement production from mature fields and reduced asset retirement obligation estimates, partially offset by increased investments
and field specific production.
Net impairment losses increased from USD 1,426 million in 2020 to USD 1,587 million in 2021, with impairments of conventional
assets in the Europe and Asia area caused by reduced reserve estimates as the largest contributors in 2021. In 2020, impairments of
conventional assets in the Europe and Asia area were the main contributors, mainly caused by decreased short-term price
assumptions and reduced reserve estimates.
Exploration expenses
were USD 451 million in 2021, compared to USD 2,071 million in 2020. The decrease from 2020 to 2021 was
primarily due to write down of previously capitalised well costs of USD 982 million related to the Tanzania LNG project in 2020 and
lower impairments of exploration prospects and signature bonuses amounting to USD 101 million in 2021 compared to USD 508
million in 2020, in addition to lower drilling and other cost. The decrease was partially offset by a lower portion of exploration
expenditure being capitalised in 2021.
In 2021 there was exploration activity in nine wells with three wells completed, compared to 18 wells with 11 wells completed in 2020.
E&P USA profit and loss analysis
Net operating income
in 2021 was positive USD 1,150 million, compared to negative USD 3,512 million in 2020. The increase from
2020 to 2021 was mainly due to higher liquids and gas prices in addition to lower net impairments in 2021.
16
In February 2022, Equinor announced its intention to exit its business activities in Russia. See note 27 Subsequent events to the
Consolidated financial statements.
100 Equinor, Annual Report on Form 20-F 2021
Net impairment losses in 2021 amounted to USD 112 million relating to the US offshore leaseholds, changes to commodity prices
assumptions, reduced reservoir performance and reduced fair value related to an asset held for sale in the first quarter of 2021. Net
impairment losses in 2020 amounted to USD 2,758 million, with impairments of unconventional onshore assets in North America as
the largest contributors caused by decreased long-term price assumptions, changed operational plans for certain assets and a
reduced fair value for one asset.
Balance sheet information:
the year ended 31 December 2021, compared to USD 12,586 million for the year ended 31 December 2020.
The average daily equity liquids and gas production
decrease of 7% from 2020 to 2021 was mainly driven by the divestment of Bakken in the second quarter of 2021 partially offset by
higher production from the Appalachian unconventional onshore asset.
The average daily entitlement liquids and gas production
Entitlement production decreased by 7% from 2020 to 2021 due to lower equity production as described above offset by lower US
royalties driven by the Bakken divestment. The effect of US royalties was 52 mboe per day in 2021 and 58 mboe per day in 2020.
For more information about equity and entitlement production see section 5.7 Terms and abbreviations
.
E&P USA - condensed income statement under IFRS
For the year ended 31 December
(in USD million)
2021
2020
21-20 change
Revenues
4,149
2,615
59%
Net income/(loss) from equity accounted investments
0
0
0%
Total revenues and other income
4,149
2,615
59%
Operating, selling, general and administrative expenses
(1,076)
(1,313)
(18%)
Depreciation, amortisation and net impairment losses
(1,733)
(3,824)
(55%)
Exploration expenses
(190)
(990)
(81%)
Net operating income/(loss)
1,150
(3,512)
N/A
E&P USA generated
total revenues and other income
of USD 4,149 million in 2021, compared to USD 2,615 million in 2020.
Revenues
were USD 4,149 million in 2021, compared to USD 2,615 million in 2020. The 59% increase from 2020 to 2021 was mainly
due to higher realised liquids and gas prices, partially offset by the effects of the Bakken divestment in second quarter 2021. Equinor
closed the Bakken transaction on 26 April 2021.
Net income/(loss) from equity accounted investments
Operating, selling, general and administrative expenses
were USD 1,076 million in 2021, compared to USD 1,313 million in 2020.
The 18% decrease from 2020 to 2021 was mainly due to the Bakken divestment in the second quarter of 2021 and reduced manning.
Depreciation, amortisation and net impairment losses
were USD 1,733 million in 2021, compared to USD 3,824 million in 2020.
The 55% decrease from 2020 to 2021 was primarily due to lower ordinary depreciation cost due to an asset classified as held for sale
at year end 2020 and lower net impairments.
Exploration expenses
were USD 190 million in 2021, compared to USD 990 million in 2020. The decrease from 2020 to 2021 was
primarily due to lower net impairments of exploration prospects and signature bonuses in 2021 of USD 44 million compared with USD
822 million in 2020, and lower drilling expenditures compared to 2020. The decrease was partially offset by increased field
development cost due to increased activity compared to 2020.
In 2021, there was exploration activity in one well with no wells completed, compared to five wells with three wells completed in 2020.
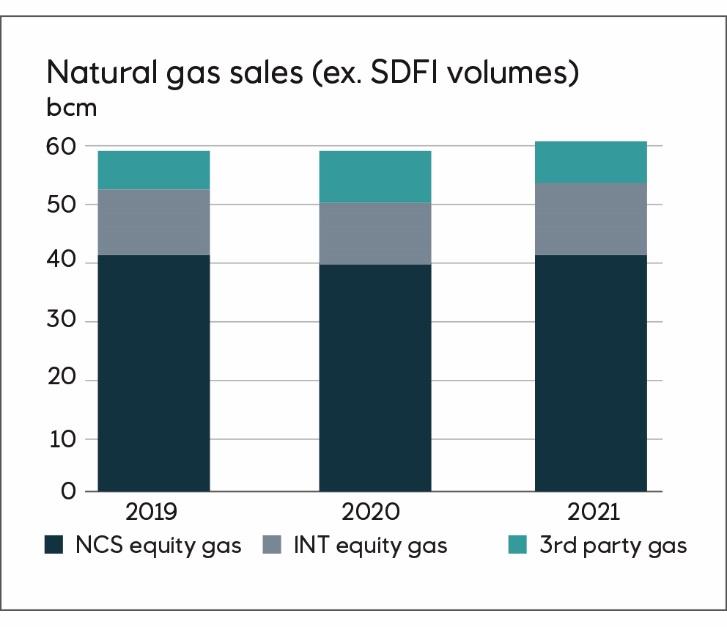
Equinor, Annual Report on Form 20-F 2021 101
MMP profit and loss analysis
Net operating income
mainly due to significant positive impact from gas derivatives, higher results from liquids trading, lower impairments and improved
processing margins, partially offset by the continued outage at the Hammerfest LNG plant due to shutdown.
Net operating income was negatively impacted by impairments of USD 718 million related to refinery assets. Operational storage
effects of USD 231 million and other income of 167 million related to disposal of refinery asset partially offset the decrease. In 2020,
net operating income was negatively impacted by impairments of USD 1,060 million mostly related to refinery assets and higher
provisions of USD 245 million. Inventory hedging effects of USD 224 million and operating storage effects of USD 127 million added to
decrease.
Balance sheet information:
the year ended 31 December 2021, compared to USD 4,460 million for the year ended 31 December 2020.
The total natural gas sales volumes were 61.0 bcm in 2021, increased by 1.8 bcm compared to total volumes for 2020. The increase
in the NCS equity gas volumes was partially offset by a decrease in third party gas. The following chart does not include any volumes
sold on behalf of the Norwegian State's direct financial interest (SDFI).
In 2021, the average invoiced natural gas sales price in Europe was USD 14.60 per mmBtu, up 308% from USD 3.58 per mmBtu in
2020. The 2020 average invoiced natural gas price in Europe was down 38% from 2019 (USD 5.79 per mmBtu).
In 2021, the average invoiced natural gas sales price in North America was USD 3.22 mmBtu, up 87% from USD 1.72 mmBtu in 2020.
The 2020 average invoiced natural gas sales price in North Americas was down 29% from 2019 (USD 2.43 mmBtu).
All of Equinor's gas produced on the NCS is sold by MMP and purchased from E&P Norway at the fields’ lifting point at a market-
based internal price with deduction for the cost of bringing the gas from the field to the market and a marketing fee element. Our NCS
transfer price for gas was USD 14.43 per mmBtu in 2021, an increase of 537% compared to USD 2.26 per mmBtu in 2020. The 2020
NCS transfer price was down 49% from 2019 (USD 4.46 per mmBtu).
The average crude, condensate and NGL sales were 2.1 mmbbl per day in 2021 of which approximately 0.90 mmbbl were sales of
our equity volumes, 0.78 mmbbl were sales of third party volumes and 0.39 mmbbl were sales of volumes purchased from SDFI. Our
average sales volumes were 2.2 mmbbl per day in 2020 and 2.1 mmbbl per day in 2019. The average daily third-party sales volumes
were 0.87 and 0.89 mmbbl in 2020 and 2019.
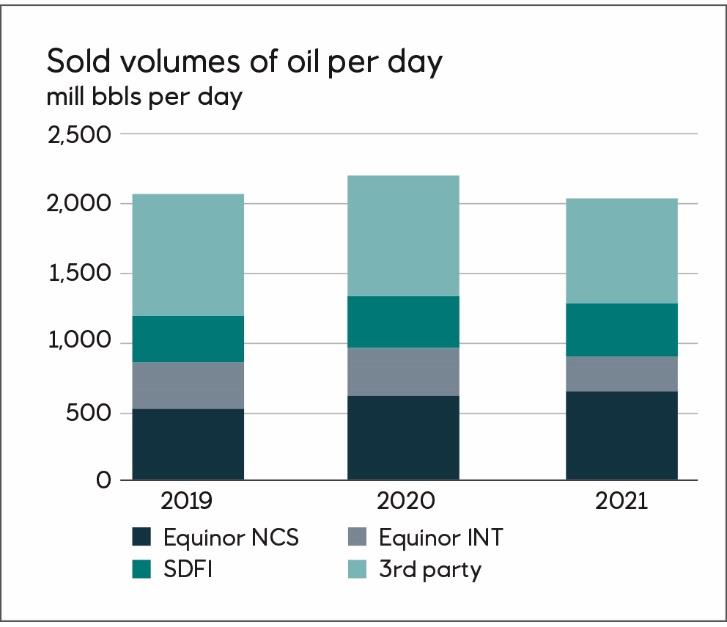
102 Equinor, Annual Report on Form 20-F 2021
MMP’s refining margins were higher for Mongstad and Kalundborg in 2021 compared to 2020. Equinor's refining reference margin
was 4.0 USD/bbl in 2021, compared to 1.5 USD/bbl in 2020, an increase of more than 100% due to recovery of the market in the
second half of 2021 after Covid-19 led to very low product demand in 2020.
MMP - condensed income statement under IFRS
For the year ended 31 December
(in USD million)
2021
2020
Change
Revenues
87,179
44,906
94%
Net income/(loss) from equity accounted investments
22
31
(30%)
Other income
168
9
>100%
Total revenues and other income
87,368
44,945
94%
Purchases [net of inventory]
(80,873)
(38,072)
>100%
Operating, selling, general and administrative expenses
(4,276)
(5,060)
(16%)
Depreciation, amortisation and net impairment losses
(1,079)
(1,453)
(26%)
Net operating income/(loss)
1,141
359
>100%
Total revenues and other income
The increase in
revenues
from liquids and improved processing margins, partially offset by the outage of Hammerfest LNG plant.
Other income
As a result of the factors explained above,
total revenues and other income
Purchases [net of inventory]
2021 was mainly due to higher prices for both gas and liquids, partially offset by lower volumes for liquids.
Operating expenses and selling, general and administrative expenses
million in 2020. The decrease from 2020 to 2021 was mainly due to significant lower transportation costs due to weak freight market in
addition to lower volumes. Higher costs at operating plants partially offset the decrease.
Depreciation, amortisation and net impairment losses
The
decrease was mainly due to lower impairments in 2021 compared to 2020.
Equinor, Annual Report on Form 20-F 2021 103
Renewables profit and loss analysis
Net operating income
mainly due to gain on divestments completed in the first quarter of 2021 of around USD 1.4 billion. Higher net income from equity
accounted investments related to assets in production added to the increase. Lower net income from equity accounted investments
related to assets under development (where project costs are expensed) in addition to increased business development costs driven
by higher activity level in the US, the UK and in Asia partially offset the increase.
Balance sheet information:
December 2021, compared to USD 1,020 million for the year ended 31 December 2020.
Power generation
(Equinor share)
was 1,562 GWh in the full year of 2021, compared to 1,662 GWh in the full year of 2020. The
decrease was mainly due to less wind. The decrease was partially offset by start-up of production from the Guanizuil IIA solar plant in
Argentina in 2021.
REN - condensed income statement under IFRS
For the year ended 31 December
(in USD million)
2021
2020
Change
Revenues
8
18
(54%)
Net income/(loss) from equity accounted investments
16
163
(90%)
Other income
1,386
0
N/A
Total revenues and other income
1,411
181
>100%
Operating, selling, general and administrative expenses
(163)
(215)
24%
Depreciation, amortisation and net impairment losses
(3)
(1)
>(100%)
Exploration expenses
0
0
N/A
0
0
N/A
Net operating income/(loss)
1,245
(35)
N/A
Total revenues and other income
were USD 1,411 million in 2021 and USD 181 million in 2020.
Net income (loss) from equity accounted investments
results from equity accounted investments were mainly due to costs related to the progressing of the Empire Wind and Beacon Wind
assets on the US east coast. These assets have changed consolidation method from proportional to equity accounted investments in
2021, following the farm-down of 50% of the owner share in the first quarter of 2021. Higher net income from equity accounted
investments related to assets in production partially offset the decrease.
Other income
Operating expenses and selling, general and administrative expenses
million in 2020. The decrease was mainly due to changed consolidation method for the Empire Wind and Beacon Wind assets,
partially offset by increased business development costs driven by higher activity level in the US, the UK and in Asia.
Other
The Other reporting segment includes activities within; Projects, Drilling & Procurement, Technology, Digital & Innovation, corporate
staffs and support functions, and IFRS 16 leases. All lease contracts are presented within the Other segment.
In 2021, the Other reporting segment recorded a net operating loss of USD 210 million compared to a net operating loss of USD 63
million in 2020. The increased loss compared to 2020 was mainly due to insurance costs related to the fire at Melkøya LNG in late
September 2020.
104 Equinor, Annual Report on Form 20-F 2021
2.12
Liquidity and capital resources
A discussion of certain items in respect of 2019 may be found in our Annual Report on Form 20-F for the year ended 31 December
2020, filed with the SEC on 19 March 2021.
Review of cash flows
Equinor’s cash flow generation in 2021 increased by USD 6,483 million compared to 2020.
Consolidated statement of cash flows
Full year
(in USD million)
2021
2020
Cash flows provided by operating activities
Cash flows used in investing activities
Cash flows provided by/(used in) financing activities
Net increase/(decrease) in cash and cash equivalents
Cash flows provided by operating activities
The most significant drivers of cash flows provided by operations were the level of production and prices for liquids and natural gas
that impact revenues, purchases [net of inventory], taxes paid and changes in working capital items.
In 2021, Cash flows provided by operating activities increased by USD 18,430 million compared to 2020. The increase was mainly
due to higher liquids and gas prices, partially offset by increased tax payments, changes in working capital and increased derivatives
payments.
Cash flows used in investing activities
increased financial investments, partially offset by increased proceeds from sale of assets.
Cash flows used in financing activities
increased by USD 7,827 million compared to 2020. The increase was mainly due to bonds
issued in the first half of 2020 and increased repayment of short-term debt and increased collateral payments, partially offset by
increase in short term debt, decreased payments related to the share buy-back programme and decreased dividend paid.
Financial assets and debt
The net debt to capital employed ratio before adjustments at year end decreased from 36.5% in 2020 to 2.2% in 2021. See section
5.2 for non-GAAP measures for net debt ratio. Net interest-bearing debt decreased from USD 19.5 billion to USD 0.9 billion. During
2021 Equinor's total equity increased from USD 33.9 billion to USD 39.0 billion, mainly driven by higher liquids and gas prices in 2021.
Equinor has paid out four quarterly dividends in 2021. For the fourth quarter of 2021 the board of directors will propose to the AGM to
declare a dividend of USD 0.20 per share and to introduce
an extraordinary quarterly cash dividend of USD 0.20 per share for 4Q
2021 and for the first three quarters of 2022. For further information, see note 18 Shareholders’ equity and dividends to the
Consolidated financial statements.
Equinor believes that, given its current liquidity reserves, including a committed revolving credit facility of USD 6.0 billion and its
access to global capital markets, Equinor will have sufficient funds available to meet its liquidity needs and its working capital
requirements.
Funding needs arise as a result of Equinor’s general business activities. Equinor generally seeks to establish financing at the
corporate (top company) level. Project financing may be used in cases involving incorporated joint ventures with other companies.
Equinor, Annual Report on Form 20-F 2021 105
Equinor aims to have access to a variety of funding sources across different markets and instruments at all times, as well as to
maintain relationships with a core group of international banks that provide a wide range of banking services.
The management of financial assets and liabilities takes into consideration funding sources, the maturity profile of non-current debt,
interest rate risk, currency risk and available liquid assets. Equinor’s borrowings are denominated in various currencies and normally
swapped into USD. In addition, interest rate derivatives, primarily interest rate swaps, are used to manage the interest rate risk of the
long-term debt portfolio. Equinor’s funding and liquidity activities are handled centrally.
Equinor has diversified its cash investments across a range of financial instruments and counterparties to avoid concentrating risk in
any one type of investment or any single country. As of
31 December 2021, approximately 20% of Equinor’s liquid assets were held in USD-denominated assets, 22% in NOK, 25% in EUR,
9% in DKK and 22% in SEK, before the effect of currency swaps and forward contracts. Approximately 27% of Equinor’s liquid assets
were held in time deposits, 58% in treasury bills and commercial papers and 8 % in money market funds. As of 31 December 2021,
approximately 6% of Equinor’s liquid assets were classified as restricted cash (including collateral deposits).
Equinor’s general policy is to keep a liquidity reserve in the form of cash and cash equivalents or other current financial investments in
Equinor’s balance sheet, as well as committed, unused credit facilities and credit lines in order to ensure that Equinor has sufficient
financial resources to meet short-term requirements.
Long-term funding is raised when a need is identified for such financing based on Equinor’s business activities, cash flows and
required financial flexibility or when market conditions are considered to be favourable.
The Group's borrowing needs are usually covered through the issuance of short-, medium- and long-term securities, including
utilisation of a US Commercial Paper Programme (programme limit USD 5.0 billion) and issuances under a Shelf Registration
Statement filed with the SEC in the US and a Euro Medium-Term Note (EMTN) Programme (programme limit EUR 20 billion) listed on
the London Stock Exchange. Committed credit facilities and credit lines may also be utilised. After the effect of currency swaps, the
major part of Equinor’s borrowings is in USD.
In 2021 Equinor did not issue any new bonds. In May 2020, Equinor issued USD 1.5 billion in new bonds in the US bond
market, amount equally split between 5 and 10 years to maturity, in addition to EUR 1.0 billion in new bonds in the European market
with 12 years to maturity and EUR 750 million with 6 years to maturity. In April 2020 Equinor issued USD 1.25 billion new bonds with 5
years to maturity, USD 500 million with 7 years to maturity, USD 1.5 billion with 10 years to maturity, USD 500 million with 20 years to
maturity and USD 1.25 billion with 30 years to maturity. All the bonds are unconditionally guaranteed by Equinor Energy AS. For more
information, see note 19 Finance debt to the Consolidated financial statements.
Financial indicators
(in USD million)
2021
2020
Gross interest-bearing debt
36,239
38,115
Net interest-bearing debt before adjustments
867
19,493
Net debt to capital employed ratio
2.2%
36.5%
Net debt to capital employed ratio adjusted, including lease liabilities
7.7%
37.3%
Net debt to capital employed ratio adjusted
(0.8%)
31.7%
Cash and cash equivalents
14,126
6,757
Current financial investments
21,246
11,865
1)
Defined as non-current and current finance debt.
2)
As calculated based on IFRS balances. Net debt to capital employed ratio is the net debt divided by capital employed. Net debt is interest-
bearing debt less cash and cash equivalents and current financial investments. Capital employed is net debt, shareholders' equity and
minority interest.
3)
In order to calculate the net debt to capital employed ratio adjusted, Equinor makes adjustments to capital employed as it would be
reported under IFRS. Restricted funds held as financial investments in Equinor Insurance AS and Collateral deposits are added to the net
debt while the lease liabilities are taken out of the net debt. See section 5.2 Net debt to capital employed ratio for a reconciliation of capital
employed and a discussion of why Equinor considers this measure to be useful.
106 Equinor, Annual Report on Form 20-F 2021
Gross interest-bearing debt
Gross interest-bearing debt was USD 36.2 billion and USD 38.1 billion at 31 December 2021 and 2020, respectively. The USD 1.9
billion net decrease from 2020 to 2021 was due to an increase in current finance debt of USD 0.7 billion, a decrease in current lease
liabilities of USD 0.1 billion, a decrease in non-current lease liabilities of USD 0.8 billion and a decrease in non-current finance debt of
USD 1.7 billion. The weighted average annual interest rate on finance debt was 3.33% and 3.38% at 31 December 2021 and 2020,
respectively. Equinor’s weighted average maturity on finance debt was ten years at 31 December 2021 and ten years at 31 December
2020.
Net interest-bearing debt
Net interest-bearing debt before adjustments were USD 0.9 billion and USD 19.5 billion at 31 December 2021 and 2020, respectively.
The decrease of USD 18.6 billion from 2020 to 2021 was mainly related to an increase in cash and cash equivalents of USD 7.3
billion, a USD 9.3 billion increase in current financial investments and a decrease in gross interest-bearing debt of USD 1.9 billion.
The net debt to capital employed ratio
The net debt to capital employed ratio before adjustments was 2.2% and 36.5% in 2021 and 2020, respectively.
The net debt to capital employed ratio adjusted (see footnote three above) was -0.8% and 31.7% in 2021 and 2020, respectively.
The 34.3 percentage points decrease in net debt to capital employed ratio before adjustments from 2020 to 2021 was related to the
decrease in net interest-bearing debt of USD 18.6 billion in combination with a decrease in capital employed of USD 13.5 billion.
The 32.5 percentage points decrease in net debt to capital employed ratio adjusted from 2020 to 2021 was related to the decrease in
net interest-bearing debt adjusted of USD 16.0 billion in combination with a decrease in capital employed adjusted of USD 10.9 billion.
Cash, cash equivalents and current financial investments
Cash and cash equivalents were USD 14.1 billion and USD 6.8 billion at 31 December 2021 and 2020, respectively. See note 17
Cash and cash equivalents to the Consolidated financial statements for information concerning restricted cash. Current financial
investments, which are part of Equinor’s liquidity management, amounted to USD 21.2 billion and USD 11.9 billion at 31 December
2021 and 2020, respectively.
Investments
In 2021, capital expenditures, defined as Additions to PP&E, intangibles and equity accounted investments in note 4 Segments to the
Consolidated financial statements, amounted to USD 8.5 billion of which USD 8.1 billion were organic capital expenditures
17
.
In 2020, capital expenditures were USD 9.8 billion, as per note 4 Segments to the Consolidated financial statements, of which organic
capital expenditures
7
In 2019, capital expenditures were USD 14.8 billion, as per note 4 Segments to the Consolidated financial statements, of which
organic capital expenditures
7
In Norway, a substantial proportion of 2022 capital expenditures will be spent on ongoing development projects such as Johan
Castberg, and Johan Sverdrup phase 2, in addition to various extensions, modifications and improvements on currently producing
fields.
Internationally, we currently estimate that a substantial proportion of 2022 capital expenditure will be spent on the following ongoing
and planned development projects: Bacalhau phase 1 and Peregrino in Brazil, and offshore and non-operated onshore activity in the
USA.
Within renewable energy, capital expenditure in 2022 is expected to be spent mainly on offshore wind projects.
17
Equinor, Annual Report on Form 20-F 2021 107
Equinor finances its capital expenditures both internally and externally. For more information, see Financial assets and debt earlier in
this chapter.
As illustrated in section Principal contractual obligations below, Equinor has committed to certain investments in the future. The further
into the future, the more flexibility we will have to revise expenditure. This flexibility is partially dependent on the expenditure joint
venture partners agree to commit to. A large part of the capital expenditure for 2022 is committed.
Equinor may alter the amount, timing or segmental or project allocation of capital expenditures in anticipation of, or as a result of a
number of factors outside our control.
108 Equinor, Annual Report on Form 20-F 2021
Principal contractual obligations
The following table summarises principal contractual obligations, excluding derivatives and other hedging instruments, as well as
asset retirement obligations which for the most part are expected to lead to cash disbursements more than five years into the future.
Non-current finance debt in the table represents principal payment obligations, including interest obligation. Obligations payable by
Equinor to entities accounted for in the Equinor group using the equity method are included in the table below with Equinor’s full
proportionate share. For assets that are included in the Equinor accounts through joint operations or similar arrangements, the
amounts in the table include the net commitment payable by Equinor (i.e. Equinor’s proportionate share of the commitment less
Equinor's ownership share in the applicable entity).
Principal contractual obligations
As at 31 December 2021
Payment due by period
1)
(in USD million)
Less than 1
year
1-3 years
3-5 years
More than 5
years
Total
Undiscounted non-current finance debt- principal and interest
2)
910
6,684
6,140
23,485
37,218
Undiscounted leases
3)
1,183
1,262
656
800
3,900
Nominal minimum other long-term commitments
4)
2,663
3,597
2,333
4,547
13,140
Total contractual obligations
4,755
11,543
9,129
28,831
54,258
1)
''Less than 1 year'' represents 2022; ''1-3 years'' represents 2023 and 2024, ''3-5 years'' represents 2025 and 2026, while ''More than 5
years'' includes amounts for later periods.
2)
See note 19 Finance debt to the Consolidated financial statements. The main differences between the table and the note relate to
interest.
3)
See note 6 Financial risk management to the Consolidated financial statements.
4)
See note 24 Other commitments and contingencies to the Consolidated financial statements.
Equinor had contractual commitments of USD 8.286 billion at
31 December 2021. The contractual commitments reflect Equinor's share and mainly comprise construction and acquisition of
property, plant and equipment.
Equinor’s projected pension benefit obligation was USD 9.358 billion, and the fair value of plan assets amounted to USD 6.404 billion
as of 31 December 2021. The company’s payments regarding these benefit plans are mainly related to employees in Norway. See
note 20 Pensions to the Consolidated financial statements for more information.
Off balance sheet arrangements
Equinor is party to various agreements such as transportation and processing capacity contracts, that are not recognised in the
balance sheet. For more information, see Principal contractual obligations in section 2.12 Liquidity and capital resources. Furthermore,
Equinor, Annual Report on Form 20-F 2021 109
Equinor is lessee in a range of lease contracts, whereas all leases shall be recognised in the balance sheet. Commitments regarding
the non-lease components of lease contracts as well as leases that have not yet commenced are not recognised in the balance sheet
and represent off balance sheet commitments. Equinor is also party to certain guarantees, commitments and contingencies that,
pursuant to IFRS, are not necessarily recognised in the balance sheet as liabilities. See note 24 Other commitments and
contingencies
to the Consolidated financial statements for more information.
110 Equinor, Annual Report on Form 20-F 2021
Summarised financial information related to guaranteed debt securities
The following summarised financial information provides financial information of Equinor Energy AS as co-obligor and guarantor
as required by SEC Rule 3-10 and 13-01 of Regulation S-X.
Equinor Energy AS is a 100% owned subsidiary of Equinor ASA. Equinor Energy AS is the co-obligor of certain existing debt
securities of Equinor ASA and has guaranteed certain existing debt securities of Equinor ASA, including in each case debt securities
that are registered under the US Securities Act of 1933 ("US registered debt securities").
As co-obligor, Equinor Energy AS fully, unconditionally and irrevocably assumes and agrees to perform, jointly and severally with
Equinor ASA, the payment and covenant obligations for certain debt held by Equinor ASA. As a guarantor, Equinor Energy AS fully
and unconditionally guarantees the payment obligations for certain debt held by Equinor ASA. Total debt at 31 December 2021 is
USD 27,650 million, all of which is either guaranteed by Equinor Energy AS (USD 25,493 million), or for which Equinor Energy AS is
co-obligor (USD 2,157 million). In the future, Equinor ASA may from time to time issue debt for which Equinor Energy AS will be the
co-obligor or guarantor.
The applicable US registered debt securities and related guarantees of Equinor Energy AS are unsecured and rank equally with all
other unsecured and unsubordinated indebtedness of Equinor ASA and Equinor Energy AS. The guarantees of Equinor Energy AS
are subject to release in limited circumstances upon the occurrence of certain customary conditions. With respect to US registered
debt securities (and certain other debt securities) issued on or after 18 November 2019, Equinor Energy AS will automatically and
unconditionally be released from all obligations under its guarantee and the guarantee shall thereupon terminate and be discharged of
no further force or effect, in the event that at substantially the same time as its guarantee of such debt securities is terminated, the
aggregate amount of indebtedness for borrowed money for which Equinor Energy AS is an obligor (as a guarantor, co-issuer or
borrower) does not exceed 10% of the aggregate principal amount of indebtedness for borrowed money of Equinor ASA and its
subsidiaries, on a consolidated basis, as of such time.
Internal dividends, group contributions and repayment of capital from Equinor Energy AS to Equinor ASA are regulated in the
Norwegian Public Limited Liabilities Act §§ 3-1 - 3-5.
The following summarised financial information for the year ended 31 December 2021 provides financial information about Equinor
ASA, as issuer, and Equinor Energy AS, as co-obligor and guarantor on a combined basis after elimination of transactions between
Equinor ASA and Equinor Energy AS. Investments in non-guarantor subsidiaries are eliminated.
Intercompany balances and transactions between the obligor group and the non-guarantor subsidiaries are presented on separate
lines. Transactions with related parties are also presented on a separate line item and include transactions with the Norwegian State's
and the Norwegian State’s share of dividend declared but not paid.
The combined summarized financial information is prepared in accordance with Equinor's IFRS accounting policies as described in
note 2 Significant accounting policies.
Equinor, Annual Report on Form 20-F 2021 111
COMBINED PROFIT AND LOSS STATEMENT FOR EQUINOR ASA AND EQUINOR ENERGY AS
Full year
2021
(unaudited, in USD million)
Revenues and other income
External
Non-guarantor subsidiaries
Related parties
Operating expenses
External (incl depreciation)
Non-guarantor subsidiaries
Related parties
Net operating income
Net financial items
External
Non-guarantor subsidiaries
Related parties
Income before tax
Income tax
Net income
COMBINED BALANCE SHEET FOR EQUINOR ASA AND EQUINOR ENERGY AS
At 31
2021
Non-current assets
External
Non-guarantor subsidiaries
Related parties
Current assets
External
Non-guarantor subsidiaries
Related parties
Non-current liabilities
External
Non-guarantor subsidiaries
Related parties
Current liabilities
External
Non-guarantor subsidiaries
Related parties
112 Equinor, Annual Report on Form 20-F 2021
2.13
Risk review
Risk factors
Equinor is exposed to risks that separately, or in combination, could affect its operational and financial performance. In this section,
some of the key risks are addressed.
Risks related to our business, strategy and operations
This section describes the most significant potential risks relating to Equinor`s business, strategy and operations.
Oil and natural gas price.
Fluctuating prices of oil and/or natural gas impact our financial performance. Generally, Equinor will not
have control over the factors that affect the prices of oil and natural gas.
The prices of oil and natural gas have fluctuated significantly over the last years. Fundamental market forces and other factors beyond
the control of Equinor or other similar market participants have impacted and will continue to impact oil and natural gas prices.
Factors that affect the prices of oil and natural gas include:
●
●
●
●
●
production levels and prices;
●
non-governmental organisations in response to such situations, and the effects of such situations on demand;
●
●
●
●
●
●
In 2021, there has been significant price volatility, primarily triggered by high economic growth and subsequent supply chain
bottlenecks on the back of measures to contain the Covid-19 pandemic. See also “Covid-19 pandemic” below. Developments relating
to Russia’s invasion of Ukraine could adversely affect global and regional economic conditions and trigger volatility in the prices of oil,
natural gas and energy generally.
Climate change in general, the energy transition, governmental regulations and policies, and the world`s ambition to reach the climate
targets set out in the Paris Agreement could, either together or independently, influence oil and natural gas prices. Equinor’s long-term
plans have to take into consideration a large outcome space for how the global energy markets may develop in the long term.
Estimating global energy demand decades ahead is an extremely difficult task, as it involves assessing the future development in
supply and demand, technology change, taxation (including, taxes on emissions), production limits and other factors.
Decreases in oil and/or natural gas prices could have an adverse effect on Equinor's business, the results of operations, financial
condition, and liquidity and Equinor's ability to finance planned capital expenditure, including possible reductions in capital
expenditures, which in turn could lead to reduced reserve replacement.
A significant or prolonged period of low oil and natural gas prices or other indicators would, if deemed to have longer term impact, lead
to reviews for impairment of the group's oil and natural gas assets. Such reviews would reflect management's view of long-term oil
and natural gas prices and could result in a charge for impairment that could have a significant effect on the results of Equinor's
operations in the period in which it occurs. Changes in management’s view on long-term oil and/or natural gas prices or further
material reductions in oil, gas and/or product prices could have an adverse impact on the economic viability of projects that are
planned or in development. See also Note 2 Significant accounting policies to the Consolidated financial statements for a discussion
of key sources of uncertainty with respect to management’s estimates and assumptions that affect Equinor’s reported amounts of
assets, liabilities, income and expenses and Note 11 Property, plants, and equipment to the Consolidated financial statements for a
discussion of price assumptions and sensitivities affecting the impairment analysis.
Equinor, Annual Report on Form 20-F 2021 113
Proved reserves and expected reserves estimates.
Crude oil and natural gas reserves are based on estimates and Equinor’s
future production, revenues and expenditures with respect to its reserves may differ from these estimates.
The reliability of the reserve estimates is dependent on:
●
●
●
●
the date the estimates are made.
Many of the factors, assumptions and variables involved in estimating reserves are beyond Equinor’s control and may prove to be
incorrect over time. The results of drilling, testing and production after the date of the estimates may require substantial upward or
downward revisions in Equinor’s reserve data.
In addition, proved reserves are estimated based on the US Securities and Exchange Commission (SEC) requirements and may
therefore differ substantially from Equinor’s view on expected reserves. The prices used for proved reserves are defined by the SEC
and are calculated based on a 12-month unweighted arithmetic average of the first day of the month price for each month during the
reporting year, leading to a forward price strongly linked to last year’s price environment.
Fluctuations in oil and gas prices will have a direct impact on Equinor’s proved reserves. For fields governed by production sharing
agreements (PSAs), a lower price may lead to higher entitlement to the production and increased reserves for those fields.
Conversely, a lower price environment may also lead to lower activity resulting in reduced reserves. For PSAs, these two effects may
to some degree offset each other. In addition, a lower price environment may result in earlier shutdown due to uneconomic
production. This will affect both PSAs and fields with concession types of agreement.
Climate change and transition to a lower carbon economy.
A transition to a lower carbon economy will affect Equinor’s business
and entails risks related to policy, legal, regulatory, market, technology developments as well as reputational impact.
Risks related to changes in policies, laws and regulations: Equinor expects, and is preparing for, regulatory changes and policy
measures targeted at reducing greenhouse gas emissions. Stricter climate regulations and policies could impact Equinor's financial
outlook, including the value of its assets, whether directly through changes in taxation, other costs to operations and projects, and
access to acreage, or indirectly through changes in consumer behaviour or technology developments.
Equinor expects greenhouse gas emission costs to increase from current levels and to have a wider geographical range than today.
Equinor applies a default minimum carbon price in investment analysis starting at 58 USD per tonne in 2022, increasing towards 100
USD per tonne by 2030. In countries where the actual or predicted carbon price is higher than our default at any point in time, Equinor
applies the actual or expected cost, such as in Norway where both a CO
2
The new EU Green Deal, EU Taxonomy and climate-related regulations and carbon pricing in specific countries imply more future
uncertainty. Climate-related policy changes may also reduce access to prospective geographical areas for exploration and future
production. Disruptive policy changes may not be ruled out, possibly triggered by severe weather events affecting public perception
and policy making.
Market and technology risks: A transition to a low carbon economy contributes to uncertainty over future demand and prices for oil
and gas as described in the section “Oil and natural gas price”. Such price sensitivities of the project portfolio are described in section
2.14 Safety, security and sustainability. Increased demand for and improved cost competitiveness of renewable energy, and
innovation and technology changes supporting the further development and use of renewable energy and low-carbon technologies,
represent both threats and opportunities for Equinor.
Reputational impact: Increased concern over climate change could lead to increased expectations on fossil fuel producers, as well as
a more negative perception of the oil and gas industry. This could lead to increased litigation-related costs and poor reputation could
affect our license to operate as well as our ability to attract and retain talent and key competences.
All of these risks could lead to an increased cost of capital. For example, certain lenders have recently indicated that they will direct or
restrict their lending activities based on environmental parameters.
Equinor’s net zero path and climate related ambitions are a response to challenges related to climate change and the energy
transition. There is no assurance that Equinor’s climate related ambitions will be achieved. The achievement of the mid- and long-term
climate ambitions depends, in part, on broader societal shifts in consumer demands and technological advancements, each of which
are beyond Equinor’s control. Should society’s demands and technological innovation not shift in parallel with Equinor’s pursuit of
significant greenhouse gas emission reductions, Equinor’s ability to meet its climate ambitions will be impaired.
114 Equinor, Annual Report on Form 20-F 2021
Move to a broader energy company and acceleration of renewable growth.
For Equinor to build a material renewable business,
covering also low carbon solutions such as hydrogen and carbon capture and storage (CCS), being competitive and getting access to
attractive acreage and opportunities at the right terms are key. Future conditions along with risks and uncertainties in power, hydrogen
and carbon markets as well as internal factors will influence our ability to achieve our ambitions relating to renewable energy.
Risks related to changes in policies, laws and regulations:
Policy makers in many modern electricity markets provide both direct and
indirect support to renewables aimed at helping the renewable industry to grow and mature. The framework for low carbon solutions
remains relatively immature while such solutions require material levels of investment. Potential regulatory changes, and new policy
measures related to support regimes represent both threats and opportunities for Equinor. However, regulatory stability and
predictability are key concerns in this area.
Market and technology risks: Technology development, such as for wind turbines, hydrogen production and carbon capture, is a
driving force to ensure financial viability of Equinor’s investments. Important risk factors are Equinor’s understanding of the markets,
market future development, and our ability to reduce costs and capitalize on technology improvements.
Financial and reputational impact: Strong competition for assets may lead to diminishing returns within the renewable and low carbon
industries and hamper the transition into a broader energy company. Competitive auctions/tenders where prices do not allow
absorption of higher costs may increase the exposure to inflation risk. This is also relevant for assets where the costs and/or income
have been locked in before the final investment decision.
Although renewables and low carbon solutions are generally perceived to be important means to meet climate challenges, these
industries may also entail impact on local communities and habitats. Accordingly, growth is also expected to be accompanied by
greater scrutiny from other industries and the society at large. Increasing criticism and push-back from environmental non-
governmental organisations and equivalents could lead to a negative perception of the renewable and low carbon industries which in
turn could lead to less access to attractive business opportunities.
Organisational risk factors: Equinor’s ambition of growth within the renewable and low carbon solutions domains highlights the need
for robust processes and fit-for-purpose management systems to ensure a solid growth foundation. Providing the renewable and low
carbon domains with a management system that is easy to adopt, implement, use and understand as well as ensuring sufficient
capability in the organization will be crucial to the future success of a broader energy company. This implies uncertainty and risks with
regards to continuously developing renewable and low carbon competence, having a disciplined capital allocation, ensuring enough
capacity and management focus on delivering a sustainable and fit for purpose growth.
Global operations.
Equinor is engaged in global activities that involve several technical, commercial and country-specific risks.
Technical risks of Equinor’s exploration activities relate to Equinor’s ability to conduct its seismic and drilling operations in a safe and
efficient manner and to encounter commercially productive oil and gas reservoirs. Technical risks of Equinor’s development and
operation activities relate to Equinor’s ability to design, construct, operate and maintain facilities and installations for hydrocarbon
exploitation, renewable energy generation and climate-related projects, such as carbon capture and storage.
Commercial risks relate to Equinor’s ability to secure access to new business opportunities in an uncertain global, competitive
environment and to recruit and maintain competent personnel and continue to ensure commercial viability of such business
opportunities in this context.
Country-specific risks relate, among other things, to health, safety and security, the political environment, compliance with and
understanding of local laws, regulatory requirements and/or license agreements, and impact on the environment and the communities
in which Equinor operates.
These risks may adversely affect Equinor’s current operations and financial results, and, for its oil- and gas activities, its long-term
replacement of reserves.
See “Covid-19 pandemic” below for further details on how the Covid-19 pandemic impacts Equinor’s operations. See “International
political, social, and economic factors” below for further details on how political, social, and economic factors could affect Equinor’s
business and Equinor’s intention to exit its business activities in Russia.
Decline of reserves.
Failure to discover, acquire and develop additional reserves, will result in material decline of reserves and
production from current levels.
Equinor's future production is dependent on its success in discovering or acquiring and developing additional reserves adding value. If
unsuccessful, future total proved reserves and production will decline.
If upstream resources are not progressed to proved reserves in a timely manner, Equinor’s reserve base, and thereby future
production, will gradually decline and future revenue will be reduced.
Equinor, Annual Report on Form 20-F 2021 115
In particular, in a number of resource-rich countries, national oil companies control a significant proportion of oil and gas reserves that
remain to be developed. To the extent that national oil companies choose to develop their oil and gas resources without the
participation of international oil companies, or if Equinor is unable to develop partnerships with national oil companies, its ability to
discover or acquire and develop additional reserves will be limited.
In addition, undeveloped resources could be impacted by low oil and/or gas prices over a sustained period of time. Such low prices
may result in Equinor deciding not to develop these resources or at least deferring development awaiting improved prices.
Health, safety and environmental.
Equinor is exposed to a wide range of health, safety and environmental risks that could result in
significant losses.
Exploration, project development, operation and transportation related to oil and natural gas, as well as development and operation of
renewable energy production, can be hazardous. In addition, Equinor’s activities and operations are affected by external factors like
difficult geographies, climate zones and environmentally sensitive regions.
Risk factors that could affect health, safety and the environment include human performance, operational failures, detrimental
substances, subsurface behaviour, technical integrity failures, vessel collisions, natural disasters, adverse weather conditions,
epidemics or pandemics, structural and organisational changes and other occurrences. Furthermore, non-compliance with our
management system could influence the potential for negative effects. These risk factors could result in disruptions of our operations
and could, among other things, lead to blowouts, structural collapses, loss of containment of hydrocarbons or other hazardous
materials, fires, explosions and water contamination that cause harm to people, loss of life or environmental damage. In particular, all
modes of transportation of hydrocarbons - including road, sea or pipeline - are susceptible to a loss of containment of hydrocarbons
and other hazardous materials and represent a significant risk to people and the environment.
As operations are subject to inherent uncertainty, it is not possible to guarantee that the management system or other policies and
procedures will be able to identify all aspects of health, safety and environmental risks. It is also not possible to say with certainty that
all activities will be carried out in accordance with these systems.
For a further description of Equinor’s health and safety results, including certain incidents in 2021, see section 2.14 Safety, security
and sustainability.
Security and cybersecurity threats.
Equinor is exposed to security threats that could have a materially adverse effect on Equinor's
results of operations and financial condition.
Security threats such as acts of terrorism, state-sponsored cyber operations, unauthorised access or attacks by hackers, computer
viruses, breaches due to unauthorized use, errors or malfeasance by employees or others who have gained access to the networks
and systems on which Equinor depends could result in loss of production, information, life and other losses. In particular, the scale,
sophistication and severity of cyber-attacks continue to evolve. Increasing digitisation and reliance on information technology (IT) and
operational technology (OT or Industrial and automation control systems, IACS) systems make managing cyber-risk a priority for
many industries, including the energy industry. Failure to manage these threats could materially disrupt Equinor’s operations. The
company could face regulatory actions, legal liability, reputational damage, and loss of revenue.
Failure to maintain and develop cybersecurity barriers, which are intended to protect Equinor’s IT infrastructure from being
compromised by unauthorized parties, may affect the confidentiality, integrity and availability of Equinor’s information systems and
digital solutions, including those critical to its operations. Attacks on Equinor’s information systems could result in significant financial
damage to Equinor, including as a result of material losses or loss of life due to such attacks. Equinor could also be required to spend
significant financial and other resources to remedy the damage caused by a security breach or to repair or replace networks and
information systems.
International political, social, and economic factors.
Equinor has interests in regions where political, social and economic
instability could adversely affect Equinor’s business.
Equinor has assets and operations in several countries and regions around the globe where negative political, social and economic
developments could occur. These developments and related security threats require continuous monitoring. Political instability, civil
strife, strikes, insurrections, acts of terrorism and acts of war, adverse and hostile actions against Equinor’s staff, its facilities, its
transportation systems and its digital infrastructure (cyberattacks) may cause harm to people and disrupt or curtail Equinor’s
operations and business opportunities, lead to a decline in production and otherwise adversely affect Equinor’s business, operations,
results and financial condition. Similarly, Equinor’s response to such situations could lead to claims from partners and relevant
stakeholders, litigation, and litigation-related costs.
Equinor holds an interest in one offshore and several onshore oil and gas projects in Russia. Some of these projects result from a
strategic cooperation with Rosneft Oil Company (Rosneft) initiated in 2012. In each of these projects, Rosneft holds the majority
interest. One of the projects is in Arctic offshore and deepwater area. As of 31 December 2021, Equinor had USD 1.2 billion in non-
116 Equinor, Annual Report on Form 20-F 2021
current assets in Russia.
On 28 February 2022 Equinor announced that it will stop new investments into its Russian businesses and
will start the process of exiting its joint ventures in Russia. It is expected that this decision will impact the book value of Equinor’s
Russian assets and lead to impairment. It is impossible to predict the timing and terms of such exit of Equinor’s interests in Russia or
the prices for which such interests may potentially be sold, all of which may be affected, among other factors, by trade restrictions and
sanctions or other steps taken by governmental authorities or any other relevant persons. Such prices could be significantly below the
book values of the assets divested and there is a risk that Equinor will not be able to recover any value from such assets.
Equinor also has investments in Argentina where revised foreign exchange and price regulations could adversely affect Equinor's
business.
Covid-19 pandemic.
Equinor’s operations and workforce have and continue to be impacted by the global Covid-19 pandemic. The
continuation or a resurgence of the pandemic, or the outbreak of other epidemics or pandemics, could precipitate or aggravate the
other risk factors identified in this report and materially impact Equinor’s operations and financial condition.
In 2021, the Covid-19 pandemic showed signs of being less severe. However, there continues to be uncertainty around the duration
and extent of the impact of the Covid-19 pandemic. Equinor’s operations and workforce, including projects under development, have
and continue to be impacted by the global Covid-19 pandemic. Quarantine rules, travel restrictions, workforce shortage, supply chain
disruptions and Covid-19 prevention and mitigation controls, such as social distancing requirements and reduced utilisation of offshore
beds, have resulted in lower activity levels on certain sites, causing delays, cost increases and disruption of further work. As a
consequence, the start-up of projects (Njord future, Johan Castberg and Peregrino phase 2) have been postponed. In addition, certain
of our suppliers and customers have and continue to be impacted by the spread of the pandemic, and the efforts to contain it, and
may as a result explore invoking contractual clauses such as those involving force majeure. There can be no assurance that the
ongoing Covid-19 pandemic, new variants, and efforts to contain the virus will not materially impact our operations or financial
condition.
The changes in market risk and economic circumstances from the Covid-19 pandemic will continue to impact Equinor’s assumptions
about the future and related sources of estimation uncertainty. The unprecedented nature of such market conditions could cause
current management estimates and assumptions to be challenged in hindsight.
The continuation or a resurgence of the pandemic, or outbreak of other pandemics or epidemics, could precipitate or aggravate the
other risk factors identified in this report. Such occurrences could further adversely affect Equinor’s business, financial condition,
liquidity, results of operations and profitability, including in ways not currently known or considered by us to present significant risks.
The effect of any infection control measures may also impact project execution.
Physical effects of climate change.
Changes in physical climate parameters could impact Equinor’s facility design and operations.
Examples of physical parameters that could impact Equinor’s facility design and operations include acute effects like increasing
frequency and severity of extreme weather events, and chronic effects like rising sea level, changes in sea currents and reduced
water availability. There is also uncertainty regarding the magnitude and time horizon for the occurrence of physical impacts of climate
change, which increases uncertainty regarding their potential impact on Equinor. The impact to Equinor could be increased costs or
incidents affecting our operations.
Unexpected changes in meteorological parameters, such as in the average wind speed, can also affect renewable power generation
outputs, resulting in performance above or below expectations.
Hydraulic fracturing.
Equinor is exposed to risks as a result of its use of hydraulic fracturing.
Equinor's US operations use hydraulic fracturing which is subject to a range of applicable federal, state and local laws, including those
discussed under the heading “Legal, Regulatory and Compliance Risks”. A case of subsurface migration of hydraulic fracturing fluids
or a case of spillage or mishandling of hydraulic fracturing fluids during these activities could subject Equinor to civil and/or criminal
liability and the possibility of incurring substantial costs, including for environmental remediation. In addition, various states and local
governments have implemented, or are considering, increased regulatory oversight of hydraulic fracturing through additional permit
requirements, operational restrictions, disclosure requirements and temporary or permanent bans. Changes to the applicable
regulatory regimes could make it more difficult to complete oil and natural gas wells in shale formations, cause operational delays,
increase costs of regulatory compliance or in exploration and production, which could adversely affect Equinor's US onshore business
and the demand for its fracturing services.
Crisis management systems.
Equinor's crisis management systems may prove inadequate.
If Equinor does not respond or is perceived not to have prepared, prevented, responded or recovered in an effective and appropriate
manner to a crisis, people, environment, assets and reputation could be severely affected. A crisis or disruption might occur as a
result of a security or cybersecurity incident or if a risk described under “Health, safety and environmental” materialises.
Equinor, Annual Report on Form 20-F 2021 117
Competition; innovation.
Equinor encounters competition from other companies in all areas of its operations. Equinor could be
adversely affected if competitors move faster or in other directions in the development and deployment of new technologies and
products.
Equinor may experience increased competition from larger players with stronger financial resources, from smaller ones with increased
agility and flexibility, and from an increasing number of companies applying new business models. Gaining access to attractive
opportunities via license rounds, auctions, and acquisitions, in addition to continued exploration and development of existing assets
are key to ensure the long-term economic viability of the business. Failure to address this could negatively impact future performance.
Technology and innovation are key competitive advantages in Equinor’s industry – both within the traditional oil and gas industry and
the renewable and low carbon industries. The ability to maintain efficient operations, develop and adapt to innovative technologies
and digital solutions, and seek profitable low carbon energy solutions are key success factors for future business and resulting
performance. Competitors may be able to invest more than Equinor in developing or acquiring intellectual property rights to
technology. Equinor could be adversely affected if it lags behind competitors and the industry in general in the development or
adoption of innovative technologies, including digitalisation and low carbon energy solutions.
Project development and production operations.
Equinor’s development projects and production operations involve uncertainties
and operating risks which could prevent Equinor from realising profits and cause substantial losses.
Oil and gas, renewable, low carbon and climate-related projects may be curtailed, delayed or cancelled for many reasons.
Unexpected events as equipment shortages or failures, natural hazards, unexpected drilling conditions or reservoir characteristics,
irregularities in geological formations, challenging soil conditions, accidents, mechanical and technical difficulties, challenges due to
new technology and quality issues might have significant impact. The risk is higher in new and challenging areas such as deep waters
or other harsh environments.
Equinor’s portfolio of development projects comprises a high number of mega-projects (eg. Njord Future, Johan Castberg and
Bacalhau phase 1), “first-off” projects (i.e., those involving a new project type/concept, a new area, a new execution model, a new
market and/or a new main contractor for Equinor), which represent an increasing portfolio complexity and potential execution risk.
In US onshore, low regional prices may render certain areas unprofitable, and production may be curtailed until prices recover. Market
changes and low oil, gas and power prices, combined with high levels of tax and government take in several jurisdictions, could erode
the profitability of some of Equinor’s activities.
Similarly, scarcity of electric power and grid capacity constraints, coupled with increasing electric power prices, could impede efforts to
reduce carbon emissions from facilities.
Strategic objectives.
Equinor may not achieve its strategic objectives of successfully exploiting profitable opportunities.
Equinor intends to continue to nurture attractive commercial opportunities to create value. This may involve acquisition of new
businesses, and/or properties or moving into new markets. Failure by Equinor to successfully pursue and exploit new business
opportunities, including in renewable and new energy solutions, could result in financial losses and inhibit value creation.
Equinor’s ability to achieve this strategic objective depends on several factors, including the ability to:
●
●
●
●
●
●
●
●
●
●
Equinor anticipates significant investments and costs as it cultivates business opportunities in new and existing markets. New projects
and acquisitions may have different embedded risks than Equinor’s existing portfolio. As a result, new projects and acquisitions could
result in unanticipated liabilities, losses or costs, as well as Equinor having to revise its forecasts either or both with respect to unit
production costs and production. In addition, the pursuit of acquisitions or new business opportunities could divert financial and
management resources away from Equinor’s day-to-day operations to the integration of acquired operations or properties. Equinor
may require additional debt or equity financing to undertake or consummate future acquisitions or projects, and such financing may
not be available on terms satisfactory to Equinor, if at all, and it may, in the case of equity, be dilutive to Equinor’s earnings per share.
118 Equinor, Annual Report on Form 20-F 2021
Transportation infrastructure.
The profitability of Equinor’s oil, gas and power production in remote areas may be affected by
infrastructure constraints.
Equinor’s ability to commercially exploit discovered petroleum resources depends, among other factors, on infrastructure to transport
oil, petroleum products and gas to potential buyers at a commercial price. Oil and petroleum products are transported by vessels, rail
or pipelines to potential customers/refineries, petrochemical plants or storage facilities, and natural gas is transported to processing
plants and end users by pipeline or vessels (for liquefied natural gas). Equinor’s ability to commercially exploit renewable opportunities
depends on available infrastructure to transmit electric power to potential buyers at a commercial price. Electricity is transmitted
through power transmission and distribution lines. Equinor must secure access to a power system with sufficient capacity to transmit
the electric power to the customers. Equinor may be unsuccessful in its efforts to secure transportation, transmission and markets for
all its potential production.
Reputation
.
to operate, and business opportunity set.
Societal and political expectations from our industry and business are high, especially in Norway with the Norwegian state as
Equinor’s majority owner. Safe and sustainable operations, ethical business conduct and compliance with laws and regulations are
prerequisites for access to natural resources, industrial value creation and contribution to society. Failure to deliver on societal and
political expectations, or non-compliance with ethical standards, laws and regulations, HSE and security/cybersecurity incidents could
impact our reputation. This could in turn have an adverse effect on Equinor’s licence to operate, ability to secure new business
opportunities, earnings and cash flow.
Norwegian State’s exercise of ownership.
Failure to deliver on expectations from the Parliament and the Ministry of Trade, Industry
and Fisheries (MTIF), and failure to deliver on societal and political expectations in general could impact the manner which the
Norwegian State exercises its ownership of the company.
On 1 July 2021 the responsibility to exercise the Norwegian State’s ownership in Equinor was transferred from the Ministry of
Petroleum and Energy (MPE) to MTIF. The MTIF’s exercise of ownership could also be subject to scrutiny by the Norwegian
Parliament.
In February 2021, Equinor was invited to a parliamentary hearing in the standing committee for scrutiny and constitutional affairs on
the Auditor-General’s review of the follow-up by the MPE of the state’s ownership in Equinor, with a specific focus on the company’s
international investments. Following the hearing, the standing committee in May 2021 endorsed the Auditor-General’s review,
including conclusions and recommendations. The recommendations expressed expectations with respect to the follow-up by the
ministry on Equinor’s financial reporting, and on risk, profitability and return in Equinor’s international portfolio. For additional
information on the management of the Norwegian State’s ownership interest in Equinor, see 3.4 Equal treatment of shareholders and
transactions with close associates.
Workforce.
Equinor may not be able to secure the right level of workforce competence and capacity.
As the energy industry is a long-term business, it needs to take a long-term perspective on workforce capacity and competence. The
uncertainty of the future of the oil industry, in light of potential reduced oil and natural gas prices, climate policy changes, the climate
debate affecting the perception of the industry, and increased competition for talent pose a risk to securing the right level of workforce
competence and capacity through industry cycles.
Changes to Equinor’s corporate structure
.
The implementation of the new corporate structure in 2021 and its continued
implementation may pose a risk for upholding safe and secure operations.
The changes to Equinor’s corporate structure were decided and implemented to further strengthen Equinor’s ability to deliver on our
strategy of always safe, high value and low carbon. The ongoing implementation process of these changes may divert management
and employee attention from tasks and responsibilities with a potential, negative impact on our ability to uphold safe and secure
operations.
Insurance coverage.
Equinor’s insurance coverage may not provide adequate protection from losses.
Equinor maintains insurance coverage that includes coverage for physical damage to its properties, third-party liability, workers’
compensation and employers’ liability, general liability, sudden pollution, and other coverage. Equinor’s insurance coverage includes
deductibles that must be met prior to recovery and is subject to caps, exclusions, and limitations. There is no assurance that such
coverage will adequately protect Equinor against liability from all potential consequences and damages. The fire at Hammerfest LNG
in September 2020, leading to a financial loss for the group related to physical damage, postponement of production, and gas trading,
illustrates that insurance may not completely protect the group from significant financial impact following an insurable loss.
Equinor, Annual Report on Form 20-F 2021 119
The Equinor group also often retains parts of its insurable risks in a wholly owned captive insurance company, so insurance recovery
outside of the Equinor group may sometimes be limited.
Uninsured losses could have a material adverse effect on Equinor’s financial position.
Legal, regulatory and compliance risks
International governmental and regulatory framework.
Equinor’s operations are subject to dynamic political and legal factors in the
countries in which it operates.
Equinor has oil and gas and renewable assets in several countries where the political and regulatory regime can change over time.
Further, Equinor has activities in countries with emerging or transitioning economies that, in part or in whole, lack well-functioning and
reliable legal systems, where the enforcement of contractual rights is uncertain or where the governmental and regulatory framework
is subject to unexpected or rapid change. Equinor's oil and gas exploration and production activities in these countries are often
undertaken together with national oil companies and are subject to a significant degree of state control. In recent years, governments
and national oil companies in some regions have begun to exercise greater authority and to impose more stringent conditions on
energy companies. Intervention by governments in such countries can take a wide variety of forms, including:
●
●
●
●
●
Janeiro State for non-compliance with minimum local requirements and the ICMS indirect tax in Rio de Janeiro State on crude oil
extraction (see note 24 Other commitments and contingencies for further details), including retroactive claims;
●
●
●
●
Argentinian foreign exchange regulations; and
●
The likelihood of these occurrences and their overall effect on Equinor vary greatly from country to country and are hard to predict. If
such risks materialize, they could cause Equinor to incur material costs, cause decrease in production, and potentially have a
materially adverse effect on Equinor’s operations or financial condition.
Policies and actions of the Norwegian State could affect Equinor’s business.
The Norwegian State governs the management of
NCS hydrocarbon resources through legislation, such as the Norwegian Petroleum Act, tax law and safety and environmental laws
and regulations. The Norwegian State awards licences for exploration, development projects, production, transportation, and
applications for production rates for individual fields. The Petroleum Act provides that if important public interests are at stake, the
Norwegian State may instruct operators on the NCS to reduce petroleum production
.
The Norwegian State has a direct participation in petroleum activities through the State's direct financial interest (SDFI). In the
production licenses in which the SDFI holds an interest, the Norwegian State has the power to direct petroleum licenses’ actions in
certain circumstances. See also section 2.9.
If the Norwegian State were to change laws, regulations, policies, or practices relating to energy or to the oil and gas industry
(including in response to environmental, social or governance concerns), or take additional action under its activities on the NCS,
Equinor’s international and/or NCS exploration, development and production activities, and the results of its operations, could be
affected.
Health, safety and environmental laws and regulations.
Compliance with health, safety and environmental laws and regulations
that apply to Equinor’s activities and operations could materially increase Equinor’s costs. The enactment of, or changes to, such laws
and regulations could increase such costs or create compliance challenges.
Equinor incurs, and expects to continue to incur, substantial capital, operating, maintenance and remediation costs relating to
compliance with increasingly complex laws and regulations for the protection of the environment and human health and safety, as well
as in response to concerns relating to climate change, including:
●
higher prices on greenhouse gas emissions;
●
costs of preventing, controlling, eliminating or reducing certain types of emissions to air and discharges to the sea;
●
remediation of environmental contamination and adverse impacts caused by Equinor’s activities;
●
decommissioning obligations and related costs; and
●
compensation of costs related to persons and/or entities claiming damages as a result of Equinor’s activities.
120 Equinor, Annual Report on Form 20-F 2021
In particular, Equinor’s activities are increasingly subject to statutory strict liability in respect of losses or damage suffered as a result
of pollution caused by spills or discharges of petroleum from petroleum facilities.
Equinor’s investments in US onshore producing assets are subject to evolving regulations that could affect these operations and their
profitability. In the United States, Federal agencies have taken steps to rescind, delay, or revise regulations seen as overly
burdensome to the upstream oil and gas sector, including methane emission controls. To the extent new or revised regulations
impose additional compliance or data gathering requirements, Equinor could incur higher operating costs.
Compliance with laws, regulations and obligations relating to climate change and other health, safety and environmental laws and
regulations could result in substantial capital expenditure, reduced profitability as a result of changes in operating costs, and adverse
effects on revenue generation and strategic growth opportunities. However, more stringent climate change regulations could also
represent business opportunities for Equinor. For more information about climate change related to legal and regulatory risks, see the
risks described under the heading “Climate change and transition to a lower carbon economy” in “Risks related to our business,
strategy and operations” in this section.
Supervision, regulatory reviews and financial reporting.
Equinor conducts business in many countries and its products are
marketed and traded worldwide. Equinor is exposed to risk of supervision, review and sanctions for violations of laws and regulations
at the supranational, national and local level. These include, among others, laws and regulations relating to financial reporting,
taxation, bribery and corruption, securities and commodities trading, fraud, competition and antitrust, safety and the environment,
labour and employment practices and data privacy rules.
Violations of applicable laws and regulations may lead to legal liability, substantial fines, claims for damages, criminal sanctions and
other sanctions for noncompliance.
Equinor is subject to supervision by the Norwegian Petroleum Supervisor (PSA), which supervises all aspects of Equinor’s operations,
from exploration drilling through development and operation, to cessation and removal. Its regulatory authority covers the whole NCS
including offshore-wind as well as petroleum-related plants on land in Norway. As its business grows internationally, Equinor may
become subject to supervision or be required to report to other regulators, and such supervision could result in audit reports, orders
and investigations.
Equinor is listed on both the Oslo Børs and New York Stock Exchange (NYSE) and is a reporting company under the rules and
regulations of the US Securities and Exchange Commission (the SEC). Equinor is required to comply with the continuing obligations of
these regulatory authorities, and violation of these obligations may result in legal liability, the imposition of fines and other sanctions.
Equinor is also subject to financial review from financial supervisory authorities such as the Norwegian Financial Supervisory Authority
(FSA) and the SEC. Reviews performed by these authorities could result in changes to previously published financial statements and
future accounting practices. In addition, failure of external reporting to report data accurately and in compliance with applicable
standards could result in regulatory action, legal liability and damage to Equinor’s reputation. Also, any identification of a material
weakness in internal controls over financial reporting could cause investors to lose confidence in reported financial information and
potentially impact the share price.
Anti-corruption, anti-bribery laws and Equinor’s Code of Conduct and the Human Rights policy.
Non-compliance with anti-
bribery, anti-corruption and other applicable laws or failure to meet Equinor’s ethical requirements, including the Human Rights policy,
has the potential to expose Equinor to legal liability, lead to a loss of business, loss of investor confidence, damage our reputation and
our social license to operate, as well as erode shareholder value. It could also lead to an adverse effect on the human rights of various
right-holders.
Equinor is a global company with a presence and/or suppliers and other business partners in many parts of the world – including
where corruption and bribery represents a high risk and where the human rights situation is challenging. Such risks often exist in
combination with weak legal institutions and lack of transparency. Governments routinely play a significant role in the energy sector,
through ownership of resources, participation, licensing, and local content which leads to a high level of interaction with public officials.
Equinor is subject to anti-corruption and bribery laws in multiple jurisdictions, including the Norwegian Penal code, the US Foreign
Corrupt Practices Act and the UK Bribery Act. A violation of such applicable anti-corruption or bribery laws could expose Equinor to
investigations from multiple authorities and may lead to criminal and/or civil liability with substantial fines. Incidents of noncompliance
with applicable anti-corruption and bribery laws and regulations and the Equinor Code of Conduct could be damaging to Equinor’s
reputation, competitive position, and shareholder value. Similarly, failure to uphold our Human Rights policy may damage our
reputation and social license to operate. Similarly, failure to identify or address potential adverse human rights impacts in line with our
Human Rights policy, e.g., in parts of our supply chains, could damage our reputation, and weaken our social license to operate.
Throughout 2021, the organization monitored potential increased risks or changed risk picture with respect to Equinor’s ethics and
compliance standards due to the Covid-19 situation. Continuation or a resurgence of the pandemic could continue to impact and/or
potentially increase our ethics and compliance risks in ways not currently known or considered by us.
Equinor, Annual Report on Form 20-F 2021 121
International sanctions and trade restrictions.
Equinor’s activities may be affected by international sanctions and trade restrictions.
In 2021, as in previous years, there were several changes to sanctions and international trade restrictions. Equinor seeks to comply
with these where they are applicable. Equinor’s diverse portfolio of projects worldwide could expose its business and financial affairs
to political and economic risks, including operations in markets or sectors targeted by sanctions and international trade restrictions.
Sanctions and trade restrictions are complex, unpredictable and are often implemented on short notice. Equinor’s business portfolio is
evolving and will constantly be subject to review. Given the use of trade restrictions by, amongst others, the US, UK and EU, it is
possible that Equinor will decide to take part in new business activity in markets or sectors where sanctions and trade restrictions are
particularly relevant.
While Equinor remains committed to do business in compliance with sanctions and trade restrictions and takes steps to ensure, to the
extent possible, compliance therewith, there can be no assurance that no Equinor entity, officer, director, employee or agent is not in
violation of such sanctions and trade restrictions. Any such violation, even if minor in monetary terms, could result in substantial civil
and/or criminal penalties and could materially adversely affect Equinor’s business and results of operations or financial condition.
The following discusses Equinor’s interests in certain jurisdictions:
For a discussion of Equinor’s intent to exit its business activities in Russia, see “International, political, social and economic factors”
above. In addition, Equinor is monitoring and remains committed to comply with Norwegian, EU, UK, US and any other applicable
trade restrictions and sanctions targeting Russian sectors, entities and persons, including Rosneft.
Equinor holds a 51% interest in a gas license offshore Venezuela. Since 2017, various international sanctions and trade controls have
targeted certain Venezuelan individuals as well as the Government of Venezuela. The international sanctions and trade controls in
place restrict to a large extent the way Equinor can conduct its business in Venezuela, and could, alone or in combination with other
factors, further negatively impact Equinor’s position and ability to continue its business in Venezuela.
Disclosure Pursuant to Section 13(r) of the Exchange Act
Equinor is providing the following disclosure pursuant to Section 13(r) of the Exchange Act. Equinor is a party to agreements with the
National Iranian Oil Company (NIOC), namely, a Development Service Contract for South Pars Gas Phases 6, 7 & 8 (offshore part),
an Exploration Service Contract for the Anaran Block and an Exploration Service Contract for the Khorramabad Block, which are
located in Iran. Equinor’s operational obligations under these agreements have terminated and the licences have been abandoned.
The cost recovery programme for these contracts was completed in 2012, except for the recovery of tax and obligations to the Social
Security Organization (SSO).
From 2013 to November 2018, after closing Equinor’s office in Iran, Equinor’s activity was focused on a final settlement with the
Iranian tax and SSO authorities relating to the above-mentioned agreements.
In a letter from the US State Department of 1 November 2010, Equinor was informed that it was not considered to be a company of
concern based on its previous Iran-related activities.
Equinor has an intention to settle historic obligations in Iran while remaining compliant with applicable sanctions and trade restrictions
against Iran. Since November 2018 Equinor has not conducted any activity in Iran, nor has it been able to resolve tax claims from the
Iranian authorities. No payments were made to Iranian authorities during 2021.
Joint arrangements and contractors.
Many of Equinor’s activities are conducted through joint arrangements and with contractors
and sub-contractors which may limit Equinor’s influence and control over the performance of such operations. This exposes Equinor to
financial, operational, safety, security, and compliance risks as well as reputational risks and risks related to ethics, integrity, and
sustainability, if the operators, partners or contractors fail to fulfil their responsibilities.
Operators, partners, and contractors may be unable or unwilling to compensate Equinor against costs incurred on their behalf or on
behalf of the arrangement. Equinor is also exposed to enforcement actions by regulators or claimants in the event of an incident in an
operation where it does not exercise operational control.
International tax law.
Equinor is exposed to potentially adverse changes in the tax regimes of each jurisdiction in which Equinor
operates.
Changes in the tax laws of the countries in which Equinor operates could have a material adverse effect on its liquidity and results of
operations.
Market, financial and liquidity risks
Foreign exchange.
Equinor’s business is exposed to foreign exchange rate fluctuations that could adversely affect the results of
Equinor’s operations.
122 Equinor, Annual Report on Form 20-F 2021
A large percentage of Equinor’s revenues and cash receipts are denominated in USD, and sales of gas and refined products are
mainly denominated in EUR and GBP. Further, Equinor pays a large portion of its income taxes, operating expenses, capital
expenditures and dividends in NOK. The majority of Equinor’s long-term debt has USD exposure. Accordingly, changes in exchange
rates between USD, EUR, GBP and NOK may significantly influence Equinor’s financial results. See also “Financial risk”
.
Liquidity and interest rate.
Equinor is exposed to liquidity and interest rate risks.
Equinor is exposed to liquidity risk, which is the risk that Equinor will not be able to meet obligations of financial liabilities when they
become due. Equinor’s main cash outflows include the quarterly dividend payments and Norwegian petroleum tax payments which
are paid six times per year. Liquidity risk sources include but are not limited to business interruptions and commodity and financial
markets price movements.
Equinor is exposed to interest rate risk, which is the possibility that changes in interest rates will affect future cash flows or the fair
values of its financial instruments, principally long-term debt and associated derivatives. Equinor’s bonds are normally issued at fixed
rates in a variety of local currencies (USD, EUR and GBP among others). Most bonds are kept as or converted to fixed rate USD while
some are converted to floating rate USD by using interest rate and/or currency swaps.
Equinor has started the transition from London Inter-bank Offered Rates (LIBOR) to alternative reference rates and expects to
complete this process within 2023.
For interest rate derivatives contracts, Equinor expects to follow the ISDA Fallback Protocol outlining the process for conversion of
LIBOR to the Official ISDA Fallback Rates for derivatives, or other official adjusted reference rates (such as SONIA or SOFR). The
expectation is that the transition from LIBOR to alternative reference rates for floating rate bonds will follow the principles outlined by
ICMA (International Capital Markets Association) and that loan agreements and facilities in general will follow the LMA (Loan Market
Association). Equinor believes that the financial risks for Equinor related to the transition are small.
Trading and supply activities.
Equinor is exposed to risks relating to trading and supply activities.
Equinor is engaged in trading and commercial activities in the physical markets. Equinor uses financial instruments such as futures,
options, over-the-counter (OTC) forward contracts, market swaps and contracts for differences related to crude oil, petroleum
products, natural gas and electricity to manage price differences and volatility. Trading activities involve elements of forecasting, and
Equinor bears the risk of market movements, the risk of losses if prices develop contrary to expectations, and the risk of default by
counterparties.
Financial risk.
Equinor is exposed to financial risk.
The main factors influencing Equinor’s operational and financial results include oil/condensate and natural gas prices and trends in the
exchange rates between mainly the USD, EUR, GBP and NOK; Equinor’s oil and natural gas entitlement production volumes (which in
turn depend on entitlement volumes under PSAs where applicable) and available petroleum reserves, and Equinor’s own, as well as
its partners’, expertise and cooperation in recovering oil and natural gas from those reserves; and changes in Equinor’s portfolio of
assets due to acquisitions and disposals.
Equinor’s operational and financial results also are affected by trends in the international oil industry, including possible actions by
governments and other regulatory authorities in the jurisdictions in which Equinor operates, possible or continued actions by members
of the Organization of Petroleum Exporting Countries (OPEC) and/or other producing nations that affect price levels and volumes,
refining margins, the cost of oilfield services, supplies and equipment, competition for exploration opportunities and operatorships and
deregulation of the natural gas markets, all of which may cause substantial changes to existing market structures and to the overall
level and volatility of prices and price differentials.
The following table shows the yearly averages for quoted Brent Blend crude oil prices, natural gas average sales prices, refining
reference margins and the USD/NOK exchange rates for 2021 and 2020.
Yearly averages
2021
2020
Average Brent oil price (USD/bbl)
70.7
41.7
Average invoiced gas prices - Europe (USD/mmBtu)
14.6
3.6
Refining reference margin (USD/bbl)
4.0
1.5
USD/NOK average daily exchange rate
8.6
8.8
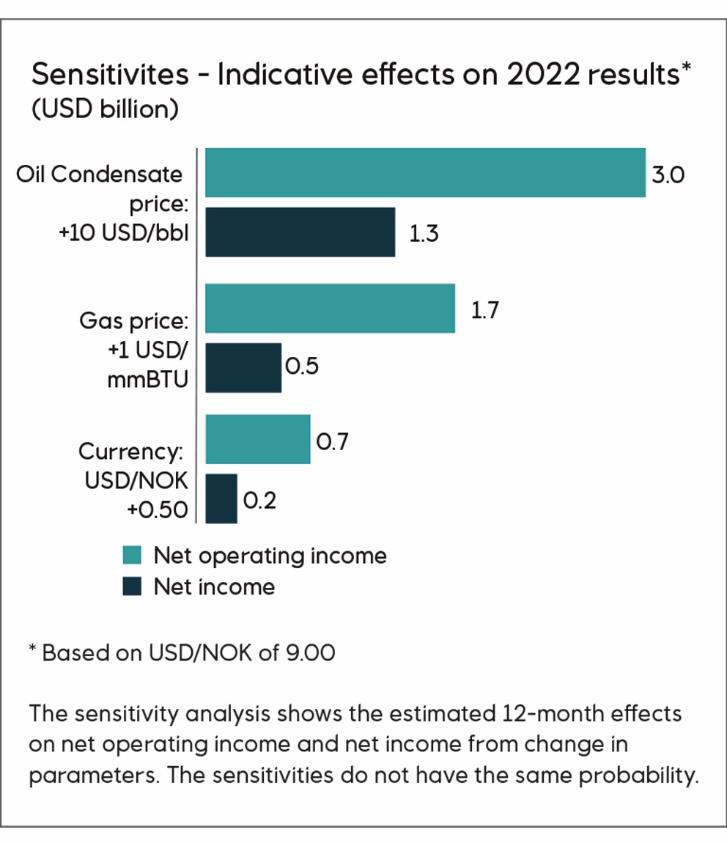
Equinor, Annual Report on Form 20-F 2021 123
The illustration shows the indicative full-year effect on the financial result for 2022 given certain changes in the oil/condensate price,
natural gas contract prices and the USD/NOK exchange rate. The estimated price sensitivity of Equinor’s financial results to each of
the factors has been estimated based on the assumption that all other factors remain unchanged. The estimated indicative effects of
the negative changes in these factors are not expected to be materially asymmetric to the effects shown in the illustration.
Significant downward adjustments of Equinor’s commodity price assumptions could result in impairments on certain producing and
development assets in the portfolio. See note 11 Property, plant and equipment to the Consolidated financial statements for sensitivity
analysis related to impairments.
Fluctuating foreign exchange rates can also have a significant impact on the operating results. Equinor’s revenues and cash flows are
mainly denominated in or driven by USD, while a large portion of the operating expenses, capital expenditures and income taxes
payable accrue in NOK. In general, an increase in the value of USD in relation to NOK can be expected to increase Equinor’s reported
net operating income.
Historically, Equinor’s revenues have largely been generated by the production of oil and natural gas on the NCS. Norway imposes a
78% marginal tax rate on income from offshore oil and natural gas activities (a symmetrical tax system). Equinor’s earnings volatility is
moderated as a result of its significant proportion of Norwegian offshore income that is subject to the 78% tax rate in profitable periods
and the significant tax assets generated by its Norwegian offshore operations in any loss-making periods. For further information, see
section 2.9 Corporate Taxation of Equinor.
Currently, the majority of dividends received by Equinor ASA are from Norwegian companies. Dividends received from Norwegian
companies and from similar companies’ resident in the EEA for tax purposes, in which the recipient holds more than 90 % of the
shares and votes, are fully exempt from tax. For other dividends, 3% of the dividends received are subject to the standard income tax
rate of 22%, giving an effective tax rate of 0.66%. Dividends from companies resident in low-tax jurisdictions in the EEA that are not
able to demonstrate that they are genuinely established and carry on genuine economic business activity within the EEA and
dividends from companies in low-tax jurisdictions and portfolio investments below 10% outside the EEA will be subject to the standard
income tax rate of 22% based on the full amounts received.
See also note 6 Financial risk management to the Consolidated financial statements.
Disclosures about market risk
Equinor uses financial instruments to manage commodity price risks, interest rate risks and currency risks. Significant amounts of
assets and liabilities are accounted for as financial instruments.
See note 26 Financial instruments: fair value measurement and sensitivity analysis of market risk in the Consolidated financial
statements for details of the nature and extent of such positions and for qualitative and quantitative disclosures of the risks associated
with these instruments.
124 Equinor, Annual Report on Form 20-F 2021
Risks related to state ownership
This section discusses some of the potential risks relating to Equinor’s business that could derive from the Norwegian State's majority
ownership and from Equinor’s involvement in the SDFI.
Control by the Norwegian State.
The interests of Equinor’s majority shareholder, the Norwegian State, may not always be aligned
with the interests of Equinor’s other shareholders, and this may affect Equinor’s activities, including its decisions relating to the NCS.
The Norwegian State has resolved that its shares in Equinor and the SDFI’s interest in NCS licences must be managed in accordance
with a coordinated ownership strategy for the Norwegian State’s oil and gas interests. Under this strategy, the Norwegian State has
required Equinor to market the Norwegian State’s oil and gas together with Equinor’s own oil and gas as a single economic unit.
Pursuant to this coordinated ownership strategy, the Norwegian State requires Equinor, in its activities on the NCS, to take account of
the Norwegian State’s interests in all decisions that may affect the marketing of Equinor’s own and the Norwegian State’s oil and gas.
The Norwegian State directly held 67% of Equinor's ordinary shares as of 31 December 2021 and has effectively the power to
influence the outcome of any vote of shareholders, including amending its articles of association and electing all non-employee
members of the corporate assembly. The interests of the Norwegian State in deciding these and other matters and the factors it
considers when casting its votes, especially the coordinated ownership strategy for the SDFI and Equinor’s shares held by the
Norwegian State, could be different from the interests of Equinor’s other shareholders.
If the Norwegian State’s coordinated ownership strategy is not implemented and pursued in the future, then Equinor’s mandate to
continue to sell the Norwegian State’s oil and gas together with its own oil and gas as a single economic unit is likely to be prejudiced.
Loss of the mandate to sell the SDFI’s oil and gas could have an adverse effect on Equinor’s position in the markets in which it
operates. See also section 3.4 under the Governance chapter for further details on State ownership.
Risk management
Equinor’s risk management practice is based on an Enterprise Risk Management (ERM) framework where risk management is an
integrated part of Equinor’s business operations. This includes managing risk in relation to all of Equinor’s activities to create value
and avoid incidents, always with Equinor’s best interest in mind.
To achieve optimal solutions, and to provide for risk informed decision basis, the focus of the ERM approach is on:
●
the value impact for Equinor, including upside and downside risk; and
●
managing of risk in compliance with Equinor’s requirements with a strong focus on avoiding HSE, human rights and business
integrity incidents (such as accidents, fraud and corruption).
Managing risk is an integral part of any manager’s responsibility. In general, risk is managed in the business line, but some risks are
managed at the corporate level to provide optimal solutions. Risks managed at the corporate level include the top enterprise risks in
addition to oil and natural gas price risks, interest and currency risks, risk dimension in the strategy work, prioritisation processes and
capital structure discussions.
ERM involves using a holistic approach where correlations between risks and the natural hedges inherent in Equinor’s portfolio are
considered. This approach allows Equinor to reduce the number of risk management transactions and avoid sub-optimisation. Some
risks related to operational activities are partly insurable and insured via Equinor’s captive insurance company operating in the
Norwegian and international insurance markets. Equinor also assesses oil and gas price hedging opportunities on a regular basis as a
tool to increase financial robustness and strengthen flexibility.
Equinor’s risk management process is based on ISO 31000 Risk management. A standardised process across Equinor allows for
comparing risk on a like-for-like basis and supports efficiency in decisions. The process seeks to ensure that risks are identified,
analysed, evaluated, and managed. Risk is integrated into the company’s Management Information System (IT tool) where Equinor’s
purpose, vision and strategy are translated into strategic objectives, risks, actions and KPIs. The tool is used to capture all risks and
follow up risk-adjusting actions and related assurance activities. In general, risk adjusting actions are subject to a cost-benefit
evaluation (except certain safety related risks which could be subject to specific regulations), and the approach to assurance is risk-
based in the context of a three-lines-of-control model.
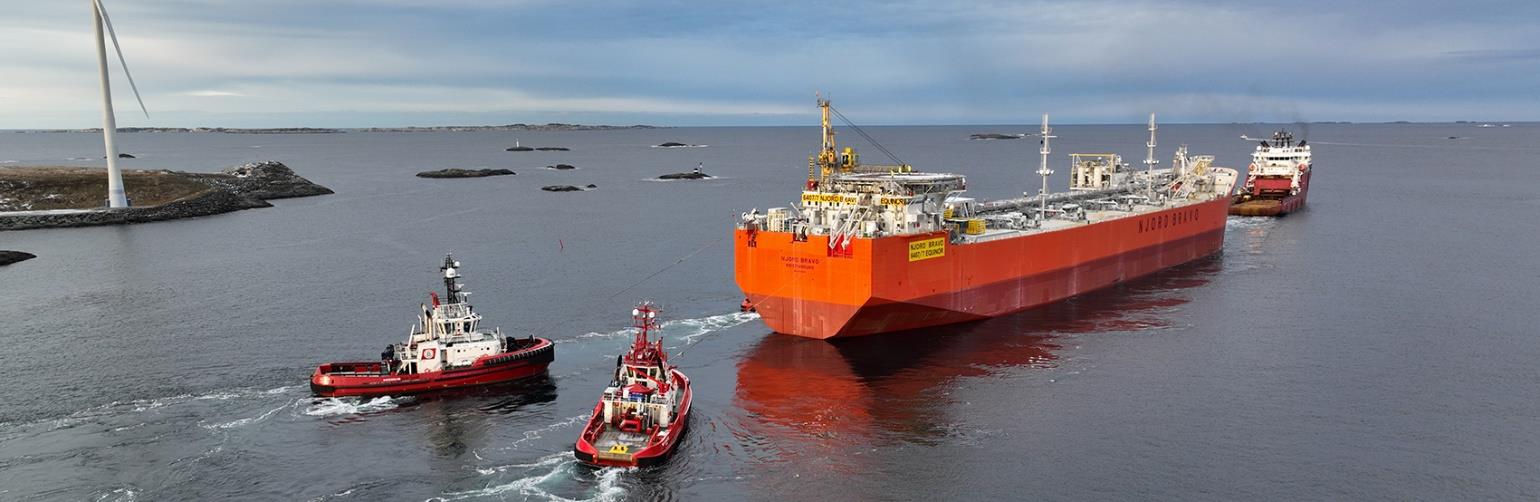
Equinor, Annual Report on Form 20-F 2021 125
The upgraded Njord Bravo under tow from Haugesund to Kristiansund, 5 December 2021.

126 Equinor, Annual Report on Form 20-F 2021
2.14
Safety, security and sustainability
Safety, security and sustainability
We recognise that our activities may have an impact on society and the environment. Health, safety and security risks are inherent in
the activities we and our suppliers perform in the regions where we operate.
We also recognise that our activities can make significant positive contributions. First and foremost, we provide society with much
needed energy. We also contribute to socio-economic development through jobs for our approximately 21,000 employees and 8,000
suppliers, and we are a significant tax contributor to the societies where we operate. Equinor’s purpose is to turn natural resources
into energy for people and progress for society, Our strategy - always safe, high value, low carbon - guides our strategic focus areas -
optimising our oil and gas portfolio, capturing high value growth in renewables and establishing new market opportunities within low
carbon solutions. Our four sustainability priorities -
getting to net zero
,
protecting the environment
,
caring for people and society
, and
governance and transparency -
social, economic and human rights benefits for workforces and communities.
We strive to adhere to high industry standards and aim to improving our performance in every area where we have a positive or
negative impact. Within our sustainability priorities we have identified ten material impact topics with corresponding performance
indicators and ambitions to measure our progress. When assessing materiality, we considered the global sustainability context and
evaluated impacts across our own activities and business relationships, including actual and potential, positive and negative impacts
on people, planet and society.
Equinor, Annual Report on Form 20-F 2021 127
*See section 5.2 for non-GAAP measures.
128 Equinor, Annual Report on Form 20-F 2021
Climate change and energy transition
Climate change and reaching the goals of the Paris Agreement represent fundamental challenges to society. As outlined in the
COP26 Glasgow Climate Pact, achieving the most ambitious goals of the Paris Agreement now requires rapid, deep and sustained
reductions in global greenhouse gas emissions. This includes reducing global carbon dioxide emissions by 45% by 2030 relative to
2010 levels, and to net zero around mid-century. The average increase in global temperatures has already reached 1.1
o
C above pre-
industrial levels, according to the Intergovernmental Panel on Climate Change.
Climate change is a collective challenge, and Equinor will contribute by accelerating its response to the energy transition in
partnership with governments, investors, customers and society at large. Our industry will play an important role. While individual
company-level decarbonisation ambitions are important, the journey towards net zero can only be met through an “unprecedented
transformation of how energy is produced, transported and used globally”, according to the International Energy Agency (IEA).
Equinor’s ambition is to be a leading company in the energy transition and to become a net-zero company by 2050, including
emissions from production through to final energy consumption. During the last year we have raised our short- and medium-term
ambitions. These demonstrate our commitment to produce energy with decreasing emissions over time. While delivering long-term
shareholder value and competitiveness, we will reduce emissions from our oil and gas operations, scale up investments in renewable
energy and aim to take a leading role in building out new low carbon value chains. We will work with our suppliers and customers,
governments and civil society to develop the technologies, business models, policies and frameworks to contribute to an energy
transition supporting the goals of the Paris Agreement.
Among the new or strengthened short- and medium-term ambitions announced in 2021/22 are:
●
●
18
by 2030
●
●
2
2
per barrel of oil equivalent (boe) by 2030
●
2
per year on an equity basis by 2030 and 15-30 million tonnes CO
2
per
year in 2035
●
●
●
In our Energy Transition Plan we describe our role in the energy transition. The plan is expected to be launched in March 2022 and
will be submitted for an advisory vote to shareholders at the Annual General Meeting (AGM) in 2022. We will update the plan every
three years for an advisory AGM vote and report on progress annually.
Industry leading carbon efficiency
We aim to remain an industry leader in carbon efficiency by working towards emitting as little CO
₂
equivalent produced. Our ambition is to reduce the upstream CO
2
kg CO
2
/barrel of oil equivalent (boe) by 2025 and to
~
6 kg CO
2
/boe by 2030.
Our upstream CO
2
kg CO
2
/boe. Divestment from the Bakken assets in the United States, temporary
shut-down of the Peregrino field in Brazil and increased production from the Johan Sverdrup, Troll and Oseberg fields in Norway were
the key drivers for this reduced upstream CO
2
million
tonnes – a decrease of 1.4
million tonnes from the previous year. The reduction can be attributed to the divestment of the Bakken
assets as well as the temporary shutdown of the Hammerfest LNG plant in Norway and the Peregrino field in Brazil.
18
See section 5.2 for non-GAAP measures.

Equinor, Annual Report on Form 20-F 2021 129
We assess carbon intensity when we shape our portfolio and implement emission reduction measures. Electrification is a key
component to reach our emissions reduction ambitions and involves replacing fossil fuel-based power supply with Norwegian grid mix,
or power from floating wind turbines. In 2021, we advanced several electrification initiatives:
●
than 150,000 tonnes of CO
₂
●
full electrification of Troll C. After its planned completion in 2026, it will cut CO
2
the equivalent of more than 3% of total emissions from oil and gas production in Norway. NO
x
1,700 tonnes per year.
●
The planned total emission reduction at Oseberg field centre and Oseberg South is more than 300,000 tonnes of CO
2
Flaring
For all Equinor operated oil and gas assets, we work to systematically reduce all flaring and to eliminate routine flaring, in line with the
“World Bank’s Zero Routine Flaring by 2030” initiative. We do not have routine flaring in our own operations in Norway, Brazil or
offshore US, and final investment decisions of all new oil fields we operate include a solution for the field’s associated gas without
routine flaring. We work actively in our partner-operated assets to help reduce flaring. We currently flare associated gas in the Mariner
field in the UK on an intermittent basis when the early production phase associated gas volumes exceed the demand for fuel gas for
power generation.
Our 2021 flaring intensity was 0.09% of hydrocarbon produced, which is significantly lower than the industry average of 0.8%.
Methane
Curbing methane emissions is a key priority for Equinor and the oil and gas industry. We continue to develop and implement
technologies and procedures to identify, quantify, avoid and minimise methane emissions. We do this to support industry efforts to
reduce methane emissions across the oil and gas value chain, increase the quality and transparency of reported data, and to support
the development of sound methane policies and regulations. An independent study published in 2021 confirmed that methane
emissions from Equinor operated fields on the Norwegian Continental Shelf are at similar or lower levels than those reported by
Equinor.
Equinor’s 2021 methane intensity for our upstream and midstream business was reduced to approximately 0.02%, which is down from
0.03% in previous years and around one tenth of the industry average. Equinor continues to pursue a methane intensity target of near
zero by 2030.
Investing in renewables and low carbon solutions
We are developing as a global offshore wind major with renewable power production from offshore wind farms in the UK and Germany
and building material clusters in the North Sea, the US East coast and in the Baltic Sea. In parallel, we are actively positioning
ourselves to access emerging markets globally. Equinor is gradually growing its presence in onshore renewables in selected power
markets with increasing demand for solar, wind and storage solutions as integrated parts of the energy system. Our equity-based
renewables energy production was 1.6 TWh in 2021, down from 1.7 TWh in 2020. Considering our renewables and low carbon
solutions project portfolio, we evaluate our capex ambition, installed renewable capacity and ambition for CO
2
track to reach our ambitions for this decade. See section 2.7 Renewables for more details.
130 Equinor, Annual Report on Form 20-F 2021
Carbon Capture and Storage (CCS) and hydrogen are important enablers to deliver on the goals of the Paris Agreement. These
technologies can remove CO
₂
and flexible power generation. Based on experience from oil and gas value chains, Equinor is well positioned to provide low-carbon
solutions and establish net zero-emission value chains.
The Northern Lights project, representing the start of commercial CCS in Europe, is on track to demonstrate that CCS is a valid
decarbonisation solution for important industry sectors. An important development in 2021 was that four of our potential customers
were granted financing from EU’s innovation fund. This represents a major step forward, as the combined storage requirement for
these four customers is over 3 million tonnes CO
2
Equinor is exploring CCS opportunities in the UK together with five other energy companies through the Northern Endurance
Partnership. Together with bp we are developing the Net Zero Teesside project, a CO
2
and we are leading the Zero Carbon Humber project which aims to decarbonise local industrial clusters.
As part of this, Equinor and SSE Thermal are collaborating on plans to develop first-of-a-kind hydrogen and CCS projects in the
Humber region in the UK. Together with ENGIE we announced the H2BE project which aims to develop production of low-carbon
hydrogen from natural gas in Belgium. See section 2.6 Marketing, Midstream and Processing for more details.
Scope 3 greenhouse gas emissions
As an energy company, our scope 3 emissions are primarily related to our customers’ use of energy products. To help reduce these
emissions, we are working with developing low carbon solutions such as CCS and hydrogen at scale. Over time, this will help
decarbonise the use of our energy products. This, combined with portfolio diversification is our most important strategic lever to
address scope 3 emissions and the carbon intensity of energy we produce.
Equinor’s scope 3 emissions in 2021 were 249 million tonnes CO
2
e compared to 250 million tonnes CO
2
e in 2020. Our net carbon
intensity in 2021 was 67 g CO
2
e/MJ energy produced, down from 68 g CO
2
e/MJ in 2020. The net carbon intensity includes scope 1
and 2 emissions from our operated assets on a 100% basis and scope 3 emissions from our equity production. As we are cutting own
emissions and adding capacity in renewables and low carbon solutions, we expect our net carbon intensity to reduce more quickly
later in this decade.
Procurement of products and services represent another source of scope 3 emissions for Equinor. While the indirect emissions from
our supply chain are significantly lower than the emissions from the use of our oil and gas products, they are still important and
represent an opportunity for GHG reduction. Supply chain emissions are the largest contributing factor to the total life cycle emissions
for our renewable operations. Maritime operations, heavy duty transport and the production of steel and cement are considered the
most material sources of scope 3 emissions in our supply chain. With greater understanding and assurance on our scope 1 and 2
emissions, we plan to apply this knowledge and experience to assess our supply chain emissions and follow up on the most material
areas.
Equinor has an ambition of halving our maritime emissions in Norway by 2030 and halving our global maritime emissions by 2050. We
are working to reduce our own consumption of fossil-based maritime fuels and to stimulate systemic change through development of
low-emission maritime solutions. Equinor has extensive maritime activity around the world, including around 175 vessels on contract
with the company at any time. As a supplier of fuel to the maritime sector, Equinor’s ambition is to increase our production and use of
low-carbon, and zero-emission fuels. Equinor has been a pioneer in using liquefied natural gas (LNG) as a fuel and in 2021 we
introduced large-scale use of liquefied petroleum gas (LPG) as a fuel. A new hybrid battery system has been introduced for 19 supply
vessels on contract with Equinor on the Norwegian Continental Shelf and the next generation of dual-fuel vessels is being introduced
to the fleet. In collaboration with the maritime industry, we have also started developing the world’s first supply vessel to run on zero-
emission ammonia.
Carbon offsets and nature-based solutions
In the longer term, we see negative emissions solutions as making an important contribution to the climate challenge. Offsets and
removals will however play a minimal role in achieving our operated emissions reductions. We have so far only purchased offsets
related to our business travel. We plan to use only credits verified according to high standards and to disclose information about the
type of offsets employed. To ensure quality in the credits we will use, we have established a set of corporate criteria and principles
based on the Oxford Principles for Net Zero Aligned Carbon Offsetting
Stress-testing our management approach to climate risk
Equinor’s business needs to be resilient in a world of significant uncertainty and disruption, where climate related risks are integral to
prudent risk management. We responsively work to navigate these risks so that we have the financial robustness to reach our
ambitions. Our company strategy is developed to address the challenges, opportunities and urgency associated with the energy
transition, whilst recognising the many risk factors outside our control.
Climate-related risks to Equinor include market effects from changing demand for oil, gas and renewable energy, potential stricter
climate policies, laws and regulations, technology changes supporting the further development and use of renewable energy and low-
Equinor, Annual Report on Form 20-F 2021 131
carbon technologies, as well as physical effects of climate change and reputational effects. A summary of our climate-related risk
factors is provided in section 2.13 Risk review. We continue to report on climate-related upside and downside risks in line with the
recommendations of the Task Force on Climate-Related Financial Disclosures (TCFD).
For portfolio and decision analysis, our base assumptions include a carbon cost for all assets and projects. In countries where no such
cost exists, we use a generic cost which has been substantially increased in 2021. We use a default minimum at 58 USD per tonne
(real 2021), that increases to 100 USD per tonne by 2030 and stays flat thereafter. In countries with higher carbon costs, we use the
country specific cost expectations. This carbon cost is included in investment decisions and is part of break-even calculations when
testing for profitability robustness.
Since 2016 we have been testing the resilience of our portfolio against the scenarios from the IEAs World Energy Outlook (WEO)
report. WEO scenarios change from year to year and in the 2021 WEO report they were: Net Zero Emissions by 2050 Scenario
(NZE), Stated Policies Scenario (STEPS), Announced Pledges Scenario (APS), and the Sustainable Development Scenario (SDS).
We test our portfolio by applying the price assumptions in each of these scenarios and compare the impact on NPV using our internal
planning assumptions. Exploration activities are not included due to the uncertainties related to potential discoveries and development
solutions. The net present value effects are varying from -9% in SDS, to -30% and -34% for STEPS and NZE, respectively. Further
details about the portfolio sensitivity test are available in our 2021 Sustainability Report, which also includes a reference index to the
TCFD framework.
As noted in section 2.13 Risk Review under Risk Factors—Risks related to our business, strategy and operations—Oil and natural gas
price, a significant or prolonged period of low oil and natural gas prices or other indicators will lead to impairment assessments of the
group's oil and natural gas assets. See also note 3 Consequences of initiatives to limit climate change to the Consolidated financial
statements for a discussion of key sources of uncertainty with respect to management’s estimates and assumptions that affect
Equinor’s reported amounts of assets, liabilities, income and expenses and note 11 Property, plants and equipment to the
Consolidated financial statements for a discussion of price assumptions and sensitivities affecting the impairment analysis.
Environment
Globally, there is an increasing expectation for urgent actions to address the twin threats of climate change and nature loss. Equinor is
a large operator of offshore oil and gas facilities and increasingly offshore wind power provider. Management of our activities and
potential impacts on the marine environment is very important. Our potential material impacts are related to discharges and accidental
spills to sea, emissions to air, and use of areas.
We aim to systematically manage environmental aspects as an integrated part of our governance, risk and performance framework.
The precautionary approach and mitigation hierarchy are central to implementing measures to avoid, reduce or mitigate adverse direct
impacts and to enhance positive outcomes. We seek to continuously improve our environmental management system and
performance. Our management approach includes environmental risk and impact assessments, as well as stakeholder engagement in
planning phases before construction or operation activities take place. It also includes environmental baseline studies, surveys,
monitoring programmes, and collaborative research projects to build knowledge and develop tools.
Equinor supports the global ambition of reversing nature loss by 2030 and is ready to play its part. In 2021 we announced our
biodiversity position, identifying five areas to focus our actions on. These include establishing voluntary exclusion zones, developing a
net-positive approach, increasing knowledge and access to biodiversity data, investing in nature-based solutions, and advocating for
ambitious biodiversity policy.
During 2021, we did not operate in UNESCO World Heritage sites or within sites in the International Union of Conservation of Nature
(IUCN) category 1a (“Strict nature reserve”) or category 1b (“Wilderness area”). There were 19 cases where we had operations inside
or adjacent to (< 1km) protected areas within any IUCN category.
The number of accidental spills of oil and other liquids was reduced by 14% from 2020 to 2021 to 218 incidents. None of these was a
serious accidental spill. Our freshwater withdrawal remained at 8 million m
3
.
SO
x
temporary shut-down of the Peregrino field throughout 2021. SO
x
the Mongstad and Kalundborg refineries, and reduced usage of diesel due to no drilling and fracking activity in our US onshore
assets. NO
x
well activities in 2021 and the divestment from the Bakken asset. The volume of oil discharged with water to sea was reduced to 1.1
thousand tonnes in 2021 compared to 1.3 thousand tonnes in 2020. The main driver for this change was the substitution of corrosion
inhibitors at our Statfjord platforms leading to better conditions for process water cleaning.
For most waste categories, we have seen a significant drop in 2021 compared to 2020. This is mainly due to changes in activity level
and types, especially lower drilling and well activities and decreased volumes of process water transported from Troll to Mongstad. An
increase of 14% in the non-hazardous waste quantity to 33 thousand tonnes in 2021 is mainly due to large quantities of sand blasting
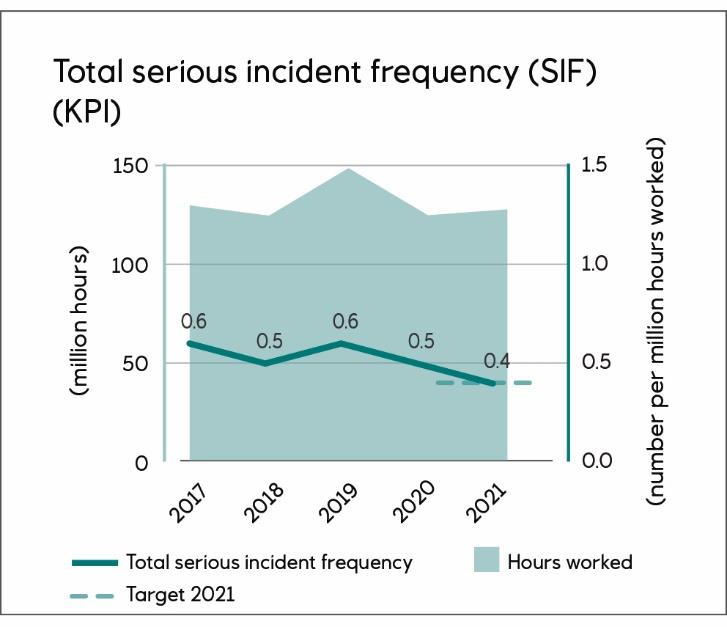
132 Equinor, Annual Report on Form 20-F 2021
waste from tank maintenance at Mongstad, waste from the fire training field at Kollsnes and waste related to the activities following the
fire at the Hammerfest LNG plant in 2020.
Health, safety and security
Safety
In a world fighting a pandemic, the running of safe operations and provision of energy, with as low major accident risk as possible, has
remained Equinor’s priority. Our vision is zero harm, which is supported by one of our three strategic pillars, “Always Safe”. The safety
and security of our people, and integrity of our operations, is our top priority. We believe that all accidents related to people,
environment and assets can be prevented.
As a response to two serious process incidents at our onshore plants last year, we have developed a new framework for major
accident prevention. This is built on three pillars: “Leadership culture and organisational frame conditions”, “Safe practices and design”
and “Safety barriers”. The global implementation of this framework remains a priority for 2021 and beyond.
Our “I am safety roadmap 2025” sets our ambition for safety performance. It outlines prioritised activities within four categories across
the company: safety visibility, leadership and behaviour; learning and follow up, and safety indicators. We are stepping up the work to
consistently improve our safety performance and work continuously to develop a proactive safety culture, where safe and secure
operations are incorporated into everything we do. Two important initiatives to achieve this were implemented in 2021. These include
the strengthening of “human and organisational performance (HOP)” and the implementation of digital “observation cards” to facilitate
more engagement and improved safety behaviour across the workforce. HOP is now implemented in leadership training to provide a
better understanding of how people, technology, organisations and processes interact as a system, and how these conditions can
influence human errors.
In 2021 we experienced no major accidents although one incident with major accident potential was recorded when H
2
S and LPG
(Liquified Petroleum Gas) leaked at the Mongstad refinery in Norway. Equinor experienced a tragic fatality at one of our chartered
tankers when a cadet was found dead in the harbour basin after the ship had left the port near Houston. The US Coast Guard, local
police and independent investigators carried out an investigation that concluded that the person had inadvertently fallen overboard.
The investigation found no evidence of any criminal action.
Our total Serious Incident Frequency (SIF), which includes near misses, ended at 0.4 incidents per million work hours in 2021. This is
at our target and an improvement compared to last year. After closure of investigations, we adjusted our number of incidents with
major accident potential in 2020 from 0 to 2.
Equinor, Annual Report on Form 20-F 2021 133
Health and working environment
Equinor’s efforts related to health and working environment during 2021 have been impacted by the Covid-19 pandemic in several
areas. The medical risk of infection resulted in a focus on measures including hygiene and social distancing. We worked proactively to
address the mental health impact of working from home. Where we were permitted to do so, offices were re-opened with safety
measures in place so that those who needed or wanted to return, could do so safely. Medical resources with competence on
ergonomics and psychosocial risk have been allocated to support leaders and teams managing risks related to working from home.
The total sick leave increased from 4.2% in 2020 to 4.6% in 2021.
Personal injuries measured by total recordable injury frequency per million hours worked (TRIF) has developed negatively from 2.3 in
in 2020 to 2.4 in 2021. This is higher than for our peers and industry benchmarking.
Security
Over the course of 2021, the security threat picture has also evolved, as have the security risks. Threat actors have tried to exploit the
practice of working from home and cyber-crime has increased. Through holistic security risk management, which includes physical,
cyber and personnel security, we seek to secure continuous safeguarding of Equinor’s people, assets, and operations. For more
information about security risks, see section 2.13 Risk review.
Emergency preparedness and response, and business continuity
To ensure that we are prepared, we work to have appropriate emergency response capabilities in place to limit the consequences of
incidents, should they occur. Our oil spill response capabilities are in line with best international practice and leverage expertise and
resources made available through our membership of local and international oil spill response organisations.
Human rights
Understanding and managing our risks of adverse human rights impacts related to our activities remains at the core of our human
rights commitment. This is consistent with the United Nations Guiding Principles on Business and Human Rights (UNGPs), the ten
principles of the Global Compact and the Voluntary Principles on Security and Human Rights. We recognise that our activities can
cause, contribute, or be linked to negative human rights and other social impacts especially in jurisdictions with weak regulatory
frameworks. Thus, we aim to promote good practice and share learnings with partners. In 2021, the Covid-19 pandemic continued to
exacerbate risks in some areas of our operations. In parallel, governments and society are sharpening their focus towards human
rights performance.
Equinor’s human rights policy applies to all our activities. When we identify human rights risks and adverse impacts, Equinor works to
prevent, mitigate or remediate as relevant to each situation. We make efforts to build and use leverage towards our suppliers or
partners including through senior level engagement, capacity building opportunities and access to third party expertise.
As part of environmental and social impact assessments for new operated assets, potential human rights risks and impacts are
identified. In addition, we undertake human rights assessments and due diligence for certain assets on a risk basis. We set
requirements for all suppliers regarding general human rights expectations. We also include human rights clauses in significant
agreements and contracts and follow up selected suppliers on their performance through verifications and follow-up findings.
We have developed a performance framework built around four pillars: leadership and governance, risk management, partner and
supplier maturity, and management of salient issues. A set of internal monitoring indicators will be implemented as a first step under
this framework.
Following the adoption of our supply chain due diligence priorities, we saw an increase in engagement with prioritised first-tier
suppliers. Through risk mapping and assessment of red flags within value and supply chains of seven suppliers, risks and impacts are
being addressed jointly.
In 2021, we have assessed conditions for workers involved in specific construction projects in Malaysia, China and Singapore.
Moreover, indicators of forced labour (as defined by the International Labour Organisation) have been identified in seven contracts or
projects we are linked to, most typically in relation to payment of recruitment fees, retention of identity documents, restriction of
movement, excessive overtime and substandard living conditions. Compensation towards undue payment such as recruitment fees
has been confirmed to 6,203 workers in our value and supply chains. In 2021, Equinor conducted 30 human rights verifications of
suppliers covering 10 countries.
During our early-stage portfolio development of solar energy in 2021 we noted several reports and concerns about potential forced
labour in the solar supply chain. In an effort to address this risk, we have proactively engaged with peers, partners, suppliers and
industry associations such as the Solar Energy Industry Association (SEIA) to increase the visibility in our supply chains, while
supplier risk assessments have been conducted by third party experts.
134 Equinor, Annual Report on Form 20-F 2021
Socio-economic impact
Contributing positively to societies and communities where we operate has always been important for Equinor and will continue to be
so during the energy transition. Through our core business and supply chain, as well as broader social engagement, we primarily
create economic value and opportunities for society and communities through:
●
●
●
●
●
In 2021, we published, for the first time, our Tax Contribution Report. This provides a breakdown of tax contributions paid by Equinor
ASA and subsidiaries in 2020. Tax earnings from Equinor, a significant tax contributor, provide governments and authorities with the
opportunity to increase welfare and strengthen their societies. The report discloses Equinor’s approach to tax and tax strategy,
compliance and governance and provides information about the corporate income tax Equinor paid in countries and locations where
we create value across all our businesses. The full report can be found on our webpage.
We generate important socio-economic impacts through working with suppliers. In 2021, supplier spend totalled over USD 16 billion.
As an example, the signing of four new contracts with Aibel this year worth around USD 600 million will create around 3,500 person
years employment ensuring job opportunities for several years in the local Norwegian communities of Haugesund, Harstad, Asker,
and Stavanger.
Thriving local supply chains are important for regional economic development and for Equinor, as we invest in long-term infrastructure
that will be operational for decades. An illustrative case is the ‘Bridge’ project that Equinor launched in Brazil that is intended to build
capacity and create opportunities for local start-ups, and small and medium sized enterprises. We have also continued our support for
educational programmes, for example the agreement signed in 2021 with the department of Chemical and Mining Engineering at the
University of Dar Es Salaam in Tanzania,
Read more about socio-economic impact in the context of how we develop our people, involve them in the development of the
company and embrace diversity and drive inclusion in section 2.15 Our people.
Integrity and transparency
An ethical business culture is the cornerstone of a sustainable company. As a global company, Equinor is present in parts of the world
where corruption is a high risk. With a strategic focus on increased investments in new energy markets, we have continued our work
on ethics and compliance throughout 2021. Our commitment to conduct business in an ethical, socially responsible and transparent
manner has remained unchanged during the Covid-19 pandemic.
The Code of Conduct sets out our commitment and requirements for how we do business at Equinor. It applies to our employees,
board members and hired personnel. We train our employees on how to apply the Code of Conduct in their daily work and require all
employees to confirm annually that they understand and will comply with it. We expect our suppliers to act in a way that is consistent
with our Code of Conduct and engage with them to help them understand our ethical requirements and how we do business.
Our Code of Conduct explicitly prohibits engaging in bribery and corruption in any form. Equinor’s Anti-Corruption Compliance
Program summarises the standards, requirements and procedures implemented to comply with applicable laws and regulations and
maintaining our high ethical standards. The Program lays down the foundation for ensuring that anti-bribery and corruption risks are
identified, concerns are reported, and measures are taken to mitigate risk throughout the organisation.
Equinor’s Code of Conduct also addresses the requirement to comply with applicable competition and antitrust laws. Our Competition
and Antitrust Program consists of governing documents and manuals, training of employees in high-risk positions as well as risk
assessments and assurance activities.
The Code of Conduct imposes a duty to report possible violations of the Code or other unethical conduct. We require leaders to take
their control responsibilities seriously to prevent, detect and respond to ethical issues. Employees are encouraged to discuss
concerns with their leader or the leader’s superior or use available internal channels to provide support. Concerns may also be
reported through our Ethics Helpline which allows for anonymous reporting and is open to employees, business partners and the
general public. Equinor has a strict non-retaliation policy.
We believe that through disclosure of payments to governments we promote accountability and build trust in the societies where we
operate. Since 2014, we have reported our payments to governments on a country-by-country, project-by-project and legal entities
basis. This reporting represents a core element of transparent corporate tax disclosure. The “Tax Contribution Report” provides further
Equinor, Annual Report on Form 20-F 2021 135
insight into our approach to tax, including use of controversial tax jurisdictions, incentives and transfer pricing, and explaining why and
where we pay the taxes we pay.
We have long standing relationships with the UN Global Compact, the World Economic Forum’s Partnering Against Corruption
Initiative (PACI) and Transparency International (TI). Equinor, as a long-standing supporter of the Extractive Industries Transparency
Initiative (EITI), has throughout 2021 continued its active participation in the EITI multi-stakeholder process with the clear objective of
strengthening revenue transparency and good governance in the sector.
136 Equinor, Annual Report on Form 20-F 2021
2.15
Our people
Hywind Scotland floating offshore wind farm - Stine Myhre Selås.
Equal opportunities
Our focus on diversity and inclusion
We are a values-driven company - open, collaborative, courageous and caring. Embracing diversity and driving inclusion is
fundamental to us. As outlined in our code of conduct, we do not tolerate any discrimination or harassment of colleagues, or others
affected by our operations, and everyone will be treated with fairness, respect and dignity. We focus on diversity and inclusion (D&I)
because we believe that leveraging our diverse workforce and creating a safe and inclusive work environment will enable us to deliver
on our strategy – taking a leading role in the energy transition.
We believe diversity is about what makes us who we are – what shapes our thoughts and perspectives. As a company we have
focused on increasing gender balance for many years, including representation in leadership, development opportunities and through
supporting girls and women in science, technology, engineering, and mathematics (STEM) education through our sponsorship
programs, and early talent recruitment. Since 2019 we have focused on increasing awareness of diversity beyond gender, and have
set an ambition that all teams in Equinor be diverse and inclusive by 2025. This ambition is set on a global corporate level.
We built our ambition on research that says diverse and inclusive teams are more innovative and perform better. That is why we focus
on bringing together people with different backgrounds, experiences and competencies to share ideas and challenge groupthink.
These teams will only be successful if everyone feels safe, included and supported at work. As a tool to help drive our D&I ambition,
we use metrics that look at the diversity dimensions of gender, age, nationality and experience. We believe diversity is broader than
these dimensions, and work to increase awareness, understanding and support for diversity on a broader level. We aim to work more
systematically to remove any barriers and strengthen inclusion for colleagues who identify as a minority group in terms of disability,
ethnicity, LGBTQ+, religion and caring responsibilities. We measure inclusion through our annual people survey, while protecting the
anonymity of our employees on these sensitive topics.
The D&I roadmap is owned by Corporate People & Organisation (HR), however deliverables are implemented through broader HR
and cross-functional collaboration with Health and Working Environment and Safety. The Corporate Executive Committee provides
strategic direction for D&I, and the Board of Directors ensures that our duty to engage in equality work is met. Progress updates are
provided through formal channels and meetings.
We involve union representatives and safety delegates as part of our processes, both through selective projects and the formal
structures of central union representative meetings. In 2021, we revised the local tariff agreement on equality, equity and diversity for
Equinor ASA. The agreement (likestillingsavtale) between the company and union Industri Energie applies to all employees in Equinor
Equinor, Annual Report on Form 20-F 2021 137
ASA and states that we as an employer work to ensure all employees are treated equally regarding recruitment, pay and working
conditions, training, career paths and professional development.
138 Equinor, Annual Report on Form 20-F 2021
Building diverse and inclusive teams
Diverse and inclusive teams are built on processes and structures that support equal opportunities. In 2021, we adjusted our
operating model to further expand the use of competence centres. This has increased our organisational flexibility and will help build
diverse teams and facilitate collaboration. Our internal job market offers transparency of available opportunities.
Recruitment plays a vital part in our D&I strategy as it provides the opportunity to increase our workforce diversity. We have a 50:50
global ambition for gender and nationality (Norwegian and non-Norwegian) for our early talent programs. In Brazil we align with local
legal requirements of hiring people with disability. In this regard, we have identified the need to review our recruitment process to
determine accessibility for candidates. Initially our focus will be to review the digital recruitment process in Brazil and Norway.
Consideration of broader and global actions will follow.
In 2021, we continued to focus our talent attraction to be broader in terms of where and how we find talent and reviewing our
compensation and benefits. We believe this will increase the diversity of our potential candidates, both globally and in Norway. We
have reviewed some of our earlier actions to determine if they have been successful in attracting diverse candidates in terms of
gender and nationality. Actions included revised job description and the expectations listed and supporting hiring managers to limit
impact of unconscious bias in recruitment process. We will explore further improvement opportunities in 2022.
We believe that building a fit-for-future workforce, driving a strong performance development culture, and empowering our people to
perform at their best, is important to driving D&I. We emphasize the importance of everyone driving their own growth and development
in the company, underpinning our focus on equal opportunities for all. We believe our feedback culture supports a safe, supportive,
and inclusive environment. In 2021, we saw a slight decrease in number of people asking for and people giving feedback and we will
work to identify actions to strengthen our feedback culture further.
Gender
Equinor has worked systematically to increase women in leadership positions over several years. In 2021, our CEO appointed a
gender balanced Corporate Executive Committee. The leadership level reporting into the CEC also represents 49% female leaders.
Embedding D&I in our key people processes, including talent and succession reviews, leadership assessments, leadership
development courses and top-tier leadership deployment has contributed to the senior leadership gender balance in Equinor.
Permanent employees and percentage of women in the Equinor group
as of 31 December 2021
Number of employees
Women
Geographical region
2021
2020
2019
2021
2020
2019
Norway
18,237
18,238
18,128
31%
31%
31%
Rest of Europe
1,427
1,381
1,359
24%
23%
23%
Africa
63
73
73
37%
37%
36%
Asia
80
68
70
41%
44%
49%
North America
667
882
1,199
33%
33%
31%
South America
652
603
583
31%
31%
30%
Total
21,126
21,245
21,412
31%
31%
30%
Non-OECD
869
821
823
33%
33%
32%
In line with revised guidelines in gender pay reporting, Equinor has published the earnings ratio between males and females for both
total compensation and for base pay for Norway, Brazil, UK and USA. The gender pay gap reported for total compensation is larger
than that of base pay. Our analysis shows that a key driver for this difference is the higher representation of males in skilled offshore
and other operational positions. These roles are typically compensated with a range of additional elements beyond base salary, such
as offshore allowances or shift allowances, as well as overtime payments. The gender imbalance in these roles compared to non-
operational onshore roles result in a wider pay gap for total compensation than with base salary.
A full table showing the breakdown of earning ratios in all major Equinor locations by Equinor’s job structure can be found in the
Equinor data hub
. In line with our principles on pay equity, Equinor will continue to develop our understanding of the underlying
causes of potential gender imbalances in all our compensation items. We will seek to identify opportunities where we can proactively
address gaps, whilst also being conscious of structural differences which may be beyond our ability to address.
To show our commitment to equal and inclusive workplaces, Equinor participates in Gender Equality Indexes that aim to give more
visibility into reporting. This includes the Nordic SHE Index where Equinor was ranked number one out of 92 participating companies
in Norway, receiving the SHE Index award in March 2021 for our progress towards gender equality. We commit to disclosing our
efforts to support gender equality as we believe increased transparency in this work will have an impact on increasing gender balance
both within our industry and in business more broadly.
Equinor, Annual Report on Form 20-F 2021 139
Creating a safe and inclusive workplace for all
We want to be a great place to work for all. To achieve this, we need everyone to feel that they belong, can be safe to be themselves
at work, and can speak up. We have set clear expectations for leaders to drive an inclusive culture, and to seek out diversity when
building teams. In 2021, the CEO sharpened the leadership expectations to match the key drivers for the energy transition. Emphasis
was placed on inclusion and our leaders’ abilities to build trust and create an environment where everyone can bring their whole self
to work and have their voices heard and respected. These expectations are integrated in all our leadership development programs
and tools.
In 2021, we increased awareness around mental health and communicated support and benefits available. Through our annual
people survey and other feedback mechanisms, we have identified the need for further support. Plans to support mental health and
wellbeing include allocating funds to welfare activities in all the countries we operate, and mental health support from external
expertise through webinars and podcasts to employees and leaders. Additionally, all employees will receive a lump sum equivalent to
1,000 USD to spend on activities of their choice, to support their wellbeing.
We have identified that using Teams to collaborate across the organisation has increased inclusion of our colleagues with vision- and
hearing impairments. In 2021, we identified risks and barriers related to office technology and building accessibility in Norway. As a
response, we have started upgrading the technology systems in our offices, and improved office accessibility in terms of noise
reduction measures in our canteens. Accessibility improvements will continue to be a focus in 2022 as we plan to do further analysis
to determine actions and priorities.
Employee resource groups (ERGs) play an important role in increasing understanding and knowledge about diversity and creating
inclusion and engagement. Home office requirement across our offices and locations have had an impact on their actions and
engagement. In 2021, further support was offered to the ERGs by promoting and supporting various initiatives, and the set-up of
additional ERGs including Black in Equinor in Brazil, incluzive in UK, and Mental Health in Norway. Having analyzed our impact, we
have identified that these measures have not been sufficient and further actions in 2022 focus on senior sponsorship and HR support
to strengthen activity and engagement. Our ERGs are run through groups in Norway, Brazil, US and UK, but are inclusive and
welcoming of employee in all our locations.
Flexibility
In line with local Covid-19 restrictions and guidelines, we introduced a flexible work strategy to support combining work from the office
with work done outside the office in a virtual way. In close collaboration with union representatives, we established corporate
principles for flexible work agreements, which will guide our future efforts for teams that can safely and securely perform their tasks
outside an Equinor office or asset. We believe flexibility will support employees with caring responsibilities and other personal
commitments that require flexibility to ensure work-life balance, and continue to work to determine how best to apply these principles.
In Equinor ASA most of our employees work on a full-time basis, and we do not have employees who work involuntary part-time. The
2.4% of employees who work part time, do so on a voluntary basis. This group represents mostly women. We will continue to monitor
the number of part time workers and the gender balance to determine if further analysis is required to understand if Equinor can better
support employees who currently work part-time but wish to work full time
Number of employees, voluntary part time employees and temporary employees 2021
Female
Male
as of 31 December 2021
Number of employees
5,690
12,527
Voluntary part time employees (in %)
5.5 %
1.0 %
active in 2021
Temporary employees
Summer internship
57
89
Apprentices
148
385
Other temporary employees
10
24
We offer 16 weeks paid parental leave for all Equinor employees who become parents. In Equinor ASA, we report on the average
number of weeks employees took in relation to the Norwegian Statutory parental leave. According to Norwegian Statutory parental
leave, mothers have a quota of 18 weeks and fathers have 15 weeks with 100% pay. An additional 16 weeks may be split between
mothers and fathers at 100% pay. Parents in same-sex couples have the same rights. On average men took less leave than the 15
140 Equinor, Annual Report on Form 20-F 2021
weeks they are entitled to. This may reflect that the leave may be spread beyond the first 12 months, and we have identified the
opportunity to do further analysis to understand the data.
Equinor, Annual Report on Form 20-F 2021 141
Norwegian statutory parental leave, Equinor ASA 2021
Number of
employees
Average weeks
Median number of
weeks
Female
293
29
32
Male
546
12
15
The numbers above include both statutory paid and employee requested unpaid parental leave.
Our people performance data relate to permanent employees in our direct employment. Equinor defines consultants as contracted
personnel that are mainly based in our offices. Hired and contractor personnel, defined as third party service providers to onshore and
offshore operations, are not included in the table. These were roughly estimated to be 40,800 in 2021. The information about people
policies applies to Equinor ASA and its subsidiaries.
Total workforce by region, employment type and new hires in the Equinor group in 2021
as of 31 December 2021
Geographical region
Permanent
employees
Consultants
Total
workforce
1)
Consultants
(%)
Part time (%)
New hires
Norway
18,237
1,261
19,498
6%
2.4%
580
Rest of Europe
1,427
65
1,492
4%
1.5%
167
Africa
63
4
67
6%
0.0%
3
Asia
80
19
99
19%
0.0%
19
North America
667
62
729
9%
0.0%
38
South America
652
39
691
6%
0.2%
79
Total
21,126
1,450
22,576
6%
2.2%
886
Non-OECD
869
62
931
7%
0.1%
102
1)
Contractor personnel, defined as third-party service providers who work at our onshore and offshore operations, are not included. These
were roughly estimated to be 40,800 in 2021.
Employee relations
In Equinor we continuously involve our people in the development of the company. This includes internal cross-functional
collaboration and liaising with union representatives, and safety delegates according to local law, regulation, and practice. In 2021,
this was vital in the work related to the new operating model and corporate flexible work strategy and principles. Cooperation and
dialogue with trade unions and employee representatives has also been a prerequisite for all changes we make related to our physical
workplace. We respect employees’ rights to organize and their opportunity to bring forward their opinions, and we have the same clear
expectation of our suppliers and partners. Data on union membership figures is available in our sustainability performance data at
Equinor.com.
Measuring our progress
Our work with D&I is broad in scope. Measuring progress towards our D&I ambition, that all teams will be diverse and inclusive by
2025, requires both formal and in-formal data collection methods. We have identified improvement opportunities in how we report on
metrics globally, which has been highlighted in our prioritized actions for 2022.
In 2021, we continued to measure progress on our D&I ambition with the Corporate D&I KPI. The KPI was implemented in 2019 and
is made up by two indexes. The diversity index monitors each business area’s progression on team diversity in terms of gender, age,
nationality and experience.
The inclusion index is measured in our annual people survey and measures employees’ perception of inclusion in their teams. The
diversity index shows a slow but steady increase over the year with 2021 figure being 39 (baseline 2018 was 33, with 2025 ambition
of 55). Our inclusion index has increased over the years, however in 2021 the figure dropped one point to 77 (baseline 2018 was 76,
ambition 80). The D&I KPI has been a valuable tool since it was implemented, however our revised operating model requires us to
reconsider our D&I metrics going forward. We have also identified the need to improve the way we measure and report actions and
initiatives that go beyond diversity metrics – including engagement around D&I, activities by ERGs, and engagement on internal
communication channels. In 2022, we aim to formalise these metrics further.
142 Equinor, Annual Report on Form 20-F 2021

Equinor, Annual Report on Form 20-F 2021 143
Plans and priorities for 2022 and beyond
We continually review our D&I scope, priorities and reporting requirements, working towards our D&I ambition. One of our priorities for
2022 is to gain better overview of all our initiatives and metrics to determine our progress on a country level. This includes gaining
better understanding of country reporting requirements according to local legislative framework in our largest locations of Norway, UK,
USA and Brazil.
We will also complete a risk assessment to examine discrimination risks and diversity barriers to prioritise actions for 2022 and
beyond. This project will be led by People & Organisation in collaboration with legal and union representatives. A few concrete
activities have been prioritised for 2022 and will be part of the risk assessment. These include the following deliverables that are both
on global and Norwegian level:
1) Review and revise current D&I metrics to better report on our progress and legal requirements.
2) Analyze current state to ensure equity in key people processes, including recruitment, and further identify actions to increase
accessibility for our colleagues.
3) Strengthen and build a more inclusive culture by increasing awareness of diversity beyond gender – with particular focus on
activities related to disability, mental health and ethnicity.
Hammerfest LNG plant, Melkøya
144 Equinor, Annual Report on Form 20-F 2021
3 Corporate governance
Equinor, Annual Report on Form 20-F 2021 145
3.1 Introduction
Articles of association
Equinor's current articles of association were adopted at the annual general meeting of shareholders on 14 May 2020.
Summary of Equinor’s articles of association:
Name of the company
The registered name is Equinor ASA. Equinor is a Norwegian public limited company.
Registered office
Equinor’s registered office is in Stavanger, Norway, registered with the Norwegian Register of Business Enterprises under number
923 609 016.
Objective of the company
The objective of Equinor is, either by itself or through participation in or together with other companies, to engage in the exploration,
production, transportation, refining and marketing of petroleum and petroleum-derived products, and other forms of energy, as well as
other business.
Share capital
Equinor’s share capital is NOK 8,144,219,267.50 divided into 3,257,687,707 ordinary shares.
Nominal value of shares
The nominal value of each ordinary share is NOK 2.50.
Board of directors
Equinor’s articles of association provide that the board of directors shall consist of 9 - 11 directors. The board, including the chair and
the deputy chair, shall be elected by the corporate assembly for a period of up to two years.
Corporate assembly
Equinor has a corporate assembly comprising 18 members who are normally elected for a term of two years. The general meeting
elects 12 members with four deputy members, and six members with deputy members are elected by and among the employees.
General meetings of shareholders
Equinor’s annual general meeting is held no later than 30 June each year. The annual general meeting shall address and decide
adoption of the annual report and accounts, including the distribution of any dividend and any other matters required by law or the
articles of association.
Documents related to the general meetings do not need to be sent to all shareholders if they are accessible on Equinor’s website. A
shareholder may request that such documents be sent to him/her.
Shareholders may vote in writing, including through electronic communication, during a specified period before the general meeting.
Equinor's board of directors adopted guidelines for advance voting in March 2012, and these guidelines are described in the notices of
the annual general meetings.
Marketing of petroleum on behalf of the Norwegian State
Equinor’s articles of association provide that Equinor is responsible for marketing and selling petroleum produced under the State’s
direct financial interest’s (SDFI) shares in production licences on the Norwegian continental shelf as well as petroleum received by the
Norwegian State paid as royalty together with its own production. Equinor’s general meeting adopted an instruction in respect of such
marketing on 25 May 2001, as most recently amended by authorisation of the annual general meeting on 15 May 2018.
Nomination committee
The tasks of the nomination committee are to present a recommendation to:
●
The general meeting regarding the election of shareholder-elected members and deputy members of the corporate assembly.
●
The general meeting regarding the election of members of the nomination committee.
●
The general meeting for the remuneration of members of the corporate assembly and the nomination committee.
146 Equinor, Annual Report on Form 20-F 2021
●
The corporate assembly regarding the election of shareholder-elected members to the board of directors.
●
The corporate assembly for the remuneration for members of the board of directors.
●
The corporate assembly for election of the chair and the deputy chair of the corporate assembly.
The general meeting may adopt instructions for the nomination committee.
Code of Conduct
Ethics – Equinor’s approach
Equinor believes that responsible and ethical behaviour is a necessary condition for a sustainable business. Equinor’s Code of
Conduct is based on its values and reflects Equinor’s commitment to high ethical standards in all its activities.
Our Code of Conduct
The Code of Conduct describes Equinor’s code of business practice and the requirements for expected behaviour. The Code of
Conduct applies to Equinor’s board members, employees and hired personnel. It is divided into five main categories: The Equinor
way, Respecting our people, Conducting our operations, Relating to our business partners and Communities and environment.
The Code of Conduct is approved by the board of directors.
Equinor seeks to work with others who share its commitment to ethics and compliance, and Equinor manages its risks through in-
depth knowledge of suppliers, business partners and markets. Equinor expects its suppliers and business partners to comply with
applicable laws, respect internationally recognised human rights and adhere to ethical standards which are consistent with Equinor’s
ethical requirements when working for or together with Equinor. In joint ventures and entities where Equinor does not have control,
Equinor makes good faith efforts to encourage the adoption of ethics and anti-corruption policies and procedures that are consistent
with its standards. Equinor will not tolerate any breaches of the Code of Conduct. Remedial measures may include termination of
employment and reporting to relevant authorities.
Training and certifying the Code of Conduct
All Equinor employees must annually confirm electronically that they understand and will comply with the Code of Conduct and pass a
quiz to certify as competent (Code certification). The Code certification reminds the individuals of their duty to comply with Equinor’s
values and ethical requirements, including how to report concerns.
In 2021, the Code of Conduct was included in Equinor’s competence assurance management solution (CAMS), providing
management with the opportunity to monitor the completion rate daily, and be more targeted in their follow-up based on completion
data in the Code of Conduct dashboard.
Further, there are specific training on various compliance topics, including anti-corruption, anti-trust, anti-money laundering and
sanctions. In 2021, many workshops were held virtually. The anti-corruption and anti-money laundering e-learning was updated in
2021.
Anti-corruption compliance program
Equinor is against all forms of corruption including bribery, facilitation payments and trading in influence. There is a company-wide
anti-corruption compliance program which implements the zero-tolerance policy. The program includes mandatory procedures
designed to comply with applicable laws and regulations, as well as guidance and training on relevant topics such as gifts, hospitality
and conflict of interest. A global network of compliance officers, who support the integration of ethics and anti-corruption
considerations into Equinor’s business activities, constitute an important part of the program.
Equinor consistently works with its partners and suppliers on ethics and anti-corruption compliance and has initiated dialogue with
several partners on the risks that we jointly face and actions that can be taken to address them. There are separate compliance
policies and procedures describing Equinor’s management of third-party corruption risk both in operated and non-operated joint
ventures, and on integrity due diligence of third parties.
Open dialogue and raising concerns
Equinor is committed to maintain an open dialogue on ethical issues. The Code of Conduct requires those who suspect a violation of
the Code of Conduct or other unethical conduct to raise their concern. Employees are encouraged to discuss concerns with their
leader. Equinor recognises that raising a concern is not always easy so there are several internal channels for taking concerns
forward, including through People and Organisation or the ethics and compliance function in the legal department. Concerns can also
be raised through the externally operated Ethics Helpline which is available 24/7 and allows for anonymous reporting and two-way
communication. Equinor has a non-retaliation policy for anyone who raises an ethical or legal concern in good faith.
More information about Equinor’s policies and requirements related to the Code of Conduct is available on
www.equinor.com/en/about-us/ethics-and-compliance-in-equinor.html
.
Equinor, Annual Report on Form 20-F 2021 147
Compliance with NYSE listing rules
Equinor's primary listing is on the Oslo Børs, and its ADRs are listed on the NYSE. In addition, Equinor is a foreign private issuer
subject to the reporting requirements of the SEC rules.
ADRs represent the company's ordinary shares listed on the NYSE. While Equinor's corporate governance practices follow the
requirements of Norwegian law, Equinor is also subject to the NYSE's listing rules.
As a foreign private issuer, Equinor is exempted from most of the NYSE corporate governance standards that domestic US
companies must comply with. However, Equinor is required to disclose any significant ways in which its corporate governance
practices differ from those applicable to domestic US companies under the NYSE rules. A statement of differences is set out below:
Corporate governance guidelines
The NYSE rules require domestic US companies to adopt and disclose corporate governance guidelines. Equinor's corporate
governance principles are developed by the management and the board of directors, in accordance with the Code of Practice and
applicable law. Oversight of the board of directors and management is exercised by the corporate assembly.
Director independence
The NYSE rules require domestic US companies to have a majority of "independent directors". The NYSE definition of an
"independent director" sets out five specific tests of independence and requires an affirmative determination by the board of directors
that the director has no material relationship with the company.
Pursuant to Norwegian company law, Equinor's board of directors consists of members elected by shareholders and employees.
Equinor's board of directors has determined that, in its judgment, all shareholder-elected directors are independent. In making its
determinations of independence, the board focuses inter alia on there not being any conflicts of interest between shareholders, the
board of directors and the company's management. It does not strictly make its determination based on the NYSE's five specific tests
but takes into consideration all relevant circumstances which may in the board’s view affect the directors’ independence. The directors
elected from among Equinor's employees would not be considered independent under the NYSE rules as they are employees of
Equinor. None of these employee representatives are executive officers of the company.
For further information about the board of directors, see 3.8 Corporate assembly, board of directors and management.
Board committees
Pursuant to Norwegian company law, managing the company is the responsibility of the board of directors. Equinor has an audit
committee, a safety, sustainability and ethics committee and a compensation and executive development committee. The audit
committee and the compensation and executive development committee operate pursuant to instructions that are broadly comparable
to the applicable committee charters required by the NYSE rules. They report on a regular basis to, and are subject to, oversight by
the board of directors. For further information about the board’s committees, see 3.9 The work of the board of directors.
Equinor complies with the NYSE rule regarding the obligation to have an audit committee that meets the requirements of Rule 10A-3
of the US Securities Exchange Act of 1934.
The members of Equinor's audit committee include an employee-elected director. Equinor relies on the exemption provided in Rule
10A-3(b)(1)(iv)(C) from the independence requirements of the US Securities Exchange Act of 1934 with respect to the employee-
elected director. Equinor does not believe that its reliance on this exemption will materially adversely affect the ability of the audit
committee to act independently or to satisfy the other requirements of Rule 10A-3 relating to audit committees. The other members of
the audit committee meet the independence requirements under Rule 10A-3.
Among other things, the audit committee evaluates the qualifications and independence of the company's external auditor.
However,
in accordance with Norwegian law, the auditor is elected by the annual general meeting of the company's shareholders.
Equinor does not have a nominating/corporate governance committee formed from its board of directors. Instead, the roles prescribed
under the NYSE rules for such committee are principally carried out by the corporate assembly and the nomination committee, each of
which is elected by the general meeting of shareholders.
NYSE rules require the compensation committee of US companies to comprise independent directors, recommend senior
management remuneration and determine the independence of advisors when engaging them. Equinor, as a foreign private issuer, is
exempted from complying with these rules and is permitted to follow its home country regulations. Equinor considers all its
compensation committee members to be independent (under Equinor’s framework which, as discussed above, is not identical to that
of NYSE). Equinor's compensation committee makes recommendations to the board regarding management remuneration, including
that of the CEO. Further, the compensation committee assesses its own performance and has the authority to hire external advisors.
The nomination committee, which is elected by the general meeting of shareholders, recommends to the corporate assembly the
148 Equinor, Annual Report on Form 20-F 2021
candidates and remuneration of the board of directors. The nomination committee also recommends to the general meeting of
shareholders the candidates and remuneration of the corporate assembly and the nomination committee.
Shareholder approval of equity compensation plans
The NYSE rules require that, with limited exemptions, all equity compensation plans must be subject to a shareholder vote. Under
Norwegian company law, although the issuance of shares and authority to buy-back company shares must be approved by Equinor's
annual general meeting of shareholders, the approval of equity compensation plans is normally reserved for the board of directors.
3.2 General meeting of shareholders
The general meeting of shareholders is Equinor’s supreme corporate body. It serves as a democratic and effective forum for
interaction between the company’s shareholders, board of directors and management.
The next annual general meeting (AGM) is scheduled for 11 May 2022.The AGM will be held as a combined physical and digital
meeting (subject to potential Covid-19 restrictions). Practical details will follow from the notice of AGM and on our website. The AGM
is conducted in Norwegian, with simultaneous English translation during the webcast. At Equinor's digital AGM on 11 May 2021, 80.18
% of the share capital was represented either by personal attendance, by proxy or by advance voting.
The main framework for convening and holding Equinor's AGM is as follows:
Pursuant to Equinor’s articles of association, the AGM must be held by the end of June each year. Notice of the meeting and
documents relating to the AGM are published on Equinor's website and notice is sent to all shareholders with known addresses at
least 21 days prior to the meeting. All shareholders who are registered in the Norwegian Central Securities Depository (VPS) will
receive an invitation to the AGM. Other documents relating to Equinor's AGMs will be made available on Equinor's website. A
shareholder may request that these documents be sent to him/her.
Shareholders are entitled to have their proposals dealt with at the AGM if the proposal has been submitted in writing to the board of
directors in sufficient time to enable it to be included in the notice of meeting, i.e. no later than 28 days before the meeting.
As described in the notice of the general meeting, shareholders may vote in writing, including through electronic communication,
during a specified period before the general meeting.
The AGM is normally opened and chaired by the chair of the corporate assembly. If there is a dispute concerning individual matters
and the chair of the corporate assembly belongs to one of the disputing parties or is for some other reason not perceived as being
impartial, another person will be appointed to chair the AGM. This is in order to ensure impartiality in relation to the matters to be
considered.
Equinor, Annual Report on Form 20-F 2021 149
The following matters are decided at the AGM:
●
recommended by the corporate assembly.
●
●
●
●
All shares carry an equal right to vote at general meetings. Resolutions at general meetings are normally passed by simple majority.
However, Norwegian company law requires a qualified majority for certain resolutions, including resolutions to waive preferential rights
in connection with any share issue, approval of a merger or demerger, amendment of the articles of association or authorisation to
increase or reduce the share capital. Such matters require the approval of at least two-thirds of the aggregate number of votes cast as
well as two-thirds of the share capital represented at the general meeting.
If shares are registered by a nominee in the Norwegian Central Securities Depository (VPS), cf. section 4-10 of the Norwegian Public
Limited Liability Companies Act, and the beneficial shareholder wants to vote such shares, the beneficial shareholder must re-register
the shares in a separate VPS account in such beneficial shareholder’s own name prior to the general meeting. If the holder can prove
that such steps have been taken and that the holder has a de facto shareholder interest in the company, the company will allow the
shareholder to vote the shares. Decisions regarding voting rights for shareholders and proxy holders are made by the person opening
the meeting, whose decisions may be reversed by the general meeting by simple majority vote.
The minutes of the AGM are made available on Equinor’s website immediately after the AGM.
An extraordinary general meeting (EGM) will be held in order to consider and decide a specific matter if demanded by the corporate
assembly, the chair of the corporate assembly, the auditor or shareholders representing at least 5% of the share capital. The board
must ensure that an EGM is held within a month of such demand being submitted.
The following sections outline certain types of resolutions by the general meeting of shareholders:
New share issues
If Equinor issues any new shares, including bonus shares, the articles of association must be amended. This requires the same
majority as other amendments to the articles of association (i.e. two-thirds of votes cast as well as two-thirds of the share capital). In
addition, under Norwegian law, the shareholders have a preferential right to subscribe for new shares issued by Equinor. The
preferential right to subscribe for an issue may be waived by a resolution of a general meeting passed by the same percentage
majority as required to approve amendments to the articles of association. The general meeting may, with a two-thirds majority as
described above, authorise the board of directors to issue new shares, and to waive the preferential rights of shareholders in
connection with such share issues. Such authorisation may be effective for a maximum of two years, and the par value of the shares
to be issued may not exceed 50% of the nominal share capital when the authorisation was granted.
The issuing of shares through the exercise of preferential rights to holders who are citizens or residents of the US may require Equinor
to file a registration statement in the US under US securities laws. If Equinor decides not to file a registration statement, these holders
may not be able to exercise their preferential rights.
Right of redemption and repurchase of shares
Equinor’s articles of association do not authorise the redemption of shares. In the absence of authorisation, the redemption of shares
may nonetheless be decided upon by a general meeting of shareholders by a two-thirds majority on certain conditions. However, such
share redemption would, for all practical purposes, depend on the consent of all shareholders whose shares are redeemed.
A Norwegian company may purchase its own shares if authorisation to do so has been granted by a general meeting with the
approval of at least two-thirds of the aggregate number of votes cast as well as two-thirds of the share capital represented at the
general meeting. The aggregate par value of such treasury shares held by the company must not exceed 10% of the company's share
capital, and treasury shares may only be acquired if, according to the most recently adopted balance sheet, the company's
distributable equity exceeds the consideration to be paid for the shares. Pursuant to Norwegian law, authorisation by the general
meeting to repurchase shares cannot be granted for a period exceeding 18 months.
Distribution of assets on liquidation
Under Norwegian law, a company may be wound up by a resolution of the company's shareholders at a general meeting passed by
both a two-thirds majority of the aggregate votes cast and a two-thirds majority of the aggregate share capital represented at the
general meeting. The shares are ranked equally in the event of a return on capital by the company upon winding up or otherwise.
150 Equinor, Annual Report on Form 20-F 2021
3.3 Nomination committee
Pursuant to Equinor's articles of association, the nomination committee shall consist of four members who are shareholders or
representatives of shareholders. The duties of the nomination committee are set forth in the articles of association, and the
instructions for the committee are adopted by the general meeting of shareholders.
The duties of the nomination committee are to submit recommendations to:
●
and the remuneration for members of the corporate assembly.
●
●
members of the board of directors.
●
The nomination committee seeks to ensure that the shareholders’ views are taken into consideration when candidates to the
governing bodies of Equinor ASA are proposed. The nomination committee invites Equinor's largest shareholders to propose
shareholder-elected candidates of the board of directors and the corporate assembly, as well as members of the nomination
committee. The shareholders are also invited to provide input to the nomination committee in respect of the composition and
competence of Equinor's governing bodies considering Equinor's strategy and challenges and opportunities going forward. The
deadline for providing input is normally set to early/mid-January so that such input may be taken into account in the upcoming
nominations. In addition, all shareholders have an opportunity to submit proposals through an electronic mailbox as described on
Equinor’s website. The results from an annual board evaluation, normally externally facilitated, are made available to the nomination
committee for the board nomination process. Separate meetings are held between the nomination committee and each board
member, including employee-elected board members. The chair of the board and the chief executive officer are invited, without having
the right to vote, to attend at least one meeting of the nomination committee before it makes its final recommendations. The committee
regularly utilises external expertise in its work and provides reasons for its recommendations of candidates.
The members of the nomination committee are elected by the annual general meeting. The chair of the nomination committee and
one other member are elected from among the shareholder-elected members of the corporate assembly. Members of the nomination
committee are normally elected for a term of two years.
Personal deputy members for one or more of the nomination committee's members may be elected in accordance with the same
criteria as described above. A deputy member normally only attends in lieu of the permanent member if the appointment of that
member terminates before the term of office has expired.
Equinor's nomination committee consists of the following members as of 31 December 2021 and are elected for the period up to the
annual general meeting in 2022:
●
●
Energy (personal deputy for Bjørn Ståle Haavik is Andreas Hilding Eriksen, Secretary General at the Norwegian Ministry of
Petroleum and Energy)
●
●
The board considers all members of the nomination committee to be independent of Equinor's management and board of directors.
The nomination committee held 21 ordinary meetings in 2021.
The instructions for the nomination committee are available at
www.equinor.com/nominationcommittee
.
3.4 Corporate assembly
Pursuant to the Norwegian Public Limited Liability Companies Act, companies with more than 200 employees must elect a corporate
assembly unless otherwise agreed between the company and a majority of its employees.
In accordance with Equinor's articles of association, the corporate assembly consists of 18 members, 12 of whom (with four deputy
members) are nominated by the nomination committee and elected by the annual general meeting. They represent a broad cross-
section of the company's shareholders and stakeholders. Six members (with deputy members) and three observers are elected by
and among our employees in Equinor ASA or a subsidiary in Norway. Such employees are non-executive personnel. The corporate
assembly elects its own chair and deputy chair from and among its members.
Members of the corporate assembly are normally elected for a term of two years and all live in Norway. Members of the board of
directors and management cannot be members of the corporate assembly, but they are entitled to attend and to speak at meetings
Equinor, Annual Report on Form 20-F 2021 151
unless the corporate assembly decides otherwise in individual cases. Members of the corporate assembly do not have service
contracts with the company or its subsidiaries providing for benefits upon termination of office.
An overview of the members and observers of the corporate assembly as of 31 December 2021 follows.
152 Equinor, Annual Report on Form 20-F 2021
Name
Occupation
Place of
residence
Year of
birth
Position
Family relations
to corporate
executive
committee,
board or
corporate
assembly
members
Share
ownership
for members
as of 31
December
2022
Share
ownership
for members
as of 8 March
2022
First
time
elected
Expiration
date of
current
term
Tone Lunde
Bakker
CEO Export Finance Norway
Oslo
1962
Chair,
Shareholder-
elected
No
0
0
2014
2022
Nils Bastiansen
Executive director of equities in
Folketrygdfondet
Oslo
1960
Deputy chair,
Shareholder-
elected
No
0
0
2016
2022
Greger
Mannsverk
Managing director, Kimek AS
Kirkenes
1961
Shareholder-
elected
No
0
0
2002
2022
Terje Venold
Independent advisor with
various directorships
Bærum
1950
Shareholder-
elected
No
500
500
2014
2022
Kjersti Kleven
Co-owner of John Kleven AS
Ulsteinvik
1967
Shareholder-
elected
No
0
0
2014
2022
Jarle Roth
CEO, Umoe Group
Bærum
1960
Shareholder-
elected
No
500
500
2016
2022
Finn Kinserdal
Associate professor,
Norwegian School of
Economics and Business
(NHH)
Bergen
1960
Shareholder-
elected
No
0
0
2018
2022
Kari Skeidsvoll
Moe
General Counsel,
Trønderenergi AS
Trondheim
1975
Shareholder-
elected
No
0
0
2018
2022
Kjerstin Fyllingen
CEO at Haraldsplass
Diakonale Sykehus AS
Paradis
1958
Shareholder-
elected
No
0
0
2020
2022
Kjerstin
Rasmussen
Braathen
CEO of DNB ASA
Oslo
1970
Shareholder-
elected
No
353
353
2020
2022
Mari Rege
Professor of Economics at the
UiS Business School at the
University of Stavanger
Stavanger
1974
Shareholder-
elected
No
0
0
2020
2022
Trond Straume
CEO of Volue ASA
Sandnes
1977
Shareholder-
elected
No
100
100
2020
2022
Peter B. Sabel
Union representative,
Tekna/NITO, Project Leader
Hafrsfjord
1968
Employee-
elected
No
0
0
2019
2023
Oddvar Karlsen
Union representative, Industri
Energi
Brattholmen
1957
Employee-
elected
No
1,177
342
2019
2023
Berit Søgnen
Sandven
Union representative,
Tekna/NITO, Principal
Engineer Fiscal metering
Kalandseidet
1962
Employee-
elected
No
3,826
4,039
2019
2023
Terje Enes
Union representative, SAFE,
Discipl Resp Maint Mech
Stavanger
1958
Employee-
elected
No
850
417
2017
2023
Lars Olav Grøvik
Union representative, Tekna,
Advisor Petech
Bergen
1961
Employee-
elected
No
8,354
8,672
2017
2023
Frode Mikkelsen
Union representative, Industri
Energi
Hauglandshe
lla
1957
Employee-
elected
No
569
416
2019
2023
Per Helge
Ødegård
Union representative, Lederne,
Discipl resp operation process
Porsgrunn
1963
Employee-
elected,
observer
No
568
417
1994
2023
Ingvild Berg
Martiniussen
Union representative,
Tekna/NITO, Principal
Researcher Production
Technology
Porsgrunn
1975
Employee-
elected,
observer
No
2,480
2,605
2021
2023
Anne Kristi
Horneland
Union representative, Industri
Energi, employee
representative RIR
Hafrsfjord
1956
Employee-
elected,
observer
No
7,801
8,075
2006
2023
Total
27,078
26,436
Equinor, Annual Report on Form 20-F 2021 153
Shareholder elected members of the corporate assembly were elected in May 2020 for a period of two years. However, Brynjar
Kristian Forbergskog chose to resign as a member in June 2021. Accordingly, deputy member Trond Straume became a member of
the corporate assembly as of 9 June 2021. An election of the employee-elected members of the corporate assembly was held in early
2021. As of 12 May 2021, Peter B. Sabel (previously observer) was elected as new member, replacing Sun Maria Lehmann. Oddvar
Karlsen, Berit Søgnen Sandven, Lars Olav Grøvik, Frode Mikkelsen and Terje Enes were re-elected as members of the corporate
assembly. Ingvild Berg Martiniussen was elected as new observer, replacing Peter B. Sabel. Per Helge Ødegård and Anne Kristi
Horneland were re-elected as observers. A total list of members and deputy members can be found at
www.equinor.com/corporateassembly
.
The duties of the corporate assembly are defined in section 6-37 of the Norwegian Public Limited Liability Companies Act. The
corporate assembly elects the board of directors and the chair of the board and can vote separately on each nominated candidate. Its
responsibilities also include overseeing the board and the CEO's management of the company, making decisions on investments of
considerable magnitude in relation to the company's resources, and making decisions involving the rationalisation or reorganisation of
operations that will entail major changes in or reallocation of the workforce.
Equinor's corporate assembly held four ordinary meetings in 2021. The chair of the board and the CEO participated in all four
meetings. Other members of management were also present at the meetings.
The procedure for the work of the corporate assembly, as well as an updated overview of its members, is available at
www.equinor.com/corporateassembly
.
154 Equinor, Annual Report on Form 20-F 2021
3.5 Board of directors
Pursuant to Equinor's articles of association, the board of directors consists of between 9 and 11 members elected by the corporate
assembly. The chair and the deputy chair of the board are also elected by the corporate assembly. At present, Equinor's board of
directors consists of 11 members. As required by Norwegian company law, the company's employees are represented by three board
members.
The employee-elected board members, but not the shareholder-elected board members, have three deputy members who attend
board meetings in the event an employee-elected member of the board is unable to attend. The management is not represented on
the board of directors. Members of the board are elected for a term of up to two years, normally for one year at a time. There are no
board member service contracts that provide for benefits upon termination of office.
The board considers its composition to be competent with respect to the expertise, capacity and diversity appropriate to attend to the
company's strategy, goals, main challenges, and the common interest of all shareholders. The board members have experience from
oil, gas, renewables, shipping, telecom, politics and climate policy. The board also deems its composition to consist of individuals who
are willing and able to work as a team, resulting in an efficient and collegiate board. At least one board member qualifies as an "audit
committee financial expert", as defined in the SEC rules. The board has determined that, in its judgment, all the shareholder
representatives on the board are considered independent. Seven board members are men, four board members are women and three
board members are non-Norwegians resident outside of Norway.
Equinor ASA has purchased and maintains a Directors and Officers Liability Insurance on behalf of the members of the board of
directors and the CEO. The insurance also covers any employee acting in a managerial capacity and includes controlled subsidiaries.
The insurance policy is issued by a reputable insurer with an appropriate rating.
The board held eight ordinary board meetings and three extraordinary meetings in 2021. Average attendance at these board meetings
was 100%.
Further information about the members of the board and its committees, including information about expertise, experience, other
directorships, independence, share ownership and loans, follows and is available on our website at
www.equinor.com/board
.


Equinor, Annual Report on Form 20-F 2021 155
Members of the board of directors as of 31 December 2021:
Jon Erik Reinhardsen
Born: 1956
Position:
Shareholder-elected chair of the board and chair of the board's compensation and executive development committee.
Term of office:
Chair of the board of Equinor ASA since 1 September 2017. Up for election in 2022.
Independent:
Yes
Other directorships:
Member of the board of Oceaneering International, Inc., Telenor ASA and Awilhelmsen AS and chair of the
board of Fire Security AS.
Number of shares in Equinor ASA as of 31 December 2021:
4,584
Loans from Equinor:
None
Experience:
Reinhardsen is a part-time senior advisor with BearingPoint Capital. Reinhardsen was the Chief Executive Officer of
Petroleum Geo-Services (PGS) from 2008 - August 2017. PGS delivers global geophysical- and reservoir services. In the period 2005
- 2008 Reinhardsen was President Growth, Primary Products in the international aluminium company Alcoa Inc. with headquarters in
the US, and he was in this period based in New York.
From 1983 to 2005, Reinhardsen held various positions in the Aker Kværner group, including Group Executive Vice President of Aker
Kværner ASA, Deputy Chief Executive Officer and Executive Vice President of Aker Kværner Oil & Gas AS in Houston and Executive
Vice President in Aker Maritime ASA.
Education:
Master’s degree in Applied Mathematics and Geophysics from the University of Bergen. He has also attended the
International Executive Program at the Institute for Management Development (IMD) in Lausanne, Switzerland.
Family relations:
assembly.
Other matters:
In 2021, Reinhardsen participated in eight ordinary board meetings, three extraordinary board meetings, six meetings
of the compensation and executive development
committee and four meetings of the audit committee. Reinhardsen is a Norwegian citizen and resident in Norway.
Jeroen van der Veer
Born:
Position:
sustainability and ethics committee.
Term of office
: Deputy chair of the board of Equinor ASA since 1 July 2019 and member since
18 March 2016. Up for election in 2022.
Independent
: Yes
Other directorships
: Chair of the supervisory board of Royal Boskalis Westminster NV.
Number of shares in Equinor ASA as of 31 December 2021:
Loans from Equinor:
Experience
: After he retired in 2009 van der Veer continued with the international oil and gas company Royal Dutch Shell Plc (Shell)
as a non-executive director on the board until 2013. He was the Chief Executive Officer of Shell in the period 2004 - 2009. He started
to work for Shell in 1971 and has experience within all sectors of the business and has significant competence within corporate
governance.


156 Equinor, Annual Report on Form 20-F 2021
Education:
Degree in Mechanical Engineering (MSc) from Delft University of Technology, Netherlands and a degree in Economics
(MSc) from Erasmus University, Rotterdam, Netherlands. Since 2005 he holds an honorary doctorate from the University of Port
Harcourt, Nigeria.
Family relations
: No family relations to other members of the board, members of the corporate executive committee or the corporate
assembly.
Other matters
: In 2021, van der Veer participated in eight ordinary board meetings, three extraordinary board meetings, six ordinary
and two extraordinary
meetings of the audit committee
and five meetings of the safety, sustainability and ethics committee. van der
Veer is a Dutch citizen and resident in the Netherlands.
Bjørn Tore Godal
Born
: 1945
Position:
Shareholder-elected member of the board, the board's compensation and executive development committee and the
board's safety, sustainability and ethics committee.
Term of office:
Member of the board of Equinor ASA since 1 September 2010. Up for election in 2022.
Independent:
Yes
Other directorships:
Chair of the Oslo Center’s Board of Trustees.
Number of shares in Equinor ASA as of 31 December 2021:
None
Loans from Equinor:
Experience:
From 2014 - 2016, Godal led a government-appointed committee responsible for the evaluation of the civil and military
contribution from Norway in Afghanistan in the period 2001 - 2014. From 2007 - 2010, he was Special Adviser for international energy
and climate issues at the Ministry of Foreign Affairs. From 2003 - 2007, he was Norway's ambassador to Germany and from 2002 -
2003 he was senior adviser at the Department of Political Science at the University of Oslo. Godal was a member of the Norwegian
parliament for 15 years during the period 1986 - 2001. At various times he served as Minister for Trade and Shipping, Minister for
Defence and Minister of Foreign Affairs for a total of eight years between 1991 and 2001.
Education:
Family relations:
No family relations to other members of the board, members of the corporate executive committee or the corporate
assembly.
Other matters:
compensation and executive development committee and five meetings of the safety, sustainability and ethics committee. Godal is a
Norwegian citizen and resident in Norway.
Rebekka Glasser Herlofsen
Born
: 1970
Position
: Shareholder-elected member of the board and the board's audit committee.

Equinor, Annual Report on Form 20-F 2021 157
Term of office
: Member of the board of Equinor ASA since 19 March 2015. Up for election in 2022.
Independent
: Yes
Other directorships
: Chair of the board of Norwegian Hull Club (NHC) and Handelsbanken Norge, board member of SATS ASA,
Rockwool International A/S, BW Offshore ASA, Klaveness Combination Carriers ASA and Wilh. Wilhelmsen Holding ASA.
Number of shares in Equinor ASA as of 31 December 2021:
220
Loans from Equinor:
None
Experience:
Herlofsen is an independent board member and consultant. She was previously the Chief Financial Officer in Wallenius
Wilhelmsen ASA, an international shipping company. Before joining Wallenius Wilhelmsen, she was the Chief Financial Officer in the
shipping company Torvald Klaveness since 2012. She has broad financial and strategic experience from several corporations and
board directorships. Herlofsen’s professional career began in the Nordic Investment Bank, Enskilda Securities, where she worked with
corporate finance from 1995 to 1999 in Oslo and London. During the next ten years Herlofsen worked in the Norwegian shipping
company Bergesen d.y. ASA (later BW Group). During her period with Bergesen d.y. ASA/BW Group she held leading positions within
M&A, strategy and corporate planning and was part of the group management team.
Education:
MSc in Economics and Business Administration (Siviløkonom) and Certified Financial Analyst Programme (AFA) from the
Norwegian School of Economics (NHH). Breakthrough Programme for Top Executives at IMD business school, Switzerland.
Family relations:
No family relations to other members of the board, members of the corporate
executive committee or the corporate assembly.
Other matters:
and two extraordinary meetings of the audit committee. Herlofsen is a Norwegian citizen and resident in Norway.
Anne Drinkwater
Born
: 1956
Position
: Shareholder-elected member of the board, chair of the board’s safety, sustainability and ethics committee and member of
the board’s audit committee.
Term of office
: Member of the board of Equinor ASA since 1 July 2018. Up for election in 2022.
Independent:
Other directorships:
Number of shares in Equinor ASA
as of 31 December 2021:
Loans from Equinor:
Experience:
Drinkwater was employed with bp in the period 1978 - 2012, holding a number of different leadership positions in the
company. In the period 2009 - 2012 she was chief executive officer of bp Canada. She has extensive international experience,
including being responsible for operations in the US, Norway, Indonesia, the Middle East and Africa. Through her career Drinkwater
has acquired a deep understanding of the oil and gas sector, holding both operational roles, and more distinct business
responsibilities.
Education:
Bachelor of Science in Applied Mathematics and Statistics, Brunel University London.
Family relations:
No family relations to other members of the board, members of the corporate executive committee or the corporate
assembly.
Other matters:
and two extraordinary meetings of the audit committee and five meetings of the safety, sustainability and ethics committee. Drinkwater
is a British citizen and resident in the US.


158 Equinor, Annual Report on Form 20-F 2021
Jonathan Lewis
Born
: 1961
Position
: Shareholder-elected member of the board and member of the board’s compensation and executive development committee
and the board’s safety, sustainability and ethics committee.
Term of office
: Member of the board of Equinor ASA since 1 July 2018. Up for election in 2022.
Independent
: Yes
Other directorships
: Member of the board of Capita plc.
Number of shares in Equinor ASA as of 31 December 2021
: None
Loans from Equinor
: None
Experience
: Lewis joined as chief executive officer (CEO) to Capita plc in December 2017; having previously spent 30 years working
for large multi-national companies in technology-enabled industries. Lewis came to Capita plc from Amec Foster Wheeler plc, a global
consulting, engineering and construction company, where he was CEO from 2016 - 2017. Prior to this, he held a number of senior
leadership positions at Halliburton, where he was employed in the period 1996 - 2016. Lewis has previously held several directorships
within technology and the oil and gas industry.
Education:
Stanford Executive Program (SEP) from Stanford University Graduate School of Business, a PhD, Reservoir
Characterisation, Geology/Sedimentology from University of Reading as well as a Bachelor of Science, Geology from Kingston
University.
Family relations
: No family relations to other members of the board, members of the corporate executive committee or the corporate
assembly.
Other matters:
compensation and executive development committee and five meetings of the safety, sustainability and ethics committee. Lewis is a
British citizen and resident in the UK.
Finn Bjørn Ruyter
Born
: 1964
Position
: Shareholder-elected member of the board and member of the board’s audit committee and the board’s compensation and
executive development committee.
Term of office
: Member of the board of Equinor ASA since 1 July 2019. Up for election in 2022.
Independent
: Yes
Other directorships
: Chair of the board of Energi Norge AS and board member of Fortum Oslo Varme AS, Cegal Sysco AS, Eidsiva
Energi AS and several subsidiaries of Hafslund Eco AS.
Number of shares in Equinor ASA as of 31 December 2021
: 620
Loans from Equinor
: None
Experience
: Ruyter has since July 2018 been chief executive officer (CEO) of Hafslund Eco AS. He was CEO of Hafslund ASA from
January 2012, and chief financial officer (CFO) in the company from 2010 - 2011. In 2009 - 2010 he held a position as chief operating
officer (COO) in the Philippine hydro power company SN Aboitiz Power. In the period 1996 - 2009 he led the power trading entity and
from 1999 also the energy division in Elkem. From 1991 - 1996 Ruyter worked with energy trading in Norsk Hydro.
Equinor, Annual Report on Form 20-F 2021 159
Education:
Master’s degree in Mechanical Engineering from the Norwegian University of Technology (NTNU) and an MBA from BI
Norwegian School of Management.
Family relations
: No family relations to other members of the board, members of the corporate executive committee or the corporate
assembly.
Other matters:
two extraordinary meetings of the audit committee and six meetings of the compensation and executive development committee.
Ruyter is a Norwegian citizen and resident in Norway.


160 Equinor, Annual Report on Form 20-F 2021
Tove Andersen
Born
: 1970
Position
: Shareholder-elected member of the board and the board’s compensation and executive development committee.
Term of office
: Member of the board of Equinor ASA since 1 July 2020. Up for election in 2022.
Independent
: Yes
Other directorships
: Member of the board of Borregaard ASA.
Number of shares in Equinor ASA as of 31 December 2021:
Loans from Equinor:
Experience
: Andersen is President & chief executive officer (CEO) of Tomra Systems ASA as of 16 August 2021. Prior to this, she
held the position as executive vice president for Europe in Yara International ASA. Andersen was part of the executive management
team in Yara since 2016 where she also held positions as executive vice president, Production and executive vice president, Supply
Chain. Previously she has had several management roles within Yara and Norsk Hydro/Yara and she started in Norsk Hydro in 1997.
She has extensive international industrial experience, and she has broad board experience.
Education
: Master of Science (Sivilingeniør) from Norwegian Institute of Technology (NTNU) and a Master of Business Administration
from the BI Norwegian Business School.
Family relations
: No family relations to other members of the board, members of the corporate executive committee or the corporate
assembly.
Other matters
: In 2021, Andersen participated in eight ordinary board meetings, three extraordinary board meetings and five
meetings of the compensation and executive development committee. Andersen is a Norwegian citizen and resident in Norway.
P
er Martin Labråten
Born:
Position:
and the board’s safety, sustainability and ethics committee.
Term of office:
Independent:
Other directorships:
positions as a result of this.
Number of shares in Equinor ASA as of 31 December 2021:
2,642
Loans from Equinor:
Experience:
process technician at the petrochemical plant on Oseberg field in the North Sea.
Education:
Labråten has a craft certificate as a process/chemistry worker.
Family relations:
assembly.
Other matters:
the compensation and executive development committee and five meetings of the safety, sustainability and ethics committee.
Labråten is a Norwegian citizen and resident in Norway.


Equinor, Annual Report on Form 20-F 2021 161
Hilde Møllerstad
Born:
1966
Position:
Employee-elected member of the board and member of the board's audit committee.
Term of office:
Member of the board of Equinor ASA since 1 July 2019. Up for election in 2023.
Independent:
No
Other directorships:
Chair of Tekna’s ethical board.
Number of shares held in Equinor ASA as of 31 December 2021:
5,234
Loans from Equinor:
Experience:
Production International. Møllerstad has been a member of the Corporate Assembly in Equinor from 2013 - 2019 and was a board
member of Tekna Private from 2012 - 2017 and she has had several trust offices in Tekna Equinor since 1993.
Education:
(PME) from Norwegian Business School BI/ Norwegian University of Science and Technology (BI/NTNU).
Family relations:
No family relationships to other board members, members of the corporate executive committee or the corporate
assembly.
Other matters:
In 2021, Møllerstad participated in eight ordinary board meetings, three extraordinary board meetings and six ordinary
and two extraordinary meetings of the audit committee. Møllerstad is a Norwegian citizen and resident in Norway.
Stig Lægreid
Born
: 1963
Position:
Employee-elected member of the board and member of the board's safety, sustainability and ethics committee.
Term of office:
Member of the board of Equinor ASA since 1 July 2013. Up for election in 2023.
Independent:
No
Other directorships
: None
Number of shares held in Equinor ASA as of 31 December 2021
: 125
Loans from Equinor
: None
Experience:
Lægreid is now a full-time employee representative as the leader of NITO, Equinor. He has been occupied as weight
estimator for platform design from 2005 and prior to this as project engineer and constructor for production of primary metals.
Employed in ÅSV and Norsk Hydro since 1985.
Education
: Bachelor’s degree, Mechanical Construction from Oslo college of engineering (OIH).
Family relations:
No family relationships to other board members, members of the corporate executive committee or the corporate
assembly.
Other matters
: In 2021, Lægreid participated in eight ordinary board meetings, three extraordinary board meetings and five meetings
of the safety, sustainability and ethics committee. Lægreid is a Norwegian citizen and resident in Norway.
There were no changes to the composition of the board of directors in 2021. The corporate assembly re-elected all members in June
2021.
162 Equinor, Annual Report on Form 20-F 2021
The work of the board of directors
The board is responsible for managing the Equinor group and for monitoring day-to-day management and the group's business
activities. This means that the board is responsible for establishing control systems and for ensuring that Equinor operates in
compliance with laws and regulations, with our values as stated in the Equinor Book and the Code of Conduct, as well as in
accordance with the owners' expectations of good corporate governance. The board emphasises the safeguarding of the interests of
all shareholders, but also the interests of Equinor's other stakeholders.
The board handles matters of major importance, or of an extraordinary nature, and may require the management to present other
matters. An important task of the board is to appoint the chief executive officer (CEO) and stipulate their job instructions and terms
and conditions of employment.
The board has adopted a generic annual plan for its work which is revised with regular intervals. Recurring items on the board's
annual plan are: safety, security, sustainability and climate, corporate strategy, business plans, targets, quarterly and annual results,
annual reporting, ethics, management's monthly performance reporting, management compensation issues, CEO and top
management leadership assessment and succession planning, project status review, people and organisation strategy and priorities,
two yearly discussions of main risks and risk issues and an annual review of the board's governing documentation.
Climate-related upside and downside risks, and Equinor’s strategic response to these are discussed frequently by the board. In 2021,
the board discussed climate change and the energy transition in most of the ordinary board meetings either as integral parts of
strategy and investment discussions or as separate topics.
In February 2021, following-up on the net-zero ambition launched on 2 November 2020, the board participated in a second workshop
which included climate risk training, building on the workshop conducted in 2020. In March, as part of Equinor’s strategy for significant
growth within renewables, the board participated in the second of two offshore wind deep dives, building on the workshop they
conducted in December 2020. Finally, in June the board participated in a deep dive into Equinor’s low carbon solutions focusing on
the project portfolios, profitability and what it takes to deliver on the ambitions. At the beginning of each board meeting, the CEO
meets separately with the board to discuss key matters in the company. At the end of all board meetings, the board has a closed
session with only board members attending the discussions and evaluating the meeting. The CEO, the CFO, the head of Safety,
Security & Sustainability, the senior vice president for communication, the general counsel and the company secretary attend all
board meetings. Other members of the executive committee and senior management attend board meetings by invitation in
connection with specific matters.
An induction programme with key members of the management is arranged for new board members. They receive an introduction to
Equinor’s business and relevant information about the company and the board’s work.
The board conducts an annual self-evaluation of its own work and competence, with input from various sources, which generally is
externally facilitated. In the annual board evaluation for 2021, climate change capabilities and knowledge were included as key
components. The evaluation report is discussed in a board meeting and is made available to the nomination committee and also
discussed in a meeting between the chair of the board and the nomination committee as input to the committee’s work.
The entire board, or part of it, regularly visits several Equinor locations in Norway and globally, and a longer board trip for all board
members to an international location is made at least every two years. When visiting Equinor locations globally, the board emphasises
the importance of improving its insight into, and knowledge about, safety and security in Equinor’s operations, Equinor’s technical and
commercial activities as well as the company's local organisations. In 2021, the board’s visits were cancelled due to the Covid-19
situation and next board trip is planned for 2022. In 2021, the chair of the board visited the South Brooklyn Marine Terminal in the
context of the US offshore wind business.
Requirements for board members
Under our Code of Conduct, which is approved by the board, and which applies to both management, employees and board
members, individuals must behave impartially in all business dealings and not give other companies, organisations or individuals
improper advantages.
The work of the board is based on rules of procedure that describe the board's responsibilities, duties and administrative procedures.
They also describe the CEO’s duties vis-à-vis the board of directors.
Further, they state that members of the board and the CEO may not participate in any discussion or decision of issues which are of
special personal importance or special financial interest to them, or to any closely related party. Each board member and the CEO are
individually responsible for ensuring that they are not disqualified from discussing any particular matter. Members of the board are
obliged to disclose any interests they or their closely related parties may have in the outcome of a particular issue. The board must
approve any agreement between the company and a member of the board or the CEO. The board must also approve any agreement
Equinor, Annual Report on Form 20-F 2021 163
between the company and a third party in which a member of the board or the CEO may have a special interest. Each member of the
board shall also continuously assess whether there are circumstances which could undermine the general confidence in the director’s
independence. It is incumbent on each board member to be especially vigilant when making such assessments in connection with the
board's handling of transactions, investments and strategic decisions. The board member shall immediately notify the chair of the
board if such circumstances are present or arise and the chair of the board will determine how the matter will be dealt with. The
board’s rules of procedure will be adjusted in 2022 to reflect the updated recommendation in the Code of Practice chapter 9 relating to
how the board and management shall treat agreements with related parties, including whether an independent valuation should be
obtained. The board's rules of procedure are available on our website at
www.equinor.com/board
.
The board of directors’ committees
Equinor’s board has established three committees: the audit committee; the compensation and executive development committee;
and the safety, sustainability and ethics committee. The committees prepare items for consideration by the board and their authority is
limited to making such recommendations. The committees consist entirely of board members and answer to the board alone for the
performance of their duties. Minutes of the committee meetings are sent to the whole board, and the chair of each committee regularly
informs the board at board meetings about the committees’ work. The composition and work of the committees are further described
below.
Audit committee
The audit committee acts as a preparatory body for the board in connection with risk management, internal control and financial
reporting, and other tasks assigned to the committee.
In particular, the audit committee shall assist the board in exercising its oversight responsibilities in relation to:
●
The financial reporting process and the integrity of the financial statements.
●
The company’s internal control, internal audit and risk management systems and practices.
●
The election of and qualifications, independence and oversight of the work of the external auditor.
●
Business integrity, including handling of complaints and reports.
●
Other duties as set out in the Norwegian Public Limited Liability Companies Act § 6-43 and Regulation 10A-3 of the US Securities
Exchange Act and applicable listing requirements.
The audit committee reviews the effectiveness of the system for monitoring compliance with laws and regulations pertaining to
business integrity and compliance with Equinor’s Code of Conduct relevant to the committee’s responsibilities.
Under Norwegian law, the external auditor is appointed by the shareholders at the annual general meeting based on a proposal from
the corporate assembly. The audit committee is responsible for making recommendations regarding appointment, re-appointment or
removal of the company’s external auditor, and supports the board and the corporate assembly in their roles related to the election of
external auditors for Equinor ASA at the annual general meeting.
The audit committee meets as often as it deems necessary, normally five to seven times every year, and holds meetings with the
internal auditor and the external auditor on a regular basis without the company’s management being present, including in relation to
the financial statement and annual report.
The audit committee is also responsible for:
●
Reviewing the scope of the audit and the nature of any non-audit services provided by external auditors.
●
Ensuring that the company has procedures in place for receiving and dealing with complaints received by the company regarding
accounting, internal control or auditing matters.
●
Procedures for the confidential and anonymous submission by company employees, via the group's ethics helpline, of concerns
regarding accounting or auditing matters, as well as other matters regarded as being in breach of the group's Code of Conduct, a
material violation of an applicable US federal or state securities law, a material breach of fiduciary duties or a similar material
violation of any other US or Norwegian statutory provision.
The audit committee is designated as the company's qualified legal compliance committee for the purposes of Part 205 in Title 17 of
the US Code of Federal Regulations.
In the execution of its tasks, the audit committee may examine all activities and circumstances relating to the operations of the
company. In this regard, the audit committee may request the CEO or any other employee to grant it access to information, facilities
and personnel and such assistance as needed. The audit committee is authorised to carry out or instigate such investigations as it
deems necessary in order to execute its tasks, and it may use the company's internal audit and investigation unit, the external auditor
or other external advice and assistance. The costs of such work will be covered by the company.
The audit committee is only responsible to the board for the execution of its tasks. The work of the audit committee in no way alters
the responsibility of the board and its individual members, and the board retains full responsibility for the audit committee's tasks.
164 Equinor, Annual Report on Form 20-F 2021
Corporate Audit reports administratively to the president and CEO and functionally to the chair of the audit committee.
The board elects at least three of its members to serve on the audit committee and appoints one of them to act as chair. The
employee-elected members of the board may nominate one member to the audit committee.
At year-end 2021, the audit committee members were Jeroen van der Veer (chair), Rebekka Glasser Herlofsen, Anne Drinkwater,
Finn Bjørn Ruyter and Hilde Møllerstad (employee-elected board member).
The board of directors has determined that a member of the audit committee, Jeroen van der Veer, qualifies as an "audit committee
financial expert", as defined in the SEC rules. The board of directors has also determined that the committee has the qualifications
needed as defined in the Norwegian Public Limited Liability Companies Act. In addition, the board of directors has concluded that
Jeroen van der Veer, Rebekka Glasser Herlofsen, Anne Drinkwater and Finn Bjørn Ruyter are independent within the meaning of the
requirements in the Norwegian Public Limited Liability Companies Act and Rule 10A-3 under the Securities Exchange Act.
The CFO, general counsel, senior vice president for Accounting and Financial Compliance and senior vice president for Corporate
Audit participate in the audit committee meetings, as well as representatives from the external auditor.
The audit committee held six regular meetings and two extraordinary meetings in 2021, in addition to two deep dive sessions into
issues relevant to the committee, and attendance was 100%.
For a more detailed description of the objective and duties of the committee, see the instructions available at
www.equinor.com/auditcommittee
.
Compensation and executive development committee
The compensation and executive development committee acts as a preparatory body for the board and assists in matters relating to
management compensation and leadership development. The main responsibilities of the compensation and executive development
committee are:
●
remuneration strategies and concepts, the CEO's contract and terms of employment, and leadership development, assessments
and succession planning.
●
executives and in drawing up appropriate remuneration policies for senior executives.
●
The committee assists the board on the philosophy, principles and strategy for the compensation of senior executives in Equinor, as
well as climate and energy transition related goals as part of the remuneration policies.
The committee consists of up to six board members. At year-end 2021, the committee members were Jon Erik Reinhardsen (chair),
Bjørn Tore Godal, Jonathan Lewis, Finn Bjørn Ruyter, Tove Andersen and Per Martin Labråten (employee-elected board member). All
the committee members are non-executive directors and the shareholder-elected committee members are deemed independent
(under Equinor’s framework).
The executive vice president People & Organisation participates in the compensation and executive development committee
meetings.
The committee held six meetings in 2021 and attendance was 96,97%.
For a more detailed description of the objective and duties of the committee, see the instructions available at
www.equinor.com/compensationcommittee
.
Safety, sustainability and ethics committee
The safety, sustainability and ethics committee assists the board in reviewing the practices and performance of the company primarily
in matters regarding safety, security, ethics, sustainability and climate. This includes quarterly reviews of the company’s risk related to
matters covered by the committee, practices and performance, including climate-related risks and performance, and an annual review
of the sustainability report and the procedures for reporting on these matters.
In its business activities, Equinor is committed to comply with applicable laws and regulations and to act in an ethical, environmental,
safe and socially responsible manner. The committee supports our commitment in this regard.
Equinor, Annual Report on Form 20-F 2021 165
Establishing and maintaining this committee is intended to ensure that the board has a strong focus on and knowledge of these
complex, important and constantly evolving areas of safety, security, ethics, sustainability and climate.
At year-end 2021, the safety, sustainability and ethics committee members were Anne Drinkwater (chair), Jeroen van der Veer, Bjørn
Tore Godal, Jonathan Lewis, Stig Lægreid (employee-elected board member) and Per Martin Labråten (employee-elected board
member).
The executive vice president Safety, Security & Sustainability, senior vice president Safety, general counsel, senior vice president
Corporate Sustainability, senior vice president Corporate Audit and the chief ethics and compliance officer participate in the safety,
sustainability and ethics committee meetings.
The committee held five meetings in 2021 and attendance was 100%.
For a more detailed description of the objective and duties of the committee, see the instructions available at
www.equinor.com/ssecommittee
.
3.6 Management
The President and CEO (CEO) has the overall responsibility for day-to-day operations in Equinor and appoints the corporate
executive committee (CEC). The CEO is responsible for developing Equinor's business strategy and presenting it to the board of
directors for its decision; for the execution of the business strategy and for cultivating a performance-driven, values-based culture.
Members of the CEC have a collective duty to safeguard and promote Equinor's corporate interests and to provide the CEO with the
best possible basis for deciding the company's direction, making decisions and executing and following up business activities. In
addition, each of the CEC members is head of a separate business area or corporate function.
Changes in corporate structure and management team
Equinor is developing as a broad energy company. Hence, changes have been made in the corporate structure and management
team to support improved value creation from our oil and gas portfolio, accelerated profitable growth within renewables and the
development of low carbon solutions.
With effect from 1 June 2021 the business areas are:
●
●
●
●
●
●
And corporate functions:
●
●
●
●
●
The following changes to the Corporate Executive Committee have been announced 1 March 2022:
●
Aksel Stenerud has been appointed Executive Vice President for the People and Organisation function with effect from 1 March.
●
Jannik Lindbæk has been appointed Executive Vice President for Communication and is a formal member of the Corporate
Executive Committee from 1 March 2022.
●
Geir Tungesvik has been appointed Executive Vice President for the Projects, Drilling and Procurement business area with effect
from 1 May 2022.
For further information on changes to the Corporate Executive Committee announced 1 March 2022, see our website at
Changes in
Equinor’s Corporate Executive Committee
.
166 Equinor, Annual Report on Form 20-F 2021

Equinor, Annual Report on Form 20-F 2021 167
Members of Equinor's corporate executive committee as of 31 December 2021:
Anders Opedal
Born:
Position:
External offices:
Numbers of shares in Equinor ASA as of 31 December 2021:
Loans from Equinor:
Experience;
and Drilling. From August to October 2018, he was Executive Vice President for Development, Production Brazil and prior to this
Senior Vice President for Development, Production International Brazil. He also held the position as Equinor’s Chief Operating Officer.
In 2011 he took on the role as Senior Vice President in Technology, Projects and Drilling; where he was responsible for Equinor’s
NOK 300 billion project portfolio. From 2007 - 2010 he served as Chief Procurement Officer. He has held a range of technical,
operational and leadership positions in the company and started as a petroleum engineer in the Statfjord operations. Prior to Equinor
Opedal worked for Schlumberger and Baker Hughes.
Education:
Technology (NTH) in Trondheim.
Family relations:
assembly.
Other matters:
Ulrica Fearn
Born:
Position:
External offices:
Number of shares in Equinor ASA as of 31 December 2021:
Loans from Equinor:
Experience:
which she held since 2017. Prior to BT, Fearn held various leadership positions in Diageo Plc from 1998 - 2017.
Education:
Family relations:
assembly.
Other matters:


168 Equinor, Annual Report on Form 20-F 2021
Jannicke Nilsson
Born:
Position:
External offices
: Member of the board of Odfjell SE and Jotun A/S
Number of shares in Equinor ASA as of 31 December 2021:
Loans from Equinor:
Experience:
1 December 2016. As COO, she established the Digital Centre of Excellence in 2017 to drive Equinor digital transformation to deliver
tangible performance within its always safe, high value and low carbon values. In August 2013 she was appointed Programme Leader
for the Equinor Technical Efficiency Programme (STEP). She has held a number of central management positions within Upstream
Operations Norway, including Senior Vice President for Technical Excellence in Technology, Projects & Drilling, Senior Vice President
for Operations North Sea, Vice President for Modifications and Project Portfolio Bergen and Platform Manager at Oseberg South.
Education:
Stavanger.
Family relations
: No family relations to other members of the corporate executive committee, members of the board or the corporate
assembly.
Other matters:
Nilsson is a Norwegian citizen and resident in Norway.
Kjetil Hove
Born:
Position:
External offices:
Number of shares in Equinor ASA as of 31 December 2021:
Loans from Equinor:
Experience:
of Senior Vice President Field Life Extension, which he held since January 2020. Prior to this, Hove was Senior Vice President for
Operations Technology in Development & Production Norway. From 2000 - 2012 he worked internationally, including as Country
Manager for Equinor in Brazil for 3.5 years. Hove started his career in 1991 in Norsk Hydro within petroleum technology holding
various positions within exploration, field development and operations in Norway.
Education:
Family relations:
assembly.
Other matters:


Equinor, Annual Report on Form 20-F 2021 169
Al Cook
Born:
Position:
External offices:
Number of shares in Equinor ASA as of 31 December 2021:
Loans from Equinor:
Experience:
Development (GSB), which he had since May 2018. He started as SVP in Development & Production International (DPI) overseeing
operations in Angola, Argentina, Azerbaijan, Libya, Nigeria, Russia and Venezuela. He joined from bp, where he was Chief of Staff to
the CEO. From 2009 - 2014 Cook led the development of the Southern Gas Corridor from Azerbaijan to Europe. From 2005 - 2009 he
led exploration and project developments in Vietnam and acted as President for bp Vietnam. He worked in field operations in the
North Sea from 2002 - 2005, becoming Offshore Installation Manager on the Cleeton platform. Cook joined BP in 1996, initially
working in commercial, project and exploration roles.
Education:
INSEAD.
Family relations:
assembly.
Other matters:
Arne Sigve Nylund
Born:
Position:
External offices:
Number of shares in Equinor ASA as of 31 December 2021:
Loans from Equinor:
Experience:
Nylund joined Equinor in 1987. He comes from the position of Executive Vice President, Development & Production
Norway (DPN) which he has had since 1 January 2014. He has held several central management positions in Equinor. Before he
started in Equinor Nylund was employed with Mobil Exploration Inc.
Education:
Rogaland Regional College/University of Stavanger (UiS). Business graduate of the Norwegian School of Business and Management
(NHH).
Family relations:
assembly.
Other matters
: Nylund is a Norwegian citizen and resident in Norway.

170 Equinor, Annual Report on Form 20-F 2021
Irene Rummelhoff
Born:
Position:
External offices:
Number of shares in Equinor ASA as of 31 December 2021:
Loans from Equinor:
Experience:
development, exploration, and the downstream business in Equinor. Her most recent position, which she held from June 2015, was as
Executive Vice President New Energy Solutions (NES).
Education:
Family relations:
assembly.
Other matters:
Pål Eitrheim
Born:
Position:
External offices:
Number of shares in Equinor ASA as of 31 December 2021:
Loans from Equinor:
Experience:
Eitrheim joined Equinor in 1998. He has held a range of leadership positions in Equinor in Azerbaijan, Washington DC,
the CEO office, corporate strategy and Brazil. In 2017-2018 he was Chief Procurement Officer. Between 2014 - 2017 he led Equinor’s
upstream business in Brazil. In 2013 Eitrheim led the Secretariat for the investigation into the terrorist attack on the In Amenas gas
processing facility in Algeria.
Education:
Family relations:
Other matters:

Equinor, Annual Report on Form 20-F 2021 171
Carri Lockhart
Born:
Position:
External offices:
Number of shares in Equinor ASA as of 31 December 2021:
Loans from Equinor ASA:
Experience:
Development & Production International, which she has held since August 2018. Prior to this, she was Senior Vice President for
Equinor’s U.S. Offshore business. She started her career with Marathon Oil as a reservoir engineer in Anchorage, Alaska. Lockhart
has held a variety of leadership roles across the upstream organisation with experience in offshore, onshore conventional and
unconventional assets, field supervision, facilities construction and operations, international country management, strategic planning
and business development.
Education:
Family relations:
assembly.
Other matters:
Siv Helen Rygh Torstensen
Born:
Position:
External offices:
Number of shares in Equinor ASA as of 31 December 2021:
Loans from Equinor ASA:
Experience:
Rygh Torstensen joined Equinor in 1998. She comes from the position of Senior Vice President and General Counsel,
which she held since 1 August 2019. Prior to that she held the position as Head of CEO office from July 2016. From 2011 - 2016 she
was Vice President Corporate in LEG. From 1998 - 2011 Rygh Torstensen held various positions within LEG, including as Corporate
Compliance Office and Acting General Counsel. Before joining Equinor she worked with the law firm Cappelen & Krefting DA and as a
lawyer for Stavanger municipal council.
Education:
Family relations:
assembly.
Other matters:

172 Equinor, Annual Report on Form 20-F 2021
Ana Fonseca Nordang
Born:
Position:
External offices:
Number of shares in Equinor ASA as of 31 December 2021:
Loans from Equinor ASA:
Experience:
Fonseca Nordang joined Equinor in 2009 and has held various leadership roles across the company. Her most recent
position, which she held from1 September 2019, was Senior Vice President in People and Leadership (PL). From July 2017, she was
Vice President in PL responsible for Executive and Leadership Development and Diversity & Inclusion. She served as Vice President,
People and Organisation in Equinor’s US operations from 2015 - 2017. From 2009 she had the role as Principle Consultant for
Organisational Change and Capabilities. She has previously worked with Roxar (Emerson) where she was responsible for marketing
for the software division. Prior to Roxar, she worked for CEB (Gartner), which she joined in 2001 in Washington, D.C. She led the
launch of a successful new advisory practice serving mid-sized organisations. She then worked as Director of Middle Market Europe
until joining Roxar in 2008.
Education:
the University of Kent in the UK.
Family relations:
assembly.
Other matters:
As part of its general loan arrangement for Equinor employees, Equinor has granted loans to Equinor-employed spouses of certain
members of the corporate executive committee. Permanent employees in certain specified employee categories may take out a car
loan from Equinor in accordance with standardised provisions set by the company.
The standard maximum car loan is limited to the
cost of the car, including registration fees, but not exceeding NOK 300,000. Employees outside the collective labour area are entitled
to a car loan up to NOK 575,000 (vice presidents and senior vice presidents) or NOK 475,000 (other positions). The car loan is
interest-free, but the tax value, "interest advantage", must be reported as salary. Permanent employees of Equinor ASA may also
apply for a consumer loan up to NOK 350,000. The interest rate on consumer loans corresponds to the standard rate in effect at any
time for “reasonable loans” from employer as decided by the Norwegian Ministry of Finance, i.e. the lowest rate an employer may offer
without triggering taxation of the benefit for the employee.
Equinor, Annual Report on Form 20-F 2021 173
3.7 Compensation to governing bodies
Remuneration to the board of directors
Approach to setting fees
Basis of fees
Other items
The remuneration to the board
and its committees is decided
by the corporate assembly,
based on a recommendation
from the nomination
committee.
The board members have an annual,
fixed remuneration, except for deputy
members (only elected for employee-
elected board members) who receive
remuneration per meeting attended.
Separate rates are set for the board's
chair, deputy chair and other members.
Separate rates are also adopted for the
board's committees, with similar
differentiation between the chair and the
other members of each committee.
The employee-elected members of the
board receive the same remuneration as
the shareholder-elected members. The
board receives its remuneration by cash
payment.
The board members from outside Scandinavia and
outside Europe, respectively, receive separate
travel allowances for each meeting attended.
Remuneration for board membership is not linked to
performance and no share or option programmes or
similar structures are in place.
Employee-elected board members may participate
in variable pay, pension and benefit programs
according to their location and grade in line with
other employees.
None of the shareholder-elected board members
have a pension scheme or agreement concerning
pay after termination of their office with the
company.
If shareholder-elected members of the board and/or
companies they are associated with should take on
specific assignments for Equinor in addition to their
board membership, this will be disclosed to the full
board.
In 2021, the total remuneration to the board, including fees for the board's three committees, was USD 833,146 (NOK 7,159,534).
174 Equinor, Annual Report on Form 20-F 2021
Detailed information about the individual remuneration to the members of the board of directors in 2021 and their share ownership is
provided in the table below.
Total remuneration
Share
ownership
Members of the board (figures in USD thousand except number
of shares)
2017
2018
2019
2020
2021
2021
Jon Erik Reinhardsen (chair of the board)
37
117
110
108
119
4,584
Jeroen van der Veer (deputy chair of the board)
88
95
101
96
98
6,000
Bjørn Tore Godal
67
70
67
64
70
-
Rebekka Glasser Herlofsen
63
66
62
59
66
220
Anne Drinkwater
-
48
100
88
82
1,100
Jonathan Lewis
-
44
93
76
70
-
Finn Bjørn Ruyter
-
-
37
69
77
620
Tove Andersen
-
-
-
27
59
4,700
Per Martin Labråten
1)
33
59
56
54
66
2,642
Stig Lægreid
1)
57
59
56
54
59
125
Hilde Møllerstad
1)
-
-
32
59
66
5,234
Employee elected deputy members of the board
Hans Einar Haldorsen
-
-
-
-
-
890
Bjørn Palerud
-
-
-
-
-
4,680
Anita Skaga Myking
-
-
-
-
-
4,199
Total remuneration
345
558
714
754
832
34,994
1) Employee-elected members of the board
Equinor, Annual Report on Form 20-F 2021 175
Remuneration to the corporate assembly
Approach to setting fees
Basis of fees
The remuneration to the corporate assembly is decided by the
general meeting, based on a recommendation from the
nomination committee
The members have an annual, fixed remuneration, except for
deputy members who receive remuneration per meeting
attended.
Separate rates are set for the corporate assembly’s chair,
deputy chair and other members. The employee-elected
members of the corporate assembly receive the same
remuneration as the shareholder-elected members.
In 2021, the total remuneration to the corporate assembly was USD 136,952 (NOK 1,176,880).
Total remuneration
Corporate assembly employee elected members (figures in USD thousand)
2020
2021
Berit Søgnen Sandven
6
6
Frode Mikkelsen
6
6
Lars Olav Grøvik
6
6
Oddvar Karlsen
6
6
Peter Bernhard Sabel
6
6
Terje S. Enes
6
6
Employee elected deputy members who received member fees
Terje Herland
-
1
Dag-Rune Dale
-
1
Total remuneration
33
36
Remuneration to the corporate executive committee
In 2021, the aggregate remuneration to the corporate executive committee was USD 11,936,197. The board of directors’ complete
remuneration policy and report for executive personnel follows.
Equinor’s performance framework and the link to business strategy, long-term interests and sustainability of the company
Our performance framework translates the company vision, values and strategy into actions and results for the company, its units,
teams and every leader and employee.
Performance is evaluated in two dimensions; “What” we deliver and “How” we deliver. This is the core of our values-based
performance culture and means that delivery (“what”) and behaviour (“how”) are equally weighted when recognising and rewarding
individual performance.
“What” we deliver (business delivery) is defined through the company’s performance framework “Ambition to Action”, which addresses
strategic objectives, key performance Indicators (KPIs) and actions across the five perspectives; Safety, Security and Sustainability,
People and Organisation, Operations, Market and Finance. Generally, Equinor believes in setting ambitious targets to inspire and
drive strong performance. Each year individual performance goals (“what”) based on the company’s “Ambition to Action” are
established for the CEO and the executive vice presidents.
The board decides annually a set of strategic objectives and KPIs that will form basis for the assessment of the business delivery
dimension (“What”). These KPIs and related targets for the upcoming performance year shall be disclosed in the annual remuneration
report. Examples of such KPIs are Serious Incident Frequency (SIF), CO
2
(LCOE), Production efficiency (PE), Production based availability (PBA), Relative Total Shareholder Return (TSR), Relative ROACE,
Improvement impact etc.
176 Equinor, Annual Report on Form 20-F 2021
Goals on “How” we deliver are based on Equinor’s core values and leadership principles and address the behaviour required and
expected to achieve the delivery goals. We believe in developing a strong leadership and culture recognised by our values, driving the
long-term and sustainable success of the company. The CEO and the executive vice presidents have individual behaviour goals
within prioritised behaviour themes such as safety and compliance, empowerment, diversity and inclusion, collaboration and
sustainability and climate.
Performance evaluation is holistic, involving both measurement and assessment. Significant changes in assumptions are taken into
account, as well as target ambition levels, sustainability of delivered results and strategic contribution.
The balanced approach, which involves a broad set of goals defined in relation to both “What” and “How” dimensions and an overall
performance evaluation, significantly reduces the likelihood that remuneration policies may incentivise excessive risk-taking or have
other material adverse effects.
Equinor, Annual Report on Form 20-F 2021 177
Main elements - Equinor executive remuneration
Remuneration
element
Award level
Base salary
Attract and retain the right
individuals by providing
competitive but not market-
leading terms.
We offer base salary levels which are aligned with and
differentiated according to the individual's responsibility,
performance and contribution to company’s goals. The
level is competitive in the markets in which we operate.
The base salary is normally subject to
annual review based on an evaluation
of the individual’s performance and
contribution to the company’s goals.
Fixed
salary
addition
The fixed salary addition is
paid in lieu of pension
accrual above 12G, applied
as a supplementing fixed
remuneration element to be
competitive in the market.
Members of the corporate executive committee employed
by Equinor ASA prior to 1 September 2017, that have
taken up their first position in the CEC after 13 February
2015, receive a fixed salary addition in lieu of pension
accrual above 12G
19
pension and insurance scheme.
No performance criteria are linked to
the fixed salary addition. The fixed
salary addition is not pensionable and
does not form basis for variable pay.
Annual
variable
pay (AVP)
Encourage our pay for
performance culture and
individual’s contribution to
the company’s business
strategy. Rewarding
individuals for annual
achievement of business
objectives, both the “What”
and the “How”.
Members of the corporate executive committee employed
by Equinor ASA are from performance year 2022 entitled
to annual variable pay ranging from 0 – 45% of their base
salary. Target
20
employed outside the Norwegian market, see section
below on remuneration policy for international executives.
The threshold principles and the company performance
modifier are applied (see explanations below).
The company reserves the right to recover all or part of the
annual bonus, if performance data is subsequently proven
to be misstated.
Performance is measured over one
financial year and is based on the
achievement of annual performance
goals (“How” and “What” to deliver), in
order to create long-term and
sustainable shareholder value.
Assessment of goals defined in the
individual’s performance contract
including objectives related to
selected KPI’s on the balanced
scorecard constitute the basis for
annual variable pay.
Long-term
incentive
(LTI)
Strengthen the alignment of
top management and
shareholders’ long-term
interests and sustainability of
the company. Retention of
key executives.
For members of the corporate executive committee
employed by Equinor ASA, the LTI is calculated as a
portion of the participant’s base salary. On behalf of the
participant, the company acquires shares equivalent to the
net annual grant amount. The shares are subject to a
three-year lock-in period and then released for the
participant’s disposal. If the lock-in obligations are not
fulfilled, the executive has to pay back the gross value of
the locked-in shares limited to the gross value of the grant
amount.
The level of the annual LTI reward for the CEC members
employed by Equinor ASA is in the range of 25-30% of the
base salary. For members of the CEC employed outside
the Norwegian market, see section below on remuneration
policy for international executives.
The threshold principles are applied to the annual grant.
The company performance modifier is not applied to the
LTI in Equinor ASA.
In Equinor ASA, LTI participation and
grant level are reflective of the level
and impact of the position and
company performance as reflected by
the threshold.
Pension &
insurance
schemes
Provide competitive
postemployment and other
benefits.
The company offers a general occupational pension plan
and insurance scheme aligned with local markets.
Reference is made to the section on pension and
insurance scheme.
N/A
Employee
share
savings
programme
(SSP)
Align and strengthen
employee and shareholders’
interests and remunerate for
long term commitment and
value creation.
Eligibility extends to all employees at Equinor and in all
markets, subject to local legislation. Participants can
purchase shares up to 5% of base salary.
With effect from 2022 share savings,
bonus shares from
the share saving programme will be
awarded to the CEO and EVPs after
a lock in period of 3 calendar years
after the year of saving.
Other
taxable and
non-taxable
benefits
Attract and retain the right
individuals by providing
competitive but not market-
leading terms.
The members of the corporate executive committee have
benefits in-kind such as company car and health checks.
They are also eligible for participation in the share saving
scheme as described above, and they take part in the
general benefit and welfare program of the company.
N/A
19
20
178 Equinor, Annual Report on Form 20-F 2021
Remuneration policy for international executives
Equinor is a broad global energy company, developing oil, gas, wind and solar energy in around 30 countries. The company has high
goals related to diversity and inclusion, and diversity at all levels including among top management is crucial in ensuring the long-term
sustainable success of the company. From time to time the company will appoint executives employed in international markets with
different framework for executive base pay, variable pay and benefits, than what is the case in the Norwegian market. To be able to
hire international executives, the company needs to offer competitive compensation in the markets where it operates. The policy of
being competitive but not market leading still remains.
In order to ensure Equinor’s competitive position and attract talent in the international market, the board of directors has the mandate
to exceed the levels for variable pay and pension terms described in the table above, for remuneration of executive vice presidents
hired in the international market and the remuneration level will reflect the at any time prevailing and documented market level for the
EVP position. The annual variable pay shall not exceed 50% of base salary at target (100% maximum) and the long-term incentive
(LTI) annual grant shall be maximum 70% of base salary. The threshold for variable pay and the company performance modifier as
described below will apply. For the international LTI a three years’ average company performance modifier will be applied. Pension
contribution will be in accordance with the local market, and the 12G cap on pension used in the Norwegian tax favored regime is not
applicable for the international executives. Any decision on terms and conditions as described above will be included in the
remuneration report subject to review and endorsement by the annual general meeting.
Duration of contracts with executive vice presidents
Duration of contracts with the executive vice presidents are not limited to a certain period and are valid until the executive resigns from
the position or enters into a new position in the company.
Mobility
To support the company’s need for a mobile workforce also at the senior executive level, the company’s standard international
assignment framework can be used for candidates employed in a different country than the location of the CEC role. International
assignment for a CEC position will normally be limited to a three-year period.
Localisation and relocation
If an executive is recruited to Equinor and employed on local terms and conditions different from the executive’s country and market,
the company may decide to cover reasonable relocation costs including housing and schooling within the international assignment
framework for these elements for a period up to two years.
Threshold for variable pay and company performance modifier
The threshold and company performance modifier are implemented to strengthen the link between the company’s overall financial
results and the individual variable pay.
Threshold
The threshold is implemented for affordability reasons to ensure that no or reduced variable pay would be granted if the company’s
financial performance and position is weak and in a critical situation. The financial threshold is applicable for payment of annual
variable pay and award of LTI grant.
The threshold has the following guiding parameters;
1) Cash flows provided by operating activities after tax and before working capital items
2) Net debt ratio and development
3) Company’s overall operational and financial performance.
“Green zone”
Cash flows provided by operating activities after tax and before working capital items higher than USD 12 billion and a net debt ratio
below 30% will normally guide for no reduction of bonus.
“Yellow zone”
billion and a net debt ratio between 30% and 45% will normally guide a reduction of bonus but not annulment.
“Red zone”
above 45% will normally guide no bonus.
Application of the threshold is subject to a discretionary assessment of the company’s overall performance by the board of directors.
These measures and targets are indicative and will form part of a broader assessment of bonus award. The conclusion considers both
achieved results and how these results are expected to impact the company’s medium and long-term development and value
creation.
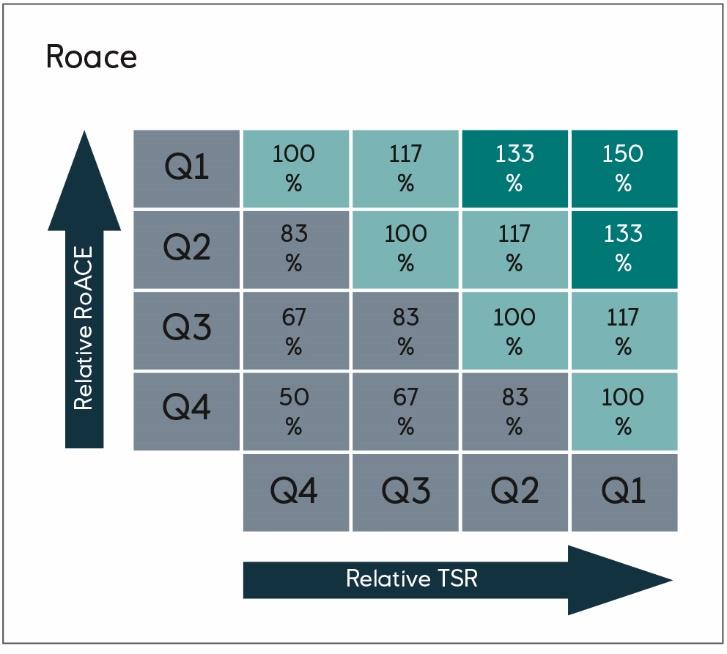
Equinor, Annual Report on Form 20-F 2021 179
Company performance modifier
Based on approval by the annual general meeting in 2016, a company performance modifier was introduced and has been applied in
the calculation of variable pay.
The company performance will be assessed against two equally weighted measures: relative total shareholder return (TSR) and
relative return on average capital employed (ROACE). TSR and ROACE are currently also applied as performance indicators in the
corporate performance management system.
The results of these two performance measures are compared to our peers and determine Equinor’s relative position. A position of
Quartile 1 means that Equinor is amongst the top scoring quartile of peer companies. A position of Quartile 4 means that Equinor is in
the bottom performing quartile. In years with strong deliveries on relative TSR and ROACE, the matrix will result in the variable pay
being modified with a factor higher than one and, correspondingly, lower than one in weak years. The combination of ratings for both
measures, will act as a ‘multiplier’ according to the guideline in the matrix displayed below.
By applying relative numbers, the effect of fluctuating oil price will be reduced.
Within the framework of 50 - 150%, the matrix is a guideline and the multiplier (percentages) may be adjusted if oil or gas price effects
or other occurrences outside the control of the company are deemed to cause disproportionate results in a given year. Application of
the modifier is subject to discretionary assessment based on the company’s overall performance.
The company performance modifier will be used in calculations of annual variable pay for members of the corporate executive
committee. The modifier will also be applied in other variable pay schemes below the corporate executive level. Further application of
the company performance modifier will also be assessed and decided if deemed appropriate.
The annual variable pay for members of the corporate executive committee employed by Equinor ASA will be within a framework of
45% of base salary, irrespective of the result of the modifier.
Pension and insurance schemes
Members of the corporate executive committee in Equinor ASA are covered by the company’s general occupational pension scheme
which is a defined contribution scheme with a contribution level of 7% below 7,1 G and 22% above 7,1 G. A defined benefit scheme is
retained by a grandfathered group of employees. For new members of the corporate executive committee appointed after 13
February
2015, a cap on pension contribution at 12 G is applied. In lieu of pension accrual above 12 G a fixed salary addition of 18% is
provided. This element does not form basis of calculation of AVP and LTI. The 12 G cap is based on the Norwegian tax favoured
occupational pension schemes and will not be applied to the pension schemes of executives employed outside Norway.
Members of the corporate executive committee employed in Equinor ASA and appointed before 13 February 2015, maintain their
pension contribution above 12 G based on obligations in previously established agreements.
Pension terms that historically have been individually agreed with elements outside the framework above will be described in the
annual remuneration report.
Equinor ASA has implemented a general cap on pensionable income at 12 G for all new hires into the company employed as of 1
September 2017.
180 Equinor, Annual Report on Form 20-F 2021
In addition to the pension benefits outlined above, the executive vice presidents in the parent company are offered disability and
dependents’ benefits in accordance with Equinor’s general pension plan/defined benefit plan. Members of the corporate executive
committee are covered by the general insurance schemes applicable within Equinor.
Severance pay arrangements
The chief executive officer and the executive vice presidents are entitled to a severance payment equivalent to six months’ salary,
commencing after the six months’ notice period, when the resignation is requested by the company. The same amount of severance
payment is also payable if the parties agree that the employment should be discontinued, and the individual gives notice pursuant to a
written agreement with the company. Any other payment earned by the individual during the period of severance payment will be fully
deducted. This relates to earnings from any employment or business activity where the individual has active ownership.
The entitlement to severance payment is conditional on the chief executive officer or the executive vice president not being guilty of
gross misconduct, gross negligence, disloyalty or other material breach of his/her duties.
The chief executive officer’s/executive vice president’s own notice will not instigate any severance payment.
Release of earned LTI grants and bonus shares at end of employment
If termination of employment is based on a mutual agreement between the executive and Equinor, the company may decide to
release locked in LTI shares and award already earned bonus shares in the share savings scheme at the end of employment.
Salary and employment conditions of other employees
Salary and employment conditions of employees of the company have been taken into account when establishing the remuneration
policy. The remuneration and employment framework for the members of the executive committee are based on the same main
principles as applicable for the remuneration frameworks for senior leaders in the company in general.
Recruitment policy
From time to time, Equinor may recruit executives from outside of the organisation. Our principles are designed to attract and retain
the right individuals to ensure the successful implementation of our strategy and to safeguard our long-term interests.
If an individual forfeits remuneration as a result of recruitment to Equinor, the company can compensate partly or fully for the
documented financial loss of unvested short and long-term incentive opportunity held by preferred external candidates. Such decision
will take into consideration the vehicle, expected value and timing of forfeited awards. Any buy-out will be limited to one year’s base
salary and normally paid over a period of 24 months.
Equinor, Annual Report on Form 20-F 2021 181
Remuneration report
Execution of the remuneration policy and principles in 2021
The board of directors proposes the following remuneration report for Equinor’ corporate executive committee, where an advisory vote
shall be held by the 2022 annual general meeting, pursuant to the Norwegian Public Limited Liability Companies Act, section 6-16b
and regulation 2020-12-11-2730 and the Norwegian Accounting Act section 7-31b.
Performance assessment for 2021
In 2021, the main business objectives and KPIs for each perspective were as outlined below. Each perspective was in addition
supported by comprehensive plans and actions.
Strategic objectives
2021 assessment
Safety, security
and
sustainability
These strategic
objectives and actions
address safety, security
and sustainability
The Serious Incident Frequency ratio (SIF) had a positive development and ended
at all time low and on target of 0.4. However, the positive development seen in
previous years related to both Total Recordable Injury Frequency (TRIF) and the
number of oil and gas leakages showed a negative trend and ended higher in 2021
than in 2020. The number of oil and gas leakages was 12 in 2021 compared to 11 in
2020. The number of red incidents is however lower than in 2020. The 2021 CO2
intensity for the upstream portfolio ended at 7 kg/boe. The low result comparted to
the 8 kg /boe in 2020 was impacted by high gas production and high production
share and regularity from low intensity fields. There is strong focus across the
organisation on continuous improvement of the safety, security and sustainability
results.
People and
organisation
These strategic
objectives and actions
address a value based
and high performing
organisation
In 2021. employees spent more time on learning than the previous year. However,
the result on the Global People Survey people development index has suffered a
decline to 68, indicating lower satisfaction with development opportunities then in
2020, when the index was at 71. The inclusion index for 2021 was 77 slightly
negative compared to the all-time high 2020 result of 78. The trend on the diversity
index is positive, increasing from 37 in 2020 to 42 in 2021.
Operations
These strategic
objectives and actions
address reliable and cost-
efficient operations, and
industry transformation
The production efficiency (PE) in 2021 had a positive development compared to the
2020 result and ended at 92.3%. 7 assets had a PE of more than 94%. Peregrino
and Snøhvit is excluded from the calculation since these assets have been out of
operation the whole year. The 12-month rolling average delivery on the Production
Based Availability (PBA) indicator for 2021 ended on 96.5% which is at the same
level as for 2020. The result is slightly below the 2021 target of 97%.
Market
These strategic
objectives and actions
address a flexible and
resilient energy portfolio
The organic capex guiding for 2021 was around USD 8 billion and the year-end
result is USD 7.9 billion. During 2021 continuous focus on capital discipline and
improvements have continued. This has given a strong portfolio demonstrating
robustness towards the lower prices. The proved reserves replacement ratio (RRR)
for 2021 is 1.1, mainly due to large positive revision caused by higher prices and the
inclusion of Bacalhau. The improvement in Levelised Cost of Energy (LCOE) ended
at 4% year on year which is 2%-points better than the target. The value on the
renewable portfolio indicator has also developed positively mainly due to gain on
sales of US projects (Empire and Beacon Wind) and Dogger Bank A/B. Value
creation from exploration ended at 1.1 – above target of 0.2. The good result is
driven by promising discoveries on Norwegian Continental Shelf as well as positive
revisions in international asset.
Finance
These strategic
objectives and actions
address cash generation,
profitability and
competitiveness
Equinor ended as number two in the peer group on relative shareholder return
(TSR) for 2021. This is a first quartile result better than the target to be above the
average among the peer group. On relative ROACE, Equinor was also ranked as
number two in the peer group, a position of first quartile, above the target of being
better than average in the peer group The fixed opex and SG&A indicator for 2021
ended at the same level as the baseline, which is below target of a 5% reduction.
Continuous strong focus on the cost development will be important for 2022.The
improvement impact potential towards 2025 has developed positively during 2021
182 Equinor, Annual Report on Form 20-F 2021
mainly driven by the value created by exporting the gas produced at Gina Krogh
instead of injection. The realised improvements for 2021 is around USD 1,8 billion.
Board of director’s assessment of the chief executive officer’s performance
The business delivery dimension (“What”) for the CEO’s variable remuneration (performance year 2021) was based on an
assessment against on the following KPIs: SIF, CO
2
and SG&A.
In its assessment of the chief executive officer’s performance for 2021, the board of directors has highlighted that the deliveries in key
areas have been above, at and below targets. The year has been impacted by the pandemic, but the markets have also shown strong
recovery, with high volatility. The ability to capture higher prices have been one area of focus in the board’s evaluation of the CEO.
Within safety, the Total Serious Incident Frequency (SIF) has improved compared to 2020 and reached the target of 0.4. This is the
lowest level in the company’s history. The Total Recordable Incident Frequency and number of oil and gas leakages had a negative
trend in 2021. This underlines the need for a continued strong focus on safety to improve the performance.
The CO
2
was delivered in line with the updated guiding provided to the market. The fixed operating costs ended at similar level as for 2020 and
did not reach the targeted improvement. In 2021 some important projects came on stream, but there has been delays for part of the
project development portfolio. The company delivered oil and gas production above the guided level, where a high production
efficiency had a strong contribution to the production growth. During the year, the company has taken important steps in the energy
transition and the updated strategy was communicated at the capital market day in June. There were positive developments in the
reserve replacement ratio for oil and gas, the value of the renewable portfolio and the levelized cost of energy which ended better than
target.
The significant transformation of the organisation and the implementation of the adjustments to the strategic ambitions, to better align
with the company`s objectives in the energy transition, were visible throughout the year. The internal general employee satisfaction
saw a negative trend indicating the importance of increasing internal focus to align the organisation with the change agenda as well as
identifying improvement areas.
Equinor was ranked number two in the peer group on relative TSR performance, above the target of being better than average in the
peer group. On relative ROACE Equinor ranked second in the peer group which is better than the target set at above average for the
peer group.
Ref. also Table 4 for details.
Equinor, Annual Report on Form 20-F 2021 183
Compensation to the corporate executive committee (CEC)
Table 1 and 2 – Remuneration of the corporate executive committee for the reported financial year
2021
Fixed remuneration
Variable remuneration
Fees
One-
year
variable
Multi-year
variable
Members of the corporate
executive committee
(figures in USD thousand)
1), 2)
Base
salary
Fixed
salary
addition
3)
Other
fees
4)
Fringe
benefits
5)
AVP
6)
LTI
7)
SSP
8)
Extra-
ordinary
items
Pension
expenses
9)
Total
remune-
ration
Proportion of
fixed and var
remuneration
Anders Opedal
1,071
193
84
22
493
159
4
0
30
2,055
68% / 32%
Irene Rummelhoff
469
85
55
10
201
58
14
0
31
924
70% / 30%
Arne Sigve Nylund
496
0
45
33
212
61
0
0
152
1,000
73% / 27%
Jannicke Nilsson
388
70
69
42
160
48
14
0
39
830
73% / 27%
Pål Eitrheim
400
72
33
19
200
46
0
0
25
796
69% / 31%
Alasdair Cook
12), 13)
765
0
163
60
564
347
13
0
0
1,912
52% / 48%
Kjetil Hove
478
86
60
35
258
43
13
0
32
1,004
69% / 31%
Carri Lockhart
11), 13)
307
112
216
70
227
199
8
0
46
1,184
63% / 37%
Ulrica Fearn
11)
367
0
299
106
163
48
0
0
11
993
79% / 21%
Siv Helen Rygh
Torstensen
11)
197
35
22
1
81
20
5
0
17
378
72% / 28%
Ana Fonseca Nordang
11)
204
37
26
5
84
18
4
0
14
393
73% / 27%
Svein Skeie
11)
144
21
16
1
45
12
5
0
14
257
76% / 24%
Tore Løseth
11)
116
17
17
10
27
10
4
0
10
210
81% / 19%


184 Equinor, Annual Report on Form 20-F 2021
2020
Fixed remuneration
Variable remuneration
Fees
One-year
variable
Multi-year
variable
Members of the corporate
executive committee
(figures in USD thousand)
1), 2)
Base
salary
Fixed
salary
addition
3)
Other
fees
4)
Fringe
benefits
5)
AVP
6)
LTI
7)
SSP
8)
Extra-
ordinary
items
Pension
expenses
Total
remune-
ration
10)
Proportion of
fixed and var
remuneration
Anders Opedal
507
91
47
15
0
123
5
0
26
814
84% / 16%
Irene Rummelhoff
405
73
30
10
0
119
16
0
28
681
80% / 20%
Arne Sigve Nylund
451
0
11
29
0
113
0
0
133
736
85% / 15%
Jannicke Nilsson
334
60
47
49
0
99
0
0
35
623
84% / 16%
Pål Eitrheim
320
58
25
5
0
94
0
0
22
524
82% / 18%
Tore Løseth
148
22
11
17
19
25
6
0
15
263
81% / 19%
Svein Skeie
48
7
7
0
6
8
2
0
6
85
81% / 19%
Alasdair Cook
572
0
126
1
0
318
20
0
0
1,037
67% / 33%
All figures in the table are presented in USD based on average foreign currency exchange rates.
Average rates: 2021: NOK/USD = 0,1164 , GBP/USD = 1,3756 , (2020: NOK/USD = 0,1068, GBP/USD = 1,2843).
The figures are presented on accrual basis. For the CEC members holding CEC position only part of 2021, all compensations and
benefits have been prorated.
All CEC members receive their remuneration in NOK except Alasdair Cook who receives the remuneration in GBP, and Carri Lockhart
who receives remuneration in USD.,
Fixed salary addition in lieu of pension accrual above 12 G (G is the base amount in the national insurance scheme). Fixed salary
addition is no longer included in the basis for calculating LTI and annual variable pay for the performance year 2021. For Carri Lockhart
the amount represents company contributions to the SERP plan.
Other fees include car allowance, holiday pay and other cash payments. For Ulrica Fearn this category includes the agreed
remuneration referred to in the section Executive terms and conditions.
Fringe benefits include benefits in kind such as company car, commuter apartments, health program.
Annual variable pay includes holiday allowance for corporate executive committee (CEC) members resident in Norway.
With respect to the employees of Equinor ASA, the long-term incentive (LTI) element implies an obligation to invest the net amount in
Equinor shares, including a lock-in period. The LTI element is presented the year it is granted for the members of the corporate
executive committee employed by Equinor ASA. Alasdair Cook and Carri Lockhart participate in Equinor’s international long-term
incentive program as described in the section Remuneration policy for international executives.
Value of bonus shares received through participation in the Share Saving Plan (SSP).
Estimated pension cost is calculated based on actuarial assumptions and pensionable salary (mainly base salary) at 31 December
2021 and is recognised as pension cost in the statement of income for 2021. Arne Sigve Nylund is maintained in the closed defined
benefit scheme, whereas the remaining members of corporate executive committee employed by Equinor ASA, are covered by the
defined contribution pension scheme. Carri Lockhart participates in pension schemes provided by Equinor US.
Includes figures for 2020 CEC members who are also CEC members in 2021.
Tore M. Løseth was acting EVP EXP until 31 May. Svein Skeie was acting EVP CFO until 15 June. The following appointments took
effect 1 June: Carri Lockhart as EVP TDI, Ana
P.
F. Nordang as EVP PO, Siv Helen Rygh Torstensen as EVP LEG. Ulrica Fearn was
appointed EVP CFO from 16 June.
Alasdair Cook’s other fees include USD 60 thousand in lieu of pension contribution for 2021.
Terms and conditions for Alasdair Cook and Carri Lockhart also include compensation according to Equinor’s international assignment
terms.
There are no loans from the company to members of the corporate executive committee.
Equinor, Annual Report on Form 20-F 2021 185
Table 3 – Shares awarded or due to the corporate executive committee for the reported financial year
LTI Plan:
The LTI plan has an annual invitation. Gross LTI grant is calculated at a fixed percentage of base salary. The threshold
principle is applied to the annual grant, where the grant is based on the performance of the company for preceding year. In relation to
the employees of Equinor ASA, Equinor shares are purchased for the net LTI grant after tax. To hold for three-year lock-in period.
Share savings plan:
years. For savings in 2022 and beyond, holding period is 3 calendar years.
The Performance period in column 2 represents:
●
●
The main conditions of share award plans
Information regarding the reported financial year
Name,
Opening
balance
During the year
Closing balance
position
1
Specifi-
cation of
plan
2
Perfor-
mance
period
3
Award date
4
Vesting
date
5
End of
holding
period
6
Shares
awarded at
the
beginning
of the year
7
Shares
awarded
8
Shares
vested
9
Shares
subject to
a perfor-
mance
condition
10
Shares
awarded
and
unvested
at year end
11
Shares
subject to
a holding
period
Anders
Opedal
LTI
Ref 3
and 5
10/26/2018
5/22/2021
5/22/2021
2,095
2,095
USD 43,085
3/22/2019
5/22/2021
5/22/2021
304
304
USD 6,252
5/8/2019
5/7/2022
5/7/2022
2,997
2,997
2,997
CEO
5/29/2020
5/28/2023
5/28/2023
3,830
3,830
3,830
6/17/2021
6/16/2024
6/16/2024
3,614
3,614
3,614
USD 77,818
Share
saving plan
2021
1/15/2021
186
USD 3,583
Sum
9,226
3,800
2,399
10,441
10,441
USD 81,401
USD 49,337
Arne Sigve
Nylund
*
LTI
Ref 3
and 5
5/23/2018
5/22/2021
5/22/2021
2,238
2,238
USD 46,026
5/8/2019
5/7/2022
5/7/2022
2,365
2,365
2,365
EVP TPD/PDP
5/29/2020
5/28/2023
5/28/2023
4,036
4,036
4,036
6/17/2021
6/16/2024
6/16/2024
1,339
1,339
1,339
USD 28,832
Sum
8,639
1,339
2,238
7,740
7,740
USD 28,832
USD 46,026
* No bonus shares in 2021
Pål Eitrheim
*
LTI
Ref 3
and 5
5/23/2018
5/22/2021
5/22/2021
408
408
USD 8,391
3/22/2019
5/22/2021
5/22/2021
428
428
USD 8,802
EVP NES/REN
5/8/2019
5/7/2022
5/7/2022
2,503
2,503
2,503
5/29/2020
5/28/2023
5/28/2023
3,385
3,385
3,385
6/17/2021
6/16/2024
6/16/2024
1,153
1,153
1,153
USD 24,827
Sum
6,724
1,153
836
7,041
7,041
USD 24,827
USD 17,193
* No bonus shares in 2021
186 Equinor, Annual Report on Form 20-F 2021
The main conditions of share award plans
Information regarding the reported financial year
Name,
Opening
balance
During the year
Closing balance
position
1
Specifi-
cation of
plan
2
Perfor-
mance
period
3
Award date
4
Vesting
date
5
End of
holding
period
6
Shares
awarded at
the
beginning
of the year
7
Shares
awarded
8
Shares
vested
9
Shares
subject to
a perfor-
mance
condition
10
Shares
awarded
and
unvested
at year end
11
Shares
subject to
a holding
period
Irene
Rummelhoff
LTI
Ref 3
and 5
5/23/2018
5/22/2021
5/22/2021
1,688
1,688
USD 34,715
3/22/2019
5/22/2021
5/22/2021
304
304
USD 6,252
5/8/2019
5/7/2022
5/7/2022
2,858
2,858
2,858
EVP MMP
5/29/2020
5/28/2023
5/28/2023
3,802
3,802
3,802
6/17/2021
6/16/2024
6/16/2024
1,267
1,267
1,267
USD 27,282
Share
saving plan
2021
1/15/2021
728
USD 14,024
Sum
8,652
1,995
1,992
7,927
7,927
USD 41,306
USD 40,967
Jannicke
Nilsson
LTI
Ref 3
and 5
5/23/2018
5/22/2021
5/22/2021
1,729
1,729
USD 35,558
3/22/2019
5/22/2021
5/22/2021
311
USD 6,396
5/8/2019
5/7/2022
5/7/2022
2,365
2,365
2,365
EVP COO/SSU
5/29/2020
5/28/2023
5/28/2023
3,205
3,205
3,205
6/17/2021
6/16/2024
6/16/2024
1,091
1,091
1,091
USD 23,492
Share
saving plan
2021
1/15/2021
732
USD 14,101
Sum
7,299
1,823
2,040
6,661
6,661
USD 37,593
USD 41,954
Kjetil Hove
LTI
Ref 3
and 5
6/17/2021
6/16/2024
6/16/2024
997
997
997
USD 21,468
EVP DPN/EPN
Share
saving plan
2021
1/15/2021
668
USD 12,868
Sum
1,665
997
997
USD 34,336
Ana Fonseca
Nordang
LTI
Ref 3
and 5
6/17/2021
6/16/2024
6/16/2024
502
502
502
USD 10,809
EVP PO
Share
saving plan
2021
1/15/2021
212
USD 4,084
Sum
714
502
502
USD 14,893
Siv Helen
Rygh
Torstensen
LTI
Ref 3
and 5
6/17/2021
6/16/2024
6/16/2024
545
545
545
USD 11,735
EVP LEG
Share
saving plan
2021
1/15/2021
252
USD 4,854
Sum
797
545
545
USD 16,590
Equinor, Annual Report on Form 20-F 2021 187
The main conditions of share award plans
Information regarding the reported financial year
Name,
Opening
balance
During the year
Closing balance
position
1
Specifi-
cation of
plan
2
Perfor-
mance
period
3
Award date
4
Vesting
date
5
End of
holding
period
6
Shares
awarded at
the
beginning
of the year
7
Shares
awarded
8
Shares
vested
9
Shares
subject to
a perfor-
mance
condition
10
Shares
awarded
and
unvested
at year end
11
Shares
subject to
a holding
period
Alasdair Cook
Share
saving plan
2021
681
EVP EPI
USD 13,376
Sum
681
USD 13,376
Carri Lockhart
Share
saving plan
2021
338
EVP TDI
USD 7,893
Sum
338
USD 7,893
Svein Skeie
LTI
Ref 3
and 5
5/29/2020
5/28/2023
5/28/2023
270
270
270
6/17/2021
6/16/2024
6/16/2024
287
286
286
USD 6,158
Acting EVP
CFO
Share
saving plan
2021
1/15/2021
235
USD 4,527
Sum
270
522
556
556
USD 10,685
Tore M.
Løseth
LTI
Ref 3
and 5
5/29/2020
5/28/2023
5/28/2023
878
878
878
6/17/2021
6/16/2024
6/16/2024
237
237
237
USD 5,103
Acting EVP
EXP
Share
saving plan
2021
1/15/2021
188
USD 3,622
Sum
878
425
1,115
1115
USD 8,725
188 Equinor, Annual Report on Form 20-F 2021
Table 4 - Performance of corporate executive committee in the reported financial year
Reference is made to the descriptions of annual variable pay, company performance modifier, threshold, and performance
assessment framework.
Performance forms the basis for the decision on annual variable pay percentages for the members of the corporate executive
committee. In Equinor performance is measured in two dimensions, where the ("what") and the ("how") dimensions are equally
weighted. Targets for annual variable pay for the members of the corporate executive committee employed by Equinor ASA are 25%
of base salary, and the maximum annual variable pay for 2021 was 50% of base salary. For members of the corporate executive
committee employed outside the Norwegian market other targets and maximum limit for annual variable pay might apply.
In addition to performance the company performance modifier and the threshold can affect the final annual variable pay award. The
company performance modifier for 2021 ended at a multiplier of 150%. The threshold will not impact the annual variable pay for the
performance year 2021.
“What” -
for the EVPs’ Performance assessment. These KPIs are listed in the table right below and referred to as common KPIs in this Table 4.
KPI
Target
Performance
• Serious Incident Frequency
0.4 or better
0.4
• CO
2
8.1 kg CO
2
7.0 kg CO
2
• Improvement in levelised cost of Energy
(LCoE) for projects which have passed concept
selection and business case (DG2)
2% improvement during the year compared to
approved plan
4% improvement delivered
• Relative Total Shareholder Return
Better than peer average
First quartile
• Relative ROACE
Better than peer average
First quartile
• Fixed OPEX and SG&A:
5% reduction compared to forecast
~ 0
The common KPIs, together with the individual performance criteria provided for the respective EVP, form the basis for the
assessment of the “what” dimension. CEO and EVPs responsible for corporate functions are only measured on common KPIs.
“How”
applicable for the EVPs’ performance assessment. In addition, the CEO and the EVPs had individual behavior goals reflecting their
personal development and respective areas of responsibility. Individual behavior goals are not subject to disclosure.
In accordance with Equinor performance framework and remuneration policy, performance in relation to behavior goals has formed an
equal part to the business performance in the holistic performance assessment.
Anders Opedal, CEO
Performance criteria 2021
The common KPIs for 2021
Demonstrate accountability, visibility, and engagement for safety and compliance
Build trust in Equinor
Transform the organisation to deliver on our corporate purpose and become a leading company in the energy transition
Individual behaviour goals
Award outcome AVP %
Reduction for threshold
Share of total annual
variable pay
USD thousand
Base salary
-
-
-
1 096
Performance evaluation
30.00%
-
66.66
329
Company modifier 150%
15.00%
-
33.33
164
Award annual variable pay
USD thousand
45.00%
-
100.00
493
Equinor, Annual Report on Form 20-F 2021 189
Kjetil Hove, EVP EPN
Performance criteria 2021
The common KPIs for 2021
Serious Incident Frequency in 2021 for EPN
The total injury frequency development for EPN
Reduction in absolute greenhouse gas emissions for EPN
Production efficiency, ramp-up and contribution from new field on stream for EPN
Maturation and development of early phase volumes from EPN
EPN cash flow
Cost development in EPN
Demonstrate accountability, visibility, and engagement for safety and compliance
Build trust in Equinor
Transform the organisation to deliver on our corporate purpose and become a leading company in the energy transition
Individual behaviour goals
Reduction for Threshold
Share of total annual
variable pay
USD thousand
Base salary
-
-
-
538
Performance evaluation
32.00%
-
66.66
172
Company modifier 150%
16.00%
-
33.33
86
Award annual variable pay
USD thousand
48.00%
-
100.00
258
Ulrica Fearn, CFO
Performance criteria 2021
The common KPIs for 2021
Demonstrate accountability, visibility, and engagement for safety and compliance
Build trust in Equinor
Transform the organisation to deliver on our corporate purpose and become a leading company in the energy transition
Individual behaviour goals
Reduction for Threshold
Share of total annual
variable pay
USD thousand
Base salary
-
-
-
698
Performance evaluation
30.00%
-
66.66
108
Company modifier 150%
15.00%
-
33.33
54
Award annual variable pay
USD thousand
45.00%
-
100.00
163
Alasdair Cook, EVP EPI
Performance criteria 2021
190 Equinor, Annual Report on Form 20-F 2021
The common KPIs for 2021
The serious incident frequency (SIF)
Portfolio optimization throughout the year
Operating costs during the year
Delivering positive results in all quarters
Being cashflow positive at 50 USD per barrel oil price
Demonstrate accountability, visibility, and engagement for safety and compliance
Build trust in Equinor
Demonstrate accountability, visibility, and engagement for safety and compliance
Build trust in Equinor
Transform the organisation to deliver on our common purpose and become a leading company in the energy transition
Individual behaviour goals
Reduction for Threshold
Share of total annual
variable pay
USD thousand
Base salary
-
-
783
Performance evaluation
48.00%
-
66.66
376
Company modifier 150%
24.00%
-
33.33
188
Award annual variable pay
USD thousand
72.00%
-
100.00
564
Irene Rummelhoff, EVP MMP
Performance criteria 2021
The common KPIs for 2021
The serious incident frequency
Number of oil and gas leakages
Availability at the processing plants
Progress in developing and maturing the portfolio within low carbon solutions
Net operating income
Capturing the value in the gas value chain
Demonstrate accountability, visibility, and engagement for safety and compliance
Build trust in Equinor
Transform the organisation to deliver on our common purpose and become a leading company in the energy transition
Individual behaviour goals
Reduction for Threshold
Share of total annual
variable pay
USD thousand
Base salary
-
-
-
479
Performance evaluation
28.00%
-
66.66
134
Company modifier 150%
14.00%
-
33.33
67
Award annual variable pay
USD thousand
42.00%
-
100.00
201
Pål Eitrheim, EVP REN
Performance criteria 2021
Equinor, Annual Report on Form 20-F 2021 191
The common KPIs for 2021
Personnel injuries
Benchmarking results for operations and maintenance
Production based availability
Value creation from divestments
Levelized cost of energy
On the way to develop 12-16 GW capacity in 2030
Demonstrate accountability, visibility, and engagement for safety and compliance
Build trust in Equinor
Transform the organisation to deliver on our common purpose and become a leading company in the energy transition
Individual behaviour goals
Reduction for Threshold
Share of total annual
variable pay
USD thousand
Base salary
-
-
-
431
Performance evaluation
31.00%
-
66.66
134
Company modifier 150%
15.50%
-
33.33
67
Award annual variable pay
USD thousand
46.50%
-
100.00
200
Arne Sigve Nylund, EVP PDP
Performance criteria 2021
The common KPIs for 2021
Serious incident frequencies
Well control incident
CO
2
Main milestones for the project portfolio
Contracts award
Improvement impact
Demonstrate accountability, visibility, and engagement for safety and compliance
Build trust in Equinor
Transform the organisation to deliver on our common purpose and become a leading company in the energy transition
Individual behaviour goals
Reduction for Threshold
Share of total annual
variable pay
USD thousand
Base salary
-
-
-
506
Performance evaluation
28.00%
-
66.66
142
Company modifier 150%
14.00%
-
33.33
71
Award annual variable pay
USD thousand
42.00%
-
100.00
212
Carri Lockhart, EVP TDI
Performance criteria 2021
The common KPIs for 2021
Serious incidents
192 Equinor, Annual Report on Form 20-F 2021
Improvement program
Number of new implementations and high impact technology implementation for LCOE and offshore wind
Low carbon research and development activity
Demonstrate accountability, visibility, and engagement for safety and compliance
Build trust in Equinor
Transform the organisation to deliver on our common purpose and become a leading company in the energy transition
Individual behaviour goals
Reduction for Threshold
Share of total annual
variable pay
USD thousand
Base salary
-
-
-
541
Performance evaluation
50.00%
-
66.66
151
Company modifier 150%
25.00%
-
33.33
76
Award annual variable pay
USD thousand
75.00%
-
100.00
227
Siv Helen Rygh Torstensen, EVP LEG
Performance criteria 2021
The common KPIs for 2021
Demonstrate accountability, visibility, and engagement for safety and compliance
Build trust in Equinor
Transform the organisation to deliver on our common purpose and become a leading company in the energy transition
Individual behaviour goals
Reduction for Threshold
Share of total annual
variable pay
USD thousand
Base salary
-
-
-
342
Performance evaluation
27.00%
-
66.66
54
Company modifier 150%
13.50%
-
33.33
27
Award annual variable pay
USD thousand
40.50%
-
100.00
81
Jannicke Nilsson, EVP SSU
Performance criteria 2021
The common KPIs for 2021
Demonstrate accountability, visibility, and engagement for safety and compliance
Build trust in Equinor
Transform the organisation to deliver on our common purpose and become a leading company in the energy transition
Equinor, Annual Report on Form 20-F 2021 193
Individual behaviour goals
Reduction for Threshold
Share of total annual
variable pay
USD thousand
Base salary
-
-
-
395
Performance evaluation
27.00%
-
66.66
107
Company modifier 150%
13.50%
-
33.33
53
Award annual variable pay
USD thousand
40.50%
-
100.00
160
Ana Fonseca Nordang, EVP PO
Performance criteria 2021
The common KPIs for 2021
Demonstrate accountability, visibility, and engagement for safety and compliance
Build trust in Equinor
Transform the organisation to deliver on our common purpose and become a leading company in the energy transition
Individual behaviour goals
Reduction for Threshold
Share of total annual
variable pay
USD thousand
Base salary
-
-
-
355
Performance evaluation
27.00%
-
66.66
56
Company modifier 150%
13.50%
-
33.33
28
Award annual variable pay
USD thousand
40.50%
-
100.00
84
Svein Skeie, acting EVP CFO 1 Jan – 15 June
Performance criteria 2021
The common KPIs for 2021
Demonstrate accountability, visibility, and engagement for safety and compliance
Build trust in Equinor
Transform the organisation to deliver on our common purpose and become a leading company in the energy transition
Individual behaviour goals
Reduction for Threshold
Share of total annual
variable pay
USD thousand
194 Equinor, Annual Report on Form 20-F 2021
Base salary
-
-
-
290
Performance evaluation
22.50%
-
66.66
30
Company modifier 150%
11.25%
-
33.33
15
Award annual variable pay
USD thousand
33.75%
-
100.00
45
Tore M. Løseth, acting EVP EXP 1 Jan – 31 May
Performance criteria 2021
The common KPIs for 2021
Demonstrate accountability, visibility, and engagement for safety and compliance
Build trust in Equinor
Transform the organisation to deliver on our common purpose and become a leading company in the energy transition
Individual behaviour goals
Reduction for Threshold
Share of total annual
variable pay
USD thousand
Base salary
-
-
-
247
Performance evaluation
17.50%
-
66.66
18
Company modifier 150%
8.75%
-
33.33
9
Award annual variable pay
USD thousand
26.25%
-
100.00
27
Equinor, Annual Report on Form 20-F 2021 195
Table 5 - Comparative table over the remuneration and company performance over the last five reported financial years
(RFY)
All amounts in USD
Remuneration
2017
2018
2019
2020
2021
Anders Opedal, CEO
Total remuneration and %
change vs previous year
1)
-
-
1,171,41
0
-
881,029
-
24.79%
814,098
-7.60%
2,055,023
152.43%
4)
Base salary % increase in annual
salary review and on other
adjustments
-
-
-
-
4.00%
-
0.00%
133.30%
4)
3.50%
-
AVP % pre and post threshold
and company performance
modifier
-
-
-
-
28.00%
23.24%
0,00%
0,00%
30.00%
45.00%
LTI % pre and post threshold
-
-
-
-
25.00%
25.00%
25.00%
25.00%
30.00%
15,00%
Irene Rummelhoff, EVP MMP
Total remuneration and %
change vs previous year
1), 2)
720,703
45.74%
924,926
28.34%
4)
826,342
-
10.66%
681,363
-17.54%
923,578
35.55%
4)
Base salary % increase in annual
salary review and on other
adjustments
16.70%
-
-
25.10%
4)
3.80%
-
-
-
3.00%
5.40%
AVP % pre and post threshold
and company performance
modifier
29.00%
39.00%
29.00%
43.50%
26.00%
21.58%
-
-
28.00%
42.00%
LTI % pre and post threshold
25.00%
12.50%
25.00%
25.00%
25.00%
25.00%
25.00%
25.00%
25.00%
12.50%
Arne Sigve Nylund, EVP PDP
Total remuneration and %
change vs previous year
1)
839,429
45.31%
1,001,19
7
19.27%
889,200
-
11.19%
736,354
-17.19%
999,976
35.80%
4)
Base salary % increase in annual
salary review and on other
adjustments
10.60%
-
11.00%
-
4.20%
-
-
-
3.00%
-
AVP % pre and post threshold
and company performance
modifier
33.00%
44.00%
31.00%
46.50%
26.00%
21.58%
-
-
28.00%
42.00%
LTI % pre and post threshold
25.00%
12.50%
25.00%
25.00%
25.00%
25.00%
25.00%
25.00%
25.00%
12.50%
Jannicke Nilsson, EVP SSU
Total remuneration and %
change vs previous year
1), 2)
772,345
50.75%
890,465
15.29%
757,055
-
14.98%
623,702
-17.61%
829,810
33.05%
4)
Base salary % increase in annual
salary review and on other
adjustments
4.60%
-
3.10%
-
3.60%
-
-
-
3.00%
5.40%
AVP % pre and post threshold
and company performance
modifier
28.00%
37.00%
26.00%
39.00%
23.00%
19.09%
-
-
27.00%
40.50%
LTI % pre and post threshold
25.00%
12.50%
25.00%
25.00%
25.00%
25.00%
25.00%
25.00%
25.00%
12.50%
Pål Eitrheim, EVP REN
Total remuneration and %
change vs previous year
1)
-
-
807,881
-
669,000
-
17.19%
524,113
-21.66%
796,048
51.88%
4)
Base salary % increase in annual
salary review and on other
adjustments
-
-
-
-
3.40%
-
-
-
4.00%
17.20%
4)
AVP % pre and post threshold
and company performance
modifier
-
-
-
-
26.00%
21.58%
-
-
31.00%
46.50%
LTI % pre and post threshold
-
-
-
-
25.00%
25.00%
25.00%
25.00%
25.00%
12.50%
196 Equinor, Annual Report on Form 20-F 2021
All amounts in USD
Remuneration
2017
2018
2019
2020
2021
Alasdair Cook, EVP EPI
Total remuneration and %
change vs previous year
1)
-
-
1,331,01
5
-
1,364,022
2.48%
1,037,27
2
-23.95%
1,912,255
84.35%
4)
Base salary % increase in annual
salary review and on other
adjustments
-
-
-
-
5.95%
-
-
-
3.50%
23.60%
4)
AVP % pre and post threshold
and company performance
modifier
-
-
-
-
43.00%
35.69%
-
-
48.00%
72.00%
LTI % pre and post threshold
3)
-
-
-
-
70.00%
93.33%
70.00%
85.40%
70.00%
85.40%
Svein Skeie, Acting EVP CFO
Total remuneration and %
change vs previous year
1)
-
-
-
-
-
-
508,434
-
564,179
10.96%
Base salary % increase in annual
salary review and on other
adjustments
-
-
-
-
-
-
-
-
-
-
AVP % pre and post threshold
and company performance
modifier
-
-
-
-
-
-
17.50%
18.86%
22.50%
33.75%
LTI % pre and post threshold
-
-
-
-
-
-
-
-
20.00%
10.00%
Tore Løseth, Acting EVP EXP
Total remuneration and %
change vs previous year
1)
-
-
-
-
-
-
450,613
-
508,545
12.86%
Base salary % increase in annual
salary review and on other
adjustments
-
-
-
-
-
-
-
-
-
-
AVP % pre and post threshold
and company performance
modifier
-
-
-
-
-
-
17.50%
19.34%
17.50%
26.25%
LTI % pre and post threshold
-
-
-
-
-
-
-
-
20.00%
10.00%
Kjetil Hove, EVP EPN
-
-
-
-
-
-
-
-
-
-
Carri Lockhart, EVP TDI
-
-
-
-
-
-
-
-
-
-
Ulrica Fearn, EVP and CFO
-
-
-
-
-
-
-
-
-
-
Siv Helen Rygh Torstensen,
EVP LEG
-
-
-
-
-
-
-
-
-
-
Ana Fonseca Nordang, EVP PO
-
-
-
-
-
-
-
-
-
-
1) Total remuneration consists of taxable compensation, non-taxable benefits in kind, and estimated pension cost for the years 2016-2020.
2) Includes retroactive corrections for AVP and LTI for 2016 and 2017.
3) Payment of LTI is made 3 years after the grant. The “post” percentage is relative to base salary at the time of the grant.
4) The changes are impacted by the executive moving to a new position. The difference in total remuneration between 2021 and 2020 is also
affected by the waiver of AVP for 2020.
Equinor, Annual Report on Form 20-F 2021 197
Company performance - effect
on AVP and LTI
2017
2018
2019
2020
2021
AVP
LTI
AVP
LTI
AVP
LTI
AVP
LTI
AVP
LTI
Threshold
-
50 %
reduct.
-
-
-
-
50 %
reduct.
-
-
50 %
reduct.
Company performance modifier
133%
-
150%
-
83%
-
133%
-
150%
-
All amounts in USD
Average remuneration on a full-
time equivalent basis of
employees
2017
2018
2019
2020
2021
Equinor ASA
4)
Average base salary and %
change vs previous year, based
on USD amounts
5)
90,619
4.00%
94,903
4.70%
90,260
-4.90%
86,229
-4.50%
95,893
11.20%
Change in average base salary
vs previous year, based on NOK
amounts
-
2.30%
-
3.00%
-
3.00%
-
1.60%
-
2.00%
Average total remuneration and
% change vs previous year,
based on USD amounts
5), 6), 7), 8)
124,908
8.60%
133,656
7.00%
123,626
-7.50%
115,137
-6.90%
135,597
17.80%
Change in average total
remuneration vs previous year,
based on NOK amounts
6), 7), 8)
-
6.80%
-
5.30%
-
0.20%
-
-0.90%
-
8.10%
General salary increase frame
-
2.60%
-
2.90%
-
3.50%
-
0.80%
-
3.50%
General bonus %
-
7.50%
-
8.50%
-
4.50%
-
3.50%
-
10.50%
AVP % range from manager to
SVP pre and post company
performance modifier and
threshold
11.25%
-
17.5%
14.96%
-
23.28%
11.25% -
17.5%
16.88% -
26.25%
11.25% -
17.5%
9.34% -
14.53%
11.25% -
17.5%
7.48% -
11.64%
11.25% -
17.5%
16.88% -
26.25%
5) Offshore workers with 2-4 schedule reported as FTE 100%.
6) Annual salary increase is affected by the NOK/USD exchange rate.
7) Holiday and bonus pay are included for the year of accrual.
8) Annual total remuneration increase is affected by bonus and any bonus shares from the SSP or LTI.
9) Overtime allowance and pension are not included.
3.8 Share ownership
The number of Equinor shares owned by the members of the board of directors and the executive committee and/or owned by their
close associates is shown below. Individually, each member of the board of directors and the corporate executive committee owned
less than 1% of the outstanding Equinor shares.
198 Equinor, Annual Report on Form 20-F 2021
As of 31
December
As of 8 March
Ownership of Equinor shares (including shares owned by close associates)
2021
2022
Members of the corporate executive committee
Anders Opedal
41,458
41,670
Ulrica Fearn
0
0
Arne Sigve Nylund
15,820
16,914
Irene Rummelhoff
25,036
26,076
Jannicke Nilsson
56,272
57,462
Pål Eitrheim
17,840
17,840
Alasdair Cook
3,738
3,738
Kjetil Hove
17,017
17,817
Carri Lockhart
8,450
9,255
Siv Helen Rygh Torstensen
13,318
14,084
Ana Fonseca Nordang
8,370
-
Members of the board of directors
Jon Erik Reinhardsen
4,584
4,584
Jeroen van der Veer
6,000
6,000
Bjørn Tore Godal
0
0
Tove Andersen
4,700
4,700
Rebekka Glasser Herlofsen
220
220
Anne Drinkwater
1,100
1,100
Jonathan Lewis
0
0
Finn Bjørn Ruyter
620
620
Per Martin Labråten
2,642
2,801
Hilde Møllerstad
5,234
5,921
Stig Lægreid
125
125
Individually, each member of the corporate assembly owned less than 1% of the outstanding Equinor shares as of 31 December 2021
and as of 8 March 2022. In aggregate, members of the corporate assembly owned a total of 27,078 shares as of 31 December 2021
and a total of 26,436 shares as of 8 March 2022. Information about the individual share ownership of the members of the corporate
assembly is presented in the section 3.8 Corporate assembly, board of directors and management.
The voting rights of members of the board of directors, the corporate executive committee and the corporate assembly do not differ
from those of ordinary shareholders.
3.9 EXTERNAL AUDITOR
Our independent registered public accounting firm (external auditor) is independent in relation to Equinor and is appointed by the
general meeting of shareholders. Our independent registered public accounting firm, Ernst & Young AS, has been engaged to provide
and audit in accordance with standards of the Public Company Accounting Oversight Board (United States). Ernst & Young AS will
also issue a report in accordance with law, regulations, and auditing standards and practices generally accepted in Norway, including
International Standards on Auditing (ISAs), which includes opinions on the Consolidated financial statements and the parent company
financial statements of Equinor ASA. The reports are set out in section 4.1 Consolidated financial statements.
The external auditor's fee must be approved by the general meeting of shareholders.
Pursuant to the instructions for the board's audit committee approved by the board of directors, the audit committee is responsible for
ensuring that the company is subject to an independent and effective external and internal audit. Every year, the external auditor
presents a plan to the audit committee for the execution of the external auditor's work. The external auditor attends the meeting of the
board that deals with the preparation of the annual accounts.
Equinor, Annual Report on Form 20-F 2021 199
The external auditor also participates in meetings of the audit committee. The audit committee considers all reports from the external
auditor before they are considered by the board. The audit committee meets at least five times a year and both the board and the
board’s audit committee hold meetings with the internal auditor and the external auditor on a regular basis without the company’s
management being present.
The audit committee evaluates and makes a recommendation to the board, the corporate assembly and the general meeting of
shareholders regarding the choice of external auditor. The committee is responsible for ensuring that the external auditor meets the
requirements in Norway and in the countries where Equinor is listed. The external auditor is subject to the provisions of US securities
legislation, which stipulates that a responsible partner may not lead the engagement for more than five consecutive years.
When evaluating the external auditor, emphasis is placed on the firm's qualifications, capacity, local and international availability and
the auditor’s fee.
The audit committee's policies and procedures for pre-approval
In its instructions for the audit committee, the board has delegated authority to the audit committee to pre-approve assignments to be
performed by the external auditor. Within this pre-approval, the audit committee has issued further guidelines. The audit committee
has issued guidelines for the management's pre-approval of assignments to be performed by the external auditor.
All audit-related and other services provided by the external auditor must be pre-approved by the audit committee. Provided that the
types of services proposed are permissible under SEC guidelines and Norwegian Auditors Act requirements, pre-approval is usually
granted at a regular audit committee meeting. The chair of the audit committee has been authorised to pre-approve services that are
in accordance with policies established by the audit committee that specify in detail the types of services that qualify. It is a condition
that any services pre-approved in this manner are presented to the full audit committee at its next meeting. Some pre-approvals can
therefore be granted by the chair of the audit committee if an urgent reply is deemed necessary.
Remuneration of the external auditor in 2019 – 2021
In the annual Consolidated financial statements and in the parent company's financial statements, the independent auditor's
remuneration is split between the audit fee and the fee for audit-related, tax and other services. The breakdown between the audit fee
and the fee for audit-related, tax and other services is presented to the annual general meeting of shareholders.
The following table sets out the aggregate fees related to professional services rendered by Equinor's external auditor Ernst & Young
AS, for the fiscal years 2019, 2020 and 2021 and KPMG until 15 May 2019.
Auditor's remuneration
Full year
(in USD million, excluding VAT)
2021
2020
2019
Audit fee Ernst & Young (principal accountant from 2019)
14.4
10.7
4.7
Audit fee KPMG (principal accountant 2018)
0.0
2.8
Audit related fee Ernst & Young (principal accountant from 2019)
1.1
1.0
0.5
Audit related fee KPMG (principal accountant 2018)
0.0
1.2
Tax fee Ernst & Young (principal accountant from 2019)
0.0
0.0
0.2
Tax fee KPMG (principal accountant 2018)
0.0
0.0
Other service fee Ernst & Young (principal accountant from 2019)
0.0
0.0
0.9
Other service fee KPMG (principal accountant 2018)
0.0
0.0
Total remuneration
15.5
11.7
10.3
All fees included in the table have been approved by the board's audit committee.
Audit fee
is defined as the fee for standard audit work that must be performed every year in order to issue an opinion on Equinor's
Consolidated financial statements, on Equinor's internal control over annual reporting and to issue reports on the statutory financial
statements. It also includes other audit services, which are services that only the independent auditor can reasonably provide, such as
the auditing of non-recurring transactions and the application of new accounting policies, audits of significant and newly implemented
system controls and limited reviews of quarterly financial results.
Audit-related fees
include other assurance and related services provided by auditors, but not limited to those that can only
reasonably be provided by the external auditor who signs the audit report, that are reasonably related to the performance of the audit
or review of the company's financial statements, such as acquisition due diligence, audits of pension and benefit plans, consultations
concerning financial accounting and reporting standards.
200 Equinor, Annual Report on Form 20-F 2021
Tax and Other services fees
include services, if any, provided by the auditors within the framework of the Sarbanes-Oxley Act, i.e.
certain agreed procedures.
In addition to the figures in the table above, the audit fees and audit-related fees relating to Equinor licences for the years 2021, 2020
and 2019 amounted to USD 0.5 million, USD 0.5 million and USD 0.5 million, respectively.
3.10 Risk management and internal control
Risk management
The board of directors oversees the company's internal control and overall risk management and assurance, and through its audit
committee, reviews and monitors the effectiveness of the company's policies and practices in such regard. On an ongoing basis, the
board and board audit committee discuss the company's enterprise risk management framework and three-lines of control model and
learning from risk-adjusting actions and assurance activities. The board, board audit committee and board safety, sustainability and
ethics committee, together, monitor and assess risks including legal, regulatory, financial, safety, security, sustainability and climate-
related risks and the associated control measures put in place to manage them. Twice a year, the board receives and reviews an
assessment of all top enterprise risks, material emerging risks and risk-issues, and discusses the company's risk profile.
Equinor manages risk to ensure that operations and other business activities are conducted in a safe and secure manner, in
compliance with external and internal standards and requirements, so that unwanted incidents are avoided, and maximum value is
created. The company's enterprise risk management framework endeavours to make risk considerations an integral part of realising
its purpose and vision, and of driving day-to-day performance.
Through its three lines of control model, company-wide accountabilities for risk management, and responsibilities for risk analysis,
monitoring, advise and assurance are defined across all relevant classes of risk, including business integrity risks (fraud, sanctions,
competition, money laundering), safety/security/sustainability risks, financial/legal/regulatory risks, people risks and political/public
affairs risks. Procedures and systems are in place to assess both potential financial impacts of risks on cash-flows and potential non-
financial impacts of risks on people, the environment, physical assets, and ultimately, the company's reputation. Where necessary,
operational risks are insured by the company's captive insurance company, that operates in both Norwegian and international
insurance markets.
Further information about the risks and risk factors that the company's financial and operating results are subject to are presented in
section 2.13 (risk review) of the Form 20-F.
Controls and procedures
This section describes controls and procedures relating to our financial reporting.
Evaluation of disclosure controls and procedures
The management of Equinor, with the participation of our chief executive officer and chief financial officer, has evaluated the
effectiveness of the design and operation of our disclosure controls and procedures pursuant to Exchange Act Rule 13a-15(b) as of
31 December 2021. Based on that evaluation, the chief executive officer and chief financial officer have concluded that these
disclosure controls and procedures are effective at a reasonable level of assurance.
In designing and evaluating our disclosure controls and procedures, our management, with the participation of the chief executive
officer and chief financial officer, recognised that any controls and procedures, no matter how well designed and operated, can only
provide reasonable assurance that the desired control objectives will be achieved, and that the management must necessarily
exercise judgment when evaluating possible controls and procedures. Because of the limitations inherent in all control systems, no
evaluation of controls can provide absolute assurance that all control issues and any instances of fraud in the company have been
detected.
Management's report on internal control over financial reporting
The management of Equinor is responsible for establishing and maintaining adequate internal control over financial reporting. Our
internal control over financial reporting is a process designed, under the supervision of the chief executive officer and chief financial
officer, to provide reasonable assurance regarding the reliability of financial reporting and the preparation of Equinor’s financial
statements for external reporting purposes in accordance with International Financial Reporting Standards (IFRS) as adopted by the
European Union (EU). The accounting policies applied by the group also comply with IFRS as issued by the International Accounting
Standards Board (IASB).
Equinor, Annual Report on Form 20-F 2021 201
The management of Equinor has assessed the effectiveness of internal control over financial reporting based on the Internal Control –
Integrated Framework (2013) issued by the Committee of Sponsoring Organizations of the Treadway Commission (COSO). Based on
this assessment, management has concluded that Equinor’s internal control over financial reporting as of 31 December 2021 was
effective.
Equinor’s internal control over financial reporting includes policies and procedures that pertain to the maintenance of records that, in
reasonable detail, accurately and fairly reflect transactions and dispositions of assets, provide reasonable assurance that transactions
are recorded in the manner necessary to permit the preparation of financial statements in accordance with IFRS, and that receipts and
expenditures are only carried out in accordance with the authorisation of the management and directors of Equinor; and provide
reasonable assurance regarding the prevention or timely detection of any unauthorised acquisition, use or disposition of Equinor’s
assets that could have a material effect on our financial statements.
Because of its inherent limitations, internal control over financial reporting may not prevent or detect all misstatements. Moreover,
projections of any evaluation of the effectiveness of internal control to future periods are subject to a risk that controls may become
inadequate because of changes in conditions and that the degree of compliance with policies or procedures may deteriorate.
Attestation report of the registered public accounting firm
The effectiveness of internal control over financial reporting as of 31 December 2021 has been audited by Ernst & Young AS, an
independent registered accounting firm that also audits the Consolidated financial statements in this report. Their audit report on the
internal control over financial reporting is included in section 4.1 Consolidated financial statements in this report.
Remediation of material weaknesses in prior year
As of 31 December 2021, management has completed the remediation work to address the material weaknesses identified as of 31
December 2020, as follows:
IT user access controls:
◾
◾
◾
increased, including further enhancement of the documentation.
◾
Controls over sales and purchases of liquid and gas, including inventory variation, and power trading in the MMP segment:
◾
controls.
◾
and increase monitoring activities.
◾
review controls and for ensuring completeness and accuracy of data and reports used in these controls.
Management believes the foregoing work has effectively remediated the material weaknesses.
Changes in internal control over financial reporting
Other than as described above, there were no significant changes in our internal control over financial reporting during the year ended
31 December 2021 that have materially affected, or are reasonably likely to materially affect, our internal control over financial
reporting.
202 Equinor, Annual Report on Form 20-F 2021
4.1 Consolidated financial statements
of the Equinor group
Equinor, Annual Report on Form 20-F 2021 203
The reports set out below are provided in accordance with standards of the Public Company Accounting Oversight Board (United
States). Ernst & Young AS (PCAOB ID:
) has also issued a report in accordance with law, regulations, and auditing standards
and practices generally accepted in Norway, including International Standards on Auditing (ISAs), which includes opinions on the
Consolidated financial statements and the parent company financial statements of Equinor ASA, and on other required matters. That
report is not included in this Annual Report on Form 20-F.
Report of Independent Registered Public Accounting Firm
To the Shareholders and the Board of Directors of Equinor ASA
Opinion on the Financial Statements
We have audited the accompanying consolidated balance sheets of Equinor ASA and its subsidiaries (Equinor or the Company) as at
31 December 2021 and 2020, the related consolidated statements of income, comprehensive income, changes in equity and cash
flows for each of the three years in the period ended 31 December 2021, and the related notes (collectively referred to as the
“Consolidated Financial Statements”). In our opinion, the Consolidated Financial Statements present fairly, in all material respects, the
financial position of the Company as at 31 December 2021 and 2020, and the results of its operations and its cash flows for each of
the three years in the period ended 31 December 2021, in conformity with International Financial Reporting Standards (IFRS) as
issued by the International Accounting Standards Board (IASB) and in conformity with IFRS as adopted by the European Union.
We also have audited, in accordance with the standards of the Public Company Accounting Oversight Board (United States)
(PCAOB), the Company's internal control over financial reporting as at 31 December 2021, based on criteria established in Internal
Control-Integrated Framework issued by the Committee of Sponsoring Organizations of the Treadway Commission (2013 framework),
and our report dated 8 March 2022 expressed an unqualified opinion thereon.
Revision of Segment Reporting
As discussed in Note 4 to the Consolidated Financial Statements, the Company revised its segment reporting in the year ended 31
December 2021.
Voluntary Change in Accounting Principle
As discussed in Notes 2 and 21 to the Consolidated Financial Statements, the Company has elected to change its method of
accounting for the discount rate used in calculation of asset retirement obligations, so that this excludes an element covering the
Company’s own credit risk in the year ended 31 December 2021, which included the disclosure of the 1 January 2020 balance sheet.
Basis for Opinion
These financial statements are the responsibility of the Company's management. Our responsibility is to express an opinion on the
Company’s financial statements based on our audits. We are a public accounting firm registered with the PCAOB and are required to
be independent with respect to the Company in accordance with the U.S. federal securities laws and the applicable rules and
regulations of the Securities and Exchange Commission and the PCAOB.
We conducted our audits in accordance with the standards of the PCAOB. Those standards require that we plan and perform the
audit to obtain reasonable assurance about whether the Consolidated Financial Statements are free of material misstatement,
whether due to error or fraud. Our audits included performing procedures to assess the risks of material misstatement of the
Consolidated Financial Statements, whether due to error or fraud, and performing procedures that respond to those risks. Such
procedures included examining, on a test basis, evidence regarding the amounts and disclosures in the Consolidated Financial
Statements. Our audits also included evaluating the accounting principles used and significant estimates made by management, as
well as evaluating the overall presentation of the Consolidated Financial Statements. We believe that our audits provide a reasonable
basis for our opinion.
Supplemental Information
The accompanying supplementary oil and gas information has been subjected to audit procedures performed in conjunction with the
audits of the Company’s Consolidated Financial Statements. Such information is the responsibility of the Company’s management.
Our audit procedures included determining whether the information reconciles to the financial statements or the underlying accounting
and other records, as applicable, and performing procedures to test the completeness and accuracy of the information. In our opinion,
the information is fairly stated, in all material respects, in relation to the Consolidated Financial Statements as a whole.
204 Equinor, Annual Report on Form 20-F 2021
Critical Audit Matters
The critical audit matters communicated below are matters arising from the current period audit of the Consolidated Financial
Statements that were communicated to the audit committee and that: (1) relate to accounts or disclosures that are material to the
Consolidated Financial Statements and (2) involved our especially challenging, subjective or complex judgments. The communication
of critical audit matters does not alter in any way our opinion on the Consolidated Financial Statements, taken as a whole, and we are
not, by communicating the critical audit matters below, providing separate opinions on the critical audit matters or on the accounts or
disclosures to which they relate.
Recoverable amounts of production plants and oil and gas assets including assets under development
As at 31 December 2021, the Company has recognised production plants and oil and gas assets,
including assets under development, of USD 45,595 million and USD 12,270 million, respectively,
within Property, plant and equipment. Refer to Notes 2 and 11 to the Consolidated Financial
Statements for the related disclosures. As described in Note 2, determining the recoverable amount of
an asset involves an estimate of future cash flows, which is dependent upon management’s best
estimate of the economic conditions that will exist over the asset’s useful life. The asset’s operational
performance and external factors have a significant impact on the estimated future cash flows and
therefore, the recoverable amount of the asset.
Auditing management’s estimate of the recoverable amount of production plants and oil and gas
assets is complex and involves a high degree of judgement. Significant assumptions used in
forecasting future cash flows are future commodity prices, currency exchange rates, expected
reserves, capital expenditures, and the discount rate.
These assumptions are forward-looking and can be affected by future economic and market
conditions, including matters related to climate change and energy transition. Such climate-related
matters have financial impacts which are mainly related to management’s estimation of long-term
commodity prices, as a result of an expected lower carbon emission scenario in the future and
expected CO2 costs.
Additionally, the treatment of tax in the estimation of the recoverable amount is challenging, as the
Company is subject to different tax structures that are inherently complex, particularly in Norway.
We obtained an understanding, evaluated the design, and tested the operating effectiveness of
controls over the Company’s process for evaluating the recoverability of production plants and oil and
gas assets including assets under development. This included testing controls over management’s
review of assumptions and inputs to the calculations of impairment and impairment reversals.
Our audit procedures performed over the significant assumptions and inputs included, among others,
evaluation of the methods and models used in the calculation of the recoverable amount. We also
evaluated the relevant tax effects based on the local legislation of the relevant jurisdictions, particularly
in Norway, and tested the clerical accuracy of the models through independently recalculating the
value in use. We involved valuation specialists to assist us with these procedures. In addition, we
compared projected capital expenditures to approved operator budgets or management forecasts and
compared expected reserve volumes to internal production forecasts and external evaluations of
expected reserves, in accordance with the Company’s internal procedures. For those assets
previously impaired, we compared actual results to the forecasts used in historical impairment
analyses. We also involved reserves specialists to assist us with these procedures.
To test price assumptions, we evaluated management’s methodology to determine future short- and
long-term commodity prices and compared such assumptions to external benchmarks, among other
procedures. We involved valuation specialists to assist in evaluating the reasonableness of the
Company’s assessment of currency exchange rates and the discount rate, by assessing the
Company’s methodologies and key assumptions used to calculate the rates and by comparing those
rates with external information. We also evaluated management’s methodology to factor climate-
related matters into their determination of future short- and long-term commodity prices, through
assessing management’s sensitivity analyses as discussed below.
To test carbon costs assumptions, with the involvement of climate change and sustainability
specialists, we evaluated management’s methodology to determine future CO2 tax, including
assessing the impact from climate-related matters, through assessing management’s sensitivity
analyses as discussed below, and compared management’s assumptions with the current legislation
in place in the relevant jurisdictions and the jurisdictions’ announced pledges regarding escalation of
CO2 taxes.
Equinor, Annual Report on Form 20-F 2021 205
We evaluated management’s sensitivity analyses over its future short- and long-term commodity
prices and carbon cost assumptions by taking into consideration, among other sources, the net-zero
emission scenario estimated by the International Energy Agency (IEA).
We have also evaluated management’s disclosures related to the consequences of initiatives to limit
climate changes, including the effects of the Company’s climate change strategy on the Consolidated
Financial Statements and the energy transition’s effects on estimation uncertainty, discussed in more
detail in Notes 2, 3 and 11.
Estimation of the asset retirement obligation
As at 31 December 2021, the Company has recognised a provision for decommissioning and removal
activities of USD 17,417 million classified within Provisions and other liabilities. Refer to Notes 2 and
21 to the Consolidated Financial Statements for disclosures related to the asset retirement obligation
(ARO) provision.
Auditing management’s estimate of the decommissioning and removal of offshore installations at the
end of the production period is complex and involves a high degree of judgement. Determining the
provision for such obligation involves application of considerable judgement related to the assumptions
used in the estimate, the inherent complexity and uncertainty in estimating future costs, and the limited
historical experience against which to benchmark estimates of future costs. Significant assumptions
used in the estimate are the discount rates, long-term currency exchange rates and the expected
future costs, which includes underlying assumptions such as norms and rates and time required to
decommission, which can vary considerably depending on the expected removal complexity. These
significant assumptions are forward-looking and can be affected by future economic and market
conditions.
How We Addressed the
Matter in Our Audit
We obtained an understanding, evaluated the design, and tested the operating effectiveness of
controls over the Company’s process to calculate the present value of the estimated future
decommissioning and removal expenditures determined in accordance with local conditions and
requirements. This includes controls related to management’s review of assumptions described above,
used in the calculation of the ARO.
To test management’s estimation of the provision for decommissioning and removal activities, our
audit procedures included, among others, evaluating the completeness of the provision by comparing
significant additions to property, plant and equipment to management’s assessment of new ARO
obligations recognized in the period.
To assess the expected future costs, among other procedures, we compared day rates for rigs, marine
operations and heavy lift vessels to external market data or existing contracts. For time required to
decommission, we compared the assumptions against historical data on a sample basis. We
compared discount rates to external market data. With the support of our valuation specialists, we
evaluated the methodology and models used by management to estimate the ARO, assessed the
long-term currency exchange rates used in the models and performed a sensitivity analysis on the
significant assumptions. In addition, we recalculated the formulas in the models.
/s/
We have served as the Company’s auditor since 2019.
8 March 2022
206 Equinor, Annual Report on Form 20-F 2021
Report of Independent Registered Public Accounting Firm
To the Shareholders and the Board of Directors of Equinor ASA
Opinion on Internal Control over Financial Reporting
We have audited Equinor ASA and subsidiaries’ (the Company) internal control over financial reporting as at 31 December 2021,
based on criteria established in Internal Control—Integrated Framework issued by the Committee of Sponsoring Organizations of the
Treadway Commission (2013 framework) (the COSO criteria). In our opinion, the Company maintained, in all material respects,
effective internal control over financial reporting as at 31 December 2021, based on the COSO criteria.
We also have audited, in accordance with the standards of the Public Company Accounting Oversight Board (United States)
(PCAOB), the 2021 Consolidated Financial Statements of the Company, and our report dated 8 March 2022 expressed an unqualified
opinion thereon.
Basis for Opinion
The Company’s management is responsible for maintaining effective internal control over financial reporting and for its assessment of
the effectiveness of internal control over financial reporting included in the accompanying Management's Report on Internal Control
over Financial Reporting as set out in section 3.10 Risk management and internal control. Our responsibility is to express an opinion
on the Company’s internal control over financial reporting based on our audit. We are a public accounting firm registered with the
PCAOB and are required to be independent with respect to the Company in accordance with the U.S. federal securities laws and the
applicable rules and regulations of the Securities and Exchange Commission and the PCAOB.
We conducted our audit in accordance with the standards of the PCAOB. Those standards require that we plan and perform the audit
to obtain reasonable assurance about whether effective internal control over financial reporting was maintained in all material
respects. Our audit included obtaining an understanding of internal control over financial reporting, assessing the risk that a material
weakness exists, testing and evaluating the design and operating effectiveness of internal control based on the assessed risk, and
performing such other procedures as we considered necessary in the circumstances. We believe that our audit provides a reasonable
basis for our opinion.
Definition and Limitations of Internal Control over Financial Reporting
A company’s internal control over financial reporting is a process designed to provide reasonable assurance regarding the reliability of
financial reporting and the preparation of financial statements for external purposes in accordance with generally accepted accounting
principles. A company’s internal control over financial reporting includes those policies and procedures that (1) pertain to the
maintenance of records that, in reasonable detail, accurately and fairly reflect the transactions and dispositions of the assets of the
company; (2) provide reasonable assurance that transactions are recorded as necessary to permit preparation of financial statements
in accordance with generally accepted accounting principles, and that receipts and expenditures of the company are being made only
in accordance with authorizations of management and directors of the company; and (3) provide reasonable assurance regarding
prevention or timely detection of unauthorized acquisition, use, or disposition of the company’s assets that could have a material effect
on the financial statements.
Because of its inherent limitations, internal control over financial reporting may not prevent or detect misstatements. Also, projections
of any evaluation of effectiveness to future periods are subject to the risk that controls may become inadequate because of changes in
conditions, or that the degree of compliance with the policies or procedures may deteriorate.
/s/ Ernst & Young AS
Stavanger, Norway
8 March 2022
Equinor, Annual Report on Form 20-F 2021 207
CONSOLIDATED STATEMENT OF INCOME
Full year
(in USD million)
Note
2021
2020
2019
Revenues
4
Net income/(loss) from equity accounted investments
13
Other income
5
Total revenues and other income
4
Purchases [net of inventory variation]
(35,160 )
(20,986 )
(29,532 )
Operating expenses
(8,598 )
(8,831 )
(9,660 )
Selling, general and administrative expenses
(780 )
(706 )
(809 )
Depreciation, amortisation and net impairment losses
11, 12
(11,719 )
(15,235 )
(13,204 )
Exploration expenses
12
(1,004 )
(3,483 )
(1,854 )
Total operating expenses
(57,261 )
(49,241 )
(55,058 )
Net operating income/(loss)
4
(3,423 )
Interest expenses and other financial expenses
(1,223 )
(1,392 )
(1,450 )
Other financial items
(857 )
Net financial items
9
(2,080 )
(836 )
(7 )
Income/(loss) before tax
(4,259 )
Income tax
10
(23,007 )
(1,237 )
(7,441 )
Net income/(loss)
(5,496 )
Attributable to equity holders of the company
(5,510 )
Attributable to non-controlling interests
Basic earnings per share (in USD)
(1.69 )
Diluted earnings per share (in USD)
(1.69 )
Weighted average number of ordinary shares outstanding (in millions)
Weighted average number of ordinary shares outstanding, diluted (in millions)
208 Equinor, Annual Report on Form 20-F 2021
CONSOLIDATED STATEMENT OF COMPREHENSIVE INCOME
Full year
(in USD million)
Note
2021
2020
2019
Net income/(loss)
(5,496 )
Actuarial gains/(losses) on defined benefit pension plans
(106 )
Income tax effect on income and expenses recognised in OCI
1)
(35 )
(98 )
Items that will not be reclassified to the Consolidated statement of income
20
(87 )
Foreign currency translation effects
(1,052 )
(51 )
Share of OCI from equity accounted investments
Items that may subsequently be reclassified to the Consolidated statement of income
(1,052 )
(7 )
Other comprehensive income/(loss)
(940 )
Total comprehensive income/(loss)
(4,519 )
Attributable to the equity holders of the company
(4,533 )
Attributable to non-controlling interests
1) Other Comprehensive Income (OCI).
Equinor, Annual Report on Form 20-F 2021 209
CONSOLIDATED BALANCE SHEET
At 1 January
(in USD million)
Note
2021
2020
2020
ASSETS
Property, plant and equipment
1)
11, 23
Intangible assets
12
Equity accounted investments
13
Deferred tax assets
10
Pension assets
20
Derivative financial instruments
26
Financial investments
14
Prepayments and financial receivables
14
Total non-current assets
Inventories
15
Trade and other receivables
16
Derivative financial instruments
26
Financial investments
14
Cash and cash equivalents
17
Total current assets
Assets classified as held for sale
5
Total assets
EQUITY AND LIABILITIES
Shareholders’ equity
Non-controlling interests
Total equity
18
Finance debt
19
Lease liabilities
23
Deferred tax liabilities
10
Pension liabilities
20
Provisions and other liabilities
1)
21
Derivative financial instruments
26
Total non-current liabilities
Trade, other payables and provisions
22
Current tax payable
Finance debt
19
Lease liabilities
23
Dividends payable
18
Derivative financial instruments
26
Total current liabilities
Liabilities directly associated with the assets classified as held for sale
5
Total liabilities
Total equity and liabilities
1) Restated 1 January 2020 and 31 December 2020 figures due to a policy change affecting ARO, see note 2 Significant accounting policies
and note 21 Provisions and other liabilities.
210 Equinor, Annual Report on Form 20-F 2021
CONSOLIDATED STATEMENT OF CHANGES IN EQUITY
(in USD million)
Share
capital
Additional
paid-in
capital
Retained
earnings
Foreign
currency
translation
reserve
OCI from equity
accounted
investments
Shareholders'
equity
Non-
controlling
interests
Total equity
At 1 January 2019
(5,206 )
(44 )
Net income/(loss)
Other comprehensive income/(loss)
(51 )
Total comprehensive income/(loss)
Dividends
(3,453 )
(3,453 )
(3,453 )
Share buy-back
(500 )
(500 )
(500 )
Other equity transactions
(15 )
(29 )
(44 )
(7 )
(52 )
At 31 December 2019
(5,258 )
Net income/(loss)
(5,510 )
(5,510 )
(5,496 )
Other comprehensive income/(loss)
(87 )
Total comprehensive income/(loss)
(4,519 )
Dividends
(1,833 )
(1,833 )
(1,833 )
Share buy-back
(21 )
(869 )
(890 )
(890 )
Other equity transactions
(11 )
(11 )
(15 )
(25 )
At 31 December 2020
(4,194 )
Net income/(loss)
Other comprehensive income/(loss)
(1,052 )
(940 )
(940 )
Total comprehensive income/(loss)
Dividends
(2,041 )
(2,041 )
(2,041 )
Share buy-back
(429 )
(429 )
(429 )
Other equity transactions
(15 )
(15 )
(18 )
(33 )
At 31 December 2021
(5,245 )
Refer to note 18 Shareholders’ equity and dividends.
Equinor, Annual Report on Form 20-F 2021 211
CONSOLIDATED STATEMENT OF CASH FLOWS
Full year
(in USD million)
Note
2021
2020
2019
Income/(loss) before tax
(4,259 )
Depreciation, amortisation and net impairment losses
11,12
Exploration expenditures written off
12
(Gains)/losses on foreign currency transactions and balances
(47 )
(224 )
(Gains)/losses on sale of assets and businesses
5
(1,519 )
(1,187 )
(Increase)/decrease in other items related to operating activities
1)
(Increase)/decrease in net derivative financial instruments
26
(451 )
(595 )
Interest received
Interest paid
(698 )
(730 )
(723 )
Cash flows provided by operating activities before taxes paid and working capital items
Taxes paid
(8,588 )
(3,134 )
(8,286 )
(Increase)/decrease in working capital
(4,546 )
(524 )
Cash flows provided by operating activities
Cash used in business combinations
2)
5
(111 )
(2,274 )
Capital expenditures and investments
(8,040 )
(8,476 )
(10,204 )
(Increase)/decrease in financial investments
3)
(9,951 )
(3,703 )
(1,012 )
(Increase)/decrease in derivative financial instruments
(1 )
(620 )
(Increase)/decrease in other interest bearing items
(10 )
Proceeds from sale of assets and businesses
5
Cash flows used in investing activities
(16,211 )
(12,092 )
(10,594 )
New finance debt
19
Repayment of finance debt
4)
19
(2,675 )
(2,055 )
(1,314 )
Repayment of lease liabilities
4)
23
(1,238 )
(1,277 )
(1,104 )
Dividends paid
18
(1,797 )
(2,330 )
(3,342 )
Share buy-back
18
(321 )
(1,059 )
(442 )
Net current finance debt and other financing activities
(277 )
Cash flows provided by/(used in) financing activities
19
(4,836 )
(5,496 )
Net increase/(decrease) in cash and cash equivalents
(2,341 )
Foreign currency translation effects
(538 )
(38 )
Cash and cash equivalents at the beginning of the period (net of overdraft)
17
Cash and cash equivalents at the end of the period (net of overdraft)
5)
17
1)
Full year 2021 includes redetermination settlement for the Agbami field. For more information, see note 24 Other commitments, contingent
liabilities and contingent assets.
2)
Net after cash and cash equivalents acquired.
3)
Includes sale of Lundin shares in 2020.
4)
Repayment of lease liabilities are separated from the line item Repayment of finance debt and 2019 and 2020 has been reclassified.
5)
At 31 December 2021 cash and cash equivalents included a net overdraft of USD
cash equivalents net overdraft were
.
Interest paid
in cash flows provided by operating activities excludes capitalised interest of USD
million for the years ending 31 December 2021, 2020 and 2019, respectively. Capitalised interest is included in Capital expenditures and
investments in cash flows used in investing activities. Total interest paid are USD
the years 2021, 2020 and 2019, respectively.
212 Equinor, Annual Report on Form 20-F 2021
Notes to the Consolidated financial statements
1 Organisation
, originally Den Norske Stats Oljeselskap AS, was founded in 1972 and is incorporated and domiciled in
. The
address of its registered office is
.
Equinor ASA’s shares are listed on the Oslo Børs (OSL, Norway) and the New York Stock Exchange (NYSE, USA).
All the Equinor group's oil and gas activities and net assets on the Norwegian continental shelf are owned by Equinor Energy AS, a
100% owned operating subsidiary. Equinor Energy AS is co-obligor or guarantor of certain debt obligations of Equinor ASA.
The Consolidated financial statements of Equinor for the full year 2021 were authorised for issue in accordance with a resolution of
the board of directors on 8 March 2022.
2 Significant accounting policies
Statement of compliance
The Consolidated financial statements of Equinor ASA and its subsidiaries (Equinor) have been prepared in accordance with
International Financial Reporting Standards (IFRSs) as adopted by the European Union (EU) and with IFRSs as issued by the
International Accounting Standards Board (IASB), effective at 31 December 2021.
Basis of preparation
The financial statements are prepared on the historical cost basis with some exceptions, as detailed in the accounting policies set out
below. The policies described in this note are, unless otherwise noted, in effect at the balance sheet date. These policies have been
applied consistently to all periods presented in these Consolidated financial statements, except as otherwise noted in disclosure
related to the impact of policy changes following the adoption of new accounting standards and voluntary changes in 2021. Certain
amounts in the comparable years have been restated or reclassified to conform to current year presentation. The subtotals and totals
in some of the tables in the notes may not equal the sum of the amounts shown in the primary financial statements due to rounding.
Operating related expenses in the Consolidated statement of income are presented as a combination of function and nature in
conformity with industry practice. Purchases [net of inventory variation] and Depreciation, amortisation and net impairment losses are
presented in separate lines based on their nature, while Operating expenses and Selling, general and administrative expenses as well
as Exploration expenses are presented on a functional basis. Significant expenses such as salaries, pensions, etc. are presented by
their nature in the notes to the Consolidated financial statements.
Changes in significant accounting policies in the current period
Interest rate benchmark reform - amendments to IFRS 9, IAS 39, IFRS 7, IFRS 4 and IFRS 16
Following the decision taken by global regulators to replace Interbank Offered Rates (IBORs) with alternative nearly risk-free rates
(RFRs), IASB released two publications addressing issues affecting financial reporting in the period before the replacement of an
existing interest rate benchmark with an RFR (phase one), and issues that affect financial reporting when an existing interest rate
benchmark is replaced with an RFR (phase two), typically modifications to contracts as a result of the reform. The amendments
provide specific guidance on how to treat financial assets and financial liabilities where the basis for determining the contractual cash
flows changes as a result of the interest rate benchmark reform. As a practical expedient, the amendments require an entity to change
the basis for determining the contractual cash flows prospectively by revising the effective interest rate. Had the expedient not existed,
the financial instrument should be derecognised by such a contractual change, or, if the modification was insubstantial, the carrying
value of the financial instrument recalculated and the adjustment recognised as a profit/loss.
The phase one amendments were effective from 1 January 2020 and the phase two amendments were effective for annual periods
beginning on or after 1 January 2021. Equinor has applied the amendments at the effective dates.
For Equinor, the transition is relevant for issued bonds with floating interest rates, terms of conditions for bank accounts, project
financing, legal contracts and joint venture cash calls as well as for derivatives. In collaboration with our counterparties, Equinor is in
the process of replacing contracts which include references to IBORs with new contracts with references to RFRs. Currently, the IBOR
Equinor, Annual Report on Form 20-F 2021 213
reform mainly implies an administrative burden and no material financial impact from the reform is expected. Equinor’s risk
management strategy has not changed to a significant degree following the IBOR reform.
Other standards, amendments to standards and interpretations of standards, effective as of 1 January 2021
Other standard amendments or interpretations of standards effective as of 1 January 2021 and adopted by Equinor, were not material
to Equinor’s Consolidated financial statements upon adoption.
Voluntary change in significant accounting policy related to discount rate for Asset Retirement Obligation (ARO) calculation
With effect from 1 October 2021, Equinor changed its discount rate used in calculation of the ARO so that it no longer includes an
element covering Equinor’s own credit risk. This voluntary accounting policy change is made because the credit element’s exclusion
from the discount rate in estimating the ARO liability is deemed to better represent the risks specific to the ARO liability. The change
affects the amounts of ARO liabilities and the ARO elements of property, plant and equipment materially, and prior periods’ balance
sheet amounts in this respect have been restated, see further details in Note 21. The policy change will impact future depreciation
expenses as well as potential asset impairments or impairment reversals. The impact on relevant lines in the income statement and
on equity upon implementation of the voluntary policy change are immaterial. Prior period income statements and statements of
changes in equity have not been restated.
Other standards, amendments to standards and interpretations of standards, issued but not yet effective
Amendment to IAS 1 and Materiality practice statement 2: Replacing ‘Significant accounting policies’ with ‘Material
accounting policies’
IASB has issued an amendment to IAS 1 Presentation of financial statements and the IFRS Practice Statement 2 ‘Making Materiality
Judgement’. These amendments are intended to help entities provide more useful accounting policy disclosures by replacing the term
‘Significant’ with the term ‘Material’ and by providing additional guidance as to what is considered a ‘material accounting policy’. When
implementing the amendment, even though some additions to the disclosures may be introduced to present an even more Equinor-
specific accounting policy note, the note is expected to be somewhat reduced in scope, disclosing only those accounting policies that
are deemed needed to understand other material information in the financial statements of Equinor.
The amendments become effective for annual periods beginning on or after 1 January 2023, but earlier application is permitted.
Equinor expects to apply the amendments from the effective date.
Other standards, amendments to standards, and interpretations of standards, issued but not yet effective, are either not expected to
materially impact Equinor’s Consolidated financial statements, or are not expected to be relevant to Equinor's Consolidated financial
statements upon adoption.
Key sources of estimation uncertainty
The preparation of the Consolidated financial statements requires that management makes estimates and assumptions that affect
reported amounts of assets, liabilities, income and expenses. The estimates are prepared based on tailormade models, while the
assumptions on which the estimates are based rely on historical experience, external sources of information and various other factors
that management assesses to be reasonable under the current conditions and circumstances. These estimates and assumptions form
the basis of making the judgements about carrying values of assets and liabilities when these are not readily apparent from other
sources. Actual results may differ from these estimates. The estimates and underlying assumptions are reviewed on an on-going
basis considering the current and expected future set of conditions.
Equinor is exposed to a number of underlying economic factors which affect the overall results, such as liquids prices, natural gas
prices, refining margins, foreign currency exchange rates, market risk premiums and interest rates as well as financial instruments
with fair values derived from changes in these factors. In addition, Equinor's results are influenced by the level of production, which in
the short term may be influenced by, for instance, maintenance programmes. In the long-term, the results are impacted by the
success of exploration, field development and operating activities.
The most important matters in understanding the key sources of estimation uncertainty that are involved in preparing these
Consolidated financial statements are disclosed in the following under each paragraph, where relevant
Estimation uncertainty from initiatives to limit climate changes and the energy transition
The effects of the initiatives to limit climate changes and the potential impact of the energy transition are relevant to some of the
economic assumptions in our estimations of future cash flow. The results the development of such initiatives may have in the future,
and the degree Equinor’s operations will be affected by them, are sources of uncertainty. Estimating global energy demand and
commodity prices towards 2050 is a challenging task, assessing the future development in supply and demand, technology change,
taxation, tax on emissions, production limits and other important factors. The assumptions may change which could materialise in
different outcomes from the current projected scenarios. This could result in significant changes to accounting estimates, such as
economic useful life (affects depreciation period and timing of asset retirement obligations) and value-in-use calculations (affects
impairment assessments). See note 3 Consequences of initiatives to limit climate changes for more details.
214 Equinor, Annual Report on Form 20-F 2021
Statement of cash flows
In the statement of cash flows, operating activities are presented using the indirect method, where Income/(loss) before tax is adjusted
for changes in inventories and operating receivables and payables, the effects of non-cash items such as depreciations, amortisations
and impairments, provisions, unrealised gains and losses and undistributed profits from associates and items of income or expense
for which the cash effects are investing or financing cash flows. Increase/decrease in financial investments, Increase/decrease in
derivative financial instruments and Increase/decrease in other interest-bearing items are all presented net as part of Investing
activities, either because the transactions are financial investments and turnover is quick, the amounts are large, and the maturities
are short, or due to materiality.
Basis of consolidation
The Consolidated financial statements include the accounts of Equinor ASA and its subsidiaries and include Equinor’s interest in
jointly controlled and equity accounted investments.
Subsidiaries
Entities are determined to be controlled by Equinor, and consolidated in Equinor's financial statements, when Equinor has power over
the entity, ability to use that power to affect the entity's returns, and exposure to, or rights to, variable returns from its involvement with
the entity.
All intercompany balances and transactions, including unrealised profits and losses arising from Equinor's internal transactions, have
been eliminated.
Non-controlling interests are presented separately within equity in the Consolidated balance sheet.
When partially divesting subsidiaries which do not constitute a business, and the investment is reclassified to an associate or a jointly
controlled investment, Equinor only recognises the gain or loss on the divested part.
Accounting judgement regarding partial divestments
The policy regarding partial divestments of subsidiaries requires judgement to be applied on a case-by-case basis and has had a
substantial impact on the accounting for the divestment of Equinor’s non-operated interests in the Empire Wind and Beacon Wind
assets, which took effect in 2021 and are further described in Note 5 Acquisitions and Disposals. Equinor reflected on the
requirements and scope of IFRS 10 Consolidated Financial Statements and IAS 28 Investments in Associates and Joint Ventures, as
well as the substance of the transactions. In evaluating the standards’ requirements, Equinor acknowledged pending considerations
related to several relevant and similar issues which have been postponed by the IASB in anticipation of concurrent consideration at a
later date and considered the facts and substance of the transactions in question as well as Equinor’s subsequent involvement. Since
assets were transferred into separate legal entities only at the time when 50% of the entities’ shares were sold to a third party, thereby
resulting in Equinor’s loss of control of those asset-owning subsidiaries, and simultaneously established investments in joint ventures,
Equinor concluded to only recognise the gain on the divested part.
Joint operations and similar arrangements, joint ventures and associates
A joint arrangement is present where Equinor holds a long-term interest which is jointly controlled by Equinor and one or more other
partners under a contractual arrangement in which decisions about the relevant activities require the unanimous consent of the parties
sharing control. Such joint arrangements are classified as either joint operations or joint ventures.
The parties to a joint operation have rights to the assets and obligations for the liabilities, relating to their respective share of the joint
arrangement. In determining whether the terms of contractual arrangements and other facts and circumstances lead to a classification
as joint operations, Equinor considers the nature of products and markets of the arrangements and whether the substance of their
agreements is that the parties involved have rights to substantially all the arrangement's assets. Equinor accounts for its share of
assets, liabilities, revenues and expenses in joint operations in accordance with the principles applicable to those particular assets,
liabilities, revenues and expenses.
Equinor, Annual Report on Form 20-F 2021 215
Acquisition of ownership shares in joint ventures and other equity accounted investments in which the activity constitutes a business,
are accounted for in accordance with the requirements applicable to business combinations.
Those of Equinor's exploration and production licence activities that are within the scope of IFRS 11 Joint Arrangements have been
classified as joint operations. A considerable number of Equinor's unincorporated joint exploration and production activities are
conducted through arrangements that are not jointly controlled, either because unanimous consent is not required among all parties
involved, or no single group of parties has joint control over the activity. Licence activities where control can be achieved through
agreement between more than one combination of involved parties are considered to be outside the scope of IFRS 11, and these
activities are accounted for on a pro-rata basis using Equinor's ownership share. Currently there are no significant differences in
Equinor's accounting for unincorporated licence arrangements whether in scope of IFRS 11 or not.
Joint ventures, in which Equinor has rights to the net assets, are accounted for using the equity method. These currently include the
majority of Equinor’s investments in the Renewables (REN) operating and reporting segment.
Equinor’s participation in joint arrangements that are joint ventures and investments in companies in which Equinor has neither control
nor joint control but has the ability to exercise significant influence over operating and financial policies, are classified as equity
accounted investments. Under the equity method, the investment is carried on the Consolidated balance sheet at cost plus post-
acquisition changes in Equinor’s share of net assets of the entity, less distributions received and less any impairment in value of the
investment. The part of an equity accounted investment’s dividend distribution exceeding the entity’s carrying amount in the
Consolidated balance sheet is reflected as income from equity accounted investments in the Consolidated statement of income.
Equinor will subsequently only reflect the share of net profit in the investment that exceeds the dividend already reflected as income.
Goodwill may arise as the surplus of the cost of investment over Equinor’s share of the net fair value of the identifiable assets and
liabilities of the joint venture or associate. Such goodwill is recorded within the corresponding investment. The Consolidated statement
of income reflects Equinor’s share of the results after tax of an equity accounted entity, adjusted to account for depreciation,
amortisation and any impairment of the equity accounted entity’s assets based on their fair values at the date of acquisition. Net
income/loss from equity accounted investments is presented as part of Total revenues and other income, as investments in and
participation with significant influence in other companies engaged in energy-related business activities is considered to be part of
Equinor’s main operating activities. Where material differences in accounting policies arise, adjustments to the financial statements of
equity accounted entities are made in order to bring the accounting policies applied in line with Equinor’s. Material unrealised gains on
transactions between Equinor and its equity accounted entities are eliminated to the extent of Equinor’s interest in each equity
accounted entity. Unrealised losses are also eliminated unless the transaction provides evidence of an impairment of the asset
transferred. Equinor assesses investments in equity accounted entities for impairment whenever events or changes in circumstances
indicate that the carrying value may not be recoverable.
Equinor as operator of joint operations and similar arrangements
Indirect operating expenses such as personnel expenses are accumulated in cost pools. These costs are allocated on an hours’
incurred basis to business areas and Equinor operated joint operations under IFRS 11 and to similar arrangements (licences) outside
the scope of IFRS 11. Costs allocated to the other partners' share of operated joint operations and similar arrangements reduce the
costs in the Consolidated statement of income. Only Equinor's share of the statement of income and balance sheet items related to
Equinor-operated joint operations and similar arrangements are reflected in the Consolidated statement of income and the
Consolidated balance sheet. The accounting for lease contracts in joint operations or similar arrangements depends on whether or not
Equinor or all partners equally have the primary responsibility for the lease payments and is described in further detail in the
paragraph Leases below.
Reporting segments
Equinor identifies its operating segments (business areas) on the basis of those components of Equinor that are regularly reviewed by
the chief operating decision maker, Equinor's corporate executive committee (CEC). Equinor combines business areas when these
satisfy relevant aggregation criteria.
Equinor's accounting policies as described in this note also apply to the specific financial information included in reporting segments-
related disclosure in these Consolidated financial statements, with an exception for leases. Note 4 Segments includes further
information about lease accounting in the reporting segments.
Foreign currency translation
In preparing the financial statements of the individual entities, transactions in foreign currencies (those other than functional currency)
are translated at the foreign exchange rate at the dates of the transactions. Monetary assets and liabilities denominated in foreign
currencies are translated to the functional currency at the foreign exchange rate at the balance sheet date. Foreign exchange
differences arising on translation are recognised in the Consolidated statement of income as foreign exchange gains or losses within
Net financial items. Foreign exchange differences arising from the translation of estimate-based provisions, however, generally are
accounted for as part of the change in the underlying estimate and as such may be included within the relevant operating expense or
income tax sections of the Consolidated statement of income depending on the nature of the provision. Non-monetary assets that are
measured at historical cost in a foreign currency are translated using the exchange rate at the date of the transactions. Loans from
Equinor ASA to subsidiaries with other functional currencies than the parent company, and for which settlement is neither planned nor
216 Equinor, Annual Report on Form 20-F 2021
likely in the foreseeable future, are considered part of the parent company’s net investment in the subsidiary. Foreign exchange
differences arising on such loans are recognised in Other comprehensive income (OCI) in the Consolidated financial statements.
Presentation currency
For the purpose of preparing the Consolidated financial statements, the statement of income, the balance sheet and the cash flows of
each entity are translated from the functional currency into the presentation currency, USD. The assets and liabilities of entities whose
functional currencies are other than USD, are translated into USD at the foreign exchange rate at the balance sheet date. The
revenues and expenses of such entities are translated using the foreign exchange rates on the dates of the transactions. Foreign
exchange differences arising on translation from functional currency to presentation currency are recognised separately in OCI. The
cumulative amount of such translation differences relating to an entity and previously recognised in OCI, is reclassified to the
Consolidated statement of income and reflected as a part of the gain or loss on disposal of that entity.
Business combinations
Business combinations, except for transactions between entities under common control, are accounted for using the acquisition
method of accounting. The acquired identifiable tangible and intangible assets, liabilities and contingent liabilities are measured at
their fair values at the date of the acquisition. Acquisition costs incurred are expensed under Selling, general and administrative
expenses.
Accounting judgement regarding acquisitions
Determining whether an acquisition meets the definition of a business combination requires judgement to be applied on a case-by-
case basis. Acquisitions are assessed under the relevant IFRS criteria to establish whether the transaction represents a business
combination or an asset purchase, and the conclusion may materially affect the financial statements both in the transaction period and
in terms of future periods’ operating income. Similar assessments are performed upon the acquisition of interests in a joint operation
to determine whether the activity in the joint operation constitutes a business, and whether the principles of business acquisition
accounting therefore should be applied. The concentration test in IFRS 3 provide some clarification to the definition of a business, but
do not diminish the fact that critical judgements apply when deciding on whether a transaction is a business combination. Depending
on the specific facts, acquisitions of exploration and evaluation licences for which a development decision has not yet been made,
have largely been concluded to represent asset purchases.
Revenue recognition
Equinor presents Revenue from contracts with customers and Other revenue as a single caption, Revenues, in the Consolidated
statement of income.
Revenue from contracts with customers
Revenue from contracts with customers is recognised upon satisfaction of the performance obligations for the transfer of goods and
services in each such contract. The revenue amounts that are recognised reflect the consideration to which Equinor expects to be
entitled in exchange for those goods and services. Revenue from the sale of crude oil, natural gas, petroleum products and other
merchandise is recognised when a customer obtains control of those products, which normally is when title passes at point of delivery,
based on the contractual terms of the agreements. Each such sale normally represents a single performance obligation. In the case of
natural gas, sales are completed over time in line with the delivery of the actual physical quantities.
Sales and purchases of physical commodities are presented on a gross basis as Revenues from contracts with customers and
Purchases [net of inventory variation] respectively in the Consolidated statement of income. When the contracts are deemed financial
instruments or part of Equinor’s trading activities, they are settled and presented on a net basis. Sales of Equinor’s own produced oil
and gas volumes are always reflected gross as Revenue from contracts with customers.
Revenues from the production of oil and gas in which Equinor shares an interest with other companies are recognised on the basis of
volumes lifted and sold to customers during the period (the sales method). Where Equinor has lifted and sold more than the
ownership interest, an accrual is recognised for the cost of the overlift. Where Equinor has lifted and sold less than the ownership
interest, costs are deferred for the underlift.
Revenue is presented net of customs, excise taxes and royalties paid in-kind on petroleum products.
Other revenue
Items representing a form of revenue, or which are closely connected with revenue from contracts with customers, are presented as
Other revenue if they do not qualify as revenue from contracts with customers. These other revenue items include taxes paid in-kind
under certain production sharing agreements (PSAs) and the net impact of commodity trading and commodity-based derivative
instruments connected with sales contracts or revenue-related risk management.
Equinor, Annual Report on Form 20-F 2021 217
Transactions with the Norwegian State
Equinor markets and sells the Norwegian State's share of oil and gas production from the Norwegian continental shelf (NCS). The
Norwegian State's participation in petroleum activities is organised through the SDFI. All purchases and sales of the SDFI's oil
production are classified as purchases [net of inventory variation] and revenues from contracts with customers, respectively.
Equinor sells, in its own name, but for the Norwegian State's account and risk, the State's production of natural gas. These gas sales
and related expenditures refunded by the Norwegian State are presented net in the Consolidated financial statements. Natural gas
sales made in the name of Equinor subsidiaries are also presented net of the SDFI’s share in the Consolidated statement of income,
but this activity is reflected gross in the Consolidated balance sheet.
Accounting judgement related to transactions with the Norwegian State
Whether to account for the transactions gross or net involves the use of significant accounting judgement. In making the judgement,
Equinor has considered whether it controls the State originated crude oil volumes prior to onwards sales to third party customers.
Equinor directs the use of the volumes, and although certain benefits from the sales subsequently flow to the State, Equinor
purchases the crude oil volumes from the State and obtains substantially all the remaining benefits. On that basis, Equinor has
concluded that it acts as principal in these sales.
Regarding gas sales, Equinor concluded that ownership of the gas had not been transferred from the SDFI to Equinor. Although
Equinor has been granted the ability to direct the use of the volumes, all the benefits from the sales of these volumes flow to the State.
On that basis, Equinor is not considered the principal in the sale of the SDFI’s natural gas volumes
Employee benefits
Wages, salaries, bonuses, social security contributions, paid annual leave and sick leave are accrued in the period in which the
associated services are rendered by employees of Equinor.
Research and development
Equinor undertakes research and development both on a funded basis for licence holders and on an unfunded basis for projects at its
own risk. Equinor's own share of the licence holders' funding and the total costs of the unfunded projects are considered for
capitalisation under the applicable IFRS requirements. Subsequent to initial recognition, any capitalised development costs are
reported at cost less accumulated amortisation and accumulated impairment losses.
Levies, emission allowances and other government takes
CO2 free quotas received under the EU Emissions Trading System (EU ETS) are reflected evenly over the accounting year.
Additional quotas purchased are reflected at cost in Operating expenses as incurred in line with emissions. Accruals for CO2 quotas
required to cover emissions to date are valued at market price and reflected as a current liability within Trade, other payables and
provisions. Quotas owned, but exceeding the emissions incurred to date, are carried in the balance sheet at cost price, classified as
Other current receivables, as long as such purchased quotas are acquired in order to cover own emissions and may be kept to cover
subsequent years’ emissions.
Obligations resulting from current year emissions and the corresponding amounts for quotas that have been bought, paid and
expensed, but which have not yet been surrendered to the relevant authorities, are reflected net in the balance sheet.
Estimation uncertainty regarding levies
Equinor’s global business activities are subject to different indirect taxes in various jurisdictions around the world. In these
jurisdictions, governments can respond to global or local development, including climate related matters and public fiscal balances, by
issuing new laws or other regulations stipulating changes in value added tax, tax on emissions, customs duties or other levies which
may affect profitability and even the viability of Equinor’s business in that jurisdiction. Equinor mitigates this risk by using local legal
representatives and staying up to date with the legislation in the jurisdictions where activities are carried out. Occasionally, legal
disputes arise from difference in interpretations. Equinor’s legal department, together with local legal representatives, estimate the
outcome from such legal disputes based on first-hand knowledge. Such estimates may differ from the actual results. We refer to note
24 Other commitments, contingent liabilities and contingent assets for a presentation of contingent liabilities arising from such legal
proceedings.
218 Equinor, Annual Report on Form 20-F 2021
Income tax
Income tax in the Consolidated statement of income comprises current and deferred tax expense. Income tax is recognised in the
Consolidated statement of income except when it relates to items recognised in OCI.
Current tax consists of the expected tax payable on the taxable income for the year and any adjustment to tax payable for previous
years. Uncertain tax positions and potential tax exposures are analysed individually, and as tax disputes are mostly binary in nature,
the most likely amount for probable liabilities to be paid (unpaid potential tax exposure amounts, including penalties) and for assets to
be received (disputed tax positions for which payment has already been made) in each case is recognised within Current tax or
Deferred tax as appropriate. Interest income and interest expenses relating to tax issues are estimated and recognised in the period in
which they are earned or incurred and are presented within Net financial items in the Consolidated statement of income. Uplift benefit
on the NCS is recognised when the deduction is included in the current year tax return and impacts taxes payable.
Deferred tax assets and liabilities are recognised for the future tax consequences attributable to differences between the carrying
amounts of existing assets and liabilities and their respective tax bases, and on unused tax losses and credits carried forward, subject
to the initial recognition exemption. The amount of deferred tax is based on the expected manner of realisation or settlement of the
carrying amount of assets and liabilities, using tax rates enacted or substantively enacted at the balance sheet date. A deferred tax
asset is recognised only to the extent that it is probable that future taxable income will be available against which the asset can be
utilised. In order for a deferred tax asset to be recognised based on future taxable income, convincing evidence is required, taking into
account the existence of contracts, production of oil or gas in the near future based on volumes of proved reserves, observable prices
in active markets, expected volatility of trading profits, expected foreign currency rate movements and similar facts and circumstances.
When an asset retirement obligation or a lease contract is initially reflected in the accounts, a deferred tax liability and a corresponding
deferred tax asset are recognised simultaneously and accounted for in line with other deferred tax items. The applied policy is in line
with an amendment to IAS 12, reducing the scope of the initial recognition exemption, which is effective from 1 January 2023.
Estimation uncertainty regarding income tax
Every year Equinor incurs significant amounts of income taxes payable to various jurisdictions around the world and may recognise
significant changes to deferred tax assets and deferred tax liabilities. There may be uncertainties related to interpretations of
applicable tax laws and regulations regarding amounts in Equinor’s tax returns, which are filed in a considerable number of tax
regimes. For cases of uncertain tax treatments, it may take several years to complete the discussions with relevant tax authorities or
to reach resolutions of the appropriate tax positions through litigation.
The carrying values of income tax related assets and liabilities are based on Equinor's interpretations of applicable laws, regulations
and relevant court decisions. The quality of these estimates, including the most likely outcomes of uncertain tax treatments, is highly
dependent upon proper application of at times very complex sets of rules, the recognition of changes in applicable rules and, in the
case of deferred tax assets, management's ability to project future earnings from activities that may apply loss carry forward positions
against future income taxes.
The Covid-19 pandemic has increased the uncertainty in determining key business assumptions used to assess the recoverability of
deferred tax assets through sufficient future taxable income before tax losses expire. Climate-related matters and the transition to
carbon-neutral energy-consumption globally could also influence Equinor’s future taxable profits, and ability to utilise tax losses
carried forward and the recognition of deferred tax assets in certain tax jurisdictions
Oil and gas exploration, evaluation and development expenditures
Equinor uses the successful efforts method of accounting for oil and gas exploration costs. Expenditures to acquire mineral interests
in oil and gas properties and to drill and equip exploratory wells are capitalised as exploration and evaluation expenditures within
intangible assets until the well is complete and the results have been evaluated, or there is any other indicator of a potential
impairment. Exploration wells that discover potentially economic quantities of oil and natural gas remain capitalised as intangible
assets during the evaluation phase of the discovery. This evaluation is normally finalised within one year after well completion. If,
following the evaluation, the exploratory well has not found potentially commercial quantities of hydrocarbons, the previously
capitalised costs are evaluated for derecognition or tested for impairment. Geological and geophysical costs and other exploration and
evaluation expenditures are expensed as incurred.
Capitalised exploration and evaluation expenditures, including expenditures to acquire mineral interests in oil and gas properties
related to offshore wells that find proved reserves, are transferred from Exploration expenditures and Acquisition costs - oil and gas
prospects (Intangible assets) to Property, plant and equipment at the time of sanctioning of the development project. The timing from
evaluation of a discovery until a project is sanctioned could take several years depending on the location and maturity, including
existing infrastructure, of the area of discovery, whether a host government agreement is in place, the complexity of the project and
the financial robustness of the project. For onshore wells where no sanction is required, the transfer from Exploration expenditures
and Acquisition cost – oil and gas prospects (Intangible assets) to Property, plant and equipment occurs at the time when a well is
ready for production.
Equinor, Annual Report on Form 20-F 2021 219
For exploration and evaluation asset acquisitions (farm-in arrangements) in which Equinor has made arrangements to fund a portion
of the selling partner's exploration and/or future development expenditures (carried interests), these expenditures are reflected in the
Consolidated financial statements as and when the exploration and development work progresses. Equinor reflects exploration and
evaluation asset dispositions (farm-out arrangements) on a historical cost basis with no gain or loss recognition.
A gain related to a post-tax-based disposition of assets on the NCS includes the release of tax liabilities previously computed and
recognised related to the assets in question. The resulting after-tax gain is recognised in full in Other income in the Consolidated
statement of income.
Consideration from the sale of an undeveloped part of an onshore asset reduces the carrying amount of the asset. The part of the
consideration that exceeds the carrying amount of the asset, if any, is reflected in the Consolidated statement of income under Other
income.
Even exchanges (swaps) of exploration and evaluation assets with only immaterial cash considerations are accounted for at the
carrying amounts of the assets given up with no gain or loss recognition.
Accounting judgement and estimation uncertainty regarding exploration activities
Equinor capitalises the costs of drilling exploratory wells pending determination of whether the wells have found proved oil and gas
reserves. Equinor also capitalises leasehold acquisition costs and signature bonuses paid to obtain access to undeveloped oil and
gas acreage. Judgements as to whether these expenditures should remain capitalised, be de-recognised or written down in the period
may materially affect the carrying values of these assets and consequently, the operating income for the period.
Property, plant and equipment
Property, plant and equipment is reflected at cost, less accumulated depreciation and accumulated impairment losses. The initial cost
of an asset comprises its purchase price or construction cost, any costs directly attributable to bringing the asset into operation, the
initial estimate of an asset retirement obligation, if any, exploration costs transferred from intangible assets and, for qualifying assets,
borrowing costs. Proceeds from production ahead of a project’s final approval are regarded as ‘early production’ and is recognised as
revenue rather than as a reduction of acquisition cost. Contingent consideration included in the acquisition of an asset or group of
similar assets is initially measured at its fair value, with later changes in fair value other than due to the passage of time reflected in
the book value of the asset or group of assets, unless the asset is impaired. Property, plant and equipment include costs relating to
expenditures incurred under the terms of PSAs in certain countries, and which qualify for recognition as assets of Equinor. State-
owned entities in the respective countries, however, normally hold the legal title to such PSA-based property, plant and equipment.
Exchanges of assets are measured at fair value, primarily of the asset given up, unless the fair value of neither the asset received, nor
the asset given up is measurable with sufficient reliability.
Expenditure on major maintenance refits or repairs comprises the cost of replacement assets or parts of assets, inspection costs and
overhaul costs. Where an asset or part of an asset is replaced and it is probable that future economic benefits associated with the
item will flow to Equinor, the expenditure is capitalised. Inspection and overhaul costs, associated with regularly scheduled major
maintenance programmes planned and carried out at recurring intervals exceeding one year, are capitalised and amortised over the
period to the next scheduled inspection and overhaul. All other maintenance costs are expensed as incurred.
Capitalised exploration and evaluation expenditures, development expenditure on the construction, installation or completion of
infrastructure facilities such as platforms, pipelines and the drilling of production wells, and field-dedicated transport systems for oil
and gas are capitalised as Producing oil and gas properties within Property, plant and equipment. Such capitalised costs, when
designed for significantly larger volumes than the reserves from already developed and producing wells, are depreciated using the
unit of production method based on proved reserves expected to be recovered from the area during the concession or contract period.
Depreciation of production wells uses the unit of production method based on proved developed reserves, and capitalised acquisition
costs of proved properties are depreciated using the unit of production method based on total proved reserves. In the rare
circumstances where the use of proved reserves fails to provide an appropriate basis reflecting the pattern in which the asset’s future
economic benefits are expected to be consumed, a more appropriate reserve estimate is used. Depreciation of other assets and
transport systems used by several fields is calculated on the basis of their estimated useful lives, normally using the straight-line
method. Each part of an item of property, plant and equipment with a cost that is significant in relation to the total cost of the item is
depreciated separately. For exploration and production assets, Equinor has established separate depreciation categories which as a
minimum distinguish between platforms, pipelines and wells.
The estimated useful lives of property, plant and equipment are reviewed on an annual basis, and changes in useful lives are
accounted for prospectively. An item of property, plant and equipment is de-recognised upon disposal or when no future economic
benefits are expected to arise from the continued use of the asset. Any gain or loss arising on derecognition of the asset (calculated
as the difference between the net disposal proceeds and the carrying amount of the item) is included in Other income or Operating
expenses, respectively, in the period the item is derecognised.
220 Equinor, Annual Report on Form 20-F 2021
Monetary or non-monetary grants from governments, when related to property, plant and equipment and considered reasonably
certain, are recognised in the Consolidated balance sheet as a deduction to the carrying value of the asset and subsequently
recognised in the Consolidated statement of income over the life of the depreciable asset as a reduced depreciation expense.
Estimation uncertainty regarding determining oil and gas reserves
Reserves estimates are complex and based on a high degree of professional judgement involving geological and engineering
assessments of in-place hydrocarbon volumes, the production, historical recovery and processing yield factors and installed plant
operating capacity. Recoverable oil and gas quantities are always uncertain. The reliability of these estimates at any point in time
depends on both the quality and availability of the technical and economic data and the efficiency of extracting and processing the
hydrocarbons. Reserves quantities are, by definition, discovered, remaining, recoverable and economic.
Estimation uncertainty; Proved oil and gas reserves
Proved oil and gas reserves may impact the carrying amounts of oil and gas producing assets, as changes in the proved reserves, for
instance as a result of changes in prices, will impact the unit of production rates used for depreciation and amortisation. Proved oil and
gas reserves are those quantities of oil and gas, which, by analysis of geoscience and engineering data, can be estimated with
reasonable certainty to be economically producible from a given date forward, from known reservoirs, and under existing economic
conditions, operating methods and government regulations. Unless evidence indicates that renewal is reasonably certain, estimates of
proved reserves only reflect the period before the contracts providing the right to operate expire. For future development projects,
proved reserves estimates are included only where there is a significant commitment to project funding and execution and when
relevant governmental and regulatory approvals have been secured or are reasonably certain to be secured.
Proved reserves are divided into proved developed and proved undeveloped reserves. Proved developed reserves are to be
recovered through existing wells with existing equipment and operating methods, or where the cost of the required equipment is
relatively minor compared to the cost of a new well. Proved undeveloped reserves are to be recovered from new wells on undrilled
acreage, or from existing wells where a relatively major capital expenditure is required for recompletion. Undrilled well locations can
be classified as having proved undeveloped reserves if a development plan is in place indicating that they are scheduled to be drilled
within five years, unless specific circumstances justify a longer time horizon. Specific circumstances are for instance fields which have
large up-front investments in offshore infrastructure, such as many fields on the NCS, where drilling of wells is scheduled to continue
for much longer than five years. For unconventional reservoirs where continued drilling of new wells is a major part of the investments,
such as the US onshore assets, the proved reserves are always limited to proved well locations scheduled to be drilled within five
years.
Proved oil and gas reserves have been estimated by internal qualified professionals on the basis of industry standards and are
governed by the oil and gas rules and disclosure requirements in the U.S. Securities and Exchange Commission (SEC) regulations S-
K and S-X, and the Financial Accounting Standards Board (FASB) requirements for supplemental oil and gas disclosures. The
estimates have been based on a 12-month average product price and on existing economic conditions and operating methods as
required, and recovery of the estimated quantities have a high degree of certainty (at least a 90% probability). An independent third
party has evaluated Equinor's proved reserves estimates, and the results of this evaluation do not differ materially from Equinor's
estimates.
Estimation uncertainty; Expected oil and gas reserves
Changes in the expected oil and gas reserves, for instance as a result of changes in prices, may materially impact the amounts of
asset retirement obligations, as a consequence of timing of the removal activities. It may also impact value-in-use calculations for oil
and gas assets, possibly also affecting impairment testing and the recognition of deferred tax assets. Expected oil and gas reserves
are the estimated remaining, commercially recoverable quantities, based on Equinor's judgement of future economic conditions, from
projects in operation or decided for development. Recoverable oil and gas quantities are always uncertain. As per Equinor’s internal
guidelines, expected reserves are defined as the ‘forward looking mean reserves’ when based on a stochastic prediction approach. In
some cases, a deterministic prediction method is used, in which case the expected reserves are the deterministic base case or best
estimate. Expected reserves are therefore typically larger than proved reserves as defined by the SEC, which are high confidence
estimates with at least a 90% probability of recovery when a probabilistic approach is used. Expected oil and gas reserves have been
estimated by internal qualified professionals on the basis of industry standards and classified in accordance with the Norwegian
resource classification system issued by the Norwegian Petroleum Directorate.
Equinor, Annual Report on Form 20-F 2021 221
Assets classified as held for sale
Non-current assets are classified separately as held for sale in the Consolidated balance sheet when their carrying amount will be
recovered through a sales transaction rather than through continuing use. This condition is met only when the sale is highly probable,
which is when the asset is available for immediate sale in its present condition, and management is committed to the sale, which
should be expected to qualify for recognition as a completed sale within one year from the date of classification. Liabilities directly
associated with the assets classified as held for sale and expected to be included as part of the sale transaction, are correspondingly
also classified separately. Once classified as held for sale, property, plant and equipment and intangible assets are not subject to
depreciation or amortisation. The net assets and liabilities of a disposal group classified as held for sale are measured at the lower of
their carrying amount and fair value less costs to sell.
Leases
A lease is defined as a contract that conveys the right to control the use of an identified asset for a period of time in exchange for
consideration. As a lessee, each contract that meets the definition of a lease is recognised in the Consolidated balance sheet. At the
date at which the underlying asset is made available for Equinor, the present value of future lease payments is recognised as a lease
liability. A corresponding right-of-use (RoU) asset is recognised, including also lease payments and direct costs incurred at or before
the commencement date. Future lease payments are reflected as interest expense and a reduction of lease liabilities. The RoU assets
are depreciated over the shorter of each contract’s term and the assets’ useful life.
The present value of fixed lease payments (or variable lease payments, if the payment depends on an index or a rate) is calculated
using the interest rate implicit in the lease, or if that rate cannot be readily determined, Equinor’s incremental borrowing rate, for the
non-cancellable period Equinor has the right to use the underlying asset. Extension options are included in the lease term if they are
considered reasonably certain to be exercised.
Short term leases (12 months or less) and leases of low value assets are not reflected in the Consolidated balance sheet but are
expensed or (if appropriate) capitalised as incurred, depending on the activity in which the leased asset is used.
Many of Equinor’s lease contracts, such as rig and vessel leases, involve several additional services and components, including
personnel cost, maintenance, drilling related activities, and other items. For a number of these contracts, the additional services
represent a not inconsiderable portion of the total contract value. Non-lease components within lease contracts are accounted for
separately for all underlying classes of assets and reflected in the relevant expense category or (if appropriate) capitalised as
incurred, depending on the activity involved.
Where all partners in a licence are considered to share the primary responsibility for lease payments under a contract, the related
lease liability and RoU asset will be recognised net by Equinor, on the basis of Equinor’s participation interest in the licence. When
Equinor is considered to have the primary responsibility for the full external lease payments, the lease liability is recognised gross
(100%). Equinor derecognises a portion of the RoU asset equal to the non-operator’s interests in the lease, and replace it with a
corresponding financial lease receivable, if a financial sublease is considered to exist between Equinor and the licence. A financial
sublease will typically exist where Equinor enters into a contract in its own name, has the primary responsibility for the external lease
payments, the underlying asset will only be used on one specific licence, and the costs and risks related to the use of the asset are
carried by that specific licence.
Accounting judgement regarding leases
In the oil and gas industry, where activity frequently is carried out through joint arrangements or similar arrangements, the application
of IFRS 16 requires evaluations of whether the joint arrangement or its operator is the lessee in each lease agreement and
consequently whether such contracts should be reflected gross (100%) in the operator’s financial statements, or according to each
joint operation partner’s proportionate share of the lease.
In many cases where an operator is the sole signatory to a lease contract of an asset to be used in the activities of a specific joint
operation, the operator does so implicitly or explicitly on behalf of the joint arrangement. In certain jurisdictions, and importantly for
Equinor as this includes the Norwegian continental shelf (NCS), the concessions granted by the authorities establish both a right and
an obligation for the operator to enter into necessary agreements in the name of the joint operations (licences).
As is the customary norm in upstream activities operated through joint arrangements, the operator will manage the lease, pay the
lessor, and subsequently re-bill the partners for their share of the lease costs. In each such instance, it is necessary to determine
whether the operator is the sole lessee in the external lease arrangement, and if so, whether the billings to partners may represent
sub-leases, or whether it is in fact the joint arrangement which is the lessee, with each participant accounting for its proportionate
share of the lease. Depending on facts and circumstances in each case, the conclusions reached may vary between contracts and
legal jurisdictions.
222 Equinor, Annual Report on Form 20-F 2021
Intangible assets including goodwill
Intangible assets are stated at cost, less accumulated amortisation and accumulated impairment losses. Intangible assets include
acquisition cost for oil and gas prospects, expenditures on the exploration for and evaluation of oil and natural gas resources, goodwill
and other intangible assets.
Intangible assets relating to expenditures on the exploration for and evaluation of oil and natural gas resources are not amortised.
When the decision to develop a particular area is made, its intangible exploration and evaluation assets are reclassified to Property,
plant and equipment.
Goodwill is initially measured at the excess of the aggregate of the consideration transferred and the amount recognised for any
noncontrolling interest over the fair value of the identifiable assets acquired and liabilities assumed in a business combination at the
acquisition date. Goodwill acquired is allocated to each cash generating unit (CGU), or group of units, expected to benefit from the
combination’s synergies. Following initial recognition, goodwill is measured at cost less any accumulated impairment losses. In
acquisitions made on a post-tax basis according to the rules on the NCS, a provision for deferred tax is reflected in the accounts
based on the difference between the acquisition cost and the transferred tax depreciation basis. The offsetting entry to such deferred
tax amounts is reflected as goodwill, which is allocated to the CGU or group of CGUs on whose tax depreciation basis the deferred tax
has been computed.
Other intangible assets with a finite useful life, are depreciated over their useful life using the straight-line method.
Financial assets
Financial assets are initially recognised at fair value when Equinor becomes a party to the contractual provisions of the asset. For
additional information on fair value methods, refer to the Measurement of fair values section below. The subsequent measurement of
the financial assets depends on which category they have been classified into at inception.
At initial recognition, Equinor classifies its financial assets into the following three categories: Financial investments at amortised cost,
at fair value through profit or loss, and at fair value through other comprehensive income based on an evaluation of the contractual
terms and the business model applied. Certain long-term investments in other entities, which do not qualify for the equity method or
consolidation, are included as at fair value through profit or loss.
Cash and cash equivalents include cash in hand, current balances with banks and similar institutions, and short-term highly liquid
investments that are readily convertible to known amounts of cash, are subject to an insignificant risk of changes in fair value and
have a maturity of three months or less from the acquisition date. Short-term highly liquid investments with original maturity exceeding
3 months are classified as current financial investments. Contractually mandatory deposits in escrow bank accounts are included as
restricted cash if the deposits are provided as part of the Group’s operating activities and therefore is deemed as held for the purpose
of meeting short-term cash commitments, and the deposits can be released from the escrow account without undue expenses. Cash
and cash equivalents and current financial investment are accounted for at amortised cost or at fair value through profit or loss.
Trade receivables are carried at the original invoice amount less a provision for doubtful receivables which represent expected losses
computed on a probability-weighted basis.
Equinor’s financial asset impairment losses are measured and recognised based on expected losses.
A part of Equinor's financial investments is managed together as an investment portfolio of Equinor's captive insurance company and
is held in order to comply with specific regulations for capital retention. The investment portfolio is managed and evaluated on a fair
value basis in accordance with an investment strategy and is accounted for at fair value through profit or loss.
Financial assets are presented as current if they contractually will expire or otherwise are expected to be recovered within 12 months
after the balance sheet date, or if they are held for the purpose of being traded. Financial assets and financial liabilities are shown
separately in the Consolidated balance sheet, unless Equinor has both a legal right and a demonstrable intention to net settle certain
balances payable to and receivable from the same counterparty, in which case they are shown net in the Consolidated balance sheet.
Financial assets are de-recognised when rights to cash flows and risks and rewards of ownership are transferred through a sales
transaction or the contractual rights to the cash flows expire, are redeemed, or cancelled. Gains and losses arising on the sale,
settlement or cancellation of financial assets are recognised either in interest income and other financial items or in interest and other
finance expenses within Net financial items.
Inventories
Commodity inventories are stated at the lower of cost and net realisable value. Cost is determined by the first-in first-out method and
comprises direct purchase costs, cost of production, transportation and manufacturing expenses. Inventories of drilling and spare
parts are reflected according to the weighted average method.
Equinor, Annual Report on Form 20-F 2021 223
Impairment of property, plant and equipment, right-of-use assets and intangible assets including goodwill
Equinor assesses individual assets or groups of assets for impairment whenever events or changes in circumstances indicate that the
carrying value of an asset may not be recoverable. Assets are grouped into cash generating units (CGUs) which are the smallest
identifiable groups of assets that generate cash inflows that are largely independent of the cash inflows from other groups of assets.
Normally, separate CGUs are individual oil and gas fields or plants. Each unconventional asset play is considered a single CGU when
no cash inflows from parts of the play can be reliably identified as being largely independent of the cash inflows from other parts of the
play. In impairment evaluations, the carrying amounts of CGUs are determined on a basis consistent with that of the recoverable
amount. In Equinor's line of business, judgement is involved in determining what constitutes a CGU. Development in production,
infrastructure solutions, markets, product pricing, management actions and other factors may over time lead to changes in CGUs such
as the disaggregation of one original CGU into several.
In assessing whether a write-down of the carrying amount of a potentially impaired asset is required, the asset's carrying amount is
compared to the recoverable amount. The recoverable amount of an asset is the higher of its fair value less cost of disposal or its
value in use. Fair value less cost of disposal is determined based on comparable recent arm’s length market transactions or based on
Equinor’s estimate of the price that would be received for the asset in an orderly transaction between market participants. Such fair
value estimates are mainly based on discounted cash flow models, using assumed market participants’ assumptions, but may also
reflect market multiples observed from comparable market transactions or independent third-party valuations. Value in use is
determined using a discounted cash flow model. The estimated future cash flows applied in establishing value in use are based on
reasonable and supportable assumptions and represent management's best estimates of the range of economic conditions that will
exist over the remaining useful life of the assets, as set down in Equinor's most recently approved long-term forecasts. Assumptions
and economic conditions in establishing the long-term forecasts are reviewed by management on a regular basis and updated at least
annually. See note 11 Property, plant and equipment for a presentation of the most recently updated commodity price assumptions.
For assets and CGUs with an expected useful life or timeline for production of expected oil and natural gas reserves extending
beyond five years, including planned onshore production from shale assets with a long development and production horizon, the
forecasts reflect expected production volumes, and the related cash flows include project or asset specific estimates reflecting the
relevant period. Such estimates are established based on Equinor's principles and assumptions and are consistently applied.
In performing a value-in-use-based impairment test, the estimated future cash flows are adjusted for risks specific to the asset and
discounted using a real post-tax discount rate which is based on Equinor's post-tax weighted average cost of capital (WACC). Country
risk specific to a project is included as a monetary adjustment to the projects’ cash flow. Equinor regards country risk primarily as an
unsystematic risk. The cash flow is adjusted for risk that influence the expected cash flow of a project and which is not part of the
project itself. The use of post-tax discount rates in determining value in use does not result in a materially different determination of
the need for, or the amount of, impairment that would be required if pre-tax discount rates had been used.
Unproved oil and gas properties are assessed for impairment when facts and circumstances suggest that the carrying amount of the
asset or CGU to which the unproved properties belong may exceed its recoverable amount, and at least once a year. Exploratory
wells that have found reserves, but where classification of those reserves as proved depends on whether major capital expenditure
can be justified or where the economic viability of that major capital expenditure depends on the successful completion of further
exploration work, will remain capitalised during the evaluation phase for the exploratory finds. Thereafter it will be considered a trigger
for impairment evaluation of the well if no development decision is planned for in the near future and there are no firm plans for future
drilling in the licence.
An assessment is made at each reporting date as to whether there is any indication that previously recognised impairment losses may
no longer be relevant or may have decreased. If such an indication exists, the recoverable amount is estimated. A previously
recognised impairment loss is reversed only if there has been a change in the estimates used to determine the asset’s recoverable
amount since the last impairment loss was recognised. If that is the case, the carrying amount of the asset is increased to its
recoverable amount. That increased amount cannot exceed the carrying amount that would have been determined, net of
depreciation, had no impairment loss been recognised for the asset in prior years.
Impairment losses and reversals of impairment losses are presented in the Consolidated statement of income as Exploration
expenses or Depreciation, amortisation and net impairment losses, on the basis of their nature as either exploration assets (intangible
exploration assets) or development and producing assets (property, plant and equipment and other intangible assets), respectively.
Goodwill is reviewed for impairment annually or more frequently if events or changes in circumstances indicate that the carrying value
may be impaired. Impairment is determined by assessing the recoverable amount of the CGU, or group of units, to which the goodwill
relates. Where the recoverable amount of the CGU, or group of units, is less than the carrying amount, an impairment loss is
recognised. When impairment testing goodwill originally recognised as an offsetting item to the computed deferred tax provision in a
post-tax transaction on the NCS, the remaining amount of the deferred tax provision will factor into the impairment evaluations. Once
recognised, impairments of goodwill are not reversed in future periods.
Estimation uncertainty regarding impairment
Changes in the circumstances or expectations of future performance of an individual asset may be an indicator that the asset is
impaired, requiring its carrying amount to be written down to its recoverable amount. Impairments are reversed if conditions for
224 Equinor, Annual Report on Form 20-F 2021
impairment are no longer present. Evaluating whether an asset is impaired or if an impairment should be reversed requires a high
degree of judgement and may to a large extent depend upon the selection of key assumptions about the future.
The key assumptions used will bear the risk of change based on the inherent volatile nature of macro-economic factors such as future
commodity prices or discount rate and uncertainty in asset specific factors such as reserve estimates and operational decisions
impacting the production profile or activity levels for our oil and natural gas properties. Changes in foreign currency exchange rates
will also affect value-in-use, especially for NCS-assets, where the functional currency is NOK. When estimating the recoverable
amount, the expected cash flow approach is applied to reflect uncertainties in timing and amounts inherent in the assumptions used in
the estimated future cash flows, including climate-related matters affecting those assumptions. For example, climate-related matters
(see also Note 3 Consequences of initiatives to limit climate changes) are expected to have a pervasive effect on the energy industry,
affecting not only supply, demand and commodity prices, but also technology-changes, increased emission-related levies and other
matters with mainly mid-term and long-term effects. These effects have been factored into the price assumptions used for estimating
future cash flows using probability-weighted scenario analyses.
Unproved oil and gas properties are assessed for impairment when facts and circumstances suggest that the carrying amount of the
relevant asset or CGU may exceed its recoverable amount, and at least annually. If, following evaluation, an exploratory well has not
found proved reserves, the previously capitalised costs are tested for impairment. Subsequent to the initial evaluation phase for a well,
it will be considered a trigger for impairment testing of a well if no development decision is planned for the near future and there is no
firm plan for future drilling in the licence. Impairment of unsuccessful wells is reversed, as applicable, to the extent that conditions for
impairment are no longer present.
Where recoverable amounts are based on estimated future cash flows, reflecting Equinor’s, market participants’ and other external
sources’ assumptions about the future and discounted to their present value, the estimates involve complexity. Impairment testing
requires long-term assumptions to be made concerning a number of economic factors such as future market prices, refinery margins,
foreign currency exchange rates and future output, discount rates, impact of the timing of tax incentive regulations, and political and
country risk among others, in order to establish relevant future cash flows. Long-term assumptions for major economic factors are
made at a group level, and there is a high degree of reasoned judgement involved in establishing these assumptions, in determining
other relevant factors such as forward price curves, in estimating production outputs and in determining the ultimate terminal value of
an asset.
Financial liabilities
Financial liabilities are initially recognised at fair value when Equinor becomes a party to the contractual provisions of the liability. The
subsequent measurement of financial liabilities depends on which category they have been classified into. The categories applicable
for Equinor are either financial liabilities at fair value through profit or loss or financial liabilities measured at amortised cost using the
effective interest method. The latter applies to Equinor's non-current bank loans and bonds.
Financial liabilities are presented as current if the liability is expected to be settled as part of Equinor’s normal operating cycle, the
liability is due to be settled within 12 months after the balance sheet date, Equinor does not have the right to defer settlement of the
liability more than 12 months after the balance sheet date, or if the liabilities are held for the purpose of being traded. Financial
liabilities are de-recognised when the contractual obligations are settled, or if they expire, are discharged or cancelled. Gains and
losses arising on the repurchase, settlement or cancellation of liabilities are recognised either in Interest income and other financial
items or in Interest and other finance expenses within Net financial items.
Share buy-backs
Where Equinor has either acquired own shares under a share buy-back programme or has placed an irrevocable order with a third
party for Equinor shares to be acquired in the market, such shares are reflected as a reduction in equity as treasury shares. The
remaining outstanding part of an irrevocable order to acquire shares is accrued for and classified as Trade, other payables and
provisions.
Derivative financial instruments
Equinor uses derivative financial instruments to manage certain exposures to fluctuations in foreign currency exchange rates, interest
rates and commodity prices. Such derivative financial instruments are initially recognised at fair value on the date on which a
derivative contract is entered into and are subsequently re-measured at fair value through profit and loss. The impact of commodity-
based derivative financial instruments is recognised in the Consolidated statement of income under Other revenues, as such
derivative instruments are related to sales contracts or revenue-related risk management for all significant purposes. The impact of
other derivative financial instruments is reflected under Net financial items.
Derivatives are carried as assets when the fair value is positive and as liabilities when the fair value is negative. Derivative assets or
liabilities expected to be recovered, or with the legal right to be settled more than 12 months after the balance sheet date, are
Equinor, Annual Report on Form 20-F 2021 225
classified as non-current. Derivative financial instruments held for the purpose of being traded are however always classified as
current.
Contracts to buy or sell a non-financial item that can be settled net in cash or another financial instrument, or by exchanging financial
instruments, as if the contracts were financial instruments, are accounted for as financial instruments. However, contracts that are
entered into and continue to be held for the purpose of the receipt or delivery of a non-financial item in accordance with Equinor's
expected purchase, sale or usage requirements, also referred to as own-use, are not accounted for as financial instruments. Such
sales and purchases of physical commodity volumes are reflected in the Consolidated statement of income as Revenue from
contracts with customers and Purchases [net of inventory variation], respectively. This is applicable to a significant number of
contracts for the purchase or sale of crude oil and natural gas, which are recognised upon delivery.
For contracts to sell a non-financial item that can be settled net in cash, but which ultimately are physically settled despite not
qualifying as own use prior to settlement, the changes in fair value prior to settlement is included in gain/(loss) on commodity
derivatives. The resulting impact upon physical settlement is shown separately and included in Other revenues. Actual physical
deliveries made by Equinor through such contracts are included in Revenue from contracts with customers at contract price.
Derivatives embedded in host contracts which are not financial assets within the scope of IFRS 9 are recognised as separate
derivatives and are reflected at fair value with subsequent changes through profit and loss, when their risks and economic
characteristics are not closely related to those of the host contracts, and the host contracts are not carried at fair value. Where there is
an active market for a commodity or other non-financial item referenced in a purchase or sale contract, a pricing formula will, for
instance, be considered to be closely related to the host purchase or sales contract if the price formula is based on the active market
in question. A price formula with indexation to other markets or products will however result in the recognition of a separate derivative.
Where there is no active market for the commodity or other non-financial item in question, Equinor assesses the characteristics of
such a price related embedded derivative to be closely related to the host contract if the price formula is based on relevant indexations
commonly used by other market participants. This applies to certain long-term natural gas sales agreements.
Pension liabilities
Equinor has pension plans for employees that either provide a defined pension benefit upon retirement or a pension dependent on
defined contributions and related returns. A portion of the contributions are provided for as notional contributions, for which the liability
increases with a promised notional return, set equal to the actual return of assets invested through the ordinary defined contribution
plan. For defined benefit plans, the benefit to be received by employees generally depends on many factors including length of
service, retirement date and future salary levels.
Equinor's proportionate share of multi-employer defined benefit plans is recognised as liabilities in the Consolidated balance sheet to
the extent that sufficient information is available, and a reliable estimate of the obligation can be made.
Equinor's net obligation in respect of defined benefit pension plans is calculated separately for each plan by estimating the amount of
future benefit that employees have earned in return for their services in the current and prior periods. That benefit is discounted to
determine its present value, and the fair value of any plan assets is deducted. The discount rate is the yield at the balance sheet date,
reflecting the maturity dates approximating the terms of Equinor's obligations. The discount rate for the main part of the pension
obligations has been established on the basis of Norwegian mortgage covered bonds, which are considered high quality corporate
bonds. The cost of pension benefit plans is expensed over the period that the employees render services and become eligible to
receive benefits. The calculation is performed by an external actuary.
The net interest related to defined benefit plans is calculated by applying the discount rate to the opening present value of the benefit
obligation and opening present value of the plan assets, adjusted for material changes during the year. The resulting net interest
element is presented in the Consolidated statement of income within Net financial items. The difference between estimated interest
income and actual return is recognised in the Consolidated statement of comprehensive income.
Past service cost is recognised when a plan amendment (the introduction or withdrawal of, or changes to, a defined benefit plan) or
curtailment (a significant reduction by the entity in the number of employees covered by a plan) occurs, or when recognising related
restructuring costs or termination benefits. The obligation and related plan assets are re-measured using current actuarial
assumptions, and the gain or loss is recognised in the Consolidated statement of income.
Actuarial gains and losses are recognised in full in the Consolidated statement of comprehensive income in the period in which they
occur, while actuarial gains and losses related to provision for termination benefits are recognised in the Consolidated statement of
income in the period in which they occur. Due to the parent company Equinor ASA's functional currency being USD, the significant
part of Equinor's pension obligations will be payable in a foreign currency (i.e. NOK). As a consequence, actuarial gains and losses
related to the parent company's pension obligations include the impact of exchange rate fluctuations.
Contributions to defined contribution schemes are recognised in the Consolidated statement of income in the period in which the
contribution amounts are earned by the employees.
226 Equinor, Annual Report on Form 20-F 2021
Notional contribution plans, reported in the parent company Equinor ASA, are recognised as Pension liabilities with the actual value of
the notional contributions and promised return at reporting date. Notional contributions are recognised in the Consolidated statement
of income as periodic pension cost, while changes in fair value of notional assets are reflected in the Consolidated statement of
income under Net financial items.
Periodic pension cost is accumulated in cost pools and allocated to business areas and Equinor operated joint operations (licences)
on an hours’ incurred basis and recognised in the statement of income based on the function of the cost.
Onerous contracts
Equinor recognises as provisions the net obligation under contracts defined as onerous. Contracts are deemed to be onerous if the
unavoidable cost of meeting the obligations under the contract exceeds the economic benefits expected to be received in relation to
the contract. The provision for onerous contracts comprises the costs that relate directly to the contract, both incremental costs and an
allocation of other costs that relate directly to fulfilling the contracts. A contract which forms an integral part of the operations of a CGU
whose assets are dedicated to that contract, and for which the economic benefits cannot be reliably separated from those of the CGU,
is included in impairment considerations for the applicable CGU.
Asset retirement obligations (ARO)
Provisions for ARO costs are recognised when Equinor has an obligation (legal or constructive) to dismantle and remove a facility or
an item of property, plant and equipment and to restore the site on which it is located, and when a reliable estimate of that liability can
be made. The amount recognised is the present value of the estimated future expenditures determined in accordance with local
conditions and requirements. The cost is estimated based on current regulations and technology, considering relevant risks and
uncertainties. The discount rate used in the calculation of the ARO is a risk-free rate based on the applicable currency and time
horizon of the underlying cash flows. To better represent the risks specific to the ARO liability, and as described in a previous
paragraph regarding changes in accounting policies, Equinor no longer includes a credit premium reflecting Equinor's own credit risk.
Normally an obligation arises for a new facility, such as an oil and natural gas production or transportation facility, upon construction or
installation. An obligation may also arise during the period of operation of a facility through a change in legislation or through a
decision to terminate operations or be based on commitments associated with Equinor's ongoing use of pipeline transport systems
where removal obligations rest with the volume shippers. The provisions are classified under Provisions in the Consolidated balance
sheet.
When a provision for ARO cost is recognised, a corresponding amount is recognised to increase the related property, plant and
equipment and is subsequently depreciated as part of the costs of the facility or item of property, plant and equipment. Any change in
the present value of the estimated expenditure is reflected as an adjustment to the provision and the corresponding property, plant
and equipment. When a decrease in the ARO provision related to a producing asset exceeds the carrying amount of the asset, the
excess is recognised as a reduction of Depreciation, amortisation and net impairment losses in the Consolidated statement of income.
When an asset has reached the end of its useful life, all subsequent changes to the ARO provision are recognised as they occur in
Operating expenses in the Consolidated statement of income. Removal provisions associated with Equinor's role as shipper of
volumes through third party transport systems are expensed as incurred.
Estimation uncertainty regarding asset retirement obligations
Establishing the appropriate estimates for such obligations are based on historical knowledge combined with knowledge of ongoing
technological developments and involve the application of judgement and involve an inherent risk of significant adjustments. The costs
of decommissioning and removal activities require revisions due to changes in current regulations and technology while considering
relevant risks and uncertainties. Most of the removal activities are many years into the future, and the removal technology and costs
are constantly changing. The speed of the transition to new renewable energy may also influence the timing of the production period,
hence the timing of the removal activities. The estimates include assumptions of norms, rates and time required which can vary
considerably depending on the assumed removal complexity. Moreover, changes in the discount rate and foreign currency exchange
rates may impact the estimates significantly. As a result, the initial recognition of the liability and the capitalised cost associated with
decommissioning and removal obligations, and the subsequent adjustment of these balance sheet items, involve the application of
significant judgement.
Measurement of fair values
Quoted prices in active markets represent the best evidence of fair value and are used by Equinor in determining the fair values of
assets and liabilities to the extent possible. Financial instruments quoted in active markets will typically include financial instruments
with quoted market prices obtained from the relevant exchanges or clearing houses. The fair values of quoted financial assets,
financial liabilities and derivative instruments are determined by reference to mid-market prices, at the close of business on the
balance sheet date.
Equinor, Annual Report on Form 20-F 2021 227
Where there is no active market, fair value is determined using valuation techniques. These include using recent arm's-length market
transactions, reference to other instruments that are substantially the same, discounted cash flow analysis, and pricing models and
related internal assumptions. In the valuation techniques, Equinor also takes into consideration the counterparty and its own credit
risk. This is either reflected in the discount rate used or through direct adjustments to the calculated cash flows. Consequently, where
Equinor reflects elements of long-term physical delivery commodity contracts at fair value, such fair value estimates to the extent
possible are based on quoted forward prices in the market and underlying indexes in the contracts, as well as assumptions of forward
prices and margins where observable market prices are not available. Similarly, the fair values of interest and currency swaps are
estimated based on relevant quotes from active markets, quotes of comparable instruments, and other appropriate valuation
techniques.
Estimation uncertainty regarding the Covid-19 pandemic
During 2020, the Covid-19 pandemic slowed economic growth and had dramatic consequences for energy demand, particularly
mobility fuels, resulting in a collapse in commodity prices in the first half of 2020. Commodity prices rebounded through the second
half of 2020 and have since the first quarter of 2021 surpassed pre-pandemic levels. When setting Equinor’s estimates for global
supply, demand and commodity prices, management factored in the effects of global roll-out of vaccines during 2021 and 2022. Virus
mutation is still causing new waves of lockdown and other restrictions, but the Omicron variant seems less dangerous, letting
governments ease restrictions as former variants are being outcompeted. Even though we expect to see the end of the pandemic in
the near future, there is always inherent uncertainties and a risk of new virus flare-ups for as long as the virus is allowed to mutate.
The outlook is still somewhat uncertain and dominated by downside risks such as virus infection flare-ups, and we expect that
continued global vaccination and the scope of monetary and fiscal governmental stimuli will still affect the economy in the short term.
As such, the full resulting operational and economic impact for Equinor from the pandemic cannot be fully ascertained at this time.
Apart from the financial impact, Equinor has only experienced immaterial effects on production from assets in operation, due to
actions taken to maintain and secure safe production during the pandemic. Minor virus outbreaks at some of our facilities have
occurred, but effective measures such as isolation and quarantines combined with social distancing and increased sanitation
requirements have prevented production shutdown, and operations have not been significantly impacted.
For projects under development, the Covid-19 pandemic has impacted progress due to personnel limitations on offshore and onshore
facilities / yards due to infection control measures and associated travel restrictions for migrant workforce. The situation is to a certain
degree still unpredictable and may have additional consequences for the progress and costs of our projects.
3 Consequences of initiatives to limit climate changes
Equinor’s ambitions and our strategy
Climate change and reaching the goals set out in the Paris Agreement represent fundamental challenges to society. As outlined in the
COP26 Glasgow Climate Pact, achieving the most ambitious goals of the Paris Agreement now requires rapid, deep and sustained
reductions in global greenhouse gas emissions. This includes reducing global carbon dioxide emissions by 45% by 2030 relative to
2010 levels, and to net zero around mid-century. Equinor’s ambition is to be a leading company in the energy transition and to
become a net-zero company by 2050, including emissions from production through to final energy consumption. Equinor’s strategy is
to create value as a leader in the energy transition by pursuing high-value growth in renewables and new markets opportunities in low
carbon solutions at the same time as it optimises its oil and gas portfolio.
Assessment of risks arising from climate change and the energy transition
Climate changes and a transition to a lower carbon economy will affect Equinor’s business and entails a broad range of different risk
factors. Equinor’s climate roadmap and all of our climate-related ambitions are a response to these challenges and risks related to
climate change.
●
oil and gas. Increased demand for and improved cost competitiveness of renewable energy, and innovation and technology
changes supporting the further development and use of renewable energy and low-carbon technologies, represent both threats
and opportunities for Equinor.
●
Equinor’s operations. Examples of physical parameters that could impact Equinor’s facility design and operations include acute
effects like increasing frequency and severity of extreme weather events, and chronic effects like rising sea level, changes in sea
currents and reduced water availability. Unexpected changes in meteorological parameters, such as average wind speed, can
also affect renewable power generation outputs, resulting in performance above or below expectations.
●
gas emissions, such as changes in carbon costs and taxes, emission standards or energy subsidy policies. Stricter climate
228 Equinor, Annual Report on Form 20-F 2021
regulations and policies could impact Equinor's financial outlook, including the value of assets, access to acreage, or indirectly
through changes in consumer behaviour or technology developments.
●
producers, as well as a more negative perception of the oil and gas industry. This could lead to increased litigation-related costs
and poor reputation could affect Equinor’s license to operate as well as the ability to attract and retain talent and key
competences.
●
low carbon industries and hamper the transition into a broader energy company. Competitive auctions/tenders where prices don’t
allow absorption of higher costs may increase the exposure to inflation risk. This is also relevant for assets where the costs and
income have been locked in before the final investment decision. There is also a risk of increased cost of capital for fossil fuel
producers. Certain lenders have recently indicated that they will direct or restrict their lending activities based on environmental
parameters.
Effects on estimation uncertainty
The effects of the initiatives to limit climate changes and the potential impact of the energy transition are relevant to some of the
economic assumptions in our estimations of future cash flows. The results of the development of such initiatives, and the degree to
which Equinor’s operations will be affected by them, are sources of uncertainty. Estimating global energy demand and commodity
prices towards 2050 is a challenging task, as this comprises assessing the future development in supply and demand, technology
change, taxation, tax on emissions, production limits and other important factors. The assumptions may change, which could
materialise in different outcomes from the current projected scenarios. This could result in significant changes to accounting
estimates, such as economic useful life (affects depreciation period and timing of asset retirement obligations) and value-in-use
calculations (affects impairment assessments).
Equinor’s commodity price assumptions applied in value-in-use impairment testing, are set in accordance with accounting regulations
and based on management’s best estimate of the development of relevant current circumstances and the likely future development of
such circumstances. This price-set is currently not equal to a price-set required to achieve the goals in the Paris Agreement as
described in the WEO Sustainability Development Scenario, or the Net Zero Emissions by 2050 Scenario. A future change in the
trajectory of how the world acts with regards to implementing actions in accordance with the goals in the Paris agreement could,
depending on the detailed characteristics of such a trajectory, have a negative impact on the valuation of Equinor’s property, plant and
equipment in total. A calculation of a possible effect of using the prices (including CO
2
o
C compatible Net Zero Emission
by 2050 Scenario as estimated by the International Energy Agency (IEA) could result in an impairment of around USD
tax. This illustrative impairment sensitivity is based on a simplified model and limitations further described in note 11 Property, plant &
equipment.
CO
2
-related cost
Equinor expects greenhouse gas emission costs to increase from current levels and to have a wider geographical range than today. A
global tax on CO
2
Equinor’s internal carbon price applied to all potential new projects and investments, currently set at
towards
decisions following Equinor’s strategy and commitments to the energy transition.
Climate considerations are included in the impairment calculations directly by estimating the CO
2
the expected effect of climate change is also included in the estimated commodity prices where supply and demand are considered.
The CO
2
Impairment calculations are based on best estimate assumptions. To reflect that carbon will have a cost for all our assets, the current
best estimate is considered to be EU ETS for countries outside EU where carbon is not already subject to taxation or where Equinor
has not established specific estimates. The EU ETS price has increased significantly from
remain high, in the region of
EUR/tonne) in 2030 and thereafter increasing to
Norway’s Climate Action Plan for the period 2021-2030 (Meld. St 13 (2020-2021)) which assumes a gradually increased CO
2
total of EU ETS + Norwegian CO
2
upstream assets.
Total expensed CO
2
2
related to activities on the Norwegian Continental Shelf (Equinor’s share of the operating licences) and land-based operating facilities
in Norway owned by Equinor amounts to USD
Upstream oil & gas (stranded assets)
The transition to renewable energy, technological development and reduction in global demand for carbon-based energy, may have a
negative impact on the future profitability of investments in upstream oil and gas assets, in particular assets with long estimated useful
lives, projects in an early development phase and undeveloped assets controlled by Equinor. Equinor seeks to mitigate this risk by
Equinor, Annual Report on Form 20-F 2021 229
focusing on improving the resilience of the existing upstream portfolio, maximising the efficiency of our infrastructure on the Norwegian
Continental Shelf and optimising our high-quality international portfolio. Equinor will also continue to selectively explore for new
resources with a focus on mature areas that can make use of existing infrastructure to minimise emissions and maximise value.
During the transition, Equinor will allocate less of our capital budget to oil and gas in the coming years and eventually decrease the
volume of production over time. Equinor’s plans to become a net-zero company by 2050 have not resulted in the identification of
additional assets being triggered for impairment or earlier cessation of production as of year-end 2021.
Any future exploration may be restricted by regulations, market and strategic considerations. Provided that the economic assumptions
would deteriorate to such an extent that undeveloped assets controlled by Equinor should not materialize, assets at risk mainly
comprise the intangible assets Oil and Gas prospects, signature bonuses and the capitalised exploration costs, with a total carrying
value of USD
Timing of Asset Retirement Obligations (ARO)
If the business cases of Equinor’s oil and gas producing assets should change materially from governmental initiatives to limit climate
change, this could affect the timing of our asset retirement obligations. A shorter production period, accelerating the time for when
assets need to be removed after ended production, will increase the carrying value of the liability. The effect of performing removal
five years earlier than currently scheduled, is estimated to increase the liability by USD
liabilities for more information regarding Equinor’s ARO.
4 Segments
As from 1 June 2021 Equinor’s operations are managed through the following operating segments (business areas): Exploration &
Production Norway (EPN), Exploration & Production International (EPI), Exploration & Production USA (EPUSA), Marketing,
Midstream & Processing (MMP), Renewables (REN), Projects, Drilling and Procurement (PDP) and Technology, Digital & Innovation
(TDI) and Corporate staff and functions.
The main change in the organisational corporate structure compared to previous periods is that the operating segment Development
& Production Brazil is merged into the operating segment Exploration & Production International. In addition, the operating segment
Exploration is divided and merged into Exploration & Production Norway, Exploration & Production International and Exploration &
Production USA. Global Strategy & Business development is divided and merged into the functions for Chief Financial Officer and
Safety, Security and Sustainability. The operating segment Technology, Projects & Drilling is split into Technology, Digital &
Innovation and Projects, Drilling & Procurement. The new organisational corporate structure has not resulted in any changes in the
reportable segments.
The Exploration & Production business areas are responsible for the discovery and appraisal of new resources and commercial
development of the oil and gas portfolios within their respective geographical areas: EPN on the Norwegian continental shelf, EPUSA
in USA and EPI worldwide outside of EPN and EPUSA.
The PDP is responsible for field development, well deliveries and procurement in Equinor.
TDI brings together research, technology development, specialist advisory services, digitalisation, IT, improvement, innovation,
ventures and future business to one technology powerhouse.
The MMP business area is responsible for marketing and trading of oil and gas commodities (crude, condensate, gas liquids,
products, natural gas and liquified natural gas), electricity and emission rights, as well as transportation, processing and
manufacturing of the above-mentioned commodities, operations of refineries, terminals and processing - and power plants and low
carbon solutions including carbon capture and storage which was previously the responsibility of the REN business area.
The REN business area is responsible for wind parks and other renewable energy solutions.
The reporting segments Exploration & Production Norway (E&P Norway), Exploration & Production International (E&P International),
Exploration & Production USA (E&P USA), Marketing, Midstream & Processing (MMP) and Renewables (REN) consist of the
business areas EPN, EPI, EPUSA, MMP and REN respectively. The operating segments, PDP, TDI and corporate staffs and
functions are aggregated into the reporting segment “Other” due to the immateriality of these operating segments. Most of the costs
within the operating segments PDP and TDI are allocated to the E&P Norway, E&P International, E&P USA, MMP and REN reporting
segments.
The changes do not have a material effect on comparable figures.
As from the first quarter of 2021, Equinor changed its reporting as REN became a separate reporting segment. Previously the
activities in REN were reported in the segment “Other”. The new reporting structure has been applied retrospectively with comparable
230 Equinor, Annual Report on Form 20-F 2021
figures reclassified. The change has its basis in the increased strategic importance of the renewable business for Equinor and that the
information is regarded useful for the readers of the financial statements.
Inter-segment sales and related unrealised profits, mainly from the sale of crude oil and products, are eliminated in the Eliminations
column below. Inter-segment revenues are based upon estimated market prices.
Segment data for the years ended 31 December 2021, 2020 and 2019 are presented below. The measurement basis of segment
profit is net operating income/(loss). In the tables below, deferred tax assets, pension assets and non-current financial assets are not
allocated to the segments.
The measurement basis for segments is IFRS as applied by the group with the exception of IFRS 16 Leases and the line item
Additions to property, plant and equipment (PP&E), intangibles and equity accounted investments. All IFRS 16 leases are presented
within the Other segment. The lease costs for the period are allocated to the different segments based on underlying lease payments,
with a corresponding credit in the Other segment. Lease costs allocated to licence partners are recognised as other revenue in the
Other segment. Additions to PP&E, intangible assets and equity accounted investments in the E&P and MMP segments include the
period’s allocated lease costs related to activity being capitalised with a corresponding negative addition in the Other segment. The
line item Additions to property, plant and equipment (PP&E), intangibles and equity accounted investments excludes movements
related to changes in asset retirement obligations.
Full year 2021
E&P
Norway
E&P
International
E&P USA
MMP
REN
Other
Eliminations
Total
(in USD million)
Revenues third party, other revenue and
other income
Revenues inter-segment
(47,300 )
Net income/(loss) from equity accounted
investments
Total revenues and other income
(47,300 )
Purchases [net of inventory variation]
(58 )
(80,873 )
(1 )
(35,160 )
Operating, selling, general and
administrative expenses
(3,729 )
(1,466 )
(1,076 )
(4,276 )
(163 )
(9,378 )
Depreciation, amortisation and net
impairment losses
(4,678 )
(3,257 )
(1,733 )
(1,079 )
(3 )
(970 )
(11,719 )
Exploration expenses
(363 )
(451 )
(190 )
(1,004 )
Total operating expenses
(8,770 )
(5,232 )
(2,999 )
(86,227 )
(166 )
(707 )
(57,261 )
Net operating income/(loss)
(210 )
(461 )
Additions to PP&E, intangibles and equity
accounted investments
Balance sheet information
Equity accounted investments
Non-current segment assets
Non-current assets not allocated to
segments
Total non-current assets
Equinor, Annual Report on Form 20-F 2021 231
Full year 2020
E&P
Norway
E&P
International
E&P
USA
MMP
REN
1)
Other
1)
Eliminations
Total
(in USD million)
Revenues third party, other revenue and
other income
Revenues inter-segment
(17,547 )
Net income/(loss) from equity accounted
investments
(146 )
Total revenues and other income
(17,547 )
Purchases [net of inventory variation]
(72 )
(38,072 )
(20,986 )
Operating, selling, general and
administrative expenses
(2,829 )
(1,439 )
(1,313 )
(5,060 )
(215 )
(9,537 )
Depreciation, amortisation and net
impairment losses
(5,546 )
(3,471 )
(3,824 )
(1,453 )
(1 )
(939 )
(15,235 )
Exploration expenses
(423 )
(2,071 )
(990 )
(3,483 )
Total operating expenses
(8,798 )
(7,054 )
(6,127 )
(44,586 )
(216 )
(304 )
(49,241 )
Net operating income/(loss)
(3,565 )
(3,512 )
(35 )
(63 )
(3,423 )
Additions to PP&E, intangibles and equity
accounted investments
Balance sheet information
Equity accounted investments
Non-current segment assets
2)
Non-current assets not allocated to
segments
Total non-current assets
1) Reclassified.
2) Restated. For more information, see note 21 Provisions and other liabilities.
232 Equinor, Annual Report on Form 20-F 2021
Full year 2019
E&P
Norway
E&P
International
E&P
USA
MMP
REN
1)
Other
1)
Eliminations
Total
(in USD million)
Revenues third party, other revenue and
other income
Revenues inter-segment
(26,379 )
Net income/(loss) from equity accounted
investments
(1 )
Total revenues and other income
(26,379 )
Purchases [net of inventory variation]
(1 )
(34 )
(54,454 )
(1 )
(29,532 )
Operating, selling, general and
administrative expenses
(3,284 )
(1,684 )
(1,668 )
(4,897 )
(192 )
(10,469 )
Depreciation, amortisation and net
impairment losses
(5,439 )
(2,228 )
(4,133 )
(600 )
(1 )
(803 )
(13,204 )
Exploration expenses
(478 )
(668 )
(709 )
(1,854 )
Total operating expenses
(9,201 )
(4,614 )
(6,510 )
(59,951 )
(193 )
(339 )
(55,058 )
Net operating income/(loss)
(2,271 )
(68 )
(629 )
Additions to PP&E, intangibles and equity
accounted investments
Balance sheet information
Equity accounted investments
Non-current segment assets
2)
Non-current assets not allocated to
segments
Total non-current assets
1) Reclassified.
2) Restated. For more information, see note 21 Provisions and other liabilities.
Equinor, Annual Report on Form 20-F 2021 233
Non-current assets by country
At 31 December
(in USD million)
2021
2020
2)
Norway
USA
Brazil
UK
Azerbaijan
Canada
Russia
Angola
Algeria
Denmark
Other
Total non-current assets
1)
1)
Excluding deferred tax assets, pension assets and non-current financial assets.
2)
Restated. For more information see note 21, Provisions and other liabilities.
See note 5 Acquisitions and disposals for information on transactions that affect the different segments.
See note 11 Property, plant and equipment for further information on impairment losses and impairment reversals that affect the
different segments.
See note 12 Intangible assets for information on impairment losses and impairment reversals that affect the different segments.
See note 24 Other commitments, contingent liabilities and contingent assets for information on contingencies that affect the segments.
234 Equinor, Annual Report on Form 20-F 2021
Revenues from contracts with customers by geographical areas
Equinor has business operations in around
When attributing the line item Revenues third party, other revenue and other
income to the country of the legal entity executing the sale for 2021, Norway constitutes
% and USA constitutes
%. For 2020 the
revenues to Norway and USA constituted
% and
% respectively, and for 2019
% and
% respectively.
Revenues from contracts with customers and other revenues
(in USD million)
2021
2020
2019
Crude oil
Natural gas
Refined products
Natural gas liquids
Transportation
Other sales
Total revenues from contracts with customers
Taxes paid in-kind
Physically settled commodity derivatives
(1,075 )
(1,086 )
Gain/(loss) on commodity derivatives
Other revenues
Total other revenues
Revenues
Equinor, Annual Report on Form 20-F 2021 235
5 Acquisitions and disposals
2021
Disposals
10% of Dogger Bank Farm C
On 10 February 2022, Equinor closed an agreement with Eni to sell a
% interest in the Dogger Bank Wind Farm C project in the UK
for a consideration of GBP
interest in Dogger Bank C from project partner SSE Renewables on the same terms. The new overall shareholding in Dogger Bank C
is SSE Renewables (
%), Equinor (
%) and Eni (
%). The asset was classified as held for sale at 31 December 2021. The
carrying amount of the interests to be disposed of is immaterial and is reported in the REN segment. The gain will be reported in the
REN segment in the first quarter 2022.
Equinor Refining Denmark A/S
On 31 December 2021, Equinor Danmark A/S closed the transaction with the Klesch Group to sell
% of the shares in Equinor
Refining Denmark A/S (ERD). Klesch paid USD
the Kalundborg refinery and associated terminals and infrastructure. Following an impairment earlier in 2021, the disposal resulted in
an immaterial loss. Prior to transaction closing, Equinor received USD
in capital from ERD.
Following the disposal, a gain of USD
statement of income in the line item Other income and has been reflected in the MMP segment.
Terra Nova
On 8 September 2021, Equinor closed the transaction with Cenovus and Murphy to sell
% of its interest, which includes a release
of any future obligations and liabilities, in the Terra Nova asset in offshore Canada. The transaction is accounted for in the E&P
International segment. The consideration paid, the net carrying amount and the impact to the Consolidated statement of income are
immaterial.
Bakken onshore unconventional field
On 26 April 2021, Equinor closed the transaction to divest its interests in the Bakken field in the US states of North Dakota and
Montana to Grayson Mill Energy, backed by EnCap Investments for an estimated total consideration of USD
interim period settlement, for which payment has been received in the first half of 2021. Post-closing settlement adjustments are
ongoing, and the consideration will be final in early 2022. The asset was impaired in the first quarter of 2021. During the subsequent
three quarters of 2021 insignificant losses were recorded and are presented in the line item Operating expenses in the Consolidated
statement of income in the E&P USA segment.
10% of Dogger Bank Farm A and B
On 26 February 2021, Equinor closed the transaction with Eni to sell a
% equity interest in the Dogger Bank Wind Farm A and B
assets in the UK for a total consideration of GBP
million). After closing, the new overall shareholdings in Dogger Bank A and Dogger Bank B are SSE Renewables (
%), Equinor
(
%), and Eni (
%). Equinor will continue to equity account for the remaining investment as a joint venture. The gain is presented in
the line item Other income in the Consolidated statement of income in the REN segment.
Non-operated interest in the Empire Wind and Beacon Wind assets on the US east coast
On 29 January 2021, Equinor closed the transaction with BP to sell
% of the non-operated interests in the Empire Wind and Beacon
Wind assets for a preliminary total consideration after interim period adjustments of USD
billion for the divested part, of which USD
two companies have established a strategic partnership for further growth within offshore wind in the USA. Following the transaction,
Equinor remains the operator with a
% interest. Equinor consolidated the assets until transaction closing, and thereafter the
investments are classified as joint ventures and accounted for using the equity method. The gain is presented in the line item Other
income in the Consolidated statement of income in the REN segment. For further information about the gain recognition, reference is
made to the section Accounting judgement regarding partial divestments and the related policy in note 2 Significant accounting
policies.
Acquisitions
Wento
On 5 May 2021, Equinor completed a transaction to acquire
% of the shares in Polish onshore renewables developer Wento from
the private equity firm Enterprise Investors for a cash consideration of EUR
addition, Equinor acquired a receivable of USD
to the acquired business have been recognised under the acquisition method. In the second quarter 2021, the acquisition resulted in
an increase of Equinor’s intangible assets of USD
236 Equinor, Annual Report on Form 20-F 2021
other net assets of USD
market obtained in the acquisition. The transaction has been accounted for in the REN segment.
Equinor, Annual Report on Form 20-F 2021 237
Held for sale
Equinor Energy Ireland Limited
In the fourth quarter of 2021, Equinor entered into an agreement with Vermilion Energy Inc (Vermilion) to sell Equinor’s non-operated
equity position in the Corrib gas project in Ireland. The transaction covers a sale of
% of the shares in Equinor Energy Ireland
Limited (EEIL). EEIL owns
% of the Corrib field alongside the operator Vermilion (
%) and Nephin Energy (
%). Equinor and
Vermilion have agreed a consideration of USD
production level and gas prices. Closing is expected during 2022.
2020
Acquisition onshore Russia
In the fourth quarter of 2020, Equinor closed a transaction with Rosneft to acquire a
% interest in the limited liability company LLC
KrasGeoNaC (KGN) which holds twelve conventional onshore exploration and production licences in Eastern Siberia. The cash
consideration at closing, including interim period adjustment, was USD
recognised a contingent consideration of USD
acquisition of USD
the E&P International segment.
As part of this agreement, Equinor extinguished its exploration commitments offshore in the Sea of Okhotsk and as such has
outstanding obligations in that area. The previous commitment in the Sea of Okhotsk has been charged to the income statement at
estimated fair value of USD
the E&P International segment.
Divestment of remaining shares in Lundin
In the second quarter of 2020, Equinor closed the divestment of its remaining (
%) financial shareholding in Lundin Energy AB
(formerly Lundin Petroleum AB). The consideration was SEK
income in the second quarter was a loss of USD
items.
Investment in interest onshore Argentina
In the first quarter of 2020, Equinor closed a transaction to acquire a
% ownership share in SPM Argentina S.A (SPM) from
Schlumberger Production Management Holding Argentina B.V. Shell acquired the remaining
% ownership share of SPM. SPM
holds a
% interest in the Bandurria Sur onshore block in Argentina, and the block is in the pilot phase of development. The
consideration including final adjustments is USD
Bandurria Sur by
% to
% for a final consideration of USD
using the equity method and reported in the E&P International segment.
6 Financial risk and capital management
General information relevant to financial risks
Equinor's business activities naturally expose Equinor to financial risk. Equinor’s approach to risk management includes assessing
and managing risk in activities using a holistic risk approach, by considering relevant correlations at portfolio level between the most
important market risks and the natural hedges inherent in Equinor’s portfolio. This approach allows Equinor to reduce the number of
risk management transactions and avoid sub-optimisation.
The corporate risk committee, which is headed by the chief financial officer, is responsible Equinor’s Enterprise Risk Management and
proposing appropriate measures to adjust risk at the corporate level. This includes assessing Equinor’s financial risk policies.
Financial risks
Equinor’s activities expose Equinor to market risk (including commodity price risk, currency risk, interest rate risk and equity price
risk), liquidity risk and credit risk.
Market risk
Equinor operates in the worldwide crude oil, refined products, natural gas, and electricity markets and is exposed to market risks
including fluctuations in hydrocarbon prices, foreign currency rates, interest rates, and electricity prices that can affect the revenues
and costs of operating, investing and financing. These risks are managed primarily on a short-term basis with a focus on achieving the
highest risk-adjusted returns for Equinor within the given mandate. Long-term exposures are managed at the corporate level, while
short-term exposures are managed according to trading strategies and mandates. Mandates in the trading organisations within crude
oil, refined products, natural gas and electricity are relatively small compared to the total market risk of Equinor.
For more information on sensitivity analysis of market risk see note 26 Financial instruments: fair value measurement and sensitivity
analysis of market risk.
238 Equinor, Annual Report on Form 20-F 2021
Commodity price risk
Equinor’s most important long-term commodity risk (oil and natural gas) is related to future market prices as Equinor´s risk policy is to
be exposed to both upside and downside price movements. The introduction of a future sizeable power price exposure will likely
compound the portfolio commodity price risk.
To manage short-term commodity risk, Equinor enters into commodity-based derivative
contracts, including futures, options, over-the-counter (OTC) forward contracts, market swaps and contracts for differences related to
crude oil, petroleum products, natural gas, power and emmissions. Equinor’s bilateral gas sales portfolio is exposed to various price
indices with a combination of gas price markers.
The term of crude oil and refined oil products derivatives are usually less than one year, and they are traded mainly on the Inter
Continental Exchange (ICE) in London, the New York Mercantile Exchange (NYMEX), the OTC Brent market, and crude and refined
products swap markets. The term of natural gas, power and emission derivatives is usually three years or less, and they are mainly
OTC physical forwards and options, NASDAQ OMX Oslo forwards and futures traded on the European Energy Exchange (EEX),
NYMEX and ICE.
Currency risk
Equinor’s cash flows from operating activities deriving from oil and gas sales, operating expenses and capital expenditures are mainly
in USD, but taxes, dividends to shareholders on the Oslo Børs and a share of our operating expenses and capital expenditures are in
NOK. Accordingly, Equinor’s currency management is primarily linked to mitigate currency risk related to payments in NOK. This
means that Equinor regularly purchases NOK, primarily spot, but also on a forward basis using conventional derivative instruments.
Interest rate risk
Bonds are normally issued at fixed rates in a variety of currencies (among others USD, EUR and GBP). Bonds are normally converted
to floating USD bonds by using interest rate and currency swaps. Equinor manages its interest rates exposure on its bond debt based
on risk and reward considerations from an enterprise risk management perspective. This means that the fixed/floating mix on interest
rate exposure may vary from time to time. For more detailed information about Equinor’s long-term debt portfolio see note 19 Finance
debt.
Equity price risk
Equinor’s captive insurance company holds listed equity securities as part of its portfolio. In addition, Equinor holds some other listed
and non-listed equities mainly for long-term strategic purposes. By holding these assets, Equinor is exposed to equity price risk,
defined as the risk of declining equity prices, which can result in a decline in the carrying value of Equinor’s assets recognised in the
balance sheet. The equity price risk in the portfolio held by Equinor’s captive insurance company is managed, with the aim of
maintaining a moderate risk profile, through geographical diversification and the use of broad benchmark indexes.
Liquidity risk
Liquidity risk is the risk that Equinor will not be able to meet obligations of financial liabilities when they become due. The purpose of
liquidity management is to ensure that Equinor has sufficient funds available at all times to cover its financial obligations.
The main cash outflows include the quarterly dividend payments and Norwegian petroleum tax payments paid six times per year. If
the cash flow forecasts indicate that the liquid assets will fall below target levels, new long-term funding will be considered.
Short-term funding needs will normally be covered by the USD
a revolving credit facility of USD
. The facility supports secure access to
funding, supported by the best available short-term rating. As at 31 December 2021 the facility has not been drawn.
financial liabilities have a weighted average maturity of approximately
.
For more information about Equinor’s non-current financial liabilities, see note 19 Finance debt.
Equinor, Annual Report on Form 20-F 2021 239
The table below shows a maturity profile, based on undiscounted contractual cash flows, for Equinor’s financial liabilities.
At 31 December
2021
2020
(in USD million)
Non-derivative financial
liabilities
Lease
liabilities
Derivative
financial
liabilities
Non-derivative financial
liabilities
Lease
liabilities
Derivative
financial
liabilities
Year 1
Year 2 and 3
Year 4 and 5
Year 6 to 10
After 10 years
Total specified
Credit risk
Credit risk is the risk that Equinor’s customers or counterparties will cause Equinor financial loss by failing to honor their obligations.
Credit risk arises from credit exposures with customer accounts receivables as well as from financial investments, derivative financial
instruments and deposits with financial institutions.
Equinor uses risk mitigation tools to reduce or control credit risk both on a counterparty and portfolio level. The main tools include
bank and parental guarantees, prepayments and cash collateral.
Equinor has pre-defined limits for the absolute credit risk level allowed at any given time on Equinor’s portfolio as well as maximum
credit exposures for individual counterparties. Equinor monitors the portfolio on a regular basis and individual exposures against limits
on a daily basis. The total credit exposure of Equinor is geographically diversified among a number of counterparties within the oil and
energy sector, as well as larger oil and gas consumers and financial counterparties. The majority of Equinor’s credit exposure is with
investment grade counterparties.
240 Equinor, Annual Report on Form 20-F 2021
The following table contains the carrying amount of Equinor’s financial receivables and derivative financial instruments split by
Equinor’s assessment of the counterparty's credit risk. Trade and other receivables include
% overdue receivables for 30 days and
more. The overdue receivables are mainly joint venture receivables pending the settlement of disputed working interest items payable
from Equinor’s working interest partners within the Exploration & Production USA – onshore activities. A provision has been
recognized for expected credit losses of trade and other receivables using the expected credit loss model.
Only non-exchange traded
instruments are included in derivative financial instruments.
(in USD million)
Non-current
financial
receivables
Trade and other
receivables
Non-current
derivative
financial
instruments
Current derivative
financial
instruments
At 31 December 2021
Investment grade, rated A or above
Other investment grade
Non-investment grade or not rated
Total financial assets
At 31 December 2020
Investment grade, rated A or above
Other investment grade
Non-investment grade or not rated
Total financial assets
For more information about Trade and other receivables, see note 16 Trade and other receivables.
At 31 December 2021, USD
December 2020, USD
related to positive fair values on interest rate swaps, cross currency swaps and foreign exchange swaps. Cash is called as collateral in
accordance with the master agreements with the different counterparties when the positive fair values for the different swap
agreements are above an agreed threshold.
Under the terms of various master netting agreements for derivative financial instruments as of 31 December 2021, USD
billion have been offset and USD
USD
financial instrument liabilities, reduce the credit exposure in the derivative financial instruments presented in the table above as they
will offset in a potential default situation for the counterparty. For trade and other receivables subject to similar master netting
agreements USD
2020.
Equinor, Annual Report on Form 20-F 2021 241
Capital management
The main objectives of Equinor's capital management policy are to maintain a strong overall financial position and to ensure sufficient
financial flexibility. Equinor’s primary focus is on maintaining its credit rating in the A category on a stand alone basis (excluding uplifts
for Norwegian Government ownership). Equinor’s current long-term ratings are AA- with a stable outlook (including one notch uplift)
and Aa2 with a stable outlook (including two notch uplift) from S&P and Moody’s, respectively. In order to monitor financial robustness
on a day to day basis, a key ratio utilized by Equinor is the non-GAAP metric of “Net interest-bearing debt adjusted (ND) to Capital
employed adjusted (CE)”.
At 31 December
(in USD million)
2021
2020
Net interest-bearing debt adjusted, including lease liabilities (ND1)
Net interest-bearing debt adjusted (ND2)
(326 )
Capital employed adjusted, including lease liabilities (CE1)
Capital employed adjusted (CE2)
Net debt to capital employed adjusted, including lease liabilities (ND1/CE1)
Net debt to capital employed adjusted (ND2/CE2)
(0.8 %)
ND1 is defined as Equinor's interest bearing financial liabilities less cash and cash equivalents and current financial investments,
adjusted for collateral deposits and balances held by Equinor's captive insurance company (amounting to USD
ND2 is defined as ND1 adjusted for lease liabilities (amounting to USD
respectively). CE2 is defined as Equinor's total equity (including non-controlling interests) and ND2.
7 Remuneration
Full year
(in USD million, except average number of employees)
2021
2020
2019
Salaries
1)
Pension costs
2)
Payroll tax
Other compensations and social costs
Total payroll costs
Average number of employees
3)
1)
Salaries include bonuses, severance packages and expatriate costs in addition to base pay.
2) See note 20 Pensions.
3) Part time employees amount to
% for 2021,
% for 2020 and
% for 2019.
Total payroll expenses are accumulated in cost-pools and partly charged to partners of Equinor operated licences on an hours
incurred basis.
242 Equinor, Annual Report on Form 20-F 2021
Compensation to the board of directors (BoD) and the corporate executive committee (CEC)
Full year
(in USD thousand)
1)
2021
2020
2019
Current employee benefits
Post-employment benefits
Other non-current benefits
Share-based payment benefits
Total benefits
1) All figures in the table are presented on accrual basis.
At 31 December 2021, 2020 and 2019 there are
Share-based compensation
Equinor's share saving plan provides employees with the opportunity to purchase Equinor shares through monthly salary deductions
and a contribution by Equinor. If the shares are kept for two full calendar years of continued employment following the year of
purchase, the employees will be allocated one bonus share for each one they have purchased.
Estimated compensation expense including the contribution by Equinor for purchased shares, amounts vested for bonus shares
granted and related social security tax was USD
programmes, respectively. For the 2022 programme (granted in 2021), the estimated compensation expense is USD
December 2021 the amount of compensation cost yet to be expensed throughout the vesting period is USD
See note 18 Shareholders’ equity and dividends for more information about share-based compensation.
8 Other expenses
Auditor's remuneration
Full year
(in USD million, excluding VAT)
2021
2020
2019
Audit fee Ernst & Young (principal accountant from 2019)
Audit fee KPMG (principal accountant 2018)
Audit related fee Ernst & Young (principal accountant from 2019)
Audit related fee KPMG (principal accountant 2018)
Tax fee Ernst & Young (principal accountant from 2019)
Tax fee KPMG (principal accountant 2018)
Other service fee Ernst & Young (principal accountant from 2019)
Other service fee KPMG (principal accountant 2018)
Total remuneration
In addition to the figures in the table above, the audit fees and audit related fees related to Equinor operated licences amount to USD
Research and development expenditures
Equinor has Research and development (R&D) activities within exploration, subsurface, drilling and well, facilities, low carbon and
renewables. Our R&D contributes to maximizing and developing long-term value from Equinor’s assets.
R&D expenditures were USD
expenditures are partly financed by partners of Equinor operated licences. Equinor's share of the expenditures has been recognised in
the Total operating expenses in the Consolidated statement of income.
Equinor, Annual Report on Form 20-F 2021 243
9 Financial items
Full year
(in USD million)
2021
2020
2019
Foreign currency exchange gains/(losses) derivative financial instruments
(1,288 )
Other foreign currency exchange gains/(losses)
(823 )
Net foreign currency exchange gains/(losses)
(646 )
Dividends received
Interest income financial investments, including cash and cash equivalents
Interest income non-current financial receivables
Interest income other current financial assets and other financial items
Interest income and other financial items
Gains/(losses) financial investments
(348 )
Gains/(losses) other derivative financial instruments
(708 )
Interest expense bonds and bank loans and net interest on related derivatives
(896 )
(951 )
(987 )
Interest expense lease liabilities
(93 )
(104 )
(126 )
Capitalised borrowing costs
Accretion expense asset retirement obligations
(453 )
(412 )
(456 )
Interest expense current financial liabilities and other finance expense
(114 )
(232 )
(360 )
Interest and other finance expenses
(1,223 )
(1,392 )
(1,450 )
Net financial items
(2,080 )
(836 )
(7 )
Equinor's main financial items relate to assets and liabilities categorised in the fair value through profit or loss and the amortised cost
category. For more information about financial instruments by category see note 26 Financial instruments: fair value measurement
and sensitivity analysis of market risk.
The line item Interest expense bonds and bank loans and net interest on related derivatives includes interest expenses of USD
billion, USD
category. It also includes net interest on related derivatives from the fair value through profit or loss category, amounting to a net
interest income of USD
billion for 2020 and 2019, respectively.
The line item Gains/(losses) other derivative financial instruments primarily includes fair value changes from the fair value through
profit or loss category on derivatives related to interest rate risk. For 2021 it is a loss of USD
USD
Foreign currency exchange gains/(losses) derivative financial instruments include fair value changes of currency derivatives related to
liquidity and currency risk. The line item Other foreign currency exchange gains/(losses) includes a net foreign currency exchange loss
of USD
2020 and 2019, respectively.
244 Equinor, Annual Report on Form 20-F 2021
10 Income taxes
Significant components of income tax expense
Full year
(in USD million)
2021
2020
2019
Current income tax expense in respect of current year
(21,271 )
(1,115 )
(7,892 )
Prior period adjustments
(28 )
Current income tax expense
(21,299 )
(802 )
(7,822 )
Origination and reversal of temporary differences
(1,778 )
(648 )
Recognition of previously unrecognised deferred tax assets
Change in tax regulations
(12 )
(6 )
Prior period adjustments
(60 )
(23 )
Deferred tax income/(expense)
(1,708 )
(435 )
Income tax
(23,007 )
(1,237 )
(7,441 )
As a measure to maintain activity in the oil and gas related industry during the Covid-19 pandemic, the Norwegian Government on
19 June 2020 enacted temporary targeted changes to Norway’s petroleum tax system for investments incurred in 2020 and 2021 and
for new projects with Plans for development and operations (PDOs) or Plans for installation and operations (PIOs) submitted to the
Ministry of Oil and Energy by the end of 2022 and approved prior to 1 January 2024. The changes are effective from 1 January 2020
and provide companies with a direct tax deduction in the special petroleum tax (
% tax rate) instead of tax depreciation over six
years. In addition, the tax uplift benefit, which has increased from
% to
%, will be recognised over one year instead of four
years. Tax depreciation towards the ordinary offshore corporate tax (
% tax rate) will continue with a six-year depreciation profile.
Equinor, Annual Report on Form 20-F 2021 245
Reconciliation of statutory tax rate to effective tax rate
Full year
(in USD million)
2021
2020
2019
Income/(loss) before tax
(4,259 )
Calculated income tax at statutory rate
1)
(7,053 )
(2,284 )
Calculated Norwegian Petroleum tax
2)
(17,619 )
(2,126 )
(5,499 )
Tax effect uplift
3)
Tax effect of permanent differences regarding divestments
(9 )
Tax effect of permanent differences caused by functional currency different from tax currency
(198 )
Tax effect of other permanent differences
Recognition of previously unrecognised deferred tax assets
Change in unrecognised deferred tax assets
(1,685 )
(974 )
Change in tax regulations
(12 )
(6 )
Prior period adjustments
(88 )
Other items including foreign currency effects
(378 )
(647 )
(139 )
Income tax
(23,007 )
(1,237 )
(7,441 )
Effective tax rate
-29.0 %
1)
The weighted average of statutory tax rates was
% in 2021,
% in 2020 and
% in 2019. The rates are influenced by
earnings composition between tax regimes with lower statutory tax rates and tax regimes with higher statutory tax rates.
2) The Norwegian petroleum tax rate is
%.
3) When computing the petroleum tax of
% on income from the Norwegian continental shelf, an additional tax-free allowance, or
uplift, is granted on the basis of the original capitalised cost of offshore production installations. Normally, a
% uplift may be
deducted from taxable income for a period of four years starting in the year in which the capital expenditure is incurred. For 2020
and 2021 temporary rules allow direct deduction of the whole uplift at a rate of
% in the year the capital expenditure is incurred.
For investments made in 2019 the uplift is calculated at a rate of
% per year, while the rate is
% per year for investments
made in 2018 and
% per year for investments under the transitional rules from 2013. Unused uplift may be carried forward
indefinitely. At year-end 2021 and 2020, unrecognised uplift credits amounted to USD
respectively.
246 Equinor, Annual Report on Form 20-F 2021
Deferred tax assets and liabilities comprise
(in USD million)
Tax losses
carried
forward
Property,
plant and
equipment
and
intangible
assets
1)
Asset
retirement
obligations
1)
Lease
liabilities
Pensions
Derivatives
Other
Total
Deferred tax at 31 December 2021
Deferred tax assets
Deferred tax liabilities
(27,136 )
(21 )
(1,453 )
(530 )
(29,140 )
Net asset/(liability) at 31 December
2021
(26,417 )
(1,432 )
(7,655)
Deferred tax at 31 December 2020
Deferred tax assets
Deferred tax liabilities
(28,290 )
(4 )
(11 )
(236 )
(676 )
(29,217 )
Net asset/(liability) at 31 December
2020
(27,464 )
(206 )
(6,250 )
1)
Restated 2020 figures due to a policy change affecting ARO calculation, see note 2 Significant accounting policies. The net
deferred tax liability in Property, plant and equipment and intangible assets has increased by USD
deferred tax asset in Asset retirement obligations has increased by USD
Changes in net deferred tax liability during the year were as follows:
(in USD million)
2021
2020
2019
Net deferred tax liability at 1 January
Charged/(credited) to the Consolidated statement of income
(381 )
Charged/(credited) to Other comprehensive income
(19 )
Foreign currency translation effects and other effects
(337 )
Net deferred tax liability at 31 December
Equinor, Annual Report on Form 20-F 2021 247
Deferred tax assets and liabilities are offset to the extent that the deferred taxes relate to the same fiscal authority, and there is a
legally enforceable right to offset current tax assets against current tax liabilities. After netting deferred tax assets and liabilities by
fiscal entity and reclassification to Held for Sale, deferred taxes are presented on the balance sheet as follows:
At 31 December
(in USD million)
2021
2020
Deferred tax assets
Deferred tax liabilities
Deferred tax assets reported in Assets classified as held for sale
Deferred tax assets are recognised based on the expectation that sufficient taxable income will be available through reversal of
taxable temporary differences or future taxable income. At year-end 2021 and 2020 the deferred tax assets of USD
USD
preceding period. The losses will be utilised through reversal of taxable temporary differences and other taxable income mainly from
production of oil and gas. It is considered probable based on business forecasts and/or a history of taxable income that such profits
will be available.
Unrecognised deferred tax assets
At 31 December
2021
2020
(in USD million)
Basis
Tax
Basis
Tax
Deductible temporary differences
Unused tax credits
Tax losses carried forward
Total unrecognised deferred tax assets
Approximately
% of the unrecognised carry forward tax losses can be carried forward indefinitely. The majority of the remaining part
of the unrecognised tax losses expire
. The unrecognised tax credits expire from 2030, while the unrecognised deductible
temporary differences do not expire under the current tax legislation. Deferred tax assets have not been recognised in respect of
these items because currently there is insufficient evidence to support that future taxable profits will be available to secure utilisation
of the benefits.
At year-end 2021, unrecognised deferred tax assets in the USA and Angola represents USD
respectively, of the total unrecognised deferred tax assets of USD
the USA and USD
assets originate from several different tax jurisdictions.
248 Equinor, Annual Report on Form 20-F 2021
11 Property, plant and equipment
(in USD million)
Machinery,
equipment and
transportation
equipment
Production
plants and oil
and gas
assets
Refining and
manufacturing
plants
Buildings
and land
Assets under
development
Right of use
assets
4)
Total
Cost at 31 December 2020 as reported
Impact of policy change
5)
Cost at 31 December 2020 as restated
Additions through business combinations
Additions and transfers
(396 )
Disposals at cost
(1,496 )
(1,975 )
(70 )
(353 )
(25 )
(501 )
(4,420 )
Assets reclassified to held for sale
(1,010 )
(563 )
(91 )
(1,664 )
Foreign currency translation effects
(13 )
(4,052 )
(220 )
(6 )
(130 )
(77 )
(4,497 )
Cost at 31 December 2021
Accumulated depreciation and impairment
losses at 31 December 2020
(2,596 )
(132,427 )
(8,005 )
(524 )
(1,275 )
(2,251 )
(147,079 )
Depreciation
(68 )
(9,136 )
(232 )
(42 )
(930 )
(10,408 )
Impairment losses
(42 )
(2,092 )
(401 )
(21 )
(390 )
(17 )
(2,962 )
Reversal of impairment losses
Transfers
(1,319 )
(61 )
(11 )
(11 )
Accumulated depreciation and impairment
on disposed assets
Accumulated depreciation and impairment
assets classified as held for sale
Foreign currency translation effects
(18 )
Accumulated depreciation and impairment
losses at 31 December 2021
(1,188 )
(137,763 )
(7,926 )
(320 )
(344 )
(2,619 )
(150,159 )
Carrying amount at 31 December 2021
Estimated useful lives (years)
UoP
1)
2)
3)
Equinor, Annual Report on Form 20-F 2021 249
(in USD million)
Machinery,
equipment and
transportation
equipment
Production
plants and oil
and gas
assets
Refining and
manufacturing
plants
Buildings
and land
Assets under
development
Right of use
assets
4)
Total
Cost at 31 December 2019 as reported
Impact of policy change
5)
Cost at 31 December 2019 as restated
Additions and transfers
Disposals at cost
(28 )
(243 )
(7 )
(5 )
(13 )
(295 )
Assets reclassified to held for sale
(66 )
(9,095 )
(15 )
(159 )
(9,335 )
Foreign currency translation effects
Cost at 31 December 2020
Accumulated depreciation and impairment
losses at 31 December 2019
(2,395 )
(125,327 )
(7,051 )
(475 )
(892 )
(1,329 )
(137,469 )
Depreciation
(102 )
(8,240 )
(248 )
(23 )
(874 )
(9,488 )
Impairment losses
(201 )
(4,667 )
(516 )
(36 )
(445 )
(25 )
(5,889 )
Reversal of impairment losses
Transfers
(68 )
(1 )
(10 )
Accumulated depreciation and impairment
on disposed assets
Accumulated depreciation and impairment
assets classified as held for sale
Foreign currency translation effects
(9 )
(2,947 )
(196 )
(3 )
(56 )
(35 )
(3,244 )
Accumulated depreciation and impairment
losses at 31 December 2020
(2,596 )
(132,427 )
(8,005 )
(524 )
(1,275 )
(2,251 )
(147,079 )
Carrying amount at 31 December 2020
Estimated useful lives (years)
UoP
1)
2)
3)
1)
Depreciation according to unit of production method (UoP), see note 2 Significant accounting policies
.
2) Land is not depreciated
.
Buildings include leasehold improvements.
3) Depreciation linearly over contract period.
4) See note 23 Leases.
5) See note 2 Significant accounting policies and note 21 Provisions and other liabilities. For 2020 table, additions and currency
lines are also impacted by the policy change.
The carrying amount of assets transferred to Property plant and equipment from Intangible assets
in 2021 and 2020 amounted to
USD
For assets reclassified to held for sale, see note 5 Acquisitions and disposals.
250 Equinor, Annual Report on Form 20-F 2021
Net impairments/(reversal) of impairments
Full year
Property, plant and equipment
3)
(in USD million)
2021
2020
2019
2021
2020
2019
2021
2020
2019
Producing and development assets
1)
(2 )
Goodwill
1)
Other intangible assets
1)
Acquisition costs related to oil and gas prospects
2)
Total net impairment loss/(reversal) recognised
1)
Producing and development assets, refining and manufacturing plants, goodwill and other intangible assets are subject to
impairment assessment under IAS 36. The total net impairment losses recognised under IAS 36 in 2021 amount to USD
billion, compared to 2020 when the net impairment amounted to USD
and gas prospects (intangible assets).
2) Acquisition costs related to exploration activities, subject to impairment assessment under the successful efforts method (IFRS
6).
3) See note 12 Intangible assets
.
For impairment purposes, the asset's carrying amount is compared to its recoverable amount. The recoverable amount is the higher of
fair value less cost of disposal (FVLCOD) and estimated value in use (VIU).
The base discount rate for VIU calculations is
% real after tax. The discount rate is derived from Equinor's weighted average cost
of capital. For projects, mainly within the REN segment, in periods with fixed low risk income a lower discount rate will be considered.
A derived pre-tax discount is in the range of
-
% for E&P Norway,
-
% for E&P International,
-
% for E&P USA and
% for
MMP depending on asset specific characteristics, such as specific tax treatments, cash flow profiles and economic life. See note 2
Significant accounting policies to the Consolidated financial statements
for further information regarding impairment on property, plant
and equipment.
The table below describes, per area, the Producing and development assets being impaired/(reversed) and the valuation method
used to determine the recoverable amount; the net impairment/(reversal), and the carrying amount after impairment.
At 31 December 2021
At 31 December 2020
(in USD million)
Valuation
method
Carrying
amount after
impairment
Net impairment
loss/ (reversal)
Carrying
amount after
impairment
Net impairment
loss/ (reversal)
Exploration & Production Norway
VIU
(1,102 )
Exploration & Production USA - onshore
VIU
(19 )
FVLCOD
Exploration & Production USA - offshore Gulf of Mexico
VIU
North America - offshore other areas
VIU
FVLCOD
(22 )
Europe and Asia
VIU
Marketing, Midstream & Processing
VIU
FVLCOD
Right of use assets/Other
VIU
(2 )
FVLCOD
Total
Equinor, Annual Report on Form 20-F 2021 251
Exploration & Production Norway
In 2021, the impairment reversals were USD
In 2020, the impairments were USD
and increased cost estimates added to the impairment losses.
Exploration & Production USA - onshore
In 2021, the net impairment was USD
impairments were USD
revision and sale of an asset. The reversal of USD
caused by upward reserve revision.
In 2020, the net impairment was USD
losses of USD
assumptions and a change to fair value less cost of disposal valuation in relation to held for sale classification. The impairment
reversals of USD
Exploration & Production USA - offshore Gulf of Mexico
In 2021, the impairment was USD
In 2020, the impairments were USD
Exploration & Production International – North America offshore other areas
In 2021, the impairment reversal was USD
In 2020, the impairment was USD
Exploration & Production International – Europe and Asia
In 2021, the net impairment was USD
revisions. The reversal of USD
In 2020, the impairments were USD
Marketing, Midstream & Processing
In 2021, the impairment losses were USD
2
fair value less cost of disposal valuation in connection with a held for sale classification.
In 2020, the impairment losses were USD
Reduced volume-estimates from processing added to the impairment loss.
Accounting assumptions
Management’s future commodity price assumptions and currency assumptions are used for value in use impairment testing. The
same assumptions are also used for evaluating investment opportunities, together with other relevant criteria, including among others
robustness targets (value creation in lower commodity price scenarios). While there are inherent uncertainties in the assumptions, the
commodity price assumptions as well as currency assumptions reflect management’s best estimate of the price and currency
development over the life of the Group’s assets based on its view of relevant current circumstances and the likely future development
of such circumstances, including energy demand development, energy and climate change policies as well as the speed of the energy
transition, population and economic growth, geopolitical risks, technology and cost development and other factors. Management’s
best estimate also takes into consideration a range of external forecasts.
Equinor has performed a thorough and broad analysis of the expected development in drivers for the different commodity markets and
exchange rates. Significant uncertainty exists regarding future commodity price development due to the transition to a lower carbon
economy, future supply actions by OPEC+ and other factors. The management’s analysis of the expected development in drivers for
the different commodity markets and exchange rates resulted in changes in the long-term price assumptions with effect from the third
quarter of 2021. The following price assumptions have been the basis for the impairment assessments.
All commodity prices are on a real 2021 basis, and comparable prices as per the fourth quarter of 2020 and up to the third quarter of
2021 are given in brackets.
For Brent blend, Equinor expects a price of
declining to
unchanged compared to year-end 2020, with the exception that the real year has been changed from 2020 to 2021.
For natural gas in the UK (NBP), we expect some volatility, where the trend is a decrease to
USD/mmbtu). From 2030, a flatter price-curve is expected, with the price gradually increasing to
252 Equinor, Annual Report on Form 20-F 2021
USD/mmbtu). Beyond 2040, a declining price trend is foreseen as the energy transition is expected to impact the demand side. For
2050, the price is expected to be at the pre-2035 level of
Henry Hub is expected to decrease to
level that is expected to continue through the 2040s.
The electricity prices are expected to increase significantly in the future. Due to the increasing gas and CO
2
in Germany are by the end of fourth quarter expected to be
end of the third quarter was
towards 2050.
Climate considerations are included in the impairment calculations directly by estimating the CO
2
the expected effect of climate change is also included in the estimated commodity prices where supply and demand are considered.
The prices also have effect on the estimated production profiles and economic cut-off of the projects. Furthermore, climate
considerations are a part of the investment decisions following Equinor’s strategy and commitments to the energy transition.
The EU ETS price has increased significantly from
in the region of
thereafter increasing to
Plan for the period 2021-2030 (Meld. St 13 (2020-2021)) which assumes a gradually increased CO
2
Norwegian CO
2
Impairment calculations are based on what is considered to be best estimate. To reflect that carbon will have a cost for all our assets
the current best estimate is considered to be EU ETS for countries outside EU where carbon is not already subject to taxation or
where Equinor has not established specific estimates.
The long-term NOK currency exchange rates are expected to be unchanged. The NOK/USD rate from 2024 and onwards is kept at
, the NOK/EUR at
.
The Weighted Average Cost of Capital (WACC) rate is
%. This rate is basically the interest rate used for upstream activities. For
other business areas the discount rate will be determined based on a risk assessment. Typically, the rate will decrease for
assets/projects where the revenue is secured by fixed fees or government grants.
Sensitivities
Commodity prices have historically been volatile. Significant downward adjustments of Equinor’s commodity price assumptions would
result in impairment losses on certain producing and development assets in Equinor’s portfolio including intangible assets that are
subject to impairment assessment, while an opposite adjustment could lead to impairment-reversals. If a decline in commodity price
forecasts over the lifetime of the assets were
%, considered to represent a reasonably possible change, the impairment amount to
be recognised could illustratively be in the region of USD
climate changes for possible effect of using the prices in a 1.5
o
C compatible Net Zero Emission by 2050 scenario as estimated by the
International Energy Agency (IEA)
These illustrative impairment sensitivities, both based on a simplified method, assumes no changes to input factors other than prices;
however, a price reduction of
% or those representing Net Zero Emission scenario is likely to result in changes in business plans as
well as other factors used when estimating an asset’s recoverable amount. These associated changes reduce the stand-alone impact
on the price sensitivities. Changes in such input factors would likely include a reduction in the cost level in the oil and gas industry as
well as offsetting foreign currency effects, both of which have historically occurred following significant changes in commodity prices.
The illustrative sensitivities are therefore not considered to represent a best estimate of an expected impairment impact, nor an
estimated impact on revenues or operating income in such a scenario. In comparison, following the amended assumptions described
above in the accounting assumptions section and the decline in commodity prices, the impairment impact recognised is considerably
lower. A significant and prolonged reduction in oil and gas prices would also result in mitigating actions by Equinor and its licence
partners, as a reduction of oil and gas prices would impact drilling plans and production profiles for new and existing assets.
Quantifying such impacts is considered impracticable, as it requires detailed technical, geological and economical evaluations based
on hypothetical scenarios and not based on existing business or development plans.
Equinor, Annual Report on Form 20-F 2021 253
12 Intangible assets
(in USD million)
Exploration
expenses
Acquisition
costs - oil and
gas prospects
Goodwill
Other
Total
Cost at 31 December 2020
Additions through business combinations
Additions
Disposals at cost
(22 )
(3 )
(29 )
(53 )
Transfers
(432 )
(1,137 )
(161 )
(1,730 )
Expensed exploration expenditures previously capitalised
(19 )
(152 )
(171 )
Impairment of goodwill
(1 )
(1 )
Foreign currency translation effects
(21 )
(10 )
(70 )
(10 )
(111 )
Cost at 31 December 2021
Accumulated depreciation and impairment losses at 31 December 2020
(356 )
(356 )
Amortisation and impairments for the year
(24 )
(24 )
Amortisation and impairment losses disposed intangible assets
Foreign currency translation effects
Accumulated depreciation and impairment losses at 31 December 2021
(364 )
(364 )
Carrying amount at 31 December 2021
(in USD million)
Exploration
expenses
Acquisition
costs - oil and
gas prospects
Goodwill
Other
Total
Cost at 31 December 2019
Additions
Disposals at cost
(7 )
(8 )
Transfers
(16 )
(73 )
(89 )
Assets reclassified to held for sale
(339 )
(160 )
(499 )
Expensed exploration expenditures previously capitalised
(1,169 )
(1,337 )
(2,506 )
Impairment of goodwill
(42 )
(42 )
Foreign currency translation effects
Cost at 31 December 2020
Accumulated depreciation and impairment losses at 31 December 2019
(295 )
(295 )
Amortisation and impairments for the year
(35 )
(35 )
Accumulated depreciation and impairment assets classified as held for
sale
(17 )
(17 )
Amortisation and impairment losses disposed intangible assets
(6 )
(6 )
Foreign currency translation effects
(3 )
(3 )
Accumulated depreciation and impairment losses at 31 December 2020
(356 )
(356 )
Carrying amount at 31 December 2020
254 Equinor, Annual Report on Form 20-F 2021
The useful lives of intangible assets are assessed to be either finite or indefinite. Intangible assets with finite useful lives are amortized
systematically over their estimated economic lives, ranging between
-
Included in the goodwill of USD
Exploration & Production Norway area and USD
In 2021, Acquisition cost - oil and gas prospects were impacted by net impairment of USD
related to exploration activities of USD
and Gulf of Mexico. Net reversal of
In 2020, Acquisition cost - oil and gas prospects were impacted by net impairment of signature bonuses and acquisition costs totaling
USD
exploration activities of USD
International.
See note 11 Property, plant and equipment regarding sensitivities.
In 2020, Equinor decided to impair capitalised well costs of USD
Tanzania. The impairment was presented in the line-item Exploration expenses.
Impairment losses and reversals of impairment losses are presented as Exploration expenses and Depreciation, amortisation and net
impairment losses on the basis of their nature as exploration assets (intangible assets) and other intangible assets, respectively. The
impairment losses and reversal of impairment losses are based on recoverable amount estimates triggered by changes in reserve
estimates, cost estimates and market conditions. See note 11 Property, plant and equipment for more information on the basis for
impairment assessments.
The table below shows the aging of capitalised exploration expenditures.
(in USD million)
2021
2020
Less than one year
Between one and five years
More than five years
Total capitalised exploration expenditures
The table below shows the components of the exploration expenses.
Full year
(in USD million)
2021
2020
2019
Exploration expenditures
Expensed exploration expenditures previously capitalised
Capitalised exploration
(194 )
(394 )
(507 )
Exploration expenses
Equinor, Annual Report on Form 20-F 2021 255
13 Equity accounted investments
(in USD million)
2021
2020
Net investments at 1 January
Net income/(loss) from equity accounted investments
Acquisitions and increase in capital
Dividend and other distributions
(230 )
(141 )
Other comprehensive income/(loss)
(58 )
Divestments, derecognition and decrease in paid in capital
(31 )
(147 )
Net investments at 31 December
Included in equity accounted investments
Other long-term receivable in equity accounted investments
For the equity accounted investments, voting rights corresponds to ownership.
Equity accounted investments consist of several investments, none above USD
an individual basis.
14 Financial investments and financial receivables
Non-current financial investments
At 31 December
(in USD million)
2021
2020
Bonds
Listed equity securities
Non-listed equity securities
Financial investments
3,346
4,083
Bonds and equity securities mainly relate to investment portfolios held by Equinor’s captive insurance company and other listed and
non-listed equities held for long-term strategic purposes, mainly accounted for using fair value through profit or loss.
Included in Listed equity securities are shares in Scatec ASA of USD
respectively
.
256 Equinor, Annual Report on Form 20-F 2021
Non-current prepayments and financial receivables
At 31 December
(in USD million)
2021
2020
Interest bearing financial receivables
Other interest bearing receivables
Prepayments and other non-interest bearing receivables
Prepayments and financial receivables
Interest bearing financial receivables primarily relate to loans to employees and project financing of equity accounted companies.
Other interest bearing receivables primarily relate to tax receivables.
Current financial investments
At 31 December
(in USD million)
2021
2020
Time deposits
Interest bearing securities
Listed equity securities
Financial investments
At 31 December 2021, current financial investments
include USD
company which mainly are accounted for using fair value through profit or loss. The corresponding balance at 31 December 2020 was
USD
For information about financial instruments by category, see note 26
Financial instruments: fair value measurement and sensitivity
analysis of market risk
.
15 Inventories
At 31 December
(in USD million)
2021
2020
Crude oil
Petroleum products
Natural gas
Other
Inventories
Other inventory consists mainly of drilling and well equipment.
The write-down of inventories from cost to net realisable value amounted to an expense of USD
and 2020, respectively.
Equinor, Annual Report on Form 20-F 2021 257
16 Trade and other receivables
At 31 December
(in USD million)
2021
2020
Trade receivables from contracts with customers
Other current receivables
Joint venture receivables
Receivables from equity accounted associated companies and other related parties
Total financial trade and other receivables
Non-financial trade and other receivables
Trade and other receivables
Trade receivables from contracts with customers are shown net of an immaterial provision for expected losses.
For more information about the credit quality of Equinor's counterparties, see note 6 Financial risk and capital management. For
currency sensitivities, see note 26 Financial instruments: fair value measurement and sensitivity analysis of market risk
17 Cash and cash equivalents
At 31 December
(in USD million)
2021
2020
Cash at bank available
Time deposits
Money market funds
Interest bearing securities
Restricted cash, including margin deposits
Cash and cash equivalents
Restricted cash at 31 December 2021 include collateral deposits of USD
collateral deposits at 31 December 2020 were USD
exchanges where Equinor is participating. The terms and conditions related to these requirements are determined by the respective
exchanges.
18 Shareholders' equity and dividends
At 31 December 2021, Equinor’s share capital of NOK
) comprised
nominal value of NOK
. Share capital at 31 December 2020 was NOK
) comprised
.
Equinor ASA has only one class of shares and all shares have voting rights. The holders of shares are entitled to receive dividends as
and when declared and are entitled to one vote per share at the annual general meeting of the company.
During 2021 dividend for the third and for the fourth quarter of 2020 and dividend for the first and second quarter of 2021 were settled.
Dividend declared but not yet settled, is presented as dividends payable in the Consolidated balance sheet. The Consolidated
statement of changes in equity shows declared dividend in the period (retained earnings). Dividend declared in 2021 relate to the
fourth quarter of 2020 and to the first three quarters of 2021.
On 8 February 2022, the board of directors proposed to declare a dividend for the fourth quarter of 2021 of USD
an extraordinary dividend of USD
258 Equinor, Annual Report on Form 20-F 2021
dividend 12 May 2022 on Oslo Børs and for ADR holders on New York Stock Exchange. Record date will be 13 May 2022 and
payment date will be 27 May 2022.
At 31 December
(in USD million)
2021
2020
Dividends declared
USD per share or ADS
Dividends paid
USD per share or ADS
NOK per share
Share buy-back programme
In July 2021 Equinor launched the first tranche of around USD
USD
initially USD
to USD
third party was entered into for up to USD
agreement with the Ministry of Petroleum and Energy be redeemed at the next annual general meeting in May 2022, in order for the
Norwegian State to maintain their ownership percentage in Equinor.
The first order in the open market was concluded in September 2021. The second order in the open market was concluded in January
2022. As of 31 December, USD
been settled, while USD
million has been settled.
Due to the irrevocable agreement with the third party, both the first and second order in the open market, in total USD
been recognised as a reduction in equity as treasury shares. The remaining order of the second tranche has been accrued for and
along with acquired shares not settled, classified as Trade, other payables and provisions. The recognition of the State’s share will be
deferred until the decision at the annual general meeting in May 2022.
On 8 February 2022, the Board announced an annual share buy-back programme for 2022 with up to USD
shares to be redeemed from the Norwegian State, subject to authorisation from the annual general meeting. The annual share buy-
back programme is expected to be executed when Brent Blend oil price is in or above the range of
-
to capital employed adjusted stays within the communicated ambition of
-
purpose of the share buy-back programme is to reduce the issued share capital of the company. All shares repurchased as part of the
programme will be cancelled.
On 8 February 2022, the board of directors resolved the commencement of the first tranche of the share buy-back programme for
2022 of a total of USD
25 March 2022..
Number of shares
2021
2020
Share buy-back programme at 1 January
Purchase
Cancellation
(26,721,259 )
Share buy-back programme at 31 December
Equinor, Annual Report on Form 20-F 2021 259
Employees share saving plan
Number of shares
2021
2020
Share saving plan at 1 January
Purchase
Allocated to employees
(2,744,381 )
(3,236,327 )
Share saving plan at 31 December
In 2021 and 2020 treasury shares were purchased and allocated to employees participating in the share saving plan for USD
million and USD
19 Finance debt
Non-current finance debt
Finance debt measured at amortised cost
Weighted average interest
rates in %
1)
Carrying amount in USD
millions at 31 December
Fair value in USD
millions at 31 December
2)
2021
2020
2021
2020
2021
2020
Unsecured bonds
United States Dollar (USD)
Euro (EUR)
Great Britain Pound (GBP)
Norwegian Kroner (NOK)
Total unsecured bonds
Unsecured loans
Japanese Yen (JPY)
Total unsecured loans
Total
Non-current finance debt due within one year
Non-current finance debt
1)
Weighted average interest rates are calculated based on the contractual rates on the loans per currency at 31 December and do
not include the effect of swap agreements.
2) Fair values are determined from external calculation models based on market observations from various sources, classified at
level 2 in the fair value hierarchy. For more information regarding fair value hierarchy, see note 26 Financial Instruments: fair
value measurement and sensitivity of market risk.
Unsecured bonds amounting to USD
amounting to USD
swapped. The table does not include the effects of agreements entered into to swap the various currencies into USD. For further
information see note 26 Financial instruments: fair value measurement and sensitivity analysis of market risk.
Substantially all unsecured bonds and unsecured bank loan agreements contain provisions restricting future pledging of assets to
secure borrowings without granting a similar secured status to the existing bondholders and lenders.
260 Equinor, Annual Report on Form 20-F 2021
In 2020 and 2021 Equinor issued the following bonds
Issuance date
Currency
Amount in million
Interest rate in %
Maturity date
18 May 2020
USD
18 May 2020
EUR
18 May 2020
USD
18 May 2020
EUR
1 April 2020
USD
1 April 2020
USD
1 April 2020
USD
1 April 2020
USD
1 April 2020
USD
No new bonds were issued in 2021.
Out of Equinor's total outstanding unsecured bond portfolio, 39 bond agreements contain provisions allowing Equinor to call the debt
prior to its final redemption at par or at certain specified premiums if there are changes to the Norwegian tax laws. The carrying
amount of these agreements is USD
For more information about the revolving credit facility, maturity profile for undiscounted cash flows and interest rate risk management,
see note 6 Financial risk and capital management.
Non-current finance debt maturity profile
At 31 December
(in USD million)
2021
2020
Year 2 and 3
Year 4 and 5
After 5 years
Total repayment of non-current finance debt
Weighted average maturity (years - including current portion)
Weighted average annual interest rate (% - including current portion)
Current finance debt
At 31 December
(in USD million)
2021
2020
Collateral liabilities
Non-current finance debt due within one year
Other including US Commercial paper program and bank overdraft
Total current finance debt
Weighted average interest rate (%)
Collateral liabilities and other current liabilities mainly relate to cash received as security for a portion of Equinor's credit exposure and
outstanding amounts on US Commercial paper (CP) programme. Issuance on the CP programme amounted to USD
of
31 December 2021 and USD
Equinor, Annual Report on Form 20-F 2021 261
Reconciliation of cash flows from financing activities to finance line items in balance sheet
(in USD million)
Non-current
finance debt
Current
finance
debt
Financial
receivable
Collaterals
1)
Additional
paid in
capital
/Treasury
shares
Non-
controlling
interest
Dividend
payable
Lease
liabilities
2)
Total
At 1 January 2021
(967 )
(1,588 )
New finance debt
Repayment of finance debt
(2,675 )
(2,675 )
Repayment of lease liabilities
(1,238 )
(1,238 )
Dividend paid
(1,797 )
(1,797 )
Share buy-back
(321 )
(321 )
Net current finance debt and other
finance activities
(335 )
(651 )
(75 )
(18 )
Net cash flow from financing activities
(3,010 )
(651 )
(396 )
(18 )
(1,797 )
(1,238 )
(4,836 )
Transfer to current portion
(1,724 )
Effect of exchange rate changes
(422 )
(8 )
(1 )
(61)
Dividend declared
New leases
Other changes
(6 )
(43 )
(19 )
(21 )
Net other changes
(1,591 )
(43 )
At 31 December 2021
(1,577 )
(2,027 )
262 Equinor, Annual Report on Form 20-F 2021
(in USD million)
Non-current
finance debt
Current
finance
debt
Financial
receivable
Collaterals
1)
Additional
paid in
capital
/Treasury
shares
Non-
controlling
interest
Dividend
payable
Lease
liabilities
2)
Total
At 1 January 2020
(634 )
(708 )
New finance debt
Repayment of finance debt
(2,055 )
(2,055 )
Repayment of lease liabilities
(1,277 )
(1,277 )
Dividend paid
(2,330 )
(2,330 )
Share buy-back
(1,059 )
(1,059 )
Net current finance debt and other
finance activities
(329 )
(69 )
(16 )
Net cash flow from financing activities
(329 )
(1,128 )
(16 )
(2,330 )
(1,277 )
Transfer to current portion
(30 )
Effect of exchange rate changes
(27 )
Dividend declared
New leases
Other changes
(8 )
(4 )
(20 )
(5 )
Net other changes
(54 )
(4 )
At 31 December 2020
(967 )
(1,588 )
1) Financial receivable collaterals are included in Trade and other receivables in the Consolidated balance sheet. See note 16 Trade and
other receivables for more information.
2) See note 23 Leases for more information.
Equinor, Annual Report on Form 20-F 2021 263
20 Pensions
the main contribution plan. See note 2 Significant accounting policies to the Consolidated financial statements for more information
about the accounting treatment of the notional contribution plans reported in Equinor ASA.
In addition, Equinor ASA has a defined benefit plan. This benefit plan was closed in 2015 for new employees and for employees with
more than 15 year to regular retirement age.
companies in the group are subject to, and complies with, the requirements of the Norwegian Mandatory Company Pensions Act.
The defined benefit plans in Norway are managed and financed through Equinor Pensjon (Equinor's pension fund - hereafter Equinor
Pension). Equinor Pension is an independent pension fund that covers the employees in Equinor's Norwegian companies. The
pension fund's assets are kept separate from the company's and group companies' assets. Equinor Pension is supervised by the
Financial Supervisory Authority of Norway ("Finanstilsynet") and is licenced to operate as a pension fund.
for all employees until age
. Pension from the AFP scheme will be paid from the AFP plan administrator to employees for their full
lifetime. Equinor has determined that its obligations under this multi-employer defined benefit plan can be estimated with sufficient
reliability for recognition purposes. Accordingly, the estimated proportionate share of the AFP plan is recognised as a defined benefit
obligation.
The present values of the defined benefit obligation, except for the notional contribution plan, and the related current service cost and
past service cost are measured using the projected unit credit method. The assumptions for salary increase, increases in pension
payments and social security base amount are based on agreed regulation in the plans, historical observations, future expectations of
the assumptions and the relationship between these assumptions. At 31 December 2021, the discount rate for the defined benefit
plans in Norway was established on the basis of seven years' mortgage covered bonds interest rate extrapolated on a yield curve
which matches the duration of Equinor's payment portfolio for earned benefits, which was calculated to be
2021. Social security tax is calculated based on a pension plan's net funded status and is included in the defined benefit obligation.
The recognition of a net surplus for the funded plan is based on the assumption that the net assets represent a future value for
Equinor, either as possible distribution to premium fund which can be used for future funding of new liabilities, or disbursement of
equity in the pension fund.
Equinor has more than one defined benefit plan, but the disclosure is made in total since the plans are not subject to materially
different risks. Pension plans outside Norway are not material and as such not disclosed separately. The tables in this note present
pension costs on a gross basis, before allocation to licence partners. In the Consolidated statement of income, the pension costs in
Equinor ASA are presented net of costs allocated to licence partners.
Net pension cost
(in USD million)
2021
2020
2019
Current service cost
Past service cost
Losses/(gains) from curtailment, settlement or plan amendment
Notional contribution plans
Defined benefit plans
Defined contribution plans
Total net pension cost
In addition to the pension cost presented in the table above, financial items related to defined benefit plans are included in the
Consolidated statement of income within Net financial items. Interest cost and changes in fair value of notional contribution plans
amounts to USD
and USD
264 Equinor, Annual Report on Form 20-F 2021
Equinor, Annual Report on Form 20-F 2021 265
Changes in defined benefit obligations (DBO) and plan assets during the year
(in USD million)
2021
2020
DBO at 1 January
Current service cost
Interest cost
Actuarial (gains)/losses - Financial assumptions
Actuarial (gains)/losses - Experience
(66 )
(61 )
Past service cost
Benefits paid
(295 )
(250 )
Paid-up policies
(7 )
Foreign currency translation effects
(300 )
Changes in notional contribution liability
DBO at 31 December
Fair value of plan assets at 1 January
Interest income
Return on plan assets (excluding interest income)
Company contributions
Benefits paid
(137 )
(113 )
Paid-up policies and personal insurance
(7 )
Foreign currency translation effects
(204 )
Fair value of plan assets at 31 December
Net pension liability at 31 December
(2,954 )
(2,981 )
Represented by:
Asset recognised as non-current pension assets (funded plan)
Liability recognised as non-current pension liabilities (unfunded plans)
(4,403 )
(4,292 )
DBO specified by funded and unfunded pension plans
9,359
9,216
Funded
Unfunded
Actual return on assets
Equinor recognised an actuarial loss from changes in financial assumptions in 2021, mainly due to a larger increase in rate of
compensation increase and expected rate of pension increase compared to the other assumptions. An actuarial loss was recognised
in 2020.
Actuarial losses and gains recognised directly in Other comprehensive income (OCI)
(in USD million)
2021
2020
2019
Net actuarial (losses)/gains recognised in OCI during the year
Foreign currency translation effects
(109 )
Tax effects of actuarial (losses)/gains recognised in OCI
(35 )
(98 )
Recognised directly in OCI during the year, net of tax
112
(87 )
Cumulative actuarial (losses)/gains recognised directly in OCI, net of tax
(787 )
(899 )
(812 )
266 Equinor, Annual Report on Form 20-F 2021
Actuarial assumptions
Assumptions used to determine
benefit costs in %
Assumptions used to determine
benefit obligations in %
Rounded to the nearest quartile
2021
2020
2021
2020
Discount rate
Rate of compensation increase
Expected rate of pension increase
Expected increase of social security base amount (G-amount)
Weighted-average duration of the defined benefit obligation
The assumptions presented are for the Norwegian companies in Equinor which are members of Equinor's pension fund. The defined
benefit plans of other subsidiaries are immaterial to the consolidated pension assets and liabilities.
For population in Norway, the mortality table K2013, issued by The Financial Supervisory Authority of Norway, is used as the best
mortality estimate.
Disability tables for plans in Norway developed by the actuary were implemented in 2013 and represent the best estimate to use for
plans in Norway.
Sensitivity analysis
The table below presents an estimate of the potential effects of changes in the key assumptions for the defined benefit plans. The
following estimates are based on facts and circumstances as of 31 December 2021.
Discount rate
Expected rate of
compensation
increase
Expected rate of
pension increase
Mortality assumption
(in USD million)
0.50%
-0.50%
0.50%
-0.50%
0.50%
-0.50%
+ 1 year
- 1 year
Effect on:
Defined benefit obligation at 31 December 2021
(645 )
(150 )
(545 )
(330 )
Service cost 2022
(20 )
(9 )
(14 )
(7 )
The sensitivity of the financial results to each of the key assumptions has been estimated based on the assumption that all other
factors would remain unchanged. The estimated effects on the financial result would differ from those that would actually appear in the
Consolidated financial statements because the Consolidated financial statements would also reflect the relationship between these
assumptions.
Equinor, Annual Report on Form 20-F 2021 267
Pension assets
The plan assets related to the defined benefit plans were measured at fair value. Equinor Pension invests in both financial assets and
real estate.
The table below presents the portfolio weighting as approved by the board of Equinor Pension for 2021. The portfolio weight during a
year will depend on the risk capacity.
Pension assets on investments classes
Target portfolio
weight
(in %)
2021
2020
Equity securities
29-38
Bonds
46-59
Money market instruments
0-14
Real estate
5-10
Other assets, including derivatives
(0.1 )
Total
In 2021,
% of the equity securities and
% of bonds had quoted market prices in an active market.
% of the equity securities,
% of bonds and
% of money market instruments had market prices based on inputs other than quoted prices. If quoted market
prices are not available, fair values are determined from external calculation models based on market observations from various
sources.
In 2020,
% of the equity securities and
% of bonds had quoted market prices in an active market.
% of the equity securities,
% of bonds and
% of money market instruments had market prices based on inputs other than quoted prices.
For definition of the various levels, see note 26 Financial instruments: fair value measurement and sensitivity analysis of market risk.
Company contributions to be made to Equinor Pension in 2022 are expected to be in the range of USD
21 Provisions and other liabilities
(in USD million)
Asset retirement
obligations
Claims and
litigations
Other
provisions and
liabilities
Total
Non-current portion at 31 December 2020 before restatement
Impact of ARO policy change
Non-current portion at 31 December 2020 after restatement
Current portion at 31 December 2020 reported as Trade, other payables and
provisions
Provisions and other liabilities at 31 December 2020
New or increased provisions and other liabilities
Change in estimates
(1,097 )
(58 )
(141 )
(1,296 )
Amounts charged against provisions and other liabilities
(125 )
(870 )
(524 )
(1,519 )
Effects of change in the discount rate
(1,610 )
-
(13 )
(1,623 )
Reduction due to divestments
(359 )
-
-
(359 )
Accretion expenses
-
Reclassification and transfer
(74 )
Foreign currency translation effects
(471 )
(5 )
(476 )
Provisions and other liabilities at 31 December 2021
Non-current portion at 31 December 2021
268 Equinor, Annual Report on Form 20-F 2021
Current portion at 31 December 2021 reported as Trade, other payables and
provisions
Equinor, Annual Report on Form 20-F 2021 269
Due to significantly reduced expected use of a transportation agreement, Equinor provided a liability of USD
onerous contract. In the third quarter 2021, this provision has been settled resulting in a payment of the settled amount and reversal of
the remaining amount of the provision. The reversal of the provision is reflected within the line item Operating expenses in the
Consolidated statement of income.
The timing of cash outflows of asset retirement obligations depends on the expected production cease at the various facilities.
In certain production sharing agreements (PSA), Equinor’s estimated share of asset retirement obligation (ARO) is paid into an escrow
account over the producing life of the field. These payments are considered down-payments of the liabilities and included in line item
Amounts charged against provisions and other liabilities.
The Claims and litigations category mainly relate to expected payments for unresolved claims. The timing and amounts of potential
settlements in respect of these claims are uncertain and dependent on various factors that are outside management's control. For
further information on provisions and contingent liabilities, see note 24 Other commitments, contingent liabilities and contingent
assets.
For further information about methods applied and estimates required, see note 2 Significant accounting policies.
Restatement of ARO due to change in the discount rate
The discount rate used in the calculation of ARO no longer includes Equinor’s own credit risk element. See note 2 Significant
accounting policies for a description of this change. The impact of this ARO calculation policy change on affected financial statement
lines of previous years’ Consolidated financial statements is summarised in the table below. For 2021, the effect on the line items PPE
and Provisions and other liabilities amounted to approx. USD
Line items impacted in the consolidated
balance sheet (in USD million)
01.01.2020
before
restatement
Impact of ARO
policy change
01.01.2020 after
restatement
31.12.2020
before
restatement
Impact of ARO
policy change
31.12.2020 after
restatement
PPE
Total non-current assets
Total assets
Provisions and other liabilities
19,749
Total non-current liabilities
Total liabilities
Expected timing of cash outflows
(in USD million)
Asset retirement
obligations
Other
provisions and
liabilities, including
claims and litigations
Total
2022 - 2026
2027 - 2031
2032 - 2036
2037 - 2041
Thereafter
At 31 December 2021
270 Equinor, Annual Report on Form 20-F 2021
22 Trade, other payables and provisions
At 31 December
(in USD million)
2021
2020
Trade payables
Non-trade payables and accrued expenses
Joint venture payables
Payables to equity accounted associated companies and other related parties
Total financial trade and other payables
Current portion of provisions and other non-financial payables
Trade, other payables and provisions
Included in Current portion of provisions and other non-financial payables are certain provisions that are further described in note 21
Provisions and other liabilities and in note 24 Other commitments, contingent liabilities and contingent assets. For information
regarding currency sensitivities, see note 26 Financial instruments: fair value measurement and sensitivity analysis of market risk. For
further information on payables to equity accounted associated companies and other related parties, see note 25 Related parties.
23 Leases
Equinor leases certain assets, notably drilling rigs, transportation vessels, storages and office facilities for operational activities.
Equinor is mostly a lessee and the use of leases serves operational purposes rather than as a tool for financing.
Certain leases, such as land bases, supply vessels, helicopters and office buildings are entered into by Equinor for subsequent
allocation of costs to licences operated by Equinor. These lease liabilities are recognized on a gross basis in the balance sheet,
income statement and statement of cash flows when Equinor is considered to have the primary responsibility for the full lease
payments. Lease liabilities related to assets dedicated to specific licences, where each licence participants are considered to have the
primary responsibility for lease payments, are reflected net of partner share. This would typically involve drilling rigs dedicated to
specific licences on the Norwegian continental shelf.
Information related to lease payments and lease liabilities
(in USD million)
2021
2020
Lease liabilities at 1 January
New leases, including remeasurements and cancellations
Gross lease payments
(1,350 )
(1,415 )
Lease interest
Lease repayments
(1,259)
(1,259 )
(1,313)
(1,313 )
Foreign currency translation effects
(61
Lease liabilities at 31 December
Current lease liabilities
Non-current lease liabilities
Lease expenses not included in lease liabilities
(in USD million)
2021
2020
Short-term lease expenses
Equinor, Annual Report on Form 20-F 2021 271
Payments related to short term leases are mainly related to drilling rigs and transportation vessels, for which a significant portion of
the lease costs have been included in the cost of other assets, such as rigs used in exploration or development activities. Variable
lease expense and lease expense related to leases of low value assets are not significant.
Equinor recognised revenues of USD
partners related to lease contracts being recognised gross by Equinor. In addition, Equinor received repayments of USD
2021 and USD
USD
Trade and other receivables in the Consolidated balance sheet.
Commitments relating to lease contracts which had not yet commenced at year-end are included within Other commitments in note 24
Other commitments, contingent liabilities and contingent assets.
A maturity profile based on undiscounted contractual cash flows for lease liabilities is disclosed in note 6 Financial risk and capital
management.
Non-current lease liabilities maturity profile
At 31 December
(in USD million)
2021
2020
Year 2 and 3
Year 4 and 5
After 5 years
Total repayment of non-current lease liabilities
Information related to Right of use assets
(in USD million)
Drilling rigs
Vessels
Land and
buildings
Storage
facilities
Other
Total
Right of use assets at 1 January 2021
Additions, remeasurements, cancellations and
divestments
Depreciation and impairment
1)
(316 )
(617 )
(176 )
(72 )
(82 )
(1,265 )
Foreign currency translation effects
(26 )
(8 )
(12 )
(5 )
(50 )
Right of use assets at 31 December 2021
(in USD million)
Drilling rigs
Vessels
Land and
buildings
Storage
facilities
Other
Total
Right of use assets at 1 January 2020
Additions, remeasurements, cancellations and
divestments
Depreciation and impairment
1)
(349 )
(571 )
(179 )
(68 )
(90 )
(1,257 )
Foreign currency translation effects
Right of use assets at 31 December 2020
1) USD 320 million in 2021 and USD 359 million in 2020 of the depreciation cost have been allocated to activities being capitalised. See note
11 Property, plant and equipment.
The Right of use assets are included within the line item Property, plant and equipment in the Consolidated balance sheet. See also
note 11 Property, plant and equipment.
272 Equinor, Annual Report on Form 20-F 2021
24 Other commitments, contingent liabilities and contingent assets
Contractual commitments
Equinor had contractual commitments of USD
proportional share and mainly comprise construction and acquisition of property, plant and equipment as well as committed
investments/funding or resources in equity accounted entities.
As a condition for being awarded oil and gas exploration and production licences, participants may be committed to drill a certain
number of wells. At the end of 2021, Equinor was committed to participate in
approximately
%. Equinor's share of estimated expenditures to drill these wells amounts to USD
Equinor may become committed to participating in depending on future discoveries in certain licences are not included in these
numbers.
Other long-term commitments
Equinor has entered into various long-term agreements for pipeline transportation as well as terminal use, processing, storage and
entry/exit capacity commitments and commitments related to specific purchase agreements. The agreements ensure the rights to the
capacity or volumes in question, but also impose on Equinor the obligation to pay for the agreed-upon service or commodity,
irrespective of actual use. The contracts' terms vary, with durations of up to
.
Take-or-pay contracts for the purchase of commodity quantities are only included in the table below if their contractually agreed
pricing is of a nature that will or may deviate from the obtainable market prices for the commodity at the time of delivery.
Obligations payable by Equinor to entities accounted for in the Equinor group using the equity method are included in the table below
with Equinor’s full proportionate share. For assets (such as pipelines) that are included in the Equinor accounts through joint
operations or similar arrangements, and where consequently Equinor’s share of assets, liabilities, income and expenses (capacity
costs) are reflected on a line-by-line basis in the Consolidated financial statements, the amounts in the table include the net
commitment payable by Equinor (i.e. Equinor’s proportionate share of the commitment less Equinor's ownership share in the
applicable entity).
The table below also includes USD
according to IFRS 16, as well as leases not yet commenced. Leases not commenced include one rig to be used on the NCS and an
increased number of vessels supporting the growing LPG and LNG business. For commenced leases, please refer to note 23 Leases.
Nominal minimum other long-term commitments at 31 December 2021:
(in USD million)
2022
2023
2024
2025
2026
Thereafter
Total other long-term commitments
Equinor, Annual Report on Form 20-F 2021 273
Guarantees
Equinor has guaranteed for its proportionate share of some of our associate’s long-term bank debt, payment obligations under
contracts, and certain third-party obligations. The total amount guaranteed at year-end 2021 is USD
guarantees is immaterial.
Contingent liabilities and contingent assets
Redetermination process for Agbami field
Through its ownership in OML 128 in Nigeria, Equinor is a party to an ownership interest redetermination process for the Agbami field,
which will reduce Equinor’s ownership interest. A non-binding agreement for settlement of the redetermination was reached during the
fourth quarter of 2018. The parties to the non-binding agreement have thereafter continued to work towards a final settlement and
agreed-upon ownership percentage adjustment. In June 2021, Equinor paid a total of USD
Agbami Unit. The payment covered outstanding amounts between the three parties as of 31 March 2021. Following the payment, an
adjustment to the previous provision by USD
remaining Agbami redetermination related provision reflected in Trade and other payables in the Consolidated balance sheet at year-
end is immaterial.
Mineral rights dispute along the Missouri riverbank
Equinor produces minerals from wells in spacing units along the Missouri River in which ownership of the mineral rights associated
with the near shore region up to the ordinary high-water mark has been disputed. As operator of wells in those units, Equinor has a
right to part of the proceeds, and a responsibility to distribute the remainder of the proceeds from the production to the owners of the
mineral rights. As the riverbank has moved continuously over time, updated river-surveys have resulted in interest claims from several
parties, including the State of North Dakota, the United States, and private parties. During the second quarter of 2021, Equinor
received updated title opinions reflecting the latest State survey that resulted in clarification among the main parties. Certain limited
procedural matters remain, but Equinor’s maximum exposure in the case was significantly reduced and at this stage is minor.
Amounts reflected in the matter in the Consolidated balance sheet at 31 December 2021 and in the Consolidated statement of income
during the year 2021 are immaterial.
Claim from Petrofac regarding multiple variation order requests performed in Algeria (In Salah)
Petrofac International (UAE) LLC (“PIUL”) was awarded the EPC Contract to execute the ISSF Project (the In Salah Southern Fields
Project which has finalized the development of 4 gas fields in central Algeria). Following suspension of activity after the terrorist attack
at another gas field in Algeria (In Amenas) in 2013, PIUL issued multiple Variation Order Requests (“VoRs”) related to the costs
incurred for stand-by and remobilization costs after the evacuation of expatriates. Several VoRs have been paid, but the settlement of
the remaining has been unsuccessful. PIUL initiated arbitration in August 2020 claiming an estimated amount of USD
which Equinor holds a
% share. Equinor's maximum exposure amounts to USD
estimate in the matter.
Withholding tax dispute regarding remittances from Brazil to Norway
Remittances made from Brazil for services are normally subject to withholding income tax. In 2012, Equinor’s subsidiaries in Brazil
filed a lawsuit to avoid paying this tax on remittances made to Equinor ASA and Equinor Energy AS for services without transfer of
technology based on the Double Tax Treaty Brazil has with Norway. The first level decision from 2013 was in Equinor's favour and
since 2014, withholding tax has not been paid. In 2017, a second level decision was rendered also in favour of Equinor, but this
decision was appealed. The trial session concluded in July 2021, overruling the previous favourable decision based on procedural
aspects only. Equinor has filed a motion for clarification which had the effect of temporarily suspending the unfavourable decision and
is currently awaiting the court’s decision, on the basis of which Equinor’s further legal steps in the case will be determined. Equinor's
maximum exposure is estimated at approximately USD
applied in the case and that Equinor has a strong position. No amounts have consequently been provided for in the financial
statements.
Suit for an annulment of Petrobras’ sale of the interest in BM-S-8 to Equinor
In March 2017, an individual connected to the Union of Oil Workers of Sergipe (Sindipetro) filed a class action suit against Petrobras,
Equinor, and ANP - the Brazilian Regulatory Agency - to seek annulment of Petrobras’ sale of the interest and operatorship in BM-S-8
to Equinor, which was closed in November 2016 after approval by the partners and authorities. In February 2022, sentence in the
annulment case was issued at the first instance level, and Equinor won on all merits. Equinor is expecting the case to be appealed
and is currently evaluation next steps. At the end of 2021, the acquired interest remains in Equinor’s balance sheet as intangible
assets of the Exploration & Production International (E&P International) segment.
ICMS indirect tax (Imposto sobre Circulaçao de Mercadorias - Tax on the Circulation of Goods and Certain Services)
In Brazil, the State of Rio de Janeiro in 2015 published a law whereby crude oil extraction would be subject to a
% ICMS indirect
tax, for which the Brazilian Industry Association challenged the law’s constitutionality. In March 2021 the plenary of Brazil’s Supreme
Court declared the State of Rio de Janeiro’s law to be unconstitutional, and the decision became final in May 2021. Following the
Supreme Court’s decision, Equinor evaluates the probability of any cash outflow in relation to the legal proceedings currently ongoing
274 Equinor, Annual Report on Form 20-F 2021
for the Roncador and Peregrino fields to be remote. The maximum exposure for Equinor is at year-end 2021 estimated at USD
million. As no provisions have previously been made in the matter, the Brazilian Supreme Court’s decision does not impact Equinor’s
Consolidated financial statements for the year 2021.
New Brazilian law creating uncertainty regarding certain tax incentives
In 2021, a law came into effect in Brazil in the State of Rio de Janeiro, requiring taxpayers that benefited from ICMS tax incentives (i.e.
Repetro) to deposit
% of the savings made from such benefits into a state fund. This law had slightly different features from a
previous similar law effective in the period 2017 to 2020. Equinor is of the opinion that specific incentives so far relevant for the
Roncador and Peregrino fields are not in scope of the new law, nor were they in scope of the previous one. State tax authorities in Rio
de Janeiro may interpret the laws differently and require deposits to be paid with the addition of fines and interests. Several legal
actions to oppose such developments have therefore been initiated by Equinor’s peers and the Brazilian Petroleum and Gas Institute
(IBP). So far, Equinor is party to two of the cases. At year-end 2021, the maximum exposure for Equinor in these various matters has
been estimated to a total of USD
2022 to avoid losing ICMS tax incentives while litigation is ongoing. Equinor is of the opinion that the laws in question are
unconstitutional, especially for Repetro incentives, and that this will be upheld in future legal proceedings. No amounts have
consequently been provided for in the financial statements.
KKD oil sands partnership
Canadian tax authorities have issued a notice of reassessment for 2014 for Equinor's Canadian subsidiary which was party to
Equinor's divestment of
allocation of the proceeds of disposition of certain Canadian resource properties from the partnership. Maximum exposure is
estimated to be approximately USD
litigation that may become necessary, may take several years. No taxes will become payable until the matter has been finally settled.
Equinor is of the view that all applicable tax regulations have been applied in the case and that Equinor has a strong position. No
amounts have consequently been provided for in the financial statements.
Deviation notices and disputes with Norwegian tax authorities
In the fourth quarter of 2020, Equinor received a decision from the Norwegian tax authorities related to the capital structure of the
subsidiary Equinor Service Center Belgium N.V. The decision concludes that the capital structure has to be based on the arm length’s
principle and the decision covers the fiscal years 2012 to 2016. Maximum exposure is estimated to be approximately USD
for which Equinor has received a claim that was settled in 2021. Equinor has brought the case to court and if Equinor’s view prevails,
the tax payment will be refunded. It continues to be Equinor’s view that the group has a strong position, and at year-end 2021, no
amounts have consequently been expensed in the financial statements.
Equinor has an ongoing dispute regarding the level of Research & Development cost to be allocated to the offshore tax regime. Based
on Equinor’s correspondence with the Norwegian tax authorities in the matter and the Petroleum Taxation Appeal Board’s decision
regarding some of the income years, the maximum exposure in this matter is estimated to approximately USD
has provided for its best estimate in the matter.
The Oil Taxation Office has challenged the internal pricing of certain products of natural gas liquids sold from Equinor Energy AS to
Equinor ASA in the years 2011-2020. During 2021 there has been development is various elements of the case, where parts of the
exposure are resolved, while for another element, a first-tier court decision ruled in Equinor’s favour but has been appealed. Second
level court proceedings are scheduled in June 2022. Other parts of the dispute remain outstanding. Where relevant, exposure for the
period 2020–2021 has been added. Following these developments, which did not impact the Consolidated statement of income
significantly, the maximum exposure regarding the gas liquid pricing remains at an estimated USD
for its best estimate in the matter.
Other claims
During the normal course of its business, Equinor is involved in legal proceedings, and several other unresolved claims are currently
outstanding. The ultimate liability or asset, in respect of such litigation and claims cannot be determined at this time. Equinor has
provided in its Consolidated financial statements for probable liabilities related to litigation and claims based on its best estimate.
Equinor does not expect that its financial position, results of operations or cash flows will be materially affected by the resolution of
these legal proceedings. Equinor is actively pursuing the above disputes through the contractual and legal means available in each
case, but the timing of the ultimate resolutions and related cash flows, if any, cannot at present be determined with sufficient reliability.
Provisions related to claims other than those related to income tax are reflected within note 21 Provisions and other liabilities.
Uncertain income tax related liabilities are reflected as current tax payables or deferred tax liabilities as appropriate, while uncertain
tax assets are reflected as current or deferred tax assets.
Equinor, Annual Report on Form 20-F 2021 275
25 Related parties
Transactions with the Norwegian State
The Norwegian State is the majority shareholder of Equinor and also holds major investments in other Norwegian companies. As of
31 December 2021, the Norwegian State had an ownership interest in Equinor of
% (excluding Folketrygdfondet, the Norwegian
national insurance fund, of
%). This ownership structure means that Equinor participates in transactions with many parties that are
under a common ownership structure and therefore meet the definition of a related party. The Minister of Trade, Industry and
Fisheries took over the constitutional responsibility for following-up of the Norwegian State`s ownership in Equinor with effect from 1
July 2021. The responsibility for the Norwegian State`s shareholding in Equinor has been transferred from the Ministry of Petroleum
and Energy to the Ministry of Trade and Industry on 1 January 2022.
Total purchases of oil and natural gas liquids from the Norwegian State amounted to USD
the Norwegian State amounted to USD
These purchases of oil and natural gas are recorded in Equinor ASA. In addition, Equinor ASA sells in its own name, but for the
Norwegian State’s account and risk, the Norwegian State’s gas production. These transactions are presented net. For further
information please see note 2 Significant accounting policies. The most significant items included in the line-item Payables to equity
accounted associated companies and other related parties in note 22 Trade and other payables, are amounts payable to the
Norwegian State for these purchases.
The line-item Prepayments and Financial Receivables includes USD
Norwegian state under the Marketing Instruction in relation to the state’s (SDFI) expected participation in the gas sales activities of a
foreign subsidiary of Equinor. At year end 2020 the corresponding amount was USD
In July 2021 Equinor launched the first tranche of around USD
USD
Other transactions
In relation to it ordinary business operations Equinor enters into contracts such as pipeline transport, gas storage and processing of
petroleum products, with companies in which Equinor has ownership interests. Such transactions are included within the applicable
captions in the Consolidated statement of income. Gassled and certain other infrastructure assets are operated by Gassco AS, which
is an entity under common control by the Norwegian Ministry of Petroleum and Energy. Gassco’s activities are performed on behalf of
and for the risk and reward of pipeline and terminal owners, and capacity payments flow through Gassco to the respective owners.
Equinor payments that flowed through Gassco in this respect amounted to USD
in 2021, 2020 and 2019, respectively. These payments are mainly recorded in Equinor ASA. The stated amounts represent Equinor’s
capacity payment net of Equinor’s own ownership interests in Gassco operated infrastructure. In addition, Equinor ASA manages, in
its own name, but for the Norwegian State’s account and risk, the Norwegian State’s share of the Gassco costs. These transactions
are presented net.
Equinor has had transactions with other associated companies and joint ventures in relation to its ordinary business operations, for
which amounts have not been disclosed due to materiality.
Equinor leases two office buildings, located in Bergen and Harstad, owned by Equinor’s pension fund (“Equinor Pensjon”).
contracts.
Related party transactions with management are presented in note 7 Remuneration
.
276 Equinor, Annual Report on Form 20-F 2021
26 Financial instruments: fair value measurement and sensitivity analysis of market risk
Financial instruments by category
The following tables present Equinor's classes of financial instruments and their carrying amounts by the categories as they are
defined in IFRS 9 Financial Instruments: Classification and Measurement. For financial investments, the difference between
measurement as defined by IFRS 9 categories and measurement at fair value is immaterial. For trade and other receivables and
payables, and cash and cash equivalents, the carrying amounts are considered a reasonable approximation of fair value. See note 19
Finance
debt for fair value information of non-current bonds and bank loans.
See note 2 Significant accounting policies for further information regarding measurement of fair values.
At 31 December 2021
Fair value
through profit
or loss
Non-financial
assets
Total carrying
amount
(in USD million)
Note
Amortised cost
Assets
Non-current derivative financial instruments
Non-current financial investments
14
Prepayments and financial receivables
14
Trade and other receivables
16
Current derivative financial instruments
Current financial investments
14
Cash and cash equivalents
17
Total financial assets
At 31 December 2020
Fair value
through profit
or loss
Non-financial
assets
Total carrying
amount
(in USD million)
Note
Amortised cost
Assets
Non-current derivative financial instruments
Non-current financial investments
14
Prepayments and financial receivables
1)
14
Trade and other receivables
16
Current derivative financial instruments
Current financial investments
14
Cash and cash equivalents
17
Total financial assets
1) The categories Amortised cost and Non-financial assets has been reclassified under Prepayments and financial receivables, due to an
incorrect classification of USD 32 million in 2020.
Equinor, Annual Report on Form 20-F 2021 277
At 31 December 2021
Amortised
cost
Fair value
through
profit or loss
Non-financial
liabilities
Total
carrying
amount
(in USD million)
Note
Liabilities
Non-current finance debt
19
Non-current derivative financial instruments
Trade, other payables and provisions
22
Current finance debt
19
Dividend payable
Current derivative financial instruments
Total financial liabilities
At 31 December 2020
Amortised
cost
Fair value
through
profit or loss
Non-financial
liabilities
Total
carrying
amount
(in USD million)
Note
Liabilities
Non-current finance debt
19
Non-current derivative financial instruments
Trade, other payables and provisions
22
Current finance debt
19
Dividend payable
Current derivative financial instruments
Total financial liabilities
278 Equinor, Annual Report on Form 20-F 2021
Fair value hierarchy
The following table summarises each class of financial instruments which are recognised in the Consolidated balance sheet at fair
value, split by Equinor's basis for fair value measurement.
(in USD million)
Non-current
financial
investments
Non-current
derivative
financial
instruments
- assets
Current
financial
investments
Current
derivative
financial
instruments
- assets
Cash
equivalents
Non-current
derivative
financial
instruments
- liabilities
Current
derivative
financial
instruments
- liabilities
Net fair
value
At 31 December 2021
Level 1
(69 )
Level 2
(762 )
(4,539 )
Level 3
(4 )
Total fair value
(767 )
(4,609 )
At 31 December 2020
Level 1
(432 )
Level 2
(671 )
(1,277 )
Level 3
(5 )
Total fair value
(676 )
(1,710 )
Level 1, fair value based on prices quoted in an active market for identical assets or liabilities, includes financial instruments actively
traded and for which the values recognised in the Consolidated balance sheet are determined based on observable prices on identical
instruments. For Equinor this category will, in most cases, only be relevant for investments in listed equity securities and government
bonds.
Level 2, fair value based on inputs other than quoted prices included within level 1, which are derived from observable market
transactions, includes Equinor's non-standardised contracts for which fair values are determined on the basis of price inputs from
observable market transactions. This will typically be when Equinor uses forward prices on crude oil, natural gas, interest rates and
foreign currency exchange rates as inputs to the valuation models to determine the fair value of it derivative financial instruments.
Level 3, fair value based on unobservable inputs, includes financial instruments for which fair values are determined on the basis of
input and assumptions that are not from observable market transactions. The fair values presented in this category are mainly based
on internal assumptions. The internal assumptions are only used in the absence of quoted prices from an active market or other
observable price inputs for the financial instruments subject to the valuation.
The fair value of certain earn-out agreements and embedded derivative contracts are determined by the use of valuation techniques
with price inputs from observable market transactions as well as internally generated price assumptions and volume profiles. The
discount rate used in the valuation is a risk-free rate based on the applicable currency and time horizon of the underlying cash flows
adjusted for a credit premium to reflect either Equinor's credit premium, if the value is a liability, or an estimated counterparty credit
premium if the value is an asset. In addition, a risk premium for risk elements not adjusted for in the cash flow may be included when
applicable. The fair values of these derivative financial instruments have been classified in their entirety in the third category within
current derivative financial instruments and non-current derivative financial instruments. Another reasonable assumption, that could
have been applied when determining the fair value of these contracts, would be to extrapolate the last relevant forward prices with
inflation. If Equinor had applied this assumption, the fair value of the contracts included would have increased by approximately USD
The reconciliation of the changes in fair value during 2021 and 2020 for financial instruments classified as level 3 in the hierarchy is
presented in the following table.
Equinor, Annual Report on Form 20-F 2021 279
(in USD million)
Non-current
financial
investments
Non-current
derivative
financial
instruments -
assets
Current
derivative
financial
instruments -
assets
Non-current
derivative
financial
instruments -
liabilities
Total amount
Opening at 1 January 2021
(5 )
Total gains and losses recognised in statement of income
(23 )
Purchases
Settlement
(7 )
(20 )
(27 )
Transfer out of level 3
Foreign currency translation effects
(3 )
(8 )
(2 )
(13 )
Closing at 31 December 2021
(4 )
Opening at 1 January 2020
(19 )
Total gains and losses recognised in statement of income
(29 )
Purchases
Settlement
(8 )
(28 )
(36 )
Transfer to level 1
Foreign currency translation effects
Closing at 31 December 2020
(5 )
During 2021 the financial instruments within level 3 have had a net increase in fair value of USD
financial investments contributed with USD
during 2021 are mainly related to changes in fair value of certain earn-out agreements where USD
balance for 2021 has been fully realised as the underlying volumes have been delivered during 2021.
Sensitivity analysis of market risk
Commodity price risk
The table below contains the commodity price risk sensitivities of Equinor's commodity based derivatives contracts. For further
information related to the type of commodity risks and how Equinor manages these risks, see note 6 Financial risk and capital
management.
Equinor's assets and liabilities resulting from commodity based derivatives contracts consist of both exchange traded and non-
exchange traded instruments, including embedded derivatives that have been bifurcated and recognised at fair value in the
Consolidated balance sheet.
Price risk sensitivities at the end of 2021 and 2020 at
% are assumed to represent a reasonably possible change based on the
duration of the derivatives. Since none of the derivative financial instruments included in the table below are part of hedging
relationships, any changes in the fair value would be recognised in the Consolidated statement of income.
Commodity price sensitivity
At 31 December
2021
2020
(in USD million)
- 30%
+ 30%
- 30%
+ 30%
Crude oil and refined products net gains/(losses)
(735 )
(1,025 )
Natural gas, electricity and CO2 net gains/(losses)
(141 )
(94 )
280 Equinor, Annual Report on Form 20-F 2021
Currency risk
The following currency risk sensitivity has been calculated, by assuming an 10% reasonable possible change in the most relevant
foreign currency exchange rates that impact Equinor’s financial accounts, based on balances at 31 December 2021. As of 31
December 2020, a change of 8% in the most relevant foreign currency exchange rates were viewed as a reasonable possible
change. With reference to table below, an increase in the foreign currency exchange rates means that the disclosed currency has
strengthened in value against all other currencies. The estimated gains and the estimated losses following from a change in the
foreign currency exchange rates would impact the Consolidated statement of income. For further information related to the currency
risk and how Equinor manages these risks, see note 6 Financial risk and capital management.
Currency risk sensitivity
At 31 December
2021
2020
(in USD million)
- 10 %
+ 10%
- 8 %
+ 8%
USD net gains/(losses)
(1,789 )
(319 )
NOK net gains/(losses)
(2,144 )
(322 )
Interest rate risk
The following interest rate risk sensitivity has been calculated by assuming a change of 0.8 percentage points as a reasonable
possible change in interest rates at the end of 2021. In 2020, a change of 0.6 percentage points in interest rates was viewed as a
reasonable possible change. A decrease in interest rates will have an estimated positive impact on net financial items in the
Consolidated statement of income, while an increase in interest rates has an estimated negative impact on net financial items in the
Consolidated statement of income. For further information related to the interest risks and how Equinor manages these risks, see note
6 Financial risk and capital management.
Interest risk sensitivity
At 31 December
2021
2020
(in USD million)
points
+ 0.8 percentage
points
points
+ 0.6 percentage
points
Positive/(negative) impact on net financial items
(448 )
(516 )
Equity price risk
The following equity price risk sensitivity has been calculated, by assuming a 35% reasonable possible change in equity prices that
impact Equinor’s financial accounts, based on balances at 31 December 2021. Also at 31 December 2020, a change of 35% in equity
prices were viewed as a reasonable possible change. The estimated gains and the estimated losses following from a change in equity
prices would impact the Consolidated statement of income. For further information related to the equity price risk and how Equinor
manages these risks, see note 6 Financial risk and capital management.
Equity price sensitivity
At 31 December
2021
2020
(in USD million)
- 35%
+ 35%
- 35%
+ 35%
Net gains/(losses)
(534 )
(684 )
27 Subsequent events
Equinor has certain investments in Russia. On 28 February 2022, Equinor announced it has decided to stop new investments into
Russia and start the process of exiting Equinor’s joint arrangements in Russia following Russia’s invasion of Ukraine. At the end of
2021, Equinor had USD
proved reserves of
21.6 mboe/d. Equinor expects that the process of exiting the joint arrangements in Russia will result in impairments.
Equinor, Annual Report on Form 20-F 2021 281
4.2 Supplementary oil and gas information (unaudited)
In accordance with the US Financial Accounting Standards Board Accounting Standards Codification "Extractive Activities - Oil and
Gas" (Topic 932), Equinor is reporting certain supplemental disclosures about oil and gas exploration and production operations.
While this information is developed with reasonable care and disclosed in good faith, it is emphasised that some of the data is
necessarily imprecise and represents only approximate amounts because of the subjective judgement involved in developing such
information. Accordingly, this information may not necessarily represent the present financial condition of Equinor or its expected
future results.
For further information regarding the reserves estimation requirement, see note 2 Significant accounting policies - Estimation
uncertainty regarding determining oil and gas reserves and Estimation uncertainty; Proved oil and gas reserves.
The effective date of the recently announced agreement to divest our interests in the Corrib field in Ireland is 1 January 2022. This will
result in an estimated reduction in proved reserves of 13 million boe at year-end 2022.
Equinor’s intention to exit its business activities in Russia is expected to reduce the net proved reserves in Eurasia excluding Norway
by 88 million boe. No other events have occurred since 31 December 2021 that would result in a significant change in the estimated
proved reserves or other figures reported as of that date.
For information related to the Agbami redetermination process and the dispute between the Nigerian National Petroleum Corporation
and the partners in Oil Mining Lease (OML) 128 concerning certain terms of the OML 128 Production Sharing Contract (PSC), see
note 24 Other commitments, contingent liabilities and contingent assets to the Consolidated financial statements. The effect of the re-
determination on proved reserves, which is estimated to be immaterial, is not yet included.
Proved oil and gas reserves
Equinor's proved oil and gas reserves have been estimated by its qualified professionals in accordance with industry standards under
the requirements of the US Securities and Exchange Commission (SEC), Rule 4-10 of Regulation S-X. Statements of reserves are
forward-looking statements. Proved oil and gas reserves are those quantities of oil and gas, which, by analysis of geoscience and
engineering data, can be estimated with reasonable certainty to be economically producible—from a given date forward, from known
reservoirs, and under existing economic conditions, operating methods, and government regulations—prior to the time at which
contracts providing the right to operate expire, unless evidence indicates that renewal is reasonably certain, regardless of whether
deterministic or probabilistic methods are used for the estimation. The project to extract the hydrocarbons must have commenced or
the operator must be reasonably certain that it will commence the project within a reasonable time.
The determination of these reserves is part of an ongoing process subject to continual revision as additional information becomes
available. Estimates of proved reserve quantities are dynamic and change over time as new information becomes available.
Moreover, identified reserves and contingent resources that may become proved in the future are excluded from the calculations.
Equinor's proved reserves are recognised under various forms of contractual agreements, including production sharing agreements
(PSAs) where Equinor's share of reserves can vary due to commodity prices or other factors. Reserves from agreements such as
PSAs are based on the volumes to which Equinor has access (cost oil and profit oil), limited to available market access. At 31
December 2021, 6% of total proved reserves were related to such agreements, representing 11% of the oil, condensate and NGL
reserves and 1% of the gas reserves. This compares with 5% of total proved reserves for both 2020 and 2019. Net entitlement oil and
gas production from fields with such agreements was 49 million boe during 2021, compared to 59 million boe for 2020 and 68 million
boe for 2019. Equinor participates in such agreements in Algeria, Angola, Azerbaijan, Brazil, Libya, Nigeria and Russia
1
.
Equinor is recording, as proved reserves, volumes equivalent to our tax liabilities under negotiated fiscal arrangements (PSAs) where
the tax is paid on behalf of Equinor. Reserves are net of royalty volumes in the US and net of royalty paid in-kind in PSA fields. Proved
reserves does not include quantities consumed during production.
Rule 4-10 of Regulation S-X requires that the estimation of reserves is based on existing economic conditions, including a 12-month
average price determined as an unweighted arithmetic average of the first-of-the month price for each month within the reporting
period, unless prices are defined by contractual arrangements. Volume weighted average prices for the total Equinor portfolio, and the
Brent blend price, is presented in the following table:
282 Equinor, Annual Report on Form 20-F 2021
Volume weighted average prices at 31 December
Brent blend
Oil
Condensate
NGL
Natural gas
(USD/boe)
(USD/boe)
(USD/boe)
(USD/boe)
(USD/mmbtu)
2021
69.22
67.61
65.02
47.17
11.89
2020
41.26
40.60
33.99
23.72
3.18
2019
63.04
60.04
55.37
29.96
5.12
The increase in commodity prices affected the profitable reserves to be recovered from accumulations, resulting in higher proved
reserves. The positive revisions due to price are in general a result of later economic cut-off. For fields with a production-sharing type
of agreement this is to some degree offset by lower entitlement to the reserves. These changes are all included in the revision
category in the tables below, giving a net increase of Equinor’s proved reserves at year-end.
From the Norwegian continental shelf (NCS), Equinor is responsible for managing, transporting and selling the Norwegian State's oil
and gas on behalf of the Norwegian State's direct financial interest (SDFI). These reserves are sold in conjunction with the Equinor
reserves. As part of this arrangement, Equinor delivers and sells gas to customers in accordance with various types of sales contracts
on behalf of the SDFI. In order to fulfil the commitments, Equinor utilises a field supply schedule which provides the highest possible
total value for the joint portfolio of oil and gas between Equinor and the SDFI.
Equinor and the SDFI receive income from the joint natural gas sales portfolio based upon their respective share in the supplied
volumes. For sales of the SDFI natural gas, to Equinor and to third parties, the payment to the Norwegian State is based on achieved
prices, a net back formula calculated price or market value. All of the Norwegian State's oil and NGL is acquired by Equinor. The price
Equinor pays to the SDFI for the crude oil is based on market reflective prices. The prices for NGL are either based on achieved
prices, market value or market reflective prices.
The regulations of the owner's instruction, as described above, may be changed or withdrawn by the Equinor ASA's general meeting.
Due to this uncertainty and the Norwegian State's estimate of proved reserves not being available to Equinor, it is not possible to
determine the total quantities to be purchased by Equinor under the owner's instruction.
Topic 932 requires the presentation of reserves and certain other supplemental oil and gas disclosures by geographic area, defined
as country or continent containing 15% or more of total proved reserves. At 31 December 2021, Norway is the only country in this
category, with 71% of the total proved reserves. Since the USA contained 16% of the proved reserves at the beginning of 2017,
management has determined that the most meaningful presentation of geographical areas also in 2021 would be Norway, US, and
the continents of Eurasia excluding Norway, Africa, and Americas excluding USA.
Proved reserves movements 2021
Norway
The increase of 465 million boe in revisions and improved recovery in Norway is the combined effect of positive revisions following
increased certainty in the ultimate recovery at many fields, prolonged economic lifetime at several fields due to the increased
commodity prices, and decisions to install low pressure production facilities increasing the future recovery at the Oseberg and Ormen
Lange fields.
Eurasia excluding Norway
The net decrease of 16 million boe in equity accounted assets in the revisions and improved recovery category is related to proved
reserves in Russia
21
, where negative revisions of 35 million boe due to reduced production potential in some areas was partially offset
by positive revisions based on increased certainty in the expected ultimate recovery in other areas.
USA
The increase of 78 million boe in revisions and improved recovery is the combined effect of positive revisions following increased
certainty in the ultimate recovery, and prolonged economic lifetime at several fields mainly due to the increase in commodity prices.
Sale of petroleum in place of 89 million boe is a result of the divestment of our interests in the Bakken assets which was completed in
2021.
Americas excluding USA
The increase of 62 million boe in revisions and improved recovery are mainly related to proved reserves in Brazil and is the combined
effect of positive revisions following increased certainty in the ultimate recovery, and prolonged economic lifetime due to the increased
commodity prices. The increase of 210 million boe in extensions and discoveries is the result of sanctioning of the Bacalhau
21
Norway by 88 million boe. See note 27 Subsequent events to the Consolidated financial statements.
Equinor, Annual Report on Form 20-F 2021 283
development in Brazil, and the 14 million boe of equity accounted additions in the same category represent drilling of new wells in
previously unproven areas at the Bandurria Sur development in Argentina.
Proved reserves movements 2020
Africa
The net increase of 40 mill boe in revision and improved recovery was mainly due to positive revisions on several fields with
production sharing agreements in Angola, Algeria, Nigeria and Libya.
USA
The net decrease of 118 million boe in revisions and improved recovery included a negative revision of 110 million boe related to our
onshore developments. This was mainly due to reduced activity levels as well as shorter economic field lifetime caused by reduced oil
and gas prices. The reduced prices have also affected some of our Gulf of Mexico fields negatively. The increase of 101 million boe in
extension and discoveries was the result of new wells drilled in previously unproven areas in our onshore developments.
Americas excl USA
The net decrease of 55 million boe in revisions and improved recovery was mainly due to shorter economic lifetime for fields in Brazil
caused by the reduced oil prices. The equity accounted increase of 6 million boe in purchase of reserves-in-place is in Argentina.
Proved reserves movements 2019
Norway
The decrease of 66 million boe (equity accounted) was due to a divestment of a 16% shareholding in Lundin after which Equinor no
longer carried any equity accounted proved reserves in Norway in 2019.
Eurasia excl Norway
The net increase of 52 million boe in revisions and improved recovery was mainly related to positive revisions on fields in the UK but
did also include some additional volumes from an increased recovery project in Azerbaijan. The increase of 110 million boe in
extensions and discoveries (equity accounted) was in Russia
22
Africa
The net increase of 25 million boe in revisions and improved recovery was mainly due to positive revisions on several fields with
production sharing agreements in Algeria and Angola.
USA
The increase of 126 mill boe in extensions and discoveries was due to continued
drilling of new wells in previously undrilled areas in
our onshore developments.
Changes to the proved reserves in 2021 are also described by each geographic area in section 2.10 Operational performance, Proved
oil and gas reserves. Development of the proved undeveloped reserves is described in section 2.10 Operational performance,
Development of reserves.
The following tables reflect the estimated proved reserves of oil and gas at 31 December 2018 through 20201 and the changes
therein.
22
million boe. See note 27 Subsequent event to the Consolidated financial statements.
284 Equinor, Annual Report on Form 20-F 2021
Consolidated companies
Equity accounted
Net proved oil and condensate
reserves
(in million boe)
Norway
Eurasia
excludin
g
Norway
Africa
USA
America
s
excludin
g USA
Subtotal
Norway
Eurasia
excludin
g
Norway
America
s
excludin
g USA
Subtotal
Total
At 31 December 2018
1,458
124
165
371
378
2,496
62
-
-
62
2,558
Revisions and improved
recovery
113
50
19
35
27
244
3
(0)
-
3
247
Extensions and discoveries
5
3
-
25
-
33
-
57
-
57
91
Purchase of reserves-in-place
41
-
-
18
-
59
-
-
-
-
59
Sales of reserves-in-place
(4)
-
-
(13)
-
(17)
(62)
-
-
(62)
(80)
Production
(151)
(9)
(47)
(54)
(36)
(296)
(3)
(1)
-
(4)
(300)
At 31 December 2019
1,463
168
137
383
369
2,518
-
56
-
56
2,575
Revisions and improved
recovery
32
(12)
33
(55)
(57)
(58)
-
(5)
-
(5)
(63)
Extensions and discoveries
27
2
-
7
-
36
-
0
-
0
36
Purchase of reserves-in-place
-
-
-
-
-
-
-
-
5
5
5
Sales of reserves-in-place
-
-
-
-
-
-
-
-
-
-
-
Production
(193)
(15)
(39)
(48)
(25)
(320)
-
(1)
(1)
(2)
(322)
At 31 December 2020
1,329
143
131
287
287
2,177
-
50
5
55
2,232
Revisions and improved
recovery
153
(15)
18
23
61
240
-
17
0
17
257
Extensions and discoveries
14
0
-
1
210
225
-
2
12
14
239
Purchase of reserves-in-place
-
-
-
-
-
-
-
-
-
-
-
Sales of reserves-in-place
-
-
-
(57)
(6)
(63)
-
-
-
-
(63)
Production
(200)
(15)
(32)
(37)
(19)
(303)
-
(5)
(2)
(7)
(310)
At 31 December 2021
1,296
114
116
217
533
2,276
-
64
15
79
2,355
Proved developed oil and
condensate reserves
At 31 December 2018
493
46
152
279
247
1,216
0
-
-
0
1,216
At 31 December 2019
691
44
124
278
254
1,392
-
5
-
5
1,396
At 31 December 2020
654
54
110
217
202
1,237
-
8
5
13
1,249
At 31 December 2021
702
47
104
161
205
1,218
-
22
10
31
1,249
Proved undeveloped oil and
condensate reserves
At 31 December 2018
966
78
13
91
131
1,279
62
-
-
62
1,342
At 31 December 2019
772
123
13
104
115
1,127
-
52
-
52
1,178
At 31 December 2020
676
88
21
70
86
940
-
42
0
42
982
At 31 December 2021
594
67
13
56
328
1,058
-
42
5
47
1,105
Equinor, Annual Report on Form 20-F 2021 285
Consolidated companies
Equity accounted
Net proved NGL reserves
(in million boe)
Norway
Eurasia
excludin
g
Norway
Africa
USA
America
s
excludin
g USA
Subtotal
Norway
Eurasia
excludin
g
Norway
America
s
excludin
g USA
Subtotal
Total
At 31 December 2018
286
-
21
85
-
392
1
-
-
1
393
Revisions and improved
recovery
5
-
0
(2)
-
3
-
-
-
-
3
Extensions and discoveries
1
-
-
11
-
12
-
-
-
-
12
Purchase of reserves-in-place
4
-
-
1
-
5
-
-
-
-
5
Sales of reserves-in-place
(1)
-
-
(18)
-
(18)
(1)
-
-
(1)
(20)
Production
(41)
-
(3)
(12)
-
(57)
-
-
-
-
(57)
At 31 December 2019
254
-
18
65
-
337
-
-
-
-
337
Revisions and improved
recovery
(7)
0
2
(8)
-
(13)
-
-
-
-
(13)
Extensions and discoveries
0
-
-
7
-
8
-
-
-
-
8
Purchase of reserves-in-place
-
-
-
-
-
-
-
-
-
-
-
Sales of reserves-in-place
-
-
-
-
-
-
-
-
-
-
-
Production
(40)
(0)
(3)
(11)
-
(54)
-
-
-
-
(54)
At 31 December 2020
208
0
17
53
-
278
-
-
-
-
278
Revisions and improved
recovery
31
0
(1)
14
-
44
-
-
-
-
44
Extensions and discoveries
1
-
-
4
-
5
-
-
-
-
5
Purchase of reserves-in-place
-
-
-
-
-
-
-
-
-
-
-
Sales of reserves-in-place
-
-
-
(17)
-
(17)
-
-
-
-
(17)
Production
(38)
(0)
(3)
(9)
-
(49)
-
-
-
-
(49)
At 31 December 2021
202
0
14
45
-
261
-
-
-
-
261
Proved developed NGL
reserves
At 31 December 2018
192
-
18
68
-
277
0
-
-
0
277
At 31 December 2019
175
-
15
49
-
240
-
-
-
-
240
At 31 December 2020
141
0
15
47
-
204
-
-
-
-
204
At 31 December 2021
160
0
12
37
-
209
-
-
-
-
209
Proved undeveloped NGL
reserves
At 31 December 2018
94
-
3
18
-
115
1
-
-
1
116
At 31 December 2019
78
-
3
16
-
97
-
-
-
-
97
At 31 December 2020
66
(0)
2
6
-
74
-
-
-
-
74
At 31 December 2021
42
-
2
8
-
52
-
-
-
-
52
286 Equinor, Annual Report on Form 20-F 2021
Consolidated companies
Equity accounted
Net proved gas reserves
(in billion cf)
Norway
Eurasia
excludin
g
Norway
Africa
USA
America
s
excludin
g USA
Subtotal
Norway
Eurasia
excludin
g
Norway
America
s
excludin
g USA
Subtotal
Total
At 31 December 2018
15,290
134
266
2,373
20
18,084
10
-
-
10
18,094
Revisions and improved
recovery
432
8
31
(39)
(3)
429
2
1
-
3
432
Extensions and discoveries
36
-
-
506
-
542
-
298
-
298
840
Purchase of reserves-in-place
37
-
-
11
-
48
-
-
-
-
48
Sales of reserves-in-place
(18)
-
-
(118)
-
(135)
(10)
-
-
(10)
(145)
Production
(1,447)
(31)
(57)
(363)
(9)
(1,907)
(2)
(4)
-
(6)
(1,913)
At 31 December 2019
14,330
111
241
2,371
8
17,060
-
295
-
295
17,355
Revisions and improved
recovery
(195)
(36)
29
(311)
8
(505)
-
(28)
-
(28)
(534)
Extensions and discoveries
4
-
-
485
-
488
-
-
-
-
488
Purchase of reserves-in-place
-
-
-
-
-
-
-
-
4
4
4
Sales of reserves-in-place
-
-
-
-
-
-
-
-
-
-
-
Production
(1,425)
(26)
(42)
(373)
(9)
(1,874)
-
(3)
(1)
(3)
(1,878)
At 31 December 2020
12,714
49
227
2,171
7
15,169
-
264
3
267
15,436
Revisions and improved
recovery
1,576
46
(23)
231
7
1,837
-
(183)
1
(182)
1,656
Extensions and discoveries
23
-
-
313
-
337
-
-
11
11
348
Purchase of reserves-in-place
-
-
-
-
-
-
-
-
-
-
-
Sales of reserves-in-place
-
-
-
(87)
-
(87)
-
-
-
-
(87)
Production
(1,500)
(20)
(41)
(396)
(8)
(1,966)
-
(3)
(1)
(5)
(1,971)
At 31 December 2021
12,813
75
163
2,233
6
15,289
-
78
14
92
15,381
Proved developed gas
reserves
At 31 December 2018
10,459
111
240
1,740
20
12,569
0
-
-
0
12,570
At 31 December 2019
9,417
111
217
1,645
8
11,398
-
67
-
67
11,465
At 31 December 2020
7,863
49
199
1,681
7
9,799
-
123
3
126
9,926
At 31 December 2021
11,145
75
145
1,845
5
13,217
-
19
9
28
13,244
Proved undeveloped gas
reserves
At 31 December 2018
4,831
24
26
634
-
5,514
10
-
-
10
5,524
At 31 December 2019
4,912
0
23
726
-
5,662
-
228
-
228
5,889
At 31 December 2020
4,851
0
28
490
-
5,369
-
141
0
141
5,510
At 31 December 2021
1,667
-
17
387
0
2,072
-
59
5
64
2,136
Equinor, Annual Report on Form 20-F 2021 287
Consolidated companies
Equity accounted
Net proved reserves
(in million boe)
Norway
Eurasia
excludin
g
Norway
Africa
USA
America
s
excludin
g USA
Subtotal
Norway
Eurasia
excludin
g
Norway
America
s
excludin
g USA
Subtotal
Total
At 31 December 2018
4,468
148
233
879
382
6,110
66
-
-
66
6,175
Revisions and improved
recovery
195
52
25
26
26
324
3
(0)
-
3
327
Extensions and discoveries
13
3
-
126
-
142
-
110
-
110
253
Purchase of reserves-in-place
51
-
-
21
-
72
-
-
-
-
72
Sales of reserves-in-place
(8)
-
-
(51)
-
(59)
(66)
-
-
(66)
(125)
Production
(450)
(15)
(60)
(131)
(38)
(693)
(3)
(1)
-
(5)
(698)
At 31 December 2019
4,270
187
198
870
370
5,895
-
109
-
109
6,004
Revisions and improved
recovery
(9)
(18)
40
(118)
(55)
(161)
-
(10)
-
(10)
(171)
Extensions and discoveries
28
2
-
101
-
131
-
0
-
0
131
Purchase of reserves-in-place
-
-
-
-
-
-
-
-
6
6
6
Sales of reserves-in-place
-
-
-
-
-
-
-
-
-
-
-
Production
(486)
(20)
(49)
(126)
(26)
(708)
-
(2)
(1)
(3)
(710)
At 31 December 2020
3,802
151
189
727
289
5,158
-
97
5
102
5,260
Revisions and improved
recovery
465
(6)
13
78
62
611
-
(16)
1
(15)
596
Extensions and discoveries
19
0
-
61
210
290
-
2
14
16
306
Purchase of reserves-in-place
-
-
-
-
-
-
-
-
-
-
-
Sales of reserves-in-place
-
-
-
(89)
(6)
(96)
-
-
-
-
(96)
Production
(505)
(18)
(42)
(117)
(20)
(703)
-
(6)
(2)
(8)
(710)
At 31 December 2021
3,781
127
159
660
534
5,261
-
77
18
95
5,356
Proved developed reserves
At 31 December 2018
2,548
66
212
657
250
3,733
0
-
-
0
3,733
At 31 December 2019
2,544
64
178
621
255
3,663
-
17
-
17
3,679
At 31 December 2020
2,196
63
161
564
203
3,187
-
30
5
35
3,222
At 31 December 2021
2,847
60
141
527
206
3,782
-
25
12
36
3,818
Proved undeveloped
reserves
At 31 December 2018
1,920
82
21
222
131
2,377
65
-
-
65
2,442
At 31 December 2019
1,725
123
20
250
115
2,233
-
92
-
92
2,325
At 31 December 2020
1,606
88
28
163
86
1,971
-
67
0
67
2,038
At 31 December 2021
934
67
18
133
328
1,479
-
53
6
59
1,538
The conversion rates used are 1 standard cubic meter = 35.3 standard cubic feet, 1 standard cubic meter oil equivalent = 6.29 barrels
of oil equivalent (boe) and 1,000 standard cubic meter gas = 1 standard cubic meter oil equivalent.
288 Equinor, Annual Report on Form 20-F 2021
Capitalised cost related to oil and gas producing activities
Consolidated companies
At 31 December
(in USD million)
2021
2020
2019
Unproved properties
7,077
9,034
11,304
Proved properties, wells, plants and other equipment
193,918
194,655
1)
190,101
1)
Total capitalised cost
200,994
203,690
201,405
Accumulated depreciation, impairment and amortisation
(139,890)
(136,524)
(129,383)
Net capitalised cost
61,104
67,165
72,022
1) Restated 2020 and 2019. For more information see note 21, Provisions and other liabilities.
Net capitalised cost related to equity accounted investments as of 31 December 2021 was USD 900 million, USD 450 million in 2020
and USD 385 million in 2019. The reported figures are based on capitalised costs within the upstream segments in Equinor, in line
with the description below for result of operations for oil and gas producing activities.
Expenditures incurred in oil and gas property acquisition, exploration and development activities
These expenditures include both amounts capitalised and expensed.
Consolidated companies
(in USD million)
Norway
Eurasia
excluding
Norway
Africa
USA
Americas
excluding
USA
Total
Full year 2021
Exploration expenditures
522
61
5
139
299
1,026
Development costs
4,732
322
256
605
977
6,892
Acquired proved properties
3
5
0
0
0
8
Acquired unproved properties
6
9
1
24
(3)
37
Total
5,263
397
262
768
1,273
7,963
Full year 2020
Exploration expenditures
470
197
81
215
409
1,372
Development costs
4,466
436
279
983
565
6,729
Acquired proved properties
0
0
36
7
0
43
Acquired unproved properties
0
41
2
1
24
68
Total
4,936
674
398
1,206
998
8,212
Full year 2019
Exploration expenditures
617
381
72
153
362
1,585
Development costs
4,955
679
350
1,947
601
8,532
Acquired proved properties
1,129
0
0
845
0
1,974
Acquired unproved properties
10
338
0
133
427
908
Total
6,711
1,398
422
3,078
1,390
12,999
Equinor, Annual Report on Form 20-F 2021 289
Expenditures incurred in exploration and development activities related to equity accounted investments was USD 233 million in 2021,
USD 71 million in 2020 and USD 166 million in 2019.
Results of operation for oil and gas producing activities
As required by Topic 932, the revenues and expenses included in the following table reflect only those relating to the oil and gas
producing operations of Equinor.
The results of operations for oil and gas producing activities are included in the two upstream reporting segments Exploration &
Production Norway (E&P Norway) and Exploration & Production International (E&P International) as presented in note 4 Segments
within the Consolidated financial statements. Production cost is based on operating expenses related to production of oil and gas.
From the operating expenses certain expenses such as; transportation costs, accruals for over/underlift position and royalty payments
costs are excluded. These expenses and mainly upstream business administration are included as other expenses in the tables
below. Other revenues mainly consist of gains and losses from sales of oil and gas interests and gains and losses from commodity-
based derivatives within the upstream segments.
Income tax expense is calculated on the basis of statutory tax rates adjusted for uplift and tax credits. No deductions are made for
interest or other elements not included in the table below.
Consolidated companies
(in USD million)
Norway
Eurasia
excluding
Norway
Africa
USA
Americas
excluding
USA
Total
Full year 2021
Sales
97
476
638
207
16
1,434
Transfers
38,578
960
2,021
3,712
1,249
46,520
Other revenues
711
(14)
0
221
14
932
Total revenues
39,386
1,422
2,659
4,140
1,279
48,886
Exploration expenses
(363)
(108)
23
(211)
(362)
(1,021)
Production costs
(2,600)
(196)
(497)
(397)
(378)
(4,068)
Depreciation, amortisation and net impairment losses
(4,900)
(2,462)
(444)
(1,734)
(416)
(9,956)
Other expenses
(1,052)
(140)
53
(674)
(292)
(2,105)
Total costs
(8,915)
(2,906)
(865)
(3,016)
(1,448)
(17,150)
Results of operations before tax
30,471
(1,484)
1,794
1,124
(169)
31,736
Tax expense
(22,887)
835
(652)
(14)
(201)
(22,919)
Results of operations
7,585
(649)
1,142
1,110
(370)
8,817
Net income/(loss) from equity accounted investments
0
176
0
0
39
215
290 Equinor, Annual Report on Form 20-F 2021
Consolidated companies
(in USD million)
Norway
Eurasia
excluding
Norway
Africa
USA
Americas
excluding
USA
Total
Full year 2020
Sales
76
189
240
218
5
728
Transfers
11,778
652
1,621
2,181
910
17,142
Other revenues
165
14
0
216
5
400
Total revenues
12,019
855
1,861
2,615
920
18,270
Exploration expenses
(423)
(295)
(1,034)
(1,000)
(739)
(3,491)
Production costs
(2,048)
(192)
(440)
(563)
(376)
(3,619)
Depreciation, amortisation and net impairment losses
(5,727)
(2,081)
(737)
(3,827)
(713)
(13,085)
Other expenses
(688)
(150)
(56)
(753)
(220)
(1,867)
Total costs
(8,886)
(2,718)
(2,267)
(6,143)
(2,048)
(22,062)
Results of operations before tax
3,133
(1,863)
(406)
(3,528)
(1,128)
(3,792)
Tax expense
(1,429)
718
(168)
(30)
(252)
(1,159)
Results of operations
1,704
(1,145)
(574)
(3,558)
(1,380)
(4,951)
Net income/(loss) from equity accounted investments
0
(136)
0
0
(10)
(146)
Equinor, Annual Report on Form 20-F 2021 291
Consolidated companies
(in USD million)
Norway
Eurasia
excluding
Norway
Africa
USA
Americas
excluding
USA
Total
Full year 2019
Sales
15
243
555
302
853
1,968
Transfers
17,754
562
2,666
3,732
1,139
25,853
Other revenues
1,151
27
2
199
51
1,430
Total revenues
18,920
832
3,223
4,233
2,043
29,251
Exploration expenses
(478)
(394)
(43)
(724)
(225)
(1,864)
Production costs
(2,297)
(163)
(519)
(658)
(413)
(4,050)
Depreciation, amortisation and net impairment losses
(5,617)
(517)
(1,032)
(4,140)
(771)
(12,077)
Other expenses
(895)
(164)
(46)
(1,012)
(329)
(2,446)
Total costs
(9,287)
(1,238)
(1,640)
(6,534)
(1,738)
(20,437)
Results of operations before tax
9,633
(406)
1,583
(2,301)
305
8,814
Tax expense
(6,197)
199
(685)
(68)
(13)
(6,764)
Results of operations
3,436
(207)
898
(2,369)
292
2,050
Net income/(loss) from equity accounted investments
15
24
0
6
0
45
Average production cost in USD per boe based on entitlement
volumes (consolidated)
Norway
Eurasia
excluding
Norway
Africa
USA
Americas
excluding
USA
Total
2021
5
11
12
3
19
6
2020
4
10
9
4
14
5
2019
5
11
9
5
11
6
Production cost per boe is calculated as the production costs in the result of operations table, divided by the produced entitlement
volumes (mboe) for the corresponding period.
Standardised measure of discounted future net cash flows relating to proved oil and gas reserves
The table below shows the standardised measure of future net cash flows relating to proved reserves. The analysis is computed in
accordance with Topic 932, by applying average market prices as defined by the SEC, year-end costs, year-end statutory tax rates
and a discount factor of 10% to year-end quantities of net proved reserves. The standardised measure of discounted future net cash
flows is a forward-looking statement.
Future price changes are limited to those provided by existing contractual arrangements at the end of each reporting year. Future
development and production costs are those estimated future expenditures necessary to develop and produce year-end estimated
proved reserves based on year-end cost indices, assuming continuation of year-end economic conditions. Pre-tax future net cash flow
is net of decommissioning and removal costs. Estimated future income taxes are calculated by applying the appropriate year-end
statutory tax rates. These rates reflect allowable deductions and tax credits and are applied to estimated future pre-tax net cash flows,
less the tax basis of related assets. Discounted future net cash flows are calculated using a discount rate of 10% per year.
Discounting requires a year-by-year estimate of when future expenditures will be incurred and when reserves will be produced. The
standardised measure of discounted future net cash flows prescribed under Topic 932 requires assumptions as to the timing and
amount of future development and production costs and income from the production of proved reserves. The information does not
represent management's estimate or Equinor's expected future cash flows or the value of its proved reserves and therefore should not
be relied upon as an indication of Equinor’s future cash flow or value of its proved reserves.
292 Equinor, Annual Report on Form 20-F 2021
(in USD million)
Norway
Eurasia
excluding
Norway
Africa
USA
Americas
excluding
USA
Total
At 31 December 2021
Consolidated companies
Future net cash inflows
287,382
8,705
9,619
21,486
35,236
362,429
Future development costs
(10,999)
(1,947)
(685)
(1,112)
(4,186)
(18,928)
Future production costs
(53,251)
(4,196)
(3,380)
(7,269)
(16,782)
(84,878)
Future income tax expenses
(178,370)
(352)
(2,138)
(2,686)
(2,979)
(186,525)
Future net cash flows
44,763
2,209
3,416
10,420
11,289
72,097
10% annual discount for estimated timing of cash flows
(18,051)
(652)
(707)
(3,406)
(5,842)
(28,658)
Standardised measure of discounted future net cash flows
26,711
1,557
2,709
7,014
5,447
43,439
Equity accounted investments
Standardised measure of discounted future net cash flows
-
224
-
-
126
350
Total standardised measure of discounted future net cash
flows including equity accounted investments
26,711
1,782
2,709
7,014
5,573
43,789
(in USD million)
Norway
Eurasia
excluding
Norway
Africa
USA
Americas
excluding
USA
Total
At 31 December 2020
Consolidated companies
Future net cash inflows
107,618
6,610
7,234
14,892
10,685
147,039
Future development costs
(11,209)
(2,489)
(682)
(1,351)
(1,534)
(17,265)
Future production costs
(42,410)
(3,622)
(3,170)
(8,020)
(7,568)
(64,790)
Future income tax expenses
(35,236)
(209)
(1,262)
(965)
(336)
(38,008)
Future net cash flows
18,763
290
2,119
4,556
1,248
26,976
10% annual discount for estimated timing of cash flows
(6,937)
(80)
(505)
(1,269)
24
(8,768)
Standardised measure of discounted future net cash flows
11,826
210
1,614
3,286
1,272
18,209
Equity accounted investments
Standardised measure of discounted future net cash flows
-
(32)
-
-
22
(10)
Total standardised measure of discounted future net cash
flows including equity accounted investments
11,826
178
1,614
3,286
1,294
18,199
(in USD million)
Norway
Eurasia
excluding
Norway
Africa
USA
Americas
excluding
USA
Total
At 31 December 2019
Consolidated companies
Future net cash inflows
187,897
10,506
10,752
27,547
19,977
256,679
Future development costs
(13,068)
(3,075)
(684)
(2,338)
(2,667)
(21,832)
Future production costs
(50,316)
(4,501)
(4,180)
(11,678)
(11,453)
(82,128)
Future income tax expenses
(91,386)
(378)
(2,194)
(2,955)
(932)
(97,846)
Future net cash flows
33,127
2,553
3,694
10,575
4,925
54,873
10% annual discount for estimated timing of cash flows
(12,854)
(772)
(883)
(3,586)
(1,605)
(19,699)
Standardised measure of discounted future net cash flows
20,273
1,781
2,811
6,989
3,320
35,173
Equity accounted investments
Standardised measure of discounted future net cash flows
-
475
-
-
-
475
Total standardised measure of discounted future net cash
flows including equity accounted investments
20,273
2,256
2,811
6,989
3,320
35,648
Equinor, Annual Report on Form 20-F 2021 293
Changes in the standardised measure of discounted future net cash flows from proved reserves
(in USD million)
2021
2020
2019
Consolidated companies
Standardised measure at 1 January
18,209
35,173
43,299
Net change in sales and transfer prices and in production (lifting) costs related to future production
126,974
(52,527)
(22,147)
Changes in estimated future development costs
(5,915)
(1,547)
(3,433)
Sales and transfers of oil and gas produced during the period, net of production cost
(43,998)
(15,180)
(24,117)
Net change due to extensions, discoveries, and improved recovery
7,734
265
1,333
Net change due to purchases and sales of minerals in place
(2,280)
-
987
Net change due to revisions in quantity estimates
17,080
3,263
8,176
Previously estimated development costs incurred during the period
6,619
6,558
8,341
Accretion of discount
4,078
9,087
11,066
Net change in income taxes
(85,062)
33,117
11,668
Total change in the standardised measure during the year
25,230
(16,965)
(8,126)
Standardised measure at 31 December
43,439
18,209
35,173
Equity accounted investments
Standardised measure at 31 December
350
(10)
475
Standardised measure at 31 December including equity accounted investments
43,789
18,199
35,648
In the table above, each line item presents the sources of changes in the standardised measure value on a discounted basis, with the
accretion of discount line item reflecting the increase in the net discounted value of the proved oil and gas reserves due to the fact that
the future cash flows are now one year closer in time.
The standardised measure at the beginning of the year represents the discounted net present value after deductions of both future
development costs, production costs and taxes. The ‘Net change in sales and transfer prices and in production (lifting) costs related to
future production’ is, on the other hand, related to the future net cash flows at 31 December 2020. The proved reserves at 31
December 2020 were multiplied by the actual change in price, and change in unit of production costs, to arrive at the net effect of
changes in price and production costs. Development costs and taxes are reflected in the line items ‘Change in estimated future
development costs’ and ‘Net change in income taxes’ and are not included in the ‘Net change in sales and transfer prices and in
production (lifting) costs related to future production’.
294 Equinor, Annual Report on Form 20-F 2021
5.1 Shareholder information
Equinor is the largest company listed on the Oslo Børs where it trades under the ticker code EQNR. Equinor is also listed on the New
York Stock Exchange under the ticker code EQNR, trading in the form of American Depositary Shares (ADS).
Equinor's shares have been listed on the Oslo Børs and the New York Stock Exchange since our initial public offering on 18 June
2001. The ADSs traded on the New York Stock Exchange are evidenced by American Depositary Receipts (ADR), and each ADS
represents one ordinary share.
Dividend policy and dividends
It is Equinor's ambition to grow the annual cash dividend measured in USD per share in line with long-term underlying earnings.
Equinor’s board approves first, second and third quarter interim dividends, based on an authorisation from the annual general meeting
(AGM), while the AGM approves the fourth quarter dividend and implicitly the total annual dividend based on a proposal from the
board. It is Equinor’s intention to pay quarterly dividends, although when deciding the interim dividends and recommending the total
annual dividend level, the board will take into consideration expected cash flow, capital expenditure plans, financing requirements and
appropriate financial flexibility.
In addition to cash dividend, Equinor might buy-back shares as part of total distribution of capital to the shareholders. The
shareholders at the AGM may vote to reduce, but may not increase, the fourth quarter dividend proposed by the board of directors.
Equinor announces dividend payments in connection with quarterly results. Payment of quarterly dividends is expected to take place
within six months after the announcement of each quarterly dividend.
The following table shows the cash dividend amounts to all shareholders since 2017 on a per share basis and in aggregate.
Ordinary dividend per share
Ordinary
dividend
per share
Fiscal year
Curr.
Q1
Curr.
Q2
Curr.
Q3
Curr.
Q4
Curr.
2017
USD
0.2201
USD
0.2201
USD
0.2201
USD
0.2300
USD
0.8903
2018
USD
0.2300
USD
0.2300
USD
0.2300
USD
0.2600
USD
0.9500
2019
USD
0.2600
USD
0.2600
USD
0.2600
USD
0.2700
USD
1.0500
2020
USD
0.0900
USD
0.0900
USD
0.1100
USD
0.1200
USD
0.4100
2021
USD
0.1500
USD
0.1800
USD
0.1800
USD
0.2000
USD
0.7100
The board of directors proposes to the AGM a cash dividend of USD 0.20 per share for the fourth quarter of 2021 and to introduce an
extraordinary quarterly cash dividend of USD 0.20 per share for the fourth quarter of 2021 and for the first three quarters of 2022. The
Equinor share will trade ex-dividend 12 May 2022 on OSE and for ADR holders on NYSE. Record date will be 13 May 2022 on OSE
and NYSE. Payment date will be 27 May 2022.
Dividends in NOK per share will be calculated and communicated four business days after record date for shareholders at Oslo Børs.
The NOK dividend will be based on average USD/NOK exchange rates from Norges Bank in the period plus/minus three business
days from record date, in total seven business dates.
Share buy-back
For the period 2013-2021, the board of directors has been authorised by the annual general meeting of Equinor to repurchase Equinor
shares in the market for subsequent annulment. It is Equinor’s intention to renew this authorisation at the annual general meeting in
May 2022.
On 14 June 2021 the board of directors of Equinor ASA launched an indicative USD 600 million programme for 2021 and an indicative
annual share buy-back programme of up to USD 1.2 billion starting from 2022, subject to board approvals before starting tranches.
Equinor, Annual Report on Form 20-F 2021 295
The first tranche was approved by the board of directors of Equinor ASA on 27 July 2021 with market operations of USD 99 million
and commenced on 28 July 2021 and ended 28 September 2021. The second tranche of the market operations of the programme of
USD 330 million were approved by the board of directors of Equinor ASA on 26 October and commenced on 27 October 2021 and
ended 31 January 2022. The share buy-back programme is expected to be executed when Brent oil prices are in or above the range
of
50-60 USD/bbl and Equinor’s net debt ratio
23
prices.
23
296 Equinor, Annual Report on Form 20-F 2021
Shares purchased by issuer
Shares are acquired in the market for transfer to employees under the share savings scheme in accordance with the limits set by the
board of directors.
Equinor's share savings plan
Since 2004, Equinor has had a share savings plan for employees of the company. The purpose of this plan is to strengthen the
business culture and encourage loyalty through employees becoming part-owners of the company.
Through regular salary deductions, employees can invest up to 5% of their base salary in Equinor shares. In addition, the company
contributes 20% of the total share investment made by employees in Norway, up to a maximum of NOK 1,500 per year (approximately
USD 175). This company contribution is a tax-free employee benefit under 2021 Norwegian tax legislation. The company will
contribute in 2022 but as a taxable income. After a lock-in period of two calendar years, one extra share will be awarded for each
share purchased. Under current Norwegian tax legislation, the share award is a taxable employee benefit, with a value equal to the
value of the shares and taxed at the time of the award.
The board of directors is authorised to acquire Equinor shares in the market on behalf of the company. The authorisation is valid until
the next annual general meeting, but not beyond 30 June 2022. This authorisation replaces the previous authorisation to acquire
Equinor’s own shares for implementation of the share savings plan granted by the annual general meeting 11 May 2017. It is
Equinor’s intention to renew this authorisation at the annual general meeting on 11 May 2022.
Period in which shares were repurchased
Number of shares
repurchased
Average price per share
in NOK
Total number of shares
purchased as part of
programme
Maximum number of
shares that may yet be
purchased under the
programme authorisation
Jan-21
646,514
165.5399
6,065,868
7,934,132
Feb-21
696,049
154.8554
6,761,917
7,238,083
Mar-21
617,558
175.2210
7,379,475
6,620,525
Apr-21
643,918
167.3735
8,023,393
5,976,607
May-21
603,872
178.0344
8,627,265
5,372,735
Jun-21
573,858
186.0530
573,858
14,626,142
Jul-21
613,050
174.7683
1,186,908
14,013,092
Aug-21
575,122
186.4915
1,762,030
13,437,970
Sep-21
515,135
209.0422
2,277,165
12,922,835
Oct-21
472,560
228.9800
2,749,725
12,450,275
Nov-21
482,020
225.2311
3,231,745
11,968,255
Dec-21
467,800
233.7323
3,699,545
11,500,455
Jan-22
439,542
254.6852
4,139,087
11,060,913
Feb-22
428,573
263.6656
4,567,660
10,632,340
TOTAL
1)
2)
1)
All shares repurchased have been purchased in the open market and pursuant to the authorisation mentioned above.
2)
Weighted average price per share.
Equinor, Annual Report on Form 20-F 2021 297
Equinor ADR programme fees
Fees and charges payable by a holder of ADSs.
JPMorgan Chase Bank N.A. (JPMorgan), serves as the depositary for Equinor’s ADR programme having replaced the Deutsche Bank
Trust Company Americas (Deutsche Bank) pursuant to the Further Amended and Restated Deposit Agreement dated 4 February
2019. JPMorgan collects its fees for the delivery and surrender of ADSs directly from investors depositing shares or surrendering
ADSs for the purpose of withdrawal, or from intermediaries acting for them. The depositary collects other fees from investors by billing
ADR holders, by deducting such fees and charges from the amounts distributed or by deducting such fees from cash dividends or
other cash distributions. The depositary may refuse to provide fee-attracting services until its fees for those services are paid.
The charges of the depositary payable by investors are as follows:
ADR holders, persons depositing or withdrawing shares, and/or persons whom ADSs are issued, must
pay:
For:
USD 5.00 (or less) per 100 ADSs (or portion of 100 ADSs)
Issuance of ADSs, including issuances resulting from
a deposit of shares, a distribution of shares or rights or
other property, and issuances pursuant to stock
dividends, stock splits, mergers, exchanges of
securities or any other transactions or events affecting
the ADSs or the deposited securities.
Cancellation of ADSs for the purpose of withdrawal of
deposited securities, including if the deposit
agreement terminates, or a cancellation or reduction of
ADSs for any other reason
USD 0.05 (or less) per ADS
Any cash distribution made or elective cash/stock
dividend offered pursuant to the Deposit Agreement
USD 0.05 (or less) per ADS, per calendar year (or portion thereof)
For the operation and maintenance costs in
administering the ADR programme
A fee equivalent to the fee that would be payable if securities distributed to you had
been shares and the shares had been deposited for issuance of ADSs
Distribution to registered ADR holders of (i) securities
distributed by the company to holders of deposited
securities or (ii) cash proceeds from the sale of such
securities
Registration or transfer fees
Transfer and registration of shares on our share
register to or from the name of the Depositary or its
agent when you deposit or withdraw shares
Expenses of the Depositary
SWIFT, cable, telex, facsimile transmission and
delivery charges (as provided in the deposit
agreement).
Fees, expenses and other charges of JPMorgan or its
agent (which may be a division, branch or affiliate) for
converting foreign currency to USD, which shall be
deducted out of such foreign currency.
Taxes and other governmental charges the Depositary or the custodian have to pay,
for example, stock transfer taxes, stamp duty or withholding taxes
As necessary
Any fees, charges and expenses incurred by the Depositary or its agents for the
servicing of the deposited securities, the sale of securities, the delivery of deposited
securities or in connection with the depositary's or its custodian's compliance with
applicable law, rule or regulation, including without limitation expenses incurred on
behalf of ADR holders in connection with compliance with foreign exchange control
regulations or any law or regulation relating to foreign investment
As necessary
Direct and indirect payments by the depositary
Under our arrangement with J.P. Morgan, the company will each year receive from J.P. Morgan the lesser of (a) USD 2,000,000 and
(b) the difference between revenues and expenses of the ADR programme. For the year ended 31 December 2021, J.P. Morgan
298 Equinor, Annual Report on Form 20-F 2021
reimbursed USD 2,000,000 to the company. Other reasonable costs associated with the administration of the ADR programme are
borne by the company. For the year ended 31 December 2021, such costs, associated with the administration of the ADR programme,
paid by the company, added up to USD 201,166. Under certain circumstances, including the removal of J.P. Morgan as depositary,
the company is required to repay to JPMorgan certain amounts paid to the company in prior periods.
Taxation
Norwegian tax consequences
This section describes material Norwegian tax consequences for shareholders in connection with the acquisition, ownership and
disposal of shares and American Depositary Shares (“ADS”) in Equinor. The term “shareholders” refers to both holders of shares and
holders of ADSs, unless otherwise explicitly stated.
The outline does not provide a complete description of all Norwegian tax regulations that might be relevant (i.e. for investors to whom
special regulations may apply, including shareholders that carry on business activities in Norway, and whose shares or ADSs are
effectively connected with such business activities), and is based on current law and practice. Shareholders should consult their
professional tax advisers for advice about individual tax consequences.
Taxation of dividends received by Norwegian shareholders
Corporate shareholders (i.e. limited liability companies and similar entities) residing in Norway for tax purposes are generally subject
to tax in Norway on dividends received from Norwegian companies. The basis for taxation is 3% of the dividends received, which is
subject to the standard income tax rate of 22%.
Individual shareholders residing in Norway for tax purposes are subject to the standard income tax rate of 22% for dividend income
exceeding a basic tax free allowance. However, dividend income exceeding the basic tax free allowance is grossed up with a factor of
1.44 before being included in the ordinary taxable income, resulting in an effective tax rate of 31.68% (22% x 1.44) for the income
year 2021. The tax free allowance is computed for each individual share or ADS and corresponds as a rule to the cost price of that
share or ADS multiplied by an annual risk-free interest rate. Any part of the calculated allowance for one year that exceeds the
dividend distributed for the share or ADS (“unused allowance”) may be carried forward and set off against future dividends received
on (or gains upon the realisation of, see below) the same share or ADS. Any unused allowance will also be added to the basis for
computation of the allowance for the same share or ADS the following year.
Individual shareholders residing in Norway for tax purposes may hold the listed shares in companies resident within the EEA through
a stock savings account. Dividend on shares owned through the stock savings account is only taxable when the dividend is withdrawn
from the account.
Taxation of dividends received by foreign shareholders
Non-resident shareholders are as a starting point subject to Norwegian withholding tax at a rate of 25% on dividends from Norwegian
companies. The distributing company is responsible for deducting the withholding tax upon distribution to non-resident shareholders.
Corporate shareholders that carry on business activities in Norway, and whose shares or ADSs are effectively connected with such
activities are not subject to withholding tax. For such shareholders, 3% of the received dividends are subject to the standard income
tax of 22%.
Certain other important exceptions and modifications are outlined below.
The withholding tax does not apply to corporate shareholders in the EEA that are comparable to Norwegian limited liability companies
or certain other types of Norwegian entities, and are further able to demonstrate that they are genuinely established and carry on
genuine economic business activity within the EEA, provided that Norway is entitled to receive information from the country of
residence pursuant to a tax treaty or other international treaty. If no such treaty exists with the country of residence, the shareholder
may instead present confirmation issued by the tax authorities of the country of residence verifying the documentation.
The withholding rate of 25% is often reduced in tax treaties between Norway and other countries. The reduced withholding tax rate will
generally only apply to dividends paid on shares held by shareholders who are able to properly demonstrate that they are the
beneficial owner and entitled to the benefits of the tax treaty.
Individual shareholders residing for tax purposes in the EEA may apply to the Norwegian tax authorities for a refund if the tax withheld
by the distributing company exceeds the tax that would have been levied on individual shareholders resident in Norway.
Individual shareholders residing for tax purposes in the EEA may hold the listed shares in companies resident within the EEA through
a stock savings account. Dividend on shares owned through the stock savings account will only be subject to withholding tax when
withdrawn from the account.
Procedure for claiming a reduced withholding tax rate on dividends:
Equinor, Annual Report on Form 20-F 2021 299
A foreign shareholder that is entitled to an exemption from or reduction of withholding tax on dividends, may request that the
exemption or reduction is applied at source by the distributor. Such request must be accompanied by satisfactory documentation
which supports that the foreign shareholder is entitled to a reduced withholding tax rate. Specific documentation requirements apply.
For holders of shares and ADSs deposited with JPMorgan Chase Bank N.A. (JPMorgan), documentation establishing that the holder
is eligible for the benefits under a tax treaty with Norway, may be provided to JPMorgan. JPMorgan has been granted permission by
the Norwegian tax authorities to receive dividends from us for redistribution to a beneficial owner of shares and ADSs at the applicable
treaty withholding rate.
The statutory 25% withholding tax rate will be levied on dividends paid to shareholders (either directly or through a depositary) who
have not provided the relevant documentation to the relevant party that they are eligible for a reduced rate. The beneficial owners will
in this case have to apply to Skatteetaten (The Norwegian Tax Administration) for a refund of the excess amount of tax withheld.
Please refer to the tax authorities’ web page for more information and the requirements of such application:
www.skatteetaten.no/en/person
.
Taxation on realisation of shares and ADSs
Corporate shareholders resident in Norway for tax purposes are not subject to tax in Norway on gains derived from the sale,
redemption or other disposal of shares or ADSs in Norwegian companies. Capital losses are not deductible.
Individual shareholders residing in Norway for tax purposes are subject to tax in Norway on the sale, redemption or other disposal of
shares or ADSs. Gains or losses in connection with such realisation are included in the individual's ordinary taxable income in the year
of disposal, which is subject to the standard income tax rate of 22%. However, the taxable gain or deductible loss is grossed up with a
factor of 1.44 before included in the ordinary taxable income, resulting in an effective tax rate of 31.68% (22% x 1.44) for the income
year 2021.
The taxable gain or deductible loss (before gross up) is calculated as the sales price adjusted for transaction expenses minus the
taxable basis. A shareholder's tax basis is normally equal to the acquisition cost of the shares or ADSs. Any unused allowance
pertaining to a share may be deducted from a taxable gain on the same share or ADS but may not lead to or increase a deductible
loss. Furthermore, any unused allowance may not be set off against gains from the realisation of the other shares or ADSs.
If a shareholder disposes of shares or ADSs acquired at different times, the shares or ADSs that were first acquired will be deemed to
be first sold (the “FIFO” principle) when calculating gain or loss for tax purposes.
Individual shareholders residing in Norway for tax purposes may hold listed shares in companies resident within the EEA through a
stock savings account. Gain on shares owned through the stock savings account will only be taxable when withdrawn from the
account whereas loss on shares will be deductible when the account is terminated.
A corporate shareholder or an individual shareholder who ceases to be tax resident in Norway due to Norwegian law or tax treaty
provisions may, in certain circumstances, become subject to Norwegian exit taxation on unrealised capital gains related to shares or
ADSs.
Shareholders not residing in Norway are generally not subject to tax in Norway on capital gains, and losses are not deductible on the
sale, redemption or other disposal of shares or ADSs in Norwegian companies, unless the shareholder carries on business activities
in Norway and
such shares or ADSs are or have been effectively connected with such activities.
Wealth tax
The shares or ADSs are included in the basis for the computation of wealth tax imposed on individuals residing in Norway for tax
purposes. Norwegian limited liability companies and certain similar entities are not subject to wealth tax. The marginal wealth tax rate
for the income year 2021 is 0.85% of the value assessed. The assessment value of listed shares (including ADSs) is 55% of the listed
value of such shares or ADSs on1 January 2022.
Non-resident shareholders are not subject to wealth tax in Norway for shares and ADSs in Norwegian limited liability companies
unless the shareholder is an individual and the shareholding is effectively connected with the individual's business activities in
Norway.
Inheritance tax and gift tax
No inheritance or gift tax is imposed in Norway.
Transfer tax
No transfer tax is imposed in Norway in connection with the sale or purchase of shares or ADSs.
United States tax matters
This section describes the material United States federal income tax consequences for US holders (as defined below) of the
ownership and disposition of shares or ADSs. It only applies to you if you hold your shares or ADSs as capital assets for United States
300 Equinor, Annual Report on Form 20-F 2021
federal income tax purposes. This discussion addresses only United States federal income taxation and does not discuss all of the tax
consequences that may be relevant to you in light of your individual circumstances, including foreign, state or local tax consequences,
estate and gift tax consequences, and tax consequences arising under the Medicare contribution tax on net investment income or the
alternative minimum tax. This section does not apply to you if you are a member of a special class of holders subject to special rules,
including dealers in securities, traders in securities that elect to use a mark-to-market method of accounting for securities holdings,
tax-exempt organisations, insurance companies, partnerships or entities or arrangements that are treated as partnerships for United
States federal income tax purposes, persons that actually or constructively own 10% of the combined voting power of voting stock of
Equinor or of the total value of stock of Equinor, persons that hold shares or ADSs as part of a straddle or a hedging or conversion
transaction, persons that purchase or sell shares or ADSs as a part of a wash sale for tax purposes, or persons whose functional
currency is not USD.
This section is based on the Internal Revenue Code of 1986, as amended, its legislative history, existing and proposed regulations,
published rulings and court decisions, all as currently in effect, and the Convention between the United States of America and the
Kingdom of Norway for the Avoidance of Double Taxation and the Prevention of Fiscal Evasion with Respect to Taxes on Income and
Property (the ”Treaty”). These laws are subject to change, possibly on a retroactive basis. In addition, this section is based in part
upon the representations of the depositary and the assumption that each obligation in the deposit agreement and any related
agreement will be performed in accordance with its terms. For United States federal income tax purposes, if you hold ADRs
evidencing ADSs, you will generally be treated as the owner of the ordinary shares represented by those ADRs. Exchanges of shares
for ADRs and ADRs for shares will not generally be subject to United States federal income tax.
A “US holder” is a beneficial owner of shares or ADSs that is, for United States federal income tax purposes: (i) a citizen or resident of
the United States; (ii) a United States domestic corporation; (iii) an estate whose income is subject to United States federal income tax
regardless of its source; or (iv) a trust if a United States court can exercise primary supervision over the trust's administration and one
or more United States persons are authorised to control all substantial decisions of the trust.
You should consult your own tax adviser regarding the United States federal, state and local and Norwegian and other tax
consequences of owning and disposing of shares and ADSs in your particular circumstances.
The tax treatment of the shares or ADSs will depend in part on whether or not we are classified as a passive foreign investment
company, or PFIC, for United States federal income tax purposes. Except as discussed below, under “—PFIC rules”, this discussion
assumes that we are not classified as a PFIC for United States federal income tax purposes.
Taxation of distributions
Under the United States federal income tax laws, the gross amount of any distribution (including any Norwegian tax withheld from the
distribution payment) paid by Equinor out of its current or accumulated earnings and profits (as determined for United States federal
income tax purposes), other than certain pro-rata distributions of its shares, will be treated as a dividend that is taxable for you when
you, in the case of shares, or the depositary, in the case of ADSs, receive the dividend, actually or constructively. If you are a non-
corporate US holder, dividends that constitute qualified dividend income will be eligible to be taxed at the preferential rates applicable
to long-term capital gains as long as, in the year that you receive the dividend, the shares or ADSs are readily tradable on an
established securities market in the United States or Equinor is eligible for benefits under the Treaty. We believe that Equinor is
currently eligible for the benefits of the Treaty and we therefore expect that dividends on the ordinary shares or ADSs will be qualified
dividend income. To qualify for the preferential rates, you must hold the shares or ADSs for more than 60 days during the 121-day
period beginning 60 days before the ex-dividend date and meet certain other requirements. The dividend will not be eligible for the
dividends-received deduction generally allowed to United States corporations in respect of dividends received from other United
States corporations.
The amount of the dividend distribution that you must include in your income will be the value in USD of the payments made in NOK
determined at the spot NOK/USD rate on the date the dividend distribution is includible in your income, regardless of whether or not
the payment is in fact converted into USD. Distributions in excess of current and accumulated earnings and profits, as determined for
United States federal income tax purposes, will be treated as a non-taxable return of capital to the extent of your tax basis in the
shares or ADSs and, to the extent in excess of your tax basis, will be treated as capital gain. However, Equinor does not expect to
calculate earnings and profits in accordance with United States federal income tax principles. Accordingly, you should expect to
generally treat distributions we make as dividends.
Subject to certain limitations, the 15% Norwegian tax withheld in accordance with the Treaty and paid to Norway will be creditable or
deductible against your United States federal income tax liability, unless a reduction or refund of the tax withheld is available to you
under Norwegian law. Special rules apply in determining the foreign tax credit limitation with respect to dividends that are subject to
the preferential tax rates. Dividends will generally be income from sources outside the United States and will generally be “passive”
income for purposes of computing the foreign tax credit allowable to you. Any gain or loss resulting from currency exchange rate
fluctuations during the period from the date you include the dividend payment in income until the date you convert the payment into
USD will generally be treated as US-source ordinary income or loss and will not be eligible for the special tax rate.
Taxation of capital gains

Equinor, Annual Report on Form 20-F 2021 301
If you sell or otherwise dispose of your shares or ADSs, you will generally recognise a capital gain or loss for United States federal
income tax purposes equal to the difference between the value in USD of the amount that you realise and your tax basis, determined
in USD, in your shares or ADSs. Capital gain of a non-corporate US holder is generally taxed at preferential rates if the property is
held for more than one year. The gain or loss will generally be income or loss from sources within the United States for foreign tax
credit limitation purposes. If you receive any foreign currency on the sale of shares or ADSs, you may recognise ordinary income or
loss from sources within the United States as a result of currency fluctuations between the date of the sale of the shares or ADSs and
the date the sales proceeds are converted into USD. You should consult your own tax adviser regarding how to account for payments
made or received in a currency other than USD.
PFIC rules
We believe that the shares and ADSs should not currently be treated as stock of a PFIC for United States federal income tax
purposes and we do not expect to become a PFIC in the foreseeable future. However, this conclusion is a factual determination that is
made annually and thus may be subject to change. It is therefore possible that we could become a PFIC in a future taxable year. If we
were to be treated as a PFIC, a gain realised on the sale or other disposition of the shares or ADSs would in general not be treated as
a capital gain. Instead, unless you elect to be taxed annually on a mark-to-market basis with respect to the shares or ADSs, you would
generally be treated as if you had realised such gain and certain “excess distributions” ratably over your holding period for the shares
or ADSs. Amounts allocated to the year in which the gain is realised or the “excess distribution” is received or to a taxable year before
we were classified as a PFIC would be subject to tax at ordinary income tax rates, and amounts allocated to all other years would be
taxed at the highest tax rate in effect for each such year to which the gain or distribution was allocated, together with an interest
charge in respect of the tax attributable to each such year. With certain exceptions, your shares or ADSs will be treated as stock in a
PFIC if we were a PFIC at any time during the period you held the shares or ADSs. Dividends that you receive from us will not be
eligible for the preferential tax rates if we are treated as a PFIC with respect to you, either in the taxable year of the distribution or the
preceding taxable year, but will instead be taxable at rates applicable to ordinary income.
Foreign Account Tax Compliance Withholding
A 30% withholding tax will be imposed on certain payments to certain non-US financial institutions that fail to comply with information
reporting requirements or certification requirements in respect of their direct and indirect United States shareholders and/or United
States accountholders. To avoid becoming subject to the 30% withholding tax on payments to them, we and other non-US financial
institutions may be required to report information to the IRS regarding the holders of shares or ADSs and to withhold on a portion of
payments under the shares or ADSs to certain holders that fail to comply with the relevant information reporting requirements (or hold
shares or ADSs directly or indirectly through certain non-compliant intermediaries). However, under proposed Treasury regulations,
such withholding will not apply to payments made before the date that is two years after the date on which final regulations defining
the term “foreign passthru payment” are enacted. The rules for the implementation of these requirements have not yet been fully
finalised, so it is impossible to determine at this time what impact, if any, these requirements will have on holders of the shares and
ADSs.
Major shareholders
The Norwegian State is the largest shareholder in Equinor, with a direct ownership interest of 67%. Its ownership interest is
managed by the Norwegian Ministry of Trade, Industry and Fisheries.

302 Equinor, Annual Report on Form 20-F 2021
As of 31 December 2021, the Norwegian State had a 67% direct ownership interest in Equinor and a 3.6% indirect interest
through the National Insurance Fund (Folketrygdfondet), totalling 70.6%.
Equinor has one class of shares, and each share confers one vote at the general meeting. The Norwegian State does not have
any voting rights that differ from the rights of other ordinary shareholders. Pursuant to the Norwegian Public Limited Liability
Companies Act, a majority of at least two-thirds of the votes cast as well as of the votes represented at a general meeting is
required to amend our articles of association. As long as the Norwegian State owns more than one-third of our shares, it will be
able to prevent any amendments to our articles of association. Since the Norwegian State, acting through the Norwegian Minister
of Petroleum and Energy, has in excess of two-thirds of the shares in the company, it has sole power to amend our articles of
association. In addition, as majority shareholder, the Norwegian State has the power to control any decision at general meetings
of our shareholders that requires a majority vote, including the election of the majority of the corporate assembly, which has the
power to elect our board of directors and approve the dividend proposed by the board of directors.
The Norwegian State endorses the principles set out in "The Norwegian Code of Practice for Corporate Governance", and it has
stated that it expects companies in which the State has ownership interests to adhere to the code. The principle of ensuring equal
treatment of different groups of shareholders is a key element in the State's own guidelines. In companies in which the State is a
shareholder together with others, the State wishes to exercise the same rights and obligations as any other shareholder and not
act in a manner that has a detrimental effect on the rights or financial interests of other shareholders. In addition to the principle of
equal treatment of shareholders, emphasis is also placed on transparency in relation to the State's ownership and on the general
meeting being the correct arena for owner decisions and formal resolutions.
Equinor, Annual Report on Form 20-F 2021 303
Shareholders at December 2021
Number of Shares
Ownership in %
1
Government of Norway
2,182,650,763
67.00%
2
Folketrygdfondet
120,551,782
3.70%
3
BlackRock Institutional Trust Company, N.A.
35,910,427
1.10%
4
Schroder Investment Management Ltd. (SIM)
35,312,273
1.08%
5
The Vanguard Group, Inc.
31,919,771
0.98%
6
T. Rowe Price Associates, Inc
22,690,956
0.70%
7
DNB Asset Management AS
20,054,515
0.62%
8
KLP Forsikring
19,428,192
0.60%
9
Dodge & Cox
19,239,700
0.59%
10
Storebrand Kapitalforvaltning AS
17,013,421
0.52%
11
Wellington Management Company, LLP
15,122,526
0.46%
12
Marathon Asset Management LLP
13,762,270
0.42%
13
SAFE Investment Company Limited
11,942,771
0.37%
14
BlackRock Investment Management (UK) Ltd.
11,839,222
0.36%
15
Lazard Asset Management, L.L.C.
11,711,934
0.36%
16
State Street Global Advisors (US)
11,635,616
0.36%
17
Templeton Investment Counsel, L.L.C.
10,107,080
0.31%
18
BlackRock Advisors (UK) Limited
9,507,244
0.29%
19
Alfred Berg Kapitalforvaltning AS
9,221,242
0.28%
20
Ruffer LLP
8,922,493
0.27%
Source: Data collected by third party, authorised by Equinor, December 2021.
Exchange controls and limitations
Under Norwegian foreign exchange controls currently in effect, transfers of capital to and from Norway are not subject to prior
government approval. An exception applies to the physical transfer of payments in currency exceeding certain thresholds, which
must be declared to the Norwegian custom authorities. This means that non-Norwegian resident shareholders may receive
dividend payments without Norwegian exchange control consent as long as the payment is made through a licensed bank or other
licensed payment institution.
There are no restrictions affecting the rights of non-Norwegian residents or foreign owners to hold or vote for our shares.
304 Equinor, Annual Report on Form 20-F 2021
5.2
Use and reconciliation of non-GAAP financial measures
Since 2007, Equinor has been preparing the Consolidated financial statements in accordance with International Financial Reporting
Standards (IFRS) as adopted by the European union (EU) and as issued by the International Accounting Standards Board. IFRS has
been applied consistently to all periods presented in the 2021 Consolidated financial statements.
Equinor is subject to SEC regulations regarding the use of non-GAAP financial measures in public disclosures. Non-GAAP financial
measures are defined as numerical measures that either exclude or include amounts that are not excluded or included in the
comparable measures calculated and presented in accordance with generally accepted accounting principles: (i.e, IFRS in the case of
Equinor). The following financial measures may be considered non-GAAP financial measures:
a) Net debt to capital employed ratio, Net debt to capital employed ratio adjusted, including lease liabilities and Net debt to capital
employed ratio adjusted
b) Return on average capital employed (ROACE)
c) Organic capital expenditures
d) Free cashflow and organic free cashflow
e) Adjusted earnings and adjusted earnings after tax
f) Total shareholder return (TSR)
g) Gross capital expenditure (gross capex)
a) Net debt to capital employed ratio
In Equinor’s view, net debt ratio provides a more informative picture of Equinor’s financial strength than gross interest-bearing financial
debt. Three different net debt ratios are provided below; 1) net debt to capital employed ratio, 2) net debt to capital employed ratio
adjusted, including lease liabilities, and 3) net debt to capital employed ratio adjusted.
The calculation is based on gross interest-bearing financial debt in the balance sheet and adjusted for cash, cash equivalents and
current financial investments. Certain adjustments are made, e.g. collateral deposits classified as cash and cash equivalents in the
Consolidated balance sheet are considered non-cash in the non-GAAP calculations. The financial investments held in Equinor
Insurance AS are excluded in the non-GAAP calculations as they are deemed restricted. These two adjustments increase net debt
and give a more prudent definition of the net debt to capital employed ratio than if the IFRS based definition was to be used. Following
implementation of IFRS16 Equinor presents a “net debt to capital employed adjusted” excluding lease liabilities from the gross
interest-bearing debt. Net interest-bearing debt adjusted for these items is included in the average capital employed. The table below
reconciles the net interest-bearing debt adjusted, the capital employed and the net debt to capital employed adjusted ratio with the
most directly comparable financial measure or measures calculated in accordance with IFRS.
Equinor, Annual Report on Form 20-F 2021 305
Calculation of capital employed and net debt to capital employed ratio
For the year ended 31 December
(in USD million)
2021
2020
2019
Shareholders' equity
39,010
33,873
41,139
Non-controlling interests
14
19
20
Total equity
A
39,024
33,892
41,159
Current finance debt
6,386
5,777
4,087
Non-current finance debt
29,854
32,338
24,945
Gross interest-bearing debt
B
36,239
38,115
29,032
Cash and cash equivalents
14,126
6,757
5,177
Current financial investments
21,246
11,865
7,426
Cash and cash equivalents and current financial investment
C
35,372
18,621
12,604
Net interest-bearing debt before adjustments
B1 = B-C
867
19,493
16,429
Other interest-bearing elements
2,369
627
790
Net interest-bearing debt adjusted, including lease liabilities
B2
3,236
20,121
17,219
Lease liabilities
3,562
4,405
4,339
Net interest-bearing debt adjusted
B3
(326)
15,716
12,880
Calculation of capital employed:
Capital employed
A+B1
39,891
53,385
57,588
Capital employed adjusted, including lease liabilities
A+B2
42,259
54,012
58,378
Capital employed adjusted
3)
A+B3
38,697
49,608
54,039
Calculated net debt to capital employed
Net debt to capital employed
(B1)/(A+B1)
2.2%
36.5%
28.5%
Net debt to capital employed adjusted, including lease liabilities
(B2)/(A+B2)
7.7%
37.3%
29.5%
Net debt to capital employed adjusted
3)
(B3)/(A+B3)
(0.8%)
31.7%
23.8%
1)
Other interest-bearing elements are cash and cash equivalents adjustments regarding collateral deposits classified as cash and cash
equivalents in the Consolidated balance sheet but considered as non-cash in the non-GAAP calculations as well as financial investments
in Equinor Insurance AS classified as current financial investments.
b) Return on average capital employed (ROACE)
This measure provides useful information for both the group and investors about performance during the period under evaluation.
Equinor uses ROACE to measure the return on capital employed adjusted, regardless of whether the financing is through equity or
debt. The use of ROACE should not be viewed as an alternative to income before financial items, income taxes and minority interest,
or to net income, which are measures calculated in accordance with IFRS or ratios based on these figures. For a reconciliation for
adjusted earnings after tax, see e) later in this section.
ROACE was 22,7% in 2021, compared to 1,8% in 2020 and 12.0% in 2019. The change from 2020 is mainly due to increase in
adjusted earnings after tax.
306 Equinor, Annual Report on Form 20-F 2021
Calculated ROACE based on Adjusted earnings after tax and capital employed adjusted
For the year ended 31 December
(in USD million, except percentages)
2021
2020
2019
Adjusted earnings after tax (A)
10,042
924
4,925
Average capital employed adjusted (B)
44,153
51,823
54,637
Calculated ROACE based on Adjusted earnings after tax and capital employed adjusted (A/B)
22.7%
1.8%
9.0 %
c) Organic capital expenditures
Capital expenditures, defined as Additions to PP&E, intangibles and equity accounted investments in note 4 Segments to the
Consolidated financial statements, amounted to USD 8.5 billion in 2021.
Organic capital expenditures are capital expenditures excluding acquisitions, capital leases and other investments with significant
different cash flow pattern.
In 2021, a total of USD 0.4 billion were excluded from the organic capital expenditures. Among items excluded from the organic
capital expenditure in 2021 were acquisition of 100% interest in Polish onshore renewables developer Wento and additions of Right of
Use (RoU) assets related to leases, resulting in organic capital expenditure of USD 8.1 billion.
In 2020, capital expenditures were USD 9.8 billion as per note 4 Segments to the Consolidated financial statements. A total of USD
2.0 billion were excluded from the organic capital expenditures. Among items excluded from the organic capital expenditure in 2020
were acquisition of 30% interest in the Bandurria Sur onshore block in Argentina, acquisition of a 49% share in LLC KrasGeoNaC in
Russia, and additions of Right of Use (RoU) assets related to leases, resulting in organic capital expenditure of USD 7.8 billion.
d) Free cash flow
Free cash flow includes the following line items in the Consolidated statement of cash flows: Cash flows provided by operating
activities before taxes paid and working capital items (USD 42.0 billion), taxes paid (negative USD 8.6 billion), cash used in business
combinations (USD 0.1 billion), capital expenditures and investments (negative USD 8.0 billion), (increase)/decrease in other items
interest-bearing (USD 0.0 billion), proceeds from sale of assets and businesses (USD 1,9 billion), dividend paid (negative USD 1.8
billion) and share buy-back (negative USD 0,3 billion), resulting in a free cash flow of USD 25 billion in 2021.
e) Adjusted earnings and adjusted earnings after tax
Management considers adjusted earnings and adjusted earnings after tax together with other non-GAAP financial measures as
defined below, to provide an indication of the underlying operational and financial performance in the period (excluding financing) by
adjusting by items that are not well correlated to Equinor’s operating performance, and therefore better facilitate comparisons between
periods.
The following financial measures may be considered non-GAAP financial measures:
Adjusted earnings
are based on net operating income/(loss) and adjusts for certain items affecting the income for the period in order
to separate out effects that management considers may not be well correlated to Equinor’s underlying operational performance in the
individual reporting period. Management considers adjusted earnings to be a supplemental measure to Equinor’s IFRS measures,
which provides an indication of Equinor’s underlying operational performance in the period and facilitates an alternative understanding
of operational trends between the periods. Adjusted earnings include adjusted revenues and other income, adjusted purchases,
adjusted operating expenses and selling, general and administrative expenses, adjusted depreciation expenses and adjusted
exploration expenses. Adjusted earnings adjusts for the following items:
●
Changes in fair value of derivatives:
embedded derivatives, required to be carried at fair value. Also, certain transactions related to historical divestments include
contingent consideration, are carried at fair value. The accounting impacts of changes in fair value of the aforementioned are
excluded from adjusted earnings. In addition, adjustments are also made for changes in the unrealised fair value of derivatives
related to some natural gas trading contracts. Due to the nature of these gas sales contracts, these are classified as financial
derivatives to be measured at fair value at the balance sheet date. Unrealised gains and losses on these contracts reflect the
value of the difference between current market gas prices and the actual prices to be realised under the gas sales contracts. Only
realised gains and losses on these contracts are reflected in adjusted earnings. This presentation best reflects the underlying
performance of the business as it replaces the effect of temporary timing differences associated with the re-measurements of the
derivatives to fair value at the balance sheet date with actual realised gains and losses for the period
●
Periodisation of inventory hedging effect:
Commercial storage is hedged in the paper market and is accounted for using the
lower of cost or market price. If market prices increase above cost price, the inventory will not reflect this increase in value. There
Equinor, Annual Report on Form 20-F 2021 307
will be a loss on the derivative hedging the inventory since the derivatives always reflect changes in the market price. An
adjustment is made to reflect the unrealised market increase of the commercial storage. As a result, loss on derivatives is
matched by a similar adjustment for the exposure being managed. If market prices decrease below cost price, the write-down of
the inventory and the derivative effect in the IFRS income statement will offset each other and no adjustment is made
●
Over/underlift
: Over/underlift is accounted for using the sales method and therefore revenues were reflected in the period the
product was sold rather than in the period it was produced. The over/underlift position depended on a number of factors related to
our lifting programme and the way it corresponded to our entitlement share of production. The effect on income for the period is
therefore adjusted, to show estimated revenues and associated costs based upon the production for the period to reflect
operational performance and comparability with peers.
●
The
operational storage
is not hedged and is not part of the trading portfolio. Cost of goods sold is measured based on the
FIFO (first-in, first-out) method, and includes realised gains or losses that arise due to changes in market prices. These gains or
losses will fluctuate from one period to another and are not considered part of the underlying operations for the period
●
Impairment and reversal of impairment
are excluded from adjusted earnings since they affect the economics of an asset for
the lifetime of that asset, not only the period in which it is impaired or the impairment is reversed. Impairment and reversal of
impairment can impact both the exploration expenses and the depreciation, amortisation and impairment line items
●
Gain or loss from sales of assets
is eliminated from the measure since the gain or loss does not give an indication of future
performance or periodic performance; such a gain or loss is related to the cumulative value creation from the time the asset is
acquired until it is sold
●
Eliminations (Internal unrealised profit on inventories:):
Volumes derived from equity oil inventory will vary depending on
several factors and inventory strategies, i.e. level of crude oil in inventory, equity oil used in the refining process and level of in-
transit cargoes. Internal profit related to volumes sold between entities within the group, and still in inventory at period end, is
eliminated according to IFRS (write down to production cost). The proportion of realised versus unrealised gain will fluctuate from
one period to another due to inventory strategies and consequently impact net operating income/(loss). Write-down to production
cost is not assessed to be a part of the underlying operational performance, and elimination of internal profit related to equity
volumes is excluded in adjusted earnings
●
Other items of income and expense
are adjusted when the impacts on income in the period are not reflective of Equinor’s
underlying operational performance in the reporting period. Such items may be unusual or infrequent transactions but they may
also include transactions that are significant which would not necessarily qualify as either unusual or infrequent. Other items are
carefully assessed and can include transactions such as provisions related to reorganisation, early retirement, etc.
●
Change in accounting policy
reflective of Equinor’s underlying operational performance in the reporting period
Adjusted earnings after tax
– equals the sum of net operating income/(loss) less income tax in business areas and adjustments to
operating income taking the applicable marginal tax into consideration. Adjusted earnings after tax excludes net financial items and
the associated tax effects on net financial items. It is based on adjusted earnings less the tax effects on all elements included in
adjusted earnings (or calculated tax on operating income and on each of the adjusting items using an estimated marginal tax rate). In
addition, tax effect related to tax exposure items not related to the individual reporting period is excluded from adjusted earnings after
tax. Management considers adjusted earnings after tax, which reflects a normalised tax charge associated with its operational
performance excluding the impact of financing, to be a supplemental measure to Equinor’s net income. Certain net USD denominated
financial positions are held by group companies that have a USD functional currency that is different from the currency in which the
taxable income is measured. As currency exchange rates change between periods, the basis for measuring net financial items for
IFRS will change disproportionally with taxable income which includes exchange gains and losses from translating the net USD
denominated financial positions into the currency of the applicable tax return. Therefore, the effective tax rate may be significantly
higher or lower than the statutory tax rate for any given period. Adjusted taxes included in adjusted earnings after tax should not be
considered indicative of the amount of current or total tax expense (or taxes payable) for the period.
Adjusted earnings and adjusted earnings after tax should be considered additional measures rather than substitutes for net operating
income/(loss) and net income/(loss), which are the most directly comparable IFRS measures. There are material limitations
associated with the use of adjusted earnings and adjusted earnings after tax compared with the IFRS measures as such non-GAAP
measures do not include all the items of revenues/gains or expenses/losses of Equinor that are needed to evaluate its profitability on
an overall basis. Adjusted earnings and adjusted earnings after tax are only intended to be indicative of the underlying developments
in trends of our on-going operations for the production, manufacturing and marketing of our products and exclude pre-and post-tax
impacts of net financial items. Equinor reflects such underlying development in our operations by eliminating the effects of certain
items that may not be directly associated with the period's operations or financing. However, for that reason, adjusted earnings and
adjusted earnings after tax are not complete measures of profitability. These measures should therefore not be used in isolation.
308 Equinor, Annual Report on Form 20-F 2021
Calculation of adjusted earnings after tax
For the year ended 31 December
(in USD million)
2021
2020
2019
Net operating income
33,663
(3,423)
9,299
Total revenues and other income
(1,836)
90
(1,022)
Changes in fair value of derivatives
(146)
2
(291)
Periodisation of inventory hedging effect
49
224
306
Impairment from associated companies
4
3
23
Over-/underlift
(125)
(130)
166
Gain/loss on sale of assets
(1,561)
(9)
(1,227)
Provisions
(57)
-
Purchases [net of inventory variation]
230
(168)
508
Operational storage effects
(231)
127
(121)
Eliminations
461
(296)
628
Operating and administrative expenses
(11)
378
619
Over-/underlift
23
70
(32)
Other adjustments
(43)
1
-
Change in accounting policy
1)
-
-
123
Gain/loss on sale of assets
47
23
43
Provisions
(37)
285
485
Depreciation, amortisation and impairment
1,288
5,715
3,429
Impairment
2,963
5,934
3,549
Reversal of impairment
(1,675)
(218)
(120)
Exploration expenses
152
1,345
651
Impairment
175
1,397
651
Reversal of impairment
(22)
(63)
-
Provisions
-
11
-
Sum of adjustments to net operating income
(177)
7,361
4,185
Adjusted earnings
33,486
3,938
13,484
Tax on adjusted earnings
(23,445)
(3,014)
(8,559)
Adjusted earnings after tax
10,042
924
4,925
1) Change in accounting policy for lifting imbalances.
f) Total shareholder return (TSR)
Total shareholder return (TSR) is the sum of a share’s price growth and dividends for the same period, divided by the share price at
beginning of period.
g) Gross capital expenditure (gross capex)
Renewables (REN) and low-carbon solutions’ (LCS) share of gross capex is calculated as gross capex to REN and LCS defined
as investments prior to project financing, divided by total organic capex (including REN and LCS gross capex).
Equinor, Annual Report on Form 20-F 2021 309
5.3 Legal proceedings
Equinor is involved in a number of proceedings globally concerning matters arising in connection with the conduct of its business. No
further update is provided on previously reported legal or arbitration proceedings. Equinor does not believe such proceedings will,
individually or in the aggregate, have a significant effect on Equinor’s financial position, profitability, results of operations or liquidity.
See also note 10 Income taxes and note 24 Other commitments, contingent liabilities and contingent assets to the Consolidated
financial statements.
310 Equinor, Annual Report on Form 20-F 2021
5.7 Terms and abbreviations
Organisational abbreviations
●
●
●
●
●
●
●
●
●
●
●
2
●
2
e - Carbon dioxide equivalent
●
●
●
●
●
●
●
●
●
●
●
●
●
●
●
●
●
●
●
●
●
●
●
●
●
●
●
●
●
●
●
●
●
●
●
●
●
●
●
●
●
●
●
●
●
●
●
●
●
●
Equinor, Annual Report on Form 20-F 2021 311
●
●
●
●
●
●
●
●
●
●
●
●
●
●
●
●
Metric abbreviations etc.
●
●
●
●
●
●
●
●
●
●
●
●
●
●
●
●
Equivalent measurements are based upon
●
●
●
●
●
●
●
●
●
●
●
●
●
●
●
●
●
●
●
Miscellaneous terms
●
●
are derived from long dead biological material
●
Natural gas volumes are converted to barrels on the basis of energy content
●
pressure – also called natural gasoline or naphtha
●
312 Equinor, Annual Report on Form 20-F 2021
●
natural gas fields
●
●
that correspond to Equinor's percentage ownership in a particular field. Entitlement volumes, on the other hand, represent Equinor's
share of the volumes distributed to the partners in the field, which are subject to deductions for, among other things, royalties and the
host government's share of profit oil. Under the terms of a PSA, the amount of profit oil deducted from equity volumes will normally
increase with the cumulative return on investment to the partners and/or production from the licence. The distinction between equity and
entitlement is relevant to most PSA regimes, whereas it is not applicable in most concessionary regimes such as those in Norway, the
UK, Canada and Brazil. The overview of equity production provides additional information for readers, as certain costs described in the
profit and loss analysis were directly associated with equity volumes produced during the reported years
●
gravity below 22.3° API. In addition to high viscosity and high specific gravity, heavy oils typically have low hydrogen-to-carbon ratios,
high asphaltene, sulphur, nitrogen, and heavy-metal content, as well as higher acid numbers
●
entails strict prioritisation and sequencing of drilling targets
●
●
expected value at a certain reference point in time. IOR comprises both of conventional and emerging technologies
●
●
under atmospheric pressures
●
LPG is shipped in special vessels
●
●
●
containing some ethane and smaller quantities of heavier hydrocarbons (also called sales gas) and 2) wet gas, primarily ethane, propane
and butane as well as smaller amounts of heavier hydrocarbons; partially liquid under atmospheric pressure
●
temperature
●
●
transportation and refining; and 5) marketing and distribution
●
●
TotalEnergies and Ørsted.
●
hydrogen (H) and carbon (C). The proportion of different compounds, from methane and ethane up to the heaviest components, in a
petroleum find varies from discovery to discovery. If a reservoir primarily contains light hydrocarbons, it is described as a gas field. If
heavier hydrocarbons predominate, it is described as an oil field. An oil field may feature free gas above the oil and contain a quantity of
light hydrocarbons, also called associated gas
●
existing economic and political conditions and using existing technology. They are the only type the US Securities and Exchange
Commission allows oil companies to report
●
differ from the actual margin, due to variations in type of crude and other feedstock, throughput, product yields, freight cost, inventory etc
●
operating divided by the number of days in the period
●
●
●
operating wells which bring the liquids and or natural gas to the surface
●
significantly vaporise and enter the earth's atmosphere (e.g. gasses formed under loading and offloading of crude oil)
Equinor, Annual Report on Form 20-F 2021 313
5.8 Forward-looking statements
This Annual Report on Form 20-F contains certain forward-looking statements that involve risks and uncertainties, in particular in the
sections "Business overview" and "Strategy and market overview". In some cases, we use words such as "aim", "ambition",
"anticipate", "believe", "continue", "could", "estimate", "expect", "intend", "likely", "objective", "outlook", "may", "plan", "schedule",
"seek", "should", "strategy", "target", "will", "goal" and similar expressions to identify forward-looking statements. All statements other
than statements of historical fact, including; the commitment to develop as a broad energy company; the ambition to reduce net
group-wide greenhouse gas emissions by 50% by 2030 and to be a net-zero energy company by 2050; our aim to decarbonise oil and
gas, industrialise offshore wind and hydrogen, and provide commercial carbon capture and storage; our ambition to develop low
carbon solutions and value chains and attain a leadership position in the European CCS market with a market share above 25%; our
expectations with respect to net carbon intensity, carbon efficiency, methane emissions and flaring reductions, renewable energy
capacity and carbon-neutral global operations; our internal carbon price for investment decisions; future levels of, and expected value
creation from, oil and gas production, scale and composition of the oil and gas portfolio, development of CCUS and hydrogen
businesses and use of offset mechanisms; production cuts, including their impact on the level and timing of our production; plans to
develop fields; market outlook and future economic projections and assumptions, including commodity price assumptions; organic
capital expenditures through 2022; our intention to optimise and mature our portfolio; future worldwide economic trends and market
conditions; business strategy and competitive position; sales, trading and market strategies; research and development initiatives and
strategy; expectations related to production levels, unit production cost, investment, exploration activities, discoveries and
development in connection with our transactions and projects in Angola, Argentina, Azerbaijan, Brazil, Canada, the Gulf of Mexico, the
NCS, the North Sea, Russia, Tanzania, the United Kingdom and the United States; our intention to exit our Russian joint ventures;
with respect to the Covid-19 pandemic and its impacts, consequences and risks; our response to the Covid-19 pandemic, including
measures to protect people, operations and value creation, operating costs and assumptions; future credit ratings; employee training
and KPIs; plans to redesign the CHP; completion and results of acquisitions, disposals and other contractual arrangements and
delivery commitments; recovery factors and levels; future margins; future levels or development of capacity, reserves or resources;
planned turnarounds and other maintenance activity; plans for renewables production capacity and the balance between oil and
renewables production; oil and gas volume growth, including for volumes lifted and sold to equal entitlement production; estimates
related to production and development, forecasts, reporting levels and dates; operational expectations, estimates, schedules and
costs; expectations relating to licences and leases; oil, gas, alternative fuel and energy prices, volatility, supply and demand
;
processes related to human rights laws; corporate structure and organizational policies; technological innovation, implementation,
position and expectations; expectations regarding board composition, remuneration; our goal of safe and efficient operations;
effectiveness of our internal policies and plans; our ability to manage our risk exposure; our liquidity levels and management of
liquidity reserves; estimated or future liabilities, obligations or expenses; expected impact of currency and interest rate fluctuations and
LIBOR discontinuation; projected outcome, impact or timing of HSE regulations; HSE goals and objectives of management for future
operations; expectations related to regulatory trends; impact of PSA effects; projected impact or timing of administrative or
governmental rules, standards, decisions, standards or laws (including taxation laws); projected impact of legal claims against us;
plans for capital distribution, share buy-backs and amounts and timing of dividends are forward-looking statements.
You should not place undue reliance on these forward-looking statements.
Our actual results could differ materially from those anticipated in the forward-looking statements for many reasons, including the risks
described above in "Risk review", and in "Operational review", and elsewhere in this Annual Report on Form 20-F.
These forward-looking statements reflect current views about future events and are, by their nature, subject to significant risks and
uncertainties because they relate to events and depend on circumstances that will occur in the future. There are a number of factors
that could cause actual results and developments to differ materially from those expressed or implied by these forward-looking
statements, including levels of industry product supply, demand and pricing, in particular in light of recent significant oil price volatility
triggered, among other things, by the changing dynamic among OPEC+ members the pressure on US shale oil companies from their
shareholders to use their higher cashflow to pay debt and dividends rather than increase drilling and production and the uncertainty
regarding demand created by the Covid-19 pandemic; Russia’s invasion of Ukraine and our subsequent decision to stop new
investments into Russia; levels and calculations of reserves and material differences from reserves estimates; natural disasters,
adverse weather conditions, climate change, and other changes to business conditions; regulatory stability and access to attractive
renewable opportunities; unsuccessful drilling; operational problems, in particular in light of quarantine rules, travel restrictions,
manpower shortage, supply chain disruptions and social distancing requirements triggered by the Covid-19 pandemic; health, safety
and environmental risks; impact of the Covid-19 pandemic; the effects of climate change; regulations on hydraulic fracturing; security
breaches, including breaches of our digital infrastructure (cybersecurity); ineffectiveness of crisis management systems; the actions of
competitors; the development and use of new technology, particularly in the renewable energy sector; inability to meet strategic
objectives; the difficulties involving transportation infrastructure; political and social stability and economic growth in relevant areas of
the world; reputational damage; exercise of ownership by the Norwegian state; an inability to attract and retain personnel; risks related
to implementing a new corporate structure; inadequate insurance coverage; changes or uncertainty in or non-compliance with laws
and governmental regulations; the actions of the Norwegian state as majority shareholder; failure to meet our ethical and social
standards; the political and economic policies of Norway and other oil-producing countries; non-compliance with international trade
sanctions; the actions of field partners; adverse changes in tax regimes; exchange rate and interest rate fluctuations; factors relating
to trading, supply and financial risk; general economic conditions; and other factors discussed elsewhere in this report.
314 Equinor, Annual Report on Form 20-F 2021
We use certain terms in this document, such as “resource” and “resources” that the SEC’s rules prohibit us from including in our filings
with the SEC. U.S. investors are urged to closely consider the disclosures in our Form 20-F, SEC File No. 1-15200. This form is
available on our website or by calling 1-800-SEC-0330 or logging on to
www.sec.gov
.
Although we believe that the expectations reflected in the forward-looking statements are reasonable, we cannot assure you that our
future results, level of activity, performance or achievements will meet these expectations. Moreover, neither we nor any other person
assumes responsibility for the accuracy and completeness of the forward-looking statements. Unless we are required by law to update
these statements, we will not necessarily update any of these statements after the date of this Annual Report, either to make them
conform to actual results or changes in our expectations.
Equinor, Annual Report on Form 20-F 2021 315
5.9 Signature page
The registrant hereby certifies that it meets all of the requirements for filing on Form 20-F and that it has duly caused and authorised
the undersigned to sign this annual report on its behalf.
EQUINOR ASA
(Registrant)
By: /s/ ULRICA FEARN
Name: Ulrica Fearn
Title: Executive Vice President and Chief Financial Officer
Dated: 18 March 2022
316 Equinor, Annual Report on Form 20-F 2021
5.10 Exhibits
The following exhibits are filed as part of this annual report:
Exhibit no
Description
Exhibit 1
Exhibit 2.1
Exhibit 2.2
Exhibit 2.3
Exhibit 2.4
Exhibit 2.5
Exhibit 2.6
Exhibit 2.7
Exhibit 4(a)(i)
Exhibit 4(a)(ii)
Exhibit 4(c)
Exhibit 8
Subsidiaries (see Significant subsidiaries included in section 2.9 Corporate in this annual
report).
Exhibit 11
Exhibit 12.1
Exhibit 12.2
Exhibit 13.1
)
Exhibit 13.2
)
Exhibit 15(a)(i)
Exhibit 15(a)(ii)
Exhibit 15(a)(iii)
Exhibit 17
Exhibit 101
Interactive Data Files (formatted in Inline XBRL (Extensible Business Reporting Language)).
Submitted electronically with the Annual report on Form 20-F.
Exhibit 104
Cover Page Interactive Data File (formatted as Inline XBRL and contained in Exhibit 101).
1)
Furnished only.
Equinor, Annual Report on Form 20-F 2021 317
The total amount of long term debt securities of Equinor ASA and its subsidiaries authorised under instruments other
than those listed above does not exceed 10% of the total assets of Equinor ASA and its subsidiaries on a consolidated
basis. The company agrees to furnish copies of any such instruments to the Commission upon request.
318 Equinor, Annual Report on Form 20-F 2021
5.11 Cross reference to Form 20-F
Sections
Item 1.
Identity of Directors, Senior Management and Advisers
N/A
Item 2.
Offer Statistics and Expected Timetable
N/A
Item 3.
Key Information
A. [Reserved]
N/A
B. Capitalisation and Indebtedness
N/A
C. Reasons for the Offer and Use of Proceeds
N/A
D. Risk Factors
2.13 (Risk review—Risk factors)
Item 4.
Information on the Company
A. History and Development of the Company
2021 Highlights; About the Report; 2.1 (Strategy and market
overview); 2.2 (Business overview); 2.3 (Exploration &
Production Norway (E&P Norway)); 2.4 (Exploration &
Production International (E&P International)); 2.5 (Exploration
& Production USA (E&P USA)); 2.6 (Marketing, Midstream &
Processing (MMP)); 2.7 (Renewables (REN)); 2.8 (Other
group); 2.12 (Liquidity and Capital Resources—Investments);
3.1 (Implementation and Reporting); note 4 (Acquisitions and
disposals) to 4.1 (Consolidated financial statements of the
Equinor Group)
B. Business Overview
2.1 (Strategy and market overview); 2.2 (Business overview);
2.3 (Exploration & Production Norway (E&P Norway)); 2.4
(Exploration & Production International (E&P International));
2.5 (Exploration & Production USA (E&P USA)); 2.6
(Marketing, Midstream & Processing (MMP)); 2.7 (Renewables
(REN)); 2.8 (Other group); 2.9 (Corporate)
C. Organisational Structure
2.2 (Business overview—Corporate structure—Segment
reporting); 2.9 (Corporate—Subsidiaries and properties)
D. Property, Plants and Equipment
2.3 (Exploration & Production Norway (E&P Norway)); 2.4
(Exploration & Production International (E&P International));
2.5 (Exploration & Production USA (E&P USA)); 2.6
(Marketing, Midstream & Processing (MMP)); 2.7 (Renewables
(REN)); 2.8 (Other group); 2.9 (Corporate—Subsidiaries and
properties); 2.12 (Liquidity and capital resources—
Investments); notes 11 (Property, plant and equipment) and 23
(Leases) to 4.1 (Consolidated financial statements of the
Equinor Group)
Oil and Gas Disclosures
2.10 (Operational performance)
Item 4A.
Unresolved Staff Comments
None
Item 5.
Operating and Financial Review and Prospects
The discussion does not address certain items in respect of
2019. A discussion of such items may be found in the Annual
Report on Form 20-F for the year ended December 31, 2020,
filed with the SEC on March 19, 2021
A. Operating Results
2.9 (Corporate—Applicable laws and regulations); 2.11
(Financial review); 2.13 (Risk review—Liquidity, market and
financial risks—Foreign exchange, —Financial risk)
B. Liquidity and Capital Resources
2.12 (Liquidity and capital resources); 2.13 (Risk review—
Market, financial and liquidity risks); notes 2 (Significant
accounting policies—Derivative financial instruments), 6
(Financial risk and capital management), 16 (Trades and other
receivables), 17 (Cash and cash equivalents), 19 (Finance
debt) and 24 (Other commitments, contingent liabilities and
contingent assets) to 4.1 (Consolidated financial statements of
the Equinor Group)
C. Research and development, Patents and Licences, etc.
2.2 (Business overview—Research and development); note 8
(Other expenses) to 4.1 (Consolidated financial statements of
the Equinor Group)
D. Trend Information
passim
E. Critical Accounting Estimates
4.1 (Consolidated financial statements of the Equinor Group)
Item 6.
Directors, Senior Management and Employees
A. Directors and Senior Management
3.5 (Board of directors); 3.6 (Management)
Equinor, Annual Report on Form 20-F 2021 319
B. Compensation
3.7 (Compensation to governing bodies); notes 7
(Remuneration) and 20 (Pensions) to 4.1 (Consolidated
financial statements of the Equinor Group)
C. Board Practices
3.4 (Corporate Assembly); 3.5 (Board of directors); 3.6
(Management)
D. Employees
2.15 (Our people)
E. Share Ownership
3.8 (Share ownership); note 7 (Remuneration) to 4.1
(consolidated financial statements of the Equinor Group); 5.1
(Shareholder information—Shares purchased by the issuer—
Equinor’s share savings plan)
Item 7.
Major Shareholders and Related Party Transactions
A. Major Shareholders
5.1 (Shareholder information—Major shareholders)
B. Related Party Transactions
2.9 (Corporate—Related party transactions); note 25 (Related
parties) to 4.1 (Consolidated financial statements of the
Equinor Group)
C. Interests of Experts and Counsel
N/A
Item 8.
Financial Information
A. Consolidated Statements and Other Financial Information
4.1 (Consolidated financial statements of the Equinor Group);
5.1 (Shareholder information); 5.3 (Legal proceedings)
B. Significant Changes
Note 27 (Subsequent events) to 4.1 (Consolidated financial
statements of the Equinor Group)
Financial Information for Subsidiary Guarantors
2.12 (Liquidity and Capital Resources—Summarized financial
information related to guaranteed debt securities)
Item 9.
The Offer and Listing
A. Offer and Listing Details
5.1 (Shareholder information)
B. Plan of Distribution
N/A
C. Markets
5.1 (Shareholder Information)
D. Selling Shareholders
N/A
E. Dilution
N/A
F. Expenses of the Issue
N/A
Item 10.
Additional Information
A. Share Capital
N/A
B. Memorandum and Articles of Association
2.13 (Risk review—Risks related to state ownership); 3.1
(Introduction—Articles of association); 3.2 (General meeting of
shareholders); 5.1 (Shareholder information); note 18
(Shareholders’ Equity and dividends) to 4.1 (Consolidated
financial statements of the Equinor Group)
C. Material Contracts
2.6 (Marketing, Midstream & Processing (MMP)—Pipelines);
note 25 (Related parties) to 4.1 (Consolidated financial
statements of the Equinor Group)
D. Exchange Controls
5.1 (Shareholder information—Exchange controls and
limitations)
E. Taxation
5.1 (Shareholder information—Taxation)
F. Dividends and Paying Agents
N/A
G. Statements by Experts
N/A
H. Documents On Display
About the Report
I. Subsidiary Information
N/A
Item 11.
Quantitative and Qualitative Disclosures About Market Risk
2.13 (Risk review); notes 6 (Financial risk and capital
management) and 26 (Financial instruments: fair value
measurement and sensitivity analysis of market risk) to 4.1
(Consolidated financial statements of the Equinor Group)
Item 12.
Description of Securities Other than Equity Securities
A. Debt Securities
N/A
B. Warrants and Rights
N/A
C. Other Securities
N/A
D. American Depositary Shares
Exhibit 2.1 (Description of securities registered under Section
12 of the Exchange Act); 5.1 (Shareholder information—
Equinor ADR programme fees)
Item 13.
Defaults, Dividend Arrearages and Delinquencies
None
320 Equinor, Annual Report on Form 20-F 2021
Item 14.
Material Modifications to the Rights of Security Holders and
Use of
None
Proceeds
Item 15.
Controls and Procedures
3.10 (Risk management and internal controls)
Item 16A.
Audit Committee Financial Expert
3.5 (Board of directors—Audit Committee)
Item 16B.
Code of Ethics
3.1 (Introduction—Code of Conduct)
Item 16C.
Principal Accountant Fees and Services
3.9 (External auditor)
Item 16D.
Exemptions from the Listing Standards for Audit Committees
3.1 (Introduction—Compliance with NYSE listing rules)
Item 16E.
Purchases of Equity Securities by the Issuer and Affiliated
Purchases
5.1 (Shareholder Information—Shares purchased by issuer)
Item 16F.
Changes in Registrant’s Certifying Accountant
N/A
Item 16G.
Corporate Governance
3.1 (Introduction—Compliance with NYSE listing rules)
Item 16H
Mine Safety Disclosure
N/A
Item 17.
Financial Statements
N/A
Item 18.
Financial Statements
4.1 (Consolidated financial statements of the Equinor Group)