00011386392023FYfalsehttp://fasb.org/us-gaap/2023#AccountingStandardsUpdate201613MemberP1YP2YP1YP1Yhttp://fasb.org/us-gaap/2023#AccountsPayableAndOtherAccruedLiabilitiesCurrenthttp://fasb.org/us-gaap/2023#AccountsPayableAndOtherAccruedLiabilitiesCurrenthttp://fasb.org/us-gaap/2023#PropertyPlantAndEquipmentAndFinanceLeaseRightOfUseAssetAfterAccumulatedDepreciationAndAmortizationhttp://fasb.org/us-gaap/2023#PropertyPlantAndEquipmentAndFinanceLeaseRightOfUseAssetAfterAccumulatedDepreciationAndAmortizationP3Y111110.13059950.10128120.1471183P1YP2Yhttp://fasb.org/us-gaap/2023#OperatingExpenseshttp://fasb.org/us-gaap/2023#OperatingExpenseshttp://fasb.org/us-gaap/2023#OperatingExpensesiso4217:USDxbrli:sharesiso4217:USDxbrli:sharesxbrli:pureutr:Dinfn:installmentinfn:segment00011386392023-01-012023-12-3000011386392023-07-0100011386392024-05-1000011386392023-12-3000011386392022-12-310001138639us-gaap:ProductMember2023-01-012023-12-300001138639us-gaap:ProductMember2021-12-262022-12-310001138639us-gaap:ProductMember2020-12-272021-12-250001138639us-gaap:ServiceMember2023-01-012023-12-300001138639us-gaap:ServiceMember2021-12-262022-12-310001138639us-gaap:ServiceMember2020-12-272021-12-2500011386392021-12-262022-12-3100011386392020-12-272021-12-250001138639us-gaap:CommonStockMember2020-12-260001138639us-gaap:AdditionalPaidInCapitalMember2020-12-260001138639us-gaap:AccumulatedOtherComprehensiveIncomeMember2020-12-260001138639us-gaap:RetainedEarningsMember2020-12-2600011386392020-12-260001138639us-gaap:CommonStockMember2020-12-272021-12-250001138639us-gaap:AdditionalPaidInCapitalMember2020-12-272021-12-250001138639us-gaap:AccumulatedOtherComprehensiveIncomeMember2020-12-272021-12-250001138639us-gaap:RetainedEarningsMember2020-12-272021-12-250001138639us-gaap:CommonStockMember2021-12-250001138639us-gaap:AdditionalPaidInCapitalMember2021-12-250001138639us-gaap:AccumulatedOtherComprehensiveIncomeMember2021-12-250001138639us-gaap:RetainedEarningsMember2021-12-2500011386392021-12-250001138639us-gaap:CommonStockMember2021-12-262022-12-310001138639us-gaap:AdditionalPaidInCapitalMember2021-12-262022-12-310001138639us-gaap:AdditionalPaidInCapitalMembersrt:CumulativeEffectPeriodOfAdoptionAdjustmentMember2021-12-250001138639us-gaap:RetainedEarningsMembersrt:CumulativeEffectPeriodOfAdoptionAdjustmentMember2021-12-250001138639srt:CumulativeEffectPeriodOfAdoptionAdjustmentMember2021-12-250001138639us-gaap:AccumulatedOtherComprehensiveIncomeMember2021-12-262022-12-310001138639us-gaap:RetainedEarningsMember2021-12-262022-12-310001138639us-gaap:CommonStockMember2022-12-310001138639us-gaap:AdditionalPaidInCapitalMember2022-12-310001138639us-gaap:AccumulatedOtherComprehensiveIncomeMember2022-12-310001138639us-gaap:RetainedEarningsMember2022-12-310001138639us-gaap:CommonStockMember2023-01-012023-12-300001138639us-gaap:AdditionalPaidInCapitalMember2023-01-012023-12-300001138639us-gaap:AccumulatedOtherComprehensiveIncomeMember2023-01-012023-12-300001138639us-gaap:RetainedEarningsMember2023-01-012023-12-300001138639us-gaap:CommonStockMember2023-12-300001138639us-gaap:AdditionalPaidInCapitalMember2023-12-300001138639us-gaap:AccumulatedOtherComprehensiveIncomeMember2023-12-300001138639us-gaap:RetainedEarningsMember2023-12-300001138639us-gaap:AccountingStandardsUpdate202006Membersrt:CumulativeEffectPeriodOfAdoptionAdjustmentMember2021-12-260001138639infn:A375ConvertibleSeniorNotesDue2028Member2023-01-012023-12-300001138639infn:A375ConvertibleSeniorNotesDue2028Member2021-12-262022-12-310001138639infn:A375ConvertibleSeniorNotesDue2028Member2020-12-272021-12-250001138639srt:MinimumMember2023-01-012023-12-300001138639srt:MaximumMember2023-01-012023-12-300001138639infn:NewHireEmployeeMembersrt:MinimumMemberus-gaap:RestrictedStockUnitsRSUMember2023-01-012023-12-300001138639srt:MaximumMemberinfn:NewHireEmployeeMemberus-gaap:RestrictedStockUnitsRSUMember2023-01-012023-12-300001138639us-gaap:PerformanceSharesMembersrt:MinimumMember2023-01-012023-12-300001138639srt:MaximumMemberus-gaap:PerformanceSharesMember2023-01-012023-12-300001138639infn:CustomerOneMemberus-gaap:CustomerConcentrationRiskMemberus-gaap:AccountsReceivableMember2021-12-262022-12-310001138639infn:CustomerOneMemberus-gaap:CustomerConcentrationRiskMemberus-gaap:RevenueFromContractWithCustomerMember2023-01-012023-12-300001138639infn:CustomerOneMemberus-gaap:CustomerConcentrationRiskMemberus-gaap:RevenueFromContractWithCustomerMember2021-12-262022-12-310001138639srt:MaximumMemberus-gaap:BuildingMember2023-12-300001138639srt:MinimumMemberinfn:ManufacturingEquipmentMember2023-12-300001138639srt:MaximumMemberinfn:ManufacturingEquipmentMember2023-12-300001138639srt:MinimumMemberus-gaap:FurnitureAndFixturesMember2023-12-300001138639srt:MaximumMemberus-gaap:FurnitureAndFixturesMember2023-12-300001138639srt:MinimumMemberinfn:ComputerHardwareMember2023-12-300001138639srt:MaximumMemberinfn:ComputerHardwareMember2023-12-300001138639us-gaap:SoftwareAndSoftwareDevelopmentCostsMember2023-12-300001138639infn:LeaseholdAndBuildingImprovementsMembersrt:MinimumMember2023-12-300001138639srt:MaximumMemberinfn:LeaseholdAndBuildingImprovementsMember2023-12-300001138639srt:MinimumMember2023-12-300001138639srt:MaximumMember2023-12-300001138639country:US2023-01-012023-12-300001138639country:US2021-12-262022-12-310001138639country:US2020-12-272021-12-250001138639infn:AmericasExcludingUnitedStatesMember2023-01-012023-12-300001138639infn:AmericasExcludingUnitedStatesMember2021-12-262022-12-310001138639infn:AmericasExcludingUnitedStatesMember2020-12-272021-12-250001138639us-gaap:EMEAMember2023-01-012023-12-300001138639us-gaap:EMEAMember2021-12-262022-12-310001138639us-gaap:EMEAMember2020-12-272021-12-250001138639srt:AsiaPacificMember2023-01-012023-12-300001138639srt:AsiaPacificMember2021-12-262022-12-310001138639srt:AsiaPacificMember2020-12-272021-12-250001138639infn:DirectRevenueMember2023-01-012023-12-300001138639infn:DirectRevenueMember2021-12-262022-12-310001138639infn:DirectRevenueMember2020-12-272021-12-250001138639infn:IndirectRevenueMember2023-01-012023-12-300001138639infn:IndirectRevenueMember2021-12-262022-12-310001138639infn:IndirectRevenueMember2020-12-272021-12-2500011386392023-12-312023-12-3000011386392025-01-012023-12-3000011386392026-01-012023-12-3000011386392027-01-012023-12-3000011386392028-01-012023-12-3000011386392029-01-012023-12-300001138639us-gaap:FairValueMeasurementsRecurringMemberus-gaap:ConvertibleDebtMemberus-gaap:FairValueInputsLevel1Member2023-12-300001138639us-gaap:FairValueMeasurementsRecurringMemberus-gaap:ConvertibleDebtMemberus-gaap:FairValueInputsLevel2Member2023-12-300001138639us-gaap:FairValueMeasurementsRecurringMemberus-gaap:ConvertibleDebtMember2023-12-300001138639us-gaap:FairValueMeasurementsRecurringMemberus-gaap:ConvertibleDebtMemberus-gaap:FairValueInputsLevel1Member2022-12-310001138639us-gaap:FairValueMeasurementsRecurringMemberus-gaap:ConvertibleDebtMemberus-gaap:FairValueInputsLevel2Member2022-12-310001138639us-gaap:FairValueMeasurementsRecurringMemberus-gaap:ConvertibleDebtMember2022-12-310001138639us-gaap:MoneyMarketFundsMemberus-gaap:FairValueMeasurementsRecurringMemberus-gaap:FairValueInputsLevel1Member2023-12-300001138639us-gaap:MoneyMarketFundsMemberus-gaap:FairValueMeasurementsRecurringMemberus-gaap:FairValueInputsLevel2Member2023-12-300001138639us-gaap:FairValueMeasurementsRecurringMemberus-gaap:MoneyMarketFundsMember2023-12-300001138639us-gaap:MoneyMarketFundsMemberus-gaap:FairValueMeasurementsRecurringMemberus-gaap:FairValueInputsLevel1Member2022-12-310001138639us-gaap:MoneyMarketFundsMemberus-gaap:FairValueMeasurementsRecurringMemberus-gaap:FairValueInputsLevel2Member2022-12-310001138639us-gaap:FairValueMeasurementsRecurringMemberus-gaap:MoneyMarketFundsMember2022-12-310001138639infn:ForeignSubsidiaryMember2023-12-300001138639infn:ForeignSubsidiaryMember2022-12-310001138639us-gaap:CustomerRelationshipsMember2023-12-300001138639us-gaap:CustomerRelationshipsMember2022-12-310001138639us-gaap:DevelopedTechnologyRightsMember2022-12-310001138639us-gaap:TradeAccountsReceivableMember2023-01-012023-12-300001138639us-gaap:TradeAccountsReceivableMember2021-12-262022-12-310001138639us-gaap:TradeAccountsReceivableMember2020-12-272021-12-250001138639us-gaap:ComputerEquipmentMember2023-12-300001138639us-gaap:ComputerEquipmentMember2022-12-310001138639us-gaap:ComputerSoftwareIntangibleAssetMember2023-12-300001138639us-gaap:ComputerSoftwareIntangibleAssetMember2022-12-310001138639infn:LaboratoryAndManufacturingEquipmentMember2023-12-300001138639infn:LaboratoryAndManufacturingEquipmentMember2022-12-310001138639us-gaap:LandAndBuildingMember2023-12-300001138639us-gaap:LandAndBuildingMember2022-12-310001138639us-gaap:FurnitureAndFixturesMember2023-12-300001138639us-gaap:FurnitureAndFixturesMember2022-12-310001138639infn:LeaseholdAndBuildingImprovementsMember2023-12-300001138639infn:LeaseholdAndBuildingImprovementsMember2022-12-310001138639us-gaap:ConstructionInProgressMember2023-12-300001138639us-gaap:ConstructionInProgressMember2022-12-310001138639infn:EnterpriseResourcePlanningSystemsMember2023-12-300001138639infn:EnterpriseResourcePlanningSystemsMember2022-12-310001138639us-gaap:LicenseMemberinfn:EnterpriseResourcePlanningSystemsMember2023-12-300001138639us-gaap:LicenseMemberinfn:EnterpriseResourcePlanningSystemsMember2022-12-310001138639infn:EnterpriseResourcePlanningSystemsMember2023-01-012023-12-300001138639infn:EnterpriseResourcePlanningSystemsMember2021-12-262022-12-310001138639infn:EnterpriseResourcePlanningSystemsMember2020-12-272021-12-250001138639us-gaap:LicenseAgreementTermsMember2023-01-012023-12-300001138639us-gaap:LicenseAgreementTermsMember2021-12-262022-12-310001138639us-gaap:LicenseAgreementTermsMember2020-12-272021-12-250001138639infn:A2023RestructuringPlanMember2023-01-012023-12-300001138639us-gaap:CostOfSalesMemberus-gaap:EmployeeSeveranceMember2023-01-012023-12-300001138639us-gaap:OperatingExpenseMemberus-gaap:EmployeeSeveranceMember2023-01-012023-12-300001138639us-gaap:CostOfSalesMemberus-gaap:EmployeeSeveranceMember2021-12-262022-12-310001138639us-gaap:OperatingExpenseMemberus-gaap:EmployeeSeveranceMember2021-12-262022-12-310001138639us-gaap:CostOfSalesMemberus-gaap:EmployeeSeveranceMember2020-12-272021-12-250001138639us-gaap:OperatingExpenseMemberus-gaap:EmployeeSeveranceMember2020-12-272021-12-250001138639infn:LeaseRelatedImpairmentChargesMemberus-gaap:CostOfSalesMember2023-01-012023-12-300001138639us-gaap:OperatingExpenseMemberinfn:LeaseRelatedImpairmentChargesMember2023-01-012023-12-300001138639infn:LeaseRelatedImpairmentChargesMemberus-gaap:CostOfSalesMember2021-12-262022-12-310001138639us-gaap:OperatingExpenseMemberinfn:LeaseRelatedImpairmentChargesMember2021-12-262022-12-310001138639infn:LeaseRelatedImpairmentChargesMemberus-gaap:CostOfSalesMember2020-12-272021-12-250001138639us-gaap:OperatingExpenseMemberinfn:LeaseRelatedImpairmentChargesMember2020-12-272021-12-250001138639infn:AssetImpairmentAndOtherImpairmentChargesMemberus-gaap:CostOfSalesMember2023-01-012023-12-300001138639us-gaap:OperatingExpenseMemberinfn:AssetImpairmentAndOtherImpairmentChargesMember2023-01-012023-12-300001138639infn:AssetImpairmentAndOtherImpairmentChargesMemberus-gaap:CostOfSalesMember2021-12-262022-12-310001138639us-gaap:OperatingExpenseMemberinfn:AssetImpairmentAndOtherImpairmentChargesMember2021-12-262022-12-310001138639infn:AssetImpairmentAndOtherImpairmentChargesMemberus-gaap:CostOfSalesMember2020-12-272021-12-250001138639us-gaap:OperatingExpenseMemberinfn:AssetImpairmentAndOtherImpairmentChargesMember2020-12-272021-12-250001138639us-gaap:CostOfSalesMember2023-01-012023-12-300001138639us-gaap:OperatingExpenseMember2023-01-012023-12-300001138639us-gaap:CostOfSalesMember2021-12-262022-12-310001138639us-gaap:OperatingExpenseMember2021-12-262022-12-310001138639us-gaap:CostOfSalesMember2020-12-272021-12-250001138639us-gaap:OperatingExpenseMember2020-12-272021-12-250001138639us-gaap:EmployeeSeveranceMember2021-12-250001138639infn:LeaseRelatedImpairmentChargesMember2021-12-250001138639infn:AssetImpairmentAndOtherImpairmentChargesMember2021-12-250001138639us-gaap:EmployeeSeveranceMember2021-12-262022-12-310001138639infn:LeaseRelatedImpairmentChargesMember2021-12-262022-12-310001138639infn:AssetImpairmentAndOtherImpairmentChargesMember2021-12-262022-12-310001138639us-gaap:EmployeeSeveranceMember2022-12-310001138639infn:LeaseRelatedImpairmentChargesMember2022-12-310001138639infn:AssetImpairmentAndOtherImpairmentChargesMember2022-12-310001138639us-gaap:EmployeeSeveranceMember2023-01-012023-12-300001138639infn:LeaseRelatedImpairmentChargesMember2023-01-012023-12-300001138639infn:AssetImpairmentAndOtherImpairmentChargesMember2023-01-012023-12-300001138639us-gaap:EmployeeSeveranceMember2023-12-300001138639infn:LeaseRelatedImpairmentChargesMember2023-12-300001138639infn:AssetImpairmentAndOtherImpairmentChargesMember2023-12-300001138639us-gaap:AccumulatedTranslationAdjustmentMember2020-12-260001138639us-gaap:AccumulatedDefinedBenefitPlansAdjustmentNetUnamortizedGainLossMember2020-12-260001138639infn:AccumulatedIncomeTaxAdjustmentAttributabletoParentMember2020-12-260001138639us-gaap:AccumulatedTranslationAdjustmentMember2020-12-272021-12-250001138639us-gaap:AccumulatedDefinedBenefitPlansAdjustmentNetUnamortizedGainLossMember2020-12-272021-12-250001138639infn:AccumulatedIncomeTaxAdjustmentAttributabletoParentMember2020-12-272021-12-250001138639us-gaap:AccumulatedTranslationAdjustmentMember2021-12-250001138639us-gaap:AccumulatedDefinedBenefitPlansAdjustmentNetUnamortizedGainLossMember2021-12-250001138639infn:AccumulatedIncomeTaxAdjustmentAttributabletoParentMember2021-12-250001138639us-gaap:AccumulatedTranslationAdjustmentMember2021-12-262022-12-310001138639us-gaap:AccumulatedDefinedBenefitPlansAdjustmentNetUnamortizedGainLossMember2021-12-262022-12-310001138639infn:AccumulatedIncomeTaxAdjustmentAttributabletoParentMember2021-12-262022-12-310001138639us-gaap:AccumulatedTranslationAdjustmentMember2022-12-310001138639us-gaap:AccumulatedDefinedBenefitPlansAdjustmentNetUnamortizedGainLossMember2022-12-310001138639infn:AccumulatedIncomeTaxAdjustmentAttributabletoParentMember2022-12-310001138639us-gaap:AccumulatedTranslationAdjustmentMember2023-01-012023-12-300001138639us-gaap:AccumulatedDefinedBenefitPlansAdjustmentNetUnamortizedGainLossMember2023-01-012023-12-300001138639infn:AccumulatedIncomeTaxAdjustmentAttributabletoParentMember2023-01-012023-12-300001138639us-gaap:AccumulatedTranslationAdjustmentMember2023-12-300001138639us-gaap:AccumulatedDefinedBenefitPlansAdjustmentNetUnamortizedGainLossMember2023-12-300001138639infn:AccumulatedIncomeTaxAdjustmentAttributabletoParentMember2023-12-300001138639us-gaap:ConvertibleNotesPayableMember2023-01-012023-12-300001138639us-gaap:ConvertibleNotesPayableMember2021-12-262022-12-310001138639us-gaap:ConvertibleNotesPayableMember2020-12-272021-12-250001138639us-gaap:RestrictedStockMember2023-01-012023-12-300001138639us-gaap:RestrictedStockMember2021-12-262022-12-310001138639us-gaap:RestrictedStockMember2020-12-272021-12-250001138639us-gaap:PerformanceSharesMember2023-01-012023-12-300001138639us-gaap:PerformanceSharesMember2021-12-262022-12-310001138639us-gaap:PerformanceSharesMember2020-12-272021-12-250001138639us-gaap:EmployeeStockMember2023-01-012023-12-300001138639us-gaap:EmployeeStockMember2021-12-262022-12-310001138639us-gaap:EmployeeStockMember2020-12-272021-12-250001138639us-gaap:SeniorNotesMemberinfn:ConvertibleSeniorNotes2.5DueMarch12027Member2021-12-250001138639us-gaap:ConvertibleDebtMemberinfn:A2.125ConvertibleSeniorNotesDueSeptember12024Member2023-12-300001138639us-gaap:ConvertibleDebtMemberinfn:ConvertibleSeniorNotes2.5DueMarch12027Member2023-12-300001138639us-gaap:ConvertibleDebtMemberinfn:A375ConvertibleSeniorNotesDue2028Member2023-12-300001138639us-gaap:MortgagesMember2023-12-300001138639us-gaap:ConvertibleDebtMemberinfn:A2.125ConvertibleSeniorNotesDueSeptember12024Member2022-12-310001138639us-gaap:ConvertibleDebtMemberinfn:ConvertibleSeniorNotes2.5DueMarch12027Member2022-12-310001138639us-gaap:ConvertibleDebtMemberinfn:A375ConvertibleSeniorNotesDue2028Member2022-12-310001138639us-gaap:MortgagesMember2022-12-310001138639us-gaap:SeniorNotesMemberinfn:A2.125ConvertibleSeniorNotesDueSeptember12024Member2018-09-300001138639us-gaap:SeniorNotesMemberinfn:ConvertibleSeniorNotes2.5DueMarch12027Member2020-03-310001138639infn:A375ConvertibleSeniorNotesDue2028Memberus-gaap:SeniorNotesMember2022-08-310001138639infn:A375ConvertibleSeniorNotesDue2028Memberus-gaap:SeniorNotesMember2023-06-300001138639us-gaap:SeniorNotesMemberinfn:A2.125ConvertibleSeniorNotesDueSeptember12024Member2018-09-012018-09-300001138639us-gaap:SeniorNotesMemberinfn:ConvertibleSeniorNotes2.5DueMarch12027Member2020-03-012020-03-310001138639infn:A375ConvertibleSeniorNotesDue2028Memberus-gaap:SeniorNotesMember2022-08-012022-08-310001138639us-gaap:SeniorNotesMemberinfn:A2.125ConvertibleSeniorNotesDueSeptember12024Member2022-08-012022-08-310001138639us-gaap:SeniorNotesMemberinfn:A2.125ConvertibleSeniorNotesDueSeptember12024Member2021-12-262022-12-310001138639infn:A375ConvertibleSeniorNotesDue2028Memberus-gaap:SeniorNotesMember2023-06-012023-06-300001138639us-gaap:SeniorNotesMemberinfn:A2.125ConvertibleSeniorNotesDueSeptember12024Member2023-06-012023-06-300001138639us-gaap:SeniorNotesMemberinfn:A2.125ConvertibleSeniorNotesDueSeptember12024Member2023-01-012023-12-300001138639us-gaap:SeniorNotesMemberinfn:A2.125ConvertibleSeniorNotesDueSeptember12024Member2023-12-300001138639us-gaap:SeniorNotesMemberinfn:ConvertibleSeniorNotes2.5DueMarch12027Member2023-12-300001138639infn:A375ConvertibleSeniorNotesDue2028Memberus-gaap:SeniorNotesMember2023-12-300001138639infn:A2.125ConvertibleSeniorNotesCircumstance1Memberus-gaap:SeniorNotesMember2018-09-012018-09-300001138639us-gaap:SeniorNotesMemberinfn:A2.125ConvertibleSeniorNotesCircumstance2Member2018-09-012018-09-300001138639us-gaap:SeniorNotesMemberinfn:A2.125ConvertibleSeniorNotesCircumstance2Member2018-09-300001138639infn:A2.125ConvertibleSeniorNotesDueSeptember12024Member2023-01-012023-12-300001138639infn:A2.125ConvertibleSeniorNotesDueSeptember12024Member2021-12-262022-12-310001138639infn:A2.125ConvertibleSeniorNotesDueSeptember12024Member2020-12-272021-12-250001138639us-gaap:SeniorNotesMemberinfn:A2.125ConvertibleSeniorNotesDueSeptember12024Memberus-gaap:AdditionalPaidInCapitalMember2020-12-272021-12-250001138639us-gaap:SeniorNotesMemberinfn:ConvertibleSeniorNotes2.5DueMarch12027Memberus-gaap:AdditionalPaidInCapitalMember2020-12-272021-12-250001138639us-gaap:SeniorNotesMemberinfn:A2.125ConvertibleSeniorNotesDueSeptember12024Member2021-12-250001138639us-gaap:SeniorNotesMemberinfn:A2.125ConvertibleSeniorNotesDueSeptember12024Member2020-12-272021-12-250001138639us-gaap:SeniorNotesMemberinfn:ConvertibleSeniorNotes2.5DueMarch12027Member2020-12-272021-12-250001138639us-gaap:SeniorNotesMemberinfn:A2.125ConvertibleSeniorNotesDueSeptember12024Member2021-12-260001138639infn:A375ConvertibleSeniorNotesDue2028Memberus-gaap:SeniorNotesMember2022-08-080001138639us-gaap:SeniorNotesMemberinfn:A2.125ConvertibleSeniorNotesDueSeptember12024Member2021-12-262021-12-260001138639us-gaap:SeniorNotesMemberinfn:ConvertibleSeniorNotes2.5DueMarch12027Member2020-03-312020-03-310001138639infn:A375ConvertibleSeniorNotesDue2028Memberus-gaap:SeniorNotesMember2022-08-082022-08-080001138639infn:A2.125ConvertibleSeniorNotesDueSeptember12024Member2023-12-300001138639infn:A2.125ConvertibleSeniorNotesDueSeptember12024Member2022-12-310001138639infn:ConvertibleSeniorNotes2.5DueMarch12027Member2023-12-300001138639infn:ConvertibleSeniorNotes2.5DueMarch12027Member2022-12-310001138639infn:A375ConvertibleSeniorNotesDue2028Member2023-12-300001138639infn:A375ConvertibleSeniorNotesDue2028Member2022-12-310001138639us-gaap:RevolvingCreditFacilityMemberus-gaap:LineOfCreditMemberinfn:CreditAgreementMember2022-06-240001138639us-gaap:LetterOfCreditMemberus-gaap:LineOfCreditMemberinfn:CreditAgreementMember2022-06-240001138639infn:SwingLoanSubFacilityMemberus-gaap:LineOfCreditMemberinfn:CreditAgreementMember2022-06-240001138639us-gaap:RevolvingCreditFacilityMemberus-gaap:LineOfCreditMemberus-gaap:SecuredOvernightFinancingRateSofrOvernightIndexSwapRateMembersrt:MinimumMemberinfn:CreditAgreementMember2022-06-242022-06-240001138639srt:MaximumMemberus-gaap:RevolvingCreditFacilityMemberus-gaap:LineOfCreditMemberus-gaap:SecuredOvernightFinancingRateSofrOvernightIndexSwapRateMemberinfn:CreditAgreementMember2022-06-242022-06-240001138639us-gaap:RevolvingCreditFacilityMemberus-gaap:BaseRateMemberus-gaap:LineOfCreditMembersrt:MinimumMemberinfn:CreditAgreementMember2022-06-242022-06-240001138639srt:MaximumMemberus-gaap:RevolvingCreditFacilityMemberus-gaap:BaseRateMemberus-gaap:LineOfCreditMemberinfn:CreditAgreementMember2022-06-242022-06-240001138639us-gaap:RevolvingCreditFacilityMemberus-gaap:LineOfCreditMemberinfn:CreditAgreementMember2022-06-242022-06-240001138639us-gaap:RevolvingCreditFacilityMemberus-gaap:LineOfCreditMemberinfn:CreditAgreementMember2023-12-300001138639us-gaap:LetterOfCreditMemberus-gaap:LineOfCreditMemberinfn:CreditAgreementMember2023-12-300001138639us-gaap:LetterOfCreditMemberinfn:BankersGuaranteesOrPerformanceBondsMember2023-12-300001138639us-gaap:MortgagesMember2019-03-012019-03-310001138639us-gaap:MortgagesMember2019-03-310001138639us-gaap:MortgagesMember2021-09-300001138639us-gaap:MortgagesMember2021-09-012021-09-300001138639us-gaap:MortgagesMemberus-gaap:SubsequentEventMember2024-03-270001138639us-gaap:SeniorNotesMemberinfn:ConvertibleSeniorNotes2.5DueMarch12027Member2018-09-012018-09-300001138639infn:A2.125ConvertibleSeniorNotesDueSeptember12024Member2018-09-012018-09-300001138639infn:A375ConvertibleSeniorNotesDue2028Member2018-09-012018-09-300001138639us-gaap:SeniorNotesMemberinfn:ConvertibleSeniorNotesTwoThousandTwentyEightMember2023-12-300001138639infn:ConvertibleSeniorNotesTwoThousandTwentySevenMemberus-gaap:SeniorNotesMember2023-12-300001138639us-gaap:SeniorNotesMemberinfn:ConvertibleSeniorNotesTwoThousandTwentyFourMember2023-12-300001138639us-gaap:OtherNoncurrentLiabilitiesMember2023-12-300001138639infn:CertainPartsProductionSuppliersMember2023-12-300001138639infn:CertainPartsProductionSuppliersMember2022-12-310001138639infn:CertainPartsProductionSuppliersMember2021-12-250001138639us-gaap:LetterOfCreditMember2023-12-300001138639us-gaap:LetterOfCreditMember2022-12-310001138639us-gaap:SuretyBondMember2023-12-300001138639us-gaap:SuretyBondMember2022-12-310001138639infn:A2016EquityIncentivePlanMember2023-05-310001138639infn:A2016EquityIncentivePlanMember2023-12-300001138639infn:A2016EquityIncentivePlanMember2016-02-012016-02-290001138639us-gaap:EmployeeStockMemberinfn:A2007EquityIncentivePlanMember2019-05-310001138639us-gaap:EmployeeStockMemberinfn:A2007EquityIncentivePlanMember2019-05-012019-05-310001138639us-gaap:RestrictedStockUnitsRSUMember2020-12-260001138639us-gaap:RestrictedStockUnitsRSUMember2020-12-272021-12-250001138639us-gaap:RestrictedStockUnitsRSUMember2021-12-250001138639us-gaap:RestrictedStockUnitsRSUMember2021-12-262022-12-310001138639us-gaap:RestrictedStockUnitsRSUMember2022-12-310001138639us-gaap:RestrictedStockUnitsRSUMember2023-01-012023-12-300001138639us-gaap:RestrictedStockUnitsRSUMember2023-12-300001138639us-gaap:PerformanceSharesMember2020-12-260001138639us-gaap:PerformanceSharesMember2020-12-272021-12-250001138639us-gaap:PerformanceSharesMember2021-12-250001138639us-gaap:PerformanceSharesMember2021-12-262022-12-310001138639us-gaap:PerformanceSharesMember2022-12-310001138639us-gaap:PerformanceSharesMember2023-01-012023-12-300001138639us-gaap:PerformanceSharesMember2023-12-3000011386392023-12-290001138639srt:MinimumMember2021-12-262022-12-310001138639srt:MaximumMember2021-12-262022-12-310001138639srt:MinimumMember2020-12-272021-12-250001138639srt:MaximumMember2020-12-272021-12-250001138639us-gaap:EmployeeStockMember2023-01-012023-12-300001138639us-gaap:EmployeeStockMember2021-12-262022-12-310001138639us-gaap:EmployeeStockMember2020-12-272021-12-250001138639infn:FiscalYear2020GrantMemberus-gaap:PerformanceSharesMember2022-12-310001138639us-gaap:PerformanceSharesMemberinfn:FiscalYear2021GrantMember2022-12-310001138639infn:FiscalYear2022GrantMemberus-gaap:PerformanceSharesMember2022-12-310001138639infn:FiscalYear2023GrantMemberus-gaap:PerformanceSharesMember2022-12-310001138639infn:FiscalYear2020GrantMemberus-gaap:PerformanceSharesMember2023-01-012023-12-300001138639us-gaap:PerformanceSharesMemberinfn:FiscalYear2021GrantMember2023-01-012023-12-300001138639infn:FiscalYear2022GrantMemberus-gaap:PerformanceSharesMember2023-01-012023-12-300001138639infn:FiscalYear2023GrantMemberus-gaap:PerformanceSharesMember2023-01-012023-12-300001138639infn:FiscalYear2020GrantMemberus-gaap:PerformanceSharesMember2023-12-300001138639us-gaap:PerformanceSharesMemberinfn:FiscalYear2021GrantMember2023-12-300001138639infn:FiscalYear2022GrantMemberus-gaap:PerformanceSharesMember2023-12-300001138639infn:FiscalYear2023GrantMemberus-gaap:PerformanceSharesMember2023-12-300001138639us-gaap:InventoryValuationAndObsolescenceMember2023-12-300001138639us-gaap:InventoryValuationAndObsolescenceMember2022-12-310001138639us-gaap:InventoryValuationAndObsolescenceMember2021-12-250001138639us-gaap:ResearchAndDevelopmentExpenseMember2023-01-012023-12-300001138639us-gaap:ResearchAndDevelopmentExpenseMember2021-12-262022-12-310001138639us-gaap:ResearchAndDevelopmentExpenseMember2020-12-272021-12-250001138639us-gaap:SellingAndMarketingExpenseMember2023-01-012023-12-300001138639us-gaap:SellingAndMarketingExpenseMember2021-12-262022-12-310001138639us-gaap:SellingAndMarketingExpenseMember2020-12-272021-12-250001138639us-gaap:GeneralAndAdministrativeExpenseMember2023-01-012023-12-300001138639us-gaap:GeneralAndAdministrativeExpenseMember2021-12-262022-12-310001138639us-gaap:GeneralAndAdministrativeExpenseMember2020-12-272021-12-250001138639us-gaap:DomesticCountryMember2023-01-012023-12-300001138639us-gaap:DomesticCountryMember2023-12-300001138639us-gaap:StateAndLocalJurisdictionMember2023-12-300001138639us-gaap:ForeignCountryMember2023-12-300001138639us-gaap:ResearchMemberus-gaap:DomesticCountryMember2023-12-300001138639us-gaap:ResearchMemberus-gaap:StateAndLocalJurisdictionMember2023-12-300001138639infn:CanadaSREDCreditsMember2023-12-300001138639infn:PortugalSIFIDECreditMember2023-12-300001138639country:US2023-12-300001138639country:US2022-12-310001138639infn:OtherAmericasMember2023-12-300001138639infn:OtherAmericasMember2022-12-310001138639us-gaap:EMEAMember2023-12-300001138639us-gaap:EMEAMember2022-12-310001138639srt:AsiaPacificMember2023-12-300001138639srt:AsiaPacificMember2022-12-310001138639infn:Plan401kMember2023-01-012023-12-300001138639infn:Plan401kMember2021-12-262022-12-310001138639infn:Plan401kMember2020-12-272021-12-250001138639infn:ITPPensionPlanMemberinfn:TransmodeMember2023-01-012023-12-300001138639infn:ITPPensionPlanMemberinfn:TransmodeMember2021-12-262022-12-310001138639infn:ITPPensionPlanMemberinfn:TransmodeMember2020-12-272021-12-250001138639srt:ScenarioForecastMember2023-12-312024-12-280001138639us-gaap:DefinedBenefitPlanCashMemberus-gaap:FairValueInputsLevel1Member2023-12-300001138639us-gaap:DefinedBenefitPlanCashMemberus-gaap:FairValueInputsLevel2Member2023-12-300001138639us-gaap:DefinedBenefitPlanCashMember2023-12-300001138639us-gaap:DefinedBenefitPlanCashMemberus-gaap:FairValueInputsLevel1Member2022-12-310001138639us-gaap:DefinedBenefitPlanCashMemberus-gaap:FairValueInputsLevel2Member2022-12-310001138639us-gaap:DefinedBenefitPlanCashMember2022-12-310001138639us-gaap:FairValueInputsLevel1Memberus-gaap:EquityFundsMember2023-12-300001138639us-gaap:EquityFundsMemberus-gaap:FairValueInputsLevel2Member2023-12-300001138639us-gaap:EquityFundsMember2023-12-300001138639us-gaap:FairValueInputsLevel1Memberus-gaap:EquityFundsMember2022-12-310001138639us-gaap:EquityFundsMemberus-gaap:FairValueInputsLevel2Member2022-12-310001138639us-gaap:EquityFundsMember2022-12-310001138639infn:DefinedBenefitPlanInsuranceContractsMemberus-gaap:FairValueInputsLevel1Member2023-12-300001138639infn:DefinedBenefitPlanInsuranceContractsMemberus-gaap:FairValueInputsLevel2Member2023-12-300001138639infn:DefinedBenefitPlanInsuranceContractsMember2023-12-300001138639infn:DefinedBenefitPlanInsuranceContractsMemberus-gaap:FairValueInputsLevel1Member2022-12-310001138639infn:DefinedBenefitPlanInsuranceContractsMemberus-gaap:FairValueInputsLevel2Member2022-12-310001138639infn:DefinedBenefitPlanInsuranceContractsMember2022-12-310001138639us-gaap:FairValueInputsLevel1Member2023-12-300001138639us-gaap:FairValueInputsLevel2Member2023-12-300001138639us-gaap:FairValueInputsLevel1Member2022-12-310001138639us-gaap:FairValueInputsLevel2Member2022-12-3100011386392023-10-012023-12-300001138639us-gaap:ValuationAllowanceOfDeferredTaxAssetsMember2022-12-310001138639us-gaap:ValuationAllowanceOfDeferredTaxAssetsMember2021-12-250001138639us-gaap:ValuationAllowanceOfDeferredTaxAssetsMember2020-12-260001138639us-gaap:ValuationAllowanceOfDeferredTaxAssetsMember2023-01-012023-12-300001138639us-gaap:ValuationAllowanceOfDeferredTaxAssetsMember2021-12-262022-12-310001138639us-gaap:ValuationAllowanceOfDeferredTaxAssetsMember2020-12-272021-12-250001138639us-gaap:ValuationAllowanceOfDeferredTaxAssetsMember2023-12-300001138639us-gaap:AllowanceForCreditLossMember2022-12-310001138639us-gaap:AllowanceForCreditLossMember2021-12-250001138639us-gaap:AllowanceForCreditLossMember2020-12-260001138639us-gaap:AllowanceForCreditLossMember2023-01-012023-12-300001138639us-gaap:AllowanceForCreditLossMember2021-12-262022-12-310001138639us-gaap:AllowanceForCreditLossMember2020-12-272021-12-250001138639us-gaap:AllowanceForCreditLossMember2023-12-30
UNITED STATES
SECURITIES AND EXCHANGE COMMISSION
Washington, D.C. 20549
Form 10-K
| | | | | |
| ☒ | ANNUAL REPORT PURSUANT TO SECTION 13 OR 15(d) OF THE SECURITIES EXCHANGE ACT OF 1934 |
For the fiscal year ended December 30, 2023
OR
| | | | | |
| ☐ | TRANSITION REPORT PURSUANT TO SECTION 13 OR 15(d) OF THE SECURITIES EXCHANGE ACT OF 1934 |
For the transition period from to
Commission file number: 001-33486
Infinera Corporation
(Exact name of registrant as specified in its charter)
| | | | | |
| Delaware | 77-0560433 |
(State or other jurisdiction of
incorporation or organization) | (IRS Employer
Identification No.) |
6373 San Ignacio Avenue
San Jose, CA 95119
(Address of principal executive offices, including zip code)
(408) 572-5200
(Registrant’s telephone number, including area code)Securities registered pursuant to Section 12(g) of the Act: None
Securities registered pursuant to Section 12(b) of the Act:
| | | | | | | | |
| Title of each class | Trading Symbol | Name of exchange on which registered |
| Common shares, par value $0.001 per share | INFN | The Nasdaq Global Select Market |
Indicate by check mark if the registrant is a well-known seasoned issuer, as defined in Rule 405 of the Securities Act. Yes ☐ No ☒
Indicate by check mark if the registrant is not required to file reports pursuant to Section 13 or 15(d) of the Act. Yes ☐ No ☒
Indicate by check mark whether the registrant (1) has filed all reports required to be filed by Section 13 or 15(d) of the Securities Exchange Act of 1934 during the preceding 12 months (or for such shorter period that the registrant was required to file such reports), and (2) has been subject to such filing requirements for the past 90 days. Yes ☒ No ☐
Indicate by check mark whether the registrant has submitted electronically every Interactive Data File required to be submitted pursuant to Rule 405 of Regulation S-T (§232.405 of this chapter) during the preceding 12 months (or for such shorter period that the registrant was required to submit such files). Yes ☒ No ☐
Indicate by check mark whether the registrant is a large accelerated filer, an accelerated filer, a non-accelerated filer, a smaller reporting company or an emerging growth company. See definitions of “large accelerated filer,” “accelerated filer,” “smaller reporting company” and “emerging growth company” in Rule 12b-2 of the Exchange Act. (Check one):
| | | | | | | | | | | | | | |
| Large accelerated filer | ☒ | | Accelerated filer | ☐ |
Non-accelerated filer | ☐ | | Smaller reporting company | ☐ |
| | | Emerging growth company | ☐ |
If an emerging growth company, indicate by check mark if the registrant has elected not to use the extended transition period for complying with any new or revised financial accounting standards provided pursuant to Section 13(a) of the Exchange Act. ☐
Indicate by check mark whether the registrant has filed a report on and attestation to its management's assessment of the effectiveness of its internal control over financial reporting under Section 404(b) of the Sarbanes-Oxley Act (15 U.S.C. 7262(b)) by the registered public accounting firm that prepared or issued its audit report. ☒
If securities are registered pursuant to Section 12(b) of the Act, indicate by check mark whether the financial statements of the registrant included in the filing reflect the correction of an error to previously issued financial statements. ☐
Indicate by check mark whether any of those error corrections are restatements that required a recovery analysis of incentive-based compensation received by any of the registrant’s executive officers during the relevant recovery period pursuant to §240.10D-1(b). ☐
Indicate by check mark whether the registrant is a shell company (as defined in Rule 12b-2 of the Exchange Act). Yes ☐ No ☒
The aggregate market value of the registrant’s common stock, $0.001 par value per share, held by non-affiliates of the registrant on July 1, 2023, the last business day of the registrant’s most recently completed second fiscal quarter, was approximately $687,781,925 (based on the closing sales price of the registrant’s common stock on that date). Shares of the registrant’s common stock held by each officer and director and each person who owns more than 10% or more of the outstanding common stock of the registrant have been excluded in that such persons may be deemed to be affiliates. This determination of affiliate status is not necessarily a conclusive determination for other purposes. As of May 10, 2024, 234,108,176 shares of the registrant’s common stock, $0.001 par value per share, were issued and outstanding.
DOCUMENTS INCORPORATED BY REFERENCE
Portions of the registrant’s definitive proxy statement relating to its 2024 Annual Meeting of Stockholders (the “2024 Proxy Statement”) are incorporated by reference into Part III of this Annual Report on Form 10-K where indicated. The 2024 Proxy Statement will be filed with the U.S. Securities and Exchange Commission within 120 days after the end of the fiscal year to which this report relates.
INFINERA CORPORATION
ANNUAL REPORT ON FORM 10-K
For the Fiscal Year Ended December 30, 2023
Table of Contents
Part I
ITEM 1. BUSINESS
Overview
Infinera Corporation (“we,” “us,” “our”, “Infinera” or the "Company") is a semiconductor manufacturer and global supplier of networking solutions comprised of networking equipment, optical semiconductors, software and services. Our portfolio of solutions includes optical transport platforms, converged packet-optical transport platforms, compact modular platforms, optical line systems, coherent optical engines and subsystems, a suite of automation software offerings, and support and professional services. Leveraging our U.S.-based compound semiconductor fabrication plant ("fab") and in-house test and packaging capabilities, we design, develop and manufacture industry-leading indium phosphide-based photonic integrated circuits ("PICs") for use in our vertically integrated, high-capacity optical communications products.
Our customers include operators of fixed line and mobile networks, including telecommunications service providers, internet content providers (“ICPs”), cable providers, wholesale carriers, research and education institutions, large enterprises, utilities and government entities. Our networking solutions enable our customers to build infrastructure networks that support and deliver high-bandwidth business and consumer communications services. Our edge-to-core portfolio of networking solutions also enables our customers to scale their transport networks as consumer and business services and applications continue to drive growth in demand for network bandwidth. These consumer and business services and applications include, but are not limited to, high-speed internet access, 4G/5G mobile broadband, cloud-based services, high-definition video streaming services, virtual and augmented reality, the Internet of Things (“IoT”), artificial intelligence ("AI"), machine learning ("ML"), business Ethernet services and data center interconnect ("DCI").
As an optical semiconductor manufacturer, we specialize in the manufacturing of optical compound semiconductors using indium phosphide ("InP"). This technology is used in infrastructure networks to transmit massive amounts of data and support delivery of consumer and business communications services. We have made significant investments in our unique research, development, fabrication and packaging facilities, including our optical compound semiconductor fab in Silicon Valley and advanced test and packaging center in Allentown, Pennsylvania. We optimize the manufacturing process by using InP to build our PICs, which enables the integration of hundreds of optical functions onto a single, monolithic optical semiconductor chip. The unique capabilities of our optical semiconductor fab, which has provided our customers with a critical and secure source of U.S.-produced optical semiconductors and strengthened the supply chain, have enabled us to consistently pioneer critical technology advancements. For example, our latest generation of technology has made it possible to transmit information at a rate of 800 gigabits per second (“Gb/s”) using a single laser. Our ongoing research and development initiatives continue to create a path to higher speed transmission and lower cost per bit performance for our customers.
We support U.S. government efforts to advance and increase the domestic manufacturing base for semiconductors as a matter of economic and national security. Compound semiconductors – including those based in InP – are an important part of the domestic semiconductor industry and will enable the next-generation of leading-edge technologies. Domestic manufacturing is critical in order to reduce our reliance on foreign sources of compound semiconductor materials and components, which is essential to economic growth and to the security of our domestic communications infrastructure.
The large-scale integration of our PICs and advanced digital signal processors (“DSPs”) enables us to develop and manufacture high-performance optical engines that are used in our coherent optical networking system and subsystem solutions. These optical engine solutions, branded as Infinite Capacity Engine ("ICE"), include features that customers care about the most, including lowest cost per bit, lowest power per bit, reduced footprint and increased flexibility, reliability and security. Coherent optical solutions are becoming increasingly important across the network as our customers transition to 800 Gb/s per wavelength transmission speeds and beyond in the network core, 400 Gb/s in metro networks and 100 Gb/s in the access market segment. We believe our vertical integration strategy provides a competitive advantage by enabling leading optical performance at higher optical speeds with increased spectral efficiency, greater control over our supply chain and an overall lower cost structure.
We have grown our solutions portfolio through internal development as well as acquisitions, including the acquisition of Telecom Holding Parent LLC (“Coriant”), a privately held global supplier of open network solutions for the largest global network operators (the “Acquisition”). These developments positioned us to be one of the leading providers of vertically integrated optical networking solutions in the world with the ability to serve a broader global customer base with accelerated delivery of the innovative solutions our customers demand. In 2021, we announced an expansion of our portfolio with the introduction of a suite of coherent optical pluggable. Pluggable optics are optical transmission solutions packaged in smaller and more versatile form factors. They are designed to seamlessly address the rapidly growing market for point-to-point optical transport solutions as well as create a new category of point-to-multipoint solutions that can enable a dramatically more cost-efficient network architecture. Based on our vertically integrated optical semiconductor technology and supporting a range of high-speed transport rates that include 800 Gb/s, 400 Gb/s and 100 Gb/s, this suite of coherent optical pluggables builds on our history of delivering innovative, vertically integrated optical engine technology that powers our differentiated optical networking solutions.
Our products are designed to be managed by a suite of software solutions that enable simplified network management, increased service agility and automated operations. We also provide software-enabled programmability that offers differentiated capabilities such as Instant Bandwidth. Combined with our differentiated hardware solutions, Instant Bandwidth enables our customers to purchase and activate bandwidth as needed through our unique software licensing feature set. This, in turn, allows our customers to accomplish two key objectives: (1) limit their initial network startup costs and investments; and (2) instantly activate new bandwidth as their customers’ and their own network capacity needs evolve.
We believe our systems and subsystems solutions benefit our customers by providing a unique combination of highly scalable capacity and advanced networking features that address edge-to-core transport network applications and ultimately simplify and automate network operations. Our high-performance optical transport solutions leverage the industry shift to open optical network architectures and enable our customers to efficiently and cost-effectively keep pace with bandwidth demands, which continue to grow 30% or more year-over-year.
We were incorporated in December 2000 and originally operated under the name “Zepton Networks.” We are incorporated in the State of Delaware. Our principal executive offices are located at 6373 San Ignacio Avenue, San Jose, CA 95119. Our telephone number is (408) 572-5200. “Infinera,” “FlexCoherent,” and the Infinera logo, are trademarks or service marks of Infinera Corporation in the United States, certain other countries and/or the European Union. Any other trademarks or trade names mentioned are the property of their respective owners.
Industry Background
Optical transport networking equipment carries digital information using light waves over fiber optic cables. With the advent of dense wavelength division multiplexing (“DWDM”) systems, data is transmitted by using multiple wavelengths of light using different frequencies or colors over a single optical fiber. Customers deploy DWDM systems to carry information between continents, across countries, between cities and within metropolitan areas, and in some cases all the way to the ultimate consumer or business user. Fiber optic networks are generally capable of carrying most types of communications traffic. Coherent optical technology is the latest innovation in DWDM transmission that dramatically increases the amount of information a single laser can transmit.
We believe that a number of trends in the communications industry are driving demand for large amounts of network bandwidth and ultimately will increase demand for advanced optical transport networking solutions. These trends include:
•growth of cloud services and DCI connectivity capacities;
•growth of over-the-top services and high-definition video streaming;
•growth of mobile broadband services, such as 5G;
•growth of edge computing resources closer to ultimate consumer or business users;
•increasing use of connected virtual and augmented reality devices;
•the IoT, which continues to drive massive growth in the number of network-connected devices; and
•emerging network capacity and power consumption demands of AI and ML workloads.
As network traffic grows, network operators will need to continue to add transmission capacity to existing optical networks or deploy new systems and/or subsystems to address bandwidth demand and offer new consumer and business services.
We believe we are in the midst of an important shift in transport network architectures that impact the markets we serve. The shift to open and disaggregated networks is increasingly being embraced by the communications industry. Examples of this trend include separation of compute, storage and networking in data centers, the separation of hardware, operating system and applications in smart phones, hardware/software separation in network function virtualization and hardware and software routing stack routers, and open radio access network initiatives for 5G. Industry evolution is now enabling optical networking to leverage these same principles of openness and disaggregation.
Optical networking technology has evolved to enable open networks at the physical and management layer. These technologies allow network operators to move from a traditional vendor locked-in model to a more flexible model where they can choose from a collection of modular, best-of-breed solutions from different suppliers for each network function. Open and standards-based interfaces ease the integration into a unified network architecture.
The shift to open optical networking provides network operators with key benefits that include:
•Accelerated innovation cycles: By leveraging the full innovation capabilities of the optical ecosystem, network operators are able to select best-in-class technologies and vendors independently throughout the network lifecycle. Solution providers can also develop innovative technologies for specific network functions without having to supply end-to-end networking solutions, significantly broadening the innovation ecosystem.
•Optimized network architectures: By selecting the ideal products and technologies for each layer and domain of the network independently, network operators are able to optimize their optical network for specific applications and services and avoid the constraints of a single-vendor for one-size-fits-all solutions.
•Improved network economics: Open optical networks enable the introduction of lower cost per bit and lower power per bit innovations to be quickly deployed throughout the network lifecycle, with customized multi-vendor network designs providing additional scope for cost-optimization as capacity and service demands evolve.
A second shift is happening at the edge of the network, where capacity is growing beyond the ability of traditional, non-coherent optical transmission solutions to address. This increasing capacity demand is driving the need for innovative edge- and access-optimized coherent optical transport solutions. These include more compact, efficient and cost-effective solutions as well as innovative coherent optical pluggable solutions such as ICE-X optics point-to-point and point-to-multipoint technology that can enable significant cost savings by dramatically simplifying network architectures.
Strategy
Our goal is to be the preeminent provider of high-performance optical transport technologies and solutions that enable our customers to cost-efficiently scale network capacity and simplify network operations in response to increasing bandwidth demand. Key aspects of our strategy include:
•Leveraging our U.S.-based optical semiconductor fab and packaging capabilities and vertically integrated solutions to deliver lowest total cost network solutions. We will continue to provide our customers with differentiated value by leveraging our vertically integrated capabilities. Our strategy is to continue to evolve our unique optical technology with higher speed and lower cost and power per bit efficiencies, integrating our vertically integrated optical engines across a broad range of our open optical networking systems and expanding our addressable market with a suite of with vertically integrated subsystem and coherent optical pluggable products.
•Driving cost structure optimization and achieving cost advantages of scale. Leveraging scale as part of our vertical integration strategy, which includes integration of our optical engine across our broad portfolio of systems and subsystems, enables us to achieve cost advantages and cost structure efficiencies that enhance our ability to continue to invest in research and development in our optical engine and edge-to-core portfolio, as well as drive profitability. In particular, we believe our vertically integrated, in-house optical semiconductor manufacturing capabilities serve as a
competitive advantage from a technology and supply chain perspective and enable a lower cost structure and higher profitability.
•Building open optical networking solutions. Our strategy is focused on leveraging open optical networking principles, including disaggregated networking solutions and industry-leading optical technology with open application programming interfaces (“APIs”) and standardized data models to offer our customers best-in-class solutions and create insertion opportunities to gain market share. Open optical networking provides benefits for both network operators and innovative solution providers. These benefits include accelerating innovation cycles, enabling optimized and differentiated networking solutions, and the ability to transform network economics.
•Delivering a superior customer experience. Our success will continue to be driven by our commitment to providing a superior experience to all customers. In addition to product delivery capability that efficiently and predictably delivers innovative technology and high-quality products to market, we bring value to our customers by providing differentiated capabilities that include usage-based bandwidth provisioning, service agility and ease-of-use that accelerates time-to-revenue. Additionally, our global customer services team is committed to making our customers successful by providing the highest quality support services that help our customers deploy, operate and maintain their networks. We believe our technology leadership combined with our ability to provide the most reliable products and a differentiated customer experience contribute to customer success and represent major differentiators.
•Utilizing software-driven automation to deliver differentiated solutions. We believe we lead the industry in ease-of-use and automation, both integrated into our system and subsystem product designs and facilitated by our software capabilities. We continue to invest in our differentiated technologies, including enhancing capabilities of Instant Bandwidth offerings and introducing advanced automation and programmability capabilities. Additionally, based on our customers’ desire for open networking solutions, we have introduced new cloud-based software capabilities designed to streamline and simplify operations of multi-vendor optical networks. This includes the addition of open APIs in our networking platforms and intelligent coherent optical pluggable management capabilities, as well as the use of AI to enhance our customer support offerings.
Customers, Products and Services
The customer verticals we serve include:
•Tier 1 carriers with domestic and international infrastructure networks;
•Tier 2 and Tier 3 communications service providers;
•ICPs, web-scale providers (also referred to as hyper-scalers) and cloud providers;
•cable providers and Multiple System Operators ("MSOs");
•wholesale carriers;
•submarine network operators;
•utilities;
•large enterprise customers spanning diverse vertical industries;
•research and education institutions;
•government and public sector entities; and
•third-party network equipment manufacturers.
In the markets we serve, we believe our customers seek the following solutions to meet growing bandwidth needs, increase their revenue, expand their service offerings and lower the total cost of their network operations:
•high-bandwidth solutions that scale optical transmission capacity to meet increasing bandwidth demand while providing efficiency through service granularity;
•flexible, efficient and easy to deploy core-to-edge coherent optical solutions that optimize performance and increase reliability while reducing physical space and power consumption, leading to lower operational and capital expenses;
•easy-to-use solutions that are highly programmable, open and automated, which help reduce the time and complexity of deploying and managing transmission bandwidth;
•sustainable products and solutions that deliver meaningful reduction in power and associated emissions; and
•strong encryption at the transport layer to ensure maximum security for data transport.
We sell our products via a direct sales force and through indirect channel partners. One end-customer accounted for 10% of our revenue in fiscal year 2023. One end-customer accounted for 11% of our revenue in fiscal year 2022 and no end-customer accounted for 10% or more of our revenue in fiscal year 2021. For the years ended December 30, 2023, December 31, 2022 and December 25, 2021, our top ten end-customers accounted for approximately 52%, 48% and 42% of our total revenue, respectively.
We have focused our efforts and capital investments on developing high-performance, vertically integrated transport technologies and solutions that enable customers to cost-efficiently scale network capacity, reduce cost and power per bit, increase flexibility and launch new services in response to increasing bandwidth demand. Our products feature industry-leading optical performance for capacity and reach, high service port density, a low power profile and open automation software that allows fast and simple provisioning of network services.
We believe one of our key differentiating capabilities is our deep vertical integration of high-end optical technology, including optical semiconductors. We have a world-class team of scientists and engineers that is responsible for driving the opto-electronic innovations that are integrated into our coherent systems and subsystems solutions. Core engineering disciplines include coherent application-specific integrated circuit ("ASIC")/DSP design, PIC design and manufacture, analog ASIC design, advanced packaging design and manufacture, and holistic co-design, including the RF interconnect. Our experts have achieved many industry firsts, including the first large-scale PIC, the first coherent PIC, the first commercial super-channels, the first digital subcarriers, and the first point-to-multipoint coherent technology. Additional innovation highlights include soft-decision forward error correction gain sharing techniques and long-codeword probabilistic constellation shaping. These innovations are the foundation for the superior reach performance of our 1.6 Terabit per second ("Tb/s")-capable ICE6 optical engine and our industry-first point-to-multipoint technology. They have resulted in Infinera setting numerous industry records for optical transmission.
Financially, we believe our in-house developed technology approach coupled with our unique monolithic InP semiconductor technology enables improved manufacturing economics for optical networking, allowing future optical transport cost and power per bit reductions to be viably sustained on a cost curve defined by volume manufacturing efficiencies and greater functional integration. These advantages also allow us to develop new technologies and solutions that offer our customers innovative ways to solve their business needs.
Product Portfolio
Our hardware product portfolio consists of compact modular platforms, packet-optical platforms, optical line systems, and optical subsystems. Software products include the Infinera Transcend Software Suite, which includes automation and network management software. These products address multiple market segments in the end-to-end transport infrastructure, including metro, long-haul and subsea. DCI is a subset of these markets. We also provide customer support services, including professional service offerings designed to help customers optimize their network assets and migrate legacy services.
Compact Modular Platforms
Infinera GX Series Compact Modular Platform
The Infinera GX Series of highly compact, modular and sled-based platforms includes integrated muxponder and optical line system capabilities optimized to support a variety of transport network applications. With a compact and flexible architectural design, the GX Series supports up to 800 Gb/s per wavelength (via our embedded ICE6 optical engine) and provides an evolution path to 1.2 Tb/s transmission with its next-generation optical engine, providing customers with a seamless path to future growth and cost-optimized reach in metro and long-haul applications. The GX muxponder solution supports deployment over virtually any optical line system, enabling network operators to easily introduce our best-of-breed, high-performance transmission capabilities over existing network infrastructure.
Infinera Cloud Xpress Family
The Infinera Cloud Xpress Family is designed to meet the varying needs of ICPs, communication service providers, internet exchange service providers, enterprises and other large-scale data center operators. The first generation of the Cloud Xpress has a 500 Gb/s DWDM super-channel output in 2 rack unit ("RU") form factor. Our second generation, the Cloud Xpress 2, released in June 2017, leverages the ICE4 optical engine, and has a 1.2 Tb/s super-channel output in 1RU. These platforms are designed with a rack-and-stack form factor and utilize a software approach that enables them to easily plug into existing cloud provisioning systems using open software defined networking ("SDN") APIs, an approach similar to the server and storage infrastructure deployed in the cloud.
Infinera XT Series
The Infinera XT Series of compact, open and disaggregated platforms, powered by our ICE4 optical engine, delivers up to 2.4 Tb/s of line-side capacity for metro, DCI, regional and long-haul networks in compact 1RU and 4RU form factors, with ultra-long-haul and submarine reach. These platforms are designed to power cloud scale network services over metro, DCI, long-haul and subsea networks.
Optical Line Systems
Infinera GX Series Optical Line System
In addition to muxponder functionality, the Infinera GX Series Compact Modular Platform also supports a variety of multi-haul optical line system capabilities. From compact plug-and-play optical function to comprehensive multi-degree reconfigurable optical add-drop multiplexer (“ROADM”) capabilities, the GX Series provides a single configurable system to address virtually any optical networking application. With natively open interfaces, the GX Series supports seamless integration into a variety of networks and open optical applications.
Infinera 7300 Series
The Infinera 7300 Series is an SDN-ready coherent optical transport system. Supporting the latest optical technology, the 7300 Series addresses the needs of regional, long-haul, and ultra-long-haul optical networking, including long, unrepeatered single-span and festoon subsea networks. The 7300 enables network operators to achieve the highest network resiliency with fast optical protection switching and the use of autonomous and SDN-controlled restoration capabilities.
Infinera FlexILS Open Optical Line System
The Infinera FlexILS open optical line system connects various Infinera and third-party terminal equipment platforms over long-distance fiber optic cable while providing switching, multiplexing, amplification and management channels. The FlexILS solution is designed to support over 50 Tb/s of fiber capacity when used with the Infinera platforms over extended C-band and L-band. The FlexILS supports ROADM functionality with a flexible grid architecture and provides unconstrained optical switching by eliminating the restrictions of fixed wavelengths by port or direction. This platform is designed to provide open APIs interfacing with SDN control for multi-layer switching when combined with other platforms featuring DWDM, optical transport network ("OTN") and packet switching.
Packet-Optical Platforms
Infinera XTM Series
The Infinera XTM Series packet-optical transport platform enables high-performance metro connectivity solutions with service-aware capabilities optimized for 5G, Fiber Deep, business services and other metro transport applications. The XTM Series offers superior density, lower power consumption and higher scalability for multi-service metro access and aggregation networks, including integrated Layer 1 and Layer 2 support and Time Sensitive Networking features required for 5G mobile x-haul applications. The platform is designed for application-rich packet-optical metro networks providing cable, mobile, broadband and business services that require 10 Gb/s, 100 Gb/s or 200 Gb/s wavelengths with differentiated performance. This offering includes Auto-Lambda, a feature that provides a unique solution for deploying access and aggregation networks. Auto-Lambda enables network operators to simply plug DWDM optics into aggregation and access nodes, which allows the packet-optical network element to automatically tune each of the optical signals to the appropriate wavelength.
Infinera 7100 Series
Infinera 7100 Series of packet-optical transport platforms are right-sized and support a flexible mix of transponders, muxponders, packet switching, OTN switching, SONET/SDH switching, and ROADM-based optical line systems, providing compact and flexible transport for metro networks. The 7100 Series includes the 7100 Nano, a 5RU platform optimized for metro transport and the 7100 Pico, a 2RU platform that extends services to the metro edge and enables metro access applications. The 7100 Series also includes the PSX-3S, a 1RU 376 Gb/s packet switch optimized for aggregation and access applications.
Infinera mTera Series
The Infinera mTera Universal Transport Platform is a flexible and efficient network transport solution supporting scalable grooming and an innovative protocol-agnostic switch fabric in which each and every port on virtually every card can be software-configured between OTN and Ethernet. The mTera Series includes a compact 8-slot, 4 Tb/s shelf and a higher capacity 14-slot, 7 Tb/s shelf, with paired 14-slot shelves able to deliver 12 Tb/s of electrical switching. The mTera Series combines SDN-ready, advanced ROADM capabilities and support for the universal switching of OTN, packet and SONET/SDH traffic at the electrical layer.
Infinera XTC Series
The Infinera XTC Series includes multi-terabit packet optical transport platforms that integrate digital OTN switching and optical DWDM transmission. The XTC Series delivers converged packet, OTN, and DWDM for metro core, regional, long-haul, and subsea applications. The XTC Series features ICE4, Instant Bandwidth, and massively simple operations to drive cost reduction and speed time to revenue. These platforms also support a broad range of Ethernet and OTN client interfaces for flexibility and are designed for metro, long-haul and subsea networks.
Infinera 7090 Series
The Infinera 7090 Packet Transport Platforms provide both Multiprotocol Label Switching Transport Profile ("MPLS-TP") and Carrier Ethernet-based options, addressing applications including business Ethernet services, migration from TDM to packet, and residential and mobile backhaul. The 7090 Series includes MPLS-TP platforms with capacities ranging from 5 Gb/s to 960 Gb/s and Carrier Ethernet-based platforms that provide a range of compact gigabit Ethernet (“GbE”) and 10 GbE access devices.
Coherent Optical Subsystems
ICE-X Coherent Pluggable Optics
ICE-X is a suite of coherent pluggable optics designed to seamlessly address point-to-point (including ZR+) and point-to-multipoint transport applications from the network edge to the core. The suite of vertically integrated ICE-X coherent optical pluggables will offer network operators the performance, scale, efficiency, and manageability critical to infrastructure support for the delivery of differentiated 5G, enhanced broadband, and next-generation cloud and business services. ICE-X coherent optical pluggables support a range of transport rates, including 800 Gb/s, 400 Gb/s and 100 Gb/s, and utilize industry-standard form factors to enable ease of deployment in a wide variety of networking elements. These networking elements include optical transport platforms, compact modular platforms, routers, switches, servers and mobile radio units. Customers for Infinera’s suite of ICE-X coherent optical pluggables include communications service providers, ICPs, enterprises and third-party network equipment manufacturers.
Our subsystems solutions include a line of high-performance transmit-receive optical sub-assemblies, innovative programmable DSPs and a line of high-performance, intelligent pluggable optical transceivers. These solutions leverage an innovative building block approach whereby subsystems can be mixed and matched flexibly, maximizing the value of each element, providing more solution options for customers, and simplifying integration into in-house and third-party optical engines.
Software
Transcend Software Suite
Leveraging cloud-native technologies and SDN principles, the Infinera Transcend Software Suite is a comprehensive software platform that provides automation capabilities designed to help network operators reduce operational costs, optimize network assets, speed time to revenue, and maximize network and service availability. Our programmable Transcend Network Management System ("NMS") provides full end-to-end network and service management across multiple technologies and equipment vendors, while the Transcend Controller enables new, efficient, and innovative applications for network control and automation, extracting the most value out edge-to-core transmission networks and open optical architectures.
Open Optical Networking Software
The Transcend Software Suite also includes software tools and applications that enable network operators to simplify the management of multi-vendor optical networks and leverage best-in-class technology from any number of suppliers in an open network environment. As part of this toolkit, Transcend Open Wave Manager makes it operationally simple to deploy, operate, and troubleshoot open wavelengths and our Intelligent Pluggables Manager brings the holistic, edge-to-core optical networking operational capabilities of DWDM transponders to intelligent pluggable optics in any network platform.
System Software
Our networking platforms and ICE-X coherent optical pluggable solutions include system software designed to maximize reliability and streamline automation. This software controls all aspects of system operations, including command processing, system security, policy management, fault monitoring, and alarm reporting. Our system software is designed to be field upgradable, with minimal impact on customer traffic.
Services
In connection with our product offerings, we provide a comprehensive range of professional, support and training services for all Infinera hardware and software products. These services cover all phases of network ownership, from the initial installation through ongoing operations and maintenance activities. Professional services extend to network optimization, expansion and modernization including migration of legacy transport services. Our global services organization is experienced and prepared to efficiently manage complex projects and assist with customer network operations in the face of today's ever-increasing demands for lower operational costs and minimized downtime.
We continue to expand and enhance our services portfolio, organization and capabilities to meet the evolving needs of our customers.
Competition
Our current technologies and solutions support the access, aggregation, metro, DCI, long-haul and subsea markets. The optical networking equipment market is highly competitive and competition in the markets we serve is based on any one or a combination of the following factors:
•the ability of products and services to meet customers’ immediate and future network requirements;
•price and other commercial terms;
•optical reach and capacity performance;
•features and functionality;
•the availability of components required to manufacture key products;
•existing business and customer relationships;
•power consumption, heat dissipation, form factor and density;
•installation and operational simplicity;
•network and service manageability;
•quality and reliability;
•service and support;
•security and encryption requirements;
•scalability and investment protection; and
•product availability and lead times.
Competition in the optical transport systems market is intense, with consolidation and geopolitical market shifts creating new competitive dynamics. In the long-haul market, our main competitors include DWDM systems suppliers such as Ciena and Nokia, as well as China-based suppliers Huawei and ZTE. In the metro market, we face the same competitors as in long-haul, in addition to Cisco, ADTRAN, Ribbon Communications, and Fujitsu, among others. Competition in the optical subsystems and pluggable optics market includes, but is not limited to, Cisco (via their acquisition of Acacia), Lumentum, Marvell and Coherent, as well as a wide range of China-based suppliers. We also encountered competitor consolidation in the markets in which we compete and may continue to do so, which could lead to a changing competitive landscape, capabilities and market share, and could impact our results of operations.
Some of our competitors have substantially greater name recognition, technical, financial, sales and marketing resources and may be perceived by our customers and suppliers to have greater financial stability, and better-established relationships with potential customers than we have. Many of our competitors have more resources and more experience in developing or acquiring new products and technologies, as well as in creating greater market awareness for those products and technologies. In addition, many of our competitors have the financial resources to offer competitive products at aggressive pricing levels that could prevent us from competing effectively. Some of our competitors offer optical products at a substantial discount or for free when bundled together with broader technology purchases, such as router or wireless equipment purchases. Further, many of our competitors have built long-standing relationships with some of our prospective and existing customers and have the ability to provide financing to customers and could, therefore, have an inherent advantage in selling products to those customers.
Sales and Marketing
We market and sell our products and related support services primarily through our direct sales force, supported by marketing and product management personnel. We also use channel distribution or support partners to enter new markets or when requested by a potential customer. Our sales team has significant experience with the buying process and sales cycles typical of high-value telecommunications systems and subsystems products.
The sales process for our products entails discussions with prospective customers, analyzing their networks and identifying how they can utilize our solutions capabilities within their networks. This process requires developing strong customer relationships and leveraging our sales force, technical experts and customer support team and associated capabilities.
Over the course of the sales cycle, potential customers often test our products before buying. Prior to commercial deployment, the customer will generally perform a field trial of our products. Upon successful completion, the customer generally accepts the products installed in its network and may continue with commercial deployment of additional products. We anticipate that our sales cycle, from initial contact with a prospective customer through the signing of a purchase agreement may, in some cases, take several quarters.
Direct Sales Force. Our sales team sells directly to service providers worldwide and is organized geographically around the following markets: (i) United States and Canada (“North America”); (ii) Latin America and South America (“LATAM”); (iii) Europe, Middle East and Africa (“EMEA”); and (iv) Asia Pacific and Japan (“APAC”). Within each geographic area, we maintain specific teams or personnel that focus on a particular region, country, customer or market vertical. We believe that we will need to further invest in the growth of our direct sales force to compete effectively against our competitors that have built long-standing relationships with some of our prospective and existing customers.
Indirect Sales Force. We employ business consultants and resale and logistics partners to assist in our sales efforts. These partners have deep knowledge of regional business practices and strong relationships with key local operators. We expect to work with business partners to assist our customers in the sale, deployment and maintenance of our systems and have entered into distribution and resale agreements to facilitate the sale and support of our products.
Marketing and Product Management. Our product management team is responsible for defining the product features and go-to-market plan required to maximize our success in the marketplace. Product management supports our sales efforts with product and application expertise. Our corporate marketing team works to create demand for our products by communicating our value proposition and differentiation through a
variety of marketing and customer engagement programs, including public relations, industry analyst relations, event and trade show marketing, web-based promotions, social media, email marketing, and advertising, among other marketing vehicles.
Research and Development
Continued investment in research and development is critical to our business. To this end, we have a team of engineers with expertise in various fields, including photonic integrated circuits, components, systems, sub-systems and software. Our research and development efforts are currently focused in San Jose, California; Allentown, Pennsylvania; Annapolis, Maryland; Bangalore and Ahmedabad, India; Kanata, Canada; Stockholm, Sweden; Munich, Germany; Lisbon, Portugal; and Shanghai, PRC. We utilize a mix of internal resources and supplement our staffing with development personnel provided by third parties on a contract basis. We have invested significant time and financial resources into the enhancement of existing products and the development of new products. We will continue to expand our product offerings and the capabilities of existing products in the future and plan to dedicate significant resources to these continued research and development efforts. We are continually increasing the scalability and software features of our current platforms. We are investing in leveraging our vertical integration capabilities across a broader portion of our platforms. We are also working to develop new generations of optical engines at a faster cadence than we have historically in order to bring new products to market more rapidly and meet evolving customer demands. We believe these efforts will enhance our competitiveness in the markets we currently serve and also allow us to address adjacent markets to fuel our future growth.
Human Capital
Integrity, trust, mutual commitment and respect for diversity are core Infinera values – values brought to life by our talented, diverse, and dedicated global workforce. Employee health and safety are also cornerstones of our human capital management. Our goal is to continuously improve employee engagement as we strive to build and maintain a culture of human connection, individual responsibility and mutual integrity.
As of December 30, 2023, we had 3,389 employees, with 2,119 of those employees located outside of the United States. Our U.S. employees are not subject to a collective bargaining agreement. Employees in certain foreign jurisdictions are represented by local workers’ councils or collective bargaining agreements, as required by local laws or customs. We have not experienced any work stoppages to date. We consider the relationships with our employees to be positive.
Organizational Culture
We believe that developing and fostering a global organizational culture is a key component of our human capital management practice and critical to our long-term success. In 2023, we strengthened our core culture to drive the evolution of our business and human capital strategy. We have intensified efforts to involve leaders at all levels in cultural initiatives and decision-making processes. For example, in 2023, we continued our cross-functional leadership program, Second Circle, which is a global initiative to accelerate the leadership development of our talent. Through regular feedback sessions and leadership forums, Second Circle aims to ensure that our culture reflects the diverse perspectives and experiences within our Company. Our executives are also evaluated and held accountable for upholding our cultural values and leading by example. Our culture is underpinned by three core principles that unite our workforce: (1) innovation that matters (empowering our people); (2) better together (workforce unified in mission and purpose) and (3) we care (engaging people to reach their potential, fostering integrity and empathy, standing with employees and respecting individuality).
Diversity, Equity and Inclusion
At Infinera, we strive to create an inclusive culture for a workforce that is unified in mission and purpose. This is reflected in the way we treat each other, the way we respect our differences across our global workforce, and how we conduct business with our customers and partners around the world. We believe that our culture of inclusion and belonging enables us to leverage the strengths of our people to exceed customer expectations and growth objectives.
In 2020, we launched Infinera ALL-In ("ALL-In"), an employee-led, executive-sponsored, company-wide effort to promote, facilitate and support sustainable diversity, equity and inclusion ("DEI") efforts. ALL-In is sponsored by our Chief Executive Officer ("CEO"), Chief Financial Officer ("CFO"), and Chief Human Resources Officer ("CHRO"), and is led by other executives and employee leaders from each region in which we have employees and do business. In the last three years, ALL-In has contributed to our inclusive culture, raised awareness and fostered meaningful dialogue, and helped guide the overall development of our DEI initiatives.
In 2023, we have continued our partnerships with non-profits and historically black colleges and universities to increase our pipeline of diverse talent. Through our partnership with the United Negro College Fund (“UNCF”), Infinera sponsors internships with a focus on providing job opportunities to candidates within the historically black colleges and universities network that may have never worked in technology before or that may be the first person in their family to attend a university. By positioning Infinera as an accessible avenue into a technical career working on the frontier of optical networking technology, we hope to further expand our candidate pool and access the best talent across the nation. Our apprenticeships also provide a direct avenue to a technical career to candidates that might not have completed a university degree. Leveraging the candidates’ passion and potential, we offer the opportunity for candidates with high school diplomas or equivalency certificates to learn and earn within our Registered Apprentice Program. In our larger sites globally, we also post roles on platforms and job boards targeted at diverse talent pools enabling greater access to diverse talent. In our larger sites globally, we post roles on platforms and job boards targeted at diverse talent pools enabling greater access to diverse talent.
In 2023, we continued to provide DEI training for our global employee base. Training topics are focused on global diversity, employees' roles in workplace diversity and related matters. We offer recruiters and managers training on topics such as leveraging inclusive hiring practices.
As of December 30, 2023, women represented 20% of our global employees, based on those who identify, and 19% based on total population. In the U.S., minorities represented approximately 45% of our U.S. population, based on those who identify, and approximately 38% of our total U.S. population.
Employee engagement
Employee engagement is critical to building a unified and global culture that values local needs and perspectives. We create an engaging workplace culture by consistently listening to and acting on employee feedback. This employee engagement has directly led to the evolution of our culture as referenced above. We continuously evolve our approach to employee communications, from a company-wide platform, to function or departmental communications, to one-on-one discussions to better understand employee expectations and assess the effectiveness of our people practices. From our employee engagement survey feedback, we created a new program where managers can invite executives from other functions to attend their internal staff meetings. This program has fostered candid, thoughtful and cross-functional collaboration. We also encourage our employees to share direct feedback about working for our company through other feedback channels, including employee surveys and on public forums such as Glassdoor.com. This helps us determine how connected employees are to their roles, each other, customers, and other stakeholders and helps us continuously improve our employee experience.
To further foster inclusion and promote our culture and values throughout our diverse workforce, we support several employee resource groups (“ERGs”) including African Descent/Black at Infinera, Infinera Veterans Employee Resource Group and Women at Infinera ("WIN"). As an example of ERG evolution and effectiveness, WIN works to provide our female employees with access to conferences, networking events and other prominent engagements in the technology industry, as well as to support greater opportunities for career growth, internships, and leadership. In 2023, we continued our WIN mentoring program, participation in local and regional women’s conferences and a speakers series including industry and thought leaders addressing topics such as development, recruitment, and retention of women. In various locations, employees have also partnered with local nonprofits and schools to encourage female students to pursue science, technology, engineering, and mathematics, or STEM, careers.
We also continue to design strategic initiatives with the intent to reduce barriers and enhance collaboration. For example, in 2023, the Company hosted three events where multiple levels of management, technologists and individual contributors engaged directly with our Board of Directors. These initiatives allowed the Board of Directors to interact with the Company’s leadership and talent, while also providing leadership direct access and visibility to the Board of Directors.
Compensation, Benefits and Well-being
Our goal is to incentivize our talented employees with a total compensation package that is market-competitive as validated through independent data sources. Our total compensation for eligible employees includes base salary, bonuses and equity awards. We intend to maintain ongoing competitiveness for attracting, engaging, retaining, and developing the best talent. We continuously improve our human resources information systems for workforce data collection, monitoring, and reporting, and expect that this will allow us to improve our understanding of compensation equity around the globe to ensure fair pay. We also seek to provide market-competitive benefits as part of our total reward structure for all employees around the globe and their dependents.
We have also invested in creating safe work environments for our workforce, which is important given our status as a critical infrastructure business with manufacturing facilities in the U.S. and research and development sites in several countries. To advance these efforts, we have a global leadership team comprised of local site leaders that meets regularly to support compliance with all local and international guidelines and establishes best practices at every site. We are committed to providing employees with a healthy and safe work environment by striving to prevent accidents and improve workplace conditions, and continuously working to improve our processes and performance. Our health and safety programs emphasize personal accountability, professional conduct, and regulatory compliance, while our culture fosters a sense of proactivity, caution, empathy, and communication.
We have also continued to emphasize employee well-being. For example, in the U.S., the Employee Assistance Program benefit includes mental health counseling for help with personal issues, childcare and eldercare referrals, financial coaching, legal consultation and wellness tools. Employees are provided medical, dental, vision, long-term and short-term disability, and life insurance, and employees covered under our health insurance have access to various wellness programs. Employees are provided paid parental leave as new parents (birth or adoption). Eligible employees are also qualified to receive unlimited flexible time off.
Growth and Development
Consistent with our commitment to innovation that matters, our employee growth and development initiatives are designed to provide opportunities for employees to learn, innovate and enhance their skillsets at every stage of their role and long-term career. To ensure business continuity and employee development, the executive leadership team regularly reviews the talent pipeline, identifies, and develops succession candidates, and builds succession plans for leadership positions. The Board and its Nominating and Governance Committee provide oversight of CEO and succession planning of key executive roles.
Part of a healthy culture is also ensuring the Company attracts and develops new talent. In 2023, the Company provided internships to candidates in high school, community colleges and universities globally. Internships enable the Company to access talent who can join the Company’s workforce as an employee, while also providing such interns with opportunities to work for an innovative technology company.
Experiential learning is powerful in career development, which is why we also provide global job-based learning opportunities including cross-functional transfers and expanded roles. Education also enables the advancement of our DEI initiatives, which is one of our core values and a continued area of focus for us. Our learning and development initiatives include a scalable, multi-language e-learning platform that enables the proliferation of global, diverse, and professional education. We also provide education on topics that include, but are not limited to, technical sessions, managerial training, effective time management, unlocking executive presence, working in a multigenerational workplace, next level delegation and breaking down barriers.
We also have a global mentorship program to empower all employees within Infinera to advance their careers and realize their full potential. By facilitating mentor-mentee relationships, this program provides a unique opportunity for reflection, self-examination, and the development of practical skills for mentees while simultaneously providing mentors with fresh perspectives, insights, opinions, and an opportunity to have a direct hand in the development of future leaders.
Manufacturing
We have invested significant time and capital to develop and improve the manufacturing processes we use to produce and package our products. This includes significant investments in personnel, equipment and the facilities needed to manufacture and package our products in California and Pennsylvania. We also have invested in automating our manufacturing process and in training and maintaining the quality of our manufacturing workforce. As a leader in the development of photonic integration, our manufacturing processes have been developed over many years and are protected through a combination of patents, trade secrets and contractual protections. We believe that the investments we have made towards the manufacturing and packaging of our products provide us with a significant competitive advantage. We also believe that our current manufacturing facilities, including our fabrication facility for our PICs in California and our module manufacturing facility in Pennsylvania, can accommodate an increase in production capacity as our business continues to grow.
We also use contract manufacturers to assemble portions of our products. Each contract manufacturer procures components necessary to assemble products according to our specifications and bills of material. For elements of our business where we outsource, we perform rigorous in-house quality control testing to ensure the reliability of our products. Our supply chain risk mitigation strategies are continuous and institutionalized in our supply chain design for external manufacturing and for procurement of components. We currently use three contract manufacturers in several different countries, including Thailand, Malaysia, and China, and we maintain the capability to transfer select manufacturing activities to U.S. qualified factories of three electronic manufacturing services partners.
We expect all suppliers to comply with our Supplier Code of Conduct, which addresses the rights of workers to safe and healthy working conditions, environmental responsibility, and compliance with applicable laws.
Backlog
Our backlog represents purchase orders received from customers for future product shipments and services to be provided in future periods. Our backlog is subject to future events that could cause the amount or timing of the related revenue to change, and, in certain cases, purchase orders may be canceled without penalty. Orders in backlog may be fulfilled several quarters following order receipt and may relate to multi-year support service obligations. As a result, we believe that backlog should not be viewed as an accurate indicator of future operating results for any particular period. A backlogged purchase order may not result in revenue in a particular period, and the actual revenue may not be equal to our backlog amounts. Our presentation of backlog may not be comparable with that of other companies in our industry.
Intellectual Property
Our innovative software and optical engine technologies, including our PIC, DSP, module and related technologies, are foundational to our products and we believe they are highly valued by our customers and provide us with a competitive advantage.
We believe our success depends upon our ability to protect our core technology and intellectual property. To accomplish this, we rely on a combination of intellectual property rights, including patents, trade secrets, copyrights and trademarks, as well as customary contractual protections. However, there can be no assurances that these protections will be sufficient to provide us with a competitive advantage or that others have not or will not reverse engineer our designs or discover, develop or disclose the same or similar designs and manufacturing processes.
As of December 30, 2023, we held 1,019 U.S. patents and 470 international patents expiring between 2024 and 2042, and held 177 U.S. and 98 foreign pending patent applications. We do not know whether any of our pending patent applications will result in the issuance of patents or whether the examination process will require us to narrow our claims.
We may not receive any competitive advantages from the rights granted under our patents and other intellectual property. Any patents granted to us may be contested, circumvented or invalidated over the course of our business, and we may not be able to prevent third parties from infringing these patents. Therefore, the impact of these patents cannot be predicted with certainty.
We believe that the frequency of assertions of patent infringement is increasing as patent holders, including entities that are not in our industry and who purchase patents as an investment or to monetize such rights by obtaining royalties, use such actions as a competitive tactic as well as a source of additional revenue. For example, we are currently involved in litigation for alleged patent infringement. See the information set forth under the heading “Legal Matters” in Note 12, Commitments and Contingencies, in Part II, Item 8 for additional information regarding such litigation. Any claim of infringement from a third party, even those without merit, could cause us to incur substantial costs defending against such claims, and could distract our management from running our business. Furthermore, a party making such a claim, if successful, could secure a judgment that requires us to pay substantial damages or could include an injunction or other court order that could prevent us from offering our products. In addition, we might be required to seek a license for the use of such intellectual property, which may not be available on commercially reasonable terms or at all. Alternatively, we may be required to develop non-infringing technology, which would require significant effort and expense and may ultimately not be successful.
In addition to trade secret and patent protections, we generally control access to and the use of our proprietary software and other confidential information. This protection is accomplished through a combination of internal and external controls, including contractual protections with employees, contractors, customers and partners, and through a combination of U.S. and international copyright laws.
We license some of our software pursuant to agreements that impose restrictions on our customers’ ability to use such software, such as prohibiting reverse engineering and limiting the use of copies. We also seek to avoid disclosure of our intellectual property by relying on non-disclosure and assignment of intellectual property agreements with our employees and consultants that acknowledge our exclusive ownership of all intellectual property developed by the individual within the scope of and during the course of his or her work with us. The agreements also require that each person maintain the confidentiality of all proprietary information disclosed to them. Other parties may not comply with the terms of their agreements with us, and we may not be able to enforce our rights adequately against these parties. We also rely on contractual rights to establish and protect our proprietary rights in our products.
We incorporate free and open source licensed software into our products. Although we monitor our use of such open source software closely, the terms of many open source licenses have not been interpreted by U.S. courts, and there is a risk that such licenses could be construed in a manner that could impose unanticipated conditions or restrictions on our ability to commercialize our products. In addition, non-compliance with open source software license terms and conditions could subject us to potential liability, including intellectual property infringement and/or contractual claims. In such event, we could be required to seek licenses from third parties in order to continue offering our products, to re-engineer our products or to discontinue the sale of our products in the event re-engineering cannot be accomplished in a timely manner, any of which could adversely affect our business, operating results and financial condition.
Governmental Regulations
Environmental Laws and Regulations. We are committed to maintaining compliance with all environmental laws and regulations applicable to our operations, products and services. Our business and operations are subject to various federal, state, local and foreign laws and regulations that have been adopted with respect to the environment, including the Waste Electrical and Electronic Equipment Directive ("WEEE"), Directive on the Restriction of the Use of Certain Hazardous Substances in Electrical and Electronic Equipment ("RoHS"), and Registration, Evaluation, Authorization, and Restriction of Chemicals ("REACH") regulations adopted by the European Union. Environmental regulation is increasing and we expect that our operations will be subject to additional environmental compliance requirements, which may expose us to additional costs. We are also subject to disclosure requirements related to the presence of “conflict minerals” in our products. To date, our compliance costs relating to environmental regulations have not resulted in a material adverse effect on our business, results of operations or financial condition.
Other Laws and Regulations. We are subject to U.S. and foreign laws and regulations across the jurisdictions in which we operate. In addition to the environmental laws and regulations discussed above, we are subject to laws and regulations addressing the telecommunications industry, cybersecurity, privacy and data protection, export and import control, trade sanctions, and anti-bribery and anti-corruption. To date, our compliance costs relating to these laws and regulations have not resulted in a material adverse effect on our business, operating results or financial condition.
For further discussion of risks associated with these governmental laws and regulations, see Part I, Item 1A, “Risk Factors – Legal and Regulatory Risk Factors.”
Information about our Executive Officers
Our executive officers and their ages and positions as of December 30, 2023, are set forth below:
| | | | | | | | | | | |
| Name | Age | | Position |
| David W. Heard | 55 | | Chief Executive Officer and Director |
| Nancy L. Erba | 57 | | Chief Financial Officer |
| David L. Teichmann | 67 | | Chief Legal Officer and Corporate Secretary |
| Nicholas R. Walden | 52 | | Senior Vice President, Worldwide Sales |
David W. Heard has served as our Chief Executive Officer and has been a member of our Board of Directors since November 2020. Mr. Heard served as our Chief Operating Officer from October 2018 to November 2020. Mr. Heard previously served as our General Manager, Products and Solutions, from June 2017 to October 2018. Prior to joining us, Mr. Heard served as a private consultant from 2015 to June 2017. From 2010 to 2015, Mr. Heard served as President of Network and Service Enablement at JDS Uniphase. From 2007 to 2010, Mr. Heard served as Chief Operating Officer at BigBand Networks (now part of Arris). From 2004 to 2006, Mr. Heard served as President and Chief Executive Officer at Somera (now part of Jabil). From 2003 to 2004, Mr. Heard served as President and General Manager Switching Division at Tekelec (now part of Oracle). From 1995 to 2003, Mr. Heard served in a number of leadership roles at Santera Systems Spatial Networks and at Lucent Technologies (both now part of Nokia). Mr. Heard holds an M.B.A. from the University of Dayton, an M.S. in management from Stanford Graduate School of Business, where he was a Sloan Fellow, and a B.A. in production and operations management from Ohio State University.
Nancy L. Erba has served as our Chief Financial Officer since August 2019 after joining us as Senior Vice President, Strategic Finance earlier in the same month. Prior to joining us, from September 2016 to March 2019, Ms. Erba served as Chief Financial Officer of Immersion Corporation, a leader in touch feedback technology. From February 2015 to October 2015, Ms. Erba was Vice President, Financial Planning and Analysis of Seagate Technology plc, a data storage company. Prior executive roles at Seagate Technology include Division CFO and Vice President of Finance for Strategic Growth Initiatives from 2013 to 2015; Vice President, Business Operations and Planning from 2009 to 2013; Division CFO and Vice President of Finance of the Consumer Solutions Division from 2008 to 2009; and Vice President, Corporate Development from 2006 to 2008. Ms. Erba currently serves on the board of directors of PDF Solutions, Inc., a software and engineering services company. Ms. Erba holds an M.B.A. from Baylor University and a B.A. in mathematics from Smith College.
David L. Teichmann has served as our Chief Legal Officer and Secretary since April 2019. Prior to joining us, Mr. Teichmann served as Executive Vice President, General Counsel and Corporate Secretary of Oclaro, Inc., a maker of optical components and modules for the long-haul, metro and data center markets, from January 2014 until its acquisition by Lumentum in December 2018. From 2007 to 2012, he served as the Executive Vice President, General Counsel and Corporate Secretary of Trident Microsystems, Inc., a public fabless semiconductor company that sold television and set top box integrated circuits. From August 1998 to February 2006, he served as the Senior Vice President, General Counsel and Secretary of GoRemote Internet Communications, Inc., a secure managed global remote access solutions provider, guiding the company through its initial public offering in 1999 and its acquisition by iPass, Inc. in 2006. Mr. Teichmann held various senior legal counsel positions from 1989 to 1998 handling legal matters in Europe, Asia Pacific, Latin America and Canada and began his career with the Fenwick & West law firm. Mr. Teichmann holds a J.D. from the William S. Richardson School of Law at the University of Hawaii, an M.A. in law and diplomacy from the Fletcher School of Law and Diplomacy, and a B.A. in political science from Trinity College.
Nicholas R. Walden has served as our Senior Vice President, Worldwide Sales since January 2020. Mr. Walden served as Senior Vice President, Strategic Accounts from January 2019 to January 2020. He served as Senior Vice President, EMEA Sales from September 2015 to January 2019. Prior to joining us, Mr. Walden served in a variety of senior sales roles at Ciena Corporation from 1999 to 2015, most recently as its Vice President and Managing Director, Regional Carrier Business, EMEA. Mr. Walden studied HVAC Mechanical Engineering at the College of Technology at Reading, Berkshire, United Kingdom.
Available Information
We may use our website (http://www.infinera.com), press releases, public conference calls and public webcasts as means of disclosing material non-public information and for complying with our disclosure obligations under Regulation FD. Information contained on our website or any website referred to in this Form 10-K is not incorporated by reference unless expressly noted. We file reports with the Securities and Exchange Commission (“SEC”), which we make available on our website free of charge. These reports include Annual Reports on Form 10-K, Quarterly Reports on Form 10-Q, Current Reports on Form 8-K and amendments to such reports, each of which is provided on our website as soon as reasonably practicable after we electronically file such materials with or furnish them to the SEC. The SEC also maintains a website that contains our SEC filings. The address of the SEC website is https://www.sec.gov.
ITEM 1A. RISK FACTORS
Investing in our securities involves a high degree of risk. A description of the risks and uncertainties associated with our business is set forth below. These risks, together with many other factors described in this report and in our other public filings, and additional risks and uncertainties not currently known to us or that we currently deem to be immaterial, could adversely affect our operations, performance and financial condition. Our actual results could differ materially from our forward-looking statements.
Risk Factors Summary
The following is a summary of the principal risks that could adversely affect our business, operations and financial results.
Business and Operational Risk Factors
•Our quarterly results may vary significantly from period to period.
•Our ability to increase our revenue will depend upon continued demand growth for additional network capacity and on the level and timing of customer capital spending.
•Any delays in the development, introduction or acceptance of our new products or in releasing enhancements to our existing products may harm our business.
•Aggressive business tactics by our competitors and new entrants may harm our business.
•The markets in which we compete are highly competitive and we may be unable to compete effectively.
•Supply chain and logistics issues, including delays, shortages, longer lead times, unfavorable contractual terms, components that have been discontinued and increased costs, and our dependency on sole source, limited source or high-cost suppliers, could harm our business and operating results.
•We are dependent on a small number of key customers for a significant portion of our revenue.
•Product performance problems, deployment delays and product security vulnerabilities could harm our business and reputation.
•The manufacturing process for our optical engine and the assembly of our products are very complex.
•If we lose key personnel or fail to attract qualified personnel, our business may be harmed.
•If our contract manufacturers do not perform as we expect, our business may be harmed.
•Increased consolidation among our customers and suppliers in the communications networking industry has had, and could continue to have, an adverse effect on our business and results of operations.
•We rely on various third-party service partners to help complement our global operations.
•We must respond to rapid technological change for our products to be successful.
•Failure to accurately forecast manufacturing requirements or customer demand could incur additional costs.
•Actions that we are taking or may in the future take to restructure or streamline our business may not be as effective as anticipated and may have negative consequences.
•Our large customers have substantial negotiating leverage, which may harm our results of operations.
•Our sales cycle can be long and unpredictable, which could result in unexpected revenue shortfalls.
•The effects of public health emergencies could have a material adverse effect on our business, manufacturing operations and results of operations.
•Any acquisitions or strategic transactions that we undertake could disrupt our business and harm our financial condition and operations.
Financial and Macroeconomic Risk Factors
•We may be unable to generate the cash flow necessary to make anticipated capital expenditures, service our debt or grow our business.
•Unfavorable macroeconomic and market conditions may adversely affect our financial results.
•Inflation may increase our costs beyond what we can recover through price increases.
•If we need additional capital in the future, it may not be available to us on favorable terms, or at all.
•Our Loan Agreement and any other credit or similar agreements into which we may enter in the future may restrict our operations.
•Our debt obligations may adversely affect our ability to raise additional capital and will be a burden on our future cash resources.
•Our international sales and operations subject us to additional risks.
•We may be adversely affected by fluctuations in currency exchange rates.
•Our effective tax rate may increase or fluctuate, which could increase our income tax expense and reduce our net income.
•We may issue additional shares of our common stock in connection with conversions of the 2024 Notes, the 2027 Notes and the 2028 Notes (as defined below).
•The fundamental change provisions of the 2024 Notes, the 2027 Notes and the 2028 Notes may delay or prevent an otherwise beneficial takeover attempt of us.
•The Capped Calls (as defined below) may affect the value of the 2024 Notes and our common stock.
•We are subject to counterparty risk with respect to the Capped Calls.
Legal and Regulatory Risk Factors
•If we fail to protect our intellectual property rights, our competitive position could be harmed, or we could incur significant expense to enforce our rights.
•Claims by others that we infringe their intellectual property rights could harm our business.
•Security incidents, such as data breaches and cyber-attacks, could cause significant damage to our business and reputation.
•If we fail to remediate our material weaknesses or discover additional weaknesses or otherwise fail to maintain an effective system of internal controls, the accuracy and timing of our financial reporting may be adversely affected.
•We are subject to various governmental export control, trade sanctions and import laws and regulations that could impair our ability to compete in international markets or subject us to liability.
•We are subject to environmental regulations that could adversely affect our business.
•Regulations relating to environmental, social and governance matters, as well as customer, supplier, investor or other stakeholder demands, may add operational complexity for us.
•We are subject to global data privacy and data protection laws and regulations that could adversely affect our business or subject us to liability.
•A portion of our revenue is generated by sales to government entities, which are subject to a number of uncertainties, challenges and risks.
•Our business could be adversely affected if we cannot obtain and maintain required security clearances, or we do not comply with obligations regarding the safeguarding of classified information.
•Failure to comply with anti-bribery and similar laws could subject us to adverse consequences.
General Risk Factors
•The trading price of our common stock has been volatile and is likely to be volatile in the future.
•Future sales of our common stock could cause our stock price to fall.
•Anti-takeover provisions in our charter documents and Delaware law could discourage, delay or prevent a change in control of our company and may affect the trading price of our common stock.
•Exclusive forum provisions in our bylaws will restrict our stockholders’ ability to choose the judicial forum for disputes with us or our directors, officers or employees.
•Events that are outside of our control, such as natural disasters, terrorist attacks, wars and armed conflicts, such as between Russia and Ukraine and Israel and Hamas, or other catastrophic events, could harm our operations.
For a more complete discussion of the material risks facing our business, see below.
Business and Operational Risk Factors
Our quarterly results may vary significantly from period to period, which could make our future results difficult to predict and could cause our operating results to fall below investor, analyst or our expectations.
Our quarterly results and, in particular, our revenue, gross margins, operating expenses, operating margins and net income (loss), have historically varied significantly from period to period and may continue to do so in the future. As a result, comparing our operating results on a period-to-period basis may not be meaningful. Our budgeted expense levels are based, in large part, on our expectations of future revenue and the development efforts associated with that future revenue. Consequently, if our revenue does not meet projected levels in the short term, our inventory levels, cost of goods sold and operating expenses would be high relative to revenue, resulting in potential operating losses. If our revenue or operating results do not meet the expectations of investors or securities analysts or fall below any guidance we provide to the market, the price of our common stock may decline substantially.
Factors that may contribute to fluctuations in our quarterly results, many of which are outside our control and may be difficult to predict, include:
•fluctuations in demand, sales cycles and prices for products and services, including discounts given in response to competitive pricing pressures or to secure long-term customer relationships, as well as the timing of purchases by our key customers;
•changes in customers’ budgets for optical transport network purchases and changes or variability in their purchasing cycles;
•the timing, market acceptance and rate of adoption of our new product releases and our competitors' new product releases;
•the price, quality, lead times, timing of delivery and availability of key components from suppliers, including any price or shipping cost increases or delays in the supply of components that may result from supply disruptions as well as impacts due to consolidations amongst our suppliers;
•fluctuations in our customer, product or geographic mix, including the impact of new customer deployments, which typically carry lower gross margins, customer consolidation, which may affect our ability to grow revenue, and products powered by our next-generation technologies, which initially tend to be lower margin due to higher per unit production costs and may have greater variability in production yields;
•our ability to manage manufacturing costs, maintain or improve quality, and increase volumes and yields on products manufactured in our internal manufacturing facilities;
•our ability to manage inventory while timely meeting customer demand and avoiding charges for excess or obsolete inventory;
•our ability to control costs, including our operating expenses, the costs and availability of components and materials we purchase for our products and our capital expenditures;
•our ability to successfully restructure or transform our operations within our anticipated time frame and realize our anticipated savings;
•order cancellations or reductions or delays in delivery schedules by our customers;
•any significant changes in the competitive dynamics of the markets we serve, including any new entrants, new technologies, or customer or competitor consolidation, as well as aggressive pricing tactics by our competitors;
•any delay in collecting or failure to collect accounts receivable;
•readiness of customers for installation of our products, which has been impacted by the budget constraints and personnel availability of our customers;
•the timing of revenue recognition and revenue deferrals;
•any future changes in U.S. GAAP or new interpretations of existing accounting rules;
•the impact of a significant natural disaster or public health emergency, as well as interruptions or shortages in the supply of utilities such as water and electricity, in a key location such as our Northern California facilities, which are located near major earthquake fault lines, in areas of high fire risk and in a designated flood zone; and
•general economic, market and political conditions in domestic and international markets, including those related to any policy changes by the federal government or by the presidential administration in the U.S., and other factors beyond our control, including the ongoing effects of continuing inflation and high interest rates.
Our ability to increase our revenue will depend upon continued growth of demand by consumers and businesses for additional network capacity, on the level and timing of capital spending by our customers, and on the continued demand for our services support.
Our future success depends on factors that increase the amount of data transmitted over communications networks and the growth of optical transport networks to meet the increased demand for optical capacity. These factors include the growth of mobile, video and cloud-based services, increased broadband connectivity and the continuing adoption of high-capacity, revenue-generating services. If demand for such bandwidth does not continue, or slows down, the market for optical transport networking equipment may not continue to grow and our product sales would be negatively impacted.
In addition, demand for our products depends on the level and timing of capital spending in optical networks by service providers as they construct, expand and upgrade the capacity of their optical networks. Capital spending is cyclical in our industry and spending by customers can change on short notice. Customer demand is dependent in part on the level of inventory held by customers and, to the extent that such inventory levels have been or will be built up by customers to address global supply issues or otherwise, overall customer demand may be dampened in subsequent periods until the level of inventory held by such customers returns to more normalized levels. Any future decisions by our customers to reduce capital spending, whether caused by lower customer demand, weakening economic conditions, high borrowing costs, inflation, customer-specific supply chain issues, changes in government regulations relating to telecommunications and data networks, or other reasons, could have a material adverse effect on our business, financial condition and results of operations.
Revenue we receive for our services offerings is highly dependent on product sales and the implementation processes of our customers. If our customers have internal services teams or if our products such as our pluggables do not otherwise require our services support, our revenue related to services and our related gross margins may be impacted and our results of operations may be harmed.
Any delays in the development, introduction or acceptance of our new products or in releasing enhancements to our existing products may harm our business.
Our products are based on complex technologies, including, in many cases, the development of next-generation PICs, DSPs and specialized ASICs, each of which are key components of our optical engines. In addition, we may also depend on technologies from outside suppliers, all of which may cause us to experience unanticipated delays in developing, improving, manufacturing or deploying our products. The development process for our optical engines is lengthy, and any modifications entail significant development cost and risks.
At any given time, various new product introductions and enhancements to our existing products are in the development phase and are not yet ready for commercial manufacturing or deployment. We rely on third parties, some of which are relatively early-stage companies, to develop, manufacture and deliver components for our next-generation products, which can often require custom development. The development process from laboratory prototype to customer trials, and subsequently to general availability, involves a significant number of simultaneous efforts. These efforts often must be completed in a timely and coordinated manner so that they may be incorporated into the product development cycle for our systems, and include:
•completion of product development, including the development and completion of our next-generation optical engines, and the completion of associated module development;
•the qualification and multiple sourcing of critical components;
•validation of manufacturing methods and processes;
•extensive quality assurance and reliability testing and staffing of testing infrastructure;
•validation of software; and
•establishment of systems integration and systems test validation requirements.
Each of these steps, in turn, presents risks of failure, rework or delay, any one of which could decrease the speed and scope of product introduction and marketplace acceptance of our products. New generations of our optical engines as well as intensive software testing are important to the timely introduction of new products and enhancements to our existing products, which are subject to these development risks. In addition, unexpected intellectual property disputes, inability to obtain licenses to utilize third party development tools or other intellectual property on commercially acceptable terms, failure of critical design elements, limited or constrained engineering resources, changes in product designs and a host of other development execution risks may delay, or even prevent, the introduction of new products or enhancements to our existing products. If we have longer development lead times than our competitors for comparable products, or if we do not develop and successfully introduce or enhance products ahead of our competitors or in a timely manner, including the successful development of our next generation optical engine, our competitive position will suffer.
As we transition customers to new products and technologies, we face significant risk that our new products or technologies may not be accepted by our current or new customers. To the extent that we fail to introduce new and innovative products and technologies that are adopted by customers, we could fail to obtain an adequate return on these investments and could lose market share to our competitors, which could be difficult or impossible to regain. Similarly, we may face decreased revenue, gross margins and profitability due to a rapid decline in sales of current products as customers hold spending to focus purchases on new product platforms. In addition, the sale of new products and technologies may result in the cannibalization of sales for existing products, which may harm our results of operations. We could also incur significant costs in completing the transition, including costs of inventory write-downs of the current product as customers transition to new product platforms. In addition, products or technologies developed by others may render our products noncompetitive or obsolete and result in significant reduction in orders from our customers and the loss of existing and prospective customers. Any delays in the introduction of new components that we are developing for use in our other products as part of our vertical integration strategy may also prevent us from realizing the anticipated cost savings of such development. This may negatively impact our gross margins and harm our business and operating results.
Aggressive business tactics by our competitors and new entrants may harm our business.
The markets that we compete in are extremely competitive, which often results in aggressive business tactics by our competitors and new entrants, including:
•aggressively pricing their optical transport products and other portfolio products, including offering significant one-time discounts and guaranteed future price decreases;
•offering optical products at a substantial discount or for free when bundled together with broader technology purchases, such as router or wireless equipment purchases;
•marketing product availability on aggressive timelines to influence customer purchasing decisions;
•providing financing, marketing and advertising assistance to customers; and
•influencing customer requirements to emphasize different product capabilities, which better suit their products.
The level of competition and pricing pressure tend to increase when competing for large or high-profile opportunities or during periods of economic weakness when there are fewer network build-out projects. If we fail to compete successfully against our current and future competitors, or if our current or future competitors continue or expand their aggressive business tactics, including those described above, demand for our products could decline, we could experience delays or cancellations of customer orders or we could be required to reduce our prices to compete in the market.
The markets in which we compete are highly competitive and we may not be able to compete effectively.
The optical networking equipment market is competitive. Our main competitors in the optical transport systems market include dense wavelength division multiplexing system suppliers, such as ADTRAN, Ciena Corporation, Cisco Systems, Fujitsu, Huawei, Nokia, Ribbon Communications and ZTE. Competition in the optical subsystems and pluggable optics market includes, but is not limited to, Cisco (via their acquisition of Acacia), Lumentum, Marvell and Coherent, as well as a wide range of China-based suppliers. Moreover, other companies have developed, or may in the future develop, products that are or could be competitive with our products. We also could encounter competitor consolidation in the markets in which we compete, which could lead to a changing competitive landscape, capabilities and market share, and could impact our results of operations.
Competition in the markets we serve is based on any one or a combination of the following factors:
•the ability of products and services to meet customers’ immediate and future network requirements;
•price and other commercial terms;
•optical reach and capacity performance;
•features and functionality;
•the availability of components required to manufacture key products;
•existing business and customer relationships;
•power consumption, heat dissipation, form factor and density;
•installation and operational simplicity;
•network and service manageability;
•quality and reliability;
•service and support;
•security and encryption requirements;
•scalability and investment protection; and
•product availability and lead times.
Some of our competitors have substantially greater name recognition and technical, financial, sales and marketing resources. Many of our competitors have more resources and more experience in developing or acquiring new products and technologies, customizing product features specific to certain geographic requirements and in creating market awareness for those products and technologies. In addition, many of our competitors have the financial resources to offer competitive products at aggressive pricing levels or have the ability to provide financing to customers, which could prevent us from competing effectively. Further, many of our competitors have built long-standing relationships with some of our prospective and existing customers and could, therefore, have an inherent advantage in selling products to those customers.
We also compete with low-cost producers that may increase pricing pressure on us and with a number of smaller companies that provide competition for a specific product, customer segment or geographic market. In addition, we may also face increased competition from system and component companies that develop products based on off-the-shelf hardware that offers the latest commercially available technologies. Due to the narrower focus of their efforts, these competitors may achieve commercial availability of their products more quickly than we can and may provide attractive alternatives to our customers.
Supply chain and logistics issues, including delays, shortages, longer than normal lead times, unfavorable contractual terms, components that have been discontinued and increased costs, and our dependency on sole source, limited source or high-cost suppliers, could harm our business and operating results.
We are reliant on our global supply chain for the production of components for our products. For example, the global supply chain has experienced disruptions beginning in 2020 as a result of the COVID-19 pandemic, leading to delays, shortages, longer than normal lead times, unfavorable contractual terms relating to refundability and cancellation, discontinued components and increased costs. These supply disruptions have negatively impacted our revenue and our results of operations. For example, shortages of and longer lead times for certain key components have adversely affected our ability to deliver products to customers in a timely manner. Additionally, price increases within our supply chain have continued to negatively affect our gross margin. We cannot predict with certainty the scope, magnitude or duration of the impact that these supply chain disruptions will have on our business and results of operations. Any efforts that we make to mitigate supply chain issues, such as by making additional or long-term purchase commitments with our suppliers or by holding higher levels of inventory, could negatively impact our cash flow and financial results if we do not accurately forecast customer demand or if our customers change their purchasing patterns in response to the evolving supply chain environment. Further, the lead times required for these mitigation efforts may not allow us to take advantage of market price decreases or meet increased customer demand in a timely manner.
We currently purchase several key components for our products from sole or limited sources. In particular, we rely on our own production of certain components of our products, such as PICs, and on third parties, including sole source and limited source suppliers, for certain of the components of our products, including ASICs, field-programmable gate arrays, processors, and other semiconductor and optical components. We have increased our reliance on third parties to develop and manufacture components for certain products, some of which require custom development. We purchase most of these components on a purchase order basis and generally only have long-term contracts with these sole source or limited source suppliers. If any of our sole source or limited source suppliers suffer from capacity constraints, materials shortages, lower than expected yields, deployment delays, geopolitical-related disruptions, work stoppages or any other reduction or disruption in output, they may be unable to meet our delivery schedule, which could result in lost revenue, additional product costs and deployment delays that could harm our business and customer relationships. In addition, these same suppliers may decide to no longer manufacture or support specific components necessary for some of our legacy products, which could lead to our inability to fulfill demand without increased engineering and material costs necessary to replace such components or cause us to transition such products to end-of-life status sooner than planned. Further, our suppliers could enter into exclusive arrangements with our competitors, refuse to sell their products or components to us at commercially reasonable prices or at all, go out of business or discontinue their relationships with us. If any of these developments were to occur, we may be unable to develop alternative sources for these components within a suitable time frame to be able to operate our business, or at all.
The loss of a source of supply, or lack of sufficient availability of key components, could require us to redesign products that use such components, which could result in lost revenue, additional product and engineering costs and deployment delays that could harm our business and customer relationships. Due to cross dependencies, any supply chain disruptions could negatively impact the demand for our products in the short term. In addition, if our contract manufacturers do not receive critical components in a timely manner to build our products, then we would not be able to ship certain products in a timely manner and would, therefore, be unable to meet our prospective customers’ product delivery requirements. In the past, we have experienced delivery delays because of lack of availability of components or reliability issues with components that we were purchasing. In addition, some of our suppliers have gone out of business, merged with other suppliers, or limited their supply of components to us, which may cause us to experience longer than normal lead times, supply delays and increased prices. We may in the future experience a shortage of certain components as a result of our own manufacturing issues, manufacturing issues at our suppliers or contract manufacturers, capacity problems experienced by our suppliers or contract manufacturers, strong demand in the industry for such components, or other disruptions in our supply chain. For example, during 2022, several of our materials suppliers with manufacturing facilities near Shanghai, China were affected by COVID-19-related quarantines, which have since been lifted. At certain times, these quarantines led to delayed shipments to certain of our contract manufacturers, which subsequently constrained the ability of these contract manufacturers to supply certain components to us on a timely basis. Disruptions to global macroeconomic conditions may also make it more difficult for us and our suppliers to accurately project overall component demand and manufacturing capacity. These supplier disruptions may continue to occur in the future, which could limit our ability to produce our products and cause us to fail to meet a customer’s delivery requirements. Any failure to meet our customers’ product delivery requirements could harm our reputation and our customer relationships, either of which would harm our business and operating results.
We are dependent on a small number of key customers for a significant portion of our revenue from period to period and the loss of, or a significant reduction in, orders from one or more of our key customers would reduce our revenue and harm our operating results.
A relatively small number of customers accounts for a large percentage of our revenue from period to period. For example, for the year ended December 30, 2023, our top ten end-customers accounted for approximately 52% of our total revenue and one end-customer accounted for 10% of our total revenue. For 2022, our top ten end-customers accounted for approximately 48% of our total revenue and one end-customer accounted for 11% of our total revenue. For 2021, our top ten end-customers accounted for approximately 42% of our total revenue and no end-customer accounted for 10% or more of our revenue.
Our business will likely be harmed if any of our key customers, for whatever reason, substantially reduce, delay or stop their orders from us. In addition, our business will be harmed if we fail to maintain our competitive advantage with our key customers or do not add new large and medium customers over time. We continue to expect a relatively small number of customers to continue to account for a large percentage of revenue from period to period. However, customer consolidation could reduce the number of key customers that generate a significant percentage of our revenue and may increase the risks relating to dependence on a small number of customers.
Our ability to continue to generate revenue from our key customers will depend on our ability to maintain strong relationships with these customers and introduce competitive new products at competitive prices. In most cases, our sales are made to these customers pursuant to standard purchase agreements, which may be canceled or reduced readily, rather than long-term purchase commitments that would require these customers to purchase any minimum or guaranteed volumes orders. In the event of a cancellation or reduction of an order, we may not have enough time to reduce operating expenses to minimize the effect of the lost revenue on our business. Our operating results will continue to depend on our ability to sell our products to our key customers. In addition, we must regularly compete for and win business with existing and new customers across all of our customer segments.
In addition, global economic conditions may affect the network spending, procurement strategies, or business practices of our key customers. If any of our key customers experience a loss in revenue due to weakening economic conditions, their corporate borrowing costs being materially impacted by high interest rates, or other adverse occurrences, they may reduce or delay capital spending generally or with respect to our products, which could materially adversely affect our business and results of operations.
Product performance problems, including undetected errors in our hardware or software, or deployment delays, and product security vulnerabilities, could harm our business, results of operations and reputation.
The development and production of products with high technology content is complicated and often involves problems with hardware, software, components and manufacturing methods. Complex hardware and software systems that are built with and include increasingly sophisticated technology, such as our products, can often contain undetected errors or bugs when first introduced or as new versions are released. In addition, errors associated with components we purchase from third parties, including customized components, may be difficult to resolve. We have experienced issues in the past in connection with our products, including failures due to the receipt of components from our suppliers that are either faulty or do not meet our product specifications, and performance issues related to software updates. From time to time, we have had to replace certain components or provide software remedies or other remediation in response to errors or bugs, and we may have to do so again in the future. In addition, performance issues can be heightened during periods where we are developing and introducing multiple new products to the market, as any performance issues we encounter in one technology or product could impact the performance or timing of delivery of other products. Our products may also suffer degradation of performance and reliability over time.
If reliability, quality, security or network monitoring problems develop, a number of negative effects on our business could result, including:
•reduced orders from existing customers;
•declining interest from potential customers;
•delays in our ability to recognize revenue or in collecting accounts receivables;
•increased costs associated with fixing hardware or software defects or replacing products;
•high service and warranty expenses;
•delays in shipments;
•high inventory excess and obsolescence expense;
•high levels of product returns;
•diversion of our engineering personnel from our product development efforts; and
•payment of liquidated damages, performance guarantees or similar penalties.
Because we outsource the manufacturing of certain components of our products, we may also be subject to product performance problems as a result of the acts or omissions of third parties, and we may not have adequate compensating remedies against such third parties or otherwise implement effective measures to mitigate such problems.
From time to time, we encounter interruptions or delays in the activation of our products at a customer’s site. These interruptions or delays may result from product performance problems or from issues with installation and activation, some of which are outside our control, such as supply chain disruptions affecting our customers or us. For example, in 2022, we experienced project delays due to incomplete customer readiness and the unavailability of certain customer resources and customer furnished prerequisites required for project implementation. If we experience significant interruptions or delays that we cannot promptly resolve, the associated revenue for these installations may be delayed.
In addition, our products are subject to security vulnerabilities and attempts by third parties to identify additional vulnerabilities. Such vulnerabilities are not always mitigated before they become known by us, our customers or the users of our products. Mitigation techniques designed to address security vulnerabilities in our products, including software and firmware updates or other preventative measures, are not always available on a timely basis - or at all - and at times do not operate as intended or effectively resolve vulnerabilities. Security vulnerabilities and any limitations or adverse effects of mitigation techniques may result in warranty or other claims, litigation, or regulatory actions, and may adversely affect our results of operations, financial condition, customer relationships, prospects, and reputation in a number of ways, any of which may be material.
The manufacturing process for our optical engine and the assembly of our finished products are complex. The partial or complete loss of any of our manufacturing facilities, a reduction in yields of our PICs or an inability to scale capacity to meet customer demands could harm our business.
The manufacturing process for our optical engine, including the PICs, DSPs and specialized ASICs, and the assembly of our finished products are complex. In the event that any of our manufacturing facilities utilized to build these components and assemble our finished products was fully or partially destroyed, or shut down, as a result of a natural disaster, work stoppage or otherwise, it could severely limit our ability to deliver and sell our products or support new product development. Because of the complex nature of our manufacturing facilities, such loss would take a considerable amount of time to repair or replace. The partial or complete loss of any of our manufacturing facilities, or an event causing the interruption in our use of any such facilities, whether as a result of a natural disaster, a public health crisis, work stoppage or otherwise, for any extended period of time, could cause our business, financial condition and results of operations to be harmed.
Minor deviations in the PIC manufacturing process can cause substantial decreases in yields and, in some cases, cause production to be suspended. In the past, we have had significant variances in our PIC yields, including production interruptions and suspensions, and may in the future have continued yield variances, including additional interruptions or suspensions. Lower than expected yields from our PIC manufacturing process or defects, integration issues or other performance problems in our products could limit our ability to satisfy customer demand requirements and could damage customer relations and harm our business, reputation and operating results.
Our inability to obtain sufficient manufacturing capacity to meet demand, either in our own facilities or through foundry or similar arrangements with third parties, could also harm our relationships with our customers, our business and our results of operations. Additionally, if we are unable to fully utilize our own manufacturing facilities, this may also reduce our efficiency and lower our gross margins.
If we lose key personnel or fail to attract, upskill and retain qualified personnel when needed, our business may be harmed.
Our success depends to a significant degree upon the continued contributions of our key management, engineering, sales and marketing, and finance personnel, many of whom will be approaching retirement age in the next decade and many of whom would be difficult to replace. For example, senior members of our engineering team have unique technical experience that would be difficult to replace. Because our products are complex, we must also hire and retain highly trained customer service and support personnel to ensure that the deployment of our products does not result in network disruption for our customers. We believe our future success will depend in large part upon our ability to identify, attract, upskill and retain highly skilled and diverse personnel, and competition for these individuals is intense in our industry, especially in the San Francisco Bay Area where we are headquartered and, increasingly, in certain cities and regions where we have operations outside the U.S. as well. The loss of the services of any of our key personnel, the inability to identify, attract or retain qualified personnel in the future or delays in hiring qualified personnel, particularly engineers and sales personnel, could make it difficult for us to manage our business and meet key objectives, such as timely product introductions. These risks may be exacerbated due to a strong labor market with a competitive wage environment and attrition or a decline in the pool of available talent. In addition, we do not have long-term employment contracts or key person life insurance covering any of our key personnel. If we are unable to identify, attract and retain qualified personnel, we may be unable to manage our business effectively, and our results of operations could suffer.
If our contract manufacturers do not perform as we expect, our business may be harmed.
We rely on third-party contract manufacturers to perform a portion of the manufacturing of our products, and our future success will depend on our ability to have sufficient volumes of our products manufactured in a cost-effective and quality-controlled manner. We have engaged third parties to manufacture certain elements of our products at multiple contract manufacturing sites located around the world but do not have long-term agreements in place with some of our manufacturers and suppliers that would guarantee product availability, or the continuation of particular pricing or payment terms. We face a number of risks due to our dependence on contract manufacturers, including:
•reduced control over delivery schedules, particularly for international contract manufacturing sites;
•risks related to dependency on certain contract manufacturers;
•reliance on the quality assurance procedures of third parties;
•potential uncertainty regarding manufacturing yields and costs;
•potential lack of adequate capacity during periods of high demand or inability to fulfill manufacturing orders due to supply issues;
•potential variability of pricing or payment terms due to agreement length;
•risks and uncertainties associated with the locations or countries where our products are manufactured or otherwise operate, including potential disruptions caused by geopolitical events, military actions, work stoppages or other social factors, natural disasters, environmental factors, or public health emergencies;
•counterparty risk, particularly if our contract manufacturers are sensitive to inflation and interest-rate risk;
•limited warranties on components; and
•potential misappropriation of our intellectual property.
Any of these risks could impair our ability to fulfill orders. Our products are built with and incorporate increasingly sophisticated technology and any delays by our contract manufacturers or their inability to meet our product specifications or quality standards may cause us to be unable to meet the delivery requirements of our customers, which could decrease customer satisfaction and harm our product sales. In addition, if our contract manufacturers are unable or unwilling to continue manufacturing our products or components of our products in required volumes or our relationship with any of our contract manufacturers is discontinued for any reason, we would be required to identify and qualify alternative manufacturers, which could cause us to be unable to meet our supply requirements to our customers and result in the breach of our customer agreements. Qualifying a new contract manufacturer and commencing volume production is expensive and time-consuming. If we are required to change or qualify a new contract manufacturer, we could lose revenue and damage our customer relationships.
Increased consolidation among our customers and suppliers in the communications networking industry has had, and could continue to have, an adverse effect on our business and results of operations.
We have seen increased consolidation in the communications networking industry over the past few years, which has adversely affected our business and results of operations. Customer consolidation in the past has led to changes in buying patterns, slowdowns in spending, redeployment of existing equipment and re-architecture of parts of existing networks or future networks, as the combined companies evaluate the needs of the combined business. Moreover, the significant purchasing power of these large companies can increase pricing and competitive pressures for us, including the potential for decreases in our average selling prices. If one of our customers is acquired by another company that does not rely on us to provide it with products or relies on another provider of similar products, we may lose that customer’s business. Such consolidation may further reduce the number of customers that generate a significant percentage of our revenue and may exacerbate the risks relating to dependence on a small number of customers. Any of the foregoing results will adversely affect our business, financial condition and results of operations.
In addition, our suppliers in the communications networking industry have recently continued to consolidate. For example, II-VI acquired Coherent in 2022. Supplier consolidation may lead to increased prices of components for our products, deployment delays or a disruption in output. In addition, such consolidation may exacerbate the risks relating to our dependence on a small number of suppliers for certain components and materials that are required to manufacture our products.
We rely on various third-party service partners to help complement our global operations, and failure to adequately manage these relationships could adversely impact our financial results and relationships with customers.
We rely on a number of third-party service partners, both domestic and international, to complement our global operations. We rely upon these partners for certain installation, maintenance, logistics and support functions. Services provided by these partners typically relate to the design, construction and operation of customer networks. Over time, the scope of work performed by our service partners is likely to increasingly include areas where we have less experience providing or managing such services. We must successfully identify, assess, train and certify qualified service partners in order to ensure the proper installation, deployment and maintenance of our products. The vetting and certification of these partners, particularly outside the U.S., can be costly and time-consuming, and certain partners may not have the same operational history, financial resources and scale as we have. Additionally, certain service partners may provide similar services for other companies, including our competitors. We may not be able to manage our relationships with our service partners effectively, and we cannot be certain that they will be able to deliver services in the manner or time required, that we will be able to maintain the continuity of their services, or that they will adhere to our approach to ethical business practices. We may also be exposed to a number of risks or challenges relating to the performance of our service partners, including:
•delays in recognizing revenue;
•liability for injuries to persons, damage to property or other claims relating to the actions or omissions of our service partners;
•our services revenue and gross margin may be adversely affected; and
•our relationships with customers could suffer.
If we do not effectively manage our relationships with third-party service partners, or if they fail to perform the services we request in the manner or time required, our financial results and relationships with our customers could be adversely affected.
We must respond to rapid technological change and comply with evolving industry standards and requirements for our products to be successful.
The optical transport networking equipment market is characterized by rapid technological change, changes in customer requirements and evolving industry standards. We continually invest in research and development to sustain or enhance our existing products, but the introduction of new communications technologies and the emergence of new industry standards or requirements could render our products obsolete. Further, in developing our products, we have made, and will continue to make, assumptions with respect to which standards or requirements will be adopted by our customers and competitors. If the standards or requirements adopted by our prospective customers are different from those on which we have focused our efforts, market acceptance of our products would be reduced or delayed, and our business would be harmed. We are continuing to invest a significant portion of our research and development efforts in the development of our next-generation products. We expect our competitors will continue to improve the performance of their existing products and introduce new products and technologies and to influence customers’ buying criteria so as to emphasize product capabilities that we do not, or may not, possess. To be competitive, we must increase our understanding of competitive dynamics in our markets, better anticipate future customer requirements and continue to invest significant resources in research and development, sales and marketing, and customer support. The demand for investment resources may also increase as the technologies we develop and utilize become more complex and the skills required to undertake such development become more scarce and expensive to obtain. If we do not anticipate or meet these future customer requirements, including with respect to the energy efficiency of our products, and invest in the technologies, including artificial intelligence and machine learning, necessary to enable us to create, manufacture and sell the appropriate solutions on a timely basis, our competitive position and future sales may be limited, which would have an adverse effect on our business and financial condition. We may not have sufficient resources to undertake these investments and we may not be able to make the technological advances necessary to be competitive and successful in the markets we serve.
If we fail to accurately forecast our manufacturing requirements or customer demand, we could incur additional costs, including inventory write-downs or equipment write-offs, which would adversely affect our business and results of operations.
We generate forecasts of future demand for our products several months prior to the scheduled delivery to our prospective customers. This requires us to make significant investments before we know if corresponding revenue will be recognized. Lead times vary significantly for materials and components, including ASICs, that we need to order for the manufacture of our products and depend on factors such as the specific supplier, contract terms and demand for each component at a given time. In the past, we have experienced lengthened lead times for certain components, which makes forecasting more challenging. We may be required to purchase increased levels of such components to satisfy our delivery commitments to our customers as a result of longer lead times for components. In addition, we must manage our inventory to ensure we continue to meet our commitments as we introduce new products or make enhancements to our existing products.
If we overestimate market demand for our products, including as a result of customers changing the timing or volume of their purchases in response to the evolving supply chain environment or broader macroeconomic conditions, and, as a result, increase our inventory in anticipation of customer orders that do not materialize, we will have excess inventory. This could result in increased risk of obsolescence and significant inventory write-downs. If we underestimate demand for our products, we will have inadequate inventory, which could slow down or interrupt the manufacturing of our products, cause delays in shipments and our ability to recognize revenue, and result in potential loss of customers or orders to competitors. In addition, we may be unable to meet our supply commitments to customers, which could result in a loss of certain customer opportunities or a breach of our customer agreements.
Actions that we may in the future take to restructure or streamline our business to cut costs and align our operating structure with current or future opportunities may not be as effective as anticipated and may have negative consequences.
We have incurred, and may in the future incur, substantial costs in connection with restructuring plans. Although such restructuring initiatives may be taken to improve our operating efficiency and to reallocate resources to align more closely with our evolving business model and current and future opportunities, they may not result in the benefits we anticipate. We incur substantial costs to implement restructuring plans, and our restructuring activities, if any, may subject us to reputational and litigation risks. Our past restructuring plans do not provide any assurance that we will realize anticipated cost savings or other benefits from any restructuring plans we may implement. In addition, restructuring plans may have other consequences, such as attrition beyond any planned reductions in workforce or a negative effect on employee morale and productivity or our ability to attract highly skilled employees. Restructuring presents other potential significant risks such as the actual or perceived disruption of service or reduction in service standards to customers, loss of sales, the failure to preserve supplier relationships and diversion of management attention. In addition, as a result of any restructuring actions we may take, our ability to execute on product development, address key market opportunities or meet customer demand could be materially and adversely affected. Further, any anticipated benefits from any restructuring initiatives we may take may be realized later than expected or not at all, and the ongoing costs of implementing these measures, if any, may be greater than anticipated. As a result, current or future restructuring plans may affect our revenue and other operating results.
Our large customers have substantial negotiating leverage, which may cause us to agree to terms and conditions that result in lower average selling prices and potentially increased cost of sales leading to lower gross margin, each of which would harm our results of operations.
Many of our customers are large service providers and ICPs that have substantial purchasing power and leverage in negotiating contractual arrangements with us. In addition, customer consolidation in the past few years has created combined companies that are even larger and have greater negotiating leverage. Our customers have sought and may continue to seek advantageous pricing, payment and other commercial terms. This may further impact our profitability if we are unable to recover through price increases passed along to these customers additional costs we have incurred from inflationary pressures to the supply chain or shipping and freight. We have also occasionally agreed and may continue to agree to unfavorable commercial terms with these customers, including the potential of reducing the average selling price of our products, increasing cost of sales or agreeing to extended payment terms in response to these commercial requirements or competitive pricing pressures. Continued inflation could decrease the profitability of customer contracts, particularly those with extended payment terms, that are not indexed to inflation. If we are compelled to agree to disadvantageous terms and conditions, unable to comply with such terms and conditions, or unable to adapt our business model and operations to such terms and conditions, then our operating results will be negatively impacted.
Our sales cycle can be long and unpredictable, which could result in an unexpected revenue shortfall in any given quarter.
Our products can have a lengthy sales cycle, which can extend from six to twelve months and may take even longer for larger prospective customers. Our prospective customers conduct significant evaluation, testing, implementation and acceptance procedures before they purchase our products. We incur substantial sales and marketing expenses and expend significant management effort during this time, regardless of whether we make a sale. Supply chain disruptions have also at times lengthened, and may in the future lengthen, our sales cycle due to delays in the customer certification process for our products.
Because our sales cycle is long, we are likely to recognize higher inflation-related costs before recognizing the benefits of any price increases that we implement for our products. Moreover, the costs associated with our sales cycle may increase faster than our ability to increase prices. In addition, changes in regulatory requirements or uncertainty associated with the regulatory environment could delay or impede investment in network infrastructures and adversely affect our business, financial condition and results of operations.
Because the purchase of our equipment involves substantial cost, most of our customers wait to purchase our equipment until they are ready to deploy it in their network. As a result, it is difficult for us to accurately predict the timing of future purchases by our customers. In addition, product purchases are often subject to budget constraints, multiple approvals and unplanned administrative processing and other delays, including the need for the customer to obtain external financing. If sales expected from customers for a particular quarter are not realized in that quarter or at all, our revenue will be negatively impacted.
The effects of public health emergencies could have a material adverse effect on our business, manufacturing operations and results of operations.
The impact of public health emergencies on our business and results of operations in the future remains uncertain and is dependent in part on infection, morbidity and disability rates, the emergence of new viruses, the continued effectiveness and availability of vaccinations, and broader global macroeconomic developments. During the COVID-19 pandemic, we at times temporarily closed or substantially limited the presence of personnel in some of our offices, implemented travel restrictions and modified our participation in various industry events. The COVID-19 pandemic also at times contributed to delays in certain operational processes, and it led to disruption and delays in our global supply chain and manufacturing operations, logistics operations and customer support operations, including shipping delays, higher transport costs, and certain limitations on our ability to access customer fulfillment and service sites. It also led to capacity issues, longer lead times, increased costs and shortages with certain component suppliers, including for semiconductors, impacting our operational processes and results of operations. If we experience pronounced disruptions in our operations or in our ability to service our customers, including due to impacts from public health emergencies, or if we face continued supply chain disruption or curtailed customer demand, these factors may materially adversely impact our business and results of operations. We could also face negative impacts on our liquidity and capital resources in the future due
to the effects of public health emergencies, and their impacts on our customers, suppliers, third-party service providers and capital markets.
Any acquisitions or strategic transactions that we undertake could disrupt our business and harm our financial condition and results of operations.
We have made strategic acquisitions of businesses, technologies and other assets in the past, including most recently the Acquisition. We may engage in acquisitions, divestitures or other strategic transactions in the future. In order to undertake certain of these transactions, we may use cash, issue equity that could dilute our current stockholders, or incur debt or assume indebtedness. If we are unable to achieve the anticipated efficiencies and strategic benefits of such transactions, it could adversely affect our business, financial condition and results of operations. In addition, the market price of our common stock could be adversely affected if investors and securities analysts react unfavorably to a strategic transaction or if the integration or the anticipated financial and strategic benefits of such transactions are not realized as rapidly as or to the extent anticipated by investors and securities analysts.
Acquisitions, divestitures or other strategic transactions can also result in adverse tax consequences, warranty or product liability exposure related to acquired assets, additional stock-based compensation expense, and write-up of acquired inventory to fair value. Divestitures can also result in contractual, employment or intellectual property liability related to divested assets. In addition, we may record goodwill and other purchased intangible assets in connection with an acquisition and incur impairment charges in the future. If our actual results, or the plans and estimates used in future impairment analyses, are less favorable than the original estimates used to assess the recoverability of these assets, we could incur additional impairment charges.
Acquisitions, divestitures or other strategic transactions also involve numerous risks that could disrupt our ongoing business and distract our management team, including:
•problems integrating the acquired operations, technologies or products with our own;
•challenges in divesting assets and intellectual property without negatively affecting our retained business;
•diversion of management’s attention from our core business;
•adverse effects on existing business relationships with suppliers and customers;
•risks associated with entering new markets or exiting existing markets; and
•loss of key employees.
Our failure to adequately manage the risks associated with an acquisition, divestment or strategic transaction could have an adverse effect on our business, financial condition and results of operations.
Financial and Macroeconomic Risk Factors
We may be unable to generate the cash flow necessary to make anticipated capital expenditures, service our debt or grow our business.
We may not be able to generate sufficient cash flow from operations to make anticipated capital expenditures, service our debt or grow our business. Our ability to pay our expenses, service our debt and fund planned capital expenditures will depend on our future performance, which will be affected by general economic, competitive, legislative, political, regulatory and other factors beyond our control, and our ability to continue to realize synergies and anticipated cost savings. If we are unable to generate sufficient cash flow from operations to service our debt or to make anticipated capital expenditures, we may be required to sell assets, reduce capital expenditures, borrow additional funds or evaluate alternatives for efficiently funding our capital expenditures and ongoing operations, including the issuance of equity, equity-linked and debt securities.
Unfavorable macroeconomic and market conditions may adversely affect our industry, business and financial results.
In the past, unfavorable macroeconomic and market conditions, including recessionary environments, have resulted in sustained periods of decreased demand for optical communications products and slowdowns in the telecommunications industry in which we operate. Such slowdowns may result in:
•reduced or delayed demand for our products as a result of constraints on capital spending by our customers or excess inventory held by our customers;
•increased price competition for our products, not only from our competitors, but also as a result of the utilization of inventoried or underutilized products by our customers or potential customers, which could put additional downward pressure on our near-term gross profits;
•risk of excess or obsolete inventories;
•our customers facing financial difficulties, including bankruptcy;
•delayed collections of accounts receivable amounts or payment defaults;
•excess internal manufacturing capacity and higher associated overhead costs as a percentage of revenue; and
•more limited ability to accurately forecast our business, operating capital needs and future financial performance.
High inflation, high interest rates, the recent collapse of several financial institutions, and other signs of economic disruption or recession, have also contributed to adverse global macroeconomic conditions. These conditions may also result in the tightening of credit markets, which could limit or delay our customers’ ability to obtain necessary financing for their purchases of our products.
Our customers may delay or cancel their purchases or increase the time they take to pay or default on their payment obligations due to a lack of liquidity in the capital markets, the continued uncertainty in the global economic environment or inflationary concerns, which could result in a higher level of bad debt expense and would negatively affect our business and operating results. In addition, currency fluctuations could negatively affect our international customers’ ability or desire to purchase our products.
A lack of liquidity and economic uncertainty may also adversely affect our suppliers or the terms on which we purchase products from these suppliers. These impacts could limit our ability to obtain components for our products from these suppliers and could adversely impact our supply chain or the delivery schedule to our customers. Suppliers could also require us to purchase more expensive components, or re-design our products, which could cause increases in the cost of our products and delays in the manufacturing and delivery of our products. Such events could harm our gross margin and harm our reputation and our customer relationships, either of which could harm our business and operating results.
Inflation may adversely affect us by increasing costs beyond what we can recover through price increases.
Inflation, which has continued in the U.S. and globally, can adversely affect us by increasing the costs of labor, supplies and other costs of doing business, and price increases within our supply chain have negatively affected our gross margin. In an inflationary environment, our ability to raise prices or add additional cost-recovery surcharges of a magnitude sufficient to match the rate of inflation, on a timely basis, may be constrained by customer resistance and competitive concerns, as well as industry-specific and other economic conditions, which would reduce our profit margins. Moreover, even if we seek to implement price increases in response to inflationary pressures, because of our long sales cycle, we may recognize increased costs as a result of inflation before we are able to recognize the benefits of any such price increases. We have experienced increases in the prices of labor, supplies and other costs of doing business and continued inflationary pressures could continue to adversely impact our profitability.
If we need additional capital in the future, it may not be available to us on favorable terms, or at all.
Our business requires significant capital. We have historically relied on outside debt or equity financing as well as cash flow from operations to fund our operations, capital expenditures and expansion. For example, in September 2018, we issued our 2.125% Convertible Senior Notes due 2024 (the "2024 Notes") to pay the cost of the Capped Calls, to fund the cash portion of the purchase price of the Acquisition, and for general corporate purposes. In August 2019 and as amended thereafter, we entered into the Prior Credit Agreement to provide additional working capital flexibility to manage our business. In addition, in March 2020, we issued our 2.5% Convertible Senior Notes due 2027 (the “2027 Notes") to raise additional funds for general corporate purposes, including working capital to fund growth and potential strategic projects. On August 12, 2020, we entered into an Open Market Sales Agreement with Jefferies LLC ("Jefferies") under which we issued and sold through Jefferies, acting as agent or principal, shares of our common stock having an aggregate offering price of $96.3 million, to raise funds for general corporate purposes, including working capital and capital expenditures. In June 2022, we terminated the Prior Credit Agreement and entered into the Loan Agreement to repay existing debt (including amounts outstanding under the Prior Credit Agreement) and for working capital and general corporate purposes, including to fund growth. In August 2022, we issued our 3.75% Convertible Senior Notes due 2028 (the "Existing 2028 Notes") to repurchase a portion of the 2024 Notes, for general corporate purposes, including working capital and to fund growth and potential strategic projects. In June 2023, we issued additional 3.75% Convertible Senior Notes due 2028 (the "Additional 2028 Notes," together with the Existing 2028 Notes, the "2028 Notes," and the 2028 Notes, together with the 2024 Notes and the 2027 Notes, the “convertible senior notes”) to repurchase a portion of the 2024 Notes, for general corporate purposes, including working capital and to fund growth and potential strategic projects.
We may require additional capital from equity or equity-linked financing, debt financing or other financings in the future to fund our operations, respond to competitive pressures or strategic opportunities or to refinance our existing debt obligations. In the event that we require additional capital, we may not be able to secure timely additional financing, or restructure existing debt, on favorable terms, or at all, and may be affected by the impacts on capital markets of global economic uncertainty, uncertainty in the financial and banking industry and inflationary pressures. The terms of any additional financings or restructurings may place limits on our financial and operating flexibility and we may not be able to obtain terms as favorable as the terms of our existing debt, including any debt being refinanced. If we raise additional funds through further issuances of equity, convertible debt securities or other securities convertible into equity, our existing stockholders could suffer dilution in their percentage ownership of our company, and any new securities we issue could have rights, preferences and privileges senior to those of holders of our common stock. If we are unable to obtain adequate financing or financing on terms satisfactory to us, if and when we require it, our ability to grow or support our business and to respond to business challenges could be limited and our business will be harmed.
Our Loan Agreement and any other credit or similar agreements into which we may enter in the future may restrict our operations, particularly our ability to respond to changes or to take certain actions regarding our business.
Our Loan Agreement contains a number of restrictive covenants that impose operating and financial restrictions on us and limit our ability to engage in acts that may be in our long-term interest, including restrictions on our ability to incur debt, create liens and encumbrances, engage in certain fundamental changes, dispose of assets, prepay certain indebtedness, make restricted payments, make investments, and engage in transactions with affiliates, in each case subject to limitations and exceptions set forth in the Loan Agreement. The Loan Agreement also contains a financial covenant that requires the Company to maintain a minimum fixed charge coverage ratio.
The Loan Agreement also contains customary events of default, such as the failure to pay obligations when due, a material breach of representations and warranties or covenants, the entry of material judgments against certain of our subsidiaries, the initiation of bankruptcy or insolvency proceedings of certain of our subsidiaries, defaults on certain other indebtedness, a change of control, the failure of the guaranty of certain of our subsidiaries to be in effect or the failure of the security documents to create valid and perfected liens or the loan documents to be valid and enforceable, which could have a material adverse effect on our business, operations, and financial results. Upon an event of default, the lenders may, subject to customary cure rights, require the immediate payment of all amounts outstanding and foreclose on collateral, which could force us into bankruptcy or liquidation. In the event that our lenders accelerated the repayment of the borrowings, we may not have sufficient assets to repay that indebtedness. Any acceleration of amounts due under the Loan Agreement would likely have a material adverse effect on us and may constitute a default under our convertible debt securities. As a result of these restrictions, we may be limited in how we conduct business, unable to raise additional debt or equity financing to operate during general economic or business downturns, or unable to compete effectively or to take advantage of new business opportunities.
In addition, we may enter into other credit agreements or other debt arrangements from time to time which contain similar or more extensive restrictive covenants and events of default, in which case we may face similar or additional limitations as a result of the terms of those credit agreements or other debt arrangements.
Our debt obligations may adversely affect our ability to raise additional capital and will be a burden on our future cash resources, particularly if we elect to settle these obligations in cash upon conversion or upon maturity or required repurchase.
As of December 30, 2023, the outstanding aggregate principal amount of the 2024 Notes, the 2027 Notes and the 2028 Notes was $18.7 million, $200.0 million and $473.8 million, respectively. The degree to which we are leveraged could have important consequences, including, but not limited to, the following:
•our ability to obtain additional financing in the future for working capital, capital expenditures, acquisitions, litigation, general corporate or other purposes may be limited; and
•a substantial portion of our future cash balance may be dedicated to the payment of the principal of our indebtedness as we have stated the intention to pay the principal amount of each series of convertible senior notes in cash upon conversion or when otherwise due, such that we would not have those funds available for use in our business.
Our ability to meet our payment obligations under our debt instruments, including the convertible senior notes, depends on our future cash flow performance. This, to some extent, is subject to general economic, financial, competitive, legislative and regulatory factors, as well as other factors that may be beyond our control. There can be no assurance that our business will generate positive cash flow from operations, or that additional capital will be available to us, in an amount sufficient to enable us to meet our debt payment obligations and to fund other liquidity needs. If we are unable to generate sufficient cash flow to service our debt obligations, we may need to refinance or restructure our debt, sell assets, reduce or delay capital investments, or seek to raise additional capital. If we are unable to implement one or more of these alternatives, we may be unable to meet our debt payment obligations. As a result, we may be more vulnerable to economic downturns, less able to withstand competitive pressures and less flexible in responding to changing business and economic conditions.
Our international sales and operations subject us to additional risks that may harm our operating results.
Sales of our products into international markets continue to be an important part of our business. During 2023, 2022 and 2021, we derived approximately 38%, 45% and 53%, respectively, of our revenue from customers outside of the U.S. We expect that significant management attention and financial resources will be required for our international activities over the foreseeable future as we continue to operate in international markets. In some countries, our success in selling our products and growing revenue will depend in part on our ability to form relationships with local partners. Our inability to identify appropriate partners or reach mutually satisfactory arrangements for international sales of our products could impact our ability to maintain or increase international market demand for our products. In addition, many of the companies we compete against internationally have greater name recognition and a more substantial sales and marketing presence.
We have sales and support personnel in the Americas, EMEA (with offices in the Middle East) and APAC (including China). In addition, we have established development centers in Canada, China, Finland, Germany, India, Portugal and Sweden. There is no assurance that our reliance upon development resources in international locations will enable us to achieve meaningful cost reductions or greater resource efficiency. We are also aggressively pursuing opportunities with customers in additional geographies, including EMEA, APAC and Latin America. Our efforts to increase our sales and capture market share in international markets may ultimately be unsuccessful and may limit our growth and adversely impact our business, financial condition and results of operations.
New or continuing disruptions of the global supply chain or the manufacture of our customer’s components caused by events outside of our control could impact our results of operations by impairing our ability to timely and efficiently deliver our products or provide installation and maintenance services to our customers.
In addition, our operations in Russia have been impacted by sanctions and other trade controls imposed by the U.S. and other governments in response to Russia's military operations in Ukraine which started in February 2022. The imposition of these sanctions and controls have prevented us from performing existing contracts. For the year ended December 30, 2023, less than 1% of our revenue was derived from customers in Russia. A de minimis percentage of our revenue is derived from Russian customers including channel partners and customers in other countries whose contracts with us may involve Russian entities.
The ongoing armed conflict between Israel and Hamas in the Gaza Strip may also broaden into a regional conflict that could impact our ability to maintain and expand our customer base in the Middle East.
Our international operations are subject to inherent risks, and our future results could be adversely affected by a variety of factors, many of which are outside of our control, including:
•greater difficulty in collecting accounts receivable and longer collection periods;
•difficulties of managing and staffing international offices, and the increased travel, infrastructure and legal compliance costs associated with such international locations;
•political, social and economic instability, including wars, terrorism, political unrest, boycotts, curtailment of trade and other business restrictions;
•tariff and trade barriers and other regulatory requirements, contractual limitations, or customer specifications impacting our ability to sell or develop our products in certain foreign markets;
•less effective protection of intellectual property than is afforded to us in the U.S. or other developed countries;
•potentially adverse tax consequences;
•natural disasters, acts of war or terrorism, and public health crises;
•changes to free trade agreements, trade protection measures, tariffs, export compliance, domestic preference procurement requirements, qualification to transact business and additional regulatory requirements, including changes related to policy and other changes made by the federal government in the U.S., other national governments or multinational bodies; and
•effects of changes in currency exchange rates, particularly relative increases in the exchange rate of the U.S. dollar compared to other currencies that could negatively affect our financial results and cash flows.
The concentration of the storage and distribution of our inventory primarily in one location in southeastern Asia also increases the risks of our global operations. As a result, our operations are susceptible to local and regional risks there, including accidents, system failures and weather conditions, natural disasters (including floods and earthquakes and related fires), acts of war and other unforeseen events and circumstances. Any significant interruption in the operations or availability of the storage and distribution facilities in which our inventory is held could lead to logistical and fulfillment issues or increased costs, which could have a material adverse effect on our results of operations, financial condition and cash flows.
International customers may also require that we comply with certain testing or customization of our products to conform to local standards. The product development costs to test or customize our products could be extensive and a material expense for us.
Our international operations are also subject to increasingly complex foreign and U.S. laws and regulations, including, but not limited to, anti-corruption laws, such as the U.S. Foreign Corrupt Practices Act of 1977, as amended (the "FCPA"), and the United Kingdom Bribery Act 2010, as amended (the “UK Bribery Act”), antitrust or competition laws, anti-money laundering laws, various trade controls, national security related regulations, and data privacy laws, among others. Violations of these laws and regulations could result in fines and penalties, criminal sanctions against us, our officers, or our employees, prohibitions on the conduct of our business and on our ability to offer our products and services in one or more countries, and could also materially affect our reputation, our international expansion efforts, our ability to attract and retain employees, our business, and our operating results. Although we have implemented policies, procedures and training designed to ensure compliance with these laws and regulations, there can be no complete assurance that any individual employee, contractor or agent will not violate our policies. Additionally, the costs of complying with these laws (including the costs of investigations, auditing and monitoring) could also adversely affect our current or future business.
As we continue to expand our business globally, our success will depend, in large part, on our ability to effectively anticipate and manage these and other risks and expenses associated with our international operations. Our failure to manage any of these risks successfully could harm our international operations and reduce our international sales, adversely affecting our business, financial condition and results of operations.
We may be adversely affected by fluctuations in currency exchange rates.
A portion of our sales and expenses stem from countries outside of the U.S., and are in currencies other than U.S. dollars, and therefore subject to foreign currency fluctuation. Accordingly, fluctuations in foreign currency rates could have a material impact on our financial results in future periods. We have from time to time entered into foreign currency exchange forward contracts to reduce the impact of foreign currency fluctuations on certain non-functional currency account balances. Even if we have forward contracts in place, while they may reduce some of the impact of currency exchange rate movements on certain transactions, they would not cover all foreign-denominated transactions and therefore may not entirely eliminate the impact of fluctuations in exchange rates on our results of operations and financial condition.
Our effective tax rate may increase or fluctuate, which could increase our income tax expense and reduce our net income.
Our effective tax rate can be adversely affected by several factors, many of which are outside of our control, including:
•changes in the valuation of our deferred tax assets and liabilities, and in deferred tax valuation allowances;
•changes in the relative proportions of revenue and income before taxes in the various jurisdictions in which we operate that have differing statutory tax rates;
•changing tax laws, regulations, rates and interpretations in multiple jurisdictions in which we operate;
•changes to the financial accounting rules for income taxes;
•the tax effects of acquisitions; and
•the resolution of issues arising from tax audits.
In August 2022, the U.S. enacted the Inflation Reduction Act, which, among other changes, implements a 1% excise tax on certain stock buybacks, that applies to repurchases of stock by U.S. corporations, and which could include certain transactions that we may undertake with respect to our Capped Calls.
Many countries and organizations, such as the Organization for Economic Cooperation and Development, are actively considering changes to existing tax laws or have proposed or enacted new laws, including an agreement to implement a 15% global minimum corporate tax, that could increase our tax obligations in countries where we do business or cause us to change the way we operate our business. While it is uncertain if the U.S. will adopt the minimum tax directive, several countries in which we operate have adopted the minimum tax directive, and other countries are in the process of introducing legislation to implement the minimum tax directive. Although we currently do not anticipate any materially adverse impacts on our business or results of operations, we cannot provide any assurances that these provisions will not have a materially adverse impact on our effective tax rate in the future years. We continue monitoring developments and evaluating the impacts these new rules may have on our tax rate. Any additional changes in U.S. federal or state or international tax laws or tax rulings could adversely affect our effective tax rate and our results of operations.
Beginning January 1, 2022, the Jobs Act eliminated the right to deduct research and development expenditures for tax purposes in the period the expenses were incurred and instead requires all U.S. and foreign research and development expenditures to be amortized over five and 15 tax years, respectively. This provision may materially increase our effective tax rate and reduce our operating cash flows over time as we continue to utilize available net operating losses and tax credits. Infinera continues to monitor and record the impact while waiting for final guidance from the IRS.
We may issue additional shares of our common stock in connection with conversions of the 2024 Notes, the 2027 Notes or the 2028 Notes, and thereby dilute our existing stockholders and potentially adversely affect the market price of our common stock.
In the event that some or all of each series of convertible senior notes are converted and we elect to deliver shares of common stock to the extent permitted, the ownership interests of existing stockholders will be diluted, and any sales in the public market of any shares of our common stock issuable upon such conversion could adversely affect the prevailing market price of our common stock. In addition, the anticipated conversion of any series of convertible senior notes we have issued could depress the market price of our common stock.
The fundamental change provisions of the 2024 Notes, the 2027 Notes and the 2028 Notes may delay or prevent an otherwise beneficial takeover attempt of us.
If a fundamental change (as defined in the applicable indenture governing our convertible senior notes), such as an acquisition of our company, occurs prior to the maturity of the 2024 Notes, the 2027 Notes or the 2028 Notes, as applicable, holders of the applicable series of convertible senior notes will have the right, at their option, to require us to repurchase all or a portion of their convertible senior notes of such series. In addition, if such fundamental change also constitutes a make-whole fundamental change, the conversion rate for the applicable series of convertible senior notes may be increased upon conversion of the such series of convertible senior notes in connection with such make-whole fundamental change. Any increase in the conversion rate will be determined based on the date on which the make-whole fundamental change occurs or becomes effective and the price paid (or deemed paid) per share of our common stock in such transaction. Any such increase will be dilutive to our existing stockholders. Our obligation to repurchase any series of convertible senior notes or increase the conversion rate upon the occurrence of a make-whole fundamental change may, in certain circumstances, delay or prevent a takeover of us that might otherwise be beneficial to our stockholders.
The Capped Calls may affect the value of the 2024 Notes and our common stock.
In connection with the issuance of the 2024 Notes, we entered into capped call transactions (the "Capped Calls") with certain financial institutions who are the option counterparties. The Capped Calls are expected generally to reduce or offset the potential dilution upon conversion of the 2024 Notes or offset any cash payments we are required to make in excess of the principal amount of converted 2024 Notes, as the case may be, with such reduction or offset subject to a cap.
From time to time, the option counterparties or their respective affiliates may modify their hedge positions by entering into or unwinding various derivatives with respect to our common stock or purchasing or selling our common stock or other securities of ours in secondary market transactions prior to the maturity of the 2024 Notes. This activity could also cause an increase or a decrease in the market price of our common stock.
We are subject to counterparty risk with respect to the Capped Calls.
The option counterparties to the Capped Calls are financial institutions, and we will be subject to the risk that any or all of them might default under the Capped Calls. Our exposure to the credit risk of the counterparties will not be secured by any collateral. Past global economic conditions have resulted in the actual or perceived failure or financial difficulties of many financial institutions. If an option counterparty becomes subject to insolvency proceedings, we will become an unsecured creditor in those proceedings with a claim equal to our exposure at the time under the Capped Calls with such option counterparty. Our exposure will depend on many factors but, generally, an increase in our exposure will be correlated to an increase in the market price and in the volatility of our common stock. In addition, upon a default by an option counterparty, we may suffer adverse tax consequences and more dilution than we currently anticipate with respect to our common stock. We can provide no assurance as to the financial stability or viability of the option counterparties.
Legal and Regulatory Risk Factors
If we fail to protect our intellectual property rights, our competitive position could be harmed, or we could incur significant expense to enforce our rights.
We depend on our ability to protect our proprietary technology. We rely on a combination of methods to protect our intellectual property, including limiting access to certain information, and utilizing trade secret, patent, copyright and trademark laws and confidentiality agreements with employees and third parties, all of which offer only limited protection. The steps we have taken to protect our proprietary rights may be inadequate to preclude misappropriation or unauthorized disclosure of our proprietary information or infringement of our intellectual property rights, and our ability to police such misappropriation, unauthorized disclosure or infringement is uncertain, particularly in countries outside of the U.S. This is likely to become an increasingly important issue as we expand our operations, product offerings and product development into countries that provide a lower level of intellectual property protection. We do not know whether any of our pending patent applications will result in the issuance of patents or whether the examination process will require us to narrow our claims, and even if patents are issued, they may be contested, circumvented or invalidated. Moreover, the rights granted under any issued patents may not provide us with a competitive advantage, and, as with any technology, competitors may be able to develop similar or superior technologies to our own now or in the future.
Protecting against the unauthorized use of our products, trademarks and other proprietary rights is expensive, difficult, time consuming and, in some cases, impossible. Litigation may be necessary in the future to enforce or defend our intellectual property rights, to protect our trade secrets or to determine the validity or scope of the proprietary rights of others. Such litigation could result in substantial cost and diversion of management resources, either of which could harm our business, financial condition and results of operations. Furthermore, many of our current and potential competitors have the ability to dedicate substantially greater resources to enforce their intellectual property rights than we do. Accordingly, despite our efforts, we may not be able to prevent third parties from infringing upon or misappropriating our intellectual property.
Claims by others that we infringe on their intellectual property rights could harm our business.
Our industry is characterized by the existence of a large number of patents and frequent claims and related litigation regarding patent and other intellectual property rights. In particular, many leading companies in the optical transport networking industry, including our competitors, have extensive patent portfolios with respect to optical transport networking technology. In addition, non-practicing patent holding companies seek to monetize patents they have purchased or otherwise obtained. We expect that infringement claims may increase as the number of products and competitors in our market increases and overlaps in technology implementation occur. From time to time, third parties may assert exclusive patent, copyright, trademark and other intellectual property rights to technologies and related standards that are important to our business or seek to invalidate the proprietary rights that we hold. Competitors or other third parties have asserted, and may continue to assert, claims or initiate litigation or other proceedings against us or our manufacturers, suppliers or customers alleging infringement of their proprietary rights, or seeking to invalidate our proprietary rights, with respect to our products and technology. In addition, in the past we have had certain patent licenses with third parties that have not been renewed, and if we cannot successfully renew these licenses, we could face claims of infringement. In the event that we are unsuccessful in defending against any such claims, or any resulting lawsuits or proceedings, we could incur liability for damages or have valuable proprietary rights invalidated. For additional information regarding certain of the legal proceedings in which we are involved, see the information set forth under the heading “Legal Matters” in Note 12, Commitments and Contingencies, in Part II, Item 8.
Any claim of infringement from a third party, even one without merit, could cause us to incur substantial costs defending against the claim, and could distract our management from running our business. Furthermore, a party making such a claim, if successful, could secure a judgment that requires us to pay substantial damages or could include an injunction or other court order that could prevent us from offering our products. In addition, we might be required to seek a license for the use of such intellectual property, which may not be available on commercially reasonable terms or at all. Alternatively, we may be required to develop non-infringing technology, which would require significant effort and expense and may ultimately not be successful. Any of these events could harm our business, financial condition and results of operations.
Competitors and other third parties have and may continue to assert infringement claims against our customers and sales partners. Any of these claims may require us to initiate or defend potentially protracted and costly litigation on their behalf, regardless of the merits of these claims, because we generally indemnify our customers and sales partners from claims of infringement of proprietary rights of third parties. If any of these claims succeed, we may be forced to pay damages on behalf of our customers or sales partners, which could have an adverse effect on our business, financial condition and results of operations.
We also incorporate free and open source licensed software into our products. Although we monitor our use of such open source software closely, the terms of many open source licenses have not been interpreted by U.S. courts, and there is a risk that such licenses could be construed in a manner that could impose unanticipated conditions or restrictions on our ability to commercialize our products. In addition, non-compliance with open source software license terms and conditions could subject us to potential liability, including intellectual property infringement or contract claims. In such events, we may be required to seek licenses from third parties in order to continue offering our products, to re-engineer our products or to discontinue the sale of our products in the event re-engineering cannot be accomplished in a timely manner, any of which could adversely affect our business, financial condition and results of operations.
Security incidents, such as data breaches and cyber-attacks, could compromise our intellectual property and proprietary or confidential information and cause significant damage to our business and reputation.
In the ordinary course of our business, we maintain sensitive data on our networks and systems, including data related to our intellectual property and data related to our business, customers and business partners, which may be considered proprietary or confidential information. This sensitive data includes certain personal information and other data relating to our employees and others. We also utilize third-party service providers to host, transmit, or otherwise process data in connection with our business activities, including our supply chain processes, operations, and communications. Companies, especially in the technology industry, have been increasingly subject to a wide variety of security incidents, cyber-attacks, malicious activity, including ransomware, malware and viruses, and other attempts to gain unauthorized access and disrupt systems and the confidentiality, security, and integrity of information, and we and our third-party service providers and suppliers have faced and may continue to face security threats and attacks from a variety of sources. Geopolitical tensions or conflicts have in the past led to, and may in the future lead to, increased risk of cybersecurity attacks. Moreover, advancements in technology, such as artificial intelligence and machine learning, are changing and may continue to change the way companies are subjected to attempts to gain unauthorized access and disrupt systems, thereby increasing the risks of security threats and attacks. In accordance with our flexible approach to work arrangements, many of our employees are also working from home and accessing our corporate network via remote devices, which may be less secure than those used in our offices and thus could increase the potential for such events to occur.
While the secure maintenance of this information and the security of the systems used in our business are critical to our business and reputation, our network and storage applications, and those systems and other business applications maintained by our third-party providers, may be subject to unauthorized access by hackers or breached or otherwise compromised due to operator error, malfeasance or other system disruptions. It may be difficult to anticipate or immediately detect such security incidents or breaches and to prevent or mitigate damage caused as a result. Accordingly, a data breach, security incident, cyber-attack, attack using ransomware or other malware, or any other unauthorized access to systems used in our business or unauthorized acquisition, disclosure, or other processing of our information or other information that we or our third-party vendors maintain or otherwise process could compromise our intellectual property, disrupt our operations, or result in loss of or unauthorized access to or acquisition, disclosure, modification, misuse, corruption, unavailability, or destruction of proprietary or confidential information. While we work to safeguard our internal networks and systems and validate the security of our third-party suppliers and providers to mitigate these potential risks, including through information security policies and employee awareness and training, there is no assurance that such actions will be sufficient to prevent cyber-attacks or security breaches or incidents, and we cannot guarantee that our systems and networks or our third-party service providers’ systems and networks have not been breached or that they or any components of our supply chain do not contain exploitable defects or bugs, including defects or bugs that could result in a breach of or disruption to our systems and networks or the systems and networks of third parties that support our operations. We and third-party service providers also may face difficulties or delays in identifying or responding to security breaches and other security-related incidents. We have been subjected in the past to a range of immaterial incidents resulting from, for example, phishing, emails purporting to come from an executive or vendor seeking payment requests, malware and communications from look-alike corporate domains. While they have not had a material effect on our business or our network security to date, security breaches or incidents involving access to or improper use of our systems, networks or products, or those of third-party service providers, could compromise confidential or otherwise protected information, result in unauthorized acquisition, disclosure, modification, misuse, corruption, unavailability, or destruction of data, cause payments to be diverted to fraudulent accounts, or otherwise disrupt our operations. Security breaches or incidents, or any reports or perceptions that they have occurred, could cause us to incur significant costs and expenses to remediate and otherwise respond to any actual or suspected breach or incident, subject us to regulatory actions and investigations, disrupt key business operations, result in claims, demands, and liability, and divert attention of management and key information technology resources, any of which could cause significant harm to our business and reputation. Even the perception of inadequate security may damage our reputation and negatively impact our business. Further, we could be required to expend significant capital and other resources to address any security incident or breach and to attempt to prevent future security incidents and breaches.
Although we maintain insurance coverage that may cover certain liabilities in connection with some security breaches and other security incidents, we cannot be certain our insurance coverage will be adequate for liabilities actually incurred, including any consequential damages that may arise from such security incidents, that insurance will continue to be available to us on commercially reasonable terms (if at all) or that any insurer will not deny coverage as to any future claim. The successful assertion of one or more large claims against us that exceed available insurance coverage, the occurrence of changes in our insurance policies, including premium increases or the imposition of large deductible or co-insurance requirements, or denials of coverage could have a material adverse effect on our business, including our financial condition, results of operations and reputation.
We have identified material weaknesses in our internal control over financial reporting. If we are unable to remediate the identified material weaknesses, or if we experience additional material weaknesses or deficiencies in the future or if we otherwise fail to maintain an effective system of internal controls, our ability to produce timely and accurate financial statements or comply with applicable regulations could be impaired.
We are subject to the reporting requirements of the Exchange Act, the Sarbanes-Oxley Act of 2002 ("Sarbanes-Oxley Act") and the rules and regulations of The Nasdaq Stock Market LLC. We expect that the requirements of these rules and regulations will continue to increase our legal, accounting and financial compliance costs, make some activities more difficult, time-consuming and costly, and place significant strain on our personnel, systems and resources. The Sarbanes-Oxley Act requires, among other things, that we maintain effective disclosure controls and procedures and internal control over financial reporting. We continue to develop and refine our disclosure controls, internal control over financial reporting and other procedures that are designed to ensure that information required to be disclosed by us in the reports that we will file with the SEC, is recorded, processed, summarized and reported within the time periods specified in SEC rules and forms, and that information required to be disclosed in reports under the Exchange Act is accumulated and communicated to our principal executive and financial officers.
As described under the heading "Controls and Procedures" in Part II, Item 9A of this Annual Report on Form 10-K, we identified control deficiencies within the revenue portion of our quote to cash cycle (revenue cycle) and inventory cycle, and with respect to these, our internal resources, expertise and policies required to maintain an effective control environment, that, individually or in the aggregate, constitute material weaknesses in our internal control over financial reporting, resulting in the determination that our disclosure controls and procedures were not effective as of December 30, 2023. A material weakness is a deficiency, or a combination of deficiencies, in internal control over financial reporting, such that there is a reasonable possibility that a material misstatement of a company's annual or interim financial statements will not be prevented or detected on a timely basis. In particular, we determined that (i) within the revenue cycle, controls over the annual establishment of the stand-alone selling prices (“SSPs”) for our performance obligations were not designed to include an adequate review and evaluation of whether the methodology used to develop and establish SSPs, including related financial statement disclosures, was in conformity with ASC 606, Revenue from Contracts with Customers, (ii) within the inventory cycle, controls over judgements used in the estimation of reserves for excess and obsolete inventory were not designed and operating effectively to support such judgements, (iii) controls over the application of our policy for capitalizing variances from standard costs as part of the cost of inventory, did not operate effectively and (iv) as related to our revenue and inventory cycles, certain key controls were not sufficiently designed to assess the completeness and accuracy of Information Produced by the Entity ("IPE"). These material weaknesses indicate that we had insufficient personnel with an appropriate level of technical accounting knowledge, experience, and training in the application of GAAP commensurate with the complexity of our business and our financial accounting and reporting requirements, which impacted our ability to adequately design, implement and monitor financial reporting controls related to our revenue cycle and inventory cycle that identify and mitigate risks of material misstatements in our financial statements.
In response to the identified material weaknesses, management has implemented or plans to implement the remediation measures described under the heading "Controls and Procedures" in Part II, Item 9A of this Annual Report on Form 10-K. While management believes these remediation measures will remediate the identified material weaknesses and strengthen our overall internal control over financial reporting, the identified material weaknesses will not be considered remediated until the applicable remediated controls operate for a sufficient period of time and management has concluded, through testing, that these controls are operating effectively. As management continues to evaluate and work to enhance our internal control over financial reporting, management may take additional measures to address control deficiencies or we may modify some of the remediation measures. Despite these efforts, we may nevertheless be unsuccessful in remediating the
identified material weaknesses. Further, additional weaknesses in our internal control over financial reporting or disclosure controls and procedures may be discovered in the future. Any failure to develop or maintain effective controls, or any difficulties encountered in their implementation or improvement, could harm our operating results or cause us to fail to meet our reporting obligations and may result in a restatement of our financial statements for prior periods. For example, we were unable to file this Annual Report on Form 10-K by the initial deadline of February 28, 2024, due to the reasons described in the Notification of Late Filing on Form 12b-25, filed with the SEC on February 29, 2024. Our failure to file periodic and certain current reports with the SEC in a timely manner could impact our operations. Any failure to implement and maintain effective internal controls also could adversely affect the results of periodic management evaluations and annual independent registered public accounting firm attestation reports regarding the effectiveness of our internal control over financial reporting that we are required to include in our periodic reports we will file with the SEC under Section 404 of the Sarbanes-Oxley Act. Ineffective disclosure controls and procedures and internal control over financial reporting could also cause investors to lose confidence in our reported financial and other information, which would likely have a negative effect on the market price of our securities and could adversely impact our business.
In order to restore, maintain and improve the effectiveness of our disclosure controls and procedures and internal control over financial reporting to comply with the SEC rules that implement Sections 302 and 404 of the Sarbanes-Oxley Act, we have expended and anticipate that we will continue to expend significant resources and undertake various actions, implementing a remediation plan, incurring accounting-related costs and implementing new internal controls and procedures, and providing significant management oversight. As part of our remediation plan, we plan to review and enhance our personnel with the appropriate level of technical accounting knowledge, experience, and training in the application of GAAP commensurate with the complexity of our business and our financial accounting and reporting requirements, particularly in areas related to our revenue and inventory cycles. Any failure to maintain the adequacy of our internal controls, or consequent inability to produce accurate financial statements on a timely basis, could increase our operating costs and could materially impair our ability to operate our business and could have a material and adverse effect on our operating results and could cause a decline in the price of our securities. In addition, if we are unable to continue to meet these requirements, we may not be able to maintain our listing on the Nasdaq Global Select Market.
We are subject to various governmental export control, trade sanctions, and import laws and regulations that could impair our ability to compete in international markets or subject us to liability if we violate these controls.
In some cases, our products are subject to U.S. and foreign export control laws and regulations that may limit where and to whom we are permitted to sell our products, including the Export Administration Regulations administered by the U.S. Department of Commerce, and our activities may be subject to trade and economic sanctions, including those administered by the U.S. Department of the Treasury’s Office of Foreign Assets Control (collectively, “Trade Controls”). As such, a license may be required to export or re-export our products, or provide related services, to certain countries and end-users, and for certain end-uses. Further, our products incorporating encryption functionality may be subject to special controls applying to encryption items or certain reporting requirements.
We have procedures in place designed to ensure our compliance with Trade Controls, with respect to which failure to comply could subject us to both civil and criminal penalties, including substantial fines, possible incarceration of responsible individuals for willful violations, possible loss of our export or import privileges, or reputational harm. Further, the process for obtaining necessary licenses may be time-consuming or unsuccessful, potentially causing delays in sales or losses of sales opportunities. Trade Controls are complex and dynamic regimes, and monitoring and ensuring compliance can be challenging, particularly given that our products are widely distributed throughout the world. Although we have no knowledge that our activities have resulted in material violations of Trade Controls, any failure by us or our partners to comply with applicable laws and regulations would have negative consequences for us, including reputational harm, government investigations and penalties.
In addition, various countries regulate the import of certain technologies and have enacted laws that could limit our ability to distribute our products and certain product features or could limit our customers’ ability to implement our products in those countries. Changes in our products or changes in U.S. and foreign import and export regulations may create delays in the introduction of our products in international markets, prevent our customers with international operations from deploying our products throughout their global systems or, in some cases, prevent the import and export of our products to certain countries altogether. For example, the U.S. has imposed tariffs on a large variety of products originating from China, including some on components that are
supplied to us from China. Depending upon the duration and implementation of these and future tariffs, as well as our ability to mitigate their impact, these tariffs could materially affect our business, including in the form of increased cost of goods sold, increased pricing for customers and reduced sales. Additionally, the U.S. government has continued to expand controls affecting the ability to send certain products and technology related to semiconductors, semiconductor manufacturing and supercomputing to China without an export license and adding additional entities to restricted party lists. It remains unclear what additional actions, if any, will be taken by the governments of the U.S. or China with respect to such trade and tariff matters. Any change in import and export regulations or related legislation, shift in approach to the enforcement or scope of existing regulations, or change in the countries, persons or technologies impacted by such regulations, could result in decreased use of our products by, or in our decreased ability to export or sell our products to, existing or potential customers with international operations. Failure to comply with these and similar laws on a timely basis, or at all, or any limitation on our ability to develop, export or sell our products would adversely affect our business, financial condition and results of operations.
We are subject to environmental regulations that could adversely affect our business.
We are subject to complex U.S. and foreign environmental rules and regulations or other social initiatives that impact how and where we manufacture our products. In particular, our manufacturing operations use substances that are regulated by various federal, state, local, foreign and international laws and regulations governing health, safety and the environment, including U.S. Environmental Protection Agency regulations and WEEE, RoHS and REACH regulations adopted by the E.U. From time to time, the E.U. restricts or considers restricting certain substances under these directives. For example, InP has been considered for restriction under RoHS. Any restriction of InP or any other substance integral to our systems could materially adversely affect our business, financial condition and operating results. In addition, if we experience a problem complying with these laws and regulations, it could cause an interruption or delay in our manufacturing operations or it could cause us to incur liabilities or costs related to health, safety or environmental remediation or compliance. We could also be subject to liability if we do not handle these substances in compliance with safety standards for handling, storage and transportation and applicable laws and regulations. If we experience a problem or fail to comply with such safety standards or laws and regulations, our business, financial condition and operating results may be harmed.
Regulations relating to environmental, social and governance matters, as well as customer, supplier, investor or other stakeholder demands, may add operational complexity for us.
There has been an increased focus on environmental, social and governance (“ESG”) matters that affect companies globally, including by the SEC, the E.U. and certain state governments. A number of customers have adopted, or may adopt, procurement policies that include ESG provisions or requirements that may impose additional burdens and costs on us as suppliers. An increasing number of investors are also requiring companies to disclose corporate ESG policies, practices, goals and metrics. In addition, various governmental authorities are developing ESG and disclosure-related laws or regulations that could cause us to incur significant compliance costs and other direct and indirect costs. Any disclosed goals and aspirations related to ESG are subject to assumptions that could change over time, may evolve as the Company and global ESG practices change, and may not be achieved. In addition, ESG-related standards and regulations are continuing to evolve and may not be adequately harmonized. Our efforts to abide by these regulations, to report against these standards and to accomplish our ESG-related goals and aspirations present operational, reputational, financial, audit, legal and other risks. Our processes and controls may not always align with evolving standards, laws and regulations, our interpretation thereof may differ from governmental authorities and other parties and the regulations and standards may continue to evolve, any of which could result in significant revisions to our goals, reported progress toward those goals, or other ESG information we disclose. In addition, any failure or perceived failure to pursue or fulfill previously stated goals and aspirations may result in reputational damage and loss of business, and could expose us to government enforcement actions, private litigation or other adverse consequences, and may adversely affect our business and results of operations.
We are subject to global laws and regulations governing privacy, data protection, and cybersecurity that could adversely affect our business or subject us to liability.
Data privacy, data protection, and cybersecurity are areas of increasing focus for our customers, governmental regulators and privacy advocates, and many jurisdictions, including the E.U., the U.S., China and other regions, are evaluating or have implemented laws and regulations relating to cybersecurity, privacy and data protection, which can affect the market and requirements for networking and communications equipment. For example, the General Data Protection Regulation (“GDPR”) in effect in the E.U., and similar regulatory standards in effect in the United Kingdom ("UK"), the Personal Information Protection Law ("PIPL") in China, the California Consumer Privacy Act (“CCPA”) and the California Privacy Rights Act (“CPRA”), other enacted or proposed legislation in the U.S., including comprehensive privacy legislation similar to the CCPA proposed, and in certain cases enacted, in numerous states, and enacted or proposed legislation in other jurisdictions, have created new compliance obligations with respect to data processing, privacy, data protection, and cybersecurity.
The laws, rules, regulations, standards and other actual and asserted obligations relating to privacy, data protection and cybersecurity to which we may be subject, or that otherwise apply to our business, are constantly evolving, and we expect that there will continue to be new proposed laws, regulations and industry standards concerning these matters in the U.S., the E.U. and other jurisdictions. We cannot fully predict the impact of the GDPR, the PIPL, the CCPA, the CPRA or other laws or regulations, including those that may be modified or enacted in the future, or new or evolving industry standards or actual or asserted obligations, relating to cybersecurity, privacy, or data protection or processing on our business or operations. These laws, regulations, and standards have required us to modify our practices and policies relating to privacy, data protection, cybersecurity, and data processing, and to incur substantial costs and expenses in an effort to comply, and we expect to continue to incur such costs and expenses in the future and may find it necessary or appropriate to further modify our relevant practices and policies. Any actual or perceived failure by us or our customers, partners or vendors to comply with laws, regulations, or other actual or asserted obligations to which we are or are alleged to be subject relating to cybersecurity, privacy or data protection could result in claims, litigation, and regulatory investigations and other proceedings, as well as damage to our reputation. These could result in substantial costs, diversion of resources, fines, penalties, and other damages, and harm to our customer relationships, our market position, and our ability to attract new customers. Any of these could harm our business, financial condition and results of operations.
A portion of our revenue is generated by sales to government entities, which are subject to a number of uncertainties, challenges, and risks.
We currently sell many of our solutions to various government entities, and we may in the future increase sales to government entities. Sales to government entities are subject to a number of risks, including risks related to a highly competitive, expensive, and time-consuming sales process, which often requires significant upfront time and expense without any assurance that we will complete a sale. Additionally, the sales process may be delayed by a shutdown of the U.S. federal government. If we are successfully awarded a government contract, such award may be subject to appeals, disputes, or litigation, including, but not limited to, bid protests by unsuccessful bidders. Government demand and payment for our solutions may be impacted by public sector budgetary cycles and funding authorizations, with funding reductions or delays adversely affecting public sector demand for our solutions. Government entities may also have statutory, contractual, or other legal rights to terminate contracts for convenience or due to a default. For purchases by the U.S. federal government, the government may require certain products to be made in, or be products of, the U.S. or other high-cost manufacturing locations, and all of our products may not be made in or products of jurisdictions that meet government requirements, and as a result, our business and results of operations may suffer. Contracts with government entities may also include preferential pricing terms, including, but not limited to, “most favored customer” pricing.
Additionally, we may be required to obtain special certifications to sell some or all of our solutions to government or quasi-government entities. Such certification requirements for our solutions may change, thereby restricting our ability to sell into the federal government sector until we have attained the revised certification. If our products and subscriptions are late in achieving or fail to achieve compliance with these certifications and standards, or our competitors achieve compliance with these certifications and standards before us, we may be disqualified from selling our products to such governmental entities, or be at a competitive disadvantage, which would harm our business, financial condition and results of operations. There are no assurances that we will find the terms for obtaining such certifications to be acceptable or that we will be successful in obtaining or maintaining the certifications.
As a government contractor or subcontractor, we must comply with laws, regulations, and contractual provisions relating to the formation, administration, and performance of government contracts and inclusion on government contract vehicles, which affect how we and our partners do business with government agencies. As a result of actual or perceived noncompliance with government contracting laws, regulations, or contractual provisions, we may be subject to non-ordinary course audits and internal investigations which may prove costly to our business financially, divert management time, or limit our ability to continue selling our products and services to our government customers. These laws and regulations may impose other added costs on our business, and failure to comply with these or other applicable regulations and requirements, including non-compliance in the past, could lead to claims for damages from our channel partners, downward contract price adjustments or refund obligations, civil or criminal penalties, termination of contracts or suspension or debarment from government contracting for a period of time with government agencies. Any such damages, penalties, disruption, or limitation in our ability to do business with a government would adversely impact, and could have a material adverse effect on, our business, financial condition, results of operations, reputation and growth prospects.
Our business could be adversely affected if our employees cannot obtain and maintain required security clearances or we cannot maintain a required facility security clearance, or we do not comply with legal and regulatory obligations regarding the safeguarding of classified information.
Our U.S. government contract revenue includes income derived from contracts that require our employees to maintain various levels of security clearances and may require us to maintain a facility security clearance, to comply with Department of Defense (“DoD”) requirements. The DoD has strict security clearance requirements for personnel who perform work in support of classified programs. In general, access to classified information, technology, facilities, or programs are subject to additional contract oversight and potential liability. In the event of a security incident involving classified information, technology, facilities, programs, or personnel holding clearances, we may be subject to legal, financial, operational and reputational harm. We are limited in our ability to provide specific information about these classified programs, their risks, or any disputes or claims relating to such programs. As a result, investors have less insight into our classified programs than our other businesses and therefore less ability to fully evaluate the risks related to our classified business or our business overall. Obtaining and maintaining security clearances for employees involves a lengthy process, and it is difficult to identify, recruit, and retain employees who already hold security clearances. If our employees are unable to obtain security clearances in a timely manner, or at all, or if our employees who hold security clearances are unable to maintain their clearances or terminate employment with us, then a customer requiring classified work could terminate an existing contract or decide not to renew the contract upon its expiration. To the extent we are not able to obtain or maintain a facility security clearance, we may not be able to bid on or win new classified contracts, and existing contracts requiring a facility security clearance could be terminated.
Failure to comply with anti-bribery, anti-corruption, anti-money laundering laws, and similar laws, could subject us to penalties and other adverse consequences.
We are subject to the FCPA, the U.S. domestic bribery statute contained in 18 U.S.C. § 201, the U.S. Travel Act, the UK Bribery Act, and possibly other anti-bribery and anti-money laundering laws in the U.S. and in countries outside of the U.S. in which we conduct our activities. Anti-corruption and anti-bribery laws have been enforced aggressively and are interpreted broadly to generally prohibit companies, their employees, agents, representatives, business partners, and third-party intermediaries from authorizing, offering, or providing, directly or indirectly, improper payments or benefits to recipients in the public or private sector.
We sometimes leverage third parties to sell our products and conduct our business abroad. We or our employees, agents, representatives, business partners or third-party intermediaries may have direct or indirect interactions with officials and employees of government agencies or state-owned or affiliated entities and may be held liable for the corrupt or other illegal activities of these employees, agents, representatives, business partners or third-party intermediaries even if we do not explicitly authorize such activities. We cannot assure you that all of our employees and agents will refrain from taking actions in violation of applicable law for which we may be ultimately held responsible. As we increase our international sales and business, our risks under these laws may increase.
These laws also require that we keep accurate books and records and maintain internal controls and compliance procedures designed to prevent any such actions. While we have policies and procedures to address compliance with such laws, we cannot assure you that none of our employees, agents, representatives, business partners or third-party intermediaries will take actions in violation of our policies and applicable law, for which we may be ultimately held responsible.
Any allegations or violation of the FCPA or other applicable anti-bribery, anti-corruption or anti-money laundering laws, could result in whistleblower complaints, sanctions, settlements, prosecution, enforcement actions, fines, damages, adverse media coverage, investigations, loss of export privileges, severe criminal or civil sanctions, or suspension or debarment from U.S. government contracts, all of which may have an adverse effect on our reputation, business, results of operations, and prospects. Responding to any investigation or action will likely result in a materially significant diversion of management’s attention and resources and significant defense costs and other professional fees.
General Risk Factors
The trading price of our common stock has been volatile and may be volatile in the future.
The trading prices of our common stock and the securities of other technology companies have been and may continue to be highly volatile. Factors affecting the trading price of our common stock include:
•market conditions in our industry, the industries of our customers and the economy as a whole, including inventory adjustments, supply chain disruptions, global trade tariffs, and fluctuations in currency exchange rates, interest rates or inflation rates;
•variations in our operating results;
•announcements of technological innovations, new services, service or manufacturing enhancements or government funding opportunities, strategic alliances or agreements by us or by our competitors;
•the gain or loss of customers;
•recruitment or departure of key personnel;
•changes in the estimates of our future operating results or external outlook on those results or changes in recommendations or business expectations by any securities analysts that elect to follow our common stock;
•mergers and acquisitions by us, by our competitors or by our customers or suppliers;
•social, geopolitical, environmental or health factors, including pandemics or other public health emergencies where we operate; and
•adoption or modification of regulations, policies, procedures or programs applicable to our business.
An economic downturn, negative financial news, continued inflation, high interest rates, declines in income or asset values, market conditions, changes to fuel and other energy costs, and other economic factors, may lead to market volatility and associated uncertainty. In addition, if the market for technology stocks or the broader stock market experiences a loss of investor confidence, the trading price of our common stock could decline for reasons unrelated to our business, financial condition or results of operations. Each of these factors, among others, could harm the value of an investment in our common stock. Some companies that have had volatile market prices for their securities have had securities class action lawsuits filed against them. If a suit were filed against us, regardless of its merits or outcome, it could result in substantial costs and divert management’s attention and resources.
Future sales of our common stock could cause our stock price to fall.
We have sold, and may in the future sell, shares of our common stock in underwritten offerings and have established, and may in the future establish, “at-the-market” offering programs pursuant to which we may offer and sell shares of our common stock. Sales of securities have resulted and will continue to result in dilution of our existing stockholders, and such sales could cause our stock price to fall.
In addition, if our existing stockholders sell, or indicate an intent to sell, a large number of shares of our common stock in the public market, it could cause our stock price to fall. We may also issue shares of common stock or securities convertible into our common stock from time to time in connection with financings, acquisitions, investments or otherwise. Any such issuance would result in dilution to our existing stockholders and could cause our stock price to fall.
Anti-takeover provisions in our charter documents and Delaware law could discourage, delay or prevent a change in control of our company and may affect the trading price of our common stock.
We are a Delaware corporation and the anti-takeover provisions of the General Corporation Law of the State of Delaware ("DGCL"), which apply to us, may discourage, delay or prevent a change in control by prohibiting us from engaging in a business combination with an interested stockholder for a period of three years after the person becomes an interested stockholder, even if a change of control would be beneficial to our existing stockholders. In addition, our amended and restated certificate of incorporation and amended and restated bylaws may discourage, delay or prevent a change in our management or control over us that stockholders may consider favorable. Our amended and restated certificate of incorporation and amended and restated bylaws:
•authorize the issuance of “blank check” convertible preferred stock that could be issued by our board of directors to thwart a takeover attempt;
•establish a classified board of directors, as a result of which the successors to the directors whose terms have expired will be elected to serve from the time of election and qualification until the third annual meeting following their election;
•require that directors only be removed from office for cause;
•provide that vacancies on the board of directors, including newly created directorships, may be filled only by a majority vote of directors then in office rather than by stockholders;
•prevent stockholders from calling special meetings; and
•prohibit stockholder action by written consent, requiring all actions to be taken at a meeting of the stockholders.
Our amended and restated bylaws designate the Court of Chancery of the State of Delaware and the federal district courts of the U.S. as the exclusive forums for substantially all disputes between us and our stockholders, which will restrict our stockholders’ ability to choose the judicial forum for disputes with us or our directors, officers or employees.
Our amended and restated bylaws provide that the Court of Chancery of the State of Delaware or, if such court lacks jurisdiction, any other state or federal court located in the State of Delaware, is the exclusive forum for any derivative action or proceeding brought on our behalf; any action asserting a breach of fiduciary duty; any action arising pursuant to the DGCL, our amended and restated certificate of incorporation or our amended and restated bylaws; or any action asserting a claim governed by the internal affairs doctrine. However, such exclusive forum provisions would not apply to any such claim as to which such court determines that there is an indispensable party not subject to the jurisdiction of such court (and the indispensable party does not consent to the personal jurisdiction of such court within 10 days following such determination), which is vested in the exclusive jurisdiction of a court or forum other than such court or for which such court does not have subject matter jurisdiction.
These provisions would not apply to suits brought to enforce a duty or liability created by the Exchange Act or any other claim for which the U.S. federal courts have exclusive jurisdiction. Furthermore, Section 22 of the Securities Act of 1933, as amended (the “Securities Act”) creates concurrent jurisdiction for federal and state courts over all such Securities Act actions. Accordingly, both state and federal courts have jurisdiction to entertain such claims. Our stockholders cannot waive compliance with the federal securities laws and the rules and regulations thereunder. To prevent having to litigate claims in multiple jurisdictions and the threat of inconsistent or contrary rulings by different courts, among other considerations, our amended and restated bylaws provide that, unless we consent in writing to the selection of an alternative forum, the federal district courts of the U.S. will be the sole and exclusive forum for resolving any complaint asserting a cause of action arising under the Securities Act. While the Delaware courts have determined that such choice of forum provisions are facially valid, a stockholder may nevertheless seek to bring a claim in a venue other than those designated in the exclusive forum provisions. In such instance, we would expect to vigorously assert the validity and enforceability of the exclusive forum provisions of our amended and restated bylaws. This may require significant additional costs associated with resolving such action in other jurisdictions and there can be no assurance that the provisions will be enforced by a court in those other jurisdictions.
These exclusive choice of forum provisions may limit a stockholder’s ability to bring a claim in a judicial forum that it finds favorable for disputes with us or our directors, officers, or other employees, which may discourage lawsuits against us and our directors, officers, and other employees. If a court were to find such exclusive-forum provisions to be inapplicable or unenforceable in an action, we may incur further significant additional costs associated with resolving the dispute in other jurisdictions, all of which could harm our business.
Events that are outside our control, such as natural disasters, violence or other catastrophic events, could harm our operations.
Our headquarters and the majority of our infrastructure, including our PIC fabrication manufacturing facility, are located in Northern California, an area that is susceptible to earthquakes, fires, floods and other natural disasters. Further, attacks and violence aimed at Northern California or at the U.S. energy or telecommunications infrastructure could hinder or delay the development and sale of our products. In the event that an earthquake, targeted attack or other man-made or natural catastrophe were to destroy any part of our or our contract manufacturers’ or suppliers' facilities, destroy or disrupt vital infrastructure systems, or interrupt our operations or supply chain for any extended period of time, our business, financial condition and results of operations would be harmed. For related risks concerning the operations and availability of the storage facilities in which our inventory is held, see also the Risk Factor titled "Our international sales and operations subject us to additional risks that may harm our operating results."
ITEM 1B. UNRESOLVED STAFF COMMENTS
Not applicable.
ITEM 1C. CYBERSECURITY
Risk Management and Strategy
Infinera has comprehensive and integrated enterprise risk management and cybersecurity risk management programs which use structured, proactive, and continuous processes to identify, understand, assess, mitigate, and report on enterprise and cybersecurity risks in alignment with business objectives. Our risk management program is used to guide and strengthen our cybersecurity posture to engender trust with customers, employees, and stockholders while protecting the confidentiality, integrity, and availability of our systems and data.
We have established a risk assessment methodology which includes requirements for treatment plans, risk acceptance thresholds, prioritization, and control analysis, as well as likelihood and impact analysis. A risk assessment is performed annually. Treatment plans are monitored and reported to management on a quarterly basis.
Governance
Cybersecurity and risk management is a shared responsibility that applies to the Infinera team across all levels of the organization.
•The Board of Directors conducts informed oversight of our risk management processes. The Audit Committee of the Board of Directors has primary responsibility for oversight of enterprise risk management and cybersecurity risk management. Reports on enterprise and cybersecurity risk, risk treatment plans, and key performance indicators of our cybersecurity program are provided to the Audit Committee by management, including our Chief Information Security Officer (CISO), on a quarterly basis and are provided to the Board of Directors as requested and as part of routine Audit Committee updates to the Board of Directors.
•The Executive Leadership Team (ELT), a cross-functional leadership group that includes our Senior Vice President, Information Systems, is responsible for assessing and managing enterprise risks, including cybersecurity risks. The ELT reviews enterprise and cybersecurity risks, risk treatment plans, and key performance indicators regarding the Company’s enterprise risk and cybersecurity risk management programs quarterly.
•The CISO is responsible for cybersecurity strategy and reporting on cybersecurity risks to the ELT, Audit Committee, and Board of Directors. The CISO collaborates with a cross-functional group of the Company’s business leaders to assess cybersecurity risk, establish and monitor cybersecurity processes, and report program effectiveness. Our CISO has over 25 years of cybersecurity and Information Technology experience across multiple industries with expertise in governance, risk and compliance, cybersecurity operations and cybersecurity engineering.
•The Cybersecurity Advisory Committee supports cybersecurity risk assessment, advises on program enhancements, and acts as a cybersecurity advocate across the business. The committee is comprised of employees with extensive experience across a diverse range of disciplines.
•All employees are responsible for adherence to the Company’s cybersecurity processes and for remaining vigilant to potential cybersecurity threats. This employee commitment to operational excellence is strengthened by ongoing cybersecurity education, training, and awareness programs.
Engaging Third Parties
Companies, especially in the technology industry, have been subject to an increasing number of complex cybersecurity risks. Infinera has engaged with a range of external service providers, including consultants, auditors, and cybersecurity service providers, to understand, manage, and mitigate cybersecurity risks. These engagements help Infinera drive improvements in our processes, identify new and emerging threats, and respond rapidly to the ever-evolving cybersecurity risk landscape.
Third-Party Risk Management
Infinera has implemented a robust third-party risk management program to identify and manage risks to the confidentiality, availability, and integrity of our systems and data. This includes contractual requirements related to data privacy and confidentiality, contractual commitments of third parties to maintain comprehensive security programs, and code of conduct requirements designed to ensure such third parties act ethically, responsibly, and safely. Infinera has also implemented processes to assess the effectiveness of third-party security programs and adherence to Infinera’s standards both prior to engaging with a new service provider and to monitor performance on an ongoing basis.
Cybersecurity Incident Response
Infinera has implemented a cybersecurity incident response plan in line with industry standards. The plan defines roles and responsibilities regarding potential cybersecurity incidents, establishes processes regarding identification, containment, eradication, and recovery from potential cybersecurity incidents and clarifies communication and notification policies regarding such potential cybersecurity incidents. The plan also captures lessons learned to drive continuous improvement. Additionally, the plan is evaluated, tested, and enhanced through training, table-top exercises, and by engaging with third-party service providers.
Infinera has not experienced a material cybersecurity incident. For additional information regarding whether any risks from cybersecurity threats, including as a result of any previous cybersecurity incidents, have materially affected or are reasonably likely to materially affect our company, including our business strategy, results of operations, or financial condition, please refer to the section titled “Risk Factors” included in Part I, Item 1A of this Annual Report on Form 10-K.
ITEM 2. PROPERTIES
Our headquarters are located in San Jose, California, which consist of approximately 82,000 square feet under lease. As of December 30, 2023, we leased approximately 57,000 square feet for research and development and manufacturing in Sunnyvale, California.
In addition to the leased buildings in San Jose and Sunnyvale, California, we also lease approximately 443,000 square feet of office spaces for research and development centers and for sales, service and support in various countries within (i) North America; (ii) LATAM; (iii) EMEA; and (iv) APAC.
All of these leases expire between 2024 and 2037. We also own a facility in Allentown, Pennsylvania. We intend to adjust our facility space to meet our requirements and we believe that suitable additional or substitute space will be available as needed to accommodate our business needs for our operations. We believe that our existing facilities are adequate to meet our business needs through the next 12 months.
ITEM 3. LEGAL PROCEEDINGS
The information set forth under the heading “Legal Matters” in Note 12, Commitments and Contingencies, in Part II, Item 8 of this Annual Report on Form 10-K is incorporated herein by reference.
ITEM 4. MINE SAFETY DISCLOSURES
Not Applicable.
PART II
ITEM 5. MARKET FOR REGISTRANT’S COMMON EQUITY, RELATED STOCKHOLDER MATTERS AND ISSUER PURCHASES OF EQUITY SECURITIES
Our common stock is listed on the Nasdaq Global Select Market under the symbol “INFN.” As of May 10, 2024, there were 67 registered holders of record of our common stock. A substantially greater number of holders of our common stock are “street name” or beneficial holders, whose shares are held by banks, brokers and other financial institutions.
We have not paid any cash dividends on our common stock and do not intend to pay any cash dividends on our common stock in the near future.
STOCK PERFORMANCE GRAPH
The following graph compares the cumulative five-year total return provided stockholders on our common stock relative to the cumulative total returns of the Nasdaq Composite Index and the Nasdaq Telecommunications Index. An investment of $100 (with reinvestment of all dividends, if any) is assumed to have been made in our common stock and in each of the indexes on December 29, 2018 and its relative performance is tracked through December 30, 2023. The Nasdaq Telecommunications Index contains securities of Nasdaq-listed companies classified according to the Industry Classification Benchmark as Telecommunications and Telecommunications Equipment. They include providers of fixed-line and mobile telephone services, and makers and distributors of high-technology communication products. This graph is not deemed to be “filed” with the SEC or subject to the liabilities of Section 18 of the Securities Exchange Act of 1934, as amended (the “Exchange Act”), and the graph shall not be deemed to be incorporated by reference into any prior or subsequent filing by us under the Securities Act of 1933, as amended, or the Exchange Act.
COMPARISON OF FIVE YEAR CUMULATIVE TOTAL RETURN*
Among Infinera Corporation, the Nasdaq Composite Index, and the Nasdaq Telecommunications Index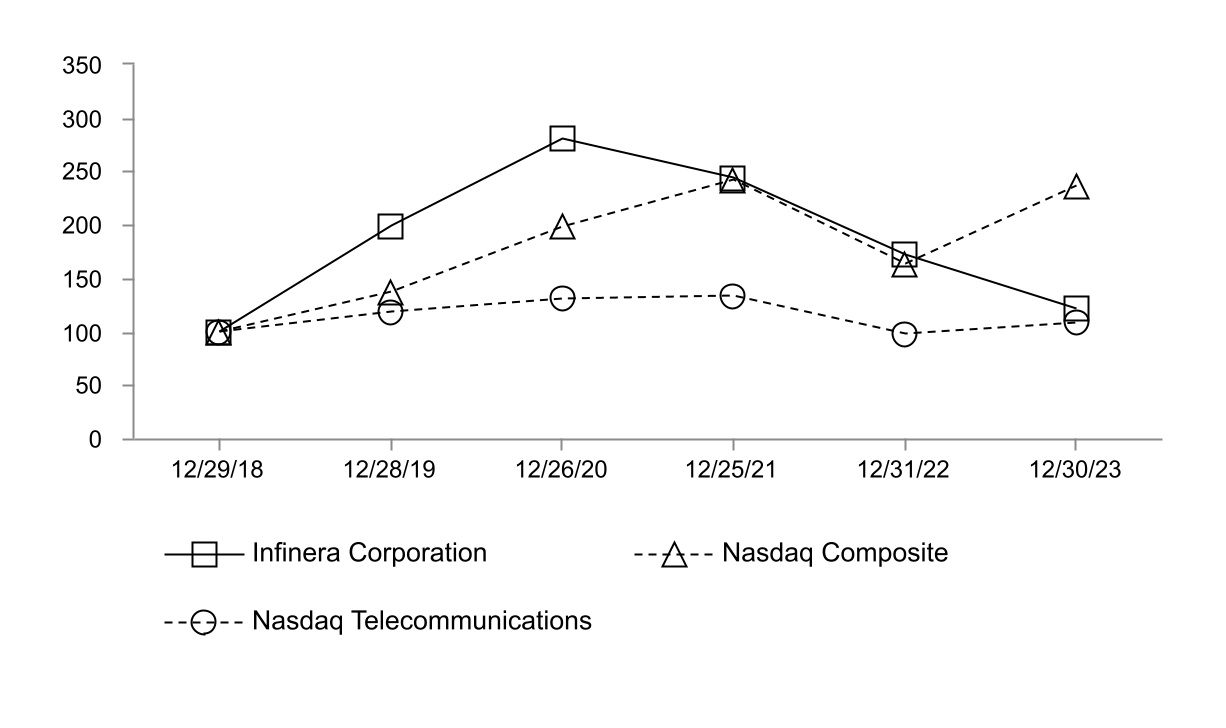
*Assumes $100 invested on December 29, 2018 in our common stock, in the Nasdaq Composite Index and the Nasdaq Telecommunications Index, with reinvestment of all dividends, if any. Indexes calculated on month-end basis.
ITEM 6. [RESERVED]
ITEM 7. MANAGEMENT’S DISCUSSION AND ANALYSIS OF FINANCIAL CONDITION AND RESULTS OF OPERATIONS
This Annual Report on Form 10-K contains “forward-looking statements” that involve risks and uncertainties, as well as assumptions that, if they never materialize or prove incorrect, could cause our results to differ materially from those expressed or implied by such forward-looking statements. Such forward-looking statements include, but are not limited to, our expectations regarding revenue, gross margin, operating expenses, cash flows and other financial items and the drivers related to these; the competitive advantages derived from sales of our vertically integrated products; demand growth for additional network capacity, the level and timing of customer capital spending and the impact on customer demand from customers holding excess inventory beyond normalized levels; the magnitude and duration of supply constraints, including delays, shortages and increased costs and our ability to mitigate such supply constraints, and the extent to which supply-related impacts could materially and adversely affect our business operations, financial performance, results of operations, financial position, and stock price; the adverse impact inflation and higher interest rates may have on us by increasing costs beyond what we can recover through price increases; achievement of strategic objectives, any statements regarding our plans, strategies and objectives; the impact of new customer network footprint on our gross margin; factors that may affect our operating results; anticipated customer acceptance of our solutions; statements concerning new products or services, including new product features; our beliefs about who we may compete with and how we are differentiated from those competitors; our ability to respond to technological changes; statements regarding our relationships with contract manufacturers and other third-party partners; statements regarding our production capacity and facilities requirements; statements related to capital expenditures; statements related to working capital and liquidity; the sufficiency of our cash to operate our business and our ability to raise capital; expectations regarding research and development investments and initiatives; our ability to realize deferred tax assets; statements related to future economic conditions, performance, market growth, competitor consolidation or our sales cycle; our ability to identify, attract, upskill and retain highly skilled personnel; the extent to which public health emergencies could materially and adversely affect our business operations, financial performance, results of operations, financial position, stock price and personnel; our ability to protect our technology and intellectual property, the frequency of claims related to our intellectual property and the value of our intellectual property; statements related to our convertible senior notes and our Credit Facility; our ability to prevent and respond to data breaches and cyber-attacks; statements related to the impact of tax regulations; statements related to our internal control over financial reporting and material weaknesses; statements related to our disclosure controls and procedures; statements related to the effects of trade sanctions and similar regulations; statements related to the proliferation and impact of environmental, social and governance regulation; statements related to the effects of litigation on our financial position, results of operations or cash flows; the impacts of any restructuring plans or other strategic efforts on our business; statements related to factors beyond our control, such as natural disasters, acts of war or terrorism, epidemics, pandemics and armed conflicts, such as between Russia and Ukraine and Israel and Hamas; statements related to new accounting standards; expectations about the outcome of legal proceedings; statements as to industry trends and other matters that do not relate strictly to historical facts; and statements of assumptions underlying any of the foregoing. These statements are often identified using words such as “anticipate,” “believe,” “could,” “estimate,” “expect,” “intend,” “may,” "should," "will," or "would," and similar expressions or variations. These statements are based on the beliefs and assumptions of our management based on information currently available to management. Such forward-looking statements are subject to risks, uncertainties and other factors that could cause actual results and the timing of certain events to differ materially from future results expressed or implied by such forward-looking statements. Factors that could cause or contribute to such differences include, but are not limited to, those identified below, and those discussed in the section titled “Risk Factors” included in Part I, Item 1A of this Annual Report on Form 10-K. You should review these risk factors for a more complete understanding of the risks associated with an investment in our securities. Such forward-looking statements speak only as of the date of this report. We disclaim any obligation to update any forward-looking statements to reflect events or circumstances after the date of such statements. The following discussion and analysis should be read in conjunction with our consolidated financial statements and notes thereto included elsewhere in this Annual Report on Form 10-K.
Overview
We are a semiconductor manufacturer and global supplier of networking solutions comprised of networking equipment, optical semiconductors, software and services. Our portfolio of solutions includes optical transport platforms, converged packet-optical transport platforms, compact modular platforms, optical line systems, coherent optical engines and subsystems, a suite of networking and automation software offerings, and support and professional services. Leveraging our U.S.-based compound semiconductor fab and in-house test and packaging capabilities, we design, develop, and manufacture industry-leading InP-based PICs for use in our vertically integrated, high-capacity optical communications products.
Our customers include operators of fixed and mobile networks, including telecommunications service providers, ICPs, cable providers, wholesale carriers, research and educational institutions, large enterprises, utilities and government entities. Our networking solutions enable our customers to deliver high-bandwidth business and consumer communications services. Our comprehensive portfolio of networking solutions also enables our customers to build infrastructure networks that support and deliver high-bandwidth business and consumer communications services. Our edge-to-core portfolio of networking solutions also enables our customers to scale their transport networks as consumer and business services and applications continue to drive growth in demand for network bandwidth. These consumer and business services and applications include, but are not limited to, high-speed internet access, 4G/5G mobile broadband, cloud-based services, high-definition video streaming services, virtual and augmented reality, IoT, AI, ML, business Ethernet services and DCI.
As an optical semiconductor manufacturer, we specialize in the manufacturing of optical compound semiconductors using InP. This technology is used in infrastructure networks to transmit massive amounts of data and support delivery of business and communications services. We have made significant investments in our unique research, development, fabrication, and packaging facilities, including our optical compound semiconductor fab in Silicon Valley and advanced test and packaging center in Allentown, Pennsylvania. We optimize the manufacturing process by using InP to build our PICs, which enables the integration of hundreds of optical functions onto a onto a single, monolithic optical semiconductor chip. The unique capabilities of our optical semiconductor fab, which has provided our customers with a critical and secure source of U.S.-produced optical semiconductors and strengthened the supply chain, have enabled us to consistently pioneer critical technology advancements. For example, our latest generation of technology has made it possible to transmit information at a rate of 800 Gb/s using a single laser. Our ongoing research and development initiatives continue to create a path to higher speed transmission and lower cost per bit performance for our customers.
We support U.S. government efforts to advance and increase the domestic manufacturing base for semiconductors as a matter of economic and national security. Compound semiconductors – including those based in InP – are an important part of the domestic semiconductor industry and will enable the next-generation of leading-edge technologies. Domestic manufacturing is critical in order to reduce our reliance on foreign sources of compound semiconductor materials and components, which is essential to economic growth and to the security of our domestic communications infrastructure.
The large-scale integration of our PICs and advanced DSPs enables us to develop and manufacture high-performance optical engines that are used in our coherent optical networking system and subsystem solutions. These solutions include features that customers care about the most, including lowest cost per bit, lowest power per bit, reduced footprint and increased flexibility, reliability and security. Coherent optical solutions are becoming increasingly important across the network as our customers transition to 800 Gb/s per wavelength transmission speeds and beyond in the network core, 400 Gb/s in the metro networks, and 100 Gb/s in the access market segment. We believe our vertical integration strategy provides a competitive advantage by enabling leading optical performance at higher optical speeds with increased spectral efficiency, greater control over our supply chain, and an overall lower cost structure.
We have grown our solutions portfolio through internal development as well as acquisitions, including the acquisition of Coriant. These developments positioned us to be one of the leading providers of vertically integrated optical networking solutions in the world with the ability to serve a global customer base with accelerated delivery of the innovative solutions our customers demand. In 2021, we announced an expansion of our portfolio with the introduction of a suite of coherent optical pluggables designed to seamlessly address the rapidly growing market for point-to-point optical transport solutions as well as create a new category of point-to-multipoint solutions that can enable a dramatically more cost-efficient network architecture. Based on our vertically integrated optical semiconductor technology and supporting a range of high-speed transport rates that include 800 Gb/s, 400 Gb/s and 100 Gb/s, this suite of coherent optical pluggables builds on our history of
delivering innovative, vertically integrated coherent optical technology that powers our differentiated optical networking solutions.
Our products are designed to be managed by a suite of software solutions that enable simplified network management, increased service agility and automated operations. We also provide software-enabled programmability that offers differentiated capabilities such as Instant Bandwidth. Combined with our differentiated hardware solutions, Instant Bandwidth enables our customers to purchase and activate bandwidth as needed through our unique software licensing feature set. This, in turn, allows our customers to accomplish two key objectives: (1) limit their initial network startup costs and investments; and (2) instantly activate new bandwidth as their customers’ and their own network needs evolve.
We sell our products via a direct sales force and through indirect channel partners.
We believe our systems and subsystems solutions benefit our customers by providing a unique combination of highly scalable capacity and advanced networking features that address edge-to-core transport network applications and ultimately simplify and automate network operations. Our high-performance optical transport solutions leverage the industry shift to open optical network architectures and enable our customers to efficiently and cost-effectively keep pace with bandwidth demands, which continue to grow 30% or more year-over-year.
Financial and Business Highlights
Total revenue was $1,614.1 million in 2023 as compared to $1,573.2 million in 2022, representing a 3% increase. The total year-over-year increase in revenue was driven by the continued ramp and deployment of our products within both our ICP and our other service provider verticals, which was modestly offset by lower revenue from our Tier 1 and Cable verticals. In 2024, we anticipate benefiting from a more diversified customer base and see several prospective opportunities to grow revenue by driving adoption of new and existing vertically integrated solutions. Our results will depend on overall market conditions and, as is typical, quarter-over-quarter revenue could be volatile, affected by, among other factors, customer buying patterns, component availability within our supply chain and the timing of customer network deployments.
One end-customer accounted for 10% of our revenue in fiscal year 2023. One end-customer accounted for 11% of our revenue in 2022 and no end-customer accounted for 10% or more of our revenue in fiscal year 2021.
Gross margin increased to 39% in 2023 from 34% in 2022. The year-over-year increase in gross margin was driven by higher sales volume, favorable mix, lower component costs and improved absorption of fixed costs from higher sales volumes. In 2024, we intend to continue to expand our vertical integration capabilities into a broader range of our optical networking solutions utilizing our own internally developed optical engines. We remain focused on improving our gross margin over time through engineering design efforts to lower component costs in our supply chain as well as driving other efficiencies within our operations.
Operating expenses increased to $627.8 million in 2023 from $595.9 million in 2022, representing a 5% increase. The increase was primarily attributable to higher employee-related costs and higher depreciation expense. In 2024, we intend to continue to balance prudent cost management with strategic investments in technology innovation and in our go-to-market efforts globally to expand our customer reach and drive additional market share gains in the long term.
We primarily sell our products through our direct sales force, with the remainder sold through channel partners. We derived 66% and 76% of our revenue from direct sales to customers in 2023 and 2022, respectively. In the future, we expect to continue generating a majority of our revenue from direct sales.
We are headquartered in San Jose, California, with employees located throughout North America, LATAM, EMEA and APAC.
Results of Operations
A discussion regarding our financial condition and results of operations for the fiscal year ended December 30, 2023 compared to our fiscal year ended December 31, 2022 is presented below. A discussion regarding our financial condition and results of operations for our fiscal year ended December 31, 2022 compared to our fiscal year ended December 25, 2021 can be found under Item 7 of our Amendment No. 1 to our Annual Report on Form 10-K/A for the fiscal year ended December 31, 2022, filed with the SEC on February 29, 2024.
The following tables set forth, for the periods presented, certain consolidated statements of operations information (in thousands, except percentages):
| | | | | | | | | | | | | | | | | | | | | | | | | | | | | | | | | | | |
| | Years Ended | | | |
| | December 30, 2023 | | % of total
revenue | | December 31,
2022 | | % of total
revenue | | Change | | % Change |
| Revenue: | | | | | | | | | | | |
| Product | $ | 1,304,229 | | | 81 | % | | $ | 1,268,624 | | | 81 | % | | $ | 35,605 | | | 3 | % |
| Services | 309,899 | | | 19 | % | | 304,618 | | | 19 | % | | 5,281 | | | 2 | % |
| Total revenue | $ | 1,614,128 | | | 100 | % | | $ | 1,573,242 | | | 100 | % | | $ | 40,886 | | | 3 | % |
| Cost of revenue: | | | | | | | | | | | |
| Product | $ | 810,845 | | | 50 | % | | $ | 852,476 | | | 54 | % | | $ | (41,631) | | | (5) | % |
| Services | 167,532 | | | 10 | % | | 161,630 | | | 10 | % | | 5,902 | | | 4 | % |
| Amortization of intangible assets | 10,621 | | | 1 | % | | 23,138 | | | 1 | % | | (12,517) | | | (54) | % |
| Restructuring and other related costs | 2,218 | | | — | % | | 222 | | | — | % | | 1,996 | | | 899 | % |
| Total cost of revenue | $ | 991,216 | | | 61 | % | | $ | 1,037,466 | | | 66 | % | | $ | (46,250) | | | (4) | % |
| Gross profit | $ | 622,912 | | | 39 | % | | $ | 535,776 | | | 34 | % | | $ | 87,136 | | | 16 | % |
| | | | | | | | | | | | | | | | | | | | | | | | | | | | | | | | | | | |
| | Years Ended | | | |
| | December 31,
2022 | | % of total
revenue | | December 25, 2021 | | % of total
revenue | | Change | | % Change |
| Revenue: | | | | | | | | | | | |
| Product | $ | 1,268,624 | | | 81 | % | | $ | 1,099,376 | | | 77 | % | | $ | 169,248 | | | 15 | % |
| Services | 304,618 | | | 19 | % | | 325,829 | | | 23 | % | | (21,211) | | | (7) | % |
| Total revenue | $ | 1,573,242 | | | 100 | % | | $ | 1,425,205 | | | 100 | % | | $ | 148,037 | | | 10 | % |
| Cost of revenue: | | | | | | | | | | | |
| Product | $ | 852,476 | | | 54 | % | | $ | 732,071 | | | 51 | % | | $ | 120,405 | | | 16 | % |
| Services | 161,630 | | | 10 | % | | 174,008 | | | 12 | % | | (12,378) | | | (7) | % |
| Amortization of intangible assets | 23,138 | | | 1 | % | | 19,621 | | | 1 | % | | 3,517 | | | 18 | % |
| | | | | | | | | | | |
| Restructuring and other related costs | 222 | | | — | % | | 1,531 | | | — | % | | (1,309) | | | (85) | % |
| Total cost of revenue | $ | 1,037,466 | | | 66 | % | | $ | 927,231 | | | 65 | % | | $ | 110,235 | | | 12 | % |
| Gross profit | $ | 535,776 | | | 34 | % | | $ | 497,974 | | | 35 | % | | $ | 37,802 | | | 8 | % |
Revenue
2023 Compared to 2022. Product revenue increased by $35.6 million, or 3%, in 2023 from 2022. This increase was primarily driven by the growth of optical line system products as well as deployments of our vertically integrated optical products.
Services revenue increased by $5.3 million, or 2%, in 2023 from 2022. This increase was primarily attributable to higher professional services revenue from new and existing customer deployment projects.
Revenue will be lower in the first quarter of 2024 as compared to the fourth quarter of 2023 due to the seasonality of our business.
Revenue by geographic region is based on the shipping address of the customer. The following tables summarize our revenue by geography and sales channel for the periods presented (in thousands, except percentages):
| | | | | | | | | | | | | | | | | | | | | | | | | | | | | | | | | | | |
| | Years Ended | | | | |
| | December 30, 2023 | | % of total
revenue | | December 31,
2022 | | % of total revenue | | Change | | % Change |
| Total revenue by geography | | | | | | | | | | | |
| Domestic | $ | 994,311 | | | 62 | % | | $ | 870,282 | | | 55 | % | | $ | 124,029 | | | 14 | % |
| International | 619,817 | | | 38 | % | | 702,960 | | | 45 | % | | (83,143) | | | (12) | % |
| $ | 1,614,128 | | | 100 | % | | $ | 1,573,242 | | | 100 | % | | $ | 40,886 | | | 3 | % |
| Total revenue by sales channel | | | | | | | | | | | |
| Direct | $ | 1,067,570 | | | 66 | % | | $ | 1,191,584 | | | 76 | % | | $ | (124,014) | | | (10) | % |
| Indirect | 546,558 | | | 34 | % | | 381,658 | | | 24 | % | | 164,900 | | | 43 | % |
| $ | 1,614,128 | | | 100 | % | | $ | 1,573,242 | | | 100 | % | | $ | 40,886 | | | 3 | % |
| | | | | | | | | | | | | | | | | | | | | | | | | | | | | | | | | | | |
| | Years Ended | | | |
| | December 31,
2022 | | % of total revenue | | December 25, 2021 | | % of total revenue | | Change | | % Change |
| Total revenue by geography | | | | | | | | | | | |
| Domestic | $ | 870,282 | | | 55 | % | | $ | 663,808 | | | 47 | % | | $ | 206,474 | | | 31 | % |
| International | 702,960 | | | 45 | % | | 761,397 | | | 53 | % | | (58,437) | | | (8) | % |
| $ | 1,573,242 | | | 100 | % | | $ | 1,425,205 | | | 100 | % | | $ | 148,037 | | | 10 | % |
| Total revenue by sales channel | | | | | | | | | | | |
| Direct | $ | 1,191,584 | | | 76 | % | | $ | 1,099,632 | | | 77 | % | | $ | 91,952 | | | 8 | % |
| Indirect | 381,658 | | | 24 | % | | 325,573 | | | 23 | % | | 56,085 | | | 17 | % |
| $ | 1,573,242 | | | 100 | % | | $ | 1,425,205 | | | 100 | % | | $ | 148,037 | | | 10 | % |
2023 Compared to 2022. Domestic revenue increased by $124.0 million, or 14%, in 2023 compared to 2022, driven primarily by increased revenue from each of our ICP and other service provider verticals, which was partially offset by decreased revenue from certain Tier 1 customers and our cable vertical.
International revenue decreased by $83.1 million, or 12%, in 2023 compared to 2022, primarily from lower other service provider revenue in EMEA and lower Tier 1 revenue in APAC.
Direct revenue decreased by $124.0 million, or 10%, in 2023 compared to 2022, primarily from lower revenue from Tier 1 customers, which vary period to period based upon the timing of customer deployment projects.
Indirect revenue increased $164.9 million, or 43%, related to revenue growth within ICP and other service provider verticals, which was modestly offset by lower Tier 1 revenue.
2023 Compared to 2022. Gross profit increased by $87.1 million, with gross margin increasing to 39% in 2023 from 34% in 2022. The gross margin improvement was driven by favorable product mix, cost reductions, including relief from elevated supply chain costs, and increased vertical integration. In 2024, we intend to continue to expand our vertical integration capabilities, drive down direct material costs through further design efforts coupled with vendor negotiations. We believe we will be able to improve our gross margin over time by leveraging our existing infrastructure as volumes increase.
In any given quarter, gross margins can fluctuate based on a number of factors, including the mix of optical line system footprint versus capacity utilization, product mix, customer mix and overall volume.
Amortization of Intangible Assets
2023 Compared to 2022. Amortization of intangible assets decreased by $12.5 million, or 54%, in 2023 from 2022. The decrease was due to certain developed technology assets that were fully amortized in 2022.
Restructuring and Other Related Costs
2023 Compared to 2022. Restructuring and other related costs increased by $2.0 million in 2023 from 2022. The increase was due to the 2023 Restructuring Plan and the costs incurred comprised of severance and related payroll charges. See Note 8, “Restructuring and Other Related Costs” to the notes to consolidated financial statements for more information on our restructuring plans.
Operating Expenses
The following tables summarize our operating expenses for the periods presented (in thousands, except percentages):
| | | | | | | | | | | | | | | | | | | | | | | | | | | | | | | | | | | |
| | Years Ended | | | |
| | December 30, 2023 | | % of total
revenue | | December 31, 2022 | | % of total
revenue | | Change | | % Change |
| Research and development | $ | 316,879 | | | 20 | % | | $ | 306,188 | | | 19 | % | | $ | 10,691 | | | 3 | % |
| Sales and marketing | 166,938 | | | 10 | % | | 146,445 | | | 9 | % | | 20,493 | | | 14 | % |
| General and administrative | 124,874 | | | 8 | % | | 118,602 | | | 8 | % | | 6,272 | | | 5 | % |
| Amortization of intangible assets | 12,344 | | | 1 | % | | 14,576 | | | 1 | % | | (2,232) | | | (15) | % |
| | | | | | | | | | | |
| Restructuring and other related costs | 6,717 | | | — | % | | 10,122 | | | 1 | % | | (3,405) | | | (34) | % |
| Total operating expenses | $ | 627,752 | | | 39 | % | | $ | 595,933 | | | 38 | % | | $ | 31,819 | | | 5 | % |
| | | | | | | | | | | | | | | | | | | | | | | | | | | | | | | | | | | |
| | Years Ended | | | | |
| | December 31,
2022 | | % of total
revenue | | December 25,
2021 | | % of total
revenue | | Change | | % Change |
| Research and development | $ | 306,188 | | | 19 | % | | $ | 299,894 | | | 21 | % | | $ | 6,294 | | | 2 | % |
| Sales and marketing | 146,445 | | | 9 | % | | 138,829 | | | 10 | % | | 7,616 | | | 5 | % |
| General and administrative | 118,602 | | | 8 | % | | 115,415 | | | 8 | % | | 3,187 | | | 3 | % |
| Amortization of intangible assets | 14,576 | | | 1 | % | | 17,455 | | | 1 | % | | (2,879) | | | (16) | % |
| Acquisition and integration costs | — | | | — | % | | 614 | | | — | % | | (614) | | | (100) | % |
| Restructuring and other related costs | 10,122 | | | 1 | % | | 13,246 | | | 1 | % | | (3,124) | | | (24) | % |
| Total operating expenses | $ | 595,933 | | | 38 | % | | $ | 585,453 | | | 41 | % | | $ | 10,480 | | | 2 | % |
The following table summarizes the stock-based compensation expense included in our operating expenses for the periods presented (in thousands):
| | | | | | | | | | | | | | | | | |
| | Years Ended |
| | December 30, 2023 | | December 31, 2022 | | December 25,
2021 |
| Research and development | $ | 22,474 | | | $ | 23,553 | | | $ | 18,554 | |
| Sales and marketing | 13,699 | | | 13,311 | | | 12,345 | |
| General and administration | 15,977 | | | 14,666 | | | 12,985 | |
| Total | $ | 52,150 | | | $ | 51,530 | | | $ | 43,884 | |
Research and Development Expenses
2023 Compared to 2022. Research and development expenses increased by $10.7 million, or 3%, in 2023 from 2022. The increase was primarily attributable to increases in employee-related expenses, outside professional services and depreciation expense. In 2024, we expect to make additional targeted investments focused on product enhancements to both new and existing products. Our goal is to continue expanding the breadth and performance of our product portfolio while simultaneously driving down component costs through design innovation, which we believe will ultimately result in additional market share capture.
Sales and Marketing Expenses
2023 Compared to 2022. Sales and marketing expenses increased by $20.5 million, or 14%, in 2023 from 2022. This increase was driven by higher employee-related expenses, increased travel, higher trials and marketing-related costs. In 2024, we plan to modestly grow this spend and strategically invest in our go-to-market programs in an effort to expand our customer reach to drive long-term market share gains.
General and Administrative Expenses
2023 Compared to 2022. General and administrative expenses increased by $6.3 million, or 5%, in 2023 from 2022. The increase was attributable to higher employee-related expenses, higher depreciation expense and increased indirect taxes, partially offset by lower litigation spend and lower outside professional fees. In 2024, we anticipate a modest increase in general and administrative expenses as we invest in system automation initiatives, personnel and other outside professional services.
Amortization of Intangible Assets
2023 Compared to 2022. Amortization of intangible assets decreased by $2.2 million or 15%, in 2023 from 2022. The decrease was largely due to lower amortization of certain customer relationships and backlog being fully amortized in the first quarter of 2023.
Restructuring and Other Related Costs
2023 Compared to 2022. Restructuring and other related costs decreased by $3.4 million, or 34%, in 2023 compared to 2022. The decrease was primarily due to lower lease-related impairment charges in 2023. See Note 8, “Restructuring and Other Related Costs” to the notes to consolidated financial statements for more information on our restructuring plans.
Other Income (Expense), Net
| | | | | | | | | | | | | | | | | |
| | Years Ended |
| | December 30, 2023 | | December 31, 2022 | | December 25,
2021 |
| | | | | |
| | (In thousands) |
| Interest income | $ | 2,716 | | | $ | 893 | | | $ | 455 | |
| Interest expense | (30,609) | | | (26,015) | | | (49,099) | |
| Gain on extinguishment of debt | — | | | 15,521 | | | — | |
| Other gain (loss), net | 15,325 | | | 14,247 | | | (22,667) | |
| Total other income (expense), net | $ | (12,568) | | | $ | 4,646 | | | $ | (71,311) | |
2023 Compared to 2022. Interest income increased by $1.8 million in 2023 compared to 2022 primarily due to increased interest from investments in money market funds.
Interest expense increased by $4.6 million in 2023 compared to 2022. The increase in interest expense was primarily due to the issuance of the $373.8 million and $100.0 million, aggregate principal amount of the Existing 2028 Notes and the Additional 2028 Notes in August 2022 and June 2023, respectively, partially offset by repurchase of the 2024 Notes. See Note 11, “Debt” to the notes to consolidated financial statements for more information.
Gain on extinguishment of debt was $15.5 million in 2022 due to the partial repurchase of our 2024 Notes at a price that was below their par value. The gain includes and was reduced by the write-off of related deferred issuance costs of $3.5 million.
The change in other gain (loss), net, 2023 compared to 2022, was $1.1 million primarily due to an increase in foreign exchange gains driven by foreign currency exchange rate changes.
Provision for Income Taxes
We recognized an income tax expense of $7.8 million on a loss before income taxes of $17.4 million, and $20.5 million on a loss before income taxes of $55.5 million, in 2023 and 2022, respectively. The resulting effective tax rates were (44.8)% and (37.1)% for 2023 and 2022, respectively. The 2023 and 2022 effective tax rates differ from the expected statutory rate of 21% based on state income taxes, tax credits, stock-based compensation expenses, foreign income taxed at different rates, impact due to foreign currency translation, foreign income inclusions in the U.S., foreign tax credit expiration, and losses in foreign jurisdictions that require a valuation allowance. The decrease in 2023 income tax provision compared to 2022 is due to benefit received from material foreign discrete.
Because of our U.S. operating loss in 2023, significant loss carryforward position, and corresponding valuation allowance in all years, other than separate filing state taxes, a few combined states and minimum taxes, we have not been subject to federal or state tax on our U.S. income because of the availability of loss carryforwards. If these losses and other tax attributes become fully utilized, our taxes will increase significantly to a more normalized, expected rate on U.S. earnings. The release of transfer pricing reserves in the future may have a beneficial impact to tax expense, but the timing of the impact depends on factors such as expiration of the statute of limitations or settlements with tax authorities. No significant releases are expected in the near future based on information available at this time.
Liquidity and Capital Resources
| | | | | | | | | | | | | | | | | |
| | Years Ended |
| | December 30, 2023 | | December 31, 2022 | | December 25,
2021 |
| (In thousands) |
| |
| Net cash flow provided by (used in): | | | | | |
| Operating activities | $ | 49,510 | | | $ | (37,560) | | | $ | 28,128 | |
| Investing activities | $ | (62,314) | | | $ | (46,053) | | | $ | (41,379) | |
| Financing activities | $ | 13,713 | | | $ | 82,346 | | | $ | (101,544) | |
| | | | | | | | | | | |
| | Years Ended |
| | December 30, 2023 | | December 31, 2022 |
| | | |
| | (In thousands) |
| Cash and cash equivalents | $ | 172,505 | | | $ | 178,657 | |
| Restricted cash | 1,354 | | | 10,546 | |
| $ | 173,859 | | | $ | 189,203 | |
Our restricted cash balance amounts are primarily pledged as collateral for certain standby letters of credit related to customer performance guarantees, value added tax licenses and property leases.
Operating Activities
Net cash provided by operating activities was $49.5 million for 2023, as compared to net cash used in operating activities of $37.6 million for 2022 and net cash provided by operating activities of $28.1 million for 2021.
Net loss for 2023 was $25.2 million, which included non-cash charges of $152.6 million such as depreciation, stock-based compensation, amortization of intangibles assets, operating lease expense, restructuring charges and related costs, and amortization of debt issuance costs, compared to a net loss of $76.0 million in 2022, which included non-cash charges of $152.1 million. Net cash used in working capital was $77.9 million in 2023. Accounts receivable decreased by $38.5 million due to timing of billings and collections. Inventory levels increased by $57.9 million due to changes in customer order patterns that reduced the amount of inventory drawdown following our efforts to build inventory to manage previous lead time challenges. Prepaid and other assets decreased by $9.7 million primarily due to decrease in customer contract assets. Accounts payable decreased by $2.9 million primarily due timing of payments to suppliers. Accrued liabilities and other expenses decreased by $40.1 million primarily due to lower contract manufacturing accruals and decreases in accrued taxes, partially offset by increases in restructuring and other compensation related expenses. Deferred revenue decreased by $25.3 million due to amortization of maintenance renewals during the period.
Net loss for 2022 was $76.0 million, which included non-cash charges of $152.1 million such as depreciation, stock-based compensation, amortization of intangibles assets, operating lease expense, restructuring charges and related costs, and amortization of debt issuance costs, compared to a net loss of $170.8 million in 2021, which included non-cash charges of $193.8 million. Net cash used in working capital was $113.7 million in 2022. Accounts receivable increased by $69.0 million due to higher billings to customers and timing of collections. Inventory levels increased by $89.5 million due to our efforts to purchase more inventory to manage lead time challenges resulting from the industry-wide supply chain environment. Prepaid and other assets increased by $34.0 million primarily due to increase in contract manufacturer deposits and increase in customer contract assets. Accounts payable increased by $88.3 million primarily due timing of payments to suppliers. Accrued liabilities and other expenses decreased by $24.4 million primarily due to timing of payments of other compensation related expenses and decreased restructuring and tax liabilities. Deferred revenue
increased by $15.1 million due to higher maintenance renewals during the period attributable to expanding our installed base. Maintenance contracts are typically contracted on an annual or multi-year basis.
Investing Activities
Net cash used in investing activities was for the purchase of property and equipment and amounted to $62.3 million and $46.1 million for 2023 and 2022, respectively. The increase was primarily due to capital expenditures related to laboratory and manufacturing equipment.
Financing Activities
Net cash provided by financing activities was $13.7 million for 2023. Financing activities in 2023 primarily included net proceeds of $15.3 million from issuance of the 2028 Notes and partial repurchase of the 2024 Notes, and $14.9 million from the issuance of shares of our common stock under the ESPP. These proceeds were offset by $10.4 million term license purchases, $2.1 million payment of debt issuance costs incurred in connection with the issuance of the 2028 Notes and entering into the asset-based revolving credit facility under the Loan Agreement, $1.0 million payments on finance lease obligations, and tax withholdings in the amount of $2.5 million paid on behalf of certain employees for net share settlements of restricted stock units (“RSUs”).
Net cash provided by financing activities was $82.3 million for 2022. Financing activities in 2022 primarily included net proceeds of $92.9 million from issuance of the 2028 Notes and partial repurchase of the 2024 Notes, and $15.2 million from the issuance of shares of our common stock under the ESPP. These proceeds were offset by $7.7 million term license purchases, $12.5 million payment of debt issuance costs incurred in connection with the issuance of the 2028 Notes and entering into the asset-based revolving credit facility under the Loan Agreement, $1.3 million payments on finance lease obligations, and tax withholdings in the amount of $3.7 million paid on behalf of certain employees for net share settlements of RSUs.
Liquidity
We believe that our current cash, along with the Credit Facility (as defined below) will be sufficient to meet our anticipated cash needs for working capital and capital expenditures, the repayment of our 2024 Notes and the interest payments on the 2027 Notes, the 2028 Notes and the Credit Facility for at least 12 months. If the impact to our business and financial position from weakness in the global economy, banking sector and financial markets is more extensive or prolonged than expected and our existing sources of cash are insufficient to satisfy our liquidity requirements, we may require additional capital from equity or debt financings to fund our operations, to respond to competitive pressures or strategic opportunities, or otherwise. In addition, we are continuously evaluating alternatives for efficiently funding our capital expenditures and ongoing operations. We may, subject to market conditions and other considerations, from time to time engage in a variety of financing transactions for such purposes, including the issuance of securities or the incurrence of additional debt and the refinancing of existing debt. We may not be able to secure timely additional financing, or restructure existing debt, on favorable terms or at all. The terms of any additional financings or restructurings may place limits on our financial and operating flexibility. If we raise additional funds through further issuances of equity or equity-linked securities, our existing stockholders could suffer dilution in their percentage ownership of us, and any new securities we issue could have rights, preferences and privileges senior to those of holders of our common stock.
On August 8, 2022, and on June 16, 2023, we issued the Existing 2028 Notes, and the Additional 2028 Notes, respectively which will mature on August 1, 2028, unless earlier repurchased, redeemed or converted. Interest is payable semi-annually in arrears on February 1 and August 1 of each year, which commenced on February 1, 2023. In the event that all of the 2028 Notes are converted, we would be required to repay the principal amount in cash and the conversion premium in any combination of cash and shares of its common stock at our election.
The net proceeds from the issuance of the Additional 2028 Notes, after deducting the repurchase price for the 2024 Notes and offering expenses and fees, was approximately $12.5 million. We used the net proceeds from this offering for general corporate purposes, including working capital and to fund growth and potential strategic projects.
On March 9, 2020, we issued the 2027 Notes, which will mature on March 1, 2027, unless earlier repurchased, redeemed or converted. Interest is payable semi-annually in arrears on March 1 and September 1 of each year, which commenced on September 1, 2020. For the conversion obligation, we intend to pay or deliver, as the case may be, cash, shares of our common stock, or a combination of cash and shares of our common stock, at our election.
On September 11, 2018, we issued the 2024 Notes, which will mature on September 1, 2024, unless earlier repurchased, redeemed or converted. Interest is payable semi-annually in arrears on March 1 and September 1 of each year, which commenced on March 1, 2019. For the conversion obligation, we intend to pay or deliver, as the case may be, cash, shares of our common stock, or a combination of cash and shares of our common stock, at our election.
For more information regarding the convertible senior notes, see Note 11, “Debt” to the notes to consolidated financial statements. Refer to the contractual obligations section below for future payment obligations.
On June 24, 2022, we entered into a Loan, Guaranty and Security Agreement (the "Loan Agreement") with the lenders party thereto, and Bank of America, N.A., as agent. The Loan Agreement provides for a senior secured asset-based revolving credit facility of up to $200 million (the "Credit Facility"), which we may draw upon from time to time. We may increase the total commitments under the revolving credit facility by up to an additional $100 million, subject to certain conditions. In addition, the Loan Agreement provides for a $50 million letter of credit subfacility and a $20 million swingline loan facility.
As of December 30, 2023, we had no drawings on the Credit Facility and we had availability of $177.7 million under the Credit Facility. For more information regarding the Credit Facility, see Note 11, “Debt” to the notes to consolidated financial statements.
As of December 30, 2023, we had $173.9 million of cash, cash equivalents and restricted cash including $48.1 million of cash held by our foreign subsidiaries. Our policy with respect to undistributed foreign subsidiaries' earnings is to consider those earnings to be indefinitely reinvested. As a result of the enactment in the United States of the Tax Cuts and Jobs Act of 2017 (the "Jobs Act"), if and when funds are actually distributed in the form of dividends or otherwise, we expect minimal tax consequences, including foreign withholding taxes, which would be applicable in some jurisdictions.
We had standby letters of credit and bank guarantees as of the years ended December 30, 2023 and December 31, 2022. See Note 13, “Guarantees” to the notes to consolidated financial statements for further information.
Contractual Obligations
The following is a summary of our contractual obligations as of December 30, 2023 and December 31, 2022 (in thousands):
| | | | | | | | | | | | | | | | | | | | | | | | | | |
| | December 30, 2023 | | December 31, 2022 | | Change | | % Change |
Operating leases(1) | | $ | 111,316 | | | $ | 71,903 | | | $ | 39,413 | | | 55 | % |
| Finance lease obligations | | 5,220 | | | 966 | | | 4,254 | | | 440 | % |
Purchase obligations(2) | | 466,346 | | | 744,777 | | | (278,431) | | | (37) | % |
2028 Notes, including interest(3) | | 562,579 | | | 457,572 | | | 105,007 | | | 23 | % |
2027 Notes, including interest(3) | | 217,500 | | | 222,500 | | | (5,000) | | | (2) | % |
2024 Notes, including interest(3) | | 19,145 | | | 107,015 | | | (87,870) | | | (82) | % |
| Mortgage payable, including interest | | 6,830 | | | 7,611 | | | (781) | | | (10) | % |
Total contractual obligations(4) | | $ | 1,388,936 | | | $ | 1,612,344 | | | $ | (223,408) | | | (14) | % |
(1)We lease facilities under non-cancelable operating lease agreements. These leases have varying terms that range from one to 14 years, and contain leasehold improvement incentives, rent holidays and escalation clauses. In addition, some of these leases have renewal options for up to six years. We also have contractual commitments to remove leasehold improvements and return certain properties to a specified condition when the leases terminate. See Note 12, "Commitments and Contingencies" to the notes to consolidated financial statements for more information.
(2)We have service agreements with certain production suppliers under which we are committed to purchase certain parts. The decrease in purchase obligations compared with the end of fiscal 2022 was primarily due to our efforts to reduce inventory and overall spend.
(3)For additional information regarding our asset-based revolving credit facility and 2028, 2027 and 2024 Notes, see Note 11, “Debt” to the notes to consolidated financial statements.
(4)Certain commitments and contingencies are not included in the table because we cannot reliably estimate the timing and amount of future payments, if any. For example, tax liabilities of $8.1 million related to uncertain tax positions and expected future payments to our pension and post-employment plans are excluded from the contractual obligation table because they do not represent contractual cash outflows as they are dependent on various factors. See Note 17, "Employee Benefit and Pension Plans" to the notes to consolidated financial statements for more information relating to our pension and post-retirement benefit plans.
Critical Accounting Policies and Estimates
Our consolidated financial statements are prepared in accordance with U.S. GAAP. These accounting principles require us to make certain estimates, assumptions and judgments that can affect the reported amounts of assets and liabilities and disclosure of contingent assets and liabilities as of the date of the consolidated financial statements, as well as the reported amounts of revenue and expenses during the periods presented. See Note 2, “Significant Accounting Policies” to the notes to consolidated financial statements, which is included in Part II, Item 8 of this Annual Report on Form 10-K. Financial Statements and Supplementary Data, which describes our significant accounting policies and methods used in preparation of our consolidated financial statements. Management believes that the estimates, assumptions and judgments upon which they rely are reasonable based upon information available to them at the time that these estimates and judgments are made. To the extent there are material differences between these estimates and actual results, our consolidated financial statements will be affected.
We believe our critical accounting policies and estimates are those related to revenue recognition, accounting for income taxes, and inventory valuation. Management considers these policies critical because they are both important to the portrayal of our financial condition and results of operations, and they require management to make judgments and estimates about inherently uncertain matters.
Revenue Recognition
We recognize revenue when control of the promised goods or services is transferred to our customers, in an amount that reflects the consideration we expect to be entitled to in exchange for those goods or services.
We determine revenue recognition by applying the following five-step approach:
•identification of the contract, or contracts, with a customer;
•identification of the performance obligations in the contract;
•determination of the transaction price;
•allocation of the transaction price to the performance obligations in the contract; and
•recognition of revenue when, or as, we satisfy a performance obligation.
Many of our product sales are sold in combination with installation and deployment services along with initial hardware and software support. Our product sales are also sold at times with spares management, on-site hardware replacement services, network operations management, software subscription services, extended hardware warranty and training. Initial software and hardware support services are generally delivered over a one-year period in connection with the initial purchase. Software warranty provides customers with maintenance releases during the warranty support period and hardware warranty provides replacement or repair of equipment that fails to perform in line with specifications. Software subscription services include software warranty and additionally provides customers with rights to receive unspecified software product upgrades released during the support period.
Spares management and on-site hardware replacement services include the replacement of defective units at customer sites in accordance with specified service level agreements. Network operations management includes the day-to-day operation of a customer's network. These services are generally delivered on an annual basis. We evaluate each promised good and service in a contract to determine whether it represents a distinct performance obligation or should be accounted for as a combined performance obligation.
Services revenue includes software subscription services, installation and deployment services, spares management, on-site hardware replacement services, network operations management, extended hardware warranty and training. Revenue from software subscription services, spares management, on-site hardware replacement services, network operations management and extended hardware warranty contracts is deferred and is recognized ratably over the contractual support period, which is generally one year, as services are provided over the course of the entire period. Revenue related to training and installation and deployment services is recognized upon completion of the services.
Contracts and customer purchase orders are generally used to determine the existence of an arrangement. In addition, shipping documents and customer acceptances, when applicable, are used to verify delivery and transfer of title. We typically satisfy our performance obligations upon shipment or delivery of product depending on the contractual terms. Payment terms to customers generally range from net 30 to 120 days from invoice, which are considered to be standard payment terms. We assess our ability to collect from our customers based primarily on the creditworthiness and past payment history of the customer.
Customer product returns are generally approved on a case by case basis. Specific reserve provisions are made based upon a specific review of all the approved product returns where the customer has yet to return the products to generate the related sales return credit at the end of a period. Estimated sales returns are recorded as a reduction to revenue.
For sales to resellers, the same revenue recognition criteria apply. It is our practice to identify an end-customer prior to shipment to a reseller. We do not offer rights of return or price protection to our resellers.
We report revenue net of any required taxes collected from customers and remitted to government authorities, with the collected taxes recorded as current liabilities until remitted to the relevant government authority.
Customer Purchase Commitments
We sell software licenses that provide customers the ability to purchase incremental bandwidth capacity on an already-deployed piece of hardware. Instant Bandwidth-enabled systems generally include a specific initial capacity and incremental capacity can be added by the purchase of Instant Bandwidth licenses. Instant Bandwidth licenses are considered distinct performance obligations because customers can provision additional transmission capacity on demand without the deployment of any incremental equipment.
Some contracts commit the customer to purchase incremental Instant Bandwidth licenses within a specified time frame from the initial shipment of the Instant Bandwidth-enabled hardware. The time frame varies by customer and generally ranges between 12 to 24 months. If the customer does not purchase the additional capacity within the time frame as stated in the contract, we have the right to deliver and invoice such Instant Bandwidth licenses to the customer. Future committed licenses are considered to be additional performance obligations when a minimum purchase obligation is present, as evidenced by enforceable rights and obligations. As such, we are required to estimate the variable consideration for future Instant Bandwidth licenses as part of determining the contract transaction price.
Contract Termination Rights
The contract term is determined on the basis of the period over which the parties to the contract have present enforceable rights and obligations. Certain customer contracts include a termination for convenience clause that allows the customer to terminate services without penalty, upon advance notification. For such contracts, the service duration is limited to the non-cancelable portion of the contract.
Variable Consideration
The consideration associated with customer contracts is generally fixed. Variable consideration includes discounts, rebates, refunds, credits, incentives, penalties, or other similar items. The amount of consideration that can vary is not a substantial portion of total consideration.
Variable consideration estimates are re-assessed at each reporting period until a final outcome is determined. The changes to the original transaction price due to a change in estimated variable consideration will be applied on a retrospective basis, with the adjustment recorded in the period in which the change occurs.
Stand-alone Selling Price
The transaction price for a contract is allocated among the performance obligations on a relative SSP basis. The SSP is the price at which an entity would sell a promised product or service separately to a customer.
While certain services we sell have readily observable SSPs, the majority of our products and services are generally not sold on a stand-alone basis and therefore SSPs for such products and services are not directly observable. If there is no observable SSP, it is estimated using judgment and considering all reasonably available information, including but not limited to, gross margin objectives, pricing practices in customer contracts with multiple goods and services, internal costs, historical profitability data, competitor pricing strategies, as well as other observable inputs. The determination of SSPs for performance obligation is assessed on a periodic basis and estimates are revised to reflect any significant changes to underlying assumptions, as needed.
Transaction Price Allocated to the Remaining Performance Obligation
Our remaining performance obligations represent the transaction price allocated to performance obligations that are unsatisfied or partially satisfied, as of period end, consisting of deferred revenue and non-cancellable backlog. Our backlog represents purchase orders received from customers for future product shipments and services that are unsatisfied or partially satisfied as of period end. Our backlog is subject to future events that could cause the amount or timing of the related revenue to change. Orders in backlog may be fulfilled several quarters following receipt or may relate to multi-year support service obligations.
Accounting for Income Taxes
As part of the process of preparing our consolidated financial statements, we are required to estimate our taxes in each of the jurisdictions in which we operate. We estimate actual current tax expense together with assessing temporary differences resulting from different treatment of items, such as accruals and allowances not currently deductible for tax purposes. These differences result in deferred tax assets and liabilities, which are included in our consolidated balance sheets. In general, deferred tax assets represent future tax benefits to be received when certain expenses previously recognized in our consolidated statements of operations become deductible expenses under applicable income tax laws or loss, or credit carryforwards are utilized. Accordingly, realization of our deferred tax assets is dependent on future taxable income within the respective jurisdictions against which these deductions, losses and credits can be utilized within the applicable future periods.
We must assess the likelihood that some portion or all of our deferred tax assets will be recovered from future taxable income within the respective jurisdictions. To the extent the Company believes that recovery does not meet the “more-likely-than-not” standard, it must establish a valuation allowance. The ultimate realization of deferred tax assets is dependent upon the generation of future taxable income during the periods in which those temporary differences become deductible. Management judgment is required in determining its provision for income taxes, its deferred tax assets and liabilities and any valuation allowance recorded against our net deferred tax assets. In evaluating the need for a full or partial valuation allowance, all positive and negative evidence must be considered, including the Company's forecast of taxable income over the applicable carryforward periods, its current financial performance, its market environment, and other factors. Based on the available objective evidence, at December 30, 2023, management believes it is not more likely than not that the domestic net deferred tax assets will be realizable in the foreseeable future. Accordingly, the domestic net deferred tax assets are subject to a full valuation allowance. To the extent that the Company determines that deferred tax assets are realizable on a more likely than not basis, and an adjustment is needed, that adjustment will be recorded in the period that the determination is made.
Inventory Valuation
Inventories consist of raw materials, work-in-process and finished goods and are stated at standard cost adjusted to approximate the lower of actual cost or net realizable value. Costs are recognized utilizing the first-in, first-out method. Net realizable value is based upon an estimated selling price reduced by the estimated cost of disposal. The determination of market value involves numerous judgments including estimated average selling prices based upon recent sales volumes, industry trends, existing customer orders, current contract price, future demand and pricing and technological obsolescence of our products.
Inventory that is obsolete or in excess of our forecasted demand or is anticipated to be sold at a loss is written down to its estimated net realizable value based on historical usage and expected demand. In valuing our inventory costs and deferred inventory costs, we considered whether the net realizable value of inventory delivered or expected to be delivered at less than cost, primarily comprised of common equipment, had declined. We concluded that, in the instances where the net realizable value of inventory delivered or expected to be delivered was less than cost, it was appropriate to value the inventory costs and deferred inventory costs at cost or net realizable value, whichever is lower, thereby recognizing the cost of the reduction in net realizable value of inventory in the period in which the reduction occurred or can be reasonably estimated. We have, therefore, recognized inventory write-downs as necessary in each period in order to reflect inventory at the lower of actual cost or net realizable value.
We consider whether we should accrue losses on firm purchase commitments related to inventory items. Given that the net realizable value of common equipment is below contractual purchase price, we have also recorded losses on these firm purchase commitments in the period in which the commitment is made. When the inventory parts related to these firm purchase commitments are received, that inventory is recorded at the purchase price less the accrual for the loss on the purchase commitment.
Recent Accounting Pronouncements
See Note 2, “Significant Accounting Policies” to the notes to consolidated financial statements for a full description of recent accounting pronouncements including the respective expected dates of adoptions and effects on us.
ITEM 7A. QUANTITATIVE AND QUALITATIVE DISCLOSURES ABOUT MARKET RISK
Foreign Currency Risk
We operate in international markets, which expose us to market risk associated with foreign currency exchange rate fluctuations between the U.S. dollar and various foreign currencies, the most significant of which is the euro. The majority of our revenue contracts are denominated in U.S. dollars, with the most significant exception being in Europe, where we invoice primarily in euros. Additionally, a portion of our expenses, primarily the cost of personnel for research and development and sales and sales support to deliver technical support on our products and professional services and the cost to manufacture, are denominated in foreign currencies, primarily the Indian rupee, the euro, the SEK and the British pound. Revenue resulting from selling in local currencies and costs incurred in local currencies are exposed to foreign currency exchange rate fluctuations that can affect our operating income. As exchange rates vary, operating income may differ from expectations.
We may enter into foreign currency exchange forward contracts to reduce the impact of currency exchange rate movements on certain transactions from time to time, but do not cover all foreign-denominated transactions and therefore do not entirely eliminate the impact of fluctuations in exchange rates that could negatively affect our results of operations and financial condition. We also may enter into foreign currency exchange forward contracts to reduce the impact of foreign currency fluctuations on certain non-functional currency denominated account balances primarily in euros and British pounds from time to time. As a result, we do not expect a significant impact to our results from a change in exchange rates on foreign denominated non-functional account balances in the near-term. Gains and losses on these contracts are intended to offset the impact of foreign exchange rate fluctuations on the underlying foreign currency denominated non-functional currency account balances. Accordingly, the effect of an immediate 10% adverse change in foreign exchange rates on these transactions during 2023 would not be material to our results of operations.
Interest Rate Risk
We had cash, cash equivalents and restricted cash totaling $173.9 million and $189.2 million as of December 30, 2023 and December 31, 2022, respectively. The unrestricted cash is held for working capital purposes. We do not enter into investments for speculative purposes. The effect of an immediate 10% adverse change in interest rates would not be material to our results of operations.
The 2024 Notes, 2027 Notes and 2028 Notes have a fixed annual interest rate of 2.125%, 2.50% and 3.75%, respectively, and, therefore, we do not have economic interest rate exposure on the convertible senior notes. However, the fair values of the convertible senior notes are subject to interest rate risk, credit risk and other factors due to the convertible feature. The fair value of the convertible senior notes will generally increase as interest rates fall and decrease as interest rates rise. In addition, the fair value of the convertible senior notes will generally increase as our common stock price increases and will generally decrease as our common stock price declines in value. The fair value of the convertible senior notes will generally increase as our credit worthiness improves and decrease when our creditworthiness weakens. The interest and market value changes affect the fair value of the convertible senior notes but do not impact our financial position, cash flows or results of operations due to the fixed nature of the debt obligation. Additionally, we do not carry the convertible senior notes at fair value. We present the fair value for required disclosure purposes only. As of December 30, 2023, the fair value of the 2024 Notes, 2027 Notes and 2028 Notes was $18.0 million, $183.2 million and $457.4 million, respectively. The fair value was determined based on the estimated fair value or quoted bid price as applicable of the 2024 Notes, 2027 Notes and 2028 Notes in an over-the-counter market on December 29, 2023. The convertible senior notes are classified as Level 2 of the fair value hierarchy.
Holders may convert the convertible senior notes prior to maturity upon the occurrence of certain circumstances. Upon conversion, we will pay or deliver, as the case may be, cash, shares of our common stock or a combination of cash and shares of our common stock, at our election (provided, however, that with respect to the 2028 Notes, we would be required to repay the principal amount in cash and the conversion premium in any combination of cash and shares of our common stock at our election). If our common stock price is above the initial conversion price of $9.87, $7.66 and $6.80 for the 2024 Notes, 2027 Notes and 2028 Notes, respectively, upon conversion or at maturity, the amount of cash or shares of common stock required to pay the conversion premium is not fixed and would increase if our common stock price increases.
See Note 11, “Debt” to the notes to consolidated financial statements for further information.
ITEM 8. FINANCIAL STATEMENTS AND SUPPLEMENTARY DATA
INDEX TO CONSOLIDATED FINANCIAL STATEMENTS
Report of Independent Registered Public Accounting Firm
To the Stockholders and the Board of Directors of Infinera Corporation
Opinion on the Financial Statements
We have audited the accompanying consolidated balance sheets of Infinera Corporation (the Company) as of December 30, 2023 and December 31, 2022, the related consolidated statements of operations, comprehensive income (loss), stockholders’ equity and cash flows for each of the three years in the period ended December 30, 2023, and the related notes and the financial statement schedule listed in the Index at Item 15(a) (collectively referred to as the “consolidated financial statements”). In our opinion, the consolidated financial statements present fairly, in all material respects, the financial position of the Company at December 30, 2023 and December 31, 2022, and the results of its operations and its cash flows for each of the three years in the period ended December 30, 2023, in conformity with U.S. generally accepted accounting principles.
We also have audited, in accordance with the standards of the Public Company Accounting Oversight Board (United States) (PCAOB), the Company's internal control over financial reporting as of December 30, 2023, based on criteria established in Internal Control-Integrated Framework issued by the Committee of Sponsoring Organizations of the Treadway Commission (2013 framework) and our report dated May 17, 2024, expressed an adverse opinion thereon.
Adoption of ASU No. 2020-06
As discussed in Note 11 to the consolidated financial statements, the Company changed its method for accounting for convertible debt in the year ended December 31, 2022 due to the adoption of Accounting Standards Update ASU No. 2020-06, Debt—Debt with Conversion and Other Options (Subtopic 470-20) and Derivatives and Hedging—Contracts in Entity’s Own Equity (Subtopic 815-40): Accounting for Convertible Instruments and Contracts in an Entity’s Own Equity.
Basis for Opinion
These financial statements are the responsibility of the Company's management. Our responsibility is to express an opinion on the Company’s financial statements based on our audits. We are a public accounting firm registered with the PCAOB and are required to be independent with respect to the Company in accordance with the U.S. federal securities laws and the applicable rules and regulations of the Securities and Exchange Commission and the PCAOB.
We conducted our audits in accordance with the standards of the PCAOB. Those standards require that we plan and perform the audit to obtain reasonable assurance about whether the financial statements are free of material misstatement, whether due to error or fraud. Our audits included performing procedures to assess the risks of material misstatement of the financial statements, whether due to error or fraud, and performing procedures that respond to those risks. Such procedures included examining, on a test basis, evidence regarding the amounts and disclosures in the financial statements. Our audits also included evaluating the accounting principles used and significant estimates made by management, as well as evaluating the overall presentation of the financial statements. We believe that our audits provide a reasonable basis for our opinion.
Critical Audit Matters
The critical audit matters communicated below are matters arising from the current period audit of the financial statements that were communicated or required to be communicated to the audit committee and that: (1) relate to accounts or disclosures that are material to the financial statements and (2) involved our especially challenging, subjective or complex judgments. The communication of the critical audit matters does not alter in any way our opinion on the consolidated financial statements, taken as a whole, and we are not, by communicating the critical audit matters below, providing separate opinions on the critical audit matters or on the accounts or disclosures to which they relate.
Inventory Valuation
Description of the Matter
As discussed in Note 2 of the consolidated financial statements, the Company assesses the valuation of inventories, including raw materials, work-in-process, and finished goods, in each reporting period. Obsolete inventory or inventory in excess of management’s forecasted demand is written down to its estimated net realizable value if less than cost.
Auditing management’s estimates for excess and obsolete inventory involved subjective auditor judgement because the estimates rely on a number of factors that are affected by market and economic conditions outside the Company’s control. In particular, the excess and obsolete inventory calculations are sensitive to significant assumptions, including forecasted demand for the Company’s products. Additionally, auditing management’s judgments and estimates was complex as there were material weaknesses in internal controls over the information and judgements used in the estimation of reserves for excess and obsolete inventory.
How We Addressed the
Matter in Our Audit
After consideration of the material weaknesses, our audit procedures included, among others, evaluating the significant assumptions, including forecasted demand, and the accuracy and completeness of the underlying data management used to value excess and obsolete inventory by preparing a comparable analysis based on historical and subsequent period consumption and sales and compared the results to management’s forecasted demand. We obtained corroborative information about management’s estimated lifecycle of the Company’s products to support the quantities on hand. Where applicable we obtained evidence of contemporaneous communications with vendors, customers, or the Company’s Board of Directors to support the ability and intent to consume on hand inventory. We also tested the completeness and accuracy of underlying data used in management’s analysis, including historical and subsequent period consumption and sales. For certain assumptions or inputs, we performed sensitivity analyses to test the reasonableness of management’s judgements.
Revenue Recognition – Estimation of Stand-alone Selling Prices
Description of the Matter
As described in Note 2 to the consolidated financial statements, the Company’s contracts with customers generally contain promises to transfer products and services which are not sold separately. The Company allocates the transaction price for a contract among the performance obligations on a relative stand-alone selling price (SSP) basis.
Auditing management’s estimates of SSP of its various performance obligations was challenging and complex due to a lack of stand-alone sales transactions that provide observable evidence. Because of this lack of stand-alone sales transactions, the Company must apply judgment and consider all reasonably available information, including but not limited to gross margin objectives, pricing practices in customer contracts with multiple goods and services, internal costs, historical profitability data and other observable inputs when estimating SSP. Additionally, auditing management’s estimates of SSP was complex as there were material weaknesses in internal controls over the information and judgments used in the estimation of such prices.
How We Addressed the
Matter in Our Audit
After consideration of the material weaknesses, our audit procedures included, among others, evaluating the appropriateness of the Company’s estimates based on the Company’s gross margin objectives and pricing practices in customer contracts. We tested the completeness and accuracy of the data used in the SSP methodology, including cost data used in determining historical profitability and pricing practices. We evaluated the Company’s identification and consideration of available information, and the use of such information in estimating SSP. We tested the accuracy of the Company’s calculations of SSP. We also tested, for a sample of transactions, the Company’s allocation of the transaction price among performance obligations based on relative SSP.
/s/ Ernst & Young LLP
We have served as the Company’s auditor since 2001.
San Jose, California
May 17, 2024
Report of Independent Registered Public Accounting Firm
To the Stockholders and the Board of Directors of Infinera Corporation
Opinion on Internal Control over Financial Reporting
We have audited Infinera Corporation’s internal control over financial reporting as of December 30, 2023, based on criteria established in Internal Control—Integrated Framework issued by the Committee of Sponsoring Organizations of the Treadway Commission (2013 framework) (the COSO criteria). In our opinion, because of the effect of the material weaknesses described below on the achievement of the objectives of the control criteria, Infinera Corporation (the Company) has not maintained effective internal control over financial reporting as of December 30, 2023, based on the COSO criteria.
A material weakness is a deficiency, or combination of deficiencies, in internal control over financial reporting, such that there is a reasonable possibility that a material misstatement of the company’s annual or interim financial statements will not be prevented or detected on a timely basis. The following material weaknesses have been identified and included in management's assessment. Management has identified material weaknesses in controls related to the Company’s revenue cycle, inventory cycle, and with respect to these, their internal resources, expertise and policies required to maintain an effective control environment.
We also have audited, in accordance with the standards of the Public Company Accounting Oversight Board (United States) (PCAOB), the Company’s consolidated balance sheets as of December 30, 2023 and December 31, 2022, the related consolidated statements of operations, comprehensive income (loss), stockholders’ equity and cash flows for each of the three years in the period ended December 30, 2023, and the related notes and the financial statement schedule listed in the Index at Item 15(a) (collectively referred to as the “consolidated financial statements”). These material weaknesses were considered in determining the nature, timing and extent of audit tests applied in our audit of the December 30, 2023 consolidated financial statements, and this report does not affect our report dated May 17, 2024, which expressed an unqualified opinion thereon.
Basis for Opinion
The Company’s management is responsible for maintaining effective internal control over financial reporting and for its assessment of the effectiveness of internal control over financial reporting included in the accompanying Management’s Report on Internal Control over Financial Reporting. Our responsibility is to express an opinion on the Company’s internal control over financial reporting based on our audit. We are a public accounting firm registered with the PCAOB and are required to be independent with respect to the Company in accordance with the U.S. federal securities laws and the applicable rules and regulations of the Securities and Exchange Commission and the PCAOB.
We conducted our audit in accordance with the standards of the PCAOB. Those standards require that we plan and perform the audit to obtain reasonable assurance about whether effective internal control over financial reporting was maintained in all material respects.
Our audit included obtaining an understanding of internal control over financial reporting, assessing the risk that a material weakness exists, testing and evaluating the design and operating effectiveness of internal control based on the assessed risk, and performing such other procedures as we considered necessary in the circumstances. We believe that our audit provides a reasonable basis for our opinion.
Definition and Limitations of Internal Control Over Financial Reporting
A company’s internal control over financial reporting is a process designed to provide reasonable assurance regarding the reliability of financial reporting and the preparation of financial statements for external purposes in accordance with generally accepted accounting principles. A company’s internal control over financial reporting includes those policies and procedures that (1) pertain to the maintenance of records that, in reasonable detail, accurately and fairly reflect the transactions and dispositions of the assets of the company; (2) provide reasonable assurance that transactions are recorded as necessary to permit preparation of financial statements in accordance with generally accepted accounting principles, and that receipts and expenditures of the company are being made only in accordance with authorizations of management and directors of the company; and (3) provide reasonable assurance regarding prevention or timely detection of unauthorized acquisition, use, or disposition of the company’s assets that could have a material effect on the financial statements.
Because of its inherent limitations, internal control over financial reporting may not prevent or detect misstatements. Also, projections of any evaluation of effectiveness to future periods are subject to the risk that controls may become inadequate because of changes in conditions, or that the degree of compliance with the policies or procedures may deteriorate.
/s/ Ernst & Young LLP
San Jose, California
May 17, 2024
INFINERA CORPORATION
CONSOLIDATED BALANCE SHEETS
(In thousands, except par values)
| | | | | | | | | | | |
| December 30, 2023 | | December 31, 2022 |
| ASSETS | | | |
| Current assets: | | | |
| Cash and cash equivalents | $ | 172,505 | | | $ | 178,657 | |
| Short-term restricted cash | 517 | | | 7,274 | |
| Accounts receivable, net | 381,981 | | | 419,735 | |
| Inventory | 431,163 | | | 374,855 | |
| Prepaid expenses and other current assets | 129,218 | | | 152,451 | |
| Total current assets | 1,115,384 | | | 1,132,972 | |
| Property, plant and equipment, net | 206,997 | | | 172,929 | |
| Operating lease right-of-use assets | 39,973 | | | 34,543 | |
| Intangible assets, net | 24,819 | | | 47,787 | |
| Goodwill | 240,566 | | | 232,663 | |
| Long-term restricted cash | 837 | | | 3,272 | |
| Other long-term assets | 50,662 | | | 44,972 | |
| Total assets | $ | 1,679,238 | | | $ | 1,669,138 | |
| LIABILITIES AND STOCKHOLDERS’ EQUITY | | | |
| Current liabilities: | | | |
| Accounts payable | $ | 299,005 | | | $ | 304,880 | |
| Accrued expenses and other current liabilities | 110,758 | | | 141,450 | |
| Accrued compensation and related benefits | 85,203 | | | 78,849 | |
| Short-term debt, net | 25,512 | | | 510 | |
| Accrued warranty | 17,266 | | | 19,747 | |
| Deferred revenue | 136,248 | | | 158,501 | |
| Total current liabilities | 673,992 | | | 703,937 | |
| Long-term debt, net | 658,756 | | | 667,719 | |
| | | |
| Long-term accrued warranty | 15,934 | | | 16,874 | |
| Long-term deferred revenue | 21,332 | | | 23,178 | |
| Long-term deferred tax liability | 1,805 | | | 2,348 | |
| Long-term operating lease liabilities | 47,464 | | | 45,862 | |
| Other long-term liabilities | 43,364 | | | 29,573 | |
Commitments and contingencies (Note 12) | | | |
| Stockholders’ equity: | | | |
Preferred stock, $0.001 par value Authorized shares—25,000 and no shares issued and outstanding | — | | | — | |
Common stock, $0.001 par value Authorized shares—500,000 in 2023 and 500,000 in 2022 Issued and outstanding shares—230,994 in 2023 and 220,408 in 2022 | 231 | | | 220 | |
| Additional paid-in capital | 1,976,014 | | | 1,901,491 | |
| Accumulated other comprehensive loss | (34,848) | | | (22,471) | |
| Accumulated deficit | (1,724,806) | | | (1,699,593) | |
| Total stockholders' equity | 216,591 | | | 179,647 | |
| Total liabilities and stockholders’ equity | $ | 1,679,238 | | | $ | 1,669,138 | |
The accompanying notes are an integral part of these consolidated financial statements.
INFINERA CORPORATION
CONSOLIDATED STATEMENTS OF OPERATIONS
(In thousands, except per share data)
| | | | | | | | | | | | | | | | | | | |
| | Years Ended |
| | December 30, 2023 | | December 31, 2022 | | December 25, 2021 | | |
| Revenue: | | | | | | | |
| Product | $ | 1,304,229 | | | $ | 1,268,624 | | | $ | 1,099,376 | | | |
| Services | 309,899 | | | 304,618 | | | 325,829 | | | |
| Total revenue | 1,614,128 | | | 1,573,242 | | | 1,425,205 | | | |
| Cost of revenue: | | | | | | | |
| Cost of product | 810,845 | | | 852,476 | | | 732,071 | | | |
| Cost of services | 167,532 | | | 161,630 | | | 174,008 | | | |
| Amortization of intangible assets | 10,621 | | | 23,138 | | | 19,621 | | | |
| | | | | | | |
| Restructuring and other related costs | 2,218 | | | 222 | | | 1,531 | | | |
| Total cost of revenue | 991,216 | | | 1,037,466 | | | 927,231 | | | |
| Gross profit | 622,912 | | | 535,776 | | | 497,974 | | | |
| Operating expenses: | | | | | | | |
| Research and development | 316,879 | | | 306,188 | | | 299,894 | | | |
| Sales and marketing | 166,938 | | | 146,445 | | | 138,829 | | | |
| General and administrative | 124,874 | | | 118,602 | | | 115,415 | | | |
| Amortization of intangible assets | 12,344 | | | 14,576 | | | 17,455 | | | |
| Acquisition and integration costs | — | | | — | | | 614 | | | |
| Restructuring and other related costs | 6,717 | | | 10,122 | | | 13,246 | | | |
| Total operating expenses | 627,752 | | | 595,933 | | | 585,453 | | | |
| Loss from operations | (4,840) | | | (60,157) | | | (87,479) | | | |
| Other income (expense), net: | | | | | | | |
| Interest income | 2,716 | | | 893 | | | 455 | | | |
| Interest expense | (30,609) | | | (26,015) | | | (49,099) | | | |
| Gain on extinguishment of debt | — | | | 15,521 | | | — | | | |
Other gain (loss), net | 15,325 | | | 14,247 | | | (22,667) | | | |
| Total other income (expense), net | (12,568) | | | 4,646 | | | (71,311) | | | |
| Loss before income taxes | (17,408) | | | (55,511) | | | (158,790) | | | |
| Provision for income taxes | 7,805 | | | 20,532 | | | 11,988 | | | |
| Net loss | (25,213) | | | (76,043) | | | (170,778) | | | |
| | | | | | | |
| | | | | | | |
| Net loss per common share: | | | | | | | |
| Basic | $ | (0.11) | | | $ | (0.35) | | | $ | (0.82) | | | |
| Diluted | $ | (0.11) | | | $ | (0.35) | | | $ | (0.82) | | | |
| Weighted average shares used in computing net loss per common share: | | | | | | | |
| Basic | 226,726 | | | 216,376 | | | 207,377 | | | |
| Diluted | 226,726 | | | 216,376 | | | 207,377 | | | |
The accompanying notes are an integral part of these consolidated financial statements.
INFINERA CORPORATION
CONSOLIDATED STATEMENTS OF COMPREHENSIVE LOSS
(In thousands)
| | | | | | | | | | | | | | | | | |
| | | | Years Ended | | |
| | December 30, 2023 | | December 31, 2022 | | December 25, 2021 |
| Net loss | $ | (25,213) | | | $ | (76,043) | | | $ | (170,778) | |
| Other comprehensive income (loss), net of tax: | | | | | |
| | | | | |
| | | | | |
| Foreign currency translation adjustment and other | (9,962) | | | (40,839) | | | (8,561) | |
| | | | | |
Actuarial (loss) gain on pension liabilities | (2,002) | | | 22,538 | | | 12,580 | |
Amortization of net actuarial (gain) loss | (413) | | | 326 | | | 3,383 | |
| Net change in accumulated other comprehensive income (loss) | (12,377) | | | (17,975) | | | 7,402 | |
| Comprehensive loss | $ | (37,590) | | | $ | (94,018) | | | $ | (163,376) | |
The accompanying notes are an integral part of these consolidated financial statements.
INFINERA CORPORATION
CONSOLIDATED STATEMENTS OF STOCKHOLDERS’ EQUITY
For the Years Ended December 30, 2023, December 31, 2022 and December 25, 2021
(In thousands)
| | | | | | | | | | | | | | | | | | | | | | | | | | | | | | | | | | | | | | |
| | | Common Stock | | Additional
Paid-in
Capital | | Accumulated
Other
Comprehensive
Income (Loss) | | Accumulated
Deficit | | Total Stockholders' Equity |
| | | Shares | | Amount | |
Balance at December 26, 2020 | | 201,397 | | | $ | 201 | | | $ | 1,965,245 | | | $ | (11,898) | | | $ | (1,527,264) | | | $ | 426,284 | |
| Stock options exercised | | 46 | | | — | | | 332 | | | — | | | — | | | 332 | |
| | | | | | | | | | | | |
| | | | | | | | | | | | |
| ESPP shares issued | | 2,272 | | | 2 | | | 16,164 | | | — | | | — | | | 16,166 | |
| Shares withheld for tax obligations | | (808) | | | — | | | (7,178) | | | — | | | — | | | (7,178) | |
| Restricted stock units released | | 8,474 | | | 8 | | | — | | | — | | | — | | | 8 | |
| | | | | | | | | | | | |
| Stock-based compensation | | — | | | — | | | 51,535 | | | — | | | — | | | 51,535 | |
| | | | | | | | | | | | |
| | | | | | | | | | | | |
| | | | | | | | | | | | |
Other comprehensive income | | — | | | — | | | — | | | 7,402 | | | — | | | 7,402 | |
| Net loss | | — | | | — | | | — | | | — | | | (170,778) | | | (170,778) | |
Balance at December 25, 2021 | | 211,381 | | | $ | 211 | | | $ | 2,026,098 | | | $ | (4,496) | | | $ | (1,698,042) | | | $ | 323,771 | |
| | | | | | | | | | | | |
| | | | | | | | | | | | |
| | | | | | | | | | | | |
| ESPP shares issued | | 2,552 | | | 2 | | | 15,189 | | | — | | | — | | | 15,191 | |
| Shares withheld for tax obligations | | (550) | | | — | | | (3,714) | | | — | | | — | | | (3,714) | |
| Restricted stock units released | | 7,025 | | | 7 | | | — | | | — | | | — | | | 7 | |
Stock-based compensation and other | | — | | | — | | | 60,411 | | | — | | | — | | | 60,411 | |
Cumulative-effect adjustment from adoption of ASU 2020-06(1) | | — | | | — | | | (196,493) | | | — | | | 74,492 | | | (122,001) | |
| | | | | | | | | | | | |
Other comprehensive loss | | — | | | — | | | — | | | (17,975) | | | — | | | (17,975) | |
| Net loss | | — | | | — | | | — | | | — | | | (76,043) | | | (76,043) | |
Balance at December 31, 2022 | | 220,408 | | | $ | 220 | | | $ | 1,901,491 | | | $ | (22,471) | | | $ | (1,699,593) | | | $ | 179,647 | |
| ESPP shares issued | | 3,514 | | | 4 | | | 14,927 | | | — | | | — | | | $ | 14,931 | |
| Restricted stock units released | | 7,495 | | | 7 | | | — | | | — | | | — | | | 7 | |
| Shares withheld for tax obligations | | (423) | | | — | | | (2,465) | | | — | | | — | | | (2,465) | |
Stock-based compensation | | — | | | — | | | 62,061 | | | — | | | — | | | 62,061 | |
| Other comprehensive loss | | — | | | — | | | — | | | (12,377) | | | — | | | (12,377) | |
| Net loss | | — | | | — | | | — | | | — | | | (25,213) | | | (25,213) | |
Balance at December 30, 2023 | | 230,994 | | | $ | 231 | | | $ | 1,976,014 | | | $ | (34,848) | | | $ | (1,724,806) | | | $ | 216,591 | |
(1) Effective December 26, 2021, the Company adopted ASU 2020-06, Accounting for Convertible Instruments and Contracts in an Entity’s Own Equity ("ASU 2020-06"). Accordingly, the Company recorded a $196.5 million reduction to additional paid in capital and a net reduction to accumulated deficit of $74.5 million due to the cumulative of adopting this new standard.
The accompanying notes are an integral part of these consolidated financial statements.
INFINERA CORPORATION
CONSOLIDATED STATEMENTS OF CASH FLOWS
(In thousands)
| | | | | | | | | | | | | | | | | |
| | | | Years Ended | | |
| | December 30, 2023 | | December 31, 2022 | | December 25, 2021 |
| Cash Flows from Operating Activities: | | | | | |
| Net loss | $ | (25,213) | | | $ | (76,043) | | | $ | (170,778) | |
Adjustments to reconcile net loss to net cash provided by (used in) operating activities: | | | | | |
| Depreciation and amortization | 78,784 | | | 83,830 | | | 83,583 | |
| Non-cash restructuring charges and other related costs | 1,200 | | | 6,066 | | | 6,805 | |
| Amortization of debt discount and issuance costs | 3,862 | | | 6,109 | | | 32,455 | |
| | | | | |
| Operating lease expense | 7,464 | | | 9,421 | | | 14,993 | |
| | | | | |
| Stock-based compensation expense | 62,150 | | | 61,015 | | | 51,812 | |
| Gain on extinguishment of debt | — | | | (15,521) | | | — | |
| Other, net | (823) | | | 1,218 | | | 4,147 | |
| Changes in assets and liabilities: | | | | | |
| Accounts receivable | 38,511 | | | (69,024) | | | (45,783) | |
| Inventory | (57,864) | | | (89,527) | | | (28,022) | |
| Prepaid expenses and other current assets | 9,683 | | | (34,046) | | | (424) | |
| Accounts payable | (2,921) | | | 88,256 | | | 32,304 | |
| Accrued expenses and other current liabilities | (40,063) | | | (24,443) | | | 39,283 | |
| Deferred revenue | (25,260) | | | 15,129 | | | 7,753 | |
Net cash provided by (used in) operating activities | 49,510 | | | (37,560) | | | 28,128 | |
| Cash Flows from Investing Activities: | | | | | |
| | | | | |
| | | | | |
| | | | | |
| | | | | |
| | | | | |
| Purchase of property and equipment | (62,314) | | | (46,053) | | | (41,379) | |
| Net cash used in investing activities | (62,314) | | | (46,053) | | | (41,379) | |
| Cash Flows from Financing Activities: | | | | | |
| Proceeds from issuance of 2028 Notes | 98,751 | | | 373,750 | | | — | |
| Repayment of 2024 Notes | (83,446) | | | (280,842) | | | — | |
| Payment of debt issuance cost | (2,108) | | | (12,451) | | | — | |
| | | | | |
| | | | | |
| | | | | |
| | | | | |
| | | | | |
| Proceeds from asset-based revolving credit facility | 50,000 | | | 80,000 | | | — | |
| Repayment of asset-based revolving credit facility | (50,000) | | | (80,000) | | | (77,000) | |
| | | | | |
| Repayment of third-party manufacturing funding | — | | | — | | | (24,610) | |
| Repayment of mortgage payable | (510) | | | (533) | | | (350) | |
Principal payments on finance lease obligations | (1,023) | | | (1,314) | | | (1,631) | |
| Payment of term license obligation | (10,417) | | | (7,739) | | | (7,272) | |
| Proceeds from issuance of common stock | 14,931 | | | 15,189 | | | 16,497 | |
| Tax withholding paid on behalf of employees for net share settlement | (2,465) | | | (3,714) | | | (7,178) | |
| Net cash provided by (used in) financing activities | 13,713 | | | 82,346 | | | (101,544) | |
Effect of exchange rate changes on cash, cash equivalents, and restricted cash | (16,253) | | | (12,051) | | | 1,933 | |
| Net change in cash, cash equivalents, and restricted cash | (15,344) | | | (13,318) | | | (112,862) | |
| Cash, cash equivalents, and restricted cash at beginning of period | 189,203 | | | 202,521 | | | 315,383 | |
Cash, cash equivalents, and restricted cash at end of period(1) | $ | 173,859 | | | $ | 189,203 | | | $ | 202,521 | |
| | | | | |
| | | | | |
| | | | | | | | | | | | | | | | | |
| | | | Years Ended | | |
| | December 30, 2023 | | December 31, 2022 | | December 25, 2021 |
| Supplemental disclosures of cash flow information: | | | | | |
| Cash paid for income taxes, net | $ | 14,109 | | | $ | 15,126 | | | $ | 18,703 | |
| Cash paid for interest | $ | 22,394 | | | $ | 14,787 | | | $ | 18,261 | |
| Supplemental schedule of non-cash investing and financing activities: | | | | | |
| Transfer of inventory to fixed assets | $ | 1,847 | | | $ | 9,332 | | | $ | 2,279 | |
| | | | | |
| | | | | |
| | | | | |
| Property and equipment included in accounts payable and accrued liabilities | $ | 10,104 | | | $ | 7,435 | | | $ | 9,011 | |
| Unpaid term licenses (included in accounts payable, accrued liabilities and other long term liabilities) | $ | 23,326 | | | $ | 9,178 | | | $ | 9,339 | |
(1) Reconciliation of cash, cash equivalents and restricted cash to the consolidated balance sheets:
| | | | | | | | | | | | | | | | | |
| December 30, 2023 | | December 31, 2022 | | December 25, 2021 |
| | | | | |
| | (In thousands) |
| Cash and cash equivalents | $ | 172,505 | | | $ | 178,657 | | | $ | 190,611 | |
| Short-term restricted cash | 517 | | | 7,274 | | | 2,840 | |
| Long-term restricted cash | 837 | | | 3,272 | | | 9,070 | |
| Total cash, cash equivalents and restricted cash | $ | 173,859 | | | $ | 189,203 | | | $ | 202,521 | |
The accompanying notes are an integral part of these consolidated financial statements.
INFINERA CORPORATION
NOTES TO CONSOLIDATED FINANCIAL STATEMENTS
1. Organization and Basis of Presentation
Infinera Corporation (“Infinera” or the “Company”), headquartered in San Jose, California, was founded in December 2000 and incorporated in the State of Delaware. Infinera is a global supplier of networking solutions comprised of networking equipment, optical semiconductors, software and services. Infinera’s portfolio of solutions includes optical transport platforms, converged packet-optical transport platforms, optical line systems, disaggregated router platforms, and a suite of networking and automation software offerings, and support and professional services. Infinera leverages its U.S.-based compound semiconductor fab and in-house packaging capabilities to design, develop, and manufacture industry-leading indium phosphide-based photonic integrated circuits for use in its high-capacity optical communications products.
The Company operates and reports financial results on a fiscal year of 52 or 53 weeks ending on the last Saturday of December in each year. Accordingly, fiscal year 2023 was a 52-week year that ended on December 30, 2023. Fiscal year 2022 was a 53-week year that ended on December 31, 2022 and fiscal year 2021 was a 52-week year that ended on December 25, 2021. The next 53-week year will end on December 30, 2028.
The accompanying consolidated financial statements have been prepared in conformity with U.S. generally accepted accounting principles (“U.S. GAAP”) and pursuant to the rules and regulations of the U.S. Securities and Exchange Commission (the “SEC”). The consolidated financial statements include all adjustments necessary for a fair presentation of the Company's annual results. All adjustments are of a normal recurring nature.
The consolidated financial statements include the accounts for the Company and its subsidiaries and affiliates in the Company which the Company has a controlling financial interest or is the primary beneficiary. All inter-company balances and transactions have been eliminated. The Company reclassified certain amounts reported in previous periods to conform to the current presentation.
2. Significant Accounting Policies
Use of Estimates
The preparation of consolidated financial statements in conformity with U.S. GAAP requires management to make certain estimates, assumptions and judgments that can affect the reported amounts of assets and liabilities and disclosure of contingent assets and liabilities as of the date of the consolidated financial statements, as well as the reported amounts of revenue and expenses during the reporting periods. Estimates, assumptions and judgements made by management include inventory valuation, revenue recognition, accounting for income taxes, stock-based compensation, employee benefit and pension plans, manufacturing partner and supplier liabilities, allowances for sales returns, allowances for credit losses, useful life of intangibles and property, plant and equipment, impairment loss related to lease abandonment, accrued warranty, operating and finance lease liabilities, restructuring and other related costs and loss contingencies. The Company bases its assumptions on historical experience and also on assumptions that it believes are reasonable. Actual results could differ materially from those estimates. These estimates may change as new events occur and additional information emerges, and such changes are recognized or disclosed in the Company's consolidated financial statements.
Revenue Recognition
The Company recognizes revenue when control of the promised goods or services is transferred to its customers, in an amount that reflects the consideration the Company expects to be entitled to in exchange for those goods or services.
The Company determines revenue recognition by applying the following five-step approach:
•identification of the contract, or contracts, with a customer;
•identification of the performance obligations in the contract;
•determination of the transaction price;
•allocation of the transaction price to the performance obligations in the contract; and
INFINERA CORPORATION
NOTES TO CONSOLIDATED FINANCIAL STATEMENTS—(Continued)
•recognition of revenue when, or as, the Company satisfies a performance obligation.
Many of the Company's product sales are sold in combination with installation and deployment services along with initial hardware and software support. The Company's product sales are also sold at times with spares management, on-site hardware replacement services, network operations management, software subscription services, extended hardware warranty and training. Initial software and hardware support services are generally delivered over a one-year period in connection with the initial purchase. Software warranty provides customers with maintenance releases during the warranty support period and hardware warranty provides replacement or repair of equipment that fails to perform in line with specifications. Software subscription services include software warranty and additionally provides customers with rights to receive unspecified software product upgrades released during the support period.
Spares management and on-site hardware replacement services include the replacement of defective units at customer sites in accordance with specified service level agreements. Network operations management includes the day-to-day operation of a customer's network. These services are generally delivered on an annual basis. The Company evaluates each promised good and service in a contract to determine whether it represents a distinct performance obligation or should be accounted for as a combined performance obligation.
Services revenue includes software subscription services, installation and deployment services, spares management, on-site hardware replacement services, network operations management, extended hardware warranty and training. Revenue from software subscription services, spares management, on-site hardware replacement services, network operations management and extended hardware warranty contracts is recognized ratably over the contractual support period, which is generally one year, as services are provided over the course of the entire period. Revenue related to training and installation and deployment services is recognized upon completion of the services.
Contracts and customer purchase orders are generally used to determine the existence of an arrangement. In addition, shipping documents and customer acceptances, when applicable, are used to verify delivery and transfer of title. The Company typically satisfies its performance obligations upon shipment or delivery of product depending on the contractual terms. Payment terms to customers generally range from net 30 to 120 days from invoice, which are considered to be standard payment terms. The Company assesses its ability to collect from its customers based primarily on the creditworthiness and past payment history of the customer.
For sales to resellers, the same revenue recognition criteria apply. It is the Company’s practice to identify an end-customer prior to shipment to a reseller. The Company does not offer rights of return or price protection to its resellers.
The Company reports revenue net of any required taxes collected from customers and remitted to government authorities, with the collected taxes recorded as current liabilities until remitted to the relevant government authority.
Customer Purchase Commitments
The Company sells software licenses that provide customers the ability to purchase incremental `bandwidth capacity on an already-deployed piece of hardware. Infinera Instant Bandwidth-enabled systems generally include a specific initial capacity and incremental capacity can be added by the purchase of Instant Bandwidth licenses. Instant Bandwidth licenses are considered distinct performance obligations because customers can provision additional transmission capacity on demand without the deployment of any incremental equipment.
Some contracts commit the customer to purchase incremental Instant Bandwidth licenses within a specified time frame from the initial shipment of the Instant Bandwidth-enabled hardware. The time frame varies by customer and generally ranges between 12 to 24 months. If the customer does not purchase the additional capacity within the time frame as stated in the contract, the Company has the right to deliver and invoice such Instant Bandwidth licenses to the customer. Future committed licenses are considered to be additional performance obligations when a minimum purchase obligation is present, as evidenced by enforceable rights and obligations. As such, the Company is required to estimate the variable consideration for future Instant Bandwidth licenses as part of determining the contract transaction price.
INFINERA CORPORATION
NOTES TO CONSOLIDATED FINANCIAL STATEMENTS—(Continued)
Contract Termination Rights
The contract term is determined on the basis of the period over which the parties to the contract have present enforceable rights and obligations. Certain customer contracts include a termination for convenience clause that allows the customer to terminate services without penalty, upon advance notification. For such contracts, the service duration is limited to the non-cancelable portion of the contract.
Variable Consideration
The consideration associated with customer contracts is generally fixed. Variable consideration includes discounts, rebates, refunds, credits, incentives, penalties, or other similar items. The amount of consideration that can vary is not a substantial portion of total consideration.
Variable consideration estimates are re-assessed at each reporting period until a final outcome is determined. The changes to the original transaction price due to a change in estimated variable consideration will be applied on a retrospective basis, with the adjustment recorded in the period in which the change occurs.
Stand-alone Selling Price
The Company allocates the transaction price for a contract among the performance obligations on a relative stand-alone selling price (SSP) basis. The SSP is the price at which an entity would sell a promised product or service separately to a customer.
While certain services sold by the Company have readily observable SSPs, the majority of the Company's products and services are generally not sold on a stand-alone basis and therefore SSPs for such products and services are not directly observable. If there is no observable SSP, it is estimated using judgment and considering all reasonably available information including but not limited to, gross margin objectives, pricing practices in customer contracts with multiple goods and services, internal costs, historical profitability data, competitor pricing strategies, as well as other observable inputs. The determination of SSPs for performance obligations is assessed on a periodic basis and estimates are revised to reflect any significant changes to underlying assumptions as needed.
Shipping and Handling
The Company treats shipping and handling activities as costs to fulfill the Company's promise to transfer products. Shipping and handling fees billed to customers are recorded as a reduction to cost of product.
Capitalization of Costs to Obtain a Contract
The Company has assessed the treatment of costs to obtain or fulfill a contract with a customer. Under Accounting Standards Codification ("ASC") Topic 606, "Revenue from Contracts with Customers" ("ASC 606"), the Company capitalizes sales commissions related to multi-year service contracts, which are paid for upfront, and amortizes the asset over the period of benefit, which is the service period. Sales commissions paid on service contract renewals are commensurate with the sales commissions paid on the initial contracts. Sales commissions are expensed as incurred.
Transaction Price Allocated to the Remaining Performance Obligation
The Company’s remaining performance obligations represent the transaction price allocated to performance obligations that are unsatisfied or partially satisfied as of period end, consisting of deferred revenue and non-cancellable backlog. The Company’s backlog represents purchase orders received from customers for future product shipments and services that are unsatisfied or partially satisfied as of period end. The Company’s backlog is subject to future events that could cause the amount or timing of the related revenue to change. Orders in backlog may be fulfilled several quarters following receipt or may relate to multi-year support service obligations.
INFINERA CORPORATION
NOTES TO CONSOLIDATED FINANCIAL STATEMENTS—(Continued)
Stock-Based Compensation
Stock-based compensation cost is measured at the grant date based on the fair value of the award and is recognized as expense over the requisite service period (generally the vesting period) under the straight-line amortization method. The Company accounts for forfeitures as they occur.
The Company estimates the fair value of the rights to acquire stock under its 2007 Employee Stock Purchase Plan (the “ESPP”) using the Black-Scholes option pricing formula. The ESPP, which was indefinitely suspended effective upon the expiration of the offering period that ended August 15, 2023, provides for consecutive six-month offering periods.
The Company accounts for the fair value of restricted stock units (“RSUs”) using the closing market price of the Company’s common stock on the date of grant. RSUs typically vest ratably over a service period ranging from one to four years.
Performance Stock Units ("PSUs") granted to the Company's executive officers, senior management and certain other employees during 2020, 2021, 2022 and 2023 are based on performance criteria related to specific financial targets over the span of a two or three-year performance period. These PSUs may become eligible for vesting to begin before the end of the applicable performance period, if the applicable financial target is met. The number of shares to be issued upon vesting of these PSUs range from 0 to 1.5 times the target number of PSUs granted. The Company assesses the achievement status of these PSUs on a quarterly basis and records the related stock-based compensation expenses based on the estimated achievement payout.
In addition, the Company granted other PSUs to certain employees that only vest upon the achievement of specific operational performance criteria. The Company assesses the achievement status of these PSUs on a quarterly basis and records the related stock-based compensation expenses based on the estimated achievement payout.
Employee Benefit and Pension Plans
The Company operates a number of post-employment plans in Germany, as well as smaller post-employment plans in other countries, including both defined contribution and defined benefit plans. Benefit cost and obligations pertaining to these plans are based on assumptions for the discount rate, expected return on plan assets, mortality rates, expected salary increases, health care cost trend rates and attrition rates. The discount rate assumption is based on current investment yields of high-quality fixed-income securities with maturities similar to the expected benefits payment period. Mortality rates help predict the expected life of plan participants. The expected increase in the compensation levels assumption reflects the Company's actual experience and future expectations. The expected long-term return on plan assets is determined based on asset allocations, historical portfolio results, historical asset correlations and management’s expected returns for each asset class. The Company evaluates its expected return assumptions annually including reviewing current capital market assumptions to assess the reasonableness of the expected long-term return on plan assets. The Company updates the expected long-term return on assets when the Company observes a sufficient level of evidence that would suggest the long-term expected return has changed.
Research and Development
All costs to develop the Company’s hardware products are expensed as incurred. Software development costs are capitalized beginning when a product’s technological feasibility has been established and ending when a product is available for general release to customers. Generally, the Company’s software products are released soon after technological feasibility has been established. As a result, costs subsequent to achieving technological feasibility have not been significant and all software development costs have been expensed as incurred.
INFINERA CORPORATION
NOTES TO CONSOLIDATED FINANCIAL STATEMENTS—(Continued)
Advertising
All advertising costs are expensed as incurred. Advertising expenses in 2023, 2022 and 2021 were $1.5 million, $1.5 million, and $1.6 million, respectively.
Accounting for Income Taxes
As part of the process of preparing its consolidated financial statements, the Company is required to estimate its taxes in each of the jurisdictions in which it operates. The Company estimates actual current tax expense together with assessing temporary differences resulting from different treatment of items, such as accruals and allowances not currently deductible for tax purposes. These differences result in deferred tax assets and liabilities, which are included in consolidated balance sheets. In general, deferred tax assets represent future tax benefits to be received when certain expenses previously recognized in consolidated statements of operations become deductible expenses under applicable income tax laws or loss, or credit carryforwards are utilized. Accordingly, realization of deferred tax assets is dependent on future taxable income within the respective jurisdictions against which these deductions, losses and credits can be utilized within the applicable future periods.
The Company must assess the likelihood that some portion or all of its deferred tax assets will be recovered from future taxable income within the respective jurisdictions, and to the extent the Company believes that recovery does not meet the “more-likely-than-not” standard, it must establish a valuation allowance. The ultimate realization of deferred tax assets is dependent upon the generation of future taxable income during the periods in which those temporary differences become deductible. Management judgment is required in determining its provision for income taxes, its deferred tax assets and liabilities and any valuation allowance recorded against our net deferred tax assets. In evaluating the need for a full or partial valuation allowance, all positive and negative evidence must be considered, including the Company's forecast of taxable income over the applicable carryforward periods, its current financial performance, its market environment, and other factors. Based on the available objective evidence, at December 30, 2023, management believes it is not more likely than not that the domestic net deferred tax assets will be realizable in the foreseeable future. Accordingly, the domestic net deferred tax assets are subject to a full valuation allowance. To the extent that the Company determines that deferred tax assets are realizable on a more likely than not basis, and an adjustment is needed, that adjustment will be recorded in the period that the determination is made.
Foreign Currency Translation and Transactions
The Company considers the functional currencies of its foreign subsidiaries to be the local currency. Assets and liabilities recorded in foreign currencies are translated at the exchange rate as of the balance sheet date, revenue, costs and expenses are translated at average exchange rates in effect during the period. Equity transactions are translated using historical exchange rates. The effects of foreign currency translation adjustments are recorded as a separate component of accumulated other comprehensive income (loss) in the accompanying consolidated balance sheets and consolidated statements of comprehensive loss.
For all non-functional currency account balances, the re-measurement of such balances to the functional currency will result in either a foreign exchange transaction gain or loss, which is recorded to other income (loss), net, in the Company's consolidated statement of operations, in the same period that the re-measurement occurred. Aggregate foreign exchange transactions recorded was gain of $14.8 million in 2023, gain of $12.8 million in 2022, and loss of $17.2 million 2021.
Cash and Cash Equivalents
Cash consists primarily of cash in bank deposit accounts which, at times, a portion may exceed federally insured limits. The Company has not experienced any losses in such accounts.
The Company considers all highly liquid investments with original maturities of three months or less at the date of purchase to be cash equivalents.
INFINERA CORPORATION
NOTES TO CONSOLIDATED FINANCIAL STATEMENTS—(Continued)
Fair Value Measurement
Pursuant to the accounting guidance for fair value measurements and its subsequent updates, fair value is defined as the price that would be received from selling an asset or paid to transfer a liability in an orderly transaction between market participants at the measurement date. When determining the fair value measurements for assets and liabilities required or permitted to be recorded at fair value, the Company considers the principal or most advantageous market in which it would transact and it considers assumptions that market participants would use when pricing the asset or liability.
Valuation techniques used by the Company are based upon observable and unobservable inputs. Observable or market inputs reflect market data obtained from independent sources, while unobservable inputs reflect the Company’s assumptions about market participant assumptions based on the best information available. Observable inputs are the preferred source of values. These two types of inputs create the following fair value hierarchy:
| | | | | | | | | | | | | | |
| Level 1 | | – | | Quoted prices in active markets for identical assets or liabilities. |
| | | | |
| Level 2 | | – | | Quoted prices for similar instruments in active markets, quoted prices for identical or similar instruments in markets that are not active, and model-based valuation techniques for which all significant assumptions are observable in the market or can be corroborated by observable market data for substantially the full term of the assets or liabilities. |
| | | | |
| Level 3 | | – | | Prices or valuations that require management inputs that are both significant to the fair value measurement and unobservable. |
The Company measures its cash equivalents and debt securities at fair value and classifies them in accordance with the fair value hierarchy on a recurring basis.
Facilities-related Charges
The Company classifies certain facilities-related charges within Level 3 of the fair value hierarchy and applies fair value accounting on a nonrecurring basis when impairment indicators exist or upon the existence of observable fair values. The impairment charges incurred for operating lease right-of-use assets are calculated at fair value based on the estimated future sublease rental receipts that the Company can reasonably obtain over the remaining lease term at the discount rate. These charges are classified as Level 3 measurement due to the significance of these unobservable inputs.
Accounts Receivable and Allowances for Credit Losses
Accounts receivable are recorded at the invoiced amount and do not bear interest. The Company maintains an allowance for estimated credit losses resulting from the inability of its customers to make required payments and reviewed the allowance quarterly. The Company determines expected credit losses by performing credit evaluations of its customers' financial condition, establishing both a general reserve and specific reserve for customers in adverse financial condition and adjusting for its expectations of changes in conditions that may impact the collectability of outstanding receivables. The Company considers a customer's receivable balance past due when the amount is due beyond the credit terms extended, The Company considers factors such as historical experience, credit quality, age of the accounts receivable balances, and geographic or country-specific risks. Amounts are written off when receivables are determined to be uncollectible.
Allowances for Sales Returns
Customer product returns are approved on a case by case basis. Specific reserve provisions are made based upon a specific review of all the approved product returns where the customer has yet to return the products to generate the related sales return credit at the end of a period. Estimated sales returns are provided for as a reduction to revenue. At December 30, 2023, December 31, 2022 and December 25, 2021, revenue was reduced for estimated sales returns by $0.3 million, $3.6 million, and $0.8 million, respectively.
Concentration of Risk
Financial instruments that are potentially subject to concentrations of credit risk consist primarily of cash, cash equivalents and restricted cash and accounts receivable.
INFINERA CORPORATION
NOTES TO CONSOLIDATED FINANCIAL STATEMENTS—(Continued)
The risk with respect to accounts receivable is mitigated by ongoing credit evaluations that the Company performs on its customers. As the Company continues to expand its sales internationally, it may experience increased levels of customer credit risk associated with those regions. Collateral is generally not required for accounts receivable but may be used in the future to mitigate credit risk associated with customers located in certain geographical regions.
No customer accounted for 10% or more of the Company's accounts receivable balance, net on the consolidated balance sheets as of December 30, 2023. One customer accounted for over 10% of the Company's accounts receivable balance, net on the consolidated balance sheets as of December 31, 2022.
One end-customer accounted for 10% of the Company's revenue in fiscal year 2023. One end-customer accounted for 11% of the Company's revenue in fiscal year 2022 and no end-customer accounted for 10% or more of the Company's revenue in fiscal year 2021.
The Company depends on sole source or limited source suppliers for several key components and raw materials. The Company generally purchases these sole source or limited source components and raw materials through standard purchase orders and does not have long-term contracts with many of these limited-source suppliers. While the Company seeks to maintain sufficient reserve stock of such components and raw materials, the Company’s business and results of operations could be adversely affected if any of its sole source or limited source suppliers suffer from capacity constraints, lower than expected yields, deployment delays, work stoppages or any other reduction or disruption in output.
Derivative Instruments
From time to time, the Company has entered into factoring agreements to sell certain receivables to unrelated third-party financial institutions. These transactions are accounted for in accordance with ASC 860, Transfers and Servicing (“ASC 860”). ASC 860 and result in a reduction in accounts receivable because the agreements transfer effective control over and risk related to the receivables to the buyers. The Company's factoring agreements do not allow for recourse in the event of uncollectability, and the Company does not retain any interest in the underlying accounts receivable once sold.
Inventory Valuation
Inventories consist of raw materials, work-in-process and finished goods and are stated at standard cost adjusted to approximate the lower of actual cost or net realizable value. Costs are recognized utilizing the first-in, first-out method. Net realizable value is based upon an estimated selling price reduced by the estimated cost of disposal. The determination of market value involves numerous judgments including estimated average selling prices based upon recent sales volumes, industry trends, existing customer orders, current contract price, future demand and pricing and technological obsolescence of the Company’s products.
Inventory that is obsolete or in excess of the Company’s forecasted demand or is anticipated to be sold at a loss is written down to its estimated net realizable value based on historical usage and expected demand. In valuing its inventory costs and deferred inventory costs, the Company considered whether the net realizable value of inventory delivered or expected to be delivered at less than cost, primarily comprised of common equipment, had declined. The Company concluded that, in the instances where the net realizable value of inventory delivered or expected to be delivered was less than cost, it was appropriate to value the inventory costs and deferred inventory costs at cost or net realizable value, whichever is lower, thereby recognizing the cost of the reduction in net realizable value of inventory in the period in which the reduction occurred or can be reasonably estimated. The Company has, therefore, recognized inventory write-downs as necessary in each period in order to reflect inventory at the lower of actual cost or net realizable value.
The Company considers whether it should accrue losses on firm purchase commitments related to inventory items. Given that the net realizable value of common equipment is below contractual purchase price, the Company has also recorded losses on these firm purchase commitments in the period in which the commitment is made. When the inventory parts related to these firm purchase commitments are received, that inventory is recorded at the purchase price less the accrual for the loss on the purchase commitment.
INFINERA CORPORATION
NOTES TO CONSOLIDATED FINANCIAL STATEMENTS—(Continued)
Property, Plant and Equipment
Property, plant and equipment are stated at cost. This includes enterprise-level business software that the Company customizes to meet its specific operational needs and certain software licenses. Depreciation is calculated using the straight-line method over the estimated useful lives of the respective assets. Leasehold improvements are amortized using the straight-line method over the shorter of the lease term or estimated useful life of the asset. An assumption of lease renewal where a renewal option exists is used only when the renewal has been determined to be reasonably certain. Repair and maintenance costs are expensed as incurred. The estimated useful life for each asset category is as follows:
| | | | | |
| | Estimated Useful Lives |
| Building | 20 years |
| Laboratory and manufacturing equipment | 1.5 to 10 years |
| Furniture and fixtures | 3 to 5 years |
| Computer hardware | 3 to 5 years |
| Computer software | 3 years |
| Leasehold and building improvements | 1 to 11 years |
The Company reviews long-lived assets for impairment whenever events or changes in circumstances indicate that the carrying amount of these assets may not be recoverable or that the useful life is shorter than originally estimated. If impairment indicators are present and the projected future undiscounted cash flows are less than the carrying value of the assets, the carrying values are reduced to the estimated fair value. If assets are determined to be recoverable, but the useful lives are shorter than originally estimated, the carrying value of the assets is depreciated over the newly determined remaining useful lives.
INFINERA CORPORATION
NOTES TO CONSOLIDATED FINANCIAL STATEMENTS—(Continued)
Accrued Warranty
In the Company's contracts with its customers, the Company warrants that its products will operate substantially in conformity with product specifications. Hardware warranties provide the purchaser with protection in the event that the product does not perform to product specifications. During the warranty period, the purchaser’s sole and exclusive remedy in the event of such defect or failure to perform is limited to the correction of the defect or failure by repair, refurbishment or replacement, at the Company’s sole option and expense. The Company's hardware warranty periods generally range from one to five years from date of acceptance for hardware and the Company's software warranty is 90 days. Upon delivery of the Company's products, the Company provides for the estimated cost to repair or replace products that may be returned under warranty. The hardware warranty accrual is based on actual historical returns and cost of repair experience and the application of those historical rates to the Company's in-warranty installed base. The provision for warranty claims fluctuates depending upon the installed base of products and the failure rates and costs of repair associated with these products under warranty. Furthermore, the Company's costs of repair vary based on repair volume and its ability to repair, rather than replace, defective units. In the event that actual product failure rates and costs to repair differ from the Company's estimates, revisions to the warranty provision are required. In addition, from time to time, specific hardware warranty accruals may be made if unforeseen technical problems arise with specific products. The Company regularly assesses the adequacy of its recorded warranty liabilities and adjusts the amounts as necessary.
Goodwill and Intangible Assets
Goodwill represents the excess of the purchase price of an acquired business over the fair value of the identifiable assets acquired and liabilities assumed. The Company tests for impairment of goodwill on an annual basis in the fourth quarter and at any other time when events occur or circumstances indicate that the carrying amount of goodwill may not be recoverable. The Company has the option to first assess qualitative factors to determine whether it is necessary to perform the quantitative goodwill impairment test. If the Company determines that as a result of the qualitative assessment that it is more likely than not (i.e., greater than 50% likelihood) that the fair value of a reporting unit is less than its carrying amount, then the quantitative test is required or it can directly perform the quantitative analysis. The Company recognizes an impairment charge for the amount by which the carrying amount exceeds the reporting unit’s fair value; however, the loss recognized does not exceed the total amount of goodwill allocated to that reporting unit. The Company completed its annual qualitative impairment test of goodwill as of the first day of the fourth fiscal quarter of 2023, or October 1, 2023, and determined that it was not more likely than not that the fair value of the reporting unit is less than its carrying amount. As a result it was determined that it was not necessary for the Company to perform a quantitative goodwill impairment test for the year ended December 30, 2023.
The Company evaluates events and changes in circumstances that could indicate carrying amounts of purchased intangible assets may not be recoverable. When such events or changes in circumstances occur, the Company assesses the recoverability of these assets by determining whether or not the carrying amount will be recovered through undiscounted expected future cash flows. If the total of the future undiscounted cash flows is less than the carrying amount of an asset, the Company records an impairment loss for the amount by which the carrying amount of the asset exceeds the fair value of the asset.
Intangible assets with finite lives are carried at cost, less accumulated amortization. Amortization is computed over the estimated useful lives of the respective assets.
Leases
The Company has operating leases primarily for real estate (facilities) and automobiles. The Company has finance leases primarily for computer hardware, laboratory and manufacturing equipment and leasehold and building improvements.
The Company leases facilities under non-cancelable operating lease agreements. These leases have varying terms that range from one to 14 years and contain leasehold improvement incentives, rent holidays and escalation clauses. In addition, some of these leases have renewal options for up to six years.
The Company determines if an arrangement contains a lease at inception. Operating leases are included in operating lease right-of-use ("ROU") assets, accrued expenses and other current liabilities and operating lease liabilities on the Company's consolidated balance sheets. Finance leases are included in
INFINERA CORPORATION
NOTES TO CONSOLIDATED FINANCIAL STATEMENTS—(Continued)
property, plant and equipment, net, accrued expenses and other current liabilities and other long-term liabilities on the Company's consolidated balance sheets.
Operating lease ROU assets and operating lease liabilities are recognized based on the present value of the future minimum lease payments over the lease term at commencement date. As most of the Company's leases do not provide an implicit rate, the Company uses its incremental borrowing rate based on the information available at commencement date in determining the present value of future payments. Operating lease ROU assets also include any lease payments made and exclude lease incentives and initial direct costs incurred. Variable lease payments are expensed as incurred and are not included within the ROU asset and lease liability calculation. Variable lease payments primarily include reimbursements of costs incurred by lessors for common area maintenance and utilities. The Company's lease terms may include options to extend or terminate the lease when it is reasonably certain that the Company will exercise that option. Lease expense for minimum lease payments is recognized on a straight-line basis over the lease term. The Company rents or subleases certain real estate under agreements that are classified as operating leases.
Leases with an initial term of 12 months or less are not recorded on the balance sheet. The Company recognizes lease expense for these leases on a straight-line basis over the lease term. The Company does not account for lease components (e.g., fixed payments including rent) separately from the non-lease components (e.g., common-area maintenance costs).
Upon abandoning or committing to a plan to abandon a leased property in the short term before the lease term expires, the Company assesses the fair value of its remaining obligation under the lease and records an impairment of the ROU asset, if needed. The impairment loss is calculated as the present value of the amount by which the remaining lease obligation, adjusted for the effects of any one-time costs to sublease, exceeds the estimated sublease rentals that could be reasonably obtained. The estimated sublease rentals consider Company's ability and intent to sublease the space. The significant assumptions used in the Company's discounted cash flow model include the amount and timing of estimated sublease rental receipts and the discount rate which involve a number of risks and uncertainties, some of which are beyond control, including future real estate market conditions and the Company's ability to successfully enter into subleases or termination agreements with terms as favorable as those assumed when arriving at its estimates. The Company monitors these estimates and assumptions on at least a quarterly basis for changes in circumstances and any corresponding adjustments to the accrual are recorded in its statement of operations in the period when such changes are known.
The loss recorded or to be recorded may change significantly as a result of the re-measurement of the liability, if the timing or amount of estimated cash flows change.
Restructuring and Other Related Costs
The Company records costs associated with exit activities related to restructuring plans in accordance with ASC 420, Exit or Disposal Cost Obligations, or ASC 712, Compensation — Nonretirement Postemployment Benefits. Liabilities for costs associated with an exit or disposal activity are recognized in the period in which the liability is incurred. The timing of the associated cash payments is dependent upon the type of exit cost. The Company records restructuring cost liabilities in “accrued expenses and other current liabilities” and "other long-term liabilities" in the consolidated balance sheet.
Restructuring costs include employee and contract termination costs, facility consolidation and closure costs, lease related impairment charges, equipment write-downs and inventory write-downs. One-time termination benefits are recognized as a liability at estimated fair value when the approved plan of termination has been communicated to employees, unless employees must provide future service, in which case the benefits are recognized ratably over the future service period. Ongoing termination benefits arrangements are recognized as a liability at estimated fair value when the amount of such benefits becomes estimable and payment is probable.
Restructuring charges require significant estimates and assumptions, including estimates made for employee separation costs and other contract termination charges. Management estimates involve a number of risks and uncertainties, some of which are beyond control, including the Company's ability to successfully enter into termination agreements with employees and others with terms as favorable as those assumed when arriving at its estimates. The Company monitors these estimates and assumptions on at least a quarterly basis for changes in circumstances and any corresponding adjustments to the accrual are recorded in its statement of operations in the period when such changes are known.
INFINERA CORPORATION
NOTES TO CONSOLIDATED FINANCIAL STATEMENTS—(Continued)
Recent Accounting Pronouncements
Accounting Pronouncements Not Yet Adopted
Segment Reporting Disclosures
In November 2023, the FASB issued ASU 2023-07, “Segment Reporting (Topic 280): Improvements to Reportable Segment Disclosures.” The standard improves reportable segment disclosure requirements for public business entities primarily through enhanced disclosures about significant segment expenses that are regularly provided to the chief operating decision maker (“CODM”) and included within each reported measure of segment profit (referred to as the “significant expense principle”). The standard will become effective for fiscal year 2024 annual financial statements and interim financial statements thereafter and will be applied retrospectively for all prior periods presented in the financial statements, with early adoption permitted. The Company plans to adopt the standard when it becomes effective beginning in fiscal year 2024 annual financial statements, and is currently evaluating the impact this guidance will have on the disclosures included in the Notes to the Consolidated Financial Statements.
Income Tax Disclosures
In December 2023, the FASB issued ASU 2023-09, “Income Taxes (Topic 740): Improvements to Income Tax Disclosures.” The standard enhances income tax disclosure requirements for all entities by requiring specified categories and greater disaggregation within the rate reconciliation table, disclosure of income taxes paid by jurisdiction, and providing clarification on uncertain tax positions and related financial statement impacts. The standard will be effective for fiscal year 2024 annual financial statements with early adoption permitted. The Company plans to adopt the standard when it becomes effective beginning in fiscal year 2024 annual financial statements, and expects the adoption of the standard will impact certain of the income tax disclosures.
3. Leases
The Company has operating leases for real estate (facilities) and automobiles. For the fiscal years ended December 30, 2023, December 31, 2022 and December 25, 2021, operating lease expense was $13.9 million, $21.1 million and $25.7 million, respectively. Included in operating lease expense were rent expense and impairment charges due to restructuring resulting in abandonment of certain lease facilities, amounting to $3.0 million, $8.1 million and $6.5 million for the fiscal years ended December 30, 2023, December 31, 2022 and December 25, 2021, respectively. Variable lease cost, short-term lease cost and sublease income were immaterial during the fiscal years ended December 30, 2023, December 31, 2022 and December 25, 2021, respectively.
The following table presents current and long-term portion of operating lease liabilities as classified in the consolidated balance sheets (in thousands):
| | | | | | | | | | | | | | |
| | December 30, 2023 | | December 31, 2022 |
| Accrued expenses and other current liabilities | | $ | 11,888 | | | $ | 10,948 | |
| Long-term operating lease liabilities | | 47,464 | | | 45,862 | |
| Total operating lease liability | | $ | 59,352 | | | $ | 56,810 | |
The Company also has finance leases. The lease term for these arrangements range from three to five years with option to purchase at the end of the term.
As of December 30, 2023 and December 31, 2022, finance leases included in property, plant, and equipment, net in the consolidated balance sheets were $4.5 million and $1.9 million, respectively. Finance lease expense includes amortization of the right-of-use assets and interest expense. Total finance lease expense during the fiscal years ended December 30, 2023 and December 31, 2022 was not material.
INFINERA CORPORATION
NOTES TO CONSOLIDATED FINANCIAL STATEMENTS—(Continued)
The following table presents maturity of lease liabilities under the Company's non-cancelable leases as of December 30, 2023 (in thousands): | | | | | | | | | | | | | | |
| | Operating Lease | | Finance Lease |
| | | | |
| Total lease payments | | $ | 111,316 | | | $ | 5,220 | |
Less: interest(1) | | 51,964 | | | 692 | |
| Present value of lease liabilities | | $ | 59,352 | | | $ | 4,528 | |
(1) Calculated using the interest rate for each lease.
The following table presents supplemental information for the Company's non-cancelable leases for the fiscal year ended December 30, 2023 (in thousands, except for weighted average and percentage data):
| | | | | | | | | | | | | | |
| | Operating Lease | | Finance Lease |
| Weighted average remaining lease term | | 15.26 years | | 4.10 years |
| Weighted average discount rate | | 10.52 | % | | 9.94 | % |
| Cash paid for amounts included in the measurement of lease liabilities | | $ | 16,386 | | $ | 1,023 |
| Leased assets obtained in exchange for new lease liabilities | | $ | 13,534 | | $ | 4,363 |
4. Revenue Recognition
Disaggregation of Revenue
The following table presents the Company's revenue disaggregated by revenue source (in thousands):
| | | | | | | | | | | | | | | | | | | | |
| | Years Ended |
| | December 30, 2023 | | December 31, 2022 | | December 25, 2021 |
| Product | | $ | 1,304,229 | | | $ | 1,268,624 | | | $ | 1,099,376 | |
| Services | | 309,899 | | | 304,618 | | | 325,829 | |
| Total revenue | | $ | 1,614,128 | | | $ | 1,573,242 | | | $ | 1,425,205 | |
The Company sells its products directly to customers who are predominantly service providers and to channel partners that sell on its behalf. The following tables present the Company's revenue disaggregated by geography, based on the shipping address of the end-customer and by sales channel (in thousands):
| | | | | | | | | | | | | | | | | | | | |
| | Years Ended |
| | December 30, 2023 | | December 31, 2022 | | December 25, 2021 |
| United States | | $ | 994,311 | | | $ | 870,282 | | | $ | 663,808 | |
| Other Americas | | 99,920 | | | 101,600 | | | 107,963 | |
| Europe, Middle East and Africa | | 359,201 | | | 405,328 | | | 477,787 | |
| Asia Pacific | | 160,696 | | | 196,032 | | | 175,647 | |
| Total revenue | | $ | 1,614,128 | | | $ | 1,573,242 | | | $ | 1,425,205 | |
| | | | | | | | | | | | | | | | | | | | |
| | Years Ended |
| | December 30, 2023 | | December 31, 2022 | | December 25, 2021 |
| Direct | | $ | 1,067,570 | | | $ | 1,191,584 | | | $ | 1,099,632 | |
| Indirect | | 546,558 | | | 381,658 | | | 325,573 | |
| Total revenue | | $ | 1,614,128 | | | $ | 1,573,242 | | | $ | 1,425,205 | |
INFINERA CORPORATION
NOTES TO CONSOLIDATED FINANCIAL STATEMENTS—(Continued)
Contract Balances
The following table provides information about receivables, contract assets and contract liabilities from contracts with customers (in thousands):
| | | | | | | | | | | |
| Assets (Liabilities) | December 30, 2023 | | December 31, 2022 |
| Accounts receivable, net | $ | 381,981 | | | $ | 419,735 | |
| Contract assets | $ | 46,738 | | | $ | 60,172 | |
Deferred revenue(1) | $ | (157,580) | | | $ | (181,679) | |
(1) Included in this balance are amounts related to services that are subject to cancellation and pro-rated refund rights of $85.9 million and $82.5 million as of December 30, 2023 and December 31, 2022, respectively.
Revenue recognized for the fiscal year ended December 30, 2023 and December 31, 2022 that was included in the deferred revenue balance at the beginning of the reporting period was $133.6 million and $106.8 million, respectively. Changes in the contract asset and liability balances during the fiscal year ended December 30, 2023 and December 31, 2022 were not materially impacted by other factors.
Transaction Price Allocated to the Remaining Performance Obligation
The Company’s remaining performance obligations represent the transaction price allocated to performance obligations that are unsatisfied or partially satisfied, consisting of deferred revenue and non- cancellable backlog. The Company’s backlog represents purchase orders received from customers for future product shipments and services. The Company’s backlog is subject to future events that could cause the amount or timing of the related revenue to change. Orders in backlog may be fulfilled several quarters following receipt or may relate to multi-year support service obligations.
The following table includes estimated revenue expected to be recognized in the future related to performance obligations that are unsatisfied (or partially satisfied) pursuant to contracts that are not subject to cancellation without penalty at the end of the reporting period (in thousands):
| | | | | | | | | | | | | | | | | | | | | | | | | | | | | | | | | | | | | | | | | | | | |
| | 2024 | | 2025 | | 2026 | | 2027 | | 2028 | | Thereafter | | Total |
Revenue expected to be recognized in the future as of December 30, 2023 | | $ | 462,363 | | | $ | 23,925 | | | $ | 14,918 | | | $ | 8,521 | | | $ | 3,492 | | | $ | 2,738 | | | $ | 515,957 | |
INFINERA CORPORATION
NOTES TO CONSOLIDATED FINANCIAL STATEMENTS—(Continued)
5. Fair Value Measurements
Disclosure of Fair Values
Financial instruments that are not re-measured at fair value include accounts receivable, accounts payable, accrued liabilities, and debt. The carrying values of these financial instruments, other than the Company's 2024 Notes, 2027 Notes and 2028 Notes (collectively referred to as "convertible senior notes" below), approximate their fair values. The fair value of each series of convertible senior notes was determined based on the quoted bid price of the applicable series of convertible senior notes in an over-the-counter market on December 29, 2023 (the last trading day of the fiscal quarter).
The following table presents the estimated fair values of the convertible senior notes (in thousands):
| | | | | | | | | | | | | | | | | | | | | | | | | | | | | | | | | | | |
| As of December 30, 2023 | | As of December 31, 2022 |
| | Fair Value Measured Using | | Fair Value Measured Using |
| | Level 1 | | Level 2 | | Total | | Level 1 | | Level 2 | | Total |
| Convertible senior notes | $ | — | | | $ | 658,609 | | | $ | 658,609 | | | $ | — | | | $ | 785,364 | | | $ | 785,364 | |
| | | | | | | | | | | |
| | | | | | | | | | | |
Cash equivalents are measured and reported at fair value on a recurring basis. The following table presents the fair value of these financial assets and their levels within the fair value hierarchy (in thousands):
| | | | | | | | | | | | | | | | | | | | | | | | | | | | | | | | | | | |
| As of December 30, 2023 | | As of December 31, 2022 |
| | Fair Value Measured Using | | Fair Value Measured Using |
| | Level 1 | | Level 2 | | Total | | Level 1 | | Level 2 | | Total |
| Money market funds | $ | 115,000 | | | $ | — | | | $ | 115,000 | | | $ | 95,000 | | | $ | — | | | $ | 95,000 | |
During 2023 and 2022, there were no transfers of assets or liabilities between Level 1 and Level 2 of the fair value hierarchy. As of December 30, 2023 and December 31, 2022, none of the Company’s existing securities were classified as Level 3 securities.
The Company measures goodwill and intangible assets at fair value on a nonrecurring basis when there are identifiable events or changes in circumstances that may have a significant adverse impact on the fair value of these assets. The Company performed an analysis of impairment indicators of these assets and noted no adverse impact to their fair values as of December 30, 2023.
Facilities-related Charges
The Company classifies certain facilities-related charges within Level 3 of the fair value hierarchy and applies fair value accounting on a nonrecurring basis when impairment indicators exist or upon the existence of observable fair values. The fair values are classified as Level 3 measurements due to the significance of unobservable inputs. These analyses require management to make assumptions and estimates regarding industry and economic factors, future operating results and discount rates.
In connection with its Restructuring Plans (as defined in Note 8, “Restructuring and Other Related Costs” to the notes to consolidated financial statements), the Company incurred facilities related charges of $3.0 million, $8.1 million and $6.5 million for the years ended December 30, 2023, December 31, 2022 and December 25, 2021, respectively. These charges primarily consisted of impairment charges incurred for operating lease right-of-use assets and were calculated at fair value based on estimated future sublease rental receipts that the Company could reasonably obtain over the remaining lease term at the discount rate. Facilities-related charges are classified as Level 3 measurement due to the significance of these unobservable inputs.
INFINERA CORPORATION
NOTES TO CONSOLIDATED FINANCIAL STATEMENTS—(Continued)
Cash and Cash Equivalents
As of December 30, 2023, the Company had $173.9 million of cash, cash equivalents and restricted cash, including $48.1 million held by its foreign subsidiaries. As of December 31, 2022, the Company had $189.2 million of cash, cash equivalents and restricted cash including $65.9 million held by its foreign subsidiaries. The Company's cash held by its foreign subsidiaries is used for operating and investing activities in those locations, and the Company does not currently have the need or the intent to repatriate those funds to the United States.
6. Goodwill and Intangible Assets
Goodwill
Goodwill is recorded when the purchase price of an acquisition exceeds the fair value of the net tangible and identified intangible assets acquired.
The following table presents details of the Company’s goodwill for the fiscal year ended December 30, 2023 (in thousands):
| | | | | |
Balance as of December 31, 2022 | $ | 232,663 | |
| |
| Foreign currency translation adjustments | 7,903 | |
Balance as of December 30, 2023 | $ | 240,566 | |
The gross carrying amount of goodwill may change due to the effects of foreign currency fluctuations as a portion of these assets are denominated in foreign currency. To date, the Company has zero accumulated impairment loss on goodwill.
INFINERA CORPORATION
NOTES TO CONSOLIDATED FINANCIAL STATEMENTS—(Continued)
Intangible Assets
The following tables present details of the Company’s intangible assets as of December 30, 2023 and December 31, 2022 (in thousands):
| | | | | | | | | | | | | | | | | | | | | | | |
| | December 30, 2023 |
| | Gross Carrying Amount | | Accumulated Amortization | | Net Carrying Amount | | Weighted Average Remaining Useful Life (In Years) |
| Intangible assets with finite lives: | | | | | | | |
| | | | | | | |
Customer relationships | 72,200 | | | (47,381) | | | 24,819 | | | 2.8 |
| | | | | | | |
| | | | | | | |
| Total intangible assets | $ | 72,200 | | | $ | (47,381) | | | $ | 24,819 | | | |
| | | | | | | | | | | | | | | | | | | | | | | |
| | December 31, 2022 |
| | Gross Carrying Amount | | Accumulated Amortization | | Net Carrying Amount | | Weighted Average Remaining Useful Life (In Years) |
| Intangible assets with finite lives: | | | | | | | |
| | | | | | | |
| Customer relationships and backlog | 151,461 | | | (114,294) | | | 37,167 | | | 3.5 |
| Developed technology | 170,467 | | | (159,847) | | | 10,620 | | | 0.7 |
| | | | | | | |
| Total intangible assets | $ | 321,928 | | | $ | (274,141) | | | $ | 47,787 | | | |
The gross carrying amount of intangible assets and the related amortization expense of intangible assets may change due to the effects of foreign currency fluctuations as a portion of these assets are denominated in foreign currency. Amortization expense was $23.0 million, $37.7 million and $37.1 million for the years ended December 30, 2023, December 31, 2022 and December 25, 2021, respectively.
The following table summarizes the Company’s estimated future amortization expense of intangible assets with finite lives as of December 30, 2023 (in thousands):
| | | | | | | | | | | | | | | | | | | | | | | | | | | | | | | | | | | | | | | | | |
| | Total | | 2024 | | 2025 | | 2026 | | 2027 | | 2028 | | Thereafter |
| Total future amortization expense | $ | 24,819 | | | $ | 9,025 | | | $ | 9,025 | | | $ | 6,769 | | | $ | — | | | $ | — | | | $ | — | |
INFINERA CORPORATION
NOTES TO CONSOLIDATED FINANCIAL STATEMENTS—(Continued)
7. Balance Sheet Details
Restricted Cash
The Company’s restricted cash balance is held in deposit accounts at various banks globally. These amounts primarily collateralize the Company’s issuances of standby letters of credit and bank guarantees.
Allowance for Credit Losses
The following table provides a rollforward of the allowance for credit losses for accounts receivable for the fiscal year ended December 30, 2023 (in thousands):
| | | | | |
Balance as of December 31, 2022 | $ | 1,422 | |
| |
Additions(1) | 521 |
Write offs(2) | (473) |
| Recoveries during the period | (594) |
| |
Balance as of December 30, 2023 | $ | 876 | |
(1)The new additions during the fiscal year ended December 30, 2023 are primarily due to specific reserves.
(2)The write offs during the fiscal year ended December 30, 2023 are primarily amounts fully reserved previously.
Accounts Receivable Factoring
The Company sells certain designated trade account receivables based on factoring arrangements with well-established factoring companies. Pursuant to the terms of the arrangements, the Company accounts for these transactions in accordance with ASC 860. The Company's factor purchases trade accounts receivables on a non-recourse basis and without any further obligations. Trade accounts receivables balances sold are removed from the consolidated balance sheets and cash received are reflected as cash provided by operating activities in the consolidated statements of cash flow. The difference between the fair value of the Company's trade receivables and the proceeds received is recorded as interest expense in the Company's consolidated statements of operations. For the years ended December 30, 2023, December 31, 2022 and December 25, 2021, the Company's recognized factoring related interest expense was approximately $0.9 million, $0.9 million and $0.4 million, respectively. The gross amount of trade accounts receivables sold totaled approximately $62.6 million and $101.0 million for the fiscal years ended December 30, 2023 and December 31, 2022 respectively.
INFINERA CORPORATION
NOTES TO CONSOLIDATED FINANCIAL STATEMENTS—(Continued)
Selected Balance Sheet Items
The following table provides details of selected balance sheet items (in thousands):
| | | | | | | | | | | |
| December 30, 2023 | | December 31, 2022 |
| Inventory | | | |
| Raw materials | $ | 133,561 | | | $ | 48,688 | |
| Work in process | 68,407 | | | 66,591 | |
| Finished goods | 229,195 | | | 259,576 | |
| Total | $ | 431,163 | | | $ | 374,855 | |
| Property, plant and equipment, net | | | |
| Computer hardware | $ | 48,611 | | | $ | 46,454 | |
Computer software(1) | 74,752 | | | 62,102 | |
| Laboratory and manufacturing equipment | 354,103 | | | 297,261 | |
| Land and building | 12,372 | | | 12,369 | |
| Furniture and fixtures | 2,916 | | | 2,828 | |
| Leasehold and building improvements | 46,652 | | | 50,360 | |
| Construction in progress | 41,328 | | | 42,418 | |
| Subtotal | $ | 580,734 | | | $ | 513,792 | |
Less accumulated depreciation and amortization(2) | (373,737) | | | (340,863) | |
| Total | $ | 206,997 | | | $ | 172,929 | |
| Accrued expenses and other current liabilities | | | |
| Loss contingency related to non-cancelable purchase commitments | $ | 17,909 | | | $ | 28,796 | |
| Taxes payable | 24,248 | | | 42,757 | |
| Restructuring accrual | 6,042 | | | 941 | |
| Short-term operating and finance lease liability | 12,905 | | | 11,701 | |
| Other accrued expenses and other current liabilities | 49,654 | | | 57,255 | |
| Total accrued expenses and other current liabilities | $ | 110,758 | | | $ | 141,450 | |
(1)Included in computer software at December 30, 2023 and December 31, 2022 were $34.8 million and $29.3 million, respectively, related to enterprise resource planning (“ERP”) systems that the Company implemented in prior years. The unamortized ERP costs at December 30, 2023 and December 31, 2022 were $9.6 million and $9.0 million, respectively. Also included in computer software at December 30, 2023 and December 31, 2022 was $29.6 million and $24.2 million, respectively, related to term licenses. The unamortized term license costs at December 30, 2023 and December 31, 2022 was $23.6 million and $9.1 million, respectively.
(2)Depreciation expense was $55.8 million, $46.1 million and $47.1 million (which includes depreciation of capitalized ERP costs of $4.9 million, $3.5 million and $2.8 million) for 2023, 2022 and 2021, respectively. Also included in depreciation expense for 2023, 2022 and 2021 was $9.5 million and $7.6 million, and $6.7 million respectively, related to term licenses.
INFINERA CORPORATION
NOTES TO CONSOLIDATED FINANCIAL STATEMENTS—(Continued)
8. Restructuring and Other Related Costs
In 2021, the Company announced a plan to restructure certain international research & development operations (the "2021 Restructuring Plan"). The 2021 Restructuring Plan is substantially completed. In 2023, the Company implemented a restructuring initiative to reduce costs (the "2023 Restructuring Plan"). In 2023, the Company incurred and recorded $5.9 million of restructuring costs related to the 2023 Restructuring Plan. The 2023 Restructuring Plan is expected to be completed in 2024 with the associated payments made in 2024. Additional restructuring activities may occur in the future in connection with the Company’s ongoing transformation initiatives.
The following table presents restructuring and other related costs included in cost of revenue and operating expenses in the accompanying consolidated statements of operations under the restructuring plans (in thousands):
| | | | | | | | | | | | | | | | | | | | | | | | | | | | | | | | | | | |
| | Years Ended |
| | December 30, 2023 | | December 31, 2022 | | December 25, 2021 |
| Cost of Revenue | | Operating Expenses | | Cost of Revenue | | Operating Expenses | | Cost of Revenue | | Operating Expenses |
|
| Severance and related expenses | $ | 2,218 | | | $ | 3,665 | | | $ | 203 | | | $ | 1,834 | | | $ | 335 | | | $ | 4,615 | |
| Lease related impairment charges | — | | | 2,996 | | | — | | | 8,059 | | | — | | | 6,534 | |
| | | | | | | | | | | |
| | | | | | | | | | | |
Asset impairment and others | — | | | 56 | | | 19 | | | 229 | | | 1,196 | | | 2,097 | |
| Total | $ | 2,218 | | | $ | 6,717 | | | $ | 222 | | | $ | 10,122 | | | $ | 1,531 | | | $ | 13,246 | |
Restructuring liabilities are reported within accrued expenses in the accompanying consolidated balance sheets (in thousands):
| | | | | | | | | | | | | | | | | | | | | | | | | |
| Severance and related expenses | | Lease related impairment charges | | | | Asset impairment and others | | Total |
Balance as of December 25, 2021 | $ | 7,536 | | | $ | — | | | | | $ | 1,346 | | | $ | 8,882 | |
| Charges | 2,033 | | | 8,059 | | | | | 239 | | | 10,331 | |
| Cash payments | (8,503) | | | (2,267) | | | | | (1,436) | | | (12,206) | |
| Non-cash Settlements and Other | (274) | | | (5,792) | | | | | — | | | (6,066) | |
Balance as of December 31, 2022 | $ | 792 | | | $ | — | | | | | $ | 149 | | | $ | 941 | |
| Charges | 5,883 | | | 2,996 | | | | | 56 | | | 8,935 | |
| Cash payments | (801) | | | (1,773) | | | | | (60) | | | (2,634) | |
| Non-cash Settlements and Other | 13 | | | (1,223) | | | | | 10 | | | (1,200) | |
Balance as of December 30, 2023 | $ | 5,887 | | | $ | — | | | | | $ | 155 | | | $ | 6,042 | |
As of December 30, 2023, the Company's restructuring liability was primarily related to the 2023 Restructuring Plan.
INFINERA CORPORATION
NOTES TO CONSOLIDATED FINANCIAL STATEMENTS—(Continued)
9. Accumulated Other Comprehensive Income (Loss)
Accumulated other comprehensive income (loss) includes certain changes in equity that are excluded from net income (loss). The following table sets forth the changes by component for the periods presented (in thousands):
| | | | | | | | | | | | | | | | | | | | | | | | | | |
| | Foreign Currency Translation | | Actuarial Gain (Loss) on Pension | | Accumulated Tax Effect | | Total |
Balance at December 26, 2020 | | $ | 732 | | | $ | (11,666) | | | $ | (964) | | | $ | (11,898) | |
| Other comprehensive income (loss) before reclassifications | | (8,561) | | | 12,580 | | | — | | | 4,019 | |
Amounts reclassified from accumulated other comprehensive loss | | — | | | 3,383 | | | — | | | 3,383 | |
| Net current-period other comprehensive income (loss) | | (8,561) | | | 15,963 | | | — | | | 7,402 | |
Balance at December 25, 2021 | | $ | (7,829) | | | $ | 4,297 | | | $ | (964) | | | $ | (4,496) | |
| Other comprehensive income (loss) before reclassifications | | (41,803) | | | 22,538 | | | — | | | (19,265) | |
Amounts reclassified from accumulated other comprehensive loss | | — | | | 326 | | | 964 | | | 1,290 | |
| Net current-period other comprehensive income (loss) | | (41,803) | | | 22,864 | | | 964 | | | (17,975) | |
Balance at December 31, 2022 | | $ | (49,632) | | | $ | 27,161 | | | $ | — | | | $ | (22,471) | |
| Other comprehensive income (loss) before reclassifications | | (9,962) | | | (2,002) | | | — | | | (11,964) | |
| Amounts reclassified from accumulated other comprehensive loss | | — | | | (413) | | | — | | | (413) | |
| Net current-period other comprehensive income (loss) | | (9,962) | | | (2,415) | | | — | | | (12,377) | |
Balance at December 30, 2023 | | $ | (59,594) | | | $ | 24,746 | | | $ | — | | | $ | (34,848) | |
INFINERA CORPORATION
NOTES TO CONSOLIDATED FINANCIAL STATEMENTS—(Continued)
10. Basic and Diluted Net Loss Per Common Share
Basic net loss per common share is computed by dividing net loss by the weighted average number of common shares outstanding during the period. Diluted net loss per common share is computed using net loss and the weighted average number of common shares outstanding plus potentially dilutive common shares outstanding during the period. Potentially dilutive common shares include the assumed exercise of outstanding in-the-money stock options, assumed release of outstanding RSUs and PSUs, and assumed issuance of common stock under the ESPP using the treasury stock method. Potentially dilutive common shares also include the shares of common stock issuable upon conversion of the convertible senior notes using the if-converted method, as further discussed in Note 11, “Debt” to the notes to consolidated financial statements. The Company includes the common shares underlying PSUs in the calculation of diluted net income per common share only when they become contingently issuable.
The following table sets forth the computation of net loss per common share (in thousands, except per share amounts):
| | | | | | | | | | | | | | | | | |
| | Years Ended |
| | December 30, 2023 | | December 31, 2022 | | December 25, 2021 |
| | | | | |
| Net loss | $ | (25,213) | | | $ | (76,043) | | | $ | (170,778) | |
| | | | | |
| Weighted average common shares outstanding - basic and diluted | 226,726 | | | 216,376 | | | 207,377 | |
| | | | | |
| | | | | |
| | | | | |
| | | | | |
| | | | | |
| Net loss per common share - basic and diluted | $ | (0.11) | | | $ | (0.35) | | | $ | (0.82) | |
| | | | | |
| | | | | |
The Company incurred net losses during 2023, 2022 and 2021, and as a result, potential common shares from stock options, RSUs, PSUs and the assumed release of outstanding shares under the ESPP were not included in the diluted shares used to calculate net loss per share, as their inclusion would have been anti-dilutive. Additionally, due to the net loss position during these periods, the Company excluded the potential shares issuable upon conversion of the 2028 Notes, the 2027 Notes and the 2024 Notes in the calculation of diluted earnings per share, as their inclusion would have been anti-dilutive.
The following table sets forth the potentially dilutive shares excluded from the computation of the diluted net loss per share because their effect was anti-dilutive (in thousands):
| | | | | | | | | | | | | | | | | |
| | As of |
| | December 30, 2023 | | December 31, 2022 | | December 25, 2021 |
Convertible senior notes(1) | 32,814 | | | 55,800 | | | 4,448 | |
| Restricted stock units | 13,619 | | | 14,836 | | | 12,860 | |
| Performance stock units | 3,668 | | | 2,685 | | | 2,751 | |
| Employee stock purchase plan shares | 53 | | | 360 | | | 1,157 | |
| Total | 50,154 | | | 73,681 | | | 21,216 | |
(1) The convertible senior notes were calculated under the if-converted method for 2022 due to the adoption of ASU 2020-06 and under the treasury stock method for 2021.
Prior to the adoption of ASU 2020-06, the Company used the treasury stock method for calculating any potential dilutive effect of the conversion spread of its convertible senior notes. The conversion spread had a dilutive impact for the 2027 Notes during the fiscal year ended December 25, 2021 since the average market price of the Company’s common stock during the periods exceeded the initial conversion price of $7.66 per share. However, the potential shares of common stock issuable upon the conversion of the convertible senior notes were excluded from the calculation of diluted net loss per share because their effect would have been anti-dilutive.
INFINERA CORPORATION
NOTES TO CONSOLIDATED FINANCIAL STATEMENTS—(Continued)
After the adoption of ASU 2020-06, the Company used the if-converted method for calculating any potential dilutive effect of the convertible senior notes for fiscal years ended December 30, 2023 and December 31, 2022. The Company calculates diluted earnings per share assuming that all of the convertible senior notes permitted to be share settled were converted solely into shares of common stock at the beginning of the reporting period. The potential impact upon the conversion of the convertible senior notes was excluded from the calculation of diluted net loss per share for the fiscal years ended December 30, 2023, December 31, 2022 and December 25, 2021 because the effect would have been anti-dilutive.
11. Debt
The following is a summary of the Company's debt as of December 30, 2023 (in thousands):
| | | | | | | | | | | | | | | | | | | | | | | | | |
| Net Carrying Value | | Unpaid Principal Balance | | | | Contractual Maturity Date |
| Current | | Long-Term | | | |
| 2024 Notes | $ | 18,747 | | | $ | — | | | $ | 18,747 | | | | | September 2024 |
| 2027 Notes | — | | | 196,829 | | | 200,000 | | | | | March 2027 |
| 2028 Notes | — | | | 461,927 | | | 473,750 | | | | | August 2028 |
| | | | | | | | | |
| | | | | | | | | |
| Mortgage | 6,765 | | | — | | | 6,765 | | | | | May 2024 |
| Total Debt | $ | 25,512 | | | $ | 658,756 | | | $ | 699,262 | | | | | |
The following is a summary of the Company's debt as of December 31, 2022 (in thousands):
| | | | | | | | | | | | | | | | | | | | | | | | | |
| Net Carrying Value | | Unpaid Principal Balance | | | | Contractual Maturity Date |
| Current | | Long-Term | | | |
| 2024 Notes | $ | — | | | $ | 101,726 | | | $ | 102,652 | | | | | September 2024 |
| 2027 Notes | — | | | 195,879 | | | 200,000 | | | | | March 2027 |
| 2028 Notes | — | | | 363,349 | | | 373,750 | | | | | August 2028 |
| | | | | | | | | |
| | | | | | | | | |
| Mortgage | 510 | | | 6,765 | | | 7,275 | | | | | March 2024 |
| Total Debt | $ | 510 | | | $ | 667,719 | | | $ | 683,677 | | | | | |
INFINERA CORPORATION
NOTES TO CONSOLIDATED FINANCIAL STATEMENTS—(Continued)
Convertible Senior Notes
In September 2018, the Company issued $402.5 million aggregate principal amount of 2.125% Convertible Senior Notes due 2024 (the "2024 Notes"). In March 2020, the Company issued $200.0 million aggregate principal amount of 2.5% Convertible Senior Notes due 2027 (the “2027 Notes"). In August 2022 and in June 2023, the Company issued $373.8 million and $100 million, respectively, aggregate principal amount of 3.75% Convertible Senior Notes due 2028 (the "2028 Notes," and, together with the 2024 Notes and 2027 Notes, the “convertible senior notes”). The 2024 Notes bear interest at a fixed rate of 2.125% per year, payable semi-annually in arrears on March 1 and September 1 of each year, beginning on March 1, 2019. The 2027 Notes bear interest at a fixed rate of 2.5% per year, payable semi-annually in arrears on March 1 and September 1 of each year, beginning on September 1, 2020. The 2028 Notes bear interest at a fixed rate of 3.75% per year, payable semi-annually in arrears on February 1 and August 1 of each year, beginning on February 1, 2023. Each series of the convertible senior notes is governed by an indenture between the Company, as the issuer, and U.S. Bank Trust Company, National Association, as Trustee (individually, each an “Indenture,” and together, the “Indentures”). The convertible senior notes of each series are unsecured and rank senior in right of payment to any of the Company’s indebtedness that is expressly subordinated in right of payment to the convertible senior notes; equal in right of payment to any of the Company's existing and future liabilities that are not so subordinated, effectively junior in right of payment to any of the Company’s secured indebtedness to the extent of the value of the assets securing such indebtedness; and structurally junior to all indebtedness and other liabilities (including trade payables) of the Company’s current or future subsidiaries. The applicable Indenture governing each series of the convertible senior notes does not contain any financial covenants or any restrictions on the payment of dividends, the incurrence of senior debt or other indebtedness, or the issuance or repurchase of the Company's other securities by the Company.
The net proceeds to the Company from the issuance of 2024 Notes were approximately $391.4 million, of which approximately $48.9 million was used to pay the cost of the capped call transactions with certain financial institutions (“Capped Calls”). The Company also used a portion of the remaining net proceeds to fund the cash portion of the purchase price of the Acquisition, including fees and expenses relating thereto, and used the remaining net proceeds for general corporate purposes.
The Capped Calls have an initial strike price of $9.87 per share, subject to certain adjustments, which corresponds to the initial conversion price of the 2024 Notes. The Capped Calls have initial cap prices of $15.19 per share, subject to certain adjustments. The Capped Calls cover, subject to anti-dilution adjustments, 40.8 million shares of common stock. The Capped Calls transactions are expected generally to reduce or offset potential dilution to the Company's common stock upon any conversion of the 2024 Notes and/or offset any cash payments the Company is required to make in excess of the principal amount of converted 2024 Notes, as the case may be, with such reduction and/or offset subject to a cap. The Capped Calls expire on various dates between July 5, 2024 and August 29, 2024. The Capped Calls were recorded as a reduction of the Company’s stockholders’ equity in the accompanying consolidated balance sheets.
The net proceeds to the Company from the issuance of 2027 Notes were approximately $193.3 million after deducting initial purchasers' fee and other debt issuance costs. The Company used the remaining net proceeds for general corporate purposes, including working capital to fund growth and potential strategic projects.
The net proceeds to the Company from the issuance of Existing 2028 Notes (as defined below) were approximately $362.4 million after deducting the initial purchasers' fee and other debt issuance costs. The Company used approximately $283.6 million, which included accrued and unpaid interest, of the net proceeds from this issuance to repurchase approximately $299.8 million in aggregate principal amount of its 2024 Notes concurrently with the issuance. This transaction involved a contemporaneous exchange of cash between the Company and holders of the 2024 Notes participating in the issuance of the Existing 2028 Notes. Accordingly, the transaction was evaluated for modification or extinguishment accounting in accordance with ASC 470-50, Debt – Modifications and Extinguishments on a creditor-by creditor basis depending on whether the exchange was determined to have substantially different terms. The repurchase of the 2024 Notes and issuance of the Existing 2028 Notes were deemed to have substantially different terms based on the present value of the cash flows or significant difference between the value of the conversion option immediately prior to and after the exchange. Therefore, the repurchase of the 2024 Notes was accounted for as a debt extinguishment. The
INFINERA CORPORATION
NOTES TO CONSOLIDATED FINANCIAL STATEMENTS—(Continued)
Company recorded a $15.5 million gain on extinguishment of debt on its consolidated statements of operations during the fiscal year ended December 31, 2022, which includes the write-off of related deferred issuance costs of $3.5 million.
In June 2023, the Company issued $100.0 million in additional aggregate principal amount (the "Additional 2028 Notes") of its currently outstanding 3.75% Convertible Senior Notes due 2028 (the "Existing 2028 Notes" and together with the Additional 2028 Notes, the “2028 Notes”). The Additional 2028 Notes were issued under the indenture dated as of August 8, 2022, by and between the Company and U.S. Bank Trust Company, National Association, as trustee. The Additional 2028 Notes constitute a further issuance of, and form a single series with, the Existing 2028 Notes issued on August 8, 2022 in the aggregate principal amount of $373.8 million and have substantially identical terms, including conversion rate, conversion price, convertible dates, redemption rights, conditions for conversion, settlement provisions and ranking.
The net proceeds to the Company from this issuance of Additional 2028 Notes were approximately $96.5 million after deducting the placement agent's fee, other debt issuance costs and discount. The Company used approximately $84.0 million of the net proceeds from this issuance to repurchase approximately $83.9 million in aggregate principal amount, which included accrued and unpaid interest, of its 2024 Notes concurrently with the issuance. This transaction involved a contemporaneous exchange of cash between the Company and holders of the 2024 Notes participating in the issuance of the Additional 2028 Notes. Accordingly, the transaction was evaluated for modification or extinguishment accounting in accordance with ASC 470-50, Debt – Modifications and Extinguishments on a creditor-by-creditor basis depending on whether the exchange was determined to have substantially different terms. The repurchase of the 2024 Notes and issuance of the Additional 2028 Notes were deemed to have substantially different terms based on the present value of the cash flows or significant difference between the value of the conversion option immediately prior to and after the exchange. Therefore, the repurchase of the 2024 Notes was accounted for as a debt extinguishment. The Company recorded an immaterial loss on extinguishment of debt in interest expense, in the consolidated statements of operations during the fiscal year ended December 30, 2023, which includes the write-off of the related deferred issuance costs. After giving effect to the repurchase, the total remaining principal amount outstanding under the 2024 Notes as of December 30, 2023 was $18.7 million.
The Company used the remaining net proceeds from the issuance of 2028 Notes for general corporate purposes, including working capital and to fund growth and potential strategic projects.
The 2024 Notes, the 2027 Notes and the 2028 Notes mature on September 1, 2024, March 1, 2027 and August 1, 2028, respectively. The Company did not have the right to redeem the 2024 Notes prior to September 5, 2021, and may not redeem the 2027 Notes prior to March 5, 2024 or the 2028 Notes prior to August 5, 2025. The Company may redeem for cash all or any portion of the 2024 Notes at its option, on or after September 5, 2021, the 2027 Notes, at its option, on or after March 5, 2024, and the 2028 Notes, at its option, on or after August 5, 2025, if the last reported sale price of its common stock has been at least 130% of the conversion price then in effect for at least 20 trading days (whether or not consecutive) during any 30 consecutive trading day period (including the last trading day of such period) ending on, and including the trading day immediately preceding the date on which the Company provides notice of redemption at a redemption price equal to 100% of the principal amount of the convertible senior notes to be redeemed, plus accrued and unpaid interest, if any, to, but excluding, the redemption date. No sinking fund is provided for the convertible senior notes.
Conversion Rate and Initial Conversion Price for each series of convertible senior notes are presented in the following table:
| | | | | | | | | | | | | | |
| | Conversion Rate per $1,000 Principal | | Initial Conversion Price |
| 2024 Notes | | 101.2812 | | $ | 9.87 | |
| 2027 Notes | | 130.5995 | | $ | 7.66 | |
| 2028 Notes | | 147.1183 | | $ | 6.80 | |
INFINERA CORPORATION
NOTES TO CONSOLIDATED FINANCIAL STATEMENTS—(Continued)
Throughout the term of the convertible senior notes, the conversion rate may be adjusted upon the occurrence of certain events, including for any cash dividends. Holders of the convertible senior notes will not receive any cash payment representing accrued and unpaid interest upon conversion. Accrued but unpaid interest will be deemed to be paid in full upon conversion rather than canceled, extinguished or forfeited. Prior to the close of business on the business day immediately preceding June 1, 2024 for the 2024 Notes, December 1, 2026 for the 2027 Notes and May 1, 2028 for the 2028 Notes (the convertible dates), holders may convert their convertible senior notes under the following circumstances:
•during any fiscal quarter commencing after the fiscal quarters ended on December 29, 2018 for the 2024 Notes, June 27, 2020 for the 2027 Notes and September 24, 2022 for the 2028 Notes (and only during such fiscal quarter) if the last reported sale price of the common stock for at least 20 trading days (whether or not consecutive) during a period of 30 consecutive trading days ending on the last trading day of the immediately preceding fiscal quarter is greater than or equal to 130% of the conversion price on each applicable trading day;
•during the five business day period after any five consecutive trading day period (the “measurement period”) in which the trading price per $1,000 principal amount of the convertible senior notes for each trading day of the measurement period was less than 98% of the product of the last reported sale price of the Company’s common stock and the conversion rate on each such trading day;
•if the Company calls any or all of the 2024 Notes, 2027 Notes, or 2028 Notes for redemption, holders of such series may convert their notes at any time prior to the close of business on the scheduled trading day immediately preceding the redemption date of such series called for redemption;
•upon the occurrence of specified corporate events described under the Indentures, such as a consolidation, merger or binding share exchange;
•or at any time on or after respective convertible dates, until the close of business on the second scheduled trading day immediately preceding the maturity date for such series, holders may convert their respective convertible senior notes at any time, regardless of the foregoing circumstances.
Upon the receipt of conversion requests, the settlement of the convertible senior notes will be paid pursuant to the terms of the respective governing Indentures. In the event that any of the 2024 Notes and 2027 Notes are converted, the Company would be required to repay the principal amount and any conversion premium in any combination of cash and shares of its common stock at the Company’s option. In the event that any of the 2028 Notes are converted, the Company would be required to repay the principal amount in cash and the conversion premium in any combination of cash and shares of its common stock at the Company’s option.
If the Company undergoes a fundamental change as defined in the Indentures, holders may require the Company to repurchase for cash all or any portion of their convertible senior notes at a repurchase price equal to 100% of the principal amount of the convertible senior notes to be repurchased, plus accrued and unpaid interest to, but excluding, the fundamental change repurchase date. In addition, upon the occurrence of a “make-whole fundamental change” (as defined in each of the Indentures), the Company may, in certain circumstances, be required to increase the conversion rate by a number of additional shares for a holder that elects to convert its convertible senior notes in connection with such make-whole fundamental change.
There have been no changes to the initial conversion price of the convertible senior notes since issuance. None of the conditions allowing holders of the convertible senior notes to convert early were met. The convertible senior notes were therefore not convertible during 2023.
INFINERA CORPORATION
NOTES TO CONSOLIDATED FINANCIAL STATEMENTS—(Continued)
Interest Expense
The following table presents the interest expense related to the contractual interest coupon, the amortization of debt issuance costs, and the amortization of debt discounts on our convertible senior notes (in thousands):
| | | | | | | | | | | | | | | | | | | | | |
| Year Ended | | | | |
| December 30, 2023 | | December 31, 2022 | | December 25, 2021 | | | | |
| Contractual interest expense | $ | 22,263 | | | $ | 16,589 | | | $ | 13,553 | | | | | |
| Amortization of debt issuance costs | 4,064 | | | 3,404 | | | 1,892 | | | | | |
| Amortization of debt discount | — | | | — | | | 29,411 | | | | | |
| Total interest expense | $ | 26,327 | | | $ | 19,993 | | | $ | 44,856 | | | | | |
Adoption of ASU 2020-06
Prior to the adoption of ASU 2020-06 on December 26, 2021 and in accounting for the issuance of the convertible senior notes, the convertible senior notes were separated into liability and equity components. The carrying amount of the liability component was calculated by measuring the fair value of a similar debt instrument that does not have an associated conversion feature. The carrying amounts of the equity component representing the conversion option related to the 2024 Notes and 2027 Notes were $128.7 million and $67.8 million, respectively. This was determined by deducting the fair value of the liability component from its par value. The equity component was recorded in additional paid-in-capital and was not re-measured as long as it continued to meet the conditions for equity classification. The excess of the principal amount of the liability component over its carrying amount (the “debt discount”) was amortized to interest expense over the respective contractual term of the convertible senior notes at an effective interest rate of 9.92%.
Prior to the adoption of ASU 2020-06 on December 26, 2021 and in accounting for the debt issuance costs of $12.9 million and $6.7 million related to the 2024 Notes and 2027 Notes, respectively, the Company allocated the total amount incurred to the liability and equity components of the convertible senior notes based on their relative values. Issuance costs attributable to the liability component were $8.7 million and $4.3 million, related to the 2024 Notes and 2027 Notes, respectively, and were amortized to interest expense using the effective interest method over the contractual term of the convertible senior notes. Issuance costs attributable to the equity component were netted with the equity component in additional paid-in-capital.
On December 26, 2021, the Company adopted ASU 2020-06 based on a modified retrospective transition method. Under such transition, prior-period information has not been retrospectively adjusted.
In accounting for the convertible senior notes after adoption of ASU 2020-06, the convertible senior notes are accounted for as a single liability. The issuance cost related to the 2024 Notes, the 2027 Notes and the 2028 Notes are being amortized to interest expense over the respective contractual term, at effective interest rates of 2.6%, 3.0% and 4.3%, respectively. Unamortized debt issuance costs will be amortized over the remaining life of the 2024 Notes, the 2027 Notes and the 2028 Notes which is approximately 8 months, 38 months, and 55 months, respectively.
INFINERA CORPORATION
NOTES TO CONSOLIDATED FINANCIAL STATEMENTS—(Continued)
The net carrying amount of the convertible senior notes as of December 30, 2023, and as of December 31, 2022, (post-ASU 2020-06 adoption) was as follows (in thousands):
| | | | | | | | | | | | | | | | | | | | | | | | | | | | | | | | | | | |
| 2024 Notes | | 2027 Notes | | 2028 Notes |
| December 30, 2023 | | December 31, 2022 | | December 30, 2023 | | December 31, 2022 | | December 30, 2023 | | December 31, 2022 |
| Principal | $ | 18,747 | | | $ | 102,652 | | | $ | 200,000 | | | $ | 200,000 | | | $ | 473,750 | | | $ | 373,750 | |
| | | | | | | | | | | |
Unamortized issuance costs and discount | — | | | (926) | | | (3,171) | | | (4,121) | | (11,823) | | (10,401) |
| Net carrying amount | $ | 18,747 | | | $ | 101,726 | | | $ | 196,829 | | | $ | 195,879 | | | $ | 461,927 | | | $ | 363,349 | |
Asset-based revolving credit facility
On June 24, 2022, the Company entered into a Loan, Guaranty and Security Agreement (the “Loan Agreement”) with the lenders party thereto, and Bank of America, N.A., as agent. The Loan Agreement provides for a senior secured asset-based revolving credit facility of up to $200 million (the "Credit Facility"), which the Company may draw upon from time to time. The Company may increase the total commitments under the revolving credit facility by up to an additional $100 million, subject to certain conditions. In addition, the Loan Agreement provides for a $50 million letter of credit subfacility and a $20 million swingline loan facility.
The proceeds of the loans under the Loan Agreement may be used to pay the fees, costs, and expenses incurred in connection with the Loan Agreement, repay existing debt and for working capital and general corporate purposes, including to fund growth. The Credit Facility has a stated maturity date of June 24, 2027. Availability under the Credit Facility will be based upon periodic borrowing base certifications valuing certain inventory and accounts receivable, as reduced by certain reserves. The Credit Facility is secured by a first-priority security interest (subject to certain exceptions) in inventory, certain related assets, specified deposit accounts, and certain other accounts.
Outstanding borrowings accrue interest at floating rates plus an applicable margin of 1.25% to 1.75% for Term Secured Overnight Financing Rate ("SOFR") rate loans and 0.25% to 0.75% for base rate loans. The unused line fee rate payable on the unused portion of the Credit Facility is equal to 0.25% per annum based on utilization of the Credit Facility.
The Loan Agreement contains customary affirmative covenants, such as financial statement reporting requirements and delivery of borrowing base certificates. The Loan Agreement also contains customary covenants that limit the ability of the Company to, among other things, incur debt, create liens and encumbrances, engage in certain fundamental changes, dispose of assets, prepay certain indebtedness, make restricted payments, make investments, and engage in transactions with affiliates. The Loan Agreement also contains a financial covenant that requires the Company to maintain a minimum fixed charge coverage ratio. As of December 30, 2023, the Company was in compliance with all covenants under the Loan Agreement.
In connection with the Credit Facility, the Company incurred lender and other third-party costs of approximately $1.2 million, which are recorded as a deferred asset and will be amortized to interest expense using a straight-line method over the term of the Credit Facility.
As of December 30, 2023, the Company had availability of $177.7 million under the Credit Facility. As of December 30, 2023, the Loan Agreement included a $50.0 million letter of credit subfacility and $22.1 million letters of credit issued and outstanding.
INFINERA CORPORATION
NOTES TO CONSOLIDATED FINANCIAL STATEMENTS—(Continued)
Mortgage Payable
In March 2019, the Company mortgaged a property it owns. The Company received proceeds of $8.7 million in connection with the loan. The loan carried a fixed interest rate of 5.25% and was repayable in 59 equal monthly installments of principal and interest with the remaining unpaid principal balance plus accrued unpaid interest due five years from the date of the loan.
In September 2021, the loan was amended to reduce the interest rate from 5.25% to 3.80% for the remaining 31 equal monthly installments of approximately $0.1 million, with the remaining principal payment at maturity date. In March 2024, the loan was further amended to extend it's maturity to May 27, 2024 and as a result, the interest rate increased to 7.50% effective March 27, 2024.
As of December 30, 2023, $6.8 million of the loan remained outstanding and is included in short-term debt, net in the consolidated balance sheets.
INFINERA CORPORATION
NOTES TO CONSOLIDATED FINANCIAL STATEMENTS—(Continued)
12. Commitments and Contingencies
The following table sets forth commitments and contingencies related to our various obligations (in thousands):
| | | | | | | | | | | | | | | | | | | | | | | | | | | | | | | | | | | | | | | | | |
| | | Payments Due by Period |
| Total | | 2024 | | 2025 | | 2026 | | 2027 | | 2028 | | Thereafter |
Operating leases(1)(2) | $ | 111,316 | | | $ | 16,570 | | | $ | 14,517 | | | $ | 11,068 | | | $ | 8,690 | | | $ | 6,554 | | | $ | 53,917 | |
Financing lease obligations(3) | 5,220 | | | 1,318 | | | 1,128 | | | 1,006 | | | 956 | | | 812 | | | — | |
Purchase obligations (4) | 466,346 | | | 445,633 | | | 19,844 | | | 869 | | | — | | | — | | | — | |
2028 Notes, including interest(5) | 562,579 | | | 17,766 | | | 17,766 | | | 17,766 | | | 17,766 | | | 491,515 | | | — | |
2027 Notes, including interest(5) | 217,500 | | | 5,000 | | | 5,000 | | | 5,000 | | | 202,500 | | | — | | | — | |
2024 Notes, including interest(5) | 19,145 | | | 19,145 | | | — | | | — | | | — | | | — | | | — | |
Mortgage Payable, including interest(5) | 6,830 | | | 6,830 | | | — | | | — | | | — | | | — | | | — | |
| Total contractual obligations | $ | 1,388,936 | | | $ | 512,262 | | | $ | 58,255 | | | $ | 35,709 | | | $ | 229,912 | | | $ | 498,881 | | | $ | 53,917 | |
(1) The Company leases facilities under non-cancelable operating lease agreements. These leases have varying terms that range from one to 14 years. The above payment schedule includes interest. See Note 3, "Leases" to the notes to consolidated financial statements for more information.
(2) The Company has contractual commitments to remove leasehold improvements and return certain properties to a specified condition when the leases terminate. At the inception of a lease with such conditions, the Company records an asset retirement obligation liability and a corresponding capital asset in an amount equal to the estimated fair value of the obligation. Asset retirement obligations were $4.6 million and $4.9 million as of December 30, 2023 and December 31, 2022, respectively. Of the $4.6 million as of December 30, 2023, $4.4 million is classified as other long-term liabilities on the accompanying consolidated balance sheets. The remainder is included in accrued expenses and other current liabilities.
(3) The Company has finance leases for computer hardware and leasehold improvements. The above payment schedule includes interest. See Note 3, "Leases" to the notes to consolidated financial statements for more information.
(4) The Company has agreements with its major production suppliers, where the Company is committed to purchase certain parts. As of December 30, 2023, December 31, 2022 and December 25, 2021, these non-cancelable purchase commitments were $466.3 million, $744.8 million and $591.5 million, respectively.
(5) See Note 11, "Debt" to the notes to consolidated financial statements for more information.
Legal Matters
NextGen Innovations, LLC
On August 9, 2022, NextGen Innovations, LLC ("NextGen") filed a complaint against us in the United States District Court for the Eastern District of Texas. The complaint asserts that through certain products we infringe on U.S. Patent Nos. 9,887,795, 10,263,723, and 10,771,181. The complaint alleges that NextGen is entitled to unspecified damages, costs, fees, expenses, interest, and injunctive relief. A Markman hearing was held on November 14, 2023, and the Court issued its claim construction order on December 22, 2023. Fact discovery closed on December 6, 2023, and expert discovery closed on February 4, 2024. The Court set a May 6, 2024 date for expected trial. On April 14, 2023, we filed petitions with the US Patent and Trademark Office ("USPTO") seeking inter partes reviews to invalidate asserted claims of the asserted NextGen patents. On December 4, 2023, the Patent Trial and Appeal Board of the USPTO denied institution of such inter partes reviews. A mediation was held on March 13, 2024, which resulted in a settlement in principle of the action against us. Following the mediation, the Court entered a stay of all litigation deadlines through May 20, 2024 to enable
INFINERA CORPORATION
NOTES TO CONSOLIDATED FINANCIAL STATEMENTS—(Continued)
NextGen and the Company to prepare a written settlement agreement and the appropriate dismissal papers for the Court. The parties are continuing to finalize the written settlement agreement. The Company does not expect that the terms of the settlement will have a material impact on its financial results.
In addition to the matter described above, we are subject to various legal proceedings, claims and litigation arising in the ordinary course of business. While the outcome of these matters is currently not determinable, we do not expect that the ultimate costs to resolve these matters will have a material effect on our consolidated financial position, results of operations or cash flows.
Loss Contingencies
The Company is subject to the possibility of various losses arising in the ordinary course of business. These may relate to disputes, litigation and other legal actions. In the preparation of its quarterly and annual financial statements, the Company considers the likelihood of loss or the incurrence of a liability, including whether it is probable, reasonably possible or remote that a liability has been incurred, as well as the Company’s ability to reasonably estimate the amount of loss, in determining loss contingencies. In accordance with U.S. GAAP, an estimated loss contingency is accrued when it is probable that a liability has been incurred and the amount of loss can be reasonably estimated. The Company regularly evaluates current information to determine whether any accruals should be adjusted and whether new accruals are required. As of each of December 30, 2023 and December 31, 2022, the Company has accrued the estimated liabilities associated with certain loss contingencies.
Indemnification Obligations
From time to time, the Company enters into certain types of contracts that contingently require it to indemnify parties against third-party claims. The terms of such indemnification obligations vary. These contracts may relate to: (i) certain real estate leases under which the Company may be required to indemnify property owners for environmental and other liabilities, and other claims arising from the Company’s use of the applicable premises; and (ii) certain agreements with the Company’s officers, directors and certain key employees, under which the Company may be required to indemnify such persons for liabilities.
In addition, the Company has agreed to indemnify certain customers for claims made against the Company’s products, where such claims allege infringement of third-party intellectual property rights, including, but not limited to, patents, registered trademarks, and/or copyrights. Under the aforementioned intellectual property indemnification clauses, the Company may be obligated to defend the customer and pay for the damages awarded against the customer under an infringement claim as well as the customer’s attorneys’ fees and costs. These indemnification obligations generally do not expire after termination or expiration of the agreement containing the indemnification obligation. In certain cases, there are limits on and exceptions to the Company’s potential liability for indemnification. The Company cannot estimate the amount of potential future payments, if any, that it might be required to make as a result of these agreements. The maximum potential amount of any future payments that the Company could be required to make under these indemnification obligations could be significant.
As permitted under Delaware law and the Company’s charter and bylaws, the Company has agreements whereby it indemnifies certain of its officers and each of its directors. The term of the indemnification period is for the officer’s or director’s lifetime for certain events or occurrences while the officer or director is, or was, serving at the Company’s request in such capacity. The maximum potential amount of future payments the Company could be required to make under these indemnification agreements could be significant; however, the Company has a director and officer insurance policy that may reduce its exposure and enable it to recover all or a portion of any future amounts paid. As a result of its insurance policy coverage, the Company believes the estimated fair value of these indemnification agreements is minimal.
INFINERA CORPORATION
NOTES TO CONSOLIDATED FINANCIAL STATEMENTS—(Continued)
13. Guarantees
Product Warranties
Activity related to product warranty was as follows (in thousands):
| | | | | | | | | | | |
| December 30, 2023 | | December 31, 2022 |
| Beginning balance | $ | 36,621 | | | $ | 44,310 | |
| Charges to operations | 22,304 | | | 27,176 | |
| Utilization | (20,516) | | | (22,420) | |
Change in estimate(1) | (5,209) | | | (12,445) | |
| Balance at the end of the period | $ | 33,200 | | | $ | 36,621 | |
(1)The Company records product warranty liabilities based on the latest quality and cost information available as of the date the revenue is recorded. The changes in estimate shown here are due to changes in overall actual failure rates, the mix of new versus used units related to replacement of failed units, and changes in the estimated cost of repair and product recalls. As the Company's products mature over time, failure rates and repair costs associated with such products generally decline leading to favorable changes in warranty reserves.
Letters of Credit and Bank Guarantees
The Company had $24.1 million and $24.7 million of standby letters of credit, bank guarantees and surety bonds outstanding as of December 30, 2023 and December 31, 2022, respectively. Details are set in below table (in thousands).
| | | | | | | | | | | | | | |
| | December 30, 2023 | | December 31, 2022 |
| Customer performance guarantees | | $ | 19,068 | | | $ | 20,903 | |
| Value added tax license | | 3,127 | | | 1,434 | |
| Property leases | | 1,894 | | | 2,398 | |
| | | | |
| | | | |
| | | | |
| Total | | $ | 24,089 | | | $ | 24,735 | |
Of the $19.1 million related to customer performance guarantees, approximately $4.0 million was used to secure surety bonds in the aggregate of $7.5 million as of December 30, 2023. Of the $20.9 million related to customer performance guarantees, approximately $4.0 million was used to secure surety bonds in the aggregate of $7.5 million as of December 31, 2022.
As of December 30, 2023, of the aforementioned standby letters of credit and bank guarantees outstanding, $1.9 million was backed by cash collateral.
INFINERA CORPORATION
NOTES TO CONSOLIDATED FINANCIAL STATEMENTS—(Continued)
14. Stockholders’ Equity
2016 Equity Incentive Plan
In February 2016, the Company's board of directors adopted the 2016 Plan and the Company's stockholders approved the 2016 Plan in May 2016. In May 2023, the Company's stockholders approved amendments to the 2016 Plan to increase the number of shares authorized for issuance under the 2016 Plan by $8.1 million. As of December 30, 2023, the Company reserved a total of 51.8 million shares of common stock for the award of stock options, RSUs and PSUs to employees, non-employees, consultants and members of the Company's board of directors pursuant to the 2016 Plan, plus any shares subject to awards granted under the 2007 Plan that, after the effective date of the 2016 Plan, expire, are forfeited or otherwise terminate without having been exercised in full to the extent such awards were exercisable, and shares issued pursuant to awards granted under the 2007 Plan that, after the effective date of the 2016 Plan, are forfeited to or repurchased by the Company due to failure to vest. The 2016 Plan has a maximum term of 10 years from the date of adoption, or it can be earlier terminated by the Company's board of directors. The 2007 Plan was cancelled and there are no outstanding grants under the 2007 Plan.
Employee Stock Purchase Plan
In February 2007, the Company's board of directors adopted the ESPP and the Company's stockholders approved the ESPP in May 2007. The ESPP was amended by the stockholders in May 2019 to increase the shares authorized under the ESPP to a total of approximately 31.6 million shares of common stock. The ESPP has a 20-year term. Eligible employees may purchase the Company’s common stock through payroll deductions at a price equal to 85% of the lower of the fair market values of the stock as of the beginning or the end of six-month offering periods. An employee’s payroll deductions under the ESPP are limited to a maximum of 15% of the employee’s compensation and an employee may not purchase more than 3,000 shares per purchase period.
The Company's ESPP was indefinitely suspended, effective upon the expiration of the offering period that ended August 15, 2023.
Shares Reserved for Future Issuances
Common stock reserved for future issuance was as follows (in thousands):
| | | | | |
| | December 30, 2023 |
| Outstanding stock awards | 15,189 | |
| Reserved for future award grants | 10,065 | |
| Reserved for future ESPP | 1,098 | |
| Total common stock reserved for stock options and awards | 26,352 | |
Stock-based Compensation Plans
The Company has stock-based compensation plans pursuant to which the Company has granted stock options, RSUs and PSUs. The Company also has an ESPP for all eligible employees. The following tables summarize the Company’s equity award activity and related information (in thousands, except per share data):
INFINERA CORPORATION
NOTES TO CONSOLIDATED FINANCIAL STATEMENTS—(Continued)
| | | | | | | | | | | | | | | | | |
| Number of
Restricted
Stock Units | | Weighted-Average
Grant Date
Fair Value
Per Share | | Aggregate
Intrinsic
Value |
Outstanding at December 26, 2020 | 12,468 | | | $ | 5.99 | | | $ | 136,781 | |
| RSUs granted | 7,377 | | | $ | 8.68 | | | |
| RSUs released | (7,509) | | | $ | 5.96 | | | $ | 66,317 | |
| RSUs canceled | (729) | | | $ | 6.92 | | | |
Outstanding at December 25, 2021 | 11,607 | | | $ | 7.66 | | | $ | 110,849 | |
| RSUs granted | 8,897 | | | $ | 8.26 | | | |
| RSUs released | (6,690) | | | $ | 7.52 | | | $ | 46,104 | |
| RSUs canceled | (1,226) | | | $ | 7.89 | | | |
Outstanding at December 31, 2022 | 12,588 | | | $ | 8.13 | | | $ | 84,847 | |
| RSUs granted | 6,990 | | | $ | 6.97 | | | |
| RSUs released | (7,496) | | | $ | 8.10 | | | $ | 43,001 | |
| RSUs canceled | (546) | | | $ | 8.01 | | | |
Outstanding at December 30, 2023 | 11,536 | | | $ | 7.45 | | | $ | 54,802 | |
| | | | | | | | | | | | | | | | | |
| Number of
Performance
Stock Units | | Weighted-Average
Grant Date
Fair Value Per Share | | Aggregate
Intrinsic
Value |
Outstanding at December 26, 2020 | 3,466 | | | $ | 5.36 | | | $ | 38,022 | |
| PSUs granted | 659 | | | $ | 8.61 | | | |
| | | | | |
| PSUs released | (964) | | | $ | 5.21 | | | $ | 8,278 | |
| PSUs canceled | (1,047) | | | $ | 4.91 | | | |
Outstanding at December 25, 2021 | 2,114 | | | $ | 6.66 | | | $ | 20,184 | |
| PSUs granted | 899 | | | $ | 8.38 | | | |
| | | | | |
| PSUs released | (335) | | | $ | 5.40 | | | $ | 2,592 | |
| PSUs canceled | (119) | | | $ | 7.19 | | | |
Outstanding at December 31, 2022 | 2,559 | | | $ | 7.40 | | | $ | 17,251 | |
| PSUs granted | 1,835 | | | $ | 7.26 | | | |
| PSUs released | — | | | $ | — | | | $ | — | |
| PSUs canceled | (741) | | | $ | 5.94 | | | |
Outstanding at December 30, 2023 | 3,653 | | | $ | 7.63 | | | $ | 17,352 | |
| | | | | |
The aggregate intrinsic value of unreleased RSUs and unreleased PSUs is calculated using the closing price of the Company's common stock of $4.75 at December 29, 2023. The aggregate intrinsic value of RSUs and PSUs released is calculated using the fair market value of the common stock at the date of release.
The following table presents total stock-based compensation cost for instruments granted but not yet recognized, net of forfeitures, of the Company’s equity compensation plans as of December 30, 2023. These costs are expected to be amortized on a straight-line basis over the following weighted-average periods (in thousands, except for weighted-average period):
INFINERA CORPORATION
NOTES TO CONSOLIDATED FINANCIAL STATEMENTS—(Continued)
| | | | | | | | | | | |
| Unrecognized
Compensation
Expense, Net | | Weighted-
Average Period
(in years) |
| | | |
| RSUs | $ | 67,456 | | | 1.85 |
| PSUs | $ | 16,477 | | | 2.10 |
Employee Stock Purchase Plan
The fair value of the ESPP shares was estimated at the date of grant using the following assumptions:
| | | | | | | | | | | | | | | | | |
| | Years Ended |
| | December 30, 2023 | | December 31, 2022 | | December 25, 2021 |
| Volatility | 60% - 63% | | 39% - 63% | | 38% - 50% |
| Risk-free interest rate | 3.12% - 4.98% | | 0.67% - 3.12% | | 0.05% - 0.06% |
| Expected life | 0.5 years | | 0.5 years | | 0.5 years |
| Estimated fair value | $1.91 - $2.37 | | $1.91 - $2.21 | | $2.22 - $3.11 |
The expected dividend yield is zero for the Company as it does not expect to pay dividends in the future.
ESPP activity was as below (in thousands):
| | | | | | | | | | | | | | | | | |
| | Years Ended |
| | December 30, 2023 | | December 31, 2022 | | December 25, 2021 |
| Stock-based compensation expense | $ | 3,798 | | | $ | 5,551 | | | $ | 5,879 | |
| Employee contributions | $ | 14,930 | | | $ | 15,189 | | | $ | 16,167 | |
| Shares purchased | 3,514 | | | 2,552 | | | 2,272 | |
Restricted Stock Units
Pursuant to the 2016 Plan, the Company has granted RSUs to employees, non-employee members of the Company's board of directors and consultants. All RSUs awarded are subject to each individual's continued service to the Company through each applicable vesting date. The Company accounted for the fair value of the RSUs using the closing market price of the Company’s common stock on the date of grant.
Performance Stock Units
Pursuant to the 2016 Plan, the Company has granted PSUs to certain of the Company’s executive officers, senior management and certain employees. All PSUs awarded are subject to each individual's continued service to the Company through each applicable vesting date and if the performance metrics are not met within the time limits specified in the award agreements, the PSUs will be canceled.
PSUs granted to the Company's executive officers, senior management and certain other employees under the 2016 Plan during 2023, 2022, 2021 and 2020 are based on performance criteria related to a specific financial target over the span of a two or three-year performance period. These PSUs may become eligible for vesting to begin before the end of such two-year or three-year performance period, if the applicable financial target is met. The number of shares to be issued upon vesting of these PSUs ranges from 0 to 1.5 times the target number of PSUs granted. Certain other employees were awarded PSUs that will only vest upon the achievement of specific financial and operational performance criteria.
INFINERA CORPORATION
NOTES TO CONSOLIDATED FINANCIAL STATEMENTS—(Continued)
The following table summarizes by grant year, the Company’s PSU activity for the fiscal year ended December 30, 2023 (in thousands):
| | | | | | | | | | | | | | | | | | | | | | | | | | | | | | | | |
| | Total Number of Performance Stock Units | | 2020 | | 2021 | | 2022 | | 2023 |
Outstanding at December 31, 2022 | | 2,559 | | | 1,058 | | | 602 | | | 899 | | | — | |
| PSUs granted | | 1,835 | | | — | | | — | | | — | | | 1,835 | |
| | | | | | | | | | |
| | | | | | | | | | |
| PSUs canceled | | (741) | | | (708) | | | — | | | — | | | (33) | |
Outstanding at December 30, 2023 | | 3,653 | | | 350 | | | 602 | | | 899 | | | 1,802 | |
Stock-based Compensation Expense
The following table summarizes the amortization of stock-based compensation expense related to the RSUs, and PSUs (in thousands):
| | | | | | | | | | | | | | | | | |
| | Years Ended |
| | December 30, 2023 | | December 31, 2022 | | December 25, 2021 |
RSUs | $ | 52,723 | | | $ | 54,102 | | | $ | 42,344 | |
PSUs | $ | 5,545 | | | $ | 1,636 | | | $ | 3,316 | |
The following table summarizes the effects of stock-based compensation on the Company’s consolidated balance sheets and statements of operations for the periods presented (in thousands):
| | | | | | | | | | | | | | | | | |
| | Years Ended |
| | December 30, 2023 | | December 31, 2022 | | December 25, 2021 |
| Stock-based compensation effects in inventory | $ | 3,895 | | | $ | 3,979 | | | $ | 3,707 | |
| Income tax benefit associated with stock-based compensation | $ | 8,165 | | | $ | 8,588 | | | $ | 9,345 | |
| Stock-based compensation effects in net loss before income taxes | | | | | |
| Cost of revenue | $ | 10,000 | | | $ | 9,485 | | | $ | 7,928 | |
| Research and development | 22,474 | | | 23,553 | | | 18,554 | |
| Sales and marketing | 13,699 | | | 13,311 | | | 12,345 | |
| General and administrative | 15,977 | | | 14,666 | | | 12,985 | |
| Total stock-based compensation expense | $ | 62,150 | | | $ | 61,015 | | | $ | 51,812 | |
INFINERA CORPORATION
NOTES TO CONSOLIDATED FINANCIAL STATEMENTS—(Continued)
15. Income Taxes
The following is a geographic breakdown of the provision for income taxes (in thousands):
| | | | | | | | | | | | | | | | | |
| | Years Ended |
| | December 30, 2023 | | December 31, 2022 | | December 25, 2021 |
| Current: | | | | | |
| Federal | $ | 1,278 | | | $ | 945 | | | $ | 991 | |
| State | 3,035 | | | 1,537 | | | 137 | |
| Foreign | 5,672 | | | 20,616 | | | 12,431 | |
| Total current | $ | 9,985 | | | $ | 23,098 | | | $ | 13,559 | |
| Deferred: | | | | | |
| Federal | $ | — | | | $ | — | | | $ | — | |
| State | — | | | — | | | — | |
| Foreign | (2,180) | | | (2,566) | | | (1,571) | |
| Total deferred | $ | (2,180) | | | $ | (2,566) | | | $ | (1,571) | |
| Total provision for income taxes | $ | 7,805 | | | $ | 20,532 | | | $ | 11,988 | |
Loss before provision for income taxes from international operations was $65.0 million for the year ended December 30, 2023, income before provision for income taxes from international operations was $20.2 million for the year ended December 31, 2022, and loss before provision for income taxes from international operations was $20.7 million for the year ended December 25, 2021.
The provisions for income taxes differ from the amount computed by applying the statutory federal income tax rates as follows:
| | | | | | | | | | | | | | | | | |
| | Years Ended |
| | December 30, 2023 | | December 31, 2022 | | December 25, 2021 |
| Expected tax at federal statutory rate | 21.0 | % | | 21.0 | % | | 21.0 | % |
| State taxes, net of federal benefit | (15.5) | % | | (2.3) | % | | (0.1) | % |
Tax credits | (37.9) | % | | 10.2 | % | | 2.9 | % |
| Stock-based compensation | (42.3) | % | | (10.2) | % | | 0.1 | % |
| Change in valuation allowance | 20.7 | % | | (19.1) | % | | (20.0) | % |
| Foreign rate differential | 4.8 | % | | (7.6) | % | | (1.1) | % |
Non-deductible expenses | (5.7) | % | | (16.1) | % | | (6.4) | % |
Other taxes on foreign operations | (24.1) | % | | (5.0) | % | | (1.5) | % |
Return to provision | 44.2 | % | | (3.7) | % | | (2.7) | % |
Uncertain tax positions | (3.6) | % | | (1.8) | % | | 4.0 | % |
Prior year adjustment | (4.4) | % | | (1.0) | % | | (1.8) | % |
| Other | (2.0) | % | | (1.5) | % | | (1.9) | % |
| Effective tax rate | (44.8) | % | | (37.1) | % | | (7.5) | % |
For 2023, the Company's income tax expense was $7.8 million with effective tax rate of (44.8)%. The difference between the effective tax rate and the U.S federal statutory rate of 21% is due to state income taxes, tax credits, stock-based compensation, foreign income taxed at different rates, impact due to foreign currency translation, foreign income inclusions in the U.S., foreign tax credit expiration, and losses in foreign jurisdictions
INFINERA CORPORATION
NOTES TO CONSOLIDATED FINANCIAL STATEMENTS—(Continued)
that require a valuation allowance. For 2022, the Company's income tax expense was $20.5 million with an effective tax rate of (37.1)%. The difference between the effective tax rate and the U.S federal statutory rate of 21% was primarily the result of tax credits, stock-based compensation, foreign income taxed at different rates and valuation allowances. The Company recognized an income tax expense of $12.0 million in 2021 with an effective tax rate of (7.5)%. The 2021 effective tax rate differs from the U.S. federal statutory rate of 21% based on state income taxes, non-deductible stock-based compensation expenses and foreign taxes provided on foreign subsidiary earnings.
Deferred tax assets and liabilities are recognized for the future tax consequences of differences between the carrying amounts of assets and liabilities and their respective tax basis using enacted tax rates in effect for the year in which the differences are expected to reverse. Significant deferred tax assets and liabilities consist of the following (in thousands):
| | | | | | | | | | | |
| | Years Ended |
| | December 30, 2023 | | December 31, 2022 |
| Deferred tax assets: | | | |
| Net operating losses | $ | 296,449 | | | $ | 293,179 | |
| Research and foreign tax credits | 137,130 | | | 140,828 | |
Non-deductible accruals | 63,763 | | | 57,480 | |
| R&D expense capitalization | 65,125 | | | 49,135 | |
| Inventory valuation | 13,612 | | | 14,329 | |
| | | |
| Leasing Liabilities | 23,917 | | | 16,890 | |
| Stock-based compensation | 4,016 | | | 5,138 | |
| Total deferred tax assets | $ | 604,012 | | | $ | 576,979 | |
| Valuation allowance | (576,998) | | | (548,257) | |
| Net deferred tax assets | $ | 27,014 | | | $ | 28,722 | |
| Deferred tax liabilities: | | | |
| Property, plant and equipment | $ | (281) | | | $ | (11,912) | |
| Right of use asset | (17,946) | | | (10,482) | |
| Acquired intangible assets | (4,113) | | | (4,293) | |
| | | |
| Total deferred tax liabilities | $ | (22,340) | | | $ | (26,687) | |
| Net deferred tax assets (liabilities) | $ | 4,674 | | | $ | 2,035 | |
The ultimate realization of deferred tax assets is dependent upon the generation of future taxable income during the periods in which those temporary differences become deductible. The Company must consider all positive and negative evidence, including the Company's forecasts of taxable income over the applicable carryforward periods, its current financial performance, its market environment, and other factors in evaluating the need for a full or partial valuation allowance against its net U.S. deferred tax assets. Based on the available objective evidence, management believes it is not more likely than not that the domestic net deferred tax assets will be realizable in the foreseeable future. Accordingly, the Company has provided a full valuation allowance against its domestic deferred tax assets, net of deferred tax liabilities, as of December 30, 2023 and December 31, 2022.
The Company intends to continue maintaining a full valuation allowance on its deferred tax assets until there is sufficient evidence to support the reversal of all or some portion of these allowances. However, considering the Company's current assessment of the probability of maintaining profitability, there is a reasonable possibility that, within the next year or two, sufficient positive evidence may become available to reach a conclusion that a portion of the valuation allowance will no longer be needed. As such, the Company may release a portion of its valuation allowance against its deferred tax assets within the next 12-24 months. This release, if
INFINERA CORPORATION
NOTES TO CONSOLIDATED FINANCIAL STATEMENTS—(Continued)
any, would result in the recognition of certain deferred tax assets and a decrease to income tax expense for the period such release is recorded.
The Company files tax returns in numerous jurisdictions. The results of our operations outside of the United States are consolidated for financial reporting; however, earnings from investments in non-U.S. operations are included in domestic taxable income only when actually or constructively received. No deferred taxes have been provided on the undistributed gross book-tax basis differences of our non-U.S. operations because we have the ability to and intend to permanently reinvest these basis differences overseas.
Beginning in 2022, the Tax Cuts and Jobs Act of 2017 eliminated the right to deduct research and development expenditures for tax purposes in the period the expenses were incurred and instead requires all U.S. and foreign research and development expenditures to be amortized over five and fifteen tax years, respectively. Due to this required capitalization of research and development expenditures, the Company has recorded a U.S. current income tax expense of $3.0 million for the year ended December 30, 2023. The U.S. current income tax provision is primarily for state taxes we anticipate paying as a result of statutory limitations on our ability to offset expected taxable income with net operating loss and research and development credit carry forwards. The increase in federal taxable income due to Section 174 capitalization is offset by net operating carryover balance. It is expected that Section 174 capitalization will continue to generate federal and state taxable income in future years and continue to utilize net operating loss and other available tax credits.
As of December 30, 2023, the Company had net operating loss carryforwards of approximately $456.2 million for federal income tax purposes. The Company had net operating loss carryforwards of approximately $331.7 million for state income tax purposes which will begin to expire in 2024 if unused. The Company also had foreign net operating loss carryforwards of approximately $812.3 million.
As of December 30, 2023, the Company also had R&D credit carryforwards of approximately $50.4 million for federal income tax and $57.4 million for state income tax purposes. The federal R&D tax credit will begin to expire in 2024 if unused. State R&D tax credits will carry forward indefinitely.
As of December 30, 2023, the Company also had foreign tax credit carryforwards of approximately $33.2 million for federal income tax. The foreign tax credit will begin to expire in 2024 if unused.
Infinera Canada Inc., an indirect wholly owned subsidiary, has Scientific Research and Experimental Development Expenditures (“SRED”) credits available of $5.5 million to offset future Canadian income taxes payable as of December 30, 2023, and will begin to expire in 2024 if unused. Infinera Portugal has a SIFIDE Credit of $2.6 million to offset future Portugal's income tax payable as of December 30, 2023, and will begin to expire in 2024 if unused.
The federal and state net operating loss carryforwards may be subject to significant limitations under Section 382 and Section 383 of the Internal Revenue Code of 1986 and similar provisions under state law. The Tax Reform Act of 1986 contains provisions that limit the federal net operating loss carryforwards that may be used in any given year in the event of special occurrences, including significant ownership changes. The Company has completed a Section 382 review and has determined that none of its operating losses will expire solely due to Section 382 limitation(s).
INFINERA CORPORATION
NOTES TO CONSOLIDATED FINANCIAL STATEMENTS—(Continued)
The aggregate changes in the balance of gross unrecognized tax benefits were as follows (in thousands):
| | | | | | | | | | | | | | | | | |
| December 30, 2023 | | December 31, 2022 | | December 25, 2021 |
| Beginning balance | $ | 57,849 | | | $ | 54,250 | | | $ | 57,931 | |
| Tax position related to current year | | | | | |
| Additions | 1,417 | | | 1,536 | | | 1,198 | |
| Tax positions related to prior years | | | | | |
| Additions | 20,638 | | | 7,220 | | | 7,633 | |
| Reductions | (5,578) | | | (4,832) | | | (9,569) | |
| Lapses of statute of limitations | (155) | | | (325) | | | (2,943) | |
| Ending balance | $ | 74,171 | | | $ | 57,849 | | | $ | 54,250 | |
As of December 30, 2023, the cumulative unrecognized tax benefit was $74.2 million, of which $67.6 million are related to tax credits. The $67.6 million was netted against deferred tax assets, and would have otherwise been subjected with a full valuation allowance. Of the total unrecognized tax benefit as of December 30, 2023, approximately $8.1 million, if recognized, would impact the Company’s effective tax rate. The amount of unrecognized tax benefit could be reduced upon expiration of the applicable statute of limitation. The potential reduction in unrecognized tax benefits during the next 12 months is not expected to be material.
As of December 30, 2023, December 31, 2022 and December 25, 2021, the Company had $1.5 million, $1.3 million and $2.1 million, respectively, of accrued interest and penalties related to unrecognized tax benefits, of which less than $0.8 million was included in the Company’s provision for income taxes in each of the years ended December 30, 2023, December 31, 2022 and December 25, 2021, respectively. The Company’s policy is to include interest and penalties related to unrecognized tax benefits within the Company’s provision for income taxes.
The Company files income tax returns in numerous tax jurisdictions, including the U.S., U.S. states and non-U.S. jurisdictions around the world. The statute of limitations varies by jurisdiction in which the Company operates. Because of the number of jurisdictions in which the Company files tax returns, in any given year the statute of limitations in certain jurisdictions may expire without examination.
Included in the balance of income tax liabilities, accrued interest and penalties at December 30, 2023 is an immaterial amount related to tax positions for which it is reasonably possible that the statute of limitations will expire in various jurisdictions within the next twelve months.
16. Segment Information
Operating segments are defined as components of an enterprise about which separate financial information is available that is evaluated regularly by the chief operating decision maker, or decision making group, in deciding how to allocate resources and in assessing performance. The Company’s chief operating decision maker is the Company’s Chief Executive Officer (“CEO”). The Company’s CEO reviews financial information presented on a consolidated basis, accompanied by information about revenue by geographic region for purposes of allocating resources and evaluating financial performance. The Company has one business activity as a provider of optical transport networking equipment, software and services. Accordingly, the Company is considered to be in a single reporting segment and operating unit structure.
Revenue by geographic region is based on the shipping address of the end-customer. For more information regarding revenue disaggregated by geography, see Note 4, “Revenue Recognition” to the notes to consolidated financial statements.
Additionally, the following table sets forth our property, plant and equipment, net by geographic region (in thousands):
INFINERA CORPORATION
NOTES TO CONSOLIDATED FINANCIAL STATEMENTS—(Continued)
| | | | | | | | | | | |
| December 30, 2023 | | December 31, 2022 |
| United States | $ | 188,684 | | | $ | 156,065 | |
| Other Americas | 2,777 | | | 2,908 | |
| Europe, Middle East and Africa | 9,973 | | | 10,285 | |
Asia Pacific | 5,563 | | | 3,671 | |
| Total property, plant and equipment, net | $ | 206,997 | | | $ | 172,929 | |
17. Employee Benefit and Pension Plans
Defined Contribution Plans
The Company has established a savings plan under Section 401(k) of the Code (the “401(k) Plan”). As allowed under Section 401(k) of the Code, the 401(k) Plan provides tax-deferred salary contributions for eligible U.S. employees. Employee contributions are limited to a maximum annual amount as set periodically by the Code. The Company made voluntary cash contributions and matched a portion of employee contributions of $3.0 million, $3.0 million and $2.8 million for 2023, 2022, and 2021, respectively. Expenses related to the 401(k) Plan were insignificant for each of the years 2023, 2022, and 2021.
The Company has an ITP pension plan covering its Swedish employees. Commitments for old-age and survivors' pension for salaried employees in Sweden are vested through an insurance policy. Expenses related to the ITP pension plan were $2.2 million, $2.5 million and $2.8 million for 2023, 2022, and 2021, respectively.
The Company also provides defined contribution plans in certain foreign countries where required by local statute or at the Company's discretion. The Company incurred $4.8 million, $4.9 million, and $6.2 million in expense related to post-retirement costs for 2023, 2022, and 2021, respectively.
Pension Plans
Pension and Post-Retirement Benefit Plans
The Company has a number of post-employment plans in Germany, as well as a number of smaller post-employment plans in other countries, including both defined contribution and defined benefit plans. The defined benefit plans expose the Company to actuarial risks such as, investment risk, interest rate risk, life expectancy risk and salary risk. The characteristics of the defined benefit plans and the risks associated with them vary depending on legal, fiscal, and economic requirements.
INFINERA CORPORATION
NOTES TO CONSOLIDATED FINANCIAL STATEMENTS—(Continued)
Obligations and Funded Status
The following table sets forth the changes in benefits obligations and the fair value of plan assets of the Company's benefit plans (in thousands):
| | | | | | | | | | | | |
| December 30, 2023 | | December 31, 2022 | |
| Benefit obligation at beginning of year | $ | 76,172 | | | $ | 115,771 | | |
| Service cost | 163 | | | 300 | | |
| Interest cost | 3,103 | | | 1,249 | | |
| Benefits paid | (4,700) | | | (3,382) | | |
| | | | |
| | | | |
Actuarial loss (gain) | 7,156 | | | (30,779) | | |
| Employee contributions | 18 | | | 54 | | |
| Foreign currency exchange rate changes | 3,245 | | | (7,041) | | |
Benefit obligation at end of year(1) | $ | 85,157 | | | $ | 76,172 | | |
| Fair value of plan assets at beginning of year | $ | 66,455 | | | $ | 81,615 | | |
| Actual (loss) return on plan assets | 7,793 | | | (5,305) | | |
| Payments | (767) | | | (5,316) | | |
| | | | |
| Employee contributions | 124 | | | 153 | | |
| Employer contributions | 78 | | | — | | |
| Foreign currency exchange rate changes | 2,894 | | | (4,692) | | |
| Fair value of plan assets at end of year | $ | 76,577 | | | $ | 66,455 | | |
| Net liability recognized | $ | 8,580 | | | $ | 9,717 | | |
(1) The Company's accumulated benefit obligation was $84.7 million and $76.1 million at December 30, 2023 and December 31, 2022, respectively.
The net liability is included in the line item other long-term liabilities in the Company's consolidated balance sheets.
The following table presents net amounts of non-current assets and current and non-current liabilities for the Company's pension and other post-retirement benefit plans recognized on its consolidated balance sheet (in thousands):
| | | | | | | | | | | |
| December 30, 2023 | | December 31, 2022 |
| Other non-current assets | $ | 76,577 | | | $ | 66,455 | |
| Other long-term liabilities | (85,157) | | | (76,172) | |
| Net liability recognized | $ | (8,580) | | | $ | (9,717) | |
INFINERA CORPORATION
NOTES TO CONSOLIDATED FINANCIAL STATEMENTS—(Continued)
Components of Net Periodic Benefit Cost
Net periodic benefit cost for the Company's pension and other post-retirement benefit plans consisted of the following (in thousands):
| | | | | | | | | | | | | | | | | |
| Years ended |
| December 30, 2023 | | December 31, 2022 | | December 25, 2021 |
| Service cost | $ | 163 | | | $ | 300 | | | $ | 351 | |
| Interest cost | 3,103 | | | 1,249 | | | 1,265 | |
| Expected return on plan assets | (2,639) | | | (2,936) | | | (2,895) | |
Amortization of net actuarial (gain) loss | (413) | | | 326 | | | 3,383 | |
| Total net periodic (benefit) cost | $ | 214 | | | $ | (1,061) | | | $ | 2,104 | |
Actuarial gains and losses are amortized using a corridor approach. The gain/loss corridor is equal to 10% of the greater of the pension benefit obligation and the market-related value of assets. Gains and losses in excess of the corridor are generally amortized over the average future working lifetime of the pension plan participants. The service cost component is included in operating expenses in the Company's consolidated statements of operations. All other components are included in Other income (expense), net in the Company's consolidated statements of operations.
The following table sets forth the changes in accumulated other comprehensive income (loss) for the Company's benefit plans (pre-tax) (in thousands):
| | | | | | | | | | | | | |
| December 30, 2023 | | December 31, 2022 | | |
| Beginning balance | $ | 27,161 | | | $ | 4,297 | | | |
Net actuarial (gain) loss arising in current year | (2,002) | | | 22,538 | | | |
Amortization of net actuarial (gain) loss(1) | (413) | | | 326 | | | |
| | | | | |
| Ending balance | $ | 24,746 | | | $ | 27,161 | | | |
(1) The actuarial gain for the fiscal year ended December 30, 2023 is primarily due to the change in the discount rate. Amounts recorded in accumulated other comprehensive income (loss) expected to be amortized as a part of net periodic pension cost during 2024 is $0.6 million (pre-tax).
Assumptions
Certain actuarial assumptions used in computing the benefit obligations for the major plans are as follows:
| | | | | | | | | | | |
| December 30, 2023 | | December 31, 2022 |
| Discount rate | 3.51 | % | | 4.17 | % |
| Salary growth rate | 2.50 | % | | 2.50 | % |
| Pension growth rate | 2.25 | % | | 2.25 | % |
| Expected long-term rate of return on plan assets | 3.93 | % | | 3.93 | % |
INFINERA CORPORATION
NOTES TO CONSOLIDATED FINANCIAL STATEMENTS—(Continued)
Investment Policy
The financial position of the Company’s funded status is the difference between the fair value of plan assets and projected benefit obligations. Volatility in funded status occurs when asset values change differently from liability values and can result in fluctuations in costs in financial reporting. The Company’s investment policies and strategies are designed to increase the rate of assets to plan liabilities at an appropriate level of funded status volatility. Asset allocation decisions are recommended by the trustees for the specific plan and agreed to by the Company's management. Investment objectives are designed to generate returns that will enable the plan to meet its future obligations. The Company's management reviews the investment strategy and performance semi-annually and discuss alternatives to manage volatility.
Basis for Expected Long-Term Rate of Return on Plan Assets
The expected long-term rate of return on plan assets reflects the expected returns for each major asset class in which the plan invests and the weight of each asset class in the target mix. Expected asset returns reflect the current yield on government bonds, risk premiums for each asset class and expected real returns which considers each country’s specific inflation outlook. The expected return is set using a low to medium risk profile and to meet the market expectations over a longer period of time to meet the obligations in the future.
Fair Value of Plan Assets
The following tables present the fair value of plan assets for pension and other benefit plans by major asset category (in thousands):
| | | | | | | | | | | | | | | | | | | | | | | | | | | | | | | | | | | | | |
| | As of December 30, 2023 | | December 31, 2022 |
| | Fair Value Measured Using | | Fair Value Measured Using |
| | Level 1 | | Level 2 | | | | Total | | Level 1 | | Level 2 | | Total |
| Cash | $ | 677 | | | $ | — | | | | | $ | 677 | | | $ | 1,160 | | | $ | — | | | $ | 1,160 | |
| Equity fund | — | | | 51,226 | | | | | 51,226 | | | — | | | 41,492 | | | 41,492 | |
| Insurance contracts | — | | | 24,674 | | | | | 24,674 | | | — | | | 23,803 | | | 23,803 | |
| | | | | | | | | | | | | |
| Total plan assets at fair value | $ | 677 | | | $ | 75,900 | | | | | $ | 76,577 | | | $ | 1,160 | | | $ | 65,295 | | | $ | 66,455 | |
| | | | | | | | | | | | | |
Valuation Techniques
The following describes the valuation techniques used to measure the fair value of the assets shown in the table above. Equity funds are invested in traded securities and are recorded at market value as of the balance sheet date. Insurance contracts are recorded at cash surrender value of the policies. Mixed fund and pension fund are valued at the amounts as provided by the insurance companies who manage the funds and represent fair market value at the date of the balance sheet.
Transfers Between Levels
Any transfers between levels in the fair value hierarchy are recognized as of the end of the reporting period. No material transfers between levels occurred during the fiscal year ended December 30, 2023.
Future Contributions
In 2024, the Company does not expect to make additional contributions to the plan.
INFINERA CORPORATION
NOTES TO CONSOLIDATED FINANCIAL STATEMENTS—(Continued)
Cash Flows
Estimated future benefit payments under the Company's pension plans as of December 30, 2023 are as follows (in thousands):
| | | | | |
| 2024 | $ | 6,176 | |
| 2025 | 3,925 | |
| 2026 | 4,285 | |
| 2027 | 4,213 | |
| 2028 | 4,494 | |
| 2029 to 2033 | 23,688 | |
ITEM 9. CHANGES IN AND DISAGREEMENTS WITH ACCOUNTANTS ON ACCOUNTING AND FINANCIAL DISCLOSURE
None.
ITEM 9A. CONTROLS AND PROCEDURES
Attached as exhibits to this Form 10-K are certifications of our principal executive officer and principal financial officer, which are required in accordance with Rule 13a-14 of the Exchange Act. This “Controls and Procedures” section includes information concerning the internal controls and controls evaluation referred to in the certifications.
Evaluation of Disclosure Controls and Procedures
An evaluation was performed by our management, with the participation of our principal executive officer and our principal financial officer, of the effectiveness of our disclosure controls and procedures (as defined in Rules 13a-15(e) and 15d -15(e) under the Exchange Act) as of the period covered by this report (the "Evaluation Date"). Disclosure controls and procedures are designed to ensure that information required to be disclosed in our reports filed or submitted under the Exchange Act is recorded, processed, summarized and reported within the time periods specified in the SEC’s rules and forms and that such information is accumulated and communicated to management, including our principal executive officer and principal financial officer, as appropriate, to allow timely decisions regarding required disclosure. Based on this evaluation, our principal executive officer and principal financial officer concluded that, as of the Evaluation Date, our disclosure controls and procedures were not effective due to the unremediated material weaknesses in our internal control over financial reporting described below.
Notwithstanding the identified material weaknesses, our principal executive officer and principal financial officer concluded that our consolidated financial statements included in Part II, Item 8, "Financial Statements and Supplementary Data" of this report fairly present, in all material respects, our financial condition, results of operations and cash flows as of and for the periods presented in conformity with U.S. GAAP.
Remediation of Previously Reported Material Weaknesses
As previously reported in the Company’s Form 10-Q for the quarter ended September 30, 2023, the Amended Quarterly Report on Form 10-Q/A for the quarter ended July 1, 2023, the Amended Quarterly Report on Form 10-Q/A for the quarter ended April 1, 2023 and the Amended Annual Report on Form 10-K/A for the fiscal year ended December 31, 2022, we previously identified material weaknesses in internal control over financial reporting due to control deficiencies within the revenue portion of our quote to cash cycle (revenue cycle) and inventory cycle, and with respect to these, our internal resources, expertise and policies required to maintain an effective control environment. Additionally, as related to both our revenue and inventory cycles, certain key controls were not sufficiently designed to assess the completeness and accuracy of Information Produced by the Entity (IPE).
Our management, under the oversight of the Audit Committee of our Board of Directors, has evaluated the material weaknesses described above and designed a remediation plan to enhance our internal control environment. To remediate the material weaknesses, we plan to:
a.revise the methodology used to determine our stand-alone selling prices ("SSPs"), including the design and implementation of effective controls that provide adequate review and evaluation of such methodology, and related financial statement disclosures;
b.review and revise the design and implementation of key controls related to inventory, including the estimation of reserves for excess and obsolete inventory and the application of our policy for capitalizing variances from standard costs;
c.design and implement effective controls over IPE to ensure adequate levels of evidence and documentation to support controls procedures, augmented by training of our control preparers and reviewers related to the assessment of completeness and accuracy; and
d.review and enhance our personnel with the appropriate level of technical accounting knowledge, experience, and training in the application of GAAP commensurate with the complexity of our business and our financial accounting and reporting requirements, particularly in areas related to our revenue and inventory cycles.
We are committed to maintaining a strong internal control environment and implementing measures designed to help ensure that control deficiencies contributing to our material weaknesses are remediated as soon as possible. We believe our efforts listed above will enable us to successfully remediate our material weaknesses, however, we cannot provide assurance as to when our remediation measures will be complete. We will consider the material weaknesses remediated after the applicable controls operate for a sufficient period of time and management has concluded, through testing, that such controls are operating effectively. We will monitor the effectiveness of our remediation plan and refine our remediation plan as appropriate.
The effectiveness of our internal control over financial reporting as of the Evaluation Date, has been audited by Ernst & Young, LLP, an independent registered public accounting firm, as stated in their report, which is included elsewhere herein.
Management’s Report on Internal Control Over Financial Reporting
Our management, with the participation of our principal executive officer and principal financial officer, is responsible for establishing and maintaining adequate internal control over financial reporting (as defined in Rules 13a-15(f) and 15d-15(f) under the Exchange Act) to provide reasonable assurance regarding the reliability of our financial reporting and the preparation of financial statements for external purposes in accordance with U.S. GAAP.
Our management assessed the effectiveness of our internal control over financial reporting as of the Evaluation Date. Management based its assessment on the framework established in the 2013 Internal Control - Integrated Framework issued by the Committee of Sponsoring Organizations of the Treadway Commission (“2013 COSO framework”). Our management’s assessment included evaluation of elements such as the design and operating effectiveness of key financial reporting controls, process documentation, accounting policies, and our overall control environment. This assessment is supported by testing and monitoring performed by our internal audit and finance personnel utilizing the 2013 COSO framework.
A material weakness is a deficiency, or a combination of deficiencies, in internal control over financial reporting, such that there is a reasonable possibility that a material misstatement of a company's annual or interim financial statements will not be prevented or detected on a timely basis.
During the third quarter of fiscal 2023, as discussed above, our management identified material weaknesses in internal control over financial reporting. The material weaknesses in internal control over financial reporting resulted from control deficiencies with our revenue cycle, inventory cycle, and with respect to these, our internal resources, expertise and policies required to maintain an effective control environment. Additionally, as related to both our revenue and inventory cycles, certain key controls were not sufficiently designed to assess the completeness and accuracy of IPE.
Within the revenue cycle, controls over the annual establishment of the SSPs for our performance obligations were not designed to include an adequate review and evaluation of whether the methodology used to develop and establish SSPs, including related financial statement disclosures, was in conformity with ASC 606, Revenue from Contracts with Customers.
Within the inventory cycle, controls over judgements used in the estimation of reserves for excess and obsolete inventory were not designed and operating effectively to support such judgements. In addition, controls over the application of our policy for capitalizing variances from standard costs as part of the cost of inventory, did not operate effectively.
Additionally, as related to both our revenue and inventory cycles, certain key controls were not sufficiently designed to assess the completeness and accuracy of Information Produced by the Entity (IPE).
The material weaknesses identified above indicate that we had insufficient personnel with an appropriate level of technical accounting knowledge, experience, and training in the application of GAAP commensurate with the complexity of our business and our financial accounting and reporting requirements. In turn, this impacted our ability to adequately design, implement and monitor financial reporting controls related to our revenue cycle and inventory cycle that identify and mitigate risks of material misstatements in our financial statements.
Notwithstanding the identified material weaknesses, our principal executive officer and principal financial officer concluded that our consolidated financial statements included in Part II, Item 8, "Financial Statements and Supplementary Data" of this Annual Report on Form 10-K, fairly present, in all material respects, our financial condition, results of operations and cash flows as of and for the periods presented in conformity with U.S. GAAP.
Changes in Internal Control over Financial Reporting
Except for the material weaknesses noted above, there were no changes in our internal control over financial reporting identified in connection with the evaluation required by Rules 13a-15(d) and 15d-15(d) of the Exchange Act, that occurred during the fiscal year ended December 31, 2022 that have materially affected, or are reasonably likely to materially affect, our internal control over financial reporting.
Inherent Limitations on Effectiveness of Controls
Because of inherent limitations, internal control over financial reporting may not prevent or detect misstatements and projections of any evaluation of effectiveness to future periods are subject to the risk that controls may become inadequate because of changes in conditions, or that the degree of compliance with the policies or procedures may deteriorate.
ITEM 9B. OTHER INFORMATION
No directors or officers, as defined in Rule 16a-1(f), adopted and/or terminated a “Rule 10b5-1 trading arrangement” or a “non-Rule 10b5-1 trading arrangement,” each as defined in Regulation S-K Item 408, during the last fiscal quarter.
ITEM 9C. DISCLOSURE REGARDING FOREIGN JURISDICTIONS THAT PREVENT INSPECTIONS
Not applicable.
PART III
ITEM 10. DIRECTORS, EXECUTIVE OFFICERS AND CORPORATE GOVERNANCE
For information pertaining to our executive officers, refer to the section entitled “Information about our Executive Officers” in Part 1, Item 1 of this Annual Report on Form 10-K.
Directors | | | | | | | | | | | |
| Name | Age | | Position |
Christine B. Bucklin | 61 | | Director |
Gregory P. Dougherty | 64 | | Director |
| David W. Heard | 56 | | Chief Executive Officer and Director |
Sharon E. Holt | 59 | | Director |
Roop K. Lakkaraju | 53 | | Director |
Paul J. Milbury | 75 | | Director |
Amy H. Rice | 44 | | Director |
George A. Riedel | 66 | | Director and Chair of the Board |
David F. Welch, Ph.D. | 63 | | Founder, Chief Innovation Officer and Director |
Christine B. Bucklin has been a member of our Board of Directors since June 2020. Ms. Bucklin served as Managing Director, Operations Group at Gryphon Investors, Inc., a private equity firm, from 2015 to 2018. From 2008 to 2010, Ms. Bucklin served as Senior Vice President, Corporate Strategic Planning at Sun Microsystems, Inc., a technology company, prior to its acquisition by Oracle Corporation in 2010. From 1999 to 2007, Ms. Bucklin served as Chief Operating Officer of Internet Brands, Inc., an internet media company. From 1988 to 1999, Ms. Bucklin worked at McKinsey & Company, a consulting company, including as a partner. From 2011 to 2019, Ms. Bucklin served as a director of Local Media San Diego, LLC, a radio station and event company. From 2015 to 2018, Ms. Bucklin served as a director of Leadership Platform Acquisition Corporation, a portfolio company of Gryphon Investors related to educational services. Ms. Bucklin received an AB in Mathematics from Dartmouth College and an MBA from Stanford Business School.
Greg P. Dougherty has been a member of our Board of Directors since January 2019. Mr. Dougherty served on the board of Fabrinet, an optical,electo-mechanical and electronic manufacturing services company from February 2019 to January 2022. Mr. Dougherty served as Chief Executive Officer of Oclaro from June 2013 until its acquisition by Lumentum in December 2018. Mr. Dougherty also served as a director of Oclaro from April 2009 until the completion of the sale in December 2018. Prior to Oclaro, Mr. Dougherty served as a director of Avanex Corporation, a leading global provider of intelligent photonic solutions, from April 2005 to April 2009, when Avanex and Bookham merged to become Oclaro. Mr. Dougherty also served as a director of Picarro, Inc., a manufacturer of ultra-sensitive gas spectroscopy equipment using laser-based technology, from October 2002 to August 2013, and as its Interim Chief Executive Officer from January 2003 to April 2004. Earlier in his career, Mr. Dougherty served as the Chief Operating Officer at SDL from 1997 to 2001, when the company was acquired by JDS Uniphase Corporation, where he continued in the role until 2002. From 1989 to 1997, Mr. Dougherty was the Director of Product Management and Marketing at Lucent Technologies Microelectronics in the Optoelectronics Strategic Business Unit. Mr. Dougherty currently serves on the public company boards of IPG Photonics Corporation, a fiber laser manufacturer since January 2019 and MaxLinear, a fabless integrated circuit design company since March 2020. Mr. Dougherty also served as a board member of the Ronald McDonald House at Stanford from January 2004 to December 2009, and the Bay Area Make-A-Wish Foundation. Mr. Dougherty received a B.Sc. in Optics in 1983 from the University of Rochester.
David W. Heard has served as our CEO and has been a member of our Board of Directors since November 2020. Mr. Heard joined Infinera in June 2017 and served as our Chief Operating Officer from October 2018 to November 2020. During his time as COO, Mr. Heard was responsible for leading the innovation of new solutions and the overall operational excellence of the company, overseeing functions including corporate development, facilities, human resources, information technology, marketing, operations, product lifecycle management, quality, research and development, and services. Mr. Heard brings a proven track record of technology industry leadership, with more than 25 years of success in the industry. Prior to Infinera, Mr. Heard
served as President of Network and Service Enablement at JDS Uniphase from 2010 to 2015, and as COO at BigBand Networks (now Arris) from 2007 to 2010. Earlier roles included President and Chief Executive Officer (CEO) at Somera (now Jabil), President and General Manager, Switching Division, at Tekelec (now Oracle), President and CEO at Santera Systems, and various positions at Lucent Technologies and AT&T. Mr. Heard holds a B.A. in Production and Operations Management from Ohio State University, an MBA from the University of Dayton, and an M.S. in Management from Stanford Graduate School of Business, where he was a Sloan Fellow.
Sharon E. Holt has been a member of our Board of Directors since June 2019. Ms. Holt has served as a Principal at Fraser Stuart Ventures, LLC, a private investment and advisory firm, since 2016. From 2016 to May 2021, Ms. Holt was on the board of Immersion Corporation, a leading developer and licensor of touch feedback technology. Since 2012, she has served as an advisor to several technology companies. Ms. Holt was a senior executive at Rambus Inc., a leading technology development and licensing company, from 2004 to 2012, where she served as Senior Vice President of Sales, Licensing and Marketing, and Senior Vice President and General Manager of the Semiconductor Business Group. From 1999 to 2004, Ms. Holt was an executive at Agilent Technologies in the Semiconductor Products Group (now Broadcom), where her last position was Vice President & General Manager of Americas Field Operations, overseeing sales and technical support operations for the semiconductor business, including ASICs, ASSPs, optical and wireless ICs. Prior to that, she ran sales operations focused on Agilent’s largest global customers. From 1986 to 1999, Ms. Holt worked at HP in Applications Engineering, Sales and Distribution Channel Management for the Semiconductor Products Group. Ms. Holt received a B.S. in Electrical Engineering from Virginia Polytechnic Institute and State University (Virginia Tech).
Roop K. Lakkaraju has been a member of our Board of Directors since February 2022. Mr. Lakkaraju is the Executive Vice President, Chief Financial Officer at Bio-Rad, a position he has held since April 2024. From January 2018 to April 2024, Mr. Lakkaraju served as Executive Vice President, Chief Financial Officer of Benchmark Electronics, Inc. From February 2017 to January 2018, he served as Chief Financial Officer of Maana, Inc., an enterprise software company that pioneered an artificial intelligence-driven knowledge platform. From October 2013 to February 2017, he served as Chief Operating Officer and Chief Financial Officer of Support.com, a provider of cloud-based software and services for technology support. From July 2011 to October 2013, he was Chief Financial Officer of Quantros, Inc., a provider of enterprise SaaS-based solutions and information services that advance healthcare quality and safety performance. Prior to that he held executive financial and operational roles at 2Wire, Solectron Corporation, and Safeguard Scientifics. Mr. Lakkaraju is currently on the board of directors of Greater Phoenix Economic Council. He began his career in 1993 as an auditor with Grant Thornton before joining PricewaterhouseCoopers in their Audit and Business Advisory Services. Mr. Lakkaraju holds a B.S. in Business Administration from San Jose State University.
Paul J. Milbury has been a member of our Board of Directors since July 2010. Mr. Milbury served as Vice President of Operations and CFO of Starent Networks Corp., a provider of mobile network solutions, from January 2007 until its acquisition by Cisco in 2009. From December 2009 to July 2010, he played a key role in integrating Starent Networks into Cisco to create the Mobile Internet Technology Group. From December 2000 to March 2007, Mr. Milbury served as Vice President and CFO of Avid Technology, Inc., a digital media creation, management, and distribution solutions company. Mr. Milbury previously served as audit committee chair for public companies Gigamon, Inc., a provider of network traffic visibility solutions and Aerohive Networks, a pioneer in cloud-managed WLAN. Mr. Milbury has served on the public company board of Markforged Holding Corporation since May 2019, and he also serves on several private company boards. Mr. Milbury holds a B.B.A. in Business and Economics and an M.B.A. from the University of Massachusetts, Amherst.
Amy H. Rice has been a member of our Board of Directors since April 2020. Ms. Rice is a Managing Director with Oaktree’s Special Situations Group and has been with the firm since 2009. Prior to joining Oaktree, Ms. Rice spent two years as an associate at Lindsay Goldberg, LLC, and before that, she spent two years as an analyst in the Leveraged Finance group at Deutsche Bank. Ms. Rice has served on the board of GenesisCare, a private company providing cancer and multi-specialty network services, since February 2024. Ms. Rice has an A.B. from Harvard College and an M.B.A. from The Wharton School of the University of Pennsylvania.
George A. Riedel has been a member of our Board of Directors since June 2020 and has served as its Chair since November 2020. Mr. Riedel has served as a Senior Lecturer in the General Management Unit at Harvard Business School since 2017. From 2014 to 2017, Mr. Riedel served as the Chair and Chief Executive Officer of CloudMark, Inc., a cybersecurity company, overseeing the company’s sale to Proofpoint, Inc. in 2017. From 2006 to 2011, Mr. Riedel served in executive leadership roles at Nortel Networks Corporation, a Canadian telecommunications and data networking equipment manufacturing company, including Chief Strategy Officer
and Vice President of Business Units. From 2003 to 2006, Mr. Riedel served as Vice President of Strategy and M&A at Juniper Networks, a networking and cybersecurity company. From 1987 to 2003, Mr. Riedel worked at McKinsey & Company, including as a senior partner. Mr. Riedel has served as an independent director at Cerner Corporation, a health information technology company, from April 2019 to June 2022. Between 2010 and 2020, Mr. Riedel served on various boards, including as chair of Accedian Networks Inc., a Canadian network communications software company; as a director of PeerApp Ltd., a caching solution provider; as a director of NextDocs Corporation, a compliance innovation company (acquired by Aurea Software, Inc.); and as a director of Xperi Corporation, a technology and intellectual property licensing company from May 2013 to June 2020. Mr. Riedel has served on the public company board of Markforged Holding Corporation since May 2024. He is also currently chairman of the board of Juvare, a private company that provides emergency preparedness and response software solutions, and a board member of Bridgeway Benefit Technologies, a private company that provides healthcare and retirement benefit administration software focused on the end-to-end needs of self-administered multiemployer benefit funds and third-party administrators. Mr. Riedel received a BS with distinction in Mechanical Engineering from the University of Virginia and an MBA from Harvard Business School.
David F. Welch, Ph.D. is Founder and Chief Innovation Officer at Infinera, a role he has held since October 2018. In this role, he drives deep business and technology innovation through forward-looking strategies, including breakthrough technologies and technology partnerships, in addition to innovative business and market directions. Dr. Welch is currently a member of Infinera’s Board of Directors, where he has served since 2010. Dr. Welch’s past roles at Infinera include Chief Strategy and Technology Officer from 2017 to 2018, President from 2013 to 2017, Executive Vice President and Chief Strategy Officer from 2004 to 2013, and Chief Technology Officer (CTO) from 2001 to 2004. Prior to co-founding Infinera, he served as CTO, Transmission Division at JDS Uniphase, and in various executive roles, including CTO and Vice President of Corporate Development, at Spectra Diode Labs (SDL). Dr. Welch currently serves on the board of directors of several start-up companies, including the public benefit corporation board of NosTerra Ventures, a position he has held since May 2023. He previously served on the board of CytoDyn Inc., a biopharmaceutical company from January 2019 to September 2020. Dr. Welch holds over 130 patents and has authored over 300 technical publications, and he has been awarded the Optical Society of America’s (OSA) Adolph Lomb Medal, Joseph Fraunhofer Award and John Tyndall Award, as well as the Institution of Engineering Technology’s J J Thomson Medal for Electronics. He is a Fellow of the OSA and the Institute of Electrical and Electronics Engineers, and he is a member of the National Academy of Engineering. Dr. Welch holds a B.S. in Electrical Engineering from the University of Delaware and a Ph.D. in Electrical Engineering from Cornell University.
Independence of the Board
On an annual basis, in accordance with the current listing standards of Nasdaq, the Board affirmatively determines the independence of each director or nominee for election as a director. The Board has determined that seven out of nine of our directors (with the exception of Mr. Heard and Dr. Welch, both of whom are employees of Infinera) are “independent” in accordance with the rules and regulations of the SEC and the listing standards of Nasdaq. Also, all members of the Audit Committee, Compensation Committee and Nominating and Governance Committee, as more fully described below, are independent directors. In making these determinations, our Board considered the current and prior relationships that each non-employee director has with our company and all other facts and circumstances that our Board deemed relevant in determining their independence, including the beneficial ownership of our capital stock by each non-employee director, and the transactions involving them described in the section titled “Certain Relationships and Related Person Transactions.” There are no family relationships among any of our directors, director nominees or executive officers.
Board Leadership Structure
The Board believes its current leadership structure best serves the objectives of the Board’s oversight of management, the Board’s ability to carry out its roles and responsibilities on behalf of our stockholders, and our overall corporate governance. Separating the positions of Chair of the Board and CEO allows our CEO to focus on our day-to-day business, while allowing the Chair of the Board to lead the Board in its fundamental role of providing advice to and independent oversight of management. While our Bylaws do not require that our Chair of the Board and CEO positions be separate, the Board believes that having separate positions is the appropriate leadership structure for Infinera at this time and demonstrates our commitment to good corporate governance practices. The Board has assigned the Chair of the Board responsibility for presiding over meetings of the Board, developing meeting agendas, facilitating communication between management and the independent directors, representing the views of the independent directors to management and improving meeting effectiveness, among other things.
The Board also believes that the combination of an independent Chair of the Board, all three of our current standing committees being comprised entirely of independent directors and the regular use of executive sessions of the independent directors enables the Board to maintain independent oversight of our strategies and activities.
Agreement with Oaktree Optical Holdings
In April 2020, we entered into a letter agreement with Oaktree Optical Holdings, L.P. (“Oaktree”) pursuant to which we agreed, among other things, to nominate and support Ms. Rice for election as a director at the 2020 Annual Meeting of Stockholders. Subject to certain exceptions set forth in the letter agreement, Oaktree and certain affiliates agreed to vote all of its shares at the 2020 Annual Meeting of Stockholders in a manner consistent with the recommendation of our Board. Oaktree also agreed to customary standstill restrictions. Our letter agreement with Oaktree also required that Infinera and Oaktree reasonably cooperate to identify a director candidate (the “Independent Designee”) for consideration by our Nominating and Governance Committee. In June 2020, Ms. Bucklin joined the Board as the Independent Designee. Ms. Rice was re-elected as a Class I director at the 2023 Annual Meeting of Stockholders.
Information Regarding the Board and its Committees
The Board met eight times during fiscal 2023. During fiscal 2023, each director then in office attended 75% or more of the meetings of the Board. During fiscal 2023, each director then in office attended 75% or more of the meetings of the committees on which he or she served during the period for which he or she was a committee chair or committee member, as applicable. Our independent directors meet in executive sessions, without management present, during most regular meetings of the Board. Directors are encouraged, but not required, to attend our annual meetings of stockholders. All nine of our then-serving members of the Board attended our 2023 Annual Meeting of Stockholders.
The Board had three standing committees as of the end of fiscal 2023: an Audit Committee, a Compensation Committee and a Nominating and Governance Committee. Mr. Heard and Dr. Welch do not currently serve on any committees of the Board. The following table presents our current Board and committee composition (and assuming the election of the nominees for Class II directors who are standing for election at the 2024 Annual Meeting of Stockholders, this table also presents our Board and committee composition effective upon the conclusion of our 2024 Annual meeting of Stockholders). | | | | | | | | | | | | | | | | | | | | | | | | | | |
Name | | Board | | Audit | | Compensation | | Nominating and Governance |
Christine B. Bucklin | | M | | M | | — | | — |
Gregory P. Dougherty | | M | | — | | M | | M |
David W. Heard | | M | | — | | — | | — |
Sharon E. Holt | | M | | — | | C | | — |
Roop K. Lakkaraju | | M | | C | | — | | — |
Paul J. Milbury | | M | | M | | M | | — |
Amy H. Rice | | M | | — | | — | | M |
George A. Riedel | | C | | — | | — | | C |
David F. Welch, Ph.D. | | M | | — | | — | | — |
Total Meetings in Fiscal 2023 | | 8 | | 17 | | 6 | | 4 |
_________________
C = Chair; M = Member
Audit Committee
The Audit Committee reviews and monitors our financial statements, financial reporting process and our external audits, including, among other things, our internal controls and audit functions, the results and scope of the annual audit and other services provided by our independent registered public accounting firm as well as our compliance with legal matters that have a significant impact on our financial statements. The Audit Committee also consults and discusses with our management and our independent registered public accounting firm prior to the presentation of financial statements to stockholders. The Audit Committee also promotes the Company’s compliance with applicable law. The Audit Committee is responsible for establishing procedures for the receipt,
retention and treatment of complaints regarding accounting, internal accounting controls or auditing matters, and for the confidential, anonymous submission by our employees of concerns regarding questionable accounting or auditing matters. In addition, the Audit Committee is directly responsible for the appointment, retention, compensation and oversight of the work of our independent registered public accounting firm, including approving services and fee arrangements. The Audit Committee has oversight of the Company’s significant financial risks and exposures, including related to cybersecurity matters. Any related party transactions are subject to approval by the Audit Committee. A more detailed description of the Audit Committee’s functions can be found in our Audit Committee charter. In addition, the Audit Committee meets in executive sessions, without management present and with the independent registered public accounting firm, during most regular meetings of the Audit Committee. A copy of the Audit Committee charter is available on our website at investors.infinera.com/ by clicking on “Governance Documents” under the “Governance” heading.
The current members of the Audit Committee are Ms. Bucklin and Messrs. Lakkaraju and Milbury. Mr. Milbury chaired the Audit Committee until May 18, 2023 when, upon the conclusion of our 2023 Annual Meeting, Mr. Lakkaraju became chair of the Audit Committee and Mr. Milbury remained a member of the Audit Committee. Each current member of the Audit Committee served the entirety of fiscal 2023. The Audit Committee met 17 times during fiscal 2023. Each member of the Audit Committee is independent for Audit Committee purposes under the rules and regulations of the SEC and the applicable Nasdaq listing standards. In addition to qualifying as independent under the Nasdaq rules, each member of the Audit Committee can read and understand fundamental financial statements in accordance with Nasdaq Audit Committee requirements. The Board has determined that Messrs. Lakkaraju and Milbury are each an “Audit Committee Financial Expert” as defined in Item 407(d)(5)(ii) of Regulation S-K. The designation does not impose on Messrs. Lakkaraju and Milbury any duties, obligations or liabilities that are greater than those generally imposed on them as members of the Audit Committee and the Board.
Compensation Committee
The Compensation Committee has the responsibility, authority and oversight relating to the development of our overall compensation strategy and compensation policies and programs. The Compensation Committee establishes our compensation philosophy and policies, administers all of our compensation plans for executive officers, and recommends the compensation for the non-employee directors of the Board. The Compensation Committee seeks to assure that our compensation policies and practices promote stockholder interests and support our compensation objectives and philosophy as described in more detail in the "Compensation Discussion and Analysis" section under Item 11 in this report.
The Compensation Committee also oversees, reviews and administers all of our material employee benefit plans, including our 401(k) plan, and reviews and approves various other compensation policies and matters. The Compensation Committee assists the Board in its oversight of our strategies, initiatives and programs relating to human capital management, including culture, talent acquisition, employee development, retention, and diversity, equity and inclusion. The Compensation Committee may form and delegate authority to one or more subcommittees as appropriate. A more detailed description of the Compensation Committee’s functions can be found in our Compensation Committee charter. A copy of the Compensation Committee charter is available on our website at investors.infinera.com/ by clicking on “Governance Documents” under the “Governance” heading.
The current members of the Compensation Committee are Ms. Holt and Messrs. Dougherty and Milbury. Ms. Holt chairs the Compensation Committee. Each current member of the Compensation Committee served the entirety of fiscal 2023. The Compensation Committee met six times during fiscal 2023. Each member of the Compensation Committee is a non-employee director, as defined in Rule 16b-3 promulgated under the Exchange Act, an outside director, as defined pursuant to Section 162(m) (“Section 162(m)”) of the Internal Revenue Code, as amended (the “Code”) and satisfies the director and compensation committee independence requirements under the applicable Nasdaq listing standards.
Nominating and Governance Committee
The Nominating and Governance Committee is responsible for reviewing developments in corporate governance practices, evaluating and making recommendations to the Board concerning corporate governance matters, and recommending changes to the Company's corporate governance policies and practices. In addition, the Nominating and Governance Committee is responsible for identifying, evaluating and making recommendations of nominees to the Board and evaluating the performance of the Board and individual directors, including those eligible for re-election at the annual meeting of stockholders. The Nominating and Governance Committee also oversees an annual board evaluation process to determine whether the Board is
functioning effectively. In addition, the Nominating and Governance Committee oversees our succession planning process. A more detailed description of the Nominating and Governance Committee’s functions can be found in our Nominating and Governance Committee charter. A copy of the Nominating and Governance Committee charter is available on our website at investors.infinera.com/ by clicking on “Governance Documents” under the “Governance” heading.
The current members of the Nominating and Governance Committee are Ms. Rice and Messrs. Dougherty and Riedel. Mr. Riedel chairs the Nominating and Governance Committee. Each current member of the Nominating and Governance Committee served the entirety of fiscal 2023 as a member of this committee. The Nominating and Governance Committee met four times during fiscal 2023. Each member of the Nominating and Governance Committee satisfies the independence requirements under the applicable Nasdaq listing standards.
Non-Executive Equity Award Subcommittee
The guidelines for the size of new hire, promotional and annual retention equity awards for Section 16 Officers are periodically reviewed and approved by the Compensation Committee. The Compensation Committee has delegated to the Non-Executive Equity Award Subcommittee (the “Subcommittee”) the authority to formally approve new hire, promotional and retention equity awards to certain employees and consultants pursuant to guidelines pre-approved from time to time by the Compensation Committee. The delegation to the Subcommittee does not include the authority to grant equity awards to new employees who are or are reasonably expected to become Section 16 Officers or to current Section 16 Officers. The delegation of authority to the Subcommittee is not exclusive and the Board and Compensation Committee have retained the right to approve any equity awards at their discretion. This Subcommittee is currently comprised solely of our CEO (who is also a Board member).
Compensation Committee Interlocks and Insider Participation
During fiscal 2023, Ms. Holt and Messrs. Dougherty and Milbury served on the Compensation Committee. None of these individuals was an executive officer or employee of Infinera at any time during fiscal 2023, or at any other time. No member of the Compensation Committee had any relationship with Infinera during fiscal 2023 requiring disclosure under Item 404 of Regulation S-K under the Exchange Act. None of our executive officers has ever served as a member of the board or compensation committee of any other entity that has or has had one or more executive officers serving as a member of the Board or Compensation Committee.
Code of Business Conduct and Ethics
We have adopted a Code of Business Conduct and Ethics which applies to all of our employees, officers (including our principal executive officer, principal financial officer, and principal accounting officer or controller, or persons performing similar functions), agents and representatives, including our independent directors and consultants, who are not employees of Infinera, with regard to their Infinera-related activities. The Code of Business Conduct and Ethics reflects our policy of dealing honestly and with integrity with everyone, including our customers, employees, investors and suppliers. We require all employees to complete training on our Code of Business Conduct and Ethics.
Our Code of Business Conduct and Ethics is just one element of the many practices and procedures we utilize to support a diverse and inclusive culture that encourages helpful and honest communication both up and down reporting relationship chains. Our executive leaders set the tone for this culture at the top and our ability to maintain a positive and creative work environment depends on its success. Our annual Infinera Environmental, Social and Governance Report describes some of the additional programs and practices we maintain to protect our people and promote their productivity, health and well-being.
A copy of our Code of Business Conduct and Ethics is available on our website at investors.infinera.com/ by clicking on “Governance Documents” under the “Governance” heading. You may also obtain a copy of our Code of Business Conduct and Ethics without charge by writing to: Infinera Corporation, c/o Corporate Secretary, 6373 San Ignacio Avenue, San Jose, California 95119. We intend to disclose future amendments to certain provisions of our Code of Business Conduct and Ethics, or waivers of such provisions, applicable to any principal executive officer, principal financial officer, principal accounting officer or controller, or persons performing similar functions and our directors on our website identified above or on a Current Report on Form 8-K if required by the applicable listing standards.
Delinquent Section 16(a) Reports
The members of the Board, our executive officers and persons who hold more than 10% of our outstanding common stock are subject to the reporting requirements of Section 16(a) of the Exchange Act, which
requires them to file reports with respect to their ownership of our common stock and certain transactions in our common stock. Based solely upon (i) the copies of Section 16(a) reports that we received from such persons for their fiscal 2023 transactions in our common stock and their common stock holdings and (ii) the written representations received from one or more of such persons, including that no Form 5 is required, we believe that all reporting requirements under Section 16(a) were met in a timely manner during fiscal 2023.
ITEM 11. EXECUTIVE COMPENSATION
Director Compensation
Our compensation program for our non-employee directors is designed to attract and retain highly qualified, independent directors to represent stockholders on the Board and to act in our stockholders' best interests. Non-employee directors receive a mix of cash compensation and equity awards under this program. Directors who are also employees of Infinera do not participate in our director compensation program, nor do they receive any additional compensation for their service as directors. The Compensation Committee, which consists solely of independent directors, has the primary responsibility for reviewing and recommending any changes to our director compensation program, with compensation changes approved or ratified by the full Board.
From time to time, the Compensation Committee engages Compensia, Inc. (“Compensia”), an independent compensation consultant, to help the Compensation Committee review our director compensation program by providing relevant market data regarding director compensation derived from the same peer group used at the time for evaluating our executive compensation. During late fiscal 2022, the Compensation Committee engaged Compensia to provide market data on director compensation. Compensia provided such market data to the Compensation Committee for the peer group which the Compensation Committee had approved in September 2022 for use in evaluating our executive compensation for fiscal 2023. The Compensation Committee concluded that in light of our director compensation program generally aligning with market competitive levels, no change in director compensation would be recommended at that time. As a result, in fiscal 2023, no changes were made to our director compensation program.
Director Fees
During fiscal 2023, our cash compensation program for our non-employee directors was as follows:
| | | | | | | | |
Position | | Annual Retainer Fee ($) |
Non-Employee Director | | 50,000 | |
Chair of the Board | | 70,000 | |
Audit Committee Chair | | 30,000 | |
Audit Committee Member | | 12,500 | |
Compensation Committee Chair | | 20,000 | |
Compensation Committee Member | | 10,000 | |
Nominating and Governance Committee Chair | | 11,000 | |
Nominating and Governance Committee Member | | 6,000 | |
We do not pay meeting fees for the Board or any of the committees of the Board. We pay the retainer fees set forth above in quarterly installments. Retainer fees are paid in arrears. In addition, we have a policy of reimbursing our non-employee directors for reasonable travel, lodging and other expenses incurred in connection with their attendance at Board and committee meetings.
Director Equity Awards
During fiscal 2023, our equity compensation program for our non-employee directors was as follows:
| | | | | | | | |
| |
| | |
| On the date of each annual meeting of stockholders, each individual who continues to serve as a non-employee director after that annual meeting will automatically be granted an RSU award covering a number of shares determined by dividing $200,000 by the closing price of the Company’s common stock on the date of grant, with any resulting fractional share rounded down to the nearest whole share (the “Annual RSU Award”). The Annual RSU Award will vest as to 100% of the underlying shares on the earlier of the date of the next annual meeting of stockholders or the one-year anniversary of the date of grant provided that the non-employee director remains a service provider of Infinera on the applicable vesting date. |
Annual Restricted Stock Unit (“RSU”) Award |
|
| | |
| | |
| Each new non-employee director will be automatically granted an annual RSU award covering a number of shares determined by first prorating $200,000 for the number of months remaining until the next scheduled annual meeting of stockholders and then dividing such prorated dollar amount by the closing price of the Company’s common stock on the date of grant, with any resulting fractional share rounded down to the nearest whole share (the “Prorated Annual RSU Award”). The Prorated Annual RSU Award will vest as to 100% of the underlying shares on the earlier of the date of the next annual meeting of stockholders or the one-year anniversary of the most recently held annual meeting of stockholders, provided that the non-employee director remains a service provider of Infinera on the applicable vesting date. |
Prorated Annual RSU Award For New Directors |
|
| | |
Effective March 27, 2024, new Annual RSU Awards and Prorated Annual RSU Awards granted to non-employee directors will vest as to 100% of the underlying shares on the earlier of (i) the date of the next annual meeting of stockholders, provided that it occurs at least 50 weeks after the prior annual stockholders meeting or (ii) the one-year anniversary of the date of grant, provided that the non-employee director remains a service provider of Infinera on the applicable vesting date.
Fiscal 2023 Director Compensation
The following table sets forth all of the compensation awarded to or earned by the non-employee members of the Board in fiscal 2023. In addition, the table sets forth compensation awarded to or earned by Dr. Welch for his services as an employee of Infinera; Dr. Welch does not receive compensation for his services as a director. Compensation information for Dr. Welch is not disclosed in “Our Pay—Fiscal 2023 Compensation” below because he is not a Named Executive Officer.
| | | | | | | | | | | | | | | | | | | | | | | | | | | | | | | | | | | |
Name | | Fees Earned or Paid in Cash ($)(1) | | | Stock Awards ($)(2) | | | All Other Compensation ($) | | | Total ($) |
Christine B. Bucklin | | 62,500 | | | | 199,996 | | (3) | | — | | | | 262,496 | |
Gregory P. Dougherty | | 66,000 | | | | 199,996 | | (3) | | — | | | | 265,996 | |
Sharon E. Holt | | 70,000 | | | | 199,996 | | (3) | | — | | | | 269,996 | |
| Roop K. Lakkaraju | | 73,413 | | | | 199,996 | | (3) | | — | | | | 273,409 | |
Paul J. Milbury | | 79,087 | | | | 199,996 | | (3) | | — | | | | 279,083 | |
Amy H. Rice(4) | | — | | | | — | | | | — | | | | — | |
George A. Riedel | | 131,000 | | | | 199,996 | | (3) | | — | | | | 330,996 | |
David F. Welch, Ph.D. | | — | | | | 738,000 | | (5) | | 205,704 | | (6) | | 943,704 | |
_________________
(1)For a description of the annual non-employee director retainer fees and retainer fees for committee chair positions and for service as Chair of the Board, see the disclosure above under “Director Fees.”
(2)The amounts reported in this column represent the aggregate grant date fair value of the RSU awards granted in fiscal 2023 computed in accordance with Financial Accounting Standards Board Accounting Standards Codification Topic 718, “Compensation – Stock Compensation” (“ASC 718”). See Notes 2 and 14 of the notes to our consolidated financial statements contained in this report for a discussion of all assumptions made by us in determining the ASC 718 values of equity awards.
(3)Reflects for each director the value of the Annual RSU Award awarded in connection with the 2023 Annual Meeting of Stockholders, which value was determined by multiplying for each director 39,447 shares of Infinera common stock by Infinera’s closing stock price of $5.07 per share on May 18, 2023, the date of grant.
(4)Ms. Rice has waived any participation in the compensation benefits available to the Company’s non-employee directors, except for customary reimbursement of expenses.
(5)Reflects the value of Dr. Welch’s equity awards granted as compensation in 2023 for his services as an employee of Infinera.
(6)Reflects Dr. Welch’s 2023 employee salary in the amount of $200,000, plus the total value of Company paid life insurance premiums and 401(k) match in the amount of $5,704.
During fiscal 2023, Dr. Welch, our Chief Innovation Officer and employee member of the Board, did not receive compensation for his services as a director. Dr. Welch’s base salary for fiscal 2023 was $200,000. Dr. Welch was not eligible for an incentive target bonus opportunity during fiscal 2023. On March 9, 2023, Dr. Welch was granted an RSU award covering 100,000 shares, which is scheduled to vest over a three-year period, with one-third of the underlying shares vesting on April 5, 2024, and one-twelfth of the underlying shares vesting quarterly thereafter, subject to his continued service to Infinera through each applicable vesting date. This RSU award had an aggregate grant date fair market value of $738,000, computed in accordance with ASC 718. See Notes 2 and 14 of the notes to our consolidated financial statements contained in this report for a discussion of all assumptions made by us in determining the ASC 718 values of equity awards.
On March 4, 2020, Dr. Welch was granted a performance share award covering 650,000 shares (at target level achievement). The award provided for a number of quantitative and qualitative performance objectives related to the successful development of the Company's XR Optics program to be achieved over different periods from fiscal 2020 through fiscal 2024. On March 24, 2023, the Compensation Committee determined that the achievement of one of the performance metrics, which related to generating $50 million of ICE-X-related revenues by the end of fiscal 2022, had not been achieved. As a result, 150,000 shares of common stock underlying the award were forfeited on this date. On May 12, 2024, the Compensation Committee determined that the achievement of another of the performance metrics, which related to generating $100 million of ICE-X-related revenues by the end of fiscal 2023, had not been achieved. As a result, 150,000 shares of common stock underlying the award were forfeited on this date.
Additional Information with Respect to Director Equity Awards
| | | | | | | | |
Name | | Number of Shares Subject to Outstanding Stock Awards at Fiscal Year-End (#)(1) |
Christine B. Bucklin | | 39,447 |
Gregory P. Dougherty | | 39,447 |
Sharon E. Holt | | 39,447 |
| Roop K. Lakkaraju | | 52,403 |
Paul J. Milbury | | 39,447 |
Amy H. Rice(2) | | — |
George A. Riedel | | 39,447 |
David F. Welch, Ph.D.(3) | | 500,001 |
_________________
(1)Unvested time-based RSU awards, except as noted below with respect to Dr. Welch.
(2)Ms. Rice has waived any participation in the compensation benefits available to the Company’s non-employee directors, except for customary reimbursement of expenses.
(3)Comprised of 150,001 shares subject to unvested time-based RSUs and 350,000 shares subject to performance share awards (at target level achievement), 150,000 of which had a performance goal that was not met as of completion of the
applicable performance period ending at the end of fiscal 2023 and 200,000 of which had a performance goal based on fiscal 2024 performance.
Compensation Discussion and Analysis
This Compensation Discussion and Analysis provides information related to the fiscal 2023 compensation program and related decisions for our NEOs identified below.
Our Named Executive Officers
For fiscal 2023, our NEOs were the following:
•David W. Heard, our CEO;
•Nancy L. Erba, our CFO;
•David L. Teichmann, our Chief Legal Officer (“CLO”) and Corporate Secretary; and
•Nicholas R. Walden, our Senior Vice President, Worldwide Sales.
Fiscal 2023 Executive Compensation Program Overview
At the beginning of fiscal 2023, when a majority of executive compensation decisions were made, the Compensation Committee considered the performance of our company as we exited fiscal 2022 and the goals of achieving profitable revenue growth and non-GAAP Operating Income growth despite a challenging macroeconomic environment and the desire to return to a customary executive compensation framework as the world normalized from the COVID-19 pandemic. The decisions made reflected our continuing commitment to a strong pay-for-performance profile and supported accountability of our leadership team for our financial performance.
As indicated below, a significant portion of our executive compensation program is designed to align the compensation outcomes for our participating NEOs with performance against measurable objectives.
Executive Compensation Program Structure
| | | | | | | | | | | | | | |
| Compensation Element (CEO/Average NEO Allocation of Elements in Target Total Direct Compensation) | Structure and Attributes | |
| | | | |
| | •Competitively set •Each NEO received a pay increase in FY’23 | |
| Base Salary (11% CEO/23% NEOs) | |
| | |
| | | | |
| | | | |
| | •Annual target bonuses are payable in cash •2023 Corporate Bonus Plan funding level determined by non-GAAP Operating Income to emphasize achievement of profitable growth •SVP, Worldwide Sales participates in the 2023 Corporate Bonus Plan but also a separate incentive plan tied to achievement of financial targets for bookings and non-GAAP product standard margin to emphasize bookings growth and profitable growth for the Company. | |
| Target Annual Incentive (14% CEO/20% NEOs) | |
|
| |
| | |
| | | | |
| | | | |
| | •Based on non-GAAP gross margin, an objective performance metric •Vesting occurs when performance objective has been certified as having been achieved by the Compensation Committee for full fiscal year during performance period and time-based vesting requirement is met •CEO received performance-based shares valued at 41% of target total direct compensation (55% of target long-term incentive ("LTI") value); other NEOs received performance-based shares valued at 28% of target total direct compensation (50% of target LTI value) | |
| Long-Term Performance- Based Stock Awards (41% CEO/28% NEOs) | |
| | |
| | | | |
| | | | |
| | •Designed for long-term retention and to promote strong long-term stockholder alignment •RSUs vest over three years, with one-third vesting after one year and then quarterly for the remaining two years •CEO received RSUs valued at 34% and other NEOs received RSUs valued at 28% of target total direct compensation | |
| Long-Term Time-Based RSU Awards (34% CEO/28% NEOs) | |
| | |
| | | | |
Pay-for-Performance Outcome in Fiscal 2023
During fiscal 2023, we continued to make progress toward achievement of our longer-term strategic goals despite a challenging macroeconomic environment. Under our fiscal 2023 executive compensation program, and consistent with our compensation policy promoting strong pay and performance alignment:
•Annual Corporate Bonus Plan incentives were earned between approximately 68.9% and 83.5% of target for each NEO;
•69.6% of the performance shares granted in 2021 became eligible to vest in 2024 based on performance during 2023;
•None of the performance shares granted in 2022 and 2023 became eligible to vest based on performance during 2023 and remain outstanding and eligible to be earned based on the level of achievement of the Company's longer-term strategic goals during the applicable performance period; and
•Realized compensation value for our CEO in fiscal 2023 was 41.2% of his target compensation (as further discussed below).
Pay-for-Performance with Respect to Fiscal 2023 CEO Compensation
We emphasize performance-based compensation for all of our NEOs, including in particular our CEO. The chart below displays the target total direct compensation (i.e., base salary, target cash incentive opportunity, and equity awards at target) of our CEO versus our CEO’s actual realized compensation during the most recent three fiscal years, as well as our stock price during that time period. Mr. Heard served as our CEO during fiscal 2021, 2022 and 2023. The target value of equity awards reflects the modeling value of such award based on an $8.00 per share reference price, which is used during the compensation modeling process and which differs from the value reported in the Summary Compensation Table provided further below. Actual realized compensation includes the base salary and any cash annual incentive earned during the year plus the sum of any RSUs and performance shares ("PSAs") that vested during the year, valued using the share price on the vesting date, which differs from the values shown in the Pay Versus Performance table provided further below given the specific requirements with respect to “compensation actually paid” under such table.
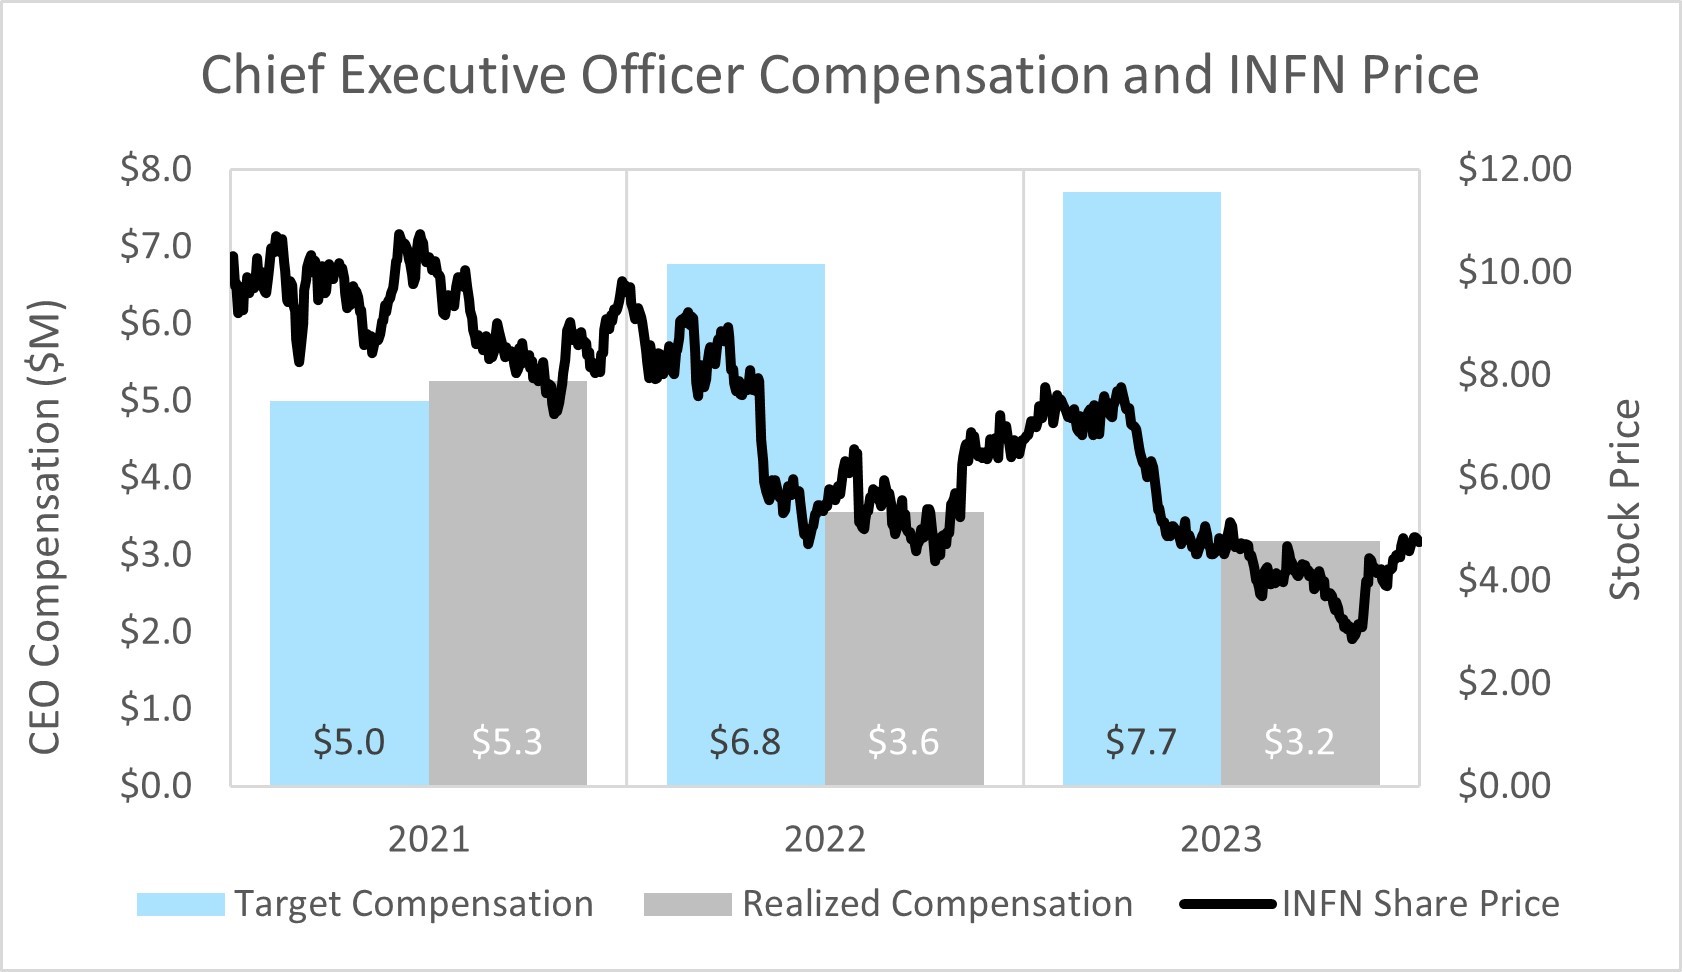
As described above, our CEO target total direct compensation emphasizes compensation that aligns with investor interests, including an at-risk annual incentive opportunity and long-term vesting equity awards. When the Company’s performance is strong, our compensation programs are designed to reward executives with realized compensation that exceeds target through a combination of strong stockholder returns and performance that exceeds the targets approved for our short- and long-term incentive plans. Realized compensation for fiscal 2023 for our CEO was 41.2% of target. This reflected in part the depreciation in the value of equity awards granted in prior years but that vested during fiscal 2023, as the closing share price of our common stock decreased from $10.48 on December 31, 2020 (the start of the 3-year period detailed in the chart above) to a closing price of $4.75 on December 29, 2023 (which was the last trading day of our fiscal 2023). The forfeiture of the performance share awards granted in fiscal 2020 with a performance period ending in fiscal 2022 also contributed to the decline in the realized compensation for fiscal 2022 (see the section below titled
“Performance Share Awards” for more information regarding these performance share awards). As a result of our emphasis on pay-for-performance, the realized compensation of our CEO fell significantly below his target total direct compensation in fiscal 2022 and fiscal 2023, but was slightly above target in fiscal 2021. In furtherance of our pay-for-performance goals, 55% of Mr. Heard’s targeted equity awards in fiscal 2023 were also granted in the form of performance share awards.
Governance of Executive Compensation
Our executive compensation program includes the following executive compensation governance policies and practices:
| | | | | | | | |
| | |
| Our executive compensation program is designed so that a significant portion of our NEO compensation is “at risk” based on corporate performance, as well as equity-based to more closely align the interests of our NEOs and stockholders. |
Compensation At Risk |
|
| | |
| | |
| We maintain a compensation recovery policy that applies to our Section 16 Officers and certain other individuals and provides for recovery of both cash and equity incentive compensation under specified circumstances. Our policy is compliant with applicable Nasdaq listing rules and SEC regulations. |
Compensation Recovery Policy |
|
| | |
| | |
| Our Insider Trading Policy prohibits all employees, including our NEOs, and Board members from hedging their Infinera common stock. |
Anti-Hedging Policy |
|
| | |
| | |
| Our Insider Trading Policy prohibits our NEOs and Board members from pledging Infinera common stock as collateral for a loan. |
| Anti-Pledging Policy |
|
| | |
| | |
| Our executive compensation program is administered by the Compensation Committee, which consists solely of independent directors. |
Fully Independent Compensation Committee |
|
| | |
| | |
| Our Section 16 Officers and Board members are subject to minimum stock ownership requirements. |
Stock Ownership Policy |
|
| | |
| | |
| Our change of control agreements contain “double-trigger” arrangements that require a termination of employment without cause or a constructive termination of employment following a change of control of Infinera before payments and benefits are triggered, unless otherwise set forth in a specific equity award agreement. |
“Double-trigger” Change of Control Arrangements |
|
| | |
| | |
| The Compensation Committee annually conducts a compensation risk assessment to determine whether our compensation arrangements, or components thereof, create risks that are reasonably likely to have a material adverse effect on Infinera. |
Annual Compensation Risk Assessment |
|
| | |
| | |
| The Compensation Committee utilizes input from Compensia, an independent compensation consultant that is retained directly by the Compensation Committee and performed no services for Infinera during fiscal 2023 other than services provided to the Compensation Committee. |
Independent Compensation Consultant Reporting Directly to Compensation Committee |
|
| | |
Overview of Our Executive Compensation Program Philosophy and Process
Compensation Objectives and Philosophy
Our executive compensation program is designed to attract, retain, and reward talented executive officers and to motivate them to pursue our corporate objectives, while fostering the creation of long-term value for our stockholders. To achieve this mission, we take a “pay-for-performance” approach that forms the foundation for the design of our executive compensation program. The Compensation Committee also designs the various components of our executive compensation program to support our company culture and performance (i.e., increasing levels of accountability through the use of “at risk” pay for more senior level employees), current business priorities and strategy and product development cycles, and takes into consideration in its design the current market practices of our peer group. Further, certain elements of our compensation program measure progress on similar metrics in the short and long term and contain rewards for our executives that are earned when certain strategically important financial milestones are met and sustained. We believe this program is in the best interests of and aligned with our stockholders and maximizes the incentive for our employees and executive team to deliver stockholder value.
Advisory Vote on Fiscal 2023 Named Executive Officer Compensation—“Say-on-Pay” Vote
In 2023, stockholders were provided with the opportunity to cast an advisory (non-binding) vote on the compensation of our NEOs (a “say-on-pay” proposal) for fiscal 2022. Our stockholders overwhelmingly approved this say-on-pay proposal, with more than 98% of votes cast voting in favor of our executive compensation program. Noting the results of this vote, the Compensation Committee considered this stockholder approval when making compensation decisions for fiscal 2023 as well as fiscal 2024.
In light of the 2023 say-on-pay vote, the Compensation Committee maintained the consistent general approach to our executive officer compensation program for fiscal 2023. This included a continued emphasis on pay-for-performance through the use of performance shares that reward executive officers only if they deliver value for our stockholders.
The Compensation Committee will continue to consider input from our stockholders as reflected in the outcome of our annual say-on-pay vote when making executive compensation program decisions.
Compensation-Setting Process
Role and Authority of Compensation Committee. The Compensation Committee is responsible for our executive compensation program and all related policies and practices. The Compensation Committee has the responsibility to establish and approve the compensation of each of our executive officers, including our NEOs. In addition, the Compensation Committee reviews and administers our equity and employee benefit plans and programs, which are generally available to our employees, including our NEOs. The Compensation Committee also has the authority to engage its own advisors to assist it in carrying out its responsibilities, and the reasonable compensation for such advisor services is paid by Infinera.
Role of Compensation Consultant. During fiscal 2023, the Compensation Committee engaged the services of Compensia, a national compensation consulting firm, as its independent compensation consultant to provide advice on matters relating to the compensation of our executives and non-employee directors. Compensia attended several of the Compensation Committee’s meetings during fiscal 2023 and provided the Compensation Committee with an analysis of industry-sector competitive market data regarding NEO compensation, information on compensation trends, peer group and general market data, as well as assistance with the parameters used to determine the peer group, base salary, incentive plan design, equity compensation and the structure of our executive compensation program. During fiscal 2023, Compensia also provided general observations about our compensation programs and reviewed and provided input on this Compensation Discussion and Analysis section.
Compensia reports directly to the Compensation Committee. During fiscal 2023, Compensia interacted with management at the direction of the Compensation Committee but did not provide any other services for Infinera or its management team. Compensia’s fees in fiscal year 2023 were paid by Infinera. The Compensation Committee annually reviews the independence of its compensation consultant and during fiscal 2023 determined that there were no conflicts of interest in connection with Compensia’s work.
Determination of CEO Compensation. Compensia provides market data and considerations for the Compensation Committee regarding the amount and form of our CEO’s compensation. As part of this process, the Compensation Committee considers input from the Board and feedback from the Chair of the Board, in particular with respect to the performance of our CEO. After considering the feedback and recommendations
received, all decisions regarding our CEO’s compensation are made by the Compensation Committee, based on its own judgment and after considering the interests of our stockholders, in executive sessions excluding our CEO.
Determination of Non-CEO NEO Compensation. As a result of his close working relationship with each of the other NEOs, our CEO is asked to provide his assessment of their performance to the Compensation Committee, including considerations regarding retention and importance of their contributions to Infinera. Our CEO is assisted by our Chief Human Resources Officer in making these assessments. Our CEO then presents his performance assessment of the other NEOs and makes formal recommendations to the Compensation Committee regarding adjustments to base salary, annual cash incentive award opportunities, and equity awards for our NEOs (other than himself). While the Compensation Committee considers the recommendations of our CEO in determining compensation for our other NEOs, ultimately its decisions are based on its own judgment and the interests of our stockholders. None of our NEOs makes any recommendations regarding his or her own compensation and none of our NEOs are present at meetings at the time their compensation is determined.
Executive Compensation Elements
We consider the following to constitute the key elements of our executive compensation programs. We believe each is necessary to attract, retain and motivate our executive officers, on whom our success largely depends.
| | | | | | | | | | | | | | | | | | | | | | | | | | |
| Pay Element | | Type | | | | Form/Purpose | | |
| | | | | | | | |
| Base Salary | | Fixed | | We pay base salaries to attract, retain and motivate our executive officers for their day-to-day contributions. |
| | | | | | | | |
| Annual Incentive Compensation | | Variable | | We provide annual incentive cash compensation to link payments to the achievement of our annual financial and/or operational objectives.(1) |
| | | | | | | | |
| Long-Term Incentive Compensation | | Variable | | We provide long-term incentive compensation delivered in the form of time-based and performance-based equity awards to more closely align the interests of our executive officers with those of our stockholders and provide significant motivational and retention value to our executive officers. |
| |
| |
| | | | | | | | |
________________
(1)In response to impacts from the COVID-19 pandemic, we cancelled this program for the second half of fiscal 2020 and all of fiscal 2021. In fiscal 2022, we fully reinstated an annual incentive cash compensation program for our CEO and CFO, and for our other NEOs, we treated fiscal 2022 as a transition year with 50% of the target value of their annual incentive compensation program issued in retention RSUs and 50% of the target value in cash. In 2023, the annual incentive cash compensation program was fully reinstated for all of our NEOs, with our SVP, Worldwide Sales participating as to 25% of his cash target value and also participating in a separate incentive compensation program as to 75% of his target value that was tied to achievement of new financial targets for bookings and non-GAAP product standard margin.
In addition, we also provide employee benefits that are generally available to all our employees including our NEOs, and certain severance and “double-trigger” change of control payments and benefits pursuant to change of control severance agreements entered into with our NEOs or our Executive Severance Policy in which NEOs participate, as described further below.
Allocation of Compensation Across Pay Elements
In determining how to allocate an NEO’s target total direct compensation opportunity among these various elements, the Compensation Committee considers market-competitive practices for companies of a similar size and with a comparable business focus. Individual retention considerations are also factored in the Compensation Committee’s final determination of target total direct compensation. Equity awards, which for fiscal 2023 consisted of awards of time-based RSUs and performance shares, represented the largest component of our NEOs’ target total direct compensation opportunity. This approach was designed to encourage sustained, long-term performance and to ensure closer alignment of the interests of our NEOs with those of our stockholders. Consistent with our “pay-for-performance” philosophy, a significant portion of our NEOs’ fiscal 2023 target total direct compensation opportunity was completely “at risk,” including 55% of Mr. Heard’s target total direct compensation opportunity. We define “at risk” compensation as opportunities for which vesting eligibility or
payout is contingent upon achievement of specified performance conditions. In fiscal 2023, this included annual target incentive compensation under the 2023 Corporate Bonus Plan and performance share awards, where the value of performance shares is included in the charts below based on the grant date target value of shares awarded.
The following charts show the target total direct compensation mix for fiscal 2023 for Mr. Heard and our other NEOs, with the value of equity awards determined using grant date fair value.
Role of the Compensation Peer Group and Market Data
In making compensation decisions for our executive officers, the Compensation Committee reviews and analyzes competitive market practices using data prepared by Compensia that is drawn from a group of peer companies, as supplemented by data from the Radford Global Technology survey as not all peer companies provide publicly available data for each role.
In September 2022, the Compensation Committee reviewed the peer group used for executive compensation decision-making for purposes of fiscal 2023 compensation planning. The target selection criteria for the peer group identified in September 2022 and used for fiscal 2023 compensation planning were:
•Industry: companies in the communications equipment sector and Infinera’s direct competitors, as well as other companies in broader technology sectors, with a focus on companies that overlap with key elements of Infinera’s business;
•Annual Revenue: $726 million to $2.9 billion;
•Market Capitalization: $312 million to $5 billion; and
•Headquarters and Location: Companies that have headquarters in the U.S., with a preference for Bay Area-headquartered companies.
Our peer group for fiscal 2023 compensation planning consisted of the following companies:
| | | | | | | | | | | |
| ADTRAN Holdings, Inc. [ADTN] | | MaxLinear, Inc. [MXL] |
| Advanced Energy Industries, Inc. [AEIS] | | NETGEAR, Inc. [NTGR] |
| Calix, Inc. [CALX] | | NetScout Systems, Inc. [NTCT] |
| Ciena Corporation [CIEN] | | OSI Systems, Inc. [OSIS] |
| Cirrus Logic, Inc. [CRUS] | | Ribbon Communications Inc. [RBBN] |
| Diodes Incorporated [DIOD] | | Synaptics Incorporated [SYNA] |
| Extreme Networks, Inc. [EXTR] | | ViaSat, Inc. [VSAT] |
| Lumentum Holdings Inc. [LITE] | | Viavi Solutions Inc. [VIAV] |
Due to the limited data available from the peer group with respect to the roles of certain of our NEOs, the Compensation Committee also reviewed market data prepared by Compensia that was derived from the Radford Global Technology survey to supplement the available peer group data in determining the compensation of Mr. Teichmann, our Chief Legal Officer and Mr. Walden, our Senior Vice President, Worldwide Sales. The Compensation Committee reviewed data from the Radford Global Technology survey in the aggregate and did not review data of any specific companies comprising such survey. In this discussion, where we refer to “market” levels of pay and the “market data,” we are referring to the combined compensation peer group and survey data described above that were then in effect and applicable to our NEOs.
Use of Market Data
For its fiscal 2023 compensation decisions, the Compensation Committee continued to maintain a holistic and flexible approach in its use of market data. The Compensation Committee’s goal is generally to set all elements of compensation to be competitive, using a balanced approach that does not use rigid percentiles to target pay levels for each compensation element, but instead makes its compensation decisions based on a variety of relevant factors, including those listed below. While the Compensation Committee continues to review and reference market data, the data generally is used to inform the Compensation Committee of market practices to ensure that our executive compensation program remains generally competitive with our peers. In addition to the market data, several other factors are taken into account in setting the amount of each NEO’s target total direct compensation opportunity. These factors include:
| | | | | | | | |
| |
| | |
| The Compensation Committee reviews existing NEO compensation and retention levels relative to estimated replacement cost with respect to the scope, responsibilities and skills required of the particular position. |
Recruitment, retention and historical factors |
|
| | |
| | |
| Compensation data for some of our key positions are often not explicitly reported by companies in our compensation peer group or survey data. This results in limited sample sizes and/or inconclusive data that can be misleading if targeting a specific percentile for market positioning. |
Lack of directly comparable data for some of our key roles |
|
| | |
| | |
| Certain elements of compensation reported from one source can be consistently higher or lower than the data collected from another, given differences in methods and samples used by each source to collect market data. Given this variability and volatility within the market data, the Compensation Committee has determined that targeting pay levels at specific percentiles of this data could result in outcomes that do not align with the internal value and strategic importance of various roles at Infinera. |
Market positioning may be distorted by the source of the data |
|
| | |
| | |
| As discussed below, the Compensation Committee also considers several qualitative factors. |
Desire to account for other factors not captured in the market data |
|
| | |
Relevant Qualitative Factors
In addition to our uses of competitive market data as described above, the Compensation Committee considers a range of subjective and qualitative factors when making compensation decisions for our NEOs, including:
•The role the executive officer plays and the importance of such individual’s contributions to our ability to execute on our business strategy and to achieve our strategic objectives;
•Each executive officer’s tenure, skills and experience;
•The responsibilities and particular nature of the functions performed or managed by the executive officer;
•Our CEO’s recommendations and his assessment of each executive officer’s performance (other than his own performance), and with respect to the CEO’s performance, assessment and input by the Board including feedback from the Chair of the Board;
•The value of unvested equity awards held by each executive officer and in comparison to other members of our executive management team and senior employees;
•Internal pay equity across the executive management team;
•The impact of our compensation decisions on key financial and other measures such as our equity award “burn rate”;
•Our overall performance as compared to internal plans and external benchmarks;
•The potential impact on stockholder dilution of our compensation decisions relative to peers and historical practices; and
•Competitive labor market pressures and the likely cost, difficulty and impact on our business and strategic objectives that would be encountered in recruiting a replacement for the role filled by each of our NEOs.
The Compensation Committee does not assign relative weights or rankings to any of these factors and does not solely use any quantitative formula, target percentile or multiple for establishing compensation among the executive officers or in relation to the market data. Instead, the Compensation Committee relies upon its members’ knowledge and judgment in assessing the various qualitative and quantitative inputs it receives regarding each individual and makes compensation decisions accordingly.
Fiscal 2023 Compensation
Base Salaries
For fiscal 2023, the Compensation Committee reviewed the base salaries in March 2023 for each of our NEOs. After considering market data provided by Compensia and taking into account each NEO’s respective individual performance during this period, the Compensation Committee approved increases to the base salaries for the NEOs as shown in the table below. The Compensation Committee did not consider these increases to be material changes for any of the NEO’s base salaries.
The following table shows the annual base salary for each of our NEOs for fiscal 2022 and fiscal 2023.
| | | | | | | | | | | | | | |
Name | | Fiscal 2022 Annual Base Salary ($) | | Fiscal 2023 Annual Base Salary ($)(1) |
David W. Heard | | 700,000 | | 758,000 |
Nancy L. Erba | | 475,000 | | 500,000 |
David L. Teichmann | | 415,000 | | 445,000 |
Nicholas R. Walden (2) | | 420,000 | | 430,000(2) |
_________________
(1)2023 annual base salary increases became effective as of July 1, 2023.
(2)In August 2023, Mr. Walden relocated from the United States to the UK. Following such relocation, Mr. Walden received his salary in Pound Sterling (“GBP”). The salary amount paid to Mr. Walden in GBP was determined by converting into GBP his annual salary amount stated above in United States Dollars (“USD”) using the exchange rate of 1.286 USD to 1 GBP.
Annual Incentive Compensation
Target Bonus Opportunities. In March 2023, the Compensation Committee reviewed the target bonus opportunities (which are expressed as a percentage of base salary) for fiscal 2023 for each of our NEOs, and determined that the target bonus opportunity for our CEO, CFO and CLO would remain the same in fiscal 2023 as in fiscal 2022 and that the target bonus opportunity for our Senior Vice President, Worldwide Sales would be increased as set forth in the table below for fiscal 2023. In considering the target bonus opportunities for our NEOs, the Compensation Committee considered the competitive market data provided by Compensia and its desire to provide appropriate competitive compensation to our NEOs given their critical leadership roles. In the case of Mr. Walden, the Compensation Committee determined to increase his target bonus opportunity from 90% to 100% of base salary. The Compensation Committee believed it would be appropriate to provide additional incentive under his bonus opportunity to further emphasize achievement of the Company’s profitable growth, in further alignment of pay versus performance for an important financial performance objective for the Company.
The following table shows the annual target bonus opportunities for each of our NEOs for fiscal 2022 and fiscal 2023. In addition, the Compensation Committee approved a variable cash compensation program for Mr. Walden for fiscal 2023.
| | | | | | | | | | | | | | |
| | Target Bonus Opportunity as a Percentage of Base Salary |
Name | | Fiscal 2022 Target Bonus | | Fiscal 2023 Target Bonus |
David W. Heard | | 125% | | 125% |
Nancy L. Erba | | 90% | | 90% |
David L. Teichmann | | 75% | | 75% |
Nicholas R. Walden(1) | | 90% | | 100% |
_________________
(1)For fiscal 2023, Mr. Walden’s total target bonus of 100% of base salary was split with 25% of his target value tied to the 2023 Corporate Bonus Plan and 75% of his target value tied to achievement under the Walden 2023 Variable Compensation Program. Please see below for information regarding the Walden 2023 Variable Compensation Program.
2023 Bonus Plan Design. In March 2023, the Compensation Committee approved a 2023 corporate bonus plan (the “2023 Corporate Bonus Plan”) that was applicable to our NEOs. The Company’s non-GAAP Operating Income achievement in fiscal 2023 was used to determine the plan’s funding level. The Compensation Committee determined that this financial performance objective supported the Company’s objectives for profitable growth. If the Company achieved the target level of non-GAAP Operating Income of $98.3 million for fiscal 2023, the 2023 Corporate Bonus Plan would be funded at 100%. If the Company achieved the threshold level of non-GAAP Operating Income of $78.6 million for fiscal 2023, the 2023 Corporate Bonus Plan would be funded at 80%. There was no guaranteed minimum funding under the plan if the threshold is not met. If the Company achieved above the target level of non-GAAP Operating Income of $98.3 million for fiscal 2023, then 50% of each additional dollar of non-GAAP Operating Income would be added to the bonus funding level. Although the Compensation Committee did not set a maximum level of non-GAAP Operating Income under the 2023 Corporate Bonus Plan, it retains authority to increase, reduce or eliminate any bonus award, and to increase, reduce or eliminate any amount allocated to the bonus pool. The Compensation Committee reserves such discretion in order to take into consideration any other relevant factors in determining bonus payouts, such as overall Company performance, functional performance, individual performance, financial considerations, or any other internal or external factors that it deems appropriate. Based on such other factors, bonus payouts may be adjusted up or down to pay out at a higher or lower level than otherwise would become payable based solely on achievement of non-GAAP Operating Income.
For fiscal 2023, each of our NEOs participated in the 2023 Corporate Bonus Plan. Mr. Walden’s participation in the 2023 Corporate Bonus Plan was limited to 25% of his total target bonus opportunity. With respect to the remaining 75% of his total target bonus opportunity, Mr. Walden participated in a separate variable compensation program, as discussed below under the “Walden 2023 Variable Compensation Program.”
2023 Bonus Plan Results. The Compensation Committee considered the Company’s actual achievement level of non-GAAP Operating Income of $87.2 million, which otherwise would result in achievement at the 88.7th percentile funding for the 2023 Corporate Bonus Plan. In determining funding as well as payout for the NEOs, the Compensation Committee considered additional factors, including that the Company’s revenue for fiscal 2023 was $1,614.1 million, which was below our expectations. Further, the Company’s bookings for fiscal 2023 were below our expectations. Given these additional factors relating to the Company’s overall performance for the year, and notwithstanding the achievement level of non-GAAP Operating Income, the Compensation Committee believed it appropriate to apply negative discretion for funding bonuses under the 2023 Corporate Bonus Plan and resolved to approve funding at 83.5% of target. The Compensation Committee further considered departmental function objectives and performance with respect to financial goals overall for the Company and applied discretion to reduce Ms. Erba’s bonus amount to approximately 68.9% of her target. The following table sets forth the payouts that will be paid to our NEOs during the second fiscal quarter of 2024 under the 2023 Corporate Bonus Plan. For a reconciliation of GAAP to non-GAAP Operating Income for fiscal 2023 referenced above or elsewhere in this report, please see Appendix A.
| | | | | | | | | | | |
Name | | Bonus Amount Earned ($)(1) | |
David W. Heard | | 791,163 | |
Nancy L. Erba | | 309,994 | |
David L. Teichmann | | 278,681 | |
Nicholas R. Walden | | 89,762 | |
_________________
(1) Mr. Walden's bonus amount is stated in USD using the exchange rate of 1.286 USD to 1 GBP. Payout of his bonus will be in GBP under our UK payroll.
The Compensation Committee also determined that the annual incentive compensation for our NEOs under the 2023 Corporate Bonus Plan would be payable entirely in cash.
The Compensation Committee decided it was appropriate that the annual incentive compensation for our NEOs with respect to fiscal 2023 would be fully at risk and payable in cash based on achievement of the target goal given their ability to drive the Company’s financial performance. This completed the transition started in fiscal 2022 of all of our NEOs back to a more customary executive compensation framework continuing to emphasize closer alignment between the interests of our NEOs and those of our stockholders.
Walden 2023 Variable Compensation Program. In March 2023, the Compensation Committee approved a fiscal 2023 variable compensation program for Mr. Walden (the “2023 Walden Variable Plan”). Under the 2023 Walden Variable Plan, 75% of Mr. Walden’s total target bonus opportunity for fiscal 2023 is tied to achievement of financial targets for bookings and non-GAAP product standard margin (the “Walden Financial Goals”). With respect to the Walden Financial Goals under the 2023 Walden Variable Plan, the achievement of the bookings objective is weighted at 50% and the achievement of the non-GAAP product standard margin objective is weighted at 50%. The Compensation Committee believed that these objectives, as well as Mr. Walden’s participation in the 2023 Walden Variable Plan in addition to his participation in the 2023 Corporate Bonus Plan, would be appropriate given Mr. Walden’s critical role leading the Company’s efforts in driving revenue, and for focusing efforts on our profitable revenue growth by emphasizing bookings, which are closely correlated with revenue balancing, and non-GAAP product standard margin, which is an important measure of the Company’s business success.
| | | | | | | | | | | | | | | | | | | | | | | | | | | | | | | | | | | |
| Bookings Minimum Threshold | | Bookings Target | | Bookings Maximum | | Non-GAAP Product Standard Margin Threshold | | Non-GAAP Product Standard Margin Target | | Non-GAAP Product Standard Margin Maximum |
Amount | $1.7 billion | | $1.9 billion | | $2.1 billion | | $660.1 million | | $680.4 million | | $707.5 million |
Funding % of Target | 35% | | 100% | | 200% | | 70% | | 100% | | 200% |
Actual Results | | | $1.4 billion | | | | | | $640.7 million | | |
Achievement between the minimum threshold and the target level would be determined based on linear interpolation. The maximum payout potential with respect to each of the bookings and non-GAAP product standard margin objectives was set at 200%, with achievement between the target level and the maximum payout potential determined based on linear interpolation.
We did not achieve the minimum threshold for the bookings or the non-GAAP product standard margin objectives under the 2023 Walden Variable Plan. The CEO recommended that the Compensation Committee use discretion to provide a partial payout with respect to the non-GAAP product standard margin achievement result in recognition of the significant year-over-year improvement in non-GAAP product standard margin during fiscal 2023. After careful consideration of the contribution of the Company’s improvement in non-GAAP product standard margin to the Company’s performance, the Compensation Committee approved the use of discretion to approve a partial payout of $66,564 or 41.28% of the target payout, attributable solely to the non-GAAP product standard margin objective. This payout amount was determined by applying linear interpolation between the target and actual amount of non-GAAP product standard margin achieved. For a reconciliation of GAAP to non-
GAAP product standard margin for fiscal 2023 referenced above or elsewhere in this report, please see Appendix A.
Fiscal 2024 Bonus Plan. In March 2024, the Compensation Committee approved a fiscal 2024 Bonus Plan (the “2024 Corporate Bonus Plan”), which will be payable in cash. Mr. Walden will participate in the 2024 Corporate Bonus Plan as to 50% of his target incentive opportunity and will also participate in a separate incentive compensation program as to 50% of his target value that is tied to achievement of new financial targets for bookings and standard margin, measured on a non-GAAP basis. The Compensation Committee determined to shift a greater percentage of Mr. Walden’s target incentive compensation to be allocated to his participation in the 2024 Corporate Bonus Plan (as compared to the prior fiscal year) to further enhance alignment with the rest of the executive team.
Long-Term Incentive Compensation
Our long-term incentive compensation opportunities are delivered in the form of equity awards. Under the Company's 2016 Equity Incentive Plan (the "2016 Plan"), the Compensation Committee grants equity awards to eligible employees, including our NEOs. All awards to our NEOs were made pursuant to the 2016 Plan. Annual equity awards for NEOs are generally approved by the Compensation Committee during the first open trading window of each new calendar year. The Compensation Committee actively monitors our annual aggregate equity utilization as measured by our burn rate.
Equity Compensation Design. The Compensation Committee believes that it is in the best interests of the Company and our stockholders to grant a combination of time-based and performance-based equity awards to senior level employees, including our NEOs. It also believes that our performance-based equity awards foster a “pay-for-performance” culture and multi-year vesting schedules create longer-term incentives that maintain alignment of the interests of our NEOs with those of our stockholders. Our NEOs benefit from these equity awards based on our sustained performance over time and the ability of our NEOs to create the results that drive stockholder value.
In determining the appropriate mix of such equity awards, the Compensation Committee considered how each equity vehicle supports our compensation strategy as follows:
| | | | | | | | | | | | | | |
Type of Award | | Description | | Why It Is Used |
Performance Share Award ("PSA" or "PSU") | | •Provides the opportunity to earn shares of Infinera common stock upon the achievement of pre-established performance objectives. •If the threshold performance level is not achieved, the entire portion of the award tied to such performance objective is forfeited. | | •Supports pay-for-performance philosophy. •Increases alignment with interests of stockholders. •Supports retention and succession planning. •Provides a direct incentive for future performance. •Useful in recruiting new executives. |
Restricted Stock Unit Award ("RSU") | | •Provides the opportunity to earn a specified number of shares of Infinera common stock subject to the participant’s continued employment for a specified period. •Typically has a three-year or four-year vesting period to encourage a long-term perspective and to encourage key employees to remain at Infinera. | |
Target Award Size. In determining the size of these annual equity awards, the Compensation Committee considered the factors described above in the sections entitled “Use of Market Data” and “Relevant Qualitative Factors,” with particular attention to market data, internal equity considerations, the potential dilutive impact of the equity awards, and the amount and value of unvested equity awards held by each of our NEOs. For our CEO, the Compensation Committee also considered his tenure and performance in the role in determining the size of his annual equity awards. The Compensation Committee believed a combination of time-based and performance-based equity awards promote close alignment of the interests of our NEOs with those of our stockholders.
For fiscal 2023, the Compensation Committee first determined the target value of long-term incentive compensation for each executive. The number of RSUs and performance shares granted to each executive was
then determined based on an assumed stock price of $8.00 per share and assuming a 55% allocation of target value into performance shares for Mr. Heard, our CEO, and a 50% allocation of target value into performance shares for our other NEOs. Due to Mr. Heard’s significant responsibilities in leading the Company and executing on our business strategy, the Compensation Committee believed it appropriate for the mix of Mr. Heard’s equity awards to be more heavily weighted toward performance shares as compared to the other NEOs. The Compensation Committee determined to utilize an $8.00 per share reference price in order to facilitate the equity planning process, which was set after considering recent stock price history and volatility at a price per share that was projected to be higher than the stock price per share at the date of grant. The actual grant date value for these equity awards was below $8.00 per share, and as a result, the target value approved by the Compensation Committee differs from the value of equity reported in the Summary Compensation Table set forth on page 155 below. The following table sets forth the fair market value of each award granted to our NEOs in March 2023 on the basis of the $8.00 per share reference price used by the Compensation Committee and the actual grant date per share value. | | | | | | | | | | | | | | | | | | | | | | | | | | | | | | | | | | | | | | | | | |
| Grant Date | | Performance Shares Granted (#) | | Value of Performance Shares Based on $8.00 Per Share Reference Price ($) | | Grant Date Fair Value of Performance Shares ($)(1) | | RSUs
Granted
(#) | | Value of RSUs Based on $8.00 Per Share Reference Price ($) | | Grant Date Fair Value of RSUs ($)(1) |
David W. Heard | 3/13/2023 | | 412,500 | | 3,300,000 | | | 2,825,625 | | 337,500 | | 2,700,000 | | | 2,311,875 | |
| Nancy L. Erba | 3/9/2023 | | 117,500 | | 940,000 | | | 867,150 | | | 117,500 | | 940,000 | | | 867,150 | |
David L. Teichmann | 3/9/2023 | | 57,500 | | 460,000 | | | 424,350 | | | 57,500 | | 460,000 | | | 424,350 | |
Nicholas R. Walden | 3/9/2023 | | 65,000 | | 520,000 | | | 479,700 | | | 65,000 | | 520,000 | | | 479,700 | |
_________________(1)The fair market value of our common stock (based on the closing sale price) was $7.38 per share for awards granted on March 9, 2023 and $6.85 per share for awards granted on March 13, 2023.
Fiscal 2023 Equity Awards. In March 2023, the Compensation Committee granted annual equity awards for fiscal 2023 in the form of a time-based RSU award and a performance share award to each of our NEOs. The following table sets forth the equity awards granted to our NEOs in March 2023.
| | | | | | | | | | | | | | |
Name | | Number of Shares Subject to 2023 RSU Awards(1) | | Number of Shares Subject to 2023 Performance Share Awards (at Target) |
David W. Heard | | 337,500 | | 412,500 |
Nancy L. Erba | | 117,500 | | 117,500 |
David L. Teichmann | | 57,500 | | 57,500 |
Nicholas R. Walden | | 65,000 | | 65,000 |
________________(1)The RSU awards vest over a three-year period, with one-third of the underlying shares vesting on April 5, 2024, and one-twelfth of the underlying shares vesting quarterly thereafter, in each case subject to the NEO’s continued service to the Company through the applicable vesting date.
Performance Share Awards
Determining the Performance Goal. In determining the performance criteria for the 2023 performance share awards (also referred to as "PSAs" or "PSUs") for our NEOs, the Compensation Committee considered the importance of growing our margins. The Compensation Committee also considered that the performance share awards should be designed to work in concert with grants made in previous years that will have overlapping performance cycles with the awards granted in 2023. Fiscal 2021 awards were structured to encourage executives to accelerate our profitable revenue growth combined with non-GAAP Operating Income growth. Fiscal 2022 awards were structured to encourage executives to focus on profitability, to accelerate the
Company’s external pluggables sales and to accelerate cost savings from using the Company’s pluggables in our products.
Performance Criteria. Accordingly, the Compensation Committee decided the fiscal 2023 performance share awards would be subject to a performance goal relating to non-GAAP gross margin (the “2023 PSA”). The performance period of the 2023 PSAs covers the three years of fiscal 2023 through fiscal 2025 (the “2023 PSA Performance Period”) and the 2023 PSA requires achievement of a non-GAAP gross margin goal at a specified level (the “2023 PSA Goal”) during the 2023 PSA Performance Period, as further explained below. We estimate that the achievement of the 2023 PSA performance goals will be challenging but possible based on effective execution of and focus on our long-term business model during the 2023 PSA Performance Period.
In establishing the performance goals for our NEOs under the 2023 PSA, the Compensation Committee reflected that the prior awards included goals targeted at specific financial objectives that ultimately tie to stockholder value, and that the 2023 awards should as well. The Compensation Committee believes the overlapping, multiyear performance period design provides our NEOs with significant incentives to achieve various objectives that are important for our long-term success.
Achievement and Vesting. If the non-GAAP gross margin is certified by the Compensation Committee to be at a certain percentage level for the last year of the 2023 PSA Performance Period, fiscal 2025 (the “Minimum Threshold”), then 50% of the target number of shares will become eligible shares. If the non-GAAP gross margin is certified by the Compensation Committee to be at a higher specified percentage level for fiscal 2025 (the “Target Threshold”), then 100% of the target number of shares will become eligible shares. If the non-GAAP gross margin is certified by the Compensation Committee to be at a higher specified percentage level for fiscal 2025 (the “Maximum Threshold”), then 150% of the target number of shares will become eligible shares. If the Minimum Threshold is not attained, then no shares will become eligible shares. If non-GAAP gross margin for fiscal 2025 is certified by the Compensation Committee to be between the Minimum Threshold and the Target Threshold, then the percentage of shares that become eligible shares will be determined by applying linear interpolation between the Minimum Threshold and the Target Threshold. If non-GAAP gross margin for fiscal 2025 is certified by the Compensation Committee to be between the Target Threshold and the Maximum Threshold, then the percentage of shares that become eligible shares will be determined by applying linear interpolation between the Target Threshold and the Maximum Threshold. The number of shares that become eligible shares may not exceed 150% of the target number of shares. Shares that become eligible for fiscal 2025 performance will vest upon the applicable certification date, subject to the NEO remaining a service provider through the applicable vesting date. If non-GAAP gross margin is certified by the Compensation Committee to be at the Target Threshold level or greater for the second year of the 2023 PSA Performance Period, for fiscal 2024 (“Early Achievement”), then 150% of the target shares will become eligible shares and 2/3 of such eligible shares will vest on such certification date and the remaining 1/3 of eligible shares will vest on the last day of fiscal 2025, subject to the NEO remaining a service provider through the applicable vesting date.
In the event a change in control occurs during the 2023 PSA Performance Period but after fiscal 2024, the Compensation Committee will complete a certification for fiscal 2024 to the extent a certification has not yet been completed, and no later than immediately prior to the change in control. In the event of a change in control that occurs during the 2023 PSA Performance Period and none of the shares have become eligible shares, then 100% of the target shares will have their vesting accelerated as of immediately prior to the change in control, provided that the NEO remains a service provider through the date of the change in control. In the event of a change in control that occurs during the 2023 PSA Performance Period but shares have already become eligible shares pursuant to Early Achievement, then 100% of the shares will become eligible shares and will have their vesting accelerated as of immediately prior to the change in control, provided that the NEO remains a service provider through the date of the change in control.
Outstanding Performance Share Awards Granted in Prior Fiscal Years. The following table provides information regarding outstanding performance share awards granted prior to fiscal 2023 that were eligible to be earned in fiscal 2023 by our NEOs based on the achievement of performance with respect to the objectives underlying such performance share awards.
| | | | | | | | | | | | | | | | | | | | | | | | | | | | | | | | | | | |
Name | | Fiscal Year of Grant | | Total Number of Performance Shares Remaining at Target (#) | | Target Number of Shares that Could Vest for Fiscal 2023 Performance Period (#) | | Maximum Number of Shares that Could Vest for Fiscal 2023 Performance Period (#) | | Actual Number of Shares Vested for Fiscal 2023 Performance Period (#) | |
David W. Heard | | 2021 | (1) | 258,000 | | 258,000 | | 258,000 | | 179,567 | (2) |
| | 2022 | (3) | 346,666 | | 346,666 | | 346,666 | | 0 | (4) |
Nancy L. Erba | | 2021 | (1) | 60,000 | | 60,000 | | 60,000 | | 41,760 | (2) |
| | 2022 | (3) | 92,500 | | 92,500 | | 92,500 | | 0 | (4) |
David L. Teichmann | | 2021 | (1) | 50,000 | | 50,000 | | 50,000 | | 34,800 | (2) |
| | 2022 | (3) | 55,000 | | 55,000 | | 55,000 | | 0 | (4) |
Nicholas R. Walden | | 2021 | (1) | 55,000 | | 55,000 | | 55,000 | | 38,279 | (2) |
| | 2022 | (3) | 64,000 | | 64,000 | | | 64,000 | | 0 | (4) |
_________________
(1)In fiscal 2021, the Compensation Committee granted to the NEOs in the table above a performance share award (the “2021 PSA”) with two sets of performance goals that could be earned during fiscal 2021 through fiscal 2023 (the “2021 PSA Performance Period”), with each set of goals covering one-half of the 2021 PSA (each such half, a tranche). The goals applicable to the first tranche, included both an operating income goal, measured on a non-GAAP basis over a full fiscal year during the performance period, and a revenue goal, measured over a full fiscal year during the performance period. If for a fiscal year, the operating income goal for the first tranche was achieved at $50 million or greater and the revenue goal was achieved at $1.66 billion or greater, then 100% of such tranche (half of the 2021 PSA) becomes eligible to vest. Alternatively, if in fiscal 2023, the operating income goal is achieved at $50 million or greater and the revenue goal is achieved at $1.56 billion or greater, then 50% of such tranche will become eligible to vest (and linear interpolation is applied with respect to achievement of revenue between $1.56 and $1.66 billion). The second tranche required an operating income goal, measured on a non-GAAP basis over a full fiscal year during the performance period, to be achieved at $116 million or greater for 100% of such tranche (half of the 2021 PSA) to become eligible to vest Alternatively, if in fiscal 2023, the operating income goal for the second tranche was achieved at $78 million or greater, then 50% of such tranche will become eligible to vest (and linear interpolation is applied with respect to achievement of operating income between $78 million and $116 million). For purposes of the 2021 PSA, non-GAAP Operating Income was calculated by excluding from the Company’s GAAP operating income the following: acquisition-related deferred revenue adjustment, stock-based compensation expense, amortization of acquired intangible assets, acquisition and integration costs, restructuring and other related costs, inventory related charges, global distribution center transition costs, warehouse fire loss (recovery) and litigation charges.
(2)In May 2024, following approval by the Audit Committee of the Company’s fiscal 2023 non-GAAP Operating Income achieved of $87.2 million, and revenue achieved of $1,614.1 million, the Compensation Committee certified that (i) based on the achievement level of the goals for the first tranche of the 2021 PSA,77.06% of the shares subject to the 2021 PSA became eligible to vest and 22.94% of the shares subject to the 2021 PSA were forfeited; and (ii) based on the level of achievement of the goal for the second tranche of the 2021 PSA, 62.14% of the shares subject to the 2021 PSA became eligible to vest and 37.86% of the shares subject to the 2021 PSA were forfeited. For a reconciliation of GAAP to non-GAAP Operating Income for fiscal 2023 referenced above or elsewhere in this report, please see Appendix A.
(3)In fiscal 2022, the Compensation Committee granted to the NEOs in the table above a performance share award (the “2022 PSA”) that would be subject to two performance goals, each covering one-half of the fiscal 2022 PSA (each such half, a tranche). The first tranche was subject to the requirement that a GAAP net income goal be achieved at a specified level for a full fiscal year during a performance period covering fiscal 2023 through fiscal 2024. Upon achievement of the performance during the performance period, 100% of the shares subject to the first tranche will become eligible to vest. If the GAAP net income goal is not achieved at such specified level during the performance period, then none of the shares subject to the first tranche would become eligible to vest. The second tranche of the 2022 PSAs was subject to a requirement to achieve a specified level of gross profit dollars determined in accordance with GAAP generated by revenue from external sales of our pluggables and by cost savings resulting from use of our pluggables in our products during the performance period covering fiscal 2022 through fiscal 2024. If the total amount from these gross profit dollars meets a threshold level during the relevant performance period, then 100% of the shares subject to the second tranche will become eligible to vest. If the gross profit dollars meets a lower specified level or greater during the relevant performance period, then 25% of the shares subject to the second tranche will become eligible to vest. If the gross profit dollar amount does not meet this lower specified level during the relevant performance period, then none of the shares subject to the second tranche would become eligible to vest. We estimate that the achievement of the goals under the 2022 PSAs would be challenging but possible based on effective execution of and focus on our long-term business model during the respective performance periods.
(4)We did not achieve the performance objectives for the 2022 PSA during fiscal 2023. As a result, as of the end of fiscal 2023, the target number of shares subject to the 2022 PSA remain eligible to be earned and vest during the applicable performance periods.
Employee Benefits and Perquisites
Generally, our NEOs are only eligible to receive the same benefits as our U.S. salaried employees. Upon relocation to the UK in 2023, Mr. Walden has received our standard UK benefits package applicable generally to our other full-time employees based in the UK. Infinera and the Compensation Committee believe this approach is reasonable and consistent with the overall compensation objectives to attract and retain employees. For our NEOs based in the U.S., these benefits include medical, dental, vision and disability benefits, a Section 401(k) plan, and other plans and programs, including the 2007 ESPP, made available on a broad basis to other eligible employees. We provide a matching contribution of up to $2,500 under the Section 401(k) plan that is applicable to all eligible participants, including our NEOs other than Mr. Walden following his relocation. Mr. Walden’s benefits in the UK include similar benefits to the other NEOs except for the Section 401(k) plan. Mr. Walden is eligible for a UK Pension plan similar to other UK employees plus other plans and programs, including the 2007 ESPP, made available on a broad basis to other eligible employees based in the UK. Employee benefits and perquisites are reviewed periodically to ensure that benefit levels remain competitive but are not included in the Compensation Committee’s annual determination of the total compensation for each of our NEOs.
All exempt U.S. employees, at any U.S. work location, participate in our “As Needed” Flexible Time-Off (“FTO”) Program providing flexible time off. Under this program, these employees may schedule FTO as they see fit and as business necessity allows, although they must continue to meet all job expectations and remain responsible for ensuring appropriate coverage for the time they will be out of the office. Under this program, FTO does not accrue for these employees. The FTO Program is not available in the UK, and Mr. Walden receives the standard UK vacation benefits.
From time to time, Infinera may provide other benefits based on the particular circumstances and any business needs (for example, in order to recruit an individual to join the Company or retain key employees).
In 2023, Infinera agreed to pay up to $238,000 in relocation costs for Mr. Walden, SVP, Worldwide Sales, in connection with his move to the UK on the basis of our belief that such relocation would strengthen Infinera’s strategic focus on improving global sales coverage in key markets outside of North America. Please see footnote 5 to the Summary Compensation Table set forth on page 155 below for the lower total amount of relocation costs actually paid by Infinera in 2023. Additional Information Regarding Our Compensation Practices
The estimated payments and benefits that would be received by each NEO in connection with a qualifying termination of employment, as described immediately below, are presented in the section entitled “Estimated Payments and Benefits upon Termination, Change of Control or Death/Disability” below.
Change of Control Payments and Benefits
The Compensation Committee considers maintaining a stable and effective management team to be essential to protecting the best interests of Infinera and its stockholders. Accordingly, Infinera has entered into Change of Control Agreements (the “COC Agreements”) with each of our NEOs to encourage their continued attention, dedication and continuity with respect to their roles and responsibilities without the distraction that may arise from the possibility or occurrence of a change of control of Infinera. The current terms of these COC Agreements are included below.
An NEO will receive payments and benefits under the COC Agreement only if his or her employment is terminated without “cause,” or by him or her as a result of a “constructive termination” (as more fully described in the section entitled “Estimated Payments and Benefits upon Termination, Change of Control or Death/Disability” below), beginning on the date three months prior to the first change of control to occur following the effective date of the COC Agreement and ending on the date 18 months following a change of control of Infinera. The Compensation Committee believes that this “double-trigger” structure provides an appropriate balance between the corporate objectives described above and the potential compensation payable to each NEO upon a change of control. The Compensation Committee also believes that should Infinera engage in any discussions or negotiations relating to a change of control that the Board believes is in the best interests of our stockholders, these COC Agreements will help to ensure that our NEOs remain focused on the consummation of such potential transaction, without significant distraction or concern regarding their personal circumstances, such as continued employment.
The following terms apply with respect to each of the NEOs if Infinera undergoes a change of control and the NEO’s employment is terminated without cause or as a result of a constructive termination during the Change of Control Period (that is, the period beginning three months prior to, and ending eighteen months after, a change of control), subject to such individual entering into and not revoking a release of claims in our favor within 60 days of the termination date:
•100% of all outstanding equity awards will vest (awards based on the achievement of performance criteria will vest as to 100% of the amount of the award assuming the performance criteria have been achieved at target levels, unless otherwise provided in the agreement relating to such performance-based award);
•Our CEO will be paid a lump sum severance payment (less applicable tax withholdings) equal to two times his annual base salary and our other NEOs will be paid a lump sum severance payment (less applicable tax withholdings) equal to one and one-half times their annual base salary;
•Our CEO will be paid a lump sum severance payment (less applicable tax withholdings) equal to two times his annual target incentive bonus amount and our other NEOs will be paid a lump sum severance payment (less applicable tax withholdings) equal to one and one-half times their annual target incentive bonus amount; and
•Our CEO will be reimbursed for premiums under COBRA for a period of up to 24 months and our other NEOs will be reimbursed for premiums under COBRA for a period of up to 18 months.
Each COC Agreement will have an initial term of three years commencing on the effective date of such COC Agreement. On the third anniversary of the effective date, such COC Agreement will renew automatically for an additional, one-year term unless either party provides the other party with written notice of non-renewal at least one year prior to the date of automatic renewal.
In addition, the award agreements of certain performance share awards granted to our NEOs specify additional terms that apply to such awards in the event of our change in control. These additional terms are described below on page 164 in the section titled “Estimated Payments and Benefits Upon Termination, Change Of Control Or Death/Disability.” Executive Severance Policy
In addition to the change of control-related payments and benefits discussed above, the Compensation Committee has taken appropriate steps to provide competitive post-employment compensation arrangements that promote the continued attention, dedication and continuity of the members of our senior management team, including our NEOs, and enable us to continue to recruit talented senior executive officers. Accordingly, the Compensation Committee has adopted an executive severance policy, under which the following severance payments and benefits will become payable if the employment of one of our NEOs is terminated by us without “cause” (as defined in the policy) subject to such individual entering into and not revoking a release of claims in our favor:
•Our CEO will be paid a lump sum severance payment equal to one and one-half times his annual base salary, and our other NEOs will be paid a lump sum severance payment equal to their annual base salary; and
•Our CEO will be reimbursed for premiums under COBRA for a period of 18 months, and our other NEOs will be reimbursed for premiums under COBRA for a period of 12 months.
If an NEO’s employment with Infinera is less than one year, the amount of severance payable to such individual will be equal to the lesser of (x) the base salary paid to such individual during his or her period of employment, or (y) the severance amount set forth above.
Acceleration of Equity Awards upon Death or Disability
In addition, all awards granted under our equity incentive plans permit accelerated vesting in the event of termination of service due to an employee’s death or terminal illness (with exceptions in certain circumstances). Because we do not have any policy with respect to severance payments or benefits in the event of an employee’s death or disability other than certain disability and life insurance benefits generally available to our employees, the Compensation Committee believes that in the event of an employee’s death or terminal illness, it would be appropriate to provide the accelerated vesting of his or her RSU awards and performance share awards at target.
Equity Award Subcommittee
The Compensation Committee has delegated to a subcommittee (the “Subcommittee”) the authority to grant new hire, retention, promotion and consultant equity awards to non-executive employees pursuant to certain pre-approved guidelines. At this time, the sole member of the Subcommittee is our CEO.
The Subcommittee generally approves the award by written consent on the second Monday of each month to approve new hire, retention, promotion and consultant equity awards. Annual focal equity awards are approved by the Compensation Committee. The delegation to the Subcommittee does not include the authority to grant equity awards to new employees who are or are reasonably expected to become Section 16 Officers or to current Section 16 Officers.
Compensation Recovery Policy
We maintain a compensation recovery policy that applies to our Section 16 Officers (which includes each of our NEOs) and which complies with applicable Nasdaq listing rules and SEC regulations. Under the policy, if we are required to prepare an accounting restatement due to the material noncompliance of the Company with any financial reporting requirement under the securities laws, including any required accounting restatement to correct an error in previously issued financial statements that is material to the previously issued financial statements, or that would result in a material misstatement if the error were corrected in the current period or left uncorrected in the current period (an “Accounting Restatement”), then the Compensation Committee must determine the Excess Compensation, if any, that must be recovered.
This policy applies to certain types of incentive-based compensation received on or after October 2, 2023 during the covered period that have been received by a person after such person became an Executive Officer and the person served as an Executive Officer at any time during the performance period to which the incentive-based compensation applies. The “Excess Compensation” that is subject to recovery under the policy is the amount of eligible incentive-based compensation that exceeds the amount of such incentive-based compensation that otherwise would have been received had such incentive-based compensation been determined based on the restated amounts. For the purposes of this policy, “incentive-based compensation” means any compensation that is granted, earned, or vested based wholly or in part upon the attainment of a financial reporting measure. For the purposes of the policy, “financial reporting measures” are measures that are determined and presented in accordance with the accounting principles used in preparing the Company’s financial statements, and any measures that are derived wholly or in part from such measures, as well as stock price and total shareholder return. Incentive-based compensation is “received” under the policy in the Company’s fiscal period during which the financial reporting measure specified in the incentive-based compensation award is attained, even if the payment, vesting, settlement or grant of such compensation occurs after the end of that period. Under the policy, the applicable “covered period” means the three completed fiscal years immediately preceding the earliest to occur of: (a) the date the Board, a committee of the Board, or one or more of the officers of the Company authorized to take such action if Board action is not required, concludes, or reasonably should have concluded, that the Company is required to prepare an Accounting Restatement; and (b) the date a court, regulator, or other legally authorized body directs the Company to prepare an Accounting Restatement.
Stock Ownership Policy
The Board believes that it is important to link the interests of our NEOs to those of our stockholders. Our Stock Ownership Policy requires our Section 16 Officers (which includes each of our NEOs) and directors to accumulate and hold a minimum number of shares of Infinera common stock within three years of the later of (i) the effective date of the policy or (ii) the date of appointment of the director or appointment/promotion of the Section 16 Officer. As of April 30, 2024, each of our Section 16 Officers and directors has either satisfied these ownership guidelines or had time remaining to do so. Our stock ownership requirements for our Section 16 Officers and directors are as follows:
| | | | | | | | |
Position | | Ownership Requirement |
CEO | | 4x annual base salary |
CFO | | 2x annual base salary |
Other Section 16 Officers and employee directors | | 1x annual base salary |
Non-employee directors | | 4x annual cash retainer for annual Board service |
Shares of Infinera common stock that count towards satisfaction of this policy include: (i) shares owned outright by the Section 16 Officer or director or his or her immediate family members residing in the same
household and (ii) shares held in trust for the benefit of the Section 16 Officer or director or his or her family. The value of a share of Infinera common stock is measured on the last trading day of the most recently completed fiscal quarter as the greater of (i) the closing price on the date of calculation or (ii) the purchase price actually paid by the person for such share of Infinera common stock. For the avoidance of doubt, the purchase price for shares of Infinera common stock subject to RSU awards, performance share awards and other similar full value awards is zero.
Anti-Hedging Policy
Under our Insider Trading Policy, we prohibit our employees, including our NEOs, and Board members from hedging the risk associated with ownership of shares of Infinera common stock and other securities.
Anti-Pledging Policy
Under our Insider Trading Policy, we prohibit our NEOs and directors from pledging any Infinera securities as collateral for a loan.
Tax and Accounting Treatment of Compensation
Prior to 2018, Section 162(m) of the Code generally limited the tax deductibility of compensation paid to the CEO and each of the next three most highly compensated executive officers (excluding the CFO) that exceeded $1 million in any taxable year unless the compensation over $1 million qualified as “performance-based” within the meaning of Section 162(m).
The ability to rely on the “performance-based” compensation exception under Section 162(m) was eliminated in 2017 and the $1 million limitation on deductibility generally was expanded to include any individuals serving as the CEO or CFO during the tax year, the next three most highly compensated executive officers during the tax year and any other individual who was considered a covered employee for any prior tax year beginning after 2016. Thus, we generally will not be able to take a deduction for any compensation paid to our NEOs in excess of $1 million unless the compensation qualifies for transition relief applicable to certain arrangements in place on November 2, 2017. We cannot guarantee that any compensation payable to our NEOs will qualify for the transition relief or that the compensation will ultimately be deductible. Although the Compensation Committee has not adopted a formal policy regarding tax deductibility of compensation paid to our CEO and other senior executive officers, the Compensation Committee intends to maintain an approach to executive compensation that strongly links pay to performance.
We account for the equity compensation awarded to our executive officers and other employees under ASC 718, which requires us to estimate and record an expense for each award of equity compensation over the service period of the award. Accounting rules also require us to record cash compensation as an expense at the time the obligation is incurred.
Compensation Committee Report
The Compensation Committee has reviewed and discussed the Compensation Discussion and Analysis with management. Based on its review and discussions with management, the Compensation Committee has recommended to the Board that the Compensation Discussion and Analysis be included in this Proxy Statement and the Company’s Annual Report on Form 10-K for the fiscal year ended December 30, 2023.
| | | | | |
| Compensation Committee |
| |
| Sharon E. Holt (Chair) |
| Gregory P. Dougherty |
| Paul J. Milbury |
The information contained in this report shall not be deemed to be “soliciting material” or “filed” with the SEC or subject to the liabilities of Section 18 of the Exchange Act, except to the extent that Infinera specifically requests that the information be treated as soliciting material or incorporates it by reference into a document filed under the Securities Act of 1933, as amended (“Securities Act”), or the Exchange Act.
Executive Compensation Tables
The following tabular information and accompanying narratives and footnotes provide all of the compensation awarded to, earned by, or paid to the individuals who served as our principal executive officer, principal financial officer and our two other executive officers during fiscal 2023. As previously noted, we refer to these executive officers as our NEOs.
Fiscal 2023 Summary Compensation Table
| | | | | | | | | | | | | | | | | | | | | | | | | | | | | | | | | | | | | | | | | | | | |
Name and Principal Position | | Year | | Salary ($)(1) | | Bonus ($) | | Stock Awards ($)(2)(3) | | Non-Equity Incentive Plan Compensation ($)(4) | | All Other Compensation ($)(5) | | Total ($) |
David W. Heard | | 2023 | | 729,000 | | | — | | | 5,137,500 | | | 791,163 | | | 5,985 | | | 6,663,648 | |
Chief Executive Officer | | 2022 | | 700,000 | | | — | | | 4,855,638 | | | 700,000 | | | 5,062 | | | 6,260,700 | |
| 2021 | | 700,000 | | | 200,000 | | | 3,702,300 | | | — | | | 4,665 | | | 4,606,965 | |
Nancy L. Erba | | 2023 | | 487,500 | | | — | | | 1,734,300 | | | 309,994 | | | 5,985 | | | 2,537,779 | |
Chief Financial Officer | | 2022 | | 463,461 | | | — | | | 1,604,875 | | | 342,000 | | | 5,985 | | | 2,416,322 | |
| 2021 | | 439,615 | | | — | | | 1,273,419 | | | — | | | 5,986 | | | 1,719,020 | |
David L. Teichmann | | 2023 | | 430,000 | | | — | | | 848,700 | | | 278,681 | | | 10,350 | | | 1,567,731 | |
Chief Legal Officer and Corporate Secretary | | 2022 | | 409,231 | | | — | | | 1,099,244 | | | 124,500 | |
| 10,350 | | | 1,643,325 | |
| 2021 | | 395,962 | | | — | | | 1,062,474 | | | — | | | 11,530 | | | 1,469,965 | |
Nicholas R. Walden | | 2023 | | 426,103 | | (6) | — | | | 959,400 | | | 156,326 | | (7) | 183,217 | | | 1,725,045 | |
Senior Vice President, Worldwide Sales | | 2022 | | 416,154 | | | — | | | 1,154,395 | | | 250,425 | |
| 4,665 | | | 1,825,639 | |
| 2021 | | 400,577 | | | — | | | 1,009,953 | | | 412,082 | | | 34,665 | | | 1,857,277 | |
_________________
(1)Salary data is provided from payroll records based on the fiscal year.
(2)The amounts reported in this column represent the aggregate grant date fair value of the listed equity awards, computed in accordance with ASC 718. See Notes 2 and 14 of the notes to our consolidated financial statements contained in this report for a discussion of all assumptions made by us in determining the ASC 718 values of equity awards.
(3)For grants made in 2023, the stock awards reported in this column were in the amounts set forth in the “Fiscal 2023 Grants of Plan- Based Awards” table below. The fair market value of our common stock (based on the closing sale price) was $7.38 per share for awards granted on March 9, 2023 and $6.85 per share for awards granted on March 13, 2023. The grant date fair value of PSAs included in this column assumes a payout at the target performance level. For additional information, including PSA awards at target and maximum performance on a per executive basis, refer to the “Fiscal 2023 Grants of Plan-Based Awards Table,” below.
(4)Non-equity incentive plan compensation reported for the applicable year was based on performance in that year, but will be paid during the second fiscal quarter of the following year. For additional information regarding the bonuses paid to our NEOs, refer to “Fiscal 2023 Compensation—Annual Incentive Compensation” in the Compensation Discussion and Analysis above.
(5)The amounts in this column represent the payment of life insurance premiums and 401(k) match for each NEO, and for Mr. Walden, the reimbursement of taxable relocation expenses in the amount of $178,999.
(6)In August 2023, Mr. Walden relocated from the United States to the UK. Following such relocation, Mr. Walden received his salary in GBP. The salary amount paid to Mr. Walden in GBP was determined by converting into GBP his annual salary amount determined in USD using the exchange rate of 1.286 USD to 1 GBP. For purposes of calculating the total salary paid to Mr. Walden in 2023, the portion of his 2023 salary paid in GBP was converted to USD using the same exchange rate applied upon his relocation.
(7)Represents (i) cash bonus in the amount of $66,564 as a result of Compensation Committee discretion applied under the 2023 Walden Variable Plan to recognize Company performance notwithstanding that the minimum threshold for a bonus payout under the 2023 Walden Variable Plan was not achieved, plus (ii) the payout of $89,762 being the cash bonus portion of Mr. Walden’s 2023 annual incentive bonus pursuant to the terms of our 2023 Corporate Bonus Plan. For additional information on Mr. Walden’s fiscal 2023 bonus payout, please see the section entitled “Annual Incentive Compensation–2023 Bonus Plan Results” in the Compensation Discussion and Analysis section above.
Fiscal 2023 Grants of Plan-Based Awards Table
The following table sets forth information regarding fiscal 2023 annual cash incentive compensation and equity awards granted to our NEOs during fiscal 2023.
| | | | | | | | | | | | | | | | | | | | | | | | | | | | | | | | | | | | | | | | | | | | | | | | | | | | | | | | |
Name | | Grant Date | | Estimated Future Payouts Under Non-Equity Incentive Plan Awards(1) | | Estimated Future Payouts Under Equity Incentive Plan Awards(2) | | All Other Stock Awards: Number of Shares of Stock or Units (#) | | Grant Date Fair Value of Stock and Option Awards ($)(3) |
| | Threshold ($) | | Target ($) | | Maximum ($) | | Threshold (#) | | Target (#) | | Maximum (#) | | |
David W. Heard | | 3/13/2023 | | 758,000 | | | 947,500 | | (4) | — | | (5) | 206,250 | | 412,500 | | 618,750 | | 337,500 | (6) | 5,137,500 | |
Nancy L. Erba | | 3/9/2023 | | 360,000 | | | 450,000 | | (4) | — | | (5) | 58,750 | | 117,500 | | 176,250 | | | 117,500 | (6) | 1,734,300 | |
David L. Teichmann | | 3/9/2023 | | 267,000 | | | 333,750 | | (4) | — | | (5) | 28,750 | | 57,500 | | 86,250 | | | 57,500 | (6) | 848,700 | |
Nicholas R. Walden | | 3/9/2023 | | 86,000 | | (7) | 107,500 | | (4) | | (5) | 32,500 | | 65,000 | | 97,500 | | | 65,000 | (6) | 959,400 | |
| | 3/9/2023 | | 56,438 | | (7) | 322,500 | | (4) | 645,000 | | | | | | | | | | | |
_________________
(1)Amounts listed in these columns do not represent amounts actually paid or that may be paid in the future. Rather, these amounts are the target award opportunities that were established under the Company’s annual incentive compensation plan for 2023 as discussed in the section entitled “Fiscal 2023 Compensation—Annual Incentive Compensation” in the Compensation Discussion and Analysis section above. Any payments that will be made to the NEOs with respect to these award opportunities during the second fiscal quarter of 2024 for 2023 performance are listed in the “2023 Summary Compensation Table” above under the “Non-Equity Incentive Plan Compensation” column for 2023.
(2)Each performance share award was granted under the 2016 Plan. The performance shares vest based on the Company’s achievement of a non-GAAP gross margin goal which can be earned during fiscal 2023 through fiscal 2025. For additional information regarding these performance share awards granted to our NEOs in fiscal 2023, please see the section entitled “Fiscal 2023 Compensation—Performance Share Awards” in the Compensation Discussion and Analysis above.
(3)Each RSU award was granted under the 2016 Plan. For RSUs, represents the aggregate grant date fair value of each equity award computed in accordance with ASC 718. For performance shares, represents the aggregate grant date fair value of each equity award at the target payout level computed in accordance with ASC 718. See Notes 2 and 14 of the notes to our consolidated financial statements contained in this report for a discussion of all assumptions made by us in determining the ASC 718 values of equity awards. The fair market value of our common stock (based on the closing sale price) was $7.38 per share for awards granted on March 9, 2023 and $6.85 per share for awards granted on March 13, 2023.
(4)Assuming target performance is achieved, our 2023 Corporate Bonus Plan is designed to pay cash bonuses at target.
(5)There is no maximum under our 2023 Corporate Bonus Plan, provided that the Compensation Committee retains authority to increase, reduce or eliminate any bonus award under such plan.
(6)This RSU award is scheduled to vest over a three-year period, with one-third of the underlying shares vesting on April 5, 2024, and one-twelfth of the underlying shares vesting quarterly thereafter, subject to each NEO’s continued service to Infinera through each applicable vesting date.
(7)Mr. Walden participated in our 2023 Corporate Bonus Plan with respect to 25% of his total target bonus and in the 2023 Walden Variable Plan with respect to 75% of his total target bonus. For additional information on Mr. Walden’s fiscal 2023 variable compensation program, please see the section entitled “Fiscal 2023 Compensation – Walden 2023 Variable Compensation Program” in the Compensation Discussion and Analysis section above.
Fiscal 2023 Outstanding Equity Awards at Fiscal Year-End Table
The following table sets forth information regarding outstanding RSU awards and performance share awards held by each of our NEOs as of December 30, 2023. The vesting conditions for each award are set forth in the footnotes below the table.
| | | | | | | | | | | | | | | | | | | | | | | | | | | | | | | | |
Name | | Grant Date | | Number of Shares or Units of Stock That Have Not Vested (#) | | Market Value of Shares or Units of Stock That Have Not Vested ($)(1) | | Equity Incentive Plan Awards: Number of Unearned Shares, Units or Other Rights That Have Not Vested (#) | | Equity Incentive Plan Awards: Market or Payout Value or Unearned Shares, Units or Other Rights That Have Not Vested ($)(1) |
David W. Heard | | 3/9/2021 | | 28,667 | | (2) | 136,168 | | | 258,000 | | (3) | 1,225,500 | |
| | 3/5/2022 | | 96,296 | | (4) | 457,406 | | | — | | | — | |
| | 3/21/2022 | | — | | | — | | | 346,666 | | (5) | 1,646,664 | |
| | 3/13/2023 | | 337,500 | | (6) | 1,603,125 | | | 412,500 | | (7) | 1,959,375 | |
Nancy L. Erba | | 3/9/2021 | | 10,000 | | (2) | 47,500 | | | 60,000 | | (3) | 285,000 | |
| | 3/1/2022 | | 38,542 | | (4) | 183,075 | | | — | | | — | |
| | 3/21/2022 | | — | | | — | | | 92,500 | | (5) | 439,375 | |
| | 3/9/2023 | | 117,500 | | (6) | 558,125 | | | 117,500 | | (7) | 558,125 | |
David L. Teichmann | | 3/9/2021 | | 8,334 | | (2) | 39,587 | | | 50,000 | | (3) | 237,500 | |
| | 3/1/2022 | | 22,917 | | (4) | 108,856 | | | — | | | — | |
| | 3/21/2022 | | — | | | — | | | 55,000 | | (5) | 261,250 | |
| | 3/9/2023 | | 57,500 | | (6) | 273,125 | | | 57,500 | | (7) | 273,125 | |
Nicholas R. Walden | | 3/9/2021 | | 9,167 | | (2) | 43,543 | | | 55,000 | | (3) | 261,250 | |
| | 3/1/2022 | | 26,667 | | (4) | 126,668 | | | — | | | — | |
| | 3/21/2022 | | — | | | — | | | 64,000 | | (5) | 304,000 | |
| | 3/9/2023 | | 65,000 | | (6) | 308,750 | | | 65,000 | | (7) | 308,750 | |
_________________
(1)The market value of unvested and unearned stock awards is based on an assumed price of $4.75 per share, which was the Nasdaq closing price per share of our common stock on December 29, 2023 (the last trading day of our 2023 fiscal year end).
(2)This RSU award is scheduled to vest over a three-year period, with one-third of the underlying shares vesting on April 5, 2022, and one-twelfth of the underlying shares vesting quarterly thereafter, subject to the NEO’s continued service to Infinera through each applicable vesting date.
(3)This performance share award can be earned during fiscal 2021 through fiscal 2023. The first half of the performance shares (each half, a "tranche”) vests based on the Company’s achievement of both an operating income goal, measured on a non-GAAP basis over a full fiscal year, and a revenue goal, measured on a GAAP basis over a full fiscal year. The second tranche of the award vests based on the Company’s achievement of an operating income goal, measured on a non-GAAP basis over a full fiscal year. For additional information regarding these performance share awards granted to our NEOs in fiscal 2021, please see the section entitled “Fiscal 2023 Compensation—Performance Share Awards” in the Compensation Discussion and Analysis above. With respect to achievement of the goals applicable to the first tranche of the awards, the Compensation Committee certified on May 12, 2024, that 77.06% of the applicable shares vested on such date. With respect to achievement of the goal applicable to the second tranche of the awards, the Compensation Committee certified on May 12, 2024, that 62.14% of the applicable shares vested on such date. The shares that did not vest were forfeited as of such certification date.
(4)This RSU award is scheduled to vest over a three-year period, with one-third of the underlying shares vesting on March 5, 2023, and one-twelfth of the underlying shares vesting quarterly thereafter, subject to the NEO’s continued service to Infinera through each applicable vesting date.
(5)One-half of the performance shares vest on the Company’s achievement of a GAAP net income goal which can be earned during fiscal 2023 through fiscal 2024. The other half of the performance shares vest on the Company achieving a target
related to gross profit dollars determined in accordance with GAAP generated by revenue from external sales of our pluggables and by cost savings resulting from use of our pluggables in our products which can be earned during fiscal 2022 through fiscal 2024. For additional information regarding these performance share awards granted to our NEOs in fiscal 2023, please see the section entitled “Fiscal 2023 Compensation—Performance Share Awards” in the Compensation Discussion and Analysis above. No performance shares subject to this award vested with respect to the Company’s performance in fiscal 2023.
(6)This RSU award is scheduled to vest over a three-year period, with one-third of the underlying shares vesting on April 5, 2024, and one-twelfth of the underlying shares vesting quarterly thereafter, subject to the NEO’s continued service to Infinera through the applicable vesting date.
(7)This performance share award can be earned during fiscal 2023 through fiscal 2025. The performance shares vest on the Company’s achievement of a gross margin goal, measured on a non-GAAP basis over a full fiscal year. For additional information regarding these performance share awards granted to our NEOs in fiscal 2023, please see the section entitled “Fiscal 2023 Compensation—Performance Share Awards” in the Compensation Discussion and Analysis above. No performance shares subject to this award vested with respect to the Company’s performance in fiscal 2023.
Fiscal 2023 Stock Vested Table
The following table sets forth the number of shares acquired and the value realized upon the vesting of RSU awards and performance share awards during fiscal 2023 by each of our NEOs.
| | | | | | | | | | | | | | |
Name | | Number of Shares Acquired on Vesting (#) | | Value Realized on Vesting ($)(1) |
David W. Heard | | 285,898 | | 1,654,003 |
Nancy L. Erba | | 228,017 | | 1,160,177 |
David L. Teichmann | | 132,608 | | 872,043 |
Nicholas R. Walden | | 66,667 | | 402,485 |
_________________
(1)The value realized on the vesting date is based on the fair market value of our common stock on the vesting date and does not necessarily reflect the proceeds actually received by the NEO.
2023 CEO Pay Ratio
We are providing the following information regarding the relationship of the annual total compensation of our median employee to the annual total compensation of our CEO (in each case, the annual total compensation was calculated in accordance with SEC rules applicable to the Summary Compensation Table above). The pay ratio included in this information is a reasonable estimate calculated in a manner consistent with Item 402(u) of Regulation S-K.
For 2023:
•Our median employee’s annual total compensation (not including our CEO) was $134,941.
•Our CEO’s annual total compensation, as reported on page 155 in the Summary Compensation Table, was $6,663,648. •Based on this information, the ratio of the annual total compensation of our CEO to the annual total compensation of our median employee is 49 to 1.
Pay Ratio Methodology. The SEC rules allow us to select a methodology for identifying our median employee in a manner that is most appropriate based on our size, organizational structure and compensation plans, policies and procedures.
For fiscal 2023, we calculated the pay ratio using the same median employee that we used to calculate the pay ratio in fiscal 2022, as there has been no significant change in our employee population or compensation arrangements during the fiscal year that we reasonably believe would result in a significant change to our pay ratio disclosure. In fiscal 2022, we selected December 1, 2022, as the date on which to determine our median employee, which is a date within the last three months of our 2022 fiscal year. As of that date, we had 3,264 employees, with 1,250 employees based in the United States and 2,014 employees located outside of the United States. The pay ratio disclosure rules provide an exemption for companies to exclude non-U.S. employees from the median employee calculation if non-U.S. employees in a particular jurisdiction account for five percent (5%)
or less of the company's total number of employees. We applied this de minimis exemption when identifying the median employee by excluding 23 countries: 13 employees in Taiwan, 12 employees in Netherlands, 12 employees in France, 11 employees in Japan, 10 employees in United Arab Emirates, 10 employees in Spain, 9 employees in Kazakhstan, 8 employees in Saudi Arabia, 8 employees in Colombia, 7 employees in Thailand, 7 employees in Poland, 6 employees in Indonesia, 6 employees in Vietnam, 6 employee in Republic of Korea, 5 employees in Ireland, 5 employees in Egypt, 4 employees in Hungary, 4 employees in Belgium, 3 employees in Denmark, 2 employees in Greece, 2 employees in Serbia, 1 employee in Norway and 1 employee in Israel.
After taking into account the de minimis exemption, 1,250 employees based in the United States and 1,862 employees located outside of the United States were considered for identifying the median employee.
For purposes of identifying the median employee from our employee population base, we considered total cash compensation (base salary, including overtime, annual bonus and the sum of other bonuses, which included retention bonuses), as compiled from our payroll records. We selected total cash compensation as this information is readily available in each country. In addition, we measured compensation for purposes of determining the median employee using the year-to-date period ended December 31, 2022, and annualized for employees (other than any temporary or seasonal employees) who were employed on December 1, 2022, but did not work for us for all of 2022. Compensation paid in foreign currencies was converted to U.S. dollars based on exchange rates in effect on December 1, 2022.
The CEO pay ratio reported above is a reasonable estimate, calculated in a manner consistent with SEC rules, based on the methodologies and assumptions described above. SEC rules for identifying the median employee and determining the CEO pay ratio permit companies to employ a wide range of methodologies, estimates, and assumptions. As a result, the CEO pay ratios reported by other companies, which may have employed other permitted methodologies or assumptions, and which may have a significantly different workforce structure from ours, might not be comparable to our CEO pay ratio.
Pay Versus Performance
As required by Section 953(a) of the Dodd-Frank Wall Street Reform and Consumer Protection Act, and Item 402(v) of Regulation S-K, we are providing the following information regarding the relationship between executive compensation actually paid and certain financial performance of the Company. For further information concerning our pay-for-performance philosophy and how we align executive compensation with the Company’s performance, refer to “Our Pay–Compensation Discussion and Analysis,” above. Fair value amounts below are computed in accordance with ASC 718. See Notes 2 and 14 of the notes to our consolidated financial statements contained in this report for a discussion of all assumptions made by us in determining the ASC 718 values of equity awards.
Pay Versus Performance Table
| | | | | | | | | | | | | | | | | | | | | | | | | | | | | | | | | | | | | | | | | | | | | | | | | | | | | | | | | | | | | | |
Year(1) | | Summary Compensation Table Total for PEO ($) | | Compensation Actually Paid to PEO ($)(2) | | | | | | Average Summary Compensation Table Total for Non-PEO NEOs ($) | | Average Compensation Actually Paid to Non-PEO NEOs ($)(2) | | Value of Initial Fixed $100
Investment Based on: | | Net
Income
($)(in thousands) | | Non-GAAP Operating Income ($)(in thousands) |
| | | Summary Compensation Table Total for Second PEO
($) | | Compensation Actually Paid for Second PEO ($)(2) | | | | Total Stockholder Return (TSR) ($)(3) | | Peer Group TSR ($)(4) | | |
| 2023 | | 6,663,648 | | | 2,991,185 | | | — | | | — | | | 1,943,518 | | | 968,440 | | | 61 | | 91 | | (25,213) | | | 87,225 | |
| 2022 | | 6,260,700 | | | 1,963,303 | | | — | | | — | | | 1,961,762 | | | 227,172 | | | 87 | | 82 | | (76,043) | | | 68,988 | |
| 2021 | | 4,606,965 | | | 3,073,908 | | | — | | | — | | | 1,682,087 | | | 1,044,985 | | | 123 | | 112 | | (170,778) | | | 29,586 | |
| 2020 | | 4,139,627 | | | 7,316,489 | | | 3,787,396 | | | 8,713,585 | | | 927,392 | | | 1,801,224 | | | 141 | | 110 | | (206,723) | | | (6,274) | |
_________________
(1)The Principal Executive Officer (“PEO”) and Other NEOs for each applicable year are:
•2023 - PEO: Mr. Heard. Other NEOs: Ms. Erba, and Messrs. Teichmann and Walden.
•2022 - PEO: Mr. Heard. Other NEOs: Ms. Erba, and Messrs. Teichmann and Walden.
•2021 - PEO: Mr. Heard. Other NEOs: Ms. Erba, and Messrs. Teichmann and Walden.
•2020 - PEOs: Mr. Heard and Tom Fallon. Mr. Fallon transitioned from his position of Chief Executive Officer to Advisor as of November 23, 2020. Mr. Heard is referred to as the first PEO and Mr. Fallon is referred to as the second PEO in the table above. Other NEOs: Ms. Erba, and Messrs. Teichmann and Walden, and Robert Jandro. Mr. Jandro resigned from his position of SVP, Worldwide Sales as of January 3, 2020.
(2) SEC rules require certain adjustments be made to the “Summary Compensation Table” totals to determine “compensation actually paid” as reported in the “Pay Versus Performance” table above. The following table details the applicable adjustments that were made to determine “compensation actually paid.”
| | | | | | | | | | | | | | | | | | | | | | | | | | | | | | | | | | | | | | | | | | | | | | | | | | | | | |
| | FY2023 | FY2022 | | FY2021 | | FY2020 |
| | PEO
($) | | Average Other NEO ($) | PEO
($) | | Average Other NEO ($) | | PEO ($) | | Average Other NEO ($) | | PEO
($) | | Second
PEO
($) | | Average Other NEO
($) |
| Summary Compensation Table - Total Compensation | | 6,663,648 | | | 1,943,518 | | 6,260,700 | | | 1,961,762 | | | 4,606,965 | | | 1,682,087 | | | 4,139,627 | | | 3,787,396 | | | 927,392 | |
| (Deduct) Grant Date Fair Value of Stock Awards and Option Awards Granted in Fiscal Year | | 5,137,500 | | | 1,180,800 | | (4,855,638) | | | (1,286,171) | | | (3,702,300) | | | (1,115,282) | | | (3,532,500) | | | (3,239,500) | | | (596,452) | |
| (Increase) Fair Value at Fiscal Year End of Outstanding and Unvested Stock Awards and Option Awards Granted in Fiscal Year | | 3,562,500 | | | 760,000 | | 3,894,217 | | | 1,001,002 | | | 4,106,500 | | | 1,237,043 | | | 5,485,000 | | | 6,033,500 | | | 1,059,154 | |
| (Increase/Deduct) Change in Fair Value of Outstanding and Unvested Stock Awards and Option Awards Granted in Prior Fiscal Years | | (1,824,514) | | | (405,864) | | (2,423,828) | | | (1,058,559) | | | (1,614,753) | | | (713,504) | | | 1,520,786 | | | 2,439,280 | | | 680,099 | |
| (Increase) Fair Value at Vesting of Stock Awards and Option Awards Granted in Fiscal Year that Vested During Fiscal Year | | — | | | — | | — | | | — | | | — | | | — | | | — | | | — | | | — | |
| (Increase/Deduct) Change in Fair Value as of Vesting Date of Stock Awards and Option Awards Granted in Prior Fiscal Years for which Applicable Vesting Conditions were Satisfied During Fiscal Year | | (272,949) | | | (148,414) | | (912,149) | | | (390,862) | | | (322,504) | | | (45,359) | | | (296,424) | | | (307,091) | | | (136,708) | |
| (Deduct) Fair Value as of Prior Fiscal Year End of Stock Awards and Option Awards Granted in Prior Fiscal Years that Failed to Meet Applicable Vesting Conditions During Fiscal Year | | — | | | — | | — | | | — | | | — | | | — | | | — | | | — | | | (132,260) | |
| Compensation Actually Paid | | 2,991,185 | | | 968,440 | | 1,963,303 | | | 227,172 | | | 3,073,908 | | | 1,044,985 | | | 7,316,489 | | | 8,713,585 | | | 1,801,224 | |
(3) Represents the Company’s common stock cumulative TSR on a fixed investment of $100 over the fiscal year starting from the market close on the last trading day of fiscal 2019 through the end of each applicable fiscal year in the table, assuming reinvestment of any dividends.
(4) Represents the cumulative TSR of the Nasdaq Telecommunications Index, the Company’s peer group for this Pay Versus Performance disclosure, on a fixed investment of $100 over the fiscal year starting from the market close on the last trading day of fiscal 2019 through the end of each applicable fiscal year in the table. This is the same peer group the Company uses for its disclosure under Item 201(e) of Regulation S-K.
List of Most Important Performance Measures
The four performance measures listed below represent an unranked list of the most important performance measures for fiscal 2023 the Company used to align compensation to the Company’s financial performance. While these performance measures are the most important measures in fiscal 2023 the Company used to align compensation and the Company’s financial performance, additional financial and other measures were also used to align pay and performance, as further described in the section “Our Pay–Compensation Discussion and Analysis” above.
The most important performance measures are:
| | | | | | | | |
| Key Performance Measures | | |
| Non-GAAP Operating Income | | Non-GAAP Gross Margin |
| Revenue | | Bookings |
Pay Versus Performance Relationship Disclosure
The chart below provides a comparison between the compensation actually paid to each of our first and second PEO (Messrs. Heard and Fallon, respectively) and our average compensation actually paid to our other NEOs against the Company TSR and the peer group TSR, which was the Nasdaq Telecommunications Index. As demonstrated below, the trend in NEO compensation has largely been aligned to the trend in TSR.
The chart below illustrates the correlation between compensation actually paid to each of our first and second PEO and average compensation actually paid to our other NEOs against the Company’s GAAP net income for fiscal years 2020, 2021, 2022 and 2023. Although GAAP net income has increased from fiscal 2020 to fiscal 2023, compensation actually paid to our NEOs has decreased in large part because of the significant emphasis the Company places on equity incentives, which are sensitive to stock price fluctuations.
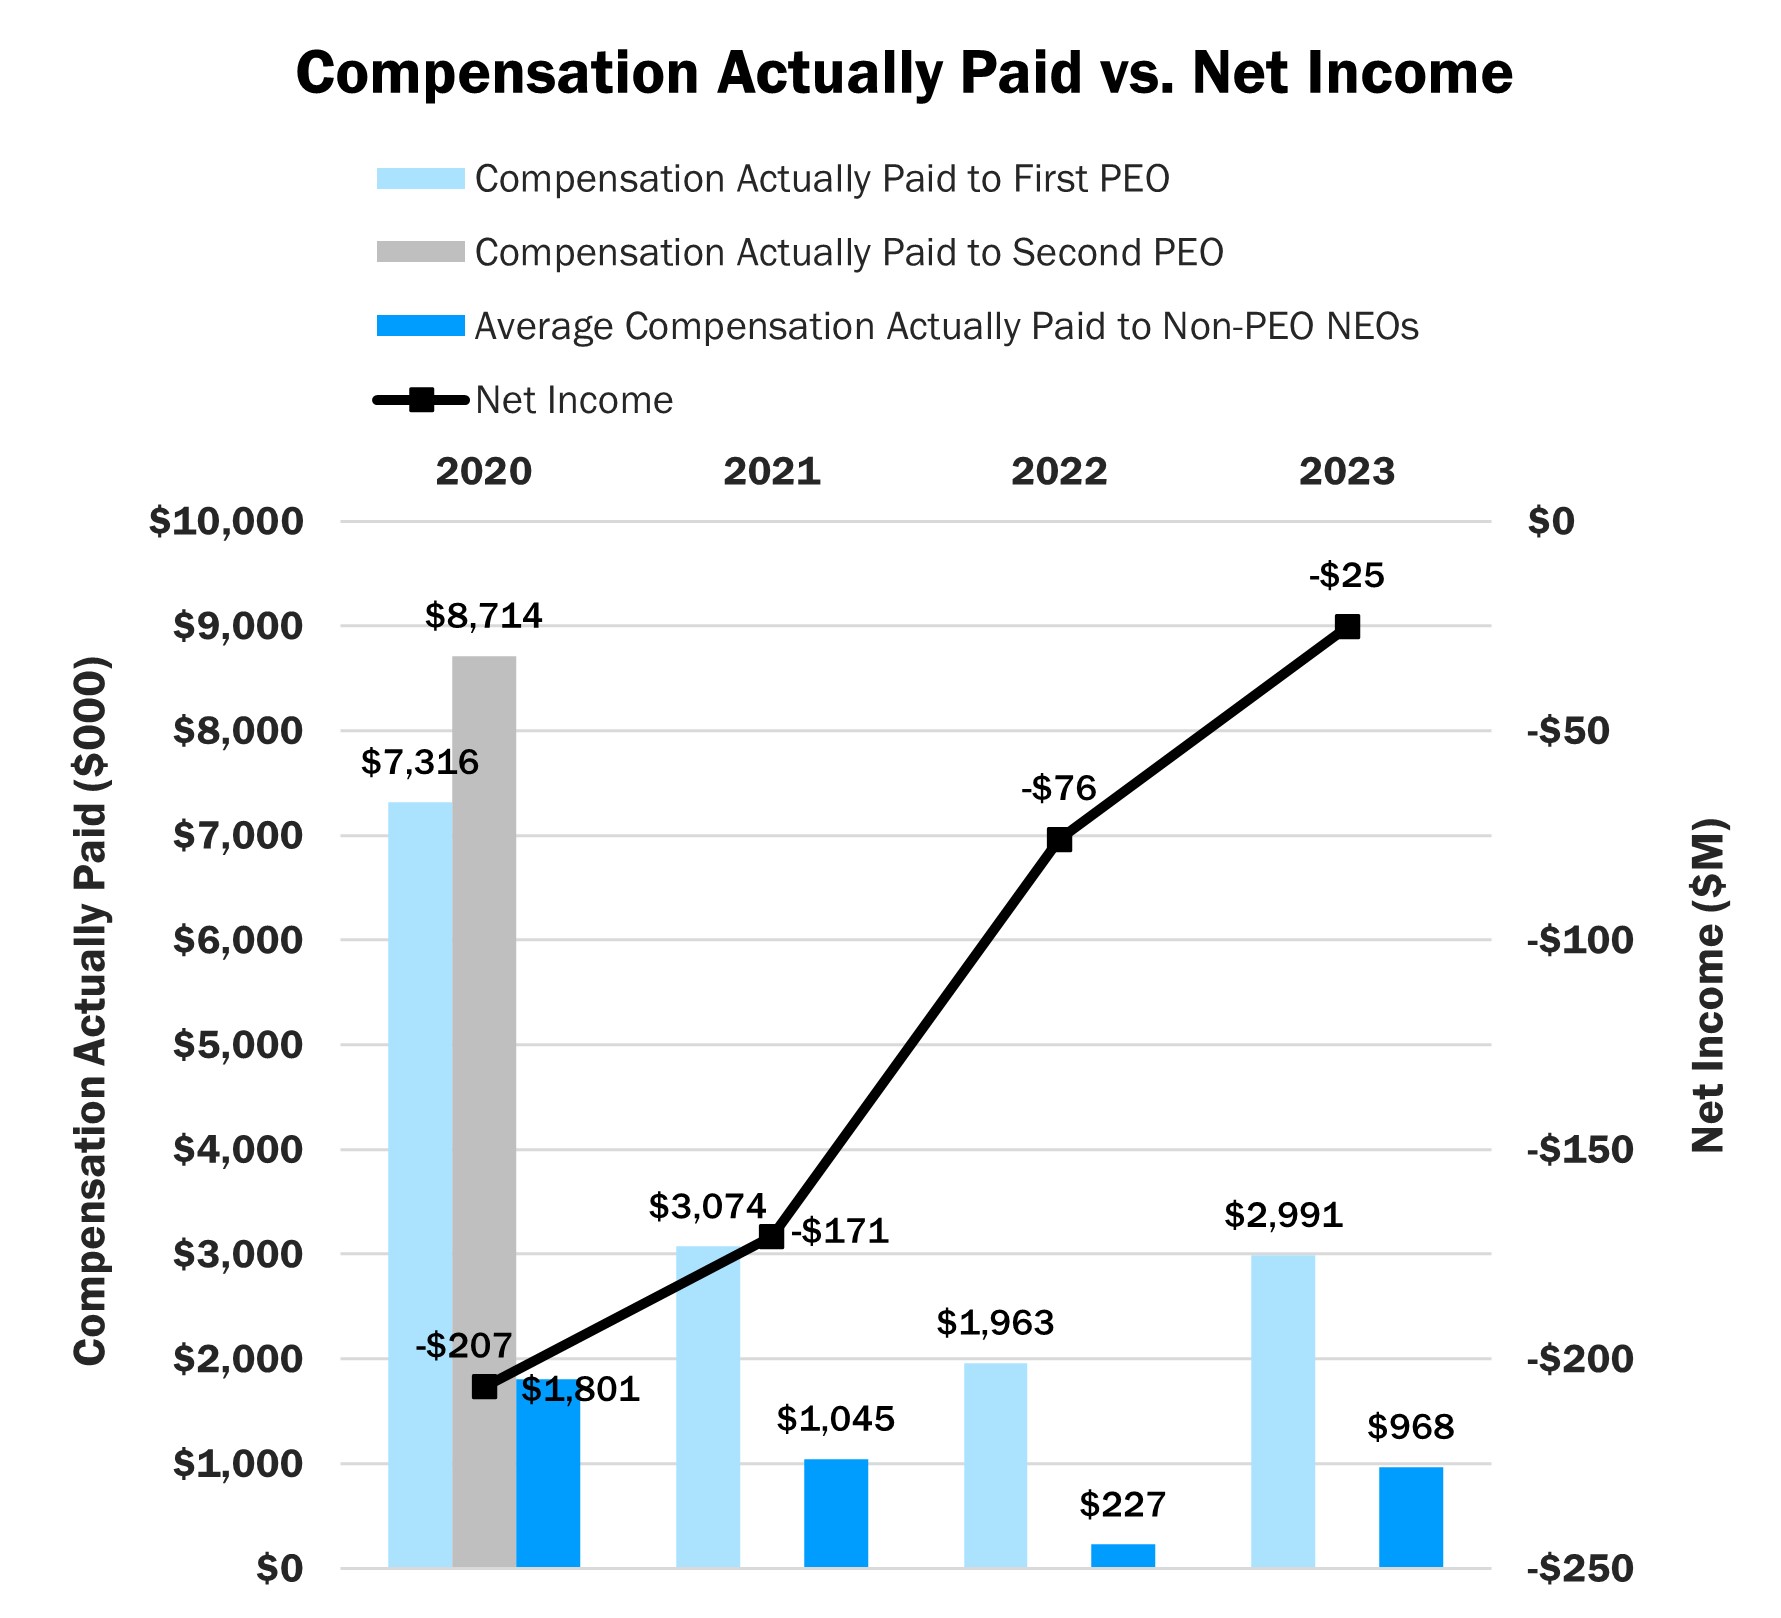
The chart below illustrates the correlation between compensation actually paid to each of first and second PEOs and average compensation actually paid to our other NEOs against the Company’s non-GAAP Operating Income for fiscal years 2020, 2021, 2022 and 2023. Although non-GAAP Operating Income has increased from fiscal 2020 to fiscal 2023, compensation actually paid to our NEOs has decreased in large part because of the significant emphasis the Company places on equity incentives, which are sensitive to stock price fluctuations.
Estimated Payment and Benefits Upon Termination, Change of Control or Death/Disability
Executive Severance Policy
As discussed above in more detail in the section entitled “Compensation Discussion and Analysis – Additional Information Regarding Our Compensation Practices—Executive Severance Policy,” the Compensation Committee has taken appropriate steps to provide competitive post-employment compensation arrangements that promote the continued attention, dedication and continuity of the members of our senior management team, including our NEOs, and enable us to continue to recruit talented senior executive officers. Infinera shall not pay severance pursuant to this policy to the individuals subject to this policy in the event of (i) a change of control of Infinera (as defined below), or (ii) if such individual is terminated for Cause (as defined below).
Death and Disability Benefits
Pursuant to the 2016 Plan, accelerated vesting of RSU awards and performance share awards is provided in the event of the termination of service due to death (with exceptions in certain circumstances) or permanent disability of an employee, including our NEOs, as discussed above in the section entitled “Compensation Discussion and Analysis – Additional Information Regarding Our Compensation Practices—Acceleration of Equity Awards upon Death or Disability.”
Change of Control Payments and Benefits
As discussed above in more detail in the section entitled “Compensation Discussion and Analysis – Additional Information Regarding Our Compensation Practices—Change of Control Payments and Benefits,” we entered into COC Agreements with each of our NEOs to encourage their continued attention, dedication and continuity with respect to their roles and responsibilities without the distraction that may arise from the possibility or occurrence of a change of control of Infinera.
For purposes of these benefits, the terms below generally have the following meanings:
| | | | | |
| |
Change of Control | (i) Any “person” (as such term is used in Sections 13(d) and 14(d) of the Exchange Act) becomes the “beneficial owner” (as defined in Rule 13d-3 under the Exchange Act), directly or indirectly, of securities of Infinera representing fifty percent (50%) or more of the total voting power represented by Infinera’s then outstanding voting securities; (ii) the consummation of the sale or disposition by Infinera of all or substantially all of Infinera’s assets; (iii) the consummation of a merger or consolidation of Infinera with any other corporation, other than a merger or consolidation which would result in the voting securities of Infinera outstanding immediately prior thereto continuing to represent (either by remaining outstanding or by being converted into voting securities of the surviving entity or its parent) at least fifty percent (50%) of the total voting power represented by the voting securities of Infinera or such surviving entity or its parent outstanding immediately after such merger or consolidation; or (iv) a change in the composition of the Board occurring within a two (2) year period, as a result of which less than a majority of the directors are Incumbent Directors. “Incumbent Directors” means directors who either (A) are directors of Infinera as of the date hereof, or (B) are elected, or nominated for election, to the Board with the affirmative votes of at least a majority of the directors of Infinera at the time of such election or nomination (but will not include an individual whose election or nomination is in connection with an actual or threatened proxy contest relating to the election of directors to Infinera). |
| |
| |
Constructive Termination | The executive officer’s resignation as a result of, and within three (3) months following the expiration of any company cure period (discussed below) following the occurrence of one or more of the following: (i) a material reduction in the executive officer’s job, duties or responsibilities in a manner that is substantially inconsistent with the position, duties or responsibilities held by the executive officer immediately before such reduction; (ii) a material reduction in the executive officer’s base salary (in other words, a reduction of more than five percent of executive’s base salary within the twelve-month period following a Change of Control); or (iii) a material change in the work location at which the executive officer is required to perform services for Infinera (in other words, a requirement that the executive officer relocate to a work location that is more than 50 miles from the executive’s work location in effect as of the date immediately prior to a Change in Control). The executive officer will not resign as the result of a Constructive Termination without first providing Infinera with written notice of the acts or omissions constituting the grounds for “Constructive Termination” within ninety (90) days of the initial existence of the grounds for “Constructive Termination” and a cure period of thirty (30) days following the date of such notice. |
| |
| |
Cause | (i) The executive officer’s willful failure to substantially perform his or her duties and responsibilities to Infinera or deliberate violation of a company policy; (ii) the executive officer’s commission of any act of fraud, embezzlement, dishonesty or any other willful misconduct that has caused or is reasonably expected to result in material injury to Infinera; (iii) unauthorized use or disclosure by the executive officer of any proprietary information or trade secrets of Infinera or any other party to whom the executive officer owes an obligation of nondisclosure as a result of his or her relationship with Infinera; or (iv) the executive officer’s willful breach of any of his or her obligations under any written agreement or covenant with Infinera. The determination as to whether the executive officer is being terminated for Cause will be made in good faith by Infinera and will be final and binding on the executive officer. |
| |
Additionally, we granted performance share awards in 2023 to our NEOs, as described further above in the section titled “Performance Share Awards” (referred to as the “2023 PSAs”), as well as performance share awards in 2022 (referred to as the “2022 PSAs”) and 2021 (referred to as the “2021 PSAs”) to each of our NEOs. The performance period for the 2023 PSAs continues through the end of fiscal 2025. The performance period for the 2022 PSAs continues through the end of fiscal 2024. The performance period for the 2021 PSAs continued through the end of fiscal 2023.
The 2023 PSAs, 2022 PSAs and 2021 PSAs provide that, in the event of our change in control (as defined in the 2016 Plan, pursuant to which each of such awards were granted) that occurs during the performance period applicable to the performance share award, such award will vest at the target level. Under our 2016 Plan, change in control generally means (i) a person (or more than one person acting as a group) acquires ownership of our shares resulting in their holding more than 50% of the total voting power of our shares (with certain exceptions where a person or group of persons that already holds more than 50% of the total voting power of our shares acquires additional shares, or where our stockholders after such transaction retain beneficial
ownership of 50% or more of the voting power of our shares in substantially the same proportions); (ii) a change in our effective control that occurs when a majority of our Board members are replaced in a 12-month period by directors whose appointment or election is not endorsed by a majority of our Board members before the date of appointment or election; or (iii) a change in ownership of a substantial portion of our assets, which occurs when a person (or group of persons acting as a group) acquires our assets having a gross fair market value of at least 50% of the total gross fair market value of all of our assets.
Fiscal 2023 Estimated Payments and Benefits Table
The amount of compensation and benefits payable to each of our NEOs (as of the last day of fiscal 2023 and assuming that no portion of the 2021 PSAs had vested or been forfeited) in the event of (a) a termination of employment by Infinera, (b) a termination of employment without Cause or as a result of a Constructive Termination in connection with a Change of Control transaction (as described above) within 3 months prior to, through 18 months after, a Change of Control, (c) a termination of employment due to death or permanent disability, or (d) a Change in Control transaction (within the meaning of our 2016 Plan as described above) has been estimated in the table below.
| | | | | | | | | | | | | | | | | | | | | | | | | | | | | | | | |
Name | | Type of Benefit | | Termination Under Severance Policy ($) | | Termination After a Change of Control ($) | | Termination Upon Death or Disability ($) | | Upon Change of Control ($) |
David W. Heard | | Cash Severance | | 1,137,000 | | | 1,516,000 | | | — | | | — | |
| | Bonus | | — | | | 1,895,000 | | | — | | | — | |
| | Vesting Acceleration(1)(2)(3) | | — | | | 7,028,238 | | | 7,028,238 | | | 4,831,539 | |
| | Continued Coverage of Employee Benefits | | 43,831 | | | 58,442 | | | — | | | — | |
| | Total Benefits | | 1,180,831 | | | 10,497,680 | | | 7,028,238 | | | 4,831,539 | |
Nancy L. Erba | | Cash Severance | | 500,000 | | | 750,000 | | | — | | | — | |
| | Bonus | | — | | | 675,000 | | | — | | | — | |
| | Vesting Acceleration(1)(4)(5) | | — | | | 2,071,200 | | | 2,071,200 | | | 1,282,500 | |
| | Continued Coverage of Employee Benefits | | 16,772 | | | 25,158 | | | — | | | — | |
| | Total Benefits | | 516,772 | | | 3,521,358 | | | 2,071,200 | | | 1,282,500 | |
David L. Teichmann | | Cash Severance | | 445,000 | | | 667,500 | | | — | | | — | |
| | Bonus | | — | | | 500,625 | | | — | | | — | |
| | Vesting Acceleration(1)(6)(7) | | — | | | 1,193,442 | | | 1,193,442 | | | 771,875 | |
| | Continued Coverage of Employee Benefits | | 24,446 | | | 36,669 | | | — | | | — | |
| | Total Benefits | | 469,446 | | | 2,398,236 | | | 1,193,442 | | | 771,875 | |
Nicholas R. Walden | | Cash Severance | | 430,000 | | | 645,000 | | | — | | | — | |
| | Bonus | | — | | | 645,000 | | | — | | | — | |
| | Vesting Acceleration(1)(8)(9) | | — | | | 1,352,962 | | | 1,352,962 | | | 874,000 | |
| | Continued Coverage of Employee Benefits | | 3,700 | | | 5,549 | | | — | | | — | |
| | Total Benefits | | 433,700 | | | 2,648,511 | | | 1,352,962 | | | 874,000 | |
_________________
(1)The value of accelerated vesting of equity awards is calculated by (i) multiplying the number of accelerated shares of common stock underlying unvested, in-the-money equity awards by $4.75 per share, which was the Nasdaq closing price per share of our common stock on December 29, 2023 (the last trading day of our 2023 fiscal year end).
(2)The vesting of 1,479,629 shares of common stock would accelerate if Mr. Heard was terminated (a) without Cause or (b) as a result of a Constructive Termination within 3 months prior to, through 18 months after, a Change of Control, or upon death or permanent disability as of December 30, 2023. The 1,479,629 shares of common stock that accelerate in
these scenarios include, and are not in addition to, the 1,017,166 target number of unvested shares of common stock subject to the 2021 PSAs, 2022 PSAs and 2023 PSAs.
(3)1,017,166 shares of common stock, representing the target number of unvested shares subject to the 2021 PSAs, 2022 PSAs and 2023 PSAs, would vest upon a Change in Control, assuming such Change in Control occurs during the award’s performance period.
(4)The vesting of 436,042 shares of common stock would accelerate if Ms. Erba was terminated (a) without Cause or (b) as a result of a Constructive Termination within 3 months prior to, through 18 months after, a Change of Control, or upon death or permanent disability as of December 30, 2023. The 436,042 shares of common stock that accelerate in these scenarios include, and are not in addition to, the 270,000 target number of unvested shares of common stock subject to the 2021 PSAs, 2022 PSAs and 2023 PSAs.
(5)270,000 shares of common stock, representing the target number of unvested shares subject to the 2021 PSAs, 2022 PSAs and 2023 PSAs, would vest upon a Change in Control, assuming such Change in Control occurs during the award’s performance period.
(6)The vesting of 251,251 shares of common stock would accelerate if Mr. Teichmann was terminated (a) without Cause or (b) as a result of a Constructive Termination within 3 months prior to, through 18 months after, a Change of Control, or upon death or permanent disability as of December 30, 2023. The 251,251 shares of common stock that accelerate in these scenarios include, and are not in addition to, the 162,500 target number of unvested shares of common stock subject to the 2021 PSAs, 2022 PSAs and 2023 PSAs.
(7)162,500 shares of common stock, representing the target number of unvested shares subject to the 2021 PSAs, 2022 PSAs and 2023 PSAs, would vest upon a Change in Control, assuming such Change in Control occurs during the award’s performance period.
(8)The vesting of 284,834 shares of common stock would accelerate if Mr. Walden was terminated (a) without Cause or (b) as a result of a Constructive Termination within 3 months prior to, through 18 months after, a Change of Control, or upon death or permanent disability as of December 30, 2023. The 284,834 shares of common stock that accelerate in these scenarios include, and are not in addition to, the 184,000 target number of unvested shares of common stock subject to the 2021 PSAs, 2022 PSAs and 2023 PSAs.
(9)184,000 shares of common stock, representing the target number of unvested shares subject to the 2021 PSAs, 2022 PSAs and 2023 PSAs, would vest upon a Change in Control, assuming such Change in Control occurs during the award’s performance period.
Risk Assessment of Compensation Practices
At the request of the Compensation Committee, a review of the risks associated with our organization-wide compensation policies and practices was conducted for fiscal 2023. This assessment covered topics including: our compensation policies and practices; a review of each of the compensation vehicles that we employ; the identification of any compensation design features that could encourage excessive risk taking; and the controls, policies and plan features that mitigate our compensation risk.
Although all compensation programs were considered, particular attention was paid to incentive-based plans and arrangements involving variable payouts, where an employee might be able to influence payout factors and compensation plans and arrangements involving our executive team. The review found that, because our incentive programs are based primarily on financial objectives important to Infinera, we avoid an over-emphasis on shorter-term financial goals. In addition, the financial objectives used to determine the performance measures for our incentive-based compensation plans and arrangements were found to be substantially derived from our annual operating plan, which is approved by the Board.
In addition, the assessment considered our controls and other mitigating factors that serve to offset elements of our compensation policies and practices that may introduce or encourage risk-taking. Those elements include the Compensation Committee’s ability to use discretion to adjust payouts on most awards; strong stock ownership requirements and a compensation recovery policy for our Section 16 Officers; the existence of, and training related to, corporate standards of business conduct and ethics; effective internal controls over financial reporting; and the participation by Mr. Walden in his variable compensation program, which enables a level of independence in establishing the sales commission plan design and quotas for our global sales team.
This risk assessment was presented to and reviewed by the Compensation Committee. The Compensation Committee agreed with the result of the review, which concluded that the risks associated with our compensation policies and practices were being effectively managed. We have determined that the risks
associated with our compensation policies and practices are not reasonably likely to result in a material adverse effect on Infinera.
ITEM 12. SECURITY OWNERSHIP OF CERTAIN BENEFICIAL OWNERS AND MANAGEMENT AND RELATED STOCKHOLDER MATTERS
Equity compensation Plan Information
The following table provides information as of December 30, 2023 with respect to the shares of our common stock that may be issued under our existing equity compensation plans
| | | | | | | | | | | | | | | | | | | | | | | |
Plan Category | | Number of Securities to be Issued Upon Exercise of Outstanding Options, Warrants and Rights | Weighted Average Exercise Price of Outstanding Options, Warrants and Rights | | Number of Securities Remaining Available for Future Issuance Under Equity Compensation Plans (Excluding Securities Reflected in First Column) |
Equity compensation plans approved by security holders | | 15,189,297 | (1) | N/A | | 11,163,150 | (2) |
Equity compensation plans not approved by security holders | | $ | — | |
| N/A | | 360,638 | |
Total | | 15,189,297 | | | | 11,523,788 | |
________________
(1)This amount includes the following:
•11,537,197 shares subject to RSUs granted under the 2016 Plan. Since these awards have no exercise price, they are not included in the weighted average exercise price calculation in the second column; and
•3,652,100 shares issuable pursuant to outstanding unvested performance share awards assuming target performance under such awards. The number of shares, if any, to be issued pursuant to such outstanding awards will be determined based on certain performance metrics, as discussed above in the section entitled “Fiscal 2023 Compensation—Long-Term Incentive Compensation” in the Compensation Discussion and Analysis. Since these awards have no exercise price, they are not included in the weighted average exercise price calculation in the second column.
(2)This amount includes 1,098,245 shares of common stock available for future issuances under the 2007 ESPP.
Security Ownership of certain Beneficial Owners and Management
The following table sets forth certain information known to us regarding beneficial ownership of our common stock as of April 30, 2024 by:
•Each person known by us to be the beneficial owner of more than 5% of any class of our voting securities;
•Our NEOs;
•Each of our directors; and
•All current executive officers and directors as a group.
The information provided in this table is based on our records, information filed with the SEC and information provided to Infinera, except where otherwise noted. To our knowledge and unless as otherwise indicated, each stockholder possesses sole voting and investment power over the shares listed, except for shares owned jointly with such person’s spouse. Percentage beneficially owned is based on 233,974,025 shares of common stock outstanding on April 30, 2024. Unless otherwise indicated, the principal address of each of the stockholders below is c/o Infinera Corporation, 6373 San Ignacio Avenue, San Jose, California 95119. | | | | | | | | | | | | | | | | | | | | | | | | | | | |
| Name of Beneficial Owner | | Common
Shares
Currently
Held | | Common Shares That May Be Acquired Within 60 Days of April 30, 2024 | | Total
Beneficial
Ownership | | Percent
Beneficially
Owned(1) |
| 5% or More Stockholders | | | | | | | | | |
FMR LLC(2) | | 34,038,565 | | — | | | 34,038,565 | | 14.55 | % |
Oaktree Optical Holdings, L.P.(3) | | 25,175,384 | | — | | | 25,175,384 | | 10.76 | % |
The Vanguard Group(4) | | 24,750,346 | | — | | | 24,750,346 | | 10.58 | % |
Shapiro Capital Management LLC(5) | | 18,767,200 | | — | | | 18,767,200 | | 8.02 | % |
BlackRock, Inc.(6) | | 17,754,504 | | — | | | 17,754,504 | | 7.59 | % |
Brown Advisory Incorporated(7) | | 14,820,495 | | — | | | 14,820,495 | | 6.33 | % |
Named Executive Officers and Directors | | | | | | | | | |
David W. Heard | | 917,000 | | 19,259 | | | 936,259 | | * |
Nancy L. Erba | | 525,441 | | 7,708 | | | 533,149 | | * |
David L. Teichmann | | 272,740 | | 4,583 | | | 277,323 | | * |
Nicholas R. Walden | | 129,082 | | 5,333 | | | 134,415 | | * |
Christine B. Bucklin | | 95,572 | | 39,447 | | | 135,019 | | * |
Gregory P. Dougherty | | 177,174 | | 39,447 | | | 216,621 | | * |
Sharon E. Holt | | 192,727 | | 39,447 | | | 232,174 | | * |
Roop K. Lakkaraju | | 48,229 | | 39,447 | | | 87,676 | | * |
Paul J. Milbury | | 153,484 | | 39,447 | | | 192,931 | | * |
Amy H. Rice | | — | | — | | | — | | * |
George A. Riedel | | 128,572 | | 39,447 | | | 168,019 | | * |
David F. Welch, Ph.D.(8) | | 403,982 | | 8,333 | | | 412,315 | | * |
All Executive Officers and Directors as a Group (12 Persons) | | 3,044,003 | | 281,898 | | | 3,325,901 | | 1.42 | % |
_________________
*Less than 1% of the outstanding shares of common stock.
(1)Includes shares represented by RSUs or other rights that are expected to vest within 60 days of April 30, 2024. These shares are deemed to be outstanding for the purpose of computing the percentage ownership of the person holding the RSUs but are not treated as outstanding for the purpose of computing the percentage ownership of any other person.
(2)According to a Schedule 13G/A filed with the SEC on February 9, 2024 by FMR LLC (“FMR”), Abigail P. Johnson (FMR’s Director, Chair and CEO) and Fidelity Growth Company Fund Commingled Pool (“Fidelity”). Such amendment states that FMR is deemed to be the beneficial owner of 34,038,565 shares by virtue of its control over Fidelity, which is deemed to be the beneficial owner of 15,290,064 shares. Such amendment further states that (a) FMR has sole voting power over 34,037,308 shares, shared voting power over zero shares, sole dispositive power over 34,038,565 shares, and shared dispositive power over zero shares; and (b) Ms. Johnson has sole voting power over zero shares, shared voting power over zero shares, sole dispositive power over 34,038,565 shares, and shared dispositive power over zero shares. The address of FMR is 245 Summer Street, Boston, Massachusetts 02210.
(3)According to Forms 4 filed on March 18, 2020 and March 23, 2020 and a Schedule 13D/A filed with the SEC on March 2, 2023 jointly, pursuant to a joint filing agreement, by (i) Oaktree Optical Holdings, L.P., a Delaware limited partnership (“Optical”), whose principal business is to invest in securities; (ii) Oaktree Fund GP, LLC, a Delaware limited liability company (“GP LLC”), whose principal business is to serve as and perform the functions of the general partner of certain investment funds including Optical; (iii) Oaktree Fund GP I, L.P., a Delaware limited partnership (“GP I”), whose principal
business is (A) serve as, and perform the functions of, the general partner of certain investment funds or to serve as, and perform the functions of, the managing member of the general partner of certain investment funds or (B) to act as the sole stockholder of certain controlling entities of certain investment funds; (iv) Oaktree Capital I, L.P., a Delaware limited partnership (“Capital I”), whose principal business is to serve as, and perform the functions of, the general partner of GP I; (v) OCM Holdings I, LLC, a Delaware limited liability company (“Holdings I”), whose principal business is to serve as, and perform the functions of, the general partner of Capital I and to hold limited partnership interests in Capital I; (vi) Oaktree Holdings, LLC, a Delaware limited liability company (“Holdings”), whose principal business is to serve as, and perform the functions of, the managing member of Holdings I; (vii) Oaktree Capital Group, LLC, a Delaware limited liability company (“OCG”), whose principal business is to act as the holding company and controlling entity of each of the general partner and investment adviser of certain investment funds and separately managed accounts; (viii) Oaktree Capital Group Holdings GP, LLC, a Delaware limited liability company (“OCGH GP”); (ix) Brookfield Corporation, solely in its capacity as the indirect owner of the Class A units of OCG (“Brookfield”); and (x) BAM Partners Trust, solely in its capacity as the sole owner of Class B Limited Voting Shares of Brookfield (“BAM” and together with Optical, GP LLC, GP I, Capital I, Holdings I, Holdings, OCG, OCGH GP and Brookfield, collectively, the “Reporting Persons”), whose principal business is to serve as, and perform the functions of, the manager of OCG, each of the Reporting Persons may be deemed the beneficial owner of, and to have sole voting power and sole dispositive power over, 25,175,384 shares. The principal business address of each of the Reporting Persons is c/o Oaktree Capital Group Holdings GP, LLC, 333 South Grand Avenue, 28th Floor, Los Angeles, California 90071.
(4)According to a Schedule 13G/A filed with the SEC on February 13, 2024 by The Vanguard Group (“Vanguard”), Vanguard is the beneficial owner of 24,750,346 shares and has sole voting power over zero shares, shared voting power over 365,147 shares, sole dispositive power over 24,209,540 shares and shared dispositive power over 540,806 shares. The address of Vanguard is 100 Vanguard Boulevard, Malvern, Pennsylvania 19355.
(5)According to a Schedule 13G filed with the SEC on February 14, 2024 by Shapiro Capital Management LLC (“Shapiro”). Shapiro is the beneficial owner of 18,767,200 shares and has sole voting power over 16,648,638 shares, shared voting power over 2,118,562 shares, sole dispositive power over 18,767,200 shares and shared dispositive power over zero shares. The address of Shapiro is 3060 Peachtree Road, Suite 1555 N.W., Atlanta, Georgia 30305.
(6)According to a Schedule 13G/A filed with the SEC on January 26, 2024 by BlackRock, Inc. (“BlackRock”). BlackRock is the beneficial owner of 17,754,504 shares and has sole voting power over 17,537,634 shares, shared voting power over zero shares, sole dispositive power over 17,754,504 shares and shared dispositive power over zero shares. The address of BlackRock is 50 Hudson Yards, New York, NY 10001.
(7)According to a Schedule 13G/A filed with the SEC on February 9, 2024 jointly by Brown Advisory Incorporated, a Maryland corporation whose principal business is as parent holding company or control person (“BAI”), Brown Investment Advisory & Trust Company, a Maryland trust company, whose principal business is banking (“BIATC”), and Brown Advisory LLC, a Maryland limited liability company whose principal business is as an investment advisor (“BALLC”). Such amendment states that BAI is deemed to be the beneficial owner of 14,820,495 shares by virtue of its control over BIATC, which is deemed to be the beneficial owner of 74,834 shares, and BALLC, which is deemed to be the beneficial owner of 14,745,661 shares. Such amendment further states that (a) BAI has sole voting power over 12,903,329 shares, shared voting power over zero shares, sole dispositive power over zero shares, and shared dispositive power over 14,820,495 shares; (b) BIATC has sole voting power over 74,834 shares, shared voting power over zero shares, sole dispositive power over zero shares, and shared dispositive power over 74,834 shares, and (c) BALLC has sole voting power over 12,828,495 shares, shared voting power over zero shares, sole dispositive power over zero shares, and shared dispositive power over 14,745,661 shares. The address of BAI is 901 South Bond Street, Suite #400, Baltimore, Maryland 21231.
(8)Shares held consist of (i) 401,482 shares held by The Welch Family Trust U/A DTD 4/3/1996 and (ii) 2,500 shares held by Dr. Welch as trustee for his children. Dr. Welch disclaims beneficial ownership of the shares held in trust for his children.
ITEM 13. CERTAIN RELATIONSHIPS AND RELATED TRANSACTIONS, AND DIRECTOR INDEPENDENCE
Certain Relationships and Related Party Transactions
We have adopted a formal policy that our executive officers, directors, and principal stockholders, including their immediate family members and affiliates, are not permitted to enter into a related party transaction with us without the prior consent of the Audit Committee, or other independent members of the Board in the case it is inappropriate for the Audit Committee to review such transaction due to a conflict of interest. Any request for us to enter into a transaction with an executive officer, director, principal stockholder, or any of such persons’ immediate family members or affiliates, in which the amount involved exceeds $120,000 must first be presented to the Audit Committee for review, consideration and approval. All of our directors, executive officers and employees are required to report to the Audit Committee any such related party transaction. In approving or rejecting the proposed agreement, the Audit Committee shall consider the relevant facts and circumstances available and deemed relevant to the Audit Committee, including, but not limited to the risks, costs and benefits to us, the terms of the transaction, the availability of other sources for comparable services or products, and, if applicable, the impact on a director’s independence. The Audit Committee shall approve only those agreements
that, in light of known circumstances, are, or are not inconsistent with, our best interests, as the Audit Committee determines in the good faith exercise of its discretion.
For a description of compensation received by Dr. Welch, our founder and an employee member of our Board, please see “How We Are Paid—Fiscal 2023 Director Compensation,” above.
We did not engage in any other related party transactions during fiscal 2023 within the meaning of the applicable SEC rules.
ITEM 14. PRINCIPAL ACCOUNTING FEES AND SERVICES
Independent Registered Public Accounting Firm’s Fees
The following table sets forth the aggregate fees for audit, audit-related, tax and other services provided by Ernst & Young LLP for the fiscal years ended December 30, 2023 and December 31, 2022. All of the services described in the following table were approved in conformity with the Audit Committee’s pre-approval processes and procedures.
| | | | | | | | | | | |
| 2023 | | 2022 |
Audit Fees | $ | 6,545,000 | | | $ | 4,785,000 | |
Audit-Related Fees | 75,000 | | | — | |
Tax Fees | 70,000 | | | 321,000 | |
All Other Fees | 2,000 | | | 2,000 | |
Total Fees | $ | 6,692,000 | | | $ | 5,108,000 | |
Audit Fees
This category includes Ernst & Young LLP’s audit of our annual financial statements and internal control over financial reporting, review of financial statements included in our Quarterly Reports on Form 10-Q, and services that are typically provided by the independent registered public accounting firm in connection with statutory and regulatory filings or engagements for those fiscal years. This category also includes statutory audits required by non-U.S. jurisdictions, consultation and advice on new accounting pronouncements, and technical advice on various accounting matters related to the consolidated financial statements or statutory financial statements that are required to be filed by non-U.S. jurisdictions, comfort letters, and consents issued in connection with SEC filings. Fiscal 2023 fees were higher than fiscal 2022 fees primarily due to the additional audit procedures required in connection with Ernst & Young LLP’s audit of our consolidated financial statements for the fiscal year ended December 31, 2022 and the material weaknesses in internal control over financial reporting described in Part II, Item 9A, "Controls and Procedures" of this report.
Audit-Related Fees
This category consists of assurance and related services provided by Ernst & Young LLP that are reasonably related to the performance of the audit or review of our financial statements and are not included in the fees reported in the table above under “Audit Fees.”
Tax Fees
This category includes fees for tax compliance, tax advice, tax planning and transfer pricing.
All Other Fees
This category consists of any permitted services provided by Ernst & Young LLP that are not included in the category descriptions under “Audit Fees,” “Audit-Related Fees” or “Tax Fees” in the table above, and principally includes non-audit services, including permissible business and advisory consulting services.
Auditor Independence
In 2023, there were no other professional services provided by Ernst & Young LLP, other than those listed above, that would have required our Audit Committee to consider their compatibility with maintaining the independence of Ernst & Young LLP.
Pre-Approval Policies and Procedures
The Audit Committee’s policy is to pre-approve all audit and permissible non-audit services rendered by Ernst & Young LLP, our independent registered public accounting firm. The Audit Committee can pre-approve specified services in defined categories of audit services, audit-related services and tax services up to specified
amounts, as part of the Audit Committee’s approval of the scope of the engagement of Ernst & Young LLP or on an individual case-by-case basis before Ernst & Young LLP is engaged to provide a service. The Audit Committee has determined that the rendering of the services other than audit services by Ernst & Young LLP is compatible with maintaining the principal accountant’s independence.
PART IV
ITEM 15. EXHIBITS, FINANCIAL STATEMENT SCHEDULES
(a)(1) Consolidated Financial Statements
This Annual Report on Form 10-K contains the following financial statements which appear under Part II, Item 8 of this Form 10-K on the pages noted below:
(a)(2) Financial Statement Schedule
Schedule II: Valuation and Qualifying Accounts
| | | | | | | | | | | | | | | | | |
| | Years Ended |
| | December 30, 2023 | | December 31, 2022 | | December 25,
2021 |
| | | | | |
| | (In thousands) |
| Deferred tax asset, valuation allowance | | | | | |
| Beginning balance | $ | 548,257 | | | $ | 521,620 | | | $ | 531,923 | |
| Additions | 49,481 | | | 41,782 | | | 14,395 | |
| Reductions | (20,740) | | | (15,145) | | | (24,698) | |
| Ending balance | $ | 576,998 | | | $ | 548,257 | | | $ | 521,620 | |
| Allowance for credit losses | | | | | |
| Beginning balance | $ | 1,422 | | | $ | 1,304 | | | $ | 2,912 | |
| Additions | 521 | | | 1,762 | | | 1,139 | |
| Write-offs | (473) | | | (1,279) | | | (2,430) | |
Recoveries during the period | (594) | | | (365) | | | (317) | |
| | | | | |
| Ending balance | $ | 876 | | | $ | 1,422 | | | $ | 1,304 | |
Schedules not listed above have been omitted because the information required to be set forth therein is not applicable or is shown in the consolidated financial statements or notes thereto.
(a)(3) Exhibits.
See Index to Exhibits. The Exhibits listed in the accompanying Index to Exhibits are filed or incorporated by reference as part of this Annual Report on Form 10-K.
ITEM 16. FORM 10-K SUMMARY
None.
INDEX TO EXHIBITS
| | | | | | | | |
| Exhibit No. | | Description |
| 2.1 | | |
| 3.1 | | |
| 3.2 | | |
| 4.1 | | |
| 4.2 | | |
| 4.3 | | |
| 4.4 | | |
| 4.5 | | |
| 4.6 | | |
| 4.7 | | |
| 4.8 | | |
| 4.9 | | |
| 4.10 | | |
4.11 | | |
| 10.1* | | |
| 10.2* | | |
| 10.3* | | |
| 10.4* | | |
| 10.5* | | |
| | | | | | | | |
| Exhibit No. | | Description |
| 10.6* | | |
| 10.7* | | |
| 10.8* | | |
| 10.9* | | |
10.10* | | |
10.11* | | |
10.12* | | |
10.13* | | |
10.14* | | |
10.15 | | |
10.16 | | |
10.17 | | |
10.18* | | |
10.19* | | |
10.20* | | |
10.21* | | |
10.22* | | |
10.23* | | |
| | | | | | | | |
| Exhibit No. | | Description |
| 10.24 | | |
| 10.25 | | |
| 10.26 | | Loan, Guaranty and Security Agreement, dated as of June 24, 2022, by and among Infinera Corporation, the other obligors party thereto, the lenders party thereto, and Bank of America, N.A. as agent, incorporated herein by reference to Exhibit 10.1 of the Registrant’s Current Report on Form 8-K (No. 001-33486), filed with the SEC on June 27, 2022. |
| 10.27 | | First Amendment to Loan, Guaranty and Security Agreement, dated as of August 2, 2022, among Infinera Corporation, the other obligors party thereto, the lenders party thereto, and Bank of America, N.A., as Administrative Agent, incorporated herein by reference to Exhibit 10.1 of the Registrant’s Current Report on Form 8-K (No. 001-33486) filed with the SEC on August 3, 2022. |
| 10.28 | | |
| 10.29 | | |
| 10.30 | | |
| 10.31 | | Second Amendment to Loan, Guaranty and Security Agreement, dated as of May 16, 2023, among Infinera Corporation, the other obligors party thereto, the lenders party thereto, and Bank of America, N.A., as Administrative Agent, incorporated herein by reference to Exhibit 10.3 of the Registrant’s Current Report on Form 8-K (No. 001-33486), filed with the SEC on May 17, 2023. |
| 19.1 | | |
| 21.1 | | |
| 23.1 | | |
| 24.1 | | Power of Attorney (reference is made to the signature page hereto) |
| 31.1 | | |
| 31.2 | | |
| 32.1** | | |
| 32.2** | | |
97.1 | | |
| 101.INS | | XBRL Instance Document |
| 101.SCH | | XBRL Taxonomy Extension Schema Document |
| 101.CAL | | XBRL Taxonomy Extension Calculation Linkbase Document |
| 101.DEF | | XBRL Taxonomy Extension Definition Linkbase Document |
| 101.LAB | | XBRL Taxonomy Extension Label Linkbase Document |
| 101.PRE | | XBRL Taxonomy Extension Presentation Linkbase Document |
| 104 | | Cover Page Interactive Data File (embedded within the Inline XBRL document) |
* Management contracts or compensation plans or arrangements in which directors or executive officers are eligible to participate.
** This exhibit shall not be deemed “filed” for purposes of Section 18 of the Exchange Act or otherwise subject to the liabilities of that section, nor shall it be deemed incorporated by reference in any filings under the Securities Act of 1933, as amended, or the Exchange Act, whether made before or after the date hereof and irrespective of any general incorporation language in any filings.
SIGNATURES
Pursuant to the requirements of Section 13 or 15(d) of the Securities Exchange Act of 1934, the Registrant has duly caused this report to be signed on its behalf by the undersigned, thereunto duly authorized.
Dated: May 17, 2024
| | | | | | | | | | | |
| Infinera Corporation |
| | |
| By: | | /s/ NANCY ERBA |
| | | Nancy Erba
Chief Financial Officer
Principal Financial Officer |
KNOW ALL PERSONS BY THESE PRESENTS, that each person whose signature appears below constitutes and appoints David W. Heard and Nancy Erba, and each of them individually, his or her attorneys-in-fact, each with the power of substitution, for him or her in any and all capacities, to sign any amendments to this Annual Report on Form 10-K, and to file the same, with exhibits thereto and other documents in connection therewith, with the Securities and Exchange Commission, hereby ratifying and confirming all that each of said attorneys-in-fact, or his substitute or substitutes, may do or cause to be done by virtue hereof.
Pursuant to the requirements of the Securities Exchange Act of 1934, this report has been signed below by the following persons on behalf of the Registrant and in the capacities and on the dates indicated.
| | | | | | | | |
| Name and Signature | Title | Date |
| | |
| /s/ DAVID W. HEARD | Chief Executive Officer, Principal Executive Officer and Director | May 17, 2024 |
| David W. Heard |
| | |
| /s/ NANCY ERBA | Chief Financial Officer, Principal Financial Officer
| May 17, 2024 |
| Nancy Erba |
| | |
| /s/ MICHAEL FERNICOLA | Chief Accounting Officer and Principal Accounting Officer | May 17, 2024 |
| Michael Fernicola |
| /s/ GEORGE RIEDEL | Chairman of the Board | May 17, 2024 |
| George Riedel |
| | |
| /s/ CHRISTINE BUCKLIN | Director | May 17, 2024 |
| Christine Bucklin |
| | |
| /s/ GREG P. DOUGHERTY | Director | May 17, 2024 |
| Greg P. Dougherty |
| | |
| /s/ SHARON HOLT | Director | May 17, 2024 |
| Sharon Holt |
| | |
| /s/ ROOP K. LAKKARAJU | Director | May 17, 2024 |
| Roop Lakkaraju |
| | |
| /s/ PAUL J. MILBURY | Director | May 17, 2024 |
| Paul J. Milbury |
| | |
| /s/ AMY RICE | Director | May 17, 2024 |
| Amy Rice |
| /s/ DAVID F. WELCH, PH.D. | Co-founder, Chief Innovation Officer and Director | May 17, 2024 |
| David F. Welch, Ph.D. |
APPENDIX A - UNAUDITED RECONCILIATIONS FROM GAAP TO NON-GAAP
| | | | | | | | | | | | | | | | | | | | |
Reconciliation of Product Standard Margin for the year ended December 30, 2023 (in thousands): |
| | | | | | |
| | GAAP as reported | | Warehouse fire loss (recovery) | | Non-GAAP as adjusted |
| Revenue | | | | | | |
| Product | | $ | 1,304,229 | | | $ | — | | | $ | 1,304,229 | |
Cost of revenue | | | | | | |
| Cost of product - standard | | 661,578 | | | (1,985) | | | 663,563 | |
Cost of product - other | | 149,267 | | | — | | | 149,267 | |
| Total cost of product | | $ | 810,845 | | | $ | (1,985) | | | $ | 812,830 | |
Total product standard margin | | $ | 642,651 | | | $ | 1,985 | | | $ | 640,666 | |
| | | | | | | | | | | | | | | | | | | | |
Reconciliation of Income (Loss) from Operations (in thousands): |
| | Years Ended |
| | December 30, 2023 | | December 31, 2022 | | December 25, 2021 |
GAAP as reported | | $ | (4,840) | | | $ | (60,157) | | | $ | (87,479) | |
| Acquisition-related deferred revenue adjustment | | — | | | — | | | 3,913 | |
| Stock-based compensation | | 62,150 | | | 61,015 | | | 51,812 | |
| Amortization of acquired intangible assets | | 22,965 | | | 37,714 | | | 37,076 | |
| Acquisition and integration costs | | — | | | — | | | 614 | |
| Restructuring and other related costs | | 8,935 | | | 10,344 | | | 14,777 | |
| Inventory related charges | | — | | | 14,381 | | | 6,582 | |
| Global distribution center transition costs | | — | | | 2,109 | | | — | |
| Warehouse fire loss (recovery) | | (1,985) | | | 2,232 | | | — | |
| Litigation charges | | — | | | 1,350 | | | 2,291 | |
| Non-GAAP as adjusted | | $ | 87,225 | | | $ | 68,988 | | | $ | 29,586 | |