Exhibit 99.1

FOR IMMEDIATE RELEASE
|
For further information: |
|
|
|
|
|
Gil Borok Chief Financial Officer 310.405.8909 |
|
Nick Kormeluk Investor Relations 949.809.4308 |
|
Steve Iaco Corporate Communications 212.984.6535 |
CBRE GROUP, INC. REPORTS IMPROVED ADJUSTED
EARNINGS FOR THE THIRD QUARTER OF 2012
Total Revenue Rose 1% (5% in local currency)
Outsourcing Revenue Up 7% (11% in local currency)
Los Angeles, CA — October 30, 2012 — CBRE Group, Inc. (NYSE:CBG) today reported an 8% increase in adjusted earnings for the third quarter ended September 30, 2012.
Third-Quarter 2012 Results
· Revenue for the quarter was $1.56 billion, up 1% (5% in local currency) from $1.53 billion in the third quarter of 2011.
· Excluding selected charges(1), net income(2) was $83.6 million, or $0.26 per diluted share, for the current quarter, up 8% from $77.7 million, or $0.24 per diluted share, in the third quarter of 2011. For the current quarter, selected charges (net of income taxes), which primarily related to the acquisition of the ING REIM businesses (completed in 2011), cost containment expenses and an intangible asset impairment related to the discontinuation of a U.K. trade name, totaled $43.9 million. For the same period in 2011, selected charges totaled $13.9 million.
· On a U.S. GAAP basis, net income was $39.7 million, or $0.12 per diluted share, for the third quarter of 2012 compared with $63.8 million, or $0.20 per diluted share, for the third quarter of 2011.
· Excluding selected charges, Earnings Before Interest Taxes Depreciation and Amortization (EBITDA) (3) increased marginally to $195.3 million for the third quarter of 2012 from $194.8 million a year earlier. EBITDA (including selected charges) was $163.6 million for the third quarter of 2012, compared with $179.0 million for the same period last year. For the current quarter, selected charges, which primarily related to the aforementioned acquisition of the ING REIM businesses, cost containment expenses and an intangible asset impairment, reduced EBITDA by $31.7 million. For the same period in 2011, selected charges totaled $15.8 million.
Management Commentary
“Many investors and occupiers turned more cautious in the third quarter. Concerns about Europe’s ongoing sovereign debt crisis and Asia’s slowing growth, which have been weighing on markets for most of the year, were heightened by unease about weakening corporate profit outlooks as well as U.S. fiscal policy and political uncertainty,” said Brett White, CBRE’s chief executive officer. “CBRE was not immune from these macro trends. Nevertheless, our strong brand, best-in-class professionals and diversified global platform enabled us to modestly improve on last year’s performance in this cautious market environment. We also continued to carefully manage expenses, and preserved our industry-leading margins. During the third quarter, we took steps to further align our cost base with reduced business volumes in certain parts of our business. This was particularly true in Europe, where the ongoing debt problems continue to adversely affect transaction activity, most notably in France.”
Outsourcing continued to grow solidly, with revenue up 7% globally (11% in local currency) and 13% in the Americas. CBRE remains at the forefront of an industry-wide trend in which property occupiers are hiring third-party service providers to manage their real estate in order to reduce costs and improve efficiency. The Company signed a record 67 total outsourcing contracts in the quarter, surpassing its previous record (54 total contracts) achieved in the first quarter of 2012. In EMEA and Asia Pacific, CBRE signed four contracts with new clients and expanded three contracts with existing clients during the quarter.
CBRE continued to benefit from last year’s acquisition of the ING real estate investment management businesses, which added significant recurring, fee-based revenue to the Company’s business mix. Fueled by contributions from the ING REIM businesses, global investment management revenue rose 48% during the third quarter, and this segment’s contributions to total Company normalized EBITDA increased significantly.
Geographically, the Americas was the Company’s best-performing region, with 4% overall revenue growth. Double-digit revenue increases in Americas outsourcing and commercial mortgage brokerage more than offset declines in sales and leasing. EMEA revenue fell 17% (9% in local currency) primarily due to the continued effects of sovereign debt issues. On a positive note, the U.K. business proved resilient, with overall revenue edging up 2%. Property sales activity was a source of particular strength in the U.K., with revenue rising 17% as CBRE claimed a greater share of investment activity in a market that is increasingly attracting offshore capital due to its relative safe-haven status. Asia Pacific revenue declined 4%, but rose 2% in local currency.
“The current recovery, unlike past ones, remains frustratingly slow and inconsistent, and is subject to quick swings in market sentiment,” Mr. White said. “We expect these variable conditions to persist until global economic growth and job creation shift into higher gear. In the meantime, we remain highly focused on operating efficiently while investing in our platform, as we help our clients navigate this choppy environment. CBRE is well positioned for the uncertain market environment because of the strength of our brand, people and diverse platform.”
Third-Quarter 2012 Segment Results
Americas Region (U.S., Canada and Latin America)
· Revenue rose 4% to $996.4 million, compared with $954.2 million for the third quarter of 2011.
· EBITDA rose 2% to $128.7 million from $126.2 million for the prior-year third quarter.
· Operating income totaled $105.4 million compared with $107.0 million in last year’s third quarter.
· Growth in outsourcing and commercial mortgage brokerage more than offset softer sales and lease transaction revenue.
EMEA Region (primarily Europe)
· Revenue was $228.7 million, a decrease of 17% (9% in local currency) from $276.0 million in the third quarter of 2011.
· EBITDA, before selected charges, was $7.2 million, compared with $21.1 million in the prior-year third quarter. Including selected charges, current-quarter EBITDA swung to a loss of $8.1 million. There were no selected charges in the comparable period of 2011.
· The region reported an operating loss of $31.7 million, compared with operating income of $17.5 million for the same period in 2011. Operating loss for the third quarter of 2012 included an approximately $20 million non-cash write-off of a trade name in the U.K., and cost containment expenses of $15.3 million, for a total of $35.3 million in charges. The non-amortizable intangible asset impairment is included in the calculation of operating loss but not in EBITDA.
· The weaker results reflected the continued impact of Europe’s sovereign debt crisis and related economic difficulties as well as the negative effect of currency movement.
Asia Pacific Region (Asia, Australia and New Zealand)
· Revenue was $200.0 million, a decrease of 4% (a 2% increase in local currency) from $208.1 million in the third quarter of 2011.
· EBITDA, before selected charges, was $18.7 million, compared with $22.3 million in the prior-year third quarter. Including selected charges, current-quarter EBITDA was $16.4 million versus $21.8 million in the prior-year period.
· Operating income was $13.9 million, compared with $19.3 million for the third quarter of 2011.
· The weaker results reflected the impact of slower economic growth, which resulted in lower sales and leasing activity throughout much of the region, as well as the negative effect of currency movement.
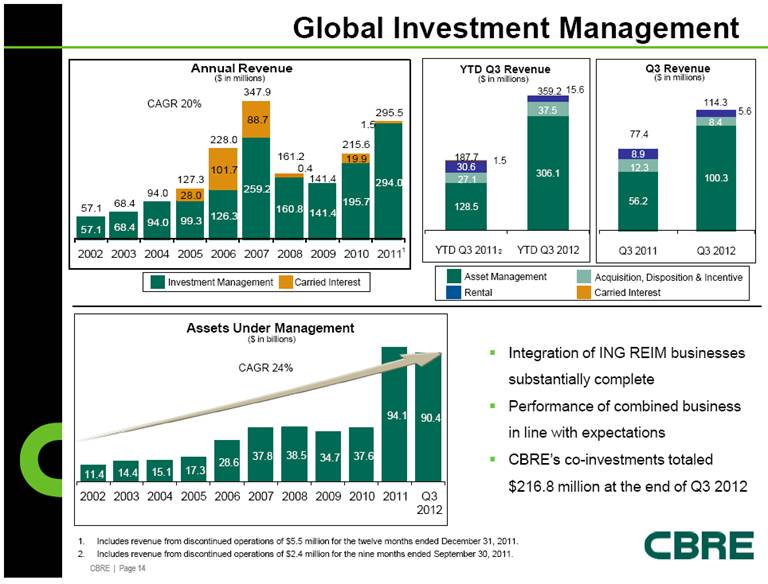
Global Investment Management Business (investment management operations in the U.S., Europe and Asia)
· Revenue rose 48% to $114.3 million from $77.4 million in the third quarter of 2011.
· EBITDA, before selected charges, rose 84% to $36.9 million from $20.0 million in the prior-year third quarter. Including selected charges in both periods, current-quarter EBITDA rose to $22.7 million from $6.2 million in the third quarter of 2011.
· Operating income was $12.1 million, compared with an operating loss of $0.3 million for the third quarter of 2011.
· The improved performance was driven by contributions from the ING REIM Europe and Asia businesses, acquired in the fourth quarter of 2011. The global real estate securities business was acquired from ING on July 1, 2011, and is therefore fully included in both the current and prior-year quarters.
· Assets under management totaled $90.4 billion at the end of the third quarter, a decrease of 1% from the second quarter of 2012 and 4% from year-end 2011. The decrease from year end was in part driven by a non-traded REIT’s decision to internalize its management, as previously reported.
Development Services (real estate development and investment activities primarily in the U.S.)
· Revenue was $17.8 million compared with $18.8 million for the third quarter of 2011.
· Operating income improved to $3.9 million, compared with an operating loss of $0.4 million for the third quarter of 2011. The 2011 period included real estate asset impairments, which did not recur in the current year, as well as higher incentive compensation.
· EBITDA was $3.8 million in both the current-year and prior-year periods. The improvement reflected in operating income in the current year was offset by equity losses from unconsolidated subsidiaries and activity associated with non-controlling interests; equity loss from unconsolidated subsidiaries and non-controlling interests are included in the calculation of EBITDA, but not in operating income.
· Development projects in process totaled $4.6 billion, down $0.1 billion from the second quarter of 2012 and $0.3 billion from year-end 2011. The inventory of pipeline deals totaled $1.9 billion, up $0.5 billion from the second quarter of 2012 and $0.7 billion from year-end 2011.
Nine-Month Results
· Revenue for the nine months ended September 30, 2012 was $4.5 billion, an increase of 9% (11% in local currency) from $4.1 billion for the same period in 2011.
· Excluding selected charges, net income was $217.5 million, or $0.67 per diluted share, for the current-year-to-date period, up 17% and 18%, respectively, from $185.2 million, or $0.57 per diluted share, in the prior-year period. Selected charges (net of income taxes), which primarily related to the acquisition of the ING REIM businesses, cost containment expenses and the impairment of assets, totaled $74.9 million for the nine months ended September 30, 2012 and $25.8 million for the same period in 2011.
· On a U.S. GAAP basis, net income was $142.6 million, or $0.44 per diluted share, for the nine months ended September 30, 2012, compared with $159.4 million, or $0.49 per diluted share, in the same period in 2011.
· Excluding selected charges, EBITDA increased 16% to $566.8 million for the first nine months of 2012 from $487.7 million a year earlier. EBITDA (including selected charges) rose 13% to $515.9 million for the current nine-month period from $458.1 million for the same period a year earlier. Selected charges, which primarily related to the acquisition of the ING REIM businesses, cost containment expenses and the impairment of assets, reduced EBITDA by $50.9 million for the nine months ended September 30, 2012 and $29.6 million for the same period in 2011.
Conference Call Details
The Company’s third-quarter earnings conference call will be held on Tuesday, October 30, 2012 at 5:00 p.m. Eastern Time. A webcast will be accessible through the Investor Relations section of the Company’s Web site at www.cbre.com/investorrelations.
The direct dial-in number for the conference call is 800-230-1951 for U.S. callers and 612-332-0342 for international callers. A replay of the call will be available starting at 10 p.m. Eastern Time on October 30, 2012, and ending at midnight Eastern Time on November 5, 2012. The dial-in number for the replay is 800-475-6701 for U.S. callers and 320-365-3844 for international callers. The access code for the replay is 268007. A transcript of the call will be available on the Company’s Investor Relations Web site at www.cbre.com/investorrelations.
About CBRE Group, Inc.
CBRE Group, Inc. (NYSE:CBG), a Fortune 500 and S&P 500 company headquartered in Los Angeles, is the world’s largest commercial real estate services firm (in terms of 2011 revenue). The Company has approximately 34,000 employees (excluding affiliates), and serves real estate owners, investors and occupiers through more than 300 offices (excluding affiliates) worldwide. CBRE offers strategic advice and execution for property sales and leasing; corporate services; property, facilities and project management; mortgage banking; appraisal and valuation; development services; investment management; and research and consulting. Please visit our Web site at www.cbre.com.
Note: This release contains forward-looking statements within the meaning of the ‘‘safe harbor’’ provisions of the Private Securities Litigation Reform Act of 1995, including statements regarding our future growth momentum, operations, financial performance, and business outlook. These forward-looking statements involve known and unknown risks, uncertainties and other factors that may cause the Company’s actual results and performance in future periods to be materially different from any future results or performance suggested in forward-looking statements in this release. Any forward-looking statements speak only as of the date of this release and, except to the extent required by applicable securities laws, the Company expressly disclaims any obligation to update or revise any of them to reflect actual results, any changes in expectations or any change in events. If the Company does update one or more forward-looking statements, no inference should be drawn that it will make additional updates with respect to those or other forward-looking statements. Factors that could cause results to differ materially include, but are not limited to: general conditions of financial liquidity for real estate transactions, including the impact of the European sovereign debt crisis and potential “fiscal cliff” in the U.S.; our leverage and our ability to perform under our credit facilities; commercial real estate vacancy levels; employment conditions and their effect on vacancy rates; property values; rental rates; interest rates; our ability to leverage our platform to grow revenues and capture market share; continued growth in trends toward use of outsourced real estate services; our ability to control costs relative to revenue growth and expand EBITDA margins; our ability to retain and incentivize producers; our ability to identify, acquire and integrate synergistic and accretive businesses; expected levels of interest, depreciation and amortization expense resulting from completed acquisitions; maintaining our effective tax rate; realization of values in investment funds to offset related incentive compensation expense; a decline in asset values in, or a reduction in earnings or cash flow from, our investment programs, as well as related litigation, liabilities and reputational harm; and our ability to comply with laws and regulations related to our international operations, including the anti-corruption laws of the U.S. and other countries.
Additional information concerning factors that may influence the Company’s financial information is discussed under “Risk Factors”, “Management’s Discussion and Analysis of Financial Condition and Results of Operations”, “Quantitative and Qualitative Disclosures About Market Risk” and “Forward-Looking Statements” in our Annual Report on Form 10-K for the year ended December 31, 2011, and under “Management’s Discussion and Analysis of Financial Condition and Results of Operations”, “Quantitative and Qualitative Disclosures About Market Risk” and “Forward-Looking Statements” in our Quarterly Report on Form 10-Q for the quarter ended June 30, 2012, as well as in the Company’s press releases and other periodic filings with the Securities and Exchange Commission. Such filings are available publicly and may be obtained on the Company’s Web site at www.cbre.com or upon written request from the CBRE Investor Relations Department at investorrelations@cbre.com.
(1) Selected charges include integration and other costs related to acquisitions, amortization expense related to incentive fees and customer relationships acquired in the ING REIM and Trammell Crow Company (TCC) acquisitions, cost containment expenses and the write-down of impaired assets, including a non-amortizable intangible asset.
(2) A reconciliation of net income attributable to CBRE Group, Inc. to net income attributable to CBRE Group, Inc., as adjusted for selected charges, is provided in the section of this press release entitled “Non-GAAP Financial Measures.”
(3) EBITDA represents earnings before net interest expense, income taxes, depreciation and amortization, while amounts shown for EBITDA, as adjusted (or normalized EBITDA), remove the impact of certain cash and non-cash charges related to acquisitions, cost containment and asset impairments. Our management believes that both of these measures are useful in evaluating our operating performance compared to that of other companies in our industry because the calculations of EBITDA and EBITDA, as adjusted, generally eliminate the effects of financing and income taxes and the accounting effects of capital spending and acquisitions, which would include impairment charges of goodwill and intangibles created from acquisitions. Such items may vary for different companies for reasons unrelated to overall operating performance. As a result, our management uses these measures to evaluate operating performance and for other discretionary purposes,
including as a significant component when measuring our operating performance under our employee incentive programs. Additionally, we believe EBITDA and EBITDA, as adjusted, are useful to investors to assist them in getting a more complete picture of our results from operations.
However, EBITDA and EBITDA, as adjusted, are not recognized measurements under U.S. generally accepted accounting principles, or GAAP, and when analyzing our operating performance, readers should use EBITDA and EBITDA, as adjusted, in addition to, and not as an alternative for, net income as determined in accordance with GAAP. Because not all companies use identical calculations, our presentation of EBITDA and EBITDA, as adjusted, may not be comparable to similarly titled measures of other companies. Furthermore, EBITDA and EBITDA, as adjusted, are not intended to be measures of free cash flow for our management’s discretionary use, as they do not consider certain cash requirements such as tax and debt service payments. The amounts shown for EBITDA and EBITDA, as adjusted, also differ from the amounts calculated under similarly titled definitions in our debt instruments, which are further adjusted to reflect certain other cash and non-cash charges and are used to determine compliance with financial covenants and our ability to engage in certain activities, such as incurring additional debt and making certain restricted payments.
For a reconciliation of EBITDA and EBITDA, as adjusted to net income attributable to CBRE Group, Inc., the most comparable financial measure calculated and presented in accordance with GAAP, see the section of this press release titled “Non-GAAP Financial Measures.”
CBRE GROUP, INC.
OPERATING RESULTS
FOR THE THREE AND NINE MONTHS ENDED SEPTEMBER 30, 2012 AND 2011
(Dollars in thousands, except share data)
(Unaudited)
|
|
|
Three Months Ended |
|
Nine Months Ended |
| ||||||||
|
|
|
2012 |
|
2011 |
|
2012 |
|
2011 |
| ||||
|
Revenue |
|
$ |
1,557,147 |
|
$ |
1,534,463 |
|
$ |
4,508,253 |
|
$ |
4,141,786 |
|
|
|
|
|
|
|
|
|
|
|
| ||||
|
Costs and expenses: |
|
|
|
|
|
|
|
|
| ||||
|
Cost of services |
|
915,245 |
|
894,607 |
|
2,610,944 |
|
2,448,184 |
| ||||
|
Operating, administrative and other |
|
482,362 |
|
469,138 |
|
1,405,461 |
|
1,279,019 |
| ||||
|
Depreciation and amortization |
|
40,102 |
|
31,308 |
|
124,895 |
|
79,871 |
| ||||
|
Non-amortizable intangible asset impairment |
|
19,826 |
|
— |
|
19,826 |
|
— |
| ||||
|
Total costs and expenses |
|
1,457,535 |
|
1,395,053 |
|
4,161,126 |
|
3,807,074 |
| ||||
|
|
|
|
|
|
|
|
|
|
| ||||
|
Gain on disposition of real estate |
|
3,983 |
|
3,595 |
|
5,231 |
|
11,594 |
| ||||
|
Operating income |
|
103,595 |
|
143,005 |
|
352,358 |
|
346,306 |
| ||||
|
Equity income from unconsolidated subsidiaries |
|
2,875 |
|
6,714 |
|
19,870 |
|
38,961 |
| ||||
|
Other income (loss) |
|
151 |
|
(5,809 |
) |
4,635 |
|
(5,809 |
) | ||||
|
Interest income |
|
1,895 |
|
2,493 |
|
5,783 |
|
7,063 |
| ||||
|
Interest expense |
|
43,651 |
|
39,080 |
|
132,043 |
|
107,014 |
| ||||
|
Income from continuing operations before provision for income taxes |
|
64,865 |
|
107,323 |
|
250,603 |
|
279,507 |
| ||||
|
Provision for income taxes |
|
22,160 |
|
47,290 |
|
102,353 |
|
117,032 |
| ||||
|
Income from continuing operations |
|
42,705 |
|
60,033 |
|
148,250 |
|
162,475 |
| ||||
|
Income from discontinued operations, net of income taxes |
|
— |
|
— |
|
— |
|
16,911 |
| ||||
|
Net income |
|
42,705 |
|
60,033 |
|
148,250 |
|
179,386 |
| ||||
|
Less: Net income (loss) attributable to non-controlling interests |
|
2,996 |
|
(3,774 |
) |
5,693 |
|
19,987 |
| ||||
|
Net income attributable to CBRE Group, Inc. |
|
$ |
39,709 |
|
$ |
63,807 |
|
$ |
142,557 |
|
$ |
159,399 |
|
|
|
|
|
|
|
|
|
|
|
| ||||
|
Basic income per share attributable to CBRE Group, Inc. shareholders |
|
|
|
|
|
|
|
|
| ||||
|
Income from continuing operations attributable to CBRE Group, Inc. |
|
$ |
0.12 |
|
$ |
0.20 |
|
$ |
0.44 |
|
$ |
0.50 |
|
|
Income from discontinued operations attributable to CBRE Group, Inc. |
|
— |
|
— |
|
— |
|
— |
| ||||
|
Net income attributable CBRE Group, Inc. |
|
$ |
0.12 |
|
$ |
0.20 |
|
$ |
0.44 |
|
$ |
0.50 |
|
|
|
|
|
|
|
|
|
|
|
| ||||
|
Weighted average shares outstanding for basic income per share |
|
322,331,850 |
|
318,867,447 |
|
321,289,017 |
|
317,718,150 |
| ||||
|
|
|
|
|
|
|
|
|
|
| ||||
|
Diluted income per share attributable to CBRE Group, Inc. shareholders |
|
|
|
|
|
|
|
|
| ||||
|
Income from continuing operations attributable to CBRE Group, Inc. |
|
$ |
0.12 |
|
$ |
0.20 |
|
$ |
0.44 |
|
$ |
0.49 |
|
|
Income from discontinued operations attributable to CBRE Group, Inc. |
|
— |
|
— |
|
— |
|
— |
| ||||
|
Net income attributable to CBRE Group, Inc. |
|
$ |
0.12 |
|
$ |
0.20 |
|
$ |
0.44 |
|
$ |
0.49 |
|
|
|
|
|
|
|
|
|
|
|
| ||||
|
Weighted average shares outstanding for diluted income per share |
|
327,309,341 |
|
323,714,703 |
|
326,380,448 |
|
323,584,637 |
| ||||
|
|
|
|
|
|
|
|
|
|
| ||||
|
EBITDA (1) |
|
$ |
163,553 |
|
$ |
178,992 |
|
$ |
515,891 |
|
$ |
458,131 |
|
(1) Includes EBITDA related to discontinued operations of $1.9 million for the nine months ended September 30, 2011.
CBRE GROUP, INC.
SEGMENT RESULTS
FOR THE THREE AND NINE MONTHS ENDED SEPTEMBER 30, 2012 AND 2011
(Dollars in thousands)
(Unaudited)
|
|
|
Three Months Ended |
|
Nine Months Ended |
| ||||||||
|
|
|
2012 |
|
2011 |
|
2012 |
|
2011 |
| ||||
|
Americas |
|
|
|
|
|
|
|
|
| ||||
|
Revenue |
|
$ |
996,380 |
|
$ |
954,213 |
|
$ |
2,855,899 |
|
$ |
2,602,156 |
|
|
Costs and expenses: |
|
|
|
|
|
|
|
|
| ||||
|
Cost of services |
|
638,138 |
|
600,168 |
|
1,818,162 |
|
1,644,835 |
| ||||
|
Operating, administrative and other |
|
232,108 |
|
231,181 |
|
665,157 |
|
646,071 |
| ||||
|
Depreciation and amortization |
|
20,744 |
|
15,855 |
|
58,555 |
|
43,517 |
| ||||
|
Operating income |
|
$ |
105,390 |
|
$ |
107,009 |
|
$ |
314,025 |
|
$ |
267,733 |
|
|
EBITDA |
|
$ |
128,749 |
|
$ |
126,156 |
|
$ |
379,304 |
|
$ |
319,659 |
|
|
|
|
|
|
|
|
|
|
|
| ||||
|
EMEA |
|
|
|
|
|
|
|
|
| ||||
|
Revenue |
|
$ |
228,737 |
|
$ |
275,958 |
|
$ |
674,367 |
|
$ |
742,013 |
|
|
Costs and expenses: |
|
|
|
|
|
|
|
|
| ||||
|
Cost of services |
|
150,729 |
|
165,450 |
|
426,486 |
|
452,461 |
| ||||
|
Operating, administrative and other |
|
86,662 |
|
89,853 |
|
248,751 |
|
244,830 |
| ||||
|
Depreciation and amortization |
|
3,181 |
|
3,191 |
|
9,674 |
|
7,706 |
| ||||
|
Non-amortizable intangible asset impairment |
|
19,826 |
|
— |
|
19,826 |
|
— |
| ||||
|
Operating (loss) income |
|
$ |
(31,661 |
) |
$ |
17,464 |
|
$ |
(30,370 |
) |
$ |
37,016 |
|
|
EBITDA |
|
$ |
(8,141 |
) |
$ |
21,089 |
|
$ |
507 |
|
$ |
45,470 |
|
|
|
|
|
|
|
|
|
|
|
| ||||
|
Asia Pacific |
|
|
|
|
|
|
|
|
| ||||
|
Revenue |
|
$ |
199,950 |
|
$ |
208,055 |
|
$ |
568,396 |
|
$ |
557,101 |
|
|
Costs and expenses: |
|
|
|
|
|
|
|
|
| ||||
|
Cost of services |
|
126,378 |
|
128,989 |
|
366,296 |
|
350,888 |
| ||||
|
Operating, administrative and other |
|
56,792 |
|
56,835 |
|
159,433 |
|
152,801 |
| ||||
|
Depreciation and amortization |
|
2,905 |
|
2,979 |
|
8,458 |
|
6,950 |
| ||||
|
Operating income |
|
$ |
13,875 |
|
$ |
19,252 |
|
$ |
34,209 |
|
$ |
46,462 |
|
|
EBITDA |
|
$ |
16,448 |
|
$ |
21,817 |
|
$ |
42,047 |
|
$ |
51,696 |
|
|
|
|
|
|
|
|
|
|
|
| ||||
|
Global Investment Management |
|
|
|
|
|
|
|
|
| ||||
|
Revenue |
|
$ |
114,306 |
|
$ |
77,426 |
|
$ |
359,180 |
|
$ |
185,302 |
|
|
Costs and expenses: |
|
|
|
|
|
|
|
|
| ||||
|
Operating, administrative and other |
|
91,658 |
|
71,770 |
|
282,952 |
|
175,268 |
| ||||
|
Depreciation and amortization |
|
10,524 |
|
6,281 |
|
39,803 |
|
12,947 |
| ||||
|
Gain on disposition of real estate |
|
— |
|
345 |
|
— |
|
345 |
| ||||
|
Operating income (loss) |
|
$ |
12,124 |
|
$ |
(280 |
) |
$ |
36,425 |
|
$ |
(2,568 |
) |
|
EBITDA(1) |
|
$ |
22,658 |
|
$ |
6,154 |
|
$ |
77,925 |
|
$ |
14,614 |
|
|
|
|
|
|
|
|
|
|
|
| ||||
|
Development Services |
|
|
|
|
|
|
|
|
| ||||
|
Revenue |
|
$ |
17,774 |
|
$ |
18,811 |
|
$ |
50,411 |
|
$ |
55,214 |
|
|
Costs and expenses: |
|
|
|
|
|
|
|
|
| ||||
|
Operating, administrative and other |
|
15,142 |
|
19,499 |
|
49,168 |
|
60,049 |
| ||||
|
Depreciation and amortization |
|
2,748 |
|
3,002 |
|
8,405 |
|
8,751 |
| ||||
|
Gain on disposition of real estate |
|
3,983 |
|
3,250 |
|
5,231 |
|
11,249 |
| ||||
|
Operating income (loss) |
|
$ |
3,867 |
|
$ |
(440 |
) |
$ |
(1,931 |
) |
$ |
(2,337 |
) |
|
EBITDA |
|
$ |
3,839 |
|
$ |
3,776 |
|
$ |
16,108 |
|
$ |
26,692 |
|
(1) Includes EBITDA related to discontinued operations of $1.9 million for the nine months ended September 30, 2011.
Non-GAAP Financial Measures
The following measures are considered “non-GAAP financial measures” under SEC guidelines:
(i) Net income attributable to CBRE Group, Inc., as adjusted for selected charges
(ii) Diluted income per share attributable to CBRE Group, Inc, as adjusted for selected charges
(iii) EBITDA and EBITDA, as adjusted for selected charges
The Company believes that these non-GAAP financial measures provide a more complete understanding of ongoing operations and enhance comparability of current results to prior periods as well as presenting the effects of selected charges in all periods presented. The Company believes that investors may find it useful to see these non-GAAP financial measures to analyze financial performance without the impact of selected charges that may obscure trends in the underlying performance of its business.
Net income attributable to CBRE Group, Inc., as adjusted for selected charges and diluted net income per share attributable to CBRE Group, Inc. shareholders, as adjusted for selected charges are calculated as follows (dollars in thousands, except per share data):
|
|
|
Three Months Ended |
|
Nine Months Ended |
| ||||||||
|
|
|
2012 |
|
2011 |
|
2012 |
|
2011 |
| ||||
|
|
|
|
|
|
|
|
|
|
| ||||
|
Net income attributable to CBRE Group, Inc. |
|
$ |
39,709 |
|
$ |
63,807 |
|
$ |
142,557 |
|
$ |
159,399 |
|
|
Non-amortizable intangible asset impairment, net of tax |
|
15,018 |
|
— |
|
15,018 |
|
— |
| ||||
|
Cost containment expenses, net of tax |
|
13,521 |
|
— |
|
13,521 |
|
— |
| ||||
|
Integration and other costs related to acquisitions, net of tax |
|
10,681 |
|
8,390 |
|
25,418 |
|
16,769 |
| ||||
|
Amortization expense related to ING REIM and TCC incentive fees and customer relationships acquired, net of tax |
|
4,623 |
|
1,924 |
|
20,984 |
|
5,528 |
| ||||
|
Write-down of impaired assets, net of tax |
|
— |
|
3,532 |
|
— |
|
3,532 |
| ||||
|
Net income attributable to CBRE Group, Inc., as adjusted |
|
$ |
83,552 |
|
$ |
77,653 |
|
$ |
217,498 |
|
$ |
185,228 |
|
|
|
|
|
|
|
|
|
|
|
| ||||
|
Diluted income per share attributable to CBRE Group, Inc. shareholders, as adjusted |
|
$ |
0.26 |
|
$ |
0.24 |
|
$ |
0.67 |
|
$ |
0.57 |
|
|
|
|
|
|
|
|
|
|
|
| ||||
|
Weighted average shares outstanding for diluted income per share |
|
327,309,341 |
|
323,714,703 |
|
326,380,448 |
|
323,584,637 |
| ||||
EBITDA and EBITDA, as adjusted for selected charges are calculated as follow (dollars in thousands):
|
|
|
Three Months Ended |
|
Nine Months Ended |
| ||||||||
|
|
|
2012 |
|
2011 |
|
2012 |
|
2011 |
| ||||
|
|
|
|
|
|
|
|
|
|
| ||||
|
Net income attributable to CBRE Group, Inc. |
|
$ |
39,709 |
|
$ |
63,807 |
|
$ |
142,557 |
|
$ |
159,399 |
|
|
Add: |
|
|
|
|
|
|
|
|
| ||||
|
Depreciation and amortization(1) |
|
40,102 |
|
31,308 |
|
124,895 |
|
80,396 |
| ||||
|
Non-amortizable intangible asset impairment |
|
19,826 |
|
— |
|
19,826 |
|
— |
| ||||
|
Interest expense(2) |
|
43,651 |
|
39,080 |
|
132,043 |
|
108,367 |
| ||||
|
Provision for income taxes |
|
22,160 |
|
47,290 |
|
102,353 |
|
117,032 |
| ||||
|
Less: |
|
|
|
|
|
|
|
|
| ||||
|
Interest income |
|
1,895 |
|
2,493 |
|
5,783 |
|
7,063 |
| ||||
|
|
|
|
|
|
|
|
|
|
| ||||
|
EBITDA(3) |
|
$ |
163,553 |
|
$ |
178,992 |
|
$ |
515,891 |
|
$ |
458,131 |
|
|
|
|
|
|
|
|
|
|
|
| ||||
|
Adjustments: |
|
|
|
|
|
|
|
|
| ||||
|
Cost containment expenses |
|
17,578 |
|
— |
|
17,578 |
|
— |
| ||||
|
Integration and other costs related to acquisitions |
|
14,215 |
|
9,921 |
|
33,313 |
|
23,704 |
| ||||
|
Write-down of impaired assets |
|
— |
|
5,889 |
|
— |
|
5,889 |
| ||||
|
|
|
|
|
|
|
|
|
|
| ||||
|
EBITDA, as adjusted (3) |
|
$ |
195,346 |
|
$ |
194,802 |
|
$ |
566,782 |
|
$ |
487,724 |
|
|
(1) |
Includes depreciation and amortization related to discontinued operations of $0.5 million for the nine months ended September 30, 2011. |
|
|
|
|
(2) |
Includes interest expense related to discontinued operations of $1.4 million for the nine months ended September 30, 2011. |
|
|
|
|
(3) |
Includes EBITDA related to discontinued operations of $1.9 million for the nine months ended September 30, 2011. |
EBITDA and EBITDA, as adjusted for selected charges for segments are calculated as follows (dollars in thousands):
|
|
|
Three Months Ended |
|
Nine Months Ended |
| ||||||||
|
|
|
2012 |
|
2011 |
|
2012 |
|
2011 |
| ||||
|
Americas |
|
|
|
|
|
|
|
|
| ||||
|
Net income attributable to CBRE Group, Inc. |
|
$ |
48,403 |
|
$ |
54,908 |
|
$ |
142,634 |
|
$ |
136,432 |
|
|
Add: |
|
|
|
|
|
|
|
|
| ||||
|
Depreciation and amortization |
|
20,744 |
|
15,855 |
|
58,555 |
|
43,517 |
| ||||
|
Interest expense |
|
35,403 |
|
30,197 |
|
106,367 |
|
81,769 |
| ||||
|
Royalty and management service income |
|
(6,921 |
) |
(7,188 |
) |
(20,779 |
) |
(20,703 |
) | ||||
|
Provision for income taxes |
|
32,283 |
|
34,196 |
|
96,000 |
|
83,523 |
| ||||
|
Less: |
|
|
|
|
|
|
|
|
| ||||
|
Interest income |
|
1,163 |
|
1,812 |
|
3,473 |
|
4,879 |
| ||||
|
EBITDA |
|
$ |
128,749 |
|
$ |
126,156 |
|
$ |
379,304 |
|
$ |
319,659 |
|
|
Integration and other costs related to acquisitions |
|
— |
|
10 |
|
— |
|
116 |
| ||||
|
EBITDA, as adjusted |
|
$ |
128,749 |
|
$ |
126,166 |
|
$ |
379,304 |
|
$ |
319,775 |
|
|
|
|
|
|
|
|
|
|
|
| ||||
|
EMEA |
|
|
|
|
|
|
|
|
| ||||
|
Net (loss) income attributable to CBRE Group, Inc. |
|
$ |
(17,893 |
) |
$ |
3,929 |
|
$ |
(18,956 |
) |
$ |
14,321 |
|
|
Add: |
|
|
|
|
|
|
|
|
| ||||
|
Depreciation and amortization |
|
3,181 |
|
3,191 |
|
9,674 |
|
7,706 |
| ||||
|
Non-amortizable intangible asset impairment |
|
19,826 |
|
— |
|
19,826 |
|
— |
| ||||
|
Interest expense |
|
2,175 |
|
30 |
|
6,738 |
|
187 |
| ||||
|
Royalty and management service expense |
|
3,182 |
|
3,507 |
|
8,966 |
|
9,660 |
| ||||
|
(Benefit of) provision for income taxes |
|
(13,473 |
) |
10,680 |
|
(11,339 |
) |
14,468 |
| ||||
|
Less: |
|
|
|
|
|
|
|
|
| ||||
|
Interest income |
|
5,139 |
|
248 |
|
14,402 |
|
872 |
| ||||
|
EBITDA |
|
$ |
(8,141 |
) |
$ |
21,089 |
|
$ |
507 |
|
$ |
45,470 |
|
|
Cost containment expenses |
|
15,331 |
|
— |
|
15,331 |
|
— |
| ||||
|
EBITDA, as adjusted |
|
$ |
7,190 |
|
$ |
21,089 |
|
$ |
15,838 |
|
$ |
45,470 |
|
|
|
|
|
|
|
|
|
|
|
| ||||
|
Asia Pacific |
|
|
|
|
|
|
|
|
| ||||
|
Net income attributable to CBRE Group, Inc. |
|
$ |
10,001 |
|
$ |
6,585 |
|
$ |
17,670 |
|
$ |
15,672 |
|
|
Add: |
|
|
|
|
|
|
|
|
| ||||
|
Depreciation and amortization |
|
2,905 |
|
2,979 |
|
8,458 |
|
6,950 |
| ||||
|
Interest expense |
|
1,124 |
|
1,395 |
|
3,188 |
|
2,624 |
| ||||
|
Royalty and management service expense |
|
3,704 |
|
3,468 |
|
11,700 |
|
10,314 |
| ||||
|
(Benefit of) provision for income taxes |
|
(1,182 |
) |
7,550 |
|
1,653 |
|
17,085 |
| ||||
|
Less: |
|
|
|
|
|
|
|
|
| ||||
|
Interest income |
|
104 |
|
160 |
|
622 |
|
949 |
| ||||
|
EBITDA |
|
$ |
16,448 |
|
$ |
21,817 |
|
$ |
42,047 |
|
$ |
51,696 |
|
|
Cost containment expenses |
|
2,247 |
|
— |
|
2,247 |
|
— |
| ||||
|
Integration and other costs related to acquisitions |
|
— |
|
512 |
|
— |
|
1,896 |
| ||||
|
EBITDA, as adjusted |
|
$ |
18,695 |
|
$ |
22,329 |
|
$ |
44,294 |
|
$ |
53,592 |
|
|
|
|
Three Months Ended |
|
Nine Months Ended |
| ||||||||
|
|
|
2012 |
|
2011 |
|
2012 |
|
2011 |
| ||||
|
|
|
|
|
|
|
|
|
|
| ||||
|
Global Investment Management |
|
|
|
|
|
|
|
|
| ||||
|
Net income (loss) attributable to CBRE Group, Inc. |
|
$ |
291 |
|
$ |
(17 |
) |
$ |
1,957 |
|
$ |
(12,249 |
) |
|
Add: |
|
|
|
|
|
|
|
|
| ||||
|
Depreciation and amortization(1) |
|
10,524 |
|
6,281 |
|
39,803 |
|
13,472 |
| ||||
|
Interest expense(2) |
|
7,162 |
|
4,097 |
|
20,981 |
|
14,186 |
| ||||
|
Royalty and management service expense |
|
35 |
|
213 |
|
113 |
|
729 |
| ||||
|
Provision for (benefit of) income taxes |
|
4,966 |
|
(4,156 |
) |
15,911 |
|
(1,223 |
) | ||||
|
Less: |
|
|
|
|
|
|
|
|
| ||||
|
Interest income |
|
320 |
|
264 |
|
840 |
|
301 |
| ||||
|
EBITDA(3) |
|
$ |
22,658 |
|
$ |
6,154 |
|
$ |
77,925 |
|
$ |
14,614 |
|
|
Integration and other costs related to acquisitions |
|
14,215 |
|
9,399 |
|
33,313 |
|
21,692 |
| ||||
|
Write-down of impaired assets |
|
— |
|
4,455 |
|
— |
|
4,455 |
| ||||
|
EBITDA, as adjusted(3) |
|
$ |
36,873 |
|
$ |
20,008 |
|
$ |
111,238 |
|
$ |
40,761 |
|
|
|
|
|
|
|
|
|
|
|
| ||||
|
Development Services |
|
|
|
|
|
|
|
|
| ||||
|
Net (loss) income attributable to CBRE Group, Inc. |
|
$ |
(1,093 |
) |
$ |
(1,598 |
) |
$ |
(748 |
) |
$ |
5,223 |
|
|
Add: |
|
|
|
|
|
|
|
|
| ||||
|
Depreciation and amortization |
|
2,748 |
|
3,002 |
|
8,405 |
|
8,751 |
| ||||
|
Interest expense |
|
2,691 |
|
3,361 |
|
8,602 |
|
9,601 |
| ||||
|
(Benefit of) provision for income taxes |
|
(434 |
) |
(980 |
) |
128 |
|
3,179 |
| ||||
|
Less: |
|
|
|
|
|
|
|
|
| ||||
|
Interest income |
|
73 |
|
9 |
|
279 |
|
62 |
| ||||
|
EBITDA |
|
$ |
3,839 |
|
$ |
3,776 |
|
$ |
16,108 |
|
$ |
26,692 |
|
|
Write-down of impaired assets |
|
— |
|
1,434 |
|
— |
|
1,434 |
| ||||
|
EBITDA, as adjusted |
|
$ |
3,839 |
|
$ |
5,210 |
|
$ |
16,108 |
|
$ |
28,126 |
|
(1) Includes depreciation and amortization related to discontinued operations of $0.5 million for the nine months ended September 30, 2011.
(2) Includes interest expense related to discontinued operations of $1.4 million for the nine months ended September 30, 2011.
(3) Includes EBITDA related to discontinued operations of $1.9 million for the nine months ended September 30, 2011.
CBRE GROUP, INC.
CONDENSED CONSOLIDATED BALANCE SHEETS
(Dollars in thousands)
(Unaudited)
|
|
|
September 30, |
|
December 31, |
| ||
|
|
|
2012 |
|
2011 |
| ||
|
Assets: |
|
|
|
|
| ||
|
Cash and cash equivalents (1) |
|
$ |
776,260 |
|
$ |
1,093,182 |
|
|
Restricted cash |
|
64,600 |
|
67,138 |
| ||
|
Receivables, net |
|
1,127,992 |
|
1,135,371 |
| ||
|
Warehouse receivables (2) |
|
465,794 |
|
720,061 |
| ||
|
Real estate assets (3) |
|
465,369 |
|
464,468 |
| ||
|
Goodwill and other intangibles, net |
|
2,615,027 |
|
2,622,732 |
| ||
|
Investments in and advances to unconsolidated subsidiaries |
|
214,231 |
|
166,832 |
| ||
|
Other assets, net |
|
1,039,504 |
|
949,359 |
| ||
|
Total assets |
|
$ |
6,768,777 |
|
$ |
7,219,143 |
|
|
|
|
|
|
|
| ||
|
Liabilities: |
|
|
|
|
| ||
|
Current liabilities, excluding debt |
|
$ |
1,344,636 |
|
$ |
1,688,034 |
|
|
Warehouse lines of credit (2) |
|
458,306 |
|
713,362 |
| ||
|
Revolving credit facility |
|
72,658 |
|
44,825 |
| ||
|
Senior secured term loans |
|
1,643,308 |
|
1,683,561 |
| ||
|
Senior subordinated notes, net |
|
440,129 |
|
439,016 |
| ||
|
Senior notes |
|
350,000 |
|
350,000 |
| ||
|
Other debt |
|
9,139 |
|
125 |
| ||
|
Notes payable on real estate (4) |
|
365,590 |
|
372,912 |
| ||
|
Other long-term liabilities |
|
565,905 |
|
510,145 |
| ||
|
Total liabilities |
|
5,249,671 |
|
5,801,980 |
| ||
|
|
|
|
|
|
| ||
|
CBRE Group, Inc. stockholders’ equity |
|
1,340,432 |
|
1,151,481 |
| ||
|
Non-controlling interests |
|
178,674 |
|
265,682 |
| ||
|
Total equity |
|
1,519,106 |
|
1,417,163 |
| ||
|
|
|
|
|
|
| ||
|
Total liabilities and equity |
|
$ |
6,768,777 |
|
$ |
7,219,143 |
|
(1) Includes $66.9 million and $208.1 million of cash in consolidated funds and other entities not available for Company use at September 30, 2012 and December 31, 2011, respectively.
(2) Represents loan receivables, the majority of which are offset by related warehouse lines of credit facilities.
(3) Includes real estate and other assets held for sale, real estate under development and real estate held for investment.
(4) Represents notes payable on real estate of which $13.6 million are recourse to the Company as of both September 30, 2012 and December 31, 2011.