Exhibit 99.1
|
|
|
|
PRESS RELEASE |
Corporate Headquarters 11150 Santa Monica Boulevard Suite 1600 Los Angeles, CA 90025 www.cbre.com |

FOR IMMEDIATE RELEASE
|
For further information: Gil Borok Chief Financial Officer 310.405.8909 |
Nick Kormeluk Investor Relations 949.809.4308 |
Steve Iaco Corporate Communications 212.984.6535 |
CB RICHARD ELLIS GROUP, INC. REPORTS STRONG EARNINGS
AND REVENUE GROWTH FOR FIRST QUARTER 2011
EARNINGS PER SHARE RISE TO $0.13 FROM $0.01 IN 2010 FIRST QUARTER
REVENUE INCREASES 16% TO $1.2 BILLION
Los Angeles, CA — April 26, 2011 — CB Richard Ellis Group, Inc. (NYSE:CBG) today reported strong earnings and revenue growth for the first quarter ended March 31, 2011.
· Net income on a U.S. GAAP basis improved sharply to $34.4 million, or $0.11 per diluted share, for the first quarter of 2011, compared with a net loss of $6.6 million, or $0.02 per diluted share, for the first quarter of 2010.
· Excluding selected charges(1), net income(2) would have totaled $40.6 million, or $0.13 per diluted share, for the current-year quarter, a significant increase from $3.2 million, or $0.01 per diluted share, in the first quarter of 2010.
· Earnings Before Interest Taxes Depreciation and Amortization (EBITDA)(3) rose 51% to $113.0 million for the first quarter of 2011 from $75.0 million a year earlier. Excluding selected charges, EBITDA(3) rose 38% to $120.6 million in the current period from $87.5 million in the prior-year first quarter.
· Revenue for the quarter totaled $1.2 billion, an increase of 16% from $1.0 billion in the first quarter of 2010.
Management Commentary
“Our results for the quarter reflect a very nice start for the year, with earnings per share and normalized EBITDA showing exceptional growth. This is particularly significant because the first quarter typically sets the tone for the rest of the year and historically is our seasonally weakest quarter,” said Brett White, CB Richard Ellis’ chief executive officer. “We are also pleased to have delivered strong EBITDA growth versus last year and to have achieved a double-digit normalized EBITDA margin.
“This year’s strong first quarter comes against a backdrop of steadily improving market fundamentals globally. The well-balanced, broadly diversified services platform we have built — across business lines and geographies — has positioned us well to serve clients and grow our business base during the current rebound. Looking ahead, general market trends remain favorable with rising transaction activity and improving fundamentals across most of the world.”
Outsourcing grew strongly. The 14% revenue increase was the best year-over-year growth rate for this business line since the third quarter of 2008. The Company also set a new record by signing 44 long-term outsourcing contracts with new and existing clients. An initiative to focus on health care and government institutions continued to pay dividends as the Company added six new outsourcing clients from these sectors during the quarter. Overall, CB Richard Ellis added 13 new outsourcing customers and expanded or renewed 31 existing clients.
Global property sales also grew robustly. Sales revenue rose 34% compared with a year ago as capital flows continued to improve and credit standards returned to historically normal levels. Reflecting the increased capital availability, mortgage brokerage revenue rose 79% from the first quarter of 2010, as U.S. loan origination volume nearly tripled from the depressed level of last year’s first quarter.
Global leasing revenue rose 8% during the quarter, posting solid gains on top of the 23% growth rate experienced in the first quarter of 2010, as employment continues to slowly recover.
Geographically, Asia-Pacific was the Company’s fastest-growing region, posting a 19% revenue increase. This growth was fueled by strong business performance in China, India, Japan and Singapore. The natural disaster and its aftermath did not materially affect the Company’s performance in Japan during the quarter, and is not expected to have a notable impact going forward. The Americas — the Company’s largest region — also grew strongly with revenue rising 16% overall. Revenue rose by double-digits in nearly all Americas business lines. Revenue grew by 9% in EMEA as rapidly accelerated outsourcing gains were partially offset by slower property sales and leasing activity, primarily in the U.K.
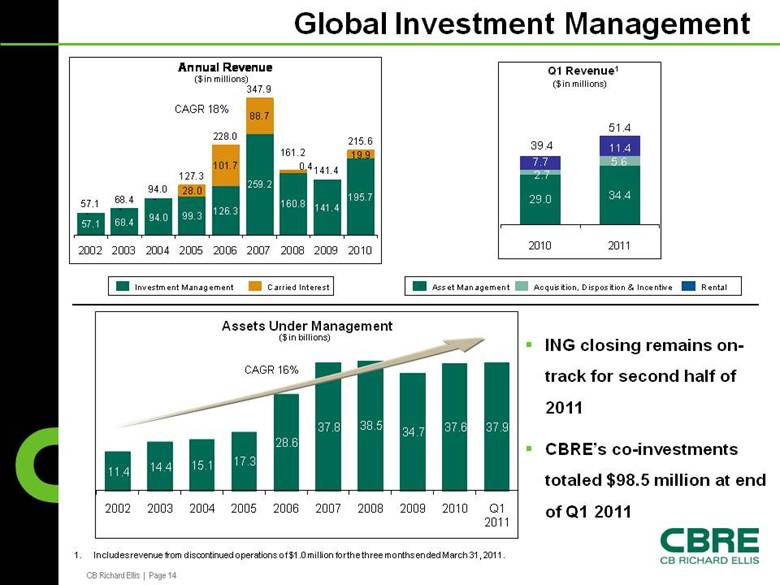
Improved investment market conditions also contributed to a 28% rise in revenue from the Company’s global investment management business during the quarter. CB Richard Ellis’ planned acquisition of the majority of ING Group’s real estate investment management businesses (ING REIM) continues to progress on schedule with closing expected, as previously announced, in the second half of this year. During the quarter, the Company secured $800 million of new delayed-draw term loans, which we anticipate using, along with cash on hand, to finance the acquisition.
Interest expense decreased by $16.1 million in the first quarter of 2011 versus the first quarter of 2010, due to a net reduction in outstanding debt in the second half of 2010.
First-Quarter 2011 Segment Results
Americas Region (U.S., Canada and Latin America)
· Revenue rose 16% to $750.1 million, compared with $645.6 million for the first quarter of 2010.
· Operating income rose 37% to $62.5 million from $45.8 million for the prior-year first quarter.
· EBITDA totaled $78.1 million, up 26% from $62.0 million in last year’s first quarter.
· The region saw double-digit revenue growth across most business lines.
EMEA Region (primarily Europe)
· Revenue rose 9% to $205.0 million from $188.2 million for the first quarter of 2010. The increase was driven by growth in France, Germany, Italy, Russia and the U.K.
· Operating income totaled $0.7 million compared with $1.3 million for the same period in 2010.
· EBITDA totaled $3.0 million compared with $4.1 million in last year’s first quarter.
· Current-period results continue to reflect the recruitment and on-boarding of fee-earners to support new initiatives and recently won contracts that have yet to translate into meaningful revenue. The benefits of these investments should be realized as the year progresses.
Asia Pacific Region (Asia, Australia and New Zealand)
· Revenue rose 19% to $160.5 million from $134.4 million for the first quarter of 2010.
· Operating income rose 83% to $11.3 million, compared with $6.2 million for the first quarter of 2010.
· EBITDA increased 51% to $12.4 million compared with $8.3 million for last year’s first quarter.
· The improved results reflect higher revenue and profitability in several countries, particularly China, Japan and Singapore.
Global Investment Management Business (investment management operations in the U.S., Europe and Asia)
· Revenue increased 28% to $50.3 million from $39.4 million in the first quarter of 2010 largely driven by higher asset management and acquisition fees in the current-year period.
· Operating income totaled $1.3 million, an improvement from an operating loss of $4.4 million in the same period of 2010.
· EBITDA improved significantly to $6.0 million from an EBITDA loss of $4.9 million in the prior-year quarter. Prior-year EBITDA included $4.5 million of net non-cash write-downs of property investments, which were not included in the 2010 operating loss.
· Current-year operating results include $7.5 million of costs associated with the anticipated acquisition of ING REIM.
· Assets under management totaled $37.9 billion at the end of the first quarter of 2011, up 1% from year-end 2010 and 14% from the first quarter of 2010.
Development Services (real estate development and investment activities primarily in the U.S.)
· Revenue rose 5% to $19.2 million, compared with $18.3 million for the first quarter of 2010.
· Operating loss narrowed to $2.6 million as compared with $3.2 million for the same period in 2010.
· EBITDA increased to $13.5 million compared with EBITDA of $5.5 million in the prior-year first quarter.
· Improved EBITDA in the current-year period was primarily driven by higher equity earnings associated with gains on property sales, which is not included in the operating loss.
· Development projects in process totaled $4.9 billion, unchanged from year-end 2010 and up $0.2 billion from the first quarter of 2010. The inventory of pipeline deals rose to $1.5 billion, up $0.3 billion from year-end 2010 and $0.6 billion from the first quarter of 2010.
Conference Call Details
The Company’s first-quarter earnings conference call will be held on Wednesday, April 27, 2011 at 10:30 a.m. Eastern Time. A live webcast will be accessible through the Investor Relations section of the Company’s Web site at www.cbre.com/investorrelations.
The direct dial-in number for the conference call is 800-398-9398 for U.S. callers and 612-332-0523 for international callers. A replay of the call will be available starting at 1 p.m. Eastern Time on April 27, 2011, and ending at midnight Eastern Time on May 3, 2011. The dial-in number for the replay is 800-475-6701 for U.S. callers and 320-365-3844 for international callers. The access code for the replay is 201786. A transcript of the call will be available on the Company’s Investor Relations Web site at www.cbre.com/investorrelations.
About CB Richard Ellis
CB Richard Ellis Group, Inc. (NYSE:CBG), a Fortune 500 and S&P 500 company headquartered in Los Angeles, is the world’s largest commercial real estate services firm (in terms of 2010 revenue). The Company has approximately 31,000 employees (excluding affiliates), and serves real estate owners, investors and occupiers through more than 300 offices (excluding affiliates) worldwide. CB Richard Ellis offers strategic advice and execution for property sales and leasing; corporate services; property, facilities and project management; mortgage banking; appraisal and valuation; development services; investment management; and research and consulting. Please visit our Web site at www.cbre.com.
Note: This release contains forward-looking statements within the meaning of the “safe harbor” provisions of the Private Securities Litigation Reform Act of 1995, including statements regarding our future growth momentum, operations, financial performance, business outlook and ability to complete and integrate our announced acquisition of ING REIM. These forward-looking statements involve known and unknown risks, uncertainties and other factors that may cause the Company’s actual results and performance in future periods to be materially different from any future results or performance suggested in forward-looking statements in this release. Any forward-looking statements speak only as of the date of this release and, except to the extent required by applicable securities laws, the Company expressly disclaims any obligation to update or revise any of them to reflect actual results, any changes in expectations or any change in events. If the Company does update one or more forward-looking statements, no inference should be drawn that it will make additional updates with respect to those or other forward-looking statements. Factors that could cause results to differ materially include, but are not limited to: general conditions of financial liquidity for real estate transactions; our leverage and our ability to perform under our credit facilities; commercial real estate vacancy levels; employment conditions and their effect on vacancy rates; property values; rental rates; interest rates; realization of values in investment funds to offset related incentive compensation expense; our ability to leverage our platform to grow revenues and capture market share; our ability to retain and incentivize producers; our ability to identify, acquire and integrate synergistic and accretive businesses; a decline in asset values in, or a reduction in earnings or cash flow from, our investment programs, as well as related litigation, liabilities and reputational harm; and our ability to comply with laws and regulations related to our international operations, including the anti-corruption laws of the U.S. and other countries.
Additional information concerning factors that may influence the Company’s financial information is discussed under “Risk Factors”, “Management’s Discussion and Analysis of Financial Condition and Results of Operations”, “Quantitative and Qualitative Disclosures About Market Risk” and “Forward-Looking Statements” in our Annual Report on Form 10-K for the year ended December 31, 2010 as well as in the Company’s press releases and other periodic filings with the Securities and Exchange Commission. Such filings are available publicly and may be obtained on the Company’s Web site at www.cbre.com or upon written request from the CB Richard Ellis Investor Relations Department at investorrelations@cbre.com.
(1) Selected charges include integration and other costs related to acquisitions, amortization expense related to customer relationships acquired, cost containment expenses and the write-down of impaired assets.
(2) A reconciliation of net income (loss) attributable to CB Richard Ellis Group, Inc. to net income attributable to CB Richard Ellis Group, Inc., as adjusted for selected charges, is provided in the section of this press release entitled “Non-GAAP Financial Measures.”
(3) The Company’s management believes that EBITDA is useful in evaluating its operating performance compared to that of other companies in its industry because the calculation of EBITDA generally eliminates the effects of financing and income taxes and the accounting effects of capital spending and acquisitions, which items may vary for different companies for reasons unrelated to overall operating performance. As a result, the Company’s management uses EBITDA as a measure to evaluate the operating performance of various business segments and for other discretionary purposes, including as a significant component when measuring its operating performance under its employee incentive programs. Additionally, management believes EBITDA is useful to investors to assist them in getting a more accurate picture of the Company’s results from operations.
However, EBITDA is not a recognized measurement under U.S. generally accepted accounting principles (GAAP), and when analyzing the Company’s operating performance, readers should use EBITDA in addition to, and not as an alternative for, net income determined in accordance with GAAP. Because not all companies use identical calculations, the Company’s presentation of EBITDA may not be comparable to similarly titled measures of other companies. Furthermore, EBITDA is not intended to be a measure of free cash flow for management’s discretionary use, as it does not consider certain cash requirements such as tax and debt service payments. The amounts shown for EBITDA also differ from the amounts calculated under similarly titled definitions in the Company’s debt instruments, which are further adjusted to reflect certain other cash and non-cash charges and are used to determine compliance with financial covenants and the Company’s ability to engage in certain activities, such as incurring additional debt and making certain restricted payments. Amounts shown for EBITDA, as adjusted (or normalized EBITDA), remove the impact of certain cash and non-cash charges related to acquisitions, cost containment and asset impairments that occur from time to time.
For a reconciliation of EBITDA and EBITDA, as adjusted to net income (loss) attributable to CB Richard Ellis Group, Inc., the most comparable financial measure calculated and presented in accordance with GAAP, see the section of this press release titled “Non-GAAP Financial Measures.”
CB RICHARD ELLIS GROUP, INC.
OPERATING RESULTS
FOR THE THREE MONTHS ENDED MARCH 31, 2011 AND 2010
(Dollars in thousands, except share data)
(Unaudited)
|
|
|
Three Months Ended |
| ||||
|
|
|
2011 |
|
2010 |
| ||
|
Revenue |
|
$ |
1,185,105 |
|
$ |
1,025,883 |
|
|
|
|
|
|
|
| ||
|
Costs and expenses: |
|
|
|
|
| ||
|
Cost of services |
|
713,755 |
|
615,194 |
| ||
|
Operating, administrative and other |
|
377,025 |
|
338,706 |
| ||
|
Depreciation and amortization |
|
23,178 |
|
26,295 |
| ||
|
Total costs and expenses |
|
1,113,958 |
|
980,195 |
| ||
|
|
|
|
|
|
| ||
|
Gain on disposition of real estate |
|
1,972 |
|
— |
| ||
|
|
|
|
|
|
| ||
|
Operating income |
|
73,119 |
|
45,688 |
| ||
|
Equity income (loss) from unconsolidated subsidiaries |
|
15,179 |
|
(6,584 |
) | ||
|
Interest income |
|
2,668 |
|
1,800 |
| ||
|
Interest expense |
|
33,718 |
|
49,792 |
| ||
|
|
|
|
|
|
| ||
|
Income (loss) from continuing operations before provision for income taxes |
|
57,248 |
|
(8,888 |
) | ||
|
Provision for income taxes |
|
23,406 |
|
7,299 |
| ||
|
|
|
|
|
|
| ||
|
Income (loss) from continuing operations |
|
33,842 |
|
(16,187 |
) | ||
|
Income from discontinued operations, net of income taxes |
|
10,644 |
|
— |
| ||
|
Net income (loss) |
|
44,486 |
|
(16,187 |
) | ||
|
Less: Net income (loss) attributable to non-controlling interests |
|
10,117 |
|
(9,560 |
) | ||
|
Net income (loss) attributable to CB Richard Ellis Group, Inc. |
|
$ |
34,369 |
|
$ |
(6,627 |
) |
|
|
|
|
|
|
| ||
|
Basic income(loss) per share attributable to CB Richard Ellis Group, Inc. shareholders |
|
|
|
|
| ||
|
Income (loss) from continuing operations attributable to CB Richard Ellis Group, Inc. |
|
$ |
0.11 |
|
$ |
(0.02 |
) |
|
Income from discontinued operations attributable to CB Richard Ellis Group, Inc. |
|
— |
|
— |
| ||
|
Net income (loss) attributable to CB Richard Ellis Group, Inc. |
|
$ |
0.11 |
|
$ |
(0.02 |
) |
|
|
|
|
|
|
| ||
|
Weighted average shares outstanding for basic income (loss) per share |
|
316,563,392 |
|
312,879,640 |
| ||
|
|
|
|
|
|
| ||
|
Diluted income (loss) per share attributable to CB Richard Ellis Group, Inc. shareholders |
|
|
|
|
| ||
|
Income (loss) from continuing operations attributable to CB Richard Ellis Group, Inc. |
|
$ |
0.11 |
|
$ |
(0.02 |
) |
|
Income from discontinued operations attributable to CB Richard Ellis Group, Inc. |
|
— |
|
— |
| ||
|
Net income (loss) attributable to CB Richard Ellis Group, Inc. |
|
$ |
0.11 |
|
$ |
(0.02 |
) |
|
|
|
|
|
|
| ||
|
Weighted average shares outstanding for diluted income (loss) per share |
|
322,920,829 |
|
312,879,640 |
| ||
|
|
|
|
|
|
| ||
|
EBITDA (1) |
|
$ |
113,044 |
|
$ |
74,959 |
|
(1) Includes EBITDA related to discontinued operations of $1.0 million for the three months ended March 31, 2011.
CB RICHARD ELLIS GROUP, INC.
SEGMENT RESULTS
FOR THE THREE MONTHS ENDED MARCH 31, 2011 AND 2010
(Dollars in thousands)
(Unaudited)
|
|
|
Three Months Ended |
| ||||
|
|
|
2011 |
|
2010 |
| ||
|
Americas |
|
|
|
|
| ||
|
Revenue |
|
$ |
750,115 |
|
$ |
645,611 |
|
|
Costs and expenses: |
|
|
|
|
| ||
|
Cost of services |
|
477,329 |
|
410,287 |
| ||
|
Operating, administrative and other |
|
197,417 |
|
174,841 |
| ||
|
Depreciation and amortization |
|
12,831 |
|
14,690 |
| ||
|
Operating income |
|
$ |
62,538 |
|
$ |
45,793 |
|
|
EBITDA |
|
$ |
78,128 |
|
$ |
61,988 |
|
|
|
|
|
|
|
| ||
|
EMEA |
|
|
|
|
| ||
|
Revenue |
|
$ |
204,968 |
|
$ |
188,160 |
|
|
Costs and expenses: |
|
|
|
|
| ||
|
Cost of services |
|
131,273 |
|
119,451 |
| ||
|
Operating, administrative and other |
|
70,782 |
|
64,976 |
| ||
|
Depreciation and amortization |
|
2,262 |
|
2,390 |
| ||
|
Operating income |
|
$ |
651 |
|
$ |
1,343 |
|
|
EBITDA |
|
$ |
3,006 |
|
$ |
4,125 |
|
|
|
|
|
|
|
| ||
|
Asia Pacific |
|
|
|
|
| ||
|
Revenue |
|
$ |
160,500 |
|
$ |
134,432 |
|
|
Costs and expenses: |
|
|
|
|
| ||
|
Cost of services |
|
105,153 |
|
85,456 |
| ||
|
Operating, administrative and other |
|
42,104 |
|
40,705 |
| ||
|
Depreciation and amortization |
|
1,983 |
|
2,112 |
| ||
|
Operating income |
|
$ |
11,260 |
|
$ |
6,159 |
|
|
EBITDA |
|
$ |
12,442 |
|
$ |
8,258 |
|
|
|
|
|
|
|
| ||
|
Global Investment Management |
|
|
|
|
| ||
|
Revenue |
|
$ |
50,322 |
|
$ |
39,407 |
|
|
Costs and expenses: |
|
|
|
|
| ||
|
Operating, administrative and other |
|
45,556 |
|
40,939 |
| ||
|
Depreciation and amortization |
|
3,495 |
|
2,857 |
| ||
|
Operating income (loss) |
|
$ |
1,271 |
|
$ |
(4,389 |
) |
|
EBITDA (1) |
|
$ |
5,990 |
|
$ |
(4,930 |
) |
|
|
|
|
|
|
| ||
|
Development Services |
|
|
|
|
| ||
|
Revenue |
|
$ |
19,200 |
|
$ |
18,273 |
|
|
Costs and expenses: |
|
|
|
|
| ||
|
Operating, administrative and other |
|
21,166 |
|
17,245 |
| ||
|
Depreciation and amortization |
|
2,607 |
|
4,246 |
| ||
|
Gain on disposition of real estate |
|
1,972 |
|
— |
| ||
|
Operating loss |
|
$ |
(2,601 |
) |
$ |
(3,218 |
) |
|
EBITDA |
|
$ |
13,478 |
|
$ |
5,518 |
|
(1) Includes EBITDA related to discontinued operations of $1.0 million for the three months ended March 31, 2011.
Non-GAAP Financial Measures
The following measures are considered “non-GAAP financial measures” under SEC guidelines:
(i) Net income attributable to CB Richard Ellis Group, Inc., as adjusted for selected charges
(ii) Diluted income per share attributable to CB Richard Ellis Group, Inc, as adjusted for selected charges
(iii) EBITDA and EBITDA, as adjusted for selected charges
The Company believes that these non-GAAP financial measures provide a more complete understanding of ongoing operations and enhance comparability of current results to prior periods as well as presenting the effects of selected charges in all periods presented. The Company believes that investors may find it useful to see these non-GAAP financial measures to analyze financial performance without the impact of selected charges that may obscure trends in the underlying performance of its business.
Net income attributable to CB Richard Ellis Group, Inc., as adjusted for selected charges and diluted net income per share attributable to CB Richard Ellis Group, Inc. shareholders, as adjusted for selected charges are calculated as follows (dollars in thousands, except per share data):
|
|
|
Three Months Ended |
| ||||
|
|
|
2011 |
|
2010 |
| ||
|
|
|
|
|
|
| ||
|
Net income (loss) attributable to CB Richard Ellis Group, Inc. |
|
$ |
34,369 |
|
$ |
(6,627 |
) |
|
Integration and other costs related to acquisitions, net of tax |
|
4,469 |
|
642 |
| ||
|
Amortization expense related to customer relationships acquired, net of tax |
|
1,764 |
|
1,890 |
| ||
|
Cost containment expenses, net of tax |
|
— |
|
4,487 |
| ||
|
Write-down of impaired assets, net of tax |
|
— |
|
2,840 |
| ||
|
Net income attributable to CB Richard Ellis Group, Inc., as adjusted |
|
$ |
40,602 |
|
$ |
3,232 |
|
|
|
|
|
|
|
| ||
|
Diluted income per share attributable to CB Richard Ellis Group, Inc. shareholders, as adjusted |
|
$ |
0.13 |
|
$ |
0.01 |
|
|
|
|
|
|
|
| ||
|
Weighted average shares outstanding for diluted income per share |
|
322,920,829 |
|
317,048,290 |
| ||
EBITDA and EBITDA, as adjusted for selected charges are calculated as follows (dollars in thousands):
|
|
|
Three Months Ended |
| ||||
|
|
|
2011 |
|
2010 |
| ||
|
|
|
|
|
|
| ||
|
Net income (loss) attributable to CB Richard Ellis Group, Inc. |
|
$ |
34,369 |
|
$ |
(6,627 |
) |
|
Add: |
|
|
|
|
| ||
|
Depreciation and amortization(1) |
|
23,469 |
|
26,295 |
| ||
|
Interest expense(2) |
|
34,468 |
|
49,792 |
| ||
|
Provision for income taxes |
|
23,406 |
|
7,299 |
| ||
|
Less: |
|
|
|
|
| ||
|
Interest income |
|
2,668 |
|
1,800 |
| ||
|
|
|
|
|
|
| ||
|
EBITDA(3) |
|
113,044 |
|
74,959 |
| ||
|
|
|
|
|
|
| ||
|
Adjustments: |
|
|
|
|
| ||
|
Integration and other costs related to acquisitions |
|
7,511 |
|
1,006 |
| ||
|
Cost containment expenses |
|
— |
|
7,035 |
| ||
|
Write-down of impaired assets |
|
— |
|
4,453 |
| ||
|
|
|
|
|
|
| ||
|
EBITDA, as adjusted(3) |
|
$ |
120,555 |
|
$ |
87,453 |
|
|
(1) |
Includes depreciation and amortization related to discontinued operations of $0.3 million for the three months ended March 31, 2011. |
|
(2) |
Includes interest expense related to discontinued operations of $0.7 million for the three months ended March 31, 2011. |
|
(3) |
Includes EBITDA related to discontinued operations of $1.0 million for the three months ended March 31, 2011. |
EBITDA for segments is calculated as follows (dollars in thousands):
|
|
|
Three Months Ended |
| ||||
|
|
|
2011 |
|
2010 |
| ||
|
Americas |
|
|
|
|
| ||
|
Net income attributable to CB Richard Ellis Group, Inc. |
|
$ |
29,509 |
|
$ |
2,546 |
|
|
Add: |
|
|
|
|
| ||
|
Depreciation and amortization |
|
12,831 |
|
14,690 |
| ||
|
Interest expense |
|
25,832 |
|
39,714 |
| ||
|
Royalty and management service income |
|
(6,620 |
) |
(4,145 |
) | ||
|
Provision for income taxes |
|
18,376 |
|
10,369 |
| ||
|
Less: |
|
|
|
|
| ||
|
Interest income |
|
1,800 |
|
1,186 |
| ||
|
EBITDA |
|
$ |
78,128 |
|
$ |
61,988 |
|
|
|
|
|
|
|
| ||
|
EMEA |
|
|
|
|
| ||
|
Net (loss) income attributable to CB Richard Ellis Group, Inc. |
|
$ |
(149 |
) |
$ |
972 |
|
|
Add: |
|
|
|
|
| ||
|
Depreciation and amortization |
|
2,262 |
|
2,390 |
| ||
|
Interest expense |
|
139 |
|
89 |
| ||
|
Royalty and management service expense |
|
2,731 |
|
2,212 |
| ||
|
Benefit of income taxes |
|
(1,460 |
) |
(1,205 |
) | ||
|
Less: |
|
|
|
|
| ||
|
Interest income |
|
517 |
|
333 |
| ||
|
EBITDA |
|
$ |
3,006 |
|
$ |
4,125 |
|
|
|
|
|
|
|
| ||
|
Asia Pacific |
|
|
|
|
| ||
|
Net income attributable to CB Richard Ellis Group, Inc. |
|
$ |
2,901 |
|
$ |
743 |
|
|
Add: |
|
|
|
|
| ||
|
Depreciation and amortization |
|
1,983 |
|
2,112 |
| ||
|
Interest expense |
|
420 |
|
557 |
| ||
|
Royalty and management service expense |
|
3,607 |
|
1,793 |
| ||
|
Provision for income taxes |
|
3,790 |
|
3,200 |
| ||
|
Less: |
|
|
|
|
| ||
|
Interest income |
|
259 |
|
147 |
| ||
|
EBITDA |
|
$ |
12,442 |
|
$ |
8,258 |
|
|
|
|
|
|
|
| ||
|
Global Investment Management |
|
|
|
|
| ||
|
Net loss attributable to CB Richard Ellis Group, Inc. |
|
$ |
(2,455 |
) |
$ |
(8,468 |
) |
|
Add: |
|
|
|
|
| ||
|
Depreciation and amortization(1) |
|
3,786 |
|
2,857 |
| ||
|
Interest expense(2) |
|
4,590 |
|
4,415 |
| ||
|
Royalty and management service expense |
|
282 |
|
140 |
| ||
|
Benefit of income taxes |
|
(160 |
) |
(3,762 |
) | ||
|
Less: |
|
|
|
|
| ||
|
Interest income |
|
53 |
|
112 |
| ||
|
EBITDA(3) |
|
$ |
5,990 |
|
$ |
(4,930 |
) |
|
|
|
|
|
|
| ||
|
Development Services |
|
|
|
|
| ||
|
Net income (loss) attributable to CB Richard Ellis Group, Inc. |
|
$ |
4,563 |
|
$ |
(2,420 |
) |
|
Add: |
|
|
|
|
| ||
|
Depreciation and amortization |
|
2,607 |
|
4,246 |
| ||
|
Interest expense |
|
3,487 |
|
5,017 |
| ||
|
Provision for (benefit of) income taxes |
|
2,860 |
|
(1,303 |
) | ||
|
Less: |
|
|
|
|
| ||
|
Interest income |
|
39 |
|
22 |
| ||
|
EBITDA |
|
$ |
13,478 |
|
$ |
5,518 |
|
|
(1) |
Includes depreciation and amortization related to discontinued operations of $0.3 million for the three months ended March 31, 2011. |
|
(2) |
Includes interest expense related to discontinued operations of $0.7 million for the three months ended March 31, 2011. |
|
(3) |
Includes EBITDA related to discontinued operations of $1.0 million for the three months ended March 31, 2011. |
CB RICHARD ELLIS GROUP, INC.
CONDENSED CONSOLIDATED BALANCE SHEETS
(Dollars in thousands)
(Unaudited)
|
|
|
March 31, |
|
December 31, |
| ||
|
|
|
2011 |
|
2010 |
| ||
|
Assets: |
|
|
|
|
| ||
|
Cash and cash equivalents |
|
$ |
427,645 |
|
$ |
506,574 |
|
|
Restricted cash |
|
46,533 |
|
52,257 |
| ||
|
Receivables, net |
|
889,076 |
|
940,167 |
| ||
|
Warehouse receivables (1) |
|
285,673 |
|
485,433 |
| ||
|
Real estate assets (2) |
|
693,674 |
|
755,509 |
| ||
|
Goodwill and other intangibles, net |
|
1,674,608 |
|
1,656,656 |
| ||
|
Investments in and advances to unconsolidated subsidiaries |
|
146,799 |
|
138,973 |
| ||
|
Other assets, net |
|
628,890 |
|
585,999 |
| ||
|
Total assets |
|
$ |
4,792,898 |
|
$ |
5,121,568 |
|
|
Liabilities: |
|
|
|
|
| ||
|
Current liabilities, excluding debt |
|
$ |
1,060,971 |
|
$ |
1,281,452 |
|
|
Warehouse lines of credit (1) |
|
277,676 |
|
453,835 |
| ||
|
Revolving credit facility |
|
60,690 |
|
17,516 |
| ||
|
Senior secured term loans |
|
631,000 |
|
640,500 |
| ||
|
Senior subordinated notes, net |
|
438,001 |
|
437,682 |
| ||
|
Senior notes |
|
350,000 |
|
350,000 |
| ||
|
Other debt |
|
117 |
|
156 |
| ||
|
Notes payable on real estate (3) |
|
571,440 |
|
627,528 |
| ||
|
Other long-term liabilities |
|
253,858 |
|
247,104 |
| ||
|
Total liabilities |
|
3,643,753 |
|
4,055,773 |
| ||
|
|
|
|
|
|
| ||
|
CB Richard Ellis Group, Inc. stockholders’ equity |
|
996,510 |
|
908,215 |
| ||
|
Non-controlling interests |
|
152,635 |
|
157,580 |
| ||
|
Total equity |
|
1,149,145 |
|
1,065,795 |
| ||
|
|
|
|
|
|
| ||
|
Total liabilities and equity |
|
$ |
4,792,898 |
|
$ |
5,121,568 |
|
|
(1) |
Represents loan receivables, the majority of which are offset by the related non-recourse warehouse line of credit facility. |
|
(2) |
Includes real estate and other assets held for sale, real estate under development and real estate held for investment. |
|
(3) |
Represents notes payable on real estate of which $13.6 million and $3.7 million are recourse to the Company as of March 31, 2011 and December 31, 2010, respectively. |