 |
JANUARY 31, 2024 |
2024 Semi-Annual Report (Unaudited) | ||
BlackRock Investment Quality Municipal Trust, Inc. (BKN)
BlackRock Municipal Income Trust (BFK)
BlackRock Municipal Income Trust II (BLE)
BlackRock MuniHoldings Fund, Inc. (MHD)
BlackRock MuniVest Fund, Inc. (MVF)
BlackRock MuniVest Fund II, Inc. (MVT)
BlackRock MuniYield Quality Fund II, Inc. (MQT)
Not FDIC Insured • May Lose Value • No Bank Guarantee |
The Markets in Review
Dear Shareholder,
The combination of continued economic growth and cooling inflation provided a supportive backdrop for investors during the 12-month reporting period ended January 31, 2024. Significantly tighter monetary policy helped to rein in inflation, and the Consumer Price Index decelerated substantially in the first half of the period before stalling between 3% and 4% in the second half. A moderating labor market helped ease inflationary pressure, although wages continued to grow. Wage and job growth powered robust consumer spending, backstopping the economy. On October 7, 2023, Hamas launched a horrific attack on Israel. The ensuing war will have a significant humanitarian impact and could lead to heightened economic and market volatility. We see geopolitics as a structural market risk going forward. See our geopolitical risk dashboard at blackrock.com for more details.
Equity returns were robust during the period, as interest rates stabilized and the economy proved to be more resilient than many investors expected. The U.S. economy continued to show strength, and growth further accelerated in the second half of 2023. Large-capitalization U.S. stocks posted particularly substantial gains, supported by the performance of a few notable technology companies, while small-capitalization U.S. stocks advanced at a significantly slower pace. Meanwhile, international developed market equities also gained, while emerging market stocks declined overall.
The 10-year U.S. Treasury yield rose during the reporting period, driving its price down, as investors reacted to elevated inflation and attempted to anticipate future interest rate changes. However, shorter-duration U.S. Treasuries gained, as higher yields boosted returns. The corporate bond market benefited from improving economic sentiment, although high-yield corporate bond prices fared significantly better than investment-grade bonds as demand from yield-seeking investors remained strong.
The U.S. Federal Reserve (the “Fed”), attempting to manage persistent inflation, raised interest rates four times during the 12-month period, but paused its tightening in the second half of the period. The Fed also wound down its bond-buying programs and incrementally reduced its balance sheet by not replacing securities that reach maturity.
Supply constraints appear to have become an embedded feature of the new macroeconomic environment, making it difficult for developed economies to increase production without sparking higher inflation. Geopolitical fragmentation and an aging population risk further exacerbating these constraints, keeping the labor market tight and wage growth high. Although the Fed has stopped tightening for now, we believe that the new economic regime means that the Fed will need to maintain high rates for an extended period despite the market’s hopes for interest rate cuts, as reflected in the recent rally. In this new regime, we anticipate greater volatility and dispersion of returns, creating more opportunities for selective portfolio management.
Looking at developed market stocks, we have an overweight stance on U.S. stocks overall, particularly given the promise of emerging AI technologies. We are also overweight Japanese stocks as shareholder-friendly policies generate increased investor interest, although we maintain an underweight stance on European stocks. In credit, there are selective opportunities in the near term despite tighter credit and financial conditions. For fixed income investing with a six- to twelve-month horizon, we see the most attractive investments in short-term U.S. Treasuries and hard-currency emerging market bonds.
Overall, our view is that investors need to think globally, position themselves to be prepared for a decarbonizing economy, and be nimble as market conditions change. We encourage you to talk with your financial advisor and visit for further insight about investing in today’s markets.
blackrock.com
Sincerely,

Rob Kapito
President, BlackRock Advisors, LLC

Rob Kapito
President, BlackRock Advisors, LLC
Total Returns as of January 31, 2024 |
||||||||
6-Month |
12-Month |
|||||||
U.S. large cap equities (S&P 500 ® Index) |
6.43% | 20.82% | ||||||
U.S. small cap equities (Russell 2000 ® Index) |
(2.02) | 2.40 | ||||||
International equities (MSCI Europe, Australasia, Far East Index) |
3.15 | 10.01 | ||||||
Emerging market equities (MSCI Emerging Markets Index) |
(6.00) | (2.94) | ||||||
3-month Treasury bills (ICE BofA 3-Month U.S. Treasury Bill Index) |
2.73 | 5.13 | ||||||
U.S. Treasury securities (ICE BofA 10-Year U.S. Treasury Index) |
1.74 | (0.38) | ||||||
U.S. investment grade bonds (Bloomberg U.S. Aggregate Bond Index) |
3.15 | 2.10 | ||||||
Tax-exempt municipal bonds (Bloomberg Municipal Bond Index) |
2.70 | 2.90 | ||||||
U.S. high yield bonds (Bloomberg U.S. Corporate High Yield 2% Issuer Capped Index) |
6.18 | 9.28 | ||||||
| Past performance is not an indication of future results. Index performance is shown for illustrative purposes only. You cannot invest directly in an index. | ||||||||
2 |
T H I S P A G E I S N O T P A R T O F Y O U R F U N D R E P O R T |
Table of Contents
Page |
||||
| 2 | ||||
Semi-Annual Report: |
||||
| 4 | ||||
| 5 | ||||
| 5 | ||||
| 6 | ||||
Financial Statements: |
||||
| 20 | ||||
| 72 | ||||
| 74 | ||||
| 76 | ||||
| 80 | ||||
| 82 | ||||
| 90 | ||||
| 101 | ||||
| 104 | ||||
| 3 |
Municipal Market Overview For the Reporting Period Ended January 31, 2024 | ||
Municipal Market Conditions
Municipals struggled at the start of the period as the Fed continued its tightening policy, raising fed fund rates to 5.25%-5.50%, before pausing in September. Subsequently, falling inflation, weakening economic growth, and the prolonged Fed pause led to more dovish expectations for monetary policy, causing a strong interest rate rally into year-end. As a result, municipals posted their strongest performance since the mid-1980s during the fourth quarter of 2023 before taking a step back to reassess macro expectations at the end of the period. Lower-rated credits and the long-end of the curve performed best.
During the 12-months ended January 31, 2024, municipal bond funds experienced net outflows totaling $20 billion (based on data from the Investment Company Institute), as demand shifted from funds to individual bonds and ETFs. At the same time, the market contended with just $368 billion in issuance, a small increase from the $347 billion issued during the prior 12-month period, as issuers shied away from rising rates and volatility. |
Bloomberg Municipal Bond Index Total Returns as of January 31, 2024 6 months: 2.70% 12 months: 2.90% |
A Closer Look at Yields
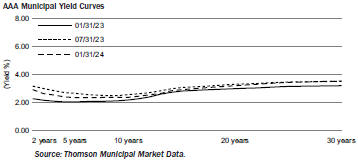
From January 31, 2023, to January 31, 2024, yields on AAA-rated 30-year municipal bonds increased by 32 basis points (bps) from 3.20% to 3.52%, ten-year yields increased by 19 bps from 2.19% to 2.38%, five-year yields increased by 31 bps from 2.05% to 2.36%, and two-year yields increased by 47 bps from 2.17% to 2.64% (as measured by Refinitiv Municipal Market Data). As a result, the municipal yield curve flattened over the 12-month period with the spread between two- and 30-year maturities flattening by 15 bps to a slope of 88 bps. Still, the curve remained relatively steep compared to the inverted U.S. Treasury curve.
Outperformance throughout the period pushed relative valuations to extremely rich levels. Municipal-to-Treasury ratios ended well through their 5-year averages across the curve, with intermediate maturities approaching all-time lows.
Financial Conditions of Municipal Issuers
With reserves at nearly an all-time high and debt service burden at a 50-year low, states are well-positioned to weather a potential economic slowdown. However, tax receipts are diverging for the states that primarily rely on consumption taxes, compared to their peers that depend on income taxes. State median revenues declined by a slight 1% for the rolling 12-months ending September 2023. States with regimes that favor sales taxes, such as Florida, Nevada, Texas, Tennessee, and Washington, all experienced positive revenue growth, while states that depend on personal income taxes, such as California and New York, experienced much greater declines in receipts, by 23% and 16%, respectively. Particularly in California’s case, the rating agencies have been patient, but the risk of downgrades has increased significantly. Meanwhile spreads remain surprisingly tight, reflecting investor indifference. Personal income tax collections should improve this April, due to a rebound in the financial markets, which should alleviate the strain on New York’s budget, but California will need to enact significant corrective action to address its reported $68 billion deficit. No sector is immune to an economic contraction; however, most municipal issuers are ultra-defensive since they provide essential services and can raise user fees or taxes to cover operations. Across all muni sectors, we anticipate borrowing to increase modestly in 2024 due to various potential factors: revenue shortfalls, aversion to fee increases, reluctance to cut programs, no future federal stimulus, preference to maintain liquidity, and deferral of capital expenditures. Patient investors will have better options in 2024 to buy solid credits in the primary market or discounted names in the secondary market.
The opinions expressed are those of BlackRock as of January 31, 2024 and are subject to change at any time due to changes in market or economic conditions. The comments should not be construed as a recommendation of any individual holdings or market sectors. Investing involves risk including loss of principal. Bond values fluctuate in price so the value of your investment can go down depending on market conditions. Fixed income risks include interest-rate and credit risk. Typically, when interest rates rise, there is a corresponding decline in bond values. Credit risk refers to the possibility that the bond issuer will not be able to make principal and interest payments. There may be less information on the financial condition of municipal issuers than for public corporations. The market for municipal bonds may be less liquid than for taxable bonds. Some investors may be subject to Alternative Minimum Tax (“AMT”). Capital gains distributions, if any, are taxable.
The Bloomberg Municipal Bond Index, a broad, market value-weighted index, seeks to measure the performance of the U.S. municipal bond market. All bonds in the index are exempt from U.S. federal income taxes or subject to the AMT. Past performance is not an indication of future results. Index performance is shown for illustrative purposes only. It is not possible to invest directly in an index.
4 |
2 0 2 4 B L A C K R O C K S E M I - A N N U A L R E P O R T T O S H A R E H O L D E R S |
The Benefits and Risks of Leveraging | ||
The Funds may utilize leverage to seek to enhance the distribution rate on, and net asset value (“NAV”) of, their common shares (“Common Shares”). However, there is no guarantee that these objectives can be achieved in all interest rate environments.
In general, the concept of leveraging is based on the premise that the financing cost of leverage, which is based on short-term interest rates, is normally lower than the income earned by a Fund on its longer-term portfolio investments purchased with the proceeds from leverage. To the extent that the total assets of each Fund (including the assets obtained from leverage) are invested in higher-yielding portfolio investments, each Fund’s shareholders benefit from the incremental net income. The interest earned on securities purchased with the proceeds from leverage (after paying the leverage costs) is paid to shareholders in the form of dividends, and the value of these portfolio holdings (less the leverage liability) is reflected in the per share NAV.
To illustrate these concepts, assume a Fund’s Common Shares capitalization is $100 million and it utilizes leverage for an additional $30 million, creating a total value of $130 million available for investment in longer-term income securities. If prevailing short-term interest rates are 3% and longer-term interest rates are 6%, the yield curve has a strongly positive slope. In this case, a Fund’s financing costs on the $30 million of proceeds obtained from leverage are based on the lower short-term interest rates. At the same time, the securities purchased by a Fund with the proceeds from leverage earn income based on longer-term interest rates. In this case, a Fund’s financing cost of leverage is significantly lower than the income earned on a Fund’s longer-term investments acquired from such leverage proceeds, and therefore the holders of Common Shares (“Common Shareholders”) are the beneficiaries of the incremental net income.
However, in order to benefit Common Shareholders, the return on assets purchased with leverage proceeds must exceed the ongoing costs associated with the leverage. If interest and other costs of leverage exceed a Fund’s return on assets purchased with leverage proceeds, income to shareholders is lower than if a Fund had not used leverage. In such circumstance, the investment adviser may nevertheless determine to maintain a Fund’s leverage if it deems such action to be appropriate. Furthermore, the value of the Funds’ portfolio investments generally varies inversely with the direction of long-term interest rates, although other factors can influence the value of portfolio investments. In contrast, the amount of each Fund’s obligations under its respective leverage arrangement generally does not fluctuate in relation to interest rates. As a result, changes in interest rates can influence the Funds’ NAVs positively or negatively. Changes in the future direction of interest rates are very difficult to predict accurately, and there is no assurance that a Fund’s intended leveraging strategy will be successful.
The use of leverage also generally causes greater changes in each Fund’s NAV, market price and dividend rates than comparable portfolios without leverage. In a declining market, leverage is likely to cause a greater decline in the NAV and market price of a Fund’s Common Shares than if the Fund were not leveraged. In addition, each Fund may be required to sell portfolio securities at inopportune times or at distressed values in order to comply with regulatory requirements applicable to the use of leverage or as required by the terms of leverage instruments, which may cause the Fund to incur losses. The use of leverage may limit a Fund’s ability to invest in certain types of securities or use certain types of hedging strategies. Each Fund incurs expenses in connection with the use of leverage, all of which are borne by Common Shareholders and may reduce income to the Common Shares. Moreover, to the extent the calculation of each Fund’s investment advisory fees includes assets purchased with the proceeds of leverage, the investment advisory fees payable to the Funds’ investment adviser will be higher than if the Funds did not use leverage.
To obtain leverage, each Fund has issued Variable Rate Muni Term Preferred Shares (“VMTP Shares” or “Preferred Shares”) and/or leveraged its assets through the use of tender option bond trusts (“TOB Trusts”) as described in the Notes to Financial Statements.
Under the Investment Company Act of 1940, as amended (the “1940 Act”), each Fund is permitted to borrow money (including through the use of TOB Trusts) or issue debt securities up to 33 1/3% of its total managed assets or equity securities (e.g., Preferred Shares) up to 50% of its total managed assets. A Fund may voluntarily elect to limit its leverage to less than the maximum amount permitted under the 1940 Act. In addition, a Fund may also be subject to certain asset coverage, leverage or portfolio composition requirements imposed by the Preferred Shares’ governing instruments or by agencies rating the Preferred Shares, which may be more stringent than those imposed by the 1940 Act.
Derivative Financial Instruments
The Funds may invest in various derivative financial instruments. These instruments are used to obtain exposure to a security, commodity, index, market, and/or other assets without owning or taking physical custody of securities, commodities and/or other referenced assets or to manage market, equity, credit, interest rate, foreign currency exchange rate, commodity and/or other risks. Derivative financial instruments may give rise to a form of economic leverage and involve risks, including the imperfect correlation between the value of a derivative financial instrument and the underlying asset, possible default of the counterparty to the transaction or illiquidity of the instrument. Pursuant to Rule 18f-4 under the 1940 Act, among other things, the Funds must either use derivative financial instruments with embedded leverage in a limited manner or comply with an outer limit on fund leverage risk based on value-at-risk. The Funds’ successful use of a derivative financial instrument depends on the investment adviser’s ability to predict pertinent market movements accurately, which cannot be assured. The use of these instruments may result in losses greater than if they had not been used, may limit the amount of appreciation a Fund can realize on an investment and/or may result in lower distributions paid to shareholders. The Funds’ investments in these instruments, if any, are discussed in detail in the Notes to Financial Statements.
T H E B E N E F I T S A N D R I S K S O F L E V E R A G I N G / D E R I V A T I V E F I N A N C I A L I N S T R U M E N T S |
5 |
Fund Summary as of January 31, 2024 |
BlackRock Investment Quality Municipal Trust, Inc. (BKN) |
Investment Objective
BlackRock Investment Quality Municipal Trust, Inc.’s (BKN) (the “Fund”)
No assurance can be given that the Fund’s investment objective will be achieved.
On October 30, 2023, the Board of Directors of the Fund and the Board of Directors of BlackRock MuniYield Quality Fund III, Inc. (MYI) announced the withdrawal of the merger proposal that was previously approved by the Boards pursuant to which the Fund would have been merged into MYI, with MYI continuing as the surviving fund.
Fund Information
Symbol on New York Stock Exchange |
BKN | |
Initial Offering Date |
February 28, 1993 | |
Yield on Closing Market Price as of January 31, 2024 ($ 11.71) (a) |
5.84% | |
Tax Equivalent Yield (b) |
9.86% | |
Current Monthly Distribution per Common Share (c) |
$0.057000 | |
Current Annualized Distribution per Common Share (c) |
$0.684000 | |
Leverage as of January 31, 2024 (d) |
31% | |
(a) |
Yield on closing market price is calculated by dividing the current annualized distribution per share by the closing market price. Past performance is not an indication of future results. |
(b) |
Tax equivalent yield assumes the maximum marginal U.S. federal tax rate of 40.8%, which includes the 3.8% Medicare tax. Actual tax rates will vary based on income, exemptions and deductions. Lower taxes will result in lower tax equivalent yields. |
(c) |
The distribution rate is not constant and is subject to change. A portion of the distribution may be deemed a return of capital or net realized gain. |
(d) |
Represents VMTP Shares and TOB Trusts as a percentage of total managed assets, which is the total assets of the Fund, including any assets attributable to VMTP Shares and TOB Trusts, minus the sum of its accrued liabilities. Does not reflect derivatives or other instruments that may give rise to economic leverage. For a discussion of leveraging techniques utilized by the Fund, please see The Benefits and Risks of Leveraging and Derivative Financial Instruments. |
Market Price and Net Asset Value Per Share Summary
01/31/24 |
07/31/23 |
Change |
High |
Low |
||||||||||||||||
Closing Market Price |
$ | 11.71 | $ | 11.75 | (0.34 | )% | $ | 12.05 | $ | 9.60 | ||||||||||
Net Asset Value |
13.14 | 13.21 | (0.53 | ) | 13.34 | 11.54 | ||||||||||||||
Performance
Returns for the period ended January 31, 2024 were as follows:
| Average Annual Total Returns | ||||||||||||||||
6-month |
1 Year |
5 Years |
10 Years |
|||||||||||||
Fund at NAV (a)(b) |
1.93 | % | 2.21 | % | 1.89 | % | 4.50 | % | ||||||||
Fund at Market Price (a)(b) |
2.12 | (0.72 | ) | 1.35 | 3.05 | |||||||||||
National Customized Reference Benchmark (c) |
2.77 | 3.02 | 2.13 | N/A | ||||||||||||
Bloomberg Municipal Bond Index (d) |
2.70 | 2.90 | 2.00 | 2.78 | ||||||||||||
(a) |
All returns reflect reinvestment of dividends and/or distributions at actual reinvestment prices. Performance results reflect the Fund’s use of leverage, if any. |
(b) |
The Fund’s discount to NAV narrowed during the period, which accounts for the difference between performance based on market price and performance based on NAV. |
(c) |
The National Customized Reference Benchmark is comprised of the Bloomberg Municipal Bond Index Total Return Index Value Unhedged (90%) and the Bloomberg Municipal Bond: High Yield (non-Investment Grade) Total Return Index (10%). The National Customized Reference Benchmark commenced on September 30, 2016. |
(d) |
An unmanaged index that tracks the U.S. long term tax-exempt bond market, including state and local general obligation bonds, revenue bonds, pre-refunded bonds, and insured bonds. |
Performance results may include adjustments made for financial reporting purposes in accordance with U.S. generally accepted accounting principles. Past performance is not an indication of future results.
The Fund is presenting the performance of one or more indices for informational purposes only. The Fund is actively managed and does not seek to track or replicate the performance of any index. The index performance shown is not intended to be indicative of the Fund’s investment strategies, portfolio components or past or future performance.
More information about the Fund’s historical performance can be found in the “Closed End Funds” section of .
blackrock.com
The following discussion relates to the Fund’s absolute performance based on NAV:
Municipal bonds posted solid gains for the six-month period behind continued optimism that the Fed would begin to cut interest rates in 2024.
6 |
2 0 2 4 B L A C K R O C K S E M I - A N N U A L R E P O R T T O S H A R E H O L D E R S |