Exhibit 99.1
| NEWS RELEASE |

Williams Industrial Services Group Inc. ♦ 200 Ashford Center North, Suite 425 ♦ Atlanta, GA 30338
|
|
FOR IMMEDIATE RELEASE
Williams Reports First Quarter 2022 Financial Results
Guidance Unchanged as Market Dynamics Point to Improving Award Environment
ATLANTA, GA, May 12, 2022 – Williams Industrial Services Group Inc. (NYSE American: WLMS) (“Williams” or the “Company”), an energy and industrial infrastructure services company, today reported its financial results for the fiscal first quarter ended March 31, 2022.
Recent Highlights
| ● | Williams posted revenue of $69.6 million in the first quarter of 2022 compared with $60.9 million in the prior-year period |
| ● | The Company reported a net loss from continuing operations of $2.0 million, or $(0.08) per diluted share, in the first quarter of 2022 compared with a net loss from continuing operations of $1.6 million, or $(0.06) per diluted share, in the first quarter of 2021 |
| ● | Adjusted EBITDA1 was $0.1 million for the first quarter of 2022 compared with $0.6 million in the prior-year period |
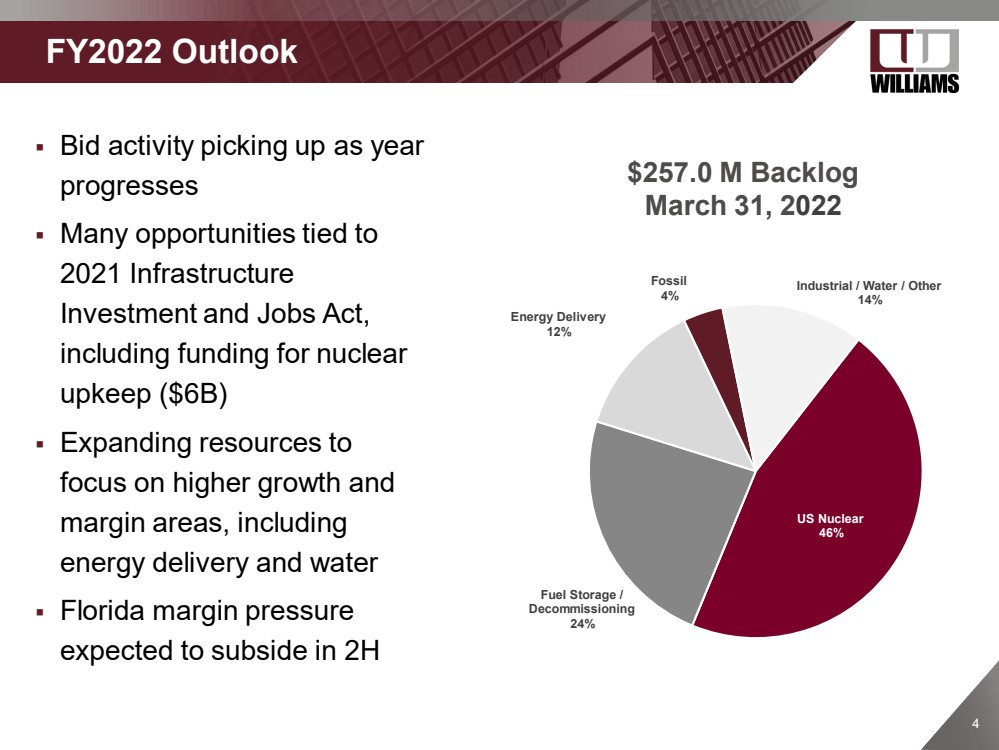
| ● | As of March 31, 2022, the Company’s backlog was $257.0 million, compared to $270.7 million as of December 31, 2021 (excluding approximately $361 million of decommissioning work subsequently transferred to a competitor, as previously announced); approximately $139 million of the March 31, 2022 backlog is expected to be converted to revenue over the following twelve months |
| ● | The Company announced its financial guidance for fiscal 2022 remains unchanged |
“As anticipated, the first quarter of 2022 was negatively impacted by downward pressure on margins related to residual operating challenges in our Florida water business as well as start-up costs associated with expanding service to the energy delivery end market,” said Tracy Pagliara, President and CEO of Williams. “However, we saw a decline in general and administrative expenses both year-over-year and sequentially, even as we recognized $0.7 million of one-time expenses for litigation against a former employee and competitor during the first quarter of 2022. We are squarely focused on reducing expenses and improving bottom line results going forward.
“We added $38 million in new orders during the quarter and believe this is just the beginning of robust opportunities ahead. The prospects for nuclear power are being enhanced by the clean energy mandate, national security concerns and federal and state-level subsidies, including $6 billion of Infrastructure Investment and Jobs Act (“IIJA”) funding designed to extend the life of existing nuclear facilities. Moreover, the capital budgets of our utility and municipality customers are substantial, and the IIJA will also add more than $45 billion of supplemental investments to enhance water and power grid infrastructure in the coming years. Overall, we are experiencing increased demand for our services, with strengthening market dynamics expected to benefit Williams for the foreseeable future. Accordingly, we are reiterating our 2022 financial guidance.”
First Quarter 2022 Financial Results Compared to First Quarter 2021
Revenue in the first quarter, typically the lightest period of the fiscal year due to seasonal work factors, was $69.6 million compared with $60.9 million in the first quarter of 2021, largely reflecting an increase in nuclear and water work. Gross profit was $5.7 million, or 8.2% of revenue, compared with $6.1 million, or 10.0% of revenue, in the prior-year period, with the lower
1See NOTE 1 — Non-GAAP Financial Measures in the attached tables for important disclosures regarding Williams’ use of Adjusted EBITDA, as well as a reconciliation of income (loss) from continuing operations to Adjusted EBITDA.
Williams Industrial Services Group
May 12, 2022
Page 2 of 8
margin primarily due to changes in project mix, including the ongoing impact of certain contracts in Florida, as previously announced, which will reach completion in the fourth quarter of 2022, and start-up costs tied to the Company’s further expansion into the energy delivery market. Excluding the aforementioned business start-up expenses and negative impact from the Company’s Florida water projects, adjusted gross margin would have been 10.5% of revenue.
Operating expenses were $6.5 million compared with $6.6 million in the first quarter of 2021, reflecting lower general and administrative expenses, inclusive of $0.7 million in professional fees relating to an ongoing legal matter. The Company reported an operating loss of $0.8 million versus $0.5 million in the prior-year period. Interest expense was $1.2 million in the first quarter of 2022 versus $1.3 million in 2021.
The Company reported a net loss from continuing operations of $2.0 million, or $(0.08) per diluted share, in the first quarter of 2022 compared with a net loss from continuing operations of $1.6 million, or $(0.06) per diluted share, in the prior-year period.
Balance Sheet
The Company’s total liquidity (the sum of unrestricted cash and availability under the Company’s revolving credit facility) was $26.1 million as of March 31, 2022, versus $27.7 million at the beginning of 2022. As of March 31, 2022, the Company had $4.3 million of unrestricted cash and cash equivalents, $0.5 million of restricted cash, and $31.3 million of bank debt compared with $2.5 million of unrestricted cash and cash equivalents, $0.5 million of restricted cash, and $32.1 million of bank debt as of December 31, 2021.
Backlog
Total backlog as of March 31, 2022 was $257.0 million compared with $270.7 million on December 31, 2021, after deducting approximately $361 million of decommissioning work through 2029 which was subsequently transferred to a competitor, as previously announced. During the first quarter of 2022, the Company recognized revenue of $69.6 million, booked new awards of $38.3 million, and (inclusive of the aforementioned contracts) saw net adjustments and cancellations of $343.5 million.
| | Three Months Ended March 31, 2022 | | |
Backlog - beginning of period | | $ | 631,693 | |
New awards | | | 38,293 | |
Adjustments and cancellations, net | | | (343,471) | |
Revenue recognized | | | (69,559) | |
Backlog - end of period | | $ | 256,956 | |
Williams estimates that approximately $139 million of its quarter-end backlog will be converted to revenue within the next twelve months, compared with an adjusted $157.2 million of backlog (after the loss of the aforementioned decommissioning contracts) as of December 31, 2021 that the Company anticipated would be converted to revenue over the succeeding twelve-month period.
Outlook
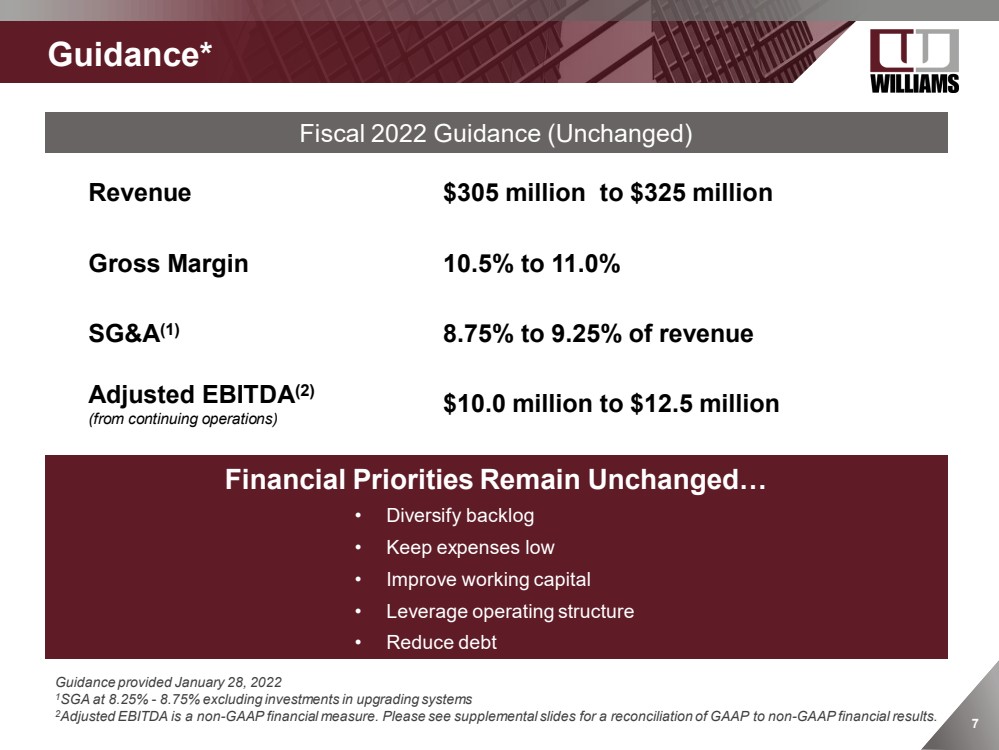
The Company confirmed that guidance previously provided January 28, 2022 for the current fiscal year remains unchanged.
2022 Guidance | |
Revenue: | $305 million to $325 million |
Gross margin: | 10.5% to 11.0% |
SG&A: | 8.75% to 9.25% of revenue (8.25% to 8.75% excluding investments in upgrading systems) |
Adjusted EBITDA*: | $10.0 million to $12.5 million |
*See Note 1 — Non-GAAP Financial Measures for information regarding the use of Adjusted EBITDA and forward-looking non-GAAP financial measures.
Webcast and Teleconference
The Company will host a conference call tomorrow, May 13, 2022, at 10:00 a.m. Eastern time. A webcast of the call and an accompanying slide presentation will be available at www.wisgrp.com. To access the conference call by telephone, listeners should dial 201-493-6780.
Williams Industrial Services Group
May 12, 2022
Page 3 of 8
An audio replay of the call will be available later that day by dialing 412-317-6671 and entering conference ID number 13728732; alternatively, a webcast replay can be found at http://ir.wisgrp.com/, where a transcript will be posted once available.
About Williams
Williams Industrial Services Group has been safely helping plant owners and operators enhance asset value for more than 50 years. The Company is a leading provider of infrastructure related services to blue-chip customers in energy and industrial end markets, including a broad range of construction maintenance, modification, and support services. Williams’ mission is to be the preferred provider of construction, maintenance, and specialty services through commitment to superior safety performance, focus on innovation, and dedication to delivering unsurpassed value to its customers.
Additional information about Williams can be found on its website: www.wisgrp.com.
Forward-looking Statement Disclaimer
This press release contains “forward-looking statements” within the meaning of the term set forth in the Private Securities Litigation Reform Act of 1995. The forward-looking statements include statements or expectations regarding the Company’s ability to perform in accordance with guidance, build and diversify its backlog and convert backlog to revenue, realize opportunities, including receiving contract awards on outstanding bids and successfully pursuing future opportunities, benefit from potential growth in the Company’s end markets, including from increased infrastructure spending by the U.S. federal government, and successfully achieve its growth, strategic and business development initiatives, including decreasing the Company’s outstanding indebtedness, future demand for the Company’s services, and expectations regarding future revenues, cash flow, and other related matters. These statements reflect the Company’s current views of future events and financial performance and are subject to a number of risks and uncertainties, including the Company’s level of indebtedness and ability to make payments on, and satisfy the financial and other covenants contained in, its debt facilities, as well as its ability to engage in certain transactions and activities due to limitations and covenants contained in such facilities; its ability to generate sufficient cash resources to continue funding operations, including investments in working capital required to support growth-related commitments that it makes to customers, and the possibility that it may be unable to obtain any additional funding as needed or incur losses from operations in the future; exposure to market risks from changes in interest rates; the Company’s ability to obtain adequate surety bonding and letters of credit; the Company’s ability to maintain effective internal control over financial reporting and disclosure controls and procedures; the Company’s ability to attract and retain qualified personnel, skilled workers, and key officers; failure to successfully implement or realize its business strategies, plans and objectives of management, and liquidity, operating and growth initiatives and opportunities, including any expansion into new markets and its ability to identify potential candidates for, and consummate, acquisition, disposition, or investment transactions; the loss of one or more of its significant customers; its competitive position; market outlook and trends in the Company’s industry, including the possibility of reduced investment in, or increased regulation of, nuclear power plants, declines in public infrastructure construction, and reductions in government funding; costs exceeding estimates the Company uses to set fixed-price contracts; harm to the Company’s reputation or profitability due to, among other things, internal operational issues, poor subcontractor performances or subcontractor insolvency; potential insolvency or financial distress of third parties, including customers and suppliers; the Company’s contract backlog and related amounts to be recognized as revenue; its ability to maintain its safety record, the risks of potential liability and adequacy of insurance; adverse changes in the Company’s relationships with suppliers, vendors, and subcontractors, including increases in cost, disruption of supply or shortage of labor, freight, equipment or supplies, including as a result of the COVID-19 pandemic; compliance with environmental, health, safety and other related laws and regulations, including those related to climate change; limitations or modifications to indemnification regulations of the U.S.; the Company’s expected financial condition, future cash flows, results of operations and future capital and other expenditures; the impact of general economic conditions, including inflation, ongoing economic disruption, including the effects of the Ukraine-Russia conflict, and any recession resulting from the COVID-19 pandemic; the impact of the COVID-19 pandemic on the Company’s business, results of operations, financial condition, and cash flows, including global supply chain disruptions and the potential for additional COVID-19 cases to occur at the Company’s active or future job sites, which potentially could impact cost and labor availability; information technology vulnerabilities and cyberattacks on the Company’s networks; the Company’s failure to comply with applicable laws and regulations, including, but not limited to, those relating to privacy and anti-bribery; the Company’s ability to successfully implement its new enterprise resource planning (ERP) system; the Company’s participation in multiemployer pension plans; the impact of any disruptions resulting from the expiration of collective bargaining agreements; the impact of natural disasters, which may worsen or increase due to the effects of climate change, and other severe catastrophic events (such as the ongoing COVID-19 pandemic); the impact of corporate citizenship and environmental, social and governance matters; the impact of changes in tax regulations and laws, including future income tax payments and utilization of net operating loss and foreign tax credit carryforwards; volatility of the market price for the Company’s common stock; the Company’s ability to maintain its stock exchange listing; the effects of anti-takeover provisions in the Company’s organizational documents and Delaware law; the impact of future offerings or sales of the Company’s common stock on the market price of such stock; expected outcomes of legal or regulatory proceedings and their anticipated effects on the Company’s results of operations; and any other statements regarding future growth, future cash needs, future operations, business plans and future financial results.
Other important factors that may cause actual results to differ materially from those expressed in the forward-looking statements are discussed in the Company’s filings with the U.S. Securities and Exchange Commission, including the section of the Annual Report on Form 10-K for its 2021 fiscal year titled “Risk Factors.” Any forward-looking statement speaks only as of the date of this press release. Except as may be required by applicable law, the Company undertakes no obligation to publicly update or revise any forward-looking statements, whether as a result of new information, future events or otherwise, and you are cautioned not to rely upon them unduly.
Investor Contact:
Chris Witty
Darrow Associates
646-345-0998
cwitty@darrowir.com
Financial Tables Follow
Williams Industrial Services Group
May 12, 2022
Page 4 of 8
WILLIAMS INDUSTRIAL SERVICES GROUP INC. AND SUBSIDIARIES
CONDENSED CONSOLIDATED STATEMENTS OF OPERATIONS (UNAUDITED)
| | | | | | | |
| | Three Months Ended March 31, | | ||||
($ in thousands, except share and per share amounts) | | 2022 | | 2021 | | ||
Revenue | | $ | 69,559 | | $ | 60,851 | |
Cost of revenue | | | 63,850 | | | 54,753 | |
| | | | | | | |
Gross profit | | | 5,709 | | | 6,098 | |
Gross margin | | | 8.2% | | | 10.0% | |
| | | | | | | |
Selling and marketing expenses | | | 330 | | | 211 | |
General and administrative expenses | | | 6,071 | | | 6,311 | |
Depreciation and amortization expense | | | 66 | | | 41 | |
Total operating expenses | | | 6,467 | | | 6,563 | |
| | | | | | | |
Operating loss | | | (758) | | | (465) | |
Operating margin | | | (1.1)% | | | (0.8)% | |
| | | | | | | |
Interest expense, net | | | 1,219 | | | 1,293 | |
Other income, net | | | (179) | | | (360) | |
Total other expense, net | | | 1,040 | | | 933 | |
| | | | | | | |
Loss from continuing operations before income tax | | | (1,798) | | | (1,398) | |
Income tax expense | | | 229 | | | 185 | |
Loss from continuing operations | | | (2,027) | | | (1,583) | |
| | | | | | | |
Loss from discontinued operations before income tax | | | — | | | (79) | |
Income tax expense | | | 17 | | | 19 | |
Loss from discontinued operations | | | (17) | | | (98) | |
| | | | | | | |
Net loss | | $ | (2,044) | | $ | (1,681) | |
| | | | | | | |
Basic loss per common share | | | | | | | |
Loss from continuing operations | | $ | (0.08) | | $ | (0.06) | |
Loss from discontinued operations | | | — | | | (0.01) | |
Basic loss per common share | | $ | (0.08) | | $ | (0.07) | |
| | | | | | | |
Diluted loss per common share | | | | | | | |
Loss from continuing operations | | $ | (0.08) | | $ | (0.06) | |
Loss from discontinued operations | | | — | | | (0.01) | |
Diluted loss per common share | | $ | (0.08) | | $ | (0.07) | |
| | | | | | | |
Weighted average common shares outstanding (basic) | | | 25,838,562 | | | 24,933,894 | |
Weighted average common shares outstanding (diluted) | | | 25,838,562 | | | 24,933,894 | |
Williams Industrial Services Group
May 12, 2022
Page 5 of 8
WILLIAMS INDUSTRIAL SERVICES GROUP INC. AND SUBSIDIARIES
REVENUE BRIDGE ANALYSIS*
First Quarter 2022 Revenue Bridge
(in millions) | | | $ Change |
First quarter 2021 revenue | | $ | 60.9 |
Other U.S. Nuclear | | | 7.1 |
Water | | | 6.3 |
Plant Vogtle Units 3 and 4 | | | 1.8 |
Project mix | | | 1.7 |
Canada | | | (4.2) |
Decommissioning | | | (4.0) |
Total change | | | 8.7 |
First quarter 2022 revenue* | | $ | 69.6 |
*Numbers may not sum due to rounding
Williams Industrial Services Group
May 12, 2022
Page 6 of 8
WILLIAMS INDUSTRIAL SERVICES GROUP INC. AND SUBSIDIARIES
CONDENSED CONSOLIDATED BALANCE SHEETS (UNAUDITED)
| | March 31, | | December 31, | ||
($ in thousands, except per share amounts) | | 2022 | | 2021 | ||
ASSETS | | | | | | |
Current assets: | | | | | | |
Cash and cash equivalents | | $ | 4,260 | | $ | 2,482 |
Restricted cash | | | 468 | | | 468 |
Accounts receivable, net of allowance of $392 and $427, respectively | | | 33,574 | | | 35,204 |
Contract assets | | | 12,838 | | | 12,683 |
Other current assets | | | 11,076 | | | 11,049 |
Total current assets | | | 62,216 | | | 61,886 |
| | | | | | |
Property, plant and equipment, net | | | 587 | | | 653 |
Goodwill | | | 35,400 | | | 35,400 |
Intangible assets, net | | | 12,500 | | | 12,500 |
Other long-term assets | | | 6,998 | | | 5,712 |
Total assets | | $ | 117,701 | | $ | 116,151 |
| | | | | | |
LIABILITIES AND STOCKHOLDERS’ EQUITY | | | | | | |
| | | | | | |
Current liabilities: | | | | | | |
Accounts payable | | $ | 16,424 | | $ | 12,168 |
Accrued compensation and benefits | | | 12,056 | | | 12,388 |
Contract liabilities | | | 2,717 | | | 3,412 |
Short-term borrowings | | | - | | | 676 |
Current portion of long-term debt | | | 1,050 | | | 1,050 |
Other current liabilities | | | 10,288 | | | 11,017 |
Current liabilities of discontinued operations | | | 337 | | | 316 |
Total current liabilities | | | 42,872 | | | 41,027 |
Long-term debt, net | | | 30,228 | | | 30,328 |
Deferred tax liabilities | | | 2,447 | | | 2,442 |
Other long-term liabilities | | | 3,539 | | | 1,647 |
Long-term liabilities of discontinued operations | | | 4,207 | | | 4,250 |
Total liabilities | | | 83,293 | | | 79,694 |
Commitments and contingencies | | | | | | |
Stockholders’ equity: | | | | | | |
Common stock, $0.01 par value, 170,000,000 shares authorized and 26,700,683 and 26,408,789 shares issued, respectively, and 26,231,515 and 25,939,621 shares outstanding, respectively | | | 261 | | | 261 |
Paid-in capital | | | 92,080 | | | 92,227 |
Accumulated other comprehensive income (loss) | | | 47 | | | (95) |
Accumulated deficit | | | (57,974) | | | (55,930) |
Treasury stock, at par (469,168 and 469,168 common shares, respectively) | | | (6) | | | (6) |
Total stockholders’ equity | | | 34,408 | | | 36,457 |
Total liabilities and stockholders’ equity | | $ | 117,701 | | $ | 116,151 |
Williams Industrial Services Group
May 12, 2022
Page 7 of 8
WILLIAMS INDUSTRIAL SERVICES GROUP INC. AND SUBSIDIARIES
CONDENSED CONSOLIDATED STATEMENTS OF CASH FLOWS (UNAUDITED)
| | Three Months Ended March 31, | ||||
(in thousands) | | 2022 | | 2021 | ||
Operating activities: | | | | | | |
Net loss | | $ | (2,044) | | $ | (1,681) |
Adjustments to reconcile net loss to net cash provided by (used in) operating activities: | | | | | | |
Net loss from discontinued operations | | | 17 | | | 98 |
Deferred income tax provision (benefit) | | | 5 | | | (13) |
Depreciation and amortization on plant, property and equipment | | | 66 | | | 41 |
Amortization of deferred financing costs | | | 208 | | | 208 |
Amortization of debt discount | | | 50 | | | 50 |
Bad debt expense | | | (35) | | | (18) |
Stock-based compensation | | | (31) | | | 715 |
Changes in operating assets and liabilities: | | | | | | |
Accounts receivable | | | 1,713 | | | (1,634) |
Contract assets | | | (153) | | | (4,410) |
Other current assets | | | (27) | | | 59 |
Other assets | | | (1,369) | | | (172) |
Accounts payable | | | 4,231 | | | (859) |
Accrued and other liabilities | | | 619 | | | 5,112 |
Contract liabilities | | | (695) | | | (548) |
Net cash provided by (used in) operating activities, continuing operations | | | 2,555 | | | (3,052) |
Net cash used in operating activities, discontinued operations | | | (39) | | | (69) |
Net cash provided by (used in) operating activities | | | 2,516 | | | (3,121) |
Investing activities: | | | | | | |
Purchase of property, plant and equipment | | | — | | | (56) |
Net cash used in investing activities | | | — | | | (56) |
Financing activities: | | | | | | |
Repurchase of stock-based awards for payment of statutory taxes due on stock-based compensation | | | — | | | (541) |
Proceeds from short-term borrowings | | | 66,618 | | | 57,971 |
Repayments of short-term borrowings | | | (67,294) | | | (57,172) |
Repayments of long-term debt | | | (263) | | | (263) |
Net cash used in financing activities | | | (939) | | | (5) |
Effect of exchange rate change on cash | | | 201 | | | (90) |
Net change in cash, cash equivalents and restricted cash | | | 1,778 | | | (3,272) |
Cash, cash equivalents and restricted cash, beginning of period | | | 2,950 | | | 9,184 |
Cash, cash equivalents and restricted cash, end of period | | $ | 4,728 | | $ | 5,912 |
| | | | | | |
Supplemental Disclosures: | | | | | | |
Cash paid for interest | | $ | 867 | | $ | 875 |
Cash paid for income taxes, net of refunds | | $ | 36 | | $ | 1,066 |
Williams Industrial Services Group
May 12, 2022
Page 8 of 8
WILLIAMS INDUSTRIAL SERVICES GROUP INC. AND SUBSIDIARIES
NON-GAAP FINANCIAL MEASURE (UNAUDITED)
This press release contains financial measures not derived in accordance with accounting principles generally accepted in the United States (“GAAP”). A reconciliation to the most comparable GAAP measure is provided below.
ADJUSTED EBITDA - CONTINUING OPERATIONS
| | Three Months Ended March 31, | | ||||
(in thousands) | | 2022 | | 2021 | | ||
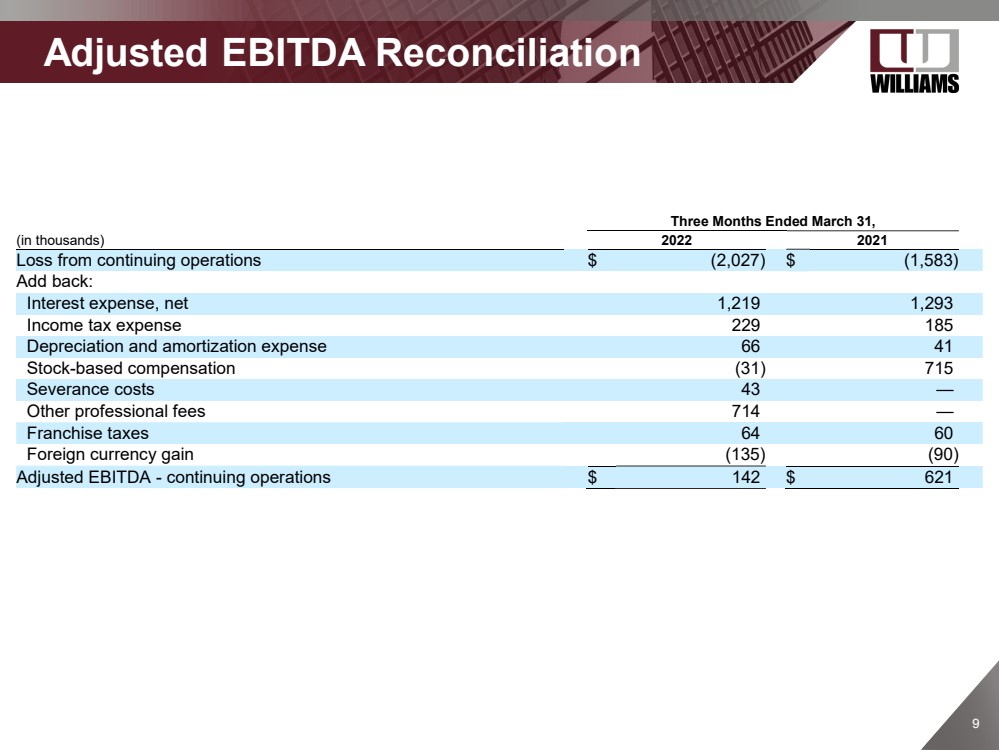
Loss from continuing operations | | $ | (2,027) | | $ | (1,583) | |
Add back: | | | | | | | |
Interest expense, net | | | 1,219 | | | 1,293 | |
Income tax expense | | | 229 | | | 185 | |
Depreciation and amortization expense | | | 66 | | | 41 | |
Stock-based compensation | | | (31) | | | 715 | |
Severance costs | | | 43 | | | — | |
Other professional fees | | | 714 | | | — | |
Franchise taxes | | | 64 | | | 60 | |
Foreign currency gain | | | (135) | | | (90) | |
Adjusted EBITDA - continuing operations | | $ | 142 | | $ | 621 | |
NOTE 1 — Non-GAAP Financial Measures
Adjusted EBITDA-Continuing Operations
Adjusted EBITDA is not calculated through the application of GAAP and is not the required form of disclosure by the U.S. Securities and Exchange Commission. Adjusted EBITDA is the sum of the Company’s income (loss) from continuing operations before interest expense, net, and income tax (benefit) expense and unusual gains or charges. It also excludes non-cash charges such as depreciation and amortization and stock-based compensation. The Company’s management believes adjusted EBITDA is an important measure of operating performance because it allows management, investors and others to evaluate and compare the performance of its core operations from period to period by removing the impact of the capital structure (interest), tangible and intangible asset base (depreciation and amortization), taxes and certain non-cash expenses and unusual gains or charges (such as stock-based compensation, severance costs, other professional fees, and foreign currency (gain) loss) which are not always commensurate with the reporting period in which such items are included. Williams’ credit facilities also contain ratios based on EBITDA. Adjusted EBITDA should not be considered an alternative to net income or income from continuing operations or as a better measure of liquidity than net cash flows from operating activities, as determined by GAAP, and, therefore, should not be used in isolation from, but in conjunction with, the GAAP measures. The use of any non-GAAP measure may produce results that vary from the GAAP measure and may not be comparable to a similarly defined non-GAAP measure used by other companies.
Note Regarding Forward-Looking Non-GAAP Financial Measures
The Company does not provide a reconciliation of forward-looking non-GAAP financial measures to their comparable GAAP financial measures because it could not do so without unreasonable effort due to the unavailability of the information needed to calculate reconciling items and due to the variability, complexity and limited visibility of the adjusting items that would be excluded from the non-GAAP financial measures in future periods. When planning, forecasting and analyzing future periods, the Company does so primarily on a non-GAAP basis without preparing a GAAP analysis.