REGISTRATION STATEMENT PURSUANT TO SECTION 12(b) OR (g) OF THE SECURITIES EXCHANGE ACT OF 1934 |
ANNUAL REPORT PURSUANT TO SECTION 13 OR 15(d) OF THE SECURITIES EXCHANGE ACT OF 1934 |
TRANSITION REPORT PURSUANT TO SECTION 13 OR 15(d) OF THE SECURITIES EXCHANGE ACT OF 1934 |
SHELL COMPANY REPORT PURSUANT TO SECTION 13 OR 15(d) OF THE SECURITIES EXCHANGE ACT OF 1934 |
Title of each class |
Trading Symbol (s) |
Name of each exchange on which registered | ||
Preferred Shares, without par value |
New York Stock Exchange* | |||
U.S. GAAP ☐ |
International Accounting Standards Board ☒ |
Other ☐ |
Audit Firm Id: |
Auditor Name: PricewaterhouseCoopers Auditores Independentes |
Auditor Location: São Paulo, Brasil |
1 | ||||
1 | ||||
2 | ||||
2 | ||||
3 | ||||
3 | ||||
4 | ||||
4 | ||||
4 | ||||
5 | ||||
5 | ||||
5 | ||||
5 | ||||
5 | ||||
30 | ||||
30 | ||||
34 | ||||
124 | ||||
125 | ||||
126 | ||||
126 | ||||
126 | ||||
154 | ||||
164 | ||||
164 | ||||
164 | ||||
164 | ||||
164 | ||||
179 | ||||
189 | ||||
192 | ||||
194 | ||||
195 | ||||
195 | ||||
197 | ||||
199 |
200 | ||||
200 | ||||
203 | ||||
203 | ||||
203 | ||||
204 | ||||
204 | ||||
206 | ||||
206 | ||||
206 | ||||
206 | ||||
206 | ||||
207 | ||||
216 | ||||
217 | ||||
217 | ||||
225 | ||||
225 | ||||
225 | ||||
225 | ||||
226 | ||||
241 | ||||
241 | ||||
241 | ||||
241 | ||||
241 | ||||
244 | ||||
244 | ||||
244 | ||||
245 | ||||
245 | ||||
245 | ||||
245 | ||||
245 | ||||
246 | ||||
246 | ||||
246 | ||||
247 |
248 | ||||
249 | ||||
249 | ||||
249 | ||||
252 | ||||
252 | ||||
252 | ||||
252 | ||||
252 | ||||
252 | ||||
253 |
• | “ Itaú Unibanco |
• | “ Itaú BBA |
• | “ Central Bank |
• | “ CLP” peso |
• | “ CMN |
• | “ CVM |
• | The economic, financial, political, public health and other effects of the outbreak of the 2019 strain of coronavirus (including variants) “COVID-19”, or other pandemics, epidemics and similar crises, and governmental responses thereto, particularly as such factors impact Brazil and the other markets in which we operate and continue to cause severe ongoing negative macroeconomic effects and disruptions to financial markets and the global economy, with a significant impact on the ability of businesses, including ours, to operate normally, thus heightening many of the other risks described in the “Risk Factors” section of this annual report; |
• | General economic, political and business conditions both in Brazil and abroad, including, in Brazil, developments and the perception of risks in connection with volatility related to the 2022 presidential elections in Brazil ongoing corruption and other investigations and increasing fractious relations and infighting within the administration of President Bolsonaro, as well as policies and potential changes to address these matters or otherwise, including economic and fiscal reforms and in response to the ongoing effects of the COVID-19 pandemic, any of which may negatively affect growth prospects in the Brazilian economy as a whole; |
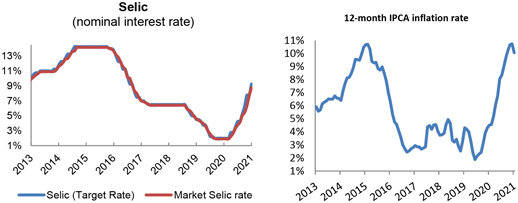
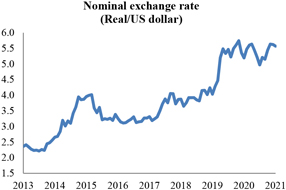
• | Fluctuations in inflation, interest rates and exchange rates in Brazil and the other markets in which we operate, which have been particularly volatile as a result of the ongoing effects of the COVID-19 pandemic; |
• | Our ability to implement, in a timely and efficient manner, any measure necessary to respond to, or reduce the impacts of, the COVID-19 pandemic on our business, operations, cash flow, prospects, liquidity and financial condition; |
• | The duration and spread of the COVID-19 pandemic and the outbreak of diseases or similar public health threats; |
• | General economic, political, and business conditions in Brazil and variations in inflation indexes, interest rates, foreign exchange rates, and the performance of financial markets; |
• | General economic and political conditions, in particular in the countries where we operate, escalating military tension between Russia and Ukraine, terrorism, or other geopolitical events; |
• | Government regulations and tax laws and amendments to such regulations and laws; |
• | Developments in high-profile investigations currently in progress and their impact on customers or on our tax exposures; |
• | Disruptions and volatility in the global financial markets; |
• | Increases in compulsory deposits and reserve requirements; |
• | Our level of capitalization; |
• | Costs and availability of funding; |
• | Increases in defaults by borrowers and other loan delinquencies, which result in increases in loan loss allowances; |
• | Regulation and liquidation of our business on a consolidated basis; |
• | Failure or hacking of our security and operational infrastructure or systems; |
• | Our ability to protect personal data; |
• | Strengthening of competition and industry consolidation; |
• | Changes in our loan portfolio and changes in the value of our securities and derivatives; |
• | Customer losses or losses of other sources of revenues; |
• | Our ability to execute our strategies and capital expenditure plans and to maintain and improve our operating performance; |
• | Our exposure to the Brazilian public debt; |
• | Incorrect pricing methodologies for insurance, pension plan and premium bond products and inadequate reserves; |
• | The effectiveness of our risk management policy; |
• | Damage to our reputation; |
• | The capacity of our controlling stockholder to conduct our business; |
• | Difficulties during the integration of acquired or merged businesses; |
• | Adverse legal or regulatory disputes or proceedings; |
• | Effects from socio-environmental issues, including new and/or more stringent regulations relating to these issues; and |
• | Other risk factors as set forth under “Item 3D. Risk Factors.” |
ITEM 1. |
IDENTITY OF DIRECTORS, SENIOR MANAGEMENT AND ADVISORS |
ITEM 2. |
OFFER STATISTICS AND EXPECTED TIMETABLE |
ITEM 3. |
KEY INFORMATION |
3A. |
[RESERVED] |
3B. |
Capitalization and Indebtedness |
3C. |
Reasons for the Offer and Use of Proceeds |
3D. |
Risk Factors |
• | Employees contracting COVID-19; |
• | Reductions in our operating effectiveness as our employees work from home or disaster-recovery locations; |
• | Unavailability of key personnel necessary to conduct our business activities, including a lack of qualified IT personnel to support remote working or combat any cyber risks; |
• | Unprecedented volatility in global financial markets and exchange markets; |
• | Reductions in revenue across our operating businesses and increased customer defaults; |
• | Closure of our offices or the offices of our clients; and |
• | Potential regulatory scrutiny of our ability to adequately supervise our activities in accordance with applicable regulatory requirements. |
• | political instability, adverse changes in diplomatic relations and unfavorable economic and business conditions in the markets in which we currently have international operations or into which we may expand; |
• | more restrictive or inconsistent government regulation of financial services, which could result in increased compliance costs and/or otherwise restrict the manner in which we provide our services; and |
• | difficulties in managing operations and adapting to cultural differences, including issues associated with (i) business practices and customs that are common in certain foreign countries but might be prohibited by Brazilian law and our internal policies and procedures and (ii) management and operational systems and infrastructures, including internal financial control and reporting systems and functions, staffing and managing of foreign operations, which we might not be able to do effectively or cost-efficiently. |
ITEM 4. |
INFORMATION ON THE COMPANY |
Product/Service |
Market Position |
Additional Information and Main Competitors | ||
Retail Banking (Including Itaú Personnalité) |
As of December 31, 2021, we reached a market share of 12.3% based on total outstanding loan balance in reais. According to the latest data base of competitors, in December 2021 we achieved the third largest position in this segment in Brazil. | We have a leading position in many sectors of the Brazilian domestic financial market. Based on Central Bank data and publicly available financial information, our main competitors are Caixa Econômica Federal, Banco do Brasil, Banco Bradesco and Banco Santander (Brazil). |
• | Microenterprises: customer base consisting of companies with annual revenues of up to R$ 0.8 million, served by 2,686 bank branches and 1,359 relationship managers and 423 managers focused on acquiring new customers as of December 31, 2021; and |
• | Small businesses: customer base consisting of companies with annual revenues between R$0.8 million and R$60 million, served by 309 bank branches and 2,118 relationship managers as of December 31, 2021. |
Product/Service |
Market Position |
Additional Information and Main Competitors | ||
Credit Cards | We are the leaders |
Our traditional competitors in this business are Banco Bradesco, Banco Santander (Brazil), Banco do Brasil and Caixa Econômica Federal. However, in recent years an increasing number of small and new digital competitors has entered this market, among which we highlight Nubank, Banco Inter and Banco Original. |
Product/Service |
Market Position |
Additional Information and Main Competitors | ||
Payroll Deducted Loans | As of December 31, 2021, we obtained a market share of 12.3% in terms of payroll deducted loans. In December 2021 we maintained the fourth position in this segment in Brazil | Our main competitors in this business are Banco do Brasil, Caixa Econômica Federal, Banco Bradesco and Banco Santander (Brazil). |
Product/Service |
Market Position |
Additional Information and Main Competitors | ||
Real Estate Financing and Mortgages | In the period from January to December 2021 we were the second in new loans to individuals among Brazilian banks, with 27.7% market share as of December 31, 2021. | Our main competitors in this business are Caixa Econômica Federal, Banco Bradesco, Banco Santander (Brazil), and Banco do Brasil. |
Financial Volume |
||||||||||||
(In billions of R$) |
||||||||||||
2021 |
2020 |
2019 |
||||||||||
Credit cards |
384.6 | 308.8 | 312.7 | |||||||||
Debit cards |
233.1 | 197.8 | 172.3 | |||||||||
|
|
|
|
|
|
|||||||
Total |
617.7 |
506.6 |
485.0 |
|||||||||
|
|
|
|
|
|
Product/Service |
Market Position |
Additional Information and Main Competitors | ||
Merchant Acquirer | In the period from January to December 2021 we reached a market share of 33.7% in terms of total transaction volume (credit and debit) generated by the acquiring services, positioning us as the second |
Our traditional competitors in this business are Cielo and GetNet. In recent years, changes in legislation made by the Central Bank combined with the growing number of fintechs, contributed to an increase in competition in the segment. Among non-traditional players, we highlight PagSeguro and Stone. |
Product/Service |
Market Position |
Additional Information and Main Competitors | ||
Private pension plans | In December 2021 our balance of provisions represented 19.6% of the market share for private pension plans, positioning us as the third largest pension provider in Brazil. Considering only Individuals plans, our market share reached 18.9%, positioning us as the third |
Our main competitors in private pension plan products are controlled by large commercial banks, such as Banco Bradesco and Banco do Brasil, which, like us, take advantage of their branch network to gain access to the retail market. Other players, such as XP and Icatu, have reached relevant amount of pension plans. Together both were responsible for 7.4% of market share by the end of 2021. |
• | Dealer’s New Experience – this product renewed the Credline tool (which merchants use to submit proposals to us) based on an intense discovery process carried out with customers. The experience became much simpler and more transparent for the dealer’s performance, in addition to incorporating new functions that help them transact more business. |
• | Speed Program – this is a loyalty program for storeowners, which aims to intensify their relationship with Itaú. |
• | End-to-end |
• | Floorplan – line of credit for dealers to purchase new and used vehicles for their stock. The product experience is very simple and fast, with a fully digital flow. |
• | VEC – Our shared electric vehicle service, developed in an environment of collaborative innovation with ecosystem partners, corresponds to a new sustainable mobility solution, such as Bike Itaú. It will allow users to unlock cars at stations directly from the app and return them to the same place or another charging station. Thus, we reinforce our presence and position in the journey of sustainable urban mobility. Today we have 1124 users in testing, and we continue to expand. |
• | iCarros Products – Our solutions help dealers make their sales process more digital and efficient, and they continue to expand. iPeças is a marketplace solution for the sale of parts for assemblers, dealers and resellers. Garagem do Conhecimento is an educational platform with distance classes to prepare professionals in the automotive sector. The iCarros Check-up is an application for monitoring the journey of the customer with their vehicles, focused on services and convenience for the user. The Easy Delivery product is a solution that allows dealers to deliver the car directly to the buyer’s home, either for a test-drive or for finalizing the purchase. iCarros Club is a B2B trade-in platform designed to help our customers increase sales safely and quickly. |
• | Itaú Tag in partnership with ConectCar, we have launched the Itaú Tag, an automatic toll and parking fee payment solution exempt from monthly fees, exclusive to our clients. The monthly fee exemption benefit has been available since the second fortnight of September, initially incorporated into the ConectCar tags. We intend to offer our own tag for all clients, as we have used the rollout to strengthen the strategy of generating loyalty by providing benefits that extrapolate banking services. |
Product/Service |
Market Position |
Additional Information and Main Competitors | ||
Vehicles | As of December 31, 2021, we reached a market share of 12.3% in terms of loans to individuals among banks,. positioning us as fourth in this segment. | Our main bank competitors in this business are Banco Santander (Brazil), Banco BV and Banco Bradesco. |
Product/Service |
Market Position |
Additional Information and Main Competitors | ||
Insurance | Giving effect to our 30% ownership interest in Porto Seguro S.A., we reached 8.1% of market share based on earned premiums, excluding VGBL (Redeemable Life Insurance), from January to December 2021, positioning us as the fourth largest insurance provider in this segment in Brazil. Considering only our recurring insurance activities, our market share reached 10.3% in the same period. | Our main competitors are controlled by or have partnerships with large commercial banks, such as Banco Bradesco, Banco Santander (Brazil) and Banco do Brasil which, like us, take advantage of their branch network to gain access to the retail market. Despite the high concentration of Brazilian banks in the market, the growing number of Insurtechs (startup companies focused on insurance) has facilitated customer access to insurance companies, making this market even more competitive. |
Product/Service |
Market Position |
Additional Information and Main Competitors | ||
Premium Bonds | In the period from January to December 2021 we had a market share of 10.9% in terms of revenues from sales of premium bonds, positioning us as the fourth largest |
Our main competitors in premium bonds are controlled by or have partnerships with large commercial banks, such as Banco Bradesco, Banco do Brasil and Banco Santander (Brazil) which, like us, take advantage of their branch network to gain access to the retail market. |
• | Average of R$1.48 billion of sales per month in the year ended December 31, 2021; |
• | New products implemented: trucks and motorcycles; |
• | New feature implemented: Customers can contract consortia at Itaú app by their-own. In addition customers who prefer to buy consortia with a specialist can press a button and receive a call from our sell team. Further customers who own more than one vehicle consortia can now join the quotas to buy a single good. |
Product/Service |
Market Position |
Additional Information and Main Competitors | ||
Consortia Services Fees | In the period from January to December 2021 we had a market share of 6.7% in total consortia services fees. Considering only banks, we are the third largest |
Considering only banks, our main competitors in the Brazilian consortia market are Bradesco Consortia and BB Consortia. |
Product/Service |
Market Position |
Additional Information and Main Competitors | ||
Investment Banking | As of December 31, 2021, Itaú BBA ranked first in mergers and acquisitions and equities markets deals (1) . Itaú BBA also ranked first in origination and in distribution in debt capital markets transactions(2) . |
In investment banking, Itau BBA’s main competitors include Santander , Credit Suisse (Brazil) S.A., Merrill Lynch S.A. (Brazil), Morgan Stanley S.A. (Brazil), JP Morgan S.A. (Brazil), Bradesco BBI and BTG Pactual S.A. |
Product/Service |
Market Position |
Additional Information and Main Competitors | ||
Asset Management | As of December 31, 2021, we had a market share of 11.4% in terms of assets under management, positioning us as the second asset manager in Brazil. | According to ANBIMA, the asset management industry in Brazil held assets totaling R$6,879 billion as of December 2021 and with 801 Financial Institutions and Assets Managers, among them, XP Investimentos. The competition is concentrated among large and well-established retail banks. Our main competitors are Banco do Brasil, Banco Bradesco and Caixa Econômica Federal. |
(i) | local custody and fiduciary services, |
(ii) | international custody services, and |
(iii) | corporate solutions where we act as transfer agent and stockholder servicer for Brazilian companies issuing equity, corporate bonds, promissory and bank credit notes. We also work as guarantor on project financings, escrow accounts and loan and financing contracts. |
Product/Service |
Market Position |
Additional Information and Main Competitors | ||
Local Custody | As of December 31, 2021, we had a market share of 21.4% based on total assets under local custody, positioning us as the second position Local Custodian. | According to ANBIMA, the local custody in Brazil held assets totaling R$6,810 billion as of December 2021. Our main competitors are Banco Bradesco S.A. and Banco do Brasil S.A. | ||
International Custody | Our market share as of December 31, 2021 was 5.9% in terms of total assets under international custody, positioning us as the fourth largest International Custodian. | Based on ANBIMA, the international custody service in Brazil totaled R$1,996 billion of assets as of December 2021. Our main competitors are Banco Citibank S.A., JP Morgan’s Securities Services and Banco Bradesco S.A. | ||
Corporate Solutions | As of December 31, 2021, we had a leading position as agent and register provider to 230 companies listed on B3, which represents 58.4% of companies listed on that exchange. Moreover, we were the second largest transfer agent with 392 debentures offerings in the Brazilian market, representing 25.5% of the debentures market in Brazil. | Our main competitors in the equities market is Banco Bradesco S.A. Our main competitor in debentures is Banco Bradesco S.A. |
• | Staying close to our customers, listening to them and striving to anticipate their needs; |
• | Our guidance is Positive Impact Commitments, which direct our decision-making and help us integrate ESG into our business practices, operations and stakeholder relations; |
• | Adding value to clients and stockholders with a complete offering of long-term proactive advisory services; |
• | Continuing to invest in our international platforms to enhance Brazilian clients’ experience; |
• | Improving our operational efficiency with digital solutions; and |
• | Maintaining a focus on risk management and regulatory considerations. |
Product/Service |
Market Position |
Additional Information and Main Competitors | ||
Retail Brokerage Services (1) |
Ranked fourth (2) . |
Main competitors: XP Investimentos, Ágora Corretora de Títulos e Valores Mobiliários S.A., Rico Corretora de Títulos e Valores Mobiliários S.A., Nu Invest Título Corretora de Valores S.A., BTG Pactual Corretora de Títulos e Valores Mobiliários S.A., Bradesco S.A. Corretora de Títulos e Valores Mobiliários, Santander Corretora de Câmbio e Valores Mobiliários S.A. and Safra Corretora de Títulos e Valores Mobiliários S.A. | ||
(1) Source: CBLCnet (2) Includes clients from Itaú Private Bank segment. |
Countries |
Branches & CSBs |
ATMs |
Employees | |||
Argentina | 78 | 175 | 1,554 | |||
Chile | 188 | 402 | 5,214 | |||
Colombia (1) |
104 | 121 | 2,691 | |||
Paraguay | 37 | 308 | 1,007 | |||
Uruguay (2) |
23 | 62 | 1,079 | |||
(1) Includes employees in Panama. (2) Does not include the 34 OCA points of service. |
Product/Service |
Market Position |
Additional Information and Main Competitors | ||
Total Loan Portfolio (includes privately-owned banks only) |
As of September 30, 2021, we had a market share of 2.2% in terms of total outstanding loan balance in Argentine pesos, positioning us as the eleventh largest |
Our main competitors are Banco Santander Río, Banco de Galicia y Buenos Aires, BBVA Banco Argentina, Banco Macro, HSBC, Industrial, Patagonia, Supervielle e Credicoop. |
Product/Service |
Market Position |
Additional Information and Main Competitors | ||
Total Loan Portfolio (includes privately-owned banks only) |
As of December 31, 2021, our market share was 11.1% based on total outstanding loan balance in Chilean pesos, positioning us as the fifth largest |
Our main competitors are Banco Santander-Chile, Banco de Chile, Scotiabank Chile and Banco de Crédito e Inversiones. |
Product/Service |
Market Position |
Additional Information and Main Competitors | ||
Total Loan Portfolio (includes privately-owned banks only) |
As of December 31, 2021, we had a market share of 14.4% in terms of total outstanding loan balance in guaranis, positioning us as the second largest |
Our main competitors are Banco Continental, Banco Regional, Sudameris and BBVA Paraguay. |
Product/Service |
Market Position |
Additional Information and Main Competitors | ||
Total Loan Portfolio (includes privately-owned banks only) |
As of December 31, 2021, we had a market share of 25.7% based on total outstanding loan balance in Uruguay pesos, positioning us as the second largest private bank in Uruguay. | Our main competitors are Banco Santander Uruguay, BBVA Uruguay and Scotiabank Uruguay. |
• | Corporate and Investment Banking: through Itau BBA International, headquartered in the United Kingdom, and its subsidiary Itaú Europe, headquartered in Portugal, with a branch in Luxembourg and business platforms in Madrid and Paris, this segment supports the financial needs of companies with international presence and operations, focusing on transactions related to financing and investment relationships between companies in Latin America and the Northern Hemisphere. The services offered include the origination of structured financing, hedging, trade financing and advisory to Latin American and U.S. companies undertaking business in the Northern Hemisphere and large economic groups investing into Latin America. |
• | Private Banking: under the corporate structure of Itau BBA International, we manage private banking activities in Miami and Zurich, offering specialized financial and asset management services for Latin American clients with high net worth by providing a diversified and specialized basis of investment funds, trading and managing on their account securities and other financial instruments, as well as by managing trusts and investment companies on behalf of customers. |
• | Support our clients in cross-border financial transactions and services, our international units are active in providing our clients with a variety of financial products, such as trade financing, loans from multilateral credit agencies, off-shore loans, international cash management services, foreign exchange, letters of credit, guarantees required in international bidding processes, derivatives for hedging or proprietary trading purposes, structured transactions and international capital markets offerings. Our international units offer a variety of financial products through their branches. |
• | Manage proprietary portfolios and raise funds through the issuance of securities in the international market. Fundraising through the issuance of securities, certificates of deposit, commercial paper and trade notes can be conducted by our branches located in the Cayman Islands, the Bahamas and the United States, as well as through Itaú Bank Ltd., a banking subsidiary incorporated in the Cayman Islands. Our proprietary portfolios are mainly held by Itaú Bank and our Nassau and Cayman Islands branches. These offices also enhance our ability to manage our international liquidity. |
Revenues from operations in Brazil and abroad |
For the Year Ended December 31, |
Variation |
||||||||||||||||||||||||||
2021 |
2020 |
2019 |
2021-2020 |
2020-2019 |
||||||||||||||||||||||||
(In millions of R$, except percentages) |
||||||||||||||||||||||||||||
Income related to financial operations (1) (2) |
144,514 |
123,611 |
145,308 |
20,903 |
16.9 |
% |
(21,697 |
) |
(14.9)% |
|||||||||||||||||||
Brazil |
107,741 | 102,016 | 117,541 | 5,725 | 5.6 | % | (15,525 | ) | (13.2)% | |||||||||||||||||||
Abroad |
36,773 | 21,595 | 27,767 | 15,178 | 70.3 | % | (6,172 | ) | (22.2)% | |||||||||||||||||||
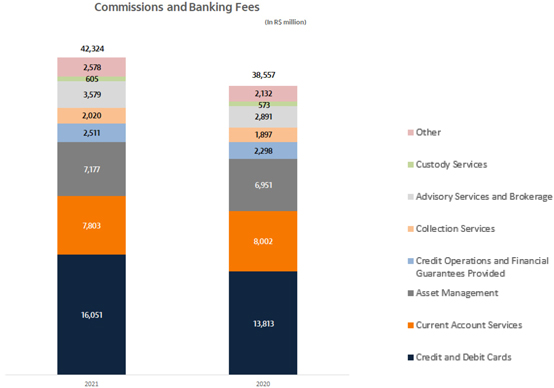
Commissions and Banking Fees |
42,324 |
38,557 |
39,032 |
3,767 |
9.8 |
% |
(475 |
) |
(1.2)% |
|||||||||||||||||||
Brazil |
37,635 | 34,533 | 35,283 | 3,102 | 9.0 | % | (750 | ) | (2.1)% | |||||||||||||||||||
Abroad |
4,689 | 4,024 | 3,749 | 665 | 16.5 | % | 275 | 7.3% | ||||||||||||||||||||
Income from insurance and private pension operations before claim and selling expenses before claim and selling expenses |
5,354 |
4,488 |
4,553 |
866 |
19.3 |
% |
(65 |
) |
(1.4)% |
|||||||||||||||||||
Brazil |
5,332 | 4,488 | 4,423 | 844 | 18.8 | % | 65 | 1.5% | ||||||||||||||||||||
Abroad |
22 | — | 130 | 22 | — | (130 | ) | (100.0)% | ||||||||||||||||||||
|
|
|
|
|
|
|
|
|
|
|
|
|
|
(1) | Includes interest and similar income, income of financial assets and liabilities at fair value through profit or loss, foreign exchange results, and exchange variation on transactions abroad. |
(2) | ITAÚ UNIBANCO HOLDING does not have clients representing 10% or greater of its revenues. |
(In billions of R$) |
||||||||||||
Position |
Banks by total assets (1) |
Control Type |
As of September 30, |
|||||||||
2021 |
% of Total |
|||||||||||
1 st |
Itaú Unibanco Holding S.A. | privately-owned |
1,973.7 | 16.2 | ||||||||
2 nd |
Banco do Brasil S.A.(2) | state-owned | 1,960.2 | 16.1 | ||||||||
3 rd |
Caixa Econômica Federal | state-owned | 1,485.1 | 12.2 | ||||||||
4 th |
Banco Bradesco S.A. | privately-owned | 1,471.6 | 12.1 | ||||||||
5 th |
Banco Santander Brasil S.A. | privately-owned | 989.2 | 8.1 | ||||||||
6 th |
Banco Nacional de Desenvolvimento Econômico e Social | state-owned | 755.7 | 6.2 | ||||||||
7 th |
Banco BTG Pactual S.A. | privately-owned | 395.2 | 3.2 | ||||||||
8 th |
Banco Safra S.A. | privately-owned | 238.6 | 2.0 | ||||||||
9 th |
Banco Citibank S.A. | privately-owned | 137.5 | 1.1 | ||||||||
10 th |
J.P. Morgan S.A | privately-owned | 103.8 | 0.9 | ||||||||
n.a. |
Others | n.a. | 2,673.9 | 21.9 | ||||||||
Total (3) |
12,184.5 |
100.0 |
||||||||||
|
|
|
|
(1) | Based on banking services, except insurance and pension funds. |
(2) | Includes the consolidation of 50.0% do Banco Votorantim S.A. based on Banco do Brasil’s shareholding stake and excludes these 50.0% of National Financial System. |
(3) | Excludes Payments Institutions |
Standard channels |
Branches |
CSBs |
ATMs |
|||||||||||||||||||||||||||||||||
2021 |
2020 |
2019 |
2021 |
2020 |
2019 |
2021 |
2020 |
2019 |
||||||||||||||||||||||||||||
Brazil |
3,244 | 3,231 | 3,347 | 656 | 656 | 671 | 20,006 | 20,687 | 21,384 | |||||||||||||||||||||||||||
Abroad |
399 | 413 | 448 | 36 | 36 | 37 | 1,068 | 1,071 | 1,107 | |||||||||||||||||||||||||||
Argentina |
65 | 71 | 74 | 13 | 13 | 13 | 175 | 175 | 176 | |||||||||||||||||||||||||||
Chile and Uruguay |
207 | 208 | 219 | 4 | 1 | 1 | 464 | 470 | 486 | |||||||||||||||||||||||||||
Colombia |
93 | 101 | 117 | 11 | 10 | 11 | 121 | 125 | 147 | |||||||||||||||||||||||||||
Paraguay |
29 | 28 | 32 | 8 | 12 | 12 | 308 | 301 | 298 | |||||||||||||||||||||||||||
Other |
5 | 5 | 6 | — | — | — | — | — | — | |||||||||||||||||||||||||||
Total in Brazil and abroad |
3,643 |
3,644 |
3,795 |
692 |
692 |
708 |
21,074 |
21,758 |
22,491 |
|||||||||||||||||||||||||||
|
|
|
|
|
|
|
|
|
|
|
|
|
|
|
|
|
|
1. | It’s only good for us if it’s good for the client; |
2. | We are passionate about performance; |
3. | People mean everything to us; |
4. | The best argument is the only one that matters; |
5. | Simple. Always; |
6. | We think and act like owners; and |
7. | Ethics is not negotiable. |
1. | Conduct and behavior |
2. | Our busine ss |
3. | Commitments for the development of the country |
4. | Accountability |
1. |
Conduct and behavior |
a) | Human capital and Diversity |
• | Foster a respectful and healthy environment for all the people who work at the organization; |
• | Promote equal opportunities for all employees; and |
• | Develop corporate leaders who are sensitive about and engaged with this commitment. |
• | Female Employees |
• | Black Employees |
• | People with Disabilities (PwD) |
• | LGBT+ |
b) | Human Rights |
2. |
Our business |
a) | Financing in Positive Impact Sectors |
b) | ESG Integration in Asset Management |
c) | Sustainable Bonds |
Green Instrument |
d) | Climate change |
NetZero | Commitment |
3. |
Commitments for the development of the country |
a) | Environmental: Biodiversity and the Amazon Region. |
• | meat processing industry and deforestation: |
• | financial and non-financial support for sustainable cultivationnon-financial tools. |
• | land regularization |
• | bio economy: |
b) | Social Private Investment |
c) | Todos pela Saúde institute |
4. |
Accountability: Transparency and Reporting |
• | Sustainability and customer satisfaction: |
• | Risk Culture: |
• | Risk pricing: |
• | Diversification: |
• | Operational excellence: |
• | Ethics and respect for regulations non-negotiable. For this reason, we promote an institutional environment of integrity, educating our employees to cultivate ethical relationships and businesses, as well as respecting the norms, and therefore looking after reputation. |
• | Decisions regarding our risk appetite, in terms of capital, liquidity, results, operational risk and reputation, ensuring these aspects are in alignment with our strategy, and including acceptable capital and liquidity levels and types of risks to which we may be exposed, as well as overall limits for each type of risk, tolerance for volatility of results and risk concentration, and general guidelines about tolerance for risks that may impact our brand (e.g., brand risk). |
• | Supervision of our risk management and control activities in order to ensure their suitability to the risk levels assumed and to the complexity of the operations as well as compliance with regulatory requirements; |
• | Review and approval of policies and strategies for capital management, to establish mechanisms and procedures aimed at keeping capital consistent with the risks we incur; |
• | Establishing our minimum expected return on capital as a whole and for our lines of business, as well as monitoring performance; |
• | Supervision of our incentive structures, including compensation, aimed at ensuring its alignment with risk control and value creation goals; and |
• | Fostering improvement in our Risk Culture. |
CMN | the highest authority of the Brazilian National Financial System (SFN) responsible for the currency and credit policy in Brazil to guarantee stability and social and economic development. Its major purpose is to disclose the general rules for the operation of the entire financial market. | |
Central Bank: | autonomous authority responsible for regulating and overseeing the entire National Financial System (SFN), ensuring the stability of the purchasing power of the currency and a solid and efficient financial system and for implementing the policies established by the CMN, authorizing the establishment of financial institutions and supervising them. | |
CVM | a government agency linked to the Ministry of the Economy with purpose of regulating, supervising and developing the securities market. | |
CNSP | responsible for establishing the guidelines and directives for insurance and premium bond companies and open private pension entities. | |
SUSEP | responsible for regulating and supervising the insurance, open private pension funds and capitalization markets in Brazil and their participants. | |
ANS | responsible for regulating and supervising the health insurance market in Brazil and its participants. |
Noteworthy regulatory requirements and restrictions on financial institutions: | • prohibition against operating in Brazil without prior approval of the Central Bank; • prohibition against acquiring real estate that is not for the financial institution’s own use, except those received for settlement of loan losses or as expressly authorized by the Central Bank, pursuant to CMN regulation; • prohibition against acquiring interests in companies without prior approval of the Central Bank, except for ownership interest typical of investment portfolios held by investment banks; • prohibition against granting loans that represent more than 25% of the financial institution’s regulatory capital to only one person or group; • restrictions on credit transactions to certain related individuals and legal entities; • obligation to deposit a portion of the deposits received from clients with the Central Bank (compulsory deposit); • obligation to maintain enough capital reserves to absorb unexpected losses, pursuant to the rules proposed by the Basel Committee and implemented by the Central Bank; • obligation to prepare and submit, by December 31, annual recovery plans that aim to re-establish adequate levels of capital and liquidity and to preserve the viability of the institution under stress scenarios;• obligation to create, in respect to financial guarantees, specific accounting procedures for the assessment and registration of passive provisions ( provisão passiva • prohibition against holding, on a consolidated basis, permanent assets, including investments in unconsolidated subsidiaries, real estate, equipment and intangible assets, exceeding 50.0% of the adjusted regulatory capital; • prohibition against granting loans or advances, and guarantees, including derivative transactions, underwriting or holding in their investment portfolio securities of any clients or group of affiliated clients that, in the aggregate, give rise to exposure to such client or group of affiliated clients that exceeds the threshold determined by the Central Bank. |
• | Partnership for Carbon Accounting Financials – PCAF: We are committed to measure and report the greenhousegas (GHG) emissions associated with our portfolio of loans and investments, using carbon estimation methodologies developed in conjunction with PCAF, in order to enable alignment of our portfolio with the Paris Agreement. |
• | Net-Zero Banking Alliance – NZBA: We are committed to establish goals for the transition of our operation and our credit portfolio to a net Zero Carbon economy by 2050, with intermediate goals, achieving a 50% reduction in our financed emissions by 2030 – a scenario consistent with the maximum increase in global average temperature of up to 1.5°C above pre-industrial levels by 2100, according to the IPCC. |
• | CMN Resolution 4327/2014: Requires financial institutions to establish an environmental and social responsibility policy. |
• | CMN Resolution 4943/2021: Amends the CMN Resolution 4557, which provides a risk management structure, the capital management structure and the information disclosure policy for Financial Institutions, in order to integrate social, environmental and climate aspects on the FI’s risk management structure. This rule will enter into effect in July 2022. |
• | CMN Resolution 4945/2021: Determines that Financial Institutions must establish, by July 2022 a Social, Environmental and Climate Responsibility Policy and implement actions aimed at its effectiveness. This Resolution revokes CMN Resolution 4327/2014 from December 2022. |
• | CMN Resolution 139/2021: Provides the disclosure information of the Social, Environmental and Climate Risks and Opportunities Report (GRSAC Report), which should be published by the Financial Institutions in 2023. The GRSAC Report must contain information regarding the following topics associated with social, environmental and climate risks: governance of risk management; actual and potential impacts of risks in the strategies adopted by the Institution in their business and risk and capital management; and risk management processes. This rule will enter into effect in December 2022. |
• | Central Bank Instruction 153/2021: Establishes the standards for the Social, Environmental and Climate Risks and Opportunities Report (GRSAC Report). This rule will enter into effect in December 2022. |
• | CVM Instruction 480/2009: Provides instruction for the registration of issuers of securities admitted to trading on securities markets, including aspects of social, environmental and climate risk that must be observed by companies. |
2021 |
||||
Common Equity Tier I |
4.5% |
|||
Tier l |
6.0% |
|||
Total Capital |
8.0% |
|||
Additional Capital Buffers (ACP) |
3.0% |
|||
conservation (1) |
2.0% |
|||
countercyclical (2) |
0% |
|||
systemic |
1.0% |
|||
Common Equity Tier I + ACP |
7.5% |
|||
Total Capital + ACP |
11.0% |
|||
Prudential adjustments deductions |
100% |
(1) |
For purposes of calculating the Conservation capital buffer, BACEN Resolution 4,783 establishes, for defined periods, percentages to be applied to the RWA value with a gradual increase until April/22, when it reaches 2.5%. |
(2) |
The countercyclical capital buffer is fixed by the Financial Stability Committee (Comef) based on discussions about the pace of credit expansion, and currently is set to zero (BACEN Communication No. 37,942/21}. Should the requirement increase, the new percentage taxes effect twelve months after the announcement. |
2021 (1) |
||||
Liquidity Coverage Ratio (LCR) |
100% |
(1) |
Mininum requirement valid from 1 January, 2019 onwards. |
• prudential indicators and risk management; |
• comparison between accounting and prudential information; | |
• capital composition; |
• macroprudential indicators; | |
• leverage ratio (RA); |
• liquidity indicators; | |
• credit risk; |
• counterparty credit risk (CCR); | |
• securitization exposures; |
• market risk; | |
• risk of interest rate fluctuation in instruments classified in the banking book (IRRBB); and |
• remuneration of administrators. |
• | The possibility of issuance of financial bills convertible into equity. The conversion may not be requested by the investor or the issuer financial institution. |
• | The suspension of interests’ payments in case of non-compliance with capital requirement rules. Additionally, in order to preserve the regular functioning of the Brazilian financial system, the Central Bank may determine that financial bills be converted into equity or be written-off. These determinations will not be considered as a financial institution’s default and will not accelerate the maturity of its other debts. |
• | The possibility of issuance of perpetual financial bills, which will only mature in case of default interest’s payments or at the time of the dissolution of the financial institution; and |
• | The institution of due diligence obligations to be observed by the issuer or any intermediary institutions involved in the distribution, placement and trading of the financial bills, in order to ensure the provision of information regarding the investment and its suitability to the investor’s profile; and |
• | The flexibilization of the rates that can be used in the remuneration of financial bills, allowing the use of floating rates regardless of a combination with a fixed rate or any other rate (fixed or floating) that is publicly known and regularly calculated. |
(i) | To our Investor Relations website (see – “Menu—Itaú Unibanco—Corporate Governance—Regulations and Policies—Policies—Anti-corruption Corporate Policy”) from which you can electronically access further details about our Anti-corruption Corporate Policy. |
(ii) | To our Investor Relations website (see—“Menu—Itaú Unibanco—Corporate Governance—Regulations and Policies—Policies—Corporate Conduct, Integrity and Ethics Policy”) from which you can electronically access further details about our Integrity and Ethics Program and guidelines for situations of conflicts of interests. |
(iii) | To our Investor Relations website (see—“Menu—Itaú Unibanco—Integrity and Ethics”) from which you can electronically access further details about our Integrity and Ethics Program. |
Classification (1) |
AA |
A |
B |
C |
D |
E |
F |
G |
H | |||||||||
Allowance (%) |
0 | 0.5 | 1 | 3 | 10 | 30 | 50 | 70 | 100 | |||||||||
Past due (in days) |
— | — | 15 to 30 | 31 to 60 | 61 to 90 | 91 to 120 | 121 to 150 | 151 to 180 | Over 180 |
(1) | Our credit classification also takes into account the client’s credit profile, which may negatively impact the past due classification. |
(i) Temporary special administration regime or RAET: | a less severe special regime with limited duration which allows financial institutions to continue to operate – the whole management loses its offices and is replaced by a steering committee appointed by the Central Bank with broad management powers, which will adopt of measures aimed at the resumption of the financial institution’s regular activities. If resumption is not possible, this regime may be turned into an extrajudicial liquidation. | |
(ii) Intervention: | a time-limited regime in which the Central Bank appoints an intervenor that takes charge of the financial institution’s management, suspending its regular activities and dismissing the financial institution’s management, with the main purpose of preventing the continuation of certain irregularities and the aggravation of the financial situation of the financial institution, which can put assets at risk and harm the financial institution’s creditors – it suspends all actions related to payment obligations of the financial institution, prevents the early settlement or maturity of its obligations and freezes pre-existing deposits. | |
(iii) Extrajudicial liquidation: | process of dissolution of the company in cases of unrecoverable insolvency or severe violations of the rules that regulate a financial institution’s activities. The extrajudicial liquidation aims at promoting the liquidation of the existing assets for the payment of creditors, with the return of any amounts left to stockholders. Controlling stockholders may be held responsible for remaining liabilities. |
• | identifying and knowing their clients, which includes determining if they are PEPs, and also identifying Ultimate Beneficial Owners (UBOs). These records should be kept up-to-date; |
• | checking the origin of funds of a client, as well as the compatibility between the movement of its funds and its economic and financial capacity; |
• | carrying out a prior analysis of new products and services, including the use of new technologies, if applicable, under the perspective of money laundering prevention; |
• | keeping records of all transactions carried out or financial services provided on behalf of a certain client or for that client; |
• | reporting to COAF, within one business day, any transaction deemed to be suspicious by the financial institution, as well as all transactions in cash equivalent to or higher than R$50,000, without informing the involved person or any third party; |
• | applying special attention to (i) unusual transactions or proposed transactions with no apparent economic or legal bases; (ii) transactions involving PEPs, (iii) indication of evading client identification and transaction registering procedures; (iv) clients and transactions for which the UBO cannot be identified; (v) transactions originated from or destined to countries that do not fully comply with the recommendations of the FATF; and (vi) situations in which it is not possible to keep the clients’ identification records duly updated; |
• | determining criteria for hiring personnel and offering anti-money laundering training for employees; |
• | establishing procedures to be complied with by all branches and subsidiaries of Brazilian financial institutions located abroad with respect to anti-money laundering; |
• | establishing that any institutions authorized to operate in the Brazilian foreign exchange market with financial institutions located abroad, must verify whether the foreign financial institution is physically located in the jurisdiction where it was incorporated and licensed, and that it is subject to effective supervision; |
• | monitoring transactions and situations which could be considered suspicious for anti-money laundering purposes; |
• | reporting to COAF the occurrence of suspicious transactions, as required under applicable regulations, and also, at least once a year, whether or not suspicious transactions are verified, in order to certify the non-occurrence of transactions subject to reporting to COAF (negative report); |
• | requiring clients to inform the financial institution, at least three business days in advance, of their intention to withdraw amounts equal to or exceeding R$50,000; |
• | maintaining specific records of all operations carried out, products and services contracted by financial institutions, including deposit, contribution, withdrawal, payments, receipts and transfers of funds |
• | ensuring that policies, procedures and internal controls are commensurate with its size and volume of transactions; and |
• | unavailability, without delay, of goods, values and rights of possession or ownership and all other rights, real or personal, owned, directly or indirectly, of natural or legal persons subject to sanctions by the resolutions of the UNSC. |
Basic consumer rights dealing with financial institutions: | • Reverse burden of proof in court; • Proper and clear information provided with respect to the products and services offered (e.g.; quantity, characteristics, composition, quality, price and risks such products pose); • Proportional reduction of interest charged in connection with personal credit and consumer directed credit transactions in case of early payment of debts; • In limited circumstances, amounts charged improperly may have to be returned in an amount equal to twice what was paid in excess of due amounts, except in cases of justifiable mistakes (e.g.; systemic failure or operational error); • Collection of credits cannot expose the client to embarrassment or be performed in a threatening manner; • Prohibition on the release of misleading or abusive publicity or information about contracts or services, as well as on the promoting of overbearing or disloyal commercial practices; and • Liability for any damages caused to consumers by misrepresentations in their publicity or information provided. |
• | An assessment of the internal controls and risk management procedures of the financial institution, including its electronic data processing system; |
• | A description of non-compliance with legal and regulatory provisions that have, or may have, a significant impact on the audited financial statements or operations of the audited financial institution; and |
• | Others reports required by the Central Bank. |
the disclosure of information with the express consent of the interested parties; | the exchange of information between financial institutions for record purposes; | |
the disclosure of information to credit reference agencies based on data from the records of subscribers of checks drawn on accounts without sufficient funds and defaulting debtors; | the disclosure of information to the competent authorities relating to the actual or suspected occurrence of criminal acts or administrative wrongdoings, including the disclosure of information on transactions involving funds related to any unlawful activities; | |
the disclosure of some information established by law to tax authorities; and | the disclosure of information in compliance with a judicial order. |
Tax |
Rate |
Tax calculation basis | ||
IRPJ | 15.0% plus a 10.0% surtax | Net income with adjustments (exclusions, additions, and deductions) | ||
CSLL | 25.0% (banking institutions) and 20.0% (other institutions authorized to operate by the Central Bank and insurance and capitalization companies) until December 31, 2021. From January 2022 onwards, the applicable CSLL rate is 20.0% (banking institutions) and 15.0% (other institutions authorized to operate by the Central Bank and insurance and capitalization companies). 9.0% (other Itaú Unibanco Group companies) |
Net income with adjustments (exclusions, additions, and deductions) | ||
COFINS | 4.0% (financial institutions, insurance companies, capitalization and similar entities) or 7.6% (other Itaú Unibanco Group companies) | Gross revenue minus specific deductions | ||
PIS | 0.65% (financial institutions, insurance companies, capitalization and similar entities) or 1.65% (other Itaú Unibanco Group companies) | Gross revenue minus specific deductions | ||
ISS | 2.0% to 5.0% | Price of service rendered | ||
IOF | Depends on the type of the transaction, as described below. | Transaction nominal value |
Type of transaction |
Applicable Rates (Rates may be changed by a decree enacted by the Brazilian government up to a maximum rate, as described below, which may become effective as of its publication date) | |
Foreign exchange transactions |
IOF/FX: zero to 6.38% (depending on the transaction) Maximum rate: 25% | |
Insurance transactions | IOF/Insurance: zero to 7.38% Maximum rate: 25% | |
Loans and credit transactions |
IOF/Credit: 0.0082% (individual) or 0.0041% (legal entities) per day, until it reaches 365 days, plus a flat 0.38% rate. Between September 20, 2021, and December 31, 2021: 0,01118% (individual) or 0,00559% (legal entities) per day, until it reaches 365 days, plus a flat 0.38% rate. Maximum rate: 1.5% per day | |
Securities | IOF/Securities: zero to 1.5% as a general rule Maximum rate: 1.5% per day | |
Securities – Derivatives | IOF/Securities – Derivatives: zero Maximum rate: 25% |
2021 |
2020 (2) |
2019 (2) |
||||||||||||||||||||||||||||||||||
Average balance |
Interest |
Average yield/ rate |
Average balance |
Interest |
Average yield/ rate |
Average balance |
Interest |
Average yield/ rate |
||||||||||||||||||||||||||||
Assets |
(In millions of R$, except percentages) |
|||||||||||||||||||||||||||||||||||
Interest-earning assets (1) |
1,794,797 |
145,931 |
8.1 |
% |
1,671,121 |
120,922 |
7.2 |
% |
1,430,016 |
144,381 |
10.1 |
% | ||||||||||||||||||||||||
Interest-bearing deposits in other banks |
62,697 | 1,203 | 1.9 | % | 52,958 | 1,102 | 2.1 | % | 30,731 | 1,173 | 3.8 | % | ||||||||||||||||||||||||
Securities purchased under agreements to resell |
195,340 | 9,812 | 5.0 | % | 274,811 | 9,832 | 3.6 | % | 258,768 | 16,197 | 6.3 | % | ||||||||||||||||||||||||
Central Bank compulsory deposits |
86,641 | 3,613 | 4.2 | % | 75,259 | 2,242 | 3.0 | % | 84,810 | 4,734 | 5.6 | % | ||||||||||||||||||||||||
Financial Assets |
627,243 | 38,691 | 6.2 | % | 537,764 | 28,271 | 5.3 | % | 437,859 | 40,198 | 9.2 | % | ||||||||||||||||||||||||
Financial assets at fair value through profit or loss |
378,731 | 16,678 | 4.4 | % | 308,867 | 6,553 | 2.1 | % | 261,385 | 26,230 | 10.0 | % | ||||||||||||||||||||||||
Financial assets at fair value through other comprehensive income |
107,825 | 17,193 | 15.9 | % | 94,763 | 18,089 | 19.1 | % | 56,511 | 11,386 | 20.1 | % | ||||||||||||||||||||||||
Financial assets at amortized cost |
140,686 | 4,820 | 3.4 | % | 134,134 | 3,629 | 2.7 | % | 119,962 | 2,582 | 2.2 | % | ||||||||||||||||||||||||
Other Financial Assets |
94,925 | (177 | ) | -0.2 | % | 96,403 | (28 | ) | 0.0 | % | 82,475 | 1,033 | 1.3 | % | ||||||||||||||||||||||
Loans and leases |
727,951 | 92,789 | 12.7 | % | 633,926 | 79,503 | 12.5 | % | 535,374 | 81,046 | 15.1 | % | ||||||||||||||||||||||||
Non-interest-earning assets |
220,499 |
225,959 |
155,209 |
|||||||||||||||||||||||||||||||||
Cash and due from banks |
41,078 | 42,186 | 31,964 | |||||||||||||||||||||||||||||||||
Central Bank compulsory deposits |
9,516 | 11,469 | 5,380 | |||||||||||||||||||||||||||||||||
Derivatives |
74,387 | 71,241 | 33,351 | |||||||||||||||||||||||||||||||||
Non-accrual loans |
25,293 | 23,317 | 22,777 | |||||||||||||||||||||||||||||||||
Provisions for Expected Loss |
(46,812 | ) | (45,641 | ) | (35,152 | ) | ||||||||||||||||||||||||||||||
Premises and equipment, net |
6,873 | 6,869 | 7,238 | |||||||||||||||||||||||||||||||||
Investments in unconsolidated companies |
9,845 | 15,335 | 12,544 | |||||||||||||||||||||||||||||||||
Goodwill |
1,724 | 3,928 | 10,970 | |||||||||||||||||||||||||||||||||
Intangible assets, net |
17,256 | 15,310 | 12,473 | |||||||||||||||||||||||||||||||||
Tax assets |
63,018 | 65,419 | 43,143 | |||||||||||||||||||||||||||||||||
Assets held for sale |
358 | 494 | 718 | |||||||||||||||||||||||||||||||||
Other assets |
17,964 | 16,031 | 9,803 | |||||||||||||||||||||||||||||||||
Total |
2,015,297 |
1,897,080 |
1,585,225 |
(1) | For the net yield on total average interest-earning assets, see “Net Interest Margin and Spread”. |
(2) | Effect of reclassifications in the methodology of 2020 and 2019 in the calculation of the average balances for purposes of comparability with the 2021 average balance. |
Liabilities |
2021 |
2020 (1) |
2019 (1) |
|||||||||||||||||||||||||||||||||
Average balance |
Interest |
Average yield/rate |
Average balance |
Interest |
Average yield/rate |
Average balance |
Interest |
Average yield/rate |
||||||||||||||||||||||||||||
(In millions of R$, except percentages) |
||||||||||||||||||||||||||||||||||||
Interest-bearing liabilities |
1,557,003 |
69,305 |
4.5 |
% |
1,487,957 |
73,558 |
4.9 |
% |
1,260,477 |
75,958 |
6.0 |
% | ||||||||||||||||||||||||
Interest-bearing deposits |
667,407 | 20,492 | 3.1 | % | 570,047 | 17,478 | 3.1 | % | 395,270 | 18,559 | 4.7 | % | ||||||||||||||||||||||||
Savings deposits |
184,469 | 6,161 | 3.3 | % | 161,226 | 5,245 | 3.3 | % | 138,034 | 7,186 | 5.2 | % | ||||||||||||||||||||||||
Deposits from banks and time deposits |
482,938 | 14,331 | 3.0 | % | 408,821 | 12,233 | 3.0 | % | 257,236 | 11,373 | 4.4 | % | ||||||||||||||||||||||||
Securities sold under repurchase agreements |
249,691 | 8,635 | 3.5 | % | 287,212 | 10,690 | 3.7 | % | 299,225 | 20,473 | 6.8 | % | ||||||||||||||||||||||||
Interbank market debt and Institutional market debt |
299,712 | 34,794 | 11.6 | % | 307,600 | 37,278 | 12.1 | % | 256,057 | 20,068 | 7.8 | % | ||||||||||||||||||||||||
Interbank market debt |
161,931 | 24,929 | 15.4 | % | 174,466 | 28,878 | 16.6 | % | 155,977 | 13,231 | 8.5 | % | ||||||||||||||||||||||||
Institutional market debt |
137,781 | 9,865 | 7.2 | % | 133,135 | 8,400 | 6.3 | % | 100,080 | 6,837 | 6.8 | % | ||||||||||||||||||||||||
Reserves for insurance and private pension and Liabilities for capitalization plans |
221,084 | 5,346 | 2.4 | % | 220,274 | 8,121 | 3.7 | % | 212,972 | 16,720 | 7.9 | % | ||||||||||||||||||||||||
Other interest-bearing liabilities |
119,109 | 38 | 0.0 | % | 102,824 | (9 | ) | 0.0 | % | 96,953 | 138 | 0.1 | % | |||||||||||||||||||||||
Non-interest bearing liabilities |
300,039 |
261,483 |
180,470 |
|||||||||||||||||||||||||||||||||
Non-interest bearing deposits |
145,306 | 111,921 | 76,381 | |||||||||||||||||||||||||||||||||
Other non-interest-bearing liabilities |
154,733 | 149,562 | 104,089 | |||||||||||||||||||||||||||||||||
Total stockholders’ equity attributed to the owners of the parent company |
146,678 |
135,087 |
130,500 |
|||||||||||||||||||||||||||||||||
Non-controlling interests |
11,577 |
12,552 |
13,778 |
|||||||||||||||||||||||||||||||||
Total |
2,015,297 |
1,897,080 |
1,585,225 |
(1) | Effect of reclassifications in the methodology of 2020 and 2019 in the calculation of the average balances for purposes of comparability with the 2021 average balance. |
Increase/(decrease) due to changes in: |
|||||||||||||||||||||||
2021-2020 |
2020-2019 |
|||||||||||||||||||||||
Volume (1) |
Yield/rate (2) |
Net change (3) |
Volume (1) |
Yield/rate (2) |
Net change (3) |
|||||||||||||||||||
(In millions of R$, except percentages) |
||||||||||||||||||||||||
Interest-earning assets |
19,116 |
5,894 |
25,009 |
(8,555 |
) |
(14,904 |
) |
(23,459 |
) | |||||||||||||||
Interest-bearing deposits in other banks |
175 | (74 | ) | 101 | (191 | ) | 120 | (71 | ) | |||||||||||||||
Securities purchased under agreements to resell |
50 | (70 | ) | (20 | ) | 1,077 | (7,442 | ) | (6,365 | ) | ||||||||||||||
Central Bank compulsory deposits |
376 | 995 | 1,371 | (485 | ) | (2,007 | ) | (2,492 | ) | |||||||||||||||
Financial Assets |
6,547 | 3,873 | 10,420 | 13,487 | (25,415 | ) | (11,928 | ) | ||||||||||||||||
Financial assets at fair value through profit or loss |
1,759 | 8,366 | 10,125 | 5,889 | (25,567 | ) | (19,678 | ) | ||||||||||||||||
Financial assets at fair value through other comprehensive income |
4,603 | (5,499 | ) | (896 | ) | 7,268 | (565 | ) | 6,703 | |||||||||||||||
Financial assets at amortized cost |
185 | 1,006 | 1,191 | 330 | 717 | 1,047 | ||||||||||||||||||
Other Financial Assets |
0 | (149 | ) | (149 | ) | 209 | (1,269 | ) | (1,060 | ) | ||||||||||||||
Loans and leases |
11,966 | 1,320 | 13,286 | (22,652 | ) | 21,109 | (1,543 | ) | ||||||||||||||||
Interest-bearing liabilities |
(32 |
) |
(4,221 |
) |
(4,253 |
) |
7,059 |
(9,459 |
) |
(2,400 |
) | |||||||||||||
Interest-bearing deposits |
2,972 | 42 | 3,014 | 3,480 | (4,561 | ) | (1,081 | ) | ||||||||||||||||
Saving deposits |
773 | 143 | 916 | 1,575 | (3,516 | ) | (1,941 | ) | ||||||||||||||||
Deposits from Banks and Time Deposits |
2,198 | (101 | ) | 2,098 | 1,905 | (1,045 | ) | 860 | ||||||||||||||||
Securities sold under repurchase agreements |
(1,332 | ) | (723 | ) | (2,055 | ) | (792 | ) | (8,991 | ) | (9,783 | ) | ||||||||||||
Interbank market debt and Institutional market debt |
(1,700 | ) | (784 | ) | (2,484 | ) | 3,768 | 13,442 | 17,210 | |||||||||||||||
Interbank market debt |
(2,001 | ) | (1,948 | ) | (3,949 | ) | 1,734 | 13,913 | 15,647 | |||||||||||||||
Institutional market debt |
301 | 1,164 | 1,465 | 2,034 | (471 | ) | 1,563 | |||||||||||||||||
Reserves for insurance and private pension and Liabilities for capitalization plans |
30 | (2,805 | ) | (2,775 | ) | 594 | (9,193 | ) | (8,599 | ) | ||||||||||||||
Other Interest-bearing liabilities |
(2 | ) | 49 | 47 | 9 | (156 | ) | (147 | ) | |||||||||||||||
|
|
|
|
|
|
|
|
|
|
|
|
(1) | Volume change has been computed as the change in the average interest-earning assets or interest-bearing liabilities from one period to the other multiplied by the average yield/rate in the earlier period. |
(2) | Yield/rate change has been computed as the change in the yield/rate in the period multiplied by the average interest-earning assets or interest-bearing liabilities in the earlier period. |
(3) | We allocated the net change from the combined effects of volume and yield/rate proportionately to volume change and yield/rate change, in absolute terms. |
2021 |
2020 |
2019 |
||||||||||
(In millions of R$, except percentages) |
||||||||||||
Total average interest-earning assets |
1,794,797 | 1,671,121 | 1,430,016 | |||||||||
Total average interest-bearing liabilities |
1,557,003 | 1,487,957 | 1,260,477 | |||||||||
Net interest income (1) |
76,626 | 47,364 | 68,423 | |||||||||
Average yield on average interest-earning assets (2) |
8.1 | % | 7.2 | % | 10.1 | % | ||||||
Average rate on average interest-bearing liabilities (3) |
4.5 | % | 4.9 | % | 6.0 | % | ||||||
Net interest spread (4) |
3.7 | % | 2.3 | % | 4.1 | % | ||||||
Net interest margin (5) |
4.3 | % | 2.8 | % | 4.8 | % | ||||||
|
|
|
|
|
|
(2) | Total interest, similar income and dividends divided by total average interest-earning assets. |
(3) | Total interest and similar expenses divided by total average interest-bearing liabilities. |
(4) | Difference between the average yield on interest-earning assets and the average rate on interest-bearing liabilities. |
(5) | Net interest income divided by total average interest-earning assets. |
For The Year Ended December 31, |
||||||||||||
Financial Assets at Fair Value Through Profit or Loss |
2021 |
2020 |
2019 |
|||||||||
Fair value |
Fair value |
Fair value |
||||||||||
(In millions of R$) |
||||||||||||
Investment funds |
20,139 |
14,204 |
8,267 |
|||||||||
Brazilian government securities (1a) |
221,755 |
285,885 |
219,611 |
|||||||||
Government securities – abroad (1b) |
5,561 |
8,210 |
1,520 |
|||||||||
Argentina |
930 | 1,498 | 318 | |||||||||
Chile |
837 | 840 | 488 | |||||||||
Colombia |
1,059 | 3,603 | 409 | |||||||||
United States |
2,671 | 2,085 | 141 | |||||||||
Mexico |
19 | 5 | 57 | |||||||||
Paraguay |
10 | 3 | 2 | |||||||||
Peru |
8 | 5 | 8 | |||||||||
Uruguay |
27 | 41 | 97 | |||||||||
Italy |
— | 130 | — | |||||||||
Corporate securities (1c) |
114,468 |
77,032 |
50,642 |
|||||||||
Shares |
19,357 | 19,047 | 14,637 | |||||||||
Rural product note |
6,852 | 2,349 | — | |||||||||
Bank deposit certificates |
150 | 729 | 792 | |||||||||
Real estate receivables certificates |
1,012 | 548 | 1,444 | |||||||||
Debentures |
65,788 | 29,937 | 12,655 | |||||||||
Eurobonds and other |
5,253 | 2,383 | 2,173 | |||||||||
Financial bills |
10,111 | 15,783 | 18,514 | |||||||||
Promissory and commercial notes |
4,684 | 5,616 | 313 | |||||||||
Other |
1,261 | 640 | 114 | |||||||||
|
|
|
|
|
|
|||||||
Total |
361,923 |
385,331 |
280,040 |
|||||||||
|
|
|
|
|
|
(1) | Financial assets at fair value through profit or loss – Securities pledged as Guarantee of Funding of Financial Institutions and Customers were: a) R$ 50,116 (R$ 12,181 at 12/31/2020 and R$ 28,759 at 12/31/2019), b) R$ 171 (R$ 765 at 12/31/2020 and R$ 329 at 12/31/2019) and c) R$ 15,984 (R$ 8,556 at 12/31/2020 and R$ 104 at 12/31/2019), totaling R$ 66,271 (R$ 21,502 at 12/31/2020 and R$ 29,192 at 12/31/2019). |
For The Year Ended December 31, |
||||||||||||
Financial Assets at Fair Value Through Other Comprehensive Income |
2021 |
2020 |
2019 |
|||||||||
Fair value |
Fair value |
Fair value |
||||||||||
(In millions of R$) |
||||||||||||
Brazilian government securities (1a) |
69,642 |
67,949 |
50,732 |
|||||||||
Other |
— | — | — | |||||||||
Government securities – abroad (1b) |
30,194 |
34,402 |
20,571 |
|||||||||
Germany |
— | — | 23 | |||||||||
Argentina |
405 | — | — | |||||||||
Colombia |
1,847 | 3,986 | 3,878 | |||||||||
Chile |
19,734 | 21,651 | 11,208 | |||||||||
United States |
4,518 | 3,750 | 2,756 | |||||||||
Italy |
— | — | 329 | |||||||||
Mexico |
1,022 | 1,181 | — | |||||||||
Paraguay |
1,459 | 2,947 | 1,780 | |||||||||
Uruguay |
1,209 | 887 | 597 | |||||||||
Corporate securities (1c) |
5,786 |
7,591 |
5,357 |
|||||||||
Shares |
743 | 1,382 | 149 | |||||||||
Bank deposit certificates |
131 | 307 | 2,371 | |||||||||
Securitized real estate loans |
— | — | 26 | |||||||||
Debentures |
351 | 889 | 334 | |||||||||
Eurobonds and others |
4,498 | 5,013 | 2,477 | |||||||||
Financial bills |
6 | — | — | |||||||||
Other |
57 | — | — | |||||||||
|
|
|
|
|
|
|||||||
Total |
105,622 |
109,942 |
76,660 |
|||||||||
|
|
|
|
|
|
(1) | The fair value of Financial assets at fair value through other comprehensive income—Securities pledged in guarantee of funding transactions of financial institutions and customers were: a) R$ 43,500 (R$ 35,203 at 12/31/2020 and R$ 27,864 at 12/31/2019), b) R$ 2,385 (R$ 2,398 at 12/31/2020 and R$ 590 at 12/31/2019) and c) R$ 778 (R$ 518 at 12/31/2020), totaling R$ 40,723 (R$ 38,119 at 12/31/2020 and R$ 28,454 at 12/31/2019). |
For the Year Ended December 31, |
||||||||||||
FinancialAssets at Amortized Cost |
2021 |
2020 |
2019 |
|||||||||
Fair Value |
Fair Value |
Fair Value |
||||||||||
(In millions of R$) |
||||||||||||
Brazilian government securities (1a) |
68,008 |
64,524 |
56,303 |
|||||||||
Government securities – abroad |
24,881 |
19,081 |
17,226 |
|||||||||
Colombia |
924 | 500 | 335 | |||||||||
Chile |
828 | 704 | 621 | |||||||||
Korea |
5,604 | 3,947 | 3,427 | |||||||||
Spain |
6,131 | 4,844 | 4,984 | |||||||||
United States |
— | — | 80 | |||||||||
Mexico |
11,372 | 9,036 | 7,763 | |||||||||
Uruguay |
22 | 50 | 16 | |||||||||
Corporate securities (1b) |
52,909 |
43,134 |
56,937 |
|||||||||
Rural product note |
5,892 | 3,474 | 5,341 | |||||||||
Bank deposit certificates |
109 | 30 | 54 | |||||||||
Securitized real estate loans |
3,987 | 4,794 | 5,842 | |||||||||
Debentures |
37,520 | 31,897 | 38,521 | |||||||||
Eurobonds and others |
455 | 208 | 1,082 | |||||||||
Financial bills |
51 | — | — | |||||||||
Promissory and commercial notes |
4,217 | 2,013 | 4,998 | |||||||||
Other |
678 | 718 | 1,099 | |||||||||
|
|
|
|
|
|
|||||||
Total |
145,798 |
126,739 |
130,466 |
|||||||||
|
|
|
|
|
|
(1) | Financial Assets at Amortized Cost – Securities Pledged as Collateral of Funding Transactions of Financial Institutions and Customers were: a) R$ 12,570 (R$ 13,786 at 12/31/2020 and R$ 9,583 at 12/31/2019); and b) R$ 11,358 (R$ 14,364 at 12/31/2020 and R$ 17,457 at 12/31/2019), totaling R$ 23,928 (R$ 28,150 at 12/31/2020 and R$ 27,040 at 12/31/2019). |
Derivative Financial Instruments |
ForThe Year Ended December 31, |
|||||||||||||||||||||||
2021 |
% of total |
2020 |
% of total |
2019 |
% of total |
|||||||||||||||||||
(In millions of R$, except percentages) |
|||||||||||||||||||||||
Assets |
||||||||||||||||||||||||
Options agreements |
21,252 | 30.8 | 20,418 | 26.7 | 8,456 | 20.2 | ||||||||||||||||||
Forwards |
3,111 | 4.5 | 2,085 | 2.7 | 2,162 | 5.2 | ||||||||||||||||||
Swaps – adjustment receivable |
38,014 | 55.0 | 46,019 | 60.2 | 26,458 | 63.2 | ||||||||||||||||||
Credit derivatives |
242 | 0.4 | 156 | 0.2 | 167 | 0.4 | ||||||||||||||||||
NDF—Non Deliverable Foward |
5,943 | 8.6 | 7,596 | 9.9 | 4,446 | 10.6 | ||||||||||||||||||
Others—derivative financial instruments |
483 | 0.7 | 230 | 0.3 | 165 | 0.4 | ||||||||||||||||||
Total derivative financial instruments assets |
69,045 |
100.0 |
76,504 |
100.0 |
41,854 |
100.0 |
||||||||||||||||||
Derivative financial instruments as percentage of total assets |
3.3% |
3.8% |
2.6% |
|||||||||||||||||||||
|
|
|
|
|
|
|
|
|
|
|
|
|||||||||||||
Liabilities |
||||||||||||||||||||||||
Options agreements |
(22,547 | ) | 35.7 | (20,262 | ) | 25.5 | (9,061 | ) | 18.9 | |||||||||||||||
Forwards |
(762 | ) | 1.2 | (905 | ) | 1.1 | (754 | ) | 1.6 | |||||||||||||||
Swaps – adjustment payable |
(34,646 | ) | 54.9 | (51,789 | ) | 65.1 | (32,927 | ) | 68.8 | |||||||||||||||
Credit derivatives |
(198 | ) | 0.3 | (76 | ) | 0.1 | (40 | ) | 0.1 | |||||||||||||||
NDF—Non Deliverable Foward |
(4,896 | ) | 7.7 | (6,426 | ) | 8.1 | (4,971 | ) | 10.4 | |||||||||||||||
Others—derivative financial instruments |
(155 | ) | 0.2 | (47 | ) | 0.1 | (75 | ) | 0.2 | |||||||||||||||
Total derivative financial instruments liabilities |
(63,204 |
) |
100.0 |
(79,505 |
) |
100.0 |
(47,828 |
) |
100.0 |
|||||||||||||||
Derivative financial instruments as percentage of total liabilities and stockholder’s equity |
3.1 |
% |
3.9 |
% |
2.9 |
% |
||||||||||||||||||
|
|
|
|
|
|
|
|
|
|
|
|
Distribution of our financial assets by maturity |
As of December 31, 2021 |
|||||||||||||||||||||||||||||||||||||||||||||||
No stated maturity |
Due in 1 year or less |
Due after 1 year to 5 years |
Due after 5 years to 10 years |
Due after 10 years |
Total |
|||||||||||||||||||||||||||||||||||||||||||
R$ |
Average yield (%) |
R$ |
Average yield (%) |
R$ |
Average yield (%) |
R$ |
Average yield (%) |
R$ |
Average yield (%) |
R$ |
Average yield (%) |
|||||||||||||||||||||||||||||||||||||
(In millions of R$, except percentages) |
||||||||||||||||||||||||||||||||||||||||||||||||
At Fair Value Through Profit or Loss |
32,853 |
44,204 |
211,325 |
50,688 |
22,853 |
361,923 |
||||||||||||||||||||||||||||||||||||||||||
Investment funds (1) |
13,496 | — | 167 | — | 6,311 | 0.0 | 165 | — | — | — | 20,139 | 0.0 | ||||||||||||||||||||||||||||||||||||
Government securities—domestic |
— | — | 29,283 | 6.8 | 156,123 | 6.4 | 23,251 | 4.4 | 13,098 | 5.1 | 221,755 | 6.2 | ||||||||||||||||||||||||||||||||||||
Government securities—abroad |
— | — | 4,031 | — | 865 | — | 530 | — | 135 | — | 5,561 | — | ||||||||||||||||||||||||||||||||||||
Argentina |
— | — | 890 | 2.3 | 35 | 0.7 | 3 | 2.3 | 2 | 0.0 | 930 | 2.3 | ||||||||||||||||||||||||||||||||||||
United States |
— | — | 2,479 | 0.2 | — | — | 192 | 14.1 | — | — | 2,671 | 1.2 | ||||||||||||||||||||||||||||||||||||
Mexico |
— | — | — | — | 3 | 6.6 | 13 | 8.6 | 3 | 14.2 | 19 | 9.2 | ||||||||||||||||||||||||||||||||||||
Chile |
— | — | 632 | 0.4 | 189 | 0.0 | 4 | 3.4 | 12 | 0.5 | 837 | 0.3 | ||||||||||||||||||||||||||||||||||||
Paraguay |
— | — | 6 | 3.2 | 2 | 3.8 | 1 | 5.3 | 1 | 3.3 | 10 | 3.5 | ||||||||||||||||||||||||||||||||||||
Uruguay |
— | — | 19 | 1.8 | 1 | 10.0 | 6 | 8.7 | 1 | 13.3 | 27 | 4.0 | ||||||||||||||||||||||||||||||||||||
Colombia |
— | — | 5 | 3.5 | 630 | 0.9 | 311 | 1.2 | 113 | 0.6 | 1,059 | 0.9 | ||||||||||||||||||||||||||||||||||||
Italy |
— | — | — | — | — | — | ||||||||||||||||||||||||||||||||||||||||||
Peru |
— | — | — | — | 5 | — | — | — | 3 | — | 8 | — | ||||||||||||||||||||||||||||||||||||
Corporate securities |
19,357 | — | 10,723 | — | 48,026 | — | 26,742 | — | 9,620 | — | 114,468 | — | ||||||||||||||||||||||||||||||||||||
Shares |
19,357 | 0.0 | — | 0.0 | — | — | — | — | — | — | 19,357 | 0.0 | ||||||||||||||||||||||||||||||||||||
Securitized real estate loans |
— | — | — | — | 437 | 0.5 | 365 | 0.2 | 210 | 1.6 | 1,012 | 0.6 | ||||||||||||||||||||||||||||||||||||
Bank deposit certificates |
— | — | 24 | 1.8 | 126 | 0.6 | — | — | — | — | 150 | 0.8 | ||||||||||||||||||||||||||||||||||||
Debentures |
— | — | 2,596 | 0.1 | 30,059 | 6.5 | 24,009 | 9.7 | 9,124 | 13.9 | 65,788 | 8.4 | ||||||||||||||||||||||||||||||||||||
Eurobonds and other |
— | — | 811 | 3.2 | 3,902 | 5.7 | 462 | 6.5 | 78 | 3.3 | 5,253 | 5.4 | ||||||||||||||||||||||||||||||||||||
Financial credit bills |
— | — | 1,960 | 2.0 | 6,724 | 1.2 | 1,219 | 0.4 | 208 | — | 10,111 | 1.3 | ||||||||||||||||||||||||||||||||||||
Promissory notes |
— | — | 2,395 | 7.4 | 2,289 | 2.0 | — | — | — | — | 4,684 | 4.8 | ||||||||||||||||||||||||||||||||||||
Rural product note |
— | — | 2,593 | 29.1 | 4,000 | 18.0 | 259 | 24.4 | — | — | 6,852 | 22.4 | ||||||||||||||||||||||||||||||||||||
Other |
— | — | 344 | 0.4 | 489 | 0.9 | 428 | 1.8 | — | — | 1,261 | 1.1 | ||||||||||||||||||||||||||||||||||||
|
|
|
|
|
|
|
|
|
|
|
|
|
|
|
|
|
|
|
|
|
|
|
|
|||||||||||||||||||||||||
Financial assets designated at fair value through profit or loss—Government securities—domestic—Brazilian external debt bonds |
— |
1,458 |
1,586 |
— |
— |
3,044 |
||||||||||||||||||||||||||||||||||||||||||
|
|
|
|
|
|
|
|
|
|
|
|
|
|
|
|
|
|
|
|
|
|
|
|
|||||||||||||||||||||||||
Derivatives |
— |
33,416 |
20,777 |
14,852 |
— |
69,045 |
||||||||||||||||||||||||||||||||||||||||||
|
|
|
|
|
|
|
|
|
|
|
|
|
|
|
|
|
|
|
|
|
|
|
|
|||||||||||||||||||||||||
At Fair Value Through Other Comprehensive Income |
743 |
25,685 |
63,256 |
— |
11,557 |
— |
4,381 |
— |
105,622 |
— |
||||||||||||||||||||||||||||||||||||||
|
|
|
|
|
|
|
|
|
|
|
|
|
|
|
|
|
|
|
|
|
|
|
|
|||||||||||||||||||||||||
Government securities—domestic |
— | — | 3,120 | 4.5 | 51,747 | 10.1 | 10,431 | 19.3 | 4,344 | 22.8 | 69,642 | 12.0 | ||||||||||||||||||||||||||||||||||||
Government securities—abroad |
— | — | 20,658 | — | 8,945 | — | 590 | — | 1 | — | 30,194 | — | ||||||||||||||||||||||||||||||||||||
Argentina |
— | — | 405 | 5.1 | — | — | — | — | — | — | 405 | 5.1 | ||||||||||||||||||||||||||||||||||||
United States |
— | — | 4,518 | — | — | — | — | — | — | — | 4,518 | — | ||||||||||||||||||||||||||||||||||||
Mexico |
— | — | 1,022 | 5.6 | — | — | — | — | — | — | 1,022 | 5.6 | ||||||||||||||||||||||||||||||||||||
Chile |
— | — | 12,159 | 0.3 | 7,222 | 0.2 | 353 | 0.3 | — | — | 19,734 | 0.3 | ||||||||||||||||||||||||||||||||||||
Paraguay |
— | — | 1,099 | — | 137 | — | 223 | — | — | — | 1,459 | — | ||||||||||||||||||||||||||||||||||||
Uruguay |
— | — | 1,190 | — | 4 | — | 14 | — | 1 | — | 1,209 | — | ||||||||||||||||||||||||||||||||||||
Colombia |
— | — | 265 | 1.5 | 1,582 | 2.6 | — | — | — | — | 1,847 | 2.4 | ||||||||||||||||||||||||||||||||||||
Corporate securities |
743 | — | 1,907 | — | 2,564 | — | 536 | — | 36 | — | 5,786 | — | ||||||||||||||||||||||||||||||||||||
Shares |
743 | — | — | — | — | — | — | — | — | — | 743 | — | ||||||||||||||||||||||||||||||||||||
Bank deposit certificates |
— | — | 124 | 1.1 | 7 | 7.9 | — | — | — | — | 131 | 1.5 | ||||||||||||||||||||||||||||||||||||
Debentures |
— | — | — | — | 84 | 2.4 | 267 | 25.3 | — | — | 351 | 19.8 | ||||||||||||||||||||||||||||||||||||
Eurobonds and others |
— | — | 1,783 | 0.6 | 2,410 | 2.1 | 269 | 3.6 | 36 | 7.0 | 4,498 | 1.6 | ||||||||||||||||||||||||||||||||||||
Financial credit bills |
— | — | — | — | 6 | 2.7 | — | — | — | — | 6 | — | ||||||||||||||||||||||||||||||||||||
Other |
— | — | — | — | 57 | 0.3 | — | — | — | — | 57 | — | ||||||||||||||||||||||||||||||||||||
|
|
|
|
|
|
|
|
|
|
|
|
|
|
|
|
|
|
|
|
|
|
|
|
|||||||||||||||||||||||||
At Amortized Cost |
— |
— |
45,169 |
— |
69,965 |
— |
25,600 |
— |
5,064 |
— |
145,798 |
— |
||||||||||||||||||||||||||||||||||||
|
|
|
|
|
|
|
|
|
|
|
|
|
|
|
|
|
|
|
|
|
|
|
|
|||||||||||||||||||||||||
Government securities—domestic |
— | — | 14,575 | 11.3 | 38,595 | 11.6 | 10,767 | 10.4 | 4,071 | 13.4 | 68,008 | 11.4 | ||||||||||||||||||||||||||||||||||||
Government securities—abroad |
— | — | 21,671 | — | 2,479 | — | 709 | — | 22 | — | 24,881 | — | ||||||||||||||||||||||||||||||||||||
Colombia |
— | — | 924 | 0.7 | — | — | — | — | — | — | 924 | 0.7 | ||||||||||||||||||||||||||||||||||||
Chile |
— | — | — | — | 119 | 5.9 | 709 | 7.4 | — | — | 828 | 7.2 | ||||||||||||||||||||||||||||||||||||
Korea |
— | — | 5,233 | 0.1 | 371 | — | — | — | — | — | 5,604 | 0.1 | ||||||||||||||||||||||||||||||||||||
Spain |
— | — | 4,142 | — | 1,989 | 0.1 | — | — | — | — | 6,131 | 0.0 | ||||||||||||||||||||||||||||||||||||
Mexico |
— | — | 11,372 | 4.3 | — | — | — | — | — | — | 11,372 | 4.3 | ||||||||||||||||||||||||||||||||||||
Uruguay |
— | — | — | — | — | — | — | — | 22 | — | 22 | — | ||||||||||||||||||||||||||||||||||||
Corporate securities |
— | — | 8,923 | — | 28,891 | — | 14,124 | — | 971 | — | 52,909 | — | ||||||||||||||||||||||||||||||||||||
Rural product note |
— | — | 3,178 | 12.1 | 2,485 | 4.4 | 229 | 22.8 | — | — | 5,892 | 9.3 | ||||||||||||||||||||||||||||||||||||
Bank deposit certificates |
— | 0.0 | 6 | 1.1 | 103 | 0.7 | — | — | — | — | 109 | 0.7 | ||||||||||||||||||||||||||||||||||||
Securitized real estate loans |
— | — | 12 | 0.9 | 2,365 | 2.3 | 1,047 | 0.7 | 563 | 0.0 | 3,987 | 1.5 | ||||||||||||||||||||||||||||||||||||
Debentures |
— | — | 4,513 | 10.9 | 19,783 | 13.2 | 12,816 | 11.5 | 408 | 22.4 | 37,520 | 12.5 | ||||||||||||||||||||||||||||||||||||
Eurobonds and other |
— | — | 85 | 2.1 | 370 | 5.8 | — | — | — | — | 455 | 5.2 | ||||||||||||||||||||||||||||||||||||
Financial credit bills |
— | — | — | — | 51 | 1.7 | — | — | — | — | 51 | 1.7 | ||||||||||||||||||||||||||||||||||||
Promissory notes |
— | — | 1,111 | 2.4 | 3,096 | 4.1 | 10 | 1.9 | — | — | 4,217 | 3.6 | ||||||||||||||||||||||||||||||||||||
Other |
— | — | 18 | — | 638 | — | 22 | — | — | — | 678 | — |
(1) | Average yields are not shown for these securities, as such yields are not meaningful because future yields are not quantifiable. These securities have been excluded from the calculation of the total yield. |
Distribution of our financial assets by currency |
Securities |
|
Derivatives |
|||||||||||||||||
Amortized Cost |
Fair Value Through Profit or Loss |
Fair Value Through other Comprehensive Income |
Fair Value Through Profit or Loss |
Total |
||||||||||||||||
(In millions of R$) |
||||||||||||||||||||
As of December 31, 2021 |
145,798 |
364,967 |
105,622 |
69,045 |
685,432 |
|||||||||||||||
Denominated in Brazilian currency |
112,553 | 338,358 | 42,485 | 9,711 | 503,107 | |||||||||||||||
Denominated in Brazilian currency and indexed by foreign currency (1) |
11,377 | 4,981 | 2,163 | 6,905 | 25,426 | |||||||||||||||
Denominated in foreign currency (1) |
21,868 | 21,628 | 60,974 | 52,429 | 156,899 | |||||||||||||||
As of December 31, 2020 |
126,739 |
389,071 |
109,942 |
76,504 |
702,256 |
|||||||||||||||
Denominated in Brazilian currency |
100,083 | 360,885 | 46,704 | 9,794 | 517,466 | |||||||||||||||
Denominated in Brazilian currency and indexed by foreign currency (1) |
— | 4,833 | 2,298 | 8,436 | 15,567 | |||||||||||||||
Denominated in foreign currency (1) |
26,656 | 23,353 | 60,940 | 58,274 | 169,223 | |||||||||||||||
As of December 31, 2019 |
130,466 |
281,075 |
76,660 |
41,854 |
530,055 |
|||||||||||||||
Denominated in Brazilian currency |
109,555 | 267,612 | 38,139 | 7,974 | 423,280 | |||||||||||||||
Denominated in Brazilian currency and indexed by foreign currency (1) |
— | 3,444 | 853 | 2,231 | 6,528 | |||||||||||||||
Denominated in foreign currency (1) |
20,911 | 10,019 | 37,668 | 31,649 | 100,247 | |||||||||||||||
|
|
|
|
|
|
|
|
|
|
(1) | Predominantly U.S. dollars. |
(2) | Restated to take into account the effect of IFRS 9, which we retroactively adopted as of January 1, 2016. |
Derivative financial instruments (notional amounts) |
For The Year Ended December 31, 2021 |
|||||||||||
Brazilian Currency |
Denominated in or linked to Foreign Currency |
Total |
||||||||||
(In millions of R$) |
||||||||||||
Swap contracts Buy (Sale) commitments, net |
7,679 | (7,679 | ) | — | ||||||||
Forward contracts Buy (Sale) commitments, net |
2,970 | 24,178 | 27,148 |
|||||||||
Future contracts Buy (Sale) commitments, net |
85,128 | (1,119 | ) | 84,009 |
||||||||
Option contracts Buy (Sale) commitments, net |
528 | 5,320 | 5,848 |
|||||||||
Others |
||||||||||||
Buy (Sale) commitments, net |
9,420 | 52 | 9,472 |
|||||||||
|
|
|
|
|
|
|
|
As of December 31, |
||||||||||||||||||
Required reserve deposits |
Regulation (1) |
Yield |
2021 |
2020 |
2019 |
|||||||||||||||
Demand Deposits |
||||||||||||||||||||
Compulsory |
|
Circular No. 3,917 |
|
Zero | 21 | % | 21 | % | 21 | % | ||||||||||
Rural (2) |
|
Resolution No. 4,669 |
|
Zero | 30 | % | 30 | % | 30 | % | ||||||||||
Microcredit (2) |
|
Resolution No. 4,861 |
|
Zero | 2 | % | 2 | % | 2 | % | ||||||||||
|
|
|
|
|
|
|
|
|
|
|||||||||||
Savings Accounts (3) |
||||||||||||||||||||
Compulsory |
|
Circular No. 3,975 |
|
TR + 6.17% p.a. | 20.0 | % | 20.0 | % | 20.0 | % | ||||||||||
Real estate financing (2) |
|
Resolution No. 4,676 |
|
80% (TR + 6.17% p.a.) | 65 | % | 65 | % | 65 | % | ||||||||||
|
|
|
|
|
|
|
|
|
|
|||||||||||
Time and Interbank Deposits Received from Leasing Companies |
||||||||||||||||||||
Compulsory |
|
Circular No. 3,916 |
|
SELIC | 20 | % | 17 | % | 31 | % | ||||||||||
|
|
|
|
|
|
|
|
|
|
(1) | Most recent regulation on the matter. |
(2) | This is a compulsory investment of resources that is made in eligible transactions, that is, the funds are granted to other economic entities. |
(3) | Remuneration on funds in savings deposits: |
Required reserve deposits |
2021 |
2020 |
2019 |
|||||||||||||||||||||
R$ |
% of total required reserve deposits |
R$ |
% of total required reserve deposits |
R$ |
% of total required reserve deposits |
|||||||||||||||||||
(In millions of R$, except percentages) |
||||||||||||||||||||||||
Non-interest bearing deposits (1) |
12,012 | 11.5 | 6,926 | 7.7 | 4,412 | 4.8 | ||||||||||||||||||
Interest-bearing deposits (2) |
92,580 | 88.5 | 83,133 | 92.3 | 86,836 | 95.2 | ||||||||||||||||||
Total |
104,592 |
100.0 |
90,059 |
100.0 |
91,248 |
100.0 |
||||||||||||||||||
|
|
|
|
|
|
|
|
|
|
|
|
(1) | Mainly related to demand deposits. |
(2) | Mainly related to time and savings deposits. |
• | The Individuals portfolio consists primarily of credit cards, personal loans (primarily including consumer finance and overdrafts), payroll loans, vehicle financing and residential mortgage loans; |
• | The Corporate portfolio consists primarily of loans made to large corporate clients; |
• | The Small and Medium Businesses portfolio consists primarily of loans to small and medium-sized companies; and |
• | The Foreign Loans – Latin America portfolio consists of loans granted to individuals and companies by our operations in Argentina, Chile, Colombia, Paraguay and Uruguay. |
Loan and Lease Operations, by type (1) |
2021 |
2020 |
2019 |
|||||||||||||||||||||
Loan |
Allowance (2) |
Loan |
Allowance (2) |
Loan |
Allowance (2) |
|||||||||||||||||||
(In millions of R$) |
||||||||||||||||||||||||
Individuals |
332,536 | 24,220 | 255,483 | 21,130 | 240,490 | 19,453 | ||||||||||||||||||
Corporate |
135,035 | 4,807 | 134,521 | 7,953 | 100,789 | 6,885 | ||||||||||||||||||
Small and Medium Businesses |
149,970 | 7,391 | 121,955 | 6,369 | 90,733 | 4,549 | ||||||||||||||||||
Foreign Loans Latin America (3) |
205,049 | 7,898 | 202,145 | 12,870 | 153,779 | 6,621 | ||||||||||||||||||
|
|
|
|
|
|
|
|
|
|
|
|
|||||||||||||
Total Loan operations and lease operations portfolio |
822,590 |
44,316 |
714,104 |
48,322 |
585,791 |
37,508 |
||||||||||||||||||
|
|
|
|
|
|
|
|
|
|
|
|
(1) | We classify all loans and leases more than 60 days overdue as non-accrual loans and we discontinue accruing financial income related to them. The contractual amount of non-accrual loans were R$ 26,630 million, R$ 22,611 million and R$ 23,555 million as of December 31, 2021, 2020 and 2019, respectively. The total of renegotiated loans in the balance of non-accrual loans reflected herein was R$ 6,108 million, R$ 5,944 million and R$ 4,092 million as of December 31, 2021, 2020 and 2019, respectively. Non-accrual loans are presented herein in the appropriate category of loan and lease operations. |
(2) | Comprises Provision for Expected Loss for Financial Guarantees Pledged R$ 767 million (R$ 907 million and R$ 837 million as of December 31, 2020 and 2019) and Commitments to be Released R$4,433 million (R$3,485 million and R$3,303 million as of December 31, 2020 and 2019). |
(3) | As of December 31, 2021 other than “Foreign Loans Latin America”, 21% of Corporate and 17% of Small and Medium Businesses correspond to cross-border outstanding. |
Non-Overdue Installments |
12/31/2021 |
|||||||||||||||||||
Type of loan and lease |
Due in one year or less |
Due in one year to five years |
Due in one five to fifteen years |
Due after fifteen years |
Total Non-Overdue Installments |
|||||||||||||||
(In millions of R$) |
||||||||||||||||||||
Individuals |
167,227 | 99,920 | 40,705 | 11,528 | 319,380 | |||||||||||||||
Corporate |
75,189 | 47,409 | 10,977 | 260 | 133,835 | |||||||||||||||
Small and Medium Businesses |
91,661 | 54,223 | 1,385 | 125 | 147,394 | |||||||||||||||
Foreign Loans Latin America |
83,182 | 65,765 | 26,364 | 25,711 | 201,022 | |||||||||||||||
Total (1) |
417,259 |
267,317 |
79,431 |
37,624 |
801,631 |
|||||||||||||||
|
|
|
|
|
|
|
|
|
|
(1) | Includes R$ 15,752 million related to non-overdue installments of the non-accrual loans. |
Non-Overdue Installments |
12/31/2020 |
|||||||||||||||||||
Type of loan and lease |
Due in one year or less |
Due in one year to five years |
Due in one five to fifteen years |
Due after fifteen years |
Total Non-Overdue Installments |
|||||||||||||||
(In millions of R$) |
||||||||||||||||||||
Individuals |
131,805 | 79,572 | 26,838 | 6,635 | 244,850 | |||||||||||||||
Corporate |
76,200 | 51,695 | 4,947 | 299 | 133,141 | |||||||||||||||
Small and Medium Businesses |
67,065 | 52,024 | 650 | 145 | 119,884 | |||||||||||||||
Foreign Loans Latin America |
79,449 | 67,432 | 39,509 | 11,156 | 197,546 | |||||||||||||||
Total (1) |
354,519 |
250,723 |
71,944 |
18,235 |
695,421 |
|||||||||||||||
|
|
|
|
|
|
|
|
|
|
(1) | Includes R$ 8,986 million related to non-overdue installments of the non-accrual loans. |
Non-Overdue Installments |
12/31/2019 |
|||||||||||||||||||
Type of loan and lease |
Due in one year or less |
Due in one year to five years |
Due in one five to fifteen years |
Due after fifteen years |
Total Non-Overdue Installments |
|||||||||||||||
(In millions of R$) |
||||||||||||||||||||
Individuals |
133,960 | 68,822 | 19,865 | 4,419 | 227,066 | |||||||||||||||
Corporate |
58,043 | 34,716 | 6,902 | 297 | 99,958 | |||||||||||||||
Small and Medium Businesses |
60,215 | 27,491 | 522 | 101 | 88,329 | |||||||||||||||
Foreign Loans Latin America |
62,410 | 52,174 | 28,153 | 6,438 | 149,175 | |||||||||||||||
Total (1) |
314,628 |
183,203 |
55,442 |
11,255 |
564,528 |
|||||||||||||||
|
|
|
|
|
|
|
|
|
|
(1) | Includes R$ 8,454 million related to non-overdue installments of the non-accrual loans. |
Overdue Installments (1) |
12/31/2021 |
|||||||||||||||||||||||||||||||
Type of loan and lease |
Due in one year or less |
Due in one year to five years |
Due in one five to fifteen years |
Due after fifteen years |
Total overdue installments |
Total gross loans |
Allowance for loan losses |
Total net |
||||||||||||||||||||||||
(In millions of R$) |
||||||||||||||||||||||||||||||||
Individuals |
11,362 | 1,795 | 13,157 | 332,536 | (24,220 | ) | 308,316 | |||||||||||||||||||||||||
Corporate |
1,186 | 14 | — | — | 1,200 | 135,035 | (4,807 | ) | 130,228 | |||||||||||||||||||||||
Small and Medium Businesses |
2,150 | 426 | — | — | 2,576 | 149,970 | (7,391 | ) | 142,579 | |||||||||||||||||||||||
Foreign Loans Latin America |
3,893 | 134 | — | — | 4,027 | 205,049 | (7,898 | ) | 197,151 | |||||||||||||||||||||||
Total (2) |
18,591 |
2,369 |
— |
— |
20,960 |
822,590 |
(44,316 |
) |
778,274 |
|||||||||||||||||||||||
|
|
|
|
|
|
|
|
|
|
|
|
|
|
|
|
(1) | Defined as loans and leases contractually past due as to payment of interest or principal. |
(2) | Includes R$ 10,879 million related to overdue installments of the non-accrual loans. |
Overdue Installments (1) |
12/31/2020 |
|||||||||||||||||||||||||||||||
Type of loan and lease |
Due in one year or less |
Due in one year to five years |
Due in one five to fifteen years |
Due after fifteen years |
Total overdue installments |
Total gross loans |
Allowance for loan losses |
Total net |
||||||||||||||||||||||||
(In millions of R$) |
||||||||||||||||||||||||||||||||
Individuals |
8,793 | 1,840 | — | — | 10,633 | 255,483 | (21,130 | ) | 234,353 | |||||||||||||||||||||||
Corporate |
1,337 | 43 | — | — | 1,380 | 134,521 | (7,953 | ) | 126,568 | |||||||||||||||||||||||
Small and Medium Businesses |
1,653 | 418 | — | — | 2,071 | 121,955 | (6,369 | ) | 115,586 | |||||||||||||||||||||||
Foreign Loans Latin America |
4,428 | 171 | — | — | 4,599 | 202,145 | (12,870 | ) | 189,275 | |||||||||||||||||||||||
Total (2) |
16,211 |
2,472 |
— |
— |
18,683 |
714,104 |
(48,322 |
) |
665,782 |
(1) | Defined as loans and leases contractually past due as to payment of interest or principal. |
(2) | Includes R$ 13,625 million related to overdue installments of the non-accrual loans. |
Overdue Installments (1) |
12/31/2019 |
|||||||||||||||||||||||||||||||
Type of loan and lease |
Due in one year or less |
Due in one year to five years |
Due in one five to fifteen years |
Due after fifteen years |
Total overdue installments |
Total gross loans |
Allowance for loan losses |
Total net |
||||||||||||||||||||||||
(In millions of R$) |
||||||||||||||||||||||||||||||||
Individuals |
11,568 | 1,856 | — | — | 13,424 | 240,490 | (19,453 | ) | 221,037 | |||||||||||||||||||||||
Corporate |
829 | 2 | — | — | 831 | 100,789 | (6,885 | ) | 93,904 | |||||||||||||||||||||||
Small and Medium Businesses |
2,015 | 389 | — | — | 2,404 | 90,733 | (4,549 | ) | 86,184 | |||||||||||||||||||||||
Foreign Loans Latin America |
4,452 | 152 | — | — | 4,604 | 153,779 | (6,621 | ) | 147,158 | |||||||||||||||||||||||
Total (2) |
18,864 |
2,399 |
— |
— |
21,263 |
585,791 |
(37,508 |
) |
548,283 |
(1) | Defined as loans and leases contractually past due as to payment of interest or principal. |
(2) | Includes R$15,101 million related to overdue installments of the non-accrual loans. |
12/31/2021 |
||||||||||||||||||||
Non-Overdue Installments |
Due in one year or less |
Due in one year to five years |
Due in one five to fifteen years |
Due after fifteen years |
Total Non- Overdue Installments |
|||||||||||||||
(In millions of R$) |
||||||||||||||||||||
Interest rate of loans to customers by maturity |
||||||||||||||||||||
Variable rates |
160,971 | 152,910 | 72,811 | 37,624 | 424,316 | |||||||||||||||
Fixed rates |
256,288 | 114,407 | 6,620 | — | 377,315 | |||||||||||||||
Total (1) |
417,259 |
267,317 |
79,431 |
37,624 |
801,631 |
|||||||||||||||
|
|
|
|
|
|
|
|
|
|
(1) | Includes R$15,752 million related to non-overdue installments of the non-accrual loans. |
12/31/2020 |
||||||||||||||||||||
Non-Overdue Installments |
Due in one year or less |
Due in one year to five years |
Due in one five to fifteen years |
Due after fifteen years |
Total Non- Overdue Installments |
|||||||||||||||
(In millions of R$) |
||||||||||||||||||||
Interest rate of loans to customers by maturity |
||||||||||||||||||||
Variable rates |
152,060 | 147,098 | 66,844 | 18,235 | 384,237 | |||||||||||||||
Fixed rates |
202,459 | 103,625 | 5,100 | — | 311,184 | |||||||||||||||
Total (1) |
354,519 |
250,723 |
71,944 |
18,235 |
695,421 |
|||||||||||||||
|
|
|
|
|
|
|
|
|
|
(1) | Includes R$8,986 million related to non-overdue installments of the non-accrual loans. |
12/31/2019 |
||||||||||||||||||||
Non-Overdue Installments |
Due in one year or less |
Due in one year to five years |
Due in one five to fifteen years |
Due after fifteen years |
Total Non- Overdue Installments |
|||||||||||||||
(In millions of R$) |
||||||||||||||||||||
Interest rate of loans to customers by maturity |
||||||||||||||||||||
Variable rates |
120,353 | 108,615 | 53,157 | 11,255 | 293,380 | |||||||||||||||
Fixed rates |
194,275 | 74,588 | 2,285 | — | 271,148 | |||||||||||||||
Total (1) |
314,628 |
183,203 |
55,442 |
11,255 |
564,528 |
|||||||||||||||
|
|
|
|
|
|
|
|
|
|
(1) | Includes R$8,454 million related to non-overdue installments of the non-accrual loans. |
12/31/2021 |
||||||||||||||||||||||||
Overdue Installments (1) |
Due in one year or less |
Due in one year to five years |
Due in one five to fifteen years |
Due after fifteen years |
Total overdue installments |
Total gross loans |
||||||||||||||||||
(In millions of R$) |
||||||||||||||||||||||||
Interest rate of loans to customers by maturity |
||||||||||||||||||||||||
Variable rates |
4,304 | 150 | — | — | 4,454 | 428,770 | ||||||||||||||||||
Fixed rates |
14,287 | 2,219 | — | — | 16,506 | 393,820 | ||||||||||||||||||
Total (2) |
18,591 |
2,369 |
— |
— |
20,960 |
822,590 |
||||||||||||||||||
|
|
|
|
|
|
|
|
|
|
|
|
(1) | Defined as loans and leases contractually past due as to payment of interest or principal. |
(2) | Includes R$10,879 millon related to overdue installments of the non-accrual loans. |
12/31/2020 |
||||||||||||||||||||||||
Overdue Installments (1) |
Due in one year or less |
Due in one year to five years |
Due in one five to fifteen years |
Due after fifteen years |
Total overdue installments |
Total gross loans |
||||||||||||||||||
(In millions of R$) |
||||||||||||||||||||||||
Interest rate of loans to customers by maturity |
||||||||||||||||||||||||
Variable rates |
5,579 | 242 | — | — | 5,821 | 390,058 | ||||||||||||||||||
Fixed rates |
10,632 | 2,230 | — | — | 12,862 | 324,046 | ||||||||||||||||||
Total (2) |
16,211 |
2,472 |
— |
— |
18,683 |
714,104 |
||||||||||||||||||
|
|
|
|
|
|
|
|
|
|
|
|
(1) | Defined as loans and leases contractually past due as to payment of interest or principal. |
(2) | Includes R$13,625 millon related to overdue installments of the non-accrual loans. |
12/31/2019 |
||||||||||||||||||||||||
Overdue Installments (1) |
Due in one year or less |
Due in one year to five years |
Due in one five to fifteen years |
Due after fifteen years |
Total overdue installments |
Total gross loans |
||||||||||||||||||
(In millions of R$) |
||||||||||||||||||||||||
Interest rate of loans to customers by maturity |
||||||||||||||||||||||||
Variable rates |
5,252 | 163 | — | — | 5,415 | 298,795 | ||||||||||||||||||
Fixed rates |
13,612 | 2,236 | — | — | 15,848 | 286,996 | ||||||||||||||||||
Total (2) |
18,864 |
2,399 |
— |
— |
21,263 |
585,791 |
||||||||||||||||||
|
|
|
|
|
|
|
|
|
|
|
|
(1) | Defined as loans and leases contractually past due as to payment of interest or principal. |
(2) | Includes R$15,101 million related to overdue installments of the non-accrual loans. |
For The Year Ended December 31, |
||||||||||||||||||||||||
Economic Activities |
2021 |
2020 |
2019 |
|||||||||||||||||||||
Loan portfolio |
% of Loan portfolio |
Loan portfolio |
% of Loan portfolio |
Loan portfolio |
% of Loan portfolio |
|||||||||||||||||||
Industry and commerce |
190,491 | 23.1 | 163,784 | 22.9 | 129,998 | 22.2 | ||||||||||||||||||
Services |
173,332 | 21.1 | 172,322 | 24.1 | 126,718 | 21.6 | ||||||||||||||||||
Individuals |
421,115 | 51.2 | 340,433 | 47.7 | 302,382 | 51.6 | ||||||||||||||||||
Other sectors |
37,652 | 4.6 | 37,565 | 5.3 | 26,693 | 4.6 | ||||||||||||||||||
Total |
822,590 |
100.0 |
714,104 |
100.0 |
585,791 |
100.0 |
||||||||||||||||||
|
|
|
|
|
|
|
|
|
|
|
|
For the Year Ended December 31, |
||||||||||||||||||||||||
Concentration |
2021 |
2020 |
2019 |
|||||||||||||||||||||
Loan portfolio |
% of Loan portfolio |
Loan portfolio |
% of Loan portfolio |
Loan portfolio |
% of Loan portfolio |
|||||||||||||||||||
(In millions of R$, except percentages) |
||||||||||||||||||||||||
Largest debtor |
6,414 | 0.8 | 7,243 | 1.0 | 5,389 | 0.9 | ||||||||||||||||||
10 largest debtors |
33,694 | 4.1 | 37,863 | 5.3 | 29,340 | 5.0 | ||||||||||||||||||
20 largest debtors |
49,541 | 6.0 | 54,812 | 7.7 | 44,712 | 7.6 | ||||||||||||||||||
50 largest debtors |
79,403 | 9.7 | 83,438 | 11.7 | 71,965 | 12.3 | ||||||||||||||||||
100 largest debtors |
111,116 | 13.5 | 112,333 | 15.7 | 97,695 | 16.7 | ||||||||||||||||||
|
|
|
|
|
|
|
|
|
|
|
|
For The Year Ended December 31, |
||||||||||||
2021 |
2020 |
2019 |
||||||||||
(In millions of R$, except percentages) |
||||||||||||
Allowance for loan losses (1) |
44,316 | 48,322 | 37,508 | |||||||||
Total loans and leases operations portfolio |
822,590 | 714,104 | 585,791 | |||||||||
Allowance for loan losses as a percentage of total loans (%) |
5.4 | 6.8 | 6.4 | |||||||||
|
|
|
|
|
|
(1) | Comprises Provision for Expected Loss for Financial Guarantees Pledged R$ 767 million (R$ 907 million and R$ 837 million as of December 31,2020 and 2019) and Commitments to be Released R$ 4,433 million (R$ 3,485 million and R$ 3,303 million as of December 31,2020 and 2019). |
• | Stage 1 – 12-month expected credit loss: represents default events possible within 12 months. Applicable to financial assets originated or purchased without credit recovery issues; |
• | Stage 2 – Lifetime expected credit loss of financial instrument: considers all possible default events. Applicable to financial assets originated or purchased without credit recovery issues and which credit risk has increased significantly; and |
• | Stage 3 – Credit loss expected for credit-impaired assets: considers all possible default events. Applicable to financial assets originated or purchased with credit recovery issues. The measurement of assets classified in this stage is different from Stage 2 due to the recognition of interest income by applying the effective interest rate at amortized cost (net of provision) rather than at the gross carrying amount. |
For The Year Ended December 31, |
||||||||||||
Allowance for Loan and Leases Losses (1) |
2021 |
2020 |
2019 |
|||||||||
(In millions of R$, except percentages) |
||||||||||||
Amount Recognized in the Balance Sheet at the beginning of period |
48,322 | 37,508 | 33,509 | |||||||||
Write-offs |
(18,007 |
) |
(13,638 |
) |
(14,299 |
) | ||||||
Individuals |
(10,309 | ) | (11,764 | ) | (9,710 | ) | ||||||
Corporate |
(310 | ) | 570 | (868 | ) | |||||||
Small and Medium Businesses |
(2,354 | ) | (1,836 | ) | (2,011 | ) | ||||||
Foreign Loans Latin America |
(5,034 | ) | (608 | ) | (1,710 | ) | ||||||
Expected Loss with Loan Operations and Lease Operations |
14,001 |
24,452 |
18,298 |
|||||||||
Amount Recognized in the Balance Sheet at the end of period |
44,316 |
48,322 |
37,508 |
|||||||||
Ratio of Write-offs during the period to average loans outstanding during the period (%) |
2.4 | 2.1 | 2.5 | |||||||||
Ratio of allowance for loan losses to total loans and leases (%) |
5.4 | 6.8 | 6.4 |
(1) | Receivables are partially written off based on an estimate of recovery on a portfolio level. The recovery of receivables partially written off is the recovery on a contract level adjusted by the reduction in the estimate of remaining receivables of the portfolio. As of December 31, 2021 the recovery of loans were R$ 929 million. |
12/31/2021 |
12/31/2020 |
12/31/2019 |
||||||||||||||||||||||||||||||||||
Allocated allowance (1) |
Allocated allowance as a % of total loans and leases |
Loans category as a % of total loans |
Allocated allowance (1) |
Allocated allowance as a % of total loans and leases |
Loans category as a % of total loans |
Allocated allowance (1) |
Allocated allowance as a % of total loans and leases |
Loans category as a % of total loans |
||||||||||||||||||||||||||||
Individuals |
24,220 | 2.9 | 40.5 | 21,130 | 3.0 | 35.8 | 19,453 | 3.3 | 41.1 | |||||||||||||||||||||||||||
Corporate |
4,807 | 0.6 | 16.4 | 7,953 | 1.1 | 18.8 | 6,885 | 1.2 | 17.2 | |||||||||||||||||||||||||||
Small and Medium Businesses |
7,391 | 0.9 | 18.2 | 6,369 | 0.9 | 17.1 | 4,549 | 0.8 | 15.5 | |||||||||||||||||||||||||||
Foreign Loans Latin America |
7,898 | 1.0 | 24.9 | 12,870 | 1.8 | 28.3 | 6,621 | 1.1 | 26.2 | |||||||||||||||||||||||||||
Total |
44,316 | 5.4 | 100.0 | 48,322 | 6.8 | 100.0 | 37,508 | 6.4 | 100.0 |
(1) | Comprises Provision for Expected Loan for Financial Guarantees Pledged R$767 million( R$907 million and R$837 million as of December 31,2020 and 2019) and Commitments to be Released R$4,433 million ( R$3,485 million and R$3,303 million as of December 31,2020 and 2019). |
For The Year Ended December 31, 2021 |
||||||||||||||||
Renegotiated loan and lease operations |
Stage 1 |
Stage 2 |
Stage 3 |
Total |
||||||||||||
(In millions of R$) |
||||||||||||||||
Individuals |
425 | 1,002 | 9,168 | 10,594 | ||||||||||||
Corporate |
39 | 66 | 2,862 | 2,967 | ||||||||||||
Small and medium businesses |
218 | 911 | 5,221 | 6,349 | ||||||||||||
Foreign loans—Latin America |
65 | 1,312 | 1,541 | 2,917 | ||||||||||||
Total renegotiated loan and lease operations |
746 |
3,290 |
18,792 |
22,827 |
||||||||||||
|
|
|
|
|
|
|
|
For The Year Ended December 31, 2020 |
||||||||||||||||
Renegotiated loan and lease operations |
Stage 1 |
Stage 2 |
Stage 3 |
Total |
||||||||||||
(In millions of R$) |
||||||||||||||||
Individuals |
322 | 750 | 9,422 | 10,494 | ||||||||||||
Corporate |
82 | 434 | 3,342 | 3,858 | ||||||||||||
Small and medium businesses |
149 | 927 | 5,306 | 6,382 | ||||||||||||
Foreign loans—Latin America |
104 | 1,228 | 2,085 | 3,417 | ||||||||||||
Total renegotiated loan and lease operations |
657 |
3,339 |
20,155 |
24,151 |
||||||||||||
|
|
|
|
|
|
|
|
For The Year Ended December 31, 2019 |
||||||||||||||||
Renegotiated loan and lease operations |
Stage 1 |
Stage 2 |
Stage 3 |
Total |
||||||||||||
(In millions of R$) |
||||||||||||||||
Individuals |
220 | 683 | 7,267 | 8,170 | ||||||||||||
Corporate |
60 | 182 | 3,661 | 3,903 | ||||||||||||
Small and medium businesses |
87 | 469 | 2,913 | 3,469 | ||||||||||||
Foreign loans—Latin America |
223 | 643 | 1,263 | 2,129 | ||||||||||||
Total renegotiated loan and lease operations |
590 |
1,977 |
15,104 |
17,671 |
||||||||||||
|
|
|
|
|
|
|
|
Renegotiated loan and lease operations |
Year ended December 31, 2021 |
|||||||||||||||||||
Impaired performing |
Non-impaired performing |
Impaired non-performing |
Non-impaired non-performing |
Total |
||||||||||||||||
(In millions of R$) |
||||||||||||||||||||
Individuals |
4,243 | 1,167 | 4,925 | 260 | 10,594 | |||||||||||||||
Corporate |
2,668 | 104 | 194 | — | 2,967 | |||||||||||||||
Small and medium businesses |
2,132 | 946 | 3,088 | 182 | 6,349 | |||||||||||||||
Foreign loans—Latin America |
1,029 | 1,229 | 512 | 148 | 2,917 | |||||||||||||||
Total renegotiated loan and lease operations |
10,072 |
3,446 |
8,719 |
590 |
22,827 |
|||||||||||||||
|
|
|
|
|
|
|
|
|
|
Year ended December 31, 2020 |
||||||||||||||||||||
Renegotiated loan and lease operations |
Impaired performing |
Non-impaired performing |
Impaired non-performing |
Non-impaired non-performing |
Total |
|||||||||||||||
(In millions of R$) |
||||||||||||||||||||
Individuals |
4,338 | 794 | 5,085 | 278 | 10,495 | |||||||||||||||
Corporate |
2,648 | 516 | 694 | — | 3,858 | |||||||||||||||
Small and medium businesses |
2,467 | 881 | 2,839 | 194 | 6,381 | |||||||||||||||
Foreign loans—Latin America |
1,394 | 1,207 | 690 | 126 | 3,417 | |||||||||||||||
Total renegotiated loan and lease operations |
10,847 |
3,398 |
9,308 |
598 |
24,151 |
|||||||||||||||
|
|
|
|
|
|
|
|
|
|
Year ended December 31, 2019 |
||||||||||||||||||||
Renegotiated loan and lease operations |
Impaired performing |
Non-impaired performing |
Impaired non-performing |
Non-impaired non-performing |
Total |
|||||||||||||||
(In millions of R$) |
||||||||||||||||||||
Individuals |
3,659 | 749 | 3,608 | 154 | 8,170 | |||||||||||||||
Corporate |
2,619 | 195 | 1,042 | 47 | 3,903 | |||||||||||||||
Small and medium businesses |
1,352 | 410 | 1,561 | 146 | 3,469 | |||||||||||||||
Foreign loans—Latin America |
652 | 738 | 612 | 127 | 2,129 | |||||||||||||||
Total renegotiated loan and lease operations |
8,282 |
2,092 |
6,823 |
474 |
17,671 |
|||||||||||||||
|
|
|
|
|
|
|
|
|
|
For The Year Ended December 31, | ||||||||||||
2021 |
2020 |
2019 |
||||||||||
(In millions of R$, except percentages) | ||||||||||||
Renegotiated loans (1) (2) |
22,827 | 24,151 | 17,671 | |||||||||
Allowance for loan and lease losses |
7,965 | 8,122 | 6,027 | |||||||||
Allowance for loan and lease losses/renegotiated loans (%) |
34.9 |
33.6 |
34.1 |
|||||||||
|
|
|
|
|
|
(1) | Includes debt consolidation, deferment or any other arrangement that modifies the periods or conditions, of operations originally overdue. |
(2) | Renegotiated Loans Overdue over 30 days. |
For The Year Ended December 31, 2021 |
||||||||||||||||||||
Type of Loan |
Total Renegotiated Loans |
Total Allowance for Loan Losses |
Allowance for Loan Losses/Renegotiated Loans (%) |
Total Redefaulted Renegotiated Loans (1) |
Redefaulted Renegotiated Loans (%) |
|||||||||||||||
(In millions of R$, except percentages) |
||||||||||||||||||||
Restructured Loans |
17,964 | 6,441 | 35.9 | 5,051 | 28.1 | |||||||||||||||
Agreements |
4,864 | 1,523 | 31.3 | 1,057 | 21.7 | |||||||||||||||
Total |
22,827 |
7,965 |
34.9 |
6,108 |
26.8 |
|||||||||||||||
|
|
|
|
|
|
|
|
|
|
(1) | Our redefaulted renegotiated loans are renegotiated transactions 60 days or more overdue. |
For The Year Ended December 31, 2020 |
||||||||||||||||||||
Type of Loan |
Total Renegotiated Loans |
Total Allowance for Loan Losses |
Allowance for Loan Losses/Renegotiated Loans (%) |
Total Redefaulted Renegotiated Loans (1) |
Redefaulted Renegotiated Loans (%) |
|||||||||||||||
(In millions of R$, except percentages) |
||||||||||||||||||||
Restructured Loans |
18,819 | 6,312 | 33.5 | 5,187 | 27.6 | |||||||||||||||
Agreements |
5,332 | 1,810 | 33.9 | 757 | 14.2 | |||||||||||||||
Total |
24,151 |
8,122 |
33.6 |
5,944 |
24.6 |
|||||||||||||||
|
|
|
|
|
|
|
|
|
|
|||||||||||
(1) Our redefaulted renegotiated loans are renegotiated transactions 60 days or more overdue. |
|
For The Year Ended December 31, 2019 |
||||||||||||||||||||
Type of Loan |
Total Renegotiated Loans |
Total Allowance for Loan Losses |
Allowance for Loan Losses/Renegotiated Loans (%) |
Total Redefaulted Renegotiated Loans (1) |
Redefaulted Renegotiated Loans (%) |
|||||||||||||||
(In millions of R$, except percentages) |
||||||||||||||||||||
Restructured Loans |
13,957 | 4,452 | 31.9 | 3,198 | 22.9 | |||||||||||||||
Agreements |
3,714 | 1,575 | 42.4 | 894 | 24.1 | |||||||||||||||
Total |
17,671 |
6,027 |
34.1 |
4,092 |
23.2 |
|||||||||||||||
|
|
|
|
|
|
|
|
|
|
(1) | Our redefaulted renegotiated loans are renegotiated transactions 60 days or more overdue. |
For The Year Ended December, 31 |
||||||||||||
Impaired loans |
2021 |
2020 |
2019 |
|||||||||
(In millions of R$) |
||||||||||||
Balance at the beginning of the period |
60,653 |
41,982 |
39,571 |
|||||||||
(+) Loan operations added |
37,938 | 54,898 | 32,958 | |||||||||
(-) Loans removed due to write-off |
(18,007 | ) | (13,638 | ) | (14,299 | ) | ||||||
(-) Loans removed due to total or partial pay-off |
(30,064 | ) | (22,589 | ) | (16,248 | ) | ||||||
Balance at the end of the period |
50,520 |
60,653 |
41,982 |
|||||||||
|
|
|
|
|
|
Breakdown of the main sources of funds |
2021 |
% of total funding |
2020 |
% of total funding |
2019 |
% of total funding |
||||||||||||||||||
(In millions of R$, except percentages) |
||||||||||||||||||||||||
Deposits |
850,372 |
59.9 |
809,010 |
58.8 |
507,060 |
48.7 |
||||||||||||||||||
Demand deposits |
158,116 | 11.1 | 134,805 | 9.8 | 82,306 | 7.9 | ||||||||||||||||||
Savings deposits |
190,601 | 13.4 | 179,470 | 13.0 | 144,558 | 13.9 | ||||||||||||||||||
Time deposits |
497,051 | 35.0 | 491,234 | 35.7 | 277,166 | 26.6 | ||||||||||||||||||
Interbank deposits |
3,776 | 0.3 | 3,430 | 0.2 | 3,021 | 0.3 | ||||||||||||||||||
Other deposits |
828 | 0.1 | 71 | 0.0 | 9 | 0.0 | ||||||||||||||||||
Securities sold under repurchase agreements |
252,848 |
17.8 |
273,364 |
19.9 |
256,583 |
24.6 |
||||||||||||||||||
Interbank market funds |
177,145 |
12.5 |
156,035 |
11.3 |
174,862 |
16.7 |
||||||||||||||||||
Real estate credit bills |
10,663 | 0.8 | 4,205 | 0.3 | 7,635 | 0.7 | ||||||||||||||||||
Agribusiness credit bills |
13,701 | 1.0 | 14,285 | 1.0 | 21,204 | 2.0 | ||||||||||||||||||
Financial bills |
24,059 | 1.7 | 43,589 | 3.2 | 65,433 | 6.3 | ||||||||||||||||||
Guaranteed real estate bills |
30,998 | 2.2 | 11,029 | 0.8 | 4,320 | 0.4 | ||||||||||||||||||
Import and export financing |
86,948 | 6.1 | 71,470 | 5.2 | 64,622 | 6.2 | ||||||||||||||||||
On-lending-domestic |
10,776 | 0.8 | 11,457 | 0.8 | 11,648 | 1.1 | ||||||||||||||||||
Institutional market funds |
138,636 |
9.8 |
138,308 |
10.0 |
104,244 |
10.0 |
||||||||||||||||||
Subordinated debt |
75,036 | 5.3 | 74,916 | 5.4 | 59,462 | 5.7 | ||||||||||||||||||
Foreing loans through securities |
62,843 | 4.4 | 62,433 | 4.5 | 43,672 | 4.2 | ||||||||||||||||||
Funding from structured operations certificates |
757 | 0.1 | 959 | 0.1 | 1,110 | 0.1 | ||||||||||||||||||
Total |
1,419,001 |
100.0 |
1,376,717 |
100.0 |
1,042,749 |
100.0 |
||||||||||||||||||
|
|
|
|
|
|
|
|
|
|
|
|
Deposits by maturity |
For The Year Ended December 31, 2021 |
|||||||||||||||||||
0-30 days |
31-180 days |
181-365 days |
Over 365 days |
Total |
||||||||||||||||
(In millions of R$) |
||||||||||||||||||||
Non-interest bearing deposits |
158,944 |
— |
— |
— |
158,944 |
|||||||||||||||
Demand deposits |
158,116 | — | — | — | 158,116 | |||||||||||||||
Other deposits |
828 | — | — | — | 828 | |||||||||||||||
Interest bearing deposits |
243,986 |
52,259 |
38,563 |
356,620 |
691,428 |
|||||||||||||||
Savings accounts |
190,601 | — | — | — | 190,601 | |||||||||||||||
Time deposits |
52,563 | 50,925 | 37,229 | 356,334 | 497,051 | |||||||||||||||
Interbanks |
822 | 1,334 | 1,334 | 286 | 3,776 | |||||||||||||||
Total |
402,930 |
52,259 |
38,563 |
356,620 |
850,372 |
|||||||||||||||
|
|
|
|
|
|
|
|
|
|
Deposits by maturity |
For The Year Ended December 31, 2020 |
|||||||||||||||||||
0-30 days |
31-180 days |
181-365 days |
Over 365 days |
Total |
||||||||||||||||
(In millions of R$) |
||||||||||||||||||||
Non-interest bearing deposits |
134,876 |
— |
— |
— |
134,876 |
|||||||||||||||
Demand deposits |
134,805 | — | — | — | 134,805 | |||||||||||||||
Other deposits |
71 | — | — | — | 71 | |||||||||||||||
Interest bearing deposits |
235,728 |
80,456 |
59,955 |
297,995 |
674,134 |
|||||||||||||||
Savings accounts |
179,470 | — | — | — | 179,470 | |||||||||||||||
Time deposits |
55,778 | 78,624 | 59,082 | 297,750 | 491,234 | |||||||||||||||
Interbanks |
480 | 1,832 | 873 | 245 | 3,430 | |||||||||||||||
Total |
370,604 |
80,456 |
59,955 |
297,995 |
809,010 |
|||||||||||||||
|
|
|
|
|
|
|
|
|
|
Deposits by maturity |
For The Year Ended December 31, 2019 |
|||||||||||||||||||
0-30 days |
31-180 days |
181-365 days |
Over 365 days |
Total |
||||||||||||||||
(In millions of R$) |
||||||||||||||||||||
Non-interest bearing deposits |
82,315 |
— |
— |
— |
82,315 |
|||||||||||||||
Demand deposits |
82,306 | — | — | — | 82,306 | |||||||||||||||
Other deposits |
9 | — | — | — | 9 | |||||||||||||||
Interest bearing deposits |
190,131 |
38,873 |
22,878 |
172,863 |
424,745 |
|||||||||||||||
Savings accounts |
144,558 | — | — | — | 144,558 | |||||||||||||||
Time deposits |
44,855 | 36,928 | 22,675 | 172,708 | 277,166 | |||||||||||||||
Interbanks |
718 | 1,945 | 203 | 155 | 3,021 | |||||||||||||||
Total |
272,446 |
38,873 |
22,878 |
172,863 |
507,060 |
|||||||||||||||
|
|
|
|
|
|
|
|
|
|
For The Year Ended December 31, |
||||||||||||||||||||||||||||||||||||
(In millions of R$) |
2021 |
2020 |
2019 |
|||||||||||||||||||||||||||||||||
Domestic |
Foreign |
Total |
Domestic |
Foreign |
Total |
Domestic |
Foreign |
Total |
||||||||||||||||||||||||||||
Maturity within three months |
4 | 34,992 | 34,996 | — | 41,810 | 41,810 | — | 30,332 | 30,332 | |||||||||||||||||||||||||||
Maturity after three months to six months |
— | 6,394 | 6,394 | — | 15,150 | 15,150 | 4 | 9,933 | 9,937 | |||||||||||||||||||||||||||
Maturity after six months to twelve months |
— | 7,458 | 7,458 | 4 | 6,578 | 6,582 | 3 | 10,157 | 10,160 | |||||||||||||||||||||||||||
Maturity after twelve months |
12 | 3,808 | 3,820 | 12 | 6,869 | 6,881 | 12 | 4,606 | 4,618 | |||||||||||||||||||||||||||
Total time deposits in Uninsured Accounts |
16 |
52,652 |
52,668 |
16 |
70,407 |
70,423 |
19 |
55,028 |
55,047 |
For The Year Ended December 31, |
||||||||||||
2021 |
2020 |
2019 |
||||||||||
(%) |
||||||||||||
Retail |
9.0 | 7.8 | 11.3 | |||||||||
Itaú Personnalité |
33.0 | 29.4 | 27.3 | |||||||||
Middle market |
30.8 | 30.1 | 29.2 | |||||||||
Corporate |
26.9 | 32.3 | 31.4 | |||||||||
Institutional |
0.3 | 0.4 | 0.8 | |||||||||
Total |
100.0 |
100.0 |
100.0 |
4C. |
Organizational Structure |
ITEM 5. |
OPERATING AND FINANCIAL REVIEW AND PROSPECTS |
• | As of December 31, 2021, our credit portfolio exceeds R$1 trillion; |
• | We broke production records in real estate credit for private individuals, consolidating our position as the largest private bank in this market, according to ABECIP. In 2021, we originated R$46 billion which represented an increase of 128% as compared to the previous year. Due to our new digital, less bureaucratized journey, we saw an increase in our transactional NPS, which increased from 35 points in March 2021, to 73 points in December 2021. |
• | R$ 2,069 billion in total assets; |
• | R$ 1,904.7 billion in liabilities and other obligations; |
• | R$ 152.9 billion in equity attributable to controlling shareholders; |
• | R$ 1,030.7 billion in Total Loan Portfolio¹ |
• | Tier 1 Capital Ratio which was at 13.0%. |
¹ | Loan portfolio with financial guarantees provided and corporate securities. |
5A. |
Operating Results |
• Real GDP Growth |
As of and for the Year Ended December 31, |
|||||||||||||||||||
2021* |
2020 |
2019 |
2018 |
2017 |
||||||||||||||||
(%) |
||||||||||||||||||||
Argentina (1) |
10.3 | -9.9 | -2.1 | -2.6 | 2.8 | |||||||||||||||
Chile (2) |
11.7 | -6.0 | 0.8 | 4.0 | 1.4 | |||||||||||||||
Colombia (3) |
10.6 | -7.0 | 3.3 | 2.6 | 1.4 | |||||||||||||||
Mexico (4) |
4.8 | -8.2 | -0.2 | 2.2 | 2.1 | |||||||||||||||
Paraguay (5) |
4.2 | -0.8 | -0.4 | 3.2 | 4.8 | |||||||||||||||
Peru (6) |
13.3 | -11.0 | 2.2 | 4.0 | 2.5 | |||||||||||||||
Uruguay (7) |
4.4 | -6.1 | 0.4 | 0.5 | 1.6 |
(1) | Source: Instituto Nacional de Estadística y Censos |
(2) | Source: Banco Central de Chile |
(3) | Source: Banco de la República. |
(4) | Source: Instituto Nacional de Estadística y Geografía. |
(5) | Source: Banco Central del Paraguay. GDP |
(6) | Source: Banco Central de Reserva del Perú |
(7) | Source: Banco Central de Uruguay |
As of and for the Year Ended December 31, |
||||||||||||||||||||
2021 |
2020 |
2019 |
2018 |
2017 |
||||||||||||||||
(%) |
||||||||||||||||||||
Inflation rate — IGP-DI (1) |
17.7 | 23.1 | 7.7 | 7.1 | -0.4 | |||||||||||||||
Inflation rate — IPCA (2) |
10.1 | 4.5 | 4.3 | 3.7 | 2.9 | |||||||||||||||
Exchange rate variation (R$/US$) (3) |
7.4 | 28.9 | 4.0 | 17.1 | 1.5 | |||||||||||||||
TR (reference interest rate) (4) |
0.02 | 0.00 | 0.00 | 0.00 | 0.00 | |||||||||||||||
CDI (interbank interest rate) (5) |
8.76 | 1.90 | 4.59 | 6.40 | 6.99 | |||||||||||||||
SELIC(overnight interest rate) 5) |
8.76 | 1.90 | 4.59 | 6.40 | 7.00 | |||||||||||||||
Sovereign 5-year CDS (6) |
221.6 | 150.9 | 107.7 | 207.9 | 165.0 |
(1) | Source: General Price Index – Internal Supply (Índice Geral de Preços – Disponibilidade Interna, or ) (“IGP-DI”) published by the Fundação Getulio Vargas. |
(2) | Source: IPCA published by IBGE. |
(3) | Source: Bloomberg (cumulative rates for the period); positive numbers mean depreciation of the Brazilian real |
(4) | Source: Mortgage reference rate ( Taxa |
(5) | Source: Central Bank. Data presented in percentage per year. |
(6) | Source: Bloomberg (period-end). Sovereign credit default swaps or CDS is a measure of country risk (and is measured using basis points). |
• | Changes in financial assets and liabilities: Practical expedient that allows to replace, as a consequence of the reform, the effective interest rate of a financial asset or financial liability with a new economically equivalent rate, without derecognition of the contract; |
• | Hedge accounting: End of exemptions for evaluating the effectiveness of hedge relationships (Phase I) with recognition in Profit or Loss of the ineffective portion, creation of sub-portfolios to segregate contracts with the amended rates for hedges of group items, 24-month term for identification and segregation of new risk based on changes in interest rates, and updates of hedge documentation;and |
• | Disclosure: Requirements about the disclosure of risks to which the entity is exposed by the reform, risk management and evolution of the IBORs transition. |
• | Change in the hierarchy level for measuring the fair value of contracts that remain referenced in IBORs under extinction due to the expectation of reduction in the liquidity of these contracts; |
• | Effect as a result of the change of financial instruments in which the renegotiated cash flows are not economically equivalent to the original cash flows; and |
• | Early settlement of contracts where there is no agreement between the parties. |
• | Fair value hedge: aimed at protecting us against changes in market risk due to changes in the fair value of interest subject to variable rates. |
• | Cash flow hedge: aimed at protecting us against future cash flows of payments of interest. |
• | Hedge of net investment of foreign operations: aimed at protecting us against changes in future cash flows of foreign exchange variations in net investments of foreign operations. |
Financial instruments recorded at fair value |
For The Year Ended December 31, |
|||||||||||
2021 |
2020 |
2019 |
||||||||||
(In millions of R$) |
||||||||||||
Assets |
||||||||||||
Financial assets at fair value through profit or loss |
364,967 | 389,071 | 281,075 | |||||||||
Derivatives |
69,045 | 76,504 | 41,854 | |||||||||
Financial assets at fair value through other comprehensive income |
105,622 | 109,942 | 76,660 | |||||||||
Other financial assets |
157 | 6 | — | |||||||||
Total |
539,791 |
575,523 |
399,589 |
|||||||||
|
|
|
|
|
|
|||||||
Liabilities |
||||||||||||
Other financial liabilities |
161 | 5 | — | |||||||||
Structured notes |
114 | 143 | 201 | |||||||||
Derivatives |
63,204 | 79,505 | 47,828 | |||||||||
Total |
63,479 |
79,653 |
48,029 |
|||||||||
|
|
|
|
|
|
• | Level 1: observable inputs reflect the quoted prices (unadjusted) of identical assets or liabilities in active markets; |
• | Level 2: observable inputs reflect the information on assets and liabilities that are either directly (such as prices) or indirectly (derived from prices) observable, except for the quoted prices included in Level 1; and |
• | Level 3: information on assets and liabilities that are not based on observable market data due to little market activity on the measurement date. We present information on our level 3 financial instruments in the table below as of December 31, 2021 and 2020. |
For The Year Ended December 31, |
||||||||
Level 3 |
2021 |
2020 |
||||||
(In millions of R$) |
||||||||
Financial assets at fair value through profit or loss |
1,563 | 1,968 | ||||||
Financial assets at fair value through other comprehensive income |
— | — | ||||||
Net position of derivatives |
27 | (5 | ) | |||||
Total |
1,590 |
1,963 |
||||||
|
|
|
|
• | Probable: liabilities are recognized as “provisions” on our consolidated balance sheet; |
• | Possible: liabilities are disclosed in our audited consolidated financial statements but no provisions are recorded; and |
• | Remote: liabilities that do not require provision or disclosure. |
For the years ended December 31, |
Variation |
|||||||||||||||
Summarized Consolidated Statement of Income |
2021 |
2020 |
R$ million |
% |
||||||||||||
(In millions of R$) |
||||||||||||||||
Operating revenues |
126,374 |
100,199 |
26,175 |
26.1 |
||||||||||||
Net interest income (1) |
75,209 | 50,053 | 25,156 | 50.3 | ||||||||||||
Non-interest income (2) |
51,165 | 50,146 | 1,019 | 2.0 | ||||||||||||
Expected loss from financial assets and claims |
(14,379 |
) |
(25,980 |
) |
11,601 |
(44.7 |
) | |||||||||
Other operating income (expenses) |
(69,764 |
) |
(68,989 |
) |
(775 |
) |
1.1 |
|||||||||
Net income before income tax and social contribution |
42,231 |
5,230 |
37,001 |
707.5 |
||||||||||||
Current and deferred income and social contribution taxes |
(13,847 | ) | 9,834 | (23,681 | ) | (240.8 | ) | |||||||||
Net income |
28,384 |
15,064 |
13,320 |
88.4 |
||||||||||||
Net income attributable to owners of the parent company |
26,760 |
18,896 |
7,864 |
41.6 |
(1) | Includes: |
(i) | interest and similar income (R$129,253 million and R$114,369 million in the years ended December 31, 2021 and 2020, respectively); |
(ii) | interest and similar expenses (R$(69,305) million and R$(73,558) million in the years ended December 31, 2021 and 2020, respectively); |
(iii) | income of financial assets and liabilities at fair value through profit or loss (R$16,678 million and R$6,553 million in the years ended December 31, 2021 and 2020, respectively); and |
(iv) | foreign exchange results and exchange variations in foreign transactions (R$(1,417) million and R$2,689 million in the years ended December 31, 2021 and 2020, respectively). |
(2) | Includes commissions and banking fees, Income from insurance and private pension operations before claim and selling expenses and other income. |
• | Interest and similar income |
• | Interest and similar expenses |
• | Non-performing loans: |
• | We calculate our 15 to 90 days non-performing loan ratio as the value of our 15 to 90 days non-performing loans to our loan portfolio. The 15 to 90 days NPL ratio is an indicator of early delinquency. |
• | Coverage ratio (90 days): |
Summarized Consolidated Statement of Income from January 1, 2021 to December 31, 2021 (1) |
Retail Banking (a) |
Wholesale Banking (b) |
Activities with the Market + Corporation (c) |
Total (a)+(b)+(c) |
Adjustments |
IFRS consolidated (2) |
||||||||||||||||||
(In millions of R$) |
||||||||||||||||||||||||
Operating revenues |
75,443 | 38,228 | 11,930 | 125,601 | 773 | 126,374 | ||||||||||||||||||
Cost of Credit |
(18,278 | ) | (1,956 | ) | — | (20,234 | ) | 7,455 | (12,779 | ) | ||||||||||||||
Claims |
(1,591 | ) | (9 | ) | — | (1,600 | ) | — | (1,600 | ) | ||||||||||||||
Other operating income (expenses) |
(40,116 | ) | (17,743 | ) | (1,055 | ) | (58,914 | ) | (10,850 | ) | (69,764 | ) | ||||||||||||
Income tax and social contribution |
(5,593 | ) | (6,799 | ) | (3,997 | ) | (16,389 | ) | 2,542 | (13,847 | ) | |||||||||||||
Non-controlling interest in subsidiaries |
(330 | ) | (591 | ) | (664 | ) | (1,585 | ) | (39 | ) | (1,624 | ) | ||||||||||||
Net income |
9,535 |
11,130 |
6,214 |
26,879 |
(119 |
) |
26,760 |
|||||||||||||||||
|
|
|
|
|
|
|
|
|
|
|
|
(1) | The first three columns are our business segments. Additional information about each of our business segments can be found below under the headings “(a) Retail Banking”, “(b) Wholesale Banking” and “(c) Activities with the Market + Corporation”. |
The adjustments column includes the following pro forma adjustments: (i) the recognition of the impact of capital allocation using a proprietary model; (ii) the use of funding and cost of capital at market prices, using certain managerial criteria; (iii) the exclusion of non-recurring events from our results; and (iv) the reclassification of the tax effects from hedging transactions we enter into for our investments abroad. The IFRS consolidated column is the total result of our three segments plus adjustments. |
(2) | The IFRS Consolidated figures do not represent the sum of the parties because there are intercompany transactions that were eliminated only in the consolidated statements. Segments are assessed by top management, net of income and expenses between related parties. |
Summarized Consolidated Statement of Income—Retail Business |
For the years ended December 31, |
Variation |
||||||||||||||
2021 |
2020 |
R$ million |
% |
|||||||||||||
(In millions of R$) |
||||||||||||||||
Operating revenues |
75,443 | 72,680 | 2,763 | 3.8 | ||||||||||||
Interest margin |
43,042 | 41,818 | 1,224 | 2.9 | ||||||||||||
Non-interest income (1) |
32,401 | 30,861 | 1,539 | 5.0 | ||||||||||||
Cost of credit and claims |
(19,869 | ) | (22,593 | ) | 2,723 | — | ||||||||||
Other operating income (expenses) |
(40,116 | ) | (40,221 | ) | 105 | (0.3 | ) | |||||||||
Income tax and social contribution |
(5,593 | ) | (3,071 | ) | (2,522 | ) | — | |||||||||
Non-controlling interest in subsidiaries |
(330 | ) | (175 | ) | (155 | ) | 89.0 | |||||||||
Net income |
9,536 |
6,621 |
2,914 |
44.0 |
||||||||||||
|
|
|
|
|
|
|
|
(1) | Non-interest income include: commissions and banking fees; income from insurance and private pension operations before claim and selling expenses and other revenues. |
Summarized Consolidated Statement of Income—Wholesale Business |
For the years ended December 31, |
Variation |
||||||||||||||
2021 |
2020 |
R$ million |
% |
|||||||||||||
(In millions of R$) |
||||||||||||||||
Operating revenues |
38,227 | 32,187 | 6,040 | 18.8 | ||||||||||||
Interest margin |
24,005 | 19,883 | 4,122 | 20.7 | ||||||||||||
Non-interest income (1) |
14,223 | 12,304 | 1,918 | 15.6 | ||||||||||||
Cost of credit and claims |
(1,965 | ) | (8,976 | ) | 7,010 | — | ||||||||||
Other operating income (expenses) |
(17,742 | ) | (16,133 | ) | (1,609 | ) | 10.0 | |||||||||
Income tax and social contribution |
(6,800 | ) | (1,893 | ) | (4,907 | ) | — | |||||||||
Non-controlling interest in subsidiaries |
(591 | ) | 601 | (1,192 | ) | (198.3 | ) | |||||||||
Net income |
11,130 |
5,786 |
5,343 |
92.3 |
||||||||||||
|
|
|
|
|
|
|
|
(1) | Non-interest income include: commissions and banking fees; income from insurance and private pension operations before claim and selling expenses and other revenues. |
Summarized Consolidated Statement of Income - Activities with the Market + Corporation |
For the years ended December 31, |
Variation |
||||||||||||||
2021 |
2020 |
R$ million |
% |
|||||||||||||
(In millions of R$) |
||||||||||||||||
Operating revenues |
11,930 | 9,918 | 2,012 | 20.3 | ||||||||||||
Interest margin |
11,199 | 8,394 | 2,705 | 32.2 | ||||||||||||
Non-interest income (1) |
831 | 1,524 | (693 | ) | (45.5 | ) | ||||||||||
Cost of credit and claims |
(0 | ) | 6 | (6 | ) | — | ||||||||||
Other operating income (expenses) |
(1,055 | ) | (650 | ) | (406 | ) | 62.4 | |||||||||
Income tax and social contribution |
(3,997 | ) | (3,099 | ) | (898 | ) | — | |||||||||
Non-controlling interest in subsidiaries |
(664 | ) | (46 | ) | (617 | ) | 1,332.5 | |||||||||
Net income |
6,214 |
6,129 |
84 |
1.4 |
||||||||||||
|
|
|
|
|
|
|
|
(1) | Non-interest income include: commissions and banking fees; income from insurance and private pension operations before claim and selling expenses and other revenues. |
Summarized Balance Sheet - Assets |
As of December 31, |
Variation |
||||||||||||||
2021 |
2020 |
R$ million |
% |
|||||||||||||
(In millions of R$) |
||||||||||||||||
Cash |
44,512 | 46,224 | (1,712 | ) | (3.7 | ) | ||||||||||
Financial assets at amortized cost |
1,375,782 | 1,275,799 | 99,983 | 7.8 | ||||||||||||
Compulsory deposits in the Central Bank of Brazil |
104,592 | 90,059 | 14,533 | 16.1 | ||||||||||||
Interbank deposits, securities purchased under agreements to resell, securities at amortized cost and Voluntary Investments with the Central Bank of Brazil |
393,206 | 425,432 | (32,226 | ) | (7.6 | ) | ||||||||||
Loan and lease operations portfolio |
822,590 | 714,104 | 108,486 | 15.2 | ||||||||||||
Other financial assets |
96,473 | 93,255 | 3,218 | 3.5 | ||||||||||||
(-) Provision for Expected Loss |
(41,079 | ) | (47,051 | ) | 5,972 | (12.7 | ) | |||||||||
Financial assets at fair value through other comprehensive income |
105,622 | 109,942 | (4,320 | ) | (3.9 | ) | ||||||||||
Financial assets at fair value through profit or loss |
434,169 | 465,581 | (31,412 | ) | (6.7 | ) | ||||||||||
Investments in associates and join ventures, Fixed assets, Goodwill and Intangible assets, assets held for sale and other assets |
50,688 | 55,610 | (4,922 | ) | (8.9 | ) | ||||||||||
Tax assets |
58,433 | 66,095 | (7,662 | ) | (11.6 | ) | ||||||||||
|
|
|
|
|
|
|
|
|||||||||
Total assets |
2,069,206 | 2,019,251 | 49,955 | 2.5 | ||||||||||||
|
|
|
|
|
|
|
|
As of December 31, |
Variation |
|||||||||||||||
Loan and Lease Operations, by asset type |
2021 |
2020 |
R$ million |
% |
||||||||||||
(In millions of R$) |
||||||||||||||||
Individuals |
332,536 |
255,483 |
77,053 |
30.2 |
||||||||||||
Credit card |
112,809 | 87,073 | 25,736 | 29.6 | ||||||||||||
Personal loan |
42,235 | 35,346 | 6,889 | 19.5 | ||||||||||||
Payroll loans |
63,416 | 55,508 | 7,908 | 14.2 | ||||||||||||
Vehicles |
29,621 | 23,290 | 6,331 | 27.2 | ||||||||||||
Mortgage loans |
84,455 | 54,266 | 30,189 | 55.6 | ||||||||||||
Corporate |
135,034 |
134,521 |
513 |
0.4 |
||||||||||||
Micro/Small and Medium Businesses |
149,970 |
121,955 |
28,015 |
23.0 |
||||||||||||
Foreign Loans Latin America |
205,050 |
202,145 |
2,905 |
1.4 |
||||||||||||
|
|
|
|
|
|
|
|
|||||||||
Total Loan operations and lease operations portfolio |
822,590 |
714,104 |
108,486 |
15.2 |
||||||||||||
|
|
|
|
|
|
|
|
As of December 31, |
Variation |
|||||||||||||||
Summarized Balance Sheet - Liabilities and Stockholders’ Equity |
2021 |
2020 |
R$ million |
% |
||||||||||||
(In millions of R$) |
||||||||||||||||
Financial Liabilities |
1,621,786 | 1,579,686 | 42,100 | 2.7 | ||||||||||||
At Amortized Cost |
1,553,107 | 1,495,641 | 57,466 | 3.8 | ||||||||||||
Deposits |
850,372 | 809,010 | 41,362 | 5.1 | ||||||||||||
Securities sold under repurchase agreements |
252,848 | 273,364 | (20,516 | ) | (7.5 | ) | ||||||||||
Interbank market funds, Institutional market funds and other financial liabilities |
449,887 | 413,267 | 36,620 | 8.9 | ||||||||||||
At Fair Value Through Profit or Loss |
63,479 | 79,653 | (16,174 | ) | (20.3 | ) | ||||||||||
Provision for Expected Loss |
5,200 | 4,392 | 808 | 18.4 | ||||||||||||
Provision for insurance and private pensions |
214,976 | 221,000 | (6,024 | ) | (2.7 | ) | ||||||||||
Provisions |
19,592 | 19,819 | (227 | ) | (1.1 | ) | ||||||||||
Tax liabilities |
6,246 | 5,710 | 536 | 9.4 | ||||||||||||
Other liabilities |
42,130 | 38,511 | 3,619 | 9.4 | ||||||||||||
Total liabilities |
1,904,730 |
1,864,726 |
40,004 |
2.1 |
||||||||||||
Total stockholders’ equity attributed to the owners of the parent company |
152,864 |
142,993 |
9,871 |
6.9 |
||||||||||||
Non-controlling interests |
11,612 | 11,532 | 80 | 0.7 | ||||||||||||
Total stockholders’ equity |
164,476 |
154,525 |
9,951 |
6.4 |
||||||||||||
|
|
|
|
|
|
|
|
|||||||||
Total liabilities and stockholders’ equity |
2,069,206 |
2,019,251 |
49,955 |
2.5 |
||||||||||||
|
|
|
|
|
|
|
|
• | RWA CPAD |
• | RWA MINT |
• | RWA OPAD |
As of December 31, |
||||||||
2021 |
2020 |
|||||||
(In R$ million, except percentages) |
||||||||
Available capital (amounts) |
||||||||
Common Equity Tier I (CET1) |
130,716 | 119,960 | ||||||
Tier I |
149,912 | 137,157 | ||||||
Total capital |
169,797 | 151,244 | ||||||
Risk-weighted assets (amounts) |
||||||||
Total risk-weighted assets (RWA) |
1,153,841 | 1,042,207 | ||||||
Risk-based capital ratios as a percentage of RWA |
||||||||
Common Equity Tier I ratio (%) |
11.3 | % | 11.5 | % | ||||
Tier I ratio (%) |
13.0 | % | 13.2 | % | ||||
Total capital ratio (%) |
14.7 | % | 14.5 | % | ||||
Additional CET1 buffer requirements as a percentage of RWA |
||||||||
Capital conservation buffer requirement (%) (1) |
2.00 | % | 1.25 | % | ||||
Countercyclical buffer requirement (%) |
0.0 | % | 0.0 | % | ||||
Bank G-SIB and/or D-SIB additional requirements (%) |
1.0 | % | 1.0 | % | ||||
Total of bank CET1 specific buffer requirements (%) |
3.00 | % | 2.25 | % |
(1) | For purposes of calculating the Conservation capital buffer, BACEN Resolution 4,783 establishes, for defined periods, percentages to be applied to the RWA value with a gradual increase until April/22, when it reaches 2.5%. |
Three-month periods ended December 31, |
||||||||
Liquidity Coverage Ratio |
2021 |
2020 |
||||||
Total Weighted Value (average) |
||||||||
(In millions of R$) |
||||||||
Total High Liquidity Assets (HQLA) 1 |
307,280 | 343,174 | ||||||
Cash Outflows 2 |
341,053 | 309,652 | ||||||
Cash Inflows 3 |
147,960 | 133,297 | ||||||
Total Net Cash Outflows |
193,093 | 176,355 | ||||||
LCR% |
159.1 |
% |
194.6 |
% | ||||
|
|
|
|
(1) | High Quality Liquidity Assets correspond to inventories, in some cases weighted by a discount factor, of assets that remain liquid in the market even in periods of stress, that can easily be converted into cash and that are classified as low risk. |
(2) | Outflows — total potential cash outflows for a 30-day horizon, calculated for a standard stress scenario as defined by BACEN Circular 3,749. |
(3) | Inflows — total potential cash inflows for a 30-day horizon, calculated for a standard stress scenario as defined by BACEN Circular 3,749. |
As of December 31, |
||||||||
Net Stable Funding Ratio |
2021 |
2020 |
||||||
Total Ajusted Value |
||||||||
(In millions of R$) |
||||||||
Total Available Stable Funding (ASF)¹ |
1,016,989 | 956,033 | ||||||
Total Required Stable Funding (RSF)² |
839,830 | 758,907 | ||||||
|
|
|
|
|||||
NSFR (%) |
121.1 |
% |
126.0 |
% | ||||
|
|
|
|
(1) | ASF – Available Stable Funding – refers to liabilities and equity weighted by a discount factor according to their stability, pursuant to Central Bank Circular 3,869/2017. |
(2) | RSF – Required Stable Funding – refers to assets and off-balance exposures weighted by a discount factor to their necessity, pursuant to Central Bank Circular 3,869/2017. |
5B. |
Liquidity and Capital Resources |
As of December 31, |
2021 Average |
|||||||||||||||
Operational Liquidity Reserve |
2021 |
2020 |
2019 |
Balance (1) |
||||||||||||
(In millions of R$) |
||||||||||||||||
Cash |
44,512 | 46,224 | 30,367 | 42,433 | ||||||||||||
Securities purchased under agreements to resell – Funded position (2) |
32,436 | 44,743 | 26,797 | 38,095 | ||||||||||||
Unencumbered government securities (3) |
152,099 | 232,245 | 115,774 | 193,130 | ||||||||||||
Operational reserve |
229,047 |
323,212 |
172,938 |
273,658 |
||||||||||||
|
|
|
|
|
|
|
|
(1) | Average calculated based on audited interim financial statements. |
(2) | Net of R$ 9,266 (R$11,119 at 12/31/2020 and R$8,544 at 12/31/2019), which securities are restricted to guarantee transactions at B3 S.A.—Brasil, Bolsa, Balcão (B3) and the Central Bank. |
(3) | Present values are included as a result of the change in the reporting of future flows of assets that are now reported as future value as of September 2016. |
Capital Expenditures |
For the Year Ended December 31, |
|
Variation |
|||||||||||||||||||||||||
2021 |
2020 |
2019 |
2021-2020 |
2020-2019 |
||||||||||||||||||||||||
(In millions of R$, except percentages) |
||||||||||||||||||||||||||||
Fixed Assets |
1,414 |
1,716 |
1,621 |
(302 |
) |
(17.6 |
)% |
95 |
5.9 |
% | ||||||||||||||||||
Fixed assets under construction |
710 | 457 | 473 | 253 | 55.4 | % | (16 | ) | (3.4 | )% | ||||||||||||||||||
Land and buildings |
25 | 38 | 52 | (13 | ) | (34.2 | )% | (14 | ) | (26.9 | )% | |||||||||||||||||
Leasehold improvements |
106 | 39 | 60 | 67 | 171.8 | % | (21 | ) | (35.0 | )% | ||||||||||||||||||
Installations, furnitures and data processing equipment |
532 | 1,112 | 946 | (580 | ) | (52.2 | )% | 166 | 17.5 | % | ||||||||||||||||||
Other |
41 | 70 | 90 | (29 | ) | (41.4 | )% | (20 | ) | (22.2 | )% | |||||||||||||||||
Intangible Assets |
7,667 |
3,591 |
2,691 |
4,076 |
113.5 |
% |
900 |
33.4 |
% | |||||||||||||||||||
Goodwill |
— | 287 | — | (287 | ) | — | 287 | — | ||||||||||||||||||||
Association for the promotion and offer of financial products and services |
5 | — | — | 5 | — | — | — | |||||||||||||||||||||
Software acquired and Internally developed software |
4,249 | 2,763 | 1,976 | 1,486 | 53.8 | % | 787 | 39.8 | % | |||||||||||||||||||
Other intangibles |
3,413 | 541 | 715 | 2,872 | 530.9 | % | (174 | ) | (24.3 | )% | ||||||||||||||||||
Total |
9,081 |
5,307 |
4,312 |
3,774 |
71.1 |
% |
995 |
23.1 |
% | |||||||||||||||||||
|
|
|
|
|
|
|
|
|
|
|
|
|
|
As of December 31, 2021 |
||||||||
Capitalization |
R$ |
US$ (1) |
||||||
(In millions, except percentages) |
||||||||
Current liabilities |
||||||||
Deposits |
493,752 | 88,478 | ||||||
Securities sold under repurchase agreements |
243,195 | 43,579 | ||||||
Structured notes |
16 | 3 | ||||||
Derivatives |
30,952 | 5,546 | ||||||
Interbank market funds |
98,106 | 17,580 | ||||||
Institutional market funds |
27,906 | 5,001 | ||||||
Other financial liabilities |
128,576 | 23,040 | ||||||
Provision for insurance and private pension |
3,643 | 653 | ||||||
Provisions |
5,362 | 961 | ||||||
Tax liabilities |
2,450 | 439 | ||||||
Other Non-financial liabilities |
39,213 | 7,027 | ||||||
|
|
|
|
|||||
Total |
1,073,171 |
192,307 |
||||||
|
|
|
|
|||||
Long-term liabilities |
||||||||
Deposits |
356,620 | 63,905 | ||||||
Securities sold under repurchase agreements |
9,653 | 1,730 | ||||||
Structured notes |
98 | 18 | ||||||
Derivatives |
32,252 | 5,779 | ||||||
Interbank market funds |
79,039 | 14,163 | ||||||
Institutional market funds |
110,730 | 19,842 | ||||||
Other financial liabilities |
5,691 | 1,020 | ||||||
Provision for insurance and private pension |
211,333 | 37,870 | ||||||
Provision for Expected Loss |
5,200 | 932 | ||||||
Provisions |
14,230 | 2,550 | ||||||
Tax liabilities |
3,516 | 630 | ||||||
Other Non-financial liabilities |
2,917 | 523 | ||||||
|
|
|
|
|||||
Total |
831,279 |
148,962 |
||||||
|
|
|
|
|||||
Income tax and social contribution—deferred |
280 |
50 |
||||||
Non-controlling interests |
11,612 |
2,081 |
||||||
Stockholders’ equity attributed to the owners of the parent company (2) |
152,864 |
27,393 |
||||||
|
|
|
|
|||||
Total capitalization (3) |
2,069,206 |
370,793 |
||||||
|
|
|
|
|||||
BIS ratio (4) |
14.7 |
% |
||||||
|
|
(1) |
Convenience translation at 5.5805 reais per U.S. dollar, the exchange rate in effect on December 31, 2021. |
(2) |
Itaú Unibanco Holding’s authorized and outstanding share capital consists of 4,958,290,359 common shares and 4,818,741,579 preferred shares, all of which are fully paid. For more information regarding our share capital see Note 19 to our audited consolidated financial statements as of and for the period ended December 31, 2021. |
(3) |
Total capitalization corresponds to the sum of total current liabilities, long-term liabilities, deferred income, minority interest in subsidiaries and stockholders’ equity. |
(4) |
Calculated by dividing total regulatory capital by risk weight assets. |
Exposures |
Trading Portfolio (1) December 31, 2021 |
Trading and Banking Portfolios (1) December 31, 2021 |
||||||||||||||||||||||||
Risk Factors |
Risk of varitions in: |
Scenario I |
Scenario II |
Scenario III |
Scenario I |
Scenario II |
Scenario III |
|||||||||||||||||||
(In millions of R$) |
||||||||||||||||||||||||||
Interest Rate |
Fixed Income Interest Rates in reais | (0.3 | ) | (86.5 | ) | (167.4 | ) | (12.8 | ) | (3,447.2 | ) | (6,666.7 | ) | |||||||||||||
Foreign Exchange Linked |
Foreign Exchange Linked Interest Rates | (0.1 | ) | (42.7 | ) | (78.2 | ) | (3.2 | ) | (304.5 | ) | (575.4 | ) | |||||||||||||
Foreign Exchange Rates |
Prices of Foreign Currencies | (3.1 | ) | (13.2 | ) | (38.7 | ) | 1.6 | (110.4 | ) | (236.2 | ) | ||||||||||||||
Price Index Linked |
Interest of Inflation coupon | — | (37.3 | ) | (80.5 | ) | (0.3 | ) | (183.7 | ) | (473.8 | ) | ||||||||||||||
TR |
TR Linked Interest Rates | — | — | — | 1.1 | (243.8 | ) | (535.0 | ) | |||||||||||||||||
Equities |
Prices of Equities | 0.2 | 56.5 | 169.7 | 6.0 | (89.0 | ) | (121.3 | ) | |||||||||||||||||
Other |
Exposures that do not fall under the definitions above | (0.1 | ) | 5.4 | 15.4 | — | 1.8 | 0.8 | ||||||||||||||||||
Total |
(3.4 |
) |
(117.8 |
) |
(179.7 |
) |
(7.6 |
) |
(4,376.8 |
) |
(8,607.6 |
) | ||||||||||||||
|
|
|
|
|
|
|
|
|
|
|
|
(1) | Amounts net of tax effects. |
• | Scenario I: Addition of one basis point to fixed interest rates, currency coupon, inflation and interest rate indexes and one percentage point to currency and equity prices; |
• | Scenario II: Shocks of 25% in fixed interest rates, currency coupon, inflation, interest rate indexes and currency and share prices, both for growth and fall, considering the largest resulting losses per risk factor; and |
• | Scenario III: Shocks of 50% in fixed interest rates, currency coupon, inflation, interest rate indexes and currency and share prices, both for growth and fall, considering the largest resulting losses per risk factor. |
For The Year Ended December 31, 2021 |
||||||||||||||||||||
Exchange Rate Sensitivity |
Brazilian currency |
Denominated in foreign currency (1) |
Indexed to foreign currency (1) |
Total |
% of amounts denominated in and indexed to foreign currency of total |
|||||||||||||||
(In millions of R$, except percentages) |
||||||||||||||||||||
Assets |
1,481,363 |
532,460 |
55,383 |
2,069,206 |
28.4 |
|||||||||||||||
Cash |
7,383 | 33,709 | 3,420 | 44,512 | 83.4 | |||||||||||||||
At Amortized Cost |
986,464 | 351,422 | 37,896 | 1,375,782 | 28.3 | |||||||||||||||
Compulsory deposits in the Central Bank of Brazil |
104,592 | — | — | 104,592 | — | |||||||||||||||
Interbank deposits |
17,795 | 52,147 | — | 69,942 | 74.6 | |||||||||||||||
Securities purchased under agreements to resell |
159,974 | 9,744 | — | 169,718 | 5.7 | |||||||||||||||
Voluntary investments with the Central Bank of Brazil |
5,800 | — | — | 5,800 | — | |||||||||||||||
Securities |
114,498 | 21,871 | 11,377 | 147,746 | 22.5 | |||||||||||||||
Loan operations and lease operations portfolio |
535,453 | 260,173 | 26,964 | 822,590 | 34.9 | |||||||||||||||
Other financial assets |
81,519 | 14,954 | (0 | ) | 96,473 | 15.5 | ||||||||||||||
(-) Provision for Expected Loss |
(33,167 | ) | (7,467 | ) | (445 | ) | (41,079 | ) | 19.3 | |||||||||||
At Fair Value Through Other Comprehensive Income |
42,485 | 60,974 | 2,163 | 105,622 | 59.8 | |||||||||||||||
Securities |
42,485 | 60,974 | 2,163 | 105,622 | 59.8 | |||||||||||||||
At Fair Value Through Profit or Loss |
348,226 | 74,057 | 11,886 | 434,169 | 19.8 | |||||||||||||||
Securities |
338,358 | 21,628 | 4,981 | 364,967 | 7.3 | |||||||||||||||
Derivatives |
9,711 | 52,429 | 6,905 | 69,045 | 85.9 | |||||||||||||||
Other financial assets |
157 | — | — | 157 | — | |||||||||||||||
Investments in associates and joint ventures |
6,119 | 2 | 0 | 6,121 | — | |||||||||||||||
Fixed assets, net |
5,794 | 1,169 | (0 | ) | 6,963 | 16.8 | ||||||||||||||
Goodwill and Intangible assets, net |
16,138 | 4,972 | 0 | 21,110 | 23.6 | |||||||||||||||
Tax assets |
54,776 | 3,657 | 0 | 58,433 | 6.3 | |||||||||||||||
Other assets |
13,978 | 2,498 | 18 | 16,494 | 15.3 | |||||||||||||||
Percentage of total assets |
71.6 |
25.7 |
2.7 |
100.0 |
||||||||||||||||
|
|
|
|
|
|
|
|
|||||||||||||
Liabilities and Stockholders’ Equity |
1,488,684 |
563,654 |
16,868 |
2,069,206 |
28.1 |
|||||||||||||||
At Amortized Cost |
1,037,825 | 502,199 | 13,083 | 1,553,107 | 33.2 | |||||||||||||||
Deposits |
593,057 | 256,654 | 661 | 850,372 | 30.3 | |||||||||||||||
Securities sold under repurchase agreements |
209,552 | 43,296 | 0 | 252,848 | 17.1 | |||||||||||||||
Interbank market debt |
92,568 | 79,106 | 5,471 | 177,145 | 47.7 | |||||||||||||||
Institutional market debt |
20,823 | 112,146 | 5,667 | 138,636 | 85.0 | |||||||||||||||
Other financial liabilities |
121,825 | 10,997 | 1,284 | 134,106 | 9.2 | |||||||||||||||
At Fair Value Through Profit or Loss |
8,002 | 51,880 | 3,597 | 63,479 | 87.4 | |||||||||||||||
Derivatives |
7,841 | 51,766 | 3,597 | 63,204 | 87.6 | |||||||||||||||
Structured notes |
— | 114 | — | 114 | 100.0 | |||||||||||||||
Other financial liabilities |
161 | — | — | 161 | — | |||||||||||||||
Provision for Expected Loss |
4,516 | 657 | 27 | 5,200 | 13.2 | |||||||||||||||
Loan Commitments |
4,093 | 318 | 22 | 4,433 | 7.7 | |||||||||||||||
Financial Guarantees |
423 | 339 | 5 | 767 | 44.9 | |||||||||||||||
Reserves for insurance and private pension |
214,971 | 5 | — | 214,976 | — | |||||||||||||||
Provisions |
19,487 | 105 | 0 | 19,592 | 0.5 | |||||||||||||||
Tax liabilities |
4,865 | 1,381 | (0 | ) | 6,246 | 22.1 | ||||||||||||||
Other liabilities |
34,542 | 7,427 | 161 | 42,130 | 18.0 | |||||||||||||||
Non-controlling interests |
11,612 | — | — | 11,612 | — | |||||||||||||||
Total stockholders’ equity attributed to the owners of the parent company |
152,864 | — | — | 152,864 | — | |||||||||||||||
Percentage of total liabilities and stockholders’ equity |
72.0 |
27.2 |
0.8 |
100.0 |
||||||||||||||||
|
|
|
|
|
|
|
|
(1) | Predominantly U.S. dollar. |
• | Green (0 to 4 exceptions): corresponds to backtesting results that do not suggest any problems with the quality or accuracy of the adopted models; |
• | Yellow (5 to 9 exceptions): refers to an intermediate range group, which indicates an early warning and/or monitoring and may indicate the need to review the model; and |
• | Red (10 or more exceptions): demonstrates the need for improvement action. |
5C. |
Research and Development, Patents and Licenses, Etc. |
5D. |
Trend Information |
• | the Brazilian economic environment (please see “Item 5A. Operating Results — Factors Affecting Our Results of Operations — Brazilian Context” and “Item 3D. Risk Factors — Macroeconomic Risks —Domestic Scenario” for further details); |
• | legal and regulatory developments (please see “Item 4B. Business Overview — Supervision and Regulation”, “Item 5A. Operating Results — Factors Affecting Our Results of Operations — Brazilian Context” and “Item 3D. Risk Factors — Legal and Regulatory Risks” for further details); |
• | the effects of any ongoing international financial turmoil, including on the liquidity and capital requirement (please see “Item 4B. Business Overview — Supervision and Regulation,” “Item 5A. Operating Results — Factors Affecting Our Results of Operations — Global Context” |
• | the inflation effects on the results of our operations (please see “Item 5A. Operating Results — Factors Affecting Our Results of Operations — Brazilian Context” and “Item 3D. Risk Factors — Macroeconomic Risks — Domestic Scenario” for further details); |
• | the effects of the variations in the value of the Brazilian real |
• | any acquisitions we may make in the future (please see “Item 3D. Risk Factors—Risks Associated with our Business—The integration of acquired or merged businesses involves certain risks that may have a material adverse effect on us” for further details). |
5E. |
Critical Accounting Estimates |
ITEM 6. |
DIRECTORS, SENIOR MANAGEMENT AND EMPLOYEES |
6A. |
Directors and Senior Management |
• | Refraining from taking part in resolutions related to matters in which the director’s interests conflict with ours. The director must inform the Board of Directors of any possible conflict of interest as soon as the matter giving rise to such conflict is included in the agenda or proposed by the Board of Director’s co-chairmen, and, in any event, before the beginning of any discussion on such matter. |
• | In the event the director or a company controlled or managed by this director carries out a transaction with any company in the Itaú Unibanco Group: (a) the transaction must be carried out at arm’s length; (b) if it is not a customary transaction or a provision of services, an appraisal report must be issued by recognized financial advisors evidencing that the transaction was carried out at arm’s length; and (c) the transaction must be disclosed to and conducted under the supervision of the Related Parties Committee, the Ethics and Ombudsman Office or of channels within the Itaú Unibanco Group that are competent in the specific area, subject to the rules and conditions set forth in our Transactions with Related Parties Policy. |
• | Serving on no more than four boards of directors of companies that do not belong to the same group. |
• | Our directors have no service contracts with us or any of our subsidiaries providing for benefits upon termination of employment. |
• | Manager Evaluation: |
• | Rapporteur: |
• | Evaluation Committee: |
Preparing a policy for the compensation of management members, proposing to the Board of Directors the many forms of fixed and variable compensation, in addition to special benefits and recruitment and termination programs. |
Discussing, analyzing and supervising the implementation and operation of existing compensation models, by discussing general principles of the employee compensation policy and recommending improvements to the Board of Directors based on the policy principles. | |
Proposing to the Board of Directors the aggregate compensation amount for management members to be submitted to the Annual Stockholders’ Meeting. |
Preparing the “Compensation Committee Report” on an annual basis. |
• | commissioning salary surveys conducted by specialized consultants, who are independent of management; |
• | participating in surveys conducted by other banks; and |
• | participating in specialized compensation and benefit forums. |
Monthly fixed compensation: Determined in accordance with the complexity of an individual’s work duties and such individual’s performance with respect with such duties. Employees’ fixed compensation changes according to our promotion and merit policy, which takes into account the employees’ seniority, responsibilities and personal performance when carrying out duties over the period under evaluation. In addition, employees are entitled to salary adjustments, in accordance with applicable collective bargaining agreements. |
Variable compensation: It acknowledges the level of dedication, results achieved and the short, medium and long-term sustainability of these results. Additionally, employees are entitled to receive additional amounts if provided in applicable collective bargaining agreements. |
Benefits: We provide several benefits agreed with labor unions representing our employees’ many professional categories, which are established in the respective collective bargaining agreements, such as: food allowance, day care/baby sitter, transportation etc. |
• | medical and dental care plans; |
• | private pension plans; |
• | group life insurance; |
• | annual health check-up; and |
• | parking lot space. |
• | differentiated banking products and services; |
• | Itaú Unibanco Club Foundation (Fundação Itaú Unibanco Clube); |
• | discounts for health or sports related activities with several fitness centers; |
• | discount partnership with several companies of goods and services; |
• | pharmacy discounts and payment facilities; and |
• | psychosocial and personal care services. |
Board of Directors (1) (2) (3) |
Board of Officers (2) |
Fiscal Council |
Audit Committee (3) (4) | |||||
Monthly Fixed Compensation |
Aggregate amount of fees in cash approved at the Annual General Stockholders’ Meeting | Aggregate amount of fees in cash approved at the Annual General Stockholders’ Meeting | Fees in cash approved at the Annual General Stockholders’ Meeting | Fees in cash approved at the Annual General Stockholders’ Meeting | ||||
Annual Fixed Compensation |
Stock-based compensation approved at the Annual General Stockholder’s Meeting. | N.A. | N.A. | N.A. | ||||
Benefit Plan |
N.A. | Composed of medical and dental care plans, check-up, private pension plan, parking lot and life insurance. |
N.A. | N.A. | ||||
Annual Variable Compensation |
Stock-based compensation approved only in the event of a resolution of the Compensation Committee, subject to the guidelines of CMN Resolution No. 3,921 and limited to the extent determined by the Annual General Stockholders’ Meeting. | Statutory profit, sharing and fees (in cash and in shares) approved by the Compensation Committee and limited to the annual amount approved at the Annual General Stockholders’ Meeting. | N.A. | N.A. |
(1) | In the event that a member of our Board of Directors is also part of our Board of Officers or our subsidiaries, the compensation will be in line with the compensation model of our Board of Officers. Management members who are also part of statutory on non-statutory committees or of our subsidiaries or affiliates are compensated according to their duties in the executive bodies or areas in which they work. As a rule, they do not receive a specific compensation for belonging to these committees. A non-management member of the Compensation Committee is compensated for his/her duties executed in the referred Committee. |
(2) | Maximum compensation amounts are defined based on the limits imposed by Article 152 of the Brazilian Corporate Law. |
(3) | Member of the Board of Directors and Audit Committee only receive benefits in they have previously been officers of the Company. |
(4) | For those members of the Audit Committee who are also part of the Board of Directors, the compensation policy of the Board of Directors is applied. |
Member |
Year |
Monthly fixed compensation |
Annual fixed compensation |
Annual variable compensation |
Benefits |
|||||||||||||||
Board of Directors |
2021 |
25 | % | 20 | % | 53 | % | 2 | % | |||||||||||
2020 |
27 | % | 30 | % | 41 | % | 2 | % | ||||||||||||
2019 |
22 | % | 23 | % | 53 | % | 2 | % | ||||||||||||
Board of Officers |
2021 |
8 | % | 0 | % | 91 | % | 1 | % | |||||||||||
2020 |
14 | % | 0 | % | 83 | % | 3 | % | ||||||||||||
2019 |
8 | % | 0 | % | 91 | % | 1 | % | ||||||||||||
Fiscal Council |
2021 |
100 | % | 0 | % | 0 | % | 0 | % | |||||||||||
2020 |
100 | % | 0 | % | 0 | % | 0 | % | ||||||||||||
2019 |
100 | % | 0 | % | 0 | % | 0 | % | ||||||||||||
Audit Committee |
2021 |
100 | % | 0 | % | 0 | % | 0 | % | |||||||||||
2020 |
100 | % | 0 | % | 0 | % | 0 | % | ||||||||||||
2019 |
100 | % | 0 | % | 0 | % | 0 | % |
Year ended in December 31, 2021 |
||||||||||||
a Body |
Board of |
Executive |
Fiscal |
|||||||||
Directors |
Board |
Council |
||||||||||
b Number of members |
12.50 | 25.50 | 6.00 | |||||||||
c Number of members who receive compensation |
12.50 | 25.50 | 6.00 | |||||||||
d Amount of the highest individual compensation (in R$) |
14,198,000 | 52,966,000 | 180,000 | |||||||||
e Amount of the lowest individual compensation (in R$) |
2,392,000 | 3,150,000 | 72,000 | |||||||||
f Average amount of individual compensation (total compensation divided by the number of compensated members) (in R$) |
4,679,738 | 16,687,921 | 124,833 |
Year ended in December 31, 2020 |
||||||||||||
a Body |
Board of |
Executive |
Fiscal |
|||||||||
Directors |
Board |
Council |
||||||||||
b Number of members |
11.50 | 19.80 | 6.00 | |||||||||
c Number of members who receive compensation |
11.50 | 19.80 | 6.00 | |||||||||
d Amount of the highest individual compensation (in R$) |
10,392,000 | 34,737,000 | 220,500 | |||||||||
e (in R$) |
2,643,000 | 2,588,000 | 88,200 | |||||||||
f Average amount of individual compensation (total compensation divided by the number of compensated members) (in R$) |
4,483,015 | 11,681,451 | 145,950 |
Year ended in December 31, 2019 |
||||||||||||
a Body |
Board of |
Executive |
Fiscal |
|||||||||
Directors |
Board |
Council |
||||||||||
b Number of members |
11.75 | 21.00 | 6.00 | |||||||||
c Number of members who receive compensation |
11.75 | 21.00 | 6.00 | |||||||||
d Amount of the highest individual compensation (in R$) |
14,560,000 | 52,060,000 | 220,500 | |||||||||
e Amount of the lowest individual compensation (in R$) |
2,643,000 | 2,953,000 | 88,200 | |||||||||
f Average amount of individual compensation (total compensation divided by the number of compensated members)( in R$) |
5,236,316 | 16,930,128 | 154,350 |
Fiscal Council |
Within the limits established by legislation, members of the Fiscal Council are paid monthly fixed compensation amount only and are not eligible for the benefit plan. Additionally, in accordance with applicable legislation, compensation members of the Fiscal Council may not be lower, for each acting member, than 10% of the fixed compensation assigned to each officer (i.e., not including benefits, representation allowances and profit sharing). | |
Board of Directors |
The monthly fixed compensation is consistent with market practices and periodically revised to attract qualified professionals. Additionally, history and résumé, among other factors, are taken into account. | |
Audit Committee |
The members of the Audit Committee are paid monthly fixed compensation amount only and are not eligible for the benefit plan. For those members of the Audit Committee who are also part of the Board of Directors, the compensation policy of the Board of Directors is applied. | |
Board of Officers |
The monthly fixed compensation is established in accordance with the position held and is based on the internal equality principle, since all officers holding equivalent position earn the same monthly fixed compensation amount, also enabling their mobility in our different businesses. Fixed compensation amounts are determined taking into account market competition. |
• | Performance of the officer; |
• | The result of the applicable business area; and |
• | Financial results of the company. |
(1) | Within the limits established by legislation, the compensation of Officers in charge of internal control and risk departments is determined irrespective of the performance of the business areas they control and assess so as not to give rise to any conflicts of interest. However, even though compensation is not impacted by the results from business areas, it is still subject to any impacts arising from our results. |
• | 30% is paid in cash on demand; and |
• | 70% is paid through the delivery of our preferred shares, deferred for payment within three years, in the proportion of 1/3 of the amount due per year. |
(2) | In accordance with CMN Resolution No. 3,921, a portion of the variable compensation must be deferred. |
Audit Committee Since 2014 |
• Oversees the quality and integrity of the financial statements • Oversees compliance with legal and regulatory requirements • Supervision of internal controls and risk management • Supervision of performance, independence and quality of internal audit activities and of the work of the independent accountant | |
100% of the members are independent | ||
46 meetings | ||
Compensation Committee Since 2011 |
• Promote discussions on incentive and compensation models • Develops compensation policies for management members and employees • Establishes Goals | |
100% of the members are non-executive |
5 meetings | ||
Personnel Committee Since 2009 |
• Establishes policies for attracting and retaining talented professionals • Proposes guidelines for recruiting and training employees • Presents long-term incentive programs and monitors the culture of meritocracy | |
100% of the members are non-executive | ||
5 meetings | ||
Strategy Committee Since 2009 |
• Proposes budgetary guidelines • Provides inputs for decision-making processes • Recommends strategic guidelines and investments opportunities (Mergers and Acquisitions) • Internationalizes and creates new business areas | |
100% of the members are non-executive | ||
6 meetings | ||
Related Parties Committee Since 2013 |
• Manages transactions between related parties • Ensures equality and transparency for these transactions | |
100% of the members are independent | ||
5 meetings | ||
Risk and Capital Management Committee Since 2009 |
• Supports the Board of Directors • Establishes the risk appetite • Evaluates the cost of capital x the minimum return expected • Allocates capital • Oversees management activities and risk control • Improve risk culture • Complies with regulatory requirements | |
100% of the members are non-executives | ||
12 meetings | ||
Nomination and Corporate Governance Committee Since 2013 |
• Periodically reviews the criteria for nomination and succession • Provides methodological support for the assessment of the Board of Directors and Chief Executive Officer • Nominates members of the Board of Directors and General Managers • Analyzes potential conflicts of interests | |
100% of the members are non-executive | ||
1 meeting | ||
Corporate Social Responsibility Committee Since 2019 |
• Defines strategies to strengthen the corporate social responsibility of the Company in all its elements, including a voluntary strategy; • Analyzes the performance of social institutions related to the Company and the initiatives directly executed by the Company; • Ensures the appropriate degree of autonomy among social institutions and the Company; • Fosters the search for synergies and opportunities to increase efficiency between institutions and the Company as well as the institutions themselves; • Approves multi-annual budget for initiatives that depend on the Company’s resources; |
• Monitors the quality of governance of each institution; • Defines the allocation process of the Rouanet Law as well as the other existing incentive laws and approve the contributions to be made by the Company or other companies of the Itaú Unibanco Group. | ||
100% of the members are non-executives | ||
3 meetings |
• | Customer Service: last resource, with significant degree of independence, to investigate and attempt to resolve clients complaints within the organization. Clients who are not satisfied with the answers received on previous contacts (within the last 30 days) are eligible. |
• | Continuous improvement: aims to identify systemic issues, through complaints root cause analysis, and address them (with the help of all other organization teams involved) for continuous improvement of products, services, customer satisfaction on a timely manner as well as guarantee ethics and transparency guidelines. |
• | Compliance with regulatory obligations: comply with regulatory obligations: responsible for the governance of all processes related to client complaints through regulators (Central Bank, SUSEP, CVM, etc) and consumer protection bureaus helping provide and ensure adequate solutions for all clients. Processes are subject to regulatory supervision by the agencies. |
Employees (Brazil and abroad) |
As of December 31, |
Variation |
||||||||||||||||||||||||||
2021 |
2020 |
2019 |
2021-2020 |
2020-2019 |
||||||||||||||||||||||||
In Brazil |
87,341 | 83,919 | 81,691 | 3,422 | 4.1 | % | 2,228 | 2.7 | % | |||||||||||||||||||
Abroad |
12,257 | 12,621 | 13,190 | (364 | ) | (2.9 | )% | (569 | ) | (4.3 | )% | |||||||||||||||||
Argentina |
1,554 | 1,584 | 1,613 | (30 | ) | (1.9 | )% | (29 | ) | (1.8 | )% | |||||||||||||||||
Chile |
5,214 | 5,340 | 5,755 | (126 | ) | (2.4 | )% | (415 | ) | (7.2 | )% | |||||||||||||||||
Colombia |
2,691 | 3,098 | 3,326 | (407 | ) | (13.1 | )% | (228 | ) | (6.9 | )% | |||||||||||||||||
Uruguay |
1,079 | 1,065 | 1,101 | 14 | 1.3 | % | (36 | ) | (3.3 | )% | ||||||||||||||||||
Paraguay |
1,007 | 975 | 869 | 32 | 3.3 | % | 106 | 12.2 | % | |||||||||||||||||||
Europe |
226 | 209 | 212 | 17 | 8.1 | % | (3 | ) | (1.4 | )% | ||||||||||||||||||
Other |
486 | 350 | 314 | 136 | 38.9 | % | 36 | 11.5 | % | |||||||||||||||||||
Total |
99,598 |
96,540 |
94,881 |
3,058 |
3.2 |
% |
1,659 |
1.7 |
% | |||||||||||||||||||
|
|
|
|
|
|
|
|
|
|
|
|
|
|
|||||||||||||||
Employees (by operating unit) |
As of December 31, |
Variation |
||||||||||||||||||||||||||
2021 |
2020 * |
2019 * |
2021-2020 |
2020-2019 |
||||||||||||||||||||||||
Wholesale |
20,523 | 19,697 | 20,160 | 826 | 4.2 | % | (463 | ) | (2.3 | )% | ||||||||||||||||||
Retail |
56,487 | 57,077 | 58,374 | (590 | ) | (1.0 | )% | (1,297 | ) | (2.2 | )% | |||||||||||||||||
Technology (1) |
13,990 | 10,947 | 7,191 | 3,043 | 27.8 | % | 3,756 | 52.2 | % | |||||||||||||||||||
Support Areas (2) |
8,598 | 8,819 | 9,156 | (221 | ) | (2.5 | )% | (337 | ) | (3.7 | )% | |||||||||||||||||
Total |
99,598 |
96,540 |
94,881 |
3,058 |
3.2 |
% |
1,659 |
1.7 |
% | |||||||||||||||||||
|
|
|
|
|
|
|
|
|
|
|
|
|
|
(1) | Includes 3.131 ZUP employees in 2021 |
(2) | Includes: Human Resources, Legal, Audit, Corporation, Finance, Operations, Risks and Marketing. |
(*) | 2019 and 2020 according to organizational restructuring |
ITEM 7. |
MAJOR STOCKHOLDERS AND RELATED PARTY TRANSACTIONS |
Common Shares |
|
Preferred Shares |
|
Total |
|
|||||||||||||||||||
Stockholders |
Total Number of Shares |
% of Total |
Total Number of Shares |
% of Total |
Total Number of Shares |
% of Total |
||||||||||||||||||
IUPAR – Itaú Unibanco Participacões S.A. |
2,564,084,404 | 51.71 | % | — | 0.00 | % | 2,564,084,404 | 26.15 | % | |||||||||||||||
Itaúsa S.A. |
1,943,906,577 | 39.21 | % | 169,323 | 0.00 | % | 1,944,075,900 | 19.83 | % | |||||||||||||||
BlackRock, Inc (1) |
— | 0.00 | % | 349,925,097 | 7.22 | % | 349,925,097 | 3.57 | % | |||||||||||||||
Dodge & Cox (1) |
— | 0.00 | % | 242,768,249 | 5.01 | % | 242,768,249 | 2.48 | % | |||||||||||||||
Others |
450,299,378 | 9.08 | % | 4,228,737,595 | 87.27 | % | 4,679,036,973 | 47.73 | % | |||||||||||||||
Subtotal |
4,958,290,359 |
100.00 |
% |
4,821,600,264 |
99.50 |
% |
9,779,890,623 |
99.75 |
% | |||||||||||||||
Treasury stock |
— | 0.00 | % | 24,244,725 | 0.50 | % | 24,244,725 | 0.25 | % | |||||||||||||||
Total |
4,958,290,359 |
100.00 |
% |
4,845,844,989 |
100.00 |
% |
9,804,135,348 |
100.00 |
% | |||||||||||||||
|
|
|
|
|
|
|
|
|
|
|
|
(1) | Share ownership information provided by stockholder. |
• | its controllers (individuals or legal entities), pursuant to Article 116 of Law No. 6,404/76, as well as their spouses, partners and their direct relatives, in the collateral line or affinity, up to the second degree; |
• | its officers, managers, and members of statutory or contractual bodies, as well as their spouses, partners and their direct relatives, in the collateral line or by affinity, up to the second degree; |
• | individuals with qualified equity interest; and |
• | legal entities: (i) with qualified equity interest; (ii) in which capital, directly or indirectly, there is qualified equity interest; (iii) in which there is effective operational control or relevance in the deliberations, regardless of equity interest; and (iv) that have an officer or member of the board of directors in common. |
ITEM 8. |
FINANCIAL INFORMATION |
8A. |
Consolidated Statements and Other Financial Information |
For The Year Ended December 31, |
||||||||||||
Provision |
2021 |
2020 |
2019 |
|||||||||
(In millions of R$) |
||||||||||||
Civil |
3,317 | 3,511 | 3,633 | |||||||||
Labor |
8,219 | 8,015 | 8,579 | |||||||||
Tax proceedings and legal obligations |
6,498 | 6,810 | 8,266 | |||||||||
Other |
1,558 | 1,483 | 976 | |||||||||
Total |
19,592 |
19,819 |
21,454 |
|||||||||
|
|
|
|
|
|
• | Salary differences arising from the application of the 30 working hours per week limit, provided for in art. 224 of the CLT, which is applicable to bank employees whose function does not require special trust from the employer; |
• | Salary differences arising from overtime not duly registered in the internal systems; |
• | Claims with respect to the method used to establish overtime pay; and |
• | Salary parity. |
8B. |
Significant Changes |
ITEM 9. |
THE OFFER AND LISTING |
Brazil |
United States | |||
B3—Bolsa, Balcão |
NYSE | |||
Level 1 ITUB3 Common Shares |
Level 1 ITUB4 |
Level 2 ITUB American Depositary Shares (ADSs) | ||
Shareholders’ rights |
ADS holder rights | |||
Common shares – – tag-along; and – |
Preferred shares – – tag-along; – – – |
ADSs – |
9B. |
Plan of Distribution |
9C. |
Markets |
9D. |
Selling Shareholders |
9E. |
Dilution |
9F. |
Expenses of the Issue |
ITEM 10. |
ADDITIONAL INFORMATION |
10A. |
Share Capital |
10B. |
Memorandum and Articles of Association |
IUPAR (Itaú Unibanco Participações) |
- Alignment and union among shareholders; - Group’s vision, mission and values; - Significant mergers and acquisitions; - Performance evaluation and admission of family members; and - Discussion and approval of the long-term strategy. |
Family Control With a long-term strategic vision |
Itaú Unibanco Board of Directors |
- Definition and monitoring of the company’s strategy; - Mergers and acquisitions; - Monitor the Executive Committee’s performance - Nomination of officers (meritocracy); - Budget approval; - Definition and monitoring of incentive and compensation models and goal settings; - Supervision of the technologies strategy; - Definition of the meritocracy policies; and - Business operation supervision. |
Value Creation Strategy definition | ||
Executive Committee |
- Implementation of Board of Director’s guidelines and goals; - Business operation and strategies for products and segments; - Ensure better allocation and management of financial, operational and human resources; - Monitoring of market, credit and operational risks; and - Operate the Bank in purpose of value creation |
Professional management Implementation of strategy and day-to-day |
• | Bylaws: |
• | Internal Charters: |
• | Policy for the Nomination of Members of the Board of Directors, Committees Reporting to the Board of Directors and the Executive Board: |
• | Code of Ethics: |
• | Policy for Trading our Securities |
• | Transactions with Related Parties: |
• | Corporate Policy and Procedure Disclosure of Material Information: |
• | Relationship Policy with Public Officials and Contracting with Bodies, Entities and Companies of Public Administration: |
• | Corporate Governance Policy: |
• | Anti-Corruption Corporate Policy: |
Duties |
Composition | |||
General Stockholder’s Meeting |
The company’s supreme body that brings stockholders together, either on an ordinary or extraordinary basis, through a convening notice as set forth by law. Annual Stockholders’ Meeting: Extraordinary Stockholders’ Meeting: |
The Annual Stockholders’ Meeting is open on first call with the attendance of stockholders representing at least 25% of voting capital. Any amendments to the Bylaws should be resolved on at an Extraordinary Stockholders’ Meeting, which will be open on first call with the attendance of stockholders representing at least two thirds (2/3) of the voting capital. Our meetings are held with a quorum representing approximately 90% of our voting capital. | ||
Fiscal Council |
An independent body operating independently from Management, our external auditors and Audit Committee. It supervises the activities of our Management, examines and opines on our financial statements for the year ended, among other duties established by Brazilian law. |
It is composed of 3 to 5 members elected annually by our stockholders, one of whom by minority preferred stockholders. | ||
Board of Directors |
It is responsible for establishing our general business guidelines, including for our subsidiaries, and holds ordinary meetings eight times per year and extraordinary meetings when necessary. |
It is composed of 12 members, all non-executive, and of whom 5 are deemed independent (41.67%). The turnover of the Board members is carried out in accordance with our bylaws, which provide for the ineligibility of persons who have reached the age of 70. Members are elected annually by our stockholders. | ||
Board of Officers |
It implements the guidelines proposed by the Board of Directors. Officers manage our daily business activities, ensuring the best allocation and management funds to accomplish the goals we have set. |
It is composed of 5 to 30 members, including Chief Executive Officer and Officers, in conformity with the guidelines established by the Board of Directors for filling these positions. Members are elected annually by the Board of Directors. Each member elected to our Board of Officers must be approved by the Central Bank. According to Brazilian law, an acting officer retains their position until they are reelected or a successor takes office. | ||
Disclosure and Trading Committee |
This Committee is responsible for: Managing the Policy for the Disclosure of Material information and the Policy for Trading our Securities. Carrying out internal actions intendent to improve the information flow. Promoting the ethical conduct of our management members and employees. Ensuring transparency, quality, equality and security of the information provided to our stockholders, investors and other capital market players. |
It is composed of: members of our Board of Directors. members of our Board of Officers or of any other Itaú Unibanco Group company. Professionals of proven knowledge in the capital markets area. Investors Relations Officer (a permanent member of the Committee). |
10F. |
Dividends and Paying Agents |
10G. |
Statement by Experts |
10H. |
Documents on Display |
10I. |
Subsidiary Information |
ITEM 11. |
QUANTITATIVE AND QUALITATIVE DISCLOSURES ABOUT MARKET RISK |
• | To follow the guidelines established by the Board of Directors, as well as to provide information for the Board to monitor the strategies and policies related to credit risk, so that there is a clear understanding of the tolerance for risk and the level of profitability that the institution expects to achieve for incurring the various credit risks; |
• | Ensure that policies and strategies for credit risk management are clearly defined, establishing operating limits, risk mitigation mechanisms, and procedures designed to maintain credit risk exposure in line with our risk appetite; |
• | Establish processes and instruments to measure, monitor and control risk, which allow quantifying the credit risk inherent to all products, portfolio concentrations and the impacts of potential changes in the economic environment; |
• | To promote the continuous monitoring of our portfolio and the policies and strategies adopted, reporting to the executive board any indications of deterioration in the quality of operations and any exceptions to the established rules; and |
• | To ensure the compliance of operations and controls with the rules and legislation in force in each country. |
• | Internal fraud; |
• | External fraud; |
• | Labor claims and deficient security in the workplace; |
• | Inadequate practices related to clients, products and services; |
• | Damage to our own physical assets or assets in use; |
• | Interruption of our activities; |
• | Failures in information technology systems; and |
• | Failures in the performance, compliance with deadlines and management of our activities. |
• | Disaster Recovery Plan: focused on the recovery of our primary data center, ensuring the continuity of the processing of critical systems within minimum pre-established periods; |
• | Workplace Contingency Plan: Employees responsible for performing critical business functions have alternatives to perform their activities in the event of unavailability of the buildings in which they usually work. Remote work is also available activities are performed from remote work (home office). |
• | Emergency Plan: procedures aimed at minimizing the effects of emergency situations that may impact our facilities, with a preventive focus; and |
• | Processes Contingency Plan: alternatives (Plan B) to carry out the critical processes identified in the business areas. |
• | Business Impact Analysis (BIA): evaluates the criticality and resumption requirement of the processes that support the delivery of products and services. Through this analysis the businesses’ resumption priorities are defined; and |
• | Threats and Vulnerabilities Analysis (AVA): identification of threats to the locations where our buildings are located. |
• | Different scenarios for liquidity projections to decision support, also using stressed macroeconomics scenarios and reversed stress according to risk appetite; |
• | Contingency plans for potential crisis, which contains procedures ordered by levels of execution, considering each countries’ characteristics; |
• | Reports of risk indicators; and |
• | Tracking, and monitoring of funding sources considering counterparty type, maturity and other aspects, considering the risk appetite. |
• | Political, economic and market conditions; |
• | The profile of our portfolio; and |
• | Capacity to act in specific markets. |
• | Provide visibility and comfort for all senior management levels that market risks assumed must be in line with our risk-return objectives; |
• | Provide disciplined and informed dialogue on the overall market risk profile and its evolution over time; |
• | Increase transparency as to how the business works to optimize results; |
• | Provide early warning mechanisms to facilitate effective risk management, without obstructing the business objectives; and |
• | Monitor and avoid risk concentration. |
• | Value at Risk (VaR): a statistical metric that quantifies the maximum potential economic loss expected in normal market conditions, considering a defined holding period and confidence interval; |
• | Losses in Stress Scenarios (Stress Testing): a simulation technique to evaluate the impact, in the assets, liabilities and derivatives of the portfolio, of various risk factors in extreme market situations (based on prospective and historic scenarios); |
• | Stop Loss: metrics that trigger a management review of positions, if the accumulated losses in a given period reach specified levels; |
• | Concentration: cumulative exposure of certain financial instruments or risk factors calculated at market value (mark to market); and |
• | Stressed VaR: a statistical metric derived from VaR calculation, aimed at capturing the biggest risk in simulations of the current portfolio, taking into consideration the observable returns in historical scenarios of extreme volatility. |
• | Gap Analysis: accumulated exposure of cash flows by risk factor, which are marked-to-market |
• | Sensitivity (DV01 – Delta Variation Risk): impact on the market value of cash flows when a one basis point change is applied to current interest rates or on the index rates; and |
• | Sensitivities to Various Risk Factors (Greek): partial derivatives of a portfolio of options on the prices of the underlying assets, implied volatilities, interest rates and time. |
Consolidaded VaR (Historical Simulation approach) (1) |
Average |
Minimum |
Maximum |
December 31, 2021 |
Average |
Minimum |
Maximum |
December 31, 2020 |
||||||||||||||||||||||||
(In millions of R$) |
||||||||||||||||||||||||||||||||
Group of Risk Factor |
||||||||||||||||||||||||||||||||
Interest rate |
937 |
425 |
1,411 |
1,257 |
614 |
292 |
1,961 |
431 |
||||||||||||||||||||||||
Currencies |
18 |
10 |
37 |
13 |
20 |
9 |
71 |
24 |
||||||||||||||||||||||||
Equities |
42 |
17 |
98 |
24 |
23 |
9 |
49 |
30 |
||||||||||||||||||||||||
Commodities |
4 |
1 |
8 |
4 |
2 |
1 |
4 |
1 |
||||||||||||||||||||||||
Diversification effect (2) |
(602 |
) |
(263 |
) | ||||||||||||||||||||||||||||
|
|
|
|
|
|
|
|
|
|
|
|
|
|
|
|
|||||||||||||||||
Total |
441 |
198 |
707 |
696 |
282 |
166 |
763 |
223 |
||||||||||||||||||||||||
|
|
|
|
|
|
|
|
|
|
|
|
|
|
|
|
(1) | Determined in local currency and converted into Brazilian reais at the closing price on the reporting date. |
(2) | Reduction of risk due to the combination of all risk factors. |
Trading Book VaR (1) |
Average |
Minimum |
Maximum |
December 31, 2021 |
Average |
Minimum |
Maximum |
December 31, 2020 |
||||||||||||||||||||||||
(In millions of R$) |
||||||||||||||||||||||||||||||||
Group of Risk Factor |
||||||||||||||||||||||||||||||||
Interest rate |
39.4 |
11.9 |
80.8 |
40.6 |
38.0 |
12.3 |
146.6 |
20.7 |
||||||||||||||||||||||||
Currencies |
12.1 |
5.1 |
50.2 |
6.2 |
14.5 |
6.0 |
61.4 |
14.5 |
||||||||||||||||||||||||
Equities |
24.4 |
10.1 |
57.6 |
10.3 |
19.7 |
5.8 |
61.4 |
15.4 |
||||||||||||||||||||||||
Commodities |
4.2 |
1.1 |
7.6 |
3.1 |
1.8 |
0.7 |
5.8 |
1.1 |
||||||||||||||||||||||||
Diversification effect (2) |
(26.7 |
) |
(8.2 |
) | ||||||||||||||||||||||||||||
|
|
|
|
|
|
|
|
|
|
|
|
|
|
|
|
|||||||||||||||||
Total |
48.7 |
21.4 |
106.8 |
33.5 |
42.0 |
20.9 |
138.2 |
43.5 |
||||||||||||||||||||||||
|
|
|
|
|
|
|
|
|
|
|
|
|
|
|
|
(1) | Determined in local currency and converted into Brazilian reais at the closing price on the reporting date. |
(2) | Reduction of risk due to the combination of all risk factors. |
• | Underwriting risk: the possibility of losses arising from insurance products, pension plans and premium bonds that go against our expectations, directly or indirectly associated with technical and actuarial bases used for calculating premiums, contributions and technical provisions; |
• | Market risk; |
• | Credit risk; |
• | Operational risk; and |
• | Liquidity risk. |
• | Policies and Procedures; |
• | Customer Identification Process; |
• | Know Your Customer—KYC; |
• | Know Your Partner—KYP; |
• | Know Your Supplier—KYS; |
• | Know Your Employee—KYE; |
• | Evaluation of New Products and Services; |
• | Sanctions Compliance; |
• | Monitoring, Selection and Analysis pf Suspicious Operations or Situations; |
• | Reporting Suspicious Transactions to Regulators and Authorities; and |
• | Training. |
ITEM 12. |
DESCRIPTION OF SECURITIES OTHER THAN EQUITY SECURITIES |
Event |
Fees | |
Issuance (1) or cancellation for the purpose of withdrawal (2) of ADSs |
US$5.00 (or less) per 100 ADSs (or portion thereof) plus any additional fees charged by any governmental authorities or other institutions for the execution and delivery or surrender of ADSs. | |
Any cash distribution | US$0.05 (or less) per ADS (or portion thereof). | |
Depositary services | US$0.05 (or less) per ADS (or portion thereof) per calendar year (in addition to cash distribution fee of US$0.05 per ADS during the year). |
(1) |
Including issuances resulting from a distribution of preferred shares or rights or other property, substitution of underlying shares and transferring, splitting or grouping of receipts. |
(2) |
Including if the deposit agreement terminates. |
• | Registration fees: registration of transfers of preferred shares on our preferred share register to or from the name of the depositary or its agent when the holder deposit or withdraws preferred shares. |
• | Distribution of securities by the depositary to ADS holders fee: equivalent to the fee that would be payable if securities distributed to the holder thereof had been preferred shares and the shares had been deposited for issuance of ADSs. |
• | Foreign currency conversion expenses: expenses of the depositary in converting foreign currency to U.S. dollars. |
• | Depositary expenses: cable, telex and facsimile transmissions (when expressly provided in the Deposit Agreement). |
ITEM 13. |
DEFAULTS, DIVIDEND ARREARAGES AND DELINQUENCIES |
ITEM 14. |
MATERIAL MODIFICATIONS TO THE RIGHTS OF SECURITY HOLDERS AND USE OF PROCEEDS |
ITEM 15. |
CONTROLS AND PROCEDURES |
ITEM 16. |
[RESERVED] |
16A. |
Audit Committee Financial Expert |
16B. |
Code of Ethics |
16C. |
Principal Accountant Fees and Services |
Fees |
2021 |
% Approved by the Audit Committee |
2020 |
% Approved by the Audit Committee |
||||||||||||
(In thousands of R$) |
||||||||||||||||
Audit Fees |
75,536 | 100.0 | 66,631 | 100.0 | ||||||||||||
Audit-Related Fees |
4,472 | 100.0 | 4,896 | 100.0 | ||||||||||||
Tax Fees |
688 | 100.0 | 541 | 100.0 | ||||||||||||
All Other Fees |
962 | 100.0 | 88 | 100.0 | ||||||||||||
Total |
81,658 |
72,156 |
||||||||||||||
|
|
|
|
Audit fees: For the audit of our consolidated financial statements, the review of our quarterly financial statements, as well as the audit and review of financial statements of our subsidiaries, services relating to issuing comfort letters in securities offerings, issuance of reports required by regulatory bodies and audit of internal control over financial reporting in connection with the Sarbanes-Oxley Act requirements. |
Audit-related fees: For independent assurance on internal controls, including certain services provided to customers, on our sustainability report, MD&A (Management Discussion & Analysis) report and Integrated Annual Report, on certain agreements signed with regulatory authorities, compliance with financial covenants, due diligence, independent opinions on the book value of assets / liabilities transferred on internal reorganizations and agreed upon procedures on the balance sheets and on profit share calculation on certain businesses. | |
Tax fees: For review of the calculations and tax settlement and compliance with tax regulations. |
Other fees: For training acquisition, consultancy of risk management system implemented in a subsidiary, gap assessment on internal control’s adequacy, use of technical materials and independent review of the financial and prudential information reporting processes. |
16D. |
Exemptions from the Listing Standards for Audit Committees |
16E. Purchases |
of Equity Securities by the Issuer and Affiliated Purchasers |
16F. Change in Registrant’s |
Certifying Accountant |
16G. Corporate Governance |
NYSE REQUIREMENTS |
OUR PRACTICES | |
Independent members of the Board of Directors | ||
Companies listed on the NYSE must have a majority of independent members on their Board of Directors (as defined in applicable rules). However, controlled listed companies (companies with more than 50% of capital held by an individual, group or another company), do not need to comply with this requirement and are exempt from the rule. | Even though we fall under the exception to the NYSE’s rule and there is no similar requirement under Brazilian law, our Board of Directors has five directors considered independent pursuant to the criteria established in our Corporate Governance Policy. The criteria we use to determine independence are also different from those adopted by the NYSE. | |
Executive Sessions | ||
Non-executive members of the Board of Directors should meet at regularly scheduled executive sessions without the presence of directors who are also officers of the company |
All members of our Board of Directors are currently non-executive. |
Nomination and Corporate Governance Committee | ||
Companies listed on the NYSE should have a nomination and corporate governance committee entirely comprised of independent directors and governed by charters on the purposes and responsibilities of such committee. However, controlled listed companies of which more than 50% of the voting power is held by an individual, a group or another company, such as in our case, are not required to comply with such requirement. | We have a Nomination and Corporate Governance Committee responsible for encouraging and overseeing the discussion of the company’s governance-related matters. All members of our Nomination and Corporate Governance Committee are non-executive, and two of them are independent, in accordance with our Corporate Governance Policy. | |
Compensation Committee | ||
Companies listed on the NYSE have a compensation committee composed of independent directors and governed by charters on the purposes and responsibilities of such committee. However, controlled listed companies of which more than 50% of voting capital is held by an individual, a group or another company, such as in our case, are not required to comply with such requirements. | CVM rules do not require publicly-listed companies to have a compensation committee. Nonetheless, Brazilian banking regulation requires that we have a compensation committee. In compliance with this regulation, our Compensation Committee reports to the Board of Directors and the members of this committee are not required to be independent. However, currently one of four members of our Compensation Committee is considered independent under our Corporate Governance Policy. | |
Audit Committee | ||
Companies listed on the NYSE are required to have an audit committee that: (i) is composed of at least three independent members who are financially literate; (ii) complies with SEC rules on audit committees of companies registered with the NYSE; (iii) has at least one member who has accounting of financial management expertise; and (iv) is governed by a charter that expressly sets out the purpose and responsibilities of the committee and establishes annual performance evaluations. | CMN regulates independent audit services rendered to financial institutions and requires the establishment of an audit committee composed of at least three independent members, in accordance with the independence criteria set forth in these rules. Our Audit Committee, that was established on April 28, 2004, meets the applicable Brazilian legal requirements, is elected annually by the Board of Directors and composed of professionals with proven technical qualifications compatible with this Committee’s responsibilities. Under SEC rules, we are not required to have an Audit Committee established or operating in accordance with NYSE rules if we meet some specified SEC requirements. We believe that our Audit Committee meets the requirements of Rule 10A-3(c)(3) under the Exchange Act and is able to act independently when performing its duties. To the extent permitted by Brazilian legislation, our Audit Committee performs all functions required to be performed by an audit committee by Rule 10A-3 under the Exchange Act. | |
Stockholders’ approval of management members’ compensation and stock options plans | ||
Stockholders have the opportunity to vote on all stock-based compensation plans and significant amendments thereto, as well as on significant increases in the number of shares available to the plan, with a few exceptions | Brazilian legislation sets forth a similar requirement, as it establishes the need for approval to the aggregate annual compensation of management members (including shares) at the General Stockholders’ Meeting. |
Corporate Governance Code | ||
Companies listed on NYSE are required to adopt and disclose their corporate governance guidance. | We have a Corporate Governance Policy that consolidates the corporate governance principles and practices we adopt. We believe these principles and practices, consistent with Brazilian legislation, are compatible with the guidelines established by the NYSE. We have adopted stricter rules than those required by Brazilian legislation, as we have voluntarily adhered to B3’s Level 1 of Corporate Governance and have granted tag-along rights to all stockholders, regardless of their voting rights. In 2021, we disclosed the Brazilian Corporate Governance Code, in accordance with CVM Instruction No. 480/09, and we have complied or partially complied with 96,29%of the 54 practices recommended. | |
Code of Ethics | ||
NYSE rules require that listed companies adopt and disclose a code of business conduct and ethics for their directors, officers and employees. NYSE also requires that listed companies promptly disclose any waiver of the provisions of the code of ethics for directors or executive officers. | Brazilian legislation has no similar requirement. However, we have a Code of Ethics that, among other matters, governs the conduct of all members of the Board of Directors, officers and employees of the Itaú Unibanco Group, detailing the principles that guide our attitudes and practices. | |
Internal Audit | ||
NYSE rules require that listed companies have an internal audit function to provide management and the Audit Committee with ongoing assessments of the company’s risk management processes and internal control systems. | Brazilian banking legislation establishes a similar requirement, since it requires that financial institution have an internal audit function compatible with the nature, size, complexity, structure, risk profile and business model of the financial institution, that it is undertaken by a specific unit directly reporting to the Board of Directors or by an independent auditor (provided that such auditor is not responsible for auditing the financial statements of the institution or any other activity that may imply a conflict of interest). Our internal audit function is responsible for assessing the sufficiency and effectiveness of our operating and management controls, as well as the adequacy of our risk identification and management process. In addition, our internal audit function is independent from management in carrying out its activities and has access to all places, executives and information necessary to carry out its duties. The internal audit function administratively reports to the Chairman of the Board of Directors, and its activities are supervised by the Audit Committee. |
16H. |
Mine Safety Disclosure |
16I. |
Disclosure Regarding Foreign Jurisdictions that Prevent Inspections |
ITEM 17. |
FINANCIAL STATEMENTS |
ITEM 18. |
FINANCIAL STATEMENTS |
ITEM 19. |
EXHIBITS |
* | Filed with this Annual Report on Form 20-F. |
** | In accordance with Rule 402 of Regulation S-T, the information in these exhibits shall not be deemed to be “filed” for purposes of Section 18 of the Exchange Act, or otherwise subject to the liability of that section, and shall not be incorporated by reference into any registration statement or other document filed under the Securities Act or the Exchange Act, except as shall be expressly set forth by specific reference in such filing. |
• | ABECS – Associação Brasileira de Empresas de Cartões de Crédito e Serviços ( Brazilian Association of Credit Cards and Services Companies) |
• | ABECIP – Associação Brasileira das Entidades de Crédito Imobiliário e Poupança (the Brazilian Association of Real Estate Loans and Savings Companies) |
• | ABRASCA – Associação Brasileira de Companhias Abertas (Brazilian Association of Public Companies) |
• | ADS – American Depositary Shares |
• | ANBIMA – Associação Brasileira das Entidades dos Mercados Financeiro e de Capitais (Brazilian Financial and Capital Markets Association) |
• | ANS – Agência Nacional de Saúde Suplementar (National Regulatory Agency for Private Health Insurance and Plans) |
• | APIMEC – Associação dos Analistas e Profissionais de Investimento do Mercado de Capitais (Association of Capital Markets Analysts and Investment Professionals) |
• | ATM – Automated Teller Machine |
• | B3 S.A. – Brasil, Bolsa, Balcão (Brazilian Exchange and OTC, formerly BM&FBovespa – Bolsa de Valores, Mercadorias e Futuros S.A.) |
• | Banco Itaú Argentina – Banco Itaú Argentina S.A |
• | Banco Itaú Chile – Banco Itaú Chile S.A. |
• | Banco Itaú Paraguay – Banco Itaú Paraguay S.A |
• | Banco Itaú Uruguay – Banco Itaú Uruguay S.A |
• | BCBS – Basel Committee for Banking Supervision |
• | BIS – Bank for International Settlements |
• | BNDES – Banco Nacional de Desenvolvimento Econômico e Social |
• | BNY Mellon – The Bank of New York Mellon |
• | Brazilian Corporate Law – Law No. 6,404, of December 15, 1976, as amended (including by Law No. 11,638) |
• | Brazilian Payment System – encompasses the institutions, the systems and the procedures related to the transfer of funds and other financial assets, among the diverse economic agents of the Brazilian market, or that involve the processing, clearing and settlement of payments in any of its forms. |
• | CADE – Conselho Administrativo de Defesa Econômica |
• | CCR – Counterparty Credit Risk |
• | CDC – Código de Defesa do Consumidor |
• | CDI – Certificado de Depósito Interbancário (Interbank Deposit Certificate) |
• | CEDEAR – Argentine Certificates of Deposits |
• | Central Bank – Banco Central do Brasil |
• | CFC – Conselho Federal de Contabilidade |
• | CGRC – Risk and Capital Management Committee |
• | Cia E. Johnston – Companhia E. Johnston de Participações |
• | CMN – Conselho Monetário Nacional (National Monetary Council) |
• | COPOM – Comitê de Política Monetária (Central Banks Monetary Policy Committee) |
• | CNSEG – Confederação Nacional das Empresas de Seguros Gerais, Previdência Privada e Vida, Saúde Suplementar e Capitalização (National Council of General Insurance, Private Pension and Life, Supplementary Health and Capitalization Companies) |
• | CNSP – Conselho Nacional de Seguros Privados (National Council of Private Insurance) |
• | COAF – Conselho de Controle de Atividades Financeiras (Financial Activities Control Council) |
• | COSO – Committee of Sponsoring Organizations of the Treadway Commission |
• | COFINS – Contribuição Para o Financiamento da Seguridade Social |
• | CONSIF – Confederação Nacional do Sistema Financeiro (National Association of the Financial System) |
• | CSB – Client Service Branches |
• | CSC – Superior Credit Committee |
• | CSCCA – Superior Wholesale Credit and Collection Committee |
• | CSCCV – Superior Retail Credit and Collection Committee |
• | CSLL – Contribuição Social Sobre o Lucro Líquido (Social Contribution on Profits) |
• | CSP – Superior Products Committee |
• | CSRML – Superior Market Risk and Liquidity Committee |
• | CSRO – Superior Operational Risk Management Committee |
• | CTAM – Model Assessment Technical Committee |
• | CVM – Comissão de Valores Mobiliários (Brazilian Securities and Exchange Commission) |
• | DJSI – Dow Jones Sustainability Index |
• | ECB – European Central Bank |
• | FATF – Financial Action Task Force |
• | FEBRABAN – Federação Brasileira de Bancos (Brazilian Federation of Banks) |
• | FENAPREVI – Federação Nacional de Previdência Privada e Vida (National Federation of Private Pension and Life) |
• | Fed – U.S. Federal Reserve System |
• | FGC – Fundo Garantidor de Crédito (Credit Insurance Fund) |
• | FGTS – Fundo de Garantia do Tempo de Serviço (The Brazilian Government Severance Indemnity Fund for Employees) |
• | FOMC – Federal Open Market Committee |
• | IASB – International Accounting Standards Board |
• | IBGE – Instituto Brasileiro de Geografia e Estatística |
• | IBRACON – Instituto de Auditores Independentes do Brasil |
• | IBRI – Instituto Brasileiro de Relações com Investidores (Brazilian Investor Relations Institute) |
• | ICAAP – Internal Capital Adequacy Assessment Process |
• | IFRS – International Financial Reporting Standards |
• | IMF – International Monetary Fund |
• | IOF – Imposto Sobre Operações Financeiras (Tax on Financial Transactions) |
• | IPCA – Índice de Preços ao Consumidor Amplo (Extended National Consumer Price Index) |
• | IRPJ – Imposto de Renda da Pessoa Jurídica |
• | IRS – U.S. Internal Revenue Service |
• | ISE – Índice de Sustentabilidade Empresarial |
• | ISS – Imposto sobre Serviços |
• | Itaú BBA Colombia – Itaú BBA Colombia S.A. Corporación Financiera |
• | Itau BBA International – Itau BBA International plc |
• | Itaucard – Banco Itaucard S.A. |
• | Itaú Europe – Itaú BBA Europe S.A. |
• | Itaú Holding Financeira – Itaú Holding Financeira S.A. |
• | Itaú Unibanco Group – Itaú Unibanco Holding S.A. and all its subsidiaries and affiliates |
• | Itaúsa – Itaú Investimentos S.A. |
• | IUPAR – Itaú Unibanco Participações S.A. |
• | KYC – Know Your Customer |
• | KYP – Know Your Partner |
• | KYS – Know Your Supplier |
• | KYE – Know Your Employee |
• | LCR – Liquidity Coverage Ratio |
• | NSFR – Net Stable Funding Ratio |
• | NYSE – New York Stock Exchange |
• | PEP – Politically Exposed Person |
• | PFIC – Passive Foreign Investment Company |
• | PIS – Programa de Integração Social (Social Integration Program) |
• | PwC – PricewaterhouseCoopers Auditores Independentes Ltda. |
• | RAET – Regime Especial de Administração Temporária (Temporary Special Administration Regime) |
• | SEC – U.S. Securities and Exchange Commission |
• | SELIC – Sistema Especial de Liquidação e Custódia (Special Clearing and Escrow System) |
• | SOX – The Sarbanes-Oxley Act of 2002 |
• | STF – Superior Tribunal Federal (Brazilian Federal Supreme Court) |
• | STJ – Superior Tribunal de Justiça (Brazilian Superior Court of Justice) |
• | SUSEP – Superintendência de Seguros Privados (Superintendency of Private Insurance) |
• | TR – Taxa Referencial (Brazilian Reference Interest Rate) |
• | Unibanco – União de Bancos Brasileiros S.A. |
• | VaR – Value at Risk |
ITAÚ UNIBANCO HOLDING S.A. | ||||||
By: | /s/ Milton Maluhy Filho | |||||
Name: | Milton Maluhy Filho | |||||
Title: | Chief Executive Officer | |||||
By: | /s/ Alexsandro Broedel Lopes | |||||
Name: | Alexsandro Broedel Lopes | |||||
Title: | Chief Financial Officer |
Dated: | April 28, 2022 |
F-2 |
||||
F-6 |
||||
F-8 |
||||
F-9 |
||||
F-10 |
||||
F-11 |
||||
F-12 |
F-3 |
F-4 |
F-5 |
Assets |
Note |
12/31/2021 |
12/31/2020 |
|||||||||
Cash |
||||||||||||
Financial Assets |
||||||||||||
At Amortized Cost |
||||||||||||
Compulsory deposits in the Central Bank of Brazil |
||||||||||||
Interbank deposits |
4 | |||||||||||
Securities purchased under agreements to resell |
4 | |||||||||||
Voluntary investments with the Central Bank of Brazil |
4 | |||||||||||
Securities |
9 | |||||||||||
Loan and lease operations |
10 | |||||||||||
Other financial assets |
18a | |||||||||||
(-) Provision for Expected Loss |
4, 9 and 10 | ( |
) | ( |
) | |||||||
At Fair Value Through Other Comprehensive Income |
||||||||||||
Securities |
8 | |||||||||||
At Fair Value Through Profit or Loss |
||||||||||||
Securities |
5 | |||||||||||
Derivatives |
6 and 7 | |||||||||||
Other financial assets |
18a | |||||||||||
Tax assets |
||||||||||||
Income tax and social contribution - current |
||||||||||||
Income tax and social contribution - deferred |
24b | |||||||||||
Other |
||||||||||||
Other assets |
18a | |||||||||||
Investments in associates and joint ventures |
11 | |||||||||||
Fixed assets, net |
13 | |||||||||||
Goodwill and Intangible assets, net |
14 | |||||||||||
Total assets |
|
|||||||||||
|
|
|
|
Liabilities and stockholders’ equity |
Note |
12/31/2021 |
12/31/2020 |
|||||||||
Financial Liabilities |
||||||||||||
At Amortized Cost |
||||||||||||
Deposits |
15 | |||||||||||
Securities sold under repurchase agreements |
17a | |||||||||||
Interbank market funds |
17b | |||||||||||
Institutional market funds |
17c | |||||||||||
Other financial liabilities |
18b | |||||||||||
At Fair Value Through Profit or Loss |
||||||||||||
Derivatives |
6 and 7 | |||||||||||
Structured notes |
16 | |||||||||||
Other financial liabilities |
18b | |||||||||||
Provision for Expected Loss |
10 |
|||||||||||
Loan commitments |
||||||||||||
Financial guarantees |
||||||||||||
Provision for insurance and private pensions |
27c | |||||||||||
Provisions |
29 | |||||||||||
Tax liabilities |
24c |
|||||||||||
Income tax and social contribution—current |
||||||||||||
Income tax and social contribution—deferred |
24b | |||||||||||
Other |
||||||||||||
Other liabilities |
18b | |||||||||||
Total liabilities |
||||||||||||
Total stockholders’ equity attributed to the owners of the parent company |
||||||||||||
Capital |
19a | |||||||||||
Treasury shares |
19a | ( |
) | ( |
) | |||||||
Capital reserves |
19c | |||||||||||
Revenue reserves |
19c | |||||||||||
Other comprehensive income |
( |
) | ( |
) | ||||||||
Non-controlling interests |
19d | |||||||||||
Total stockholders’ equity |
||||||||||||
|
|
|
|
|||||||||
Total liabilities and stockholders’ equity |
||||||||||||
|
|
|
|
Note |
01/01 to 12/31/2021 |
01/01 to 12/31/2020 |
01/01 to 12/31/2019 |
|||||||||||||
Operating Revenues |
||||||||||||||||
Interest and similar income |
21a | |||||||||||||||
Interest and similar expenses |
21b | ( |
) | ( |
) | ( |
) | |||||||||
Income of Financial Assets and Liabilities at Fair Value through Profit or Loss |
21c | |||||||||||||||
Foreign exchange results and exchange variations in foreign transactions |
( |
) | ||||||||||||||
Commissions and Banking Fees |
22 | |||||||||||||||
Income from insurance and private pension operations before claim and selling |
||||||||||||||||
Revenues from insurance premiuns and private pensions |
||||||||||||||||
Change in provision for insurance and private pension |
( |
) | ( |
) | ( |
) | ||||||||||
Other income |
3 | |||||||||||||||
Expected Loss from Financial Assets and Claims |
( |
) |
( |
) |
( |
) | ||||||||||
Expected Loss with Loan and Lease Operations |
10c | ( |
) | ( |
) | ( |
) | |||||||||
Expected Loss with Other Financial Asset, net |
( |
) | ||||||||||||||
(Expenses) / Recovery of claims |
( |
) | ( |
) | ( |
) | ||||||||||
Operating Revenues Net of Expected Losses from Financial Assets and Claims |
||||||||||||||||
Other operating income / (expenses) |
( |
) |
( |
) |
( |
) | ||||||||||
General and administrative expenses |
23 | ( |
) | ( |
) | ( |
) | |||||||||
Tax expenses |
( |
) | ( |
) | ( |
) | ||||||||||
Share of profit or (loss) in associates and joint ventures |
11 | |||||||||||||||
Income / (loss) before income tax and social contribution |
||||||||||||||||
Current income tax and social contribution |
24a | ( |
) | ( |
) | ( |
) | |||||||||
Deferred income tax and social contribution |
24a | ( |
) | |||||||||||||
Net income / (loss) |
||||||||||||||||
Net income attributable to owners of the parent company |
25 | |||||||||||||||
Net income / (loss) attributable to non-controlling interests |
19d | ( |
) | |||||||||||||
Earnings per share - basic |
25 | |||||||||||||||
Common |
||||||||||||||||
Preferred |
||||||||||||||||
Earnings per share - diluted |
25 | |||||||||||||||
Common |
||||||||||||||||
Preferred |
||||||||||||||||
Weighted average number of outstanding shares - basic |
25 | |||||||||||||||
Common |
||||||||||||||||
Preferred |
||||||||||||||||
Weighted average number of outstanding shares - diluted |
25 | |||||||||||||||
Common |
||||||||||||||||
Preferred |
Note |
01/01 to 12/31/2021 |
01/01 to 12/31/2020 |
01/01 to 12/31/2019 |
|||||||||||||
Net income / (loss) |
||||||||||||||||
Financial assets at fair value through other comprehensive income |
( |
) |
||||||||||||||
Change in fair value |
( |
) |
||||||||||||||
Tax effect |
( |
) |
( |
) | ||||||||||||
(Gains) / losses transferred to income statement |
( |
) |
( |
) | ||||||||||||
Tax effect |
( |
) |
||||||||||||||
Hedge |
( |
) |
( |
) | ||||||||||||
Cash flow hedge |
7 |
( |
) | |||||||||||||
Change in fair value |
( |
) | ||||||||||||||
Tax effect |
( |
) |
( |
) |
||||||||||||
Hedge of net investment in foreign operation |
7 |
( |
) |
|||||||||||||
Change in fair value |
( |
) |
||||||||||||||
Tax effect |
( |
) |
( |
) | ||||||||||||
Remeasurements of liabilities for post-employment benefits (*) |
( |
) |
( |
) | ||||||||||||
Remeasurements |
26 |
( |
) |
( |
) | |||||||||||
Tax effect |
( |
) |
||||||||||||||
Foreign exchange variation in foreign investments |
( |
) |
( |
) | ||||||||||||
Total other comprehensive income |
( |
) |
( |
) | ||||||||||||
Total comprehensive income |
||||||||||||||||
Comprehensive income attributable to the owners of the parent company |
||||||||||||||||
Comprehensive income attributable to non-controlling interests |
( |
) |
(*) |
Amounts that will not be subsequently reclassified to income. |
Attributed to owners of the parent company |
||||||||||||||||||||||||||||||||||||||||||||||||
Other comprehensive income |
||||||||||||||||||||||||||||||||||||||||||||||||
Capital |
Treasury shares |
Capital reserves |
Revenue reserves |
Retained earnings |
Financial Assets at Fair Value Through Other Comprehensive Income (1) |
Remeasurements of liabilities of post- employment benefits |
Conversion adjustments of foreign investments |
Gains and losses – hedge (2) |
Total stockholders’ equity - owners of the parent company |
Total stockholders’ equity – non- controlling interests |
Total |
|||||||||||||||||||||||||||||||||||||
Balance at 01/01/2019 |
( |
) |
— |
( |
) |
( |
) |
( |
) |
|||||||||||||||||||||||||||||||||||||||
Transactions with owners |
— |
— |
— |
— |
— |
— |
— |
— |
||||||||||||||||||||||||||||||||||||||||
Result of delivery of treasury shares |
— | — | — | — | — | — | — | — | ||||||||||||||||||||||||||||||||||||||||
Recognition of share-based payment plans |
— | — | ( |
) | — | — | — | — | — | — | ( |
) | — | ( |
) | |||||||||||||||||||||||||||||||||
(Increase) / Reduction of interest of controlling stockholders (Note 2.4a I and 3) |
— | — | — | — | — | — | — | — | — | — | ( |
) | ( |
) | ||||||||||||||||||||||||||||||||||
Dividends |
— | — | — | ( |
) | — | — | — | — | ( |
) | ( |
) | ( |
) | |||||||||||||||||||||||||||||||||
Interest on capital |
— | — | — | ( |
) | — | — | — | — | ( |
) | — | ( |
) | ||||||||||||||||||||||||||||||||||
Dividends / Interest on capital – declared after previous period |
— | — | — | ( |
) | — | — | — | — | — | ( |
) | — | ( |
) | |||||||||||||||||||||||||||||||||
Unclaimed dividends and Interest on capital |
— | — | — | — | — | — | — | — | — | |||||||||||||||||||||||||||||||||||||||
Other (3) |
— | — | — | ( |
) | — | — | — | — | — | ( |
) | — | ( |
) | |||||||||||||||||||||||||||||||||
Total comprehensive income |
— |
— |
— |
— |
( |
) |
( |
) |
( |
) |
||||||||||||||||||||||||||||||||||||||
Net income |
— | — | — | — | — | — | — | — | ||||||||||||||||||||||||||||||||||||||||
Other comprehensive income for the period |
— | — | — | — | — | ( |
) | ( |
) | ( |
) | ( |
) | — | ( |
) | ||||||||||||||||||||||||||||||||
Appropriations: |
||||||||||||||||||||||||||||||||||||||||||||||||
Legal reserve |
— | — | — | ( |
) | — | — | — | — | — | — | — | ||||||||||||||||||||||||||||||||||||
Statutory reserve |
— | — | — | ( |
) | — | — | — | — | — | — | — | ||||||||||||||||||||||||||||||||||||
Balance at 12/31/2019 |
( |
) |
— |
( |
) |
( |
) |
|||||||||||||||||||||||||||||||||||||||||
|
|
|
|
|
|
|
|
|
|
|
|
|
|
|
|
|
|
|
|
|
|
|
|
|||||||||||||||||||||||||
Change in the period |
— |
( |
) |
( |
) |
( |
) |
( |
) |
( |
) |
( |
) | |||||||||||||||||||||||||||||||||||
|
|
|
|
|
|
|
|
|
|
|
|
|
|
|
|
|
|
|
|
|
|
|
|
|||||||||||||||||||||||||
Balance at 01/01/2020 |
( |
) |
— |
( |
) |
( |
) |
|||||||||||||||||||||||||||||||||||||||||
Transactions with owners |
— |
— |
— |
— |
— |
— |
— |
|||||||||||||||||||||||||||||||||||||||||
Result of delivery of treasury shares |
— | — | — | — | — | — | — | — | ||||||||||||||||||||||||||||||||||||||||
Recognition of share-based payment plans |
— | — | — | — | — | — | — | — | — | |||||||||||||||||||||||||||||||||||||||
(Increase) / Reduction of interest of controlling stockholders (Note 2.4a I and 3) |
— | — | — | — | — | — | — | — | — | |||||||||||||||||||||||||||||||||||||||
Dividends |
— | — | — | — | ( |
) | — | — | — | — | ( |
) | ( |
) | ( |
) | ||||||||||||||||||||||||||||||||
Interest on capital |
— | — | — | — | ( |
) | — | — | — | — | ( |
) | — | ( |
) | |||||||||||||||||||||||||||||||||
Dividends / Interest on capital – declared after previous period |
— | — | — | ( |
) | — | — | — | — | — | ( |
) | — | ( |
) | |||||||||||||||||||||||||||||||||
Unclaimed dividends and Interest on capital |
— | — | — | — | — | — | — | — | — | |||||||||||||||||||||||||||||||||||||||
Other (3) |
— | — | — | — | — | — | — | — | — | |||||||||||||||||||||||||||||||||||||||
Total comprehensive income |
— |
— |
— |
— |
( |
) |
( |
) |
( |
) |
||||||||||||||||||||||||||||||||||||||
Net income |
— | — | — | — | — | — | — | — | ( |
) | ||||||||||||||||||||||||||||||||||||||
Other comprehensive income for the period |
— | — | — | — | — | ( |
) | ( |
) | — | ||||||||||||||||||||||||||||||||||||||
Appropriations: |
||||||||||||||||||||||||||||||||||||||||||||||||
Legal reserve |
— | — | — | ( |
) | — | — | — | — | — | — | — | ||||||||||||||||||||||||||||||||||||
Statutory reserve |
— | — | — | ( |
) | — | — | — | — | — | — | — | ||||||||||||||||||||||||||||||||||||
Balance at 12/31/2020 |
( |
) |
— |
( |
) |
( |
) |
|||||||||||||||||||||||||||||||||||||||||
|
|
|
|
|
|
|
|
|
|
|
|
|
|
|
|
|
|
|
|
|
|
|
|
|||||||||||||||||||||||||
Change in the period |
— |
— |
( |
) |
( |
) |
( |
) |
||||||||||||||||||||||||||||||||||||||||
|
|
|
|
|
|
|
|
|
|
|
|
|
|
|
|
|
|
|
|
|
|
|
|
|||||||||||||||||||||||||
Balance at 01/01/2021 |
( |
) |
— |
( |
) |
( |
) |
|||||||||||||||||||||||||||||||||||||||||
Transactions with owners |
— |
— |
— |
— |
— |
— |
— |
( |
) |
( |
) | |||||||||||||||||||||||||||||||||||||
Result of delivery of treasury shares |
— | — | — | — | — | — | — | — | ||||||||||||||||||||||||||||||||||||||||
Recognition of share-based payment plans |
— | — | ( |
) | — | — | — | — | — | — | ( |
) | — | ( |
) | |||||||||||||||||||||||||||||||||
(Increase) / Reduction of interest of controlling stockholders (Note 2.4a I and 3) |
— | — | — | — | — | — | — | — | — | — | ( |
) | ( |
) | ||||||||||||||||||||||||||||||||||
Partial spin-off (Note 3) |
( |
) | — | ( |
) | ( |
) | — | — | ( |
) | ( |
) | — | ( |
) | ||||||||||||||||||||||||||||||||
Dividends |
— | — | — | — | ( |
) | — | — | — | — | ( |
) | ( |
) | ( |
) | ||||||||||||||||||||||||||||||||
Interest on capital |
— | — | — | — | ( |
) | — | — | — | — | ( |
) | — | ( |
) | |||||||||||||||||||||||||||||||||
Reversal of Dividends or Interest on capital – declared after previous period |
— | — | — | — | — | — | — | — | ||||||||||||||||||||||||||||||||||||||||
Unclaimed dividends and Interest on capital |
— | — | — | — | — | — | — | — | ||||||||||||||||||||||||||||||||||||||||
Corporate reorganization (Note 2.4a IV and 3) |
— | — | — | — | — | — | — | — | ||||||||||||||||||||||||||||||||||||||||
Other (3) |
— | — | — | — | — | — | — | — | — | |||||||||||||||||||||||||||||||||||||||
Total comprehensive income |
— | — | — | — | ( |
) | ( |
) | ||||||||||||||||||||||||||||||||||||||||
Net income |
— |
— |
— |
— |
— |
— |
— |
— |
||||||||||||||||||||||||||||||||||||||||
Other comprehensive income for the period |
— | — | — | — | — | ( |
) | ( |
) | ( |
) | — | ( |
) | ||||||||||||||||||||||||||||||||||
Appropriations: |
||||||||||||||||||||||||||||||||||||||||||||||||
Legal reserve |
— | — | — | ( |
) | — | — | — | — | — | — | — | ||||||||||||||||||||||||||||||||||||
Statutory reserve |
— | — | — | ( |
) | — | — | — | — | — | — | |||||||||||||||||||||||||||||||||||||
Balance at 12/31/2021 |
( |
) |
— |
( |
) |
( |
) |
( |
) |
|||||||||||||||||||||||||||||||||||||||
|
|
|
|
|
|
|
|
|
|
|
|
|
|
|
|
|
|
|
|
|
|
|
|
|||||||||||||||||||||||||
Change in the period |
( |
) |
( |
) |
— |
( |
) |
( |
) |
|||||||||||||||||||||||||||||||||||||||
|
|
|
|
|
|
|
|
|
|
|
|
|
|
|
|
|
|
|
|
|
|
|
|
(1) |
Includes the share in other comprehensive income of investments in associates and joint ventures related to financial assets at fair value through other comprehensive income. |
(2) |
Includes cash flow hedge and hedge of net investment in foreign operation. |
(3) |
Includes Argentina´s hyperinflation adjustment. |
Note |
01/01 to 12/31/2021 |
01/01 to 12/31/2020 |
01/01 to 12/31/2019 |
|||||||||||||
Adjusted net income |
||||||||||||||||
Net income |
||||||||||||||||
Adjustments to net income: |
||||||||||||||||
Share-based payment |
( |
) | ( |
) | ||||||||||||
Effects of changes in exchange rates on cash and cash equivalents |
( |
) | ||||||||||||||
Expected Loss from Financial Assets and Claims |
||||||||||||||||
Income from interest and foreign exchange variation from operations with subordinated debt |
||||||||||||||||
Provision for insurance and private pension |
||||||||||||||||
Depreciation and amortization |
||||||||||||||||
Expense from update / charges on the provision for civil, labor, tax and legal obligations |
||||||||||||||||
Provision for civil, labor, tax and legal obligations |
||||||||||||||||
Revenue from update / charges on deposits in guarantee |
( |
) | ( |
) | ( |
) | ||||||||||
Deferred taxes (excluding hedge tax effects) |
24b | ( |
) | |||||||||||||
Income from share in the net income of associates and joint ventures and other investments |
( |
) | ( |
) | ( |
) | ||||||||||
Income from Financial assets - At fair value through other comprehensive income |
( |
) | ( |
) | ||||||||||||
Income from interest and foreign exchange variation of financial assets at fair value through other comprehensive income |
( |
) | ( |
) | ( |
) | ||||||||||
Income from Interest and foreign exchange variation of financial assets at amortized cost |
( |
) | ( |
) | ( |
) | ||||||||||
(Gain) loss on sale of investments and fixed assets |
( |
) | ( |
) | ( |
) | ||||||||||
Other |
23 | ( |
) | |||||||||||||
Change in assets and liabilities |
( |
) |
( |
) |
( |
) | ||||||||||
(Increase) / decrease in assets |
||||||||||||||||
Interbank deposits |
( |
) | ( |
) | ( |
) | ||||||||||
Securities purchased under agreements to resell |
( |
) | ||||||||||||||
Compulsory deposits with the Central Bank of Brazil |
( |
) | ||||||||||||||
Loan operations |
( |
) | ( |
) | ( |
) | ||||||||||
Derivatives (assets / liabilities) |
( |
) | ( |
) | ||||||||||||
Financial assets designated at fair value through profit or loss |
( |
) | ( |
) | ||||||||||||
Other financial assets |
( |
) | ( |
) | ||||||||||||
Other tax assets |
||||||||||||||||
Other assets |
( |
) | ( |
) | ||||||||||||
(Decrease) / increase in liabilities |
||||||||||||||||
Deposits |
||||||||||||||||
Deposits received under securities repurchase agreements |
( |
) | ( |
) | ||||||||||||
Funds from interbank markets |
( |
) | ||||||||||||||
Funds from institutional markets |
||||||||||||||||
Other financial liabilities |
||||||||||||||||
Financial liabilities at fair value throught profit or loss |
( |
) | ( |
) | ||||||||||||
Provision for insurance and private pension |
( |
) | ( |
) | ||||||||||||
Provisions |
( |
) | ||||||||||||||
Tax liabilities |
( |
) | ( |
) | ( |
) | ||||||||||
Other liabilities |
||||||||||||||||
Payment of income tax and social contribution |
( |
) | ( |
) | ( |
) | ||||||||||
Net cash from / (used in) operating activities |
||||||||||||||||
Dividends / Interest on capital received from investments in associates and joint ventures |
||||||||||||||||
Cash upon sale of investments in associates and joint ventures |
||||||||||||||||
Cash and Cash equivalents, net of assets and liabilities arising from the spin-off of XP Inc. |
3 | ( |
) | |||||||||||||
Cash upon sale of fixed assets |
||||||||||||||||
Mutual rescission of intangible assets agreements |
||||||||||||||||
(Purchase) / Cash from the sale of financial assets - At fair value through other comprehensive income |
( |
) | ( |
) | ||||||||||||
(Purchase) / redemptions of financial assets at amortized cost |
( |
) | ( |
) | ||||||||||||
(Purchase) of investments in associates and joint ventures |
( |
) | ( |
) | ( |
) | ||||||||||
(Purchase) of fixed assets |
( |
) | ( |
) | ( |
) | ||||||||||
(Purchase) of intangible assets |
14 | ( |
) | ( |
) | ( |
) | |||||||||
Net cash from / (used in) investment activities |
( |
) |
( |
) | ||||||||||||
Funding from institutional markets |
||||||||||||||||
Redemptions in institutional markets |
( |
) | ( |
) | ( |
) | ||||||||||
Change in non-controlling interests stockholders |
( |
) | ( |
) | ||||||||||||
Result of delivery of treasury shares |
||||||||||||||||
Dividends and interest on capital paid to non-controlling interests |
( |
) | ( |
) | ( |
) | ||||||||||
Dividends and interest on capital paid |
( |
) | ( |
) | ( |
) | ||||||||||
Net cash from / (used in) financing activities |
( |
) |
( |
) |
( |
) | ||||||||||
Net increase / (decrease) in cash and cash equivalents |
2.4c |
( |
) | |||||||||||||
Cash and cash equivalents at the beginning of the period |
||||||||||||||||
Effects of changes in exchange rates on cash and cash equivalents |
( |
) | ( |
) | ||||||||||||
Cash and cash equivalents at the end of the period |
||||||||||||||||
|
|
|
|
|
|
|||||||||||
Cash |
||||||||||||||||
Interbank deposits |
||||||||||||||||
Securities purchased under agreements to resell - Collateral held |
||||||||||||||||
Voluntary investments with the Central Bank of Brazil |
||||||||||||||||
Additional information on cash flow (Mainly Operating activities) |
||||||||||||||||
Interest received |
||||||||||||||||
Interest paid |
||||||||||||||||
Non-cash transactions |
||||||||||||||||
Loans transferred to assets held for sale |
||||||||||||||||
Spin-off of XP Inc. investment |
||||||||||||||||
Dividends and interest on capital declared and not yet paid |
2.1. |
Basis of preparation |
2.2. |
New accounting standards changes and interpretations of existing standards |
a) |
Accounting standards applicable for period ended December 31, 2021 |
• | Interest Rate Benchmark Reform (IBOR Reform) Phase II - Amendments to IFRS 4 – Insurance Contracts, IFRS7 – Financial Instruments: Disclosures, IFRS 9 – Financial Instruments, IFRS 16 – Leases and IAS 39 – Financial Instruments: Recognition and Measurement: Phase II of the inter-bank offered rates reform used as market benchmarks (IBOR). The amendments are summarized as: |
• | Changes in financial assets and liabilities: Practical expedient that allows to replace, as a consequence of the reform, the effective interest rate of a financial asset or financial liability with a new economically equivalent rate, without derecognition of the contract; |
• | Hedge accounting: End of exemptions for evaluating the effectiveness of hedge relationships (Phase I) with recognition in Profit or Loss of the ineffective portion, creation of sub-portfolios to segregate contracts with the amended rates for hedges of group items, 24-month term for identification and segregation of new risk based on changes in interest rates, and updates of hedge documentation; |
• | Disclosure: Requirements about the disclosure of risks to which the entity is exposed by the reform, risk management and evolution of the IBORs transition. |
• | Change in the hierarchy level for measuring the fair value of contracts that remain referenced in IBORs under extinction due to the expectation of reduction in the liquidity of these contracts; |
• | Effect as a result of the change of financial instruments in which the renegotiated cash flows are not economically equivalent to the original cash flows; and |
• | Early settlement of contracts where there is no agreement between the parties. |
b) |
Accounting standards recently issued and applicable in future periods |
• | IFRS 17 – Insurance Contracts: The pronouncement replaces IFRS 4 – Insurance Contracts and presents three approaches for valuation: |
• | General Model: applicable to all contracts without direct participation features; |
• | Premium Allocation Approach (PAA): applicable to contracts with term is up to 12 months or when it produces results similar to those that would be obtained if the general model was used. It is more simplified than the general model; |
• | Variable Fee Approach: applicable to insurance contracts with direct participation features, the insurance contracts which are substantially investment related service contracts under which an entity promises an investment return based on underlying items. |
• | Expected Future Cash Flows: estimate of all components of cash flow of the contract, considering inflows and outflows; |
• | Risk Adjustment: estimate of offset required for differences that may occur between cash flows; |
• | Contractual Margin: difference between any amounts received before the beginning of the contract coverage and present value of cash flows estimated at the beginning of the contract; |
• | Discount: projected cash flows must be discounted to present value, to reflect the time value of money, at rates that reflect the characteristics of the respective flows. |
• | Amendments to IAS 1 – Presentation of Financial Statements – Requires that only information about material accounting policies are disclosed, eliminating disclosures of information that duplicate or summarize IFRS requirements. These amendments are effective for the years beginning January 1 st , 2023 and they have no financial impacts. Analyzes regarding changes in disclosure will be completed by the date the standard becomes effective. |
• | Amendments to IAS 8 - Accounting Policies, Changes in Accounting Estimates and Errors – Includes the definition of accounting estimates: monetary amounts subject to uncertainties in their measurement. Expected credit loss and the fair value of an asset or liability are examples of accounting estimates. This change is effective for the years beginning January 1 st , 2023 and there are no impacts for the Consolidated Financial Statements of ITAÚ UNIBANCO HOLDING. |
• | Amendments to IAS 12 – Income Taxes – Clarifies that the exemption for accounting for deferred taxes arising from temporary differences generated in the initial recognition of assets or liabilities is no applicable to lease operations. These amendments are effective for years beginning January 1 st , 2023. Possible impacts are being evaluated and will be completed by the date the standard becomes effective. |
2.3. |
Critical accounting estimates and judgments |
Topic |
Notes | |
Consolidation | Note 2.3 (a) and Note 3 | |
Fair value of financial instruments | Note 2.3 (b) and Note 28 | |
Effective interest rate | Note 2.3 (c), Notes 5, 8, 9 and 10 | |
Change to financial assets | Note 2.3 (d), Notes 5, 8, 9 and 10 | |
Transfer and write-off of financial assets |
Note 2.3 (e), Notes 5, 8, 9 and 10 | |
Expected credit loss | Note 2.3 (f), Notes 8, 9, 10 and 32 | |
Goodwill impairment | Note 2.3 (g) and Note 14 | |
Deferred income tax and social contribution | Note 2.3 (h) and Note 24 | |
Defined benefit pension plan | Note 2.3 (i) and Note 26 | |
Provisions, contingencies and legal obligations | Note 2.3 (j) and Note 29 | |
Technical provisions for insurance and private pension | Note 2.3 (k) and Note 27 |
a) |
Consolidation |
b) |
Fair value of financial instruments not traded in active markets, including derivatives |
c) |
Effective interest rate |
d) |
Modification of financial assets |
e) |
Transfer and write-off of financial assets |
f) |
Expected credit loss |
• | Term to maturity: |
• | Prospective information: |
• | Macroeconomic scenarios: |
• | Probability-weighted loss scenarios: |
• | Determining criteria for significant increase or decrease in credit risk: non-activation of credit deterioration triggers for at least 6 months. |
g) |
Goodwill impairment |
h) |
Deferred income tax and social contribution |
i) |
Defined benefit pension plan |
j) |
Provisions, contingencies and legal obligations |
k) |
Technical provisions for insurance and private pension |
2.4. |
Summary of main accounting practices |
a) |
Consolidation |
l. |
Subsidiaries |
Functional currency (1) |
Incorporation country |
Activity |
Interest in voting capital % |
Interest in total capital % |
||||||||||||||||||||||||
12/31/2021 |
12/31/2020 |
12/31/2021 |
12/31/2020 |
|||||||||||||||||||||||||
In Brazil |
||||||||||||||||||||||||||||
Banco Itaú BBA S.A. |
Real | % | % | % | ||||||||||||||||||||||||
Banco Itaú Consignado S.A. |
Real | % | % | % | ||||||||||||||||||||||||
Banco Itaucard S.A. |
Real | % | % | % | ||||||||||||||||||||||||
Banco Itauleasing S.A. |
Real | % | % | % | ||||||||||||||||||||||||
Cia. Itaú de Capitalização |
Real | % | % | % | ||||||||||||||||||||||||
Dibens Leasing S.A. - Arrendamento Mercantil |
Real | % | % | % | ||||||||||||||||||||||||
Financeira Itaú CBD S.A. Crédito, Financiamento e Investimento |
Real | credit |
|
% | % | % | ||||||||||||||||||||||
Hipercard Banco Múltiplo S.A. |
Real | % | % | % | ||||||||||||||||||||||||
Itauseg Seguradora S.A. |
Real | % | % | % | ||||||||||||||||||||||||
Itaú Corretora de Valores S.A. |
Real | % | % | % | ||||||||||||||||||||||||
Itaú Seguros S.A. |
Real | % | % | % | ||||||||||||||||||||||||
Itaú Unibanco S.A. |
Real | % | % | % | ||||||||||||||||||||||||
Itaú Vida e Previdência S.A. |
Real | % | % | % | ||||||||||||||||||||||||
Luizacred S.A. Sociedade de Crédito, Financiamento e Investimento |
Real | credit |
|
% | % | % | ||||||||||||||||||||||
Redecard Instituição de Pagamento S.A. (2) |
Real | % | % | % | ||||||||||||||||||||||||
Foreign |
||||||||||||||||||||||||||||
Itaú CorpBanca Colombia S.A. |
% | % | % | |||||||||||||||||||||||||
Banco Itaú (Suisse) S.A. |
% | % | % | |||||||||||||||||||||||||
Banco Itaú Argentina S.A. |
% | % | % | |||||||||||||||||||||||||
Banco Itaú Paraguay S.A. |
% | % | % | |||||||||||||||||||||||||
Banco Itaú Uruguay S.A. |
% | % | % | |||||||||||||||||||||||||
Itau Bank, Ltd. |
% | % | % | |||||||||||||||||||||||||
Itau BBA International plc |
% | % | % | |||||||||||||||||||||||||
Itau BBA USA Securities Inc. |
% | % | % | |||||||||||||||||||||||||
Itaú CorpBanca (3) |
% | % | % |
(1) |
All overseas offices of ITAÚ UNIBANCO HOLDING have the same functional currency as the parent company, except for CorpBanca New York Branch, which uses the US dollar. |
(2) |
New company name of Redecard S.A. |
(3) |
ITAÚ UNIBANCO HOLDING controls ITAÚ CORPBANCA due to the shareholders’ agreement. |
II. |
Business combinations |
III. |
Goodwill |
IV. |
Capital Transactions with non-controlling stockholders |
b) |
Foreign currency translation |
I. |
Functional and presentation currency |
II. |
Foreign currency operations |
c) |
Cash and cash equivalents |
d) |
Financial assets and liabilities |
• | the contractual rights to the cash flows of the financial asset expire, or |
• | ITAÚ UNIBANCO HOLDING transfers the financial asset and this transfer qualifies for derecognition. |
• | Amortized cost: used when financial assets are managed to obtain contractual cash flows, consisting solely of payments of principal and interest; |
• | Fair value through other comprehensive income: used when financial assets are held both for obtaining contractual cash flows, consisting solely of payments of principal and interest, and for sale; |
• | Fair value through profit or loss: used for financial assets that do not meet the aforementioned criteria. |
• | The business model under which they are managed; |
• | The characteristics of their cash flows (Solely Payment of Principal and Interest Test – SPPI Test). |
• | In stockholders’ equity for financial assets and liabilities measured at fair value through other comprehensive income; and |
• | In the Consolidated Statement of Income, under the heading Income of Financial Assets and Liabilities at Fair Value through Profit or Loss, for the other financial assets and liabilities. |
• | Financial assets: |
• | Loan commitments: |
• | Financial guarantees: |
• | Stage 1 – 12-month expected credit loss: represents default events possible within 12 months. Applicable to financial assets which are not credit impaired when purchased or originated; |
• | Stage 2 – Lifetime expected credit loss of financial instrument: considers all possible default events. Applicable to financial assets originated which are not credit impaired when originated or purchased but for which credit risk has increased significantly; and |
• | Stage 3 – Credit loss expected for credit-impaired assets: considers all possible default events. Applicable to financial assets which are credit impaired when purchased or originated. The measurement of assets classified in this stage is different from Stage 2 due to the recognition of interest income by applying the effective interest rate to amortized cost (net of provision) rather than to the gross carrying amount. |
• | Financial liabilities at fair value through profit or loss: |
• | Loan commitments and financial guarantees: |
a) | The gain or loss arising from the remeasurement of the hedging instrument at fair value is recognized in income; and |
b) | The gain or loss arising from the hedged item, attributable to the effective portion of the hedged risk, is applied to the book value of the hedged item and is also recognized in income. |
a) | The effective portion of gains or losses on derivatives is recognized directly in Other comprehensive income – Cash flow hedge; |
b) | The portion of gain or loss on derivatives that represents the ineffective portion or on hedge components excluded from the assessment of effectiveness is recognized in income. |
a) | The portion of gain or loss on the hedging instrument determined as effective is recognized in Other comprehensive income; |
b) | The ineffective portion is recognized in income. |
e) |
Investments in associates and joint ventures |
f) |
Lease operations (Lessee) |
g) |
Fixed assets |
h) |
Intangible assets |
i) |
Assets held for sale |
j) |
Income tax and social contribution |
k) |
Insurance contracts and private pensions |
l) |
Post-employments benefits |
m) |
Share-based payments |
n) |
Provisions, contingent assets and contingent liabilities |
• | Probable: |
• | Possible: |
• | Remote: |
o) |
Capital |
p) |
Treasury shares |
q) |
Dividends and interest on capital |
r) |
Earnings per share |
s) |
Segment information |
t) |
Commissions and Banking Fees |
• | Credit and debit cards |
• | Current account services |
• | Economic, Financial and Brokerage Advisory |
• | Funds management - |
• | Credit operations and financial guarantees provided - |
• | Collection services - |
12/31/2021 |
12/31/2020 |
|||||||||||||||||||||||
Current |
Non-current |
Total |
Current |
Non-current |
Total |
|||||||||||||||||||
Securities purchased under agreements to resell (1) |
||||||||||||||||||||||||
Collateral held |
||||||||||||||||||||||||
Collateral repledge |
— |
— |
||||||||||||||||||||||
Assets received as collateral with right to sell or repledge |
— | — | ||||||||||||||||||||||
Assets received as collateral without right to sell or repledge |
— | — | ||||||||||||||||||||||
Collateral sold |
— | — | ||||||||||||||||||||||
Interbank deposits |
||||||||||||||||||||||||
Voluntary investments with the Central Bank of Brazil |
— | — | — | — | ||||||||||||||||||||
|
|
|
|
|
|
|
|
|
|
|
|
|||||||||||||
Total (2) |
||||||||||||||||||||||||
|
|
|
|
|
|
|
|
|
|
|
|
(1) |
The amounts of R$ |
(2) |
Includes losses in the amounts of R$ ( |
12/31/2021 |
12/31/2020 |
|||||||||||||||||||||||
Cost |
Adjustments to Fair Value (in Income) |
Fair value |
Cost |
Adjustments to Fair Value (in Income) (2) |
Fair value |
|||||||||||||||||||
Investment funds |
( |
) |
||||||||||||||||||||||
Brazilian government securities (1a) |
( |
) |
||||||||||||||||||||||
Government securities – abroad (1b) |
( |
) |
||||||||||||||||||||||
Argentina |
||||||||||||||||||||||||
Chile |
( |
) | ||||||||||||||||||||||
Colombia |
( |
) | ||||||||||||||||||||||
United States |
( |
) | ( |
) | ||||||||||||||||||||
Mexico |
— | — | ||||||||||||||||||||||
Paraguay |
— | — | ||||||||||||||||||||||
Peru |
— | |||||||||||||||||||||||
Uruguay |
— | |||||||||||||||||||||||
Italy |
— | — | ( |
) | ||||||||||||||||||||
Corporate securities (1c) |
( |
) |
( |
) |
||||||||||||||||||||
Shares |
( |
) | ( |
) | ||||||||||||||||||||
Rural product note |
( |
) | ||||||||||||||||||||||
Bank deposit certificates |
— | — | ||||||||||||||||||||||
Real estate receivables certificates |
( |
) | ( |
) | ||||||||||||||||||||
Debentures |
( |
) | ( |
) | ||||||||||||||||||||
Eurobonds and other |
( |
) | ||||||||||||||||||||||
Financial bills |
( |
) | ( |
) | ||||||||||||||||||||
Promissory and commercial notes |
||||||||||||||||||||||||
Other |
( |
) | ( |
) | ||||||||||||||||||||
|
|
|
|
|
|
|
|
|
|
|
|
|||||||||||||
Total |
( |
) |
( |
) |
||||||||||||||||||||
|
|
|
|
|
|
|
|
|
|
|
|
(1) |
Financial assets at fair value through profit or loss – Securities pledged as Guarantee of Funding of Financial Institutions and Customers were: a) R$ |
(2) |
In the period, the result of Adjustment to Fair Value of Financial Assets (particularly private securities) had their amounts affected by oscillations of rates and other market variables arising from the impact of the COVID-19 pandemic on the macroeconomic scenario in the period (Note 33a). |
12/31/2021 |
12/31/2020 |
|||||||||||||||
Cost |
Fair value |
Cost |
Fair value |
|||||||||||||
Current |
||||||||||||||||
Non-stated maturity |
||||||||||||||||
Up to one year |
||||||||||||||||
Non-current |
||||||||||||||||
From one to five years |
||||||||||||||||
From five to ten years |
||||||||||||||||
After ten years |
||||||||||||||||
|
|
|
|
|
|
|
|
|||||||||
Total |
||||||||||||||||
|
|
|
|
|
|
|
|
12/31/2021 |
||||||||||||
Cost |
Adjustments to Fair Value (in Income) |
Fair value |
||||||||||
Brazilian external debt bonds |
( |
) | ||||||||||
|
|
|
|
|
|
|||||||
Total |
( |
) |
||||||||||
|
|
|
|
|
|
12/31/2020 |
||||||||||||
Cost |
Adjustments to Fair Value (in Income) |
Fair value |
||||||||||
Brazilian external debt bonds |
|
|||||||||||
|
|
|
|
|
|
|||||||
Total |
||||||||||||
|
|
|
|
|
|
12/31/2021 |
12/31/2020 |
|||||||||||||||
Cost |
Fair value |
Cost |
Fair value |
|||||||||||||
Current |
||||||||||||||||
Up to one year |
||||||||||||||||
Non-current |
||||||||||||||||
From one to five years |
||||||||||||||||
|
|
|
|
|
|
|
|
|||||||||
Total |
||||||||||||||||
|
|
|
|
|
|
|
|
12/31/2021 |
||||||||||||||||||||||||||||||||
Fair value (*) |
% |
0-30 |
31-90 |
91-180 |
181-365 |
366-720 |
Over 720 days |
|||||||||||||||||||||||||
Assets |
||||||||||||||||||||||||||||||||
Swaps – adjustment receivable |
|
|
|
|
||||||||||||||||||||||||||||
Option agreements |
|
|
|
|||||||||||||||||||||||||||||
Forwards |
— | |||||||||||||||||||||||||||||||
Credit derivatives |
— | — | ||||||||||||||||||||||||||||||
NDF - Non Deliverable Forward |
||||||||||||||||||||||||||||||||
Other Derivative Financial Instruments |
||||||||||||||||||||||||||||||||
|
|
|
|
|
|
|
|
|
|
|
|
|
|
|
|
|||||||||||||||||
Total |
||||||||||||||||||||||||||||||||
% per maturity date |
||||||||||||||||||||||||||||||||
|
|
|
|
|
|
|
|
|
|
|
|
|
|
|
|
12/31/2021 |
||||||||||||||||||||||||||||||||
Fair value (*) |
% |
0-30 |
31-90 |
91-180 |
181-365 |
366-720 |
Over 720 days |
|||||||||||||||||||||||||
Liabilities |
||||||||||||||||||||||||||||||||
Swaps – adjustment payable |
( |
) | ( |
) | ( |
) | ( |
) | ( |
) | ( |
) | ( |
) | ||||||||||||||||||
Option agreements |
( |
) | ( |
) | ( |
) | ( |
) | ( |
) | ( |
) | ( |
) | ||||||||||||||||||
Forwards |
( |
) | ( |
) | — | — | — | |||||||||||||||||||||||||
Credit derivatives |
( |
) | — | — | (1 | ) | ( |
) | ( |
) | ( |
) | ||||||||||||||||||||
NDF - Non Deliverable Forward |
( |
) | ( |
) | ( |
) | ( |
) | ( |
) | ( |
) | ( |
) | ||||||||||||||||||
Other Derivative Financial Instruments |
( |
) | ( |
) | ( |
) | ( |
) | ( |
) | ( |
) | ( |
) | ||||||||||||||||||
|
|
|
|
|
|
|
|
|
|
|
|
|
|
|
|
|||||||||||||||||
Total |
( |
) |
( |
) |
( |
) |
( |
) |
( |
) |
( |
) |
( |
) | ||||||||||||||||||
% per maturity date |
|
|||||||||||||||||||||||||||||||
|
|
|
|
|
|
|
|
|
|
|
|
|
|
|
|
(*) |
Comprises R$ ( |
12/31/2020 |
||||||||||||||||||||||||||||||||
Fair value (*) |
% |
0-30 |
31-90 |
91-180 |
181-365 |
366-720 |
Over 720 days |
|||||||||||||||||||||||||
Assets |
||||||||||||||||||||||||||||||||
Swaps – adjustment receivable |
|
|
|
|||||||||||||||||||||||||||||
Option agreements |
||||||||||||||||||||||||||||||||
Forwards |
— | |||||||||||||||||||||||||||||||
Credit derivatives |
— | — | ||||||||||||||||||||||||||||||
NDF - Non Deliverable Forward |
|
|
|
|||||||||||||||||||||||||||||
Other Derivative Financial Instruments |
||||||||||||||||||||||||||||||||
|
|
|
|
|
|
|
|
|
|
|
|
|
|
|
|
|||||||||||||||||
Total |
||||||||||||||||||||||||||||||||
% per maturity date |
||||||||||||||||||||||||||||||||
|
|
|
|
|
|
|
|
|
|
|
|
|
|
|
|
12/31/2020 |
||||||||||||||||||||||||||||||||
Fair value (*) |
% |
0-30 |
31-90 |
91-180 |
181-365 |
366-720 |
Over 720 days |
|||||||||||||||||||||||||
Liabilities |
||||||||||||||||||||||||||||||||
Swaps – adjustment payable |
( |
) | ( |
) | ( |
) | ( |
) | ( |
) | ( |
) | ( |
) | ||||||||||||||||||
Option agreements |
( |
) | ( |
) | ( |
) | ( |
) | ( |
) | ( |
) | ( |
) | ||||||||||||||||||
Forwards |
( |
) | ( |
) | — | ( |
) | ( |
) | — | — | |||||||||||||||||||||
Credit derivatives |
( |
) | — | — | — | ( |
) | ( |
) | ( |
) | |||||||||||||||||||||
NDF - Non Deliverable Forward |
( |
) | ( |
) | ( |
) | ( |
) | ( |
) | ( |
) | ( |
) | ||||||||||||||||||
Other Derivative Financial Instruments |
( |
) | — | ( |
) | ( |
) | ( |
) | ( |
) | ( |
) | |||||||||||||||||||
|
|
|
|
|
|
|
|
|
|
|
|
|
|
|
|
|||||||||||||||||
Total |
( |
) |
( |
) |
( |
) |
( |
) |
( |
) |
( |
) |
( |
) | ||||||||||||||||||
% per maturity date |
||||||||||||||||||||||||||||||||
|
|
|
|
|
|
|
|
|
|
|
|
|
|
|
|
(*) |
In the period, the result of Derivative had its amounts affected by oscillations of rates and other market variables arising from the impact of the COVID-19 pandemic on the macroeconomic scenario in the period (Note 33a). |
Off-balance sheet notional amount |
Balance sheet account receivable / (received) (payable) / paid |
Adjustment to fair value (in income / stockholders’ equity) |
Fair value |
|||||||||||||
12/31/2021 |
12/31/2021 |
12/31/2021 |
12/31/2021 |
|||||||||||||
Future contracts |
— |
— |
— |
|||||||||||||
Purchase commitments |
— |
— |
— |
|||||||||||||
Shares |
— | — | — | |||||||||||||
Commodities |
— | — | — | |||||||||||||
Interest |
— | — | — | |||||||||||||
Foreign currency |
— | — | — | |||||||||||||
Commitments to sell |
— |
— |
— |
|||||||||||||
Shares |
— | — | — | |||||||||||||
Commodities |
— | — | — | |||||||||||||
Interest |
— | — | — | |||||||||||||
Foreign currency |
— | — | — | |||||||||||||
Swap contracts |
( |
) |
||||||||||||||
Asset position |
||||||||||||||||
Commodities |
— | — | — | |||||||||||||
Interest |
||||||||||||||||
Foreign currency |
||||||||||||||||
Liability position |
( |
) |
( |
) |
( |
) | ||||||||||
Shares |
( |
) | ( |
) | ( |
) | ||||||||||
Commodities |
— | ( |
) | ( |
) | |||||||||||
Interest |
( |
) | ( |
) | ( |
) | ||||||||||
Foreign currency |
( |
) | ( |
) | ||||||||||||
Option contracts |
( |
) |
( |
) | ||||||||||||
Purchase commitments – long position |
||||||||||||||||
Shares |
||||||||||||||||
Commodities |
||||||||||||||||
Interest |
||||||||||||||||
Foreign currency |
||||||||||||||||
Commitments to sell – long position |
( |
) |
||||||||||||||
Shares |
||||||||||||||||
Commodities |
( |
) | ||||||||||||||
Interest |
( |
) | ||||||||||||||
Foreign currency |
( |
) | ||||||||||||||
Purchase commitments – short position |
( |
) |
( |
) |
( |
) | ||||||||||
Shares |
( |
) | ( |
) | ( |
) | ||||||||||
Commodities |
( |
) | ( |
) | ( |
) | ||||||||||
Interest |
( |
) | ( |
) | ( |
) | ||||||||||
Foreign currency |
( |
) | ( |
) | ( |
) | ||||||||||
Commitments to sell – short position |
( |
) |
( |
) | ||||||||||||
Shares |
( |
) | ( |
) | ( |
) | ||||||||||
Commodities |
( |
) | ( |
) | ||||||||||||
Interest |
( |
) | ( |
) | ||||||||||||
Foreign currency |
( |
) | ( |
) | ||||||||||||
Forward operations |
( |
) |
||||||||||||||
Purchases receivable |
( |
) |
||||||||||||||
Shares |
( |
) | ||||||||||||||
Interest |
— | |||||||||||||||
Purchases payable obligations |
( |
) |
— |
( |
) | |||||||||||
Interest |
( |
) | — | ( |
) | |||||||||||
Sales receivable |
||||||||||||||||
Shares |
( |
) | ||||||||||||||
Interest |
— | |||||||||||||||
Foreign currency |
— | |||||||||||||||
Sales deliverable obligations |
( |
) |
— |
( |
) | |||||||||||
Interest |
( |
) | — | ( |
) | |||||||||||
Foreign currency |
— | — | ||||||||||||||
Credit derivatives |
( |
) |
||||||||||||||
Asset position |
( |
) |
||||||||||||||
Shares |
( |
) | ||||||||||||||
Commodities |
— | — | — | |||||||||||||
Interest |
( |
) | ||||||||||||||
Liability position |
( |
) |
( |
) | ||||||||||||
Shares |
( |
) | ( |
) | ||||||||||||
Interest |
( |
) | ( |
) | ||||||||||||
NDF – Non Deliverable Forward |
||||||||||||||||
Asset position |
||||||||||||||||
Shares |
— | — | — | |||||||||||||
Commodities |
( |
) | ||||||||||||||
Foreign currency |
||||||||||||||||
Liability position |
( |
) |
( |
) | ||||||||||||
Commodities |
( |
) | ( |
) | ||||||||||||
Foreign currency |
( |
) | ( |
) | ||||||||||||
Other derivative financial instruments |
||||||||||||||||
Asset position |
||||||||||||||||
Shares |
— | |||||||||||||||
Interest |
||||||||||||||||
Foreign currency |
||||||||||||||||
Liability position |
( |
) |
( |
) |
( |
) | ||||||||||
Shares |
( |
) | ( |
) | ( |
) | ||||||||||
Interest |
( |
) | ( |
) | ( |
) | ||||||||||
Foreign currency |
— | ( |
) | ( |
) | |||||||||||
Asset |
||||||||||||||||
Liability |
( |
) |
( |
) |
( |
) | ||||||||||
Total |
Off-balance sheet – notional amount (*) |
0 - 30 |
31 - 180 |
181 - 365 |
Over 365 days |
12/31/2021 |
|||||||||||||||
Future contracts |
||||||||||||||||||||
Swap contracts |
||||||||||||||||||||
Option contracts |
||||||||||||||||||||
Forwards |
||||||||||||||||||||
Credit derivatives |
— | |||||||||||||||||||
NDF - Non Deliverable Forward |
||||||||||||||||||||
Other derivative financial instruments |
(*) | Comprises R$ |
Off-balance sheet notional amount |
Balance sheet account receivable / (received) (payable) / paid |
Adjustment to fair value (in income / stockholders’ equity) |
Fair value |
|||||||||||||
12/31/2020 |
12/31/2020 |
12/31/2020 |
12/31/2020 |
|||||||||||||
Future contracts |
— |
— |
— |
|||||||||||||
Purchase commitments |
— |
— |
— |
|||||||||||||
Shares |
— | — | — | |||||||||||||
Commodities |
— | — | — | |||||||||||||
Interest |
— | — | — | |||||||||||||
Foreign currency |
— | — | — | |||||||||||||
Commitments to sell |
— |
— |
— |
|||||||||||||
Shares |
— | — | — | |||||||||||||
Commodities |
— | — | — | |||||||||||||
Interest |
— | — | — | |||||||||||||
Foreign currency |
— | — | — | |||||||||||||
Swap contracts |
( |
) |
( |
) | ||||||||||||
Asset position |
||||||||||||||||
Commodities |
— | |||||||||||||||
Interest |
||||||||||||||||
Foreign currency |
||||||||||||||||
Liability position |
( |
) |
( |
) |
( |
) | ||||||||||
Shares |
( |
) | ( |
) | ||||||||||||
Commodities |
( |
) | — | ( |
) | |||||||||||
Interest |
( |
) | ( |
) | ( |
) | ||||||||||
Foreign currency |
( |
) | ( |
) | ( |
) | ||||||||||
Option contracts |
||||||||||||||||
Purchase commitments – long position |
||||||||||||||||
Shares |
||||||||||||||||
Commodities |
||||||||||||||||
Interest |
( |
) | ||||||||||||||
Foreign currency |
||||||||||||||||
Commitments to sell – long position |
||||||||||||||||
Shares |
||||||||||||||||
Commodities |
( |
) | ||||||||||||||
Interest |
||||||||||||||||
Foreign currency |
( |
) | ||||||||||||||
Purchase commitments – short position |
( |
) |
( |
) |
( |
) | ||||||||||
Shares |
( |
) | ( |
) | ( |
) | ||||||||||
Commodities |
( |
) | ( |
) | ( |
) | ||||||||||
Interest |
( |
) | ( |
) | ||||||||||||
Foreign currency |
( |
) | ( |
) | ( |
) | ||||||||||
Commitments to sell – short position |
( |
) |
( |
) |
( |
) | ||||||||||
Shares |
( |
) | ( |
) | ( |
) | ||||||||||
Commodities |
( |
) | ( |
) | ||||||||||||
Interest |
( |
) | ( |
) | ( |
) | ||||||||||
Foreign currency |
( |
) | ( |
) | ||||||||||||
Forward operations |
( |
) |
||||||||||||||
Purchases receivable |
( |
) |
||||||||||||||
Shares |
( |
) | ||||||||||||||
Interest |
— | |||||||||||||||
Foreign currency |
— | — | — | |||||||||||||
Purchases payable obligations |
— |
( |
) |
— |
( |
) | ||||||||||
Interest |
— | ( |
) | — | ( |
) | ||||||||||
Sales receivable |
||||||||||||||||
Shares |
||||||||||||||||
Interest |
— | — | ||||||||||||||
Foreign currency |
— | — | — | |||||||||||||
Sales deliverable obligations |
( |
) |
( |
) |
( |
) | ||||||||||
Interest |
( |
) | — | ( |
) | |||||||||||
Foreign currency |
— | ( |
) | ( |
) | |||||||||||
Credit derivatives |
( |
) |
||||||||||||||
Asset position |
( |
) |
||||||||||||||
Shares |
( |
) | ||||||||||||||
Commodities |
— | |||||||||||||||
Interest |
( |
) | ||||||||||||||
Liability position |
( |
) |
( |
) | ||||||||||||
Shares |
( |
) | ( |
) | ||||||||||||
Commodities |
— | — | — | |||||||||||||
Interest |
( |
) | ( |
) | ||||||||||||
NDF – Non Deliverable Forward |
( |
) |
||||||||||||||
Asset position |
||||||||||||||||
Commodities |
( |
) | ||||||||||||||
Foreign currency |
||||||||||||||||
Liability position |
( |
) |
( |
) |
( |
) | ||||||||||
Commodities |
( |
) | ( |
) | ( |
) | ||||||||||
Foreign currency |
( |
) | ( |
) | ( |
) | ||||||||||
Other derivative financial instruments |
||||||||||||||||
Asset position |
||||||||||||||||
Shares |
( |
) | — | |||||||||||||
Interest |
( |
) | ||||||||||||||
Foreign currency |
— | |||||||||||||||
Liability position |
( |
) |
( |
) |
( |
) | ||||||||||
Shares |
( |
) | ( |
) | ( |
) | ||||||||||
Interest |
( |
) | ( |
) | ( |
) | ||||||||||
Asset |
||||||||||||||||
Liability |
( |
) |
( |
) |
( |
) | ||||||||||
Total |
( |
) |
( |
) |
Off-balance sheet – notional amount |
0 - 30 |
31 - 180 |
181 - 365 |
Over 365 days |
12/31/2020 |
|||||||||||||||
Future contracts |
||||||||||||||||||||
Swap contracts |
||||||||||||||||||||
Option contracts |
||||||||||||||||||||
Forwards |
||||||||||||||||||||
Credit derivatives |
— | |||||||||||||||||||
NDF - Non Deliverable Forward |
||||||||||||||||||||
Other derivative financial instruments |
12/31/2021 |
||||||||||||||||||||||||||||
Future contracts |
Swap contracts |
Option contracts |
Forwards |
Credit derivatives |
NDF - Non Deliverable Forward |
Other derivative financial instruments |
||||||||||||||||||||||
Stock exchange |
— |
|||||||||||||||||||||||||||
Over-the-counter |
— | |||||||||||||||||||||||||||
Financial institutions |
— | |||||||||||||||||||||||||||
Companies |
— | — | — | |||||||||||||||||||||||||
Individuals |
— | — | — | |||||||||||||||||||||||||
|
|
|
|
|
|
|
|
|
|
|
|
|
|
|||||||||||||||
Total |
||||||||||||||||||||||||||||
|
|
|
|
|
|
|
|
|
|
|
|
|
|
12/31/2020 |
||||||||||||||||||||||||||||
Future contracts |
Swap contracts |
Option contracts |
Forwards |
Credit derivatives |
NDF - Non Deliverable Forward |
Other derivative financial instruments |
||||||||||||||||||||||
Stock exchange |
— |
|||||||||||||||||||||||||||
Over-the-counter |
— |
|||||||||||||||||||||||||||
Financial institutions |
— | |||||||||||||||||||||||||||
Companies |
— | — | — | |||||||||||||||||||||||||
Individuals |
— | — | — | — | ||||||||||||||||||||||||
|
|
|
|
|
|
|
|
|
|
|
|
|
|
|||||||||||||||
Total |
||||||||||||||||||||||||||||
|
|
|
|
|
|
|
|
|
|
|
|
|
|
12/31/2021 |
||||||||||||||||||||
Maximum potential of future payments, gross |
Up to 1 year |
From 1 to 3 years |
From 3 to 5 years |
Over 5 years |
||||||||||||||||
By instrument |
||||||||||||||||||||
CDS |
||||||||||||||||||||
TRS |
— | — | — | |||||||||||||||||
|
|
|
|
|
|
|
|
|
|
|||||||||||
Total by instrument |
||||||||||||||||||||
|
|
|
|
|
|
|
|
|
|
|||||||||||
By risk rating |
||||||||||||||||||||
Investment grade |
— | |||||||||||||||||||
Below investment grade |
||||||||||||||||||||
|
|
|
|
|
|
|
|
|
|
|||||||||||
Total by risk |
||||||||||||||||||||
|
|
|
|
|
|
|
|
|
|
|||||||||||
By reference entity |
||||||||||||||||||||
Brazilian government |
— | |||||||||||||||||||
Governments – abroad |
— | |||||||||||||||||||
Private entities |
||||||||||||||||||||
|
|
|
|
|
|
|
|
|
|
|||||||||||
Total by entity |
||||||||||||||||||||
|
|
|
|
|
|
|
|
|
|
12/31/2020 |
||||||||||||||||||||
Maximum potential of future payments, gross |
Up to 1 year |
From 1 to 3 years |
From 3 to 5 years |
Over 5 years |
||||||||||||||||
By instrument |
||||||||||||||||||||
CDS |
||||||||||||||||||||
TRS |
— | — | — | |||||||||||||||||
|
|
|
|
|
|
|
|
|
|
|||||||||||
Total by instrument |
||||||||||||||||||||
|
|
|
|
|
|
|
|
|
|
|||||||||||
By risk rating |
||||||||||||||||||||
Investment grade |
— | |||||||||||||||||||
Below investment grade |
||||||||||||||||||||
|
|
|
|
|
|
|
|
|
|
|||||||||||
Total by risk |
||||||||||||||||||||
|
|
|
|
|
|
|
|
|
|
|||||||||||
By reference entity |
||||||||||||||||||||
Brazilian government |
— | |||||||||||||||||||
Governments – abroad |
— | |||||||||||||||||||
Private entities |
||||||||||||||||||||
|
|
|
|
|
|
|
|
|
|
|||||||||||
Total by entity |
||||||||||||||||||||
|
|
|
|
|
|
|
|
|
|
12/31/2021 |
||||||||||||
Notional amount of credit protection sold |
Notional amount of credit protection purchased with identical underlying amount |
Net position |
||||||||||
CDS |
( |
) | ( |
) | ||||||||
TRS |
( |
) | — | ( |
) | |||||||
|
|
|
|
|
|
|||||||
Total |
( |
) |
( |
) | ||||||||
|
|
|
|
|
|
12/31/2020 |
||||||||||||
Notional amount of credit protection sold |
Notional amount of credit protection purchased with identical underlying amount |
Net position |
||||||||||
CDS |
( |
) | ( |
) | ||||||||
TRS |
( |
) | — | ( |
) | |||||||
|
|
|
|
|
|
|||||||
Total |
( |
) |
( |
) | ||||||||
|
|
|
|
|
|
12/31/2021 |
||||||||||||||||||||||||
Gross amount of recognized financial assets (1) |
Gross amount offset in the Balance Sheet |
Net amount of financial assets presented in the Balance Sheet |
Related amounts not offset in the Balance Sheet (2) |
|||||||||||||||||||||
Financial instruments (3) |
Cash collateral received |
Total |
||||||||||||||||||||||
Securities purchased under agreements to resell |
— | ( |
) | — | ||||||||||||||||||||
Derivatives financial instruments |
— | ( |
) | ( |
) |
12/31/2020 |
||||||||||||||||||||||||
Gross amount of recognized financial assets (1) |
Gross amount offset in the Balance Sheet |
Net amount of financial assets presented in the Balance Sheet |
Related amounts not offset in the Balance Sheet (2) |
|||||||||||||||||||||
Financial instruments (3) |
Cash collateral received |
Total |
||||||||||||||||||||||
Securities purchased under agreements to resell |
— | ( |
) | — | ||||||||||||||||||||
Derivatives financial instruments |
— | ( |
) | — |
12/31/2021 |
||||||||||||||||||||||||
Gross amount of recognized financial liabilities (1) |
Gross amount offset in the Balance Sheet |
Net amount of financial liabilities presented in the Balance Sheet |
Related amounts not offset in the Balance Sheet (2) |
|||||||||||||||||||||
Financial instruments (3) |
Cash collateral pledged |
Total |
||||||||||||||||||||||
Securities sold under repurchase agreements |
|
— | ( |
) | — | |||||||||||||||||||
Derivatives financial instruments |
— | ( |
) |
12/31/2020 |
||||||||||||||||||||||||
Gross amount of recognized financial liabilities (1) |
Gross amount offset in the Balance Sheet |
Net amount of financial liabilities presented in the Balance Sheet |
Related amounts not offset in the Balance Sheet (2) |
|||||||||||||||||||||
Financial instruments (3) |
Cash collateral pledged |
Total |
||||||||||||||||||||||
Securities sold under repurchase agreements |
— | ( |
) | — | ||||||||||||||||||||
Derivatives financial instruments |
— | ( |
) | ( |
) |
(1) |
Includes amounts of master offset agreements and other such agreements, both enforceable and unenforceable. |
(2) |
Limited to amounts subject to enforceable master offset agreements and other such agreements. |
(3) |
Includes amounts subject to enforceable master offset agreements and other such agreements, and guarantees in financial instruments. |
• | Interest Rate: Risk of loss in transactions subject to interest rate variations; |
• | Currency: Risk of loss in transactions subject to foreign exchange variation. |
• | Hedge of time deposits and repurchase agreements: to hedge fluctuations in cash flows of interest payments resulting from changes in the DI interest rate, through futures contracts; |
• | Hedge of asset transactions: to hedge fluctuations in cash flows of interest receipts resulting from changes in the DI rate, through futures contracts; |
• | Hedge of assets denominated in UF*: to hedge fluctuations in cash flows of interest receipts resulting from changes in the UF*, through swap contracts; |
• | Hedge of Funding: to hedge fluctuations in cash flows of interest payments resulting from changes in the TPM* rate, through swap contracts; |
• | Hedge of loan operations: to hedge fluctuations in cash flows of interest receipts resulting from changes in the TPM* rate , |
• | Hedge of repurchase agreements: to hedge fluctuations in cash flows of interest received from changes in Selic (benchmark interest rate), through futures contracts; |
• | Hedging of expected highly probable transactions: to hedge the risk of variation in the amount of the commitments assumed when resulting from variation in the exchange rates. |
*UF | – Chilean unit of account / TPM – Monetary policy rate |
12/31/2021 |
||||||||||||||||||||||||||
Hedged item |
Hedge instrument |
|||||||||||||||||||||||||
Book Value |
Variation in value recognized in Other |
Cash flow hedge |
Notional |
Variation in fair value used to calculate hedge |
||||||||||||||||||||||
Strategies |
Heading |
Assets |
Liabilities |
comprehensive income |
reserve |
Amount |
ineffectiveness |
|||||||||||||||||||
Interest rate risk |
||||||||||||||||||||||||||
Hedge of deposits and repurchase agreements |
Securities purchased under agreements to resell | — | ||||||||||||||||||||||||
Hedge of assets transactions |
Loans and lease operations and Securities | — | ( |
) | ( |
) | ( |
) | ||||||||||||||||||
Hedge of asset-backed securities under repurchase agreements |
Securities purchased under agreements to resell | — | ( |
) | ( |
) | ( |
) | ||||||||||||||||||
Hedge of loan operations |
Loans and lease operations | — | ||||||||||||||||||||||||
Hedge of funding |
Deposits | — | ||||||||||||||||||||||||
Hedge of assets denominated in UF |
Securities | — | ( |
) | ( |
) | ( |
) | ||||||||||||||||||
Foreign exchange risk |
||||||||||||||||||||||||||
Hedge of highly probable forecast transactions |
— | |||||||||||||||||||||||||
|
|
|
|
|
|
|
|
|
|
|
|
|||||||||||||||
Total |
( |
) |
( |
) |
( |
) | ||||||||||||||||||||
|
|
|
|
|
|
|
|
|
|
|
|
12/31/2020 |
||||||||||||||||||||||||||
Hedged item |
Hedge instrument |
|||||||||||||||||||||||||
Book Value |
Variation in value recognized in Other |
Cash flow hedge |
Notional |
Variation in fair value used to calculate hedge |
||||||||||||||||||||||
Strategies |
Heading |
Assets |
Liabilities |
comprehensive income |
reserve |
Amount |
ineffectiveness |
|||||||||||||||||||
Interest rate risk |
|
|||||||||||||||||||||||||
Hedge of deposits and repurchase agreements |
Securities purchased under agreements to resell | — | ( |
) | ( |
) | ( |
) | ||||||||||||||||||
Hedge of assets transactions |
Loans and lease operations and Securities | — | ||||||||||||||||||||||||
Hedge of asset-backed securities under repurchase agreements |
Securities purchased under agreements to resell | — | ||||||||||||||||||||||||
Hedge of loan operations |
Loans and lease operations | — | ||||||||||||||||||||||||
Hedge of funding |
Deposits | — | ( |
) | ( |
) | ( |
) | ||||||||||||||||||
Hedge of assets denominated in UF |
Securities | — | ( |
) | ( |
) | ( |
) | ||||||||||||||||||
Foreign exchange risk |
||||||||||||||||||||||||||
Hedge of highly probable forecast transactions |
— | ( |
) | ( |
) | |||||||||||||||||||||
|
|
|
|
|
|
|
|
|
|
|
|
|||||||||||||||
Total |
( |
) |
( |
) |
( |
) | ||||||||||||||||||||
|
|
|
|
|
|
|
|
|
|
|
|
12/31/2021 |
||||||||||||||||||||||||||||
Notional |
Book Value (*) |
Variations in fair value used to calculate hedge |
Variation in value recognized in Other comprehensive |
Hedge ineffectiveness recognized in |
Amount reclassified from Cash flow hedge |
|||||||||||||||||||||||
Hedge Instruments |
amount |
Assets |
Liabilities |
ineffectiveness |
income |
income |
reserve to income |
|||||||||||||||||||||
Interest rate risk |
||||||||||||||||||||||||||||
Futures |
— | ( |
) | ( |
) | ( |
) | ( |
) | |||||||||||||||||||
Swap |
( |
) | ( |
) | ||||||||||||||||||||||||
Foreign exchange risk |
||||||||||||||||||||||||||||
Futures |
— | |||||||||||||||||||||||||||
|
|
|
|
|
|
|
|
|
|
|
|
|
|
|||||||||||||||
Total |
( |
) |
( |
) |
( |
) |
( |
) | ||||||||||||||||||||
|
|
|
|
|
|
|
|
|
|
|
|
|
|
12/31/2020 |
||||||||||||||||||||||||||||
Notional |
Book Value (*) |
Variations in fair value used to calculate hedge |
Variation in value recognized in Other comprehensive |
Hedge ineffectiveness recognized in |
Amount reclassified from Cash flow hedge |
|||||||||||||||||||||||
Hedge Instruments |
amount |
Assets |
Liabilities |
ineffectiveness |
income |
income |
reserve to income |
|||||||||||||||||||||
Interest rate risk |
||||||||||||||||||||||||||||
Futures |
— | ( |
) | ( |
) | ( |
) | ( |
) | |||||||||||||||||||
Swap |
( |
) | ||||||||||||||||||||||||||
Foreign exchange risk |
||||||||||||||||||||||||||||
Futures |
( |
) | ( |
) | — | |||||||||||||||||||||||
|
|
|
|
|
|
|
|
|
|
|
|
|
|
|||||||||||||||
Total |
( |
) |
( |
) |
( |
) | ||||||||||||||||||||||
|
|
|
|
|
|
|
|
|
|
|
|
|
|
(*) |
Amounts recorded under heading Derivatives. |
12/31/2021 |
||||||||||||||||||||||||
Hedged item |
Hedge instrument |
|||||||||||||||||||||||
Book Value (2) |
Variation in value recognized in Other |
Foreign currency |
Notional |
Variation in fair value used to calculate hedge |
||||||||||||||||||||
Strategies |
Assets |
Liabilities |
comprehensive income |
convertion reserve |
amount |
ineffectiveness |
||||||||||||||||||
Foreign exchange risk |
||||||||||||||||||||||||
Hedge of net investment in foreign operations (1) |
( |
) | ( |
) | ( |
) | ||||||||||||||||||
|
|
|
|
|
|
|
|
|
|
|
|
|||||||||||||
Total |
( |
) |
( |
) |
( |
) | ||||||||||||||||||
|
|
|
|
|
|
|
|
|
|
|
|
12/31/2020 |
||||||||||||||||||||||||
Hedged item |
Hedge instrument |
|||||||||||||||||||||||
Book Value (2) |
Variation in value recognized in Other |
Foreign currency |
Notional |
Variation in fair value used to calculate hedge |
||||||||||||||||||||
Strategies |
Assets |
Liabilities |
comprehensive income |
convertion reserve |
amount |
ineffectiveness |
||||||||||||||||||
Foreign exchange risk |
||||||||||||||||||||||||
Hedge of net investment in foreign operations (1) |
( |
) | ( |
) | ( |
) | ||||||||||||||||||
|
|
|
|
|
|
|
|
|
|
|
|
|||||||||||||
Total |
( |
) |
( |
) |
( |
) | ||||||||||||||||||
|
|
|
|
|
|
|
|
|
|
|
|
(1) |
Hedge instruments consider the gross tax position. |
(2) |
Amounts recorded under heading Derivatives. |
12/31/2021 |
||||||||||||||||||||||||||||
Variations in fair value used to calculate hedge ineffectiveness |
Variation in the value recognized in Other comprehensive income |
Hedge ineffectiveness recognized in income |
Amount reclassified from foreign currency convertion reserve into income |
|||||||||||||||||||||||||
Notional amount |
Book Value (*) |
|||||||||||||||||||||||||||
Hedge instruments |
Assets |
Liabilities |
||||||||||||||||||||||||||
Foreign exchange risk |
||||||||||||||||||||||||||||
Futures |
— | ( |
) | ( |
) | ( |
) | — | ||||||||||||||||||||
Futures / NDF - Non Deliverable |
— | ( |
) | ( |
) | — | ||||||||||||||||||||||
Futures / Financial Assets |
( |
) | ( |
) | ( |
) | — | |||||||||||||||||||||
|
|
|
|
|
|
|
|
|
|
|
|
|
|
|||||||||||||||
Total |
( |
) |
( |
) |
— |
|||||||||||||||||||||||
|
|
|
|
|
|
|
|
|
|
|
|
|
|
12/31/2021 |
||||||||||||||||||||||||||||
Variations in fair value used to calculate hedge ineffectiveness |
Variation in the value recognized in Other comprehensive income |
Hedge ineffectiveness recognized in income |
Amount reclassified from foreign currency convertion reserve into income |
|||||||||||||||||||||||||
Notional amount |
Book Value (*) |
|||||||||||||||||||||||||||
Hedge instruments |
Assets |
Liabilities |
||||||||||||||||||||||||||
Foreign exchange risk |
||||||||||||||||||||||||||||
Futures |
— | ( |
) | ( |
) | ( |
) | — | ||||||||||||||||||||
Futures / NDF - Non Deliverable |
— | ( |
) | ( |
) | ( |
) | — | ||||||||||||||||||||
Futures / Financial Assets |
( |
) | ( |
) | — | |||||||||||||||||||||||
|
|
|
|
|
|
|
|
|
|
|
|
|
|
|||||||||||||||
Total |
( |
) |
( |
) |
( |
) |
— |
|||||||||||||||||||||
|
|
|
|
|
|
|
|
|
|
|
|
|
|
(*) |
Amounts recorded under heading Derivatives. |
c) |
Fair value hedge |
• | To protect the risk of variation in the fair value of receipt and payment of interest resulting from variations in the fair value of the variable rates involved, by contracting swaps and futures. |
• | The percentage approach is based on the calculation of change in the fair value of the revised estimate for the hedged position (hedged item) attributable to the protected risk versus the change in the fair value of the derivative hedging instrument. |
• | The dollar offset method is based on the difference between the variation in the fair value of the hedging instrument and the variation in the fair value of the hedged item attributed to changes in the interest rate. |
12/31/2021 |
||||||||||||||||||||||||||||
Hedge Item |
Hedge Instruments (2) |
|||||||||||||||||||||||||||
Variation in fair |
||||||||||||||||||||||||||||
Variation in fair value |
value used to |
|||||||||||||||||||||||||||
Book Value (1) |
Fair value |
recognized in |
Notional |
calculate hedge |
||||||||||||||||||||||||
Strategies |
Assets |
Liabilities |
Assets |
Liabilities |
income |
amount |
ineffectiveness |
|||||||||||||||||||||
Interest rate risk |
||||||||||||||||||||||||||||
Hedge of loan operations |
— | — | ( |
) | ||||||||||||||||||||||||
Hedge of funding |
— | — | ( |
) | ||||||||||||||||||||||||
Hedge of securities at fair value through other comprehensive income |
— | — | ( |
) | ||||||||||||||||||||||||
|
|
|
|
|
|
|
|
|
|
|
|
|
|
|||||||||||||||
Total |
( |
) |
12/31/2020 |
||||||||||||||||||||||||||||
Hedge Item |
Hedge Instruments (2) |
|||||||||||||||||||||||||||
Book Value (1) |
Fair value |
Variation in fair value recognized in income |
Notional amount |
Variation in fair value used to calculate hedge ineffectiveness |
||||||||||||||||||||||||
Strategies |
Assets |
Liabilities |
Assets |
Liabilities |
||||||||||||||||||||||||
Interest rate risk |
||||||||||||||||||||||||||||
Hedge of loan operations |
— | — | ( |
) | ||||||||||||||||||||||||
Hedge of funding |
— | — | ( |
) | ||||||||||||||||||||||||
Hedge of securities at fair value through other comprehensive income |
— | — | ( |
) | ||||||||||||||||||||||||
|
|
|
|
|
|
|
|
|
|
|
|
|
|
|||||||||||||||
Total |
( |
) |
||||||||||||||||||||||||||
|
|
|
|
|
|
|
|
|
|
|
|
|
|
(1) |
Amounts recorded under heading Deposits, Securities, Funds from Interbank Markets and Loan and Lease Operations. |
(2) |
Comprises the amount of R$ |
12/31/2021 |
||||||||||||||||||||
Notional amount |
Book value (1) |
Variation in fair value used to calculate hedge ineffectiveness |
Hedge ineffectiveness recognized in income |
|||||||||||||||||
Hedge Instruments |
Assets |
Liabilities |
||||||||||||||||||
Interest rate risk |
||||||||||||||||||||
Swap |
( |
) | ( |
) | ||||||||||||||||
|
|
|
|
|
|
|
|
|
|
|||||||||||
Total |
( |
) |
( |
) | ||||||||||||||||
|
|
|
|
|
|
|
|
|
|
12/31/2020 |
||||||||||||||||||||
Notional amount |
Book value (1) |
Variation in fair value used to calculate hedge ineffectiveness |
Hedge ineffectiveness recognized in income |
|||||||||||||||||
Hedge Instruments |
Assets |
Liabilities |
||||||||||||||||||
Interest rate risk |
||||||||||||||||||||
Swap |
( |
) | ||||||||||||||||||
|
|
|
|
|
|
|
|
|
|
|||||||||||
Total |
( |
) | ||||||||||||||||||
|
|
|
|
|
|
|
|
|
|
(1) |
Amounts recorded under heading Derivatives. |
12/31/2021 |
12/31/2020 |
|||||||||||||||||||||||
Hedge instruments |
Hedged item |
Hedge instruments |
Hedged item |
|||||||||||||||||||||
Strategies |
Notional amount |
Fair value adjustments |
Book Value |
Notional amount |
Fair value adjustments |
Book Value |
||||||||||||||||||
Hedge of deposits and repurchase agreements |
||||||||||||||||||||||||
Hedge of highly probable forecast transactions |
( |
) | ||||||||||||||||||||||
Hedge of net investment in foreign operations |
||||||||||||||||||||||||
Hedge of loan operations (Fair value) |
( |
) | ( |
) | ||||||||||||||||||||
Hedge of loan operations (Cash flow) |
||||||||||||||||||||||||
Hedge of funding (Fair value) |
( |
) | ||||||||||||||||||||||
Hedge of funding (Cash flow) |
( |
) | ||||||||||||||||||||||
Hedge of assets transactions |
( |
) | ||||||||||||||||||||||
Hedge of asset-backed securities under repurchase agreements |
( |
) | ||||||||||||||||||||||
Hedge of assets denominated in UF |
( |
) | ( |
) | ||||||||||||||||||||
Hedge of securities at fair value through other comprehensive income |
( |
) | ||||||||||||||||||||||
|
|
|
|
|||||||||||||||||||||
Total |
||||||||||||||||||||||||
|
|
|
|
12/31/2021 |
||||||||||||||||||||||||||||||||
0-1 ano |
1-2 anos |
2-3 anos |
3-4 anos |
4-5 anos |
5-10 anos |
Acima de 10 anos |
Total |
|||||||||||||||||||||||||
Hedge of deposits and repurchase agreements |
— | |||||||||||||||||||||||||||||||
Hedge of highly probable forecast transactions |
— | — | — | — | — | — | ||||||||||||||||||||||||||
Hedge of net investment in foreign operations (*) |
— | — | — | — | — | — | ||||||||||||||||||||||||||
Hedge of loan operations (Fair value) |
||||||||||||||||||||||||||||||||
Hedge of loan operations (Cash flow) |
— | — | — | |||||||||||||||||||||||||||||
Hedge of funding (Fair value) |
||||||||||||||||||||||||||||||||
Hedge of funding (Cash flow) |
— | — | — | |||||||||||||||||||||||||||||
Hedge of assets transactions |
— | — | — | — | ||||||||||||||||||||||||||||
Hedge of asset-backed securities under repurchase agreements |
— | |||||||||||||||||||||||||||||||
Hedge of assets denominated in UF |
— | — | — | — | ||||||||||||||||||||||||||||
Hedge of securities at fair value through other comprehensive income |
— | |||||||||||||||||||||||||||||||
|
|
|
|
|
|
|
|
|
|
|
|
|
|
|
|
|||||||||||||||||
Total |
||||||||||||||||||||||||||||||||
|
|
|
|
|
|
|
|
|
|
|
|
|
|
|
|
12/31/2020 |
||||||||||||||||||||||||||||||||
0-1 year |
1-2 years |
2-3 years |
3-4 years |
4-5 years |
5-10 years |
over 10 years |
Total |
|||||||||||||||||||||||||
Hedge of deposits and repurchase agreements |
— | |||||||||||||||||||||||||||||||
Hedge of highly probable forecast transactions |
— | — | — | — | — | — | ||||||||||||||||||||||||||
Hedge of net investment in foreign operations (*) |
— | — | — | — | — | — | ||||||||||||||||||||||||||
Hedge of loan operations (Fair value) |
||||||||||||||||||||||||||||||||
Hedge of loan operations (Cash flow) |
— | — | — | |||||||||||||||||||||||||||||
Hedge of funding (Fair value) |
||||||||||||||||||||||||||||||||
Hedge of funding (Cash flow) |
— | — | — | |||||||||||||||||||||||||||||
Hedge of assets transactions |
— | — | — | — | ||||||||||||||||||||||||||||
Hedge of asset-backed securities under repurchase agreements |
— | — | — | |||||||||||||||||||||||||||||
Hedge of assets denominated in UF |
— | — | — | — | ||||||||||||||||||||||||||||
Hedge of securities at fair value through other comprehensive income |
— | — | ||||||||||||||||||||||||||||||
|
|
|
|
|
|
|
|
|
|
|
|
|
|
|
|
|||||||||||||||||
Total |
||||||||||||||||||||||||||||||||
|
|
|
|
|
|
|
|
|
|
|
|
|
|
|
|
(*) |
Classified as current, since instruments are frequently renewed. |
12/31/2021 |
12/31/2020 |
|||||||||||||||||||||||||||||||
Gross carrying amount |
Fair value adjustments (in stockholders’ equity) |
Expected loss |
Fair value |
Gross carrying amount |
Fair value adjustments (in stockholders’ equity) (2) |
Expected loss |
Fair value |
|||||||||||||||||||||||||
Brazilian government securities (1a) |
( |
) |
— |
— |
||||||||||||||||||||||||||||
Other government securities |
( |
) |
— |
— |
( |
) |
— |
|||||||||||||||||||||||||
Government securities – abroad (1b) |
( |
) |
( |
) |
||||||||||||||||||||||||||||
Argentina |
( |
) | — | — | — | — | — | |||||||||||||||||||||||||
Colombia |
( |
) | — | — | ||||||||||||||||||||||||||||
Chile |
( |
) | — | — | ||||||||||||||||||||||||||||
United States |
( |
) | — | ( |
) | — | ||||||||||||||||||||||||||
Mexico |
( |
) | — | — | ||||||||||||||||||||||||||||
Paraguay |
( |
) | ( |
) | ( |
) | ||||||||||||||||||||||||||
Uruguay |
— | |||||||||||||||||||||||||||||||
Corporate securities (1c) |
( |
) |
( |
) |
( |
) |
( |
) |
||||||||||||||||||||||||
Shares |
( |
) | — | ( |
) | — | ||||||||||||||||||||||||||
Bank deposit certificates |
( |
) | — | — | ||||||||||||||||||||||||||||
Debentures |
( |
) | ( |
) | ( |
) | ||||||||||||||||||||||||||
Eurobonds and other |
( |
) | ( |
) | ||||||||||||||||||||||||||||
Financial bills |
— | — | — | — | — | — | ||||||||||||||||||||||||||
Other |
( |
) | — | ( |
) | — | ||||||||||||||||||||||||||
|
|
|
|
|
|
|
|
|
|
|
|
|
|
|
|
|||||||||||||||||
Total |
( |
) |
( |
) |
( |
) |
||||||||||||||||||||||||||
|
|
|
|
|
|
|
|
|
|
|
|
|
|
|
|
(1) |
Financial assets at fair value through other comprehensive income - Securities pledged in guarantee of funding transactions of financial institutions and customers were: a) R$ |
(2) |
In the period, the result of Adjustment to Fair Value of Financial Assets (particularly private securities) had their amounts affected by oscillations of rates and other market variables arising from the impact of the COVID-19 pandemic on the macroeconomic scenario in the period (Note 33a). |
12/31/2021 |
12/31/2020 |
|||||||||||||||
Gross carrying amount |
Fair value |
Gross carrying amount |
Fair value |
|||||||||||||
Current |
||||||||||||||||
Non-stated maturity |
||||||||||||||||
Up to one year |
||||||||||||||||
Non-current |
||||||||||||||||
From one to five years |
||||||||||||||||
From five to ten years |
||||||||||||||||
After ten years |
||||||||||||||||
|
|
|
|
|
|
|
|
|||||||||
Total |
||||||||||||||||
|
|
|
|
|
|
|
|
12/31/2021 |
||||||||||||||||
Gross carrying amount |
Adjustments to fair value (in Stockholders’ equity) |
Expected loss |
Fair Value |
|||||||||||||
Shares |
( |
) | ||||||||||||||
|
|
|
|
|
|
|
|
|||||||||
Total |
( |
) |
||||||||||||||
|
|
|
|
|
|
|
|
12/31/2020 |
||||||||||||||||
Gross carrying amount |
Adjustments to fair value (in Stockholders’ equity) |
Expected loss |
Fair Value |
|||||||||||||
Shares |
( |
) | ||||||||||||||
|
|
|
|
|
|
|
|
|||||||||
Total |
( |
) |
||||||||||||||
|
|
|
|
|
|
|
|
12/31/2021 |
12/31/2020 |
|||||||||||||||
Gross carrying amount |
Fair Value |
Gross carrying amount |
Fair Value |
|||||||||||||
Current |
||||||||||||||||
Non-stated maturity |
Stage 1 |
Expected loss 12/31/2020 |
Gains / (Losses) |
Purchases |
Settlements |
Transfer to stage 2 |
Transfer to stage 3 |
Cure from stage 2 |
Cure from stage 3 |
Expected loss 12/31/2021 |
|||||||||||||||||||||||||||
Financial assets at fair value through other comprehensive income |
( |
) |
( |
) |
— |
— |
— |
— |
( |
) | ||||||||||||||||||||||||||
|
|
|
|
|
|
|
|
|
|
|
|
|
|
|
|
|
|
|||||||||||||||||||
Brazilian government securities |
( |
) |
— |
— |
— |
— |
— |
— |
— |
( |
) | |||||||||||||||||||||||||
Other |
( |
) | — | — | — | — | — | — | — | ( |
) | |||||||||||||||||||||||||
Government securities - abroad |
( |
) |
— |
— |
— |
— |
||||||||||||||||||||||||||||||
Corporate securities |
( |
) |
( |
) |
— |
— |
— |
— |
( |
) | ||||||||||||||||||||||||||
Debentures |
( |
) | — | — | — | — | — | — | ( |
) | ||||||||||||||||||||||||||
Eurobonds and other |
( |
) | ( |
) | — | — | — | — | ( |
) | ||||||||||||||||||||||||||
Other |
( |
) | — | — | — | — | — | — | — | ( |
) |
Stage 1 |
Expected loss 12/31/2019 |
Gains / (Losses) |
Purchases |
Settlements |
Transfer to stage 2 |
Transfer to stage 3 |
Cure from stage 2 |
Cure from stage 3 |
Expected loss 12/31/2020 |
|||||||||||||||||||||||||||
Financial assets at fair value through other comprehensive income |
( |
) |
( |
) |
( |
) |
— |
— |
— |
— |
( |
) | ||||||||||||||||||||||||
|
|
|
|
|
|
|
|
|
|
|
|
|
|
|
|
|
|
|||||||||||||||||||
Brazilian government securities |
( |
) |
— |
— |
— |
— |
— |
— |
— |
( |
) | |||||||||||||||||||||||||
Other |
( |
) | — | — | — | — | — | — | — | ( |
) | |||||||||||||||||||||||||
Government securities - abroad |
( |
) |
( |
) |
— |
— |
— |
— |
( |
) | ||||||||||||||||||||||||||
Corporate securities |
( |
) |
( |
) |
( |
) |
— |
— |
— |
— |
( |
) | ||||||||||||||||||||||||
Debentures |
( |
) | — | ( |
) | — | — | — | — | — | ( |
) | ||||||||||||||||||||||||
Eurobonds and other |
( |
) | ( |
) | ( |
) | — | — | — | — | ( |
) | ||||||||||||||||||||||||
Other |
( |
) | — | — | — | — | — | — | — | ( |
) |
12/31/2021 |
12/31/2020 |
|||||||||||||||||||||||
Amortized Cost |
Expected Loss |
Net Amortized Cost |
Amortized Cost |
Expected Loss |
Net Amortized Cost |
|||||||||||||||||||
Brazilian government securities (1a) |
( |
) |
( |
) |
||||||||||||||||||||
Government securities – abroad |
( |
) |
( |
) |
||||||||||||||||||||
Colombia |
( |
) | — | |||||||||||||||||||||
Chile |
— | ( |
) | |||||||||||||||||||||
Korea |
— | ( |
) | |||||||||||||||||||||
Spain |
( |
) | ( |
) | ||||||||||||||||||||
Mexico |
( |
) | ( |
) | ||||||||||||||||||||
Uruguay |
— | — | ||||||||||||||||||||||
Corporate securities (1b) |
( |
) |
( |
) |
||||||||||||||||||||
Rural product note |
( |
) | ( |
) | ||||||||||||||||||||
Bank deposit certificates |
( |
) | — | |||||||||||||||||||||
Real estate receivables certificates |
( |
) | ( |
) | ||||||||||||||||||||
Debentures |
( |
) | ( |
) | ||||||||||||||||||||
Eurobonds and other |
( |
) | ( |
) | ||||||||||||||||||||
Financial bills |
— | — | — | — | ||||||||||||||||||||
Promissory and commercial notes |
( |
) | ( |
) | ||||||||||||||||||||
Other |
( |
) | ( |
) | ||||||||||||||||||||
|
|
|
|
|
|
|
|
|
|
|
|
|||||||||||||
Total |
( |
) |
( |
) |
||||||||||||||||||||
|
|
|
|
|
|
|
|
|
|
|
|
(1) |
Financial Assets at Amortized Cost – Securities Pledged as Collateral of Funding Transactions of Financial Institutions and Customers were: a) R$ |
12/31/2021 |
12/31/2020 |
|||||||||||||||
Amortized Cost |
Net Amortized Cost |
Amortized Cost |
Net Amortized Cost |
|||||||||||||
Current |
||||||||||||||||
Up to one year |
||||||||||||||||
Non-current |
||||||||||||||||
From one to five years |
||||||||||||||||
From five to ten years |
||||||||||||||||
After ten years |
||||||||||||||||
|
|
|
|
|
|
|
|
|||||||||
Total |
||||||||||||||||
|
|
|
|
|
|
|
|
Stage 1 |
Expected loss 12/31/2020 |
Gains / (Losses) |
Purchases |
Settlements |
Transfer to Stage 2 |
Transfer to Stage 3 |
Cure from Stage 2 |
Cure from Stage 3 |
Expected loss 12/31/2021 |
|||||||||||||||||||||||||||
Financial assets at amortized cost |
( |
) |
( |
) |
— |
— |
— |
— |
( |
) | ||||||||||||||||||||||||||
|
|
|
|
|
|
|
|
|
|
|
|
|
|
|
|
|
|
|||||||||||||||||||
Brazilian government securities |
( |
) |
— |
— |
— |
— |
— |
— |
( |
) | ||||||||||||||||||||||||||
Government securities - abroad |
( |
) |
( |
) |
— |
— |
— |
— |
( |
) | ||||||||||||||||||||||||||
Chile |
( |
) | — | — | — | — | — | — | — | |||||||||||||||||||||||||||
Colombia |
— | ( |
) | — | — | — | — | ( |
) | |||||||||||||||||||||||||||
Korea |
( |
) | ( |
) | — | — | — | — | — | — | ||||||||||||||||||||||||||
Spain |
( |
) | ( |
) | — | — | — | — | ( |
) | ||||||||||||||||||||||||||
Mexico |
( |
) | ( |
) | — | — | — | — | ( |
) | ||||||||||||||||||||||||||
Corporate securities |
( |
) |
( |
) |
— |
— |
— |
— |
( |
) | ||||||||||||||||||||||||||
Rural product note |
( |
) | ( |
) | — | — | — | — | ( |
) | ||||||||||||||||||||||||||
Bank deposit certificate |
— | ( |
) | — | — | — | — | ( |
) | |||||||||||||||||||||||||||
Real estate receivables certificates |
( |
) | — | — | — | — | — | ( |
) | |||||||||||||||||||||||||||
Debentures |
( |
) | ( |
) | — | — | — | — | ( |
) | ||||||||||||||||||||||||||
Eurobonds and other |
( |
) | ( |
) | — | — | — | — | ( |
) | ||||||||||||||||||||||||||
Promissory and commercial notes |
( |
) | ( |
) | — | — | — | — | ( |
) | ||||||||||||||||||||||||||
Other |
( |
) | — | — | — | — | — | — | ( |
) |
Stage 2 |
Expected loss 12/31/2020 |
Gains / (Losses) |
Purchases |
Settlements |
Cure to Stage 1 |
Transfer to Stage 3 |
Transfer from Stage 1 |
Cure from Stage 3 |
Expected loss 12/31/2021 |
|||||||||||||||||||||||||||
Financial assets at amortized cost |
( |
) |
( |
) |
— |
— |
— |
— |
( |
) | ||||||||||||||||||||||||||
|
|
|
|
|
|
|
|
|
|
|
|
|
|
|
|
|
|
|||||||||||||||||||
Corporate securities |
( |
) |
( |
) |
— |
— |
— |
— |
( |
) | ||||||||||||||||||||||||||
Rural product note |
( |
) | — | — | — | — | — | — | — | |||||||||||||||||||||||||||
Real estate receivables certificates |
( |
) | — | — | — | — | — | — | — | |||||||||||||||||||||||||||
Debentures |
( |
) | ( |
) | — | — | — | — | ( |
) |
Stage 3 |
Expected loss 12/31/2020 |
Gains / (Losses) |
Purchases |
Settlements |
Cure to Stage 1 |
Cure to Stage 2 |
Transfer from Stage 1 |
Transfer from Stage 2 |
Expected loss 12/31/2021 |
|||||||||||||||||||||||||||
Financial assets at amortized cost |
( |
) |
( |
) |
— |
— |
— |
— |
( |
) | ||||||||||||||||||||||||||
|
|
|
|
|
|
|
|
|
|
|
|
|
|
|
|
|
|
|||||||||||||||||||
Corporate securities |
( |
) |
( |
) |
— |
— |
— |
— |
( |
) | ||||||||||||||||||||||||||
Rural product note |
— | ( |
) | — | — | — | — | — | ( |
) | ||||||||||||||||||||||||||
Debentures |
( |
) | ( |
) | — | — | — | — | ( |
) |
Stage1 |
Expected loss 12/31/2019 |
Gains / (Losses) |
Purchases |
Settlements |
Transfer to Stage 2 |
Transfer to Stage 3 |
Cure from Stage 2 |
Cure from Stage 3 |
Expected loss 12/31/2020 |
|||||||||||||||||||||||||||
Financial assets at amortized cost |
( |
) |
( |
) |
( |
) |
— |
— |
( |
) |
( |
) | ||||||||||||||||||||||||
Brazilian government securities |
( |
) |
— |
— |
— |
— |
— |
— |
( |
) | ||||||||||||||||||||||||||
Government securities - abroad |
— |
( |
) |
— |
— |
— |
— |
( |
) | |||||||||||||||||||||||||||
Chile |
— | ( |
) | — | — | — | — | — | — | ( |
) | |||||||||||||||||||||||||
Colombia |
— | — | ( |
) | — | — | — | — | — | |||||||||||||||||||||||||||
Korea |
— | ( |
) | — | — | — | — | ( |
) | |||||||||||||||||||||||||||
Spain |
— | — | ( |
) | — | — | — | — | — | ( |
) | |||||||||||||||||||||||||
Mexico |
— | ( |
) | — | — | — | — | ( |
) | |||||||||||||||||||||||||||
Corporate securities |
( |
) |
( |
) |
( |
) |
— |
— |
( |
) |
( |
) | ||||||||||||||||||||||||
Rural product note |
( |
) | ( |
) | — | — | — | — | ( |
) | ||||||||||||||||||||||||||
Real estate receivables certificates |
( |
) | ( |
) | ( |
) | — | — | — | — | ( |
) | ||||||||||||||||||||||||
Debentures |
( |
) | ( |
) | ( |
) | — | — | ( |
) | ( |
) | ||||||||||||||||||||||||
Eurobonds and other |
( |
) | ( |
) | ( |
) | — | — | — | — | ( |
) | ||||||||||||||||||||||||
Promissory and commercial notes |
( |
) | ( |
) | ( |
) | — | — | — | — | ( |
) | ||||||||||||||||||||||||
Other |
— | ( |
) | — | — | — | — | ( |
) |
Stage 2 |
Expected loss 12/31/2019 |
Gains / (Losses) |
Purchases |
Settlements |
Cure to Stage 1 |
Transfer to Stage 3 |
Transfer from Stage 1 |
Cure from Stage 3 |
Expected loss 12/31/2020 |
|||||||||||||||||||||||||||
Financial assets at amortized cost |
( |
) |
( |
) |
( |
) |
— |
( |
) |
( |
) |
( |
) | |||||||||||||||||||||||
|
|
|
|
|
|
|
|
|
|
|
|
|
|
|
|
|
|
|||||||||||||||||||
Corporate securities |
( |
) |
( |
) |
( |
) |
— |
( |
) |
( |
) |
( |
) | |||||||||||||||||||||||
Rural product note |
( |
) | ( |
) | — | — | — | — | ( |
) | ||||||||||||||||||||||||||
Real estate receivables certificates |
— | ( |
) | — | — | — | — | — | — | ( |
) | |||||||||||||||||||||||||
Debentures |
( |
) | ( |
) | ( |
) | — | ( |
) | ( |
) | ( |
) | |||||||||||||||||||||||
Eurobonds and other |
— | ( |
) | — | — | — | — | — | — |
Stage 3 |
Expected loss 12/31/2019 |
Gains / (Losses) |
Purchases |
Settlements |
Cure to Stage 1 |
Cure to Stage 2 |
Transfer from Stage 1 |
Transfer from Stage 2 |
Expected loss 12/31/2020 |
|||||||||||||||||||||||||||
Financial assets at amortized cost |
( |
) |
( |
) |
( |
) |
— |
( |
) |
( |
) | |||||||||||||||||||||||||
|
|
|
|
|
|
|
|
|
|
|
|
|
|
|
|
|
|
|||||||||||||||||||
Corporate securities |
( |
) |
( |
) |
( |
) |
— |
( |
) |
( |
) | |||||||||||||||||||||||||
Rural product note |
( |
) | ( |
) | ( |
) | — | — | — | ( |
) | — | ||||||||||||||||||||||||
Debentures |
( |
) | ( |
) | ( |
) | — | ( |
) | ( |
) | |||||||||||||||||||||||||
Other |
( |
) | ( |
) | — | — | — | — | — |
a) |
Composition of loans and lease operations portfolio |
Loans and lease operations by type |
12/31/2021 |
12/31/2020 |
||||||
Individuals |
||||||||
Credit card |
||||||||
Personal loan |
||||||||
Payroll loans |
||||||||
Vehicles |
||||||||
Mortgage loans |
||||||||
Corporate |
||||||||
Micro / small and medium companies |
||||||||
Foreign loans - Latin America |
||||||||
|
|
|
|
|||||
Total loans and lease operations |
||||||||
|
|
|
|
|||||
Provision for Expected Loss (1) |
( |
) | ( |
) | ||||
|
|
|
|
|||||
Total loans and lease operations, net of Expected Credit Loss |
||||||||
|
|
|
|
(1) |
Comprises Expected Credit Loss for Financial Guarantees Pledged R$ ( |
By maturity |
12/31/2021 |
12/31/2020 |
||||||
Overdue as from 1 day |
||||||||
Falling due up to 3 months |
||||||||
Falling due from 3 months to 12 months |
||||||||
Falling due after 1 year |
||||||||
|
|
|
|
|||||
Total loans and lease operations |
||||||||
|
|
|
|
By concentration |
12/31/2021 |
12/31/2020 |
||||||
Largest debtor |
||||||||
10 largest debtors |
||||||||
20 largest debtors |
||||||||
50 largest debtors |
||||||||
100 largest debtors |
b) |
Gross Carrying Amount (Loan Portfolio) |
Stage 1 |
Balance at 12/31/2020 |
Transfer to Stage 2 |
Transfer to Stage 3 (1) |
Cure from Stage 2 |
Cure from Stage 3 |
Derecognition |
Acquisition / (Settlement) |
Closing balance 12/31/2021 |
||||||||||||||||||||||||
Individuals |
( |
) | ( |
) | — | — | ||||||||||||||||||||||||||
Corporate |
( |
) | ( |
) | — | |||||||||||||||||||||||||||
Micro / Small and medium companies |
( |
) | ( |
) | — | |||||||||||||||||||||||||||
Foreign loans - Latin America |
( |
) | ( |
) | — | |||||||||||||||||||||||||||
|
|
|
|
|
|
|
|
|
|
|
|
|
|
|
|
|||||||||||||||||
Total |
( |
) |
( |
) |
— |
|||||||||||||||||||||||||||
|
|
|
|
|
|
|
|
|
|
|
|
|
|
|
|
|||||||||||||||||
Stage 2 |
Balance at 12/31/2020 |
Cure to Stage 1 |
Transfer to Stage 3 |
Transfer from Stage 1 |
Cure from Stage 3 |
Derecognition |
Acquisition / (Settlement) |
Closing balance 12/31/2021 |
||||||||||||||||||||||||
Individuals |
( |
) | ( |
) | — | ( |
) | |||||||||||||||||||||||||
Corporate |
( |
) | ( |
) | — | ( |
) | |||||||||||||||||||||||||
Micro / Small and medium companies |
( |
) | ( |
) | — | ( |
) | |||||||||||||||||||||||||
Foreign loans - Latin America |
( |
) | ( |
) | — | ( |
) | |||||||||||||||||||||||||
|
|
|
|
|
|
|
|
|
|
|
|
|
|
|
|
|||||||||||||||||
Total |
( |
) |
( |
) |
— |
( |
) |
|||||||||||||||||||||||||
|
|
|
|
|
|
|
|
|
|
|
|
|
|
|
|
|||||||||||||||||
Stage 3 |
Balance at 12/31/2020 |
Cure to Stage 1 |
Cure to Stage 2 |
Transfer from Stage 1 |
Transfer from Stage 2 |
Derecognition |
Acquisition / (Settlement) |
Closing balance 12/31/2021 |
||||||||||||||||||||||||
Individuals |
( |
) | ( |
) | ||||||||||||||||||||||||||||
Corporate |
( |
) | ( |
) | ( |
) | ( |
) | ||||||||||||||||||||||||
Micro / Small and medium companies |
( |
) | ( |
) | ( |
) | ( |
) | ||||||||||||||||||||||||
Foreign loans - Latin America |
( |
) | ( |
) | ( |
) | ( |
) | ||||||||||||||||||||||||
|
|
|
|
|
|
|
|
|
|
|
|
|
|
|
|
|||||||||||||||||
Total |
( |
) |
( |
) |
( |
) |
( |
) |
||||||||||||||||||||||||
|
|
|
|
|
|
|
|
|
|
|
|
|
|
|
|
Consolidated 3 Stages |
Balance at 12/31/2020 |
Derecognition |
Acquisition / (Settlement) |
Closing balance 12/31/2021 |
||||||||||||
Individuals |
( |
) | ||||||||||||||
Corporate |
( |
) | ||||||||||||||
Micro / Small and medium companies |
( |
) | ||||||||||||||
Foreign loans - Latin America |
( |
) | ||||||||||||||
|
|
|
|
|
|
|
|
|||||||||
Total (2) |
( |
) |
||||||||||||||
|
|
|
|
|
|
|
|
(1) |
In the movement of transfer of operations from stage 1 to stage 3 over the period, a representative part thereof have first gone through stage 2. |
(2) |
Comprises R$ |
Stage 1 |
Balance at 12/31/2019 |
Transfer to Stage 2 |
Transfer to Stage 3 (1) |
Cure from Stage 2 |
Cure from Stage 3 |
Derecognition |
Acquisition / (Settlement) |
Closing balance 12/31/2020 |
||||||||||||||||||||||||
Individuals |
( |
) | ( |
) | — | |||||||||||||||||||||||||||
Corporate |
( |
) | ( |
) | — | |||||||||||||||||||||||||||
Micro / Small and medium companies |
( |
) | ( |
) | — | |||||||||||||||||||||||||||
Foreign loans - Latin America |
( |
) | ( |
) | — | |||||||||||||||||||||||||||
|
|
|
|
|
|
|
|
|
|
|
|
|
|
|
|
|||||||||||||||||
Total |
( |
) |
( |
) |
— |
|||||||||||||||||||||||||||
|
|
|
|
|
|
|
|
|
|
|
|
|
|
|
|
Stage 2 |
Balance at 12/31/2019 |
Cure to Stage 1 |
Transfer to Stage 3 |
Transfer from Stage 1 |
Cure from Stage 3 |
Derecognition |
Acquisition / (Settlement) |
Closing balance 12/31/2020 |
||||||||||||||||||||||||
Individuals |
( |
) | ( |
) | — | ( |
) | |||||||||||||||||||||||||
Corporate |
( |
) | ( |
) | — | |||||||||||||||||||||||||||
Micro / Small and medium companies |
( |
) | ( |
) | — | |||||||||||||||||||||||||||
Foreign loans - Latin America |
( |
) | ( |
) | — | |||||||||||||||||||||||||||
|
|
|
|
|
|
|
|
|
|
|
|
|
|
|
|
|||||||||||||||||
Total |
( |
) |
( |
) |
— |
|||||||||||||||||||||||||||
|
|
|
|
|
|
|
|
|
|
|
|
|
|
|
|
Stage 3 |
Balance at 12/31/2019 |
Cure to Stage 1 |
Cure to Stage 2 |
Transfer from Stage 1 |
Transfer from Stage 2 |
Derecognition |
Acquisition / (Settlement) |
Closing balance 12/31/2020 |
||||||||||||||||||||||||
Individuals |
( |
) | ( |
) | ( |
) | ||||||||||||||||||||||||||
Corporate |
( |
) | ( |
) | ( |
) | ||||||||||||||||||||||||||
Micro / Small and medium companies |
( |
) | ( |
) | ( |
) | ||||||||||||||||||||||||||
Foreign loans - Latin America |
( |
) | ( |
) | ( |
) | ( |
) | ||||||||||||||||||||||||
|
|
|
|
|
|
|
|
|
|
|
|
|
|
|
|
|||||||||||||||||
Total |
( |
) |
( |
) |
( |
) |
||||||||||||||||||||||||||
|
|
|
|
|
|
|
|
|
|
|
|
|
|
|
|
Consolidated 3 Stages |
Balance at 12/31/2019 |
Derecognition |
Acquisition / (Settlement) |
Closing balance 12/31/2020 |
||||||||||||
Individuals |
( |
) | ||||||||||||||
Corporate |
||||||||||||||||
Micro / Small and medium companies |
( |
) | ||||||||||||||
Foreign loans - Latin America |
( |
) | ||||||||||||||
|
|
|
|
|
|
|
|
|||||||||
Total (2) |
( |
) |
||||||||||||||
|
|
|
|
|
|
|
|
(1) |
In the movement of transfer of operations from stage 1 to stage 3 over the period, a representative part thereof have first gone through stage 2. |
(2) |
Comprises R$ |
c) |
Expected credit loss |
Stage 1 |
Balance at 12/31/2020 |
Transfer to Stage 2 |
Transfer to Stage 3 (1) |
Cure from Stage 2 |
Cure from Stage 3 |
Derecognition |
(Increase) / Reversal |
Closing balance 12/31/2021 |
||||||||||||||||||||||||
Individuals |
( |
) |
( |
) |
— |
— |
( |
) |
( |
) | ||||||||||||||||||||||
Corporate |
( |
) |
( |
) |
( |
) |
— |
( |
) | |||||||||||||||||||||||
Micro / Small and medium companies |
( |
) |
( |
) |
( |
) |
— |
( |
) |
( |
) | |||||||||||||||||||||
Foreign loans - Latin America |
( |
) |
( |
) |
( |
) |
— |
( |
) | |||||||||||||||||||||||
|
|
|
|
|
|
|
|
|
|
|
|
|
|
|
|
|||||||||||||||||
Total |
( |
) |
( |
) |
( |
) |
— |
( |
) |
( |
) | |||||||||||||||||||||
|
|
|
|
|
|
|
|
|
|
|
|
|
|
|
|
Stage 2 |
Balance at 12/31/2020 |
Cure to Stage 1 |
Transfer to Stage 3 |
Transfer from Stage 1 |
Cure from Stage 3 |
Derecognition |
(Increase) / Reversal |
Closing balance 12/31/2021 |
||||||||||||||||||||||||
Individuals |
( |
) |
( |
) |
( |
) |
— |
( |
) |
( |
) | |||||||||||||||||||||
Corporate |
( |
) |
( |
) |
( |
) |
— |
( |
) | |||||||||||||||||||||||
Micro / Small and medium companies |
( |
) |
( |
) |
( |
) |
— |
( |
) |
( |
) | |||||||||||||||||||||
Foreign loans - Latin America |
( |
) |
( |
) |
( |
) |
— |
( |
) | |||||||||||||||||||||||
|
|
|
|
|
|
|
|
|
|
|
|
|
|
|
|
|||||||||||||||||
Total |
( |
) |
( |
) |
( |
) |
— |
( |
) |
( |
) | |||||||||||||||||||||
|
|
|
|
|
|
|
|
|
|
|
|
|
|
|
|
Stage 3 |
Balance at 12/31/2020 |
Cure to Stagee 1 |
Cure to Stag 2 |
Transfer from Stage 1 |
Transfer from Stage 2 |
Derecognition |
(Increase) / Reversal |
Closing balance 12/31/2021 |
||||||||||||||||||||||||
Individuals |
( |
) |
( |
) |
( |
) |
( |
) |
( |
) | ||||||||||||||||||||||
Corporate |
( |
) |
( |
) |
( |
) |
( |
) | ||||||||||||||||||||||||
Micro / Small and medium companies |
( |
) |
( |
) |
( |
) |
( |
) |
( |
) | ||||||||||||||||||||||
Foreign loans - Latin America |
( |
) |
( |
) |
( |
) |
( |
) |
( |
) | ||||||||||||||||||||||
|
|
|
|
|
|
|
|
|
|
|
|
|
|
|
|
|||||||||||||||||
Total |
( |
) |
( |
) |
( |
) |
( |
) |
( |
) | ||||||||||||||||||||||
|
|
|
|
|
|
|
|
|
|
|
|
|
|
|
|
Consolidated 3 Stages |
Balance at 12/31/2020 |
Derecognition |
(Increase) / Reversal |
Closing balance at 12/31/2021 (2) |
||||||||||||
Individuals |
( |
) | ( |
) | ( |
) | ||||||||||
Corporate |
( |
) | ( |
) | ||||||||||||
Micro / Small and medium companies |
( |
) | ( |
) | ( |
) | ||||||||||
Foreign loans - Latin America |
( |
) | ( |
) | ( |
) | ||||||||||
|
|
|
|
|
|
|
|
|||||||||
Total |
( |
) |
( |
) |
( |
) | ||||||||||
|
|
|
|
|
|
|
|
(1) |
In the movement of transfer of operations from stage 1 to stage 3 over the period, a representative part thereof have first gone through stage 2. |
(2) |
Comprises Expected Credit Loss for Financial Guarantees R$ ( |
Stage 1 |
Balance at 12/31/2019 |
Transfer to Stage 2 |
Transfer to Stage 3 (1) |
Cure from Stage 2 |
Cure from Stage 3 |
Derecognition |
(Increase) / Reversal |
Closing balance 12/31/2020 |
||||||||||||||||||||||||
Individuals |
( |
) |
( |
) |
— |
— |
( |
) |
( |
) | ||||||||||||||||||||||
Corporate |
( |
) |
( |
) |
( |
) |
— |
( |
) |
( |
) | |||||||||||||||||||||
Micro / Small and medium companies |
( |
) |
( |
) |
( |
) |
— |
( |
) |
( |
) | |||||||||||||||||||||
Foreign loans - Latin America |
( |
) |
( |
) |
( |
) |
— |
( |
) |
( |
) | |||||||||||||||||||||
|
|
|
|
|
|
|
|
|
|
|
|
|
|
|
|
|||||||||||||||||
Total |
( |
) |
( |
) |
( |
) |
— |
( |
) |
( |
) | |||||||||||||||||||||
|
|
|
|
|
|
|
|
|
|
|
|
|
|
|
|
Stage 2 |
Balance at 12/31/2019 |
Cure to Stage 1 |
Transfer to Stage 3 |
Transfer from Stage 1 |
Cure from Stage 3 |
Derecognition |
(Increase) / Reversal |
Closing balance 12/31/2020 |
||||||||||||||||||||||||
Individuals |
( |
) |
( |
) |
( |
) |
— |
( |
) |
( |
) | |||||||||||||||||||||
Corporate |
( |
) |
( |
) |
( |
) |
— |
( |
) |
( |
) | |||||||||||||||||||||
Micro / Small and medium companies |
( |
) |
( |
) |
( |
) |
— |
( |
) |
( |
) | |||||||||||||||||||||
Foreign loans - Latin America |
( |
) |
( |
) |
( |
) |
— |
( |
) |
( |
) | |||||||||||||||||||||
|
|
|
|
|
|
|
|
|
|
|
|
|
|
|
|
|||||||||||||||||
Total |
( |
) |
( |
) |
( |
) |
— |
( |
) |
( |
) | |||||||||||||||||||||
|
|
|
|
|
|
|
|
|
|
|
|
|
|
|
|
Stage 3 |
Balance at 12/31/2019 |
Cure to Stage 1 |
Cure to Stage 2 |
Transfer from Stage 1 |
Transfer from Stage 2 |
Derecognition |
(Increase) / Reversal |
Closing balance 12/31/2020 |
||||||||||||||||||||||||
Individuals |
( |
) |
( |
) |
( |
) |
( |
) |
( |
) | ||||||||||||||||||||||
Corporate |
( |
) |
( |
) |
( |
) |
( |
) |
( |
) | ||||||||||||||||||||||
Micro / Small and medium companies |
( |
) |
( |
) |
( |
) |
( |
) |
( |
) | ||||||||||||||||||||||
Foreign loans - Latin America |
( |
) |
( |
) |
( |
) |
( |
) |
( |
) | ||||||||||||||||||||||
|
|
|
|
|
|
|
|
|
|
|
|
|
|
|
|
|||||||||||||||||
Total |
( |
) |
( |
) |
( |
) |
( |
) |
( |
) | ||||||||||||||||||||||
|
|
|
|
|
|
|
|
|
|
|
|
|
|
|
|
Consolidated 3 Stages |
Balance at 12/31/2019 |
Derecognition |
(Increase) / Reversal (2) |
Closing balance at 12/31/2020 (3) |
||||||||||||
Individuals |
( |
) | ( |
) | ( |
) | ||||||||||
Corporate |
( |
) | ( |
) | ( |
) | ( |
) | ||||||||
Micro / Small and medium companies |
( |
) | ( |
) | ( |
) | ||||||||||
Foreign loans - Latin America |
( |
) | ( |
) | ( |
) | ||||||||||
|
|
|
|
|
|
|
|
|||||||||
Total |
( |
) |
( |
) |
( |
) | ||||||||||
|
|
|
|
|
|
|
|
(1) |
In the movement of transfer of operations from stage 1 to stage 3 over the period, a representative part thereof have first gone through stage 2. |
(2) |
The increase in the Expected Credit Loss is related to the change in the macroeconomic scenario as from the second half of March 2020 and that impacted our provisioning model for expected loss (Note 33a). |
(3) |
Comprises expected credit loss for Financial Guarantees R$ ( |
d) |
Lease operations - Lessor |
12/31/2021 |
12/31/2020 |
|||||||||||||||||||||||
Payments receivable |
Future financial income |
Present value |
Payments receivable |
Future financial income |
Present value |
|||||||||||||||||||
Current |
( |
) |
( |
) |
||||||||||||||||||||
Up to 1 year |
( |
) | ( |
) | ||||||||||||||||||||
Non-current |
( |
) |
( |
) |
||||||||||||||||||||
From 1 to 2 years |
( |
) | ( |
) | ||||||||||||||||||||
From 2 to 3 years |
( |
) | ( |
) | ||||||||||||||||||||
From 3 to 4 years |
( |
) | ( |
) | ||||||||||||||||||||
From 4 to 5 years |
( |
) | ( |
) | ||||||||||||||||||||
Over 5 years |
( |
) | ( |
) | ||||||||||||||||||||
|
|
|
|
|
|
|
|
|
|
|
|
|||||||||||||
Total |
( |
) |
( |
) |
||||||||||||||||||||
|
|
|
|
|
|
|
|
|
|
|
|
01/01 to 12/31/2021 |
01/01 to 12/31/2020 |
01/01 to 12/31/2019 |
||||||||||
Financial Income |
||||||||||||
Variable payments |
||||||||||||
|
|
|
|
|
|
|||||||
Total |
||||||||||||
|
|
|
|
|
|
e) |
Operations of securitization or transfer and acquisition of financial assets |
12/31/2021 |
12/31/2020 |
|||||||||||||||||||||||||||||||
Assets |
Liabilities (*) |
Assets |
Liabilities (*) |
|||||||||||||||||||||||||||||
Nature of operation |
Book value |
Fair value |
Book value |
Fair value |
Book value |
Fair value |
Book value |
Fair value |
||||||||||||||||||||||||
Mortgage loan |
||||||||||||||||||||||||||||||||
Working capital |
||||||||||||||||||||||||||||||||
|
|
|
|
|
|
|
|
|
|
|
|
|
|
|
|
|||||||||||||||||
Total |
||||||||||||||||||||||||||||||||
|
|
|
|
|
|
|
|
|
|
|
|
|
|
|
|
(*) |
Under Other liabilities. |
a) | The following table presents non-material individual investments of ITAU UNIBANCO HOLDING: |
12/31/2021 |
01/01 to 12/31/2021 |
|||||||||||||||
Investment |
Equity in earnings |
Other comprehensive income |
Total Income |
|||||||||||||
Associates (1) |
( |
) | ||||||||||||||
Joint ventures (2) |
( |
) | — | ( |
) | |||||||||||
|
|
|
|
|
|
|
|
|||||||||
Total |
( |
) |
||||||||||||||
|
|
|
|
|
|
|
|
12/31/2020 |
01/01 to 12/31/2020 |
01/01 to 12/31/2019 |
||||||||||||||||||
Investment |
Equity in earnings |
Other comprehensive income |
Total Income |
Equity in earnings |
||||||||||||||||
Associates (1) |
( |
) | ||||||||||||||||||
Joint ventures (2) |
— | ( |
) | ( |
) | |||||||||||||||
|
|
|
|
|
|
|
|
|
|
|||||||||||
Total |
( |
) |
||||||||||||||||||
|
|
|
|
|
|
|
|
|
|
(1) |
At 12/31/2021, this includes interest in total capital and voting capital of the following companies: Pravaler S.A. ( |
(2) |
At 12/31/2021, this includes interest in total and voting capital of the following companies: Olímpia Promoção e Serviços S.A. ( |
12/31/2021 |
12/31/2020 |
|||||||
Up to 3 months |
||||||||
3 months to 1 year |
||||||||
From 1 to 5 years |
||||||||
Over 5 years |
||||||||
|
|
|
|
|||||
Total Financial Liability |
||||||||
|
|
|
|
01/01 to 12/31/2021 |
01/01 to 12/31/2020 |
01/01 to 12/31/2019 |
||||||||||
Sublease revenues |
||||||||||||
Depreciation expenses |
( |
) | ( |
) | ( |
) | ||||||
Interest expenses |
( |
) | ( |
) | ( |
) | ||||||
Lease expenses for low value assets |
( |
) | ( |
) | ( |
) | ||||||
Variable expenses not include in lease liabilities |
( |
) | ( |
) | ( |
) | ||||||
|
|
|
|
|
|
|||||||
Total |
( |
) |
( |
) |
( |
) | ||||||
|
|
|
|
|
|
12/31/2021 |
||||||||||||||||||||
Fixed Assets (1) |
Annual depreciation rates |
Cost |
Depreciation |
Impairment |
Residual |
|||||||||||||||
Real estate |
( |
) |
( |
) |
||||||||||||||||
Land |
— | — | — | |||||||||||||||||
Buildings and Improvements |
( |
) | ( |
) | ||||||||||||||||
Other fixed assets |
( |
) |
( |
) |
||||||||||||||||
Installations and furniture |
( |
) | ( |
) | ||||||||||||||||
Data processing systems |
( |
) | ( |
) | ||||||||||||||||
Other (2) |
( |
) | — | |||||||||||||||||
|
|
|
|
|
|
|
|
|||||||||||||
Total |
( |
) |
( |
) |
||||||||||||||||
|
|
|
|
|
|
|
|
(1) |
The contractual commitments for purchase of the fixed assets totaled R$ |
(2) |
Others refer to negotiations of Fixed assets in progress and other Communication, Security and Transportation equipment. |
12/31/2020 |
||||||||||||||||||||
Fixed Assets (1) |
Annual depreciation rates |
Cost |
Depreciation |
Impairment |
Residual |
|||||||||||||||
Real estate |
( |
) |
( |
) |
||||||||||||||||
Land |
— | — | — | |||||||||||||||||
Buildings and Improvements |
( |
) | ( |
) | ||||||||||||||||
Other fixed assets |
( |
) |
( |
) |
||||||||||||||||
Installations and furniture |
( |
) | ( |
) | ||||||||||||||||
Data processing systems |
( |
) | ( |
) | ||||||||||||||||
Other (2) |
( |
) | — | |||||||||||||||||
|
|
|
|
|
|
|
|
|||||||||||||
Total |
( |
) |
( |
) |
||||||||||||||||
|
|
|
|
|
|
|
|
(1) |
The contractual commitments for purchase of the fixed assets totaled R$ |
(2) |
Others refer to negotiations of Fixed assets in progress and other Communication, Security and Transportation equipment. |
Intangible assets |
||||||||||||||||||||||||
Goodwill and intangible from acquisition |
Association for the promotion and offer of financial products and services |
Software Acquired |
Internally developed software |
Other intangible assets (1) |
Total |
|||||||||||||||||||
Annual amortization rates |
% | % | % | |||||||||||||||||||||
Cost |
||||||||||||||||||||||||
Balance at 12/31/2020 |
||||||||||||||||||||||||
Acquisitions (4) |
— | |||||||||||||||||||||||
Rescissions / disposals |
( |
) | — | ( |
) | ( |
) | ( |
) | ( |
) | |||||||||||||
Exchange variation |
( |
) | ( |
) | ( |
) | — | ( |
) | ( |
) | |||||||||||||
Other (3,5) |
— | ( |
) | ( |
) | ( |
) | — | ( |
) | ||||||||||||||
Balance at 12/31/2021 |
||||||||||||||||||||||||
Amortization |
||||||||||||||||||||||||
Balance at 12/31/2020 |
— |
( |
) |
( |
) |
( |
) |
( |
) |
( |
) | |||||||||||||
Amortization expense (2) |
— | ( |
) | ( |
) | ( |
) | ( |
) | ( |
) | |||||||||||||
Rescissions / disposals |
— | — | ||||||||||||||||||||||
Exchange variation |
— | — | ||||||||||||||||||||||
Other (3,5) |
— | — | — | |||||||||||||||||||||
Balance at 12/31/2021 |
— |
( |
) |
( |
) |
( |
) |
( |
) |
( |
) | |||||||||||||
Impairment (Note 2.4h) |
||||||||||||||||||||||||
Balance at 12/31/2020 |
( |
) |
( |
) |
( |
) |
( |
) |
— |
( |
) | |||||||||||||
Increase |
— | — | — | ( |
) | — | ( |
) | ||||||||||||||||
Disposals |
— | — | — | — | ||||||||||||||||||||
Exchange variation |
— | — | — | |||||||||||||||||||||
Balance at 12/31/2021 |
( |
) |
( |
) |
( |
) |
( |
) |
— |
( |
) | |||||||||||||
Book value |
||||||||||||||||||||||||
Balance at 12/31/2021 |
(1) |
Includes amounts paid for acquisition of rights to provide services of payment of salaries, proceeds, retirement and pension benefits and similar benefits. |
(2) |
Amortization expenses related to the rights for acquisition of payrolls and associations, in the amount of R$ ( |
(3) |
Includes the total amount of R$ |
(4) |
Other intangible assets: includes the effect of R$ |
(5) |
Includes reclassifications of Software licenses necessary to put data processing systems into use, in the net amount of R$ |
Intangible assets |
||||||||||||||||||||||||
Goodwill and intangible from acquisition |
Association for the promotion and offer of financial products and services |
Software Acquired |
Internally developed software |
Other intangible assets (1) |
Total |
|||||||||||||||||||
Annual amortization rates |
% | % | % | |||||||||||||||||||||
Cost |
||||||||||||||||||||||||
Balance at 12/31/2019 |
||||||||||||||||||||||||
Acquisitions |
— | |||||||||||||||||||||||
Rescissions / disposals |
— | — | ( |
) | ( |
) | ( |
) | ( |
) | ||||||||||||||
Exchange variation |
— | |||||||||||||||||||||||
Other (3) |
— | ( |
) | — | ( |
) | ( |
) | ||||||||||||||||
Balance at 12/31/2020 |
||||||||||||||||||||||||
Amortization |
||||||||||||||||||||||||
Balance at 12/31/2019 |
— |
( |
) |
( |
) |
( |
) |
( |
) |
( |
) | |||||||||||||
Amortization expense (2) |
— | ( |
) | ( |
) | ( |
) | ( |
) | ( |
) | |||||||||||||
Rescissions / disposals |
— | — | — | |||||||||||||||||||||
Exchange variation |
— | ( |
) | ( |
) | — | ( |
) | ( |
) | ||||||||||||||
Other (3) |
— | ( |
) | ( |
) | |||||||||||||||||||
Balance at 12/31/2020 |
— |
( |
) |
( |
) |
( |
) |
( |
) |
( |
) | |||||||||||||
Impairment (Note 2.4h) |
||||||||||||||||||||||||
Balance at 12/31/2019 |
— |
— |
( |
) |
( |
) |
— |
( |
) | |||||||||||||||
Incresase |
( |
) | ( |
) | ( |
) | ( |
) | — | ( |
) | |||||||||||||
Disposals |
— | — | — | — | — | — | ||||||||||||||||||
Balance at 12/31/2020 |
( |
) |
( |
) |
( |
) |
( |
) |
— |
( |
) | |||||||||||||
Book value |
||||||||||||||||||||||||
Balance at 12/31/2020 |
(1) |
Includes amounts paid for acquisition of rights to provide services of payment of salaries, proceeds, retirement and pension benefits and similar benefits. |
(2) |
Amortization expenses related to the rights for acquisition of payrolls and associations, in the amount of R$ ( |
(3) |
Includes the total amount of R$ |
12/31/2021 |
12/31/2020 |
|||||||||||||||||||||||
Current |
Non-current |
Total |
Current |
Non-current |
Total |
|||||||||||||||||||
Interest-bearing deposits |
||||||||||||||||||||||||
Savings deposits |
— |
— |
||||||||||||||||||||||
Interbank deposits |
||||||||||||||||||||||||
Time deposits |
||||||||||||||||||||||||
Non-interest bearing deposits |
— |
— |
||||||||||||||||||||||
Demand deposits |
— |
— |
||||||||||||||||||||||
Other deposits |
— |
— |
||||||||||||||||||||||
|
|
|
|
|
|
|
|
|
|
|
|
|||||||||||||
Total |
||||||||||||||||||||||||
|
|
|
|
|
|
|
|
|
|
|
|
12/31/2021 |
12/31/2020 |
|||||||||||||||||||||||
Current |
Non-current |
Total |
Current |
Non-current |
Total |
|||||||||||||||||||
Structured notes |
||||||||||||||||||||||||
Debt securities |
||||||||||||||||||||||||
|
|
|
|
|
|
|
|
|
|
|
|
|||||||||||||
Total |
||||||||||||||||||||||||
|
|
|
|
|
|
|
|
|
|
|
|
a) |
Securities sold under repurchase agreements |
12/31/2021 |
12/31/2020 |
|||||||||||||||||||||||||
Interest rate (p.a.) |
Current |
Non- current |
Total |
Current |
Non- current |
Total |
||||||||||||||||||||
Assets pledged as collateral |
||||||||||||||||||||||||||
Government securities |
— | — | ||||||||||||||||||||||||
Corporate securities |
— | — | ||||||||||||||||||||||||
Own issue |
||||||||||||||||||||||||||
Foreign |
||||||||||||||||||||||||||
Assets received as collateral |
— |
— |
||||||||||||||||||||||||
Right to sell or repledge the collateral |
||||||||||||||||||||||||||
|
|
|
|
|
|
|
|
|
|
|
|
|||||||||||||||
Total |
||||||||||||||||||||||||||
|
|
|
|
|
|
|
|
|
|
|
|
b) |
Interbank market funds |
12/31/2021 |
12/31/2020 |
|||||||||||||||||||||||||
Interest rate (p.a.) |
Current |
Non- current |
Total |
Current |
Non- current |
Total |
||||||||||||||||||||
Financial bills |
||||||||||||||||||||||||||
Real estate credit bills |
||||||||||||||||||||||||||
Agribusiness credit bills |
||||||||||||||||||||||||||
Guaranteed real estate bills |
||||||||||||||||||||||||||
Import and export financing |
||||||||||||||||||||||||||
On-lending-domestic |
||||||||||||||||||||||||||
|
|
|
|
|
|
|
|
|
|
|
|
|||||||||||||||
Total (*) |
||||||||||||||||||||||||||
|
|
|
|
|
|
|
|
|
|
|
|
(*) |
Comprises R$ |
c) |
Institutional market funds |
12/31/2021 |
12/31/2020 |
|||||||||||||||||||||||||
Interest rate (p.a.) |
Current |
Non- current |
Total |
Current |
Non- current |
Total |
||||||||||||||||||||
Subordinated debt |
||||||||||||||||||||||||||
Foreign loans through securities |
( |
|||||||||||||||||||||||||
Funding from structured operations certificates (1) |
||||||||||||||||||||||||||
|
|
|
|
|
|
|
|
|
|
|
|
|||||||||||||||
Total |
||||||||||||||||||||||||||
|
|
|
|
|
|
|
|
|
|
|
|
(1) |
The fair value of funding from structured operations certificates issued is R$ |
d) |
Subordinated debt, including perpetual debts |
Name of security / currency |
Principal amount (original currency) |
Issue |
Maturity |
Return p.a. |
12/31/2021 |
12/31/2020 |
||||||||||||||||||
Subordinated financial bills—BRL |
|
|||||||||||||||||||||||
— | ||||||||||||||||||||||||
— | ||||||||||||||||||||||||
Total |
||||||||||||||||||||||||
Subordinated euronotes—USD |
||||||||||||||||||||||||
— | ||||||||||||||||||||||||
— | ||||||||||||||||||||||||
— | ||||||||||||||||||||||||
— | ||||||||||||||||||||||||
Total |
||||||||||||||||||||||||
Subordinated bonds—CLP |
||||||||||||||||||||||||
Total |
||||||||||||||||||||||||
Subordinated bonds—COP |
||||||||||||||||||||||||
Total |
||||||||||||||||||||||||
|
|
|
|
|||||||||||||||||||||
Total |
||||||||||||||||||||||||
|
|
|
|
a) |
Other assets |
12/31/2021 |
12/31/2020 |
|||||
Financial |
||||||
At Amortized Cost |
||||||
Receivables from credit card issuers |
||||||
Deposits in guarantee for contingent liabilities, provisions and legal obligations (Note 29d) |
||||||
Trading and intermediation of securities |
||||||
Income receivable |
||||||
Operations without credit granting characteristics, net of provisions |
||||||
Insurance and reinsurance operations |
||||||
Net amount receivables from reimbursement of provisions (Note 29c) |
||||||
Deposits in guarantee of fund raisings abroad |
||||||
Foreign exchange portfolio |
— | |||||
Other |
— | |||||
At Fair Value Through Profit or Loss |
||||||
Other financial assets |
||||||
Non-financial |
||||||
Sundry foreign |
||||||
Prepaid expenses |
||||||
Sundry domestic |
||||||
Assets of post-employment benefit plans (Note 26e) |
||||||
Lease right-of-use |
||||||
Other |
||||||
Current |
||||||
|
|
|
||||
Non-current |
||||||
|
|
|
b) |
Other liabilities |
12/31/2021 |
12/31/2020 |
|||||||
Financial |
||||||||
At Amortized Cost |
||||||||
Credit card operations |
||||||||
Trading and intermediation of securities |
||||||||
Foreign exchange portfolio |
||||||||
Lease liabilties |
||||||||
Other |
||||||||
At Fair Value Through Profit or Loss |
||||||||
Other financial liabilities |
||||||||
Non-financial |
||||||||
Funds in transit |
||||||||
Charging and collection of taxes and similar |
||||||||
Social and statutory |
||||||||
Deferred income |
||||||||
Sundry domestic |
||||||||
Personnel provision |
||||||||
Provision for sundry payments |
||||||||
Obligations on official agreements and rendering of payment services |
||||||||
Liabilities from post-employment benefit plans (Note 26e) |
||||||||
Other |
||||||||
|
|
|
|
|||||
Current |
||||||||
Non-current |
||||||||
|
|
|
|
a) |
Capital |
12/31/2021 |
||||||||||||||||
Number |
||||||||||||||||
Common |
Preferred |
Total |
Amount |
|||||||||||||
Residents in Brazil at 12/31/2020 |
||||||||||||||||
Residents abroad at 12/31/2020 |
||||||||||||||||
|
|
|
|
|
|
|
|
|||||||||
Shares of capital stock at 12/31/2020 |
||||||||||||||||
Shares of capital stock at 12/31/2021 (2) |
||||||||||||||||
|
|
|
|
|
|
|
|
|||||||||
Residents in Brazil at 12/31/2021 |
||||||||||||||||
Residents abroad at 12/31/2021 |
||||||||||||||||
Treasury shares at 12/31/2020 (1) |
— |
( |
) | |||||||||||||
Result from delivery of treasury shares |
— | ( |
) | ( |
) | |||||||||||
Treasury shares at 12/31/2021 (1) |
— |
( |
) | |||||||||||||
|
|
|
|
|
|
|
|
|||||||||
Outstanding shares at 12/31/2021 |
||||||||||||||||
Outstanding shares at 12/31/2020 |
||||||||||||||||
|
|
|
|
|
|
12/31/2020 |
||||||||||||||||
Number |
||||||||||||||||
Common |
Preferred |
Total |
Amount |
|||||||||||||
Residents in Brazil at 12/31/2019 |
||||||||||||||||
Residents abroad at 12/31/2019 |
||||||||||||||||
|
|
|
|
|
|
|
|
|||||||||
Shares of capital stock at 12/31/2019 |
||||||||||||||||
Shares of capital stock at 12/31/2020 |
||||||||||||||||
|
|
|
|
|
|
|
|
|||||||||
Residents in Brazil at 12/31/2020 |
||||||||||||||||
Residents abroad at 12/31/2020 |
||||||||||||||||
Treasury shares at 12/31/2019 (1) |
— |
( |
) | |||||||||||||
Result from delivery of treasury shares |
— | ( |
) | ( |
) | |||||||||||
Treasury shares at 12/31/2020 (1) |
— |
( |
) | |||||||||||||
|
|
|
|
|
|
|
|
|||||||||
Outstanding shares at 12/31/2020 |
||||||||||||||||
Outstanding shares at 12/31/2019 |
||||||||||||||||
|
|
|
|
|
|
(1) |
Own shares, purchased based on authorization of the Board of Directors, to be held in Treasury for subsequent cancellation of replacement in the market. |
(2) |
Partial spin-off (Note 3). |
12/31/2021 |
||||||||
Cost / market value |
Common |
Preferred |
||||||
Average cost |
— | |||||||
Market value at 12/31/2021 |
12/31/2020 |
||||||||
Cost / market value |
Common |
Preferred |
||||||
Average cost |
— | |||||||
Market value at 12/31/2020 |
b) |
Dividends |
12/31/2021 |
12/31/2020 |
12/31/2019 |
||||||||||
Statutory net income |
||||||||||||
Adjustments: |
||||||||||||
(-) Legal reserve - 5% |
( |
) | ( |
) | ( |
) | ||||||
Dividend calculation basis |
||||||||||||
Minimum mandatory dividend - 25% |
||||||||||||
Dividends and Interest on Capital Paid / Accrued |
12/31/2021 |
||||||||||||||||
Gross value per share (R$) |
Value |
WHT (With holding tax) |
Net |
|||||||||||||
Paid / Prepaid |
( |
) |
||||||||||||||
Dividends - 10 monthly installments paid from February to November 2021 |
— | |||||||||||||||
Interest on capital - 1 monthly installment paid on December 2021 |
( |
) | ||||||||||||||
Interest on capital - paid on 08/26/2021 |
( |
) | ||||||||||||||
Accrued (Recorded in Other Liabilities - Social and Statutory) |
( |
) |
||||||||||||||
Interest on capital - 1 monthly installment paid on 01/03/2022 |
( |
) | ||||||||||||||
Interest on capital - credited on 11/26/2021 to be paid until 04/29/2022 |
( |
) | ||||||||||||||
Interest on capital |
( |
) | ||||||||||||||
Total from 01/01 to 12/31/2021 |
( |
) |
12/31/2020 |
||||||||||||||||
Gross value per share (R$) |
Value |
WHT (With holding tax) |
Net |
|||||||||||||
Paid / Prepaid |
( |
) |
||||||||||||||
Dividends - 11 monthly installments paid from February to December de 2020 |
— | |||||||||||||||
Interest on capital - paid on 08/26/2020 |
( |
) | ||||||||||||||
Accrued (Recorded in Other Liabilities - Social and Statutory) |
( |
) |
||||||||||||||
Dividends - 1 monthly installment paid on 01/04/2021 |
— | |||||||||||||||
Interest on capital - credited on 12/17/2020 to be paid until 04/30/2021 |
( |
) | ||||||||||||||
Interest on capital - credited on 01/28/2021 to be paid until 04/30/2021 |
( |
) | ||||||||||||||
Dividends or Interest on capital |
( |
) | ||||||||||||||
Total from 01/01 to 12/31/2020 |
( |
) |
12/31/2019 |
||||||||||||||||
Gross value per share (R$) |
Value |
WHT (With holding tax) |
Net |
|||||||||||||
Paid / prepaid |
— |
|||||||||||||||
Dividends - 11 monthly installments from February to December 2019 |
— | |||||||||||||||
Dividends - paid on 08/23/2019 |
— | |||||||||||||||
Accrued (Recorded in Other Liabilities) |
( |
) |
||||||||||||||
Dividends - 1 monthly installment paid on 01/02/2020 |
— | |||||||||||||||
Interest on capital - credited on 12/19/2019 to be paid until 04/30/2020 |
( |
) | ||||||||||||||
Identified in Profit Reserve In Stockholders’ Equity |
( |
) |
||||||||||||||
Total from 01/01 to 12/31/2019 |
( |
) |
c) |
Capital reserves and profit reserves |
12/31/2021 |
12/31/2020 |
12/31/2019 |
||||||||||
Capital reserves |
||||||||||||
Premium on subscription of shares |
||||||||||||
Share-based payment |
||||||||||||
Reserves from tax incentives, restatement of equity securities and other |
||||||||||||
Profit reserves |
||||||||||||
Legal (1) |
||||||||||||
Statutory (2)(3) |
||||||||||||
Corporate reorganizations (Note 2.4 a IV) |
( |
) | ( |
) | ( |
) | ||||||
|
|
|
|
|
|
|||||||
Total reserves at parent company |
||||||||||||
|
|
|
|
|
|
(1) |
Its purpose is to ensure the integrity of capital, compensate loss or increase capital. |
(2) |
Its main purpose is to ensure the yield flow to shareholders. |
(3) |
Includes R$ |
d) |
Non-con trolling interests |
Stockholders’ equity |
Income |
|||||||||||||||||||
12/31/2021 |
12/31/2020 |
01/01 to 12/31/2021 |
01/01 to 12/31/2020 |
01/01 a 12/31/2019 |
||||||||||||||||
Itaú CorpBanca |
( |
) | ||||||||||||||||||
Itaú CorpBanca Colômbia S.A. |
( |
) | ( |
) | ||||||||||||||||
Financeira Itaú CBD S.A. Crédito, Financiamento e Investimento |
||||||||||||||||||||
Luizacred S.A. Soc. Cred. Financiamento Investimento |
||||||||||||||||||||
Other |
||||||||||||||||||||
|
|
|
|
|
|
|
|
|
|
|||||||||||
Total |
( |
) |
||||||||||||||||||
|
|
|
|
|
|
|
|
|
|
01/01 to 12/31/2021 |
01/01 to 12/31/2020 |
01/01 to 12/31/2019 |
||||||||||
Partner Plan |
( |
) | ( |
) | ( |
) | ||||||
Share-based plan |
( |
) | ( |
) | ( |
) | ||||||
|
|
|
|
|
|
|||||||
Total |
( |
) |
( |
) |
( |
) | ||||||
|
|
|
|
|
|
01/01 to 12/31/2021 |
01/01 to 12/31/2020 |
|||||||
Quantity |
Quantity |
|||||||
Opening balance |
||||||||
|
|
|
|
|||||
New (1) |
||||||||
Delivered |
( |
) | ( |
) | ||||
Cancelled |
( |
) | ( |
) | ||||
|
|
|
|
|||||
Closing balance |
||||||||
|
|
|
|
|||||
Weighted average of remaining contractual life (years) |
||||||||
|
|
|
|
|||||
Market value weighted average (R$) |
||||||||
|
|
|
|
(1) |
As a result of the reduction of the minority interest in XP Inc. and subsequent merger of Xpart S.A. (Note 3), as from October 2021, there was and increase in the number of ITUB4 shares to be delivered under the variable compensation plans. |
01/01 to 12/31/2021 |
01/01 to 12/31/2020 |
|||||||
Quantity |
Quantity |
|||||||
Opening balance |
||||||||
|
|
|
|
|||||
New (1) |
||||||||
Delivered |
( |
) | ( |
) | ||||
Cancelled |
( |
) | ( |
) | ||||
|
|
|
|
|||||
Closing balance |
||||||||
|
|
|
|
|||||
Weighted average of remaining contractual life (years) |
||||||||
|
|
|
|
|||||
Market value weighted average (R$) |
||||||||
|
|
|
|
(1) |
As a result of the reduction of the minority interest in XP Inc. and subsequent merger of XPart S.A. (Note 3), as from October 2021, there was an increase in the number of ITUB4 shares to be delivered under the variable compensation plans. |
01/01 to 12/31/2021 |
01/01 to 12/31/2020 |
01/01 to 12/31/2019 |
||||||||||
Compulsory deposits in the Central Bank of Brazil |
||||||||||||
Interbank deposits |
||||||||||||
Securities purchased under agreements to resell |
||||||||||||
Financial assets at fair value through other comprehensive income |
||||||||||||
Financial assets at amortized cost |
||||||||||||
Loan operations |
||||||||||||
Other financial assets |
( |
) | ( |
) | ||||||||
|
|
|
|
|
|
|||||||
Total |
||||||||||||
|
|
|
|
|
|
01/01 to 12/31/2021 |
01/01 to 12/31/2020 |
01/01 to 12/31/2019 |
||||||||||
Deposits |
( |
) | ( |
) | ( |
) | ||||||
Securities sold under repurchase agreements |
( |
) | ( |
) | ( |
) | ||||||
Interbank market funds |
( |
) | ( |
) | ( |
) | ||||||
Institutional market funds |
( |
) | ( |
) | ( |
) | ||||||
Financial expense from technical provisions for insurance and private pension |
( |
) | ( |
) | ( |
) | ||||||
Other |
( |
) | ( |
) | ||||||||
|
|
|
|
|
|
|||||||
Total |
( |
) |
( |
) |
( |
) | ||||||
|
|
|
|
|
|
01/01 to 12/31/2021 |
01/01 to 12/31/2020 |
01/01 to 12/31/2019 |
||||||||||
Securities |
||||||||||||
Derivatives (*) |
( |
) | ( |
) | ||||||||
Financial assets designated at fair value through profit or loss |
( |
) | ( |
) | ( |
) | ||||||
Other financial assets at fair value through profit or loss |
— | — | ||||||||||
Financial liabilities at fair value through profit or loss |
( |
) | ( |
) | — | |||||||
Financial liabilities designated at fair value |
( |
) | ||||||||||
|
|
|
|
|
|
|||||||
Total |
||||||||||||
|
|
|
|
|
|
(*) |
Includes the ineffective derivatives portion related to hedge accounting. |
01/01 to 12/31/2021 |
01/01 to 12/31/2020 |
01/01 to 12/31/2019 |
||||||||||
Credit and debit cards |
||||||||||||
Current account services |
||||||||||||
Asset management |
||||||||||||
Funds |
||||||||||||
Consortia |
||||||||||||
Credit operations and financial guarantees provided |
||||||||||||
Credit operations |
||||||||||||
Financial guarantees provided |
||||||||||||
Collection services |
||||||||||||
Advisory services and brokerage |
||||||||||||
Custody services |
||||||||||||
Other |
||||||||||||
|
|
|
|
|
|
|||||||
Total |
||||||||||||
|
|
|
|
|
|
01/01 to 12/31/2021 |
01/01 to 12/31/2020 |
01/01 to 12/31/2019 |
||||||||||
Personnel expenses |
( |
) |
( |
) |
( |
) | ||||||
Compensation |
( |
) | ( |
) | ( |
) | ||||||
Employees’ profit sharing |
( |
) | ( |
) | ( |
) | ||||||
Welfare benefits |
( |
) | ( |
) | ( |
) | ||||||
Provision for labor claims and dismissals |
( |
) | ( |
) | ( |
) | ||||||
Payroll charges |
( |
) | ( |
) | ( |
) | ||||||
Share-based payment (Note 20) |
( |
) | ( |
) | ( |
) | ||||||
Training |
( |
) | ( |
) | ( |
) | ||||||
Other |
( |
) | ( |
) | ||||||||
Administrative expenses |
( |
) |
( |
) |
( |
) | ||||||
Third party services, Financial services expenses, Security and Transportation |
( |
) | ( |
) | ( |
) | ||||||
Data processing and telecommunications |
( |
) | ( |
) | ( |
) | ||||||
Installations |
( |
) | ( |
) | ( |
) | ||||||
Advertising, promotions and publicity |
( |
) | ( |
) | ( |
) | ||||||
Materials |
( |
) | ( |
) | ( |
) | ||||||
Travel expenses |
( |
) | ( |
) | ( |
) | ||||||
Other (1) |
( |
) | ( |
) | ( |
) | ||||||
Depreciation and Amortization |
( |
) |
( |
) |
( |
) | ||||||
Other expenses |
( |
) |
( |
) |
( |
) | ||||||
Selling - credit cards |
( |
) | ( |
) | ( |
) | ||||||
Claims losses |
( |
) | ( |
) | ( |
) | ||||||
Loss on sale of other assets, fixed assets and investments in associates and joint ventures |
( |
) | ( |
) | ( |
) | ||||||
Provision for lawsuits civil (Note 29) |
( |
) | ( |
) | ( |
) | ||||||
Provision for tax and social security lawsuits |
( |
) | ( |
) | ||||||||
Refund of interbank costs |
( |
) | ( |
) | ( |
) | ||||||
Impairment (2) |
( |
) | ( |
) | ( |
) | ||||||
Other |
( |
) | ( |
) | ( |
) | ||||||
|
|
|
|
|
|
|||||||
Total |
( |
) |
( |
) |
( |
) | ||||||
|
|
|
|
|
|
(1) |
At 12/31/2020 comprises R$ ( |
(2) |
At 12/31/2020 comprises the effects of impairment of goodwill and intangible assets of Itaú Corpbanca, net of tax effects and ownership interest of non-controlling shareholders total R$ ( |
Income tax |
% | |||
Additional income tax |
% | |||
Social contribution on net income (1) |
% |
(1) |
Law No. 14,183/21 (conversion of Provisional Measure (MP) No. 1,034/21): published on July 15, 2021, sets forth the increase in the rate of Social Contribution on Net Income of banks, which increased to non-financial companies it remained at |
Due on operations for the period |
01/01 to 12/31/2021 |
01/01 to 12/31/2020 |
01/01 to 12/31/2019 |
|||||||||
Income / (loss) before income tax and social contribution |
||||||||||||
Charges (income tax and social contribution) at the rates in effect (1) |
( |
) | ( |
) | ( |
) | ||||||
Increase / decrease in income tax and social contribution charges arising from: |
||||||||||||
Share of profit or (loss) of associates and joint ventures |
||||||||||||
Foreign exchange variation on investments abroad |
||||||||||||
Interest on capital |
||||||||||||
Other nondeductible expenses net of non taxable income (2) |
( |
) | ( |
) | ||||||||
Income tax and social contribution expenses |
( |
) |
( |
) |
( |
) | ||||||
Related to temporary differences |
||||||||||||
Increase / (reversal) for the period |
( |
) | ||||||||||
Increase / (reversal) of prior periods |
— | — | ( |
) | ||||||||
(Expenses) / Income from deferred taxes |
( |
) |
||||||||||
|
|
|
|
|
|
|||||||
Total income tax and social contribution expenses |
( |
) |
( |
) | ||||||||
|
|
|
|
|
|
(1) |
It considers that in the first half of 2021 the current IRPJ and CSLL rate is equal to |
(2) |
Includes temporary (additions) and exclusions. |
12/31/2020 |
Realization / Reversal |
Increase |
12/31/2021 |
|||||||||||||
Reflected in income |
( |
) |
||||||||||||||
Provision for expected loss |
( |
) | ||||||||||||||
Related to tax losses and social contribution loss carryforwards |
( |
) | ||||||||||||||
Provision for profit sharing |
( |
) | ||||||||||||||
Provision for devaluation of securities with permanent impairment |
( |
) | ||||||||||||||
Provisions |
( |
) | ||||||||||||||
|
|
|
|
|
|
|
|
|||||||||
Civil lawsuits |
( |
) | ||||||||||||||
Labor claims |
( |
) | ||||||||||||||
Tax and social security lawsuits |
( |
) | ||||||||||||||
Legal obligations |
( |
) | ||||||||||||||
Adjustments of operations carried out on the futures settlement market |
( |
) | — | — | ||||||||||||
Adjustment to Fair Value of Financial Assets – At Fair Value Through Profit or Loss |
( |
) | ||||||||||||||
Provision relating to health insurance operations |
— | |||||||||||||||
Other |
( |
) | ||||||||||||||
Reflected in stockholders’ equity |
( |
) |
||||||||||||||
Adjustment to Fair Value of Financial Assets – At Fair Value Through Other Comprehensive Income |
( |
) | ||||||||||||||
Cash flow hedge |
( |
) | — | |||||||||||||
Other |
( |
) | ||||||||||||||
|
|
|
|
|
|
|
|
|||||||||
Total (1) (2) |
( |
) |
||||||||||||||
|
|
|
|
|
|
|
|
(1) |
Deferred income tax and social contribution assets and liabilities are recorded in the balance sheet offset by a taxable entity and amounting to R$ |
(2) |
The accounting records of deferred tax assets on income tax losses and/or social contribution loss carryforwards, as well as those arising from temporary differences, are based on technical feasibility studies which consider the expected generation of future taxable income, considering the history of profitability for each subsidiary individually, and for the consolidated taken as a whole. |
12/31/2019 |
Realization / Reversal |
Increase |
12/31/2020 |
|||||||||||||
Reflected in income |
( |
) |
||||||||||||||
Provision for expected loss |
( |
) | ||||||||||||||
Related to tax losses and social contribution loss carryforwards |
( |
) | ||||||||||||||
Provision for profit sharing |
( |
) | ||||||||||||||
Provision for devaluation of securities with permanent impairment |
( |
) | ||||||||||||||
Provisions |
( |
) | ||||||||||||||
|
|
|
|
|
|
|
|
|||||||||
Civil lawsuits |
( |
) | ||||||||||||||
Labor claims |
( |
) | ||||||||||||||
Tax and social security lawsuits |
( |
) | ||||||||||||||
Legal obligations |
( |
) | ||||||||||||||
Adjustments of operations carried out in futures settlement market |
( |
) | ||||||||||||||
Adjustment to Fair Value of Financial Assets – At Fair Value Through Profit or Loss |
( |
) | ||||||||||||||
Provision relating to health insurance operations |
— | |||||||||||||||
Other |
( |
) | ||||||||||||||
Reflected in stockholders’ equity |
( |
) |
||||||||||||||
Adjustment to Fair Value of Financial Assets – At Fair Value Through Other Comprehensive Income |
( |
) | ||||||||||||||
Cash flow hedge |
( |
) | — | |||||||||||||
Other |
— | |||||||||||||||
|
|
|
|
|
|
|
|
|||||||||
Total (1) (2) |
( |
) |
||||||||||||||
|
|
|
|
|
|
|
|
(1) |
Deferred income tax and social contribution assets and liabilities are recorded in the balance sheet offset by a taxable entity and amounting to R$ |
(2) |
At 12/31/2019, deferred tax asset balance comprised its annual revaluation and effects caused by EC 103/2019 in tax rate of the Social Contribution on Net Income, which was increased from |
12/31/2020 |
Realization / reversal |
Increase |
12/31/2021 |
|||||||||||||
Reflected in income |
( |
) |
||||||||||||||
Depreciation in excess finance lease |
( |
) | — | |||||||||||||
Adjustment of deposits in guarantee and provisions |
( |
) | ||||||||||||||
Post-employment benefits |
( |
) | ||||||||||||||
Adjustments of operations carried out on the futures settlement market |
( |
) | ||||||||||||||
Adjustment to Fair Value of Financial Assets - At Fair Value Through Profit or Loss |
( |
) | ||||||||||||||
Taxation of results abroad – capital gains |
( |
) | ||||||||||||||
Other |
( |
) | ||||||||||||||
Reflected in stockholders’ equity |
( |
) |
||||||||||||||
Adjustment to Fair Value of Financial Assets - At Fair Value Through Other Comprehensive Income |
( |
) | ||||||||||||||
Cash flow hedge |
( |
) | ||||||||||||||
Post-employment benefits |
||||||||||||||||
|
|
|
|
|
|
|
|
|||||||||
Total (*) |
( |
) |
||||||||||||||
|
|
|
|
|
|
|
|
(*) |
Deferred income tax and social contribution asset and liabilities are recorded in the balance sheet offset by a taxable entity and amounting to R$ |
12/31/2019 |
Realization / reversal |
Increase |
12/31/2020 |
|||||||||||||
Reflected in income |
( |
) |
||||||||||||||
Depreciation in excess finance lease |
( |
) | — | |||||||||||||
Adjustment of deposits in guarantee and provisions |
( |
) | ||||||||||||||
Post-employment benefits |
( |
) | ||||||||||||||
Adjustments of operations carried out on the futures settlement market |
( |
) | ||||||||||||||
Adjustment to Fair Value of Financial Assets - At Fair Value Through Profit or Loss |
( |
) | ||||||||||||||
Taxation of results abroad – capital gains |
||||||||||||||||
Other |
( |
) | ||||||||||||||
Reflected in stockholders’ equity |
( |
) |
||||||||||||||
Adjustment to Fair Value of Financial Assets - At Fair Value Through Other Comprehensive Income |
( |
) | ||||||||||||||
Cash flow hedge |
( |
) | — | |||||||||||||
Post-employment benefits |
( |
) | — | |||||||||||||
|
|
|
|
|
|
|
|
|||||||||
Total (*) |
( |
) |
||||||||||||||
|
|
|
|
|
|
|
|
(*) |
Deferred income tax and social contribution asset and liabilities are recorded in the balance sheet offset by a taxable entity and amounting to R$ |
Deferred tax assets |
||||||||||||||||||||||||||||||||||||||||
Year of realization |
Temporary differences |
% |
Tax loss / social contribution loss carryforwards |
% |
Total |
% |
Deferred tax liabilities |
% |
Net deferred taxes |
% |
||||||||||||||||||||||||||||||
2022 |
% | % | % | ( |
) | % | % | |||||||||||||||||||||||||||||||||
2023 |
% | % | % | ( |
) | % | % | |||||||||||||||||||||||||||||||||
2024 |
% | % | % | ( |
) | % | % | |||||||||||||||||||||||||||||||||
2025 |
% | % | % | ( |
) | % | % | |||||||||||||||||||||||||||||||||
2026 |
% | % | % | ( |
) | % | % | |||||||||||||||||||||||||||||||||
After 2026 |
% | % | % | ( |
) | % | % | |||||||||||||||||||||||||||||||||
Total |
% |
% |
% |
( |
) |
% |
% | |||||||||||||||||||||||||||||||||
|
|
|
|
|
|
|
|
|
|
|
|
|
|
|
|
|
|
|
|
|||||||||||||||||||||
Present value (*) |
( |
|||||||||||||||||||||||||||||||||||||||
|
|
|
|
|
|
|
|
|
|
(*) |
The average funding rate, net of tax effects, was used to determine the present value. |
IV - |
At 12/31/2021, deferred tax assets not accounted for correspond to R$ |
12/31/2021 |
12/31/2020 |
|||||||
Taxes and contributions on income payable |
||||||||
Deferred tax liabilities (Note 24b II) |
||||||||
Other |
||||||||
Total |
||||||||
Current |
||||||||
|
|
|
|
|||||
Non-current |
||||||||
|
|
|
|
01/01 to 12/31/2021 |
01/01 to 12/31/2020 |
01/01 to 12/31/2019 |
||||||||||
Net income attributable to owners of the parent company |
||||||||||||
Minimum non-cumulative dividends on preferred shares |
( |
) | ( |
) | ( |
) | ||||||
Retained earnings to be distributed to common equity owners in an amount per share equal to the minimum dividend payable to preferred equity owners |
( |
) | ( |
) | ( |
) | ||||||
Retained earnings to be distributed, on a pro rata basis, to common and preferred equity owners: |
||||||||||||
Common |
||||||||||||
Preferred |
||||||||||||
Total net income available to equity owners: |
||||||||||||
Common |
||||||||||||
Preferred |
||||||||||||
Weighted average number of outstanding shares |
||||||||||||
Common |
||||||||||||
Preferred |
||||||||||||
Basic earnings per share – R$ |
||||||||||||
Common |
||||||||||||
Preferred |
01/01 to 12/31/2021 |
01/01 to 12/31/2020 |
01/01 to 12/31/2019 |
||||||||||
Net income available to preferred equity owners |
||||||||||||
Dividends on preferred shares after dilution effects |
||||||||||||
Net income available to preferred equity owners considering preferred shares after the dilution effect |
||||||||||||
Net income available to ordinary equity owners |
||||||||||||
Dividend on preferred shares after dilution effects |
( |
) | ( |
) | ( |
) | ||||||
Net income available to ordinary equity owners considering preferred shares after the dilution effect |
||||||||||||
Adjusted weighted average of shares |
||||||||||||
Common |
||||||||||||
Preferred |
||||||||||||
Preferred |
||||||||||||
Incremental as per share-based payment plans |
||||||||||||
Diluted earnings per share – R$ |
||||||||||||
Common |
||||||||||||
Preferred |
• | Defined Benefit Plans (BD): plans which scheduled benefits have their value established in advance, based on salaries and/or length of service of employees, and its cost is actuarially determined; |
• | Defined Contribution Plans (CD): are those plans which scheduled benefits have their value permanently adjusted to the investments balance, kept in favor of the participant, including in the benefit concession phase, considering net proceedings of its investment, amounts contributed and benefits paid; and |
• | Variable Contribution Plans (CV): in this type of plan, scheduled benefits present a combination of characteristics of defined contribution and defined benefit modalities, and the benefit is actuarially determined based on the investments accumulated balance by the participant on the retirement date. |
Entity |
Benefit Plan |
Modality | ||
Fundação Itaú Unibanco – Previdência Complementar - FIU | Supplementary Retirement Plan Supplementary Retirement Plan – Flexible Premium Annuity Franprev Benefit Plan 002 Benefit Plan Prebeg Benefit Plan UBB PREV Defined Benefit Plan Benefit Plan II Itaulam Basic Plan Itaucard Defined Benefit Plan Itaú Unibanco Main Retirement Plan |
Defined Benefit | ||
Itaubanco Defined Contribution Plan Itaubank Retirement Plan Redecard Pension Plan |
Defined Contribution | |||
Unibanco Pension Plan – Intelligent Future Itaulam Supplementary Plan Itaucard Variable Contribution Plan Itaú Unibanco Supplementary Retirement Plan |
Variable Contribution | |||
FUNBEP – Fundo de Pensão Multipatrocinado | Benefit Plan l Benefit Plan ll |
Defined Benefit Variable Contribution |
12/31/2021 |
12/31/2020 | |||
Mortality table (1) |
||||
Discount rate (2) |
||||
Inflation (3) |
||||
Actuarial method | ||||
|
|
(1) |
Correspond to those disclosed by SOA – “Society of Actuaries”, that reflect a |
(2) |
Determined based on market yield relating to National Treasury Notes (NTN-B) and compatible with the economic scenario observed on the balance sheet closing date, considering the volatility of interest market and models used. |
(3) |
Refers to estimated long-term projection. |
Fair value |
% Allocation |
|||||||||||||||
Types |
12/31/2021 |
12/31/2020 |
12/31/2021 |
12/31/2020 |
||||||||||||
Fixed income securities |
% |
% | ||||||||||||||
Quoted in an active market |
% | % | ||||||||||||||
Non quoted in an active market |
% | % | ||||||||||||||
Variable income securities |
% |
% | ||||||||||||||
Quoted in an active market |
% | % | ||||||||||||||
Non quoted in an active market |
% | % | ||||||||||||||
Structured investments |
% |
% | ||||||||||||||
Non quoted in an active market |
% | % | ||||||||||||||
Real estate |
% |
% | ||||||||||||||
Loans to participants |
% |
% | ||||||||||||||
|
|
|
|
|
|
|
|
|||||||||
Total |
||||||||||||||||
|
|
|
|
|
|
|
|
12/31/2021 |
||||||||||||||||||||||||||||||||||||
BD and CV plans |
CD plans |
Other post- employment benefits Liabilities |
Total Recognized amount |
|||||||||||||||||||||||||||||||||
Net assets |
Actuarial liabilities |
Asset ceiling |
Recognized amount |
Pension plan fund |
Asset ceiling |
Recognized amount |
||||||||||||||||||||||||||||||
Amounts at the beginning of the period |
( |
) |
( |
) |
( |
) |
( |
) |
( |
) |
( |
) | ||||||||||||||||||||||||
|
|
|
|
|
|
|
|
|
|
|
|
|
|
|
|
|
|
|||||||||||||||||||
Amounts recognized in income (1+2+3+4) |
( |
) |
( |
) |
( |
) |
( |
) |
( |
) |
( |
) |
( |
) | ||||||||||||||||||||||
1 - Cost of current service |
— | ( |
) | — | ( |
) | — | — | — | — | ( |
) | ||||||||||||||||||||||||
2 - Cost of past service |
— | — | — | — | — | — | — | — | ||||||||||||||||||||||||||||
3 - Net interest (1) |
( |
) | ( |
) | ( |
) | ( |
) | ( |
) | ( |
) | ||||||||||||||||||||||||
4 - Other expenses (2) |
— | — | — | — | ( |
) | — | ( |
) | — | ( |
) | ||||||||||||||||||||||||
Amounts recognized in stockholders´ equity - other comprehensive income (5+6+7) |
( |
) |
( |
) |
( |
) |
||||||||||||||||||||||||||||||
5 - Effects on asset ceiling (4) |
— | — | ( |
) | — | |||||||||||||||||||||||||||||||
6 - Remeasurements |
( |
) | — | ( |
) | ( |
) | — | ( |
) | ( |
) | ||||||||||||||||||||||||
Changes in demographic assumptions |
— | — | — | — | — | — | ||||||||||||||||||||||||||||||
Changes in financial assumptions |
— | — | — | — | — | |||||||||||||||||||||||||||||||
Experience of the plan (3) |
( |
) | ( |
) | — | ( |
) | ( |
) | — | ( |
) | ( |
) | ( |
) | ||||||||||||||||||||
7 - Exchange variation |
— | — | — | — | — | |||||||||||||||||||||||||||||||
Other (8+9+10) |
( |
) |
— |
( |
) |
— |
( |
) |
( |
) | ||||||||||||||||||||||||||
8 - Receipt by Destination of Resources (4) |
— | — | — | — | ( |
) | — | ( |
) | — | ( |
) | ||||||||||||||||||||||||
9 - Benefits paid |
( |
) | — | — | — | — | — | |||||||||||||||||||||||||||||
10 - Contributions and investments from sponsor |
— | — | — | — | — | — | ||||||||||||||||||||||||||||||
|
|
|
|
|
|
|
|
|
|
|
|
|
|
|
|
|
|
|||||||||||||||||||
Amounts at end of the period |
( |
) |
( |
) |
( |
) |
( |
) |
( |
) |
( |
) | ||||||||||||||||||||||||
|
|
|
|
|
|
|
|
|
|
|
|
|
|
|
|
|
|
|||||||||||||||||||
Amount recognized in Assets (Note 18a) |
— | |||||||||||||||||||||||||||||||||||
Amount recognized in Liabilities (Note 18b) |
( |
) | — | ( |
) | ( |
) | |||||||||||||||||||||||||||||
|
|
|
|
|
|
|
|
12/31/2020 |
||||||||||||||||||||||||||||||||||||
BD and CV plans |
CD plans |
Other post- employment benefits Liabilities |
Total Recognized amount |
|||||||||||||||||||||||||||||||||
Net assets |
Actuarial liabilities |
Asset ceiling |
Recognized amount |
Pension plan fund |
Asset ceiling |
Recognized amount |
||||||||||||||||||||||||||||||
Amounts at the beginning of the period |
( |
) |
( |
) |
( |
) |
( |
) |
( |
) |
( |
) | ||||||||||||||||||||||||
|
|
|
|
|
|
|
|
|
|
|
|
|
|
|
|
|
|
|||||||||||||||||||
Amounts recognized in income (1+2+3+4) |
( |
) |
( |
) |
( |
) |
( |
) |
( |
) |
( |
) |
( |
) | ||||||||||||||||||||||
1 - Cost of current service |
— | ( |
) | — | ( |
) | — | — | — | — | ( |
) | ||||||||||||||||||||||||
2 - Cost of past service |
( |
) | — | ( |
) | — | — | — | — | ( |
) | |||||||||||||||||||||||||
3 - Net interest (1) |
( |
) | ( |
) | ( |
) | ( |
) | ( |
) | ( |
) | ||||||||||||||||||||||||
4 - Other expenses (2) |
— | — | — | — | ( |
) | — | ( |
) | — | ( |
) | ||||||||||||||||||||||||
Amounts recognized in stockholders´ equity - other comprehensive income (5+6+7) |
( |
) |
( |
) |
( |
) |
( |
) |
( |
) |
( |
) |
( |
) | ||||||||||||||||||||||
5 - Effects on asset ceiling |
— | — | — | ( |
) | ( |
) | — | ||||||||||||||||||||||||||||
6 - Remeasurements |
( |
) | ( |
) | — | ( |
) | ( |
) | — | ( |
) | ( |
) | ||||||||||||||||||||||
Changes in demographic assumptions |
— | ( |
) | — | ( |
) | — | — | — | — | ( |
) | ||||||||||||||||||||||||
Changes in financial assumptions |
— | — | — | — | — | |||||||||||||||||||||||||||||||
Experience of the plan (3) |
( |
) | ( |
) | — | ( |
) | ( |
) | — | ( |
) | ( |
) | ( |
) | ||||||||||||||||||||
7 - Exchange variation |
( |
) | — | ( |
) | — | — | — | — | ( |
) | |||||||||||||||||||||||||
Other (8+9) |
( |
) |
— |
— |
— |
— |
||||||||||||||||||||||||||||||
8 - Benefits paid |
( |
) | — | — | — | — | — | |||||||||||||||||||||||||||||
9 - Contributions and investments from sponsor |
— | — | — | — | — | — | ||||||||||||||||||||||||||||||
|
|
|
|
|
|
|
|
|
|
|
|
|
|
|
|
|
|
|||||||||||||||||||
Amounts at end of the period |
( |
) |
( |
) |
( |
) |
( |
) |
( |
) |
( |
) | ||||||||||||||||||||||||
|
|
|
|
|
|
|
|
|
|
|
|
|
|
|
|
|
|
|||||||||||||||||||
Amount recognized in Assets (Note 18a) |
— | |||||||||||||||||||||||||||||||||||
Amount recognized in Liabilities (Note 18b) |
( |
) | — | ( |
) | ( |
) | |||||||||||||||||||||||||||||
|
|
|
|
|
|
|
|
(1) |
Corresponds to the amount calculated on 01/01/2021 based on the initial amount (Net Assets, Actuarial Liabilities and Restriction of Assets), taking into account the estimated amount of payments/ receipts of benefits/ contributions, multiplied by the discount rate of |
(2) |
Corresponds to the use of asset amounts allocated in pension funds of the defined contribution plans. |
(3) |
Correspond to the income obtained above/below the expected return and comprise the contributions made by participants. |
(4) |
Includes the effects of the allocation of the surplus from the pension fund of Itaubanco Defined Contribution Plan. |
Estimated contribution |
Contributions made |
|||||||||||
2022 |
01/01 to 12/31/2021 |
01/01 to 12/31/2020 |
||||||||||
Retirement plan - FIU |
||||||||||||
Retiremente plan - FUNBEP |
||||||||||||
|
|
|
|
|
|
|||||||
Total |
||||||||||||
|
|
|
|
|
|
Duration (*) |
2022 |
2023 |
2024 |
2025 |
2026 |
2027 to 2031 |
||||||||||||||||||||||
Pension plan - FIU |
||||||||||||||||||||||||||||
Pension plan - FUNBEP |
||||||||||||||||||||||||||||
Other post-employment benefits |
||||||||||||||||||||||||||||
|
|
|
|
|
|
|
|
|
|
|
|
|||||||||||||||||
Total |
||||||||||||||||||||||||||||
|
|
|
|
|
|
|
|
|
|
|
|
(*) |
Average duration of plan´s actuarial liabilities. |
BD and CV plans |
Other post-employment benefits |
|||||||||||||||||||||||
Main assumptions |
Present value of liability |
Income |
Stockholders´ equity (Other Comprehensive Income) (*) |
Present value of liability |
Income |
Stockholders´ equity (Other Comprehensive Income) (*) |
||||||||||||||||||
Discount rate |
||||||||||||||||||||||||
Increase by |
( |
) | — | ( |
) | — | ||||||||||||||||||
Decrease by |
— | ( |
) | — | ( |
) | ||||||||||||||||||
Mortality table |
||||||||||||||||||||||||
Increase by |
( |
) | — | ( |
) | — | ||||||||||||||||||
Decrease by |
— | ( |
) | — | ( |
) | ||||||||||||||||||
Medical inflation |
||||||||||||||||||||||||
Increase by |
— | — | — | — | ( |
) | ||||||||||||||||||
Decrease by |
— | — | — | ( |
) | — |
(*) |
Net of effects of asset ceiling |
• | PGBL – Free Benefit Generating Plan: |
• | VGBL - Free Benefit Generating Life Plan: |
• | FGB – Benefit Generating Fund: |
• | Provision for unearned premiums (PPNG) - |
• | Provision for unsettled claims (PSL) - past-due income, all gross of reinsurance operations and net of coinsurance operations, when applicable. When necessary, it must cover adjustments for IBNER (claims incurred but not sufficiently reported) for the total of claims reported but not yet paid, a total which may change during the process up to final settlement; |
• | Provision for claims incurred and not reported (IBNR) - |
• | Mathematical provisions for benefits to be granted (PMBAC) - |
• | Mathematical provisions for benefits granted (PMBC) - |
• | Provision for financial surplus (PEF) - |
• | Supplemental Coverage Reserve (PCC) - |
• | Provision for redemptions and other amounts to be regularized (PVR) - |
• | Provision for related expenses (PDR) - |
Sales ratio % |
Loss ratio % |
|||||||||||||||||||||||
Main Insurance Lines |
01/01 to 12/31/2021 |
01/01 to 12/31/2020 |
01/01 to 12/31/2019 |
01/01 to 12/31/2021 |
01/01 to 12/31/2020 |
01/01 to 12/31/2019 |
||||||||||||||||||
Group Accident Insurance |
||||||||||||||||||||||||
Individual Accident Insurance |
||||||||||||||||||||||||
Credit Life Insurance |
||||||||||||||||||||||||
Random Events |
||||||||||||||||||||||||
Multiple Peril |
||||||||||||||||||||||||
Mortagage Insurance in Market Policies – Credit Life Insurance |
||||||||||||||||||||||||
Group Life |
Premiums and contributions |
||||||||||||
Main lines |
01/01 to 12/31/2021 |
01/01 to 12/31/2020 |
01/01 to 12/31/2019 |
|||||||||
Group Accident Insurance |
||||||||||||
Individual Accident Insurance |
||||||||||||
Disability Savings Pension |
||||||||||||
PGBL |
||||||||||||
Credit Life Insurance |
||||||||||||
Random Events |
||||||||||||
Multiple Peril |
||||||||||||
Mortagage Insurance in Market Policies – Credit Life Insurance |
||||||||||||
Traditional |
||||||||||||
VGBL |
||||||||||||
Group Life |
||||||||||||
Other lines |
||||||||||||
Total |
||||||||||||
|
|
|
|
|
|
12/31/2021 |
12/31/2020 |
|||||||||||||||||||||||
Insurance |
Private Pension |
Total |
Insurance |
Private Pension |
Total |
|||||||||||||||||||
Unearned premiums (PPNG) |
||||||||||||||||||||||||
Mathematical provisions for benefits to be granted (PMBAC) and granted benefits (PMBC) |
||||||||||||||||||||||||
Redemptions and Other Unsettled Amounts (PVR) |
||||||||||||||||||||||||
Financial surplus (PEF) |
||||||||||||||||||||||||
Unsettled claims (PSL) |
||||||||||||||||||||||||
Claims / events incurred but not reported (IBNR) |
||||||||||||||||||||||||
Related Expenses (PDR) |
||||||||||||||||||||||||
Other provisions |
||||||||||||||||||||||||
Total |
||||||||||||||||||||||||
|
|
|
|
|
|
|
|
|
|
|
|
|||||||||||||
Current |
||||||||||||||||||||||||
Non-current |
||||||||||||||||||||||||
|
|
|
|
|
|
|
|
|
|
|
|
12/31/2021 |
12/31/2020 |
|||||||||||||||||||||||
Insurance |
Private pension |
Total |
Insurance |
Private pension |
Total |
|||||||||||||||||||
Opening balance - 01/01 |
||||||||||||||||||||||||
(+) Additions arising from premiums / contributions |
||||||||||||||||||||||||
(-) Deferral due to elapsed risk |
( |
) | — | ( |
) | ( |
) | — | ( |
) | ||||||||||||||
(-) Payment of claims / benefits |
( |
) | ( |
) | ( |
) | ( |
) | ( |
) | ( |
) | ||||||||||||
(+) Reported claims |
— | — | ||||||||||||||||||||||
(-) Redemptions |
— | ( |
) | ( |
) | ( |
) | ( |
) | |||||||||||||||
(+/-) Net Portability |
— | ( |
) | ( |
) | — | ||||||||||||||||||
(+) Adjustment of reserves and financial surplus |
||||||||||||||||||||||||
(+/-) Other (increase / reversal) |
( |
) | ( |
) | ( |
) | ( |
) | ||||||||||||||||
(+/-) Corporate Reorganization |
— | ( |
) | — | ( |
) | ||||||||||||||||||
Closing balance |
||||||||||||||||||||||||
|
|
|
|
|
|
|
|
|
|
|
|
12/31/2021 |
12/31/2020 |
|||||||
Opening Balance - 01/01 |
||||||||
|
|
|
|
|||||
Increase |
||||||||
Amortization |
( |
) | ( |
) | ||||
|
|
|
|
|||||
Closing Balance |
||||||||
|
|
|
|
|||||
Balance to be amortized in up to 12 months |
||||||||
Balance to be amortized after 12 months |
||||||||
|
|
|
|
Provision for unsettled claims (PSL) |
||||
(-) IBNER |
||||
(-) Reinsurance |
||||
(-) Retrocession and other estimates |
||||
Liability claims presented in the claims development table (a + b) |
||||
|
|
Occurrence date |
12/31/2017 |
12/31/2018 |
12/31/2019 |
12/31/2020 |
12/31/2021 |
Total |
||||||||||||||||||
At the end of reporting period |
||||||||||||||||||||||||
After 1 year |
||||||||||||||||||||||||
After 2 years |
||||||||||||||||||||||||
After 3 years |
||||||||||||||||||||||||
After 4 years |
||||||||||||||||||||||||
Current estimate |
||||||||||||||||||||||||
Accumulated payments through base date |
||||||||||||||||||||||||
Liabilities recognized in the balance sheet |
||||||||||||||||||||||||
Liabilities in relation to prior periods |
||||||||||||||||||||||||
Total administratives claims |
||||||||||||||||||||||||
|
|
Occurrence date |
12/31/2017 |
12/31/2018 |
12/31/2019 |
12/31/2020 |
12/31/2021 |
Total |
||||||||||||||||||
At the end of reporting period |
||||||||||||||||||||||||
After 1 year |
||||||||||||||||||||||||
After 2 years |
||||||||||||||||||||||||
After 3 years |
||||||||||||||||||||||||
After 4 years |
||||||||||||||||||||||||
Current estimate |
||||||||||||||||||||||||
Accumulated payments through base date |
||||||||||||||||||||||||
Liabilities recognized in the balance sheet |
||||||||||||||||||||||||
Liabilities in relation to prior periods |
||||||||||||||||||||||||
Total judicial claims |
||||||||||||||||||||||||
|
|
12/31/2021 |
12/31/2020 |
|||||||||||||||||||
Book value |
Fair value |
Book value |
Fair value (*) |
|||||||||||||||||
Financial assets |
||||||||||||||||||||
At Amortized Cost |
||||||||||||||||||||
Central Bank compulsory deposits |
(a | ) | ||||||||||||||||||
Interbank deposits |
(b | ) | ||||||||||||||||||
Securities purchased under agreements to resell |
(a | ) | ||||||||||||||||||
Voluntary investments with the Central Bank of Brazil |
(a | ) | — | — | ||||||||||||||||
Securities |
(c | ) | ||||||||||||||||||
Loan and Financial Lease |
(d | ) | ||||||||||||||||||
Other financial assets |
(e | ) | ||||||||||||||||||
(-) Provision for Expected Loss |
( |
) | ( |
) | ( |
) | ( |
) | ||||||||||||
At Fair Value Through Other Comprehensive Income |
||||||||||||||||||||
Securities |
(c | ) | ||||||||||||||||||
At Fair Value Through Profit or Loss |
||||||||||||||||||||
Securities |
(c | ) | ||||||||||||||||||
Derivatives |
(c | ) | ||||||||||||||||||
Other financial assets |
||||||||||||||||||||
Financial liabilities |
||||||||||||||||||||
At Amortized Cost |
||||||||||||||||||||
Deposits |
(b | ) | ||||||||||||||||||
Securities sold under repurchase agreements |
(a | ) | ||||||||||||||||||
Interbank market funds |
(b | ) | ||||||||||||||||||
Institutional market funds |
(b | ) | ||||||||||||||||||
Other financial liabilities |
(e | ) | ||||||||||||||||||
At Fair Value Through Profit or Loss |
||||||||||||||||||||
Derivatives |
(c | ) | ||||||||||||||||||
Structured notes |
||||||||||||||||||||
Other financial liabilities |
||||||||||||||||||||
Provision for Expected Loss |
||||||||||||||||||||
Loan Commitments |
||||||||||||||||||||
Financial Guarantees |
(*) |
In the period, the result of Derivatives, as well as Adjustment to Fair Value of Financial Assets (particularly private securities) had their amounts affected by oscillations of rates and other market variables arising from the impact of the COVID-19 pandemic on the macroeconomic scenario in the period (Note 33a). |
a) |
Central Bank deposits, Securities purchased under agreements to resell and Securities sold under repurchase agreements – |
b) |
Interbank deposits, Deposits, Interbank and Institutional Market Funds – |
c) |
Securities and Derivatives – |
d) |
Loans and financial leases – |
e) |
Other financial assets / liabilities |
12/31/2021 |
12/31/2020 | |||||||||||||||||||||||||||||||||||||||
Level 1 |
Level 2 |
Level 3 |
Total |
Level 1 |
Level 2 |
Level 3 |
Total | |||||||||||||||||||||||||||||||||
Financial assets at fair value through profit or loss |
||||||||||||||||||||||||||||||||||||||||
|
|
|
|
|
|
|
|
|
|
|
|
|
|
|
|
|||||||||||||||||||||||||
Investment funds |
— | — | ||||||||||||||||||||||||||||||||||||||
Brazilian government securities |
— | — | ||||||||||||||||||||||||||||||||||||||
Government securities – other countries |
— |
— |
— |
— |
||||||||||||||||||||||||||||||||||||
|
|
|
|
|
|
|
|
|
|
|
|
|
|
|
|
|||||||||||||||||||||||||
Argentina |
— | — | — | — | ||||||||||||||||||||||||||||||||||||
Chile |
— | — | — | — | ||||||||||||||||||||||||||||||||||||
Colombia |
— | — | — | — | ||||||||||||||||||||||||||||||||||||
United States |
— | — | — | — | ||||||||||||||||||||||||||||||||||||
Italy |
— | — | — | — | — | — | ||||||||||||||||||||||||||||||||||
Mexico |
— | — | — | — | ||||||||||||||||||||||||||||||||||||
Paraguay |
— | — | — | — | ||||||||||||||||||||||||||||||||||||
Peru |
— | — | — | — | ||||||||||||||||||||||||||||||||||||
Uruguay |
— | — | — | — | ||||||||||||||||||||||||||||||||||||
Corporate securities |
||||||||||||||||||||||||||||||||||||||||
|
|
|
|
|
|
|
|
|
|
|
|
|
|
|
|
|||||||||||||||||||||||||
Shares |
— | — | ||||||||||||||||||||||||||||||||||||||
Rural product note |
— | — | ||||||||||||||||||||||||||||||||||||||
Bank deposit certificates |
— | — | — | — | ||||||||||||||||||||||||||||||||||||
Real estate receivables certificates |
— | — | — | |||||||||||||||||||||||||||||||||||||
Debentures |
||||||||||||||||||||||||||||||||||||||||
Eurobonds and others |
— | — | ||||||||||||||||||||||||||||||||||||||
Financial bills |
— | — | ||||||||||||||||||||||||||||||||||||||
Promissory and commercial notes |
— | — | — | — | ||||||||||||||||||||||||||||||||||||
Other |
— | — | ||||||||||||||||||||||||||||||||||||||
Other Financial Assets |
— | — | — | — | ||||||||||||||||||||||||||||||||||||
Financial assets at fair value through other comprehensive income |
— |
— |
||||||||||||||||||||||||||||||||||||||
|
|
|
|
|
|
|
|
|
|
|
|
|
|
|
|
|||||||||||||||||||||||||
Brazilian government securities |
— | — | ||||||||||||||||||||||||||||||||||||||
Government securities – other countries |
— |
— |
— |
— |
||||||||||||||||||||||||||||||||||||
|
|
|
|
|
|
|
|
|
|
|
|
|
|
|
|
|||||||||||||||||||||||||
Argentina |
— | — | — | — | — | — | ||||||||||||||||||||||||||||||||||
Chile |
— | — | — | — | ||||||||||||||||||||||||||||||||||||
Colombia |
— | — | — | — | ||||||||||||||||||||||||||||||||||||
United States |
— | — | — | — | ||||||||||||||||||||||||||||||||||||
Mexico |
— | — | — | — | ||||||||||||||||||||||||||||||||||||
Paraguay |
— | — | — | — | ||||||||||||||||||||||||||||||||||||
Uruguay |
— | — | — | — | ||||||||||||||||||||||||||||||||||||
Corporate securities |
— |
— |
||||||||||||||||||||||||||||||||||||||
|
|
|
|
|
|
|
|
|
|
|
|
|
|
|
|
|||||||||||||||||||||||||
Shares |
— | — | — | — | ||||||||||||||||||||||||||||||||||||
Bank deposit certificates |
— | — | — | |||||||||||||||||||||||||||||||||||||
Debentures |
— | — | ||||||||||||||||||||||||||||||||||||||
Eurobonds and others |
— | — | ||||||||||||||||||||||||||||||||||||||
Financial credit bills |
— | — | — | — | — | — | ||||||||||||||||||||||||||||||||||
Other |
— | — | — | — | — | — | ||||||||||||||||||||||||||||||||||
Financial assets designated at fair value through profit or loss |
— |
— |
— |
— |
||||||||||||||||||||||||||||||||||||
|
|
|
|
|
|
|
|
|
|
|
|
|
|
|
|
|||||||||||||||||||||||||
Brazilian external debt bonds |
— | — | — | — | ||||||||||||||||||||||||||||||||||||
Financial liabilities at fair value through profit or loss |
— |
161 |
— |
161 |
— |
5 |
— |
5 |
||||||||||||||||||||||||||||||||
|
|
|
|
|
|
|
|
|
|
|
|
|
|
|
|
|||||||||||||||||||||||||
Other financial liabilities |
— | — | — | — | ||||||||||||||||||||||||||||||||||||
Financial liabilities designated at fair value through profit or loss |
— |
— |
— |
— |
||||||||||||||||||||||||||||||||||||
|
|
|
|
|
|
|
|
|
|
|
|
|
|
|
|
|||||||||||||||||||||||||
Structured notes |
— | — | — | — |
12/31/2021 |
12/31/2020 |
|||||||||||||||||||||||||||||||
Level 1 |
Level 2 |
Level 3 |
Total |
Level 1 |
Level 2 |
Level 3 |
Total |
|||||||||||||||||||||||||
Assets |
||||||||||||||||||||||||||||||||
|
|
|
|
|
|
|
|
|
|
|
|
|
|
|
|
|||||||||||||||||
Swap Contracts – adjustment receivable |
— | — | ||||||||||||||||||||||||||||||
Option Contracts |
||||||||||||||||||||||||||||||||
Forward Contracts |
— | — | — | — | ||||||||||||||||||||||||||||
Credit derivatives |
— | — | — | — | ||||||||||||||||||||||||||||
NDF - Non Deliverable Forward |
— | — | — | — | ||||||||||||||||||||||||||||
Other derivative financial instruments |
|
— | — | |||||||||||||||||||||||||||||
|
|
|
|
|
|
|
|
|
|
|
|
|
|
|
|
|||||||||||||||||
Liabilities |
( |
) |
( |
) |
( |
) |
( |
) |
( |
) |
( |
) |
( |
) |
( |
) | ||||||||||||||||
|
|
|
|
|
|
|
|
|
|
|
|
|
|
|
|
|||||||||||||||||
Swap Contracts – adjustment payable |
— | ( |
) | ( |
) | ( |
) | — | ( |
) | ( |
) | ( |
) | ||||||||||||||||||
Option Contracts |
( |
) | ( |
) | ( |
) | ( |
) | ( |
) | ( |
) | ( |
) | ( |
) | ||||||||||||||||
Forward Contracts |
— | ( |
) | — | ( |
) | — | ( |
) | — | ( |
) | ||||||||||||||||||||
Credit derivatives |
— | ( |
) | — | ( |
) | — | ( |
) | — | ( |
) | ||||||||||||||||||||
NDF - Non Deliverable Forward |
— | ( |
) | — | ( |
) | — | ( |
) | — | ( |
) | ||||||||||||||||||||
Other derivative financial instruments |
( |
) | ( |
) | — | ( |
) | ( |
) | ( |
) | — | ( |
) |
Total gains or losses (realized / unrealized) |
||||||||||||||||||||||||||||||||
Fair value at 12/31/2020 |
Recognized in income |
Recognized in other comprehensive income |
Purchases |
Settlements |
Transfers in and /or out of Level |
Fair value at 12/31/2021 |
Total Gains or Losses (Unrealized) |
|||||||||||||||||||||||||
Financial assets at fair value through profit or loss |
( |
) |
— |
( |
) |
( |
) |
( |
) | |||||||||||||||||||||||
|
|
|
|
|
|
|
|
|
|
|
|
|
|
|
|
|||||||||||||||||
Corporate securities |
( |
) |
— |
( |
) |
( |
) |
( |
) | |||||||||||||||||||||||
Real estate receivables certificates |
( |
) | — | ( |
) | ( |
) | — | ||||||||||||||||||||||||
Debentures |
( |
) | — | ( |
) | ( |
) | ( |
) | |||||||||||||||||||||||
Rural Product Note |
( |
) | — | ( |
) | ( |
) | — | ||||||||||||||||||||||||
Eurobonds and other |
— | ( |
) | — | ( |
) | — | ( |
) | |||||||||||||||||||||||
Financial bills |
( |
) | — | — | ( |
) | — |
Total gains or losses (realized / unrealized) |
||||||||||||||||||||||||||||||||
Fair value at 12/31/2020 |
Recognized in income |
Recognized in other comprehensive income |
Purchases |
Settlements |
Transfers in and / or out of Level |
Fair value at 12/31/2021 |
Total Gains or Losses (Unrealized) |
|||||||||||||||||||||||||
Derivatives – assets |
— |
( |
) |
( |
) |
|||||||||||||||||||||||||||
|
|
|
|
|
|
|
|
|
|
|
|
|
|
|
|
|||||||||||||||||
Swap Contracts – adjustment receivable |
— | ( |
) | ( |
) | |||||||||||||||||||||||||||
Option Contracts |
— | ( |
) | — | ( |
) | ||||||||||||||||||||||||||
Derivatives – liabilities |
( |
) |
— |
( |
) |
( |
) |
( |
) |
( |
) | |||||||||||||||||||||
|
|
|
|
|
|
|
|
|
|
|
|
|
|
|
|
|||||||||||||||||
Swap Contracts – adjustment payable |
( |
) | — | ( |
) | ( |
) | ( |
) | ( |
) | |||||||||||||||||||||
Option Contracts |
( |
) | — | ( |
) | — | ( |
) |
Total gains or losses (realized / unrealized) |
||||||||||||||||||||||||||||||||
Fair value at 12/31/2019 |
Recognized in income |
Recognized in other comprehensive income |
Purchases |
Settlements |
Transfers in and / or out of Level |
Fair value at 12/31/2020 |
Total Gains or Losses (Unrealized) |
|||||||||||||||||||||||||
Financial assets at fair value through profit or loss |
( |
) |
— |
( |
) |
( |
) | |||||||||||||||||||||||||
Corporate securities |
( |
) |
— |
( |
) |
( |
) | |||||||||||||||||||||||||
Real estate receivables certificates |
( |
) | — | ( |
) | — | ( |
) | ||||||||||||||||||||||||
Debentures |
( |
) | — | ( |
) | ( |
) | |||||||||||||||||||||||||
Rural Product Note |
— | ( |
) | — | ( |
) | ( |
) | ( |
) | ||||||||||||||||||||||
Eurobonds and other |
( |
) | — | ( |
) | ( |
) | — | — | |||||||||||||||||||||||
Financial bills |
( |
) | — | — | ( |
) | — | — | ||||||||||||||||||||||||
Other |
( |
) | — | ( |
) | — | — | — | ||||||||||||||||||||||||
|
|
|
|
|
|
|
|
|
|
|
|
|
|
|
|
|||||||||||||||||
Financial assets at fair value through other comprehensive income |
— |
( |
) |
( |
) |
— |
— |
|||||||||||||||||||||||||
|
|
|
|
|
|
|
|
|
|
|
|
|
|
|
|
|||||||||||||||||
Corporate securities |
— | ( |
) |
( |
) |
— |
— | |||||||||||||||||||||||||
Real estate receivables certificates |
— | — | — | ( |
) | — | — | — | ||||||||||||||||||||||||
Debentures |
— | ( |
) | ( |
) | — | — | — | ||||||||||||||||||||||||
Eurobonds and other |
( |
) | ( |
) | ( |
) | — | — |
Total gains or losses (realized / unrealized) |
||||||||||||||||||||||||||||||||
Fair value at 12/31/2019 |
Recognized in income |
Recognized in other comprehensive income |
Purchases |
Settlements |
Transfers in and / or out of Level |
Fair value at 12/31/2020 |
Total Gains or Losses (Unrealized) |
|||||||||||||||||||||||||
Derivatives – Assets |
— |
( |
) |
( |
) |
|||||||||||||||||||||||||||
|
|
|
|
|
|
|
|
|
|
|
|
|
|
|
|
|||||||||||||||||
Swap Contracts – adjustment receivable |
— | ( |
) | ( |
) | |||||||||||||||||||||||||||
Option Contracts |
( |
) | — | ( |
) | ( |
) | ( |
) | |||||||||||||||||||||||
Derivatives – Liabilities |
( |
) |
( |
) |
— |
( |
) |
( |
) |
( |
) | |||||||||||||||||||||
|
|
|
|
|
|
|
|
|
|
|
|
|
|
|
|
|||||||||||||||||
Swap Contracts – adjustment payable |
( |
) | ( |
) | — | ( |
) | ( |
) | ( |
) | |||||||||||||||||||||
Option Contracts |
( |
) | ( |
) | — | ( |
) | ( |
) | ( |
) | — |
Sensitivity – Level 3 Operations |
12/31/2021 |
12/31/2020 |
||||||||||||||||
Impact |
Impact |
|||||||||||||||||
Market risk factor groups |
Scenarios |
Income |
Stockholders’ equity |
Income |
Stockholders’ equity |
|||||||||||||
Interest rates |
I |
( |
) | ( |
) | |||||||||||||
II |
( |
) | ( |
) | ||||||||||||||
III |
( |
) | ( |
) | ||||||||||||||
|
|
|
|
|
|
|
|
|
||||||||||
Commodities, Index and Shares |
I |
|||||||||||||||||
II |
||||||||||||||||||
|
|
|
|
|
|
|
|
|
||||||||||
Nonlinear |
I |
( |
) | ( |
) | |||||||||||||
II |
( |
) | ( |
) | ||||||||||||||
|
|
|
|
|
|
|
|
|
12/31/2021 |
||||||||||||||||
Civil |
Labor |
Other Risks |
Total |
|||||||||||||
Opening balance – 01/01 |
||||||||||||||||
(-) Provisions guaranteed by indemnity clause (Note 2.4.n) |
( |
) | ( |
) | — | ( |
) | |||||||||
Subtotal |
||||||||||||||||
Adjustment / Interest (Note 23) |
— | |||||||||||||||
Changes in the period reflected in income (Note 23) |
||||||||||||||||
|
|
|
|
|
|
|
|
|||||||||
Increase |
||||||||||||||||
Reversal |
( |
) | ( |
) | ( |
) | ( |
) | ||||||||
Payment |
( |
) | ( |
) | ( |
) | ( |
) | ||||||||
Subtotal |
||||||||||||||||
(+) Provisions guaranteed by indemnity clause (Note 2.4.n) |
— | |||||||||||||||
Closing balance |
||||||||||||||||
|
|
|
|
|
|
|
|
|||||||||
Current |
||||||||||||||||
Non-current |
— |
|||||||||||||||
|
|
|
|
|
|
|
|
12/31/2020 |
||||||||||||||||
Civil |
Labor |
Other Risks |
Total |
|||||||||||||
Opening balance – 01/01 |
||||||||||||||||
(-) Provisions guaranteed by indemnity clause (Note 2.4.n) |
( |
) | ( |
) | — | ( |
) | |||||||||
Subtotal |
||||||||||||||||
Adjustment / Interest (Note 23) |
— | |||||||||||||||
Changes in the period reflected in income (Note 23) |
||||||||||||||||
|
|
|
|
|
|
|
|
|||||||||
Increase |
||||||||||||||||
Reversal |
( |
) | ( |
) | ( |
) | ( |
) | ||||||||
Payment |
( |
) | ( |
) | ( |
) | ( |
) | ||||||||
Subtotal |
||||||||||||||||
(+) Provisions guaranteed by indemnity clause (Note 2.4.n) |
— | |||||||||||||||
Closing balance |
||||||||||||||||
|
|
|
|
|
|
|
|
|||||||||
Current |
||||||||||||||||
Non-current |
— |
|||||||||||||||
|
|
|
|
|
|
|
|
12/31/2021 |
12/31/2020 |
|||||||
Opening balance - 01/01 |
||||||||
(-) Provisions guaranteed by indemnity clause (Note 2.4 n) |
( |
) | ( |
) | ||||
Subtotal |
||||||||
Adjustment / Interest (*) |
||||||||
Changes in the period reflected in income |
||||||||
|
|
|
|
|||||
Increase (*) |
||||||||
Reversal (*) |
( |
) | ( |
) | ||||
Payment |
( |
) | ( |
) | ||||
Subtotal |
||||||||
(+) Provisions guaranteed by indemnity clause (Note 2.4 n) |
||||||||
Closing balance |
||||||||
|
|
|
|
|||||
Current |
||||||||
Non-current |
||||||||
|
|
|
|
(*) |
The amounts are included in the headings Tax Expenses, General and Administrative Expenses and Current Income Tax and Social Contribution. |
• | INSS – Non-compensatory Amounts – R$ non-levy of social security contribution on amounts paid as profit sharing is defended. The balance of the deposits in guarantee is R$ |
• | PIS and COFINS – Calculation Basis – R$ |
• | INSS – Non-compensatory Amounts – R$ non-levy of this contribution on these amounts, among which are profit sharing and stock options; |
• | IRPJ, CSLL, PIS and COFINS – Funding Expenses – R$ |
• | ISS – Banking Activities – R$ |
• | IRPJ and CSLL – Goodwill – Deduction – R$ |
• | PIS and COFINS – Reversal of Revenues from Depreciation in Excess – R$ |
• | IRPJ, CSLL, PIS and COFINS – Requests for Offsetting Dismissed – R$ |
• | IRPJ and CSLL – Disallowance of Losses – R$ |
12/31/2021 |
12/31/2020 |
|||||||||||||||||||
Civil |
Labor |
Tax |
Total |
Total |
||||||||||||||||
Deposits in guarantee (Note 18a) |
||||||||||||||||||||
Investment fund quotas |
||||||||||||||||||||
Surety |
||||||||||||||||||||
Insurance bond |
||||||||||||||||||||
Guarantee by government securities |
||||||||||||||||||||
|
|
|
|
|
|
|
|
|
|
|||||||||||
Total |
||||||||||||||||||||
|
|
|
|
|
|
|
|
|
|
• |
Retail Banking |
• |
Wholesale Banking |
• |
Activities with the Market + Corporation |
a) |
Basis of Presentation |
• |
Reclassification and application of managerial criteria |
• | Requirements for impairment testing of financial assets are based on the expected credit losses model; |
• | Adjustment to fair value due to reclassifications of financial assets to categories of measurement at amortized cost, at fair value through profit and loss or at fair value through other comprehensive income, as a result of the concept of business models of IFRS 9; |
• | Financial assets modified and not written-off, with their balances recalculated in accordance with the requirements of IFRS 9; |
• | Effective interest rate of financial assets and liabilities measured at amortized cost, appropriating revenues and costs directly attributable to their acquisition, issue or disposal over the transaction term, where as in the standards adopted in Brazil, recognition of expenses and revenues from fees occurs at the time these transactions are contracted; |
• | Goodwill generated in a business combination is not amortized, where as in the standards adopted in Brazil, it is amortized. |
01/01 to 12/31/2021 |
||||||||||||||||||||||||
Retail Banking |
Wholesale Banking |
Activities with the Market + Corporation |
ITAÚ UNIBANCO |
Adjustments |
IFRS consolidated (3) |
|||||||||||||||||||
Operating revenues |
||||||||||||||||||||||||
Interest margin (1) |
( |
) | ||||||||||||||||||||||
Revenues from banking services and bank charges |
||||||||||||||||||||||||
Income from insurance and private pension operations before claim and selling expenses |
( |
) | ( |
) | ||||||||||||||||||||
Other revenues |
||||||||||||||||||||||||
Cost of Credit |
( |
) |
( |
) |
( |
) |
( |
) | ||||||||||||||||
Claims |
( |
) |
( |
) |
( |
) |
( |
) | ||||||||||||||||
Operating margin |
||||||||||||||||||||||||
Other operating income / (expenses) |
( |
) |
( |
) |
( |
) |
( |
) |
( |
) |
( |
) | ||||||||||||
Non-interest expenses (2) |
( |
) | ( |
) | ( |
) | ( |
) | ( |
) | ( |
) | ||||||||||||
Tax expenses for ISS, PIS and COFINS and Other |
( |
) | ( |
) | ( |
) | ( |
) | ( |
) | ( |
) | ||||||||||||
Share of profit or (loss) in associates and joint ventures |
||||||||||||||||||||||||
Income before income tax and social contribution |
( |
) |
||||||||||||||||||||||
Income tax and social contribution |
( |
) | ( |
) | ( |
) | ( |
) | ( |
) | ||||||||||||||
Non-controlling interest in subsidiaries |
( |
) | ( |
) | ( |
) | ( |
) | ( |
) | ( |
) | ||||||||||||
Net income |
( |
) |
||||||||||||||||||||||
|
|
|
|
|
|
|
|
|
|
|
|
|||||||||||||
Total assets (*) – 12/31/2021 |
( |
) |
||||||||||||||||||||||
|
|
|
|
|
|
|
|
|
|
|
|
|||||||||||||
Total liabilities – 12/31/2021 |
( |
) |
||||||||||||||||||||||
|
|
|
|
|
|
|
|
|
|
|
|
|||||||||||||
(*) Includes: |
||||||||||||||||||||||||
Investments in associates and joint ventures |
( |
) | ||||||||||||||||||||||
Fixed assets, net |
||||||||||||||||||||||||
Goodwill and Intangible assets, net |
||||||||||||||||||||||||
|
|
|
|
|
|
|
|
|
|
|
|
(1) |
Includes interest and similar income and expenses of R$ |
(2) |
Refers to general and administrative expenses including depreciation and amortization expenses of R$ ( |
(3) |
The IFRS Consolidated figures do not represent the sum of the parties because there are intercompany transactions that were eliminated only in the consolidated statements. Segments are assessed by top management, net of income and expenses between related parties. |
01/01 to 12/31/2020 |
||||||||||||||||||||||||
Retail Banking |
Wholesale Banking |
Activities with the Market + Corporation |
ITAÚ UNIBANCO |
Adjustments |
IFRS consolidated (3) |
|||||||||||||||||||
Operating revenues |
( |
) |
||||||||||||||||||||||
Interest margin (1) |
( |
) | ||||||||||||||||||||||
Commissions and Banking Fees |
||||||||||||||||||||||||
Income from insurance and private pension operations before claim and selling expenses |
( |
) | ||||||||||||||||||||||
Other revenues |
||||||||||||||||||||||||
Cost of Credit |
( |
) |
( |
) |
( |
) |
( |
) | ||||||||||||||||
Claims |
( |
) |
( |
) |
( |
) |
( |
) |
( |
) | ||||||||||||||
Operating margin |
( |
) |
||||||||||||||||||||||
Other operating income / (expenses) |
( |
) |
( |
) |
( |
) |
( |
) |
( |
) |
( |
) | ||||||||||||
Non-interest expenses (2) |
( |
) | ( |
) | ( |
) | ( |
) | ( |
) | ( |
) | ||||||||||||
Tax expenses for ISS, PIS and COFINS and Other |
( |
) | ( |
) | ( |
) | ( |
) | ( |
) | ||||||||||||||
Share of profit or (loss) in associates and joint ventures |
||||||||||||||||||||||||
Income before income tax and social contribution |
( |
) |
||||||||||||||||||||||
Income tax and social contribution |
( |
) | ( |
) | ( |
) | ( |
) | ||||||||||||||||
Non-controlling interest in subsidiaries |
( |
) | ( |
) | ||||||||||||||||||||
Net income |
||||||||||||||||||||||||
|
|
|
|
|
|
|
|
|
|
|
|
|||||||||||||
Total assets (*) - 12/31/2020 |
( |
) |
||||||||||||||||||||||
|
|
|
|
|
|
|
|
|
|
|
|
|||||||||||||
Total liabilities - 12/31/2020 |
( |
) |
||||||||||||||||||||||
|
|
|
|
|
|
|
|
|
|
|
|
|||||||||||||
(*) Includes: |
||||||||||||||||||||||||
Investments in associates and joint ventures |
( |
) | ||||||||||||||||||||||
Fixed assets, net |
||||||||||||||||||||||||
Goodwill and Intangible assets, net |
||||||||||||||||||||||||
|
|
|
|
|
|
|
|
|
|
|
|
(1) |
Includes interest and similar income and expenses of R$ |
(2) |
Refers to general and administrative expenses including depreciation and amortization expenses of R$ ( |
(3) |
The IFRS Consolidated figures do not represent the sum of the segments because there are intercompany transactions that were eliminated only in the consolidated financial statements. Segments are assessed by top management, net of income and expenses between related parties. |
01/01 to 12/31/2019 |
||||||||||||||||||||||||
Retail Banking |
Wholesale Banking |
Activities with the Market + Corporation |
ITAÚ UNIBANCO |
Adjustments |
IFRS consolidated (3) |
|||||||||||||||||||
Operating revenues |
( |
) |
||||||||||||||||||||||
Interest margin (1) |
( |
) | ||||||||||||||||||||||
Commissions and Banking Fees |
||||||||||||||||||||||||
Income from insurance and private pension operations before claim and selling expenses |
( |
) | ||||||||||||||||||||||
Other revenues |
||||||||||||||||||||||||
Cost of Credit |
( |
) |
( |
) |
— |
( |
) |
( |
) | |||||||||||||||
Claims |
( |
) |
( |
) |
— |
( |
) |
( |
) |
( |
) | |||||||||||||
Operating margin |
( |
) |
||||||||||||||||||||||
Other operating income / (expenses) |
( |
) |
( |
) |
( |
) |
( |
) |
( |
) |
( |
) | ||||||||||||
Non-interest expenses (2) |
( |
) | ( |
) | ( |
) | ( |
) | ( |
) | ( |
) | ||||||||||||
Tax expenses for ISS, PIS and COFINS and Other |
( |
) | ( |
) | ( |
) | ( |
) | ( |
) | ( |
) | ||||||||||||
Share of profit or (loss) in associates and joint ventures |
— | — | — | — | ||||||||||||||||||||
Net income before income tax and social contribution |
( |
) |
||||||||||||||||||||||
Income tax and social contribution |
( |
) | ( |
) | ( |
) | ( |
) | ( |
) | ||||||||||||||
Non-controlling interest in subsidiaries |
( |
) | ( |
) | ( |
) | ( |
) | ( |
) | ( |
) | ||||||||||||
Net income |
( |
) |
||||||||||||||||||||||
|
|
|
|
|
|
|
|
|
|
|
|
|||||||||||||
Total assets (*) – 12/31/2019 |
( |
) |
||||||||||||||||||||||
|
|
|
|
|
|
|
|
|
|
|
|
|||||||||||||
Total liabilities – 12/31/2019 |
( |
) |
||||||||||||||||||||||
|
|
|
|
|
|
|
|
|
|
|
|
|||||||||||||
(*) Includes: |
||||||||||||||||||||||||
Investments in associates and joint ventures |
— | ( |
) | |||||||||||||||||||||
Fixed assets, net |
— | |||||||||||||||||||||||
Goodwill and Intangible assets, net |
— | |||||||||||||||||||||||
|
|
|
|
|
|
|
|
|
|
|
|
(1) |
Includes interest and similar income and expenses of R$ |
(2) |
Refers to general and administrative expenses including depreciation and amortization expenses of R$ ( |
(3) |
The IFRS Consolidated figures do not represent the sum of the segments because there are intercompany transactions that were eliminated only in the consolidated financial statements. Segments are assessed by top management, net of income and expenses between related parties. |
12/31/2021 |
12/31/2020 |
|||||||||||||||||||||||
Brazil |
Abroad |
Total |
Brazil |
Abroad |
Total |
|||||||||||||||||||
Non-current assets |
01/01 to 12/31/2021 |
01/01 to 12/31/2020 |
01/01 to 12/31/2019 |
||||||||||||||||||||||||||||||||||
Brazil |
Abroad |
Total |
Brazil |
Abroad |
Total |
Brazil |
Abroad |
Total |
||||||||||||||||||||||||||||
Income related to financial operations (1) (2) |
||||||||||||||||||||||||||||||||||||
Income from insurance and private pension operations before claim and selling expenses |
||||||||||||||||||||||||||||||||||||
Commissions and Banking Fees |
(1) |
Includes interest and similar income, result of financial assets and liabilities at fair value through profit or loss and foreign exchange results and exchange variations in foreign transactions. |
(2) |
ITAÚ UNIBANCO HOLDING does not have customers representing |
• | Itaú Unibanco Participações S.A. (IUPAR), Companhia E. Johnston de Participações S.A. (shareholder of IUPAR) and ITAÚSA, direct and indirect shareholders of ITAÚ UNIBANCO HOLDING. |
• | The associates, non-financial subsidiaries and joint ventures of ITAÚSA, in particular Dexco S.A. (1) , Copagaz – Distribuidora de Gás S.A., Aegea Saneamento e Participações S.A., Águas do Rio 1 SPE S.A., Águas do Rio 4 SPE S.A., Alpargatas S.A. and XP Inc. (Note 3). |
• | Investments in associates and joint ventures, in particular Porto Seguro Itaú Unibanco Participações S.A., BSF Holding S.A. and XP Inc. (Note 3). |
• | Pension Plans: Fundação Itaú Unibanco – Previdência Complementar and FUNBEP – Fundo de Pensão Multipatrocinado, closed-end supplementary pension entities, that administer retirement plans sponsored by ITAÚ UNIBANCO HOLDING, created exclusively for employees. |
• | Associations: Associação Cubo Coworking Itaú – a partner entity of ITAÚ UNIBANCO HOLDING its purpose is to encourage and promote the discussion and development of alternative and innovative technologies, business models and solutions; the produce and disseminate the resulting technical and scientific knowledge; the attract and bring in new information technology talents that may be characterized as startups; and to research, develop and establish ecosystems for entrepreneur and startups. |
• | Foundations and Institutes maintained by donations from ITAÚ UNIBANCO HOLDING and by the proceeds generated by their assets, so that they can accomplish their objectives and to maintain their operational and administrative structure: |
ITAÚ UNIBANCO HOLDING |
||||||||||||||||||||||
Annual rate |
Assets / (Liabilities) |
Revenues / (Expenses) |
||||||||||||||||||||
12/31/2021 |
12/31/2020 |
01/01 to 12/31/2021 |
01/01 to 12/31/2020 |
01/01 to 12/31/2019 |
||||||||||||||||||
Interbank investments |
||||||||||||||||||||||
Other |
||||||||||||||||||||||
Loan operations |
||||||||||||||||||||||
Dexco S.A. |
CDI + 1.45 % |
— | ||||||||||||||||||||
Other |
||||||||||||||||||||||
Securities and derivative financial instruments (assets and liabilities) |
— |
|||||||||||||||||||||
Investment funds |
— | |||||||||||||||||||||
Copagaz – Distribuidora de Gás S.A. |
— | |||||||||||||||||||||
Itaúsa S.A. |
— | |||||||||||||||||||||
Águas do Rio 4 SPE S.A. |
— | — | — | |||||||||||||||||||
Aegea Saneamento e Participações S.A. |
— | — | — | |||||||||||||||||||
Other |
( |
) | ( |
) | — | |||||||||||||||||
Deposits |
— |
— |
( |
) |
( |
) |
( |
) | ||||||||||||||
Other |
— | — | ( |
) | ( |
) | ( |
) | ||||||||||||||
Deposits received under securities repurchase agreements |
( |
) |
( |
) |
( |
) |
( |
) |
( |
) | ||||||||||||
Alpargatas S.A. |
( |
) | ( |
) | ( |
) | ( |
) | — | |||||||||||||
Dexco S.A. |
( |
) | ( |
) | ( |
) | ( |
) | ( |
) | ||||||||||||
Águas do Rio 4 SPE S.A. |
( |
) | — | ( |
) | — | — | |||||||||||||||
Águas do Rio 1 SPE S.A. |
( |
) | — | ( |
) | — | — | |||||||||||||||
Aegea Saneamento e Participações S.A. |
( |
) | — | ( |
) | — | — | |||||||||||||||
Other |
( |
) | ( |
) | ( |
) | — | ( |
) | |||||||||||||
Amounts receivable (payable) / Commissions and/or Other General and Administrative expenses |
( |
) |
( |
) |
( |
) |
||||||||||||||||
Instituto Unibanco |
— | — | ||||||||||||||||||||
Fundação Itaú Unibanco – Previdência Complementar |
( |
) | ( |
) | ||||||||||||||||||
ConectCar Soluções de Mobilidade Eletrônica S.A. |
( |
) | ( |
) | ( |
) | ||||||||||||||||
Olímpia Promoção e Serviços S.A. |
( |
) | ( |
) | — | ( |
) | ( |
) | |||||||||||||
FUNBEP—Fundo de Pensão Multipatrocinado |
( |
) | ( |
) | ( |
) | ||||||||||||||||
Itaúsa S.A. |
( |
) | ( |
) | ||||||||||||||||||
Águas do Rio 4 SPE S.A. |
( |
) | — | — | — | — | ||||||||||||||||
Águas do Rio 1 SPE S.A. |
( |
) | — | — | — | — | ||||||||||||||||
Other |
( |
) | — | |||||||||||||||||||
Rent |
— |
— |
( |
) |
( |
) |
( |
) | ||||||||||||||
Fundação Itaú Unibanco – Previdência Complementar |
— | — | ( |
) | ( |
) | ( |
) | ||||||||||||||
FUNBEP – Fundo de Pensão Multipatrocinado |
— | — | ( |
) | ( |
) | ( |
) | ||||||||||||||
Other |
— | — | — | — | ( |
) | ||||||||||||||||
Donation |
— |
( |
) |
— |
( |
) |
( |
) | ||||||||||||||
Fundação Itaú para a Educação e Cultura |
— | ( |
) | — | ( |
) | ( |
) | ||||||||||||||
Other |
— | — | — | ( |
) | — | ||||||||||||||||
Sponsorship |
( |
) |
( |
) |
( |
) | ||||||||||||||||
Associação Cubo Coworking Itaú |
( |
) | ( |
) | ( |
) | ||||||||||||||||
Other |
— | — | — | — | ( |
) |
01/01 to 12/31/2021 |
01/01 to 12/31/2020 |
01/01 to 12/31/2019 |
||||||||||
Fees |
( |
) | ( |
) | ( |
) | ||||||
Profit sharing |
( |
) | ( |
) | ( |
) | ||||||
Post-employment benefits |
( |
) | ( |
) | ( |
) | ||||||
Share-based payment plan |
( |
) | ( |
) | ( |
) | ||||||
|
|
|
|
|
|
|||||||
Total |
( |
) |
( |
) |
( |
) | ||||||
|
|
|
|
|
|
b) |
Risk Management |
• | Capitalization: |
• | Liquidity: |
• | Composition of results: |
• | Operational risk: |
• | Reputation: |
• | Sustainability and customer satisfaction: |
• | Risk culture: |
• | Risk pricing: |
• | Diversification: |
• | Operational excellence: |
• | Ethics and respect for regulations: non-negotiable, and it |
12/31/2021 |
12/31/2020 |
|||||||||||||||||||||||||||||||||||
Reduction/(Increase) of |
|||||||||||||||||||||||||||||||||||
Financial Assets (1) |
Expected Loss (2) |
Expected Loss |
Financial Assets (1) |
Expected Loss (2) |
Expected Loss |
|||||||||||||||||||||||||||||||
Pessimistic scenario |
Base scenario |
Optimistic scenario |
Pessimistic scenario |
Base scenario |
Optimistic scenario |
|||||||||||||||||||||||||||||||
|
( |
) | ( |
) | ( |
) | ( |
) |
(1) |
Composed of Loan operations, lease operations and securities. |
(2) |
Comprises expected credit loss for Financial Guarantees R$ ( |
• | Stage 1 to stage 2: |
• | Stage 3: |
12/31/2021 |
12/31/2020 |
|||||||||||||||||||||||
Brazil |
Abroad |
Total |
Brazil |
Abroad |
Total |
|||||||||||||||||||
Financial Assets |
||||||||||||||||||||||||
At Amortized Cost |
||||||||||||||||||||||||
Interbank deposits |
||||||||||||||||||||||||
Securities purchased under agreements to resell |
||||||||||||||||||||||||
Voluntary investments with the Central Bank of Brazil |
— | — | — | — | ||||||||||||||||||||
Securities |
||||||||||||||||||||||||
Loan and lease operations |
||||||||||||||||||||||||
Other financial assets |
||||||||||||||||||||||||
(-) Provision for Expected Loss |
( |
) | ( |
) | ( |
) | ( |
) | ( |
) | ( |
) | ||||||||||||
At Fair Value Through Other Comprehensive Income |
||||||||||||||||||||||||
Securities |
||||||||||||||||||||||||
At Fair Value Through Profit or Loss |
||||||||||||||||||||||||
Securities |
||||||||||||||||||||||||
Derivatives |
||||||||||||||||||||||||
Other financial assets |
— | — | ||||||||||||||||||||||
Financial liabilities – provision for expected loss |
||||||||||||||||||||||||
Loan Commitments |
||||||||||||||||||||||||
Financial Guarantees |
||||||||||||||||||||||||
Off balance sheet |
||||||||||||||||||||||||
Financial guarantees |
||||||||||||||||||||||||
Letters of credit to be released |
— | — | ||||||||||||||||||||||
Loan commitments |
||||||||||||||||||||||||
Mortgage loans |
— | — | ||||||||||||||||||||||
Overdraft accounts |
— | — | ||||||||||||||||||||||
Credit cards |
||||||||||||||||||||||||
Other pre-approved limits |
||||||||||||||||||||||||
|
|
|
|
|
|
|
|
|
|
|
|
|||||||||||||
Total |
||||||||||||||||||||||||
|
|
|
|
|
|
|
|
|
|
|
|
12/31/2021 |
% |
12/31/2020 |
% |
|||||||||||||
Industry and commerce |
||||||||||||||||
Services |
||||||||||||||||
Other sectors |
||||||||||||||||
Individuals |
||||||||||||||||
|
|
|
|
|
|
|
|
|||||||||
Total |
||||||||||||||||
|
|
|
|
|
|
|
|
12/31/2021 |
% |
12/31/2020 |
% |
|||||||||||||
Public sector |
||||||||||||||||
Services |
||||||||||||||||
Other sectors |
||||||||||||||||
Financial |
||||||||||||||||
|
|
|
|
|
|
|
|
|||||||||
Total |
||||||||||||||||
|
|
|
|
|
|
|
|
(*) |
Includes Financial Assets at Fair Value through Profit and Loss, Financial Assets at Fair Value through Other Comprehensive Income and Financial Assets at Amortized Cost, except for Loan and Lease Operations and Other Financial Assets. |
12/31/2021 |
||||||||||||||||||||||||||||||||||||||||||||||||||||||||||||||||
Stage 1 |
Stage 2 |
Stage 3 |
Total Consolidated of 3 stages |
|||||||||||||||||||||||||||||||||||||||||||||||||||||||||||||
Loan Operations |
Loan commitments |
Financial Guarantees |
Total |
Loan Operations |
Loan commitments |
Financial Guarantees |
Total |
Loan Operations |
Loan commitments |
Financial Guarantees |
Total |
Loan Operations |
Loan commitments |
Financial Guarantees |
Total |
|||||||||||||||||||||||||||||||||||||||||||||||||
Individuals |
— | — | ||||||||||||||||||||||||||||||||||||||||||||||||||||||||||||||
Corporate |
||||||||||||||||||||||||||||||||||||||||||||||||||||||||||||||||
Micro/Small and medium companies |
||||||||||||||||||||||||||||||||||||||||||||||||||||||||||||||||
Foreign loans - Latin America |
||||||||||||||||||||||||||||||||||||||||||||||||||||||||||||||||
|
|
|
|
|
|
|
|
|
|
|
|
|
|
|
|
|
|
|
|
|
|
|
|
|
|
|
|
|
|
|
|
|||||||||||||||||||||||||||||||||
Total |
||||||||||||||||||||||||||||||||||||||||||||||||||||||||||||||||
|
|
|
|
|
|
|
|
|
|
|
|
|
|
|
|
|
|
|
|
|
|
|
|
|
|
|
|
|
|
|
|
|||||||||||||||||||||||||||||||||
% |
||||||||||||||||||||||||||||||||||||||||||||||||||||||||||||||||
|
|
|
|
|
|
|
|
|
|
|
|
|
|
|
|
|
|
|
|
|
|
|
|
|
|
|
|
|
|
|
|
12/31/2020 |
||||||||||||||||||||||||||||||||||||||||||||||||||||||||||||||||
Stage 1 |
Stage 2 |
Stage 3 |
Total Consolidated of 3 stages |
|||||||||||||||||||||||||||||||||||||||||||||||||||||||||||||
Loan Operations |
Loan commitments |
Financial Guarantees |
Total |
Loan Operations |
Loan commitments |
Financial Guarantees |
Total |
Loan Operations |
Loan commitments |
Financial Guarantees |
Total |
Loan Operations |
Loan commitments |
Financial Guarantees |
Total |
|||||||||||||||||||||||||||||||||||||||||||||||||
Individuals |
— | — | ||||||||||||||||||||||||||||||||||||||||||||||||||||||||||||||
Corporate |
||||||||||||||||||||||||||||||||||||||||||||||||||||||||||||||||
Micro/Small and medium companies |
||||||||||||||||||||||||||||||||||||||||||||||||||||||||||||||||
Foreign loans - Latin America |
||||||||||||||||||||||||||||||||||||||||||||||||||||||||||||||||
|
|
|
|
|
|
|
|
|
|
|
|
|
|
|
|
|
|
|
|
|
|
|
|
|
|
|
|
|
|
|
|
|||||||||||||||||||||||||||||||||
Total |
||||||||||||||||||||||||||||||||||||||||||||||||||||||||||||||||
|
|
|
|
|
|
|
|
|
|
|
|
|
|
|
|
|
|
|
|
|
|
|
|
|
|
|
|
|
|
|
|
|||||||||||||||||||||||||||||||||
% |
||||||||||||||||||||||||||||||||||||||||||||||||||||||||||||||||
|
|
|
|
|
|
|
|
|
|
|
|
|
|
|
|
|
|
|
|
|
|
|
|
|
|
|
|
|
|
|
|
12/31/2021 |
12/31/2020 |
|||||||||||||||||||||||||||||||
Internal Rating |
Stage 1 |
Stage 2 |
Stage 3 |
Total loan operations |
Stage 1 |
Stage 2 |
Stage 3 |
Total loan operations |
||||||||||||||||||||||||
Low |
— | — | ||||||||||||||||||||||||||||||
Medium |
— | — | ||||||||||||||||||||||||||||||
High |
— | — | ||||||||||||||||||||||||||||||
Credit-Impaired |
— | — | — | — | ||||||||||||||||||||||||||||
|
|
|
|
|
|
|
|
|
|
|
|
|
|
|
|
|||||||||||||||||
Total |
||||||||||||||||||||||||||||||||
|
|
|
|
|
|
|
|
|
|
|
|
|
|
|
|
|||||||||||||||||
% |
||||||||||||||||||||||||||||||||
|
|
|
|
|
|
|
|
|
|
|
|
|
|
|
|
12/31/2021 |
||||||||||||||||||||||||||||
Stage 1 |
Stage 2 |
Stage 3 |
||||||||||||||||||||||||||
Fair Value |
Cost |
Fair Value |
Cost |
Fair Value |
Cost |
Fair Value |
||||||||||||||||||||||
Investment funds |
||||||||||||||||||||||||||||
Government securities |
— |
— |
— |
— |
||||||||||||||||||||||||
Brazilian government |
— | — | — | — | ||||||||||||||||||||||||
Other Public |
— | — | — | — | — | — | ||||||||||||||||||||||
Abroad |
— |
— |
— |
— |
||||||||||||||||||||||||
Argentina |
— | — | — | — | ||||||||||||||||||||||||
United States |
— | — | — | — | ||||||||||||||||||||||||
Mexico |
— | — | — | — | ||||||||||||||||||||||||
Spain |
— | — | — | — | ||||||||||||||||||||||||
Korea |
— | — | — | — | ||||||||||||||||||||||||
Chile |
— | — | — | — | ||||||||||||||||||||||||
Paraguay |
— | — | — | — | ||||||||||||||||||||||||
Uruguay |
— | — | — | — | ||||||||||||||||||||||||
Colombia |
— | — | — | — | ||||||||||||||||||||||||
Peru |
— | — | — | — | ||||||||||||||||||||||||
Corporate securities |
||||||||||||||||||||||||||||
Rural product note |
||||||||||||||||||||||||||||
Real estate receivables certificates |
— | |||||||||||||||||||||||||||
Bank deposit certificate |
— | — | — | — | ||||||||||||||||||||||||
Debentures |
||||||||||||||||||||||||||||
Eurobonds and other |
— | — | ||||||||||||||||||||||||||
Financial bills |
— | — | — | — | ||||||||||||||||||||||||
Promissory and commercial notes |
— | — | — | — | ||||||||||||||||||||||||
Other |
||||||||||||||||||||||||||||
|
|
|
|
|
|
|
|
|
|
|
|
|
|
|||||||||||||||
Total |
||||||||||||||||||||||||||||
|
|
|
|
|
|
|
|
|
|
|
|
|
|
12/31/2020 |
||||||||||||||||||||||||||||
Stage 1 |
Stage 2 |
Stage 3 |
||||||||||||||||||||||||||
Fair Value |
Cost |
Fair Value |
Cost |
Fair Value |
Cost |
Fair Value |
||||||||||||||||||||||
Investment funds |
||||||||||||||||||||||||||||
Government securities |
— |
— |
— |
— |
||||||||||||||||||||||||
Brazilian government |
— | — | — | — | ||||||||||||||||||||||||
Other Public |
— | — | — | — | — | — | ||||||||||||||||||||||
Abroad |
— |
— |
— |
— |
||||||||||||||||||||||||
Argentina |
— | — | — | — | ||||||||||||||||||||||||
United States |
— | — | — | — | ||||||||||||||||||||||||
Mexico |
— | — | — | — | ||||||||||||||||||||||||
Italy |
— | — | — | — | ||||||||||||||||||||||||
Spain |
— | — | — | — | ||||||||||||||||||||||||
Korea |
— | — | — | — | ||||||||||||||||||||||||
Chile |
— | — | — | — | ||||||||||||||||||||||||
Paraguay |
— | — | — | — | ||||||||||||||||||||||||
Uruguay |
— | — | — | — | ||||||||||||||||||||||||
Colombia |
— | — | — | — | ||||||||||||||||||||||||
Peru |
— | — | — | — | ||||||||||||||||||||||||
Corporate securities |
||||||||||||||||||||||||||||
Rural product note |
||||||||||||||||||||||||||||
Real estate receivables certificates |
— | |||||||||||||||||||||||||||
Bank deposit certificate |
— | — | — | — | ||||||||||||||||||||||||
Debentures |
||||||||||||||||||||||||||||
Eurobonds and other |
— | — | — | — | ||||||||||||||||||||||||
Financial bills |
— | — | — | — | ||||||||||||||||||||||||
Promissory and commercial notes |
— | — | — | — | ||||||||||||||||||||||||
Other |
||||||||||||||||||||||||||||
|
|
|
|
|
|
|
|
|
|
|
|
|
|
|||||||||||||||
Total |
||||||||||||||||||||||||||||
|
|
|
|
|
|
|
|
|
|
|
|
|
|
12/31/2021 |
||||||||||||||||||||
Financial Assets - At Amortized Cost |
||||||||||||||||||||
Internal rating |
Interbank deposits and securities purchased under agreements to resell |
Securities |
Financial assets at fair value through profit or loss (*) |
Financial Assets at fair value through other comprehensive income |
Total |
|||||||||||||||
Low |
||||||||||||||||||||
Medium |
— | — | ||||||||||||||||||
High |
— | |||||||||||||||||||
|
|
|
|
|
|
|
|
|
|
|||||||||||
Total |
||||||||||||||||||||
|
|
|
|
|
|
|
|
|
|
|||||||||||
% |
||||||||||||||||||||
|
|
|
|
|
|
|
|
|
|
(*) |
Includes Derivatives in the amount of R$ |
12/31/2020 |
||||||||||||||||||||
Financial Assets -Amortized Cost |
||||||||||||||||||||
Internal rating |
Interbank deposits and securities purchased under agreements to resell |
Securities |
Financial assets at fair value through profit or loss (*) |
Financial Assets at fair value through other comprehensive income |
Total |
|||||||||||||||
Low |
||||||||||||||||||||
Medium |
— | — | ||||||||||||||||||
High |
— | |||||||||||||||||||
|
|
|
|
|
|
|
|
|
|
|||||||||||
Total |
||||||||||||||||||||
|
|
|
|
|
|
|
|
|
|
|||||||||||
% |
||||||||||||||||||||
|
|
|
|
|
|
|
|
|
|
(*) |
Includes Derivatives in the amount of R$ |
12/31/2021 |
12/31/2020 |
|||||||||||||||||||||||||||||||
Over-collateralized assets |
Under-collateralized assets |
Over-collateralized assets |
Under-collateralized assets |
|||||||||||||||||||||||||||||
Carrying value of the assets |
Fair value of collateral |
Carrying value of the assets |
Fair value of collateral |
Carrying value of the assets |
Fair value of collateral |
Carrying value of the assets |
Fair value of collateral |
|||||||||||||||||||||||||
Individuals |
||||||||||||||||||||||||||||||||
Personal (1) |
||||||||||||||||||||||||||||||||
Vehicles (2) |
||||||||||||||||||||||||||||||||
Mortgage loans (3) |
||||||||||||||||||||||||||||||||
Micro, small and medium companies and corporates (4) |
||||||||||||||||||||||||||||||||
Foreign loans – Latin America (4) |
||||||||||||||||||||||||||||||||
Total |
||||||||||||||||||||||||||||||||
|
|
|
|
|
|
|
|
|
|
|
|
|
|
|
|
(1) |
In general requires financial collaterals. |
(2) |
Vehicles themselves are pledged as collateral, as well as assets leased in lease operations. |
(3) |
Properties themselves are pledged as collateral. |
(4) |
Any collateral set forth in the credit policy of ITAÚ UNIBANCO HOLDING (chattel mortgage, surety/joint debtor, mortgage and others). |
• | Value at risk (VaR): a statistical measure that estimates the expected maximum potential economic loss under normal market conditions, considering a certain time horizon and confidence level; |
• | Losses in stress scenarios (Stress Test): simulation technique to assess the behavior of assets, liabilities and derivatives of a portfolio when several risk factors are taken to extreme market situations (based on prospective and historical scenarios); |
• | Stop loss: metrics used to revise positions, should losses accumulated in a fixed period reach a certain level; |
• | Concentration: cumulative exposure of a certain financial instrument or risk factor, calculated at market value (MtM – Mark to Market); and |
• | Stressed VaR: statistical metric derived from the VaR calculation, with the purpose is of simulating higher risk in the trading portfolio, taking returns that can be seen in past scenarios of extreme volatility. |
• | ΔEVE (Delta Economic Value of Equity): difference between the present value of the sum of repricing flows of instruments subject to IRRBB in a base scenario and the present value of the sum of repricing flows of these instruments in a scenario of shock in interest rates; |
• | ΔNII (Delta Net Interest Income): difference between the result of financial intermediation of instruments subject to IRRBB in a base scenario and the result of financial intermediation of these instruments in a scenario of shock in interest rates. |
• | Mismatching analysis (GAPS): accumulated exposure by risk factor of cash flows expressed at market value, allocated at the maturity dates; |
• | Sensitivity (DV01- Delta Variation): impact on the fair value of cash flows when a 1 basis point change is applied to current interest rates or on the index rates; and |
• | Sensitivity to Sundry Risk Factors (Greeks): partial derivatives of an option portfolio in relation to the prices of underlying assets, implied volatilities, interest rates and time. |
VaR Total (Historical Simulation) (in millions of Reais) |
||||||||||||||||||||||||||||||||
12/31/2021 (*) |
12/31/2020 (*) |
|||||||||||||||||||||||||||||||
Average |
Maximum |
Minimum |
Var Total |
Average |
Minimum |
Minimum |
Var Total |
|||||||||||||||||||||||||
VaR by Risk Factor Group |
||||||||||||||||||||||||||||||||
Interest rates |
||||||||||||||||||||||||||||||||
Currencies |
||||||||||||||||||||||||||||||||
Shares |
||||||||||||||||||||||||||||||||
Commodities |
||||||||||||||||||||||||||||||||
Effect of diversification |
— | — | — | ( |
) | — | — | — | ( |
) | ||||||||||||||||||||||
|
|
|
|
|
|
|
|
|
|
|
|
|
|
|
|
|||||||||||||||||
Total risk |
||||||||||||||||||||||||||||||||
|
|
|
|
|
|
|
|
|
|
|
|
|
|
|
|
(*) |
VaR by Group of Risk Factors considers information from foreign units. |
12/31/2021 |
12/31/2020 |
|||||||||||||||||||||||||||||||||||||||||||||||
0-30 days |
31-180 days |
181-365 days |
1-5 years |
Over 5 years |
Total |
0-30 days |
31-180 days |
181-365 days |
1-5 years |
Over 5 years |
Total |
|||||||||||||||||||||||||||||||||||||
Financial assets |
||||||||||||||||||||||||||||||||||||||||||||||||
At amortized cost |
||||||||||||||||||||||||||||||||||||||||||||||||
Compulsory deposits in the Central Bank of Brazil |
||||||||||||||||||||||||||||||||||||||||||||||||
Interbank deposits |
||||||||||||||||||||||||||||||||||||||||||||||||
Securities purchased under agreements to resell |
||||||||||||||||||||||||||||||||||||||||||||||||
Voluntary investments with the Central Bank of Brazil |
||||||||||||||||||||||||||||||||||||||||||||||||
Securities |
||||||||||||||||||||||||||||||||||||||||||||||||
Loan and lease operations |
||||||||||||||||||||||||||||||||||||||||||||||||
At fair value through other comprehensive income |
||||||||||||||||||||||||||||||||||||||||||||||||
At fair value through profit and loss |
||||||||||||||||||||||||||||||||||||||||||||||||
Securities |
||||||||||||||||||||||||||||||||||||||||||||||||
Derivatives |
||||||||||||||||||||||||||||||||||||||||||||||||
Other financial assets |
||||||||||||||||||||||||||||||||||||||||||||||||
Financial liabilities |
||||||||||||||||||||||||||||||||||||||||||||||||
At amortized cost |
||||||||||||||||||||||||||||||||||||||||||||||||
Deposits |
||||||||||||||||||||||||||||||||||||||||||||||||
Securities sold under repurchase agreements |
||||||||||||||||||||||||||||||||||||||||||||||||
Interbank market funds |
||||||||||||||||||||||||||||||||||||||||||||||||
Institutional market funds |
||||||||||||||||||||||||||||||||||||||||||||||||
Premium bonds plans |
||||||||||||||||||||||||||||||||||||||||||||||||
At fair value through profit and loss |
||||||||||||||||||||||||||||||||||||||||||||||||
Derivatives |
||||||||||||||||||||||||||||||||||||||||||||||||
Structured notes |
||||||||||||||||||||||||||||||||||||||||||||||||
Other financial liabilities |
||||||||||||||||||||||||||||||||||||||||||||||||
Difference assets / liabilities (*) |
( |
) |
( |
) |
||||||||||||||||||||||||||||||||||||||||||||
Cumulative difference |
( |
) |
( |
) |
( |
) |
||||||||||||||||||||||||||||||||||||||||||
Ratio of cumulative difference to total interest-bearing assets |
( |
)% | ( |
)% | % | % | % | ( |
)% | % | % | % | % | |||||||||||||||||||||||||||||||||||
|
|
|
|
|
|
|
|
|
|
|
|
|
|
|
|
|
|
|
|
(*) |
The difference arises from the mismatch between the maturities of all remunerated assets and liabilities, at the respective period-end date, considering the contractually agreed terms. |
• | Different scenarios projected for changes in liquidity; |
• | Contingency plans for crisis situations; |
• | Reports and charts that describe the risk positions; |
• | Assessment of funding costs and alternative sources of funding; |
• | Monitoring of changes in funding through a constant control of sources of funding, considering the type of investor, maturities and other factors. |
Funding from customers |
12/31/2021 |
12/31/2020 |
||||||||||||||||||||||
0-30 days |
Total |
% |
0-30 days |
Total |
% |
|||||||||||||||||||
Deposits |
||||||||||||||||||||||||
Demand deposits |
||||||||||||||||||||||||
Savings deposits |
||||||||||||||||||||||||
Time deposits |
||||||||||||||||||||||||
Other |
||||||||||||||||||||||||
Funds from acceptances and issuance of securities (1) |
||||||||||||||||||||||||
Funds from own issue (2) |
||||||||||||||||||||||||
Subordinated debt |
||||||||||||||||||||||||
|
|
|
|
|
|
|
|
|
|
|
|
|||||||||||||
Total |
||||||||||||||||||||||||
|
|
|
|
|
|
|
|
|
|
|
|
(1) |
Includes mortgage notes, guaranteed real estate credit bills, agribusiness, financial recorded in interbank markets funds and Obligations on the issue of debentures, Securities abroad and strutured operations certificates recorded in Institutional Markets Funds. |
(2) |
Refer to deposits received under securities repurchase agreements with securities from own issue. |
Liquidity indicators |
12/31/2021 |
12/31/2020 |
||||||
% |
% |
|||||||
Net assets (1) (2) |
||||||||
Net assets (1) (3) |
||||||||
Net assets (1) (4) |
(1) |
Net assets (present value): Cash, Securities purchased under agreements to resell – Funded position and Government securities—available. Detailed in the table Non discounted future flows – Financial assets. |
(2) |
Funding from customers table (Total funding from customers 0-30 days). |
(3) |
Funding from customers table (Total funding from customers). |
(4) |
Detailed in the table Non discounted future flows – Financial assets, total present value regards R$ |
Undiscounted future flows, except for derivatives which are fair value |
12/31/2021 |
12/31/2020 |
||||||||||||||||||||||||||||||||||||||
Financial assets (1) |
0 - 30 |
31 - 365 |
366 -720 |
Over 720 days |
Total |
0 - 30 |
31 -365 |
366 - 720 |
Over 720 days |
Total |
||||||||||||||||||||||||||||||
Cash |
— |
— |
— |
|||||||||||||||||||||||||||||||||||||
Interbank investments |
||||||||||||||||||||||||||||||||||||||||
Securities purchased under agreements to resell – Collateral held (2) |
— | — | — | |||||||||||||||||||||||||||||||||||||
Securities purchased under agreements to resell – Collateral repledge |
— | |||||||||||||||||||||||||||||||||||||||
Interbank deposits (4) |
||||||||||||||||||||||||||||||||||||||||
Securities |
||||||||||||||||||||||||||||||||||||||||
Government securities—available |
||||||||||||||||||||||||||||||||||||||||
Government securities—under repurchase commitments |
||||||||||||||||||||||||||||||||||||||||
Corporate securities—available |
||||||||||||||||||||||||||||||||||||||||
Corporate securities—under repurchase commitments |
— | |||||||||||||||||||||||||||||||||||||||
Derivative financial instruments – Net position |
||||||||||||||||||||||||||||||||||||||||
Swaps |
||||||||||||||||||||||||||||||||||||||||
Options |
||||||||||||||||||||||||||||||||||||||||
Forwards |
— | |||||||||||||||||||||||||||||||||||||||
Other derivatives |
||||||||||||||||||||||||||||||||||||||||
Loan and lease operations (3) |
||||||||||||||||||||||||||||||||||||||||
Other financial assets |
— |
— |
— |
— |
||||||||||||||||||||||||||||||||||||
|
|
|
|
|
|
|
|
|
|
|
|
|
|
|
|
|
|
|
|
|||||||||||||||||||||
Total financial assets |
||||||||||||||||||||||||||||||||||||||||
|
|
|
|
|
|
|
|
|
|
|
|
|
|
|
|
|
|
|
|
(1) |
The assets portfolio does not take into consideration the balance of compulsory deposits in Central Bank, amounting to R$ |
(2) |
Net of R$ |
(3) |
Net of payment to merchants of R$ |
(4) |
Includes R$ |
Undiscounted future flows, except for derivatives which are fair value |
12/31/2021 |
12/31/2020 |
||||||||||||||||||||||||||||||||||||||
Financial liabilities |
0 - 30 |
31 - 365 |
366 -720 |
Over 720 days |
Total |
0 - 30 |
31 - 365 |
366 - 720 |
Over 720 days |
Total |
||||||||||||||||||||||||||||||
Deposits |
||||||||||||||||||||||||||||||||||||||||
Demand deposits |
— | — | — | |||||||||||||||||||||||||||||||||||||
Savings deposits |
— | — | — | |||||||||||||||||||||||||||||||||||||
Time deposit |
||||||||||||||||||||||||||||||||||||||||
Interbank deposits |
||||||||||||||||||||||||||||||||||||||||
Other deposits |
— | — | — | |||||||||||||||||||||||||||||||||||||
Compulsory deposits |
( |
) |
( |
) |
( |
) |
( |
) |
( |
) |
( |
) |
( |
) |
( |
) |
( |
) |
( |
) | ||||||||||||||||||||
Demand deposits |
( |
) | ( |
) | ( |
) | — | — | — | ( |
) | |||||||||||||||||||||||||||||
Savings deposits |
( |
) | ( |
) | ( |
) | — | — | — | ( |
) | |||||||||||||||||||||||||||||
Time deposit |
( |
) | ( |
) | ( |
) | ( |
) | ( |
) | ( |
) | ( |
) | ( |
) | ( |
) | ( |
) | ||||||||||||||||||||
Securities sold under repurchase agreements (1) |
||||||||||||||||||||||||||||||||||||||||
Government securities |
||||||||||||||||||||||||||||||||||||||||
Corporate securities |
||||||||||||||||||||||||||||||||||||||||
Foreign |
— | — | ||||||||||||||||||||||||||||||||||||||
Funds from acceptances and issuance of securities (2) |
||||||||||||||||||||||||||||||||||||||||
Loans and obligations (3) |
||||||||||||||||||||||||||||||||||||||||
Subordinated debt (4) |
||||||||||||||||||||||||||||||||||||||||
Derivative financial instruments – Net position |
||||||||||||||||||||||||||||||||||||||||
Swaps |
||||||||||||||||||||||||||||||||||||||||
Options |
||||||||||||||||||||||||||||||||||||||||
Forwards |
||||||||||||||||||||||||||||||||||||||||
Other derivatives |
||||||||||||||||||||||||||||||||||||||||
Other financial liabilities |
— |
— |
3 |
— |
5 |
— |
— |
5 |
||||||||||||||||||||||||||||||||
|
|
|
|
|
|
|
|
|
|
|
|
|
|
|
|
|
|
|
|
|||||||||||||||||||||
Total financial liabilities |
||||||||||||||||||||||||||||||||||||||||
|
|
|
|
|
|
|
|
|
|
|
|
|
|
|
|
|
|
|
|
(1) |
Includes own and third parties’ portfolios. |
(2) |
Includes mortgage notes, Guaranteed real estate notes, agribusiness, financial recorded in interbank market funds and Obligations on issue of debentures, Securities abroad and Structured Transactions certificates recorded in institutional markets funds. |
(3) |
Recorded in funds from interbank markets. |
(4) |
Recorded in funds from institutional markets. |
12/31/2021 |
12/31/2020 |
|||||||||||||||||||||||||||||||||||||||
Off balance commitments |
0 – 30 |
31 – 365 |
366 – 720 |
Over 720 days |
Total |
0 – 30 |
31 – 365 |
366 – 720 |
Over 720 days |
Total |
||||||||||||||||||||||||||||||
Financial Guarantees |
||||||||||||||||||||||||||||||||||||||||
Commitments to be released |
||||||||||||||||||||||||||||||||||||||||
Letters of credit to be released |
— | — | — | |||||||||||||||||||||||||||||||||||||
Contractual commitments—Fixed and Intangible assets (Notes 13 and 14) |
— | — | ||||||||||||||||||||||||||||||||||||||
|
|
|
|
|
|
|
|
|
|
|
|
|
|
|
|
|
|
|
|
|||||||||||||||||||||
Total |
||||||||||||||||||||||||||||||||||||||||
|
|
|
|
|
|
|
|
|
|
|
|
|
|
|
|
|
|
|
|
12/31/2021 |
12/31/2020 |
|||||||
Available capital (amounts) |
||||||||
Common Equity Tier 1 |
||||||||
Tier 1 |
||||||||
Total capital (PR) |
||||||||
Risk-weighted assets (amounts) |
||||||||
Total risk-weighted assets (RWA) |
||||||||
Risk-based capital ratios as a percentage of RWA |
||||||||
Common Equity Tier 1 ratio (%) |
% | % | ||||||
Tier 1 ratio (%) |
% | % | ||||||
Total capital ratio (%) |
% | % | ||||||
Additional CET1 buffer requirements as a percentage of RWA |
||||||||
Capital conservation buffer requirement (%) (*) |
% | % | ||||||
Countercyclical buffer requirement (%) |
% | % | ||||||
Bank G-SIB and/or D-SIB additional requirements (%) |
% | % | ||||||
Total of bank CET1 specific buffer requirements (%) |
% | % |
(*) |
For purposes of calculating the Conservation capital buffer, BACEN Resolution 4,783 establishes, for defined periods, percentages to be applied to the RWA value with a gradual increase until April/22, when it reaches |
• |
RWA CPAD |
• |
RWA MINT |
• |
RWA OPAD |
RWA |
||||||||
12/31/2021 |
12/31/2020 |
|||||||
Credit Risk—standardized approach |
||||||||
Credit risk (excluding counterparty credit risk) |
||||||||
Counterparty credit risk (CCR) |
||||||||
Of which: standardized approach for counterparty credit risk (SA-CCR) |
||||||||
Of which: other CCR |
||||||||
Credit valuation adjustment (CVA) |
||||||||
Equity investments in funds—look-through approach |
||||||||
Equity investments in funds—mandate-based approach |
||||||||
Equity investments in funds—fall-back approach |
||||||||
Securitisation exposures—standardized approach |
||||||||
Amounts below the thresholds for deduction |
||||||||
Market Risk |
||||||||
Of which: standardized approach (RWA MPAD ) |
||||||||
Of which: internal models approach (RWA MINT ) |
||||||||
Operational Risk |
||||||||
|
|
|
|
|||||
Total |
||||||||
|
|
|
|
• | Demographic risk relates to: i) a greater than expected increase in life expectancies for products with survivorship coverage (mostly pension plans); and ii) a greater than expected decrease in mortality rates for products with life coverage (mostly life insurance). |
• | Financial risk: is inherent in the underwriting risk of products that offer a contractual financial guarantee, this risk being considered insurance risk. |
• | Behavioral risk relates to a greater than expected increase in the rates of conversion into annuity income, resulting in increased payments of retirement benefits. |
a) |
Effect of changes on actuarial assumptions |
Impact in Income and Stockholders’ Equity (1) |
||||||||||||||||
Sensitivity Test |
12/31/2021 |
12/31/2020 |
||||||||||||||
Private Pension |
Insurance |
Private Pension |
Insurance |
|||||||||||||
Mortality Rates |
||||||||||||||||
5% increase |
( |
) | 2 | |||||||||||||
5% decrease |
( |
) | ( |
) | ( |
) | ||||||||||
Risk-free Interest Rates |
||||||||||||||||
0.1% increase |
||||||||||||||||
0.1% decrease |
( |
) | ( |
) | ( |
) | ( |
) | ||||||||
Conversion in Income Rates |
||||||||||||||||
5% increase |
( |
) | — | ( |
) | — | ||||||||||
5% decrease |
— | — | ||||||||||||||
Claims |
||||||||||||||||
5% increase |
— | ( |
) | — | ( |
) | ||||||||||
5% decrease |
— | — |
(1) |
Amounts net of tax effects. |
01/01 to 12/31/2021 |
01/01 to 12/31/2020 |
01/01 to 12/31/2019 |
||||||||||||||||||||||||||||||||||
Insurance |
Retained |
Retention |
Insurance |
Retained |
Retention |
Insurance |
Retained |
Retention |
||||||||||||||||||||||||||||
premiums |
premium |
(%) |
premiums |
premium |
(%) |
premiums |
premium |
(%) |
||||||||||||||||||||||||||||
Individuals |
||||||||||||||||||||||||||||||||||||
Group accident insurance |
||||||||||||||||||||||||||||||||||||
Individual accident |
||||||||||||||||||||||||||||||||||||
Credit Life Insurance |
||||||||||||||||||||||||||||||||||||
Group life |
12/31/2021 |
12/31/2020 | |||||||||||
Class |
Account balance |
DV01 |
Account balance |
DV01 | ||||||||
Government securities |
||||||||||||
National Treasury Notes (NTN-C) |
( |
( | ||||||||||
National Treasury Notes (NTN-B) |
( |
( | ||||||||||
National Treasury Notes (NTN-F) |
( |
( | ||||||||||
National Treasury Bills (LTN) |
( |
( | ||||||||||
Corporate securities |
||||||||||||
Indexed to IGPM |
( |
|||||||||||
Indexed to IPCA |
( |
( | ||||||||||
Indexed to PRE |
||||||||||||
Indexed to PYG |
( |
|||||||||||
Shares |
||||||||||||
Post-fixed assets |
||||||||||||
Under agreements to resell |
||||||||||||
|
|
|
|
|||||||||
Total |
||||||||||||
|
|
|
|
12/31/2021 |
12/31/2020 |
|||||||||||||||||||||||||
Liabilities |
Assets |
Liabilities amounts (1) |
Liabilities DU (2) |
Assets DU (2) |
Liabilities amounts (1) |
Liabilities DU (2) |
Assets DU (2) |
|||||||||||||||||||
Insurance operations |
Backing asset |
|||||||||||||||||||||||||
Unearned premiums |
LFT, repurchase agreements, NTN-B, CDB, LF and debentures |
|||||||||||||||||||||||||
IBNR, PDR and PSL |
LFT, repurchase agreements, NTN-B, CDB, LF and debentures |
|||||||||||||||||||||||||
Redemptions and Other Unsettled Amounts |
LFT, repurchase agreements, NTN-B, CDB, LF and debentures |
|||||||||||||||||||||||||
Mathematical reserve for benefits to be granted and benefits granted |
LFT, repurchase agreements, NTN-B, NTN-C, debentures |
|||||||||||||||||||||||||
Financial surplus |
LFT, repurchase agreements, NTN-B, NTN-C, CDB, LF and debentures |
|||||||||||||||||||||||||
Other provisions |
LFT, repurchase agreements, NTN-B, CDB, LF and debentures |
|||||||||||||||||||||||||
Subtotal |
Subtotal |
|||||||||||||||||||||||||
Pension plan, VGBL and individual life operations |
||||||||||||||||||||||||||
Related expenses |
LFT, repurchase agreements, NTN-B, CDB, LF and debentures |
|||||||||||||||||||||||||
Unearned premiums |
LFT, repurchase agreements, NTN-B, CDB and debentures |
|||||||||||||||||||||||||
Unsettled claims |
LFT, repurchase agreements, NTN-B, CDB and debentures |
|||||||||||||||||||||||||
IBNR |
LFT, repurchase agreements, NTN-B, CDB and debentures |
|||||||||||||||||||||||||
Redemptions and Other Unsettled Amounts |
LFT, repurchase agreements, NTN-B, CDB and debentures |
|||||||||||||||||||||||||
Mathematical reserve for benefits granted |
LFT, repurchase agreements, LTN, NTN-B, NTN-C, NTN-F, CDB, LF and debentures |
|||||||||||||||||||||||||
Mathematical reserve for benefits to be granted – PGBL/ VGBL |
LFT, repurchase agreements, LTN, NTN-B, NTN-C, NTN-F, CDB, LF and debentures |
|||||||||||||||||||||||||
Mathematical reserve for benefits to be granted – traditional |
LFT, repurchase agreements, NTN-B, NTN-C, debentures |
|||||||||||||||||||||||||
Other provisions |
LFT, repurchase agreements, NTN-B, NTN-C, CDB, LF and debentures |
|||||||||||||||||||||||||
Financial surplus |
LFT, repurchase agreements, NTN-B, NTN-C, CDB, LF and debentures |
|||||||||||||||||||||||||
Subtotal |
Subtotal |
|||||||||||||||||||||||||
Total technical reserves |
Total backing assets |
(1) |
Gross amounts of Credit Rights, Deposits in Guarantee and Reinsurance. |
(2) |
DU = Duration in months. |
• | Insurance Operations: |
• | Private Pension Operations: |
12/31/2021 |
||||||||||||||||||||
Financial Assets at Amortized Cost |
Financial Assets at Fair Value Through Other Comprehensive Income |
Total |
||||||||||||||||||
Internal rating |
Interbank deposits and securities purchased under agreements to resell |
Securities |
Financial assets at fair value through profit or loss (*) |
|||||||||||||||||
Low |
||||||||||||||||||||
Medium |
— | — | — | |||||||||||||||||
High |
— | — | — | |||||||||||||||||
|
|
|
|
|
|
|
|
|
|
|||||||||||
Total |
||||||||||||||||||||
|
|
|
|
|
|
|
|
|
|
|||||||||||
% |
||||||||||||||||||||
|
|
|
|
|
|
|
|
|
|
(*) |
Includes Derivatives in the amount of R$ |
12/31/2020 |
||||||||||||||||||||
Financial Assets at Amortized Cost |
Financial Assets at Fair Value Through Other Comprehensive Income |
|||||||||||||||||||
Internal rating |
Interbank deposits and securities purchased under agreements to resell |
Securities |
Financial assets at fair value through profit or loss (*) |
Total |
||||||||||||||||
Low |
||||||||||||||||||||
Medium |
— | — | — | |||||||||||||||||
High |
— | — | — | — | — | |||||||||||||||
|
|
|
|
|
|
|
|
|
|
|||||||||||
Total |
||||||||||||||||||||
|
|
|
|
|
|
|
|
|
|
|||||||||||
% |
||||||||||||||||||||
|
|
|
|
|
|
|
|
|
|
(*) |
Includes Derivatives in the amount of R$ |
i) | CMN Resolution No. 4,782/20, and amendments made by CMN Resolutions No. 4,791/20 and No. 4,856/20, which established, for a determined period of time, criteria for characterization of restructuring of loan operations; |
ii) | CMN Resolution No. 4,838/20, which regulates the Working Capital Program for Business Preservation (CGPE), which contracting term ended in the fourth quarter of 2020; |
iii) | CMN Resolution No. 4,846/20 which provides for loan operations for financing of payroll carried out by financial institutions, under the Emergency Employment Support Program (PESE); |
iv) | CMN Resolution No. 4,937/21 which regulates the Credit Incentive Program (PEC) established by Provisional Measure No. 1,057/21, with conditions similar to those of the CGPE and contracting term scheduled until December 31, 2021; |
v) | Law No. 13,999/20, and amendments made by Law No. 14,161/21, that instituted the National Support Program for Micro and Small Companies (PRONAMPE) with the purpose of developing and strengthening small businesses; |
vi) | Law No. 14,042/20 that established the Emergency Program for Access to Credit (PEAC), with the purpose of making easier the access to credit and preserving companies, for the protection of jobs and income. The PEAC has two modalities: Emergency Program for Access to Credit in the modality of guarantee (PEAC-FGI) and Emergency Program for Access to Credit in the modality guarantee of receivables (PEAC-Maquininha); |
vii) | Law No. 14,148/21 which established the Emergency Program for the Recovery of the Events Sector (PERSE), which aims at creating conditions for the events sector to mitigate losses arising from the state of calamity and the Guarantee Program for Critical Sectors (PGSC), guaranteeing loan operations contracted within 180 days after the law becomes effective; and |
viii) | BACEN Circular No. 3,990/20 and amendments made by BACEN Circular 3,992/20 which permits to carry out repurchase agreements in foreign currency by BACEN. |
(a) | increase in 2020 and 2021 in loan and financing operations, especially for micro, small and medium-sized companies due to the measures adopted for mitigation of the impacts of COVID-19 by the authorities with the creation of programs such as PESE, PRONAMPE, PEAC-FGI and CGPE, which balance in December 2021 is R$ |
(b) | with the purpose of treating indebtedness in a structured way and giving financial impetus to clients, initiatives were established that allowed the extension of grace periods, terms and better interest rate conditions for individuals, and micro and small business clients. In March 2020, the Program 60+ was established, which, among other measures, allowed a mid-April the Travessia |
(c) | |
(d) | the allowance for loan losses in the amount of R$ COVID-19 pandemic on the loan portfolio, permitting quick access to the information needed for discussions and actions of the crisis management daily forums; |
(e) | the mark-to-market - in the first quarter of 2020, partially due to rate fluctuations and high price volatility in the markets in the beginning of the pandemic, influencing the measurement of items stated at fair value in their different levels. In subsequent periods, variations observed in the mark-to-market |
(f) | due to the COVID-19 pandemic, during 2020, instability in the variable income market was noted causing a migration to fixed income instruments with liquidity. This movement resulted in the increase in the Bank Deposit Certificates portfolio; however, over 2021, variation in the portfolio was noted, with changes not necessarily related to the effects of the pandemic. With the purpose of mitigating the system’s liquidity risk, BACEN made available in 2020 to financial institutions credit lines through repurchase agreements in foreign currency and purchase of financial bills with guarantee, and operations in the total amount of R$ |
(g) | increase in the recognition of deferred income tax and social contribution in 2020 due to the greater volume of deductible temporary differences recorded for the period. The pandemic reduced the projections of taxable income, however, it was not responsible for the generation of tax loss and social contribution loss carry forwards in ITAÚ UNIBANCO HOLDING. In the period, there were no significant impacts of the pandemic in the recognition of deferred income tax and social contribution in ITAÚ UNIBANCO HOLDING; and |
(h) | increase in expenses with claims related to COVID-19 of R$ |