Table of Contents
UNITED STATES
SECURITIES AND EXCHANGE COMMISSION
Washington, D.C. 20549
FORM 20-F
| ☐ | REGISTRATION STATEMENT PURSUANT TO SECTION 12(b) OR (g) OF THE SECURITIES EXCHANGE ACT OF 1934 |
OR
| ☒ | ANNUAL REPORT PURSUANT TO SECTION 13 OR 15(d) OF THE SECURITIES EXCHANGE ACT OF 1934 |
For the fiscal year ended December 31, 2018
OR
| ☐ | TRANSITION REPORT PURSUANT TO SECTION 13 OR 15(d) OF THE SECURITIES EXCHANGE ACT OF 1934 |
OR
| ☐ | SHELL COMPANY REPORT PURSUANT TO SECTION 13 OR 15(d) OF THE SECURITIES EXCHANGE ACT OF 1934 |
Commission File Number 001-15276
ITAÚ UNIBANCO HOLDING S.A.
(Exact Name of Registrant as Specified in its Charter)
ITAÚ UNIBANCO HOLDING S.A.
(Translation of Registrant’s name into English)
THE FEDERATIVE REPUBLIC OF BRAZIL
(Jurisdiction of incorporation or organization)
Praça Alfredo Egydio de Souza Aranha, 100
04344-902 São Paulo, SP, Brazil
(Address of principal executive offices)
Alexsandro Broedel
Group Executive Finance Director and Investor Relations Officer
Itaú Unibanco Holding S.A.
Praça Alfredo Egydio de Souza Aranha, 100
04344-902 São Paulo, SP, Brazil
+55 11 2794 3547
drinvest@itau-unibanco.com.br
(Name, Telephone, E-mail and/or Facsimile number and Address of Company Contact Person)
Securities registered or to be registered pursuant to Section 12(b) of the Act.
| Title of each class |
Name of each exchange on which registered | |
| Preferred Shares, without par value | New York Stock Exchange* | |
| American Depositary Shares (as evidenced by American Depositary Receipts), each representing one Preferred Share | New York Stock Exchange |
*Not for trading purposes, but only in connection with the listing on the New York Stock Exchange of American Depositary Shares representing those Preferred Shares.
Securities registered or to be registered pursuant to Section 12(g) of the Act:
None
Securities for which there is a reporting obligation pursuant to Section 15(d) of the Act:
None
Indicate the number of outstanding shares of each of the issuer’s classes of capital or common stock as of the period covered by the annual report:
4,958,290,359 Common Shares, no par value per share
4,762,230,563 Preferred Shares, no par value per share
Indicate by check mark if the registrant is a well-known seasoned issuer, as defined in Rule 405 of the Securities Act
☒ Yes ☐ No
If this annual report is an annual or transition report, indicate by check mark if the registrant is not required to file reports pursuant to Section 13 or 15(d) of the Securities Exchange Act of 1934.
☐ Yes ☒ No
Note—Checking the box above will not relieve any registrant required to file reports pursuant to Section 13 or 15(d) of the Securities Exchange Act of 1934 from their obligations under those Sections.
Indicate by check mark whether the registrant (1) has filed all reports required to be filed by Section 13 or 15(d) of the Securities Exchange Act of 1934 during the preceding 12 months (or for such shorter period that the registrant was required to file such reports), and (2) has been subject to such filing requirements for the past 90 days.
☒ Yes ☐ No
Indicate by check mark whether the registrant has submitted electronically every Interactive Data File required to be submitted pursuant to Rule 405 of Regulation S-T (§232.405 of this chapter) during the preceding 12 months (or for such shorter period that the registrant was required to submit such files).
☒ Yes ☐ No
Indicate by check mark whether the registrant is a large accelerated filer, an accelerated filer, a non-accelerated filer, or an emerging growth company. See definition of “large accelerated filer,” “accelerated filer,” and “emerging growth company” in Rule 12b-2 of the Exchange Act.
☒Large Accelerated filer ☐ Accelerated filer ☐ Non-accelerated filer ☐ Emerging growth company ☐
If an emerging growth company that prepares its financial statements in accordance with U.S. GAAP, indicate by check mark if the registrant has elected not to use the extended transition period for complying with any new or revised financial accounting standards† provided pursuant to Section 13(a) of the Exchange Act. ☐,
† The term “new or revised financial accounting standard” refers to any update issued by the Financial Accounting Standards Board to its Accounting Standards Codification after April 5, 2012.
Indicate by check mark which basis of accounting the registrant has used to prepare the financial statements included in this filing:
| U.S. GAAP ☐ |
International Financial Reporting Standards as issued by
the |
Other ☐ |
If “Other” has been checked in response to the previous question, indicate by check mark which financial statement item the registrant has elected to follow:
Item 17 ☐ Item 18 ☐
If this is an annual report, indicate by check mark whether the registrant is a shell company (as defined in Rule 12b-2 of the Exchange Act).
☐ Yes ☒ No
Table of Contents
| Page | ||||
| 1 | ||||
| 1 | ||||
| 2 | ||||
| 2 | ||||
| 2 | ||||
| 2 | ||||
| 3 | ||||
| ITEM 1. IDENTITY OF DIRECTORS, SENIOR MANAGEMENT AND ADVISORS |
3 | |||
| 3 | ||||
| 4 | ||||
| 4 | ||||
| 9 | ||||
| 9 | ||||
| 9 | ||||
| 27 | ||||
| 27 | ||||
| 28 | ||||
| 108 | ||||
| 108 | ||||
| 108 | ||||
| 108 | ||||
| 108 | ||||
| 125 | ||||
| 134 | ||||
| 134 | ||||
| 135 | ||||
| 135 | ||||
| 135 | ||||
| 135 | ||||
| 135 | ||||
| 151 | ||||
| 163 | ||||
| 168 | ||||
| 169 | ||||
| 170 | ||||
| 170 | ||||
| 171 | ||||
| 171 | ||||
| 172 | ||||
| 172 | ||||
| 175 | ||||
| 176 | ||||
| 176 | ||||
| 177 | ||||
| 177 | ||||
| 179 | ||||
| 179 | ||||
| 179 | ||||
i
Table of Contents
| 179 | ||||
| 179 | ||||
| 179 | ||||
| 185 | ||||
| 185 | ||||
| 185 | ||||
| 192 | ||||
| 192 | ||||
| 193 | ||||
| 193 | ||||
| ITEM 11. QUANTITATIVE AND QUALITATIVE DISCLOSURES ABOUT MARKET RISK |
193 | |||
| ITEM 12. DESCRIPTION OF SECURITIES OTHER THAN EQUITY SECURITIES |
205 | |||
| 205 | ||||
| 205 | ||||
| 205 | ||||
| 205 | ||||
| 207 | ||||
| 207 | ||||
| ITEM 14. MATERIAL MODIFICATIONS TO THE RIGHTS OF SECURITY HOLDERS AND USE OF PROCEEDS |
207 | |||
| 207 | ||||
| 208 | ||||
| 208 | ||||
| 208 | ||||
| 208 | ||||
| D. Exemptions from the Listing Standards for Audit Committees |
209 | |||
| E. Purchases of Equity Securities by the Issuer and Affiliated Purchasers |
210 | |||
| 210 | ||||
| 210 | ||||
| 212 | ||||
| 212 | ||||
| 212 | ||||
| 212 | ||||
| 212 | ||||
| 215 |
ii
Table of Contents
All references in this annual report to (i) “Itaú Unibanco Holding,” “Itaú Unibanco Group,” “we,” “us” or “our” are references to Itaú Unibanco Holding S.A. and its consolidated subsidiaries and affiliates, except where specified or differently required by the context; (ii) the “Brazilian government” are references to the federal government of the Federative Republic of Brazil, or Brazil; (iii) “preferred shares” are references to our authorized and outstanding preferred shares with no par value; and (iv) “common shares” are references to our authorized and outstanding common shares with no par value. All references to “ADSs” are to American Depositary Shares, each representing one preferred share, without par value. The ADSs are evidenced by American Depositary Receipts, or “ADRs,” issued by The Bank of New York Mellon, or BNY Mellon. All references herein to the “real,” “reais” or “R$” are to the Brazilian real, the official currency of Brazil. All references to “US$,” “dollars” or “U.S. dollars” are to United States dollars.
Additionally, unless specified or the context indicates otherwise, the following definitions apply throughout this annual report:
| • | “Itaú Unibanco” means Itaú Unibanco S.A., together with its consolidated subsidiaries; |
| • | “Itaú BBA” means Banco Itaú BBA S.A., together with its consolidated subsidiaries; |
| • | “Central Bank” means the Central Bank of Brazil; |
| • | “CLP” means the Chilean peso, the official currency of Chile; |
| • | “CMN” means the Brazilian National Monetary Council; and |
| • | “CVM” means the Securities and Exchange Commission of Brazil. |
Additionally, acronyms used repeatedly, defined and technical terms, specific market expressions and the full names of our main subsidiaries and other entities referenced in this annual report are explained or detailed in the section entitled “Glossary”.
This annual report contains statements that are or may constitute forward-looking statements within the meaning of Section 27A of the United States Securities Act of 1933, as amended, or the Securities Act, and Section 21E of the U.S. Securities Exchange Act of 1934, as amended, or Exchange Act. We have based these forward-looking statements largely on our current expectations and projections about future events and financial trends affecting our business. These forward-looking statements are subject to risks, uncertainties and assumptions including, among other risks:
| • | General economic, political, and business conditions in Brazil and variations in inflation indexes, interest rates, foreign exchange rates, and the performance of financial markets; |
| • | General economic and political conditions, in particular in the countries where we operate; |
| • | Government regulations and tax laws and amendments to such regulations and laws; |
| • | Developments in high-profile investigations currently in progress and their impact on customers or on our tax exposures; |
| • | Disruptions and volatility in the global financial markets; |
| • | Increases in compulsory deposits and reserve requirements; |
| • | Regulation and liquidation of our business on a consolidated basis; |
| • | Obstacles for holders of our shares and ADSs to receive dividends; |
| • | Failure or hacking of our security and operational infrastructure or systems; |
| • | Our ability to protect personal or other data; |
| • | Strengthening of competition and industry consolidation; |
| • | Changes in our loan portfolio and changes in the value of our securities and derivatives; |
| • | Losses associated with counterparty exposure; |
| • | Our exposure to the Brazilian public debt; |
| • | Incorrect pricing methodologies for insurance, pension plan and premium bond products and inadequate reserves; |
| • | The effectiveness of our risk management policy; |
1
Table of Contents
| • | Damage to our reputation; |
| • | The capacity of our controlling stockholder to conduct our business; |
| • | Difficulties during the integration of acquired or merged businesses; |
| • | Effects from socio-environmental issues; and |
| • | Other risk factors as set forth under “Item 3D. Risk Factors.” |
The words “believe”, “may”, “will”, “estimate”, “continue”, “anticipate”, “intend”, “expect” and similar words are intended to identify forward-looking statements, but are not the exclusive means of identifying such statements. We undertake no obligation to update publicly or revise any forward-looking statements because of new information, future events or otherwise. In light of these risks and uncertainties, the forward-looking information, events and circumstances discussed in this annual report might not occur. Our actual results and performance could differ substantially from those anticipated in such forward-looking statements.
Presentation of Financial and Other Information
The information found in this annual report is accurate only as of the date of such information or as of the date of this annual report, as applicable. Our activities, our financial position and assets, the results of transactions and our prospects may have changed since that date.
Information contained in or accessible through our website or any other websites referenced herein does not form part of this annual report unless we specifically state that it is incorporated by reference and forms part of this annual report. All references in this annual report to websites are inactive textual references and are for information only.
Certain amounts and percentages included in this annual report, including in the section of this annual report entitled “Item 5. Operating and Financial Review and Prospects” have been rounded for ease of presentation. Percentage figures included in this annual report have not been calculated in all cases on the basis of the rounded figures but on the basis of the original amounts prior to rounding. For this reason, certain percentage amounts in this annual report may vary from those obtained by performing the same calculations using the figures in the audited consolidated financial statements. Certain other amounts that appear in this annual report may not sum due to rounding.
This annual report contains information, including statistical data, about certain markets and our competitive position. Except as otherwise indicated, this information is taken or derived from external sources. We indicate the name of the external source in each case where industry data is presented in this annual report. We cannot guarantee and we have not independently verified the accuracy of information taken from external sources, or that, in respect of internal estimates, a third party using different methods would obtain the same estimates as the estimates we present in this annual report.
About our Financial Information
The reference date for the quantitative information for balances found in this annual report is as of December 31, 2018 and the reference date for results is the year ended December 31, 2018, except where otherwise indicated.
Our fiscal year ends on December 31 and, in this annual report, any reference to any specific fiscal year is to the twelve-month period ended on December 31 of that year.
Our audited consolidated financial statements, included elsewhere in this annual report, are prepared in accordance with IFRS, as issued by the IASB. Unless otherwise stated all audited consolidated financial information related to the years ended December 31, 2018, 2017 and 2016 included in this annual report was prepared in accordance with IFRS. The consolidated financial information as of and for the years ended December 31, 2015 and 2014 has been derived from our historical financial statements, which are not included in this annual report, but was not restated for the retrospective application of IFRS 9 as our management cannot provide this financial information without unreasonable effort or expense.
2
Table of Contents
We use accounting practices adopted in Brazil applicable to institutions authorized to operate by the Central Bank, or Brazilian GAAP, for our reports to Brazilian stockholders, filings with the CVM, and calculation of payments of dividends and tax liabilities.
The CMN establishes that financial institutions meeting certain criteria, such as us, are required to present audited consolidated financial statements in accordance with IFRS as issued by the IASB, in addition to financial statements under Brazilian GAAP.
Please see “Note 30 – Segment Information” to our audited consolidated financial statements for further details about the main differences between our management reporting systems and the audited consolidated financial statements prepared in accordance with IFRS.
Our audited consolidated financial statements as of December 31, 2018 and 2017 and for each of the years ended December 31, 2018, 2017 and 2016 were audited by PricewaterhouseCoopers Auditores Independentes, or PwC, independent auditors, as stated in its audit report contained in this Form 20-F.
Please see “Note 2 – Significant Accounting Policies” to our audited consolidated financial statements for further details about the significant accounting policies applied in the preparation of our audited consolidated financial statements in accordance with IFRS.
| ITEM 1. | IDENTITY OF DIRECTORS, SENIOR MANAGEMENT AND ADVISORS |
Not applicable.
| ITEM 2. | OFFER STATISTICS AND EXPECTED TIMETABLE |
Not applicable.
3
Table of Contents
| ITEM 3. | KEY INFORMATION |
| 3A. | Selected Financial Data |
We present below our selected financial data derived from our audited consolidated financial statements as of and for the years ended December 31, 2018, 2017 and 2016 which have been prepared in accordance with IFRS as issued by IASB. The audited consolidated financial data as of and for the years ended December 31, 2015 and 2014 has been derived from our historical financial statements, which are not included herein, but was not restated for the retrospective application of IFRS 9 as our management cannot provide this financial information without unreasonable effort or expense.
The following selected financial data should be read together with “Presentation of Financial and Other Information,” “Item 4B. Business Overview—Selected Statistical Information” and “Item 5. Operating and Financial Review and Prospects”.
| Assets |
As of December 31, | Variation | ||||||||||||||||||||||||||
| 2018 | 2017(1) | 2016(1) | 2018-2017 | % | 2017-2016 | % | ||||||||||||||||||||||
| (In millions of R$, except percentages) | ||||||||||||||||||||||||||||
| Cash |
37,159 | 18,749 | 18,542 | 18,410 | 98.2 | 207 | 1.1 | |||||||||||||||||||||
| Financial Assets |
1,424,876 | 1,330,251 | 1,246,833 | 94,625 | 7.1 | 83,418 | 6.7 | |||||||||||||||||||||
| Compulsory deposits in the Central Bank of Brazil |
94,148 | 98,837 | 85,700 | (4,689 | ) | (4.7 | ) | 13,137 | 15.3 | |||||||||||||||||||
| At Amortized Cost |
994,759 | 905,729 | 902,289 | 89,030 | 9.8 | 3,440 | 0.4 | |||||||||||||||||||||
| Interbank deposits |
26,420 | 29,048 | 22,688 | (2,628 | ) | (9.0 | ) | 6,360 | 28.0 | |||||||||||||||||||
| Securities purchased under agreements to resell |
280,136 | 244,707 | 265,050 | 35,429 | 14.5 | (20,343 | ) | (7.7 | ) | |||||||||||||||||||
| Securities |
110,395 | 111,424 | 102,568 | (1,029 | ) | (0.9 | ) | 8,856 | 8.6 | |||||||||||||||||||
| Loan operations and lease operations portfolio |
536,091 | 497,719 | 494,851 | 38,372 | 7.7 | 2,868 | 0.6 | |||||||||||||||||||||
| Other financial assets |
75,090 | 59,568 | 53,895 | 15,522 | 26.1 | 5,673 | 10.5 | |||||||||||||||||||||
| (-) Provision for Expected Loss |
(33,373 | ) | (36,737 | ) | (36,763 | ) | 3,364 | (9.2 | ) | 26 | (0.1 | ) | ||||||||||||||||
| At Fair Value Through Other Comprehensive Income |
49,323 | 52,149 | 40,039 | (2,826 | ) | (5.4 | ) | 12,110 | 30.2 | |||||||||||||||||||
| Securities |
49,323 | 52,149 | 40,039 | (2,826 | ) | (5.4 | ) | 12,110 | 30.2 | |||||||||||||||||||
| At Fair Value Through Profit or Loss |
286,646 | 273,536 | 218,805 | 13,110 | 4.8 | 54,731 | 25.0 | |||||||||||||||||||||
| Securities |
263,180 | 250,693 | 194,574 | 12,487 | 5.0 | 56,119 | 28.8 | |||||||||||||||||||||
| Derivatives |
23,466 | 22,843 | 24,231 | 623 | 2.7 | (1,388 | ) | (5.7 | ) | |||||||||||||||||||
| Investments in associates and joint ventures |
12,019 | 5,055 | 5,073 | 6,964 | 137.8 | (18 | ) | (0.4 | ) | |||||||||||||||||||
| Fixed assets, net |
7,302 | 7,359 | 8,042 | (57 | ) | (0.8 | ) | (683 | ) | (8.5 | ) | |||||||||||||||||
| Goodwill and Intangible assets, net |
19,329 | 19,383 | 17,056 | (54 | ) | (0.3 | ) | 2,327 | 13.6 | |||||||||||||||||||
| Tax assets |
42,830 | 44,249 | 45,081 | (1,419 | ) | (3.2 | ) | (832 | ) | (1.8 | ) | |||||||||||||||||
| Income tax and social contribution - current |
2,831 | 2,336 | 2,703 | 495 | 21.2 | (367 | ) | (13.6 | ) | |||||||||||||||||||
| Income tax and social contribution - deferred |
32,781 | 35,869 | 38,202 | (3,088 | ) | (8.6 | ) | (2,333 | ) | (6.1 | ) | |||||||||||||||||
| Other |
7,218 | 6,044 | 4,176 | 1,174 | 19.4 | 1,868 | 44.7 | |||||||||||||||||||||
| Other assets |
9,282 | 11,193 | 10,687 | (1,911 | ) | (17.1 | ) | 506 | 4.7 | |||||||||||||||||||
| Total assets |
1,552,797 | 1,436,239 | 1,351,314 | 116,558 | 8.1 | 84,925 | 6.3 | |||||||||||||||||||||
|
|
|
|
|
|
|
|
|
|
|
|
|
|
|
|||||||||||||||
| (1) | Restated to take into account the effect of IFRS 9, which we retroactively adopted as of January 1, 2016. |
4
Table of Contents
| Assets (1) |
As of December 31, | Variation | ||||||||||||||
| 2015 | 2014 | 2015-2014 | % | |||||||||||||
| (In millions of R$, except percentages) | ||||||||||||||||
| Cash and deposits on demand |
18,544 | 17,527 | 1,017 | 5.8 | ||||||||||||
| Central Bank compulsory deposits |
66,556 | 63,106 | 3,450 | 5.5 | ||||||||||||
| Interbank deposits |
30,525 | 23,081 | 7,444 | 32.3 | ||||||||||||
| Securities purchased under agreements to resell |
254,404 | 208,918 | 45,486 | 21.8 | ||||||||||||
| Financial assets held for trading |
164,311 | 132,944 | 31,367 | 23.6 | ||||||||||||
| Financial assets designated at fair value through profit or loss |
642 | 733 | (91 | ) | (12.4 | ) | ||||||||||
| Derivatives |
26,755 | 14,156 | 12,599 | 89.0 | ||||||||||||
| Available-for-sale financial assets |
86,045 | 78,360 | 7,685 | 9.8 | ||||||||||||
| Held-to-maturity financial assets |
42,185 | 34,434 | 7,751 | 22.5 | ||||||||||||
| Loan operations and lease operations portfolio, net |
447,404 | 430,039 | 17,365 | 4.0 | ||||||||||||
| Loan operations and lease operations portfolio |
474,248 | 452,431 | 21,817 | 4.8 | ||||||||||||
| (-) Allowance for loan and lease losses |
(26,844 | ) | (22,392 | ) | (4,452 | ) | 19.9 | |||||||||
| Other financial assets |
53,506 | 53,649 | (143 | ) | (0.3 | ) | ||||||||||
| Investments in associates and joint ventures |
4,399 | 4,090 | 309 | 7.6 | ||||||||||||
| Goodwill |
2,057 | 1,961 | 96 | 4.9 | ||||||||||||
| Fixed assets, net |
8,541 | 8,711 | (170 | ) | (2.0 | ) | ||||||||||
| Intangible assets, net |
6,295 | 6,134 | 161 | 2.6 | ||||||||||||
| Tax assets |
52,149 | 35,243 | 16,906 | 48.0 | ||||||||||||
| Assets held for sale |
486 | 196 | 290 | 148.0 | ||||||||||||
| Other assets |
11,611 | 13,921 | (2,310 | ) | (16.6 | ) | ||||||||||
| Total assets |
1,276,415 | 1,127,203 | 149,212 | 13.2 | ||||||||||||
|
|
|
|
|
|
|
|
|
|||||||||
| (1) | The consolidated financial information as of and for the years ended December 31, 2015 and 2014 has been derived from our historical financial statements but was not restated for the retrospective application of IFRS 9 as management cannot be provided this financial information without unreasonable effort or expense. |
5
Table of Contents
| Liabilities and stockholders’ equity |
As of December 31, | Variation | ||||||||||||||||||||||||||
| 2018 | 2017(1) | 2016(1) | 2018-2017 | % | 2017-2016 | % | ||||||||||||||||||||||
| (In millions of R$, except percentages) | ||||||||||||||||||||||||||||
| Financial Liabilities |
1,151,237 | 1,056,717 | 1,012,075 | 94,520 | 8.9 | 44,642 | 4.4 | |||||||||||||||||||||
| At Amortized Cost |
1,119,734 | 1,024,584 | 982,116 | 95,150 | 9.3 | 42,468 | 4.3 | |||||||||||||||||||||
| Deposits |
463,424 | 402,938 | 329,414 | 60,486 | 15.0 | 73,524 | 22.3 | |||||||||||||||||||||
| Securities sold under repurchase agreements |
330,237 | 312,634 | 349,164 | 17,603 | 5.6 | (36,530 | ) | (10.5 | ) | |||||||||||||||||||
| Interbank market debt |
134,670 | 124,587 | 129,648 | 10,083 | 8.1 | (5,061 | ) | (3.9 | ) | |||||||||||||||||||
| Institutional market debt |
93,974 | 98,482 | 96,239 | (4,508 | ) | (4.6 | ) | 2,243 | 2.3 | |||||||||||||||||||
| Other financial liabilities |
97,429 | 85,943 | 77,651 | 11,486 | 13.4 | 8,292 | 10.7 | |||||||||||||||||||||
| At Fair Value Through Profit or Loss |
27,711 | 27,211 | 25,217 | 500 | 1.8 | 1,994 | 7.9 | |||||||||||||||||||||
| Derivatives |
27,519 | 26,746 | 24,698 | 773 | 2.9 | 2,048 | 8.3 | |||||||||||||||||||||
| Structured notes |
192 | 465 | 519 | (273 | ) | (58.7 | ) | (54 | ) | (10.4 | ) | |||||||||||||||||
| Provision for Expected Loss |
3,792 | 4,922 | 4,742 | (1,130 | ) | (23.0 | ) | 180 | 3.8 | |||||||||||||||||||
| Loan Commitments |
2,601 | 3,015 | 2,761 | (414 | ) | (13.7 | ) | 254 | 9.2 | |||||||||||||||||||
| Financial Guarantees |
1,191 | 1,907 | 1,981 | (716 | ) | (37.5 | ) | (74 | ) | (3.7 | ) | |||||||||||||||||
| Reserves for insurance and private pension |
201,187 | 181,232 | 154,076 | 19,955 | 11.0 | 27,156 | 17.6 | |||||||||||||||||||||
| Provisions |
18,613 | 19,736 | 20,909 | (1,123 | ) | (5.7 | ) | (1,173 | ) | (5.6 | ) | |||||||||||||||||
| Tax liabilities |
5,284 | 7,836 | 4,950 | (2,552 | ) | (32.6 | ) | 2,886 | 58.3 | |||||||||||||||||||
| Income tax and social contribution - current |
2,058 | 3,175 | 1,741 | (1,117 | ) | (35.2 | ) | 1,434 | 82.4 | |||||||||||||||||||
| Income tax and social contribution - deferred |
447 | 391 | (289 | ) | 56 | 14.3 | 680 | (235.3 | ) | |||||||||||||||||||
| Other |
2,779 | 4,270 | 3,498 | (1,491 | ) | (34.9 | ) | 772 | 22.1 | |||||||||||||||||||
| Other liabilities |
26,010 | 26,362 | 26,920 | (352 | ) | (1.3 | ) | (558 | ) | (2.1 | ) | |||||||||||||||||
| Total liabilities |
1,402,331 | 1,291,883 | 1,218,930 | 110,448 | 8.5 | 72,953 | 6.0 | |||||||||||||||||||||
| Capital |
97,148 | 97,148 | 97,148 | 0 | 0.0 | 0 | 0.0 | |||||||||||||||||||||
| Treasury shares |
(1,820 | ) | (2,743 | ) | (1,882 | ) | 923 | (33.6 | ) | (861 | ) | 45.7 | ||||||||||||||||
| Additional paid-in capital |
2,120 | 1,930 | 1,785 | 190 | 9.8 | 145 | 8.1 | |||||||||||||||||||||
| Appropriated reserves |
13,480 | 12,499 | 3,443 | 981 | 7.8 | 9,056 | 263.0 | |||||||||||||||||||||
| Unappropriated reserves |
29,666 | 26,030 | 23,740 | 3,636 | 14.0 | 2,290 | 9.6 | |||||||||||||||||||||
| Cumulative other comprehensive income |
(3,812 | ) | (3,486 | ) | (4,139 | ) | (326 | ) | 9.4 | 653 | (15.8 | ) | ||||||||||||||||
| Total stockholders’ equity attributed to the owners of the parent company |
136,782 | 131,378 | 120,095 | 5,404 | 4.1 | 11,283 | 9.4 | |||||||||||||||||||||
| Non-controlling interests |
13,684 | 12,978 | 12,289 | 706 | 5.4 | 689 | 5.6 | |||||||||||||||||||||
| Total stockholders’ equity |
150,466 | 144,356 | 132,384 | 6,110 | 4.2 | 11,972 | 9.0 | |||||||||||||||||||||
| Total liabilities and stockholders’ equity |
1,552,797 | 1,436,239 | 1,351,314 | 116,558 | 8.1 | 84,925 | 6.3 | |||||||||||||||||||||
|
|
|
|
|
|
|
|
|
|
|
|
|
|
|
|||||||||||||||
| (1) | Restated to take into account the effect of IFRS 9, which we retroactively adopted as of January 1, 2016. |
6
Table of Contents
| As of December 31, | Variation | |||||||||||||||
| Liabilities(1) |
2015 | 2014 | 2015-2014 | % | ||||||||||||
| (In millions of R$, except percentages) | ||||||||||||||||
| Deposits |
292,610 | 294,773 | (2,163 | ) | (0.7 | ) | ||||||||||
| Securities sold under repurchase agreements |
336,643 | 288,683 | 47,960 | 16.6 | ||||||||||||
| Financial liabilities held for trading |
412 | 520 | (108 | ) | (20.8 | ) | ||||||||||
| Derivatives |
31,071 | 17,350 | 13,721 | 79.1 | ||||||||||||
| Interbank market debt |
156,886 | 122,586 | 34,300 | 28.0 | ||||||||||||
| Institutional market debt |
93,918 | 73,242 | 20,676 | 28.2 | ||||||||||||
| Other financial liabilities |
68,715 | 71,492 | (2,777 | ) | (3.9 | ) | ||||||||||
| Reserves for insurance and private pension |
129,305 | 109,778 | 19,527 | 17.8 | ||||||||||||
| Liabilities for capitalization plans |
3,044 | 3,010 | 34 | 1.1 | ||||||||||||
| Provisions |
18,994 | 17,027 | 1,967 | 11.6 | ||||||||||||
| Tax liabilities |
4,971 | 4,465 | 506 | 11.3 | ||||||||||||
| Other liabilities |
25,787 | 23,660 | 2,127 | 9.0 | ||||||||||||
| Total liabilities |
1,162,356 | 1,026,586 | 135,770 | 13.2 | ||||||||||||
| Capital |
85,148 | 75,000 | 10,148 | 13.5 | ||||||||||||
| Treasury shares |
(4,353 | ) | (1,328 | ) | (3,025 | ) | 227.8 | |||||||||
| Additional paid-in capital |
1,733 | 1,508 | 225 | 14.9 | ||||||||||||
| Appropriated reserves |
10,067 | 8,210 | 1,857 | 22.6 | ||||||||||||
| Unappropriated reserves |
20,947 | 16,301 | 4,646 | 28.5 | ||||||||||||
| Cumulative other comprehensive income |
(1,290 | ) | (431 | ) | (859 | ) | 199.3 | |||||||||
| Total stockholders’ equity attributed to the owners of the parent company |
112,252 | 99,260 | 12,992 | 13.1 | ||||||||||||
| Non-controlling interests |
1,807 | 1,357 | 450 | 33.2 | ||||||||||||
| Total stockholders’ equity |
114,059 | 100,617 | 13,442 | 13.4 | ||||||||||||
| Total liabilities and stockholders’ equity |
1,276,415 | 1,127,203 | 149,212 | 13.2 | ||||||||||||
|
|
|
|
|
|
|
|
|
|||||||||
| (1) | The consolidated financial information as of and for the years ended December 31, 2015 and 2014 has been derived from our historical financial statements but was not restated for the retrospective application of IFRS 9 as management cannot be provided this financial information without unreasonable effort or expense. |
| For the Year Ended December 31, | Variation | |||||||||||||||||||||||||||
| Statement of Income |
2018 | 2017(*) | 2016(*) | 2018-2017 | % | 2017-2016 | % | |||||||||||||||||||||
| (In millions of R$, except percentages) | ||||||||||||||||||||||||||||
| Banking Product |
104,200 | 111,523 | 118,422 | (7,323 | ) | (6.6 | ) | (6,899 | ) | (5.8 | ) | |||||||||||||||||
| Expected Loss from Financial Assets and Claims |
(10,182 | ) | (20,966 | ) | (24,355 | ) | 10,784 | (51.4 | ) | 3,389 | (13.9 | ) | ||||||||||||||||
| Net Banking Product of Expected Losses from Financial Assets and Claims |
94,018 | 90,557 | 94,067 | 3,461 | 3.8 | (3,510 | ) | (3.7 | ) | |||||||||||||||||||
| General and Administrative Expenses |
(57,538 | ) | (53,494 | ) | (50,905 | ) | (4,044 | ) | 7.6 | (2,589 | ) | 5.1 | ||||||||||||||||
| Tax Expenses |
(6,619 | ) | (7,031 | ) | (8,011 | ) | 412 | (5.9 | ) | 980 | (12.2 | ) | ||||||||||||||||
| Share of profit or (loss) in associates and joint ventures |
747 | 550 | 528 | 197 | 35.8 | 22 | 4.2 | |||||||||||||||||||||
| Current Income Tax and Social Contribution |
(2,564 | ) | (4,539 | ) | (3,898 | ) | 1,975 | (43.5 | ) | (641 | ) | 16.4 | ||||||||||||||||
| Deferred Income Tax and Social Contribution |
(2,405 | ) | (2,818 | ) | (9,765 | ) | 413 | (14.7 | ) | 6,947 | (71.1 | ) | ||||||||||||||||
| Net Income |
25,639 | 23,225 | 22,016 | 2,414 | 10.4 | 1,209 | 5.5 | |||||||||||||||||||||
| Net Income Attributable to Owners of the Parent Company |
24,907 | 23,193 | 21,627 | 1,714 | 7.4 | 1,566 | 7.2 | |||||||||||||||||||||
| Net Income Attributable to Non-Controlling Interests |
732 | 32 | 389 | 700 | 2,187.5 | (357 | ) | (91.8 | ) | |||||||||||||||||||
|
|
|
|
|
|
|
|
|
|
|
|
|
|
|
|||||||||||||||
| (*) | Restated to take into account the effect of IFRS 9, which we retroactively adopted as of January 1,2016. |
7
Table of Contents
| Statement of Income(*) |
For the Year Ended December 31, | Variation | ||||||||||||||
| 2015 | 2014 | 2015-2014 | % | |||||||||||||
| (In millions of R$, except percentages) | ||||||||||||||||
| Banking Product |
92,011 | 91,657 | 354 | 0.4 | ||||||||||||
| Losses on Loans and Claims |
(21,335 | ) | (15,801 | ) | (5,534 | ) | 35.0 | |||||||||
| Banking Product Net of Losses on Loans and Claims |
70,676 | 75,856 | (5,180 | ) | (6.8 | ) | ||||||||||
| General and Administrative Expenses |
(47,626 | ) | (42,550 | ) | (5,076 | ) | 11.9 | |||||||||
| Tax Expenses |
(5,405 | ) | (5,063 | ) | (342 | ) | 6.8 | |||||||||
| Share of profit or (loss) in associates and joint ventures |
620 | 565 | 55 | 9.7 | ||||||||||||
| Current Income Tax and Social Contribution |
(8,965 | ) | (7,209 | ) | (1,756 | ) | 24.4 | |||||||||
| Deferred Income Tax and Social Contribution |
16,856 | 262 | 16,594 | 6,333.6 | ||||||||||||
| Net Income |
26,156 | 21,861 | 4,295 | 19.6 | ||||||||||||
| Net Income Attributable to Owners of the Parent Company |
25,740 | 21,555 | 4,185 | 19.4 | ||||||||||||
| Net Income Attributable to Non-Controlling Interests |
416 | 306 | 110 | 35.9 | ||||||||||||
|
|
|
|
|
|
|
|
|
|||||||||
| (*) | The consolidated financial information as of and for the years ended December 31, 2015 and 2014 has been derived from our historical financial statements but was not restated for the retrospective application of IFRS 9 as management cannot be provided this financial information without unreasonable effort or expense. |
| As of the Year Ended December 31, | ||||||||||||||||||||
| Liquidity and Capital |
2018 | 2017(3) | 2016(3) | 2015(4) | 2014(4) | |||||||||||||||
| (%) | ||||||||||||||||||||
| Loans and leases as a percentage of total deposits(1) |
115.7 | 123.5 | 150.2 | 162.1 | 153.5 | |||||||||||||||
| Total stockholders’ equity as a percentage of total assets(2) |
9.7 | 10.1 | 9.8 | 8.9 | 8.9 | |||||||||||||||
|
|
|
|
|
|
|
|
|
|
|
|||||||||||
| (1) | Loans and leases operations as of year-end divided by total deposits as of year-end. |
| (2) | Total stockholders’ equity as of year-end divided by total assets as of year-end. |
| (3) | Restated to take into account the effect of IFRS 9, which we retroactively adopted as of January 1, 2016. |
| (4) | The consolidated financial information as of and for the years ended December 31, 2015 and 2014 has been derived from our historical financial statements but was not restated for the retrospective application of IFRS 9 as management cannot be provided this financial information without unreasonable effort or expense. |
| For the Year Ended December 31, | ||||||||||||||||||||
| Earnings and Dividends per Share |
2018 | 2017(3) | 2016(3) | 2015(4) | 2014(4) | |||||||||||||||
| (In R$, except number of shares) | ||||||||||||||||||||
| Earnings per share - basic(1)(2) |
||||||||||||||||||||
| Common |
2.56 | 2.38 | 2.21 | 3.91 | 3.26 | |||||||||||||||
| Preferred |
2.56 | 2.38 | 2.21 | 3.91 | 3.26 | |||||||||||||||
| Earnings per share - diluted(1)(2) |
||||||||||||||||||||
| Common |
2.55 | 2.36 | 2.20 | 3.89 | 3.24 | |||||||||||||||
| Preferred |
2.55 | 2.36 | 2.20 | 3.89 | 3.24 | |||||||||||||||
| Dividends and interest on stockholders’ equity per share |
||||||||||||||||||||
| Common |
2.61 | 2.71 | 1.58 | 1.24 | 1.22 | |||||||||||||||
| Preferred |
2.61 | 2.71 | 1.58 | 1.24 | 1.22 | |||||||||||||||
| Weighted average number of shares outstanding -basic(1) |
||||||||||||||||||||
| Common |
4,958,290,359 | 5,021,834,934 | 5,027,611,714 | 3,351,741,143 | 3,351,741,143 | |||||||||||||||
| Preferred |
4,759,872,085 | 4,734,030,111 | 4,756,823,490 | 3,228,881,081 | 3,266,347,063 | |||||||||||||||
| Weighted average number of shares outstanding - diluted(1) |
||||||||||||||||||||
| Common |
4,958,290,359 | 5,021,834,934 | 5,027,611,714 | 3,351,741,143 | 3,351,741,143 | |||||||||||||||
| Preferred |
4,815,473,777 | 4,796,645,028 | 4,821,864,280 | 3,270,734,307 | 3,305,545,129 | |||||||||||||||
|
|
|
|
|
|
|
|
|
|
|
|||||||||||
| (1) | The Extraordinary Stockholders’ Meeting - ESM held on July 27, 2018 approved the split in 50% the Company’s shares of capital stock, and the process was approved by the Central Bank on October 31, 2018. The new shares were included in the share position on November 26, 2018. Thus, for better comparability, the number of shares presented in this item are affected by the split effect. |
| (2) | Earnings per share have been computed following the “two class method” set forth by IAS 33 Earnings Per Share. Please refer to “Note 25 - Earnings per Share” to our audited consolidated financial statements for further details of calculation of earnings per share” and see “Item 8A Consolidated Statements and Other Financial Information—Stockholders’ Payment”. |
| (3) | Restated to take into account the effect of IFRS 9, which we retroactively adopted as of January 1, 2016. |
| (4) | The consolidated financial information as of and for the years ended December 31, 2015 and 2014 has been derived from our historical financial statements but was not restated for the retrospective application of IFRS 9 as management cannot be provided this financial information without unreasonable effort or expense. |
8
Table of Contents
| For the Year Ended December 31, | ||||||||||||||||||||
| Earnings and Dividends per Share |
2018 | 2017(3) | 2016(3) | 2015(4) | 2014(4) | |||||||||||||||
| (In US$) | ||||||||||||||||||||
| Dividends and interest on stockholders’ equity per share(1)(2) |
||||||||||||||||||||
| Common |
0.67 | 0.82 | 0.48 | 0.32 | 0.46 | |||||||||||||||
| Preferred |
0.67 | 0.82 | 0.48 | 0.32 | 0.46 | |||||||||||||||
|
|
|
|
|
|
|
|
|
|
||||||||||||
| (1) | Under Brazilian Corporate Law, we are allowed to pay interest on stockholders’ equity as an alternative to paying dividends to our stockholders. Please refer to “Item 8A. Consolidated Statements and Other Financial Information – Stockholders’ Payment” and “Item 4B. Business Overview - Regulatory Environment”. |
| (2) | Converted into US$ from reais at the selling rate established by the Central Bank at the end of the year in which dividends or interest on stockholders’ equity were paid or declared, as the case may be. |
| (3) | Restated to take into account the effect of IFRS 9, which we retroactively adopted as of January 1, 2016. |
| (4) | The consolidated financial information as of and for the years ended December 31, 2015 and 2014 has been derived from our historical financial statements but was not restated for the retrospective application of IFRS 9 as management cannot be provided this financial information without unreasonable effort or expense. |
| 3B. | Capitalization and Indebtedness |
Not applicable.
| 3C. | Reasons for the Offer and Use of Proceeds |
Not applicable.
| 3D. | Risk Factors |
This section addresses the risks we consider material to our business and an investment in our securities. Should any of the following risks actually occur, our business and financial condition, as well as the value of any investments made in our securities, will be adversely affected. Accordingly, investors should carefully assess the risk factors described below and the information disclosed in this annual report before making an investment decision. The risks described below are those that we currently believe may adversely affect us. Other risks that we currently deem immaterial or that are currently not known to us may also adversely affect us.
Macroeconomic Risks
International Scenario
Changes in economic conditions may adversely affect us.
Our operations are dependent upon the performance of the economies of the countries in which we do business, Latin American countries in particular. Crises and volatility in the financial markets of countries other than Brazil may affect the global financial markets and the Brazilian economy and have a negative impact on our operations.
The demand for credit and financial services, as well as our clients’ ability to pay, is directly impacted by macroeconomic variables, such as economic growth, income, unemployment, inflation, and fluctuations in interest and foreign exchange rates. Therefore, any significant change in the economies of countries in which we do business, Latin American countries in particular, may affect our operations.
The disruptions and volatility in the global financial markets may have significant consequences in the countries in which we operate, such as volatility in the prices of equity securities, interest rates and foreign exchange rates. Higher uncertainty and volatility may result in a slowdown in the credit market and the economy, which, in turn, could lead to higher unemployment rates and a reduction in the purchasing power of consumers. In addition, such events may significantly impair our clients’ ability to perform their obligations and increase overdue or non-performing loan operations, resulting in an increase in the risk associated with our lending activity.
9
Table of Contents
The economic and market conditions of other countries, including the United States, countries of the European Union, and emerging markets, may affect the credit availability and the volume of foreign investments in Brazil and in the countries in which we do business, to varying degrees. Political uncertainty continues to pose a significant risk to the global economic scenario, particularly the possibility of a trade war between the U.S. and China. In the Eurozone, the United Kingdom’s Brexit negotiations and Italy’s fiscal sustainability are risks to financial stability. Crises in these countries may decrease investors’ interest in assets from Brazil and other countries in which we do business, which may materially and adversely affect the market price of our securities, making it more difficult for us to access capital markets and, as a result, to finance our operations in the future.
We are exposed to certain risks that are particular to emerging and other markets
In conducting our businesses in Brazil, as well as other emerging markets, we are subject to political, economic, legal, operational and other risks that are inherent to operating in these countries. Banks that operate in countries considered to be emerging markets, including ours, may be particularly susceptible to disruptions and reductions in the availability of credit or increases in financing costs, which may have a material adverse impact on their operations. In particular, the availability of credit to financial institutions operating in emerging markets is significantly influenced by an aversion to global risk. In addition, any factor impacting investors’ confidence, such as a downgrade sovereign in credit ratings, since the ratings of financial institutions, including ours, tend to be subject to a ceiling based on the sovereign credit rating, or an intervention by a government or monetary authority in one of such markets, may affect the price or availability of resources for financial institutions in any of these markets, which may affect us.
Thus, crises in these countries may decrease investors’ interest in Brazilian assets, which may materially and adversely affect the market price of our securities, making it more difficult for us to access capital markets and, as a result, to finance our operations in the future. Global financial crises, in addition to the Brazilian macroeconomic environment, may also affect in a material and adverse way the market price of securities of Brazilian issuers or lead to other negative effects in Brazil and in the countries in which we operate and have a material adverse effect on us.
Please see “Item 5A. Operating Results—Factors Affecting Our Results of Operations—Brazilian Context” for further details about data and economic indicators.
Domestic Scenario
Brazilian authorities exercise influence over the Brazilian economy. Changes in fiscal, monetary and foreign exchange policies as well as a deterioration of government fiscal accounts, may adversely affect us.
Our operations are highly dependent upon the performance of the Brazilian economy. The demand for credit and financial services, as well as our clients’ ability to make payments when due, is directly impacted by macroeconomic variables, such as economic growth, income, unemployment, inflation, and fluctuations in interest and foreign exchange rates.
After a period of accelerated economic expansion, Brazil’s growth rates began to slow down in 2011 and by 2015 the country was in recession. In 2016, gross domestic product, or GDP, decreased by 3.3% and improved to 1.1% in 2017. In the year ended December 31, 2018, GDP expanded by 1.1%. Growth was impacted by high interest rates, low commodities prices, and high corporate leverage. In the long term, growth may be limited by a number of factors, including structural factors, such as inadequate infrastructure, which entail risks of potential energy shortages and deficiencies in the transportation sector, among others, and lack of qualified professionals, which can reduce the country’s productivity and efficiency levels. Low levels of national savings require relatively large financial flows from abroad, which may falter if political and fiscal instability is perceived by foreign investors. Depending on their intensity, these factors could lead to decreasing employment rates and to lower income and consumption levels, which could result in increased default rates on loans we grant for individuals and non-financial corporations and, therefore, have a material adverse effect on us.
Brazilian authorities intervene from time to time in the Brazilian economy, through changes in fiscal, monetary, and foreign exchange policies, which may adversely affect us. These changes may impact variables that are crucial for our growth strategy (such as foreign exchange and interest rates, liquidity in the currency market, tax burden, and economic growth), thus limiting our operations in certain markets, affecting our liquidity and our client’s ability to pay and, consequently, affecting us.
10
Table of Contents
On October 28, 2018, Jair Bolsonaro was elected as the new President in the Brazilian national elections. A new Congress was also elected in October 2018. The new President took office on January 1, 2019 and the new members of Congress took office in February 2019. The new government’s main challenge is to approve the pivotal reforms to the economy. In Brazil, unlike other countries, many issues demand changing the Constitution, hence, a support of 3/5 of deputies and senators. This is the case, for example, for setting a minimum age for retirement, the main measure in the social security reform. The new government has not formed a formal coalition of parties that achieve this majority and may have a learning curve when dealing with Congress. If the social security reform is not approved, the deterioration of the Brazilian government fiscal accounts would continue and it could generate a loss of confidence by local and foreign investors.
Fiscal
The Brazilian primary public budget result has been in deficit since 2014. If the deterioration of the Brazilian government fiscal accounts continues, it could generate a loss of confidence by local and foreign investors. Regional governments are also facing fiscal concerns due to their high debt burden, declining revenues and inflexible expenditures. The Brazilian Congress approved a ceiling on government spending that will limit primary public expenditure growth to the prior year’s inflation for a period of at least 10 years (beginning in 2017). In the short term, the spotlight will remain on fiscal reforms that are critical for achieving future compliance with the spending limit. A pivotal social security reform proposal was presented for the vote of Congress in February 2019 and the new government affirmed that it will try to approve such proposal in 2019. Diminished confidence in the Brazilian government’s fiscal circumstances could lead to the downgrading of the Brazilian sovereign debt by credit rating agencies, and negatively impact the local economy, causing a depreciation of the Brazilian real, an increase in inflation and interest rates and a deceleration of economic growth, thus adversely affecting our business, results of operations and financial condition.
Monetary
Sudden increases in prices and long periods of high inflation may cause, among other effects, loss of purchasing power and distortions in the allocation of resources in the economy. Measures to combat high inflation rates include a tightening of monetary policy, with an increase in the short-term interest, or SELIC, rate, resulting in restrictions on credit and short-term liquidity, which may have a material adverse effect on us. Changes in interest rates may have a material effect on our net margins, since they impact our funding and credit granting costs. In addition, increases in the SELIC interest rate could reduce demand for credit and increase the costs of our reserves and the risk of default by our clients. Conversely, decreases in the SELIC interest rate could reduce our gains from interest-bearing assets, as well as our net margins.
The Central Bank’s Monetary Policy Committee, or COPOM, was created on June 20, 1996 and is responsible for setting the SELIC interest rate. The COPOM meets eight times a year, every 45 days. The aim in creating the COPOM was to enhance monetary policy transparency and confer adequate regularity to the monetary policy decision-making process. Currently, many central banks around the world follow similar procedures, facilitating the decision-making process, monetary policy transparency and communication with the public.
After reaching 14.25% per annum at the end of 2015, the Central Bank began to cut interest rates in October 2016. In March 2018, the SELIC rate reached 6.50% where it currently remains, despite foreign exchange shocks and the truck drivers stoppage that temporarily affected inflation. The widespread decline in inflation, due to the high level of idle capacity in the Brazilian economy, as well as anchored inflation expectations have resulted in the current stability of the SELIC at historically low levels.
Foreign Exchange
Brazil has a floating foreign exchange rate system, pursuant to which the market establishes the value of the Brazilian real in relation to foreign currencies. However, the Central Bank may intervene in the purchase or sale of foreign currencies for the purpose of easing variations and reducing volatility of the foreign exchange rate. In spite of those interventions, the foreign exchange rate may significantly fluctuate. In addition, in some cases, interventions made with the purpose of avoiding sharp fluctuations in the value of the Brazilian real in relation to other currencies may have the opposite effect, leading to an increase in the volatility of the applicable foreign exchange rate. Instability in foreign exchange rates could negatively impact our business. A potential depreciation of the Brazilian real could result in (i) losses on our liabilities denominated in or indexed to foreign currencies; (ii) a decrease in our ability to pay for obligations denominated in or indexed to foreign currencies, as it would be more costly for us to obtain the foreign currency required to meet such obligations; (iii) a decrease in the ability of our Brazilian borrowers to pay us for debts denominated in or indexed to foreign currencies; and (iv) negative effects on the market price of our securities portfolio. On the other hand, an appreciation of the Brazilian real could cause us to incur losses on assets denominated in or indexed to foreign currencies.
11
Table of Contents
All these changes may impact variables that are crucial for our growth strategy (such as foreign exchange and interest rates, liquidity in the currency market, tax burden, and economic growth), thus limiting our operations in certain markets, affecting our liquidity and our clients’ ability to pay. Uncertainty regarding future economic policies may, in the future, contribute to an increase in the volatility of the Brazilian capital markets, which, in turn, may have an adverse impact on us. Other political, diplomatic, social and economic developments in Brazil and abroad that affect Brazil may also affect us. To summarize, any significant change in the Brazilian economy may affect our operations.
Ongoing high profile anti-corruption investigations in Brazil may affect the perception of Brazil and domestic growth prospects.
Certain relevant Brazilian companies in the energy, infrastructure and oil and gas sectors are facing investigations by the CVM, the SEC, the U.S. Department of Justice, or DOJ, the Brazilian Federal Police and other Brazilian public entities who are responsible for corruption and cartel investigations, in connection with corruption allegations (so called Lava Jato investigations) and, depending on the outcome of such investigations and the time it takes to conclude them, they may face (as some of them already faced) downgrades from credit rating agencies, experience (as some of them already experienced) funding restrictions and have (as some of them already had) a reduction in revenues, among other negative effects. Such negative effects may hinder the ability of those companies to timely honor their financial obligations bringing loses to us as a number of them are our clients. The companies involved in the Lava Jato investigations, a number of which are our clients, may also be (as some of them already have been) prosecuted by investors on the grounds that they were misled by the information released to them, including their financial statements. Moreover, the current corruption investigations have contributed to reduce the value of the securities of several companies. The investment banks (including Itau BBA Securities in NY) that acted as underwriters on public distributions of securities of such investigated companies, and Banco Itau International, private banking vehicle of Itau in Miami, were in the recent past also parties to certain related lawsuits in the U.S., that were either settled or dismissed, and may be parties to other legal proceedings yet to be filed. We cannot predict how long the corruption investigations may continue, or how significant the effects of the corruption investigations may be for the Brazilian economy and for the financial sector that may be investigated for the commercial relationships it may have held with companies and persons involved in Lava Jato investigations. Another high profile investigation, besides Lava Jato, ongoing in Brazil is the so-called Zelotes operation. If the allegations of such investigations are confirmed they may also affect some of our clients and their credit trustworthiness. In March 2016, the Brazilian Internal Revenue Services, or Brazilian IRS, summoned us to account for certain tax proceedings related to BankBoston Brazil which came under investigation in relation to the Zelotes operations. We acquired BankBoston Brazil’s operation from Bank of America in 2006. On December 1, 2016, the Brazilian Federal Police conducted searches at Itaú Unibanco’s premises, to look for documents related to those proceedings, and documents related to payments made to lawyers and consultants that acted on those proceedings. We clarify that the agreement with Bank of America for the acquisition of BankBoston Brazil’s operations included a provision whereby the seller would remain liable and responsible for the conduct of BankBoston’s tax proceedings, including with regard to the retention of lawyers and consultants. Therefore, according to such agreement, any and all payments made by Itaú Unibanco to lawyers and consultants were made strictly on behalf of Bank of America. On July 2017, the Brazilian Federal Public Prosecutor indicted some lawyers and public agents regarding this case, based on their potential participation on the scheme. None of them was Itau´s employees or executives. We remain fully available and will cooperate with the authorities should any further clarification be needed. After reviewing our control procedures and our monitoring systems, we believe we are in compliance with the existing standards, especially related to anti-money laundering standards; notwithstanding, due to the size and breadth of our operations and our commercial relationship with investigated companies or persons, and due to the several banks, both publicly and privately owned, that Itaú Unibanco acquired throughout the last fifteen years, we may also come within the scope of investigations, which may ultimately result in reputational damage, civil or criminal liability. Negative effects on a number of companies may also impact the level of investments in infrastructure in Brazil, which may also lead to lower economic growth.
12
Table of Contents
Legal and Regulatory Risks
Bank Regulations
We are subject to regulation on a consolidated basis and may be subject to liquidation or intervention on a consolidated basis.
We operate in a number of credit and financial services related sectors through entities under our control. For purposes of regulation and supervision, the Central Bank treats us and our subsidiaries and affiliates as a single financial institution. While our consolidated capital base provides financial strength and flexibility to our subsidiaries and affiliates, their individual activities could indirectly put our capital base at risk. Any investigation or intervention by the Central Bank, particularly in the activities carried out by any of our subsidiaries and affiliates, could have a material adverse impact on our other subsidiaries and affiliates and, ultimately, on us. If we or any of our financial subsidiaries become insolvent, the Central Bank may carry out an intervention or liquidation process on a consolidated basis rather than conduct such procedures for each individual entity. In the event of an intervention or a liquidation process on a consolidated basis, our creditors would have claims on our assets and the assets of our consolidated financial subsidiaries. In this case, claims of creditors of the same nature held against us and our consolidated financial subsidiaries would rank equally in respect of payment. If the Central Bank carries out a liquidation or intervention process with respect to us or any of our financial subsidiaries on an individual basis, our creditors would not have a direct claim on the assets of such financial subsidiaries, and the creditors of such financial subsidiaries would have priority in relation to our creditors in connection with such financial subsidiaries’ assets. The Central Bank also has the authority to carry out other corporate reorganizations or transfers of control under an intervention or liquidation process.
Changes in applicable law or regulations may have a material adverse effect on our business.
Changes in the law or regulations applicable to financial institutions in Brazil may affect our ability to grant loans and collect debts in arrears, which may have an adverse effect on us. Our operations could also be adversely affected by other changes, including with respect to restrictions on remittances abroad and other exchange controls as well as by interpretations of the law by courts and agencies in a manner that differs from our legal advisors’ opinions.
In the context of economic or financial crises, the Brazilian government may also decide to implement changes to the legal framework applicable to the operation of Brazilian financial institutions. For example, in response to the global financial crisis which began in late 2007, Brazilian national and intergovernmental regulatory entities, such as the BCBS, proposed regulatory reforms aiming to prevent the recurrence of similar crises, which included a new requirement to increase the minimum regulatory capital (Basel III). Please see “Item 4B. Business Overview—Regulatory Environment—Basel III Framework—Implementation of Basel III in Brazil” for further details about regulatory capital requirements.
Moreover, the Brazilian Congress is considering enacting new legislation that, if signed into law as currently drafted, could have an adverse effect on us. For example, a proposed law to amend the Brazilian consumer protection code would allow courts to modify terms and conditions of credit agreements in certain circumstances, imposing certain difficulties for the collection of amounts from final consumers. Another example is the proposed Private Security Statute that may prohibit foreign capital and participation of financial institutions in cash in transit companies and, as such, limit the number of possible suppliers (security is a relevant part of operating costs). In addition, local or state legislatures may from time to time consider bills intending to impose security measures and standards for customer services, such as setting branch opening hours, requiring 24 hour armed guard personnel and specifications on ATM functioning, among others, that, if signed into law, could affect our operations. More recently, certain bills have passed (and others were proposed) in certain Brazilian states or municipalities that affect our ability to evaluate credit risk and collect outstanding debts. For example, legislators often impose, or aim to impose, restrictions on the ability of creditors to include the information about insolvent debtors in the records of credit protection bureaus. These types of restrictions could also adversely affect our ability to collect outstanding credit.
We also have operations outside of Brazil, including, but not limited to, Argentina, the Bahamas, the Cayman Islands, Chile, Colombia, Paraguay, Portugal, Switzerland, the United Kingdom, the United States and Uruguay. Changes in the laws or regulations applicable to our business in the countries where we operate, or the adoption of new laws, and related regulations, may have an adverse effect on us.
13
Table of Contents
Increases in compulsory deposit requirements may have a material adverse effect on us.
Compulsory deposits are reserves that financial institutions are required to maintain with the Central Bank. Compulsory deposits generally do not provide the same returns as other investments and deposits because a portion of these compulsory deposits does not bear interest; instead, these funds must be held in Brazilian federal government securities and used to finance government programs, including a federal housing program and rural sector subsidies. The Central Bank has periodically changed the minimum level of compulsory deposits reserves that financial institutions are required to maintain with the Central Bank.
Insurance Regulations
Our insurance operation is subject to regulatory agencies, such as SUSEP and ANS. Therefore, we may be affected negatively by the penalties applied by such regulators.
Insurance companies are subject to SUSEP intervention and/or liquidation. In case of insufficient resources, technical reserves, or poor economic health with respect to a regulated entity, SUSEP may appoint an inspector to act within the relevant company. If such intervention does not remedy the issue, SUSEP will forward to CNSP a proposal to withdraw the applicable insurance license. In additional, insurance companies are subject to pecuniary penalties, warnings, suspension of authorization of activities and disqualification to engage in business activities as set in Law.
Health insurance companies are subject to ANS regulations. With respect to companies that are deemed to have financial imbalances or serious economic, financial or administrative irregularities, ANS may order the disposal of the applicable health insurance company’s portfolio, or take other measures such as fiscal or technical direction regime for a period not exceeding 365 days, or extrajudicial liquidation. The penalties established for violations committed by health insurance companies and their directors and officers are: (i) warnings; (ii) pecuniary penalties; (iii) suspension of company’s activities; (iv) temporary disqualification for the exercise of management positions in health insurance companies; (v) permanent disqualification for the exercise of management positions in health insurance companies as well as in open private pension funds, insurance companies, insurance brokers and financial institutions; and (vi) the cancellation of the company’s authorization to operate and sale of its portfolio.
In this sense, our insurance operation may be affected negatively by the penalties applied by SUSEP or ANS, as described above.
The purchase of reinsurance does not hold us harmless against our liability towards our clients if the reinsurer fails to meet its obligations under the reinsurance contracts. As a result, reinsurers’ insolvency or failure to make timely payments under these contracts could have an adverse effect on us, given that we remain liable to our insured policyholders.
Capital Market and Tax Regulations
Holders of our shares and ADSs may not receive any dividends.
Corporations in Brazil are legally required to pay their stockholders a minimum mandatory dividend at least on a yearly basis (except in specific cases provided for in applicable law). Our Bylaws determine that we must pay our stockholders at least 25% of our annual net income calculated and adjusted pursuant to Brazilian Corporate Law. Applicable Brazilian legislation also allows corporations to consider the amount of interest on shareholders’ equity distributed to their stockholders for purposes of calculating the minimum mandatory dividends. The calculation of net income pursuant to the Brazilian Corporate Law may significantly differ from our net income calculated under IFRS.
Brazilian Corporate Law also allows the suspension of the payment of the mandatory dividends in any particular year if our Board of Directors informs our general stockholders’ meeting that such payment would be incompatible with our financial condition. Therefore, upon the occurrence of such event, the holders of our shares and ADSs may not receive any dividends. If this happens, the dividends that were not paid in the particular fiscal year shall be registered as a special reserve and, if not used to cover any losses of subsequent years, the amounts of unpaid dividends still available under such reserve shall be distributed when the financial condition of the corporation allows for such payment.
Furthermore, pursuant to its regulatory powers provided under Brazilian law and banking regulations, the Central Bank may at its sole discretion reduce the dividends or determine that no dividends will be paid by a financial institution if such restriction is necessary to mitigate relevant risks to the Brazilian financial system or the financial institution.
14
Table of Contents
Please see “Item 8A. Consolidated Statements and Other Financial Information—Stockholders’ Payment” and “Item 4B. Business Overview—Regulatory Environment—Basel III Framework—Implementation of Basel III in Brazil.” For further details about CMN’s capital requirements and dividends and interest on capital see “Note 2.4 – Summary of Main Accounting Practices, q) Dividends and Interest on Capital” and “Note 19 – Stockholders’ Equity” to our audited consolidated financial statements.
Tax reforms may adversely affect our operations and profitability.
The Brazilian government regularly amends tax laws and regulations, including by creating new taxes, which can be temporary, and changing tax rates, the basis on which taxes are assessed or the manner in which taxes are calculated, including in respect of tax rates applicable solely to the banking industry. Tax reforms may reduce the volume of our transactions, increase our costs or limit our profitability.
Risks Associated with our Business
Market Risk
The value of our securities and derivatives is subject to market fluctuations due to changes in Brazilian or international economic conditions and, as a result, may subject us to material losses.
Market risk is the risk of losses due to movements in financial market prices.
The securities and derivative financial instruments in our portfolio may cause us to record gains and losses, when sold or marked to market (in the case of trading securities), and may fluctuate considerably from period to period due to domestic and international economic conditions. In addition, we may incur losses from fluctuations in the market value of positions held, including risks associated with transactions subject to variations in foreign exchange rates, interest rates, price indexes, equity and commodity prices.
We cannot predict the amount of realized or unrealized gains or losses for any future period. Gains or losses on our investment portfolio may not contribute to our net revenue in the future or may cease to contribute to our net revenue at levels consistent with more recent periods. We may not successfully realize the appreciation or depreciation now existing in our consolidated investment portfolio or in any assets of such portfolio.
Credit Risks
Past performance of our loan portfolio may not be indicative of future performance, changes in the profile of our business may adversely affect our loan portfolio. In addition, the value of any collateral securing our loans may not be sufficient, and we may be unable to realize the full value of the collateral securing our loan portfolio.
Our historical loan loss experience may not be indicative of our future loan losses. While the quality of our loan portfolio is associated with the default risk in the sectors in which we operate, changes in our business profile may occur due, among other factors, to our organic growth, merger and acquisition activity, changes in local economic and political conditions, a slowdown in customer demand, an increase in market competition, changes in regulation and in the tax regimes applicable to the sectors in which we operate and, to a lesser extent, other related changes in countries in which we operate and in the international economic environment. In addition, the market value of any collateral related to our loan portfolio may fluctuate, from the time we evaluate it at the beginning of the trade to the time such collateral can be executed upon, due to the factors related to changes in economic, political or sectorial factors beyond our control.
For example, in the early part of this decade, Brazilian banks increased their loan portfolio to consumers, particularly in the automotive sector. However, this increased demand for vehicle loans has been followed by a significant rise in the level of consumer indebtedness, leading to high nonperforming loan rates. As a result, many financial institutions recorded higher loan losses due to an increased volume of provisions and a decrease in loans for vehicle acquisition.
Any changes affecting any of the sectors to which we have significant lending exposure, and changes in the value of the collateral securing our loans, may result in a reduction in the value we realize from collateral and in our loan portfolio. Consequentially, it may have an adverse impact on our results of operations and financial condition and it could also adversely affect the growth rate and the mix of our loan portfolio.
15
Table of Contents
In addition, if we are unable to recover sums owed to us under secured loans in default through extrajudicial measures such as restructurings, our last recourse with respect to such loans may be to enforce the collateral secured in our favor by the applicable borrower. Depending on the type of collateral granted, we either have to enforce such collateral through the courts or through extrajudicial measures. However, even where the enforcement mechanism is duly established by the law, Brazilian law allows borrowers to challenge the enforcement in the courts, even if such challenge is unfounded, which can delay the realization of value from the collateral. In addition, our secured claims under Brazilian law will in certain cases rank below those of preferred creditors such as employees and tax authorities. As a result, we may not be able to realize value from the collateral, or may only be able to do so to a limited extent or after a significant amount of time, thereby potentially adversely affecting our financial condition and results of operations.
We may incur losses associated with counterparty exposure risks, including the Brazilian federal government.
We routinely conduct transactions with counterparties in the financial services industry, including brokers and dealers, commercial banks, investment banks, mutual and hedge funds and other institutional clients. Like most Brazilian banks, we also invest in debt securities issued by the Brazilian government. As of December 31, 2018, approximately 19.3% of all our assets and 71.6% of our securities portfolio were comprised of these public debt securities.
We may incur losses if any of our counterparties fail to meet
their contractual obligations, due to bankruptcy, lack of liquidity, operational failure or other reasons that are exclusively attributable to our counterparties. As an example, an eventual failure by the Brazilian government to
make timely payments under the terms of these securities, or a significant decrease in their market value could negatively affect our results in two ways: directly, through portfolio losses, and indirectly, through instabilities that a default in
public debt could cause to the banking system as a whole, particularly since commercial banks’ exposure to government debt is high in countries in which we operate. This counterparty risk may also arise from our entering into reinsurance
agreements or credit agreements pursuant to which counterparties have obligations to make payments to us and are unable to do so, or from our carrying out transactions in the foreign currency market (or other markets) that fail to be settled at the
specified time due to non-delivery by the counterparty, clearing house or other financial intermediary. Their failure to meet their contractual obligations may adversely affect our financial performance.
A downgrade of our ratings may adversely affect our funding cost, our access to capital and debt markets, our liquidity and, as a result, our competitive position.
Credit ratings represent the opinions of independent rating agencies regarding our ability to repay ours indebtedness, and affect the cost and other terms upon which we are able to obtain funding. Each of the rating agencies reviews its ratings and rating methodologies on a periodic basis and may decide on a grade change at any time, based on factors that affect our financial strength, such as liquidity, capitalization, asset quality and profitability.
Under the criteria utilized by the rating agencies, ratings assigned to Brazilian financial institutions, including Itaú Unibanco are constrained by the grades assigned to the Brazilian sovereign. Events that are not subject to our control, such as economic or political crises, may lead to a downgrade of the Brazilian sovereign rating and a corresponding downgrade of the ratings assigned to Itaú Unibanco.
Credit ratings are essential to our capability to raise capital and funding through the issuance of debt and to the cost of such financing. A downgrade or a potential downgrade in our credit ratings could have an adverse impact on our operations, income and risk weighting. This may affect net earnings, capital requirements and return on capital levels, causing a negative impact on our competitive position. Additionally, if our credit ratings were to be downgraded, rating trigger clauses in our financing agreements with other institutions could result in an immediate need to deliver additional collateral to counterparties or taking other actions under some of our derivative contracts, adversely affecting our interest margins and results of operations. Thus, a failure to maintain favorable ratings and outlooks can affect the cost and availability of our financing through the capital markets and other sources of financing, affecting our interest margins and capacity to operate.
16
Table of Contents
Changes or uncertainty in base interest rates could adversely affect us.
A significant portion of our business is conducted in Brazil, where the Central Bank’s Monetary Policy Committee (Comitê de Política Monetária), or COPOM, establishes the target base interest rate for the Brazilian banking system, and uses changes in this rate as an instrument of monetary policy. The base interest rate is the benchmark interest rate payable to holders of certain securities issued by the Brazilian government and traded in the SELIC. In recent years, the SELIC rate, has fluctuated significantly reflecting the corresponding volatility in the macroeconomic scenario and inflationary environment. During 2014, as a result of increased prospects of inflation and macroeconomic instability, COPOM increased the SELIC rate, reaching 11.75% as of December 31, 2014. The continued political instability in Brazil coupled with the sustained inflationary environment continued to be reflected in the SELIC rate, corresponding to an increased rate of 14.25% and 13.75% as of December 31, 2015 and December 31, 2016, respectively. As of December 31, 2017 and September 30, 2018, the SELIC rate was 7.00% and 6.50%, respectively, reflecting a historical low. As of the date of this annual report, the SELIC rate was 6.50%.
A significant portion of our income, expenses and liabilities is directly tied to interest rates. Therefore, our results of operations and financial condition are significantly affected by inflation, interest rate fluctuations and related government monetary policies. In addition, various interest rates and other indices which are deemed to be “benchmarks” (including LIBOR and EURIBOR) are the subject of recent national, international and other regulatory guidance and proposals for reform. Some of these reforms are already effective whilst others are still to be implemented, including the majority of the provisions of the EU Benchmark Regulation (Regulation (EU) 2016/1011), or the Benchmarks Regulation.
In particular, in 2017, the Chief Executive of the U.K. Financial Conduct Authority, or FCA announced that the FCA will no longer persuade or compel banks to submit rates for the calculation of LIBOR after 2021. This announcement indicates that the continuation of LIBOR on the current basis cannot and will not be guaranteed after 2021, and it appears likely that LIBOR will be discontinued or modified by 2021. This and other reforms may cause benchmarks to perform differently than in the past, or to disappear entirely, or have other consequences, which cannot be fully anticipated, which introduce a number of risks for us including legal risks arising from potential changes required to documentation for new and existing transactions, financial risks arising from any changes in the valuation of financial instruments linked to benchmark rates, pricing risks arising from how changes to benchmark indices could impact pricing mechanisms on some instruments, operational risks arising from the potential requirement to adapt information technology systems, trade reporting infrastructure and operational processes, and conduct risks arising from the potential impact of communication with customers and engagement during the transition period. The replacement benchmarks, and the timing of and mechanisms for implementation have not yet been confirmed by central banks. Accordingly, it is not currently possible to determine whether, or to what extent, any such changes would affect us. However, the implementation of alternative benchmark rates may have a material adverse effect on our business, results of operations, financial condition and prospects.
Liquidity Risk
We face risks relating to liquidity of our capital resources.
Liquidity risk, as we understand it, is the risk that we will not have sufficient financial resources to meet our obligations by the respective maturity dates or that we will honor such obligations but at an excessive cost. This risk is inherent in the activities of any commercial or retail bank.
Our capacity and cost of funding may be impacted by a number of factors, such as changes in market conditions (e.g., in interest rates), credit supply, regulatory changes, systemic shocks in the banking sector, and changes in the market’s perception of us, among others.
In scenarios where access to funding is scarce and/or becomes too expensive, and the access to capital markets is either not possible or is limited, we may find ourselves obliged to increase the return rate paid to deposits made to attract more clients and/or to settle assets not compromised and/or potentially devalued so that we will be able to meet our obligations. If the market liquidity is reduced, the demand pressure may have a negative impact on prices, since natural buyers may not be immediately available. Should this happen, we may have a significant negative goodwill on assets, which will impact the bank’s results and financial position. The persistence or worsening of such adverse market conditions or rises in basic interest rates may have a material adverse impact on our capacity to access capital markets and on our cost of funding.
17
Table of Contents
Concentration Risk
We face risks related to market concentration.
Concentration risk is the risk associated with potential high financial losses triggered by significant exposure to particular component of risk, whether it be related to a particular counterparty, industry or geographic concentration. Examples of such risks include significant exposure to a single counterparty, to counterparties operating in the same economic sector or geographical region, or to financial instruments that depend on the same index or currency.
We believe that an excessive concentration with respect to a particular risk factor could generate a relevant financial loss for us, especially if the risk is one described in this annual report. We recognize the importance of this risk and the potential impacts that may affect our portfolio and results of operations.
Hedge Risk
Our hedge strategy may not be able to prevent losses
We use diverse instruments and strategies to hedge our exposures to a number of risks associated with our business, but we may incur losses if such hedges are not effective.
We may not be able to hedge our positions, or do so only partially, or we may not have the desired effectiveness to mitigate our exposure to the diverse risks and market in which we are involved. Any of these scenarios may adversely affect our business and financial results.
Operational Risks
We face risks relating to our operations.
Operational risks, which may arise from errors in the performance of our processes, the conduct of our employees, instability, malfunction or outage of our IT system and infrastructure, or loss of business continuity, or comparable issues with respect to our vendors, may disrupt our businesses and lead to material losses. We face operational risk arising from errors, accidental or premeditated, made in the execution, confirmation or settlement of transactions or from transactions not being properly recorded, evaluated or accounted for. The occurrence of any of these risks may adversely affect our business, financial results and reputations.
We are exposed to failures, deficiency or inadequacy of our internal processes, human error or misconducts and cyberattacks. Additionally, we rely on third-party services. All these factors may adversely affect us.
Due to the high volume of daily processing, we are dependent on technology and management of information, which exposes us to eventual unavailability of systems and infrastructure such as power outages, interruption of telecommunication services, and generalized system failures, as well as internal and external events that may affect third parties with which we do business or that are crucial to our business activities (including stock exchanges, clearing houses, financial dealers or service providers) and events resulting from wider political or social issues, such as cyberattacks or unauthorized disclosures of personal information in our possession. We manage and store certain proprietary information and sensitive or confidential data relating to our clients and to our operations. We may be subject to breaches of the information technology systems we use for these purposes. Additionally, we operate in many geographic locations and are frequently subject to the occurrence of events outside of our control. Despite the contingency plans we have in place, our ability to conduct business in any of these locations may be adversely impacted by a disruption to the infrastructure that supports our business. We are strongly dependent on technology and thus are vulnerable to viruses, worms and other malicious software, including “bugs” and other problems that could unexpectedly interfere with the operation of our systems.
Operating failures, including those that result from human error or fraud, not only increase our costs and cause losses, but may also give rise to conflicts with our clients, lawsuits, regulatory fines, sanctions, interventions, reimbursements and other indemnity costs. Ethical misconduct and non compliance – ethical misconduct or breaches of applicable laws by our businesses or our employees could be damaging to our reputation too, and could result in litigation, regulatory action and penalties. All of which may have a material adverse effect on our business, reputation and results of operations. Operational risk also includes legal risk associated with inadequacy or deficiency in contracts signed by us, as well as penalties due to non compliance with laws and punitive damages to third parties arising from the activities undertaken by us. Additionally, we have essential other services for the proper functioning of our business and technology infrastructure, such as call centers, networks, internet and systems, among others, provided by external or outsourced companies. Impacts on the provision of these services, caused by these companies due to the lack of supply or the poor quality of the contracted services, can affect the conduct of our business as well as our clients. We also rely in certain limited capacities on third-party data management providers whose possible security problems and security vulnerabilities.
18
Table of Contents
Failure to protect personal information could adversely affect us.
We manage and hold confidential personal information of clients in the ordinary course of our business. Although we have procedures and controls to safeguard personal information in our possession, unauthorized disclosures or security breaches could subject us to legal action and administrative sanctions as well as damage that could materially and adversely affect our operating results, financial condition and prospects. Further, our business is exposed to risk from potential non compliance with policies, employee misconduct or negligence and fraud, which could result in regulatory sanctions and reputational or financial harm. In addition, we may be required to report events related to cybersecurity issues, events where client information may be compromised, unauthorized access and other security breaches, to the relevant regulatory authority. Any material disruption or slowdown of our systems could cause information, including data related to client requests, to be lost or to be delivered to our clients with delays or errors, which could reduce demand for our services and products and could materially and adversely affect us.
Failure to adequately protect ourselves against risks relating to cybersecurity could materially and adversely affect us.
We face various cybersecurity risks, including but not limited to: penetration of our information technology systems and platforms, by ill-intentioned third parties, infiltration of malware (such as computer viruses) into our systems, contamination (whether intentional or accidental) of our networks and systems by third parties with whom we exchange data, unauthorized access to confidential client and/or proprietary data by persons inside or outside of our organization, and cyberattacks causing systems degradation or service unavailability that may result in business losses.
Although we have procedures and controls to safeguard our information technology systems and platforms, we are subject to cybersecurity risks. We have seen in recent years computer systems of companies and organizations being targeted, not only by cyber criminals, but also by activists and rogue states. We define cyberattack as any type of offensive maneuver employed by states, nations, individuals, groups or organizations that targets computer information systems, infrastructure, networks and/or personal devices, using varied means, such as denial of service, malware and phishing, for the purpose of stealing, altering or destroying a specific target by hacking into a technological susceptible system. Cyberattacks can range from the installation of viruses on a personal computer to attempts to destroy the infrastructure of entire nations. We are exposed to this risk over the entire lifecycle of information, from the moment it is collected to its processing, transmission, storage, analysis and destruction.
A successful cyberattack may result in unavailability of our services, leak or compromise of the integrity of information and could give rise to the loss of significant amounts of client data and other sensitive information, as well as significant levels of liquid assets (including cash) as well as damage to our image, directly affecting our customers and partners. In addition, cyberattacks could give rise to the disabling of our information technology systems used to service our clients. As attempted attacks continue to evolve in scope and sophistication, we may incur significant costs in our attempt to modify or enhance our protective measures against such attacks, or to investigate or remediate any vulnerability or resulting breach.
If we fail to effectively manage our cybersecurity risk, for example, by failing to update our systems and processes in response to new threats, this could harm our reputation and adversely affect our operating results, financial condition and prospects through the payment of client compensation, regulatory penalties and fines and/or through the loss of assets. In addition, we may also be subject to cyberattacks against critical infrastructures of Brazil or of the other countries where we operate. Our information technology systems are dependent on such critical infrastructure and any cyberattack against such critical infrastructure could negatively affect our ability to service our clients.
In addition, according to the CMN Resolution No. 4,658, dated April 26, 2018, financial institutions must now follow new cyber risk management and cloud outsourcing requirements. Policies and action plans to prevent and respond to cybersecurity incidents must be in place by May 6, 2019, and fully compliant by December 31, 2021. Failure to comply with any of these new regulatory requirements could have an adverse effect on us.
The loss of senior management, or our ability to attract and maintain key personnel, could have a material adverse effect on us.
Our ability to maintain our competitive position and implement our strategy depends on our senior management. The loss of some of the members of our senior management, or our inability to maintain and attract additional personnel, could have a material adverse effect on our operations and our ability to implement our strategy.
19
Table of Contents
Our performance and success are largely dependent on the talents and efforts of highly skilled individuals. Talent attraction and retention is one of the key pillars for supporting the results of our organization, which is focused on client satisfaction and sustainable performance. Our ability to attract, develop, motivate and retain the right number of appropriately qualified people is critical to our performance and ability to thrive globally. Concurrently, we face the challenge to provide a new experience to employees, so that we are able to attract and retain highly-qualified professionals who value environments offering equal opportunities and who wish to build up their careers in dynamic, cooperative workplaces, which encourage diversity and meritocracy and are up to date with new work models. Also, our current business scenario demands not only a careful look at traditional careers, but also at new career paths that are indispensable for our future.
Our performance could be adversely affected if it were unable to attract, retain and motivate key talent. As we are highly dependent on the technical skills of our personnel, including successors to crucial leadership positions, as well as their relationships with clients, the loss of key components of our workforce could make it difficult to compete, grow and manage the business. A loss of such expertise could adversely affect our financial performance, future prospects and competitive position.
Misconduct of our employees or representatives may adversely affect us.
Our business is based on institutional principles (“Our Way”), among which are “it’s only good for us if it’s good for the client” and “ethics are non-negotiable”. However, part of the customer relationship depends on direct interaction with our employees or representatives. We cannot assure you that our individual employees will always comply with our internal policies and that our internal procedures will effectively monitor and identify misbehavior. Deviations in behavior such as inappropriate sales practices and improper use of information may occur. These risks can give rise to customer attrition, need of compensation or reimbursements, litigation and, according to its extension, may expose the institution to reputation risk, financial and credibility losses with the market and regulators.
We may not be able to prevent our officers, employees or third parties acting on our behalf from engaging in situations that qualify as corruption in Brazil or in any other jurisdiction, which could expose us to administrative and judicial sanctions, as well as have an adverse effect to us.
We are subject to Brazilian anticorruption legislation, and similarly-focused legislation of the other countries where we have branches and operations, as well as other anticorruption laws and regulatory regimes with a transnational scope. These laws require the adoption of integrity procedures to mitigate the risk that any person acting on our behalf may offer an improper advantage to a public agent in order to obtain benefits of any kind. Applicable transnational legislation, such as the U.S. Foreign Corrupt Practices Act and U.K. Bribery Act, as well as the applicable Brazilian legislation (mainly Brazilian Law No. 12,846/2013 – Lei Anticorrupção Brasileira), require us, among other things, the maintenance of policies and procedures aimed at preventing any illegal or improper activities related to corruption involving government entities and officials in order to secure any business advantage, and require us to maintain accurate books and a system of internal controls to ensure the accuracy of our books and prevent illegal activities. We have policies and procedures designed to prevent bribery and other corrupt practices. See “Item 4B. Business Overview—Regulatory Environment” for further details. Unauthorized actions by our officers, employees or third parties acting on our behalf in breach of our internal policies may qualify as corruption in Brazil or in other jurisdiction and we could be exposed to administrative and judicial sanctions, accounting errors or adjustments, monetary losses and reputational damages or other adverse effects. The perception or allegations that we, our employees, our affiliates or other persons or entities associated with us have engaged in any such improper conduct, even if unsubstantiated, may cause significant reputational harm and other adverse effects.
20
Table of Contents
We operate in international markets which subject us to risks associated with the legislative, judicial, accounting, regulatory, political and economic risks and conditions specific to such markets, which could adversely affect us or our foreign units.
We operate in various jurisdictions outside of Brazil through branches, subsidiaries and affiliates, and we expect to continue to expand our international presence. We face, and expect to continue to face, additional risks in the case of our existing and future international operations, including:
| • | political instability, adverse changes in diplomatic relations and unfavorable economic and business conditions in the markets in which we currently have international operations or into which we may expand; |
| • | more restrictive or inconsistent government regulation of financial services, which could result in increased compliance costs and/or otherwise restrict the manner in which we provide our services; |
| • | difficulties in managing operations and adapting to cultural differences, including issues associated with (i) business practices and customs that are common in certain foreign countries but might be prohibited by Brazilian law and our internal policies and procedures and (ii) management and operational systems and infrastructures, including internal financial control and reporting systems and functions, staffing and managing of foreign operations, which we might not be able to do effectively or cost-efficiently. |
As we expand into these and additional markets these risks could be more significant and have the potential to have an adverse impact on us.
Strategy Risk
Our business strategy may not provide us the results we expect.
Our strategy and challenges are determined by management based on related assumptions, such as the future economic environment, and the regulatory, political and social scenarios in the regions in which we operate. These assumptions are subject to inaccuracies and risks that might not be identified or anticipated.
Accordingly, the results and consequences arising from any possible inaccurate assumptions may compromise our capacity to fully or partially implement strategies, as well as to achieve the results and benefits expected therefrom, which might give rise to financial losses and reduce the value creation to our stockholders.
Additionally, factors beyond our control, such as, but not limited to, economic and market conditions, changes in laws and regulations and other risk factors stated in this annual report may make it difficult or impossible to implement fully or partially our business model and also our achieving the results and benefits expected from our business plan.
Adverse changes to the political and economic scenario in Latin America may affect some of the challenges we have taken on, such as the internationalization of our business, since our strategy to strengthen our position in other countries is also dependent on the respective economic performance of these countries.
21
Table of Contents
The integration of acquired or merged businesses involves certain risks that may have a material adverse effect on us.
As part of our growth strategy in the Brazilian and Latin American financial sector, we have engaged in a number of mergers, acquisitions and partnerships with other companies and financial institutions in the past and may pursue further such transactions in the future. Until we have signed a definitive agreement, we usually do not comment publicly on possible acquisitions. When we do announce, our stock price may fall depending on the size of the acquisition. Even though we review the companies we plan to acquire, it is generally not viable for these reviews to be complete in all respects. Any such transactions involve risks, such as the possible incurrence of unanticipated costs as a result of difficulties in integrating systems, finance, accounting and personnel platforms, failure in diligence or the occurrence of unanticipated contingencies, as well as the breach of the transaction agreements by counterparties. In addition, we may not achieve the operating and financial synergies and other benefits that we expected from such transactions in a timely manner, on a cost-effective basis or at all. There is also the risk that antitrust and other regulatory authorities may impose restrictions or limitations on the transactions or on the businesses that arise from certain combinations or impose fines or sanctions due to the interpretation by the authorities of irregularities with respect to a corporate merger, consolidation or acquisition.
If we are unable to take advantage of business growth opportunities, cost savings, operating efficiencies, revenue synergies and other benefits we anticipate from mergers and acquisitions, or if we incur greater integration costs than we have estimated, then we may be adversely affected.
Our controlling stockholder has the ability to direct our business.
As of December 31, 2018, IUPAR, our controlling stockholder, directly owned 51.71% of our common shares and 26.15% of our total share capital, giving it the power to appoint and remove our directors and officers and determine the outcome of any action requiring stockholder approval, including transactions with related parties, corporate reorganizations and the timing and payment of dividends.
In addition, IUPAR is jointly controlled by Itaúsa, which, in turn, is controlled by the Egydio de Souza Aranha family, and by Cia. E. Johnston, which in turn is controlled by the Moreira Salles family. The interests of IUPAR, Itaúsa and the Egydio de Souza Aranha and Moreira Salles families may be different from the interests of our other stockholders.
In addition, some of our directors are affiliated with IUPAR and circumstances may arise in which the interests of IUPAR and its affiliates conflict with the interests of our other stockholders. To the extent that these and other conflicting interests exist, our stockholders will depend on our directors duly exercising their fiduciary duties as members of our Board of Directors. Notwithstanding, according to Brazilian Corporation Law the controlling stockholders should always vote in the interest of the Company. In addition, they are prohibited from voting in cases of conflict of interest in the matter to be decided.
Litigation Risk
Unfavorable court decisions involving material amounts for which we have no or partial provisions or in the event that the losses estimated turn out to be significantly higher than the provisions made, may adversely affect our results and financial condition.
As part of the ordinary course of our business, we are subject to, and party to various civil, tax and labor lawsuits, which involve financial risks. Our audited consolidated financial statements only include reserves for probable losses that can be reasonably estimated and eventual expenses that we incur in connection with litigation or administrative proceedings, or as otherwise required by Brazilian law. It is currently not possible to estimate the amount of all potential costs that we may incur or penalties that may be imposed on us other than those amounts for which we have reserves. In the event of unfavorable court decisions involving material amounts for which we have no or partial provisions, or in the event that the losses estimated turn out to be significantly higher than the provisions made, the aggregate cost of unfavorable decisions, may adversely affect our results and financial condition.
Decisions on lawsuits due to government monetary stabilization plans may have a material adverse effect on us.
We are a defendant in lawsuits for the collection of understated inflation adjustment for savings resulting from the economic plans implemented in the 1980s and 1990s by the Brazilian government as a measure to combat inflation.
22
Table of Contents
Itaú Unibanco Holding is a defendant in lawsuits filed by individuals, as well as class actions filed by (i) consumer protection associations; and (ii) the public attorneys’ office (Ministério Público) on behalf of holders of savings accounts. In connection with these class actions, we established provisions upon service of the individual claim requiring the enforcement of a judgment handed down by the judiciary, using the same criteria used to determine the provisions of individual actions.
The STF has issued a number of decisions in favor of the holders of savings accounts, but has not ruled regarding the constitutionality of economic plans and their applicability to savings accounts. Currently, the appeals on this issue are suspended by order of the STF, until there is a definitive decision by the STF regarding the constitutional issue.
In December 2017, under the mediation of the Advocacia-Geral da União (or AGU), the representative entities of banks and the representative entities of holders of savings accounts entered into an agreement with the objective of ending the litigation related to economic plans against the Brazilian banks. The agreement establishes the conditions for the voluntary adhesion of the holders of savings accounts for the receiving of amounts and closure of processes.
The agreement was ratified at a plenary session of the STF on March 1, 2018. The accession of the holders of savings accounts began in May 2018. However, it is not clear how many individuals will actually adhere to the agreement.
As such, in the scenario of low adherence to the agreement and an eventual unfavorable judgment by the STF, the Brazilian banks may incur relevant costs, which could have an adverse effect on our financial position. We are currently concentrating efforts for adherence together with the judicial courts.
Tax assessments may adversely affect us.
As part of the normal course of business, we are subject to inspections by federal, municipal and state tax authorities. These inspections, arising from the divergence in the understanding of the application of tax laws may generate tax assessments which, depending on their results, may have an adverse effect on our financial results. Also due to such proceedings and for other reasons we may be thwarted by a court decision to pay dividends and other distributions to our shareholders.
Please see “Item 8A. Consolidated Statements and Other Financial Information—Legal Proceedings” for further details.
Management Risk Factor
Our policies, procedures and models related to risk control may be ineffective and our results may be adversely affected by unexpected losses.
Our risk management methods, procedures and policies, including our statistical models and tools for risk measurement, such as value at risk, or VaR, for market risk default probability estimation models for credit risk or customer unusual behavior models for fraud detection or money-laundering risk identification, may not be fully effective in mitigating our risk exposure in all economic environments or against all types of risks, including those that we fail to identify or anticipate. Some of our qualitative tools and metrics for managing risk are based on our observations of the historical market behavior. In addition, due to limitations on information available in Brazil, to assess clients’ creditworthiness, we rely largely on credit information available from our own databases, on certain publicly available consumer credit information and other sources. We apply statistical and other tools to these observations and data to quantify our risk exposure. These tools and metrics may fail to predict all types of future risk exposures. These risk exposures, for example, could arise from factors we did not anticipate or correctly evaluate in our statistical models. This would limit our ability to manage our risks. Our losses, therefore, could be significantly greater than indicated by historical measures. In addition, our quantified modeling may not take all risks into account. Our qualitative approach to managing those risks could prove insufficient, exposing us to material unexpected losses.
Our results of operations and financial position depend on our ability to evaluate losses associated with risks to which we are exposed and on our ability to build these risks into our pricing policies. We recognize an allowance for loan losses aiming at ensuring an allowance level compatible with the expected loss, according to internal models credit risk measurement. The calculation also involves significant judgment on the part of our management. Those judgments may prove to be incorrect or change in the future depending on information as it becomes available. These factors may adversely affect us.
23
Table of Contents
Financial Reporting Risks
We make estimates and assumptions in connection with the preparation of our financial statements, and any changes to those estimates and assumptions could have a material adverse effect on our operating results.
In connection with the preparation of our financial statements, we use certain estimates and assumptions based on historical experience and other factors. While we believe that these estimates and assumptions are reasonable under the circumstances, they are subject to significant uncertainties, some of which are beyond our control. Should any of these estimates and assumptions change or prove to have been incorrect, our reported operating results could be materially adversely affected.
As a result of the inherent limitations in our disclosure and accounting controls, misstatements due to error or fraud may occur and not be detected.
Our disclosure controls and procedures are designed to provide reasonable assurance that information required to be disclosed by us in reports we file with or submit to the SEC under the Exchange Act is accumulated and communicated to management, recorded, processed summarized and reported within the time periods specified in SEC rules and forms. We believe that any disclosure controls and procedures or internal controls and procedures, including related accounting controls, can provide only reasonable, not absolute, assurance that the objectives of the control system are met. These inherent limitations include the realities that judgments in decision-making can be faulty and that breakdowns can occur because of simple error or mistake. In addition, controls can be circumvented by the individual acts of some persons, by collusion of two or more people or by an unauthorized override of the controls.
Any failure by us to maintain effective internal control over financial reporting may adversely affect investor confidence in our company and, as a result, the value of investments in our securities.
We are required under the Sarbanes-Oxley Act of 2002 to furnish a report by our management on the effectiveness of our internal control over financial reporting and to include a report by our independent auditors attesting to such effectiveness. Any failure by us to maintain effective internal control over financial reporting could adversely affect our ability to report accurately our financial condition or results of operations. If we are unable to conclude that our internal control over financial reporting is effective, or if our independent auditors determine that we have a material weakness or significant deficiency in our internal control over financial reporting, we could lose investor confidence in the accuracy and completeness of our financial reports, the market prices of our shares and ADSs could decline, and we could be subject to sanctions or investigations by the SEC or other regulatory authorities. Failure to remedy any material weakness in our internal control over financial reporting, or to implement or maintain other effective control systems required of public companies subject to SEC regulation, also could restrict our future access to the capital markets.
Underwriting Risk
Inadequate pricing methodologies for insurance, pension plan and premium bond products may adversely affect us.
Our insurance and pension plan subsidiaries establish prices and calculations for our insurance and pension products based on actuarial or statistical estimates. The pricing of our insurance and pension plan products is based on models that include a number of assumptions and projections that may prove to be incorrect, since these assumptions and projections involve the exercise of judgment with respect to the levels and timing of receipt or payment of premiums, contributions, provisions, benefits, claims, expenses, interest, investment results, retirement, mortality, morbidity, and persistence. We could suffer losses due to events that are contrary to our expectations directly or indirectly based on incorrect biometric and economic assumptions or faulty actuarial bases used for contribution and provision calculations.
Although the pricing of our insurance and pension plan products and the adequacy of the associated reserves are reassessed on a yearly basis, we cannot accurately determine whether our assets supporting our policy liabilities, together with future premiums and contributions, will be sufficient for the payment of benefits, claims, and expenses. Accordingly, the occurrence of significant deviations from our pricing assumptions could have an adverse effect on the profitability of our insurance and pension products. In addition, if we conclude that our reserves and future premiums are insufficient to cover future policy benefits and claims, we will be required to increase our reserves and record these effects in our financial statements, which may have a material adverse effect on us.
24
Table of Contents
Competition Risk
We face risks associated with the increasingly competitive environment, and recent consolidations in the Brazilian banking industry, as well as competition based on technological alternatives to traditional banking services.
The Brazilian market for financial and banking services is highly competitive. We face significant competition from other Brazilian and international banks, in addition to other non-financial companies competing in certain segments of the banking industry in which we operate. These latter competitors may not be subject to the same regulatory and capital requirements that we are and, therefore, may be able to operate with less stringent regulatory requirements. Competition has increased as a result of recent consolidations among financial institutions in Brazil and of regulations that increase the ability of clients to switch business between financial institutions. Furthermore, digital technologies are changing the ways customers access banking services and the competitive environment with respect to such services. The use of digital channels has risen steadily over the past few years. In this context, new competitors are seeking to disrupt existing business models through technological alternatives to traditional banking services. If we are not successfully able to compete with these disruptive business models and markets, we may lose market share and, consequently, lower our margins and profitability. Such increased competition may also adversely affect us by, among other things, limiting our ability to retain or increase our current client base and to expand our operations, or by impacting the fees and rates we adopt, which could reduce our profit margins on banking and other services and products we offer.
Please see “Item 4B. Business Overview—Regulatory Environment—Antitrust Regulation” for further details about the competition on the Brazilian markets.
Reputational Risk
Damage to our reputation could harm our business and outlook.
We are highly dependent on our image and credibility to generate business. A number of factors may tarnish our reputation and generate a negative perception of the institution by our clients, counterparties, stockholders, investors, supervisors, commercial partners and other stakeholders, such as non compliance with legal obligations, making irregular sales to clients, dealing with suppliers with questionable ethics, unauthorized disclosure of client data, inappropriate behavior by our employees, and third-party failures in risk management, among others. In addition, certain significant actions taken by third parties, such as competitors or other market participants, may indirectly damage our reputation with clients, investors and the market in general. If we are unable, or are perceived unable, to properly address these issues we may be subject to penalties, fines, class actions, and regulatory investigations, among others. Damages to our reputation among clients, investors and other stakeholders may have a material adverse effect on our business, financial performance and prospects.
Social and Environmental Risk
We may incur financial losses and damages to our reputation from environmental and social risks.
Environmental and social factors are considered one of the most relevant topics for the business, since they can affect the creation of shared value in the short, medium and long terms, from the standpoint of the organization and its main stakeholders. In addition we also understand social and environmental risk as the risk of potential losses due to exposure to social and environmental events arising from the performance of our activities. For more information about our social and environmental risk management please see “Item 11. Quantitative and Qualitative Disclosures about Market Risk—Social and Environmental Risk.”.
Financial institutions are subject to specific guidelines about the management of social and environmental risks, due to CMN Resolution No. 4,327, as of April 25, 2014, that provided for the implementation by financial institutions of social and environmental responsibility policies containing certain minimum requirements. These rules also provide an obligation for registering environmental and social losses, analysis of the environmental risk in the approval of products and services, among other dispositions. Brazilian Central Bank is responsible for the inspection of the corresponding filings and information and for the implementation of the provisions of such regulation.
We understand that environmental and social issues may affect our activities and the revenue of our clients, causing delays in payments or default, especially in the case of significant environmental and social incidents.
Environmental and social risks become more evident when we finance projects, where should there be environmental damage caused by projects in which we were involved with respect to the financing thereof, we could be deemed to be indirectly responsible for such damage and could consequently be held liable for certain damages.
25
Table of Contents
We also recognize that climate change is one of the major challenges for us, because climate events may affect our activities in our administrative buildings, network of branches and data processing centers and are taken into consideration for all geographical regions in which we operate in Brazil.
Finally, we could suffer damage to our image and brand if we do not fully comply with voluntary commitments, such as in applying the Equator Principles, Principles for Responsible Investment and National Pact for the Eradication of Slave Labor.
Risk Factors for ADS Holders
The relative price volatility and limited liquidity of the Brazilian capital markets may significantly limit the ability of our investors to sell the preferred shares underlying our ADSs, at the price and time they desire
The investment in securities traded in emerging markets frequently involves a risk higher than an investment in securities of issuers from the U.S. or other developed countries, and these investments are generally considered more speculative. The Brazilian securities market is smaller, less liquid, more concentrated and can be more volatile than markets in the U.S. and other countries. Thus, an investor’s ability to sell preferred shares underlying ADSs at the price and time the investor desires may be substantially limited.
The preferred shares underlying our ADSs do not have voting rights, except in specific circumstances.
Pursuant to our Bylaws, the holders of preferred shares and therefore of our ADSs are not entitled to vote in our general stockholders’ meetings, except in specific circumstances. Even in such circumstances, ADS holders may be subject to practical restrictions on their ability to exercise their voting rights due to additional operational steps involved in communicating with these stockholders, as mentioned below.
According to the provisions of the ADSs deposit agreement, in the event of a general stockholders’ meeting, we will provide notice to the depositary bank, which will, to the extent practicable, send such notice to ADS holders and instructions on how such holders can participate in such general stockholders’ meeting, and ADS holders should instruct the depositary bank on how to vote in order to exercise their voting rights. This additional step of instructing the ADS depositary bank may make the process for exercising voting rights longer for ADS holders.
Holders of ADSs may be unable to exercise preemptive rights with respect to our preferred shares
We may not be able to offer the U.S. holders of our ADSs preemptive rights granted to holders of our preferred shares in the event of an increase of our share capital by issuing preferred shares unless a registration statement relating to such preemptive rights and our preferred shares is effective or an exemption from such registration requirements of the Securities Act is available. As we are not obligated to file a registration statement relating to preemptive rights with respect to our preferred shares, we cannot assure that preemptive rights will be offered to you. In the event such registration statement is not filed (or in case filed, not declared effective) or if the exemption from registration is not available, the U.S. holders of our ADSs may not receive any value from the granting of such preemptive rights and have their interests in us diluted.
The surrender of ADSs may cause the loss of the ability to remit foreign currency abroad and of certain Brazilian tax advantages
While ADS holders benefit from the electronic certificate of foreign capital registration obtained in Brazil by the custodian for our preferred shares underlying the ADSs, which permits the depositary bank to convert dividends and other distributions with respect to the preferred shares underlying the ADSs into foreign currency and remit the proceeds abroad, the availability and requirements of such electronic certificate may be adversely affected by future legislative changes.
If an ADS holder surrenders the ADSs and, consequently, receives preferred shares underlying the ADSs, such holder will have to register its investment in the preferred shares with the Central Bank of Brazil either as (i) a Foreign Direct Investment, subject to Law No. 4131/62, which will require an electronic certificate of foreign capital registration, the Electronic Declaratory Registration of Foreign Direct Investment (RDE-IED), or (ii) as a Foreign Investment in Portfolio, subject to Resolution CMN No. 4373/14, which among other requirements, requires the appointment of a financial institution in Brazil as the custodian of the preferred shares and legal representative of the foreign investor in the Electronic Declaratory Registration of Portfolio (RDE – Portfolio). The failure to register the investment in the preferred shares as foreign investment under one of the regimes mentioned above (E.g. RDE – IED or RDE – Portfolio) will impact the ability of the holder to dispose of the preferred shares and to receive dividends. Moreover, upon receipt of the preferred shares underlying the ADSs, Brazilian regulations require the investor to enter into corresponding exchange rate transactions and pay taxes on these exchange rate transactions, as applicable.
26
Table of Contents
The tax treatment for the remittance of dividends and distributions on, and the proceeds from any sale of, our preferred shares is less favorable in case a holder of preferred shares obtains the RDE-IED instead of the RDE-Portfolio. In addition, if a holder of preferred shares attempts to obtain an electronic certificate of foreign capital registration, such holder may incur expenses or suffer delays in the application process, which could impact the investor’s ability to receive dividends or distributions relating to our preferred shares or the return of capital on a timely manner.
The holders of ADSs have rights that differ from those of stockholders of companies organized under the laws of the U.S. or other countries
Our corporate affairs are governed by our Bylaws and Brazilian Corporate Law, which may have legal principles that differ from those that would apply if we were incorporated in the U.S. or in another country. Under Brazilian Corporate Law, the holders of ADSs and the holders of our preferred shares may have different rights with respect to the protection of investor interests, including remedies available to investors in relation to any actions taken by our Board of Directors or the holders of our common shares, which may be different from what is provided in U.S. law or the law of another country.
| ITEM 4. | INFORMATION ON THE COMPANY |
| 4A. | History and Development of the Company |
Our legal and commercial name is Itaú Unibanco Holding S.A. We were incorporated on September 27, 1924. We are organized as a publicly held corporation for an unlimited period of time under the laws of Brazil. Our head offices are located at Praça Alfredo Egydio de Souza Aranha, 100, 04344-902, São Paulo, SP, Brazil and our telephone number is +55-11-5019-1267.
Investor information can be found on our website at www.itau-unibanco.com/ir. Information contained on our website is not incorporated by reference in, and shall not be considered a part of, this annual report. Our agent for service of process in the United States is the general manager of our New York branch, which is located at 767 Fifth Avenue, 50th floor, New York, NY 10153.
History
In 2018, we celebrated the 10th anniversary of the merger between Itaú and Unibanco, adding a new chapter to our 94-year history, and which has hoisted us to the position of Latin America’s largest private bank. Before their paths crossed, both institutions already enjoyed solid track records dating from the first half of the 20th century.
Our story begins in 1924, when the banking section of Casa Moreira Salles started its operations in Minas Gerais, later becoming União dos Bancos Brasileiros and widely known as Unibanco.
The other pillar of our history began with the creation of Banco Central de Crédito S.A. in 1943 in the city of São Paulo. During the early decades of the bank’s life, a merger resulted in the creation of Banco Itaú América and the resulting consolidation of the Itaú brand. Since 1973, we have operated through Banco Itaú S.A., now Itaú Unibanco.
The volatility of the context in which we currently find ourselves, especially with respect to the Brazilian economy, has contributed to increasing our ability to manage risks, get used to scenarios of uncertainty and adapt rapidly to changes.
The 2008 merger between Itaú and Unibanco merger was considered the largest deal in the country’s history. We believe this is especially noteworthy given the difficult moment we experienced in 2008, when the world witnessed a serious financial crisis on the international market.
In spite of this context, we learned from our customers, evolved and created an organization capable of expanding its operations overseas. The result was a new bank with the vocation and ability to foster people’s power of transformation. Ten years later, our market value at December 31, 2018 was R$342.0 billion, three times greater than the total sum of the two organizations in 2008.
This transaction is not the end of the history of two great banks. Rather it is the starting point of an endeavor especially focused on our customers, employees and on the use of the best digital tools to make it easier to use our products.
As part of the merger consolidation process and the construction of Itaú Unibanco, in 2012 we adopted a business model focused on value creation, which takes into account not only our operational and financial expenses, but also the cost of capital allocated to each business line in an effort to achieve proper remuneration. This has meant that our operations are now dedicated to businesses that effectively create shareholder value, stipulating the minimum return required for our operations.
27
Table of Contents
Recent Acquisitions
XP Investimentos S.A.
On May 11, 2017, we entered into a Share Purchase Agreement with XP Controle Participações S.A., G.A. Brasil IV Fundo de Investimento em Participações, and Dyna III Fundo de Investimento em Participações, among others, as sellers, to acquire 49.9% of the capital stock (30.1% of the common shares) of XP Investimentos S.A., a holding company that consolidates all the investments of the XP group, including XP Investimentos Corretora de Câmbio, Títulos e Valores Mobiliários S.A., in the first tranche, or the First Tranche, by means of a capital increase of R$600 million and the acquisition of XP Investimentos S.A.’s shares from the Sellers for R$5.7 billion, provided that such amounts are subject to contractual adjustments. The value attributed to 100% of the total capital stock of XP Investimentos S.A. (before the First Tranche) was approximately R$12 billion.
The First Tranche was approved (i) in March 2018, by CADE, and (ii) in August 2018, by the Central Bank. As a condition, we entered into Concentration Control Agreements (i) with CADE, whereby we undertook (a) if requested, to distribute proprietary investment products through open platforms competing with XP Investimentos S.A. platforms in a non-discriminatory manner; and (b) to not promote the targeting of its customers to XP Investimentos S.A. platforms; and (ii) with the Central Bank, whereby we undertook: (a) not to acquire control of XP Investimentos S.A. for 8 years counted from the execution of the CCA; and (b) to cancel our call options and XP Controle’s put options.
In August 2018, we closed the First Tranche and, together with some of the Sellers, entered into a shareholders’ agreement which contains, among others, provisions with respect to our rights as a minority shareholder, including our right to appoint two out of the seven members of the Board of Directors of XP Investimentos S.A.
Subject to the Central Bank’s approval, in 2022, we will acquire an additional percentage of 12.5% of the capital stock of XP Investimentos S.A., increasing our ownership to 62.4% of XP Investimentos S.A.’s capital stock (40% of the common shares), or the Second Tranche.
The management and conduct of business of all companies within XP group, including XP Investimentos S.A., remains independent, segregated and autonomous, preserving the same principles and values that are currently in force. XP Controle’s partners will maintain control of the XP group, and the current directors, officers and executives of XP Investimentos S.A. and other subsidiaries will remain at the forefront of their respective businesses, in order to ensure that XP Investimentos S.A. will continue to act as an open and independent platform, offering a diversified range of proprietary and third party products to its clients, competing freely with other brokers and capital market distributors, including those controlled by us, without any restrictions or barriers.
| 4B. | Business Overview |
Our principal operations are: (i) commercial banking (including insurance, pension plan and capitalization products, credit cards, asset management and a variety of credit products and services for individuals, small and middle-market companies); (ii) corporate and investment banking (Itaú BBA); (iii) consumer credit (financial products and services to our non-accountholders); and (iv) operations with the market and corporations.
Business Strategy
Our strategic objectives fall within two groups: Transformational (which we believe requires the actual transformation of the Itaú Unibanco Group) and Continuous Improvement (which includes issues widely disseminated within the Itaú Unibanco Group, but which require effort for further enhancement). Within the Transformational group, our strategic objectives are customer satisfaction, digital transformation and people management. Within the Continuous Improvement group, our strategic objectives are risk management, sustainable profitability and internationalization.
Customer Satisfaction
Our customers’ demands are constantly evolving. This presents us with the challenge of serving them well, respecting their characteristics and preferences. We aim to be the benchmark in customer satisfaction for both business and individual customers. To do this, we focus on the project rather than the product, noting how we provide solutions and how we relate to customers on a continuous basis.
28
Table of Contents
To transform our customers’ experience, we seek inspiration from companies that are leaders in customer satisfaction, regardless of their geographic reach, aiming to “change leagues” and raise our customer satisfaction levels. We undertake to “change leagues” as we are already a leader in customer satisfaction among our Brazilian peers, ending 2018 and 2017 in sixth place for the lowest number of complaints, according to the Central Bank.
Digital Transformation
We use the Itaú Unibanco Group’s intellectual capacity to help people “live the power of digital” by saving time and generating value. Digital products are developed with the customer in mind. We believe that technology is more valuable when used to satisfy our customers. We provide a simple and convenient end-to-end process to meet customers’ expectations, from contact with the customer, to transaction processing, customer service and after sales.
As evidence of our digital transformation, in 2018 we had more than 11 million individual customers using our digital channels, we saw overall growth of 35% and 26% in the number of individual and business customers, respectively, accessing or digital channels on a daily basis. In addition, in 2018 we added over 40 new functionalities in our mobile channels and we had 318 upgrades in our applications (with an average of two updates per month per application).
People Management
In order to “change leagues” in terms of customer satisfaction, we depend on our employees. To this end, we have taken several steps to transform and improve our employees’ experience through their careers within the Itaú Unibanco Group. We believe it is our role to value people as they are, their experiences, characteristics and mindsets, eliminating barriers so that all employees can develop their potential. To afford greater autonomy and comfort in the work space, in addition to encouraging diversity of styles within the Itaú Unibanco Group, we have developed a campaign entitled “Go as I Am,” based on a flexible dress code, while still highlighting the importance of common sense and respect for the context and the day’s business engagements. We also strive to propose new ways of working, such as the home office model, in order to offer greater convenience and flexibility, enhancing efficiency and improving our employees’ quality of life.
In recognition of our efforts, we are the only bank listed in GPTW/Época magazine’s 2018 edition of the “20 Best Companies to Work For.” In addition, for the tenth consecutive year, in 2018, we were listed as one of young people’s “dream companies,” according to the Dream Career survey. Furthermore, in 2018, we were listed in LinkedIn’s “TOP Companies” ranking.
Risk Management
Managing risks is the essence of our business and a responsibility of all employees. We understand that risk management has to incorporate more than its traditional concepts (market risk, credit risk and operational risk), which we closely monitor. Transformations in our business environment demand that we monitor and take a pro-active approach to other types of risk, such as new technologies with disruptive potential, obsolescence of legacy systems, data and models, new entrants and traditional competition, changes in customers’ habits, new business models, changes in laws and rules, fostering competition and innovation, new regulations, attracting and retaining talent and new work methods.
Sustainable Profitability
We strive to continuously enhance the efficiency of our operations, identifying opportunities for reducing costs, managing our investments to make us more agile and increased efficiency in the management of capital allocations using the appropriate cost of capital. We have undertaken initiatives ranging from the reduction of waste and structural reviews, to projects for enhancing productivity and digitalization. In this way, we hope to expand economies of scale while ensuring synergies for the business.
Internationalization
As of December 31, 2018, we operate in 19 countries, with 512 branches and 13.5 thousand employees. Internationalization allows us to access new markets and increase in scale. Our internationalization strategy involves two distinct models:
| • | In the Northern Hemisphere, the service units are seeking to strengthen our operations and expand the range of products, optimize and simplify structures and processes and innovate the technology platform. |
| • | In the Southern Cone and at Itaú Corpbanca, we have adopted the universal bank model, operating predominately in Latin America. The aim is to accelerate development and optimize our investments. Our strategy in the Latin American countries provides for attaining the same management standard that we enjoy in Brazil by standardizing practices and creating conditions for us to assume additional positions of leadership. |
29
Table of Contents
Capital Expenditures
For information on our capital expenditures, see “Item 5B. Liquidity and Capital Resources.”
Operations Overview
We report the following segments: (i) Retail Banking, (ii) Wholesale Banking, and (iii) Activities with the Market and Corporation. Through these operational segments, we provide a broad range of banking services to a diverse client base that includes individuals and corporate clients, on an integrated basis as follows:

The Retail Banking segment offers services to a diversified base of account holders and non-account holders, individuals and companies in Brazil. The segment includes retail customers, mass affluent clients (Itaú Uniclass and Personnalité) and very small and small companies. Our offering of products and services in this segment includes: personal loans, credit cards, payroll loans, vehicle financing, mortgage loans, insurance, pension plan and premium bond products, and acquiring services, among others. The Retail Banking segment represents an important funding source for our operations and generates significant financial income and banking fees.
The Wholesale Banking segment is responsible for our private banking clients, the activities of our Latin America units, our middle-market banking business, asset management, capital market solutions, corporate and investment banking activities. Our wholesale banking management model is based on building close relationships with our clients by obtaining an in-depth understanding of our clients’ needs and offering customized solutions. Corporate activities include providing banking services to large corporations and investment banking activities include offering funding resources to the corporate sector, including fixed and variable income instruments.
The Activities with the Market and Corporation segment manages interest income associated with our capital surplus, subordinated debt surplus and the net balance of tax credits and debits. This segment also manages net interest income from the trading of financial instruments through proprietary positions, currency interest rate gaps and other risk factors, arbitrage opportunities in the foreign and Brazilian domestic markets, and mark-to-market of financial instruments. It also includes our interest in Porto Seguro S.A. For more information on our interest in Porto Seguro S.A., see “ —Insurance.”
We carry out a wide range of operations outside of Brazil with units strategically located in the Americas, Europe and Asia. Our international presence creates significant synergies in foreign trade finance, in the placement of Eurobonds and in the offering of more sophisticated financial transactions to our clients.
Please see “Note 30 – Segment Information” to our audited consolidated financial statements for further details.
30
Table of Contents
The diversification of our business is reflected in the changing composition of our loan portfolio over the last few years, focusing on origination in lower risk segments with enhanced guarantees. We continuously seek to implement and focus on offering new products and services that add value to our clients and diversify our income sources. This allows for the growth of our non-financial income arising mainly from banking service fees, income from bank charges and from insurance, pension plan and capitalization operations.
Retail Banking
We have a large and diverse portfolio of products, such as credit and investments, and services to address our clients’ needs. Our retail banking business is segmented according to customer profiles, which allows us to connect with and understand our customers’ needs, better enabling us to offer suitable products to meet their demands. Our main activities under the retail banking segment are the following:
Itaú Retail Banking (individuals)
Our core business is retail banking and through our retail operation we offer a dedicated service structure to consumer clients throughout Brazil. Our customer service structure is targeted to offering the best solutions for each client profile. We classify our retail clients as individuals with a monthly income of up to R$4,000.
Our Itaú Uniclass services are available at every branch for clients who earn more than R$4,000 and less than R$10,000 per month. We offer exclusive services to our Itaú Uniclass clients, including investment advisory services, exclusive cashiers, a special telephone service and higher credit limits and a large team of dedicated relationship managers. For clients who prefer remote services, our Itaú Uniclass provides a “digital bank platform” where relationship managers service clients through telephone, e-mail, SMS, videoconference and online chat from 8 a.m. to 10 p.m. on business days, at no additional cost.
Focusing on our clients’ needs, in 2017 we launched our application Light, which is a smaller version of our full banking app made for our clients that do not have enough capacity on their smartphones to support the full app. We were the first large retail bank in Brazil to offer an online account opening process via mobile app.
Our retail network is focused on building long term relationships with our clients.
Itaú Personnalité (banking for high-income individuals)
We began providing customized services to high-income individuals in 1996 with the creation of the Itaú Personnalité segment, which currently serves individuals who earn more than R$10,000 per month or have investments in excess of R$100,000.
Itaú Personnalité is focused on providing (i) financial advisory services by managers who understand the specific needs of our higher-income clients, (ii) a large portfolio of exclusive products and services and (iii) special benefits based on the type and length of relationship with the client, including discounts on various products and services. Itaú Personnalité services its clients through a dedicated network of 270 branches, located in the main Brazilian cities. Itaú Personnalité clients also have access to our retail banking network of branches and ATMs throughout the country and can also access our internet, telephone and mobile banking.
For clients who prefer remote services, Itaú Personnalité provides a “digital bank platform” where relationship managers service clients through telephone, email, SMS and videoconference from 8 a.m. to 10 p.m. on business days. We also developed apps for smartphones and tablets that enable our clients to make investments, buy products such as credit and insurance, make check deposits, transfers and payments, check account balances and find nearby branches and ATMs using GPS features.
The table below shows our market position and information about competitors for our retail banking (including Itaú Personnalité) business:
| Product/Service | Market Position |
Additional Information and Main Competitors | ||
| Retail Banking (Including Itaú Personnalité) |
In December 2018, we reached a market share of 11.7% based on total outstanding loan balance in reais, positioning us as the third largest bank in this segment in Brazil. |
Itaú Unibanco Holding has a leading position in many sectors of the Brazilian domestic financial market. Based on Central Bank data and publicly available financial information, our main competitors are Banco Bradesco, Banco Santander (Brazil), Banco do Brasil and Caixa Econômica Federal. |
Source: Itaú Unibanco Holding and the Central Bank.
31
Table of Contents
Itaú Empresas (very small and small companies)
To meet and fulfill the needs of our corporate customers, we specialize in offering customized solutions and detailed advice on all products and services for:
| • | Microenterprises: customer base consisting of companies with annual revenues of up to R$1.2 million, served by 3,258 bank branches and 2,077 relationship managers at December 31, 2018; and |
| • | Small businesses: customer base consisting of companies with annual revenues between R$1.2 million and R$ 30 million, served by 359 bank branches and 1,639 relationship managers at December 31, 2018. |
ANBIMA certifies all of our relationship managers, who are trained and skilled to offer the appropriate banking solutions for each client, guided by all the variables that can affect the companies that we serve and their owners.
Our customers rely on our main strategy of capturing market opportunities and meeting their needs, particularly regarding cash flow management, credit facilities, investments and banking services.
To improve our credit portfolio and reduce the volume of delinquent loans, we have maintained our 2018 targets focused on sustainable performance. We have improved processes, policies and credit tools, as well as intensified our credit collection and recovery efforts.
To service our customers’ needs, we have redesigned our service model for micro-enterprises, offering a targeted service according to the client’s profile, aiming at greater proximity and profitability of our portfolio.
We created digital agencies to support this new format, aiming for greater efficiency in business generation and service readiness. In addition, we have also prospectively increased our commercial sales force aimed at attracting new customers.
We aim at maintaining high levels of customer satisfaction by always having a customer centric business approach. To achieve this goal, we implemented follow-ups of customer satisfaction through periodic and detailed indicators for transactions and interactions with our managers and other service channels.
We continue our strategy for digital products and services, as well as the development and enhancement of the tools used by our sales and relationship teams and intend to continue to capture and expand the benefits of such investments, measured by increased business productivity and greater proximity to our customers.
Credit Cards and Commercial Agreements
We are the market leader in Brazilian credit cards, based on volume of purchases, according to ABECS. Through proprietary and partnership operations with major retailers, telephone carriers, automakers and airline companies established in Brazil, as of December 31, 2018 we offered a wide range of credit and debit cards to more than 60.5 million account holders and non-account holders.
We work to provide the best customer experience and pursue client satisfaction. Our aim is to continually grow our credit card portfolio, enhance its profitability and manage our asset quality. Accordingly, our credit card division focuses on developing new products and new digital services, increasing our customers ability to obtain financing, assessing our partnerships, and controlling our portfolio’s credit quality.
In June 2017, we launched the Passaí credit card in partnership with Assai, a wholesale business that is part of the Pão de Açúcar group, one of the largest retailers in Brazil and the owner of other important brands with which we also have partnerships, such as Pão de Açúcar, Ponto Frio and Extra. Assai has shown double-digit growth in revenues for the past three years. In 2018, we had points of sales in all of Assai’s physical stores and, we expect to establish a point of sale in every new Assai store. In 2018 we grew card sales by more than three times compared to 2017, reaching more than 501 thousand accounts in the portfolio.
In December 2017, we relaunched our credit card brand Credicard, which was acquired by us in 2013. The occasion was marked with the launch of the new Credicard ZERO. The product has no annual fee, offers various benefits such as discounts with partners like Uber, Decolar.com, and Netshoes. Customer experience is 100% digital through the Credicard mobile application. In December 2018 we had more than 456 thousand accounts in our portfolio of Credicard ZERO.
In March 2018, we launched the Personnalité Visa Infinite credit card in partnership with Multiplus, a leader in the loyalty market. The product was developed specifically for high-income customers and offers a variety of benefits such as free access to more than 850 VIP lounges at airports around the world. In December 2018, we surpassed 17 thousand customers.
32
Table of Contents
In May 2018, Credicard ZERO evolved to an international credit card. The product is now accepted worldwide in all Mastercard enabled terminals. In June 2018, we launched the Credicard Mastercard Black. This credit card offers a unique digital experience in the premium segment, giving customers real benefits and simple rules to waive annual fees. On the digital frontier, our Credicard mobile app evolved and now has a Benefit Store where customers can enjoy discounts with more than 10 merchants. We have also completely redesigned our Credicard credit cards giving them a new modern look.
With regards to customer service, we provide 24 hour per day access to our app. The Itaucard app, directed towards personal card and business card clients, continually adds new functionalities, such as the acquisition of personal loans, unblocking new credit cards, balance checks, product redemption from our loyalty program and purchase dispute for the Credicard portfolio. In October 2018, we also launched Luiza Card App in partnership with Magazine Luiza, a major retailer in Brazil.
As of December 31, 2018 we had more than 4.9 million active users of the Itaucard app and increased our digital clients by almost 56% since 2017. As a percentage of our total credit card sales, this digital channel has grown from 11.4% in 2017 to 18.2% in 2018.
In April 2018, we launched our digital wallets and became pioneer in Brazil with Apple Pay and then with Samsung Pay. By December 2018, we reached more than 1.0 million customers and a market share of 65% in digital wallets purchase volume.
In 2018, we grew our portfolio while maintaining strict credit criteria. The indicators of default and risk of our credit card business continued below the credit card market average. We managed to maintain the default indicator above 90 days substantially at the same level as 2017, 5.70% as of December 31, 2017 compared to 5.35% as of December 31, 2018.
The table below shows the market position and information about competitors for our credit card business:
| Product/Service | Market Position |
Additional Information and Main Competitors | ||
| Credit Cards |
We are the leaders in terms of transaction purchase volume of cards in Brazil, with 42.2% market share in the period from January to December 2018. |
Our traditional competitors in this business are Banco Bradesco, Banco Santander (Brazil), Banco do Brasil and Caixa Econômica Federal. In addition to these main competitors, in recent years an increasing number of small and new digital competitors has entered this market, including Nubank and Banco Original. |
Source: Itaú Unibanco Holding and ABECS.
Payroll Deducted Loans
In Brazil, a payroll deducted loan is a specific type of loan entered into by salaried employees or pensioners of the Brazilian social security system, as borrowers, and banks, as lenders, in which fixed monthly installments are deducted directly from the borrower’s payroll or pension, as the case may be, for the payment of the amount owed to the lender.
Our strategy is directed mainly to the pensioners of the Brazilian social security system and employees of public and private companies.
We offer payroll deducted loans in Brazil mainly through two sales channels: (i) our branch network and our remote service channels, focusing on retail account holders, and (ii) the network of acquisition partners, focusing on non-account holders. This strategy allows us to expand our business activities with historically lower credit risk, achieving a competitive position in the offer, distribution and sale of payroll deducted loans in Brazil and improving the risk profile of our loans portfolio to individuals.
33
Table of Contents
The table below shows our market position and information about competitors for the business listed below:
| Product/Service | Market Position |
Additional Information and Main Competitors | ||
| Payroll Deducted Loans | In December 2018, we obtained a market share of 14.0% in terms of payroll loans, positioning us as the fourth largest bank in this segment in Brazil. |
Our main competitors in this business are Banco do Brasil, Caixa Econômica Federal, Banco Bradesco and Banco Santander (Brazil). |
Source: Itaú Unibanco Holding and the Central Bank.
Mortgage
We assist our clients with their financial development, as we help them with their personal assets. Mortgage financing products allow us to create long-lasting relationships with our clients, as mortgage financing products are of a long-term nature.
Since 2008, we have been the market leaders among Brazilian private banks in mortgage loans to individuals in terms of the total size of our portfolio. This is a result of our business focus, which is in line with our strategy to migrate to lower-risk portfolios.
We have a number of sales channels that are utilized for purposes of mortgage financing products: (i) branch network, (ii) construction and development companies, (iii) mortgage agencies, and (iv) partnerships with REMAX, a realtor company, and CrediPronto, a mortgage financing company.
We prioritize customer satisfaction by providing our clients with a specialized mortgage financing advisor to support them during the mortgage process. Our process is expeditious and efficient, and it takes us less than one hour to get back to the client for loans up to R$800 thousand. This financing process can be fully digital.
In line with our strategic focus on digital processes, our simulator is included on the websites of partner development companies and real estate agencies, placing our brand closer to clients when they are looking to acquire real property. Our services are customized for every moment of the client’s digital journey, from internet banking services to social networks, providing us with increasing client exposure levels. In 2018, we received the “Best Digital Mortgage Bank Brazil” award from the British magazine Global Finance.
The number of mortgages we provided directly to individuals in 2018 was 33 thousand, for an aggregate value of R$9.1 billion during the year. In 2018, our portfolio had an average Loan to Value (LTV) of 38.7%, compared to 40.2% in 2017. In commercial loans, we financed 64 new real estate units during 2018, with an aggregate value of R$2.3 billion.
Another positive feature of the Brazilian market is the constant amortization system pursuant to which decreasing installments provide faster amortization of a contract, reducing our loan-to-value indicator at a faster rate than other amortization systems.
The table below shows our market position and information about competitors for the business listed below:
| Product/Service | Market Position |
Additional Information and Main Competitors | ||
| Real Estate Financing and Mortgages | In the period from January to December 2018 we were the second in new loans to individuals among Brazilian banks, with 22.4% market share. |
Our main bank competitors in this business are Banco Bradesco S.A., Banco Santander (Brazil) S.A., Caixa Econômica Federal and Banco do Brasil S.A. |
Source: Itaú Unibanco Holding and ABECIP.
Merchant Acquirer
Rede is one of the leading companies in the electronic payment solutions industry in Brazil, according to ABECS. It is a multi-brand merchant acquirer of credit, debit and benefit cards. Rede’s activities include merchant acquiring, capturing, transmission, processing and settlement of credit and debit card transactions, prepayment of receivables to merchants (resulting from credit card transactions made in installments), rental of point of sale, or POS, terminals, e-commerce solutions, e-wallet and check verification through POS terminals.
34
Table of Contents
In 2018, we implemented a business restructuring plan, intended to reposition our business relevance and growing our market share by adjusting profitability to lower market levels set by the industry. One initiative we implemented to achieve this was the launch of POP Credicard, a new product aimed at micro-entrepreneur clients.
We received R$437.1 billion in transactions with respect to credit and debit cards as of December 31, 2018, an increase of 11.6% compared to December 31, 2017. The following table sets forth the financial volume of transactions of credit and debit cards processed by us in 2018, 2017 and 2016:
| Financial Volume | ||||||||||||
| (In billions of R$) | ||||||||||||
| Fiscal Year 2018 | Fiscal Year 2017 | Fiscal Year 2016 | ||||||||||
| Credit cards |
280.8 | 255.9 | 251.9 | |||||||||
| Debit cards |
156.3 | 135.8 | 135.4 | |||||||||
|
|
|
|
|
|
|
|||||||
| Total |
437.1 | 391.7 | 387.3 | |||||||||
|
|
|
|
|
|
|
|||||||
The table below shows our market position and information about competitors for the business listed below:
| Product/Service | Market Position |
Additional Information and Main Competitors | ||
| Merchant Acquirer | In the period from January to December, 2018 we reached a market share of 34.0% in terms of total transaction volume (credit and debit) generated by the acquiring services, positioning us as the second largest player in this segment in Brazil. |
Our main competitors in this business are Cielo and Santander GetNet.
In recent years, changes in legislation made by the Central Bank combined with the growing number of payment method fintech companies facilitated the entry of new competitors into this market, such as PagSeguro, Stone and Bin. Some of these new competitors have experienced significant growth. |
Source: Itaú Unibanco Holding and ABECS.
Private Pension Plans
We offer private pension plans to our clients as an option for wealth, inheritance planning and income tax purposes (these products are tax-deferred). We provide our clients with a solution to ensure the maintenance of their quality of life through long-term investments, as a supplement to government general social security system plans.
Product innovation has been important for the sustainable growth of our private sector pension operations. For legal entities, we offer specialized advice and develop customized solutions for each company. We establish long-term partnerships with our corporate clients, maintaining a close relationship with their human resources departments and adopting a communication strategy focused on our employees’ financial education.
According to the National Federation of Private Pension and Life (Federação Nacional de Previdência Privada e Vida), or FENAPREVI, contributions to Itaú Private Pension Plans reached R$26.9 billion in 2018, mainly due to the increase in our VGBL (Redeemable Life Insurance) product.
The table below shows our market position and information about competitors for the business listed below:
| Product/Service | Market Position |
Additional Information and Main Competitors | ||
| Private pension plans | In December, 2018 our balance of provisions represented 23.2% of the market share for private pension plans, positioning us as the third largest private pension provider in Brazil. Considering only Individuals plans, our market share reached 24.0%, positioning us as the largest private bank. |
Our main competitors in private pension plan products are controlled by large commercial banks, such as Banco Bradesco and Banco do Brasil, which, like us, take advantage of their branch network to gain access to the retail market. |
Source: FENAPREVI (Balance of provisions—Pension Plans for Individuals and Companies).
35
Table of Contents
Vehicle Financing
We have developed and launched a series of new products and services during 2018, some of which are described below:
iCarros Products – this classified ads portal offers many solutions to optimize dealers’ sales, such as iCarros Club, a business to business trade-in platform for used vehicles; Leads Manager, a service that integrates leads from different websites in an single interface for the dealer and has WhatsApp communication; Call Qualifier, which records calls and identifies if customers have a pre-approved vehicle financing credit with us; and Stock Integration that automatically synchronizes dealers’ car inventory in different classified websites.
New Credline – a new credit application platform, which is also available in a mobile version, that offers a simple and full experience for dealers, helping them to easily calculate, contract and manage all the financing workflow.
Digital Retail – online calculator and credit application feature that allows customers to quote a vehicle financing anywhere they want to. Due to our open banking system we were able to plug this tool not only in iCarros, but also in many partners’ website, like Jaguar, Land Rover, Fiat Chrysler Automobile, Mitsubishi Motors, and OLX. In July 2018, we became the financial partner of Jaguar and Land Rover in Brazil.
Protected Purchase and Sale (Compra e Venda Protegida) – an escrow account that mediates the payment between the parties involved in customer to customer car sales transactions, making these transactions safer for both buyers and sellers.
As of December 31, 2018, our individual vehicle financing portfolio totaled R$15.9 billion, an 12.9% increase from the previous year. The average loan to value ratio of our vehicle portfolio (the ratio of a loan to the value of an asset purchased) was 60.5% as of December 31, 2018, following a downward trend, compared to 66.5% as of December 31, 2017. Since 2012, we have reduced our risk exposure in the sector and focused on clients with better risk profiles, which has allowed us to improve the credit quality of our vehicle loan portfolio.
In 2018, our new individual and corporate vehicle financing operations reached R$ 14.96 billion, a 42% growth compared to 2017. The average vehicle loan term was 42 months, with 39% of the transactions carried out with terms up to 36 months.
The table below shows our market position and information about competitors for the business listed below:
| Product/Service | Market Position |
Additional Information and Main Competitors | ||
| Vehicles | In December 2018, we reached a market share of 9.3% in terms of loans to individuals among banks, positioning us as third in Brazil in this segment. |
Our main bank competitors in this business are Banco Santander (Brazil), Banco do Brasil and Banco Bradesco. |
Source: Itaú Unibanco Holding and the Central Bank.
Insurance
Our insurance business provides a wide range of life and personal accident products, automobile and property insurance, credit insurance and travel insurance. Our insurance core activities, which include our 30% stake in Porto Seguro S.A, consist of mass-market insurance products related to life, property and credit. These products are offered in synergy with retail channels – our branch network, partnerships with retailers, credit card clients, real estate and vehicle financing, personal and payroll loans – and the wholesale channel. These products have characteristics such as a low combined ratio, low volatility in results and less use of capital, making them strategic and increasingly relevant in the diversification of the Itaú Unibanco Group’s revenues. Other insurance activities encompass extended warranty, health insurance, our 11.1% stake in IRB – Brasil Resseguros S.A. and other operations.
Our insurance products have been receiving updates on coverage and assistance, bringing more value to these customers. In order to expand our insurance products portfolio, we are concentrating on our own existing distribution channels as well as expanding our insurance brokerage activities and providing third-party insurance policies from partner insurers to our clients through an open platform.
36
Table of Contents
The table below shows the market position and information about competitors for the business listed below:
| Product/Service | Market Position |
Additional Information and Main Competitors | ||
| Insurance | Giving effect to our 30% ownership interest in Porto Seguro S.A., we reached 8.2% of market share based on earned premiums, excluding VGBL (Redeemable Life Insurance), from January to December, 2018, positioning us as the fourth largest insurance provider in this segment in Brazil. Considering only our recurring insurance activities, our market share reached 10.2% in the same period. |
Our main competitors are controlled by or are in partnership with large commercial banks, such as Banco Bradesco, Banco Santander (Brazil) and Banco do Brasil which, like us, take advantage of their branch network to gain access to the retail market.
Despite the high concentration of Brazilian banks, in this market, the growing number of Insurtechs (startup companies focused on insurance) has facilitated customer access to insurance companies, making this market even more competitive. |
Source: SUSEP. Recurring insurance activities include: Personal Insurance (Life, Personal Accidents, Credit Insurance, Travel, Unemployment, Funeral Allowance, Serious Diseases, Random Events), Housing, Multiple Peril and Homeowners. Health Insurance and VGBL—Redeemable Life Insurance products are not included.
Premium Bonds (títulos de capitalização, or capitalization plans)
Premium bonds are fixed deposit products pursuant to which a client makes a one-time deposit or monthly deposits of a fixed sum that will be returned at the end of a designated term. Ownership of premium bonds automatically qualifies a customer to participate in periodic raffles, each time with the opportunity to win a significant cash prize. In 2018, we distributed R$ 47.0 million in raffle prizes for 1935 clients.
We currently market our premium bonds products portfolio through our branch network, electronic channels and ATMs, and we are currently developing new technologies for channel diversification. The net collection, taking into account the deduction of redemptions, from capitalization plans decreased 20.0% in 2018 when compared to 2017.
The table below shows our market position and information about competitors for the business listed below:
| Product/Service | Market Position |
Additional Information and Main Competitors | ||
| Premium Bonds | In the period from January to December, 2018 we had a market share of 12.7% in terms of revenues from sales of premium bonds, positioning us as the third largest provider of such products in this segment in Brazil. |
Our main competitors in premium bonds are controlled by or are in partnership with large commercial banks, such as Banco Bradesco, Banco do Brasil and Banco Santander (Brazil) which, like us, take advantage of their branch network to gain access to the retail market. |
Source: SUSEP.
Consortia
Consortium is a pool of people and/or legal persons in a group with the purpose of allowing their members, on an equal basis, to acquire assets, such as vehicles, properties, or services, through self-financing. The payments made by the group participants are applied to a common fund, used by one or more members of the consortium at a time, to acquire the assets elected by the members when the product was contracted. The participants receive the assets during the validity of the contract through the following methods: (i) random drawing; (ii) bid offer with own resources; (iii) part of the letter of credit; and (iv) FGTS tax (only for properties consortium), with the exception of the random drawing, the other options may be combined.
As consortia are regarded as a provision of services under Brazilian law, the management of consortia does not give rise to default risk or regulatory capital requirements for us.
Consortia do not charge interest rates and our revenues come mainly from the administration fee charged to clients.
37
Table of Contents
Given these characteristics, this business is strategic to us, contributing to revenue diversification and to a more complete product portfolio offering to our clients. As of December 31, 2018, we achieved the following results:
| • | 385 thousand in active contracts, a decrease of 2% compared to December 31, 2017; |
| • | R$11.8 billion in balance of installments receivables, an increase of 7% compared to December 31, 2017; and |
| • | R$681 million in administration fees from January 31, 2018 to December 31, 2018, an increase of 8% compared to the same period of 2017. |
The table below shows the market position and information about competitors for the business listed below:
| Product/Service | Market Position |
Additional Information and Main Competitors | ||
| Consortia Services Fees | In the period from January to December, 2018 we had a market share of 7.3% in total consortia services fees. Considering only banks, we are the third largest provider of such services in terms of fees in Brazil. |
Considering only banks, our main competitors in the Brazilian consortia market are Bradesco Adm. Consortia and BB Consortia. |
Source: Central Bank.
Microcredit
Our microcredit unit offers to low-income entrepreneurs who do not have the necessary attributes to participate in the traditional financial system the chance to expand and develop their businesses. Itaú Microcrédito’s loan officers solicit new and existing clients, offering loans. Loan officers are also responsible for disseminating information regarding financial concepts related to the responsible use of money.
A major benefit arising from this initiative is that micro-entrepreneurs start to develop a relationship with the formal financial system.
As a tool to stimulate entrepreneurship, Itau Microcrédito has specific rules to credit application. Some of them are: includes working capital loans, or loans for upgrades and fixed assets provided to formal and informal business people engaged in small business activities. Any grant of loans requires the presence of a trained microcredit loan officer.
Our investment in microcredit consolidates our strategy to act as an agent of transformation in society. Microcredit is also important as it reinforces our vision of sustainability and increases our ability to spread our knowledge in financial education. The end goal is to create a virtuous cycle in which our bank stimulates the social and economic development of Brazil’s low-income population.
Public Sector
Our public sector business operates in all divisions of the public sector, including the federal, state and municipal governments (in the executive, legislative and judicial branches).
To service public sector clients, we use platforms that are separate from our retail banking branches, with teams of specially trained managers who offer customized solutions in tax collection, foreign exchange services, administration of public assets, payments to suppliers, payroll for civil and military servants and retirement. Based on these platforms, we have a significant amount of business with public sector clients, particularly in those Brazilian states where we acquired previously state-owned financial institutions. As of December 31, 2018, we had 5,804 public sector clients and 13 offices where such services were offered in Brazil.
Wholesale Banking
Wholesale Banking is the segment responsible for banking operations of middle-market, corporate, large and ultra companies (those with annual revenues from R$30 million) and investment banking services. The breakdown of revenue among these segments is set out in the section “Item 4B. – Business Overview – Operations Overview” above. Our Wholesale Banking segment offers a wide range of products and services to the largest economic groups of Brazil.
38
Table of Contents
Our activities in this business range from typical operations of a commercial bank to capital markets operations and advisory services for mergers and acquisitions. These activities are fully integrated, which enables us to achieve a performance tailored to our clients’ needs.
One of the most important features of our strategy for our Wholesale Banking segment is the set of initiatives linked to improving efficiency in our operations. These ongoing actions, which are expected to continue to grow in the coming years, are designed to increase revenues, improve processes and reduce costs.
Investment Banking
Our investment banking business carried out through Itaú BBA, assists companies raising capital through fixed income and equity instruments in public and private capital markets, and provides advisory services in mergers and acquisitions. We advise companies, private equity funds and investors in the structuring of variable income products and in mergers and acquisitions. We believe we offer a wide portfolio of investment banking services ranging from research to Brazilian and other Latin American companies.
Our fixed income department acts as bookrunner or manager in the issuance of debentures, promissory notes and securitization transactions at the investment banking segment.
The table below shows our market position and information about competitors for the business listed below:
| Product/Service | Market Position |
Additional Information and Main Competitors | ||
| Investment Banking | At december 2018, Itaú BBA ranked first in mergers and acquisitions(1). Itaú BBA also ranked first in origination and in distribution in debt capital markets transactions(2). |
In investment banking, Itaú BBA’s main competitors include Santander , Credit Suisse (Brazil) S.A., Merrill Lynch S.A. (Brazil), Morgan Stanley S.A. (Brazil), JP Morgan S.A. (Brazil), Bradesco BBI and BTG Pactual S.A. |
Source: (1) Dealogic. (2) ANBIMA ranking in terms of volume.
Asset Management
With more than 60 years of experience in investment management, Itaú Asset Management has R$ 680.6 billion in assets under management (including Itaú Unibanco and Intrag) according to ANBIMA (Ranking de Gestão – December 2018) and recorded 11.6% growth during 2018. Itaú Asset Management ranked as the largest non-government owned asset manager in Brazil, with a 14.7% market share as of December 31, 2018, according to ANBIMA.
In 2018 Itaú Asset Management was awarded for the 10th time the title of best asset manager in Brazil by Revista Exame.
Kinea Investimentos LTDA., an alternative investments management company controlled by us, held R$50.8 billion in managed assets as of December 31, 2018, compared to R$28.2 billion as of December 31, 2017, according to ANBIMA.
The table below shows the market position and information about competitors for the business listed below:
| Product/Service | Market Position |
Additional Information and Main Competitors | ||
| Asset Management | In December 2018, we had a market share of 14.7% in terms of assets under management, positioning us as the second asset management in Brazil. |
According to ANBIMA, the asset management industry in Brazil held assets totaling R$4,618 billion as of December 2018 and with 588 Financial Institutions and Assets Managers, among them, XP Investimentos.
The competition is concentrated among large and well-established retail banks. Our main competitors are Banco do Brasil, Banco Bradesco and Caixa Econômica Federal. |
Source: ANBIMA.
39
Table of Contents
Securities Services
Itaú Securities Services business units provide
| (i) | local custody and fiduciary services, |
| (ii) | international custody services, and |
| (iii) | corporate solutions that act as transfer agent and stockholder servicer for Brazilian companies issuing equity, corporate bonds, promissory and bank credit notes. We also work as guarantor in transactions for project finance, escrow accounts and loan and financing contracts. |
Our focus is to be a full service provider with specialized professionals and with technology as a foundation.
Pension funds, insurance companies, asset managers, international institutional investors and equity and debt issuers are our primary clients in these businesses, representing approximately 2,850 clients in 21 countries, that reached R$3.05 trillion of assets under service as of December 31, 2018, which includes investment funds, underwriting, pension funds, trustee and brokerage services.
In 2018, Global Finance named Itaú Securities Services as the best sub-custodian in Brazil, Uruguay and Paraguay. We are currently updating our technological platform with respect to securities services.
The table below shows the market position and information about competitors for the businesses listed below:
| Product/Service | Market Position |
Additional Information and Main Competitors | ||
| Local Custody | In December 2018, we had a market share of 26.6% based on total assets under local custody, positioning us as the second position Local Custodian. |
According to ANBIMA, the local custody in Brazil held assets totaling R$5,054 billion as of December 2018.
Our main competitors are Banco Bradesco S.A. and Banco do Brasil S.A. | ||
| International Custody | Our market share in December 2018 was 13.4% in terms of total assets under international custody, positioning us as the third largest International Custodian. |
Based on ANBIMA, the international custody service in Brazil totaled R$1,624 billion of assets as of December 2018.
Our main competitors are Banco Citibank S.A., JP Morgan’s Securities Services and Banco Bradesco S.A. | ||
| Corporate Solutions |
In December 2018, we had a leading position as agent and register provider to 198 companies listed on B3, which represents 58.6% of companies listed on that exchange.
Moreover, we were the second largest transfer agent with 375 debentures offerings in the Brazilian market, representing 37.2% of the debentures market in Brazil. |
Our main competitors in the equities market are Banco Bradesco S.A. and Banco do Brasil S.A.
Our main competitor in debentures is Banco Bradesco S.A. |
Source: Itaú Unibanco Holding, ANBIMA and B3.
Itaú Private Bank
With a full global wealth management platform, we are one of the private bank market leaders in Brazil and one of the main private bank players in Latin America. Our multidisciplinary team, which is supported by a team of investment advisers and product experts, provides comprehensive financial services to clients, understanding and addressing their needs from our eight offices in Brazil and in our offices located in Zurich, Miami, New York, Santiago, Asunción and Nassau.
Our clients have access to a complete portfolio of products and services, ranging from investment management to wealth planning, as well as credit and banking solutions. In addition to our in-house customized products and services, we offer our clients access to an open architecture of alternative products from third-party providers.
40
Table of Contents
Aligned with our vision to be the leading bank in sustainable performance and customer satisfaction, we decided to focus our strategic priorities on the following Itaú Private Bank initiatives. We intend to continue this focus in 2019.
| • | Being the leading private bank in terms of client satisfaction; |
| • | Adding value to clients and stockholders with a complete offering of long-term proactive advisory services; |
| • | Continuing to invest in our international platforms to enhance Brazilian clients’ experience and expand our operations in Latin America; |
| • | Increasing the operational efficiency of our platform through continuous investments in our IT platforms; and |
| • | Maintaining a focus on risk management and regulatory considerations. |
The table below shows our market position for the business:
| Product/Service | Market Position | |
| Itaú Private Bank |
In December 2018, we obtained a market share of 29.7% in terms of Itaú Private Bank. |
Source: ANBIMA.
Itaú Corretora (Brokerage)
Itaú Corretora has been providing brokerage services since 1965. We provide retail brokerage services in Brazil to over 172 thousand clients with positions in the equity and fixed income markets, accounting for approximately R$41 billion in trading volume in 2018. The brokerage services are also provided to international clients through our broker-dealer in New York.
The following table shows our market position and information about competitors for the businesses listed below:
| Product/Service | Market Position | Additional Information and Main Competitors | ||
| Retail Brokerage Services (1) | Ranked fourth in Retail Brokerage Services by trading volume in December 2018. | Main competitors: XP Investimentos, Ágora Corretora de Títulos e Valores Mobiliários S.A., Rico Corretora de Títulos e Valores Mobiliários S.A., Easynvest Título Corretora de Valores S.A., BTG Pactual Corretora de Títulos e Valores Mobiliários S.A., Bradesco S.A. Corretora de Títulos e Valores Mobiliários and Santander Corretora de Câmbio e Valores Mobiliários S.A. | ||
| Cash Equities (2) | Ranked ninth in Cash Equities by trading volume in the period between January and December 2018. | Main competitors: UBS Brasil Corretora, XP Investimentos, Morgan Stanley Corretora de Títulos e Valores Mobiliários S.A., Credit Suisse Hedging-Griffo Corretora de Valores S.A., Bradesco S.A. Corretora de Títulos e Valores Mobiliários and Merrill Lynch S.A. | ||
| Futures and Derivatives (2) | Ranked eleventh in Derivatives and Futures by number of traded contracts in the period between January and December 2018. | Main competitors: UBS Brasil Corretora, BTG Pactual Corretora de Títulos e Valores Mobiliários S.A., XP Investimentos, Clear Corretora de Títulos e Valores Mobiliários LTDA, Modal Distribuidora de Títulos e Valores Mobiliários LTDA. | ||
| Research (3) | Ranked third Research House in Latin America in July 2018. | Main competitors (local and global players): J.P. Morgan Corretora de Câmbio e Valores Mobiliários S.A., BTG Pactual Corretora de Títulos e Valores Mobiliários S.A., Credit Suisse Hedging-Griffo Corretora de Valores S.A. and Bank of America Merrill Lynch S.A. Corretora de Títulos e Valores Mobiliários. |
Source: (1) CBLCnet, (2) Bloomberg, (3) Institutional Investor Magazine.
41
Table of Contents
International Operations
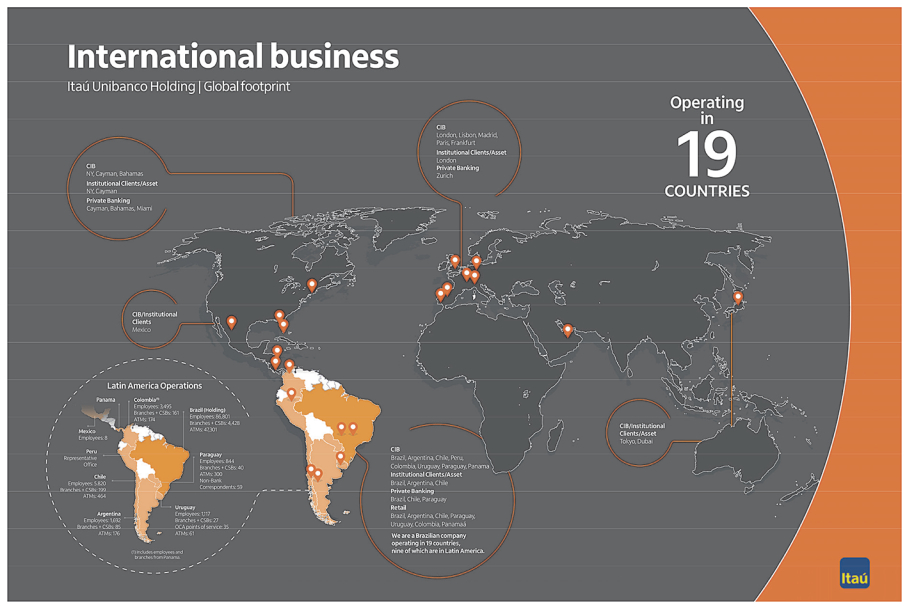
Latin America
Overview
Latin America is a priority in our international expansion due to the geographic and cultural proximity to Brazil. Our goal is to be recognized as the “Latin American Bank”, becoming a reference in the region for all financial services provided to individuals and companies.
Over the past years, we consolidated our presence in Argentina, Chile, Paraguay and Uruguay. In these countries, we operate in the retail, companies, corporate and treasury segments, with commercial banking as our main focus. With the recent merger between Banco Itaú Chile and CorpBanca, which assured our presence in Colombia and Panama, we expanded our operations in the region even further. In Mexico, we are present through an office dedicated to equity research activities.
As of December 31, 2018 we had a network of 512 branches and client service branches in Latin America (excluding Brazil). In Paraguay, we had 59 non-bank correspondent locations, which are points of service with a simplified structure, strategically located in supermarkets to provide services to our clients in that country. As of December 31, 2018, we also had 35 points of service through OCA S.A., our credit card operator in Uruguay. Please see “Distribution Channels”, for further details about our distribution network in Latin America.
Banco Itaú Argentina
We have operated in Argentina since 1979, where we began with a focus on large companies with business ties to Brazil. In 1995, we began our retail operations in Buenos Aires. In 1998, we increased our presence through the acquisition of Buen Ayre Bank, subsequently renamed Banco Itaú Argentina.
Through Banco Itaú Argentina we offer products and services in corporate banking, small and middle-market companies and retail banking. Our corporate banking business focuses on large and institutional clients, providing lending, structured finance, investment and cash management services. Our small and middle-market operations provide credit for working capital and investments in production capacity increases. Our retail banking business focuses on middle and upper-income clients, and our services offerings include current and savings accounts, personal loans and credit cards.
42
Table of Contents
The table below shows our market position and information about competitors for the business listed below:
| Product/Service | Market Position |
Additional Information and Main Competitors | ||
| Total Loan Portfolio (includes privately-owned banks only) |
In December 2018, we had a market share of 2.3% in terms of total outstanding loan balance in Argentine pesos, positioning us as the twelfth largest private bank in Argentina. |
Our main competitors are Banco Santander Río S.A., Banco de Galicia y Buenos Aires S.A., BBVA Banco Frances S.A. and Banco Macro S.A. |
Source: Central Bank of Argentina.
Itaú Corpbanca
In April 2016, we closed the merger of Banco Itaú Chile with and into Corpbanca and, as a result, acquired control of the resulting entity – Itaú Corpbanca. On that same date, we entered into the Shareholders’ Agreement of Itaú Corpbanca, or Itaú Corpbanca’s Shareholders’ Agreement, which entitles us to appoint, together with Corp Group, the former controlling shareholder of Corpbanca, the majority of the members of Itaú Corpbanca’s Board of Directors. Such members are appointed according to the ownership interest of each party, and we have the right to elect the majority of the members elected by this block. In addition, on that same date, we consolidated Itaú Corpbanca in our financial statements, adding approximately R$114 billion of assets to our balance sheet.
These steps were implemented as a result of the obligations we undertook in the transaction agreement, which we entered into together with Corpbanca and its controlling shareholders in January 2014 and amended in June 2015.
In January 2017, we executed a new amendment to the transaction agreement, which provided for (i) the postponement of the date of acquisition of the shares held by Corp Group in Banco Corpbanca Colombia S.A., or Corpbanca Colombia, from January 29, 2017 to January 28, 2022, subject to receipt of applicable regulatory approvals; (ii) the modification of the previously defined structure for the combination of the operations of Itaú Unibanco and Itaú Corpbanca in Colombia to a sale and purchase of assets and liabilities, which was concluded in April 2017; and (iii) the replacement of the obligation to consummate an initial public offering of Corpbanca Colombia for the obligation to register Corpbanca Colombia as a public company and list its shares on the Colombian stock exchange.
Pursuant to the exercise of put options by Corp Group, as set forth in Itaú Corpbanca’s Shareholders’ Agreement, we acquired (i) in October 2016, 10.9 billion shares of Itaú Corpbanca for approximately R$288.1 million, increasing our equity stake from 33.58% to 35.71%; (ii) in September 2017, 1.8 billion shares of Itaú Corpbanca for approximately R$55.6 million, increasing our equity stake from 35.71% to 36.06%; and (iii) in October 2018, 10.6 billion shares of Itaú Corpbanca for approximately R$363 million, increasing our equity stake from 36.06% to 38.14%. In all cases the governance of Itaú Corpbanca remained the same.
Helm Group
On December 20, 2016, Helm LLC initiated an arbitration proceeding (the “Arbitration”) before the ICC International Court of Arbitration (the “ICC”) against Corp Group Holding Inversiones Ltda. (“Corp Group”) and Itaú Corpbanca (collectively, “Respondents”). Helm alleged that the Respondents had breached (i) the Amended and Restated Shareholders Agreement of HB Acquisition S.A.S., dated July 31, 2013, which governs Itaú Corpbanca’s subsidiary Itaú Corpbanca Colombia (formerly Banco Santander Colombia S.A.), and (ii) the Transaction Agreement, dated January 29, 2014, as amended and restated, which governs the merger between Itaú Chile S.A. and Corpbanca, by which Itaú Corpbanca was formed, and the potential acquisition by Itaú Corpbanca of certain shares of Itaú Corpbanca Colombia from Corp Group.
During the course of the proceedings, Helm demanded that Itaú Corpbanca and Corp Group effect the acquisition of its shares of Itaú Corpbanca Colombia at a price in excess of the price agreed with Corp Group in the Transaction Agreement, which would have totaled approximately US$850 million (with interest at 9% per year from January 29, 2014 onwards). On February 28, 2019, a three-member Tribunal of the ICC rejected Helm’s demand and ordered Helm to sell its shares of Itaú Corpbanca Colombia, which represent 19.44% of the equity in Itaú Corpbanca Colombia, to Respondents at approximately US$299 million (including interest at LIBOR plus 2.7% per year from April 1, 2016 onwards). Itaú Corpbanca intends to purchase the shares from Helm. This price of US$299 million implies a valuation multiple of 1.36 times the book value of Itaú Corpbanca Colombia as of December 31, 2018 and is consistent with the valuations of Itaú Corpbanca Colombia in Itaú Corpbanca’s financial statements. The acquisition, when completed, will result in an estimated impact of 0.82% on Itaú Corpbanca’s Common Equity Tier 1 capital, as if we were applying the new regulatory capital requirements on a fully loaded basis, under the Basel III standards (using exchange rates as of February 28, 2019).
43
Table of Contents
The purchase of shares of Itaú Corpbanca Colombia by Itaú Corpbanca will be subject to regulatory approvals in Colombia, Chile and Brazil. Itaú Corpbanca has also sought regulatory approval to purchase the shares held by Kresge Stock Holding Company Inc. (“Kresge”) in Itaú Corpbanca Colombia, which represent 1.38% of the capital stock of Itaú Corpbanca Colombia. When the purchase of shares is complete, Itaú Corpbanca and Corp Group intend to terminate the existing Shareholders Agreement. Itaú Corpbanca can offer no assurances as to when the regulatory approvals—which are not perfunctory—will be received. The acquisition of the non-controlling interest of Kresge and corresponding obligation is to be reflected in Itaú Corpbanca’s consolidated financial statements once the approval process is completed. Consequently, there are no effects to be recognized in Itaú Corpbanca’s consolidated financial statements and in our audited consolidated financial statements.
The table below shows the market position and information about competitors for the business listed below:
| Product/Service | Market Position |
Additional Information and Main Competitors | ||
| Total Loan Portfolio (includes privately-owned banks only) |
In December 2018, our market share was 11.6% based on total outstanding loan balance in Chilean pesos, positioning us as the fifth largest private bank in Chile. |
Our main competitors are Banco Santander-Chile, Banco de Chile, Scotiabank Chile and Banco de Crédito e Inversiones. |
Source: Superintendency of Banks and Financial Institutions.
Banco Itaú Paraguay
Our operations in Paraguay began in 1978 and comprise retail and wholesale banking, through Interbanco, which was acquired in 1995 by Unibanco. In 2010, the Itaú brand was introduced and our bank’s name was changed to Banco Itaú Paraguay. Banco Itaú Paraguay distributes products and services to small and middle market companies, agribusiness, large companies, institutional clients and consumer clients. The retail segment also focuses on payroll clients. Under corporate banking, Banco Itaú Paraguay has a well-established presence in the agribusiness sector. Banco Itaú Paraguay’s qualification is based on its strong positioning, with leadership in several segments, reflecting high returns.
The table below shows our market position and information about our competitors for the Banco Itaú Paraguay business:
| Product/Service | Market Position |
Additional Information and Main Competitors | ||
| Total Loan Portfolio (includes privately-owned banks only) |
In December 2018, we had a market share of 15.0% in terms of total outstanding loan balance in guaranis, positioning us as the third largest private bank in Paraguay. |
Our main competitors are Banco Continental S.A.E.C.A., Banco Regional S.A.E.C.A. and Banco Bilbao Viscaya Argentaria Paraguay S.A. |
Source: Central Bank of Paraguay.
Banco Itaú Uruguay
Our banking operations in Uruguay include Banco Itaú Uruguay, OCA (the largest credit card issuer in Uruguay, in accordance with data from Uruguay’s central bank) and the pension fund management company Unión Capital. Our strategy in Uruguay is to serve a broad range of clients through customized banking solutions.
Our retail banking business is focused on individuals and small business clients. Retail products and services focus on the middle and upper-income segments, and also include current and savings accounts, payroll payment, self-service areas and ATMs in all branches, and phone and internet banking. The wholesale banking division is focused on multinational companies, financial institutions, large and middle market companies and the public sector, providing lending, cash management, treasury, trade and investment services.
The table below shows our market position and information about our competitors for the Banco Itaú Uruguay business:
| Product/Service | Market Position |
Additional Information and Main Competitors | ||
| Total Loan Portfolio (includes privately-owned banks only) |
In December 2018, we had a market share of 21.6% based on total outstanding loan balance in Uruguayan pesos, positioning us as the second largest private bank in Uruguay. |
Our main competitors are Banco Santander Uruguay, Banco Bilbao Vizcaya Argentaria Uruguay and Scotiabank Uruguay. |
Source: Central Bank of Uruguay.
44
Table of Contents
Itau BBA International
Our banking activities carried out under the corporate structure of Itau BBA International are mainly focused on two business lines:
| • | Corporate and Investment Banking: headquartered in the United Kingdom, but with business platforms in several cities in Europe, this segment supports the financial needs of companies with international presence and operations, focusing on transactions related to financing and investment relationships between companies in Latin America and the Northern Hemisphere. The services offered include the origination of structured financing, hedging, trade financing and advisory to Latin American and U.S. companies undertaking business in the Northern Hemisphere and large economic groups investing into Latin America. |
| • | Private Banking: under the corporate structure of Itau BBA International, we manage private banking activities in Miami and Zurich, offering specialized financial and asset management services for Latin American clients with high net worth by providing a diversified and specialized basis of investment funds, trading and managing on their account securities and other financial instruments, as well as by managing trusts and investment companies on behalf of customers.. |
Other International Operations
Our other international operations have the following objectives:
| • | Support our clients in cross-border financial transactions and services, our international units are active in providing our clients with a variety of financial products, such as trade financing, loans from multilateral credit agencies, off-shore loans, international cash management services, foreign exchange, letters of credit, guarantees required in international bidding processes, derivatives for hedging or proprietary trading purposes, structured transactions and international capital markets offerings. Our international units offer a variety of financial products through their branches. |
| • | Manage proprietary portfolios and raise funds through the issuance of securities in the international market. Fundraising through the issuance of securities, certificates of deposit, commercial paper and trade notes can be conducted by our branches located in the Cayman Islands, the Bahamas and New York, as well as through Itaú Bank Ltd., a banking subsidiary incorporated in the Cayman Islands. Our proprietary portfolios are mainly held by Itaú Bank and our Nassau and Cayman Islands branches. These offices also enhance our ability to manage our international liquidity. |
Through our international operations, we establish and monitor trade-related lines of credit from foreign banks, maintain correspondent banking relationships with money centers and regional banks throughout the world and oversee our other foreign currency-raising activities.
Additionally, Itaú BBA participates in the international capital markets as a dealer, as it has equity and fixed income sales and trading teams in São Paulo, New York, Santiago, London. We provide extensive research coverage of over 234 listed companies in Brazil, Mexico, Chile, Colombia, Peru, Panama and Argentina. Our international fixed income and equity teams both act in offerings and trading of Brazilian and Latin American securities to institutional investors.
45
Table of Contents
Revenues from Operations in Brazil and Abroad
We conduct most of our business activities in Brazil, but we do not break down our revenues by geographic markets within Brazil. Our interest income from loans and leases, banking service fees and income from insurance, private pension plans and premium bonds transactions are divided between revenues earned in Brazil and outside of Brazil. The following information is presented in IFRS, after eliminations on consolidation.
The following table sets forth the consolidated statement of income with respect to our revenues from operations in Brazil and abroad for the years ended December 31, 2018, 2017 and 2016:
| Revenues from operations in Brazil and abroad |
For the Year Ended December 31, | Variation | ||||||||||||||||||||||||||
| 2018 | 2017 | 2016 | 2018-2017 | 2017-2016 | ||||||||||||||||||||||||
| (In millions of R$, except percentages) | ||||||||||||||||||||||||||||
| Income Related to Financial Operations (1) (2) |
131,317 | 149,572 | 174,984 | (18,255 | ) | (12.2 | )% | (25,412 | ) | (14.5 | )% | |||||||||||||||||
| Brazil |
108,362 | 131,689 | 155,030 | (23,327 | ) | (17.7 | )% | (23,341 | ) | (15.1 | )% | |||||||||||||||||
| Abroad |
22,955 | 17,883 | 19,954 | 5,072 | 28.4 | % | (2,071 | ) | (10.4 | )% | ||||||||||||||||||
| Banking Service Fees |
36,809 | 34,448 | 31,918 | 2,361 | 6.9 | % | 2,530 | 7.9 | % | |||||||||||||||||||
| Brazil |
33,211 | 31,296 | 29,061 | 1,915 | 6.1 | % | 2,235 | 7.7 | % | |||||||||||||||||||
| Abroad |
3,598 | 3,152 | 2,857 | 446 | 14.1 | % | 295 | 10.3 | % | |||||||||||||||||||
| Income related to insurance and private pension operations before claim and selling expenses, net of reinsurrance |
3,961 | 4,699 | 5,265 | (738 | ) | (15.7 | )% | (566 | ) | (10.8 | )% | |||||||||||||||||
| Brazil |
3,812 | 4,551 | 5,133 | (739 | ) | (16.2 | )% | (582 | ) | (11.3 | )% | |||||||||||||||||
| Abroad |
149 | 148 | 132 | 1 | 0.7 | % | 16 | 12.1 | % | |||||||||||||||||||
| (1) | Includes interest and similar income, dividend income, net gain (loss) on investment securities and derivatives, foreign exchange results, and exchange variation on transactions. |
| (2) | ITAÚ UNIBANCO HOLDING does not have clients representing 10% or higher of its revenues. |
Competition
The last several years have been characterized by increased competition and consolidation in the financial services industry in Brazil. As of December 31, 2018, there were 135 conglomerates, commercial banks and multiple-service banks, development banks and Caixa Econômica Federal, among a total of 1,348 institutions in Brazil.
We, together with Banco Bradesco S.A. and Banco Santander Brasil S.A., are the leaders in the privately-owned multiple-services banking sector. As at December 31, 2018, these banks accounted for 38.9% of the Brazilian banking sector’s total assets. We also face competition from state-owned banks. As at December 31, 2018, Banco do Brasil S.A., Caixa Econômica Federal, and BNDES accounted for 39.7% of the banking system’s total assets.
46
Table of Contents
The following table sets for the total assets of the 10 main banks in Brazil, classified according to their interest in the total assets of the Brazilian banking sector
| Position |
Banks by total assets(1) |
Control Type |
As of December 31 | |||||
| 2018 |
% of Total | |||||||
| (In billions of R$) | (%) | |||||||
| 1st |
Itaú Unibanco Holding S.A. | privately-owned | 1,492.8 | 17.0 | ||||
| 2nd |
Banco do Brasil S.A.(2) | state-owned | 1,418.2 | 16.1 | ||||
| 3rd |
Caixa Economica Federal | state-owned | 1,264.6 | 14.4 | ||||
| 4th |
Banco Bradesco S.A. | privately-owned | 1,132.9 | 12.9 | ||||
| 5th |
Banco Nacional de Desenvolvimento Economico e Social | state-owned | 806.6 | 9.2 | ||||
| 6th |
Banco Santander Brasil S.A. | privately-owned | 787.6 | 9.0 | ||||
| 7th |
Banco Safra S.A. | privately-owned | 167.4 | 1.9 | ||||
| 8th |
Banco BTG Pactual S.A. | privately-owned | 165.5 | 1.9 | ||||
| 9th |
Banco do Estado do Rio Grande do Sul S.A. (Banrisul) | state-owned | 77.0 | 0.9 | ||||
| 10th |
Banco Citibank S.A. | privately-owned | 74.7 | 0.8 | ||||
| n.a. |
Others | n.a. | 1,401.1 | 15.9 | ||||
| Total(3) | 8,788.4 | 100.0 | ||||||
|
|
| |||||||
| (1) | Based on banking services, except insurance and pension funds. |
| (2) | Includes the consolidation of 50.0% do Banco Votorantim S.A. based on Banco do Brasil’s shareholding stake and excludes these 50.0% of National Financial System. |
| (3) | Excludes Payments Institutions |
Source: Central Bank.
Distribution Channels
We provide integrated financial services and products to our clients through a variety of distribution channels. In addition to our traditional portfolio of banking products, we offer products such as insurance, investments, foreign exchange and brokerage.
Our distribution network is divided into (i) standard channels: branches, Customer Site Branches –CSB (banking service centers located at certain corporate clients), Automatic Teller Machines—ATMs, and telephones; and (ii) digital channels: internet, mobile and SMS banking.
Standard Channels (branches, CSBs and ATMs)
Our branch network serves as a distribution network for all of the products and services we offer to our clients. As of December 31, 2018 our standard branch network included 3,514 physical branches in Brazil. Of those, 93 branches were especially refurbished for shopping malls, with a new visual identity and service proposition. The spaces present a new concept of client service, with a differentiated layout inspired by the design of a retail store. Focusing on the relationship with the client as a way to strengthen contact with the public, these branches function during different hours compared to regular branches (which are usually open from 10 a.m. to 4 p.m.). Furthermore, we had 195 digital branches as of December 31, 2018, which is consistent with our digital transformation strategy.
Similarly, we also implemented changes in service hours for certain branches located in commercial hubs, which now open at 8 a.m. or 9 a.m. and close at 6 p.m. or 8 p.m. This initiative was designed to adapt our services to the routines of our clients.
The range of services provided at CSBs can be the same as those provided at a full service branch, or more limited according to the size of a particular corporate client and its needs. CSBs represent a low-cost alternative to opening full service branches. In addition, we believe CSBs provide us with an opportunity to target new retail clients while servicing corporate clients and their personnel.
ATMs are low-cost alternatives to employee-based services and give us points of service at significantly lower costs than branches. Our clients can conduct almost all account-related transactions through ATMs.
47
Table of Contents
In addition to all our standard channels for serving clients (branches, CSBs and ATMs), we also have a partnership with the “TecBan” ATM network, comprising of more than 23,049 ATMs in Brazil and which provide our clients with limited services – primarily cash withdrawal services.
Since 2012, we have made differentiated services available to certain registered clients. In addition to services available to our clients in general, these registered clients are able to withdraw funds and check current account balances and statements just by using biometric technology. Biometrics enables these registered clients to carry out transactions with fingerprint identification, without typing a password or using a card, providing more security and convenience for our clients. To be able to use biometrics, clients must register at any Itaú Unibanco branch.
Digital Channels (internet and mobile banking)
In a world permeated by ongoing digital transformation, our challenge is to keep up with changes and meet the needs of our clients. An essential part of this transformation is the increasing usage of mobile devices with access to the internet. This is reflected in the growth of our mobile banking operations, which grew 23% for individuals and 21% for companies in 2018, when compared to 2017.
Considering this scenario, in 2018 we significantly improved our technological platforms, including by redesigning them to deliver a more intuitive client experience and to offer a wider range of products and services. In June 2018 we launched “Teclado Itaú,” an innovative platform to transfer money using the smartphone’s own keyboard, which was adopted by over 200 thousand users in its first month after launch and was highly commended at the Financial World Innovation Awards in the innovation in product or service design – payments category. In addition, in November 2018, we launched, as part of our main app, “Minhas Finanças,” Itaú Unibanco’s personal finance manager, a new feature that helps our individual clients manage and improve their financial life through the categorization of their expenses and by providing intuitive dashboards of their financial life. Our “Minhas Finanças” platform had over 5 million accesses in the first two weeks after its release to the public. Further, in April 2018 we were the first Brazilian bank to offer Apple Pay, and two months later, we started offering Samsung Pay as well.
In addition to improving our technological platforms and renewing the experience of our clients, in 2018 we launched in our internet banking a new credit dashboard for our corporate clients that brings a consolidated position of contracts and limits available for hiring in order to provide a better experience. In our app, our corporate clients can review their financial statements, through graphs that makes it simpler to better understand the evolution of their financial status.
| Standard channels |
Branches | CSBs | ATMs | |||||||||||||||||||||||||||||||||
| 2018 | 2017 | 2016 | 2018 | 2017 | 2016 | 2018 | 2017 | 2016 | ||||||||||||||||||||||||||||
| Brazil |
3,717 | 3,743 | 3,780 | 703 | 703 | 766 | 24,252 | 24,745 | 25,079 | |||||||||||||||||||||||||||
| Abroad |
483 | 497 | 531 | 37 | 38 | 26 | 1,175 | 1,196 | 1,228 | |||||||||||||||||||||||||||
| Argentina |
72 | 72 | 72 | 13 | 15 | 15 | 176 | 178 | 178 | |||||||||||||||||||||||||||
| Chile |
199 | 201 | 223 | - | - | 2 | 464 | 469 | 502 | |||||||||||||||||||||||||||
| Colombia |
148 | 161 | 174 | 13 | 13 | - | 174 | 176 | 178 | |||||||||||||||||||||||||||
| Paraguay |
31 | 31 | 31 | 9 | 8 | 8 | 300 | 312 | 311 | |||||||||||||||||||||||||||
| Uruguay |
25 | 24 | 23 | 2 | 2 | 1 | 61 | 61 | 59 | |||||||||||||||||||||||||||
| Other |
8 | 8 | 8 | - | - | - | - | - | - | |||||||||||||||||||||||||||
| Total in Brazil and abroad |
4,200 | 4,240 | 4,311 | 740 | 741 | 792 | 25,427 | 25,941 | 26,307 | |||||||||||||||||||||||||||
|
|
|
|
|
|
|
|
|
|
|
|
|
|
|
|
|
|
|
|||||||||||||||||||
Our Brand and Marketing Channels
Our brand aims to promote positive changes in the lives of people and in society. We deliver products and services – focused on our clients’ needs – that reflect our continuous efforts to provide the best experience for everyone who interacts with us on a daily basis.
Our efforts to foster financial education permeate our entire organization and encourage our clients to have a more balanced relationship with their money by choosing the best type of credit and by planning their investments more efficiently. Our responsibility for the development of society in the locations where we operate is at the very heart of our brand, which is why, in addition to the transformation that is inherent in our core business, we also invest in projects related to education, culture, sports and urban mobility.
48
Table of Contents
The #issomudaomundo (#thischangestheworld) platform, which guides our causes and our investments in various projects illustrate our institutional campaigns. Our urban mobility platform is present in six cities throughout Brazil and has more than 690 bike stations. According to the operator TemBici, in 2018 more than 1 million trips were made each month using bicycles from our urban mobility platform.
In education, our programs are equally powerful: since the “Leia para uma criança” (Read to a child) program was created, more than 51 million printed books were distributed to people and 12 thousand braile books were offered to visually impaired children. Three million books have already been sent to public libraries, civil society organizations and schools. All of this shows that we continue to mobilize clients and non-clients to make a difference in children’s lives.
Our capacity to inspire and engage people can also be seen on social media. We publish a series of articles and videos that express our point of view and tell stories that encourage people to implement positive changes in their lives, and in 2018 we reached over 579 million views in our brand channel on YouTube.
Social media is increasingly important to our strategy. On December 31, 2018, we reached over 9 million followers on Facebook. Our Twitter profile has over 616 thousand followers and we also have 266 thousand followers on Instagram.
We continue to monitor
all of our social media profiles 24 hours a day, seven days a week. We have a specific structure with 110 employees to interact with the public on all matters related to Itaú Unibanco Group in Brazil, including
questions, suggestions, comments and complaints. We received more than 715 thousand mentions on social media in 2018, according to Gauge and Mutato, consulting agencies that assist us in the analysis of social media data.
As a result, in 2018 we were ranked for the 15th consecutive year at the top of the Interbrand ranking of most valuable Brazilian brands with an estimated value of R$ 29.8 billion. The analysis is based on our brand’s ability to generate financial results, influence the client selection process and ensure long-term demand.
Our Vision, Our Culture
We believe that our strong culture supports us in attracting and retaining talent, directing our business path and, promoting a competitive advantage.
Our culture translates into the seven attitudes listed below, which we call “Our Way”, that keep us up-to-date with the context, demands and transformations of our business and organizational culture. “Our Way” directs how we intend to achieve our vision to be a leader in sustainable performance and in client satisfaction. For more information, see “Item 4B. Business Overview—Business Strategy.”
“Our Way”:
| 1. | It’s only good for us if it’s good for the client; |
| 2. | We are passionate about performance; |
| 3. | People mean everything to us; |
| 4. | The best argument is the only one that matters; |
| 5. | Simple. Always; |
| 6. | We think and act like owners; and |
| 7. | Ethics is not negotiable. |
49
Table of Contents
Ownership Structure
The following chart shows a simplified overview of our share ownership and our direct and indirect subsidiaries as of March 31, 2019:

Sustainability
Sustainability is embedded in our corporate strategy through a consolidated governance structure that is integrated into our business, which allows us to incorporate environmental and social issues into daily activities and processes across the Itaú Unibanco Group. Long-term strategic decisions on sustainability are discussed on an annual basis by our Board of Directors, at an annual meeting of the Strategy Committee (composed of Board of Directors members) and twice a year at meetings of our Executive Committee.
50
Table of Contents
We are revising our strategic Sustainable Finance Drivers and this process is divided into three main phases:
| • | Evolution of the concept of “Corporate Sustainability”; |
| • | Internal Diagnosis, based on the opinion of our stakeholders and executives regarding our activities; and |
| • | Strategy construction, which consists in developing a new strategic and positioning model, more connected to the positive impact we strive to cause. |
This process has already resulted in the implementation of certain changes to our sustainability department’s structure in order to promote and develop specific workstreams.
In addition, we revised our materiality themes, based on our strategic fronts, on the sustainable financial drivers and on the results of our consultations with stakeholders. Our 10 new materiality themes are: Integrity and ethics; Digital transformation; Customer satisfaction; Value creation; Risk management; Diversity; Environmental management; Financial inclusion and orientation; Corporate citizenship and Employee experience. Further details on this matter, including our mapping on SDGs goals, our materiality and our strategy, are available on our Sustainability Report, which is disclosed based on the Global Reporting Initiative criteria, since 2004.
In 2017, we launched Itaú’s Human Rights Commitment, which aims to reinforce our commitment to respect for human rights in its relations with employees, client, suppliers, partners and society. It guides our actions related to critical topics, mitigation practices, remedy and monitoring and work with vulnerable groups (such as children, adolescents, indigenous people, migrants, women, black people, people with disabilities, among others).
We also start acting on action plans to address the results of 2017 human rights risk assessment and also to institutionally address diversity issues. To do this, we conducted, actions plans, such as: the organization of two “diversity weeks” for employees, focused on discussions of race and LGBT+ publics and the divulgation of human rights and diversity recommendations for suppliers, with the aim of encouraging the entire value chain to consider such relevant issues in its operations. Other approaches that we had in 2018 to promote a more equal environment were to develop a support program and to update the policy of evaluating the performance of women on maternity leave, to ensure that their performance evaluation was based on the work performed and not on the time of their performance, thus preserving their evaluations, which affect the eligibility for career acceleration programs, educational sponsorships and promotions. We also defined that profit sharing will be paid in full, and not more proportionally as it was done before.
In 2018, a multidisciplinary working group involving the areas of Sustainability, Social-environmental Risk, Finances, Asset Management and Investor Relations, was created to develop the Climate Finance agenda. We participate in the main national and international forums and initiatives, in order to anticipate tendencies and help us guide the way we do business in the short and long terms. As an example, we participated in the Task Force on Climate Financial Disclosure (TCFD) working group of the United Nations Environment Programme Finance (UNEP-FI). In this group, we and another 15 financial institutions gathered efforts to develop indicators and tools to strengthen the assessment and disclosure of risks and opportunities related to climate change in such institutions. Besides that, we are also implementing the recommendations made by the Financial Stability Board.
Additionally, as a result of the notice published for our Emissions Offsetting “Commitment to Climate Program,” in partnership with Natura and the Brazilian Ekos Institute, we received more than 100 projects, from 25 Brazilian states, totaling a volume of more than 5 million tCO2. Seven projects were selected to offset the emissions from Itaú and Natura, which had the goal of compensating 500 thousand tCO2. We have selected three projects totaling 86,000 tCO2e to offset our emissions from 2016 and 2017.
In August 2018, we launched the Climate Compromise Program platform, whose main objective is to promote the carbon market and invite other organizations to participate in this initiative.
Other initiative on sustainability was to research trends and new business that could benefit us, society and the environment. During the process, an expanded group of people from various internal departments, including Risks, UX and Products teams, was formed to develop Minimum Viable Product, or MVP, projects aimed at creating business with positive impact. As an outcome of this working group, 40 ideas were generated and 10 product projects were started, coping with the transition of a greener and responsible economy.
Our sustainable management contributed to our access to funding through development agencies, and to our presence in sustainability indexes. We are the only Latin American bank to be included in the Dow Jones Sustainability Index since the inception of the index in 1999, and we also integrate the Business Sustainability Index and the Carbon Efficient Index, both of B3.
51
Table of Contents
Intellectual Property
We are not dependent on any intellectual property, including, but not limited to, patents and licenses, industrial, commercial or financial contracts (including contracts with customers or suppliers).
Risk Management
Undertaking and managing risks is essential to our business and a responsibility of all of our employees. For this reason, we must have well-established objectives and rules with respect to risk management.
In this context, risk appetite determines the nature and the level of the risks that are acceptable to us and our culture of risks guides the necessary attitudes to manage them:
| • | Our Risk Culture is intended to be an umbrella for different risk-management related initiatives. |
| • | Both our risk appetite and the initiatives included in the strategic risk management frontline are aimed at designing tools to enable implementation of our Risk Culture principles, namely: “We are all risk managers”, “We assume risks on an informed basis”, “We discuss our risks”, and “We act on our risks”. |
Our risk appetite establishes the types and levels of risk acceptable to us.
52
Table of Contents

In 2018, through the priority strategic management of risk management, we expanded our approach to risks, classifying them into traditional and strategic.
We have a consolidated structure and governance to manage traditional risks: credit, market and liquidity, operational, compliance and information security risks. Our aim is to continue improving our management of traditional risks, in addition to expanding the coverage so that we are able to manage risks, of a more strategic nature, which may threaten our future profitability: business, regulatory, technology, and people risks. Strategic risks include risks derived from new players entering into the market or a more proactive attitude by regulators and they are as relevant to us as traditional credit or market risks.
53
Table of Contents

Governance and organizational structure
Our risk management organizational structure complies with Brazilian and applicable international regulations currently in place and is aligned with best market practices. There is a structure in place for coordination and consolidation of information and related processes, which are all subject to verification by independent validation, internal controls and audit areas. The following committees are part of our risk and capital management governance structure:

54
Table of Contents
Risk & Capital Management Committee (CGRC): supports our Board of Directors in performing its duties related to our risk and capital management by meeting, at least, four times annually, and submitting reports and recommendations to assist the Board of Directors in its decision-making with respect to:
| ◾ | Decisions regarding our risk appetite, in terms of capital, liquidity, results, operational risk and reputation, ensuring these aspects are in alignment with our strategy, and including acceptable capital and liquidity levels and types of risks to which we may be exposed, as well as overall limits for each type of risk, tolerance for volatility of results and risk concentration, and general guidelines about tolerance for risks that may impact our brand (e.g., brand risk). |
| ◾ | Supervision of our risk management and control activities in order to ensure their suitability to the risk levels assumed and to the complexity of the operations as well as compliance with regulatory requirements; |
| ◾ | Review and approval of policies and strategies for capital management, to establish mechanisms and procedures aimed at keeping capital consistent with the risks we incur; |
| ◾ | Establishing our minimum expected return on capital as a whole and for our lines of business, as well as monitoring performance; |
| ◾ | Supervision of our incentive structures, including compensation, aimed at ensuring its alignment with risk control and value creation goals; |
| ◾ | Fostering improvement in our Risk Culture. |
Superior Market Risk and Liquidity Committee (CSRML): meets on a monthly basis and is responsible for setting guidelines and governance for investments and market and liquidity risks regarding our consolidated positions and business lines.
Superior Operational Risk Committee (CSRO): meets on a bimonthly basis and is responsible for understanding the risks of our processes and business, defining guidelines for operational risks management and assessing the results achieved by our Internal Controls and Compliance System. The CSRO is our main decision-making committee for all operational risk management matters. It is responsible for defining our operational risk framework and structure and related policies for identification, measurement, assessment, reporting and monitoring of operational risk.
Superior Products Committee (CSP): meets on a weekly basis and is responsible for evaluating products, operations, services and processes that are beyond the authority of our Products Committees that report to it or that involve image risk to us.
Superior Credit Committee (CSC): meets on a weekly basis and is responsible for analyzing and deciding on credit proposals that are beyond the authority of the credit committees that report to the CSC. It is also responsible for analyzing decisions which may have not been taken due to a lack of consensus at the committee immediately subordinate to it or cases where, due to the relevance or characteristics of the topic or other features, such Credit Committees decide to submit to the CSC’s review.
Superior Retail Credit and Collection Committee (CSCCV): meets on a monthly basis and is responsible for approving credit policies and assessing the performance of Retail Credit and Collection portfolios and strategies.
Superior Wholesale Credit and Collection Committee (CSCCA): meets on a monthly basis and is responsible for approving credit policies and assessing the performance of Wholesale Credit and Collection portfolios and strategies.
Additionally, we have sub-committees, chaired by our chief risk officer and CFO, which are also responsible for risk and capital management. Any such sub-committee may report directly to the Risk and Capital Management Committee or to the sub-committees mentioned above.
To support this structure, we have the Risks & Finance Control and Management Area, structured with specialized departments and subordinated to our chief risk officer and CFO, intending to independently and in a centralized manner to ensure that the institution’s risks and capital are managed in accordance with established policies and procedures.
55
Table of Contents
Risk governance at foreign subsidiaries
Among our medium and long-term strategic goals, is our internationalization process that aims to reach, in the countries in which we do business, at least the same governance quality and level of results we observe in Brazil.
Therefore, we have been continuously improving our risk monitoring and management processes, not only in operations carried out abroad, but also for the supervision, proximity and robust governance of our holding company.
The continuous improvement of control processes allow us to better understand the particularities of each country and region in which we do business, and quickly adapt to changes in the different regulatory, social and economic market environments.
Risk management at our foreign subsidiaries is undertaken by teams dedicated to control and monitor risks, with direct communication channels that allow the information to flow at a timely manner as well as the alignment in the whole group.
Finally, promoting the Risk Culture in Brazil and abroad strengthens the individual and collective responsibility of all of our employees, so they can do the right thing, at the right time and in the right way, respecting the ethical and sustainable way of doing business.
Regulatory Environment
We are subject to regulation by, and supervision of, several entities, in the countries and for the segments in which we operate. The supervisory activities of these entities are essential to the structure of our business, and they directly impact our growth strategies. Below we describe the main entities that regulate and supervise our activities in Brazil:
| • | CMN: the highest authority responsible for establishing monetary and financial policies in Brazil, overall supervision of Brazilian monetary, credit, budgetary, fiscal and public debt policies, for regulating the conditions for organization, operation and inspection of financial institutions, as well as supervising the liquidity and solvency of these institutions. The CMN is also responsible for the general guidelines to be followed in the organization and operation of the securities market and the regulation of foreign investments in Brazil; |
| • | Central Bank: responsible for implementing the policies established by the CMN, authorizing the establishment of financial institutions and supervising financial institutions in Brazil. It establishes minimum capital requirements, limits for permanent assets, credit limits and requirements for compulsory deposits, in accordance with the policies established by the CMN; |
| • | CVM: responsible for regulating, sanctioning and inspecting the Brazilian securities market (which in Brazil includes derivatives) and its participants, as well as overseeing exchange and organized over-the-counter markets; |
| • | CNSP: responsible for establishing the guidelines and directives for insurance and premium bond companies and open private pension entities; |
| • | SUSEP: responsible for regulating and supervising the insurance, open private pension funds and capitalization markets in Brazil and their participants; and |
| • | ANS: responsible for regulating and supervising the health insurance market in Brazil and its participants. |
Outside of Brazil, we have main operations subject to oversight by local regulatory authorities in the following jurisdictions: South America, in particular Argentina, Colombia, Chile, Uruguay and Paraguay; Europe, in particular, the United Kingdom and Switzerland; Central America in particular Panamá, and the Caribbean, in particular Bahamas and Cayman Islands; and the United States of America.
56
Table of Contents
Financial institutions are subject to a number of regulatory requirements and restrictions, among which the following are noteworthy:
| • | prohibition against operating in Brazil without the prior approval of the Central Bank; |
| • | prohibition against acquiring real estate that are not for the financial institution’s own use, except real estate received for settlement of loan losses or as expressly authorized by the Central Bank, pursuant to CMN regulation; |
| • | prohibition against acquiring interests in companies without the prior approval of the Central Bank, except for ownership interest typical of investment portfolios held by investment banks or universal banks with investment portfolios; |
| • | prohibition against granting loans that represent more than 25% of the financial institution’s regulatory capital to only one person or group; |
| • | restrictions on credit transactions to certain related individuals and legal entities. |
| • | obligation to deposit a portion of the deposits received from clients with the Central Bank (compulsory deposit); and |
| • | obligation to maintain sufficient capital reserves to absorb unexpected losses, pursuant to the rules proposed by the Basel Committee and implemented by the Central Bank. |
Basel III Framework
Financial institutions based in Brazil are subject to capital measurement and standards based on a weighted risk-asset ratio, according to CMN Resolutions No. 4,192/13 and No. 4,193/13. On December 16, 2010, the Basel Committee issued its Basel III framework, which was revised and republished on June 1, 2011. The Basel III framework increases minimum capital requirements, creates new conservation and countercyclical buffers, changes risk-based capital measures, and introduces a new leverage limit and new liquidity standards in comparison to the former framework. The rules were phased in gradually and were fully implemented by January 1, 2019.
The Basel III framework requires banks to maintain minimum capital levels corresponding to the following percentages of risk-weighted assets: (i) a minimum common equity capital ratio of 4.5% composed of common shares; (ii) a minimum Tier 1 Capital ratio of 6.0%; and (iii) a minimum total capital ratio of 8.0%. In addition to the minimum capital requirements, Basel III requires a “capital conservation buffer” of 2.5% and each national regulator is given discretion to institute a “countercyclical buffer” if it perceives a greater system-wide risk to the banking system as the result of a build-up of excess credit growth in its jurisdiction. Basel III also introduces a new leverage ratio, defined as Tier 1 Capital divided by the bank’s total exposure.
Basel III implemented a liquidity coverage ratio, or LCR, and a net stable funding ratio, or NSFR. The LCR requires affected banks to maintain sufficient high-quality liquid assets to cover the net cash outflows that could occur under a potential liquidity disruption scenario over a thirty-day period. The NFSR establishes a minimum amount of stable sources of funding that banks will be required to maintain based on the liquidity profile of the banks’ assets, as well as the potential for contingent liquidity needs arising from off-balance sheet commitments over a one-year period.
Additional requirements apply to non-common equity Tier 1 Capital or Tier 2 Capital instruments issued by internationally active banks. To be included in Additional Tier 1 Capital or Tier 2 Capital, an instrument must contain a provision that requires that, at the discretion of the relevant authority, such instrument be either written-off or converted into common shares upon a “trigger event.” A “trigger event” is the decision of a competent authority pursuant to which, for a bank to remain a feasible financial institution, it is necessary (i) to write-off an instrument, or (ii) to inject government funds, or equivalent support, into such bank, whichever occurs first. The requirements are applicable to all instruments issued after January 1st, 2013. The instruments qualified as capital issued before that date that do not comply with these requirements will be phased out of banks’ capital over a ten-year period, beginning on January 1st, 2013.
57
Table of Contents
Additional regulatory capital requirements apply to systemically important financial institutions, or G-SIFIs. The Basel Committee’s assessment methodology to determine which financial institutions are G-SIFIs is based on indicators that reflect the following aspects of G-SIFIs: (i) size; (ii) interconnectedness; (iii) lack of readily available substitute or financial institution infrastructure for the services provided; (iv) global or cross-jurisdictional activity; and (v) complexity. Each of these factors receives an equal weight of 20.0% in the assessment.
The Basel Committee has also issued a framework for the regulation of domestic systemically important banks, or D-SIBs, which supplements the G-SIFI framework by focusing on the impact that the distress or failure of systemically important banks would have on the domestic economy of each country.
In addition to the minimum capital requirements, Basel III requires a “capital conservation buffer” of 2.5% and each national regulator is given discretion to institute a “countercyclical buffer” if it perceives a greater system-wide risk to the banking system as the result of a build-up of excess credit growth in its jurisdiction.
Implementation of Basel III in Brazil
Brazilian banks’ minimum total capital ratio is calculated as the sum of two components: Regulatory Capital (Patrimônio de Referência); and Additional Core Capital (Adicional de Capital Principal).
Brazilian banks’ Regulatory Capital is comprised of Tier 1 Capital and Tier 2 Capital. Tier 1 Capital is further divided into two elements: Common Equity Tier 1 Capital (common equity capital and profit reserves, or Capital Principal) and Additional Tier 1 Capital (hybrid debt and equity instruments authorized by the Central Bank, or Capital Complementar).
In order to qualify as Additional Tier 1 Capital or Tier 2 Capital, according to CMN Resolution No. 4,192/13, all instruments issued after October 1, 2013 by a Brazilian bank must contain loss-absorbency provisions, including a requirement that such instruments be automatically written off or converted into equity upon a “trigger event”. A “trigger event” is the earlier of: (i) Common Equity Tier 1 Capital being less than 5.125% of the risk-weighted assets for Additional Tier 1 Capital instruments and 4.5% for Tier 2 Capital instruments; (ii) the execution of a firm irrevocable written agreement for the government to inject capital in the financial institution; (iii) the Central Bank declaring the beginning of a special administration regime (Regime de Administração Especial Temporária, or RAET) or intervention in the financial institution; or (iv) a decision by the Central Bank, according to criteria established by the CMN, that the write-off or conversion of the instrument is necessary to maintain the bank as a viable financial institution and to mitigate relevant risks to the Brazilian financial system. Specific procedures and criteria for the conversion of shares and the write-off of outstanding debt related to funding instruments eligible to qualify as regulatory capital are established by CMN regulation. The legal framework applicable to financial bills (letras financeiras) was adapted to allow Brazilian financial institutions to issue Basel III-compliant debt instruments in the Brazilian market.
Existing hybrid instruments and subordinated debt previously approved by the Central Bank as eligible capital instruments may continue to qualify as Additional Tier 1 Capital or Tier 2 Capital, as the case may be, provided that they comply with the above requirements and a new authorization from the Central Bank is obtained. Instruments that do not comply with these requirements will be phased out as eligible capital instruments by deducting 10.0% of their book value per year from the amount that qualifies as Additional Tier 1 Capital or Tier 2 Capital. The first deduction occurred on October 1, 2013, and subsequent deductions will take place annually starting January 1, 2014 until January 1, 2022.
The Additional Core Capital requirement is subdivided into three elements: the capital conservation buffer (Adicional de Capital Principal Conservação), the countercyclical capital buffer (Adicional de Capital Principal Contracíclico) and the higher loss absorbency requirement for domestic systemically important banks (Adicional de Capital Principal Sistêmico). The capital conservation buffer is aimed at increasing the loss absorption ability of financial institutions. The countercyclical capital buffer can be imposed within a range by the Central Bank if it judges that credit growth is increasing systematic risk. The higher loss absorbency requirement for domestic systemically important banks seeks to address the impact that the distress or failure of Brazilian banks may have on the local economy. In the event of non compliance with the Additional Core Capital requirement, certain restrictions will apply, including the inability of the financial institution to: (i) pay officers and directors their share of variable compensation; (ii) distribute dividends and interest on equity to stockholders; and (iii) repurchase its own shares and effect reductions in its share capital.
58
Table of Contents
Since October 1, 2018, a minimum LCR in a standardized liquidity stress scenario requirement applies to banks with total assets that are equal or superior to 10% of the Brazilian GDP or to banks with relevant international activity (in such case, regardless of total assets). The calculation of the LCR follows the methodology set forth by the Central Bank which is aligned with the international guidelines. During periods of increased need for liquidity, banks may report a lower LCR than the minimum required ratio, provided that they also report to the Central Bank the causes for not meeting the minimum requirement, the contingent sources of liquidity it has available, and the measures it plans to adopt to be in compliance with the LCR requirement. Since April 1, 2016, banks must also publicly disclose their LCR on a quarterly basis.
The following table presents the schedule for phased-in implementation by the Central Bank of the capital adequacy and liquidity coverage ratio requirements under Basel III, as applicable to Itaú Unibanco Holding. The figures presented below refer to the percentage of our risk-weighted assets.
| From January 1st | ||||||||||||
| Basel III - Implementation Schedule |
2017 | 2018 | 2019(2) | |||||||||
| Common Equity Tier I |
4.5% | 4.5% | 4.5% | |||||||||
| Tier I |
6.0% | 6.0% | 6.0% | |||||||||
| Total Capital |
9.25% | 8.625% | 8.0% | |||||||||
| Additional Capital Buffers (ACP) |
1.50% | 2.375% | 3.5% | |||||||||
| conservation |
1.25% | 1.875% | 2.5% | |||||||||
| countercyclical(1) |
0% | 0% | 0% | |||||||||
| systemic |
0.25% | 0.5% | 1.0% | |||||||||
| Common Equity Tier I + ACP |
6.0% | 6.875% | 8.0% | |||||||||
| Total Capital + ACP |
10.75% | 11.0% | 11.5% | |||||||||
| Prudential adjustments deductions |
80% | 100% | 100% | |||||||||
|
|
|
|
|
|
|
|||||||
| (1) | The countercyclical capital buffer is fixed by the Financial Stability Committee (Comef) based on discussions about the pace of credit expansion (Central Bank Communication No. 30,371/17), and currently is set to zero (Central Bank Communication No. 32,794/18). Should the requirement increase, the new percentage takes effect twelve months after the announcement. |
| (2) | Minimum requirements valid from January 1, 2019 onwards. |
| From January 1st | ||||||||||||
| Schedule for limits to be observed |
2017 | 2018 | 2019 | |||||||||
| Liquidity Coverage Ratio (LCR) |
80% | 90% | 100% | |||||||||
Since October 1, 2015, banks are required to prepare public disclosures of their leverage ratios (Razão de Alavancagem, or RA) on a quarterly basis. In November 2017, the CMN established the minimum limit for the Net Stable Funding Ratio (Índice de Liquidez de Longo Prazo, or NSFR) and the Leverage Ratio (Razão de Alavancagem, or RA) to be observed by certain Brazilian Financial institutions, including those classified as Segment 1 pursuant to CMN regulation (such as us – please refer to item “Segmentation for the proportional application of the prudential regulation” for more information), and the terms for compliance with such requirements.
The NSFR corresponds to the ratio between the Available Stable Funds (Recursos Estáveis Disponíveis, or ASF) and the Required Stable Funds (Recursos Estáveis Requeridos, or RSF) of the financial institution. This new rule for NSFR, which became effective on October 1st, 2018, determines that the minimum limit for the NSFR for Segment 1 financial institutions is 100%. The RA, which calculation methodology was established by the Central Bank in 2015, consists of the ratio between the sum of the Common Equity Tier 1 Capital and the Additional Tier 1 Capital and the total exposure of the financial institution ascertained as established by the applicable regulation. The RA rule enacted in November 2017 became effective as of January 1, 2018 and determined the threshold of 3% as the minimum requirement for the RA for Segment 1 financial institutions (which is our case).
59
Table of Contents
CMN regulation also defines the entities that compose the consolidated enterprise level (conglomerado prudencial) of Brazilian financial institutions and establishes the requirement that a financial institution prepare and file with the Central Bank monthly consolidated financial statements at the consolidated enterprise level (conglomerado prudencial) pursuant to the parameters defined therein. Such financial statements should also be audited by external auditors on a semi-annual basis. Since January 1, 2015, minimum capital and ratio requirements apply at the consolidated enterprise level (conglomerado prudencial).
In addition to the rules issued in accordance with the criteria set forth in Basel III, in July, 2013, Law No. 12,838 was issued, allowing the determination of deemed credit based on deferred tax assets arising from temporary differences resulting from allowances for loan losses, which, in practice, exempts financial institutions from deducting this type of credit from its core capital. The law also changes the rules for the issue of subordinated debt, requiring the inclusion of clauses for the suspension of the stipulated compensation and the extinction of the credit right or its conversion into shares, and conditions stockholders’ remuneration to compliance with the prudential requirements established by the CMN.
Brazilian financial institutions are also required to implement a capital management structure compatible with the nature of its transactions, the complexity of the products and services it offers, as well as with the extent of its exposure to risks. In February 2017, the CMN enacted a new rule which unifies and expands Brazilian regulation on risk and capital management. Such rule provides that risk management must be conducted through an integrated effort by the relevant entity and sets out different structures for risk and capital management, which are applicable for different risk profiles.
According to such new rule, capital management is defined as a process that includes: (i) monitoring and controlling the financial institution’s capital; (ii) assessing capital needs in light of the risks to which the financial institution is subject; and (iii) setting goals and conducting capital planning in order to meet capital needs due to changes in market conditions. Financial institutions should publish a report describing the structure of their capital management at least on an annual basis. Disclosure and reporting of risk management matters, risk-weighted asset calculation, and adequate compliance with regulatory capital requirements are regulated by the Central Bank and reflect the so-called “Pillar 3” of regulatory capital recommended under Basel III, aimed at improving governance and disclosure.
Global Systemically Important Financial Institutions (G-SIFI) Assessment in Brazil
The Central Bank has adopted the same indicators set out by the Basel Committee to determine if Brazilian financial institutions qualify as G-SIFIs. Please see “Basel III Framework,” for further details. This assessment is required of banks with total exposure – the denominator for the leverage ratio – in excess of EUR200 billion, individually. However, no additional loss absorbency requirements for Brazilian G-SIFIs have been established. We were not included on the latest list of G-SIFIs issued on November 16, 2018. The next update is expected in November 2019.
Recovery Plans for Systematically Important Financial Institutions
On June 30, 2016, the CMN enacted a rule providing stricter guidelines for recovery plans (Planos de Recuperação) for Brazil’s systemically important financial institutions. The rule which incorporated recommendations from the Financial Stability Board, requires financial institutions to prepare recovery plans that aim to re-establish adequate levels of capital and liquidity and to preserve the viability of such institutions under stress scenarios.
The guidelines require, among other things, that subject financial institutions must identify their critical functions for the National Financial System (Sistema Financeiro Nacional) and their core business lines, monitor indicators and their critical levels, adopt stress-testing scenarios, predict recovery strategies, assess possible risks and barriers related to the strategies and define clear and transparent governance procedures, as well as effective communication plans with key stakeholders. The rule provides for the submission of such recovery plans by December 31st, annually.
60
Table of Contents
Segmentation for the Proportional Application of the Prudential Regulation
On January 30, 2017, the CMN enacted a resolution establishing segmentation for financial institutions, financial institution groups and other institutions authorized to operate by the Central Bank for proportional application of the prudential regulation, considering the size, international activity and risk profile of members of each segment. According to such resolution, out of the five possible segments, we are classified as Segment 1, which is composed of universal banks, commercial banks, investment banks, foreign exchange banks and federal saving banks that (a) have a size equivalent or superior to 10% of the Brazilian GDP; or that (b) perform relevant international activities, independently from the magnitude of the institution.
Brazilian Covered Bond (“Letra Imobiliária Garantida” – LIG)
In 2015, Law No. 13,097 was enacted to create the Brazilian covered bond (Letra Imobiliária Garantida, or LIG), a new debt instrument for funding Brazilian financial institutions that follows the covered bonds structure. The law provides that the CMN shall regulate its provisions , including regarding the terms and conditions, financial institutions authorized to issue Brazilian covered bonds, conditions of redemption and early maturity of Brazilian covered bonds, eligibility requirements, composition, sufficiency, maturity and liquidity of the related portfolio of assets, conditions of replacement and reinforcement of such assets, requirements for financial institutions to act as fiduciary agent and the assumptions, conditions and manner of their removal or replacement and its attributions.
On August 29 2017, the CMN issued a rule regulating the provisions of Law No. 13,097. In December 2017, the Central Bank enacted two rules applicable to the issuance of Brazilian covered bonds. The first rule establishes the procedures for accounting and disclosure of information by the issuers of Brazilian covered bonds, as portfolio managers of assets subject to the fiduciary regime provided in Law No. 13,097. The second rule establishes the minimum information in respect of the Brazilian covered bonds to be provided by the issuers to investors.
On May 4, 2018, the Central Bank issued a rule establishing the procedures and the information necessary for the deposit of the Brazilian covered bonds and for the registration or deposit of the assets that compose the underlying portfolio of the instrument. On May 9, 2018 it issued a rule establishing the procedures for accounting and disclosure of information about the assets that compose the underlying portfolios and the obligations, by issuance of Brazilian covered bonds, of the issuing institution and of the fiduciary agent, in the event of an intervention decree, extrajudicial liquidation, bankruptcy or the recognition (by the Central Bank) of the insolvency status of the issuing institution. Following these rules, on December 14, 2018, Itaú Unibanco S.A. completed its first issuance of Brazilian covered bonds in the total amount of R$1.224 billion. As of December 31, 2018, the accrued value of the outstanding Brazilian covered bonds (as reflected in Itaú Unibanco Holding’s financial statements), amounted to R$1.227 billion.
Passive provision for financial guarantees
On July 28, 2016 the CMN enacted a new rule, establishing specific accounting procedures for the assessment and registration of passive provisions (provisão passiva) that financial institutions must create in respect of financial guarantees. The accounting procedures established by this regulation seek to align the Brazilian standards with IFRS. Such resolution is effective since January 1, 2017.
Foreign Currency Transactions and Exposure
Transactions involving the sale and purchase of foreign currency in Brazil may only be conducted by institutions authorized to do so by the Central Bank. There are no limits for long or short positions in foreign currency for banks authorized to carry out transactions on the foreign exchange market. Currently there is no compulsory deposit requirement rate on the foreign currency short position held by financial institutions.
61
Table of Contents
In accordance with CMN regulation, financial institutions in Brazil may raise funds abroad, either through direct loans or through the issuance of debt securities. Funds raised accordingly may be freely invested in Brazil, including but not limited to on-lending to Brazilian companies and financial institutions. Brazilian banks authorized to operate in foreign currency markets which hold regulatory capital higher than R$5 billion may also use these funds to grant loans abroad to Brazilian companies, their offshore subsidiaries and to foreign companies controlled by Brazilians or to acquire securities issued or guaranteed by such companies in the primary market. Cross-border loans, in which one party is in Brazil and the other party is abroad, require previous registration with the Central Bank, which may establish limits on the conditions of such foreign currency loan transactions. Please see “Item 10E. Taxation” for further details about tax on foreign exchange transactions.
Financial institutions may also grant loans in or indexed to a foreign currency to their clients’ trade-related activities, such as by granting advances on foreign exchange contracts (Adiantamento sobre Contrato de Câmbio), advances on delivered export register (Adiantamento sobre Cambiais Entregues) or export or import prepayment agreements (Pré-Pagamento de Exportação e Financiamento à Importação), all in accordance with Brazilian regulations on foreign exchange markets and international capital flows.
The Central Bank and the Brazilian government frequently change rules and regulations applicable to foreign currency borrowing and loans in accordance with the economic scenario and Brazilian monetary policy.
In addition, the legislation sets forth that the total exposure in gold and other assets and liabilities indexed or linked to the foreign exchange rate variation undertaken by financial institutions (including their offshore branches), and their direct and indirect subsidiaries, on a consolidated basis, may not exceed 30.0% of their regulatory capital.
Liquidity and Fixed Assets Investment Regime
In accordance with CMN regulation, financial institutions may not hold, on a consolidated basis, permanent assets, including investments in unconsolidated subsidiaries, real estate, equipment and intangible assets, exceeding 50.0% of the adjusted regulatory capital.
Large Exposure Limits
We are legally prevented from granting loans or advances, and guarantees, including derivative transactions, underwriting or holding in our investment portfolio securities of any clients or group of affiliated clients that, in the aggregate, give rise to exposure to such client or group of affiliated clients that exceeds the threshold determined by the Central Bank. In this respect, on July 31, 2018 the Central Bank released a new resolution in order to comply with the Basel III reforms. The main differences between the former rule and the new rule in force since January 1, 2019 are changes in the basis for calculation of the exposure limits applicable to financial institutions classified as Segment 1 to their Tier 1 Regulatory Capital and an augmentation of the scope of transactions that increase exposure to clients subject to the limit, including exposure from securities and derivatives holding in our investment portfolio. According to the new rule, the maximum exposure to any one individual counterparty or to a group of connected counterparties of a Segment 1 financial institution is 25% of its Tier 1 Regulatory Capital and the maximum exposure to concentrated individual clients or group of connected clients of such Segment 1 financial institution is 600% of its Tier 1 Regulatory Capital (a concentrated individual client would mean, for the purpose of the proposed rule, as any one client to which exposure is equal to or higher than 10% of its Tier 1 Regulatory Capital. Please refer to “Item 4B. Business Overview – Segmentation for the proportional application of the prudential regulation” for more information regarding Segment 1 financial institutions, which is our case.
62
Table of Contents
For the purpose of this limit, the following public sector entities are to be considered as separate customers: (i) the Brazilian government; (ii) an entity controlled directly or indirectly by the Brazilian government which is not financially dependent on another entity controlled directly or indirectly by the Brazilian government; (iii) entities controlled directly or indirectly by the Brazilian government which are financially dependent among themselves; (iv) a State or the Federal District, jointly with all entities directly or indirectly controlled by it; and (v) a municipal district, jointly with all entities directly or indirectly controlled by it. Such definition is also subject to change under the new resolution published by the Central Bank on July 31, 2018 mentioned above. The new rule establishes additional criteria for the identification of separate customers: (i) the Brazilian government, including the Central Bank; (ii) an entity which 50% or more of its voting capital is held directly by the Brazilian Government, jointly with its controlled entities; (iii) a State of the Federative Republic of Brazil or the Federal District, jointly with its controlled entities and with entities which are financially dependent on a State, the Federal District or their controlled entities; (iv) each Brazilian municipal district, jointly with its controlled entities and with entities which are financially dependent on a municipality or its controlled entities; (v) each central government of a foreign jurisdiction; (vi) each central bank of a foreign jurisdiction, if this entity is not included in the central government; (vii) each entity which 50% or more of its voting capital is held directly by a central government of a foreign jurisdiction, jointly with its controlled entities and with entities that are financially dependent on it; (viii) a governmental body of a foreign jurisdiction, jointly with its controlled entities and with entities that are financially dependent on it or its controlled entities; and (ix) any other entity, public or private, which share the credit risk calculated by the financial institution according to CMN regulations.
At last, banks must identify possible connected counterparties on the basis of economic interdependence in all cases where the sum of all exposures to one individual counterparty exceeds 5% of the eligible capital base. Two or more counterparties sustain a relation of economic interdependence if one of the counterparties were to experience financial difficulties, then the other, as a result, would also be likely to encounter financial difficulties, which include those related to funding, payment of obligations and insolvency. Counterparties identified as economically interdependent must be treated as a single counterparty that is subject to the requirements specified above.
Risk Weighted Asset Calculation
The calculation of risk exposure is based on several factors set forth by the Central Bank regulations and impacts the capital requirements. The components take into consideration the type of risk and include the parameters and procedures for calculation of the risk weighted asset, or RWA, to determine the capital requirements resulting from each risk exposure. The Central Bank has been frequently changing and updating the rules and regulations for the RWA calculation.
Financial Bills (Letras Financeiras)
Law No. 12,838 of July 9, 2013 adapted financial bills (letras financeiras) to the Basel III framework and granted the Central Bank power to limit the payment of dividends and interest on capital by financial institutions that do not comply with the CMN capital requirements. With the changes enacted by Law No. 12,838, Brazilian financial institutions will likely issue Basel III-compliant hybrid or subordinated debt instruments under the regulatory framework of financial bills. The main characteristics of financial bills changed by Law No. 12,838 are:
| • | Possibility of issuance of financial bills convertible into equity. The conversion may not be requested by the investor or the issuer financial institution; |
| • | Suspension of payment of interest in case of non compliance with capital requirement rules in case the financial bills are part of the regulatory capital of the financial institution. Additionally, in order to preserve the regular functioning of the Brazilian financial system, the Central Bank may determine that financial bills be converted into equity or written-off. These determinations will not be considered a default by the financial institution and will not accelerate the maturity of its other debts; and |
| • | Financial bills may include, as early maturity events, default on the payment of the interest of the financial bill or the dissolution of the financial institution. |
63
Table of Contents
Establishment of a Succession Policy
Financial institutions and other institutions authorized to operate by the Central Bank are required to maintain a succession policy for its management. The Board of Directors of the institutions are required by law to approve, supervise and control the process of planning such policy, which must expressly assign the positions subject to the succession policy, taking into consideration the institution’s structure, risk profile and business model. The succession policy shall cover recruiting, promotion, election and retention processes, based on rules that regulate the identification, evaluation and training of senior management positions considering the following aspects: (i) conditions required by Brazilian law to exercise such position; (ii) technical capacity; (iii) managing capacity; (iv) interpersonal skills; (v) knowledge of legislation and regulation regarding liability for their actions; and (vi) experience.
Our Board of Director’s approved our Manager’s Succession Policy in accordance with CMN’s resolution. Our succession policy aims to consolidate the internal procedures and practices of the Itaú Unibanco Group regarding the succession of our management team.
Code of Corporate Governance
The Brazilian Corporate Governance Code for publicly-held companies (Código Brasileiro de Governança Corporativa – Companhias Abertas) sets forth corporate governance-related principles, guidelines and actions applicable to publicly-held companies and determines that companies adopt the “apply or explain” model in respect of its principles, guidelines and actions. As a result of the edition of this Code, companies must submit to CVM a report regarding their adherence to the Brazilian Corporate Governance Code within seven months of the closing date of the fiscal year. The implementation of the Corporate Governance Code was integrated in the local regulatory framework in 2017 by means of the CVM Ruling No. 586/17.
In addition, the CMN has included the principles and criteria of corporate governance of financial institutions established by the Basel Committee into the Brazilian regulatory framework, through the “Core Principles for Effective Banking Supervision.”
CMN rules establish the terms for the remittance of information on the management of financial institutions to the Central Bank, controlling group and relevant shareholders, including the obligation to communicate to the regulator any information that may affect the reputation of any person classified in one of such categories. For this purpose, financial institutions must provide a communication channel which allows employees, contributors, clients, users, associates, or services providers to anonymously report situations indicating illegal acts of any nature related to the institution. The financial institutions must also determine the internal body responsible for receiving the information and complying with the reporting obligations.
Anti-Corruption Law
In January 2014, a new Brazilian anti-corruption law came into force. The new law establishes that legal entities will have strict liability (regardless of fault or willful misconduct) if they are involved in any form of bribery. Although known as an anti-corruption law, it also encompasses other injurious acts contrary to the Brazilian or foreign public administration including bid rigging and obstruction of justice. The law provides for heavy penalties, both through administrative and judicial proceedings including determination of dissolution of a company, prohibition against undertaking to finance with public entities and prohibition against participating in public biddings.
In addition, the law authorizes the public administrative authorities responsible for the investigation to enter into leniency agreements. The self-disclosure of violations and cooperation by legal entities may result in the reduction of fines and other sanctions as determined by the new federal regulation issued in March 2015.
64
Table of Contents
The new regulation also provides parameters for the application of the anti-corruption law including with respect to penalties and compliance programs. Please refer:
| (i) | To our Investor Relations website > Itaú Unibanco > Corporate Governance > Rules and Policies > Policies > Anti-corruption Corporate Policy from which you can electronically access further details about our Anti-corruption Corporate Policy. |
| (ii) | To our Investor Relations website > Itaú Unibanco > Corporate Governance > Rules and Policies > Policies > Corporate Conduct, Integrity and Ethics Policy from which you can electronically access further details about our Integrity and Ethics Program and guidelines for situations of conflicts of interests. |
Compensation of Directors and Officers of Financial Institutions
According to rules set forth by the CMN, Brazilian financial institutions are required to have a compensation policy. If variable compensation is to be paid to management, at least 50% of the total compensation should be paid in shares or share-based instruments and at least 40% of the total compensation should be deferred for future payment for at least three years. If the institution records a significant decrease in the realized recurring profit or a negative result during the deferral period, the deferred and unpaid portions of the compensation should be reversed proportionally to the decrease in result, in order to minimize the loss incurred by the financial institutions and their stockholders.
Our compensation policy, applicable to directors and officers in Brazil (constituting the major part of the management population of the Itaú Unibanco Group), complies with CMN’s regulatory requirements. Our compensation principles and practices worldwide comply with each local regulation and seek to increase alignment between the interests of our stockholders and our management.
For further information, see Item 6B, Compensation.
Antitrust Regulation
The Brazilian Antitrust Law requires that transactions resulting in economic concentration should be submitted for prior approval to CADE, the Brazilian antitrust regulator, if the transactions meet the following criteria: (i) the economic group of any of the parties to a transaction recorded, in the fiscal year prior to that of the transaction, minimum gross revenues of R$750 million; and (ii) at least one of the other economic groups involved in the transaction recorded, for the same time period, minimum gross revenues of R$75 million. The closing of a transaction prior to CADE’s approval subjects the parties to fines ranging from R$60,000 to R$60 million, the nullity of the relevant agreement and potential administrative proceedings. In addition to submitting such transactions to CADE’s approval, financial institutions are required by Circular No. 3,590/2012 of the Central Bank (updated by Circular No. 3,800/2016) to submit to the Central Bank’s antitrust approval any concentration acts involving two or more financial institutions in the following cases: (i) acquisition of corporate control, (ii) a merger, (iii) transfer of the business to another financial institution, and (iv) other transactions which result in increased market share in the market segments they operate.
With respect to the conflict of jurisdiction to review and approve concentration acts involving financial institutions, in December 2018, the Central Bank and CADE approved a joint normative act establishing the procedures improve the efficiency their respective actions in antitrust matters in the National Financial System. Pursuant to the joint normative act, the authorities will be authorized to share information for the purposes of their respective activities and carry out meetings to discuss matters that require actions from such authorities. Such joint normative act also provides that transactions involving financial institutions must be submitted to independent analyses by each of the authorities. In cases involving risk to the financial system, the Central Bank shall approve the transaction; CADE will be bound by this approval and must adopt the decision of the Central Bank as grounds for approval. CADE and the Central Bank shall also cooperate in CADE’s administrative procedures regarding anticompetitive practices of financial institutions.
Our Antitrust Corporate Policy is available on the Investors Relations website of Itaú Unibanco > Corporate Governance > Rules and Policies > Policies >Antitrust Corporate Policy.
65
Table of Contents
Treatment of Past Due Debts
Brazilian financial institutions are required to classify their credit transactions (including leasing transactions and other transactions characterized as credit advances) at different levels and recognize provisions according to the level attributed to each such transaction. The classification is based on the financial condition of the clients the terms and conditions of the transaction and the period of time during which the transaction is past due, if any. For purposes of Central Bank requirements, transactions are classified as level AA, A, B, C, D, E, F, G or H, with AA being the highest classification. Credit classifications must be reviewed on a monthly basis and, apart from additional provisions required by the Central Bank which are deemed necessary by the management of financial institutions, each level has a specific allowance percentage that is applied to it and which we use to calculate our allowance for loan losses, as specified in more detail in the table below:
|
Classification(1) |
AA | A | B | C | D | E | F | G | H | |||||||||||||||||||||||||||
| Allowance (%) | 0 | 0.5 | 1 | 3 | 10 | 30 | 50 | 70 | 100 | |||||||||||||||||||||||||||
| Past due (in days) |
- | - | 15 to 30 | 31 to 60 | 61 to 90 | 91 to 120 | 121 to 150 | 151 to 180 | Over 180 | |||||||||||||||||||||||||||
| (1) | Our credit classification also takes into account the client’s credit profile, which may negatively impact the past due classification. |
Under IFRS, the allowance for loan losses is based on our internally developed incurred loss models, which calculate the allowance for loan losses by multiplying the probability of default by the clients or counterparty, or PD, by the potential for recovery on defaulted credits (LGD) for each transaction, as described in “Note 2.4(d) I – Classification and Measurement of Financial Assets” and “Note 32 Risk and Capital Management” of our audited consolidated financial statements. The risk levels are categorized as:
Lower risk: PD lower or equal than 4.44%
Satisfactory: PD from 4.44% up to 25.95%
Higher risk: PD higher than 25.95%
Credit-Impaired: loans classified in Stage 3
Bank insolvency
The insolvency of financial institutions is handled pursuant to applicable laws and regulations by the Central Bank, which initiates and monitors all applicable administrative proceedings. There are three types of special regimes that may be imposed to either privately-held financial institutions or state-owned (other than federal government-owned) financial institutions or similar institutions: (i) temporary special administration regime or RAET, (ii) intervention, and (iii) extrajudicial liquidation. Financial institutions may also be subject to the bankruptcy regime.
In the course of the special regimes described below, the steering committee, the intervenor, and the liquidator may, when authorized by the Central Bank: (i) dispose of assets and rights of the financial institution to third parties and (ii) proceed with corporate restructuring processes in the financial institution or its subsidiaries, among other possible measures of similar effect.
RAET
The RAET is a less severe special regime which allows financial institutions to continue to operate. Its main effect is that the whole management loses its offices and is replaced by a steering committee appointed by the Central Bank with broad management powers. Its duration is limited and its main objective is the adoption of measures aimed at the resumption of the financial institution’s regular activities. If resumption is not possible, this regime may be turned into an extrajudicial liquidation.
66
Table of Contents
Intervention
Under this regime, the Central Bank appoints an intervenor that takes charge of the financial institution’s management, suspending its regular activities and dismissing the financial institution’s management. In general, the intervention is aimed at preventing the continuation of certain irregularities and the aggravation of the financial situation of the financial institution, which can put assets at risk and harm the financial institution’s creditors. The intervention is also time-limited and may be followed by the resumption of the financial institution’s regular activities or the declaration of extrajudicial liquidation or bankruptcy.
The intervention suspends all actions related to payment obligations of the financial institution, prevents the early settlement or maturity of its obligations and freezes pre-existing deposits.
Extrajudicial Liquidation
Extrajudicial liquidation generally corresponds to the process of dissolution of the company in cases of unrecoverable insolvency or severe violations of the rules that regulate a financial institution’s activities. The extrajudicial liquidation aims at promoting the liquidation of the existing assets for the payment of creditors, with the return of any amounts left to stockholders. Controlling stockholders may be held responsible for remaining liabilities.
The extrajudicial liquidation (i) suspends actions and executions against the financial institution, (ii) accelerates the maturity of the financial institution’s obligations; and (iii) interrupts the statute of limitations of the financial institution’s obligations. In addition, the debt of the estate under liquidation will no longer accrue interest until all obligations to third parties are settled.
Deposit Insurance
In the event of intervention, extrajudicial liquidation or liquidation of a financial institution in a bankruptcy proceeding, the Credit Insurance Fund, or FGC, a deposit insurance system, guarantees the maximum amount of R$250,000 for certain deposits and credit instruments held by an individual, a company or another legal entity with a financial institution (or financial institutions of the same economic group). Such deposits and credit instruments contracted as of December 22, 2017 are subject to an additional limit: the total coverage of the referred guarantee is R$1,000,000 per investor regardless of the number of accounts held in different financial groups and such limit is valid for a period of 4 years. The resources of the FGC come primarily from mandatory contributions from all Brazilian financial institutions that receive deposits from clients, currently at a monthly rate of 0.01% of the amount of the balances of accounts corresponding to the financial instruments that are the subject matter of the ordinary guarantee, even if the related credits are not fully covered by FGC, and certain special contributions. Deposits and funds raised abroad are not guaranteed by the FGC. As from February 2016, credits of financial institutions and other institutions authorized to operate by the Central Bank, complementary welfare entities, insurance companies, capitalization companies, investment clubs and investment funds, as well as those representing any interest in or financial instrument held by such entities, are not protected by the ordinary guarantee of FGC.
Payment of Creditors in Liquidation
In the event of extrajudicial liquidation of a financial institution or liquidation of a financial institution in a bankruptcy proceeding, the salaries of employees and the related labor claims up to a certain amount, secured credits and tax charges have priority in any claims against the entity in liquidation. The payment of unsecured credits, including deposits from regular retail clients that are not guaranteed by the FGC, is subject to the prior payment of preferred credits. Additionally, upon the payment of the deposits guaranteed by the FGC, the FGC becomes an unsecured creditor of the estate in liquidation.
67
Table of Contents
Insurance Regulation
With governmental approval, insurance companies in Brazil may offer all types of insurance, except for workers’ compensation insurance, directly to clients or through qualified brokers.
Insurance companies must set aside reserves to be invested in specific types of securities. As a result, insurance companies are among the main investors in the Brazilian securities market and subject to CMN regulations regarding the investment of technical reserves.
In the event an insurance company is declared bankrupt, the insurance company will be subject to a special procedure administered by SUSEP or by ANS. If an insurance company is declared bankrupt and (i) its assets are not sufficient to guarantee at least half of the unsecured credits or (ii) procedures relating to acts that may be considered bankruptcy-related crimes are in place, the insurance company will be subject to ordinary bankruptcy procedures.
There is currently no restriction on foreign investments in insurance companies in Brazil.
Brazilian legislation establishes that insurance companies must buy reinsurance to the extent their liabilities exceed their technical limits under the rules of the regulatory bodies (CNSP and SUSEP), and reinsurance contracts may be entered into through a direct negotiation between the insurance and reinsurance companies or through a reinsurance broker authorized to operate in Brazil.
Insurance companies, from January 1, 2017, when transferring their risks in reinsurance, must transfer 30.0% of each facultative or automatic contract to local reinsurers (companies domiciled in Brazil).
From January 1, 2018, this percentage reduced to 25%, and will reduce annually until it reaches 15% on January 1, 2020.
In addition, from January 1, 2017, risk assignment between insurers and reinsurers belonging to the same economic group based abroad is limited to 30.0% of the premiums pertaining to each facultative or automatic contract.
From January 1, 2018, this percentage increased to 45%, and annually will increase until it reaches 75% on January 1, 2020.
Anti-Money Laundering Regulation
The Brazilian anti-money laundering law establishes the basic framework to prevent and punish money laundering as a crime. It prohibits the concealment or dissimulation of origin, location, availability, handling or ownership of assets, rights or financial resources directly or indirectly originated from crimes, subjecting the agents of these illegal practices to imprisonment, temporary disqualification from managing enterprises up to ten years and monetary fines.
The Brazilian anti-money laundering law also created COAF, which is the Brazilian financial intelligence unit that operates under the jurisdiction of the Ministry of Justice. COAF performs a key role in the Brazilian anti-money laundering and counter-terrorism financing system, and its legal responsibility is to coordinate the mechanisms for international cooperation and information exchange.
In compliance with the Brazilian anti-money laundering law and related regulations enacted by the Central Bank, including the rules applicable to procedures that must be adopted by financial institutions to prevent and combat money laundering and terrorism financing, as well as in response to the recommendation of FATF and United Nations Security Council, financial institutions in Brazil must establish internal control and procedures aiming at:
| • | identifying and knowing their clients, which includes determining if they are PEPs, and also identifying UBOs. These records should be kept up-to-date; |
| • | checking the compatibility between the movement of funds of a client and such client’s economic and financial capacity; |
| • | checking the origin of funds; |
68
Table of Contents
| • | carrying out a prior analysis of new products and services, under the perspective of money laundering prevention; |
| • | keeping records of all transactions carried out or financial services provided on behalf of a certain client or for that client; |
| • | reporting to COAF, within one business day, any transaction deemed to be suspicious by the financial institution, as well as all transactions in cash equivalent to or higher than R$50,000, without informing the involved person or any third party; |
| • | applying special attention to (i) unusual transactions or proposed transactions with no apparent economic or legal bases; (ii) transactions involving PEPs, (iii) indication of evading client identification and transaction registering procedures; (iv) client and transactions for which the UBO cannot be identified; (v) transactions originated from or destined to countries that do not fully comply with the recommendations of the FATF; and (vi) situations in which it is not possible to keep the clients’ identification records duly updated; |
| • | determining criteria for hiring personnel and offering anti-money laundering training for employees; |
| • | establishing procedures to be complied with by all branches and subsidiaries of a Brazilian financial institutions located abroad with respect to anti-money laundering; |
| • | establishing that, any institutions authorized to operate in the Brazilian foreign exchange market with financial institutions located abroad must verify whether the foreign financial institution is physically located in the jurisdiction where it was organized and licensed, and that it is subject to effective supervision; |
| • | monitoring transactions and situations which could be considered suspicious for anti-money laundering purposes; |
| • | reporting to COAF the occurrence of suspicious transactions, as required under applicable regulations, and also, at least once a year, whether or not suspicious transactions are verified, in order to certify the non-occurrence of transactions subject to reporting to COAF (negative report); |
| • | requiring clients to inform the financial institution, at least three business days in advance, of their intention to withdraw amounts equal to or exceeding R$50,000; |
| • | ensuring that policies, procedures and internal controls are commensurate with the size and volume of transactions; and |
| • | unavailability of goods, values and rights of possession or ownership and all other rights, real or personal, owned, directly or indirectly, of natural or legal persons subject to sanctions by the resolutions of the United Nations Security United Council. |
Non compliance with any of the obligations above subjects the financial institution and its officers to penalties ranging from: (i) formal notice, (ii) fines (from 1.0% to 200.0% of the amount of the transaction, 200.0% of the profit generated thereby, or a fine of up to R$20,000,000), (iii) rendering executive officers ineligible for holding any management position in financial institutions, to (iv) the cancellation of the financial institution’s license to operate.
In August 2013, the FEBRABAN enacted an anti-money laundering and terrorism financing self-regulation. The purpose of the document is to improve the contribution of the Brazilian financial system to the prevention of money laundering and make consistent the practices adopted by all banks, encouraging them to reinforce their preventive procedures.
On July 28, 2017, the Central Bank enacted a new rule including additional requirements with respect to anti-money laundering, that it came into force on December 27, 2017. The recent changes to the regulation include the obligation to maintain specific records of transactions in cash (deposit, withdrawal, withdrawal by means of a prepaid card, request of provision for withdrawal or Electronic Available Transfer—TED) by financial institutions in an amount equal to or greater than R$50,000 per transaction. The rule also includes provision establishing that, among others, all commercial banks, multiple banks and credit cooperatives must require form their clients a minimum of three business days prior communication for withdrawals and cash payments of an amount equal to or greater than R$50,000 per withdrawal.
69
Table of Contents
On May 28, 2018, the Central Bank enacted a new rule that prohibits financial institutions from receiving a payment receipt equal to or greater than R$10,000 in cash.
Politically Exposed Persons (PEPs)
According to the Central Bank, PEPs are public agents who hold or have held a relevant public position, as well as their representatives, family members or other close associates, over the past five years, in Brazil or other countries, territories and foreign jurisdictions. It also includes their legal entities. Financial institutions must develop and implement internal procedures to identify PEPs and obtain special approval from a more senior staff member, such as an officer, than otherwise would be required to approve relationships prior to establishing any relationship with those individuals. They should also adopt reinforced and continuous surveillance actions regarding transactions with PEPs and report all suspicious transactions to COAF.
Leasing Regulation
Although leasing transactions are not classified as credit transactions under Brazilian legislation, the Central Bank regulates and oversees leasing transactions. The parties involved in a leasing transaction are the “lessor” (the bank) and “lessee” (our client). The leased asset, owned by the lessor, is delivered to be used by the lessee until the end of the contract, when the lessee may opt to either acquire or return it to the lessor or renew the contract for a new period.
Brazilian legislation establishes a specific methodology to account for the profits or losses in leasing transactions and all information that should be included in a lease agreement. The guaranteed residual amount paid by a lessee should correspond to a minimum return required for the transaction to be viable for the lessor, whether the purchase option is exercised or not. The laws and regulations applicable to financial institutions, such as those related to reporting requirements, capital adequacy and leverage, assets composition limits and allowance for losses, are also generally applicable to leasing companies.
Correspondent Agents
We may engage other entities to provide certain services to our clients, including customer service. These entities are generally called correspondents, and our relationship with correspondents is regulated by the Central Bank. Among other requirements, the Central Bank establishes that employees of all correspondent agents must hold a technical certification authorizing them to serve customers involved in credit and leasing operations.
Regulation of the Brazilian Securities Market
According to the Brazilian Corporate Law, a company is considered publicly-traded or closely-held depending on whether the securities issued by it are accepted for trading in the securities market or not. All publicly-held companies, such as our company, are registered with the CVM, are subject to specific regulations and are also subject to information disclosure and reporting requirements.
Disclosure Requirements
Under CVM rules, publicly-traded companies are subject to disclosure requirements and rules governing the use of material information. Any decision that may reasonably influence the price of the securities issued by a publicly-held company or the decision of investors to buy, sell, or hold these securities, is considered material.
The CVM improved the quality of the information that must be presented in periodic filings by securities issuers by requiring such issuers to file a “Reference Form” with the CVM. This form was modeled after IOSCO’s shelf registration system in gathering all of the issuer’s information in a single document.
In 2018, some publicly-held companies, like us, filed a form about a “Brazilian Corporate Governance Code” in the “apply or explain” format.
70
Table of Contents
Asset Management Regulation
The Brazilian asset management regulation requires a previous registration with the CVM to perform the services of portfolio management and fund administration.
Itaú Unibanco Group provides several services in the capital markets and, in particular, performs activities related to fund administration and portfolio management under CVM registration and in accordance with CVM regulation.
By providing these services, our entities engaged in the asset management business can be held civilly and administratively liable for losses arising from either intentional acts or negligence in conducting their activities.
The CVM has regulatory powers to oversee these activities, including powers to impose fines and other sanctions on registered asset managers.
Funds of Foreign Investors
Individuals or legal entities domiciled outside Brazil may invest in companies or other assets in Brazilian financial and capital markets, according to the restrictions and requirements set forth in the local regulation. All foreign investments in Brazil shall be registered with the Central Bank and/or CVM, depending on the type of the investment.
The foreign direct investment (RDE – IED) enables the non-resident investors to hold stock of companies in Brazil, whereas the portfolio investment (RDE – Portfolio) entitles the investment in almost all financial assets and transactions available in the Brazilian financial and capital markets, being subject to some restrictions of Brazilian regulation.
In March 2015 a new regulatory framework regarding RDE – Portfolio became effective. The most significant changes in the rules applicable to foreign investment in the Brazilian financial and capital markets introduced by the new regulation were: (i) a requirement that only financial institutions authorized to operate in Brazil may act as legal representatives of non-resident investors in Brazil for purposes of any investments made within the purview of such rule; (ii) clarification of requirements regarding simultaneous foreign exchange transactions (without the effective transfer of money) related to foreign investments; and (iii) clarification about the types of investments that can be made through a foreign investor account (conta de domiciliado no exterior) maintained at a bank in Brazil.
The new regulation also amended the rules applicable to depositary receipts, by allowing the issuance of depositary receipts based on (i) any security issued by Brazilian companies registered with the CVM (companhias abertas), in contrast to the previous rules which limited the issuance of depository receipts to equity securities, and (ii) credit instruments issued by financial institutions and other types of institutions registered with the CVM and authorized by the Central Bank, and eligible to be included in the financial institution’s regulatory capital (Patrimônio de Referência).
Some of the changes implemented by the CVM rules on registry, operations and disclosure of information related to foreign investment in the Brazilian financial and capital markets were made to detail the activities of legal representatives, to enlarge the scope of non-resident investor’s private transactions and to determine the exceptions of transfer between non-resident investors prohibited by CMN.
Internet and E-Commerce Regulation
Certain aspects of electronic commerce are regulated, including the validity of electronic documents in Brazil and electronic commerce transactions from the consumer protection standpoint. Current regulation on electronic commerce is intended to: (i) clearly identify the supplier and the product sold on the Internet; (ii) provide an electronic service channel to clients; and (iii) guarantee cancellation and return of Internet orders.
In addition, computer hacking offenses were criminalized in Brazil in 2012.
71
Table of Contents
In light of the increased use of electronic channels in the Brazilian banking industry, the CMN has enacted a number of resolutions over the past few years in order to provide or establish:
| • | that Brazilian residents may open deposit bank accounts by electronic means, which includes the Internet, ATMs, telephone and other communication channels, provided that transfers of amounts from such accounts are allowed only between accounts of the same account holder or in the event of liquidation of investment products and funds of an account, of the same account holders who own the investment products or funds; |
| • | the requirements related to the verification of a client’s identity; |
| • | that all financial institutions that offer products and services through electronic means must guarantee the security, secrecy and reliability of all electronic transactions and disclose, in clear and precise terms, the risks and responsibilities involving the product or service acquired through these channels; and |
| • | the opening of deposit bank and savings accounts that can be used exclusively through electronic means. |
On April 25, 2016, the CMN enacted a regulation on the opening and closing of banking accounts by electronic means, without the restrictions described above. The banks must adopt procedures and controls to confirm and guarantee the client’s identity and the authenticity of the information required to open an account. The regulation permits the use of digital signatures and the collection of signatures through electronic devices. The procedures and technologies used in the opening and closing of electronically deposit accounts must observe:
I—integrity, authenticity and confidentiality of the information and electronic documents used;
II—protection against access, use, modification, reproduction and unauthorized destruction of information and electronic documents;
III—backup production of information and electronic documents; and
IV—tracking and auditing procedures and technologies used in the process.
Under the new regulation, clients must be afforded the option of closing banking accounts electronically.
Federal Law No. 12,965/2014 and Federal No. Decree 8,771/2016 establish the regulatory framework for internet services in Brazil and set forth principles and rules to be observed by internet providers and users, including the protection of privacy and personal data and the preservation and safeguard of net neutrality
FEBRABAN, has issued a regulation on extending credit through remote channels (such as ATM’s, call centers and internet banking), setting out minimum guidelines and procedures to ensure reliability, quality, transparency and efficiency.
Regulation on Payment Agents and Payment Arrangements
A Brazilian law enacted in October 2013 establishes the legal framework for “payment arrangements” (i.e. the set of rules governing a payment scheme, such as a credit or debit card transaction), and “payment agents” (i.e., any agent that issues a payment instrument or acquires a merchant for payment acceptance), which became part of the Brazilian Payments System and subject to oversight by the Central Bank. Payment agents, in spite of being regulated by the Central Bank, are not deemed to be financial institutions and are prohibited from engaging in activities that are exclusive of financial institutions.
The CMN and the Central Bank published rules in November 2013 regulating payment arrangements and payment agents. This regulation establishes, among other matters: (i) consumer protection and anti-money laundering compliance and loss prevention rules that should be followed by all entities supervised by the Central Bank when acting as payment agents and payment arrangers; (ii) the procedures for the incorporation, organization, authorization and operation of payment agents, as well for the transfer of control, subject to the Central Bank’s prior approval; (iii) capital requirements; (iv) definition of arrangements excluded from the Brazilian Payments System; (v) payment accounts, which are divided into prepaid and post-paid accounts; and (vi) a liquidity requirement for prepaid accounts that demands the allocation of their balance to a special account at the Central Bank or to be invested in government bonds, starting at 20% in 2014 and raising gradually up to the totality of the total account balance in 2019.
72
Table of Contents
In October 2015, a regulation was published by the Central Bank regulating limitations on closed payment arrangements, the concept of domicile institution, the obligation of centralized clearing and settlement for the payment arrangements, and transparency of interoperability rules within an arrangement and between arrangements.
On March 26, 2018, the Central Bank enacted Circular No. 3,887 establishing limitations to the interchange fee for debit transactions, which is the remuneration of the issuer paid by the merchant for each transaction. The average fee for the interchange is 0.5% and the maximum fee is 0.8%. These limitations are not applicable to non-face-to-face transactions and to corporate cards.
Provision of Financial Services through Electronic Channels
On April 25, 2016, the CMN enacted a new regulation, altering the exceptions to the general rule that obligates financial institutions to provide client access to traditional banking services channels, establishing that it is not required for collection and receipt services based on agreements that demand exclusively electronic channels.
Credit Performance Information
CMN regulates a database known as Credit Information System (Sistema de Informações de Crédito, or SCR), which comprises information regarding credit operations sent to the Central Bank. SCR’s purpose is to provide information for the Central Bank to monitor and supervise credit in the financial system, and also to enable information exchange among financial institutions.
Consumer Protection Code
The Brazilian Consumer Protection Code, or CDC, sets forth consumer defense and protection rules applicable to consumers’ relationships with suppliers of products or services. Brazilian higher courts understand that the CDC is also applicable to financial institutions.
The basic consumer rights dealing with financial institutions are as follows:
| • | Reverse burden of proof in court; |
| • | Proper and clear information provided with respect to the different products and services offered, with accurate specifications for quantity, characteristics, composition, quality, and price, as well as on any risks such products pose; |
| • | Interest charged in connection with personal credit and consumer directed credit transactions must be proportionally reduced in case of early payment of debts; |
| • | Amounts charged improperly may in limited circumstances have to be returned in an amount equal to twice what was paid in excess of due amounts. Such rule does not apply to cases of justifiable mistakes, such as systemic failure or operational error; |
| • | Collection of credits cannot expose the client to embarrassment or be performed in a threatening manner; |
| • | Financial institutions are prohibited from releasing misleading or abusive publicity or information about their contracts or services, as well as promoting overbearing or disloyal commercial practices; and |
| • | Financial institutions are liable for any damages caused to their consumers by misrepresentations in their publicity or information provided. |
Moreover, the Brazilian Congress is considering enacting legislation that, if signed into law as currently proposed, could have an adverse effect on us. For example, a proposed law to amend the Brazilian consumer protection code would allow courts to modify terms and conditions of credit agreements in certain circumstances, imposing specified restrictions on the collection of amounts from final consumers.
73
Table of Contents
In addition, there are some local and state bills and laws governing banking activities, by imposing security measures, standards for customer service and accessibility requirements (such as limits with respect to queues, folding screens, security guards, braille statements, receipt notice in debt collection and strict charging schedule). However, due to illegality or lack of reasonability in the provisions, some of those laws are judicially questioned.
Late Payment and Default
On February 23, 2017, the CMN enacted a new regulation (Resolution No. 4,558) providing that in case of delay or non-payment of credit operations, the financial institutions may only charge customers the following: (i) the interest rate established in the agreement; (ii) default interest and late payment fine in accordance with the law. This regulation entered into force on September 1, 2017.
Data Protection
The Brazilian General Data Protection Act, or the GDPA, was published in the Federal Official Gazette on August 15, 2018 and was amended by Provisional Measure No. 869, issued by the President of Brazil in December 2018, or the MP 869/2018. The GDPA will take effect in August 2020 (the original effective date was February 2020, but MP 869/2018 postponed it for 6 months).
Before GDPA comes into force, Brazil lacks a data privacy specific regulation and a data protection authority. Privacy is generally protected through the Federal Constitution, the Brazilian Civil Code (Law No. 10,406 of January 10, 2002), the Brazilian Consumer Protection Code (Law No. 8,078 of September 11, 1990) and the Civil Rights Framework for the Internet (Law No. 12,965 of April 23, 2014 and the Decree 8,771 of May 11, 2016, also known as the Internet Law).
The GDPA brings about major changes in the conditions for personal data processing, with a set of rules to be observed in activities such as collection, processing, storage, use, transfer, sharing and erasure of information concerning identified or identifiable natural persons. The application of the GDPA will apply irrespective of industry or business when dealing with personal data.
The MP 869/2018
created the Brazilian.National Data Protection Authority, or the ANPD, which will have equivalent activities to the European data protection authorities, exercising the triple role of (i) investigation, being able to issue
norms and procedures, deliberate on the interpretation of the Act and request information to controllers and processors; (ii) enforcement, in cases of non compliance with the law, through an administrative process; and (iii) education,
disseminating knowledge about the Act and security measures, stimulating standards for services and products that facilitate control of data subjects, and elaborating studies on national and international practices for the protection of personal
data and privacy, amongst others.
The ANPD has been assured technical independence, although subordinated to the Presidency of the Republic.
Regulation of Independent Auditors
In accordance with CMN regulations establishing the rules that govern external audit services provided to financial institutions, the financial statements and financial information of financial institutions must be audited by independent auditors who are (i) duly registered with the CVM; (ii) qualified as specialists in audit of banks by the CFC and the IBRACON; and (iii) meet the requirements that ensure auditor independence.
After issuing audit reports for five consecutive fiscal years, the responsible audit partner and audit team members with management responsibilities must rotate-off and cannot be part of the audit team of such institution for three consecutive fiscal years.
74
Table of Contents
CMN regulations also prohibits the engagement and maintenance of independent auditors by financial institutions in the event that: (i) any of the circumstances of impediment or incompatibility for the provision of audit services provided for in the rules and regulations of the CVM, CFC or IBRACON arise; (ii) ownership of shares of or entering into financial transactions (either asset or liability) with the audited financial institution by the audit firm or members of the audit team involved in the audit work of the financial institution; and (iii) fees payable by the institution represent 25% or more of the total annual fees of the audit firm. Additionally, the audited financial institution is prohibited from hiring partners and members of the audit team with managerial responsibilities who were involved in the audit work at the financial institution during the preceding 12 months.
In addition to the audit report, the independent auditor must prepare the following reports, as required by CMN regulation.
| • | An assessment of the internal controls and risk management procedures of the financial institution, including its electronic data processing system; |
| • | A description of non compliance with legal and regulatory provisions that have, or may have, a significant impact on the audited financial statements or operations of the audited financial institution; and |
| • | Others reports required by Central Bank. |
These reports, as well as working papers, correspondence, service agreements and other documents related to the audit work must be retained and made available to the Central Bank for at least five years.
Under Brazilian law, our financial statements must be prepared in accordance with the accounting practices adopted in Brazil applicable to institutions authorized to operate by the Central Bank. We also prepare financial statements in accordance with the IFRS as issued by IASB. Please see “Presentation of Financial and Other Information—About our Financial Information” for further details. Financial institutions must have their financial statements audited every six months. Quarterly financial statements filed with the CVM must be reviewed by independent auditors of the financial institutions. CVM rules require publicly-held companies, including financial institutions, to disclose information related to non-audit services provided by independent auditors when they represent more than 5% of the fees for audit services. Such information should include the type of service, the amount paid and the percentage that they represent of the fees for the audit of financial statements. Please see “Item 16C. Principal Accountant Fees and Services” for further details about fees and services of the principal auditors.
Self-Regulators
We are signatories of self-regulation codes that establish principles, rules and recommendations of best corporate governance practices and determined activities, as applicable. Some of self-regulatory entities that we are subject are the ABRASCA, ABECS, ANBIMA, FEBRABAN, among others.
Portability of Credit Transactions
The portability of credit transactions has been regulated by the Central Bank since 2013. Portability consists of the transfer of a credit transaction from the original creditor to another institution, at the request of the debtor, maintaining the same outstanding balance and payment conditions. The regulation establishes standard procedures and deadlines for the exchange of information and the mandatory use of an electronic system authorized by the Central Bank for the transfer of funds between financial institutions, prohibiting the use of any alternative procedure to produce the same effects of the portability, including so-called “debt purchases”.
Rules Governing the Charging of Fees on Banking and Credit Card Operations
Banking fees and credit card operations are extensively regulated by the CMN and the Central Bank. According to Brazilian legislation, we must classify the services we provide to individuals under pre-determined categories and are subject to limitations on the collection of fees for such services.
75
Table of Contents
Brazilian financial institutions are generally not authorized to charge fees from individuals for providing services classified as “essential” with respect to checking and savings accounts, such as supplying debit cards, check books, withdrawals, statements and transfers, among others.
Brazilian legislation also authorizes financial institutions to charge fees related to “priority services”, a standard set of services defined by Central Bank regulation. Financial institutions must offer to their individual clients “standard packages” of priority services. Clients may also choose between these or other packages offered by the financial institution, or to use and pay for services individually instead of selecting a package.
Current rules also authorize financial institutions to charge fees for specific services called “additional services” (serviços diferenciados), provided that the account holder or user is informed of the use and payment conditions relating to such services, or that fees and collection methods are defined in the contract.
The CMN also establishes rules applicable to credit cards, determining the events that allow for the collection of fees by issuers, as well as the information that must be disclosed in credit card statements and in the credit card agreement. There is also a list of priority services. The rules define two types of credit cards: (i) basic credit cards, with simpler services, without rewards programs and (ii) “special credit cards”, with benefits and reward programs.
A minimum of 30-days’ prior notice to the public must precede the creation or increase of a fee. In addition, fees related to priority services may only be increased 180 days after the date of a previous increase (the reduction of a fee can take place at any time). With respect to credit cards, a 45-days’ prior notice to the public is required for any increase or creation of fees and such fees may only be increased 365 days after the previous increase. The period of 365 days is also subject to changes in the rules applicable to benefit or reward programs.
At the end of 2016 and the beginning of 2017, two major changes occurred in the Brazilian payment market. In December 2016 a provisional measure was published authorizing the surcharge by payment instrument as a way to stimulate retail sales, allowing retailers to charge different prices depending on the payment method. In January 2017 the CMN published a new resolution establishing that revolving credit for the financing of credit card bills may only be extended to clients until the due date of the following credit card bill. After such term, the credit provider must offer the client another type of financing with conditions more favorable than the ones that are provided in the credit card market. In addition, the credit provider shall no longer offer this type of credit to clients that already contracted revolving credit for the financing of credit card bills which were not repaid on time.
In 2018, the CMN enacted a new resolution establishing that the following fees may be collected in the event of late payment or settlement of obligations related to credit card bills and other postpaid payment instruments: (i) compensatory interest, per day of delay, on overdue installments or on unpaid debtor balances; (ii) a fine and (iii) interest for late payment.
The same resolution also established that the change in credit limits, if not carried out at the request of the customer, should, in the case of: (i) reduction, be preceded by at least 30-days’ advanced notice to the client, except if there is a deterioration of the customer’s credit risk profile, according to the criteria defined in the credit risk management policy, in which case notice may be made at any time prior to the reduction; and (ii) increase, be conditioned upon the customer’s prior acquiescence.
Banking Secrecy
Brazilian financial institutions must maintain the secrecy of banking transactions and services provided to their clients. The only circumstances in which information about clients, services or transactions by Brazilian financial institutions or credit card companies may be disclosed to third parties are the following:
| • | the disclosure of information with the express consent of the interested parties; |
| • | the exchange of information between financial institutions for record purposes; |
| • | the disclosure of information to credit reference agencies based on data from the records of subscribers of checks drawn on accounts without sufficient funds and defaulting debtors; |
76
Table of Contents
| • | the disclosure of information to the competent authorities relating to the actual or suspected occurrence of criminal acts or administrative wrongdoings, including the disclosure of information on transactions involving funds related to any unlawful activities; |
| • | the disclosure of some information established by law to tax authority; and |
| • | the disclosure of information in compliance with a judicial order. |
Except as permitted under Brazilian legislation or by judicial order, a breach of bank secrecy is a criminal offense.
Digitalization of Documents and Record Keeping
On March 31, 2016, the CMN enacted a new resolution regulating the digitalization of documents with respect to transactions carried out by financial institutions and other institutions authorized to operate by the Central Bank. The regulation authorizes those institutions to maintain digital documents, instead of paper documents, for recordkeeping purposes, if certain requirements to ensure the documents authenticity, validity and protection are met. It also permits the disposal of original paper documents provided that this measure will not prejudice the institution’s ability to exercise any rights or to commence any proceeding or exercise any protective remedy related to the relevant document.
Cybersecurity
In April 2018, the CMN issued a regulation on cyber risks and storage and processing in external environments and public clouds applicable to financial services following the public consultation held in 2017. According to this new rule, financial institutions must now follow cyber risk management and cloud outsourcing requirements on how these entities must design or adapt their internal controls. Policies and action plans to prevent and respond to cybersecurity incidents must be in place before May 2019, and fully compliant by December 2021. Data location and processing may take place inside or outside the Brazilian territory, but access to data stored abroad must be granted at all times to the Central Bank for inspection purposes.
Centralized Registration and Deposit of Financial Assets and Securities
On August 28, 2017, the Brazilian Congress converted Provisional Measure No. 775, issued by the President of Brazil in April 2017, into Law No. 13,476. The new law consolidates the provisions on the creation of liens over financial assets and securities. On the same day, the CMN issued a new rule to regulate the provisions of Law No. 13,476 and to consolidate the regulation on centralized deposit and the registry of financial assets and securities issued or owned by financial institutions and other institutions authorized to operate by the Central Bank. The CMN established a term of 180 days for this rule to become effective.
On September 5, 2018, the Central Bank issued a new rule amending the existing rule on centralized registration and deposit of financial assets and securities and the creation of liens on deposited financial assets and established the terms for the creation of liens over financial assets registered with registering entities. The referred rule established, amongst other changes, that such liens are effective in the moment that the central depositary accepts the command from its participant, pursuant to its internal regulations.
Labor Law Overhaul
Law No. 13,467/2017 (known as the Labor Law Overhaul), became effective on November 11, 2017. It amends several articles of Brazilian Consolidated Labor Statutes (known as “CLT”). Among the changes, the Law permits employers and unions to contract around certain provisions of the CLT, for purposes of preserving certain constitutional labor rights. This should give businesses the ability to better organize work shifts, overtime, vacation schedules, among other things. It also regulates telecommuting and intermittent jobs (which refers to a work schedule that is less than fulltime and does not have a prescheduled hour of duty). In addition, it authorizes that certain high-level employees can utilize arbitration as a dispute resolution method instead of taking their issues to the courts. Certain labor judges and scholars have raised legal and constitutional issues regarding the new law. Notwithstanding these discussions, the Labor Law Overhaul is an important reform of labor relations in Brazil.
77
Table of Contents
Law Amending the Proceedings for Administrative Sanctions in the Brazilian National Financial System, the SPB and Capital Markets
In June 2017, the Provisional Measure No. 784, or “MPV 784” was enacted amending the administrative proceedings in the Brazilian National Financial System, the Brazilian Payment System and capital markets. After numerous discussions, on October 19, 2017, Provisional Measure No. 784 ceased to be effective as no further legislative action was taken with respect to the provisional measure. Proposed modifications to the subject matter of Provisional Measure No. 784 related to administrative sanctioning procedures applicable to the Brazilian national financial system the Brazilian payment system and capital markets transactions in the Brazilian capital markets were then reissued under Bill of Law No. 8,843, which was approved by the Chamber of Deputies on October 18, 2017 and converted into Bill of Law No. 129 that was subsequently approved by the Brazilian senate on October 25, 2017. The result of the process was Law No. 13,506 which was published on November 14, 2017.
Law No. 13,506 provides for administrative sanctioning procedures by the Central Bank and the CVM. Some of the key aspects of Law No. 13, 506 are: (i) it increases the maximum fine applicable by the Central Bank from R$250 thousand to R$2 billion or 0.5% of the revenues of the company arising from services and financial products in the year prior to the violation; (ii) it increases the maximum fine applicable by the CVM from R$500 thousand to R$50 million; (iii) it makes additional types of violations and redefines some types of violations within the scope of the Central Bank’s regulatory authority; (iv) it provides for a penalty of “public admonition” in place of “warning”, applicable by the Central Bank; (v) it defines “serious violations” that fall within the scope of the Central Bank’s regulatory authority; (vi) it increases the maximum penalty with respect to disqualification to a period of twenty years; (vii) it provides that the Central Bank may enter into cease-and-desist commitments; (viii) it provides that the Central Bank and the CVM may enter into administrative agreements similar to leniency agreements; and (ix) it redefines certain conditions deemed forbidden in credit operations between related parties.
Compliance Risk
On August 28, 2017, the CMN enacted a new rule providing that Brazilian financial institutions and other institutions authorized to operate by the Central Bank must implement and maintain a compliance policy commensurate with the nature, size, complexity, structure, risk profile and business model of the institution. Such compliance policies are intended to ensure effective compliance risk management by an institution and may be established at the consolidated enterprise level (conglomerado prudencial). Among others, a compliance policy must establish the scope and purpose of the compliance function in the institution, set forth the organizational structure of the compliance policies, specify which personnel are allocated to the compliance function, and establish a segregation of roles among personnel in order to avoid conflicts of interest.
Internal Audit
On June 29, 2017, the CMN published Resolution No. 4,588, which establishes the rules applicable for internal audits at financial institutions and other institutions authorized to operate by the Central Bank. It determines that financial institutions and other institutions authorized to operate by the Central Bank must implement and maintain internal audit functions compatible with the nature, size, complexity, structure, risk profile and business model of the respective institution. Such activity must be undertaken by a specific unit in the institution directly subordinated to the Board of Directors or an independent auditor (provided that such auditor is not in charge of the audit of the financial statements of the institution or any other activity that may imply a conflict of interest).
Taxation of closed investment funds
MP 806/17 issued on October 30, 2017, which intended to extinguish the tax deferral regime applicable to closely held investment funds and subject them to taxation, was not converted into law. As a consequence, it was repealed.
78
Table of Contents
Taxes on Transactions entered into by the Itaú Unibanco Group
We summarize below the main taxes levied on the transactions entered into by entities in the Itaú Unibanco Group in Brazil. This description does not represent a comprehensive analysis of all tax considerations applicable to the Itaú Unibanco Group. For a more in-depth analysis, we recommend that potential investors consult their own tax advisors. The main taxes we are subject to, with its respective rates, are as follows:
| Tax | Rate | Tax calculation basis | ||
| IRPJ | 15.0% plus a 10.0% surtax | Net income with adjustments (exclusions, additions, and deductions) | ||
| CSLL | 20.0% (financial institutions, insurance companies and capitalization entities) or 9.0% (other Itaú Unibanco Group companies) Since January 1, 2019, the CSLL tax rate, as defined below, applicable to financial institutions, insurance companies, capitalization and similar entities was reduced to 15.0% |
Net income with adjustments (exclusions, additions, and deductions) | ||
| COFINS | 4.0% (financial institutions, insurance companies, capitalization and similar entities) or 7.6% (other Itaú Unibanco Group companies) | Gross revenue minus specific deductions | ||
| PIS | 0.65% (financial institutions, insurance companies, capitalization and similar entities) or 1.65% (other Itaú Unibanco Group companies) | Gross revenue minus specific deductions | ||
| ISS | 2.0% to 5.0% | Price of service rendered | ||
| IOF | Depends on the type of the transaction, as described below. | Transaction nominal value |
Corporate Income Tax and Social Contribution on Net Income
In accordance with applicable legislation, corporate income tax (Imposto de Renda da Pessoa Jurídica, or IRPJ), and social contribution on profits (Contribuição Social Sobre o Lucro Líquido, or CSLL) are determined by the taxable income regime. Under this regime, our taxable income, on which IRPJ and CSLL will be levied, must be adjusted by additions, deductions, and exclusions, such as nondeductible expenses, operating costs and equity accounting, respectively.
The IRPJ is levied at a basic 15.0% rate, and a 10.0% surtax is applicable when the total amount of profit for the fiscal period exceeds R$20,000 per month or R$240,000 per year. In other words, any portion of our profit exceeding this limit is taxed at an effective 25.0% rate.
Until December 31, 2018, the CSLL was levied on our taxable income at a 20.0% rate, which is specific for financial institutions, insurance, and similar companies. As of January 1, 2019, the CSLL rate for financial institutions is 15.0%. Note that this tax is generally levied at a 9.0% for non-financial legal entities.
As other Brazilian legal entities, our companies may offset the historical nominal amount of tax losses determined in prior years against results of subsequent years at any time (i.e., with no limitations with respect to time periods), provided that such offsetting does not exceed 30.0% of the annual taxable income of such future year. For purposes of IRPJ and CSLL taxation, companies should consider their income abroad as well rather than income solely from Brazilian operations. Therefore, profits, capital gains and other income earned abroad by Itaú Unibanco Group entities in Brazil, their branches, representations, affiliates or subsidiaries, will also be computed for determination of the entities net income. However, Brazilian legislation provides the possibility of deducting the amounts paid as corporate income tax abroad against the IRPJ due in Brazil and CSLL, provided certain limits are observed.
79
Table of Contents
Contribution on Social Integration Program and Social Security Financing Contribution
In addition to IRPJ and CSLL, Brazilian legal entities are subject to the following taxes on revenue: PIS and COFINS.
In accordance with applicable legislation, financial institutions are subject to the cumulative regime for calculation of these taxes. Under the cumulative regime, financial institutions are required to pay PIS at a 0.65% rate and COFINS at a 4.0% rate. The cumulative regime provides for rates lower than those levied under the non-cumulative regime, which is explained below, but it prevents the use of tax credits.
Some additional deductions are legally permitted to financial institutions.
Most non-financial companies, on the other hand, are authorized to pay PIS and COFINS contributions according to the non-cumulative regime. Under the non-cumulative regime, PIS is levied at a 1.65% rate and COFINS is levied at a 7.6% rate. The calculation basis of these taxes is the gross revenue earned by the entity; however, the taxpayer may offset credits calculated through the application of the same rates on the value paid on the purchase of certain inputs used in the entity’s production process. Currently, under such non-cumulative regime, the financial income of non-financial companies is subject to PIS and COFINS at the rate of 0.65% and 4%, respectively, except for income from interest on capital, which is subjected to PIS and COFINS at the rate of 1.65% and 7.6%, respectively.
Service Tax
The ISS is generally levied on the price of services rendered (e.g., banking services) and is charged by the municipality where our branch or office rendering the service is located. The tax rates vary from 2.0% up to the maximum rate of 5.0%, depending on the municipality in which the service is provided and its respective nature.
A new tax law enacted on December 30, 2016, effected a number of changes with respect to Brazilian Tax on Service, or ISS. Among a series of modifications to the ISS, the new law introduced a minimum tax rate of 2%.
The original proposed legislation approved by the Brazilian Congress provided changes related to ISS assessment on new activities such as credit card and leasing operations but President Temer vetoed these changes. However, on May 30, 2017, the Brazilian Congress overturned the presidential veto. As a result, beginning on January 1, 2018, ISS levied on the services of leasing, cards administration, funds administration and consortium administration would be charged by the municipality where the client is located. As this change brought some relevant impacts, in November 2017, a lawsuit was filed by CONSIF and CNSEG in the Federal Supreme Court. On March, 23, 2018, the required preliminary injunction was granted, in order to suspend the amendment introduced by the new law and to resume the previous treatment of ISS collection in the Municipality where the establishment is located. However, it is important to mention that this is not a final decision, as it is still pending the final pronouncement by the Federal Supreme Court.
Tax on Financial Transactions
The tax on financial transactions is levied at specific rates according to the transaction in question, and may be changed by a decree from the Executive Branch (which may become effective as of its publication date), rather than by a law enacted by the Brazilian Congress.
80
Table of Contents
The table below summarizes the main IOF rates levied on our transactions. Notwithstanding, we note that IOF is a very comprehensive tax. Therefore, for a more in-depth analysis, we recommend that tax advisors be consulted accordingly.
| Type of transaction |
Applicable Rates (Rates may be changed by a decree enacted by the Brazilian government up to a maximum rate, as described below, which may become effective as of its publication date) | |
| Foreign exchange transactions | IOF/FX: zero to 6.38% (depending on the transaction) Maximum rate: 25% | |
| Insurance transactions | IOF/Insurance: zero to 7.38% Maximum rate: 25% | |
| Loans and credit transactions | IOF/Credit: 0.0082% (individual) or 0.0041% (legal entities) per day, until it reaches 365 days, plus a flat 0.38% rate Maximum rate: 1.5% per day | |
| Securities | IOF/Securities: zero to 1.5% as a general rule Maximum rate: 1.5% per day | |
| Securities – Derivatives |
IOF/Securities—Derivatives: zero Maximum rate: 25% |
U.S. Foreign Account Tax Compliance Act (FATCA)
FATCA attempts to minimize tax avoidance by U.S. persons investing in foreign assets both through their own accounts and through their investments in foreign entities. FATCA requires U.S. withholding agents such as Itaú to provide information to the IRS regarding their U.S. account holders including substantial U.S. owners of certain non-financial foreign entities, or NFFEs, and specified U.S. persons having an interest in certain professionally managed investment vehicles and trusts known as owner-documented foreign financial institutions, or FFIs.
To the extent a U.S. withholding agent is not able to properly document an account, it generally will be required to deduct 30% FATCA withholding on certain payments of U.S. source income.
U.S. tax law has detailed rules for determining the source of income. Different rules apply for each type of income. Interest and dividends, two of the most common types of income for investors, are generally sourced by reference to the residence of the obligor. Specifically, dividends are generally treated as U.S. source income when paid by a U.S. corporation with respect to its stock, and interest is generally treated as U.S. source income when paid by a U.S. borrower of money.
The United States collaborated with other governments to develop Intergovernmental Agreements, or IGAs, to implement FATCA. IGAs with partner jurisdictions facilitate the effective and efficient implementation of FATCA. The purpose of these agreements is essentially to remove domestic legal impediments to compliance with FATCA and sharing of information and to reduce burdens on FFIs located in partner jurisdictions.
More than 70 jurisdictions have signed an IGA, including Brazil, the Cayman Islands, Switzerland and United Kingdom. In addition, approximately 30 other jurisdictions are deemed as having an IGA in effect. Some countries signed a reciprocal agreement, meaning that the country (such as Brazil) and the U.S. will automatically exchange annually, on a reciprocal basis, specific account holder information.
There are two types of IGAs – Model 1 IGA, where local FFIs are required to implement account opening and due diligence procedures to identify U.S. accounts and report them to the local tax authority for exchange with the IRS (examples of Model 1 IGA countries are Brazil, Cayman Islands, The Bahamas, Peru and Colombia), and Model 2 IGA, where local FFIs are required to implement account opening and due diligence procedures to identify U.S. accounts, but report such information directly to the IRS (examples of Model 2 IGA countries are Switzerland, Chile, Paraguay and Japan).
81
Table of Contents
The governments of Brazil and the United States entered into a Model 1 IGA on September 23, 2014, which became effective in Brazil on August 24, 2015, after the approval by the Brazilian Congress, ratification by the President and enactment of Decree 8,506 (IGA-BR).
Under the IGA-BR, Brazilian financial institutions and other entities subject to FATCA disclosure requirements are generally required to provide certain information on their U.S. account holders to the Brazilian tax authorities, which will share this information with the U.S. Internal Revenue Service.
Furthermore, Normative Ruling No. 1,680, dated December 28, 2016, was enacted to introduce the so-called Common Reporting Standard, or CRS, in Brazil, which seeks to implement a system of reporting financial accounts in a manner similar to FATCA. CRS is the result of discussions on the necessity of exchanging information between tax authorities of many countries in the context of the Base Erosion and Profit Shifting, or BEPS Project, coordinated by the Organization for Economic Co-operation and Development, or OECD. In connection therewith, an ancillary obligation called “e-financeira” provided by Normative Ruling No. 1,571, dated July 2, 2016, was created to be the mandatory report filed by financial institutions in order to fulfill FATCA and CRS obligations.
Moreover, on May 6, 2016, Brazilian tax authorities issued the Normative Ruling No. 1,634, effective as of January 1, 2017, that amended the regulation applicable to the National Registry of Legal Entities, or CNPJ. This regulation introduced a new rule providing an ancillary obligation by which certain entities have to indicate the “Final Beneficiary” in each CNPJ, which is defined as the natural person who ultimately, directly or indirectly, owns, controls or significantly influences a particular entity or on whose behalf a transaction is conducted. Currently, this subject is regulated by Normative Ruling No. 1,863, dated December 27, 2018.
In addition, Normative Ruling No. 1,681 was enacted in December 28, 2016 providing the obligation to annually deliver the so-called Country-by-Country Statement, an ancillary obligation also arising from the discussions under the BEPS Project, before the Brazilian Federal Revenue Service (RFB), which in its turn is also expected to exchange such information with other countries’ tax authorities.
Pursuant to FATCA, the issuer, any other financial institution or other entities subject to FATCA disclosure requirements to or through which any payment with respect to the preferred shares or ADSs is made may be required, pursuant to the IGA-BR or under applicable law, to (i) request certain information from holders or beneficial owners of our preferred shares or ADSs, which information may be provided to the U.S. Internal Revenue Service; and (ii) withhold U.S. federal tax at a 30.0% rate on some portion or all of the payments considered “pass-thru payments” made after December 31, 2018, with respect to the preferred shares or ADSs if such information is not duly provided by such a holder or beneficial owner (referred to under FATCA as a “recalcitrant account holder”). If the issuer or any other person is required to withhold amounts under or in connection with FATCA from any payments made in respect of the preferred shares or ADSs, holders and beneficial owners of the preferred shares or ADSs will not be entitled to receive any gross up or other additional amounts to compensate them for such withholding.
The above description is based on guidance issued to date by the U.S. Treasury Department, including the final U.S. Treasury regulations and IGA-BR. Future guidance may affect the application of FATCA to the preferred shares or ADSs.
82
Table of Contents
Selected Statistical Information
The following information is included for analytical purposes and should be read in together with our audited consolidated financial statements and “Item 5. Operating and Financial Review and Prospects”.
The data included or referenced in this section are presented in accordance with IFRS, unless otherwise indicated.
Average Balance Sheet and Interest Rate Data
The following tables present the average balances of our interest-earning assets and interest-bearing liabilities, other assets and liabilities accounts, the related interest income and expense amounts and the average real yield/rate for each period.
The following methodologies were used when calculating the average balances of our assets and liabilities presented in the following tables. For the 2018 average balances, we used the monthly balances prepared in accordance with IFRS, reflecting the adoption of IFRS 9. For the 2017 and 2016 monthly average balances, we used the monthly average balances reported under BRGAAP, which were adjusted to reflect management’s best estimate of the impact of the retrospective adoption of IFRS 9.
The majority of our business is comprised of operations with individuals and corporate entities without significant fluctuations over short periods. Non-accrual loans and leases are disclosed as a non-interest earning asset in the table below:
| Assets |
2018 | 2017 | 2016 | |||||||||||||||||||||||||||||||||
| Average balance |
Interest | Average yield/rate |
Average balance |
Interest | Average yield/ rate |
Average balance |
Interest | Average yield/ rate |
||||||||||||||||||||||||||||
| (In millions of R$, except percentages) | ||||||||||||||||||||||||||||||||||||
| Interest-earning assets(1) |
1,335,686 | 133,177 | 10.0 | 1,239,882 | 145,641 | 11.7 | 1,175,966 | 162,405 | 13.8 | |||||||||||||||||||||||||||
| Interest-bearing deposits in other banks |
26,174 | 1,080 | 4.1 | 29,638 | 744 | 2.5 | 26,907 | 674 | 2.5 | |||||||||||||||||||||||||||
| Securities purchased under agreements to resell |
265,218 | 17,365 | 6.5 | 262,238 | 25,711 | 9.8 | 252,627 | 34,162 | 13.5 | |||||||||||||||||||||||||||
| Central Bank compulsory deposits |
91,421 | 5,063 | 5.5 | 90,189 | 7,201 | 8.0 | 72,031 | 6,920 | 9.6 | |||||||||||||||||||||||||||
| Financial Assets |
402,846 | 34,661 | 8.6 | 356,227 | 34,841 | 9.8 | 304,625 | 38,623 | 12.7 | |||||||||||||||||||||||||||
| Financial assets at fair value through profit or loss |
248,274 | 22,853 | 9.2 | 210,865 | 22,938 | 10.9 | 165,479 | 23,641 | 14.3 | |||||||||||||||||||||||||||
| Financial assets at fair value through other comprehensive income |
53,948 | 9,194 | 17.0 | 43,288 | 8,886 | 20.5 | 39,504 | 11,160 | 28.3 | |||||||||||||||||||||||||||
| Financial assets at amortized cost |
100,624 | 2,614 | 2.6 | 102,075 | 3,017 | 3.0 | 99,643 | 3,822 | 3.8 | |||||||||||||||||||||||||||
| Other Financial Assets |
64,618 | 1,368 | 2.1 | 49,611 | 1,576 | 3.2 | 61,946 | 1,902 | 3.1 | |||||||||||||||||||||||||||
| Loans and leases |
485,409 | 73,640 | 15.2 | 451,979 | 75,568 | 16.7 | 457,830 | 80,124 | 17.5 | |||||||||||||||||||||||||||
| Non-interest-earning assets |
142,750 | 130,877 | 139,973 | |||||||||||||||||||||||||||||||||
| Cash and due from banks |
26,611 | 19,027 | 21,204 | |||||||||||||||||||||||||||||||||
| Central Bank compulsory deposits |
4,981 | 3,806 | 3,782 | |||||||||||||||||||||||||||||||||
| Derivatives |
25,242 | 21,820 | 28,801 | |||||||||||||||||||||||||||||||||
| Non-accrual loans |
22,419 | 21,834 | 23,926 | |||||||||||||||||||||||||||||||||
| Provisions for Expected Loss |
(35,381 | ) | (33,248 | ) | (33,948 | ) | ||||||||||||||||||||||||||||||
| Premises and equipment, net |
7,202 | 7,611 | 8,036 | |||||||||||||||||||||||||||||||||
| Investments in unconsolidated companies |
7,730 | 5,002 | 4,792 | |||||||||||||||||||||||||||||||||
| Goodwill |
11,109 | 9,912 | 6,475 | |||||||||||||||||||||||||||||||||
| Intangible assets, net |
8,545 | 7,757 | 8,689 | |||||||||||||||||||||||||||||||||
| Tax assets |
43,741 | 43,590 | 45,032 | |||||||||||||||||||||||||||||||||
| Assets held for sale |
767 | 685 | 570 | |||||||||||||||||||||||||||||||||
| Other assets |
19,785 | 23,081 | 22,615 | |||||||||||||||||||||||||||||||||
|
|
|
|
|
|
|
|
|
|
|
|
|
|
|
|
|
|
|
|||||||||||||||||||
| Total |
1,478,435 | 1,370,759 | 1,315,940 | |||||||||||||||||||||||||||||||||
|
|
|
|
|
|
|
|
|
|
|
|
|
|
|
|
|
|
|
|||||||||||||||||||
| (1) | For the net yield on total average interest-earning assets, see “Net Interest Margin and Spread”. |
83
Table of Contents
| Liabilities |
2018 | 2017 | 2016 | |||||||||||||||||||||||||||||||||
| Average balance |
Interest | Average yield/rate |
Average balance |
Interest | Average yield/rate |
Average balance |
Interest | Average yield/rate |
||||||||||||||||||||||||||||
| (In millions of R$, except percentages) | ||||||||||||||||||||||||||||||||||||
| Interest-bearing liabilities |
1,176,795 | 70,612 | 6.0 | 1,151,960 | 78,330 | 6.8 | 1,042,406 | 95,129 | 9.1 | |||||||||||||||||||||||||||
| Interest-bearing deposits |
357,684 | 17,484 | 4.9 | 287,398 | 13,340 | 4.6 | 244,121 | 14,701 | 6.0 | |||||||||||||||||||||||||||
| Savings deposits |
126,987 | 6,809 | 5.4 | 110,411 | 6,393 | 5.8 | 106,838 | 7,501 | 7.0 | |||||||||||||||||||||||||||
| Deposits from banks and time deposits |
230,697 | 10,675 | 4.6 | 176,987 | 6,946 | 3.9 | 137,283 | 7,200 | 5.2 | |||||||||||||||||||||||||||
| Securities sold under repurchase agreements |
308,306 | 20,889 | 6.8 | 345,218 | 33,087 | 9.6 | 336,962 | 45,935 | 13.6 | |||||||||||||||||||||||||||
| Interbank market debt and Institutional market debt |
232,802 | 20,359 | 8.7 | 229,269 | 16,911 | 7.4 | 240,608 | 16,596 | 6.9 | |||||||||||||||||||||||||||
| Interbank market debt |
135,357 | 13,587 | 10.0 | 133,984 | 10,059 | 7.5 | 145,013 | 8,347 | 5.8 | |||||||||||||||||||||||||||
| Institutional market debt |
97,445 | 6,773 | 7.0 | 95,285 | 6,852 | 7.2 | 95,595 | 8,249 | 8.6 | |||||||||||||||||||||||||||
| Reserves for insurance and private pension and Liabilities for capitalization plans |
193,908 | 11,815 | 6.1 | 170,561 | 14,918 | 8.7 | 144,481 | 17,790 | 12.3 | |||||||||||||||||||||||||||
| Other interest-bearing liabilities |
84,095 | 64 | 0.1 | 119,515 | 74 | 0.1 | 76,234 | 107 | 0.1 | |||||||||||||||||||||||||||
| Non-interest bearing liabilities |
158,960 | 87,378 | 147,515 | |||||||||||||||||||||||||||||||||
| Non-interest bearing deposits |
70,205 | 61,844 | 61,895 | |||||||||||||||||||||||||||||||||
| Other Comprehensive Income |
4,038 | 5,485 | 6,008 | |||||||||||||||||||||||||||||||||
| Other non-interest-bearing liabilities |
84,718 | 20,049 | 79,613 | |||||||||||||||||||||||||||||||||
| Total stockholders’ equity attributed to the owners of the parent company |
128,851 | 119,809 | 115,687 | |||||||||||||||||||||||||||||||||
| Non-controlling interests |
13,829 | 11,613 | 10,331 | |||||||||||||||||||||||||||||||||
| Total |
1,478,435 | 1,370,759 | 1,315,940 | |||||||||||||||||||||||||||||||||
|
|
|
|
|
|
|
|
|
|
|
|
|
|
|
|
|
|
|
|||||||||||||||||||
Changes in Interest Income and Expenses – Volume and Rate Analysis
The following table sets forth the allocation of the changes in our interest income and expense in terms of average volume and changes in the average yields/rates for the periods indicated below. Volume balance and rate variations have been calculated based on variations of average balances over the period and changes in average interest yield/rates on interest earning assets and interest-bearing liabilities from one period to the other.
| Increase/(decrease) due to changes in: |
Increase/(decrease) due to changes in: |
|||||||||||||||||||||||
| 2018-2017 | 2017 -2016 | |||||||||||||||||||||||
| Volume (1) | Yield/ rate (2) |
Net change (3) |
Volume (1) | Yield/ rate (2) |
Net change (3) |
|||||||||||||||||||
| (In millions of R$, except percentages) | ||||||||||||||||||||||||
| Interest-earning assets |
10,297 | (22,761 | ) | (12,464 | ) | (3,210 | ) | 13,554 | 16,764 | |||||||||||||||
| Interest-bearing deposits in other banks |
(75 | ) | 411 | 336 | 69 | 1 | 70 | |||||||||||||||||
| Securities purchased under agreements to resell |
296 | (8,642 | ) | (8,346 | ) | 1,357 | (9,808 | ) | (8,451 | ) | ||||||||||||||
| Central Bank compulsory deposits |
100 | (2,238 | ) | (2,138 | ) | 852 | (571 | ) | 281 | |||||||||||||||
| Financial Assets |
310 | (490 | ) | (180 | ) | (4,079 | ) | 297 | (3,782 | ) | ||||||||||||||
| Financial assets at fair value through profit or loss |
(639 | ) | 554 | (85 | ) | (5,401 | ) | 4,698 | (703 | ) | ||||||||||||||
| Financial assets at fair value through other comprehensive income |
992 | (684 | ) | 308 | 1,227 | (3,501 | ) | (2,274 | ) | |||||||||||||||
| Financial assets at amortized cost |
(42 | ) | (361 | ) | (403 | ) | 96 | (901 | ) | (805 | ) | |||||||||||||
| Other Financial Assets |
2,025 | (2,233 | ) | (208 | ) | (395 | ) | 69 | (326 | ) | ||||||||||||||
| Loans and leases |
7,641 | (9,569 | ) | (1,928 | ) | (1,014 | ) | (3,542 | ) | (4,556 | ) | |||||||||||||
| Interest-bearing liabilities |
2,653 | (10,372 | ) | (7,718 | ) | 4,864 | (21,663 | ) | (16,799 | ) | ||||||||||||||
| Interest-bearing deposits |
3,134 | 1,010 | 4,144 | 1,271 | (2,632 | ) | (1,362 | ) | ||||||||||||||||
| Saving deposits |
820 | (404 | ) | 416 | 261 | (1,369 | ) | (1,108 | ) | |||||||||||||||
| Deposits from Banks |
(17 | ) | 85 | 68 | (602 | ) | (773 | ) | (1,375 | ) | ||||||||||||||
| Time Deposits |
2,332 | 1,329 | 3,661 | 1,611 | (490 | ) | 1,121 | |||||||||||||||||
| Securities sold under repurchase agreements |
(3,261 | ) | (8,937 | ) | (12,198 | ) | (1,155 | ) | (14,003 | ) | (12,848 | ) | ||||||||||||
| Interbank market debt and Institutional market debt |
270 | 3,178 | 3,448 | (597 | ) | 912 | 315 | |||||||||||||||||
| Interbank market debt |
104 | 3,424 | 3,528 | (570 | ) | 2,282 | 1,712 | |||||||||||||||||
| Institutional market debt |
166 | (246 | ) | (80 | ) | (27 | ) | (1,370 | ) | (1,397 | ) | |||||||||||||
| Reserves for insurance and private pension and Liabilities for capitalization plans |
2,551 | (5,654 | ) | (3,103 | ) | 4,750 | (7,621 | ) | (2,872 | ) | ||||||||||||||
| Other Interest-bearing liabilities |
(42 | ) | 32 | (10 | ) | (1,715 | ) | 1,682 | (33 | ) | ||||||||||||||
|
|
|
|
|
|
|
|
|
|
|
|
|
|||||||||||||
| (1) | Volume change has been computed as the change in the average interest-earning assets or interest-bearing liabilities from one period to the other multiplied by the average yield/rate in the earlier period. |
| (2) | Yield/rate change has been computed as the change in the yield/rate in the period multiplied by the average interest-earning assets or interest-bearing liabilities in the earlier period. |
| (3) | We allocated the net change from the combined effects of volume and yield/rate proportionately to volume change and yield/rate change, in absolute terms, without considering positive and negative effects. |
84
Table of Contents
Net Interest Margin and Spread
The following table sets forth our average interest-earning assets, total average interest bearing liabilities, net interest income and the comparative net interest margin and net interest spread for the periods indicated below.
| 2018 | 2017(6) | 2016(6) | ||||||||||
| (In millions of R$, except percentages) | ||||||||||||
| Total average interest-earning assets |
1,335,686 | 1,239,882 | 1,175,966 | |||||||||
| Total average interest-bearing liabilities |
1,176,795 | 1,151,960 | 1,042,406 | |||||||||
| Net interest income (1) |
62,565 | 67,311 | 67,276 | |||||||||
| Average yield on average interest-earning assets (2) |
10.0% | 11.7% | 13.8% | |||||||||
| Average rate on average interest-bearing liabilities (3) |
6.0% | 6.8% | 9.1% | |||||||||
| Net interest spread (4) |
4.0% | 4.9% | 4.7% | |||||||||
| Net interest margin (5) |
4.7% | 5.4% | 5.7% | |||||||||
| (1) | Includes interest and similar income of financial assets at amortized cost and fair value through other comprehensive income; interest, similar income and dividends of financial assets at fair value through profit or loss; and interest and similar expenses. |
| (2) | Total interest, similar income and dividends divided by total average interest-earning assets. |
| (3) | Total interest and similar expenses divided by total average interest-bearing liabilities. |
| (4) | Difference between the average yield on interest-earning assets and the average rate on interest-bearing liabilities. |
| (5) | Net interest income divided by total average interest-earning assets. |
| (6) | Restated to take into account the effect of IFRS 9, which we retroactively adopted as of January 1, 2016. |
Return on Equity and Assets
The following table sets forth certain data with respect to return on equity and assets for the periods indicated below.
| 2018 | 2017(3) | 2016(3) | ||||||||||
| (In millions of R$, except percentages) | ||||||||||||
| Net income attributable to owners of the parent company |
24,907 | 23,193 | 21,627 | |||||||||
| Average total assets |
1,478,435 | 1,370,759 | 1,315,940 | |||||||||
| Average stockholders’ equity |
128,851 | 119,809 | 115,687 | |||||||||
| Net income as a percentage of average total assets |
1.7% | 1.7% | 1.6% | |||||||||
| Net income as a percentage of average stockholder’s equity (1) |
20.4% | 19.6% | 19.0% | |||||||||
| Average stockholder’s equity as a percentage of average total assets |
8.7% | 8.7% | 8.8% | |||||||||
| Dividend payout ratio per share (2) |
87.2% | 70.6% | 45.0% | |||||||||
| (1) | Attributable to owners of the parent company. |
| (2) | Dividend and interest on stockholders’ equity per share divided by earnings per share. Please refer to “Item 3A. Selected Financial Data” for additional information on the computation of both dividend and interest on shareholders’ equity and basic earnings per share. Payout calculated considering the recurring net income based on BRGAAP figures. |
| (3) | Restated to take into account the effect of IFRS 9, which we retroactively adopted as of January 1, 2016. |
Assets
Portfolio of Securities and Derivative Financial Instruments
General information
We present below our portfolio of Financial Assets at fair value through profit or loss – Securities, Financial Assets at Fair Value Through Other Comprehensive Income, Financial Assets at Amortized Cost and Derivative Financial Instruments as of December 31, 2018, 2017 and 2016.
The amounts exclude our investments in securities of unconsolidated companies. For further information on our investments in unconsolidated companies, see “Note 2.4(e) – Investments in Associates and Joint Ventures” to our audited consolidated financial statements. Financial assets at fair value through profit or loss and designated at fair value through profit or loss and Financial Assets at Fair Value Through Other Comprehensive Income are stated at fair value and Financial assets at amortized cost—Securities are stated at amortized cost. Please see “Note 2 – Significant Accounting Policies” to our audited consolidated financial statements for further details.
85
Table of Contents
As of December 31, 2018, we held securities issued by the Brazilian federal government classified as “Government Securities – Domestic” with an aggregate book value and an aggregate market value of R$298,352 million and R$300,172 million, respectively, which represented 199.49% of our consolidated stockholders’ equity as of that date. As of December 31, 2017, we held securities issued by the Brazilian federal government classified as “Government Securities – Domestic” with an aggregate book value and an aggregate market value of R$295,932 million and R$297,325 million, respectively, which represented 205.97% of our consolidated stockholders’ equity as of that date. As of December 31, 2016, we held securities issued by the Brazilian federal government classified as “Government Securities – Domestic” with an aggregate book value and an aggregate market value of R$223,240 million and R$223,387 million, respectively, which represented 168.74% of our consolidated stockholders’ equity as of that date. As of December 31, 2018, we did not hold securities of any other issuer the book value of which in the aggregate represented more than 10.0% of our consolidated stockholders’ equity. This is due to our conservative asset and liabilities management and our liquidity in local currency maintained in securities issued by the Brazilian federal government. Additionally, securities issued by the Brazilian federal government are accepted as deposits in our operations in the market on B3.
Financial Assets at Fair Value Through Profit or Loss and Designated at Fair Value Through Profit or Loss – Securities
Listed below are the assets acquired and accrued which are either available for sale in the short term or are part of a portfolio of financial instruments that are managed as a whole and for which there is a recent history of sales in the short term. Please see “Note 5 – Financial Assets at Fair Value Through Profit or Loss and Designated at Fair Value Through Profit or Loss” to our audited consolidated financial statements for further details.
| 12/31/2018 | 12/31/2017(2) | 12/31/2016(2) | ||||||||||||||||||||||||||||||||||
| Gross Carrying Amount |
Adjustments to Fair Value (in Income) |
Fair Value |
Gross Carrying Amount |
Adjustments to Fair Value (in Income) |
Fair value |
Gross Carrying Amount |
Adjustments to Fair Value (in Income) |
Fair value |
||||||||||||||||||||||||||||
| (In millions of R$) | ||||||||||||||||||||||||||||||||||||
| Investment funds |
5,253 | (927 | ) | 4,326 | 4,135 | (622 | ) | 3,513 | 1,992 | (778 | ) | 1,214 | ||||||||||||||||||||||||
| Brazilian government securities (1a) |
217,188 | 1,139 | 218,327 | 209,088 | 502 | 209,590 | 150,014 | 479 | 150,493 | |||||||||||||||||||||||||||
| Government securities - abroad (1b) |
2,070 | 9 | 2,079 | 3,917 | 32 | 3,949 | 2,428 | 8 | 2,436 | |||||||||||||||||||||||||||
| Argentina |
1,121 | 8 | 1,129 | 1,446 | 20 | 1,466 | 634 | 17 | 651 | |||||||||||||||||||||||||||
| Chile |
301 | 1 | 302 | 57 | - | 57 | 119 | 1 | 120 | |||||||||||||||||||||||||||
| Colombia |
207 | - | 207 | 2,080 | 12 | 2,092 | 1,588 | (10 | ) | 1,578 | ||||||||||||||||||||||||||
| United States |
117 | - | 117 | 100 | - | 100 | - | - | - | |||||||||||||||||||||||||||
| Mexico |
120 | - | 120 | 5 | - | 5 | 3 | - | 3 | |||||||||||||||||||||||||||
| Paraguay |
1 | - | 1 | 3 | - | 3 | - | - | - | |||||||||||||||||||||||||||
| Uruguay |
84 | - | 84 | 193 | - | 193 | 1 | - | 1 | |||||||||||||||||||||||||||
| Italy |
115 | - | 115 | - | - | - | - | - | - | |||||||||||||||||||||||||||
| Other |
4 | - | 4 | 33 | - | 33 | 83 | - | 83 | |||||||||||||||||||||||||||
| Corporate securities (1c) |
38,953 | (505 | ) | 38,448 | 33,816 | (175 | ) | 33,641 | 40,896 | (465 | ) | 40,431 | ||||||||||||||||||||||||
| Shares |
9,778 | (332 | ) | 9,446 | 6,080 | (121 | ) | 5,959 | 4,385 | (467 | ) | 3,918 | ||||||||||||||||||||||||
| Bank deposit certificates |
969 | - | 969 | 335 | - | 335 | 1,811 | - | 1,811 | |||||||||||||||||||||||||||
| Securitized real estate loans |
1,391 | 20 | 1,411 | 1,779 | 16 | 1,795 | 2,153 | (61 | ) | 2,092 | ||||||||||||||||||||||||||
| Debentures |
5,147 | (187 | ) | 4,960 | 3,290 | (74 | ) | 3,216 | 3,083 | 54 | 3,137 | |||||||||||||||||||||||||
| Eurobonds and other |
1,403 | (7 | ) | 1,396 | 684 | 4 | 688 | 673 | 16 | 689 | ||||||||||||||||||||||||||
| Financial credit bills |
19,724 | - | 19,724 | 21,170 | - | 21,170 | 28,497 | (6 | ) | 28,491 | ||||||||||||||||||||||||||
| Promissory notes |
435 | - | 435 | 391 | - | 391 | - | - | - | |||||||||||||||||||||||||||
| Other |
106 | 1 | 107 | 87 | - | 87 | 294 | (1 | ) | 293 | ||||||||||||||||||||||||||
|
|
|
|
|
|
|
|
|
|
|
|
|
|
|
|
|
|
|
|||||||||||||||||||
| Total |
263,464 | (284 | ) | 263,180 | 250,956 | (263 | ) | 250,693 | 195,330 | (756 | ) | 194,574 | ||||||||||||||||||||||||
|
|
|
|
|
|
|
|
|
|
|
|
|
|
|
|
|
|
|
|||||||||||||||||||
| (1) | Financial assets at fair value through profit or loss – Securities pledged as Guarantee of Funding of Financial Institutions and Clients were: a) R$ 30,114 million (R$ 30,325 million at 12/31/2017 and R$ 12,108 million at 12/31/2016), b) R$ 131 million (R$ 46 million at 12/31/2017) and c) (R$ 28 million at 12/31/2017 and R$ 17 million at 12/31/2016), totaling R$ 30,245 million (R$ 30,399 million at 12/31/2017 and R$ 12,125 million at 12/31/2016 ). |
| (2) | Restated to take into account the effect of IFRS 9, which we retroactively adopted as of January 1, 2016. |
86
Table of Contents
We note that Brazilian government securities represented over 83.0% of our portfolio of financial assets at fair value through profit or loss in 2018. Brazilian government securities classified at fair value through profit or loss represented 14.1% of our total assets in the same period. Please see “Item 3D. Risk Factors—Risks Associated with our Business—Credit Risks—We may incur losses associated with counterparty exposure risks, including the Brazilian federal government” for further details.
Assets at Fair Value Through Other Comprehensive Income
Listed below are financial assets that, according to our management’s understanding, may be sold in response to, or before changes in, market conditions and are not classified as financial assets at fair value through profit or loss, loans and receivables or held to maturity. Please see “Note 8 – Financial Assets at Fair Value Through Other Comprehensive Income – Securities” to our audited consolidated financial statements for further details.
| 12/31/2018 | 12/31/2017(2) | 12/31/2016(2) | ||||||||||||||||||||||||||||||||||||||||||||||
| Gross Carrving Amount |
Fair Value adjustments (in stockholders’ equity) |
Expected loss |
Fair value |
Gross Carrving Amount |
Fair Value adjustments (in stockholders’ equity) |
Expected loss |
Fair value |
Gross Carrving Amount |
Fair Value adjustments (in stockholders’ equity) |
Expected loss |
Fair value |
|||||||||||||||||||||||||||||||||||||
| (In millions of R$) | ||||||||||||||||||||||||||||||||||||||||||||||||
| Brazilian government securities (1a) |
27,100 | 775 | (36 | ) | 27,839 | 31,969 | 993 | (36 | ) | 32,926 | 27,493 | (260 | ) | - | 27,233 | |||||||||||||||||||||||||||||||||
| Government securities - abroad (1b) |
18,844 | (70 | ) | (2 | ) | 18,772 | 16,583 | (41 | ) | - | 16,542 | 9,258 | (67 | ) | - | 9,191 | ||||||||||||||||||||||||||||||||
| Germany |
22 | - | - | 22 | - | - | - | - | - | - | - | - | ||||||||||||||||||||||||||||||||||||
| Colombia |
5,491 | 14 | - | 5,505 | 2,928 | 92 | - | 3,020 | 703 | (1 | ) | - | 702 | |||||||||||||||||||||||||||||||||||
| Chile |
7,647 | 7 | (1 | ) | 7,653 | 9,554 | (4 | ) | - | 9,550 | 5,238 | 12 | - | 5,250 | ||||||||||||||||||||||||||||||||||
| United States |
2,634 | (16 | ) | - | 2,618 | 1,568 | (18 | ) | - | 1,550 | 1,508 | (19 | ) | - | 1,489 | |||||||||||||||||||||||||||||||||
| France |
891 | - | - | 891 | - | - | - | - | - | - | - | - | ||||||||||||||||||||||||||||||||||||
| Paraguay |
1,601 | (71 | ) | (1 | ) | 1,529 | 1,915 | (115 | ) | - | 1,800 | 1,255 | (56 | ) | - | 1,199 | ||||||||||||||||||||||||||||||||
| Uruguay |
557 | (4 | ) | - | 553 | 618 | 4 | - | 622 | 444 | (2 | ) | - | 442 | ||||||||||||||||||||||||||||||||||
| Netherlands |
- | - | - | - | - | - | - | - | 101 | - | - | 101 | ||||||||||||||||||||||||||||||||||||
| Other |
1 | - | - | 1 | - | - | - | - | 9 | (1 | ) | - | 8 | |||||||||||||||||||||||||||||||||||
| Corporate securities (1c) |
2,719 | 40 | (47 | ) | 2,712 | 2,656 | 73 | (48 | ) | 2,681 | 3,606 | 20 | (11 | ) | 3,615 | |||||||||||||||||||||||||||||||||
| Shares |
77 | 84 | - | 161 | 73 | 75 | - | 148 | 91 | 4 | - | 95 | ||||||||||||||||||||||||||||||||||||
| Bank deposit certificates |
1,053 | - | - | 1,053 | 685 | - | - | 685 | 2,158 | 1 | - | 2,159 | ||||||||||||||||||||||||||||||||||||
| Debentures |
44 | - | (42 | ) | 2 | 44 | - | (43 | ) | 1 | 1 | - | - | 1 | ||||||||||||||||||||||||||||||||||
| Eurobonds and others |
1,542 | (44 | ) | (2 | ) | 1,496 | 1,851 | (2 | ) | (2 | ) | 1,847 | 1,356 | 15 | (11 | ) | 1,360 | |||||||||||||||||||||||||||||||
| Other |
3 | - | (3 | ) | - | 3 | - | (3 | ) | - | - | - | - | - | ||||||||||||||||||||||||||||||||||
|
|
|
|
|
|
|
|
|
|
|
|
|
|
|
|
|
|
|
|
|
|
|
|
|
|||||||||||||||||||||||||
| Total |
48,663 | 745 | (85 | ) | 49,323 | 51,208 | 1,025 | (84 | ) | 52,149 | 40,357 | (307 | ) | (11 | ) | 40,039 | ||||||||||||||||||||||||||||||||
|
|
|
|
|
|
|
|
|
|
|
|
|
|
|
|
|
|
|
|
|
|
|
|
|
|||||||||||||||||||||||||
| (1) | Financial assets at fair value through other comprehensive income – Securities pledged in guarantee of funding transactions of financial institutions and clients were: a) R$ 25,147 million (R$ 26,953 million at 12/31/2017 and R$ 25,531 million at 12/31/2016). b) R$ 3,583 million (R$ 37 million at 12/31/2017 and R$ 88 million at 12/31/2016) and c) R$ 237 million (R$ 479 million at 12/31/2017 and R$ 54 million at 12/31/2016), totaling R$ 28,967 million (R$ 27,469 million at 12/31/2017 and R$ 25,673 million at 12/31/2016); |
| (2) | Restated to take into account the effect of IFRS 9, which we retroactively adopted as of January 1, 2016. |
Brazilian government securities and corporate securities represented 56% and 5.5%, respectively, of our portfolio of assets at Fair Value Through Other Comprehensive Income in 2018. Brazilian government securities and corporate securities classified as assets at Fair Value Through Other Comprehensive Income, which are used as a hedge for our subordinated debt portfolio, represented 1.8% and 0.2%, respectively, of our total assets in the same period.
87
Table of Contents
Financial Assets at Amortized Cost
Listed below are non-derivative financial assets that we have the intention and financial ability to hold to maturity. Please see “Note 9– Financial assets at amortized cost – Securities” to our audited consolidated financial statements for further details.
| 12/31/2018 | 12/31/2017(2) | 12/31/2016(2) | ||||||||||||||||||||||||||||||||||
| Amortized cost |
Expected loss* |
Fair Value |
Amortized cost |
Expected loss* |
Fair Value |
Amortized cost |
Expected loss* |
Fair Value |
||||||||||||||||||||||||||||
| (In millions of R$) | ||||||||||||||||||||||||||||||||||||
| Brazilian government securities (1a) |
54,064 | (58 | ) | 54,006 | 54,875 | (66 | ) | 54,809 | 45,733 | (72 | ) | 45,661 | ||||||||||||||||||||||||
| Government securities - abroad (1b) |
6,700 | (3 | ) | 6,697 | 8,414 | (3 | ) | 8,411 | 7,055 | (3 | ) | 7,052 | ||||||||||||||||||||||||
| Colombia |
356 | (3 | ) | 353 | 836 | (3 | ) | 833 | 2,007 | (3 | ) | 2,004 | ||||||||||||||||||||||||
| Chile |
256 | - | 256 | 154 | - | 154 | 601 | - | 601 | |||||||||||||||||||||||||||
| Korea |
1,385 | - | 1,385 | 1,944 | - | 1,944 | 2,673 | - | 2,673 | |||||||||||||||||||||||||||
| Denmark |
- | - | - | 1,951 | - | 1,951 | 819 | - | 819 | |||||||||||||||||||||||||||
| Spain |
2,411 | - | 2,411 | 2,937 | - | 2,937 | 923 | - | 923 | |||||||||||||||||||||||||||
| United States |
19 | - | 19 | 16 | - | 16 | 16 | - | 16 | |||||||||||||||||||||||||||
| Mexico |
2,258 | - | 2,258 | 559 | - | 559 | 3 | - | 3 | |||||||||||||||||||||||||||
| Paraguay |
- | - | - | 4 | - | 4 | - | - | ||||||||||||||||||||||||||||
| Uruguay |
15 | - | 15 | 13 | - | 13 | 13 | - | 13 | |||||||||||||||||||||||||||
| Corporate securities (1c) |
49,631 | (3,585 | ) | 46,046 | 48,135 | (5,113 | ) | 43,022 | 49,780 | (3,741 | ) | 46,039 | ||||||||||||||||||||||||
| Rural product note |
4,181 | (178 | ) | 4,003 | 2,899 | (160 | ) | 2,739 | 1,477 | (89 | ) | 1,388 | ||||||||||||||||||||||||
| Bank deposit certificates |
123 | - | 123 | 130 | - | 130 | 493 | (1 | ) | 492 | ||||||||||||||||||||||||||
| Securitized real estate loans |
9,876 | (361 | ) | 9,515 | 13,839 | (2,056 | ) | 11,783 | 15,230 | (1,716 | ) | 13,514 | ||||||||||||||||||||||||
| Debentures |
29,001 | (3,013 | ) | 25,988 | 23,397 | (2,857 | ) | 20,540 | 23,053 | (1,804 | ) | 21,249 | ||||||||||||||||||||||||
| Eurobonds and others |
4,005 | (2 | ) | 4,003 | 3,660 | (3 | ) | 3,657 | 6,280 | (106 | ) | 6,174 | ||||||||||||||||||||||||
| Financial bills |
- | - | - | 60 | - | 60 | 218 | - | 218 | |||||||||||||||||||||||||||
| Promissory notes |
1,069 | (14 | ) | 1,055 | 3,246 | (23 | ) | 3,223 | 2,193 | (23 | ) | 2,170 | ||||||||||||||||||||||||
| Other |
1,376 | (17 | ) | 1,359 | 904 | (14 | ) | 890 | 836 | (2 | ) | 834 | ||||||||||||||||||||||||
|
|
|
|
|
|
|
|
|
|
|
|
|
|
|
|
|
|
|
|||||||||||||||||||
| Total |
110,395 | (3,646 | ) | 106,749 | 111,424 | (5,182 | ) | 106,242 | 102,568 | (3,816 | ) | 98,752 | ||||||||||||||||||||||||
|
|
|
|
|
|
|
|
|
|
|
|
|
|
|
|
|
|
|
|||||||||||||||||||
| (1) | Financial Assets at Amortized Cost – Securities Pledged as Collateral of Funding Transactions of Financial Institutions and Clients were: a) R$ 24,988 million (R$ 26,953 million at 12/31/2017 and R$ 12,043 million at 12/31/2016), b) (R$ 479 million at 12/31/2017 and R$ 1,082 million at 12/31/2016) and c) R$ 8,860 million (R$ 37 million at 12/31/2017 and R$ 6,624 million at 12/31/2016), totaling R$ 33,848 million (R$ 27,469 million at 12/31/2017 and R$ 19,749 million at 12/31/2016). |
| (2) | Restated to take into account the effect of IFRS 9, which we retroactively adopted as of January 1, 2016. |
The interest income related to Financial assets at amortized cost - Securities assets was R$ 2,614 million. See “Note 21 - Interest and similar income and expense and net gain (loss) on investment securities and derivatives” to our audited consolidated financial statements.
The fair value of Financial assets at amortized cost - Securities assets see “Note 28 - Fair Value of Financial Instruments” to our audited consolidated financial statements.
| * | According to IFR9 Financial assets at amortized cost - Securities are not measured at fair value. |
Derivatives
Derivatives are classified on the date of their acquisition in accordance with our management’s intention to use them as a hedging instrument, as determined by Brazilian regulations. Please see “Note 6 – Derivatives” of our audited consolidated financial statements for further details. Our derivatives portfolio (assets and liabilities) is composed of futures, forward, swaps, options and credit derivatives, as stated in the table below:
| As of December 31, | ||||||||||||||||||||||||
| Derivative Financial Instruments |
2018 | % of total |
2017 | % of total |
2016 | % of total |
||||||||||||||||||
| (In millions of R$, except percentages) | ||||||||||||||||||||||||
| Assets |
||||||||||||||||||||||||
| Futures Contracts |
- | - | 158 | 0.7 | 127 | 0.5 | ||||||||||||||||||
| Options premiums |
4,215 | 18.0 | 3,337 | 14.6 | 4,792 | 19.8 | ||||||||||||||||||
| Forwards (onshore) |
1,835 | 7.8 | 6,911 | 30.3 | 4,971 | 20.5 | ||||||||||||||||||
| Swaps - difference receivable |
13,049 | 55.6 | 9,190 | 40.2 | 10,542 | 43.5 | ||||||||||||||||||
| Credit derivatives - financial Institutions |
120 | 0.5 | 137 | 0.6 | 181 | 0.7 | ||||||||||||||||||
| NDF - Non Deliverable Foward |
3,711 | 15.8 | 2,950 | 12.9 | 3,459 | 14.3 | ||||||||||||||||||
| Check of Swap - companies |
44 | 0.2 | 68 | 0.3 | 88 | 0.4 | ||||||||||||||||||
| Others |
492 | 2.1 | 92 | 0.4 | 71 | 0.3 | ||||||||||||||||||
| Total derivative financial instruments assets |
23,466 | 100.0 | 22,843 | 100.0 | 24,231 | 100.0 | ||||||||||||||||||
| Derivative financial instruments as percentage of total assets |
1.5% | 1.6% | 1.8% | |||||||||||||||||||||
|
|
|
|
|
|
|
|||||||||||||||||||
| Liabilities |
||||||||||||||||||||||||
| Futures Contracts |
- | - | - | - | - | - | ||||||||||||||||||
| Options premiums |
(3,929 | ) | 14.3 | (2,793 | ) | 10.4 | (4,552 | ) | 18.4 | |||||||||||||||
| Forwards (onshore) |
(470 | ) | 1.7 | (6,272 | ) | 23.5 | (3,530 | ) | 14.3 | |||||||||||||||
| Swaps - difference payable |
(19,354 | ) | 70.3 | (13,692 | ) | 51.2 | (13,221 | ) | 53.5 | |||||||||||||||
| Credit derivatives - financial Institutions |
(140 | ) | 0.5 | (58 | ) | 0.2 | (147 | ) | 0.6 | |||||||||||||||
| NDF - Non Deliverable Foward |
(3,384 | ) | 12.3 | (3,745 | ) | 14.0 | (2,825 | ) | 11.5 | |||||||||||||||
| Check of swap - Companies |
(162 | ) | 0.6 | (122 | ) | 0.5 | (353 | ) | 1.4 | |||||||||||||||
| Other - Companies |
(80 | ) | 0.3 | (64 | ) | 0.2 | (70 | ) | 0.3 | |||||||||||||||
| Total derivative financial instruments liabilities |
(27,519 | ) | 100.0 | (26,746 | ) | 100.0 | (24,698 | ) | 100.0 | |||||||||||||||
| Derivative financial instruments as percentage of total liabilities and stockholder’s equity |
1.8% | 1.9% | 1.8% | |||||||||||||||||||||
88
Table of Contents
| As of December 31, 2018 | ||||||||||||||||||||||||||||||||||||||||||||||||
| Distribution of our financial assets by maturity |
No stated maturity | Due in 1 year or less |
Due after 1 year to 5 years |
Due after 5 years to 10 years |
Due after 10 years | Total | ||||||||||||||||||||||||||||||||||||||||||
| R$ | Average yield (%) |
R$ | Average yield (%) |
R$ | Average yield (%) |
R$ | Average yield (%) |
R$ | Average yield (%) |
R$ | Average yield (%) |
|||||||||||||||||||||||||||||||||||||
| (In millions of R$, except percentages) | ||||||||||||||||||||||||||||||||||||||||||||||||
| At Fair Value Through Profit or Loss |
13,772 | 39,123 | 154,171 | 44,620 | 11,494 | 263,180 | ||||||||||||||||||||||||||||||||||||||||||
| Investment funds(1) |
4,326 | - | - | - | - | - | - | - | - | - | 4,326 | - | ||||||||||||||||||||||||||||||||||||
| Government securities - domestic |
- | 28,545 | 137,176 | 43,079 | 9,527 | 218,327 | ||||||||||||||||||||||||||||||||||||||||||
| Government securities - abroad |
- | 1,604 | - | 412 | 59 | 4 | 2,079 | |||||||||||||||||||||||||||||||||||||||||
| Argentina |
- | - | 1,048 | 1.3 | 45 | 8.1 | 36 | 0.0 | - | 3.7 | 1,129 | 1.6 | ||||||||||||||||||||||||||||||||||||
| United States |
- | - | 117 | 0.4 | - | - | - | - | - | - | 117 | 0.4 | ||||||||||||||||||||||||||||||||||||
| Mexico |
- | - | - | 5.7 | 115 | 0.8 | 2 | - | 3 | 1.5 | 120 | 0.8 | ||||||||||||||||||||||||||||||||||||
| Chile |
- | - | 91 | 0.1 | 207 | 0.0 | 4 | - | - | 2.6 | 302 | 0.0 | ||||||||||||||||||||||||||||||||||||
| Paraguay |
- | - | - | - | - | 4.3 | 1 | 5.5 | - | - | 1 | 6.2 | ||||||||||||||||||||||||||||||||||||
| Uruguay |
- | - | 83 | 3.5 | - | - | 1 | 14.7 | - | 18.3 | 84 | 3.7 | ||||||||||||||||||||||||||||||||||||
| Colombia |
- | - | 147 | 1.9 | 45 | 0.5 | 14 | 1.3 | 1 | 24.4 | 207 | 1.7 | ||||||||||||||||||||||||||||||||||||
| Italy |
- | - | 115 | 1.4 | - | - | - | - | - | - | 115 | 1.4 | ||||||||||||||||||||||||||||||||||||
| Other |
- | - | 3 | 2.8 | - | - | 1 | 7.1 | - | 21.3 | 4 | 7.1 | ||||||||||||||||||||||||||||||||||||
| Corporate securities |
9,446 | 8,974 | 16,583 | 1,482 | 1,963 | 38,448 | ||||||||||||||||||||||||||||||||||||||||||
| Shares |
9,446 | - | - | - | - | - | - | - | - | - | 9,446 | - | ||||||||||||||||||||||||||||||||||||
| Securitized real estate loans |
- | - | - | - | 8 | 0.2 | - | 9.9 | 1,403 | 1.3 | 1,411 | 1.3 | ||||||||||||||||||||||||||||||||||||
| Bank deposit certificates |
- | - | 779 | 0.4 | 190 | - | - | - | - | - | 969 | 0.3 | ||||||||||||||||||||||||||||||||||||
| Debentures |
- | - | 526 | 0.2 | 4,007 | 0.4 | 196 | 0.8 | 231 | 3.6 | 4,960 | 0.5 | ||||||||||||||||||||||||||||||||||||
| Eurobonds and other |
- | - | 747 | 1.0 | 490 | 4.1 | 135 | 1.3 | 24 | 2.1 | 1,396 | 2.2 | ||||||||||||||||||||||||||||||||||||
| Financial credit bills |
- | - | 6,566 | 1.8 | 11,707 | 0.4 | 1,146 | - | 305 | - | 19,724 | 0.8 | ||||||||||||||||||||||||||||||||||||
| Promissory notes |
- | - | 306 | - | 129 | - | - | - | - | - | 435 | - | ||||||||||||||||||||||||||||||||||||
| Other |
- | - | 50 | 14.0 | 52 | 1.1 | 5 | 0.9 | - | - | 107 | 7.0 | ||||||||||||||||||||||||||||||||||||
|
|
|
|
|
|
|
|
|
|
|
|
|
|
|
|
|
|
|
|
|
|
|
|
|
|||||||||||||||||||||||||
| Derivatives |
- | 10,371 | 4,069 | 9,026 | 23,466 | |||||||||||||||||||||||||||||||||||||||||||
|
|
|
|
|
|
|
|
|
|
|
|
|
|
|
|
|
|
|
|
|
|
|
|
|
|||||||||||||||||||||||||
|
At Fair Value Through Other Comprehensive Income |
161 | 10,523 | 21,650 | 12,030 | 4,959 | 49,323 | ||||||||||||||||||||||||||||||||||||||||||
| Government securities - domestic |
- | 1,026 | 11,303 | 10,701 | 4,809 | 27,839 | - | |||||||||||||||||||||||||||||||||||||||||
| Government securities - abroad |
- | 7,622 | 9,799 | 1,228 | 123 | 18,772 | ||||||||||||||||||||||||||||||||||||||||||
| United States |
- | - | 2,166 | 0.4 | 452 | 0.5 | - | - | - | - | 2,618 | 0.4 | ||||||||||||||||||||||||||||||||||||
| Chile |
- | - | 80 | 0.4 | 6,807 | 0.4 | 706 | 0.7 | 60 | 0.5 | 7,653 | 0.4 | ||||||||||||||||||||||||||||||||||||
| Paraguay |
- | - | 1,340 | 5.2 | 177 | 0.8 | - | - | 12 | 1.9 | 1,529 | 4.7 | ||||||||||||||||||||||||||||||||||||
| Uruguay |
- | - | 347 | 4.7 | 164 | 3.4 | 42 | 2.8 | 0 | 0.6 | 553 | 4.1 | ||||||||||||||||||||||||||||||||||||
| Colombia |
- | - | 2,798 | 2.1 | 2,176 | 2.1 | 480 | 26.3 | 51 | 1.5 | 5,505 | 4.2 | ||||||||||||||||||||||||||||||||||||
| France |
- | - | 891 | 0.4 | - | - | - | - | - | - | 891 | 0.4 | ||||||||||||||||||||||||||||||||||||
| Germany |
- | - | - | - | 22 | - | - | - | - | - | 22 | - | ||||||||||||||||||||||||||||||||||||
| Other |
- | - | - | - | 1 | 1.2 | 0 | - | - | - | 1 | 1.2 | ||||||||||||||||||||||||||||||||||||
| Corporate securities |
161 | 1,875 | 548 | 101 | 27 | 2,712 | ||||||||||||||||||||||||||||||||||||||||||
| Shares |
161 | - | - | - | - | - | - | - | - | - | 161 | - | ||||||||||||||||||||||||||||||||||||
| Bank deposit certificates |
- | - | 1,053 | 0.1 | - | - | - | - | - | - | 1,053 | 0.1 | ||||||||||||||||||||||||||||||||||||
| Debentures |
- | - | - | - | 2 | - | - | - | - | - | 2 | - | ||||||||||||||||||||||||||||||||||||
| Eurobonds and others |
- | - | 822 | 0.5 | 546 | 2.7 | 101 | 1.5 | 27 | 7.2 | 1,496 | 1.5 | ||||||||||||||||||||||||||||||||||||
|
|
|
|
|
|
|
|
|
|
|
|
|
|
|
|
|
|
|
|
|
|
|
|
|
|||||||||||||||||||||||||
| At Amortized Cost |
- | 14,119 | 50,971 | 29,801 | 11,858 | 106,749 | ||||||||||||||||||||||||||||||||||||||||||
| Government securities - domestic |
- | 1,625 | 29,226 | 15,316 | 7,839 | 54,006 | ||||||||||||||||||||||||||||||||||||||||||
| Government securities - abroad |
- | 4,066 | 2,616 | - | 15 | 6,697 | - | |||||||||||||||||||||||||||||||||||||||||
| Colombia |
- | - | 353 | 0.4 | - | - | - | - | - | - | 353 | 0.4 | ||||||||||||||||||||||||||||||||||||
| Chile |
- | - | 101 | 0.3 | 155 | 0.1 | - | - | - | - | 256 | 0.2 | ||||||||||||||||||||||||||||||||||||
| Korea |
- | - | - | - | 1,385 | 0.7 | - | - | - | - | 1,385 | 0.7 | ||||||||||||||||||||||||||||||||||||
| Spain |
- | - | 1,335 | 0.8 | 1,076 | 1.5 | - | - | - | - | 2,411 | 1.1 | ||||||||||||||||||||||||||||||||||||
| United States |
- | - | 19 | - | - | - | - | - | - | - | 19 | - | ||||||||||||||||||||||||||||||||||||
| Mexico |
- | - | 2,258 | 6.9 | - | - | - | - | - | - | 2,258 | 6.9 | ||||||||||||||||||||||||||||||||||||
| Uruguay |
- | - | - | - | - | - | - | - | 15 | - | 15 | - | ||||||||||||||||||||||||||||||||||||
| Corporate securities |
- | 8,428 | 19,129 | 14,485 | 4,004 | 46,046 | ||||||||||||||||||||||||||||||||||||||||||
| Rural product note |
- | - | 944 | 3.3 | 2,706 | 2.1 | 352 | 2.7 | 1 | - | 4,003 | 2.4 | ||||||||||||||||||||||||||||||||||||
| Bank deposit certificates |
- | - | 123 | - | - | - | - | - | - | - | 123 | - | ||||||||||||||||||||||||||||||||||||
| Securitized real estate loans |
- | - | 445 | 1.4 | 1,289 | 0.1 | 4,748 | 2.5 | 3,033 | 0.4 | 9,515 | 1.5 | ||||||||||||||||||||||||||||||||||||
| Debentures |
- | - | 3,292 | 4.4 | 12,377 | 2.2 | 9,349 | 2.5 | 970 | 5.6 | 25,988 | 2.7 | ||||||||||||||||||||||||||||||||||||
| Eurobonds and other |
- | - | 2,283 | 0.9 | 1,718 | 0.6 | 2 | 46.1 | - | - | 4,003 | 0.8 | ||||||||||||||||||||||||||||||||||||
| Promissory notes |
- | - | 654 | 7.8 | 401 | 4.1 | - | - | - | - | 1,055 | 6.4 | ||||||||||||||||||||||||||||||||||||
| Other |
- | - | 687 | - | 638 | - | 34 | - | - | - | 1,359 | - | ||||||||||||||||||||||||||||||||||||
|
|
|
|
|
|
|
|
|
|
|
|
|
|
|
|
|
|
|
|
|
|
|
|
|
|||||||||||||||||||||||||
|
(1) Average yields are not shown for these securities, as such yields are not meaningful because future yields are not quantifiable. These securities have been excluded from the calculation of the total yield. |
| |||||||||||||||||||||||||||||||||||||||||||||||
89
Table of Contents
| Securities | Derivatives | |||||||||||||||||||
| Distribution of our financial assets by currency |
Amortized Cost |
Fair ValueThrough Profit or Loss |
Fair Value Through other Comprehensive Income |
Fair Value Through Profit or Loss |
Total | |||||||||||||||
| (In millions of R$) | ||||||||||||||||||||
| As of December 31, 2018 |
106,749 | 263,180 | 49,323 | 23,466 | 442,718 | |||||||||||||||
| Denominated in Brazilian currency |
82,l9l | 248,921 | l4,055 | 9,32l | 354,488 | |||||||||||||||
| Denominated in Brazilian currency and indexed by foreign currency(1) |
- | 3,242 | 80l | 2,526 | 6,569 | |||||||||||||||
| Denominated in foreign currency(l) |
24,558 | ll,0l7 | 34,467 | ll,6l9 | 8l,66l | |||||||||||||||
| As of December 31, 2017(2) |
106,242 | 250,693 | 52,149 | 22,843 | 431,927 | |||||||||||||||
| Denominated in Brazilian currency |
9l,86l | 59,869 | l9,43l | l2,024 | l83,l85 | |||||||||||||||
| Denominated in Brazilian currency and indexed by foreign currency(l) |
- | 2,8l7 | 707 | l,5l6 | 5,040 | |||||||||||||||
| Denominated in foreign currency(l) |
l4,38l | l88,007 | 32,0ll | 9,303 | 243,702 | |||||||||||||||
| As of December 31, 2016(2) |
98,752 | 194,574 | 40,039 | 24,231 | 357,596 | |||||||||||||||
| Denominated in Brazilian currency |
76,920 | l80,993 | l2,499 | l0,7l0 | 28l,l22 | |||||||||||||||
| Denominated in Brazilian currency and indexed by foreign currency(l) |
- | 2,653 | 670 | 4,634 | 7,957 | |||||||||||||||
| Denominated in foreign currency(1) |
2l,832 | 10,928 | 26,870 | 8,887 | 68,5l7 | |||||||||||||||
| (1) | Predominantly U.S. dollars. |
| (2) | Restated to take into account the effect of IFRS 9, which we retroactively adopted as of January 1, 2016. |
For the purpose of analyzing the exposure of variations in foreign exchange rates, the table below presents the composition of our derivative financial instruments as of December 3l, 2018 in reais and in foreign currency, including the instruments denominated in foreign currencies. For the notional amount of derivative financial instruments, please see “Note 6 Derivatives” to our audited consolidated financial statements.
| As of December 31, 2018 | ||||||||||||
| Derivative financial instruments (notional amounts) |
Brazilian Currency |
Denominated in or linked to Foreign Currency |
Total | |||||||||
| (In millions of R$) | ||||||||||||
| Swap contracts |
||||||||||||
| Buy (Sale) commitments, net |
10,946 | (10,946 | ) | - | ||||||||
| Forward contracts |
||||||||||||
| Buy (Sale) commitments, net |
1,746 | 18,992 | 20,738 | |||||||||
| Future contracts |
||||||||||||
| Buy (Sale) commitments, net |
(22,100 | ) | (27,477 | ) | (49,577 | ) | ||||||
| Option contracts |
||||||||||||
| Buy (Sale) commitments, net |
24,537 | 6,181 | 30,718 | |||||||||
| Others |
||||||||||||
| Buy (Sale) commitments, net |
1,513 | (3 | ) | 1,510 | ||||||||
90
Table of Contents
Compulsory Reserve Deposits with the Central Bank
The Central Bank requires reserves for deposits from Brazilian financial institutions. The reserve requirements are tools utilized by the Central Bank to control the liquidity of the Brazilian financial system, for both monetary policy and risk mitigation purposes. These requirements are applied to balances on demand deposits, saving account deposits and time deposits. The below table sets forth the required reserve for each type of deposit:
| Required reserve deposits |
Regulation(1) | Yield | 2018 | 2017 | 2016 | 2015 | ||||||||||||||||||
| Demand Deposits |
||||||||||||||||||||||||
| Compulsory |
Circular No. 3,917 | Zero | 21% | 40% | 45% | 45% | ||||||||||||||||||
| Additional Compulsory |
Circular No. 3,655 | SELIC | 0% | 0% | 0% | 0% | ||||||||||||||||||
| Rural(2) |
Resolution No. 4,669 | Zero | 30% | 34% | 34% | 34% | ||||||||||||||||||
| Microcredit(2) |
Resolution No. 4,000 | Zero | 2% | 2% | 2% | 2% | ||||||||||||||||||
| Savings Accounts(3) |
||||||||||||||||||||||||
| Compulsory |
Circular No. 3,093 | TR + 6.17% p.a. | 20.0% | 24.5% | 24.5% | 24.5% | ||||||||||||||||||
| Additional Compulsory |
Circular No. 3,655 | SELIC | 0.0% | 0.0% | 5.5% | 5.5% | ||||||||||||||||||
| Real estate financing(2) |
Resolution No. 3,932 | 80% (TR + 6.17% p.a.) | 65% | 65% | 65% | 65% | ||||||||||||||||||
| Time and Interbank Deposits Received from Leasing Companies |
||||||||||||||||||||||||
| Compulsory |
Circular No. 3,916 | SELIC | 33% | 36% | 25% | 25% | ||||||||||||||||||
| Additional Compulsory |
Circular No. 3,655 | SELIC | 0% | 0% | 11% | 11% | ||||||||||||||||||
| (1) | Most recent regulation on the matter. |
| (2) | This is a compulsory investment of resources that is made in eligible transactions, that is, the funds are granted to other economic entities. |
| (3) | Remuneration on funds in savings deposits: |
For deposits made until March 5, 2012, inclusive: TR + 6.17% per annum.
For deposits made after March 5, 2012: (a) If the target of the Selic rate is higher than 8.5% per annum: TR + 6.17% per annum; (b) If the target of the Selic rate is lower than 8.5% per annum: TR + 70% of the target of the Selic rate per annum.
The Central Bank, in accordance with economic scenario and its monetary policy objectives, may change the rules governing the required deposit requirements with which Brazilian financial institutions must comply, as a mechanism to control the liquidity of the Brazilian financial system.
Thus, in the second half of 2018, the Central Bank made changes to the rules on compulsory deposits that did not change the volume of money in circulation in the economy, but simplified the operational processes to reduce banks administrative costs, aiming at reducing the cost of medium and long-term credit in Brazil. The rates of compulsory deposits are currently as follow: (i) time deposits: 33.0%, (ii) demand deposits: 21.0% and (iii) savings deposits: 20% and 30% for rural credits.
As of December 31, 2018, we recorded R$ 94,148 million in compulsory deposits in cash compared to R$ 98,837 million as of December 31, 2017 and R$ 88,548 million in interest-bearing deposits compared to R$ 94,047 million as of December 31, 2016.
| 2018 | 2017 | 2016 | ||||||||||||||||||||||
| Required reserve deposits |
R$ | % of total required reserve deposits |
R$ | % of total required reserve deposits |
R$ | % of total required reserve deposits |
||||||||||||||||||
| (In millions of R$, except percentages) | ||||||||||||||||||||||||
| Non-interest bearing deposits(1) |
5,600 | 5.9 | 4,790 | 4.8 | 3,002 | 3.5 | ||||||||||||||||||
| Interest-bearing deposits(2) |
88,548 | 94.1 | 94,047 | 95.2 | 82,698 | 96.5 | ||||||||||||||||||
| Total |
94,148 | 100.0 | 98,837 | 100.0 | 85,700 | 100.0 | ||||||||||||||||||
| (1) | Mainly related to demand deposits. |
| (2) | Mainly related to time and savings deposits. |
Loan and lease operations
Most of our loans are granted to clients domiciled in Brazil and are denominated in Brazilian reais. Additionally, 46.4% of our credit portfolio consists of transactions with fixed interest rates and 53.6% of our credit portfolio consists of transactions with variable interest rates.
91
Table of Contents
Indexation
Most of our portfolio is denominated in Brazilian reais. However, a portion of our portfolio is indexed to foreign currencies, primarily the U.S. dollar. The foreign currency portion of our portfolio consists of loans and financing for foreign trade and onlending operations. Our loans abroad represented 35.6%, 34.2% and 32.8% of our loan portfolio as of December 31, 2018, 2017 and 2016, respectively, see “Note 32 – Risk and Capital Management, 1.4. Maximum Exposure of Financial Assets to Credit Risk” to our audited consolidated financial statements for further details.
Loan and lease operations by type
The following table sets out the distribution of our credit portfolio according to the type of loan and lease operations, as follows:
| • | The Individuals portfolio consists primarily of credit cards, personal loans (primarily including consumer finance and overdrafts), payroll loans, vehicle financing and residential mortgage loans; |
| • | The Corporate portfolio consists primarily of loans made to large corporate clients; |
| • | The Small and Medium Businesses portfolio consists primarily of loans to small and medium-sized companies; and |
| • | The Foreign Loans – Latin America portfolio consists of loans granted to individuals and companies by our operations in Argentina, Chile, Colombia, Paraguay and Uruguay. |
| Loan and Lease Operations, by type(1) |
2018 | 2017(3) | 2016(3) | |||||||||||||||||||||
| Loan | Allowance(2) | Loan | Allowance(2) | Loan | Allowance(2) | |||||||||||||||||||
| (In millions of R$) | ||||||||||||||||||||||||
| Individuals |
212,564 | 14,425 | 193,385 | 14,830 | 186,467 | 14,790 | ||||||||||||||||||
| Credit card |
78,255 | 6,077 | 67,413 | 6,684 | 59,863 | 5,693 | ||||||||||||||||||
| Personal loans |
29,543 | 5,447 | 27,295 | 5,138 | 27,930 | 6,038 | ||||||||||||||||||
| Payroll Loans |
46,878 | 2,279 | 44,716 | 2,368 | 44,860 | 2,284 | ||||||||||||||||||
| Vehicles |
15,920 | 523 | 14,165 | 547 | 15,566 | 675 | ||||||||||||||||||
| Mortgage loans |
41,968 | 99 | 39,796 | 93 | 38,248 | 100 | ||||||||||||||||||
| Corporate |
102,643 | 9,367 | 107,647 | 11,452 | 121,761 | 11,089 | ||||||||||||||||||
| Small and Medium Businesses |
68,812 | 4,532 | 60,290 | 5,404 | 59,847 | 6,366 | ||||||||||||||||||
| Foreign Loans Latin America(4) |
152,072 | 5,185 | 136,397 | 4,783 | 126,776 | 2,280 | ||||||||||||||||||
|
|
|
|
|
|
|
|
|
|
|
|
|
|||||||||||||
| Total Loan operations and lease operations portfolio |
536,091 | 33,509 | 497,719 | 36,469 | 494,851 | 34,525 | ||||||||||||||||||
|
|
|
|
|
|
|
|
|
|
|
|
|
|||||||||||||
| (1) | We classify all loans and leases more than 60 days overdue as non-accrual loans and we discontinue accruing financial income related to them. The contractual amount of non-accrual loans were R$22,369 million, R$23,340 million and R$24,284 million as of December 31, 2018, 2017 and 2016, respectively. The total of renegotiated loans in the balance of non-accrual loans reflected herein was R$4,973 million, R$5,433 million and R$5,720 million as of December 31, 2018, 2017 and 2016, respectively. Non-accrual loans are presented herein in the appropriate category of loan and lease operations. |
| (2) | Comprises Provision for Expected Loss for Financial Guarantees Pledged R$ 1,191 million (R$ 1,907 million and R$ 1,580 million as of December 31, 2017 and 2016) and Commitments to be Released R$ 2,601 million (R$ 3,015 million and R$ 2,691 million as of December 31, 2017 and 2016). |
| (3) | Restated to take into account the effect of IFRS 9, which we retroactively adopted as of January 1, 2016. |
| (4) | As of December 31, 2018 other than “Foreign Loans Latin America”, 26% of Corporate and 17% of Small and Medium Businesses correspond to cross-border outstanding. |
92
Table of Contents
Loan and lease operations by maturity
The following table sets out the distribution of our credit portfolio by maturity, including non-overdue and overdue installments, according to the type of loan and lease:
| Non-Overdue Installments |
12/31/2018 | |||||||||||||||||||||||||||
| Type of loan and lease |
Due in 30 days or less |
Due in 31-90 days |
Due in 91-180 days |
Due in 181-360 days |
Due in one year to five years |
Due after five years |
Total Non- Overdue Installments |
|||||||||||||||||||||
| (In millions of R$) | ||||||||||||||||||||||||||||
| Individuals |
36,728 | 28,842 | 22,681 | 23,435 | 57,329 | 32,529 | 201,544 | |||||||||||||||||||||
| Credit card |
28,896 | 21,831 | 13,358 | 7,175 | 799 | - | 72,059 | |||||||||||||||||||||
| Personal loans |
5,254 | 1,960 | 2,416 | 4,079 | 11,846 | 186 | 25,741 | |||||||||||||||||||||
| Payroll loans |
1,648 | 3,264 | 4,468 | 7,792 | 27,490 | 1,611 | 46,273 | |||||||||||||||||||||
| Vehicles |
695 | 1,425 | 1,945 | 3,386 | 8,167 | - | 15,618 | |||||||||||||||||||||
| Mortgage loans |
235 | 362 | 494 | 1,003 | 9,027 | 30,732 | 41,853 | |||||||||||||||||||||
| Corporate |
10,224 | 11,813 | 14,912 | 14,748 | 36,995 | 12,056 | 100,748 | |||||||||||||||||||||
| Small and Medium Businesses |
12,143 | 14,567 | 8,346 | 11,047 | 20,188 | 165 | 66,456 | |||||||||||||||||||||
| Foreign Loans Latin America |
14,862 | 15,779 | 15,716 | 17,301 | 49,848 | 34,274 | 147,780 | |||||||||||||||||||||
| Total(1) |
73,957 | 71,001 | 61,655 | 66,531 | 164,360 | 79,024 | 516,528 | |||||||||||||||||||||
|
|
|
|
|
|
|
|
|
|
|
|
|
|
|
|||||||||||||||
| (1) | Includes R$8,786 million related to non-overdue installments of the non-accrual loans. |
| Non-Overdue Installments |
12/31/2017(2) | |||||||||||||||||||||||||||
| Type of loan and lease |
Due in 30 days or less |
Due in 31-90 days |
Due in 91-180 days |
Due in 181-360 days |
Due in one year to five years |
Due after five years |
Total Non- Overdue Installments |
|||||||||||||||||||||
| (In millions of R$) | ||||||||||||||||||||||||||||
| Individuals |
32,995 | 24,388 | 18,431 | 19,079 | 55,171 | 31,447 | 181,511 | |||||||||||||||||||||
| Credit card |
26,278 | 18,809 | 10,909 | 5,418 | 390 | - | 61,804 | |||||||||||||||||||||
| Personal loans |
4,298 | 1,627 | 2,007 | 3,392 | 11,056 | 165 | 22,545 | |||||||||||||||||||||
| Payroll loans |
1,527 | 2,518 | 3,525 | 6,408 | 27,745 | 2,206 | 43,929 | |||||||||||||||||||||
| Vehicles |
599 | 1,050 | 1,466 | 2,733 | 7,945 | - | 13,793 | |||||||||||||||||||||
| Mortgage loans |
293 | 384 | 524 | 1,128 | 8,035 | 29,076 | 39,440 | |||||||||||||||||||||
| Corporate |
9,870 | 11,257 | 14,103 | 18,400 | 41,039 | 10,457 | 105,126 | |||||||||||||||||||||
| Small and Medium Businesses |
10,680 | 11,536 | 6,867 | 9,456 | 18,691 | 218 | 57,448 | |||||||||||||||||||||
| Foreign Loans Latin America |
14,146 | 12,530 | 13,407 | 16,346 | 43,756 | 31,475 | 131,660 | |||||||||||||||||||||
| Total(1) |
67,691 | 59,711 | 52,808 | 63,281 | 158,657 | 73,597 | 475,745 | |||||||||||||||||||||
|
|
|
|
|
|
|
|
|
|
|
|
|
|
|
|||||||||||||||
| (1) | Includes R$8,653 million related to non-overdue installments of the non-accrual loans. |
| (2) | Restated to take into account the effect of IFRS 9, which we retroactively adopted as of January 1, 2016. |
93
Table of Contents
| Non-Overdue Installments |
12/31/2016(2) | |||||||||||||||||||||||||||
| Type of loan and lease |
Due in 30 days or less |
Due in 31-90 days |
Due in 91-180 days |
Due in 181-360 days |
Due in one year to five years |
Due after five years |
Total Non- Overdue Installments |
|||||||||||||||||||||
| (In millions of R$) | ||||||||||||||||||||||||||||
| Individuals |
29,843 | 22,919 | 16,934 | 18,330 | 54,966 | 30,044 | 173,036 | |||||||||||||||||||||
| Credit card |
23,093 | 16,972 | 9,186 | 4,165 | 27 | - | 53,443 | |||||||||||||||||||||
| Personal loans |
4,353 | 1,788 | 1,985 | 3,414 | 10,770 | 64 | 22,374 | |||||||||||||||||||||
| Payroll loans |
1,388 | 2,551 | 3,571 | 6,553 | 28,237 | 1,836 | 44,136 | |||||||||||||||||||||
| Vehicles |
705 | 1,236 | 1,693 | 3,113 | 8,190 | 2 | 14,939 | |||||||||||||||||||||
| Mortgage loans |
304 | 372 | 499 | 1,085 | 7,742 | 28,142 | 38,144 | |||||||||||||||||||||
| Corporate |
12,970 | 13,645 | 15,232 | 20,627 | 48,148 | 9,452 | 120,074 | |||||||||||||||||||||
| Small and Medium Businesses |
10,388 | 11,661 | 6,619 | 9,566 | 17,811 | 234 | 56,279 | |||||||||||||||||||||
| Foreign Loans Latin America |
14,144 | 14,743 | 11,903 | 13,641 | 40,620 | 27,855 | 122,906 | |||||||||||||||||||||
| Total(1) |
67,345 | 62,968 | 50,688 | 62,164 | 161,545 | 67,585 | 472,295 | |||||||||||||||||||||
|
|
|
|
|
|
|
|
|
|
|
|
|
|
|
|||||||||||||||
| (1) | Includes R$9,085 million related to non-overdue installments of the non-accrual loans. |
| (2) | Restated to take into account the effect of IFRS 9, which we retroactively adopted as of January 1, 2016. |
| Overdue Installments(1) |
12/31/2018 | |||||||||||||||||||||||||||||||||||||||
| Type of loan and lease |
01-30 days |
31-60 days |
61-90 days |
91-180 days |
181-360 days |
One year or more |
Total overdue installments |
Total gross loans |
Allowance for loan losses |
Total net | ||||||||||||||||||||||||||||||
| (In millions of R$) | ||||||||||||||||||||||||||||||||||||||||
| Individuals |
1,596 | 886 | 941 | 2,347 | 3,116 | 2,134 | 11,020 | 212,564 | (14,425 | ) | 198,139 | |||||||||||||||||||||||||||||
| Credit card |
862 | 377 | 531 | 1,399 | 2,206 | 821 | 6,196 | 78,255 | (6,077 | ) | 72,178 | |||||||||||||||||||||||||||||
| Personal loans |
511 | 391 | 326 | 764 | 734 | 1,076 | 3,802 | 29,543 | (5,447 | ) | 24,096 | |||||||||||||||||||||||||||||
| Payroll loans |
75 | 56 | 51 | 125 | 126 | 172 | 605 | 46,878 | (2,279 | ) | 44,599 | |||||||||||||||||||||||||||||
| Vehicles |
108 | 43 | 24 | 46 | 37 | 44 | 302 | 15,920 | (523 | ) | 15,397 | |||||||||||||||||||||||||||||
| Mortgage loans |
40 | 19 | 9 | 13 | 13 | 21 | 115 | 41,968 | (99 | ) | 41,869 | |||||||||||||||||||||||||||||
| Corporate |
568 | 281 | 631 | 176 | 236 | 3 | 1,895 | 102,643 | (9,367 | ) | 93,276 | |||||||||||||||||||||||||||||
| Small and Medium Businesses |
478 | 207 | 155 | 390 | 466 | 660 | 2,356 | 68,812 | (4,532 | ) | 64,280 | |||||||||||||||||||||||||||||
| Foreign Loans Latin America |
2,110 | 598 | 324 | 465 | 443 | 352 | 4,292 | 152,072 | (5,185 | ) | 146,887 | |||||||||||||||||||||||||||||
| Total(2) |
4,752 | 1,972 | 2,051 | 3,378 | 4,261 | 3,149 | 19,563 | 536,091 | (33,509 | ) | 502,582 | |||||||||||||||||||||||||||||
|
|
|
|
|
|
|
|
|
|
|
|
|
|
|
|
|
|
|
|
|
|||||||||||||||||||||
| (1) | Defined as loans and leases contractually past due as to payment of interest or principal. |
| (2) | Includes R$13,583 million related to overdue installments of the non-accrual loans. |
94
Table of Contents
| Overdue Installments(1) |
12/31/2017(3) | |||||||||||||||||||||||||||||||||||||||
| Type of loan and lease |
01-30 days |
31-60 days |
61-90 days |
91-180 days |
181-360 days |
One year or more |
Total overdue installments |
Total gross loans |
Allowance for loan losses |
Total net | ||||||||||||||||||||||||||||||
| (In millions of R$) | ||||||||||||||||||||||||||||||||||||||||
| Individuals |
1,963 | 815 | 841 | 2,090 | 3,083 | 3,082 | 11,874 | 193,385 | (14,830 | ) | 178,555 | |||||||||||||||||||||||||||||
| Credit card |
841 | 383 | 454 | 1,246 | 2,174 | 511 | 5,609 | 67,413 | (6,684 | ) | 60,729 | |||||||||||||||||||||||||||||
| Personal loans |
595 | 313 | 303 | 673 | 738 | 2,128 | 4,750 | 27,295 | (5,138 | ) | 22,157 | |||||||||||||||||||||||||||||
| Payroll loans |
85 | 54 | 48 | 121 | 130 | 349 | 787 | 44,716 | (2,368 | ) | 42,348 | |||||||||||||||||||||||||||||
| Vehicles |
123 | 44 | 25 | 45 | 41 | 94 | 372 | 14,165 | (547 | ) | 13,618 | |||||||||||||||||||||||||||||
| Mortgage loans |
319 | 21 | 11 | 5 | - | - | 356 | 39,796 | (93 | ) | 39,703 | |||||||||||||||||||||||||||||
| Corporate |
314 | 737 | 748 | 303 | 135 | 284 | 2,521 | 107,647 | (11,452 | ) | 96,195 | |||||||||||||||||||||||||||||
| Small and Medium Businesses |
707 | 185 | 163 | 410 | 518 | 859 | 2,842 | 60,290 | (5,404 | ) | 54,886 | |||||||||||||||||||||||||||||
| Foreign Loans Latin America |
2,564 | 605 | 345 | 461 | 434 | 328 | 4,737 | 136,397 | (4,783 | ) | 131,614 | |||||||||||||||||||||||||||||
| Total(2) |
5,548 | 2,342 | 2,097 | 3,264 | 4,170 | 4,553 | 21,974 | 497,719 | (36,469 | ) | 461,250 | |||||||||||||||||||||||||||||
|
|
|
|
|
|
|
|
|
|
|
|
|
|
|
|
|
|
|
|
|
|||||||||||||||||||||
| (1) | Defined as loans and leases contractually past due as to payment of interest or principal. |
| (2) | Includes R$14,687 million related to overdue installments of the non-accrual loans. |
| (3) | Restated to take into account the effect of IFRS 9, which we retroactively adopted as of January 1, 2016. |
| Overdue Installments (1) |
12/31/2016(3) | |||||||||||||||||||||||||||||||||||||||
| Type of loan and lease |
01-30 days |
31-60 days |
61-90 days |
91-180 days |
181-360 days |
One year or more |
Total overdue installments |
Total gross loans |
Allowance for loan losses |
Total net | ||||||||||||||||||||||||||||||
| (In millions of R$) | ||||||||||||||||||||||||||||||||||||||||
| Individuals |
1,704 | 931 | 859 | 2,318 | 3,231 | 4,388 | 13,431 | 186,467 | (14,790 | ) | 171,677 | |||||||||||||||||||||||||||||
| Credit card |
937 | 443 | 446 | 1,273 | 2,236 | 1,085 | 6,420 | 59,863 | (5,693 | ) | 54,170 | |||||||||||||||||||||||||||||
| Personal loans |
514 | 352 | 319 | 846 | 800 | 2,725 | 5,556 | 27,930 | (6,038 | ) | 21,892 | |||||||||||||||||||||||||||||
| Payroll loans |
71 | 53 | 47 | 116 | 123 | 314 | 724 | 44,860 | (2,284 | ) | 42,576 | |||||||||||||||||||||||||||||
| Vehicles |
145 | 64 | 38 | 69 | 60 | 251 | 627 | 15,566 | (675 | ) | 14,891 | |||||||||||||||||||||||||||||
| Mortgage loans |
37 | 19 | 9 | 14 | 12 | 13 | 104 | 38,248 | (100 | ) | 38,148 | |||||||||||||||||||||||||||||
| Corporate |
484 | 237 | 201 | 161 | 315 | 289 | 1,687 | 121,761 | (11,089 | ) | 110,672 | |||||||||||||||||||||||||||||
| Small and Medium Businesses |
481 | 301 | 223 | 619 | 799 | 1,145 | 3,568 | 59,847 | (6,366 | ) | 53,481 | |||||||||||||||||||||||||||||
| Foreign Loans Latin America |
2,170 | 523 | 329 | 386 | 414 | 48 | 3,870 | 126,776 | (2,280 | ) | 124,496 | |||||||||||||||||||||||||||||
| Total(2) |
4,839 | 1,992 | 1,612 | 3,484 | 4,759 | 5,870 | 22,556 | 494,851 | (34,525 | ) | 460,326 | |||||||||||||||||||||||||||||
|
|
|
|
|
|
|
|
|
|
|
|
|
|
|
|
|
|
|
|
|
|||||||||||||||||||||
| (1) | Defined as loans and leases contractually past due as to payment of interest or principal. |
| (2) | Includes R$15,199 million related to overdue installments of the non-accrual loans. |
| (3) | Restated to take into account the effect of IFRS 9, which we retroactively adopted as of January 1, 2016. |
95
Table of Contents
Loan and Lease Operations by interest rate
The following table sets forth the classification of our credit portfolio into fixed and variable rates, including non-overdue and overdue installments:
| 12/31/2018 | ||||||||||||||||||||||||||||
| Non-Overdue Installments |
Due in 30 days or less |
Due in 31-90 days |
Due in 91-180 days |
Due in 181-360 days |
Due in one year to five years |
Due after five years |
Total Non-Overdue Installments |
|||||||||||||||||||||
| (In millions of R$) | ||||||||||||||||||||||||||||
| Interest rate of loans to customers by maturity |
||||||||||||||||||||||||||||
| Variable rates |
21,129 | 30,729 | 26,210 | 29,854 | 96,461 | 76,828 | 281,211 | |||||||||||||||||||||
| Fixed rates |
52,828 | 40,272 | 35,445 | 36,677 | 67,899 | 2,196 | 235,317 | |||||||||||||||||||||
|
|
|
|
|
|
|
|
|
|
|
|
|
|
|
|||||||||||||||
| Total(1) |
73,957 | 71,001 | 61,655 | 66,531 | 164,360 | 79,024 | 516,528 | |||||||||||||||||||||
|
|
|
|
|
|
|
|
|
|
|
|
|
|
|
|||||||||||||||
| (1) | Includes R$8,786 million related to non-overdue installments of the non-accrual loans. |
| 12/31/2017(2) | ||||||||||||||||||||||||||||
| Non-Overdue Installments |
Due in 30 days or less |
Due in 31-90 days |
Due in 91-180 days |
Due in 181-360 days |
Due in one year to five years |
Due after five years |
Total Non-Overdue Installments |
|||||||||||||||||||||
| (In millions of R$) | ||||||||||||||||||||||||||||
| Interest rate of loans to customers by maturity |
||||||||||||||||||||||||||||
| Variable rates |
19,158 | 25,848 | 23,020 | 30,863 | 91,251 | 70,414 | 260,554 | |||||||||||||||||||||
| Fixed rates |
48,533 | 33,863 | 29,788 | 32,418 | 67,406 | 3,183 | 215,191 | |||||||||||||||||||||
|
|
|
|
|
|
|
|
|
|
|
|
|
|
|
|||||||||||||||
| Total(1) |
67,691 | 59,711 | 52,808 | 63,281 | 158,657 | 73,597 | 475,745 | |||||||||||||||||||||
|
|
|
|
|
|
|
|
|
|
|
|
|
|
|
|||||||||||||||
| (1) | Includes R$8,653 million related to non-overdue installments of the non-accrual loans. |
| (2) | Restated to take into account the effect of IFRS 9, which we retroactively adopted as of January 1, 2016. |
| 12/31/2016(2) | ||||||||||||||||||||||||||||
| Non-Overdue Installments |
Due in 30 days or less |
Due in 31-90 days |
Due in 91-180 days |
Due in 181-360 days |
Due in one year to five years |
Due after five years |
Total Non-Overdue Installments |
|||||||||||||||||||||
| (In millions of R$) | ||||||||||||||||||||||||||||
| Interest rate of loans to customers by maturity |
||||||||||||||||||||||||||||
| Variable rates |
21,082 | 28,062 | 22,294 | 28,492 | 89,274 | 64,034 | 253,238 | |||||||||||||||||||||
| Fixed rates |
46,263 | 34,906 | 28,394 | 33,672 | 72,271 | 3,551 | 219,057 | |||||||||||||||||||||
|
|
|
|
|
|
|
|
|
|
|
|
|
|
|
|||||||||||||||
| Total(1) |
67,345 | 62,968 | 50,688 | 62,164 | 161,545 | 67,585 | 472,295 | |||||||||||||||||||||
|
|
|
|
|
|
|
|
|
|
|
|
|
|
|
|||||||||||||||
| (1) | Includes R$9,085 million related to non-overdue installments of the non-accrual loans. |
| (2) | Restated to take account the effect of IFRS 9, which we retroactively adopted as of January 1, 2016. |
| 12/31/2018 | ||||||||||||||||||||||||||||||||
| Overdue Installments(1) |
01-30 days |
31-60 days |
61-90 days |
91-180 days |
181-360 days |
One year or more |
Total overdue installments |
Total gross loans |
||||||||||||||||||||||||
| (In millions of R$) | ||||||||||||||||||||||||||||||||
| Interest rate of loans to customers by maturity |
||||||||||||||||||||||||||||||||
| Variable rates |
2,484 | 792 | 962 | 617 | 702 | 387 | 5,944 | 287,155 | ||||||||||||||||||||||||
| Fixed rates |
2,268 | 1,180 | 1,089 | 2,761 | 3,559 | 2,762 | 13,619 | 248,936 | ||||||||||||||||||||||||
|
|
|
|
|
|
|
|
|
|
|
|
|
|
|
|
|
|||||||||||||||||
| Total(2) |
4,752 | 1,972 | 2,051 | 3,378 | 4,261 | 3,149 | 19,563 | 536,091 | ||||||||||||||||||||||||
|
|
|
|
|
|
|
|
|
|
|
|
|
|
|
|
|
|||||||||||||||||
| (1) | Defined as loans and leases contractually past due as to payment of interest or principal. |
| (2) | Includes R$13,583 million related to overdue installments of the non-accrual loans. |
96
Table of Contents
| 12/31/2017(3) | ||||||||||||||||||||||||||||||||
| Overdue Installments(1) |
01-30 days |
31-60 days |
61-90 days |
91-180 days |
181-360 days |
One year or more |
Total overdue installments |
Total gross loans |
||||||||||||||||||||||||
| (In millions of R$) | ||||||||||||||||||||||||||||||||
| Interest rate of loans to customers by maturity |
||||||||||||||||||||||||||||||||
| Variable rates |
3,139 | 1,359 | 1,076 | 599 | 531 | 2,813 | 9,517 | 270,071 | ||||||||||||||||||||||||
| Fixed rates |
2,409 | 983 | 1,021 | 2,665 | 3,639 | 1,740 | 12,457 | 227,648 | ||||||||||||||||||||||||
|
|
|
|
|
|
|
|
|
|
|
|
|
|
|
|
|
|||||||||||||||||
| Total(2) |
5,548 | 2,342 | 2,097 | 3,264 | 4,170 | 4,553 | 21,974 | 497,719 | ||||||||||||||||||||||||
|
|
|
|
|
|
|
|
|
|
|
|
|
|
|
|
|
|||||||||||||||||
| (1) | Defined as loans and leases contractually past due as to payment of interest or principal. |
| (2) | Includes R$14,687 million related to overdue installments of the non-accrual loans. |
| (3) | Restated to take into account the effect of IFRS 9, which we retroactively adopted as of January 1, 2016. |
| 12/31/2016(3) | ||||||||||||||||||||||||||||||||
| Overdue Installments(1) |
01-30 days |
31-60 days |
61-90 days |
91-180 days |
181-360 days |
One year or more |
Total overdue installments |
Total gross loans |
||||||||||||||||||||||||
| (In millions of R$) | ||||||||||||||||||||||||||||||||
| Interest rate of loans to customers by maturity |
||||||||||||||||||||||||||||||||
| Variable rates |
2,513 | 795 | 512 | 506 | 686 | 2,874 | 7,886 | 261,124 | ||||||||||||||||||||||||
| Fixed rates |
2,326 | 1,197 | 1,100 | 2,978 | 4,073 | 2,996 | 14,670 | 233,727 | ||||||||||||||||||||||||
|
|
|
|
|
|
|
|
|
|
|
|
|
|
|
|
|
|||||||||||||||||
| Total(2) |
4,839 | 1,992 | 1,612 | 3,484 | 4,759 | 5,870 | 22,556 | 494,851 | ||||||||||||||||||||||||
|
|
|
|
|
|
|
|
|
|
|
|
|
|
|
|
|
|||||||||||||||||
| (1) | Defined as loans and leases contractually past due as to payment of interest or principal. |
| (2) | Includes R$15,199 million related to overdue installments of the non-accrual loans. |
| (3) | Restated to take into account the effect of IFRS 9, which we retroactively adopted as of January 1, 2016. |
Loan and Lease Operations by economic activity
The following table sets out the composition of our credit portfolio, including non-accrual loan operations, by economic activity of the borrower:
On December 31, 2018, there was no concentration of loan and lease operations exceeding 10% of the total portfolio that had not been disclosed in a category of loan and losses.
| Economic Activities |
12/31/2018 | 12/31/2017(1) | 12/31/2016(1) | |||||||||||||||||||||
| Loan portfolio |
% of Loan portfolio |
Loan portfolio |
% of Loan portfolio |
Loan portfolio |
% of Loan portfolio |
|||||||||||||||||||
| (In millions of R$, except percentages) | ||||||||||||||||||||||||
| Industry and commerce |
115,225 | 21.5 | 107,201 | 21.5 | 112,948 | 22.8 | ||||||||||||||||||
| Services |
118,435 | 22.1 | 114,332 | 23.0 | 118,680 | 24.0 | ||||||||||||||||||
| Individuals |
271,991 | 50.7 | 247,139 | 49.7 | 232,911 | 47.1 | ||||||||||||||||||
| Other sectors |
30,440 | 5.7 | 29,047 | 5.8 | 30,312 | 6.1 | ||||||||||||||||||
|
|
|
|
|
|
|
|
|
|
|
|
|
|||||||||||||
| Total |
536,091 | 100.0 | 497,719 | 100.0 | 494,851 | 100.0 | ||||||||||||||||||
| (1) | Restated to take into account the effect of IFRS 9, which we retroactively adopted as of January 1, 2016. |
Loan and Lease Operations by concentration
The following table presents the composition of our credit portfolio by concentration with respect to the amounts owed by the debtors:
| 12/31/2018 | 12/31/2017(1) | 12/31/2016(1) | ||||||||||||||||||||||
| Concentration |
Loan portfolio |
% of Loan portfolio |
Loan portfolio |
% of Loan portfolio |
Loan portfolio |
% of Loan portfolio |
||||||||||||||||||
| (In millions of R$, except percentages) | ||||||||||||||||||||||||
| Largest debtor |
5,193 | 1.0 | 4,079 | 0.8 | 3,543 | 0.7 | ||||||||||||||||||
| 10 largest debtors |
31,564 | 5.9 | 28,958 | 5.8 | 21,609 | 4.4 | ||||||||||||||||||
| 20 largest debtors |
47,433 | 8.8 | 46,313 | 9.3 | 32,720 | 6.6 | ||||||||||||||||||
| 50 largest debtors |
73,358 | 13.7 | 74,772 | 15.0 | 52,992 | 10.7 | ||||||||||||||||||
| 100 largest debtors |
98,675 | 18.4 | 101,149 | 20.3 | 72,443 | 14.6 | ||||||||||||||||||
|
|
|
|
|
|
|
|
|
|
|
|
|
|||||||||||||
| Total |
536,091 | 497,719 | 494,851 | |||||||||||||||||||||
|
|
|
|
|
|
|
|
|
|
|
|
|
|||||||||||||
| (1) | Restated to take into account the effect of IFRS 9, which we retroactively adopted as of January 1, 2016. |
97
Table of Contents
Rating of the Loan and Lease Portfolio
The following table presents the rating of our loan and lease portfolio based on the probability of default for the periods indicated below.
| Internal Rating |
12/31/2018 | |||||||||||||||
| Stage 1 | Stage 2 | Stage 3 | Total loans | |||||||||||||
| (In millions of R$, except percentages) | ||||||||||||||||
| Lower Risk |
378,389 | 4,536 | — | 382,925 | ||||||||||||
| Satisfactory |
72,921 | 19,723 | — | 92,644 | ||||||||||||
| Higher Risk |
8,316 | 12,635 | — | 20,951 | ||||||||||||
| Credit-Impaired |
— | — | 39,571 | 39,571 | ||||||||||||
| Total |
459,626 | 36,894 | 39,571 | 536,091 | ||||||||||||
|
|
|
|
|
|
|
|
|
|||||||||
| % |
85.7 | 6.9 | 7.4 | 100.0 | ||||||||||||
|
|
|
|
|
|
|
|
|
|||||||||
| Internal Rating (1) |
12/31/2017 | |||||||||||||||
| Stage 1 | Stage 2 | Stage 3 | Total loans | |||||||||||||
| (In millions of R$, except percentages) | ||||||||||||||||
| Lower Risk |
349,354 | 5,274 | — | 354,628 | ||||||||||||
| Satisfactory |
60,707 | 17,798 | — | 78,505 | ||||||||||||
| Higher Risk |
7,325 | 12,822 | — | 20,147 | ||||||||||||
| Credit-Impaired |
— | — | 44,439 | 44,439 | ||||||||||||
| Total |
417,386 | 35,894 | 44,439 | 497,719 | ||||||||||||
|
|
|
|
|
|
|
|
|
|||||||||
| % |
83.9 | 7.2 | 8.9 | 100.0 | ||||||||||||
|
|
|
|
|
|
|
|
|
|||||||||
| (1) | Restated to take into account the effect of IFRS9, which we retroactively adopted as of January 1, 2016. |
| Internal Rating (1) |
12/31/2016 | |||||||||||||||
| Stage 1 | Stage 2 | Stage 3 | Total loans | |||||||||||||
| (In millions of R$, except percentages) | ||||||||||||||||
| Lower Risk |
349,402 | 10,320 | — | 359,722 | ||||||||||||
| Satisfactory |
56,063 | 16,515 | — | 72,578 | ||||||||||||
| Higher Risk |
7,027 | 10,069 | — | 17,096 | ||||||||||||
| Credit-Impaired |
— | — | 45,455 | 45,455 | ||||||||||||
| Total |
412,492 | 36,904 | 45,455 | 494,851 | ||||||||||||
|
|
|
|
|
|
|
|
|
|||||||||
| % |
83.4 | 7.4 | 9.2 | 100.0 | ||||||||||||
|
|
|
|
|
|
|
|
|
|||||||||
| (1) | Restated to take into account the effect of IFRS9, which we retroactively adopted as of January 1, 2016. |
For individual, small and middle-market companies, the credit rating is attributed based on application of statistical models (in the early phases of the client relationship) and behavior score (used for clients with which we already have a relationship).
For large companies, the credit rating is based on information such as the counterparty’s economic and financial condition, their cash-generating capability, the economic group to which they belong, and the current and prospective situation of the economic sector in which they operate. The credit proposals are analyzed on a case-by-case basis, through an approval-level mechanism.
We strictly control the credit exposure of clients and counterparties, taking action to address situations in which the actual exposure exceeds the desired one. For this purpose, contractually provided actions can be taken, such as early settlement or the requirement of additional collateral.
The risk ratings are grouped into the following four categories:
| (i) | Lower risk: probability of default (PD) lower or equal than 4.44% |
| (ii) | Satisfactory: PD from 4.44% up to 25.95% |
| (iii) | Higher risk: PD higher than 25.95%; and |
| (iv) | Credit-Impaired: loans classified in Stage 3 |
98
Table of Contents
Non-accrual Loans
We consider a loan to be a non-accrual loan if the payment of principal or interest is in default for 60 days or more. When this occurs, accrual of interest is no longer recognized.
Write-offs
When there is no reasonable expectation of recovery of a financial asset, considering historical curves, we carry out a total or partial write-off concurrently with the use of the related allowance for expected credit loss, with no effect on our Consolidated Statement of Income. Subsequent recoveries of amounts previously written off are accounted for as income in our Consolidated Statement of Income.
Information on the Quality of Loans and Leases
The table below shows our non-accrual loans together with certain asset quality ratios.
| 12/31/2018 | 12/31/2017(2) | 12/31/2016(2) | 12/31/2015(3) | 12/31/2014(3) | ||||||||||||||||
| (In millions of R$, except percentages) | ||||||||||||||||||||
| Non-accrual loans |
22,369 | 23,340 | 24,284 | 19,458 | 16,514 | |||||||||||||||
| Allowance for loan losses(1) |
33,509 | 36,469 | 34,525 | 26,844 | 22,392 | |||||||||||||||
| Total loans and leases operations portfolio |
536,091 | 497,719 | 494,851 | 474,248 | 452,431 | |||||||||||||||
| Non-accrual loans as a percentage of total loans (%) |
4.2 | 4.7 | 4.9 | 4.1 | 3.7 | |||||||||||||||
| Allowance for loan losses as a percentage of total loans (%) |
6.3 | 7.3 | 7.0 | 5.7 | 4.9 | |||||||||||||||
| Allowance for loan losses as a percentage of non-accrual loans (%) |
149.8 | 156.3 | 142.2 | 138.0 | 135.6 | |||||||||||||||
|
|
|
|
|
|
|
|
|
|
|
|||||||||||
| (1) | Comprises Provision for Expected Loss for Financial Guarantees Pledged R$ 1,191 million (R$ 1,907 million and R$ 1,580 million as of December 31, 2017 and 2016) and Commitments to be Released R$ 2,601 million (R$ 3,015 million and R$ 2,691 million as of December 31, 2017 and 2016). |
| (2) | Restated to take into account the effect of IFRS 9, which we retroactively adopted as of January 1, 2016. |
| (3) | The consolidated financial information as of and for the years ended December 31, 2015 and 2014 has been derived from our historical financial statements but was not restated for the retrospective application of IFRS 9 as management cannot be provided this financial information without unreasonable effort or expense. |
Impairment
The requirements for assessing the impairment of financial assets are based on an expected credit loss model.
The expected credit loss model includes the use of prospective information and classification of financial assets in three stages:
| • | Stage 1 – 12-month expected credit loss: represents default events possible within 12 months. Applicable to financial assets originated or purchased without credit recovery issues; |
| • | Stage 2 – Lifetime expected credit loss of financial instrument: considers all possible default events. Applicable to financial assets originated or purchased without credit recovery issues and which credit risk has increased significantly; and |
| • | Stage 3 – Credit loss expected for credit-impaired assets: considers all possible default events. Applicable to financial assets originated or purchased with credit recovery issues. The measurement of assets classified in this stage is different from Stage 2 due to the recognition of interest income by applying the effective interest rate at amortized cost (net of provision) rather than at the gross carrying amount. |
An asset will migrate from one stage to another as its credit risk increases or decreases. Therefore, a financial asset that began in Stage 1 and migrated to Stage 2 and 3 may return to Stage 1, unless it was originated or purchased with credit recovery issues.
99
Table of Contents
| Allowance for Loan and Leases Losses(3) |
12/31/2018 | 12/31/2017(1) | 12/31/2016(1) | 12/31/2015(2) | 12/31/2014(2) | |||||||||||||||
| (In millions of R$, except percentages) | ||||||||||||||||||||
| Amount Recognized in the Balance Sheet at the beginning of period |
36,469 | 34,525 | 32,033 | 22,392 | 22,235 | |||||||||||||||
| Write-offs |
(13,547 | ) | (16,437 | ) | (19,974 | ) | (20,065 | ) | (18,675 | ) | ||||||||||
| Individuals |
(8,520 | ) | (10,728 | ) | (12,103 | ) | (11,235 | ) | (12,668 | ) | ||||||||||
| Credit card |
(3,155 | ) | (3,891 | ) | (4,641 | ) | (4,055 | ) | (3,784 | ) | ||||||||||
| Personal loans |
(3,724 | ) | (5,190 | ) | (5,592 | ) | (5,221 | ) | (5,150 | ) | ||||||||||
| Payroll loans |
(1,336 | ) | (1,177 | ) | (1,151 | ) | (622 | ) | (429 | ) | ||||||||||
| Vehicles |
(283 | ) | (433 | ) | (671 | ) | (1,294 | ) | (3,254 | ) | ||||||||||
| Mortgage loans |
(22 | ) | (37 | ) | (48 | ) | (43 | ) | (51 | ) | ||||||||||
| Corporate |
(1,172 | ) | (956 | ) | (2,995 | ) | (4,321 | ) | (672 | ) | ||||||||||
| Small and Medium Businesses |
(2,471 | ) | (3,648 | ) | (3,862 | ) | (3,981 | ) | (4,992 | ) | ||||||||||
| Foreign Loans Latin America |
(1,384 | ) | (1,105 | ) | (1,014 | ) | (528 | ) | (343 | ) | ||||||||||
| Expense Recognized in the Income Statement |
10,587 | 18,381 | 22,466 | 24,517 | 18,832 | |||||||||||||||
| Amount Recognized in the Balance Sheet at the end of period |
33,509 | 36,469 | 34,525 | 26,844 | 22,392 | |||||||||||||||
| Effect of the initial adoption of IFRS 9 |
— | — | — | 5,189 | — | |||||||||||||||
| Amount Recognized in the Balance Sheet at the end of period with effect of the initial adoption of IFRS 9 |
— | — | — | 32,033 | — | |||||||||||||||
| Net Write-offs |
(13,547 | ) | (16,437 | ) | (19,974 | ) | (20,065 | ) | (18,675 | ) | ||||||||||
| Ratio of Write-offs during the period to average loans outstanding during the period (%) |
2.6 | 3.4 | 4.1 | 4.3 | 4.4 | |||||||||||||||
| Ratio of allowance for loan losses to total loans and leases (%) |
6.3 | 7.3 | 7.0 | 5.7 | 4.9 | |||||||||||||||
|
|
|
|
|
|
|
|
|
|
|
|||||||||||
| (1) | Restated to take into account the effect of IFRS 9, which we retroactively adopted as of January 1, 2016. |
| (2) | The consolidated financial information as of and for the years ended December 31, 2015 and 2014 has been derived from our historical financial statements but was not restated for the retrospective application of IFRS 9 as management cannot be provided this financial information without unreasonable effort or expense. |
| (3) | Receivables are partially written off based on an estimate of recovery on a portfolio level. The recovery of receivables partially written off is the recovery on a contract level adjusted by the reduction in the estimate of remaining receivables of the portfolio. As of December 31, 2018 the recovery of loans was R$951 million. According to the criteria applicable and published in our 2017 form 20-F write offs for 2017, 2016, 2015 and 2014 was respectively R$19,823 million, R$24,251 million, R$20,065 million and R$18,675 million. The recovery of loans for 2017, 2016, 2015 and 2014 was respectively R$3,698 million, R$3,742 million, R$4,779 million and R$5,054 million. |
During the year ended December 31, 2018, we wrote off a total amount of R$13,547 million from our loan portfolio and our ratio of the allowance for loan and lease losses to total loans and leases was 6.3%. The decrease in loans written off the previous year, is a result of the adoption of a policy of stricter selectivity in origination of credits.
During the year ended December 31, 2017, we wrote off a total amount of R$16,437 million from our loan portfolio and our ratio of the allowance for loan and lease losses to total loans and leases was 7.3%.
During the year ended December 31, 2016, we wrote off a total amount of R$19,974 million from our loan portfolio and our ratio of the allowance for loan and lease losses to total loans and leases was 7.0%.
During the year ended December 31, 2015, we wrote off a total amount of R$20,065 million from our loan portfolio and our ratio of the allowance for loan and lease losses to total loans and leases was 5.7%. The increase in loans written off from the prior year is due to the worsening macroeconomic scenario, mainly in Brazil.
During the year ended December 31, 2014, we wrote off a total amount of R$18,675 million from our loan portfolio and our ratio of the allowance for loan and lease losses to total loans and leases was 4.9%. The decrease in loans written off from the previous year from the prior year is a result of the adoption of a policy of stricter selectivity in origination, which gave rise to lower default levels compared to the previous year.
Allocation of the Allowance for Loan and Lease Losses
The table below presents the details, by segment and class, as defined in the segmentation of our portfolio, of the allowance for loan and lease losses, of this allowance as a percentage of the total loan and lease losses for the corresponding segment or class, and the percentage of the total loan and leases in each segment and class in relation to the total loans and leases.
100
Table of Contents
| 12/31/2018 | 12/31/2017(2) | 12/31/2016(2) | 12/31/2015(3) | 12/31/2014(3) | ||||||||||||||||||||||||||||||||||||||||||||||||||||||||
| Allocated allowance(1) |
Allocated allowance as a % of total loans and leases |
Loans category as a % of total loans |
Allocated allowance(1) |
Allocated allowance as a % of total loans and leases |
Loans category as a% of total loans |
Allocated allowance |
Allocated allowance as a % of total loans and leases |
Loans category as a % of total loans |
Allocated allowance |
Allocated allowance as a % of total loans and leases |
Loans category as a% of total loans |
Allocated allowance |
Allocated allowance as a % of total loans and leases |
Loans category as a% of total loans |
||||||||||||||||||||||||||||||||||||||||||||||
| (In millions of R$, except percentages) | ||||||||||||||||||||||||||||||||||||||||||||||||||||||||||||
| Individuals |
14,425 | 2.7 | 39.7 | 14,830 | 2.9 | 38.9 | 14,790 | 3.0 | 37.7 | 14,717 | 3.1 | 39.5 | 13,385 | 3.0 | 41.1 | |||||||||||||||||||||||||||||||||||||||||||||
| Credit card |
6,077 | 1.1 | 14.6 | 6,684 | 1.3 | 13.5 | 5,693 | 1.2 | 12.1 | 4,141 | 0.9 | 12.4 | 3,740 | 0.8 | 13.1 | |||||||||||||||||||||||||||||||||||||||||||||
| Personal loans |
5,447 | 1.0 | 5.5 | 5,138 | 1.0 | 5.5 | 6,038 | 1.2 | 5.6 | 8,330 | 1.7 | 6.0 | 7,024 | 1.6 | 6.2 | |||||||||||||||||||||||||||||||||||||||||||||
| Payroll loans |
2,279 | 0.5 | 8.8 | 2,368 | 0.5 | 9.0 | 2,284 | 0.5 | 9.1 | 1,319 | 0.3 | 9.6 | 1,107 | 0.2 | 9.0 | |||||||||||||||||||||||||||||||||||||||||||||
| Vehicles |
523 | 0.1 | 3.0 | 547 | 0.1 | 2.9 | 675 | 0.1 | 3.2 | 874 | 0.2 | 4.2 | 1,469 | 0.3 | 6.4 | |||||||||||||||||||||||||||||||||||||||||||||
| Mortgage loans |
99 | - | 7.8 | 93 | - | 8.0 | 100 | - | 7.7 | 53 | - | 7.3 | 45 | - | 6.4 | |||||||||||||||||||||||||||||||||||||||||||||
| Corporate |
9,367 | 1.7 | 19.1 | 11,452 | 2.3 | 21.6 | 11,089 | 2.2 | 24.6 | 6,459 | 1.4 | 32.2 | 3,114 | 0.7 | 32.5 | |||||||||||||||||||||||||||||||||||||||||||||
| Small and Medium Businesses |
4,532 | 0.8 | 12.8 | 5,404 | 1.1 | 12.1 | 6,366 | 1.3 | 12.1 | 4,809 | 1.0 | 13.9 | 5,158 | 1.1 | 15.2 | |||||||||||||||||||||||||||||||||||||||||||||
| Foreign Loans Latin America |
5,185 | 1.0 | 28.4 | 4,783 | 1.0 | 27.4 | 2,280 | 0.5 | 25.6 | 859 | 0.2 | 14.4 | 735 | 0.2 | 11.2 | |||||||||||||||||||||||||||||||||||||||||||||
| Total |
33,509 | 6.2 | 100.0 | 36,469 | 7.3 | 100.0 | 34,525 | 7.0 | 100.0 | 26,844 | 5.7 | 100.0 | 22,392 | 4.9 | 100.0 | |||||||||||||||||||||||||||||||||||||||||||||
|
|
|
|
|
|
|
|
|
|
|
|
|
|
|
|
|
|
|
|
|
|
|
|
|
|
|
|
|
|
|
|||||||||||||||||||||||||||||||
| (1) | Comprises Provision for Expected Loan for Financial Guarantees Pledged R$ 1,191 million (R$ 1,907 million and R$ 1,580 million as of December 31,2017 and 2016) and Commitments to be Released R$ 2,601 million (R$ 3,015 million and R$ 2,691 million as of December 31, 2017 and 2016). |
| (2) | Restated to take into account the effect of IFRS 9, which we retroactively adopted as of January 1, 2016. |
| (3) | The consolidated financial information as of and for the years ended December 31, 2015 and 2014 has been derived from our historical financial statements but was not restated for the retrospective application of IFRS 9 as management cannot be provided this financial information without unreasonable effort or expense. |
Renegotiated loans include both loans for which the corresponding credit agreement’s original terms were amended (amendments) and new loans originated in order to settle past due contracts or transactions with the same client (restructured loans). Amendments and restructured loans usually reflect changes in contract terms, rates or payment conditions.
Renegotiated loans return to non-performing and non-accrual status when they are 60 days past due under the renegotiated terms, which typically corresponds to the borrower missing two or more payments.
The fact that a loan or lease has been renegotiated is also taken into consideration when determining the allowance for loan and lease losses after the renegotiation. The past performance and the payment history of the client and the transaction, including the probability of another default for renegotiated transactions, are considered in our risk models in order to determine the probability of default. This probability of default is generally higher than the probability assigned to similar transactions that have never been renegotiated. Another factor considered in determining the appropriate level of the allowance for loan and lease losses is the additional collateral to be offered by the debtor. The resulting allowance levels are compatible with the risk profile of each transaction.
Our renegotiated loan portfolio decreased to 3.3% of our total loan portfolio as of December 31, 2018, compared to 3.8% as of December 31, 2017. At the end of 2018, the ratio of the renegotiated portfolio to the allowance for loan and lease losses was 36.2% compared to 36.0% as of December 31, 2017.
Our renegotiated loan portfolio increased to 3.8% of our total loan portfolio as of December 31, 2017, compared to 3.6% as of December 31, 2016. At the end of 2017, the ratio of the renegotiated portfolio to the allowance for loan and lease losses was 36.0% compared to 35.2% as of December 31, 2016.
Our renegotiated loan portfolio increased to 3.6% of our total loan portfolio as of December 31, 2016, compared to 3.1% as of December 31, 2015. At the end of 2016, the ratio of the renegotiated portfolio to the allowance for loan and lease losses was 35.2% compared to 46.8% as of December 31, 2015. This portfolio increased in 2016 due to the deteriorating macroeconomic scenario, mainly in Brazil, specifically in the corporate segment, and small and medium business segment as shown below in the table “Renegotiated loan and lease operations”.
Our renegotiated loan portfolio increased to 3.1% of our total loan portfolio as of December 31, 2015, compared to 2.6% as of December 31, 2014. At the end of 2015, the ratio of the renegotiated portfolio to the allowance for loan and lease losses was 46.8% compared to 47.2% as of December 31, 2014. This portfolio increased in 2015 due to the deteriorating macroeconomic scenario, mainly in Brazil, specifically in the corporate segment, as shown below in the table “Renegotiated loan and lease operations”.
Since 2013, we maintain our policy for the recovery of overdue loans, including loans already written off as losses, and to reduce losses, we enhanced our collection and recovery initiatives. We also adopted a policy of stricter selectivity in origination of loans, which led to lower levels of delinquency and a decreased volume of renegotiated loans.
101
Table of Contents
The tables below present an additional breakdown of renegotiated loans by portfolio, in segments and types, based on the type of modification, as of December 31, 2018, 2017 and 2016:
| As of December 31, 2018 | ||||||||||||||||
| Renegotiated loan and lease operations |
Stage 1 | Stage 2 | Stage 3 | Total | ||||||||||||
| (In millions of R$) | ||||||||||||||||
| Individuals |
259 | 545 | 6,495 | 7,299 | ||||||||||||
| Credit card |
114 | 155 | 9 | 278 | ||||||||||||
| Personal loans |
18 | 272 | 6,356 | 6,646 | ||||||||||||
| Payroll loans |
65 | 43 | 82 | 190 | ||||||||||||
| Vehicles |
59 | 6 | 12 | 77 | ||||||||||||
| Mortgage loans |
3 | 69 | 36 | 108 | ||||||||||||
| Corporate |
43 | 767 | 3,906 | 4,716 | ||||||||||||
| Small and medium businesses |
91 | 417 | 3,240 | 3,748 | ||||||||||||
| Foreign loans - Latin America |
139 | 697 | 1,116 | 1,952 | ||||||||||||
| Total renegotiated loan and lease operations |
532 | 2,426 | 14,757 | 17,715 | ||||||||||||
|
|
|
|
|
|
|
|
|
|||||||||
| As of December 31, 2017(1) | ||||||||||||||||
| Renegotiated loan and lease operations |
Stage 1 | Stage 2 | Stage 3 | Total | ||||||||||||
| (In millions of R$) | ||||||||||||||||
| Individuals |
303 | 565 | 7,309 | 8,177 | ||||||||||||
| Credit card |
188 | 221 | 25 | 434 | ||||||||||||
| Personal loans |
16 | 241 | 7,105 | 7,362 | ||||||||||||
| Payroll loans |
35 | 42 | 120 | 197 | ||||||||||||
| Vehicles |
63 | 6 | 24 | 93 | ||||||||||||
| Mortgage loans |
1 | 55 | 35 | 91 | ||||||||||||
| Corporate |
57 | 386 | 3,741 | 4,184 | ||||||||||||
| Small and medium businesses |
65 | 461 | 4,031 | 4,557 | ||||||||||||
| Foreign loans - Latin America |
82 | 550 | 1,234 | 1,866 | ||||||||||||
| Total renegotiated loan and lease operations |
507 | 1,962 | 16,315 | 18,784 | ||||||||||||
|
|
|
|
|
|
|
|
|
|||||||||
| (1) | Restated to take into account the effect of IFRS 9, which we retroactively adopted as of January 1, 2016. |
| As of December 31, 2016(1) | ||||||||||||||||
| Renegotiated loan and lease operations |
Stage 1 | Stage 2 | Stage 3 | Total | ||||||||||||
| (In millions of R$) | ||||||||||||||||
| Individuals |
140 | 683 | 8,190 | 9,013 | ||||||||||||
| Credit card |
60 | 272 | 2 | 334 | ||||||||||||
| Personal loans |
9 | 311 | 8,004 | 8,324 | ||||||||||||
| Payroll loans |
37 | 48 | 95 | 180 | ||||||||||||
| Vehicles |
33 | 10 | 61 | 104 | ||||||||||||
| Mortgage loans |
1 | 42 | 28 | 71 | ||||||||||||
| Corporate |
55 | 136 | 2,717 | 2,908 | ||||||||||||
| Small and medium businesses |
23 | 254 | 4,336 | 4,613 | ||||||||||||
| Foreign loans - Latin America |
41 | 451 | 934 | 1,426 | ||||||||||||
| Total renegotiated loan and lease operations |
259 | 1,524 | 16,177 | 17,960 | ||||||||||||
|
|
|
|
|
|
|
|
|
|||||||||
| (1) | Restated to take into account the effect of IFRS 9, which we retroactively adopted as of January 1, 2016. |
102
Table of Contents
Renegotiated Loans
The following tables present an additional breakdown of renegotiated loans and leases by segment and class, as of December 31, 2018, 2017 and 2016:
| As of December 31, 2018 | ||||||||||||||||||||
| Renegotiated loan and lease operations |
Impaired performing |
Non-impaired performing |
Impaired non-performing |
Non-impaired non-performing |
Total | |||||||||||||||
| (In millions of R$) | ||||||||||||||||||||
| Individuals |
3,367 | 672 | 3,129 | 131 | 7,299 | |||||||||||||||
| Credit card |
7 | 267 | 2 | 2 | 278 | |||||||||||||||
| Personal loans |
3,329 | 244 | 3,027 | 46 | 6,646 | |||||||||||||||
| Payroll loans |
28 | 99 | 55 | 8 | 190 | |||||||||||||||
| Vehicles |
- | 57 | 12 | 8 | 77 | |||||||||||||||
| Mortgage loans |
3 | 5 | 33 | 67 | 108 | |||||||||||||||
| Corporate |
2,459 | 748 | 1,447 | 62 | 4,716 | |||||||||||||||
| Small and medium businesses |
1,312 | 372 | 1,927 | 136 | 3,747 | |||||||||||||||
| Foreign loans - Latin America |
619 | 711 | 497 | 126 | 1,953 | |||||||||||||||
| Total renegotiated loan and lease operations |
7,757 | 2,503 | 7,000 | 455 | 17,715 | |||||||||||||||
|
|
|
|
|
|
|
|
|
|
|
|||||||||||
| As of December 31, 2017 (1) | ||||||||||||||||||||
| Renegotiated loan and lease operations |
Impaired performing |
Non-impaired performing |
Impaired non-performing |
Non-impaired non-performing |
Total | |||||||||||||||
| (In millions of R$) | ||||||||||||||||||||
| Individuals |
3,408 | 736 | 3,902 | 133 | 8,179 | |||||||||||||||
| Credit card |
22 | 401 | 4 | 8 | 435 | |||||||||||||||
| Personal loans |
3,325 | 207 | 3,780 | 51 | 7,363 | |||||||||||||||
| Payroll loans |
60 | 66 | 60 | 11 | 197 | |||||||||||||||
| Vehicles |
- | 60 | 24 | 9 | 93 | |||||||||||||||
| Mortgage loans |
1 | 2 | 34 | 54 | 91 | |||||||||||||||
| Corporate |
2,639 | 329 | 1,101 | 114 | 4,183 | |||||||||||||||
| Small and medium businesses |
1,445 | 365 | 2,586 | 161 | 4,557 | |||||||||||||||
| Foreign loans - Latin America |
637 | 551 | 597 | 80 | 1,865 | |||||||||||||||
| Total renegotiated loan and lease operations |
8,129 | 1,981 | 8,186 | 488 | 18,784 | |||||||||||||||
|
|
|
|
|
|
|
|
|
|
|
|||||||||||
| (1) | Restated to take into account the effect of IFRS 9, which we retroactively adopted as of January 1, 2016. |
| As of December 31, 2016 (1) | ||||||||||||||||||||
| Renegotiated loan and lease operations |
Impaired performing |
Non-impaired performing |
Impaired non-performing |
Non-impaired non-performing |
Total | |||||||||||||||
| (In millions of R$) | ||||||||||||||||||||
| Individuals |
3,491 | 676 | 4,699 | 146 | 9,012 | |||||||||||||||
| Credit card |
2 | 332 | - | - | 334 | |||||||||||||||
| Personal loans |
3,456 | 237 | 4,548 | 83 | 8,324 | |||||||||||||||
| Payroll loans |
32 | 72 | 63 | 12 | 179 | |||||||||||||||
| Vehicles |
- | 32 | 61 | 11 | 104 | |||||||||||||||
| Mortgage loans |
1 | 3 | 27 | 40 | 71 | |||||||||||||||
| Corporate |
2,085 | 163 | 632 | 29 | 2,909 | |||||||||||||||
| Small and medium businesses |
1,866 | 198 | 2,470 | 79 | 4,613 | |||||||||||||||
| Foreign loans - Latin America |
422 | 380 | 512 | 112 | 1,426 | |||||||||||||||
| Total renegotiated loan and lease operations |
7,864 | 1,417 | 8,313 | 366 | 17,960 | |||||||||||||||
|
|
|
|
|
|
|
|
|
|
|
|||||||||||
| (1) | Restated to take into account the effect of IFRS 9, which we retroactively adopted as of January 1, 2016. |
103
Table of Contents
| Year Ended December 31, | ||||||||||||||||||||
| 2018 | 2017(3) | 2016(3) | 2015(4) | 2014(4) | ||||||||||||||||
| (In millions of R$, except percentages) | ||||||||||||||||||||
| Renegotiated loans (1)(2) |
17,715 | 18,784 | 17,960 | 14,932 | 11,572 | |||||||||||||||
| Allowance for loan and lease losses |
6,414 | 6,756 | 6,315 | 6,991 | 5,459 | |||||||||||||||
| Allowance for loan and lease losses/renegotiated loans (%) |
36.2 | 36.0 | 35.2 | 46.8 | 47.2 | |||||||||||||||
|
|
|
|
|
|
|
|
|
|
|
|||||||||||
| (1) | Includes debt consolidation, deferment or any other arrangement that modifies the periods or conditions, of operations originally overdue. |
| (2) | Renegotiated Loans Overdue over 30 days. |
| (3) | Restated to take into account the effect of IFRS 9, which we retroactively adopted as of January 1, 2016. |
| (4) | The consolidated financial information as of and for the years ended December 31, 2015 and 2014 has been derived from our historical financial statements but was not restated for the retrospective application of IFRS 9 as management cannot be provided this financial information without unreasonable effort or expense. |
| As of December 31, 2018 | ||||||||||||||||||||
| Type of Loan |
Total Renegotiated Loans |
Total Allowance for Loan Losses |
Allowance for Loan Losses/ Renegotiated Loans (%) |
Total Redefaulted Renegotiated Loans(1) |
Redefaulted Renegotiated Loans (%) |
|||||||||||||||
| (In millions of R$, except percentages) | ||||||||||||||||||||
| Restructured Loans |
13,096 | 4,173 | 31.9 | 3,681 | 28.1 | |||||||||||||||
| Agreements |
4,619 | 2,241 | 48.5 | 1,292 | 28.0 | |||||||||||||||
| Total |
17,715 | 6,414 | 36.2 | 4,973 | 28.1 | |||||||||||||||
|
|
|
|
|
|
|
|
|
|
|
|||||||||||
| (1) | Our redefaulted renegotiated loans are renegotiated transactions 60 days or more overdue. |
| As of December 31, 2017(2) | ||||||||||||||||||||
| Type of Loan |
Total Renegotiated Loans |
Total Allowance for Loan Losses |
Allowance for Loan Losses/ Renegotiated Loans (%) |
Total Redefaulted Renegotiated Loans(1) |
Redefaulted Renegotiated Loans (%) |
|||||||||||||||
| (In millions of R$, except percentages) | ||||||||||||||||||||
| Restructured Loans |
15,011 | 5,102 | 34.0 | 4,740 | 31.6 | |||||||||||||||
| Agreements |
3,773 | 1,654 | 43.8 | 693 | 18.4 | |||||||||||||||
| Total |
18,784 | 6,756 | 36.0 | 5,433 | 28.9 | |||||||||||||||
|
|
|
|
|
|
|
|
|
|
|
|||||||||||
| (1) | Our redefaulted renegotiated loans are renegotiated transactions 60 days or more overdue. |
| (2) | Restated to take into account the effect of IFRS 9, which we retroactively adopted as of January 1, 2016. |
| As of December 31, 2016(2) | ||||||||||||||||||||
| Type of Loan |
Total Renegotiated Loans |
Total Allowance for Loan Losses |
Allowance for Loan Losses/ Renegotiated Loans (%) |
Total Redefaulted Renegotiated Loans(1) |
Redefaulted Renegotiated Loans (%) |
|||||||||||||||
| (In millions of R$, except percentages) | ||||||||||||||||||||
| Restructured Loans |
15,887 | 5,605 | 35.3 | 5,348 | 33.7 | |||||||||||||||
| Agreements |
2,073 | 710 | 34.2 | 372 | 17.9 | |||||||||||||||
| Total |
17,960 | 6,315 | 35.2 | 5,720 | 31.8 | |||||||||||||||
|
|
|
|
|
|
|
|
|
|
|
|||||||||||
| (1) | Our redefaulted renegotiated loans are renegotiated transactions 60 days or more overdue. |
| (2) | Restated to take into account the effect of IFRS 9, which we retroactively adopted as of January 1, 2016. |
The table below presents the changes in our loan and lease portfolio with loss event, including the changes of the renegotiated loans and leases with loss event related to each year as of December 31, 2018, 2017 and 2016:
| Impaired loans |
2018 | 2017(1) | 2016(1) | |||||||||
| (In millions of R$) | ||||||||||||
| Balance at the beginning of the period |
44,439 | 45,455 | 35,338 | |||||||||
| (+) Loan operations added |
27,215 | 30,861 | 42,168 | |||||||||
| (-) Loans removed due to write-off |
(13,547 | ) | (16,437 | ) | (19,974 | ) | ||||||
| (-) Loans removed due to total or partial pay-off |
(18,536 | ) | (15,440 | ) | (12,077 | ) | ||||||
| Balance at the end of the period |
39,571 | 44,439 | 45,455 | |||||||||
|
|
|
|
|
|
|
|||||||
| (1) | Restated to take into account the effect of IFRS 9, which we retroactively adopted as of January 1, 2016. |
104
Table of Contents
Please see “Note 10 – Loan Operations and Lease Operations Portfolio” to our audited consolidated financial statements for further details.
Cross border outstanding
Cross border outstanding are monetary assets which are denominated in non-local currency and exceeded 1% of our total assets in the case of transactions with foreign clients entered into by our subsidiaries in the United Kingdom, the Cayman Islands, the Bahamas and Chile. The aggregate cross border outstanding breakdown of these subsidiaries for the periods indicated below is as follows:
| Cross border outstanding |
12/31/2018 | % | 12/31/2017 | % | 12/31/2016 | % | ||||||||||||||||||
| (In millions of R$, except percentages) | ||||||||||||||||||||||||
| Cash and deposits on demand |
32,104 | 2.1 | 42,570 | 3.0 | 41,234 | 3.1 | ||||||||||||||||||
| Interbank deposits |
97,069 | 6.3 | 115,396 | 8.0 | 97,934 | 7.2 | ||||||||||||||||||
| Securities purchased under agreements to resell |
17,453 | 1.1 | 17,954 | 1.3 | 22,267 | 1.6 | ||||||||||||||||||
| Central Bank compulsory deposits |
2 | 0.0 | 1,966 | 0.1 | 266 | 0.0 | ||||||||||||||||||
| Financial assets held for trading and designated at fair value through profit or loss |
28,691 | 1.8 | 9,844 | 0.7 | 12,121 | 0.9 | ||||||||||||||||||
| Derivatives |
27,638 | 1.8 | 14,897 | 1.0 | 10,153 | 0.8 | ||||||||||||||||||
| Financial assets at Fair Value Through Other Comprehensive Income |
66,985 | 4.3 | 59,387 | 4.1 | 47,002 | 3.5 | ||||||||||||||||||
| Financial assets at amortized cost |
19,760 | 1.3 | 9,633 | 0.7 | 12,595 | 0.9 | ||||||||||||||||||
| Loan and lease operations |
63,460 | 4.1 | 51,275 | 3.6 | 59,667 | 4.4 | ||||||||||||||||||
| Total outstanding |
353,162 | 22.8 | 322,922 | 22.5 | 303,239 | 22.4 | ||||||||||||||||||
|
|
|
|
|
|
|
|
|
|
|
|
|
|||||||||||||
The aggregate cross border outstanding breakdown by country of these subsidiaries for the periods indicated below is as follows:
| Cross border outstanding by country* |
12/31/2018 | % | 12/31/2017 | % | 12/31/2016 | % | ||||||||||||||||||
| (In millions of R$, except percentages) | ||||||||||||||||||||||||
| Bahamas |
185,931 | 12.0 | 164,441 | 11.5 | 165,341 | 12.2 | ||||||||||||||||||
| Cayman |
113,555 | 7.3 | 119,484 | 8.3 | 106,581 | 7.9 | ||||||||||||||||||
| United Kingdom |
30,842 | 2.0 | 21,319 | 1.5 | 16,557 | 1.2 | ||||||||||||||||||
| Chile |
22,834 | 1.5 | 17,678 | 1.2 | 14,760 | 1.1 | ||||||||||||||||||
| Total outstanding |
353,162 | 22.8 | 322,922 | 22.5 | 303,239 | 22.4 | ||||||||||||||||||
|
|
|
|
|
|
|
|
|
|
|
|
|
|||||||||||||
|
(*) Uruguay is the only country whose outstandings are between 0.75% and 1% of our total assets.The aggregate amounts of this country for each period are disclosed as follows:
|
| |||||||||||||||||||||||
| Uruguay |
13,932 | 0.9 | 11,355 | 0.79 | 11,634 | 0.86 | ||||||||||||||||||
Liabilities
Funding
Main sources
Our current funding strategy is to continue to use all of our sources of funds in accordance with their costs and availability and our general asset and liability management strategy. In order to fund our operations, we intensified the use of the liquidity generated by savings deposits, interbank deposits, debt in the interbank market and debt in the institutional market during 2018, 2017 and 2016.
We also used Brazilian debentures subject to repurchase as a source of funding, reported as deposits received under securities repurchase agreements and offered to institutional clients as well as private banking, corporate banking and retail clients. This funding is designed to provide increased profitability through higher spreads in our savings deposits and higher fees earned on market funds.
Our ability to obtain funding depends on several factors, including credit ratings, general economic conditions and investors’ perception of emerging markets in general and of Brazil (particularly, current political and economic conditions in Brazil and government regulations for foreign currency funding).
Part of our long-term debt provides for the advance payment of the outstanding principal balance upon the occurrence of certain facts, as is customary for long-term financing agreements. As of December 31, 2018, none of these events, including default events and non compliance with any financial covenant, had occurred, and we have no reason to believe that any of these events are likely to occur in 2019.
105
Table of Contents
Our main sources of funding are our deposits, which are split into demand deposits, savings deposits, time deposits and interbank deposits. As of December 31, 2018, total deposits were R$463,424 million, which represented 45.3% of total funding. As of December 31, 2017, total deposits amounted to R$402,938 million, representing 42.9% of total funding. As of December 31, 2016, total deposits amounted to R$329,414 million, representing 36.4% of our total funding. Our time deposits represent one of our major sources of funding which, as of December 31, 2018, 2017 and 2016 accounted for 24.6%, 22.6% and 17.3% of total funding, respectively.
The table below shows the breakdown of our main sources of funds as of December 31, 2018, 2017 and 2016:
| Breakdown of the main sources of funds |
2018 | % of total funding |
2017(*) | % of total funding |
2016(*) | % of total funding |
||||||||||||||||||
| (In millions of R$, except percentages) | ||||||||||||||||||||||||
| Deposits |
463,424 | 45.4 | 402,938 | 42.9 | 329,414 | 36.5 | ||||||||||||||||||
| Demand deposits |
72,581 | 7.1 | 68,973 | 7.3 | 61,133 | 6.8 | ||||||||||||||||||
| Savings accounts |
136,865 | 13.4 | 119,980 | 12.8 | 108,250 | 12.0 | ||||||||||||||||||
| Time deposits |
251,300 | 24.6 | 211,800 | 22.6 | 156,274 | 17.3 | ||||||||||||||||||
| Interbank |
2,675 | 0.3 | 2,182 | 0.2 | 3,757 | 0.4 | ||||||||||||||||||
| Other deposits |
3 | 0,0 | 3 | 0,0 | - | 0,0 | ||||||||||||||||||
| Securities sold under repurchase agreements |
330,237 | 32.3 | 312,634 | 33.3 | 349,164 | 38.6 | ||||||||||||||||||
| Interbank market debt |
134,670 | 13.2 | 124,587 | 13.4 | 129,648 | 14.3 | ||||||||||||||||||
| Real estate credit bills |
9,546 | 0.9 | 18,525 | 2.0 | 19,179 | 2.1 | ||||||||||||||||||
| Agribusiness credit bills |
18,013 | 1.8 | 15,101 | 1.6 | 15,442 | 1.7 | ||||||||||||||||||
| Financial credit bills |
37,928 | 3.7 | 27,691 | 3.0 | 19,566 | 2.2 | ||||||||||||||||||
| Guaranteed real state notes |
1,227 | 0.1 | - | 0,0 | - | 0,0 | ||||||||||||||||||
| Import and export Financing |
50,050 | 4.9 | 39,089 | 4.2 | 45,633 | 5.0 | ||||||||||||||||||
| Onlending-domestic |
17,906 | 1.8 | 24,181 | 2.6 | 29,828 | 3.3 | ||||||||||||||||||
| Institutional market debt |
93,974 | 9.1 | 98,482 | 10.4 | 96,239 | 10.6 | ||||||||||||||||||
| Subordinated debt |
49,313 | 4.8 | 52,696 | 5.5 | 57,420 | 6.3 | ||||||||||||||||||
| Foreign borrowings through securities |
41,863 | 4.0 | 41,400 | 4.4 | 33,583 | 3.7 | ||||||||||||||||||
| Structured Operations Certificates |
2,798 | 0.3 | 4,386 | 0.5 | 5,236 | 0.6 | ||||||||||||||||||
| Total |
1,022,305 | 100.0 | 938,641 | 100.0 | 904,465 | 100.0 | ||||||||||||||||||
|
|
|
|
|
|
|
|
|
|
|
|
|
|||||||||||||
| (*) | Restated to take into account the effect of IFRS 9, which we retroactively adopted as of January 1, 2016. |
Deposits by maturity
The table below shows the maturity profile of our deposits as of December 31, 2018, 2017 and 2016:
| Deposits by maturity |
2018 | |||||||||||||||||||
| 0-30 days | 31-180 days | 181-365 days | Over 365 days | Total | ||||||||||||||||
| (In millions of R$) | ||||||||||||||||||||
| Non-interest bearing deposits |
72,584 | - | - | - | 72,584 | |||||||||||||||
| Demand deposits |
72,581 | 72,581 | ||||||||||||||||||
| Other deposits |
3 | 3 | ||||||||||||||||||
| Interest bearing deposits |
176,329 | 36,857 | 22,062 | 155,592 | 390,840 | |||||||||||||||
| Savings accounts |
136,865 | - | - | - | 136,865 | |||||||||||||||
| Time deposits |
37,784 | 36,211 | 21,919 | 155,386 | 251,300 | |||||||||||||||
| Interbanks |
1,680 | 646 | 143 | 206 | 2,675 | |||||||||||||||
| Total |
248,913 | 36,857 | 22,062 | 155,592 | 463,424 | |||||||||||||||
|
|
|
|
|
|
|
|
|
|
|
|||||||||||
| Deposits by maturity |
2017 | |||||||||||||||||||
| 0-30 days | 31-180 days | 181-365 days | Over 365 days | Total | ||||||||||||||||
| (In millions of R$) | ||||||||||||||||||||
| Non-interest bearing deposits |
68,976 | - | - | - | 68,976 | |||||||||||||||
| Demand deposits |
68,973 | 68,973 | ||||||||||||||||||
| Other deposits |
3 | 3 | ||||||||||||||||||
| Interest bearing deposits |
147,867 | 33,258 | 23,238 | 129,599 | 333,962 | |||||||||||||||
| Savings accounts |
119,980 | - | - | - | 119,980 | |||||||||||||||
| Time deposits |
27,799 | 32,350 | 22,569 | 129,082 | 211,800 | |||||||||||||||
| Interbanks |
88 | 908 | 669 | 517 | 2,182 | |||||||||||||||
| Total |
216,843 | 33,258 | 23,238 | 129,599 | 402,938 | |||||||||||||||
|
|
|
|
|
|
|
|
|
|
|
|||||||||||
106
Table of Contents
| Deposits by maturity |
2016 | |||||||||||||||||||
| 0-30 days | 31-180 days | 181-365 days | Over 365 days | Total | ||||||||||||||||
| (In millions of R$) | ||||||||||||||||||||
| Non-interest bearing deposits |
61,133 | - | - | - | 61,133 | |||||||||||||||
| Demand deposits |
61,133 | - | - | - | 61,133 | |||||||||||||||
| Interest bearing deposits |
139,982 | 30,166 | 17,734 | 80,399 | 268,281 | |||||||||||||||
| Savings accounts |
108,250 | - | - | - | 108,250 | |||||||||||||||
| Time deposits |
30,555 | 28,248 | 17,109 | 80,362 | 156,274 | |||||||||||||||
| Interbanks |
1,177 | 1,918 | 625 | 37 | 3,757 | |||||||||||||||
| Total |
201,115 | 30,166 | 17,734 | 80,399 | 329,414 | |||||||||||||||
|
|
|
|
|
|
|
|
|
|
|
|||||||||||
The table below sets forth the maturity of outstanding time deposits with balances in excess of US$100,000 (or its equivalent) issued by us as of December 31, 2018, 2017 and 2016:
| (In millions of R$) |
2018 | 2017 | 2016 | |||||||||||||||||||||||||||||||||
| Domestic | Foreign | Total | Domestic | Foreign | Total | Domestic | Foreign | Total | ||||||||||||||||||||||||||||
| Maturity within three months |
2,415 | 46,757 | 49,172 | 37,622 | 37,622 | 30,560 | 30,560 | |||||||||||||||||||||||||||||
| Maturity after three months to six months |
1,750 | 18,810 | 20,560 | 13,541 | 13,541 | 11,124 | 11,124 | |||||||||||||||||||||||||||||
| Maturity after six months to twelve months |
5,045 | 24,830 | 29,875 | 15,484 | 15,484 | 12,509 | 12,509 | |||||||||||||||||||||||||||||
| Maturity after twelve months |
82,072 | 9,259 | 91,331 | 58,561 | 8,657 | 67,218 | 23,085 | 12,082 | 35,167 | |||||||||||||||||||||||||||
| Total time deposits in excess of US$100,000 |
91,282 | 99,656 | 190,938 | 58,561 | 75,304 | 133,865 | 23,085 | 66,275 | 89,360 | |||||||||||||||||||||||||||
|
|
|
|
|
|
|
|
|
|
|
|
|
|
|
|
|
|
|
|||||||||||||||||||
The following table sets forth the mix of the individual and corporate time deposits divided among our retail, Itaú Personnalité, middle market and corporate markets (each expressed as a percentage of total time deposits) as of December 31, 2018, 2017 and 2016:
| 2018 | 2017 | 2016 | ||||||||||
| (%) | ||||||||||||
| Retail |
10.5 | 11.6 | 8.1 | |||||||||
| Itaú Personnalité |
28.8 | 23.4 | 14.3 | |||||||||
| Middle market |
27.9 | 24.5 | 39.7 | |||||||||
| Corporate |
31.0 | 38.2 | 32.5 | |||||||||
| Institutional |
1.8 | 2.3 | 5.4 | |||||||||
| Total |
100.0 | 100.0 | 100.0 | |||||||||
|
|
|
|
|
|
|
|||||||
Other sources
We also act as a financial agent in borrowing funds from BNDES and FINAME, and lending such funds at a spread determined by the Brazilian government to targeted sectors of the economy. We obtain U.S. dollar-denominated lines of credit from our affiliates, including Itaú Unibanco Holding – Grand Cayman branch, Banco Itaú Chile and Itaú BBA S.A. – Nassau branch to provide trade finance funding for Brazilian companies. For further details on domestic lending and import and export financing, please see “Note 17 – Securities Sold under Repurchase Agreements and Interbank and Institutional Market Debts” to our audited consolidated financial statements.
Short-term borrowings
Short-term borrowings are included in our balance sheet under the “Securities sold under repurchase agreement” line item. The main category for short-term borrowings is “Deposits Received under Securities Repurchase Agreements with Own and Third-Party Financial Assets”. The table below shows our short-term borrowings as of December 31, 2018, 2017 and 2016:
| As of December 31, | ||||||||||||
| Securities sold under repurchase agreements |
2018 | 2017 | 2016 | |||||||||
| (In millions of R$, except percentages) |
||||||||||||
| Amount outstanding |
330,237 | 312,634 | 349,164 | |||||||||
| Maximum amount outstanding during the period |
332,297 | 346,518 | 358,781 | |||||||||
| Weighted average interest rate at period-end (%) |
6.7 | 9.4 | 12.1 | |||||||||
| Average amount outstanding during period |
308,306 | 328,721 | 339,416 | |||||||||
| Weighted average interest rate (%) |
6.5 | 7.0 | 11.9 | |||||||||
|
|
|
|
|
|
|
|||||||
107
Table of Contents
| 4C. | Organizational Structure |
We are a financial holding company controlled by IUPAR, a holding company jointly controlled by Itaúsa and E. Johnston. Itaúsa and Cia. E. Johnston. Itaúsa is controlled by members of the Egydio de Souza Aranha family, and Cia. E. Johnston is controlled by members of the Moreira Salles family. See “Item 7A. Major Stockholders” for further information. For further information about our significant subsidiaries as of December 31, 2018, see Exhibit 8.1 to this annual report.
| 4D. | Property, Plant and Equipment |
As of December 31, 2018, we owned and leased our principal administrative offices, which include office buildings in 10 different addresses, comprising a total area of 446,050 square meters, located primarily in São Paulo, Brazil. Such offices include our head office, and a number of other administrative buildings, where administrative functions are performed, such as commercial departments, back offices, wholesale and investment bank activities, and also our data processing center.
We also lease part of our administrative offices and most of our bank branches at competitive, market prices through renewable leases with terms ending from the first half of 2018 (currently undergoing renewal under similar terms and conditions) to the first half of 2037.
As of December 31, 2018, we owned approximately 32% of our administrative offices and branches (including electronic service points, banking sites and parking lots) and leased approximately 68%.
| ITEM 4A. | UNRESOLVED STAFF COMMENTS |
None.
| ITEM 5. | OPERATING AND FINANCIAL REVIEW AND PROSPECTS |
The following discussion should be read in conjunction with our audited consolidated financial statements and accompanying notes and other financial information included elsewhere in this annual report, and in conjunction with the information included under “Item 3A. Selected Financial Data” and “Item 4B. Business Overview – Selected Statistical Information.” The following discussion contains forward-looking statements that involve risks and uncertainties. Our actual results may differ materially from these discussed in forward-looking statements as a result of various factors, including those set in forth in “Forward-Looking Statements” and “Item 3D. Risk Factors.”
| 5A. | Operating Results |
Factors Affecting Our Results of Operations
Our results of operations are affected by, among others, the following factors:
Macroeconomic Context
Global Context
Global economic activity has slowed somewhat, but continued to perform well. U.S. real GDP has accelerated to 2.9% in the year ended December 31, 2018, after expanding at a rate of 2.2% in 2017. However, the GDP growth of the Eurozone, Japan, China and other emerging markets has been gradually slowing.
In the Eurozone, real GDP growth decelerated to 1.8% in 2018, after expanding at a rate of 2.4% in 2017. Political uncertainty in the region remains high with government instability in the major economies and Brexit negotiations. Immigration continues to be a longer-term issue for the region.
108
Table of Contents
The U.S. Federal Reserve has raised the target range for the Federal Funds Rate nine times since the Federal Open Market Committee meeting in December 2015. In addition, the Federal Open Market Committee has been reducing its balance sheet by allowing its portfolio of U.S. treasury securities and U.S government agency debt securities to mature without replacing them. The U.S. economic outlook remains positive, but tighter monetary and financial conditions suggest that U.S. GDP growth may decelerate in 2019. As such, the Federal Open Market Committee has stated that it will be patient before deciding to make further adjustments to its monetary policy stance.
International capital flows have become more available to emerging markets since mid-2016 with better balance of the risks to the world economic outlook, as some emerging markets improved their economic fundamentals and commodity prices stabilized. However, U.S.-China trade negotiations could lead to a sharper slowdown in China’s growth, European political uncertainty could lead to a recession in Europe, and Turkey and Argentina still need reforms amid fragile political environments.
Supported by solid domestic demand, the economic expansion in the U.S. is expected to continue at a moderate pace, according to the Survey of Professional Forecasters issued by the Federal Reserve Bank of Philadelphia, given the (i) accommodative monetary and fiscal policies; (ii) optimistic sentiment among consumers and businesses, according to the January 2019 survey data published by the Conference Board and the Institute for Supply Management, respectively; and (iii) a healthy labor market, with net job increases averaging 234,000 per month in the twelve months ended January 31, 2019 and the U.S. unemployment rate of 4.0% in January 2019.
China’s real GDP grew by 6.6% in 2018, down 0.2 percentage points compared to 6.8% in 2017. A trade deal with the U.S. (if implemented) and fiscal and monetary stimuli are expected to stabilize growth in the second quarter of 2019.
Latin America Context
Economic growth remains fragile in the region, with Chile and Peru performing better than the other economies of the region. Still, given the trade openness of both economies, it is unlikely that the decoupling from the rest of the globe will be sustained. Mexico’s economy is also losing momentum due to weaker growth in the U.S. In Argentina, the recession remains deep, as a result of lower real wages, tight macro policies and weak agriculture production.
Below-potential growth combined with a looser monetary policy stance by the US Fed are expected to lead central banks in the region to postpone interest rate hikes and we do not expect interest rates to change during the first half of 2019.
The table below shows the real GDP growth rates in seven Latin American countries as of and for the years ended December 31, 2018, 2017, 2016, 2015 and 2014, except as otherwise indicated.
| Real GDP Growth |
As of and for the Year Ended December 31, |
|||||||||||||||||||
| 2018 | 2017 | 2016 | 2015 | 2014 | ||||||||||||||||
| (%) | ||||||||||||||||||||
| Argentina(1) |
(0.1 | )* | 2.9 | (1.8 | ) | 2.7 | (2.5 | ) | ||||||||||||
| Chile(2) |
4.0 | 1.5 | 1.3 | 2.3 | 1.8 | |||||||||||||||
| Colombia(3) |
2.7 | 1.4 | 2.1 | 3.0 | 4.7 | |||||||||||||||
| Mexico(4) |
2.0 | 2.0 | 2.9 | 3.3 | 2.8 | |||||||||||||||
| Paraguay(5) |
4.6 | * | 4.8 | 4.3 | 3.1 | 4.9 | ||||||||||||||
| Peru(6) |
4.0 | 2.5 | 4.0 | 3.3 | 2.4 | |||||||||||||||
| Uruguay(7) |
2.2 | * | 2.7 | 1.7 | 0.4 | 3.2 | ||||||||||||||
|
|
|
|
|
|
|
|
|
|
|
|||||||||||
* As of and for the twelve months ended September 30, 2018.
| (1) | Source: Instituto Nacional de Estadística y Censos |
| (2) | Source: Banco Central de Chile. |
| (3) | Source: Banco de la República. |
| (4) | Source: Instituto Nacional de Estadística y Geografía. |
| (5) | Source: Banco Central del Paraguay. GDP |
| (6) | Source: Banco Central de Reserva del Perú. |
| (7) | Source: Banco Central de Uruguay. |
109
Table of Contents
Brazilian Context
As a Brazilian bank with most of our operations in Brazil, we are significantly affected by the economic, political and social conditions in the country. From 2004 to 2013, we benefited from Brazil’s generally stable economic environment, with average annual GDP growth of approximately 4.0% during that period, which led to increased bank lending and deposits. The following years were less favorable, as GDP growth slowed to 0.5% in 2014 then decreased by 3.5% in 2015 and 3.3% in 2016. The Brazilian economy showed signs of a recovery in 2017, as GDP increased by 1.1%. In the year ended December 31, 2018, GDP expanded 1.1%.

The widespread decline in inflation, due to the high level of idle capacity in the Brazilian economy and anchored inflation expectations, created an opportunity for the Central Bank to start a monetary easing cycle. After reaching 14.25% per annum at the end of 2015, the Central Bank began to cut interest rates in October 2016. In March 2018, the SELIC rate reached 6.5% where it currently remains. Bank lending as a proportion of GDP increased to 47.4% in December 2018 from 47.2% in December 2017.

Source: Itaú Unibanco Holding and Central Bank.
110
Table of Contents
Inflation reached 3.7% in the year ended December 31, 2018, up from 2.9% in the year ended December 31, 2017. Government-regulated prices (such as gasoline, health insurance, medicines, electricity, urban bus and others) increased by 6.2% in 2018 (from 8.0% in 2017), while market-set prices increased by 2.9% in the same period (from 1.3% in 2017).

The Brazilian primary public budget result has been in deficit since 2014. Cuts in discretionary spending and tax hikes proved insufficient to offset the drop in tax revenues and growth in mandatory expenditures. The twelve-month Brazilian primary public budget balance deficit ended 2018 at 1.6% of GDP, after closing with a deficit of 1.7% of GDP in 2017, 2.5% of GDP in 2016, 1.9% of GDP in 2015 and 0.6% of GDP in 2014. To tackle the structural fiscal imbalance, the Brazilian Congress approved a ceiling on government spending that will limit primary public expenditure growth to the prior year’s inflation for a period of at least 10 years, representing a structural reform for the Brazilian economy. Social security reform and other reforms are essential to ensure that the spending ceiling remains feasible in the years ahead, but their approval by the Brazilian Congress is uncertain. These reforms are important steps towards returning to primary surpluses and stabilizing public debt in the medium-term.
In addition, Brazil has implemented a large number of regulatory changes, such as changes in reserve and capital requirements for financial institutions, as well as other macro-prudential policies. Please refer to the section “Item 4B. Business Overview—Regulatory Environment—Basel III Framework—Implementation of Basel III in Brazil” and to the section “Item 4B. Business Overview—Selected Statistical Information—Securities Portfolio—Compulsory Reserve Deposits with the Central Bank” for further details.
Total outstanding loans provided by Brazilian financial institutions increased in year-over-year real terms in December 2018, by 1.6%, after a decrease of 3.3% in December 2017. Total new loans increased by 7.7% as of December 31, 2018, when compared to a decrease of 0.2% as of December 31, 2017, both on an annualized basis. The rate of non-performing household loans decreased by 0.2 percentage points to 3.5% as of December 31, 2018 when compared with the same month in 2017. The rate of non-performing loans to non-financial corporations reached 2.4% in December 2018, below the level observed in December 2017 (2.9%).
The Brazilian real depreciated against the U.S. dollar, with the exchange rate reaching R$3.88 per US$1.00 as of December 31, 2018, compared to R$3.31 per US$1.00 as of December 29, 2017. Both international and domestic economic conditions were more volatile in 2018 when compared to 2017.

Source: Itaú Unibanco Holding and Central Bank.
111
Table of Contents
Brazil’s current account deficit (comprised of the net balance from the trade of goods and services and international transfers) totaled 0.8% of GDP as of December 31, 2018. Brazil has maintained its external solvency, with US$375 billion in international reserves and US$316 billion in external debt as of December 31, 2017.
The table below shows real GDP growth, the inflation rate, exchange rate variation and interest rates in Brazil as of and for the twelve-month period ended December 31, 2018, 2017, 2016, 2015 and 2014, except as otherwise indicated.
| As of and for the Year Ended December 31, | ||||||||||||||||||||
| 2018 | 2017 | 2016 | 2015 | 2014 | ||||||||||||||||
| (%) | ||||||||||||||||||||
| Real GDP growth(1) |
1.1 | 1.1 | (3.3 | ) | (3.5 | ) | 0.5 | |||||||||||||
| Inflation rate—IGP-DI(2) |
7.1 | (0.4 | ) | 7.2 | 10.7 | 3.8 | ||||||||||||||
| Inflation rate—IPCA(3) |
3.7 | 2.9 | 6.3 | 10.7 | 6.4 | |||||||||||||||
| Exchange rate variation (R$/US$)(4) |
13.5 | 1.5 | (16.5 | ) | 47.0 | 13.4 | ||||||||||||||
| TR (reference interest rate)(5) |
0.00 | 0.00 | 1.98 | 2.07 | 1.01 | |||||||||||||||
| CDI (interbank interest rate)(6) |
6.40 | 6.99 | 13.63 | 14.14 | 11.51 | |||||||||||||||
| SELIC (overnight interest rate)(6) |
6.40 | 7.00 | 13.65 | 14.15 | 11.58 | |||||||||||||||
| Sovereign 5-year CDS(7) |
207.9 | 162.0 | 280.8 | 494.9 | 200.8 | |||||||||||||||
| (1) | Source: Instituto Brasileiro de Geografia e Estatística, or IBGE. |
| (2) | Source: General Price Index – Internal Supply (Índice Geral de Preços – Disponibilidade Interna, or IGP-DI) published by the Fundação Getulio Vargas. |
| (3) | Source: Extended National Consumer Price Index (Índice de Preços ao Consumidor Amplo, or IPCA) published by IBGE. |
| (4) | Source: Bloomberg (cumulative rates for the period); positive numbers mean depreciation of the Brazilian real. |
| (5) | Source: Mortgage reference rate (Taxa Referencial, or TR) published by the Central Bank. Data presented in percentage per year. |
| (6) | Source: Central Bank. Data presented in percentage per year. |
| (7) | Source: Bloomberg (period-end). Sovereign credit default swaps or CDS is a measure of country risk (and is measured using basis points). |
Significant Accounting Policies
General Information
The preparation of our audited consolidated financial statements involves certain assumptions that are based on our historical experience and other factors that we deem reasonable and material. Although we review these estimates and assumptions in the ordinary course of business, the presentation of our financial condition and results of operations often requires our management to make judgments regarding the effects of matters that are uncertain by nature on our financial condition and results of operations. The following section describes those aspects that require significant judgment or involve a higher degree of complexity in the application of the accounting policies that currently affect our financial condition and results of operations. The accounting estimates we make in these contexts involve making assumptions about highly uncertain matters and actual results may differ from those estimated based on different variables, assumptions or conditions.
Use of Estimates and Assumptions
The preparation of the audited consolidated financial statements in accordance with IFRS requires management to make estimates and assumptions that affect the reported amounts of assets and liabilities at the date of the audited consolidated financial statements, as well as the reported amounts of revenue, expenses and gains and losses during the reporting period because the actual results may differ from those determined based on such estimates and assumptions.
All estimates and assumptions made by management are in accordance with IFRS and represent our best estimates made in conformity with applicable standards. Estimates and judgments are evaluated on an ongoing basis and are based on past experience and other factors.
Please see “Note 2.3 – Critical Accounting Estimates and Judgments” to our audited consolidated financial statements for further details.
Transition to IFRS 9
We adopted the requirements of IFRS 9 Financial Instruments, which became effective on January 1, 2018 and applied the new standard retrospectively from January 1, 2016, resulting in the restatements of our audited consolidated financial statements for the years ended December 31, 2016, 2017 and 2018. We continue to apply the requirements of IAS 39 for hedge accounting.
112
Table of Contents
The main changes identified by us due to the adoption of IFRS 9 are related to the classification, measurement and impairment of financial assets. The impact of transitioning to IFRS 9 at January 1, 2016 on our audited consolidated financial statements was a decrease in net assets of R$ 2.6 billion, arising from:
| • | A decrease of R$ 4.6 billion from additional impairment allowance. |
| • | A decrease of R$ 0.7 billion from the remeasurement of financial assets due to classification changes resulting from the new categories introduced by IFRS 9. |
| • | An increase in net deferred tax assets of R$ 2.5 billion. |
| • | An increase of R$ 0.2 billion on the interest of non-controlling stockholders. |
Further information on new classification requirements and accounting policies adopted is detailed in “Note 2.4 – Summary of main accounting practices” to our audited consolidated financial statements.
Derivative Instruments that Qualify for Hedge Accounting
Hedging transactions may be classified into three categories: Fair value hedge, Cash flow hedge, and Hedge of net investment in foreign operations:
| • | Fair value hedge: is aimed at protecting us against changes in market risk due to changes in the fair value of interest subject to variable rates. |
| • | Cash flow hedge: is aimed at protecting us against future cash flows of payments of interest. |
| • | Hedge of net investment of foreign operations: it is aimed at protecting us against changes in future cash flows of foreign exchange variations in net investments of foreign operations. |
Please see “Item 11. Quantitative and Qualitative Disclosures about Market Risk—Market and Liquidity Risk” for further details about hedge accounting.
Please see “Note 7 – Hedge Accounting” to our audited consolidated financial statements for further details. With respect to the hedge accounting policy, please see “Note 2.4 – Summary of Main Accounting Practices—d) Financial Assets and Liabilities—IV – Derivatives” to our audited consolidated financial statements.
Fair Value of Financial Instruments
Financial instruments recorded at fair value on our balance sheet include securities classified as Fair Value Through Other Comprehensive Income and Fair Value Through Profit or Loss, including derivatives. Other financial instruments are classified at historical amortized cost on our balance sheet, and their corresponding fair values are shown in the notes to our audited consolidated financial statements. We present information on the fair value of our financial instruments in the table below as of December 31, 2018 and 2017.
| Financial instruments recorded at fair value |
As of December 31, | |||||||
| 2018 | 2017(*) | |||||||
| (In millions of R$) | ||||||||
| Assets |
| |||||||
| Financial assets at fair value through profit or loss |
263,180 | 250,693 | ||||||
| Derivatives |
23,466 | 22,843 | ||||||
| Financial assets at fair value through other comprehensive income |
49,323 | 52,149 | ||||||
| Total |
335,969 | 325,685 | ||||||
|
|
|
|
|
|||||
| Liabilities |
| |||||||
| Financial liabilities designated at fair value through profit or loss |
192 | 465 | ||||||
| Derivatives |
27,519 | 26,746 | ||||||
| Total |
27,711 | 27,211 | ||||||
|
|
|
|
|
|||||
| (*) | Restated to take into account the effect of IFRS 9, which we retroactively adopted as of January 1, 2016. |
We determine the fair value of our financial instruments based on IFRS 13, which defines fair value as the price that would be received to sell an asset or paid to transfer a liability in an orderly transaction between market participants at the measurement date.
According to IFRS 13, there are different levels of inputs that may be used to measure the fair value of financial instruments classified as levels 1, 2 and 3.
| • | Level 1: observable inputs reflect the quoted prices (unadjusted) of identical assets or liabilities in active markets; |
| • | Level 2: observable inputs reflect the information on assets and liabilities that are either directly (such as prices) or indirectly (derived from prices) observable, except for the quoted prices included in Level 1; and |
113
Table of Contents
| • | Level 3: information on assets and liabilities that are not based on observable market data due to little market activity on the measurement date. We present information on our level 3 financial instruments in the table below as of December 31, 2018 and 2017. |
| Level 3 |
As of December 31, | |||||||
| 2018 | 2017 (*) | |||||||
| (In millions of R$) | ||||||||
| Financial assets at fair value through profit or loss |
2,833 | 3,947 | ||||||
| Net position of derivatives |
116 | 333 | ||||||
| Total |
2,949 | 4,280 | ||||||
|
|
|
|
|
|||||
| (*) | Restated to take into account the effect of IFRS 9, which we retroactively adopted as of January 1, 2016. |
Please refer to “Note 28 – Fair Value of Financial Instruments” to our audited consolidated financial statements for further details.
Contingent Liabilities
Contingent liabilities arise mainly from judicial and administrative proceedings inherent to the ordinary course of our business and that are filed by third parties, including former employees and public bodies related to civil, labor, tax and social security claims.
These contingencies are assessed based on the best estimates of our management, taking into consideration the opinion of legal advisors when there is a probability that financial resources will be required to settle obligations and the amount of such obligations can be reliably measured.
Contingencies are classified as follows, based on the likelihood of loss:
| • | Probable: liabilities are recognized as “provisions” on our consolidated balance sheet; |
| • | Possible: liabilities are disclosed in our audited consolidated financial statements but no provisions are recorded; and |
| • | Remote: liabilities that do not require provision or disclosure. |
Contingent liabilities for which provisions are recorded and those classified as having a “possible” likelihood of loss are evaluated based on our best estimates, using models and criteria that allow for their proper evaluation despite the uncertainty that is inherent to their terms and amounts.
Significant Changes in Accounting Standards
Please see “Note 2.2 – New Accounting Standards and New Accounting Standards Changes and Interpretations” to our audited consolidated financial statements for further details about information on significant changes in accounting standards.
Accounting Practices Adopted in Brazil
Our books and records are maintained in Brazilian reais, the official currency in Brazil, and our audited consolidated financial statements, for statutory and regulatory purposes, are prepared in accordance with Brazilian GAAP. The accounting principles and standards generally applicable under Brazilian GAAP include those established under Brazilian Corporate Law, by the Accounting Pronouncements Committee, or CPC, which started issuing standards in 2007, and by the Federal Accounting Council. In the case of companies subject to regulation by the Central Bank, such as us, the effectiveness of the accounting pronouncements issued by entities such as the CPC depends on approval of the pronouncement by the CMN, which also establishes the date of effectiveness of any pronouncements with respect to financial institutions. Additionally, the CVM and other regulatory bodies, such as SUSEP and the Central Bank, provide additional industry-specific guidelines.
Regulation Applicable to the Presentation of the Audited Consolidated Financial Statements
Brazilian regulations establish specific rules for the consolidation of audited consolidated financial statements by financial institutions. Under current Central Bank regulations, financial institutions, except for credit cooperatives, are required to prepare consolidated financial statements including investments directly or indirectly held in other companies, individually or jointly controlled, and with respect to which such financial institutions have (i) the right to appoint or designate the majority of the company’s board of directors; (ii) the right to appoint or remove the majority of the company’s executives and directors; and/or (iii) operational or shareholding control. These regulations apply to the entire group to which a financial institution belongs.
114
Table of Contents
Financial results review
The interest rates cited are expressed in reais and include the effect of the variation in the real against foreign currencies. Please, see “Item 3D. Risk Factors, Macroeconomic Risks – Domestic Scenario – Brazilian authorities exercise influence over the Brazilian economy. Changes in fiscal, monetary and foreign exchange policies as well as a deterioration of government fiscal accounts, may adversely affect us” and “Item 3D. Risk Factors –Risks Associated with our Business – Market Risk” for further details.
| For the Year Ended December 31, | Variation | |||||||||||||||||||||||||||
| Summarized Consolidated Statement of Income |
2018 | 2017(1) | 2016(1) | 2018-2017 | 2017-2016 | |||||||||||||||||||||||
| (In millions of R$, except percentages) | ||||||||||||||||||||||||||||
| Banking product |
104,200 | 111,523 | 118,422 | (7,323) | (6.6)% | (6,899) | (5.8)% | |||||||||||||||||||||
| Net interest income(2) |
62,565 | 67,311 | 67,276 | (4,746) | (7.1)% | 35 | 0.1% | |||||||||||||||||||||
| Adjustments to Fair Value of Financial Assets and Liabilities |
(4,834) | 4,181 | 7,066 | (9,015) | (215.6)% | (2,885) | (40.8)% | |||||||||||||||||||||
| Foreign exchange results and exchange variations on transactions |
2,974 | (250) | 5,513 | 3,224 | (1,289.6)% | (5,763) | (104.5)% | |||||||||||||||||||||
| Non-interest income(3) |
43,495 | 40,281 | 38,567 | 3,214 | 8.0% | 1,714 | 4.4% | |||||||||||||||||||||
| Expected Loss from Financial Assets and Claims |
(10,182) | (20,966) | (24,355) | 10,784 | (51.4)% | 3,389 | (13.9)% | |||||||||||||||||||||
| Other operating income (expenses) |
(63,410) | (59,975) | (58,388) | (3,435) | 5.7% | (1,587) | 2.7% | |||||||||||||||||||||
| Income before current and deferred income tax and social contribution |
30,608 | 30,582 | 35,679 | 26 | 0.1% | (5,097) | (14.3)% | |||||||||||||||||||||
| Current and deferred income and social contribution taxes |
(4,969) | (7,357) | (13,663) | 2,388 | (32.5)% | 6,306 | (46.2)% | |||||||||||||||||||||
| Net income |
25,639 | 23,225 | 22,016 | 2,414 | 10.4% | 1,209 | 5.5% | |||||||||||||||||||||
| Net income attributable to owners of the parent company |
24,907 | 23,193 | 21,627 | 1,714 | 7.4% | 1,566 | 7.2% | |||||||||||||||||||||
|
|
|
|
|
|
|
|
|
|
|
|
|
|
|
|||||||||||||||
| (1) | Restated to take into account the effect of IFRS 9, which we retroactively adopted as of January 1, 2016. |
| (2) | Includes interest and similar income of financial assets at amortized cost and fair value through other comprehensive income; interest, similar income and dividends of financial assets at fair value through profit or loss; and interest and similar expenses. |
| (3) | Includes banking services fees, income related to insurance and private pension operations before claim and selling expenses and other income. |
Please see our audited consolidated financial statements for further details about our Consolidated Statement of Income.
Our net income (attributable to the owners of the parent company) increased by 7.4% in 2018, compared to 2017, whereas it increased 7.2% in 2017, compared to 2016. These results are detailed as follows:
| • | Net interest income decreased by 7.1% in 2018, compared to 2017. From 2016 to 2017, this item increased slightly by 0.1%. These results were mainly due to the effect of lower basic interest rates (the average SELIC decreased from 14.2% in 2016, to 9.9% in 2017 and to 6.6% in 2018) and exchange rate variations (the Brazilian real depreciated 1.5% against the U.S. dollar in 2017 and 17.1% in 2018) on our strategy for hedging the effects of exchange rate variation on our foreign investments, as further detailed below under “Current and deferred income and social contribution taxes”. |
Please see “Note 21 – Interest and Similar Income and Expense and Net Gain (Loss) on Investment Securities and Derivatives” to our audited consolidated financial statements for further details on Net interest, similar income and dividend.
| • | Adjustments to Fair Value of Financial Assets and Liabilities decreased by 215.6% in 2018, when compared to 2017, having decreased by 40.8% in 2017, compared to 2016. These decreases were mainly due to the effect of exchange rate variation on our hedge strategy for our foreign investments (approximately R$72,413 million at the end of 2016, R$78,064 million at the end of 2017 and R$68,052 million at the end of 2018). This effect was offset by the reduction in tax expenses, as further detailed in “Current and deferred income and social contribution taxes”. |
Please see “Note 21 – Interest and Similar Income and Expense and Net Gain (Loss) on Investment Securities and Derivatives” to our audited consolidated financial statements for further details on Adjustments to Fair Value of Financial Assets and Liabilities.
| • | Foreign Exchange Results and Exchange Variation on Transactions amounted to a gain of R$2,974 million in 2018, compared to a loss of R$250 million in 2017 and a gain of R$5,513 million for 2016, mainly due to the effect of exchange rate variations in the periods. As previously stated, the Brazilian real depreciated 1.5% against the U.S. dollar in 2017 and 17.1% in 2018. |
115
Table of Contents
| • | Non-Interest Income increased by 8.0% in 2018, compared to 2017 and 4.4% in 2017, compared to 2016. The main drivers of this result for the referred periods were: (i) asset management fees (which grew by 21.1% in 2018 and 17.8% in 2017), as a result of a higher volume of funds under management (16.6% and 19.1%, respectively, in 2018 and in 2017) and higher revenues from performance fees; (ii) income from credit and debit card service fees (which increased by 4.0% in 2018 and 5.7% in 2017), mainly driven by higher interchange revenues resulting from an increase in the volume of transactions and revenues from credit and debit card annuity fees, (iii) income from current account services (which increased by 4.5% in 2018 and 8.3% in 2017), mainly due to the higher number of current-account holders; and (iv) higher income from fees from both credit and debit card services and current account services was also related to the incorporation of Citibank’s retail operations. |
The following chart shows the main components of our banking service fees for the years ended December 31, 2018, 2017 and 2016:
In R$ million
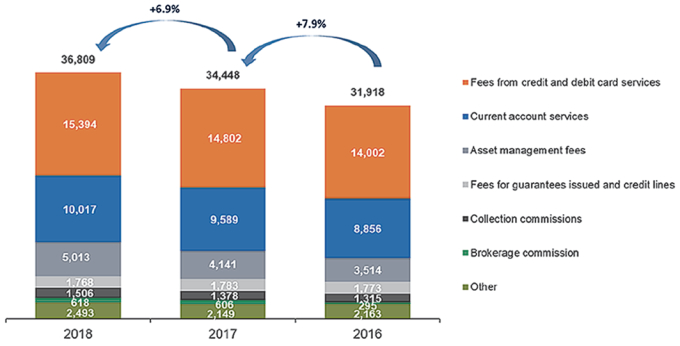
Please see “Note 22 – Banking Service Fees” to our audited consolidated financial statements for further details on banking service fees.
For more details on our main products and market position, see “Item 4B. Business Overview – Operations Overview.”
| • | Expected Loss from Financial Assets and Claims decreased 51.4% in 2018 compared to 2017. From 2016 to 2017, this decreased by 13.9%. These consecutive decreases were mainly due to lower expenses with expected loss with loan and lease operations with individuals and legal entities (R$10,587 million in 2018, R$18,381 in 2017 and R$22,466 in 2016), as a result of the improvement in the credit quality of our total loan portfolio. From 2015 to 2017, we made greater provisions of our expected loss from financial assets and claims due to the Brazilian economic context with deteriorating credit quality, mainly in the wholesale banking segment. More recently, we have noticed an improvement in the credit rating of our large corporate clients, which has reduced our expected loss with other financial assets. |
Please see “Note 10—Loan operations and lease operations portfolio” to our audited consolidated financial statements for further details on our loan and lease operations portfolio.
| • | Other Operating Income (Expenses) increased by 5.7% in 2018, compared to 2017. Personnel expenses increased by 6.7%, following the execution of the collective bargaining agreement (which resulted in a 5% wage increase for bank employees) and the higher headcount due to the hiring of new insurance consultants, REDE sales representatives and technology department personnel to speed up our digital transformation process. We had more than 100,000 employees at the end of 2018, an increase of 1.0% compared to 2017. In addition, our administrative expenses increased by 6.0% in 2018, mainly due to the higher cost of third-party services (increase of 7.7%); data processing and telecommunications (increase of 2.9%); and advertising, promotion and publication (increase of 21.6%). |
In 2017, our other operating income (expenses) increased by 2.7%, compared to 2016. Personnel expenses grew by 4.1%, mainly due to the new employees hired for the Retail Banking operational structure related to the branch network and the acquisition of Citibank’s retail operations in Brazil, which took place on October 31, 2017. Additionally, REDE increased its commercial team to extend the reach of the sales force and to improve the quality of its services. In the case of administrative expenses, which increased by 2.1% in 2017 compared to 2016, we experienced increases in costs related to data processing and telecommunications (increase of 4.7%) and advertising, promotions and publications (increase of 12.6%).
Please see “Note 23—General and administrative expenses” to our audited consolidated financial statements for further details.
| • | Current and deferred income and social contribution taxes decreased by 32.5% in 2018, compared to 2017 and 46.2% in 2017, compared to 2016, mainly due to a fiscal effect on the hedge instruments for our investments aboard. The result of exchange rate variation on our investments aboard is non-taxable, unlike revenue from our hedge instruments, which is taxable. With the depreciation of the Brazilian real, we incurred losses on hedge instruments abroad, which affected our tax expenses in both periods. |
Please see “Note 24 – Taxes” to our audited consolidated financial statements for further details.
116
Table of Contents
Basis for Presentations of Segment Information
Our segment information is based on reports used by senior management to assess the financial performance of our businesses and to make decisions regarding the allocation of funds for investment and other purposes.
Segment information is not prepared in accordance with IFRS, but according to the accounting practices adopted in Brazil as established by the Central Bank. It includes the following pro forma adjustments: (i) the recognition of the impact of capital allocation using a proprietary model; (ii) the use of funding and cost of capital at market prices, using certain managerial criteria; (iii) the exclusion of non-recurring events from our results; and (iv) the reclassification of the tax effects from hedging transactions we enter into for our investments abroad.
We present below the summarized results from our operating segments for the year ended December 31, 2018:
| Summarized Consolidated Statement of Income from January 1
to |
Retail Banking (a) |
Wholesale Banking (b) |
Activities with the Market + Corporation (c) |
ITAÚ UNIBANCO (a)+(b)+(c) |
Adjustments | IFRS consolidated |
||||||||||||||||||
| (In millions of R$) | ||||||||||||||||||||||||
| Banking product |
72,182 | 29,389 | 10,246 | 111,817 | (7,617 | ) | 104,200 | |||||||||||||||||
| Cost of Credit |
(12,526 | ) | (1,540 | ) | - | (14,066 | ) | 5,112 | (8,954 | ) | ||||||||||||||
| Claims |
(1,160 | ) | (68 | ) | - | (1,228 | ) | - | (1,228 | ) | ||||||||||||||
| Other operating income (expenses) |
(40,002 | ) | (15,217 | ) | (1,070 | ) | (56,289 | ) | (7,121 | ) | (63,410 | ) | ||||||||||||
| Income tax and social contribution |
(6,939 | ) | (3,829 | ) | (2,964 | ) | (13,732 | ) | 8,763 | (4,969 | ) | |||||||||||||
| Non-controlling interest in subsidiaries |
(184 | ) | (550 | ) | (35 | ) | (769 | ) | 37 | (732 | ) | |||||||||||||
| Net income |
11,371 | 8,185 | 6,177 | 25,733 | (826 | ) | 24,907 | |||||||||||||||||
|
|
|
|
|
|
|
|
|
|
|
|
|
|||||||||||||
The following discussion should be read in conjunction with our audited consolidated financial statements, especially “Note 30 – Segment information.” The adjustments column shown in this note shows the effects of the differences between the segmented results (substantially in accordance with the accounting practices adopted in Brazil) and those calculated according to the principles adopted in our audited consolidated financial statements in IFRS.
For more details on our segments, see “Item 4B. Business Overview – Operations Overview.”
Retail Banking
The result from this segment is derived from the banking products and services provided to a diversified customer base of account holders and non-account holders, individuals and companies in Brazil. It includes retail customers, high-income customers (Itaú Uniclass and Personnalité), and very small and small companies. It also consists of financing and lending activities at units other than the branch network and credit cards, in addition to transactions with Banco Itaú Consignado S.A.;
The following table shows the summarized consolidated statement of income with respect to our Retail Banking segment for the years ended December 31, 2018, 2017 and 2016:
| For the Year Ended December 31, |
Variation | |||||||||||||||||||||||||||
| Summarized Consolidated Statement of Income - Retail banking |
2018 | 2017 | 2016 | 2018-2017 | 2017-2016 | |||||||||||||||||||||||
| (In millions of R$, except percentages) | ||||||||||||||||||||||||||||
| Banking product |
72,182 | 69,921 | 70,496 | 2,261 | 3.2% | (575 | ) | -0.8% | ||||||||||||||||||||
| Cost of Credit and Claims |
(13,686 | ) | (13,388 | ) | (15,820 | ) | (298 | ) | 2.2% | 2,432 | -15.4% | |||||||||||||||||
| Other operating income (expenses) |
(40,002 | ) | (37,601 | ) | (37,202 | ) | (2,401 | ) | 6.4% | (399 | ) | 1.1% | ||||||||||||||||
| Income tax and social contribution |
(6,939 | ) | (7,107 | ) | (6,328 | ) | 168 | -2.4% | (779 | ) | 12.3% | |||||||||||||||||
| Non-controlling interest in subsidiaries |
(184 | ) | (166 | ) | (223 | ) | (18 | ) | 10.8% | 57 | -25.6% | |||||||||||||||||
| Net income |
11,371 | 11,659 | 10,923 | (288 | ) | -2.5% | 736 | 6.7% | ||||||||||||||||||||
|
|
|
|
|
|
|
|
|
|
|
|
|
|
|
|||||||||||||||
117
Table of Contents
Our net income in retail banking increased by 6.7% from 2016 to 2017, and decreased 2.5% in 2018. These results are explained as follows:
| • | Banking product: increased by 3.2% from 2017 to 2018. This growth derived from: (i) an increase of 4.3% in interest margin on account of higher volumes of credit originated with individuals and small and medium business, reflecting a 10.3% increase in retail loan operations in 2018; and (ii) an increase of 4.3% in banking service fees, mainly driven by revenues from current account services, given the increased number of current-account holders, and by credit and debit card fees, given the higher number of clients and transaction volume. This result was partially offset by a decrease in the results from insurance and private pension operations. |
From 2016 to 2017, banking product decreased by 0.8%. The main drivers of this result were: (i) a decrease in interest margin of 3.8% due to the new regulatory framework for credit cards and the adverse impact of the lower interbank deposit rate on the liabilities margin and on the remuneration of the allocated capital; and (ii) a decrease of 6.6% in income from insurance, private pension and capitalization operations before claim and selling expenses. These effects were partially offset by an increase of 6.3% in banking service fees due to higher revenues from current account services, the increased number of current-account holders and a differentiated products and services offering.
| • | Cost of credit and claims increased by 2.2% in 2018 when compared to 2017, in line with the previously mentioned loan portfolio growth in the segment in Brazil. |
In 2017, we experienced a decrease of 15.4% compared to 2016, mainly because of improvement in our credit quality and therefore lower provisions for loan losses.
| • | Other operating income (expenses) increased by 6.4% in 2018 compared to 2017, mainly due to the intensification of investments in acquiring business (REDE) and insurance operations and by the incorporation of the retail operations acquired from Citibank. Additionally, these expenses were impacted by the increase in the number of employees and the collective bargaining agreement. From 2016 to 2017, other operating income (expenses) increased by 1.1%, mainly reflecting new hires for the branch network and the REDE commercial team, as well as the acquisition of Citibank’s retail operations in Brazil. |
Wholesale Banking
The result of this segment is derived from the products and services offered to middle-market companies, private banking clients, the activities of the Latin American units (excluding Brazil), including those of CorpBanca as of the second quarter of 2016 following the merger between Banco Itaú Chile and CorpBanca, and the activities of Itaú BBA, the unit in charge of commercial operations with large companies, in addition to operating as an investment banking unit.
The following table sets out the summarized consolidated statement of income with respect to our Wholesale Banking segment for the years ended December 31, 2018, 2017 and 2016:
| Summarized Consolidated Statement of Income - Wholesale banking |
For the Year Ended December 31, |
Variation | ||||||||||||||||||||||||||
| 2018 | 2017 | 2016 | 2018-2017 | 2017-2016 | ||||||||||||||||||||||||
| (In millions of R$, except percentages) | ||||||||||||||||||||||||||||
| Banking product |
29,389 | 28,748 | 30,498 | 641 | 2.2% | (1,750 | ) | -5.7% | ||||||||||||||||||||
| Cost of Credit and Claims |
(1,608 | ) | (5,882 | ) | (10,645 | ) | 4,274 | -72.7% | 4,763 | -44.7% | ||||||||||||||||||
| Other operating income (expenses) |
(15,217 | ) | (14,523 | ) | (13,410 | ) | (694 | ) | 4.8% | (1,113 | ) | 8.3% | ||||||||||||||||
| Income tax and social contribution |
(3,829 | ) | (2,412 | ) | (1,081 | ) | (1,417 | ) | 58.7% | (1,331 | ) | 123.1% | ||||||||||||||||
| Non-controlling interest in subsidiaries |
(550 | ) | 117 | 79 | (667 | ) | -570.1% | 38 | 48.1% | |||||||||||||||||||
| Net income |
8,185 | 6,048 | 5,441 | 2,137 | 35.3% | 607 | 11.2% | |||||||||||||||||||||
|
|
|
|
|
|
|
|
|
|
|
|
|
|
|
|||||||||||||||
Our net income in wholesale banking increased by 35.3% from 2017 to 2018, and by 11.2% from 2016 to 2017. These results are explained as follows:
| • | Banking product: increased by 2.2% from 2017 to 2018, mainly because of the increase of R$934 million in banking service fees, partially offset by the R$496 million decline in interest margin. The increase in banking service fees was due to higher revenues from asset management services, related to higher balances and the performance fee of managed portfolios and investment funds. |
In 2017, banking product for this segment decreased by 5.7% compared to 2016. This is explained by the decrease of R$2,503 million in interest margin in this period, as a consequence of lower basic interest rates and a reduction in loan and lease operations in this segment, partially offset by an increase of R$804 million in banking service fees, mainly due to the reasons presented above.
118
Table of Contents
| • | Cost of credit and claims decreased by 72.7% in 2018 compared to 2017, and by 44.7% in 2017, compared to 2016, mainly due to the improvement in credit ratings in this segment, leading to a lower volume of provisions and reversals in the periods. |
| • | Non-controlling interest in subsidiaries amounted to a loss of R$550 million in 2018, mainly reflecting the better results of our operations in Chile. From 2016 to 2017, the variation in this result was not material. |
Activities with the Market and Corporation
This segment includes the results from investing our surplus capital, the costs of our surplus subordinated debt and the net balance of tax assets and liabilities. It also includes the financial margin on market transactions, the costs of treasury operations and equity pick-up from companies not linked to any segments, as well as adjustments related to minority shareholdings in subsidiaries and our equity interest in Porto Seguro S.A.
The following table shows the summarized consolidated statement of income with respect to our Activities with the Market and Corporation segment for the years ended December 31, 2018, 2017 and 2016:
| Summarized Consolidated Statement of Income - Activities
with the Market |
For the Year Ended December 31, |
Variation | ||||||||||||||||||||||||||
| 2018 | 2017 | 2016 | 2018-2017 | 2017-2016 | ||||||||||||||||||||||||
| (In millions of R$, except percentages) | ||||||||||||||||||||||||||||
| Banking product |
10,246 | 10,623 | 9,412 | (377 | ) | -3.5% | 1,211 | 12.9% | ||||||||||||||||||||
| Cost of Credit and Claims |
- | (6 | ) | 71 | 6 | -100.0% | (77 | ) | -108.5% | |||||||||||||||||||
| Other operating income (expenses) |
(1,070 | ) | (1,647 | ) | (2,387 | ) | 577 | -35.0% | 740 | -31.0% | ||||||||||||||||||
| Income tax and social contribution |
(2,964 | ) | (1,775 | ) | (1,237 | ) | (1,189 | ) | 67.0% | (538 | ) | 43.5% | ||||||||||||||||
| Non-controlling interest in subsidiaries |
(35 | ) | (23 | ) | (1 | ) | (12 | ) | 52.2% | (22 | ) | 2,200% | ||||||||||||||||
| Net income |
6,177 | 7,172 | 5,858 | (995 | ) | -13.9% | 1,314 | 22.4% | ||||||||||||||||||||
|
|
|
|
|
|
|
|
|
|
|
|
|
|
|
|||||||||||||||
| • | Banking product decreased by 3.5% from 2017 to 2018 as a consequence of lower interest margins with market¹. From 2016 to 2017, banking product increased by 12.9%, mainly due to an increase of 13.5% in interest margin, as consequence of better results on asset and liability management transactions. |
| • | Net income in this segment decline by 13.9% in 2018, compared to 2017. This decrease was mainly due to the increase of R$1,189 million in income and social contribution taxes from the recognition of deferred tax assets at a rate of 40% and, as our effective tax rate in 2018 was temporarily increased (due to the current legislation), tax payments at a rate of 45%. |
In 2017, net income in this segment increased 22.4% when compared to 2016, mostly driven by the increase in banking product mentioned above.
| (1) | Financial margin with the market includes (i) treasury banking, that manages mismatches of assets and liabilities (ALM—Asset and Liability Management), terms, and interest, foreign exchange and other rates and (ii) treasury trading, that manages proprietary portfolios and may assume guiding positions, in compliance with the limits established by our risk appetite. |
119
Table of Contents
Balance Sheet
We present below our summarized balance sheet for the years 2017 and 2018. Please see our audited consolidated financial statements for further details about our Consolidated Balance Sheet.
| As of December 31, | Annual variation | |||||||||||||||
| Summarized Balance Sheet - Assets |
2018 | 2017(1) | R$ millions |
% | ||||||||||||
| (In millions of R$) | ||||||||||||||||
| Cash and compulsory deposits in the Central Bank of Brazil |
131,307 | 117,586 | 13,721 | 11.7 | ||||||||||||
| Financial assets at amortized cost |
994,759 | 905,729 | 89,030 | 9.8 | ||||||||||||
| Loan operations and lease operations portfolio |
536,091 | 497,719 | 38,372 | 7.7 | ||||||||||||
| (-) Provision for Expected Loss |
(33,373 | ) | (36,737 | ) | 3,364 | (9.2 | ) | |||||||||
| Other financial assets(2) |
492,041 | 444,747 | 47,294 | 10.6 | ||||||||||||
| Financial assets at fair value through other comprehensive inc |
49,323 | 52,149 | (2,826 | ) | (5.4 | ) | ||||||||||
| Financial assets at fair value through profit or loss |
286,646 | 273,536 | 13,110 | 4.8 | ||||||||||||
| Investments in associates and joint ventures, Fixed assets, Goodwill and Intangible assets and other assets |
47,932 | 42,990 | 4,942 | 11.5 | ||||||||||||
| Tax assets |
42,830 | 44,249 | (1,419 | ) | (3.2 | ) | ||||||||||
|
|
|
|
|
|
|
|
|
|||||||||
| Total assets |
1,552,797 | 1,436,239 | 116,558 | 8.1 | ||||||||||||
|
|
|
|
|
|
|
|
|
|||||||||
| (1) | Restated to take into account the effect of IFRS 9, which we retroactively adopted as of January 1, 2016. |
| (2) | Includes Interbank deposits; Securities purchased under agreements to resell; Securities; and Other financial assets. |
Our Total assets increased by 8.1% from 2017 to 2018, mainly due to the larger loan operations and lease operations portfolio and other financial assets at amortized cost. These results are detailed as follows:
| • | Loan operations and lease operations portfolio increased by 7.7% in 2018, compared to 2017, mainly due to an increase of 9.9% in individuals portfolio, 14.1% in small and medium business portfolio and 11.5% in the Latin America portfolio. This result was partially offset by a decrease of 4.6% in the corporate portfolio. The individual portfolio produced growth in all products, as shown below. This growth is the effect of the higher volume of loans in response to higher demand for credit, as consequence of a better economic environment, especially in the small and medium business and individuals portfolios. In the corporate portfolio, we saw higher demand for securities reflecting the uptick in capital market activity. The Latin America portfolio was positively impacted by the variation of the Brazilian real against the currencies of those countries where we operate. |
| Loan and Lease Operations, by asset type |
2018 | 2017(1) | Annual variation | |||||||||||||
| (In millions of R$) | R$ millions | % | ||||||||||||||
| Individuals |
212,564 | 193,385 | 19,179 | 9.9 | ||||||||||||
| Credit card |
78,255 | 67,413 | 10,842 | 16.1 | ||||||||||||
| Personal loans |
29,543 | 27,295 | 2,248 | 8.2 | ||||||||||||
| Payroll Loans |
46,878 | 44,716 | 2,162 | 4.8 | ||||||||||||
| Vehicles |
15,920 | 14,165 | 1,755 | 12.4 | ||||||||||||
| Mortgage loans |
41,968 | 39,796 | 2,172 | 5.5 | ||||||||||||
| Corporate |
102,643 | 107,647 | (5,004 | ) | (4.6 | ) | ||||||||||
| Small and Medium Businesses |
68,812 | 60,290 | 8,522 | 14.1 | ||||||||||||
| Foreign Loans Latin America |
152,072 | 136,397 | 15,675 | 11.5 | ||||||||||||
|
|
|
|
|
|
|
|
|
|||||||||
| Total Loan operations and lease operations portfolio |
536,091 | 497,719 | 38,372 | 7.7 | ||||||||||||
|
|
|
|
|
|
|
|
|
|||||||||
| (1) | Restated to take into account the effect of IFRS 9, which we retroactively adopted as of January 1, 2016 |
Please see “Note 10—Loan operations and lease operations portfolio” to our audited consolidated financial statements for further details.
| • | Other financial assets at amortized cost increased by 10.6% in 2018 compared to 2017 mainly due to the higher volume of securities purchased under agreements to resell (increase of 14.5%) as part of our asset and liability management strategy. |
Please see “Note 18—Other assets and liabilities” to our audited consolidated financial statements for further details.
120
Table of Contents
| • | Financial assets at fair value through profit or loss increased by 4.8% in 2018, compared to 2017, mainly due to higher allocations of collateral for technical provisions related to pension plans (increase of 11%). |
Please see “Note 5 – Financial assets held for trading and designated at fair value through profit or loss—Securities” and “Note 27 – Insurance contracts and private pension” to our audited consolidated financial statements for further details.
| • | Investments in associates and joint ventures, Fixed assets, Goodwill and Intangible assets and other assets increased by 11.5%, mainly because of our acquisition of a non-controlling interest in XP Investimentos (49.9% of the total share capital). |
For more details regarding our investment in XP Investimentos, see “Item 4A. History and Development of the Company.”
| As of December 31, | Annual variation | |||||||||||||||
| Summarized Balance Sheet - Liabilities and stockholders’ equity |
2018 | 2017(1) | R$ millions | % | ||||||||||||
| (In millions of R$) | ||||||||||||||||
| Financial Liabilities |
1,151,237 | 1,056,717 | 94,520 | 8.9 | ||||||||||||
| At Amortized Cost |
1,119,734 | 1,024,584 | 95,150 | 9.3 | ||||||||||||
| Deposits |
463,424 | 402,938 | 60,486 | 15.0 | ||||||||||||
| Securities sold under repurchase agreements |
330,237 | 312,634 | 17,603 | 5.6 | ||||||||||||
| Interbank market debt, Institutional market debt and Other financial liabilities |
326,073 | 309,012 | 17,061 | 5.5 | ||||||||||||
| At Fair Value Through Profit or Loss |
27,711 | 27,211 | 500 | 1.8 | ||||||||||||
| Provision for Expected Loss |
3,792 | 4,922 | (1,130 | ) | (23.0 | ) | ||||||||||
| Reserves for insurance and private pension |
201,187 | 181,232 | 19,955 | 11.0 | ||||||||||||
| Provisions |
18,613 | 19,736 | (1,123 | ) | (5.7 | ) | ||||||||||
| Tax liabilities |
5,284 | 7,836 | (2,552 | ) | (32.6 | ) | ||||||||||
| Other liabilities |
26,010 | 26,362 | (352 | ) | (1.3 | ) | ||||||||||
| Total liabilities |
1,402,331 | 1,291,883 | 110,448 | 8.5 | ||||||||||||
| Total stockholders’ equity attributed to the owners of the parent company |
136,782 | 131,378 | 5,404 | 4.1 | ||||||||||||
| Non-controlling interests |
13,684 | 12,978 | 706 | 5.4 | ||||||||||||
| Total stockholders’ equity |
150,466 | 144,356 | 6,110 | 4.2 | ||||||||||||
|
|
|
|
|
|
|
|
|
|||||||||
| Total liabilities andstockholders’ equity |
1,552,797 | 1,436,239 | 116,558 | 8.1 | ||||||||||||
|
|
|
|
|
|
|
|
|
|||||||||
| (1) | Restated to take into account the effect of IFRS 9, which we retroactively adopted as of January 1, 2016. |
Total liabilities increased 8.5% in 2018 compared to 2017, mainly due to higher deposits, securities sold under repurchase agreements and reserves for insurance and private pension. These results are detailed as follows:
| • | Deposits increased by 15.0% in 2018, compared to 2017, primarily time deposits (increase of 18.6%), mainly due to the migration of resources from repurchase transactions involving collateralized debentures booked as securities sold under agreements to resell. |
Please see “Note 15 – Deposits” to our audited consolidated financial statements for further details.
| • | Securities sold under repurchase agreements increased by 5.6% in 2018, compared to 2017, mainly due to higher proceeds from repurchase agreements on collateralized third-party securities (third-party portfolio grew 17.8%). As described above, this increase was partially offset by the migration of funds from repurchase agreements on collateralized debentures. |
Please see “Note 17 – Securities sold under repurchase agreements and interbank and institutional market debts” to our audited consolidated financial statements for further details.
| • | Interbank and Institutional market debt and other financial liabilities increased by 5.5% in 2018 compared to 2017, due to a higher volume of financial credit bills (increase of 37.0%) and import and export financing (increase of 28.0%). |
For more details, see “Item 4B – Business Overview – Selected Statistical Information – Liabilities – Funding – Main Sources”.
121
Table of Contents
Stockholders’ equity (attributable to the owners of the parent company) increased by 4.1% in 2018 compared to 2017, due primarily to net income. We remunerate our stockholders by means of monthly and supplementary payments of dividends and interest on own capital. In 2018, we paid or provisioned in our stockholders’ equity R$23,667 million before taxes, R$22,437 million net of taxes (R$17,558 million in 2017). Under the buyback, in 2018 we acquired 19.7 million* of our own non-voting shares (56.9 million* of in 2017), totaling R$510 million.
| (*) | Figures adjusted for the 50% stock split that took place in November 2018. |
The image below shows our payout and dividend distribution in 2018:
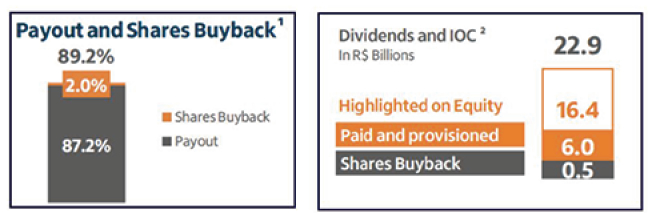
| (1) | Considerers the payout of 89.2% and the average daily closing price in 2018; |
| (2) | Dividends and income on capital, net of taxes. |
For further details, see “Item 16E. Purchases of Equity Securities by the Issuer and Affiliated Purchasers.” and “Item 5A. Operating Results – Capital Management”.
Capital-to-risk-weighted assets ratio
The Basel Ratio reached 18% on December 31, 2018, a decrease of 0.8 percentage points compared to December 31, 2017, mainly due to the payment of additional dividends related to the 2017 net income. Our Tier I (Common Equity Tier I + Additional Tier I Capital) was 16.0% and our Tier II was 1.9% on December 31, 2018.
Considering the applicable Basel III rules, our Tier I Capital was 15.9% at the end of 2018. Due to our Stockholder Remuneration Policy, and taking into account the effect of 2.4 percentage points after additional payment of dividends and interest on own capital, our Tier I capital achieved the 13.5% target at the end of 2018. By the same measure, our Common Equity ratio stood at 12.5% at the end of 2018, compared to 12.9% at the end of 2017.

Please see “Note 32 – Risk and Capital Management” for further details on our capital risk management.
122
Table of Contents
Cash Flows
The following table sets forth the main variations in our summarized cash flows for the years ended December 31, 2018, 2017 and 2016:
| For the Year Ended December 31, | ||||||||||||
| Summarized Cash Flows |
2018 | 2017(1) | 2016(1) | |||||||||
| (In millions of R$) | ||||||||||||
| Net cash from (used in) operating activities |
22,709 | 10,392 | 36,072 | |||||||||
| Net cash from (used in) investing activities |
20,129 | (865 | ) | (16,727 | ) | |||||||
| Net cash from (used in) financing activities |
(31,584 | ) | (21,690 | ) | (10,070 | ) | ||||||
| Net increase (decrease) in cash and cash equivalents |
11,254 | (12,163 | ) | 9,275 | ||||||||
|
|
|
|
|
|
|
|||||||
| (1) | Restated to take into account the effect of IFRS 9, which we retroactively adopted as of January 1, 2016. |
Please see our audited consolidated financial statements for further details about our Consolidated Statement of Cash Flows.
| • | Operating Activities: In 2018, net cash provided by operating activities was R$22,709 million due to increases in deposits and deposits received under securities repurchase agreements partially offset by the increase in loan operations (as a result of growth in our credit portfolio). |
In 2017, net cash provided by operating activities was R$10,392 million as a result of the increase in deposits partially offset by changes in financial assets designated at fair value through profit or loss.
In 2016, net cash from operating activities was R$36,072 million as a result of increases in deposits, deposits received under securities repurchase agreements and funds from institutional markets, partially offset by an increase in loan operations and a decrease in funds from interbank markets.
Our management believes cash flows from operations, available cash balances and funds from interbank markets will be sufficient to fund our operating liquidity needs for the coming years.
| • | Investing Activities: Investing activities include assets at fair value through other comprehensive income, at amortized cost, other receivables and investment securities. |
In 2018, the increase in net cash provided by investing activities totaled R$20,129 million, mainly related to (i) cash flows received from financial assets at fair value through other comprehensive income in the amount of R$16,622 million and (ii) cash flows received from the redemption of financial assets at amortized cost in the amount of R$14,991 million.
In 2017, net cash used in investing activities totaled R$865 million, mainly related to the purchase of financial assets at fair value through other comprehensive income in the amount of R$21,647 million and the purchase of intangible assets in the amount of R$2,553 million.
In 2016, the decrease in net cash used in investing activities totaled R$16,727 million related to the purchase of financial assets at fair value through other comprehensive income and to the purchase of intangible assets.
| • | Financing Activities: In 2018, net cash used in financing activities was R$31,584 million, mainly related to dividends and interest on capital paid in the amount of R$20,093 million and redemptions in institutional markets in the amount of R$15,048 million. |
In 2017 net cash used in financing activities was R$21,690 million, mainly related to redemptions of our subordinated debt in institutional markets in the amount of R$13,573 million, dividends and interest on own capital paid in the amount of R$10,800 million and also the purchase of treasury shares in the amount of R$3,089 million. These effects were partially offset by funding from institutional markets.
In 2016 net cash used in financing activities was R$10,070 million, mainly related to an increase in redemption of our subordinated debt in institutional markets in the amount of R$14,170 million and dividends and interest on own capital paid in the amount of R$10,769 million.
Highlights of our business in 2018:
Acquisition of Citibank retail business in Brazil
On October 31, 2017, after approval from the regulatory bodies, we acquired Citibank’s retail business in Brazil.
Citibank’s retail operations in Brazil (which included 71 branches) had, as of the date of execution of the Equity Interest Purchase Agreement, approximately 315,000 retail bank clients, approximately 1.1 million credit cards, a credit portfolio of approximately R$6 billion and approximately R$35 billion in deposits and assets under management. The retail operations of Citibank in Brazil were consolidated on October 31, 2017, affecting our result from November 2017.
123
Table of Contents
Perpetual Subordinated Notes
In March 2018, we accessed the international debt market by issuing an aggregate principal amount of US$750 million in perpetual subordinated notes/AT1. We had already issued an aggregate principal amount of US$1.25 billion of these notes in December 2017. The Central Bank approved the inclusion of this debt, as from the issuance date, in our Reference Equity as Additional Tier I Capital for our Tier I Capital ratio. The total increase was approximately 90 basis points on the Tier I Capital capitalization ratio, seeking to maintain our CET1 at 13.5% and distributing any surplus.
Apple Pay and Samsung Pay
As of the first quarter of 2018, we made Apple Pay and Samsung Pay available to our clients. Both tools are new mechanisms for clients to make payments in the retail and e-commerce segments, enabling them to purchase with their iPhone, Apple Watch, iPad and MacBook (Apple Pay) or Samsung Smartphones and Smartwatch Gear (Samsung Pay).
POP Credicard
In July 2018, we announced the entry of the Credicard brand into the merchant acquiring segment, with a POS machine family (POP Credicard and Mega POP Credicard), which can be purchased through its website. In addition to selling POS machines, our strategy is to have a simpler commercial proposal, based on shorter payment terms to retailers and competitive rates for debit and credit card transactions. This operation seeks to target self-employed individuals, microentrepreneurs and small companies. This initiative is an addition to our product offering in the acquiring market.
XP Investimentos S.A. – Minority interest
In August 2018, we concluded the acquisition of a 49.9% minority interest in XP Investimentos through a capital injection of R$600 million, and the acquisition of R$5.7 billion¹ in shares. The contract also provides for a one-off additional transaction in 2022, subject to future approval by the Central Bank and which, if approved, will enable us to hold 62.4% of the total equity of XP Investimentos (equal to 40.0% of the common shares) based on an income multiple (19 times) of XP Investimentos, with control of the XP group remaining unchanged.
The acquisition of XP Investimentos did not have a significant impact on our results. For further information see “Item 4.A. History and Development of the Company – History – Recent Acquisitions”.
No fees charged for Treasury Direct bonds, Pension funds and Fixed Income products
In September 2018, we zeroed out our custody fees for Tesouro Direto (direct retail purchases of treasury direct bonds) offered by Itaú Corretora and for fixed income products (bank deposit certificates (CDBs) from other managers, financial credit bills, debentures, real estate receivables certificates (CRIs) and agribusiness receivables certificates (CRAs)). Additionally, we also zeroed out the initial and final contribution fees for Private Pension plans (VGBL and PGBL) for all bank customers. This initiative provides them with more investment options in a scenario of low interest rates.
Ticket – Minority interest
On September 4, 2018, we entered into a strategic partnership with Edenred Participações S.A. in the employee benefits market, mainly regulated by the Programa de Alimentação do Trabalhador (Worker’s Meal Program). Under this agreement, Itaú will make a minority investment of 11% in Ticket, by means of a capital increase paid in (i) cash, equivalent to the book value of such equity interest, and (ii) with the contribution of distribution exclusivity rights regarding Ticket Restaurante, Ticket Alimentação, Ticket Cultura and Ticket Transporte to Itaú’s corporate client base during the term of the partnership. Ticket will continue to distribute its products by means of other commercial agreements and shall remain under Edenred’s control and management. The completion of this transaction is conditioned upon the necessary regulatory approvals.
Zero cost on advances against single-installment credit card sales
Clients of Rede with annual sales of up to R$ 30 million2 who use Rede equipment and receive their payments with Itaú Unibanco, will have the amounts – related to their single-installment credit card sales done after on May 2, 2019 – deposited in two days, without the advancement charge. This initiative applies to both current and new customers and aims to benefit small and medium companies, as well as the self-employed and micro entrepreneurs, and users of any model of the Rede device are eligible.
| (1) | Figures on the date of signature of the contract, which were adjusted up to the financial settlement date. |
| (2) | Considers the economic group annual sales. |
124
Table of Contents
| 5B. | Liquidity and Capital Resources |
Our Board of Directors determines our policy regarding liquidity risk management, and establishes broad quantitative liquidity risk management limits in line with our risk appetite. The CSRML, composed of members of senior management, is responsible for strategic liquidity risk management in line with the board-approved liquidity risk framework and risk appetite. In establishing our guidelines, CSRML considers the liquidity implications of each market segment and product. The institutional treasury unit of Itaú Unibanco Holding is responsible for day-to-day management of the Itaú Unibanco Group’s liquidity profile, within the parameters set by the Board of Directors and the CSRML. This includes an oversight responsibility with respect to all business units operating outside of Brazil.
We maintain separate liquidity pools at our Brazilian operations and at each of our subsidiaries in Latin America and Europe. Our Brazilian operations include the financial institutions in Brazil and the entities used by the Brazilian operations for funding and serving their clients abroad. Each subsidiary in Latin America (e.g., in Chile, Argentina, Uruguay, Colombia and Paraguay) and in Europe has its own treasury function with appropriate autonomy to manage liquidity according to local needs and regulations, while remaining in compliance with the liquidity limits established by Itaú Unibanco Holding senior management. In general, there are rarely liquidity transfers between subsidiaries or between the head office and a subsidiary, except under very specific circumstances (e.g., targeted capital increases). Brazil, Argentina, United Kingdom and Colombia are the only countries in which we operate where local regulators have established minimum liquidity levels.
CMN regulations also establish capital conservation and countercyclical buffers for Brazilian financial institutions, and determines their minimum percentages as well as which sanctions and limitations will apply in case of non compliance with such additional requirements.
We define our consolidated group operational liquidity reserve as the total amount of assets that can be rapidly turned into cash, based on local market practices and legal restrictions. The operational liquidity reserve generally includes: cash and deposits on demand, funded positions of securities purchased under agreements to resell and unencumbered government securities.
The following table presents our operational liquidity reserve as of December 31, 2018, 2017 and 2016:
| Cash in Cash Flows |
As of December 31, | 2018 Average Balance(1) |
||||||||||||||
| 2018 | 2017 | 2016 | ||||||||||||||
| (In millions of R$) | ||||||||||||||||
| Cash |
37,159 | 18,749 | 18,542 | 27,244 | ||||||||||||
| Securities purchased under agreements to resell - Funded position(2) |
45,335 | 38,833 | 77,452 | 45,936 | ||||||||||||
| Unencumbered government securities |
74,760 | 106,681 | 78,633 | 86,575 | ||||||||||||
| Operational reserve |
157,254 | 164,263 | 174,627 | 159,755 | ||||||||||||
|
|
|
|
|
|
|
|
|
|||||||||
| (1) | Average calculated based on interim financial statements. |
| (2) | Net of R$5,120 million (R$3,664 million at 12/31/2017 and R$4,329 million at 12/31/2016), which securities are restricted to guarantee transactions at B3 and the Central Bank. |
Our management controls our liquidity reserves by projecting the resources that will be available for investment by our treasury department. The technique we employ involves the statistical projection of scenarios for our assets and liabilities, considering the liquidity profiles of our counterparties.
Short-term minimum liquidity limits are defined according to guidelines set by the CSRML. These limits aim to ensure that the Itaú Unibanco Group always has sufficient liquidity available to cover unforeseen market events. These limits are revised periodically, based on the projection of cash needs in atypical market situations (i.e., stress scenarios).
Management of liquidity makes it possible for us to simultaneously meet our operating requirements, protect our capital and exploit market opportunities. Our strategy is to maintain adequate liquidity to meet our present and future financial obligations and to capitalize on business opportunities as they arise.
We are exposed to effects of the disruptions and volatility in the global financial markets and the economies in those countries where we do business, especially Brazil. However, due to our stable sources of funding, which include a large deposit base, the large number of correspondent banks with which we have long-standing relationships, as well as facilities in place which enable us to access further funding when required, we have not historically experienced liquidity challenges, even during periods of disruption in the international financial markets.
125
Table of Contents
| For the Year Ended December 31, | ||||||||||||||||||||||||
| 2018 | 2017 | 2016 | ||||||||||||||||||||||
| Average deposits and borrowings |
Average balance |
% of total |
Average balance |
% of total |
Average balance |
% of total |
||||||||||||||||||
| (In millions of R$, except percentages) | ||||||||||||||||||||||||
| Interest-bearing liabilities |
1,176,795 | 88.1% | 1,151,960 | 92.9% | 1,042,406 | 87.6% | ||||||||||||||||||
| Interest-bearing deposits |
357,684 | 26.8% | 287,398 | 23.2% | 244,121 | 20.5% | ||||||||||||||||||
| Savings deposits |
126,987 | 9.5% | 110,411 | 8.9% | 106,838 | 9.0% | ||||||||||||||||||
| Interbank deposits |
2,970 | 0.2% | 3,282 | 0.3% | 7,304 | 0.6% | ||||||||||||||||||
| Time deposits |
227,727 | 17.0% | 173,705 | 14.0% | 129,979 | 10.9% | ||||||||||||||||||
| Securities sold under repurchase agreements |
308,306 | 23.1% | 345,218 | 27.9% | 336,962 | 28.3% | ||||||||||||||||||
| Interbank market debt and Institutional market debt |
232,802 | 17.4% | 229,269 | 18.5% | 240,608 | 20.2% | ||||||||||||||||||
| Interbank market debt |
135,357 | 10.1% | 133,984 | 10.8% | 145,013 | 12.2% | ||||||||||||||||||
| Institutional market debt |
97,445 | 7.3% | 95,285 | 7.7% | 95,595 | 8.0% | ||||||||||||||||||
| Reserves for insurance private pension and liabilities for capitalization plans |
193,908 | 14.5% | 170,561 | 13.8% | 144,481 | 12.1% | ||||||||||||||||||
| Other Interest-bearing liabilities |
84,095 | 6.3% | 119,515 | 9.6% | 76,234 | 6.4% | ||||||||||||||||||
| Non-interest-bearing liabilities |
158,960 | 11.9% | 87,378 | 7.1% | 147,515 | 12.4% | ||||||||||||||||||
| Non-interest bearing deposits |
70,205 | 5.3% | 61,844 | 5.0% | 61,895 | 5.2% | ||||||||||||||||||
| Other Comprehensive Income |
4,038 | 0.3% | 5,485 | 0.4% | 6,008 | 0.5% | ||||||||||||||||||
| Other non-interest bearing liabilities |
84,718 | 6.3% | 20,049 | 1.6% | 79,613 | 6.7% | ||||||||||||||||||
| Total |
1,335,755 | 100% | 1,239,338 | 100% | 1,189,921 | 100% | ||||||||||||||||||
|
|
|
|
|
|
|
|
|
|
|
|
|
|||||||||||||
Our main sources of funding are interest-bearing deposits, deposits received under repurchase agreements, on-lending from government financial institutions, lines of credit with foreign banks and the issuance of securities abroad. Please see “Note 15 – Deposits” to our audited consolidated financial statements for further details about funding.
We may from time to time seek to retire or purchase our outstanding debt, including our subordinated notes (subject to the approval of the Central Bank), and senior notes, through cash purchases in the open market purchases, privately negotiated transactions or otherwise. Such repurchases, if any, will depend on prevailing market conditions, our liquidity requirements, contractual restrictions and other factors. Notes repurchased may be held, cancelled or resold and any resale thereof will only be in compliance with applicable requirements or exemptions under the relevant securities laws.
Some of our long-term debt provides for acceleration of the outstanding principal balance upon the occurrence of specified events, which are events ordinarily found in long-term financing agreements. Up to December 31, 2018, none of these events, including any events of default or failure to satisfy financial covenants, have occurred.
Under Brazilian law, cash dividends may only be paid if the subsidiary paying such dividends has reported a profit in its financial statements. In addition, subsidiaries that are financial institutions are prohibited from making loans to Itaú Unibanco Holding, but they are allowed to make deposits in Itaú Unibanco Holding, which represent interbank certificates of deposit (Certificado de Depósito Interbancário). These restrictions have not had, and are not expected to have, a material impact on our ability to meet our cash obligations. For more information on our dividend policy, see “Item 8A. Consolidated Statements and Other Financial Information – Stockholders’ Payment”.
Changes in Cash Flows
Please refer to “Item 5A. Operating Results”.
126
Table of Contents
Capital Expenditures
In accordance with our practice in the last few years, our capital expenditures in the year ended December 31, 2018 were funded with internal resources. We cannot provide assurance that we will make capital expenditures in the future and, if made, that the amounts will correspond to the current estimates. The table below shows our capital expenditures as of December 31, 2018, 2017 and 2016:
| Capital Expenditures |
For the Year Ended December 31, |
Variation | ||||||||||||||||||||||||||
| 2018 | 2017 | 2016 | 2018-2017 | 2017-2016 | ||||||||||||||||||||||||
| (In millions of R$, except percentages) | ||||||||||||||||||||||||||||
| Fixed Assets |
1,483 | 943 | 1,430 | 540 | 57.3 | % | (487 | ) | (34.1 | )% | ||||||||||||||||||
| Fixed assets under construction |
474 | 302 | 341 | 172 | 57.0 | % | (39 | ) | (11.4 | )% | ||||||||||||||||||
| Land and buildings |
- | - | 127 | - | 0.0 | % | (127 | ) | (100.0 | )% | ||||||||||||||||||
| Leasehold improvements |
35 | 147 | 137 | (112 | ) | (76.2 | )% | 10 | 7.3 | % | ||||||||||||||||||
| Furniture and data processing equipment |
845 | 412 | 602 | 433 | 105.1 | % | (190 | ) | (31.6 | )% | ||||||||||||||||||
| Other |
129 | 82 | 223 | 47 | 57.3 | % | (141 | ) | (63.2 | )% | ||||||||||||||||||
| Intangible Assets |
1,373 | 1,919 | 2,846 | (546 | ) | (28.5 | )% | (927 | ) | (32.6 | )% | |||||||||||||||||
| Association for the promotion and offer of financial products and services |
1 | 18 | 719 | (17 | ) | (94.4 | )% | (701 | ) | (97.5 | )% | |||||||||||||||||
| Software developed or obtained for internal use |
964 | 1,556 | 1,508 | (592 | ) | (38.0 | )% | 48 | 3.2 | % | ||||||||||||||||||
| Other intangibles |
408 | 345 | 619 | 63 | 18.3 | % | (274 | ) | (44.3 | )% | ||||||||||||||||||
| Total |
2,856 | 2,862 | 4,276 | (6 | ) | (0.2 | )% | (1,414 | ) | (33.1 | )% | |||||||||||||||||
|
|
|
|
|
|
|
|
|
|
|
|
|
|
|
|||||||||||||||
See “Note 13 – Fixed Assets” and “Note 14 – Goodwill and Intangible Assets” to our audited consolidated financial statements for further details.
Capitalization
The table below presents our capitalization as of December 31, 2018. The information described is derived from our audited consolidated financial statements as of and for the year ended December 31, 2018. As of the date of this annual report, there has been no material change in our capitalization since December 31, 2018.
You should read the table below in conjunction with the information included in “Item 4B. Business Overview – Selected Statistical Information” for further details.
127
Table of Contents
| Capitalization |
As of December 31, 2018 | |||||||
| R$ | US$(1) | |||||||
| (In millions of R$, except percentages) |
||||||||
| Current liabilities |
||||||||
| Deposits |
307,832 | 79,445 | ||||||
| Securities sold under repurchase agreements |
271,521 | 70,074 | ||||||
| Financial liabilities designated at fair value through profit or loss |
37 | 10 | ||||||
| Derivatives |
10,053 | 2,594 | ||||||
| Interbank market debt |
73,176 | 18,885 | ||||||
| Institutional market debt |
8,524 | 2,200 | ||||||
| Other financial liabilities |
95,639 | 24,682 | ||||||
| Reserves for insurance and private pension |
3,702 | 955 | ||||||
| Provisions |
4,940 | 1,275 | ||||||
| Tax liabilities |
2,058 | 531 | ||||||
| Other liabilities |
24,931 | 6,434 | ||||||
|
|
|
|
|
|||||
| Total |
802,413 | 207,085 | ||||||
|
|
|
|
|
|||||
| Long-term liabilities |
||||||||
| Deposits |
155,592 | 40,155 | ||||||
| Securities sold under repurchase agreements |
58,716 | 15,153 | ||||||
| Financial liabilities designated at fair value through profit or loss |
155 | 40 | ||||||
| Derivatives |
17,466 | 4,508 | ||||||
| Interbank market debt |
61,494 | 15,870 | ||||||
| Institutional market debt |
85,450 | 22,053 | ||||||
| Other financial liabilities |
1,790 | 462 | ||||||
| Reserves for insurance and private pension |
197,485 | 50,967 | ||||||
| Provision for Expected Loss |
3,792 | 979 | ||||||
| Provisions |
13,673 | 3,529 | ||||||
| Tax liabilities |
2,779 | 717 | ||||||
| Other liabilities |
1,079 | 278 | ||||||
|
|
|
|
|
|||||
| Total |
599,471 | 154,710 | ||||||
|
|
|
|
|
|||||
| Income tax and social contribution - deferred |
447 | 115 | ||||||
| Non-controlling interests |
13,684 | 3,532 | ||||||
| Stockholders’ equity attributed to the owners of the parent company(2) |
136,782 | 35,300 | ||||||
|
|
|
|
|
|||||
| Total capitalization(3) |
1,552,797 | 400,742 | ||||||
|
|
|
|
|
|||||
| BIS ratio(4) |
18.0% | |||||||
|
|
|
|||||||
| (1) | Convenience translation at 3.8748 reais per U.S. dollar, the exchange rate in effect on December 31, 2018. |
| (2) | Itaú Unibanco Holding’s authorized and outstanding share capital consists of 4,958,290,359 common shares and 4,762,230,563 preferred shares, all of which are fully paid. For more information regarding our share capital see “Note 19 – Stockholders’ equity” to our audited consolidated financial statements as of and for the period ended December 31, 2018. |
| (3) | Total capitalization corresponds to the sum of total current liabilities, long-term liabilities, deferred income, minority interest in subsidiaries and stockholders’ equity. |
| (4) | Calculated by dividing total regulator capital by risk weight assets. |
128
Table of Contents
Capital Management
Key Indicators
Our Board of Directors is the main body responsible for our capital management, and for approving our capital management policies and guidelines regarding our capitalization level. It is also responsible for approving the ICAAP report, a process which is intended to assess our capital adequacy. At the executive level, corporate bodies are responsible for approving risk assessment and capital calculation methodologies, as well as reviewing, monitoring and recommending capital-related documents and topics to the Board of Directors.
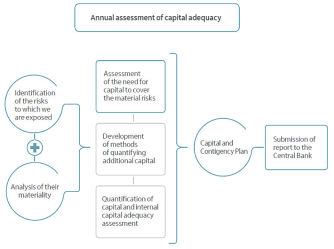
In compliance with CMN and Central Bank regulations, we have implemented a capital management structure and ICAAP, taking a prospective stance in relation to capital management.
Requirements and Capital Composition
Our minimum capital requirements are expressed as ratios of the capital available, or the Total Capital, and the risk-weighted assets, or RWA. These ratios follow the set of resolutions and circulars disclosed by the Central Bank that implemented, in Brazil, the global capital requirement standards known as Basel III.
The Total Capital is the sum of three items, as shown below:

For purposes of calculating these minimum capital requirements, the total RWA is determined as the sum of the risk-weighted asset amounts for credit, market, and operational risks.
129
Table of Contents
From January 1, 2018 to December 31, 2018, the minimum required Total Capital ratio was 8.675%, and in accordance with the scheduled gradual reduction, it will be 8% on January 1, 2019.
The Central Bank rules call for Additional Capital Buffers, or ACP, corresponding to the sum of the components ACPConservation, ACPCountercyclical and ACPSystemic, which, in conjunction with the requirements mentioned, increase capital requirements over time, as provided for CMN Resolution 4,193. Under the applicable CMN regulation, the values of the components ACPConservation, ACPSystemic and ACPCountercyclical will increase gradually from 2.375%, as from January 1, 2018, to 3.5% as from January 1, 2019. The amount of each component and the minimum regulatory requirements are provided for in CMN Resolution 4,193, as amended.
According to CMN Resolution 4,193, as amended, for assessing the minimum capital requirements, the RWA must be calculated by adding the following portions:
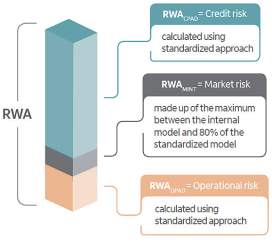
The table below presents the evolution of RWA composition for Itaú Unibanco.
| As of December 31, | ||||||||
| Composition of risk-weighted assets (Prudential Conglomerate) |
2018 | 2017 | ||||||
| (R$ million) | ||||||||
| Credit Risk (RWAcpad) |
714,969 | 660,516 | ||||||
| Market Risk (RWAmint) |
30,270 | 32,915 | ||||||
| Operational Risk (RWAopad) |
72,833 | 63,277 | ||||||
|
|
|
|
|
|||||
| Total risk-weighted assets |
818,072 | 756,708 | ||||||
|
|
|
|
|
|||||
Capital Adequacy
Through our ICAAP, we assess the adequacy of our capital to face the incurred risks. For ICAAP, capital is composed by regulatory capital for credit, market and operational risks, and by the necessary capital to face other risks.
In order to ensure our capital soundness and availability to support business growth, we maintain capital levels above the minimum requirements, according to the Common Equity Tier I, Additional Tier I Capital, and Tier II minimum ratios. As of December 31, 2018, our Total Capital (PR) reached R$ 147,028 million, an increase of R$ 4,776 million compared to December 31, 2017, mainly impacted by the approval of perpetual subordinated notes / Additional Tier I Capital (AT1), issued on December 12, 2017 and March 19, 2018 and the net income of the year. Our current working capital is sufficient for present requirements.
Our BIS ratio (calculated as the ratio between our Regulatory Capital and the total amount of RWA) reached 18.0%, as of December 31, 2018, a decrease of 0.8% compared to 18.8% as of December 31, 2017. Such decrease is mainly explained due to an increase of Risk Weighted Assets.
130
Table of Contents
Additionally, the Fixed Assets Ratio (Índice de Imobilização) indicates the level of total capital committed to adjusted permanent assets. Itaú Unibanco is within the maximum limit of 50% of the adjusted total capital, as established by the Central Bank. On December 31, 2018, our Fixed Assets Ratio reached 25.9%, which presents a buffer of R$ 35,447 million.
| (R$ million) | ||||||||||||||||||||||||||||||||
| Capital Adequacy (Prudential Conglomerate) |
December 31, 2018 | December 31, 2017 | ||||||||||||||||||||||||||||||
| Required Amount |
Current Amount |
Required Ratio |
Current Ratio |
Required Amount |
Current Amount |
Required Ratio |
Current Ratio |
|||||||||||||||||||||||||
| Common Equity Tier I |
36,813 | 123,358 | 4.5% | 15.1% | 34,052 | 122,396 | 4.5% | 16.2% | ||||||||||||||||||||||||
| Additional Tier I Capital |
- | 7,796 | - | - | - | 57 | - | - | ||||||||||||||||||||||||
| Tier I |
49,084 | 131,154 | 6.0% | 16.0% | 45,402 | 122,453 | 6.0% | 16.2% | ||||||||||||||||||||||||
| Tier II |
- | 15,874 | - | - | 19,799 | - | - | |||||||||||||||||||||||||
| Referential Equity (Tier I + Tier II) |
70,559 | 147,028 | 8.625% | 18.0% | 69,995 | 142,252 | 9.250% | 18.8% | ||||||||||||||||||||||||
|
|
|
|
|
|
|
|
|
|
|
|
|
|
|
|
|
|||||||||||||||||
| Additional Capital Buffers |
19,429 | 2.375% | 11,351 | 1.5% | ||||||||||||||||||||||||||||
|
|
|
|
|
|||||||||||||||||||||||||||||
Our Total Capital, Tier 1 Capital and Common Equity Tier 1 Capital ratios are calculated on a consolidated basis, applied to institutions included in our Prudential Conglomerate which comprises not only financial institutions but also collective financing plans (consórcios), payment entities, factoring companies or companies that directly or indirectly assume credit risk, and investment funds in which our Itaú Unibanco Group retains substantially all risks and rewards.
Please see “Item 4B. Business Overview – Regulatory Environment – Basel III Framework – Implementation of Basel III in Brazil” for further details about minimum capital ratios.
Please see “Note 32 – Risk and Capital Management” of our audited consolidated financial statements in IFRS for further details about regulatory capital.
Sensitivity Analyses (Trading and Banking Portfolios)
As required by Brazilian regulation, we conduct sensitivity analyses for market risk factors considered important. The highest resulting losses are presented below, with impact on result, by risk factor, in each such scenario and are calculated net of tax effects, providing a view of our exposure under different circumstances.
The sensitivity analyses of the Trading Portfolio and Banking Portfolio presented here are based on a static assessment of the portfolio exposure. Therefore, such analyses do not consider the dynamic response capacity of management (e.g., treasury and market risk control unit) to initiate mitigating measures, whenever a situation of high loss or risk is identified, minimizing the possibility of significant losses. In addition, the analysis is intended to assess risk exposure and the respective protective actions, taking into account the fair value of financial instruments, regardless of whether or not financial instruments are accounted for on an accrual basis.
| Exposures |
Trading Portfolio(1) December 31, 2018 |
Trading and Banking Portfolios(1) December 31, 2018 |
||||||||||||||||||||||||
| Risk Factors |
Risk of varitions in: |
Scenario I | Scenario II | Scenario III | Scenario I | Scenario II | Scenario III | |||||||||||||||||||
| (In thousands of R$) | ||||||||||||||||||||||||||
| Interest Rate |
Fixed Income Interest Rates in reais | (193 | ) | (18,277 | ) | (56,547 | ) | (7,935 | ) | (1,305,886 | ) | (2,582,531 | ) | |||||||||||||
| Foreign Exchange Linked |
Foreign Exchange Linked Interest Rates | 30 | (8,951 | ) | (31,199 | ) | (1,595 | ) | (245,172 | ) | (477,888 | ) | ||||||||||||||
| Foreign Exchange Rates |
Prices of Foreign Currencies | (5,015 | ) | (185,640 | ) | (451,796 | ) | (5,308 | ) | (198,514 | ) | (476,063 | ) | |||||||||||||
| Price Index Linked |
Interest of Inflation coupon | (494 | ) | (19,537 | ) | (41,174 | ) | (606 | ) | (58,746 | ) | (124,841 | ) | |||||||||||||
| TR |
TR Linked Interest Rates | - | - | (1 | ) | 446 | (96,086 | ) | (227,634 | ) | ||||||||||||||||
| Equities |
Prices of Equities | 540 | (23,026 | ) | 45,451 | 4,388 | (117,695 | ) | (143,886 | ) | ||||||||||||||||
| Other |
Exposures that do not fall under the definitions above | (1 | ) | (2,542 | ) | (8,098 | ) | 63 | 6,282 | 11,175 | ||||||||||||||||
| Total |
(5,133 | ) | (257,973 | ) | (543,364 | ) | (10,547 | ) | (2,015,817 | ) | (4,021,668 | ) | ||||||||||||||
|
|
|
|
|
|
|
|
|
|
|
|
|
|||||||||||||||
| (1) | Amounts net of tax effects. |
131
Table of Contents
| • | Scenario I: Addition of one basis point to fixed interest rates, currency coupon, inflation and interest rate indexes and one percentage point to currency and equity prices; |
| • | Scenario II: Shocks of 25% in fixed interest rates, currency coupon, inflation, interest rate indexes and currency and share prices, both for growth and fall, considering the largest resulting losses per risk factor; and |
| • | Scenario III: Shocks of 50% in fixed interest rates, currency coupon, inflation, interest rate indexes and currency and share prices, both for growth and fall, considering the largest resulting losses per risk factor. |
Interest Rate Sensitivity
Interest rate sensitivity is the relationship between market interest rates and net interest income arising from the maturity or the renegotiation of prices of interest-bearing assets and liabilities.
Our strategy for interest rate sensitivity considers the return rates, the underlying risk level and the liquidity requirements, including our minimum regulatory cash reserves, mandatory liquidity ratios, withdrawals and maturity of deposits, capital costs and additional demand for funds.
The pricing structure is matched when equal amounts of these assets or liabilities mature or are renegotiated. Any mismatch of interest-bearing assets and liabilities is known as a gap position. The interest rate sensitivity may vary in the renegotiation periods presented due to the different renegotiation dates within the period. Also, variations among the different currencies in which the interest rate positions are denominated may arise.
These relationships are material for a particular date, and significant fluctuations may occur on a daily basis as a result of both market forces and management decisions. Our “CSRML” analyzes Itaú Unibanco Group’s gap position on a monthly basis and establishes limits for market risk exposure, interest rate positions and foreign currency positions.
Please see “Note 32 – Risk and Capital Management, 2. Market Risk” of our audited consolidated financial statements for further details about the position of our interest-bearing assets and liabilities as of December 31, 2018. This note provides a snapshot view, and accordingly, does not reflect the interest rate gaps that may exist at other times, due to changing asset and liability positions, and management’s actions to manage risk in these changing positions.
Exchange Rate Sensitivity
Most of our banking operations are denominated in or indexed to Brazilian reais. We also have assets and liabilities denominated in foreign currency, mainly in U.S. dollars, as well as assets and liabilities that, although denominated in Brazilian reais, are indexed to U.S. dollars and, therefore, expose us to exchange rate risk. The Central Bank regulates our foreign currency positions. Please see “Note 32 – Risk and Capital Management, 2. Market Risk” of our audited consolidated financial statements for further details.
The gap management adopted by the CSRML takes into consideration the tax effects with respect to our foreign exchange positions. Since the gains from the foreign exchange rate variation on investments abroad are not taxed, we set up a hedge (a liability in foreign currency derivative instruments) in an amount sufficient so that our total foreign exchange exposure, net of tax effects, is consistent with our low risk exposure strategy.
Our foreign exchange position on the liability side is composed of various elements, including the issuance of securities in international capital markets, credit from foreign banks used to finance import and export transactions, dollar-linked onlendings from government financial institutions and deposits in currencies of Latin America countries. The proceeds of these financial operations are usually invested in loans and in the purchase of dollar-linked securities.
The information set forth in the table below was prepared on a consolidated basis, eliminating transactions between related parties. Our investments abroad, which are eliminated when we consolidate the accounting information, represented R$69.7 billion as of December 31, 2018, under the gap management policy adopted, as mentioned above. We apply either economic hedges or hedge accounting to those net investments abroad.
132
Table of Contents
| As of December 31, 2018 | ||||||||||||||||||||
| Exchange Rate Sensitivity |
Brazilian currency |
Denominated in foreign currency (1) |
Indexed to foreign currency (1) |
Total | % of amounts denominated in and indexed to foreign currency of total |
|||||||||||||||
| (In millions of R$, except percentages) | ||||||||||||||||||||
| Assets |
1,175,796 | 341,981 | 35,020 | 1,552,797 | 24.3 | |||||||||||||||
| Cash |
8,168 | 26,851 | 2,140 | 37,159 | 78.0 | |||||||||||||||
| Compulsory deposits in the Central Bank of Brazil |
94,148 | - | - | 94,148 | - | |||||||||||||||
| At Amortized Cost |
726,116 | 242,699 | 25,944 | 994,759 | 27.0 | |||||||||||||||
| Interbank deposits |
6,234 | 20,186 | - | 26,420 | 76.4 | |||||||||||||||
| Securities purchased under agreements to resell |
279,353 | 783 | - | 280,136 | 0.3 | |||||||||||||||
| Securities |
85,833 | 24,562 | - | 110,395 | 22.2 | |||||||||||||||
| Loan operations and lease operations portfolio |
330,705 | 190,755 | 14,631 | 536,091 | 38.3 | |||||||||||||||
| Other financial assets |
50,341 | 13,215 | 11,534 | 75,090 | 33.0 | |||||||||||||||
| (-) Provision for Expected Loss |
(26,350 | ) | (6,802 | ) | (221 | ) | (33,373 | ) | 21.0 | |||||||||||
| At Fair Value Through Other Comprehensive Income |
14,055 | 34,467 | 801 | 49,323 | 71.5 | |||||||||||||||
| Securities |
14,055 | 34,467 | 801 | 49,323 | 71.5 | |||||||||||||||
| At Fair Value Through Profit or Loss |
258,242 | 22,636 | 5,768 | 286,646 | 9.9 | |||||||||||||||
| Securities |
248,921 | 11,017 | 3,242 | 263,180 | 5.4 | |||||||||||||||
| Derivatives |
9,321 | 11,619 | 2,526 | 23,466 | 60.3 | |||||||||||||||
| Investments in associates and joint ventures |
12,016 | 3 | - | 12,019 | 0.0 | |||||||||||||||
| Fixed assets, net |
6,339 | 963 | - | 7,302 | 13.2 | |||||||||||||||
| Goodwill and Intangible assets, net |
9,097 | 10,232 | - | 19,329 | 52.9 | |||||||||||||||
| Tax assets |
40,390 | 2,440 | - | 42,830 | 5.7 | |||||||||||||||
| Other assets |
7,225 | 1,690 | 367 | 9,282 | 22.2 | |||||||||||||||
| Percentage of total assets |
75.7 | 22.0 | 2.3 | 100.0 | - | |||||||||||||||
|
|
|
|
|
|
|
|
|
|
|
|||||||||||
| Liabilities and Stockholders’ Equity |
1,197,151 | 337,900 | 17,746 | 1,552,797 | 22.9 | |||||||||||||||
| At Amortized Cost |
786,610 | 321,178 | 11,946 | 1,119,734 | 29.8 | |||||||||||||||
| Deposits |
306,696 | 156,267 | 461 | 463,424 | 33.8 | |||||||||||||||
| Securities sold under repurchase agreements |
299,253 | 30,984 | 0 | 330,237 | 9.4 | |||||||||||||||
| Interbank market debt |
87,235 | 46,503 | 932 | 134,670 | 35.2 | |||||||||||||||
| Institutional market debt |
7,700 | 81,282 | 4,992 | 93,974 | 91.8 | |||||||||||||||
| Other financial liabilities |
85,727 | 6,142 | 5,560 | 97,429 | 12.0 | |||||||||||||||
| At Fair Value Through Profit or Loss |
16,747 | 9,763 | 1,201 | 27,711 | 39.6 | |||||||||||||||
| Derivatives |
16,747 | 9,571 | 1,201 | 27,519 | 39.1 | |||||||||||||||
| Structured notes |
- | 192 | - | 192 | 100.0 | |||||||||||||||
| Provision for Expected Loss |
3,237 | 436 | 119 | 3,792 | 14.6 | |||||||||||||||
| Loan Commitments |
2,285 | 311 | 5 | 2,601 | 12.1 | |||||||||||||||
| Financial Guarantees |
952 | 125 | 114 | 1,191 | 20.1 | |||||||||||||||
| Reserves for insurance and private pension |
200,966 | 221 | 201,187 | 0.1 | ||||||||||||||||
| Provisions |
18,405 | 208 | - | 18,613 | 1.1 | |||||||||||||||
| Tax liabilities |
4,042 | 1,242 | - | 5,284 | 23.5 | |||||||||||||||
| Other liabilities |
16,678 | 4,852 | 4,480 | 26,010 | 35.9 | |||||||||||||||
| Non-controlling interests |
13,684 | - | - | 13,684 | - | |||||||||||||||
| Total stockholders’ equity attributed to the owners of the parent company |
136,782 | - | - | 136,782 | - | |||||||||||||||
| Percentage of total liabilities and stockholders’ equity |
77.1 | 21.8 | 1.1 | 100.0 | - | |||||||||||||||
|
|
|
|
|
|
|
|
|
|
|
|||||||||||
| (1) | Predominantly U.S. dollar. |
133
Table of Contents
Backtesting
The effectiveness of the VaR model is validated by the use of backtesting techniques that compare hypothetical and effective daily results with the estimated daily VaR. The number of exceptions to the VaR pre-established limits should be consistent, within an acceptable margin, with the hypothesis of 99% confidence level considering a period of 250 business days. Confidence levels of 97.5% and 95%, and periods of 500 and 750 business days are also considered. The backtesting analysis presented below considers the ranges suggested by the Basel Committee on Banking Supervision. The ranges are divided into:
| • | Green (0 to 4 exceptions): corresponds to backtesting results that do not suggest any problems with the quality or accuracy of the adopted models; |
| • | Yellow (5 to 9 exceptions): refers to an intermediate range group, which indicates an early warning and/or monitoring and may indicate the need to review the model; and |
| • | Red (10 or more exceptions): demonstrates the need for improvement action. |
According to Central Bank Circular No. 3,646, hypothetical testing consists of applying market price variations for a specific day to the portfolio balance at the end of the preceding business day. The effective test is the variation in the portfolio value up to the end of the day, including intraday transactions and excluding amounts not related to market price variations, such as fees, brokerage fees and commissions.
The regulatory VaR model had one backtesting exception in the 250 business days ended December 31, 2018.
| 5C. | Research and Development, Patents and Licenses, Etc. |
We do not have any significant research and development activities.
| 5D. | Trend Information |
We expect many factors to affect our future results of operations, liquidity and capital resources, including:
| • | the Brazilian economic environment (please see “Item 5A. Operating Results — Factors Affecting Our Results of Operations — Brazilian Context” and “Item 3D. Risk Factors — Macroeconomic Risks —Domestic Scenario” for further details); |
| • | legal and regulatory developments (please see “Item 4B. Business Overview — Regulatory Environment,” “Item 5A. Operating Results — Factors Affecting Our Results of Operations — Brazilian Context” and “Item 3D. Risk Factors — Legal and Regulatory Risks” for further details); |
| • | the effects of any ongoing international financial turmoil, including on the liquidity and capital requirement (please see “Item 4B. Business Overview — Regulatory Environment,” “Item 5A. Operating Results — Factors Affecting Our Results of Operations — Global Context” and “Item 3D. Risk Factors — Macroeconomic Risks — Domestic Scenario” for further details); |
| • | the inflation effects on the results of our operations (please see “Item 5A. Operating Results — Factors Affecting Our Results of Operations — Brazilian Context” and “Item 3D. Risk Factors — Macroeconomic Risks — Domestic Scenario” for further details); |
| • | the effects of the variations in the value of the Brazilian real, foreign exchange rates and interest rates on our net interest income (please see “Item 5A. Operating Results” and “Item 3D. Risk Factors— Macroeconomic Risks—Domestic Scenario” for further details); and |
| • | any acquisitions we may make in the future (please see “Item 3D. Risk Factors—Risks Associated with our Business—The integration of acquired or merged businesses involves certain risks that may have a material adverse effect on us” for further details). |
As part of our strategy, we continue to review growth opportunities, both in Brazil and outside of Brazil. Additionally, please see “Item 3D. Risk Factors” for comments on the risks faced in our operations and that could affect our business, results of operations or financial condition.
134
Table of Contents
| 5E. | Off-Balance Sheet Arrangements |
We do not have any off-balance sheet arrangements, other than the guarantees we granted that are described in “Note 32 – Risk and Capital Management, 1.1 – Collateral and policies for mitigating credit risk” and “1.4 – Maximum Exposure of Financial Assets to Credit Risk” of our audited consolidated financial statements and Item 4B. Business Overview – Selected Statistical Information – Assets – Portfolio of Securities and Derivative Financial Instruments”. Please see “Item 5B. Liquidity and Capital Resources – Exchange Rate Sensitivity” for further details.
| 5F. | Tabular Disclosure of Contractual Obligations |
The table below summarizes the maturity profile of our consolidated long-term debt, operating leases and other contractual commitments as of December 31, 2018:
| Payments due by period | ||||||||||||||||||||
| Contractual Obligations |
Total | Less than 1 year |
1-3 years | 3-5 years | More than 5 years |
|||||||||||||||
| (In millions of R$) | ||||||||||||||||||||
| Interbank market debt(1)(3) |
134,670 | 73,176 | 53,664 | 4,712 | 3,118 | |||||||||||||||
| Institutional market debt(2)(3) |
93,974 | 8,524 | 28,363 | 30,150 | 26,937 | |||||||||||||||
| Time Deposits(3) |
305,266 | 97,635 | 41,540 | 152,030 | 14,061 | |||||||||||||||
| Operating and capital (finance) lease obligations |
5,437 | 774 | 2,975 | 919 | 769 | |||||||||||||||
| Financial Guarantees |
66,105 | 18,619 | 8,316 | 1,335 | 37,835 | |||||||||||||||
| Commitments to be released |
272,843 | 136,887 | 9,875 | 31,052 | 95,029 | |||||||||||||||
| Letters of credit to be released |
10,747 | 10,747 | - | - | - | |||||||||||||||
| Pension Obligations |
415 | 40 | 80 | 83 | 212 | |||||||||||||||
| Health Benefits |
282 | 21 | 47 | 53 | 161 | |||||||||||||||
| Total |
889,739 | 346,423 | 144,860 | 220,334 | 178,122 | |||||||||||||||
|
|
|
|
|
|
|
|
|
|
|
|||||||||||
| (1) | Includes mortgage notes, real estate credit bills, agribusiness credit bills, financial credit bills, import and export financing and on-lending - domestic. |
| (2) | Includes subordinated debt, debentures and foreign borrowings through securities. |
| (3) | Includes total estimated interest payments (including for derivatives). These estimated interest payments were calculated substantially based on the interbank forward rates at the specific periods. |
| 5G. | Safe Harbor |
See “Forward-Looking Statements” of this annual report.
| ITEM 6. | DIRECTORS, SENIOR MANAGEMENT AND EMPLOYEES |
| 6A. | Directors and Senior Management |
Executive Committee
Our Executive Committee is responsible for conducting strategies for business and products developed by us and implementing guidelines proposed by the Board of Directors.
Our Executive Committee has a term of office of one year, which continues to be effective until the investiture of the members elected by the Board of Directors held immediately after the Annual Shareholders’ Meeting Executive Committee may be reelected.
135
Table of Contents
The table below presents the structure of our executive committee, composed of the CEO, two general directors and three vice presidents:
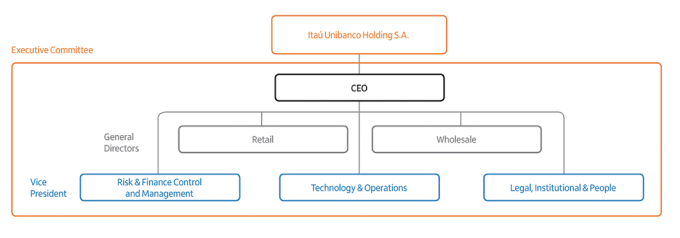
Changes in the Executive Committee – Board of Directors’ Meeting of September 27, 2018
In September 2018, we announced certain changes to our Executive Committee, as our Wholesale General Director Eduardo Vassimon reached the age limit imposed by our Bylaws, 60 years old on the date of the election, for exercising the duties of his position. In January 2019, Mr. Vassimon was succeeded by another current member of our Executive Committee, Caio Ibrahim David, who was previously the Executive Vice President of the Risks and Finance Area, Chief Financial Officer and Chief Risk Officer. Milton Maluhy Filho, who ended his term of office as CEO of Itaú Corpbanca in January 2019, replaced Mr. David as Vice President of Risks and Finance, Chief Financial Officer and Chief Risk Officer and joined our Executive Committee. These changes were approved by our Nomination and Corporate Governance Committee and our Board of Directors.
Change in the Board of Directors
On April 16, 2019, the resignation of Mr. Amos Genish was registered with the Board of Directors.
Annual Shareholder’s Meeting
On April 24, 2019 at our annual shareholders’ meeting Pedro Moreira Salles, Roberto Egydio Setubal, Alfredo Egydio Setubal, Ana Lúcia de Mattos Barretto Villela, Fábio Colletti Barbosa, Gustavo Jorge Laboissiére Loyola, João Moreira Salles, José Galló, Marco Ambrogio Crespi Bonomi, Pedro Luiz Bodin de Moraes and Ricardo Villela Marino were reelected as members of our Board of Directors, each for a term of one year. We deemed the directors Fábio Colletti Barbosa, Gustavo Jorge Laboissière Loyola, José Galló, Marco Ambrogio Crespi Bonomi and Pedro Luiz Bodin de Moraes to be independent members representing 45% of our Board of Directors. With respect to our Fiscal Council on the same date, Alkimar Ribeiro Moura was reelected as an effective member and João Costa was reelected as his alternate; José Caruso Cruz Henriques was reelected as an effective member and Reinaldo Guerreiro was reelected as his alternate. Eduardo Azevedo do Valle was reelected as an effective member and Débora Santille was elected as his alternate. The reelections of the members are subject to approval by the Central Bank.
136
Table of Contents
Our Board of Directors includes certain members with family relationships, as follows: Alfredo Egydio Setubal and Roberto Egydio Setubal are siblings, Pedro Moreira Salles is the father of João Moreira Salles, and Ana Lúcia de Mattos Barretto Villela and Ricardo Villela Marino are cousins.
Board of Officers and Members of our Audit Committee
On April 25, 2019 at the Meeting of the Board of Directors, the members of our Board of Officers and the members of our Audit Committee were reelected for a term of office of one year. The reelections of the members are subject to approval by the Central Bank.
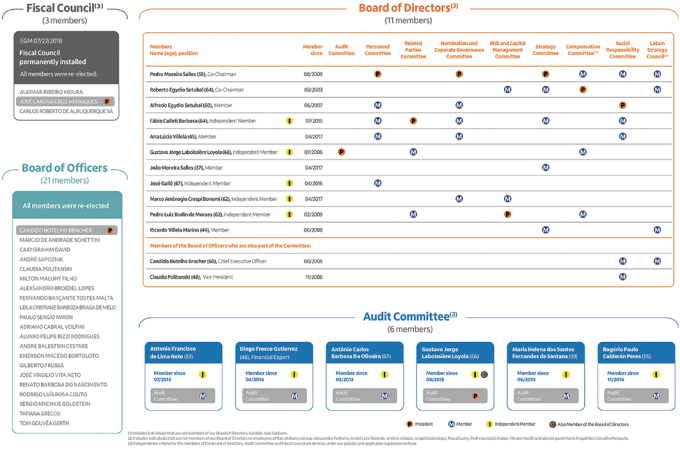
Board of Directors
Members of our Board of Directors have a term of office of one year, which will continue to be effective until the investiture of the members elected by our annual general stockholders’ meeting. Members of our Board of Directors may be reelected.
Pedro Moreira Salles (Co-Chairman) has held several positions within the Itaú Unibanco Group including Member of the Board of Directors since February 2009, and he was also the Chairman of the Board of Directors (August 2009 to April 2017) and Executive Vice President (November 2008 to August 2009) of Itaú Unibanco Holding S.A.
137
Table of Contents
He has also served as Vice Chairman of the Board of Directors (February 2010 to April 2012) of Banco Itaú BBA S.A.; Member of the Board of Directors (December 1989 to July 1990), Vice Chairman of the Board of Directors (July 1990 to December 2008), CEO (September 2004 to November 2008) and Director Vice President (November 2008 to October 2009) of Unibanco – União de Bancos Brasileiros S.A.; Vice Chairman of the Board of Directors (March 2008 to November 2008) and CEO (March 2007 to November 2008) of Unibanco Holdings S.A.; and Chairman of the Board of Directors (December 1995 to February 2009) of Unibanco Seguros S.A.
Mr. Salles has also been a Chairman of the Board of Directors and CEO of Companhia E. Johnston de Participações since 2008.
He has also a Chairman since June 2018; was a Member of the Board of Directors (November 2008 to June 2015) and has been CEO (June 2015 to June 2018) at IUPAR – Itaú Unibanco Participações S.A., having previously served as Chairman (November 2008 to April 2012); Member of the Board of Directors of Totvs S.A. (March 2010 to September 2017).
He has served as Vice Chairman of the Board of Directors of Porto Seguro S.A. (November 2009 to March 2012) and as Chairman of the Board of Directors of E. Johnston Representação e Participações S.A. (2001 to February 2009).
Mr. Salles has also been the Chairman of the Steering Committee of the Brazilian Federation of Bank Associations (FEBRABAN) since March 2017.
He has a Bachelor’s degree, magna cum laude, in Economics and History from the University of California, Los Angeles. He also attended the international relations master’s program at Yale University and the OPM – Owner/President Management Program at Harvard University, both in the United States.
Roberto Egydio Setubal (Co-Chairman) has held several positions within the Itaú Unibanco Group including CEO (November 1995 to April 2017), Vice Chairman of the Board of Directors (March 2003 to April 2017) and Chairman of the International Advisory Board (March 2003 to April 2009) at Itaú Unibanco Holding S.A.
Mr. Setubal has been a Member of the Board of Directors and of the Audit Committee of Royal Dutch Shell (Netherlands) since October 2017.
He has also served as CEO (April 1994 to March 2015), General Director (July 1990 to April 1994) and Member of the Board of Directors (May 1991 to March 2003) at Itaú Unibanco S.A.
Mr. Setubal was also Chairman of the Board of Directors (November 2004 to April 2015) at Banco Itaú BBA S.A.; CEO (November 2008 to April 2011) at Unibanco – União de Bancos Brasileiros S.A.; and Chairman of the Board of Directors (July 2005 to April 2013) and CEO (March 2005 to July 2008) at Itauseg Participações S.A.
He has served as Director Vice President since May 1994 at Itaúsa – Investimentos Itaú S.A. and Chairman of the Accounting Policies Committee from August 2008 to April 2011.
Since 1994 he has been a Member of the Board of the International Monetary Conference. He was President of the National Federation of Banks – FENABAN and of the Brazilian Federation of Bank Associations – FEBRABAN (April 1997 to March 2001) and President of the Advisory Board of FEBRABAN (October 2008 to March 2017). In April 2000, Mr. Setubal became a Member of the Trilateral Commission and the International Board of the NYSE and in 2002 he became a Member of the International Advisory Committee of the Federal Reserve Bank of New York. In 2010, he became a Member of the China Development Forum and, since 2015, he has been a Co-Chairman of the WEF (World Economic Forum) 2015. He has also been a member of the Economic and Social Development Board of the Presidency of the Republic of Brazil (CDES) since November 2016.
He has a Bachelor’s degree in Production Engineering from the Polytechnic School of the University of São Paulo (USP), Brazil (1977) and a Master’s degree in Science Engineering from Stanford University, United States (1979).
Alfredo Egydio Setubal (Member) has held several positions within the Itaú Unibanco Group including Director Vice President (March 2003 to March 2015) and Investor Relations Officer (March 2003 to February 2015) at Itaú Unibanco Holding S.A.
He was Chairman of the Board of Directors (April 2008 to April 2013) of Investimentos Bemge S.A.; and Vice President (April 1996 to March 2015), Investor Relations Officer (1995 to 2003), Executive Officer (May 1993 to June 1996) and Managing Officer (1988 and 1993) at Itaú Unibanco S.A.
138
Table of Contents
Mr. Setubal has also served as CEO and Investor Relations Officer since May 2015, Vice Chairman of the Board of Directors since September 2008, Coordinator since May 2015 and Member of the Ethics, Disclosure and Trading Committees since May 2009 and of the Investment Policies Committee from August 2008 to April 2011 at Itaúsa – Investimentos Itaú S.A.
He was Vice President (1994 to August 2003) and President (August 2003 to August 2008) of the National Association of Investment Banks (ANBID), and Member of the Board of Directors (1999 to 2009) of the Brazilian Institute of Investors Relations (IBRI) and has been the Chairman of its Superior Guidance, Nomination and Ethics Committee since 2009.
Mr. Setubal has also served as Member of the Advisory Board of the Association of Broker-Dealers (ADEVAL) since 1993; Member of the Board of Directors at Brazilian Association of Listed Capital Companies (ABRASCA) (1999 to 2017); and Financial Officer of São Paulo Museum of Modern Art – MAM since 1992.
He has a Bachelor’s and postgraduate degrees in Business Administration from the Getulio Vargas Foundation (FGV), São Paulo, Brazil, with a specialization course at INSEAD (France).
Ana Lúcia de Mattos Barretto Villela (Member) has held several positions within the Itaú Unibanco Group. Was Member of the Board of Directors at Itaú Unibanco S.A. from June 1996 to July 2001 and Member of the Board of Trustees since 1995 and Member of the Executive Board since February 2017 at Itaú Cultural and Member of the Guiding Group since February 2017 at Itaú Social.
Ms. Villela has also been a Alternate Member of the Board of Directors since June 2018 of IUPAR – Itaú Unibanco Participações S.A.; Vice Chairman of the Board of Directors (Non-Executive Member) since April 2017 of Itaúsa – Investimentos Itaú S.A.; Member of the Sustainability Committee since April 2015 of Duratex S.A.; Co-Founder since September 2014 of AlanaLab (Maria Farinha Filmes, Flow, JungleBee); Founding President since April 2012 of Alana Foundation; CEO of Instituto Alana since April 2002; Member of Advisory Board at Instituto Brincante since 2001 and Fellow Ashoka since 2010.
She was a Member of the Innovation Board of XPRIZE since August 2018. First representative from Latin America on the Innovation Board of XPRIZE, a non-profit organization created by Peter Diamandis, who idealizes and manages global competitions to encourage the development of new technologies that may help solve some of mankind’s major challenges.
She was a Member of the Advisory Board at Instituto Akatu (June 2013 to December 2017); Member of the Advisory Board at Commercial Free Childhood (CCFC) (December 2015 to December 2017) and Member of the Advisory Board at Conectas (2003 to January 2018).
She has a Bachelor’s degree in Teaching with a minor in School Management (1996) from Pontifícia Universidade Católica de São Paulo (PUC-SP); Master’s degree in Educational Psychology (2003) from Pontifical Catholic University of São Paulo (PUC-SP); Graduation in Business administration from FAAP (incomplete) and Post-graduation in Administration in the Third Sector from the Fundação Getúlio Vargas (incomplete).
Fábio Colletti Barbosa (Independent Member) has been a Member of the Board of Directors of Natura Cosméticos S.A. since May 2017 and a Member of the Board of Directors of Cia. Hering since May 2017.
He was CEO (September 2011 to March 2014) at Abril Comunicações S.A.; Chairman of the Board of Directors (January 2011 to September 2011) at Banco Santander (Brasil) S.A.; Chairman of the Board of Directors (August 2008 to December 2010) at Banco Santander S.A.; and CEO (1998 to 2008) at Banco Real S.A.
Mr. Barbosa has also served as Chairman of the Board of Directors at Fundação OSESP since 2012; Member of the Governing Council at Insper—Instituto de Ensino e Pesquisa since 2010; Board Member at UN Foundation (USA) since 2011; Member of the Board of Directors at Instituto Empreender Endeavor since 2008; Member of the Board of Directors at Almar Participações S.A. since 2013; and Member of the Investment Committee at Gávea Investments since September 2015.
He has a Bachelor’s degree in Economics from the School of Economics of the Getulio Vargas Foundation (FGV), São Paulo, Brazil, and a Master’s degree in Business Administration from the Institute for Management Development, Lausanne, Switzerland.
Gustavo Jorge Laboissière Loyola (Independent Member) was a Member of the Fiscal Council (March 2003 to April 2006) of Itaú Unibanco Holding S.A.
139
Table of Contents
He has been a partner at Tendências Consultoria Integrada S/S Ltda. since November 2002 and at Tendências Conhecimento Assessoria Econômica Ltda. since July 2003 and a Managing Partner at Gustavo Loyola Consultoria S/C since February 1998.
Mr. Loyola was Governor (November 1992 to March 1993) and (June 1995 to November 1997) of the Central Bank of Brazil and Governor of the National Financial System Regulation and Organization (March 1990 to November 1992).
He has a Bachelor’s degree in Economics from the University of Brasília (1979) and a PhD in Economics from the Getulio Vargas Foundation, Rio de Janeiro, Brazil (1983).
João Moreira Salles (Member) has held several positions within the Itaú Unibanco Group including Member of the Board of Directors of IUPAR—Itaú Unibanco Participações S.A. (June 2015 to June 2018) and Officer since June 2018. He also served as Economist of Banco Itaú BBA Creditanstalt S.A. (2002 to 2003).
He is currently an Officer of Brasil Warrant Administração de Bens e Empresas S.A, where, since 2013, he has been co-responsible for the management of BW Gestão de Investimentos (BWGI) and Member of the Investment (CO-CIO), Risk and Operational Committees; Member of the Advisory Board of Cambuhy Agrícola and responsible for the monitoring of other BWSA subsidiaries.
He has been a Partner of Cambuhy Investimentos since 2013; Member of the Investment Committee since 2013; and was Member of the Board of Directors of investee Parnaíba Gás Natural (2014 to 2017).
He was an Investment Banker of J. P. Morgan Chase, NY, U.S. (2011 to 2013), and the Chief Economist of ForeSee Asset Management, SP, Brazil (2003 to 2005).
He has a Bachelor’s degree in Economics from INSPER (IBMEC-SP) (2003); Master’s degrees in Economics from Columbia University, GSAS, NY, U.S. (2007), and a Master’s degree in Finance from Columbia University, GSB, NY, U.S. (2009). He also has a PhD degree in Economic Theory from University of São Paulo (USP) (FEA) (2012).
José Galló (Independent Member) has been a Member of the Board of Directors of Lojas Renner S.A. since 1998 and CEO since March 1999 and he was also the Chairman of the Board (1999 to 2005) and Superintendent Director (September 1991 to March 1999).
Mr. Galló has also served as Officer at Renner Administradora de Cartões de Crédito Ltda. since September 2005; Officer at Dromegon Participações Ltda. since September 2005; Officer at LR Investimentos Ltda. since August 2008 and Officer at Realize Participações S.A. since December 2015.
He also was CEO (December 2016 to August 2017) at Realize Crédito, Financiamento e Investimento S.A. and Member of the Board of Directors (April 2007 to May 2016) at SLC Agrícola S.A.
Mr. Galló has served as a Member of the Governing Council at Instituto Lojas Renner since June 2008; Officer at Rumos Consultoria Empresarial Ltda. since March 1987; Member of the Board of Directors at Localiza Rent a Car S.A. since October 2010; and Member of the Board of Directors at the Institute for the Development of the Retail Segment (IDV) since July 2004.
He has also been Vice Chairman of the Retail Managers Chamber of the State of Porto Alegre since June 2004.
He has a Bachelor’s degree in Business Administration from the School of Business Administration of the State of São Paulo of the Getulio Vargas Foundation (FGV), Brazil (1974).
Marco Ambrogio Crespi Bonomi (Member) has held several positions within the Itaú Unibanco Group including General Director (July 2015 to April 2017) of Itaú Unibanco Holding S.A.
He has also served as General Director (April 2015 to April 2017), Director Vice President (April 2007 to March 2015), Executive Officer (April 2004 to April 2007), Senior Managing Officer (October 2000 to April 2004), Managing Officer (August 1998 to October 2000) at Itaú Unibanco S.A.
Mr. Bonomi was also Executive Officer (November 2008 to June 2014) at Unibanco – União de Bancos Brasileiros S.A. and Vice President (April 2004 to April 2011) of the Brazilian Association of Credit, Financing and Investment Institutions (ACREFI).
140
Table of Contents
He has a Bachelor’s degree in Economics from FAAP—Armando Álvares Penteado Foundation, São Paulo, Brazil (1978) and attended a Financial Executive Advanced course at the Getulio Vargas Foundation (FGV), Brazil (1982) and a course on Capital Markets at New York University (1984).
Pedro Luiz Bodin de Moraes (Independent Member) has been a partner at Cambuhy Investimentos Ltda. since 2011 and at Ventor Investimentos Ltda. since 2009.
He was a Member of the Board of Directors (July 2003 to December 2008) of Unibanco – União de Banco Brasileiros S.A.; Officer (2002 to 2003) and Partner (2005 to 2014) at Icatu Holding S.A. and Officer and Partner (1993 to 2002) at Banco Icatu S.A.
Mr. Moraes has also served as Monetary Policy Director (1991 to 1992) at the Central Bank of Brazil and as Officer (1990 to 1991) at the Brazilian Bank for Social and Economic Development (BNDES).
He has Bachelor’s and Master’s degrees in Economics from the Pontifical Catholic University of Rio de Janeiro – PUC-RJ and a PhD in Economics from the Massachusetts Institute of Technology (MIT).
Ricardo Villela Marino (Member) has held several positions within the Itaú Unibanco Group including Executive Vice President at Itaú Unibanco S.A. (August 2010 to April 2018) and also was Executive Officer (September 2006 to August 2010), Senior Managing Officer (August 2005 to September 2006) and Managing Officer (December 2004 to August 2005).
He has also been an Alternate Member of the Board of Directors of Itaúsa – Investimentos Itaú S.A. since April 2011, Alternate Member of the Board of Directors of Duratex S.A. since April 2009, Alternate Member of the Board of Directors of Itautec S.A. since April 2009 and Alternate Member of the Board of Directors of Elekeiroz S.A. (April 2009 to June 2018).
He has a Bachelor’s degree in Mechanical Engineering from the Polytechnic School of the University of São Paulo (USP) (1996) and a Master’s degree in Business Administration from MIT Sloan School of Management, Cambridge, U.S. (2000).
Board of Officers
Members of our Board of Officers have a term of office of one year, which will continue to be effective until the investiture of the members elected by the meeting of the Board of Directors to be held immediately after our annual general stockholders’ meeting. Members of our Board of Officers may be reelected.
Candido Botelho Bracher (CEO) has held several positions within the Itaú Unibanco Group including Wholesale Banking General Manager (July 2015 to May 2017), Vice President (August 2005 to June 2015) and Member of the Board of Directors (February 2009 to April 2017) at Itaú Unibanco Holding S.A.
He has also served as Vice Chairman of the Board of Directors (March 2013 to April 2015), Member of the Board of Directors (November 2004 to March 2013), CEO (August 2005 to January 2017), and Vice President (November 2005 to August 2005) at Banco Itaú BBA S.A.
Mr. Bracher was also a Member of the Board of Directors (April 2009 to June 2014) of B3, an Alternate Member of the Board of Directors (September 1999 to June 2005); a Member of the Board of Directors (June 2005 to March 2013) of Pão de Açúcar—Companhia Brasileira de Distribuição; Officer and Partner (1988 to 2003), Member of the Board of Directors (May 2003 to April 2005), Vice President (May 2003 to April 2005) and Officer (December 1988 to May 2003) at Banco Itaú BBA Creditanstalt S.A.
He has a Bachelor’s degree in Business Administration from the School of Business Administration of the Getulio Vargas Foundation (FGV), Brazil (1980).
Caio Ibrahim David (General Manager) has held several positions within the Itaú Unibanco Group including Vice President (January 2017 to December 2018) and Executive Officer (June 2010 to April 2015) at Itaú Unibanco Holding S.A.
He has served as General Manager since February 2019 at Itaú Unibanco S.A. and Director Vice President (May 2013 to January 2019) and was also an Executive Officer (May 2010 to April 2013). He joined the Group in 1987 as a trainee and has worked in the Controller’s, Market and Liquidity Risk Control and Treasury departments. He has been a Member of the Board of Directors of Itaú Corpbanca S.A. since January 2019.
Mr. David is CEO since January 2019 and was Executive Officer (May 2008 to April 2010), Officer (November 2004 to April 2008) at Banco Itaú BBA S.A. He has worked in the Finance, Risks, Market Intelligence, Products and Operations departments.
141
Table of Contents
He has been a Member of the Board of Directors of Investimentos Bemge S.A. (April 2012 to April 2018) and was its Director Vice President (October 2010 to April 2013) and Officer at Banco Itaú BBA Creditanstalt S.A. (July 2003 to April 2005).
He has also been a Member of the Board of Directors at Dibens Leasing S.A. – Arrendamento Mercantil (July 2010 to April 2018) and was an Executive Officer (April 2010 to April 2013) and CEO (May 2013 to March 2015) at Itauseg Participações S.A.
Mr. David has served as Vice Chairman of the Board of Directors (June 2010 to December 2012) and Member of the Board of Directors (May 2010 to December 2012) of Redecard S.A.
He has a Bachelor’s degree in Engineering from Mackenzie University (1986 to 1990) and a postgraduate degree in Economics and Finance from the University of São Paulo (USP) (1992 to 1993). He also has a Master’s degree in Controllership from the University of São Paulo (USP) (1994 to 1997) and an MBA from New York University (1997 to 1999) with specialization in Finance, Accounting and International Business.
Márcio de Andrade Schettini (General Manager) has held several positions within the Itaú Unibanco Group including General Director at Itaú Unibanco S.A. since April 2015 and Director Vice President (November 2008 to March 2015).
He was also an Director Vice President (April 2004 to April 2009) at Unibanco – União de Bancos Brasileiros S.A.
He has a Bachelor’s degree in Electric Engineering and a Master’s degree from the Pontifical Catholic University of Rio de Janeiro, where he also attended a specialization course on mathematical systems and modeling. He also has Master’s degree in Finance from the University of London – SOAS and attended the OPM – Owners/President Management Program at Harvard University.
André Sapoznik (Vice President) has held several positions within the Itaú Unibanco Group including Director Vice President at Itaú Unibanco S.A. since December 2016, Executive Officer (December 2011 to December 2016) and Officer (April 2009 to December 2011).
He joined Unibanco in 1998.
He has a Bachelor’s degree in Production Engineering from the Polytechnic School of the University of São Paulo (USP) and an MBA from Stanford University Graduate School of Business.
Claudia Politanski (Vice President) has held several positions within the Itaú Unibanco Group including Executive Officer (November 2008 to March 2015) at Itaú Unibanco Holding S.A.
She has been Director Vice President at Itaú Unibanco S.A. since July 2013 and was also an Executive Officer (February 2010 to July 2013).
Ms. Politanski was also an Executive Officer (August 2007 to July 2014), an Officer (February 2006 to August 2007) and a Deputy Officer (July 2003 to February 2006) at Unibanco – União de Bancos Brasileiros S.A.
She has a Bachelor’s degree in Law from the University of São Paulo (USP) (1992) and a Master’s degree in Law from the University of Virginia.
Milton Maluhy Filho (Vice President) has held several positions within the Itaú Unibanco Group including Director Vice President at Itaú Unibanco S.A. since February 2019 and Member of the Board of Directors since January 2019 at Itaú Corpbanca S.A. and CEO of Itaú CorpBanca (April 2016 to December 2018). He is currently CFO and CRO of the Itaú Unibanco Group.
He has been Executive Officer (August 2013 to March 2016), an Officer (April to August 2013); Foreign Trade Analyst (June 1995 to June 1996) and Foreign Trade Desk Manager (January 2002 to March 2003) at Itaú Unibanco S.A. He served as CEO at Redecard S.A. (October 2012 to March 2016).
Mr. Maluhy Filho was also Executive Officer (March 2010 to April 2012) at Banco Itaú BBA S.A. as responsible for the Products and Clients Desks area. He was an Officer from July 2007 and responsible for the Campinas Branch to March 2009 and as responsible for the Financial Institutions and Funding Area (April 2009 to February 2010). Mr. Maluhy Filho joined Itaú BBA in March 2003, and held the positions of Foreign Trade Senior Officer and Financial Institutions Senior Officer. Mr. Maluhy Filho was responsible for the relationship and trading of operations with Financial Institutions (December 2004 to July 2007).
142
Table of Contents
He has a Bachelor’s degree in Business Administration from Fundação Armando Álvares Penteado (FAAP).
Alexsandro Broedel (Executive Officer) has held several positions within the Itaú Unibanco Group including Group Chief Accounting Officer and Group Controller from August 2012 to March 2015 and Finance Executive Officer since 2015 and Investor Relations Officer at Itaú Unibanco Holding S.A. since October 2017.
At Itaú Unibanco S.A., he has been an Executive Officer since March 2015 and was also an Officer (May 2012 to March 2015).
He has also served as Chairman of the Board of Directors since April 2018 and CEO at Investimentos Bemge S.A. since February 2018, has been a Officer (June 2012 to February 2018) and Investor Relations Officer since October 2017; Officer at Itauseg Participações S.A. since June 2012; Chairman of the Board of Directors since April 2018 and Officer at Dibens Leasing S.A. – Arrendamento Mercantil since August 2012 and Investor Relations Officer since October 2017.
Mr. Broedel has been Full Professor of Accounting and Finance at Universidade de São Paulo since 2002, teaching in graduate, master and postgraduate programs and was a Commissioner (2010 to 2012) at the Brazilian Securities Commission (CVM).
He was a Consultant (2008 to 2009) at Mattos Filho, Veiga Filho, Marrey Jr. e Quiroga Advogados and a Member of the Audit Committee (2012) of B3.
Mr. Broedel has also been a Member of the Board of Directors of CETIP S.A.—Mercados Organizados (CETIP S.A. – The Organized Over-the-counter Market in Assets and Derivatives) (May 2013 to March 2017); a Member of the International Accounting Standards Board (IASB) since 2010; a Member of the Board of Directors of IRB Brasil Resseguros since 2015; and a Member of International Integrated Reporting Committee – IIRC since 2014.
He is also Full Professor at FEA-USP and was Professor (2001 to 2002) at EAESP-FGV; Professor (2005) at Manchester Business School; and Visiting professor at London School of Economics.
He has a PhD in Accounting and Finance from Manchester Business School (2008); a PhD in Controllership and Accounting from the University of São Paulo (USP) (2001); a Bachelor’s degree in Accounting (1997) from the University of São Paulo (USP); and a Bachelor’s degree in Law from the University of São Paulo—USP (2012).
Fernando Barçante Tostes Malta (Executive Officer) has held several positions within the Itaú Unibanco Group including Executive Officer at Itaú Unibanco S.A. since March 2015, working for the Executive Boards of Office of Internal Controls and Compliance from March 2016 up to this date; Cards Operations, Rede (Redecard), Mortgage Loans, Vehicle Financing, Consortia, Collection, Legal Operations, and all active customer services of Itaú Unibanco (February 2015 to February 2016).
Also at Itaú Unibanco S.A., Mr. Malta was an Officer in Customer Service, Operations and Card Services, Mortgage Loans, Vehicle Financing, Consortia, Insurance and Capitalization Operations (March 2013 to January 2015); a Customer Service, Operations and Services Officer of Consumer Credit (cards and financing companies) (May 2011 to February 2013); Customer Service Officer of the Consumer Credit department (cards and financing companies) (February 2009 to April 2011); and a Channel and CRM Officer (Unibanco, prior to the merger) (December 2004 to January 2009).
He started his career in 1988, working in many different positions.
Mr. Malta has also worked in the management of the Channels, Branches and Institutional Portfolio departments and participated in a number of projects/initiatives (1995 to 2008) at Unibanco – União de Bancos Brasileiros S.A.
He has also served as Alternate Member of the Board of Directors of Tecnologia Bancária S.A.; Deputy Member of the Board of Directors of Luizacred S.A. Sociedade de Crédito, Financiamento e Investimento; and as Alternate Member of the Board of Directors of Financeira Itaú CBD Crédito, Financiamento e Investimento and Banco Carrefour S.A.
He has a Bachelor’s degree in Information Technology from the Pontifical Catholic University of Rio de Janeiro – PUC-RJ (1989) and an MBA from the Dom Cabral Foundation (1998). Mr. Malta also attended an extension course in Strategy from the Kellogg School of Management (FDC) (2003) and an extension course in Banking Management from the Swiss Finance Institute (2011).
143
Table of Contents
Leila Cristiane Barboza Braga de Melo (Executive Officer) has held several positions within the Itaú Unibanco Group including Executive Officer at Itaú Unibanco S.A. (since April 2015) and Officer (February 2010 to March 2015). She has been working at the conglomerate for over 20 years and is currently responsible for the entire Legal Department, which encompasses Legal—Litigation, Legal—Retail Business, Legal—Wholesale Business and Legal—Institutional and International. Since 2014, she has also been working as the Ombudsman Officer.
Ms. Melo has also served as Deputy Officer (October 2008 to October 2009) at Unibanco – União de Bancos Brasileiros S.A. She joined Unibanco in 1997, working in the Legal Advisory Department of Unibanco in operations involving banking products, credit card, and real estate and vehicle financing, and in projects related to mergers and acquisitions, corporate restructuring processes and capital markets, among others.
She is also a Member of the International Women’s Forum (IWF) and a Member of W.I.L.L. – Women in Leadership in Latin America (organization with international coverage focused on improving the individual and collective value of women in leadership positions in Latin America).
Ms. Melo has also worked in the Project Finance and Securities Departments of the Debevoise & Plimpton firm in New York and on the Women Up Program – Building a Global Leadership Community promoted by McKinsey & Company, Inc.
She has a Bachelor’s degree in Law from the University of São Paulo (USP) and attended a Specialization course on Financial Law and Capital Markets from the Brazilian Institute of Capital Markets and on Fundamentals of Business Law from New York University (NYU).
Paulo Sergio Miron (Executive Officer) is a Member of the Audit Committee of Porto Seguro S.A.; Member of the Fiscal Council of the Maria Cecilia Souto Vidigal Foundation; and an Executive Officer of the Unibanco Institute.
He was a Partner at PricewaterhouseCoopers, São Paulo, Brazil (1996 to 2015) and the partner responsible for the audit work at large Brazilian financial conglomerates, including Unibanco – União de Bancos Brasileiros (1997 to 2000), Banco do Brasil (2001 to 2005) and Itaú Unibanco S.A. (2009 to 2013).
At PricewaterhouseCoopers, Brasília, Federal District (DF), Brazil, Mr. Miron was a Partner (2001 to 2008) and he also was the partner responsible for PwC Brazil’s department for the provision of services to the government (2004 to 2008) and the partner responsible for PwC Brazil’s banking department (1997 to 2008).
He was also the coordinator of PwC Brazil’s department of training at financial institutions for over 10 years and worked as a college professor for a number of years teaching courses related to the financial market.
He is a member of the Brazilian Institute of Accountants and a speaker at many seminars related to financial instruments and auditing.
He has a Bachelor’s degree in Accounting from the São Judas Tadeu University, São Paulo, Brazil, and in Economics from Mackenzie University, São Paulo, Brazil.
Adriano Cabral Volpini (Officer) has held several positions within the Itaú Unibanco Group including Corporate Security Officer at Itaú Unibanco S.A. since July 2012.
Also at Itaú Unibanco S.A., Mr. Volpini has served as Superintendent of Prevention of Unlawful Acts (August 2005 to March 2012), Manager of Prevention of Unlawful Acts (January 2004 to July 2005), Inspection Manager (June 2003 to December 2003), Inspector (January 1998 to March 2003) and Auditor (May 1996 to December 1997) and worked in the Branch Operation Department (March 1991 to April 1996). He also holds a management position in many companies of the Itaú Unibanco Group.
He has also been an Officer at Banco Itaú BBA S.A. (April 2016 to November 2018) and an Officer at Dibens Leasing S.A. – Arrendamento Mercantil (January 2014 to November 2018) where he also worked as Executive Officer (June 2012 to January 2014).
He has a Bachelor’s degree in Social Communication from the Armando Álvares Penteado Foundation – FAAP (1991 to 1995), a postgraduate degree in Accounting and Financial Administration from the Armando Álvares Penteado Foundation – FAAP (1998 to 2000), and an MBA in Finance from the Brazilian Institute of Capital Markets—IBMEC (2000 to 2002).
Álvaro Felipe Rizzi Rodrigues (Officer) has held several positions within the Itaú Unibanco Group including Officer at Itaú Unibanco S.A. since October 2014; Legal Superintendent (July 2008 to August 2014) and Legal Manager (March 2006 to July 2008).
144
Table of Contents
Also at Itaú Unibanco S.A., Mr. Rodrigues worked as Coordinator and Supervisor of Legal M&A (Mergers and Acquisitions) Department, Domestic Corporate Legal Department and Corporate Governance, Paralegal Corporate Affairs Department, Legal Department – Contracts, Equity, Marketing and Third Sector, and International Legal Department (responsible for the matrix management of the legal teams of the Itaú Unibanco Group’s foreign units and for the monitoring and assessment of the main legal issues regarding these units), and Legal Retail Business Department (responsible for the legal issues related to products and services of the retail banking and insurance company).
He has also served in the Corporate Law and Contracts Law departments (August 1998 to February 2005) of Tozzini Freire Advogados.
He has a Bachelor’s degree in Law from the Law School of the University of São Paulo (USP) (1999). He also attended a Specialization course in Business Law from the Pontifical Catholic University of São Paulo – PUC-SP (2001) and has a Master’s degree (“Master at Laws” – L.L.M.) from Columbia University Law School in New York, U.S. (2004).
Andre Balestrin Cestare (Officer) has held several positions within the Itaú Unibanco Group including Officer of Itaú Unibanco S.A. since August 2017, where he was the Finance Superintendent responsible for the financial planning of the Retail Banking, the analysis and disclosure of results and changes from budget; budgeting and monitoring the performance of products under Retail management (April 2016 to July 2017); he was also responsible for the Accounting Management of Loan Operations and contact to regulatory bodies, including sending regulatory information on loan portfolio, and calculating and controlling the allowance for loan losses (June 2015 to April 2016); responsible for preparing, analyzing and disclosing the managerial budget, calculating managerial result by product, sales channel and operation, and costing model calculations (June 2014 to June 2015); responsible for preparing, analyzing and disclosing the managerial budget (June 2012 to June 2014), and responsible for calculating the Treasury managerial result, providing support to management of structural and proprietary positions, and supporting the Treasury result budget (June 2010 to June 2012).
He has also been an Officer of Investimentos Bemge S.A. since August 2017.
He has a Bachelor’s degree in Mechanical Engineering from Polytechnic School of the University of São Paulo (USP) (2000), a Postgraduate degree in Business Administration from Getulio Vargas Foundation (FGV), São Paulo, Brazil (2002), and a Professional Master’s degree in Finance and Economics from Getulio Vargas Foundation (FGV), São Paulo, Brazil (2007). He also attended the Executive Qualification Program from Dom Cabral Foundation (2016).
Emerson Macedo Bortoloto (Officer) joined Itaú Unibanco S.A. in July 2003, assuming positions in the Internal Audit Department. Since November 2008, he has been responsible for assessing processes related to market, credit and operational risks, in addition to project auditing and continuous auditing. He was also responsible for auditing the information technology and retail credit analysis and granting processes.
He has a Bachelor’s degree in Data Processing Technology from Faculdades Integradas Tibiriça, a postgraduate degree in Audit and Consulting in Information Security from Faculdades Associadas de São Paulo (FASP) and in 2004, he obtained the CISA certification issued by the Information Systems Audit and Control Association (ISACA). He also has a MBA in Internal Auditing from Institute of Accounting, Actuarial and Financial Research Foundations (FIPECAFI).
Gilberto Frussa (Officer) has held several positions within the Itaú Unibanco Group including Corporate Compliance Officer at Itaú Unibanco S.A. since March 2017. He has been an Officer since April 2014 and he worked as Retail Products and Business Legal Officer (April 2016 to March 2017).
Mr. Frussa has also been an Officer at Dibens Leasing S.A. since June 2017 and Officer at Banco Itaú BBA S.A. since June 2017. At Itaú BBA S.A., he was also an Officer (June 2006 to February 2016) and an Attorney (April 1995 to June 2006).
He was also a partner (October 1993 to April 1995) at Carvalho Pinto, Monteiro De Barros, Frussa & Bohlsen – Advogados, responsible for the banking law department, an Attorney (October 1989 to October 1993) at Banco BBA-Creditanstalt S.A. and a Law trainee and legal assistant in the Contracts and Intellectual Property departments (September 1986 to May 1989) at Pinheiro Neto – Advogados.
Mr. Frussa was also Chairman of the Legal Affairs Committee (2012 to 2015) of the Brazilian Association of Financial and Capital Markets Entities – ANBIMA and an Effective Member of the Appeals Board of the National Financial System – CRSFN in the capacity of representative of the National Association of Investment Banks – ANBID (2000 to 2003) and in the capacity of representative of Brazilian Association of Financial and Capital Markets Entities – ANBIMA (2011 to 2013).
145
Table of Contents
He has a Bachelor’s degree in Law from the University of São Paulo (USP) (1989).
José Virgilio Vita Neto (Officer) has held several positions within the Itaú Unibanco Group including Officer at Itaú Unibanco S.A. since October 2011.
He joined Unibanco—União de Bancos Brasileiros S.A. in February 2000 and worked as a lawyer until June 2003. He was responsible for the wholesale banking’s legal consulting department, particularly, structured operations and real estate loans. Mr. Vita worked as Legal Manager (June 2003 to June 2008), being responsible for the wholesale banking’s legal department, including, particularly, structured operations, real estate loans, foreign exchange, derivatives and project financing; retail legal consulting and administrative and investigative proceedings, including those related to consumer protection bodies. He also worked as Legal Superintendent (June 2008 to October 2009), responsible for retail legal consulting, administrative and investigative proceedings, litigation for major cases and public-interest civil actions. At the Itaú Unibanco’s structure, he served as Legal Superintendent (December 2009 to March 2011), being responsible for the Retail Legal Consulting, litigation for major cases and public-interest civil actions, management of appeals in higher courts, administrative and investigative proceedings, tax administrative proceedings and criminal cases.
He has a Bachelor’s degree in Law from the University of São Paulo (USP) (2000), a Master’s degree in Civil Law – Contracts from the University de Salamanca, Spain, (2006), and a PhD in Civil Law – Contracts from the University of São Paulo (USP) (2007).
Renato Barbosa do Nascimento (Officer) has held several positions within PricewaterhouseCoopers Auditores Independentes (São Paulo, Brazil), including Audit Partner from July 2009 to July 2017. He took part in a three-year professional exchange program (July 2014 to July 2017) and worked at PricewaterhouseCoopers in Mexico City, in Mexico, as audit officer to lead external audits in subsidiaries of international entities of the financial industry in Mexico. His main responsibility as Audit Partner was to lead external audits in entities of the financial industry in São Paulo (July 2009 to July 2017). In this period, Mr. Nascimento was also responsible for following up external audits carried out by the PricewaterhouseCoopers teams of the United States, United Kingdom, Switzerland, Portugal, Chile, Argentina, Paraguay and Uruguay in favor of subsidiaries of Brazilian financial institutions in these countries.
Also at PricewaterhouseCoopers Auditores Independentes (São Paulo, Brazil) he has been Audit Senior Manager of the financial industry (March 2008 to July 2009), and his main responsibility was to manage teams in charge of carrying out audits of entities of the financial industry, regulated by the Central Bank of Brazil. Mr. Nascimento served as Audit Senior Manager of the financial industry (February 2006 to March 2008), and took part in a two-year professional exchange program working at PricewaterhouseCoopers in London, United Kingdom, as audit senior manager, and his main responsibilities were managing external audits of British financial institutions in England, managing external audits of subsidiaries of international banks, as well as the resulting development of knowledge on the application of the International Financial Reporting Standards (IFRS), Sarbanes Oxley (SOx) rules and policies issued by the Public Company Accounting Oversight Board (PCAOB).
He has a Bachelor’s degree in Accounting from Paulista University (1998) and a Bachelor’s degree in Business Administration from Paulista University (1999). He also has a Master’s degree in Business Administration (MBA) from Getulio Vargas Foundation (FGV), São Paulo, Brazil (2003).
Rodrigo Luís Rosa Couto (Officer) has held several positions within the Itaú Unibanco Group including Corporate Risk Superintendent (February 2008 to December 2011) at Itaú Unibanco Holding S.A. and has been an Officer at Banco Itaú BBA S.A. Officer since June 2015.
He has also been an Officer at Dibens Leasing S.A. – Arrendamento Mercantil since January 2014 and an Officer at Itaú Unibanco S.A. since December 2011.
Mr. Couto was an Associate (September 2005 to February 2008) at McKinsey & Company and Inspector (1998 to 2003) at the Central Bank of Brazil.
He participated in an internship program at Financial Stability Institute of the BIS where he worked on the development and was a member of the teaching staff of a training course for bank supervisors of regulatory authorities worldwide (April to June 2003).
He has a Bachelor’s degree in Business Administration, Finance major, from the Federal University of Rio Grande do Sul (1993 to 1997), and a Master’s degree in Business Administration, Finance major, from The Wharton School, University of Pennsylvania (2003 to 2005).
146
Table of Contents
Sergio Mychkis Goldstein (Officer) has held several positions within the Itaú Unibanco Group including Officer at Itaú Unibanco S.A. since December 2015 and Officer at Banco Itaú BBA S.A. since December 2015.
At Banco Itaú BBA S.A., Mr. Goldstein was responsible for the Wholesale Legal and Tax departments, carrying out legal services in the following business lines: (i) Investment Banking: coordinating the performance of services in fixed income, variable income, M&A and structured operations; (ii) Treasury: coordinating the performance of services in treasury operations, mainly fund raising with the retail segment, private segment, and institutional investors; (iii) Wealth Management Services: coordinating the performance of the service in asset management operations of the Itaú Group, Private Banking, and custody, management and own and third parties’ fund management activities; (iv) Allocated Funds and Onlending: coordinating the performance of services to meet corporate banking demands with respect to allocated fund operations (rural and real estate) and onlending operations of funds from BNDES and other external lines; (v) Debt Restructuring: coordinating the performance of the services to meet the demands of the Debt Restructuring Department, both in the corporate and the largest companies in the middle-market segments, basically working on the restructuring of contracts – out of court; (vi) Cross Border Loans/F/X: coordinating the performance of services to meet the demands for granting foreign and cross border loans; (vii) High Volumes: coordinating the performance of services to meet the demands for banking products, such as working capital, selling, buying, assignment and discount operations. (viii) Tax Advisory and Litigation issues.
He has a Bachelor’s degree in Law from Pontifical Catholic University of São Paulo – PUC-SP (2000), and a Master’s degree in Banking and Finance from the Boston University School of Law, Boston (MA, U.S.) (2004).
Tatiana Grecco (Officer) has held several positions within the Itaú Unibanco Group including Officer of Itaú Unibanco S.A. since July 2017. She has been a Superintendent of Investment Funds since June 2014 in the Itaú Asset Management Department – Superintendency of Portfolio Solutions, being responsible for the portfolio solutions management desk of Itaú Asset Management, comprising the systematic, structured and smart beta funds, as well as the exclusive funds and portfolios of Itaú’s Private, Corporate and Institutional clients; Superintendent of Investment Funds since January 2009 in the Itaú Asset Management Department – Superintendency of Indexed Funds, being responsible for the indexed fund management desk of Itaú Asset Management, comprising both Fixed Income and Variable Income funds – funds and ETF’s based on both local and international indexes; Superintendent of Technical Reserves and Manager of Senior Portfolios (October 2001 to December 2008) in the Itaú Asset Management Department – Superintendency of Technical Reserves, responsible for the technical reserves management desk of insurance and capitalization companies and open and closed pension entities of the Itaú conglomerate.
Ms. Tatiana has also been a Member of the Board of Directors since April 2018 of Dibens Leasing S.A. – Arrendamento Mercantil and Member of the Board of Directors of Investimentos Bemge S.A. since April 2018.
She has a Bachelor’s degree in Civil Construction Technology from Julio de Mesquita Filho Paulista State University (UNESP) (1995); a Postgraduate degree in Business Administration from Ibirapuera University (1997); Executive MBA in Finance from IBMEC Business School—SP (2001). She also has a Professional Master’s degree in Business Administration from Getulio Vargas Foundation (FGV), São Paulo, Brazil (2012).
Tom Gouvêa Gerth (Officer) has been Officer of Itaú Unibanco Holding S.A. since November 2017 and Officer of the Controller’s Department for Latin America (June 2015 to June 2017) and Member of the Executive Committee for Latin America of PayPal do Brasil Serviços de Pagamentos Ltda.
He has also been Controller of Metropolitan Life Seguros e Previdência S.A. (MetLife) (August 2013 to May 2015), responsible for financial reports, treasury, internal controls and taxes.
Mr. Gerth started his career at PricewaterhouseCoopers (April 1998) as Senior Manager and remained until July 2013. He worked in the Capital Markets & Accounting Advisory Services area focused on advising clients on issues involving US GAAP, IFRS and requirements from the Securities and Exchange Commission – SEC. He worked in the New York office (2007 to 2009).
He has a Bachelor’s degree in Accounting from Álvares Penteado School of Commerce Foundation (FECAP) (2000), and in Business Administration from Mackenzie University (1997). He also attended the International Executive MBA from Foundation Institute of Administration – FIA (completed in 2011), and continuing education courses from Dom Cabral Foundation and The University of Chicago Booth School of Business.
Mr. Gerth is a US Certified Public Accountant (CPA) and member of the American Institute of Certified Public Accountants (AICPA).
147
Table of Contents
Audit Committee
The resume of Mr. Gustavo Jorge Laboissière Loyola (Member of the Board) is detailed above, in the Board of Directors item.
Antonio Carlos Barbosa de Oliveira (Independent Member) has held several positions within Itaú Unibanco Group including as Executive Officer (May 2008 to May 2010); Member of the Disclosure and Trading Committee (May 2005 to April 2010); and Member of the Accounting Policies Committee (May 2008 to May 2009).
At Banco Itaú BBA S.A. was Member of the Board of Directors (June 2010 to April 2015); Director Vice President (February 2003 to April 2010); Member of the Board of Directors (February 2003 to February 2009).
Mr. Oliveira worked as Director Vice President (April 2008 to April 2010); Vice President between 2002 and 2003; Executive Officer (March 1994 to July 2002); Managing Director (December 1991 to August 1994) at Itaú Unibanco S.A. and was Member of the Board of Directors (April 1994 to April 2018) and Executive Officer (2001 to April 2018) at Instituto Itaú Cultural.
He also worked as Director Vice President (November 2008 to April 2010) at Unibanco – União de Bancos Brasileiros S.A.; Managing Director (December 1994 to September 2003) at Banco Itauleasing S.A.; Executive General Director of Banco Itaú Argentina S.A. between 1995 and 2001. At Itautec Informática S.A. worked as Officer, Banking and Commercial Automation Division (1983 to 1991). He was General Manager of Microelectronic Projects at Itaú Tecnologia S.A. (1981 to 1983).
He was Member of the Board of the Fernand Braudel Institute of World Economics since 2016; Vice Chairman of the Board of Fundo Patrimonial Amigos da Poli in 2012; Officer at Visa Argentina (1997 to 2001); Officer at ABA-Associacion de Bancos de la Argentina (1994 to 2001); Member of the Steering Committee of the Instituto de Estudos Avançados Universidade de São Paulo (Institute of Advanced Studies of the University of São Paulo) since 1994.
He has a Bachelor’s degree in production engineering from the Polytechnic School of the University of São Paulo in 1974, Master of Science in Management from the Massachusetts Institute of Technology (MIT) in 1977 and Master of Astronomy from James Cook University in 2012.
Antonio Francisco de Lima Neto (Independent Member) has held several positions within Itaú Unibanco Group including as a Member of the Audit Committee of Itaú Corpbanca (Chile) since April 2018. He was President of Banco Fibra S.A. (August 2009 to October 2013) and has held several positions in Banco do Brasil S.A. including President (December 2006 to April 2009); Vice President of Retail and Distribution (July 2005 to December 2006); Vice President of International Business and Wholesale (November 2004 to July 2005); Commercial Director (September 2001 to November 2004); Executive Superintendent of the Commercial Board (July 2000 to September 2001); Tocantins State Superintendent (May 1999 to May 2000); and Regional Superintendent of Belo Horizonte (from January 1997 to May 1999).
Mr. Lima has served as a Member of the Board of Directors (2007 to 2009) of Brasilprev Seguros e Previdência S.A.; a Member of the Board of Directors (2006 to 2009) of the Brazilian Federation of Banks – FEBRABAN; a Member of the Board of Directors (2004 to 2005) of BB Securities Limited; a Member of the Board of Directors (2003 to 2005) of Brasilsaúde Companhia de Seguros; a Member of the Board of Directors (2001 to 2009) of Companhia de Seguros Aliança do Brasil; and a Member of the Board of Directors (2000 to 2007) of BB Previdência – Fundo de Pensão do Banco do Brasil.
He has a Master’s degree in Economics from the Getulio Vargas Foundation (FGV), São Paulo, Brazil (January 2017) and attended a Course for Board Members at the Brazilian Institute of Corporate Governance (2014). Mr. Lima also has a postgraduate degree, Lato Sensu, in Marketing from the Pontifical Catholic University of Rio de Janeiro – PUC-RJ (2001) and an MBA in Training for Executives from the Dom Cabral Foundation (1997). He also has a Bachelor’s degree in Economics from the Federal University of Pernambuco (1996).
Diego Fresco Gutierrez (Independent Member and Financial Expert) has been a Member of the Audit Committee of Itaú Corpbanca (Chile) since May 2016 and an Alternate Director of Itaú CorpBanca (Chile) since March 2018 as well as a member of the Audit Committee of Itaú Corpbanca (Colombia) since April 2018.
He has been an Independent Advisor since 2013 in complex financial reporting mainly for publicly-held companies registered in Brazil and in the United States, and in compliance internal and external audit issues.
Mr. Gutierrez was a partner in charge of accounting advisory and regulatory requirements for the issue of securities abroad at PricewaterhouseCoopers (1990 to 2013) (Brazil, Uruguay, and the United States) and also worked in the audit of financial statements.
148
Table of Contents
He has a Bachelor’s degree in Accounting from Universidad de la Republica Oriental del Uruguay (1994). Mr. Gutierrez has been a Certified Public Accountant in the United States for the State of Virginia since 2002 and he also is a Public Accountant registered in the Regional Accounting Board of the State of São Paulo. He also attended the Course for Members of Boards of Directors from the Brazilian Institute of Corporate Governance (2013).
Maria Helena dos Santos Fernandes de Santana (Independent Member) has been a Member of the Board of Directors of BME – Bolsas y Mercados Españoles since 2016; Member of the Board of Trustees of IFRS Foundation since January 2014; Member of the Board of Directors and coordinator of the Committee on People, Appointment and Governance of Oi S.A. since 2018 and President of the Audit Committee of XP Investimentos S.A. since 2018.
Ms. Santana was a Member of the Board of Directors and Chairman of the Corporate Governance Committee of Companhia Brasileira de Distribuição S.A. (2013 to 2017); Member of the Board of Directors and Coordinator of the Audit Committee of Totvs S.A. (2013 to 2017); Member of the Board of Directors of CPFL Energia S.A. (April 2013 to 2015); and Chairman (July 2007 to July 2012) and Director (July 2006 to July 2007) of the Brazilian Securities and Exchange Commission (CVM).
She worked for the B3 (1994 to 2006) initially in the Special Projects department and then as Executive Superintendent of Relationships with Companies (2000 to 2006). In this position, she was responsible for the supervision of listed companies and for attracting new companies to the stock exchange. She was involved in the creation of the New Market and was responsible for its implementation.
Ms. Santana was Vice President of the Brazilian Institute of Corporate Governance – IBGC (2004 to 2006); Chairman of the Executive Committee of International Organization of Securities Commissions – IOSCO (2010 to 2012); and a Member of the Latin-American Roundtable on Corporate Governance (OECD / WB Group) (2000 to 2015).
She has a Bachelor’s degree in Economics (1990) from the School of Economics and Business Administration (FEA) of the University of São Paulo (USP).
Rogério Paulo Calderón Peres (Independent Member) has held several positions within the Itaú Unibanco Group including Officer and at Itaú Unibanco Holding S.A. (April 2011 to April 2014), Member of the Disclosure and Trading Committee from June 2009 to April 2014 and Officer at Itaú Unibanco S.A. (April 2009 to April 2014).
Mr. Peres has also served as Director Vice President (June 2012 to April 2013), Chairman of the Board of Directors and CEO (April 2013 to April 2014) of Investimentos Bemge S.A.
He also was an Officer (April 2013 to April 2014) at Dibens Leasing S.A. – Arrendamento Mercantil, an Executive Officer (2007 to 2009) at Unibanco – União de Bancos Brasileiros S.A. and CFO for Latin America, Member of the Financial Management Council and Member of the Administrative Committee for Latin America at the HSBC Group (July 2014 to October 2016).
Mr. Peres was Executive Vice President (2003 to 2006) at the Bunge Group – Bunge Brasil S.A., a Member of the Boards of Directors of Fosfertil, Ultrafertil and Fertifos and also a Member of the Audit Committees of the Bunge Foundation, Bungeprev and Fosfertil.
He was also an Active Partner in the divisions of Audit, Tax and Consultancy for Agribusiness and Consumer and Retail Products (1981 to 2003) at PricewaterhouseCoopers.
He has a Bachelor’s degree in Business Administration from the Getulio Vargas Foundation (FGV), São Paulo, Brazil, and in Accounting from the Paulo Eiró Foundation, São Paulo. He also has postgraduate degrees and attended special professional courses in E-Business Education Series from the University of Virginia Darden School of Business. Mr. Peres also has an Executive MBA from the University of Western Ontario, Canada, Case Studies in consumer and retail companies. Center for Executive Development Faculty at Princeton University, Business Strategy and Organization. Continuing Education Management and Professional Training, Arundel, England. Executive Business Development – Finance and Investment Decision Course – Analyzes and Measures at the Getulio Vargas Foundation (FGV), São Paulo, Brazil. Continuing Education Course at Harvard Business School, Making Corporate Boards More Effective – United States.
149
Table of Contents
Fiscal Council
Alkimar Ribeiro Moura (Independent Member) has held several positions within the Itaú Unibanco Group including Member of the Audit Committee (May 2010 to July 2015).
Mr. Moura is a Retired Economics Professor at the School of Business Administration of São Paulo of the Getulio Vargas Foundation (FGV), São Paulo, Brazil.
He was an Independent Member of the Board of Directors (May 2012 to March 2017), and a Coordinating Member of the Audit Committee (November 2013 to March 2017) of Cetip S.A. Mercados Organizados (CETIP S.A. – The Organized Over-the-Counter Market in Assets and Derivatives).
Mr. Moura was an Independent Member of the Supervisory Board of B3: Market Supervision (October 2007 to September 2010).
He was Chairman of Investment Banking (April 2001 to January 2003) and Vice Chairman of Finance and Capital Markets (April 2001 to January 2003) at Banco do Brasil S.A.
Mr. Moura has held several positions within the Central Bank of Brazil, including Standards and Financial System Organization Officer (February 1996 to September 1997); Monetary Policy Officer (February 1994 to February 1996); Public Debt and Open Market Transactions Officer (January 1987 to January 1988).
He was an Officer at Banco Pirelli-Fintec (March 1988 to March 1993).
He has a Bachelor’s degree in Economics from the Federal University de Minas Gerais, Belo Horizonte, Brazil (1963); a Master’s degree from the University of California, Berkeley, (1966), and a PhD in Applied Economics from Stanford University, California, (1978).
Carlos Roberto de Albuquerque Sá (Independent Member) has been a Alternate Member of the Fiscal Council (April 2015 to April 2016) at Itaú Unibanco Holding S.A.
He has been Coordinator of the Audit Committee of Lojas Marisa S.A. since 2012 and Coordinator of the Audit Committee of Moinhos Paulista S.A. since 2016.
Mr. Albuquerque Sá was an Effective Member (2016 to 2017) and an Alternate Member (March 2011 to October 2012) of the Fiscal Council of Marfrig S.A.; an Officer at KPMG Auditores Independentes (March 2003 to December 2010); Risk Officer at Net Serviços de Comunicação S.A. (March 1999 to December 2002); Administrative and Financial Officer at Sobremetal (March 1995 to December 1998); Financial Officer of Castrol do Brasil Ltda. (March 1991 to December 1994); Controller at Schlumberger Serviços de Petróleo Ltda. (March 1986 to December 1988); and Financial Manager at Det Norske Veritas (March 1979 to December 1981).
He has a Bachelor’s degree in Economics from Candido Mendes University (1973), and in Accounting from Faculdade Moraes Júnior (1981), and a postgraduate degree in Finance from the Pontifical Catholic University of Rio de Janeiro – PUC-RJ (1995).
José Caruso Cruz Henriques (Independent Member) has been an Alternate Member of the Fiscal Council of Itaú Unibanco Holding S.A. since August 2011, an Effective Member since May 3, 2016 and Chairman since June 2017.
Mr. Henriques was Managing Officer at Itaú Unibanco S.A. (December 1988 to August 2003); Officer at BFB Leasing S.A. – Arrendamento Mercantil (June 1997 to July 2003); Member of the Board of Directors of Banco Itauleasing S.A. (December 1994 to September 2003); Officer at Banco Itaucard S.A. (March 2000 to April 2003); Managing Officer at Intrag Distribuidora de Títulos e Valores Mobiliários Ltda. (April 1994 to July 2003); Managing Officer at Banco Itaú Cartões S.A. (July to October 2000); and Officer at Itautec Componentes da Amazônia S.A. – Itaucam (April 1993 to April 2003).
He has been Executive President of Corhen Serviços Ltda. since 2003.
He has a Bachelor’s degree in Law from the University of São Paulo (USP) (1971) and a postgraduate degree in Business Administration from the Getulio Vargas Foundation, São Paulo, Brazil (1979).
150
Table of Contents
| 6B. | Compensation |
Performance Evaluation of the Board of Directors and Board of Officers
Board of Directors
Our Board of Directors, its members and co-chairmen, as well as the Board of Directors committees, are evaluated annually for their performance as management members and bodies, in compliance with best corporate governance practices. The reelection of members of the Board of Directors and Board of Directors committees takes into account each director’s positive performance, regular attendance at meetings over the previous term and experience and independence level.
This evaluation consists of each director’s own self-evaluation, a cross-evaluation of the members of the Board of Directors (where members of our Board of Directors evaluate each other), the evaluation of the Board of Directors by its members, the evaluation of the co-chairmen by directors and evaluation of the Board of Directors committees by their members. This process is structured based on specific characteristics and responsibilities of the Board of Directors, its members, Co-chairmen, and each of its committees, seeking to achieve a high expertise level. Furthermore, this process is carried out by a third party responsible for distributing specific questionnaires to the Board of Directors and every Board of Directors committee, as well as for interviewing individual members of the Board of Directors and its committees. This person is also responsible for analyzing responses and comparing them to the responses from previous years in order to identify and address any Board of Directors and the Board of Director committee gaps.
Additionally, the Nomination and Corporate Governance Committee provides methodological and procedural support to the evaluation process, in addition to discussing the outcomes of the evaluation, the composition and the succession plan to the Board of Directors. In addition to the support provided by this committee, an independent person is responsible for carrying out the evaluation.
Ultimately, our Board of Directors is composed of outstanding knowledgeable professionals with expertise in different areas of operation.
Pre-established Rules of our Board of Directors:
The members of our Board of Directors must act fairly, in accordance with pre-established rules to avoid conflicts of interest. These rules include:
| • | Refraining from taking part in resolutions related to matters in which the director’s interests conflict with ours. The director must inform the Board of Directors of any possible conflict of interest as soon as the matter giving rise to such conflict is included in the agenda or proposed by the Board of Director’s co-chairmen, and, in any event, before the beginning of any discussion on such matter. |
| • | In the event the director or a company controlled or managed by this director carries out a transaction with any company in the Itaú Unibanco Group: (a) the transaction must be carried out at arm’s length; (b) if it is not a customary transaction or a provision of services, an appraisal report must be issued by recognized financial advisors evidencing that the transaction was carried out at arm’s length; and (c) the transaction must be disclosed to and conducted under the supervision of the Related Parties Committee, the Ethics and Ombudsman Office or of channels within the Itaú Unibanco Group that are competent in the specific area, subject to the rules and conditions set forth in our Transactions with Related Parties Policy. |
| • | Serving on no more than four boards of directors of companies that do not belong to the same group. |
| • | Our directors have no service contracts with us or any of our subsidiaries providing for benefits upon termination of employment. |
Please see “Item 6A. Directors and Senior Management – Board of Directors” for further information on the members of our Board of Directors.
151
Table of Contents
Officers
The performance evaluation of our officers consists of a behavior assessment and results assessment, as shown below:

152
Table of Contents
Compensation and Benefits
Governance of compensation
Our compensation strategy adopts clear and transparent processes, aimed at complying with applicable regulation and the best national and international practices, as well as at ensuring consistency with our risk management policy.
Compensation Committee
We have a statutory compensation committee, or Compensation Committee, that reports to the Board of Directors, which duties include:

Compensation policy
Our compensation policy aims to consolidate our compensation principles and practices so as to attract, reward, retain and motivate management members and employees in the sustainable running of business, subject to proper risk limits and always in line with stockholders’ interests.
Compensation strategy
Our compensation and benefit strategies vary according to the area of activity and market parameters. We periodically verify these parameters by:
| • | commissioning salary surveys conducted by specialized consultants, who are independent of management; |
| • | participating in surveys conducted by other banks; and |
| • | participating in specialized compensation and benefit forums. |
153
Table of Contents
Compensation of employees
Employee compensation is composed of:

In addition to those benefits set forth in collective bargaining agreements, we offer the following benefits to our employees:
| • | medical and dental care plans; |
| • | private pension plans; |
| • | group life insurance; |
| • | annual health check-up; and |
| • | parking lot space. |
These benefits may be granted according to each employee’s category or regulation applicable to each jurisdiction.
Moreover, we present below the benefits that are available to all employees:
| • | differentiated banking products and services; |
| • | Itaú Unibanco Club Foundation (Fundação Itaú Unibanco Clube); |
| • | discounts for health or sports related activities with several fitness centers; |
| • | discount partnership with several companies of goods and services; |
| • | pharmacy discounts and payment facilities; and |
| • | psychosocial and personal care services. |
154
Table of Contents
Stock-based Profit Sharing to Employees
We have a stock-based profit-sharing program for a specific group of employees, acknowledging those who had outstanding performance during the relevant year.

155
Table of Contents

156
Table of Contents
Compensation of Management Members

157
Table of Contents
Composition of compensation of management members
| Member |
Year | Monthly fixed compensation |
Annual fixed compensation |
Annual variable compensation |
Benefits | |||||||||||||||
| 2018 | 24% | 29% | 45% | 2% | ||||||||||||||||
| Board of Directors |
2017 | 23% | 31% | 44% | 2% | |||||||||||||||
| 2016 | 21% | 40% | 37% | 2% | ||||||||||||||||
| 2018 | 9% | 0% | 90% | 1% | ||||||||||||||||
| Board of Officers |
2017 | 8% | 0% | 91% | 1% | |||||||||||||||
| 2016 | 7% | 0% | 92% | 1% | ||||||||||||||||
| 2018 | 100% | 0% | 0% | 0% | ||||||||||||||||
| Fiscal Council |
2017 | 100% | 0% | 0% | 0% | |||||||||||||||
| 2016 | 100% | 0% | 0% | 0% | ||||||||||||||||
| 2018 | 100% | 0% | 0% | 0% | ||||||||||||||||
| Audit Committee |
2017 | 100% | 0% | 0% | 0% | |||||||||||||||
| 2016 | 100% | 0% | 0% | 0% | ||||||||||||||||
| Year ended December 31, 2018 |
||||||||||||
| a Body | Board of Directors |
Executive Board |
Fiscal Council |
|||||||||
| b number of members |
11.25 | 20.83 | 6.00 | |||||||||
| c number of members who receive compensation |
11.25 | 20.83 | 6.00 | |||||||||
| d Amount of the highest individual compensation |
12,941,000 | 46,880,000 | 220,500 | |||||||||
| e Amount of the lowest individual compensation |
2,652,000 | 2,604,000 | 88,200 | |||||||||
| f Average amount of individual compensation (total compensation divided by the number of compensated members) |
5,218,146 | 13,316,714 | 154,500 | |||||||||
For the annual amount of the lowest individual compensation, members who have not performed their duties for the full 12 months of the relevant year were disregarded. Members who received the amount of the highest compensation in each body performed their duties during the 12 months of the relevant year.
| Year ended December 31, 2017 |
||||||||||||
| a Body | Board of Directors |
Executive Board |
Fiscal Council |
|||||||||
| b number of members |
10.18 | 21.67 | 5.58 | |||||||||
| c number of members who receive compensation |
10.18 | 21.67 | 5.58 | |||||||||
| d Amount of the highest individual compensation |
12,228,000 | 40,918,000 | 220,500 | |||||||||
| e Amount of the lowest individual compensation |
2,567,000 | 2,309,000 | 88,200 | |||||||||
| f Average amount of individual compensation (total compensation divided by the number of compensated members) |
4,822,777 | 13,505,633 | 155,642 | |||||||||
For the annual amount of the lowest individual compensation, members who have not performed their duties for the full 12 months of the relevant year were disregarded. Members who received the amount of the highest compensation in each body performed their duties during the 12 months of the relevant year.
| Year ended December 31, 2016 |
||||||||||||
| a Body | Board of Directors |
Executive Board |
Fiscal Council |
|||||||||
| b number of members |
8.67 | 21.33 | 4.33 | |||||||||
| c number of members who receive compensation |
8.67 | 21.33 | 4.33 | |||||||||
| d Amount of the highest individual compensation |
11,709,000 | 72,935,000 | 220,500 | |||||||||
| e Amount of the lowest individual compensation |
2,109,000 | 1,903,000 | 88,200 | |||||||||
| f Average amount of individual compensation (total compensation divided by the number of compensated members) |
3,369,550 | 13,341,960 | 159,584 | |||||||||
For the annual amount of the lowest individual compensation, members who have not performed their duties for the full 12 months of the relevant year were disregarded. Members who received the amount of the highest compensation in each body performed their duties during the 12 months of the relevant year.
In 2016, structural changes were carried out in the Company’s Executive Board. Accordingly, the amount of the highest individual compensation of the Statutory Executive Board includes a non-recurring special termination bonus for significant contribution to the Company, in shares of the Company and a three year deferral period. The amount recorded as non-recurring was R$37,611 thousand.
158
Table of Contents
Criteria for defining monthly and annual fixed compensation of management members:
Fixed compensation of members of the Board of Directors and Board of Officers, as well as the benefit plan granted to officers, is not impacted by performance indicators, as discussed below:

Criteria for defining the annual variable compensation of the Board of Officers(1):

| (1) | Within the limits established by legislation, the compensation of Officers in charge of internal control and risk departments is determined irrespective of the performance of the business areas they control and assess so as not to give rise to any conflicts of interest. However, even though compensation is not impacted by the results from business areas, it is still subject to any impacts arising from our results. |
159
Table of Contents
Distribution of the annual variable compensation of the Board of Officers(1):

| (1) | In accordance with CMN Resolution No. 3,921, a portion of the variable compensation must be deferred. |
Delivery of preferred shares related to the annual variable compensation of the Board of Officers:

Partnership Program for Officers and Employees
Aimed at aligning the interests of our officers and employees to those of our stockholders, this program offers participants the opportunity to invest in our preferred shares, traded under ticker symbol “ITUB4”, sharing short, medium and long-term risks.
160
Table of Contents
The program is aimed at officers and employees approved by the Personnel Committee due to their history of contribution, relevant work and outstanding performance. It has two types of appointments: partners and associates, and the person must join the program first as an associate. Main differences in the two types of appointments are as follows:

161
Table of Contents

Stock Grant Plan and Stock Ownership Requirements
In order to consolidate the rules of our long-term stock-based incentive programs, described in items above, under the terms of CVM Instruction No. 567/15, we approved the Stock Grant Plan at the 2017 Extraordinary General Stockholders’ Meeting.
In addition, in 2019 the Compensation Committee determined that members of the Executive Committee must comply with a stock ownership requirement of a minimum equivalent (i) to 10 times the annual salary for the CEO and (ii) to 5 times of the annual salary for other Executive Committee members, which must be complied within a five-year period of after their position’s start date. Currently, all Executive Committee members comply with the minimum requirement.
With the Stock Grant Plan and the share ownership requirements, we reinforce the alignment of interests of management members and employees of our company and its direct and indirect subsidiaries with our interests and stockholders’ interests.
162
Table of Contents
Stock Option Plan to Officers and Employees
We have a Stock Option Plan through which our officers and employees with outstanding performance are entitled to receive stock options. These options enable them to share the risk of price fluctuations of our preferred shares with other stockholders and are intended to integrate the participants of this program into the Itaú Holding Group’s development process in the medium and long term. Our Personnel Committee manages the Stock Option Plan, including matters such as strike prices, vesting periods and effectiveness of options, in compliance with the rules set forth in the Stock Option Plan.
Options may be granted only to participants if there is net income sufficient to be distributed as mandatory dividends. Also, to avoid the dilution of stockholders, the sum of shares to be used in the programs described in the Stock Grant Plan and Stock Option Plan every year will not exceed the limit of 0.5% of total outstanding shares. In the event the number of shares delivered and options granted is below the 0.5% limit, the difference may be added for purposes of stock-based compensation or granting of options in any one of the seven subsequent fiscal years.
Since 2012, no simple option has been granted within the scope of our Stock Option Plan. For further information on changes in the plan, see “Financial Performance”, and “Note 22 – “Banking Service Fees” to our audited consolidated financial statements.
| 6C. | Board Practices |
Board of Directors Committees
The organizational chart below presents our eight committees, reporting directly to our Board of Directors, the body responsible for electing these committee members for a one-year term of office, conditioned on their having proven knowledge in the respective areas of work and technical qualification compatible with their duties.
The committees may hire outside experts but must always maintain the integrity and the confidentiality of their work.
This year we continued with our regular agenda, following up the performance of the internal audit, the corporate departments responsible for risk management and the independent auditor. The topics of focus by the Committee throughout 2018 included receiving reports from the different control areas regarding information security risks, as well as the performance of the 2nd and 3rd lines of defense in the subsidiaries outside Brazil and their relationship with the respective headquarters’ departments in Brazil. The Committee also focused on the actions by management with respect to consumer matters and risk management in digital platforms, in addition to monitoring of the internal control systems and management of traditional risks.
Diego Fresco Gutierrez – Financial Expert of the Audit Committee.
“In 2018, in addition to exercising its mandate to oversee the risk and capital management activities through a continuous agenda of updating and monitoring the Group’s Risk Appetite, the Committee further focused its approach on emerging risks in the areas of technology, models, business and strategy, as well as in the regulatory environment.”
Pedro Luiz Bodin de Moraes – Independent member of the Board of Directors and Chairman of the Risk and Capital Management Committee.
In 2018, the Committee worked effectively on the analysis of transactions between related parties, in accordance with the governance defined in the Policy for Transactions with Related Parties in order to ensure stockholders and other stakeholders that Itaú Unibanco is in compliance with the best Corporate Governance Practices, avoiding any conflict of interest or favoritism towards related parties. Over the year, more than 20 cases were analyzed involving issues such as the contracting of a consulting firm, trading of investment fund units, sponsorships and donations, three of which are disclosed to the market, in compliance with CVM Instruction No. 480/09.”
Fábio Colletti Barbosa – Independent Member and Chairman of the Related Parties Committee.
163
Table of Contents
“The purpose of the Strategy Committee is to address relevant matters that have a major impact on the bank. During 2018, it discussed the achieved results and the actions planned with respect to the strategic fronts of Digital Transformation and Customer Satisfaction, it addressed the internationalization process that allows the bank to have access to new markets and to increase its scale, it revised the Policy For Sustainability And Social Environmental Responsibility and it also focused on competition in the digital environment.”
Roberto Setubal – Co-chairman of the Board of Directors and member of the Strategy Committee.
“In 2018, the Compensation Committee discussed its ordinary agenda, which included the approval of the pool of the global bonus to be distributed to employees and management members. It also approved the target contracts for the members of the Executive Committee and assessed, for comparison purposes, the target contracts adopted by the market. Additionally, the Committee met with representatives of the Central Bank to present the workings of the bank’s governance process for issues related to compensation, to the work dynamics of the Committee itself and, also, to the alignment of the compensation policy with the risk policy.”
Gustavo Jorge Laboissière Loyola – Member of the Board of Directors and member of the Compensation Committee.
“During 2018, the Committee maintained its discussion agenda with regards to the structure and composition of the Board of Directors and its Committees. In this context, the establishment of the Social Responsibility Committee, subordinated to the Board of Directors, was approved. Another highlight was the discussion related to the change in the composition of the Company’s Executive Committee, as announced to the market in September. The Committee also proceeded with the analysis of practices recommended by local and foreign sustainability indexes and governance codes aiming at the continual improvement of our Corporate Governance practices. One of the measures arising from this analysis was the formalization of an internal charter for the Executive Board.”
Alfredo Egydio Setubal – Member of the Board of Directors and Member of the Nomination and Corporate Governance Committee.
“Over the course of 2018, we have made progress on relevant issues concerning People that will help us strengthen our ability to attract and retain the best talents and increase our ability to innovate and the connection with our clients. In order to support digital transformation, we proceeded with the agenda of communities in technology and business, making our teams more multidisciplinary, in agile cells, with more autonomy and cooperation. We created and developed new careers, such as Data Scientist, and trained thousands of employees in topics such as Lean, Agile, Design Thinking and User Experience (UX), which are appropriate for the new environment of relationship with clients and information speed. Additionally, we implemented initiatives to improve the experience of our employees, seeking to value their individualities, and to reduce bureaucracy as much as possible in the work environment. Lastly, in line with the priority agendas we have been developing, we approved important changes in the incentives models, increasingly stimulating cooperation and team work, but always recognizing those who make the difference.”
Pedro Moreira Salles – Co-Chairman of the Board of Directors and Chairman of the Personnel Committee.
164
Table of Contents

Originated on January 31, 2019, the Social Responsibility Committee will define, within the Board of Directors, the strategies to strengthen our corporate social responsibility and to monitor the performance of social institutions related thereto, as well as the initiatives directly executed by us, thus expanding the activities that were already being exercised by the executive body.
It is incumbent upon the organ (i) to define strategies to strengthen our corporate social responsibility in all its elements, including a voluntary strategy; (ii) to analyze the performance of social institutions related to us and the initiatives directly executed by us; (iii) to ensure the appropriate degree of autonomy among social institutions and us; (iv) to foster the search for synergies and opportunities to increase efficiency between institutions and us as well as the institutions themselves; (v) to approve multi-annual budget for initiatives that depend on the Company’s resources; (vi) to monitor the quality of governance of each institution; (vii) to define the allocation process of the Rouanet Law as well as the other existing incentive laws and approve the contributions to be made by the Company or other companies of the Itaú Unibanco Conglomerate.
165
Table of Contents
Audit Committee
We have an Audit Committee, which complies with the rules issued by the National Monetary Council for audit committees of financial institutions. The Audit Committee is responsible for overseeing the quality and integrity of the financial statements, the compliance with legal and regulatory requirements, the performance, independence and quality of the services provided by independent auditors and by our internal auditors, and the quality and effectiveness of the internal control and risk management systems. Set up in April 2004 by the Annual General Stockholders’ Meeting, it is the only audit committee for institutions authorized to operate by the Central Bank and for companies overseen by SUSEP that are part of the Conglomerate.
The members of the Audit Committee are annually elected by the Board of Directors from among its members or professionals with renowned competence and outstanding knowledge, taking into account that at least member of this Committee will be designated Financial Expert and must have proven knowledge in the accounting and auditing areas.
All members of the Audit Committee are independent, in accordance with CMN regulation, and the Board of Directors will terminate the term of office of any member of the Audit Committee if their independence is affected by any conflict of interest or potential conflict of interest. The evaluations of the Audit Committee are based on information received from management, external auditors, internal auditors, departments responsible for risk management and internal controls, and on analyses made by the members of the Committee as a result of direct observation.
Compensation Committee
It is incumbent upon the Compensation Committee to promote discussions on matters related to our management compensation. Its duties include, but are not limited to: developing a policy for the compensation of our management, proposing to the Board of Directors the many forms of fixed and variable compensation, in addition to special benefits and programs for recruitment and termination; discussing, examining and overseeing the implementation and operation of existing compensation models, discussing general principles of the compensation policy for our employees and recommending adjustments or improvements to the Board of Directors.
Internal Audit
Under the Audit Committee’s technical supervision, our Internal Audit function provides the Board of Directors and senior management with independent, unbiased and timely evaluations of the effectiveness of risk management, adequacy of controls and compliance with relevant rules and regulations related to the Conglomerate’s operations. These evaluations occur periodically, and follow a methodology in compliance with The Institute of Internal Auditors (IIA) standards.
The Internal Audit requires the area being audited to establish action plans for any deficiencies identified, based on deadlines that vary according to risk rating criteria.
166
Table of Contents
Ombudsman
Itaú Unibanco’ Ombudsman has three different pillars as its objective:
| • | Last resource resolving clients demands; |
| • | Improving every internal process; and |
| • | Compliance with regulatory obligations. |
The main duties of the ombudsman’s office are to attend to complaints not resolved through our primary channels, and to act as a last resource within the institution to resolve demands between clients and the institution.
Clients can get in touch with our Ombudsman’s Office through the telephone number that is disclosed on our website, as required by Central Bank regulation.
Our Ombudsman’s Office also gets involved in every process of clients’ demands resolution. These processes are subject to regulatory institutions, such as the Central Bank and SUSEP, and consumer defense institutions, such as Procon. It ensures better solutions for clients’ demands.
The Ombudsman’s Office acts in partnership with business, product, operation, quality and customer service departments to reduce complaints numbers through case studies to improve processes and services so we can guarantee principles of ethics and transparency.
The Ombudsman’s Office is constantly monitoring performance through specific procedures committee and ombudsman’s office committee.
Since July 2018, additional changes introduced to the ombudsman regulations became effective. Among such changes are the requirements to implement a direct client evaluation tool of the ombudsman office’s quality of service and to give full disclosure of the existence of the Ombudsman’s Office through its communication channels.
As part of the strategy to be a benchmark and improve our services, we established a schedule of meetings with National System of Consumer Defense, Normative Regulation Institutes and Civil Entities. These agendas are instruments to ensure the internal regulatory practices and contribute to the market evolution and customer’s satisfaction.
Every six months, Ombudsman’s Office prepares a report about the most critical complaints, case studies and action plans to improve customer experience. This report is submitted to our management and audit committee, as well as to the Central Bank.
The Ombudsman’s Office also participates in validation process for the creation of new products and customer services using a General Risk Assessment System, which is a required by governance model for crisis management. It is a suitable tool for Consumer Defense Code which guarantees customer vision throughout the process and consequently higher levels of customer satisfaction.
At January 17, 2018, the Ombudsman’s Office began reporting directly to the Itaú Unibanco’s CEO.
167
Table of Contents
| 6D. | Employees |
We had 100,335 employees on December 31, 2018 compared to 99,332 on December 31, 2017.
The following tables show the total number of employees for the years ended December 31, 2018, 2017 and 2016, segmented by region (Brazil and abroad) and operating unit:
| Employees (Brazil and abroad) |
As of December 31, | Variation | ||||||||||||||||||||||||||
| 2018 | 2017 | 2016 | 2018-2017 | 2017-2016 | ||||||||||||||||||||||||
| In Brazil |
86,801 | 85,537 | 80,871 | 1,264 | 1.5% | 4,666 | 5.8% | |||||||||||||||||||||
| Abroad |
13,534 | 13,795 | 13,908 | (261 | ) | (1.9)% | (113 | ) | (0.8)% | |||||||||||||||||||
| Argentina |
1,692 | 1,700 | 1,647 | (8 | ) | (0.5)% | 53 | 3.2% | ||||||||||||||||||||
| Chile |
5,820 | 5,922 | 5,919 | (102 | ) | (1.7)% | 3 | 0.1% | ||||||||||||||||||||
| Colombia |
3,495 | 3,650 | 3,754 | (155 | ) | (4.2)% | (104 | ) | (2.8)% | |||||||||||||||||||
| Uruguay |
1,117 | 1,122 | 1,134 | (5 | ) | (0.4)% | (12 | ) | (1.1)% | |||||||||||||||||||
| Paraguay |
844 | 829 | 806 | 15 | 1.8% | 23 | 2.9% | |||||||||||||||||||||
| Europe |
213 | 203 | 200 | 10 | 4.9% | 3 | 1.5% | |||||||||||||||||||||
| Other |
353 | 369 | 448 | (16 | ) | (4.3)% | (79 | ) | (17.6)% | |||||||||||||||||||
|
|
|
|
|
|
|
|
|
|
|
|
|
|
|
|||||||||||||||
| Total |
100,335 | 99,332 | 94,779 | 1,003 | 1.0% | 4,553 | 4.8% | |||||||||||||||||||||
|
|
|
|
|
|
|
|
|
|
|
|
|
|
|
|||||||||||||||
| Employees (by operating unit) |
As of December 31, | Variation | ||||||||||||||||||||||||||
| 2018 | 2017 | 2016 | 2018-2017 | 2017-2016 | ||||||||||||||||||||||||
| Retail banking |
77,862 | 75,768 | 71,159 | 2,094 | 2.8% | 4,609 | 6.5% | |||||||||||||||||||||
| Wholesale banking |
21,698 | 22,630 | 22,909 | (932 | ) | (4.1)% | (279 | ) | (1.2)% | |||||||||||||||||||
| Activities with the market and corporation |
775 | 934 | 711 | (159 | ) | (17.0)% | 223 | 31.4% | ||||||||||||||||||||
|
|
|
|
|
|
|
|
|
|
|
|
|
|
|
|||||||||||||||
| Total |
100,335 | 99,332 | 94,779 | 1,003 | 1.0% | 4,553 | 4.8% | |||||||||||||||||||||
|
|
|
|
|
|
|
|
|
|
|
|
|
|
|
|||||||||||||||
Labor Relations
Itaú Unibanco has a permanent channel for dialog throughout the year with the labor unions representing the employees in their various professional categories. Meetings between the company and the labor unions are constantly held to discuss themes for furthering a good organizational climate and to discuss matters relating to the organization and workplace safety. We meet to discuss specific collective bargaining agreements, such as Profits or Results Sharing, Time Clock Registration and Working Day Compensation (hours bank) schemes, among others.
168
Table of Contents
From the point of view of labor relations, we recognize the labor unions as legitimate representatives of our employees. We guarantee our employees rights to freedom of association as well as the absolute freedom for employees to take part in labor union activities, always recognizing the rights and prerogatives of those elected to executive positions in the unions pursuant to the current Brazilian legislation and the collective agreements for each professional category to which we are a party. The company has 1,438 active employees with roles in the various boards of directors of the representative labor unions. As set forth in the collective labor agreement for bank employees, 890 work full time for these union entities. In addition, we allow the unions to hold membership campaigns and, when requested, to hold meetings between the union entities, our managers and employees, with a view to seeking negotiated solutions in a respectful manner and in line with ethical principles.
We note that all activities within the scope of relations with union entities are conducted with a focus on innovation and negotiated solutions with a view to minimizing possible differences and conflicts involving our employees.
At Itaú Unibanco, all employees are covered by collective bargaining agreements which guarantee rights, not only those granted under the labor legislation but also other benefits which may be granted to our employees on a one-off basis in accordance with our internal human resources policies. Collective labor agreement rules, as well as other alterations and adjustments to internal norms that impact the routine of employees or modify their rights are widely disclosed by the company’s various means of communication. Among such means are e-mail, videos, electronic media, advertising totems, our internal magazine and our corporative portal (where human resources policies are detailed in our personnel regulations). In addition, employees have a call center at their disposal, to which they may have recourse in the event of questions.
We are a party to annual collective round table negotiations involving the labor unions representing bank, insurance and finance house employees for the joint preparation with employers’ and professional associations the collective bargaining agreements which spell out employee rights and benefits. The banking sector has historically experienced annual strikes. Below is a brief record of labor stoppages:
| Year |
Stoppage (working days)(1) |
Branches closed (%) | ||
| 2015 |
14 working days | 37.7 | ||
| 2016(2) |
22 working days | 37.7 |
| (1) | These stoppages did not result in losses for Itaú Unibanco since the movement took place across the entire Brazilian financial system. |
| (2) | The collective labor agreements process in 2016 established agreements valid for a period of two years, valid from September 1, 2016 to August 31, 2018. On September 1, 2017, as stated in the current collective labor agreements, we readjusted salaries and benefits of all employees in the banking category. Thus, we did not have any kind of strike or significant interruptions in banking operations in 2017. |
All these movements and strike action at our branches had a partial impact only. Some branches were able to open during the course of the day and the operations of the branch network were never brought to a complete halt. However, in the past few years we have noticed a growing volume of transactions executed through our digital channels. This has made a significant contribution to offsetting the effects of strike action on our operations.
The collective labor agreements process in 2018 established agreements valid for a period of two years, valid from September 1st, 2018 to August 31st, 2020. We had did not have any kind of strike or significant interruptions in banking operations in 2018.
Notwithstanding the foregoing, Itaú Unibanco believes that the way to solve labor disputes is through direct negotiation, avoiding litigating issues which can be resolved through an exhaustive process of dialog and transparency in relations with labor union entities.
| 6E. | Share Ownership |
As of December 31, 2018, our Board of Directors and our Board of Officers directly owned an aggregate amount of 0,5602% common shares and 0,7064% preferred shares. Except for the shares indirectly owned by our controlling stockholders (through their participation in IUPAR and Itaúsa), the members of our Board of Directors and our Board of Officers, on an individual basis and as a group, beneficially owned less than 1% of our common shares and less than 1% of our preferred shares as of December 31, 2018.
169
Table of Contents
| ITEM 7. | MAJOR STOCKHOLDERS AND RELATED PARTY TRANSACTIONS |
| 7A. | Major Stockholders |
Main Stockholders
We are controlled by IUPAR, which is jointly controlled by Itaúsa and Cia. E. Johnston. Itaúsa is controlled by members of the Egydio de Souza Aranha family, and Cia. E. Johnston is controlled by members of the Moreira Salles family.
Except for the shares indirectly owned by our controlling stockholders (through their participation in IUPAR and Itaúsa), the members of our Board of Directors and our Board of Officers, on an individual basis and as a group, beneficially owned less than 1% of our common shares and less than 1% of our preferred shares as of December 31, 2018.
According to Brazilian regulation and as approved by the Central Bank, foreign investors may have a maximum of 30% of our common shares.
The table below presents information on the persons that, to our knowledge, beneficially own over 5% of our common or preferred shares as of March 31, 2019:
| Stockholders |
Common Shares | Preferred Shares |
Total | |||||||||||||||||||||
| Total Number of Shares |
% of Total | Total Number of Shares |
% of Total | Total Number of Shares |
% of Total | |||||||||||||||||||
| IUPAR – Itau Unibanco Participacões S.A. |
2,564,084,404 | 51.71% | - | 0.00% | 2,564,084,404 | 26.15% | ||||||||||||||||||
| Itausa – Investimentos Itaú S.A. |
1,943,906,577 | 39.21% | 169,323 | 0.00% | 1,944,075,900 | 19.83% | ||||||||||||||||||
| BlackRock(1) |
- | 0.00% | 349,925,097 | 7.22% | 349,925,097 | 3.57% | ||||||||||||||||||
| Others |
450,299,378 | 9.08% | 4,434,445,892 | 91.51% | 4,884,745,270 | 49.82% | ||||||||||||||||||
| Subtotal |
4,958,290,359 | 100.00% | 4,784,540,312 | 98.73% | 9,742,830,671 | 99.37% | ||||||||||||||||||
| Treasury stock |
- | 0.00% | 61,304,677 | 1.27% | 61,304,677 | 0.63% | ||||||||||||||||||
|
|
|
|
|
|
|
|
|
|
|
|
|
|||||||||||||
| Total |
4,958,290,359 | 100.00% | 4,845,844,989 | 100.00% | 9,804,135,348 | 100.00% | ||||||||||||||||||
|
|
|
|
|
|
|
|
|
|
|
|
|
|||||||||||||
| (1) | Share ownership information provided by stockholder. |
Date: 2019, 03.31.
ADSs Held in Host Country
As of March 31, 2019, 1,318,900,157 ADSs (27.6% of the total outstanding shares of our preferred stock) were outstanding and held of record by 71 registered depositary receipts holders. We are aware that many ADSs are held of record by brokers and other nominees, and accordingly the above numbers are not necessarily representative of the actual number of U.S. persons who are beneficial holders of ADSs or the number of ADSs beneficially held by such persons.
IUPAR Stockholders’ Agreement
Itaúsa and Cia. E. Johnston have a stockholders’ agreement that governs their relationship as controlling stockholders of IUPAR and, indirectly, as our controlling stockholders and as controlling stockholders of our subsidiaries. For further information, please, access our Investor Relations Website > MENU > Itaú Unibanco > Corporate Governance > Rules and Policies > Others > Shareholders Agreement – IUPAR.
Transfer of control and increase of interest in the share capital
Subject to the provisions of the IUPAR stockholders’ agreement, our Bylaws do not contain any provision that is intended to delay, defer or prevent a change in our shareholding control or that would operate only with respect to a merger, acquisition or corporate restructuring of our Company or its subsidiaries. However, according to Brazilian regulation all such transactions must be carried out in accordance with procedures established by CMN and be previously approved by the Central Bank.
170
Table of Contents
Brazilian legislation provides that acquisition of control of a publicly held company triggers the requirement for the acquiring party to make a tender offer for all outstanding common shares, at a price equivalent to at least 80% of the price per share paid to the controlling stockholders. Additionally, our Bylaws establish the same price rule for the holders of our preferred shares. This legislation also requires our controlling stockholders to make a tender offer for all of our shares if they increase their interest in our share capital to a level that materially and negatively affects the liquidity of our shares.
| 7B. | Related Party Transactions |
Transactions with controllers, joint control and related parties, and key management personnel are required to be conducted on arms’ length terms.
Under the Laws No. 4,595/64, No. 7,492/86 and CMN Resolution No. 4,693/18, financial institutions must observe specific terms and conditions when granting credit to:
| • | its controllers (individuals or legal entities), pursuant to Article 116 of Law No. 6,404/76, as well as their spouses, partners and their direct relatives, in the collateral line or affinity, up to the second degree; |
| • | its officers, managers, and members of statutory or contractual bodies, as well as their spouses, partners and their direct relatives, in the collateral line or by affinity, up to the second degree; |
| • | individuals with qualified equity interest; and |
| • | legal entities: (i) with qualified equity interest; (ii) in which capital, directly or indirectly, there is qualified equity interest; (iii) in which there is effective operational control or relevance in the deliberations, regardless of equity interest; and (iv) that have an officer or member of the board of directors in common. |
CMN Resolution No. 4,693/18 established the definition of “qualified equity interest” as a holder that owns 15% or more of the capital of the legal entity for purposes of credit transactions by financial institutions with its related parties.
For further details on restrictions on the operations of financial institutions, see “Item 4B. Business Overview – Regulatory Environment.”
On October 22, 2012, our Board of Directors approved a Transactions with Related Parties Policy, which is reviewed annually. The definition of related party for the purpose of disclosures in financial statements is provided in this Transactions with Related Parties Policy, and includes controlling shareholders of, and entities controlled by or under common control with, us, as well as the directors and officers of these entities, certain family members of such individuals and any entities controlled directly or indirectly by them. Our Transactions with Related Parties Policy provides that any transaction involving related parties must be carried out at arm’s length, comply with all practices put in place by our management (such as the guidelines provided in our Code of Ethics), be executed in writing, and be clearly disclosed in our financial statements according to the materiality criteria provided by accounting standards.
Any related party transaction or series of transactions within a one-year period that exceeds R$1 million, defined as a “Significant Amount” (except those exclusively involving entities controlled, directly or indirectly, by us), is analyzed by the Related Parties Committee and reported to our Board of Directors on a quarterly basis.
Transactions between companies included in the consolidation were eliminated in the audited consolidated financial statements and take into consideration the absence of risk. See “Note 31 – Related parties” to our audited consolidated financial statements for more information.
| 7C. | Interests of Experts and Counsel |
Not applicable.
171
Table of Contents
| ITEM 8. | FINANCIAL INFORMATION |
| 8A. | Consolidated Statements and Other Financial Information |
The information included in Item 18 of this annual report is referred to and incorporated by reference into this Item 8A.
Legal Proceedings
Overview
We are not defendants in any significant administrative proceeding before the CVM, SUSEP, the Central Bank or any municipalities. As part of the ordinary course of our business, we are party to various legal and administrative proceedings (including consumer complaints) filed against us with SUSEP, certain municipalities or the Central Bank.
Our audited consolidated financial statements only include reserves for probable losses that can be reasonably estimated and expenses that we may incur in connection with pending litigation or administrative proceedings, or as otherwise required by Brazilian law. Our management believes that our provisions, including interest, for legal proceedings in which we are defendants are sufficient to cover probable losses that can be reasonably estimated in the event of unfavorable court decisions. It is currently not possible to estimate the amount of all potential costs that we may incur or penalties that may be imposed on us other than those amounts for which we have reserves. We believe that any potential liabilities related to these lawsuits and administrative proceedings will not have a material adverse effect on our business, financial condition or results. There are no material proceedings in which any of our directors, any member of our senior management or any of our affiliates is either a party adverse to us or to our subsidiaries or has a material interest adverse to us or our subsidiaries.
Please see “Note 2.3 – Critical Accounting Estimates and Judgments, j) Provisions, Contingencies and Other Commitments” to our audited consolidated financial statements for further information and details about the changes in the provisions and respective escrow deposits for tax and social security lawsuits and main types of tax disputes. The following table sets forth our provisions for such contingencies as of December 31, 2018, 2017 and 2016.
| Provision |
12/31/2018 | 12/31/2017 | 12/31/2016 | |||||||||
| (In millions of R$) | ||||||||||||
| Civil |
4,426 | 5,300 | 5,172 | |||||||||
| Labor |
6,821 | 7,283 | 7,232 | |||||||||
| Tax proceedings and legal obligations |
6,793 | 7,003 | 8,246 | |||||||||
| Other |
573 | 150 | 259 | |||||||||
| Total |
18,613 | 19,736 | 20,909 | |||||||||
|
|
|
|
|
|
|
|||||||
Civil Litigation
Litigation Arising from Government Monetary Stabilization Plans
We are a defendant in lawsuits for the collection of understated inflation adjustment for savings resulting from the economic plans implemented in the 1980s and 1990s by the Brazilian Federal Government as a measure to combat inflation. Please see “Item 3D. Risk Factors – Legal and Regulatory Risks, Decision on lawsuits due to government monetary stabilization plans may have a material adverse effect on us” for further information.
172
Table of Contents
Other Civil Litigation
In addition to litigation arising from government monetary stabilization plans, we are defendants in numerous civil lawsuits arising in the normal course of our business. Additionally, we and our subsidiaries carry out corporate operations that may be contested in court by minority shareholders, who disagree especially with the amount paid for their actions. We are not able to currently predict the total amounts involved in these claims, due to the nature of the matters disputed. However, we believe that any potential liabilities related to these lawsuits will not have a material adverse effect on our financial condition or results.
Labor Litigation
In 2018, we and our subsidiaries were not exposed to any labor liabilities or labor contingencies which individually significantly impacted our results. The pool of labor claims for our subsidiaries in such period comprised of labor claims filed by employees, former employees and outsourced service providers.
Labor unions and former employees have filed labor claims against us, seeking compensation for alleged breaches of employment agreements or rights under the applicable labor laws. As of December 31, 2018, there were 68,086 labor claims filed against us.
The main requests in the labor claims filed by our current and former employees include:
| • | Salary differences arising from the application of the 30 working hours per week limit, provided for in Art. 224 of the CLT, which is applicable to bank employees whose function does not require special trust from the employer; |
| • | Salary differences arising from overtime not duly registered in the internal systems; |
| • | Claims with respect to the method used to establish overtime pay; and |
| • | Salary parity. |
Labor class actions filed against us mainly relate to the continuation of health care plans, safety rules and strikes. We are also defendants in connection with labor claims filed by the labor prosecution office regarding union classification, outsourcing, occupational diseases, health and safety and compliance with the minimum quotas for disabled personnel. In the fiscal year ended December 31, 2018, we paid approximately R$ 2,911 million in direct labor expenses, mainly in settlements and convictions involving former employees, in accordance to the agreements signed and to the rulings imposed by labor courts.
Regarding labor claims filed by outsourced service providers, they generally involve allegations of subsidiary liability of the companies within our group.
Please see “Note 2.3 – Critical Accounting Estimates and Judgments, j) Provisions, Contingencies and Other Commitments” of our audited consolidated financial statements for further information about labor claims.
173
Table of Contents
Tax Litigation
We have certain tax disputes that arise in our ordinary business activities, mainly relating to the constitutionality or legality of certain taxes imposed on us.
We classify tax due as legal liability when the legality and / or unconstitutionality of the legislation in force is challenged. Legal liability taxes are provisioned regardless of the likelihood of loss.
Tax contingencies correspond to the principal amount of taxes involved in tax, administrative or judicial challenges, subject to tax assessment notices, plus interest and, when applicable, fines and charges. A provision is recognized whenever the chance of prevailing is probable.
On June 25, 2013, we received a notice of deficiency from the Brazilian tax authorities alleging that we failed to pay approximately R$11,844.7 million of IRPJ, plus accrued penalties and interest, and approximately R$6,867.0 million of CSLL, plus accrued penalties and interest, in fiscal year 2008, as a result of the corporate transaction that led to the association of Itaú Holding and Unibanco Holdings S.A. The Brazilian tax authorities allege that corporate transactions of a different kind should have been used. However, the transaction suggested by the Brazilian tax authorities is not supported in the rules applicable to financial institutions. We defend that the transactions conducted were appropriate and legitimate, having been approved by the involved companies’ management bodies and their respective stockholders, and subsequently sanctioned as well by the relevant regulatory authorities, including the CVM, the Central Bank and CADE. We and our external counsel assess the risk of loss in this tax proceeding as remote. On April, 10, 2017, the Administrative Board of Tax Appeals (CARF), by the Ordinary Instance, issued a favorable decision to us, canceling the tax assessment notice. The Brazilian federal government appealed to the Superior Chamber of CARF. We understand that the CARF decision is final, and there is no possibility of a review. As such, we presented a writ of security to have the final judgment of the administrative proceeding judicially recognized. Our injunction and sentence were favorable. Currently, the writ of security awaits judgment of the Brazilian federal government’s appeal and request for suspension of judgment.
Additionally, relating to the same transaction on November 14, 2013, we received a notice of tax assessment issued on behalf of Itaú Unibanco S.A., charging R$1,439.9 million of Income Tax (IRPJ) and R$502.6 million of (CSLL), plus accrued penalties and interest. We also assess the chance of in prevailing in this litigation as remote. We filed a voluntary appeal that was dismissed by CARF and by the Superior Administrative Court of Federal Tax Appeals (CSRF). Currently, the company is discussing the case in court.
Please see “Note 2.3 – Critical Accounting Estimates and Judgments, j) Provisions, Contingencies and Other Commitments” to our audited consolidated financial statements for further details about the changes in the provisions and respective escrow deposits for tax and social security lawsuits and main types of tax disputes.
174
Table of Contents
Stockholders’ Payment
Our Bylaws establish the distribution to stockholders of mandatory dividends equivalent to 25% of our net income calculated for each fiscal year, adjusted by the decrease or increase of amounts related to legal reserve, to reserve for contingencies and to its reversal related to prior years.
The mandatory dividend may be paid as dividends or interest on capital. The main difference between these forms of payment is tax-related. The payment of dividends is tax-free for stockholders.
The payment of interest on capital is subject to withholding income tax at a 15% rate, or 25% if the stockholder is a resident of or domiciled in a tax haven jurisdiction or a privileged tax regime.
The amount paid to stockholders as interest on capital, net of any withholding tax, may be included as part of the mandatory dividend. In such case, we are required to distribute to stockholders an amount sufficient to ensure that the net amount received by stockholders, after the payment by us of applicable withholding taxes in respect of the distribution of interest on capital, is at least equal to the mandatory dividend. For further information, please see “Item 10E. Taxation”.
Our Stockholder Remuneration Policy, which was approved by our the Board of Directors, establishes the monthly payment of R$0.015 per share as an advance mandatory dividend. The date used as a reference to determine which stockholders are entitled to receive such dividend in Brazil is determined based on the stockholding position registered on the last day of the preceding month. With respect to our ADSs, however, the date used to determine which stockholders are entitled to receive the monthly dividend is three days after the Brazilian reference date. In both cases, monthly dividends for a given month are paid on the first business day of the following month.
Stockholders may claim the payment of any dividend for a period of three years counted from the dividend payment date. After this period we have no responsibility whatsoever for such payment. Stockholders not residing in Brazil must register with the Central Bank so that dividends, interest on capital and other share-related amounts can be remitted abroad in foreign currency.
Currently, we pay dividends and interest on capital equivalent to or higher than the mandatory dividends, but this may not continue to happen if our stockholders decide that such distribution is not advisable in view of our financial condition. In this case, if our Fiscal Council is constituted, it must issue an opinion about that decision, and management must present a report to the CVM detailing the reasons for the suspension of the dividend payment. Profits not distributed due to a suspension of the dividend payment must be allocated to a special reserve and, if it is not absorbed by losses in subsequent years, it must be paid as dividends as soon as our financial position so permits.
For information regarding recent amounts paid or provisioned and reserved in stockholder’s equity, dividends and interest on own capital, see “Item 5A. Operating Results—Results—Highlights.”
Please see “Note 21 – Interest and Similar Income and Expense and Net Gain (Loss) on Investment Securities and Derivatives, b) Interest and Similar Expense,” to our audited consolidated financial statements and “Item 4B. Business Overview—Regulatory Environment—Basel III Framework—Implementation of Basel III in Brazil.”
Please see “Item 12D. American Depositary Shares—ADS Holders’ Payment of Dividends” for details on the payment of dividends to our ADS holders.
| 8B. | Significant Changes |
None.
175
Table of Contents
| ITEM 9. | THE OFFER AND LISTING |
| 9A. | Offer and Listing Details |
Our Shares
Beginning in 1996, we have held meetings with institutional investors in Brazil, the United States and Europe to present our governance practices, financial performance and value creation strategy, among other significant issues. Since 2002, in line with the commitment to strengthening our position in the Brazilian capital market and forge closer ties with stockholders and investors, we have held a number of presentations every year in different Brazilian regions where APIMEC operates.

176
Table of Contents
Stock Split
At the extraordinary general stockholders’ meeting held on July 27, 2018, our stockholders approved a 50% split of the then outstanding 6,536,090,232 shares, with no par value, consisting of 3,305,526,906 common shares and 3,230,563,326 preferred shares. At the same meeting, our stockholders also approved a proportional increase in our authorized share capital in order to allow for the 50% stock split.
In order to give effect to the stock split, we issued 3,268,045,116 new shares, consisting of 1,652,763,453 common shares and 1,615,281,663 preferred shares. In connection with the share split, treasury shares and ADSs were also split by 50%, therefore, ADS holders received one new ADS for every two ADSs they held. The ADSs continue to be traded at a ratio of one preferred share to one ADS.
Monthly dividends were maintained at R$0.015 per share so that the total amounts paid monthly by us to stockholders increased by 50% as from January 2, 2019. The annual minimum dividend assured to preferred shares was also maintained at R$0.022 per share. There were no changes in our Stockholder Remuneration Policy.
| 9B. | Plan of Distribution |
Not applicable.
| 9C. | Markets |
Our preferred shares and common shares have traded on the São Paulo Stock Exchange (currently B3) since 1944. Our preferred shares have been traded on the NYSE in the form of ADSs (one ADS represents one preferred share) since February 21, 2002, in compliance with NYSE and SEC requirements. ADS holders have no stockholder rights, which are governed by Brazilian Corporate Law. The depositary is the holder of the preferred shares underlying the ADSs. Holders of ADSs have ADS holder rights.
Regulation of the Brazilian Securities Market
According to the Brazilian Corporate Law, a company is considered publicly-traded or closely-held depending on whether the securities issued by it are accepted for trading in the securities market or not. All publicly-held companies, such as our company, are registered with the CVM, are subject to specific regulations and are also subject to information disclosure and reporting requirements.
Disclosure Requirements
See “Item 4B. Business Overview – Regulatory Environment” for more details regarding disclosure requirements.
Trading on the B3
B3 is a publicly traded corporation. Beginning in April 2000, the Brazilian stock exchanges were reorganized through the execution of protocols of intention by the Brazilian stock exchanges. Until April 2004, all shares underlying securities were traded only on the B3, with the exception of privatization auctions, which occurred on the Rio de Janeiro Stock Exchange. In May 2004, the Rio de Janeiro Stock Exchange reopened for the trading of certain Brazilian government securities.
If you were to trade in our shares on the B3, your trade would settle in three business days after the trade date. The seller is ordinarily required to deliver the shares to the exchange on the third business day following the trade date. Delivery of and payment for shares are made through the facilities of the Central Depository of B3.
177
Table of Contents
In September 2014, the CMN issued Resolution No. 4,373/14, amending and improving the provisions for (i) foreign investments through a depositary receipt mechanism; and (ii) investments made by non-resident investors in the financial and capital markets in Brazil. The main changes were: (a) increasing the number of instruments that may be issued through depositary receipts; (b) making it possible for non-resident investors to invest in financial and capital markets without having previously entered into foreign exchange operations; (c) clarifying the criteria for simultaneous foreign exchange operations; and (d) increasing the responsibility of the non-resident investor’s representative. CMN Resolution No. 4,373/14 became effective in March 2015.
See “Item 10E. Taxation – Brazilian Tax Considerations—Taxation of Gains” for a description of certain tax benefits extended to non-Brazilian holders who qualify under CMN Resolution No. 4,373/14.
Corporate Governance Practices of B3
In 2000, B3 introduced three special listing segments known as “Levels 1 and 2 of Differentiated Corporate Governance Practices and Novo Mercado” with the purpose of stimulating the secondary market of securities issued by Brazilian companies listed on B3, encouraging these companies to follow good corporate governance practices. B3 subsequently introduced two new segments called “Bovespa Mais” and “Bovespa Mais Nível 2,” specifically for small- and medium-scale companies. The listing segments were designed for the trading of shares issued by companies that voluntarily commit themselves to follow corporate governance practices and disclosure requirements beyond those required by Brazilian legislation. These rules generally increase shareholders’ rights and increase the quality of the information made available to shareholders. Newly amended rules for Levels 1 and 2 of Differentiated Corporate Governance Practices came into effect in May 2011 and newly amended rules for Novo Mercado came into effect in May 2018.
To become a “Level 1” company, like us, the issuer must agree to the following requirements, in addition to those imposed by applicable law: (i) ensure that the shares that represent at least 25.0% of its total capital are actually available for trading; (ii) adopt offering procedures that favor the widespread ownership of the shares whenever a public offer is made; (iii) comply with minimum standards for quarterly disclosure; (iv) follow stricter disclosure policies for transactions done by its controlling shareholders, members of its Board of Directors and executives that involve securities issued by the issuer; (v) submit any existing shareholders’ agreement and stock option plans to B3; and (vi) prepare a schedule of corporate events and make it available to the shareholders.
To become a “Level 2” company, the issuer must agree to the following requirements, in addition to those imposed by applicable law: (i) comply with all Level 1 listing requirements; (ii) grant tag-along rights to all shareholders in case the company’s control is transferred, offering to common shareholders the same price paid per share for the controlling block of common and preferred shares; (iii) give holders of preferred shares voting rights for decisions on certain corporate restructurings and related-party transactions, such as: (a) conversions, acquisitions, mergers or splits; (b) approval of any transactions between the company and its controlling shareholder, if such decisions are within the competence of the general meeting; (c) valuation of assets to be used for payment of a share capital increase; (d) selecting an institution or specialized company to determine the economic value of the company; and (e) any alterations to these voting rights that will prevail as long as the agreement to adhere to the B3’s “Level 2” segment is in force; (iv) the Board of Directors must be made up of at least five members, of which at least a minimum of 20.0% shall be independent members with a term of office limited to two years, and reelection is permitted; (v) prepare financial statements in English, including the statement of cash flows, according to international accounting standards such as U.S. GAAP or IFRS; (vi) effect a tender offer by the company’s controlling shareholder (the minimum price of the shares to be offered shall be determined by an assessment process), if the controlling shareholder decides on the delisting from the “Level 2” segment; and (vii) exclusively adopt the B3 “Arbitration Board” rules for resolving any conflicts between the company and its investors.
To join B3’s “Novo Mercado” segment, an issuer must meet all requirements described in “Levels 1 and 2,” including the issuance of common shares only (with voting rights) and granting tag-along rights to all shareholders in case the company’s control is transferred, offering the same price paid per share for the controlling block of shares.
In 2001, we executed an agreement with B3 to list our shares in the Level 1 segment, effective immediately after the disclosure of the offer’s opening date in Brazil. We agreed to comply with and continue to comply with all of the Level 1 listing requirements.
178
Table of Contents
| 9D. | Selling Shareholders |
Not applicable.
| 9E. | Dilution |
Not applicable.
| 9F. | Expenses of the Issue |
Not applicable.
| ITEM 10. | ADDITIONAL INFORMATION |
| 10A. | Share Capital |
Not applicable.
| 10B. | Memorandum and Articles of Association |
Set forth below is certain information concerning our capital stock and a brief summary of certain significant provisions of our Bylaws and Brazilian Corporate Law. This description does not purport to be complete and is qualified by reference to our Bylaws and to Brazilian Corporate Law.
Corporate Purpose
We are organized as a publicly held corporation for an unlimited period of time under the laws of Brazil. Our head offices are located at Praça Alfredo Egydio de Souza Aranha, 100, 04344-902, São Paulo, SP, Brazil and our telephone number is +55 (11) 2794-3547. We are primarily governed by Brazilian Corporate Law and our Bylaws. Our Tax Payer’s Registry (CNPJ) is 60.872.504/0001-23, and we are registered with the São Paulo Commercial Registry (Junta Comercial do Estado de São Paulo) under NIRE 35300010230.
Our corporate purpose, as set forth in Article 2 of our Bylaws, is to perform banking activity in all its authorized forms, including foreign exchange transactions. Our agent for service of process in the United States is the general manager of our New York branch, which is located at 767 Fifth Avenue, 50th floor, New York, NY 10153.
Adoption of Cumulative Voting
Under Brazilian Corporate Law and CVM’s regulation, stockholders that represent at least 5% of share capital with voting rights may demand a cumulative voting process up to 48 hours before a general stockholders’ meeting. Each share will be entitled to as many votes as the members of the board being elected, and the stockholder has the right to concentrate votes in one candidate or distribute them among several candidates. The presiding officer must inform the stockholders in advance about the number of votes required for the election of each member of the Board of Directors.
Whenever the election of the Board of Directors is held under the cumulative vote process and the common or preferred stockholders exercise their right of electing one director, the controlling stockholder will have the right to elect directors in the same number as those elected by the other stockholders plus one, regardless of the number of directors that, according to our Bylaws, compose the board.
179
Table of Contents
Preemptive right, capital increase and payment for subscribed shares
Each stockholder has the preemptive right to subscribe for shares in any capital increase, in proportion to his equity interest, except in specific cases, in compliance with Brazilian Corporate Law.
Our Bylaws authorize the Board of Directors to increase our capital stock up to a limit of 13,176,900,000 shares, of which 6,588,450,000 must be common shares and 6,588,450,000 preferred shares (authorized capital). Up to the limit of our authorized capital, shares may be issued without considering our stockholders preemptive rights if it is made: (i) for sale on a stock exchange; (ii) by public subscription; and (iii) in exchange for our shares at a public offering for acquisition of our control. Regardless of this provision, all increases in capital stock must be ratified by stockholders and approved by the Central Bank.
After the approval of the capital increase by the Central Bank, stockholders must pay the amount corresponding to subscribed shares under the terms established in the subscription documentation in connection with that capital increase. A stockholder that fails to make payments under the terms of the subscription documentation will be deemed to be in default in accordance with Brazilian Corporate Law.
Brazilian legislation does not provide for liability in capital calls, therefore the ownership interest of our stockholders may be diluted if they decide not to exercise their preemptive rights to subscribe shares in cases of capital increase.
Form and Transfer
Our shares are book-entry and Itaú Corretora de Valores S.A. is our bookkeeping service provider. Therefore, the shares issued by us are to be kept in deposit accounts, under the investor’s name.
As an alternative, the investor may also deposit shares in the B3 via a custodian institution authorized by the CVM. In such case, the B3, as central depositary, holds the shares under its name but controls the ownership of the securities through a structure of deposit accounts kept under the investors’ name. There is no distinction in the rights and obligations of stockholders, regardless of whether their shares are deposited with a broker-dealer or with B3.
Redemption and withdrawal rights
Our common shares and our preferred shares are not redeemable, except upon delisting. Pursuant to Brazilian Corporate Law, however, the approval of certain matters entitles a dissenting stockholder to withdraw from the company, such right expiring thirty days after publication of the minutes of the applicable stockholders’ meeting. This withdrawal may occur under certain conditions upon reimbursement of the value of such holder’s shares, calculated based on criteria set forth under Brazilian Corporate Law. Also, in accordance with Brazilian Corporate Law, we are entitled to reconsider any resolution that gives rise to a withdrawal within ten days following the expiration of the withdrawal period, if such exercise of withdrawal rights jeopardizes our financial stability.
Withdrawal rights are not available to stockholders whose shares have liquidity and are actively traded in the stock market in cases of merger or takeover or in case the company elects to take part in a group of companies.
Common and preferred shares should be reimbursed upon cancellation of their registration at their value, calculated based on the criteria set forth under Brazilian Corporate Law. If the resolution that gave rise to withdrawal rights was approved more than 60 days after the date when the last balance sheet was approved, the stockholder may demand that his shares be redeemed at a value based on a new balance sheet, dated up to 60 days after the date of the general meeting.
Threshold above which shareholder ownership must be disclosed
Brazilian regulations require that any person or group of persons representing the same interest that has directly or indirectly acquired an interest corresponding to 5.0% of any type or class of shares of a publicly traded company must disclose its share ownership to the CVM and to Brazilian stock exchanges. Any subsequent increase or decrease of 5.0% or more in ownership of any type or class of shares must be similarly disclosed.
180
Table of Contents
Our Governance
Our governance structure
The main goal of our corporate governance is to create an efficient set of incentive and monitoring mechanisms to ensure that management members are always aligned with our stockholders’ best interests in a sustainable way. In order to achieve this goal, we have set up decision-making bodies and institutionalized procedures to align management with our meritocratic, performance-focused and long-term value-creation culture.
The three main pillars of our corporate governance structure are:

Our Policies
We adopt policies in order to formalize and consolidate existing structures to protect the interests of our employees, management members and stockholders, as well as promote our culture and values, always seeking to run business in an ethical and transparent manner, preventing and fighting fraud and illegal acts and ensuring our business sustainability.
181
Table of Contents
The following illustration presents the main documents related to our corporate governance, including our Bylaws, as approved by our Board of Directors.

182
Table of Contents
Our Practices
Given that our shares have traded on the São Paulo Stock Exchange (currently B3) since 1944 and our ADSs have traded on the NYSE since 2002, we comply with the rules of the CVM, the B3, the SEC and the NYSE.
The following timeline illustrates the main Corporate Governance practices adopted over recent years:

183
Table of Contents
Management structure
Our management is structured to ensure that matters are extensively discussed and decisions are made on a collective basis. The information below concerns our management bodies, their main duties and composition:


184
Table of Contents
| 10C. | Material Contracts |
None.
| 10D. | Exchange controls |
Individuals or legal entities domiciled outside Brazil may own our stock through ADSs negotiated in a U.S. Exchange or through direct investments in the Brazilian Market.
However, the right to convert dividend payments and proceeds from the sale of our shares in the Brazilian Market, into foreign currency and to remit such amounts abroad is subject to compliance with requirements of Brazilian foreign investment and foreign currency legislation. This legislation generally requires, among other things, documentary evidence that establishes the legality, the legitimacy and the economic validity of the exchange operation and that the relevant investment has registered with the Central Bank and the CVM, as applicable.
In case the investment in our stock is made through ADS, the ADS holders benefit from the electronic certificate of foreign capital registration obtained in Brazil by the custodian of the preferred shares underlying the ADSs, which permits the depositary bank to convert dividends and other distributions with respect to the preferred shares underlying the ADSs into foreign currency and remit the proceeds abroad.
In case the investment in our stock is made directly in the Brazilian Market, such investment needs to be registered with the Central Bank either as (i) a foreign direct investment, the Electronic Declaratory Registration of Foreign Direct Investment (RDE-IED), or (ii) a portfolio investment, the Electronic Declaratory Registration of Portfolio (RDE – Portfolio).
The foreign direct investment (RDE-IED) enables non-resident investors to hold stock of companies, although it, limits the ability of the investor to negotiate such stocks in the Brazilian Capital Markets. On the other hand, the portfolio investment (RDE – Portfolio) entitles certain foreign investors to invest not only in stocks, but also in other financial assets and securities, and to engage in a variety of transactions available in the Brazilian financial and capital markets, provided that certain requirements of the regulation are fulfilled.
Registration under RDE – Portfolio affords favorable tax treatment to non-resident investors who are not residents or domiciled in tax haven jurisdictions, as defined by Brazilian tax laws.
| 10E. | Taxation |
Taxation Considerations for ADS Holders
This summary is based upon tax laws of Brazil and the United States in effect as of the date hereof, and contains a description of the main Brazilian and U.S. federal income tax considerations regarding the acquisition, ownership and disposition of our preferred shares or ADSs, but it does not purport to be a comprehensive description of all the tax considerations that may be relevant to these matters, considering that laws are subject to change and to differing interpretations (possibly with retroactive effect). Although there is no income tax treaty between Brazil and the United States in place, the tax authorities of the two countries have agreed in applicable provisions of reciprocal tax treatment as to compensation of tax withheld at the source country in the residence country. No assurance can be given, however, as to whether or when a treaty will enter into force or how it will affect a U.S. Holder (as defined below) of our preferred shares or ADSs.
Prospective purchasers of our preferred shares or ADSs should consult their own tax advisors as to the tax consequences of the acquisition, ownership and disposition of our preferred shares and ADSs, including, in particular, the effect of any non-U.S., non-resident, state or local tax laws.
Brazilian Tax Considerations
The following discussion summarizes the main Brazilian tax consequences related to the acquisition, ownership and disposition by Non-Resident Holders of our ADSs.
Non-Resident Holders Resident or Domiciled in Tax Haven Jurisdictions
Under Brazilian tax laws, as regulated by Article 1 of Normative Instruction No. 1,037 of June 4, 2010, as amended, a “tax haven” is defined as a country or location (a) that does not impose any income tax or where the maximum income tax rate is 20%, or 17% as further detailed below (b) where the local legislation imposes restrictions on disclosure regarding shareholder composition or investment ownership. A list of current tax haven jurisdictions has been published per such Normative Instruction. Non-Resident Holders resident or domiciled in tax haven jurisdictions may be subject to withholding tax in Brazil at higher rates than Non-Resident Holders not resident or domiciled in tax havens, as described below.
185
Table of Contents
Additionally, on June 24, 2008, Law No. 11,727 introduced the concept of “privileged tax regime,” which is defined as a tax regime that (i) does not tax income or taxes it at a maximum rate lower than 20%; (ii) grants tax benefits to non-resident entities or individuals (a) without the requirement to carry out substantial economic activity in the country or dependency or (b) contingent to the non-exercise of substantial economic activity in the country or dependency; (iii) does not tax or that taxes income generated abroad at a maximum rate of lower than 20%; or (iv) does not provide access to information related to shareholding composition, ownership of assets and rights or economic transactions carried out.
On November 28, 2014, the Brazilian tax authorities issued Ordinance No. 488, which decreased these minimum thresholds from 20% to 17% in certain cases. Under Ordinance No. 488, the 17% threshold applies only to countries and regimes aligned with international standards of fiscal transparency, in accordance with rules to be established by the Brazilian tax authorities.
Notwithstanding the above, we recommend that you consult your own tax advisors regarding the consequences of the implementation of Law No. 11,727, Normative Ruling No. 1,037 and of any related Brazilian tax law or regulation concerning tax havens and privileged tax regimes.
Income Tax for Individuals and Foreign Investors
Law No. 13,259 enacted on March 16, 2016 increased the flat 15% rate of the income tax levied on capital gains derived by individuals, certain corporations and foreign investors (individuals and corporations) as a result of the disposal of assets and rights in general exceeding R$5 million, by adopting a system of progressive rates that may reach a 22.5% tax rate (for positive results exceeding R$30 million). Since capital gains arising from transactions executed through a securities exchange are subject to specific tax rules, which are not included under the scope of Law No. 13,259, it is possible to sustain the position that the provisions of this rule should not apply to such transactions. This rule applies since January 1, 2017. If the stockholder is a resident of or domiciled in a tax haven jurisdiction, the capital gains are still subject to the withholding income tax at a 25% rate.
Taxation of Dividends
Payment of dividends derived from profits generated after January 1, 1996, including dividends paid in kind, are not subject to withholding tax in Brazil. Payment of dividends derived from profits generated before January 1st, 1996 may be subject to Brazilian withholding tax at varying rates, according to the year when the profits have been generated.
Taxation of Interest on Net Equity
Law No. 9,249, dated December 26, 1995, as amended, allows a Brazilian corporation, such as ourselves, to also make payments of interest on net equity in addition to dividend distributions. Currently, payments of interest on net equity are subject to withholding tax at a rate of 15%, or 25% in the case of a Non-Resident Holder that is resident or domiciled in a tax haven jurisdiction, as set forth in Article 14 from the Normative Instruction No. 1,455, dated March 6, 2014.
Taxation of Gains
Sales or Other Dispositions of ADSs
Gains realized outside Brazil by a Non-Resident Holder from the sale or other disposition of ADSs to another Non-Resident Holder should not be subject to Brazilian taxation. However, according to Law No. 10,833, dated December 29, 2003, as amended, the disposition of assets located in Brazil by a Non-Resident Holder may be subject to Brazilian withholding tax at a 15% flat rate or a progressive rate varying from 15%to 22.5% depending on the kind of investment made into Brazil and the location where the Non-Resident Holder is resident or domiciled (also, a 25% rate may apply if the foreign beneficiary is resident or domiciled in a jurisdiction deemed to be a tax haven for Brazilian tax purposes).
186
Table of Contents
Although the referred Law does not clarify what is considered to be an asset located in Brazil, ADSs generally should not be considered to be assets located in Brazil for purposes of such Law, because they represent securities issued and negotiated in an offshore exchange market. It is important to note that even if ADSs were considered to be assets located in Brazil, Non-Resident Holders not resident or domiciled in tax haven jurisdictions may still apply for exemption from capital gains tax according to Article 81 of Law No. 8,981, dated January 20, 1995, as amended.
Conversion of Our Preferred Shares into ADSs
The deposit by a Non-Resident Holder of our preferred shares with the depositary for conversion into ADSs may be subject to Brazilian capital gains tax, if such Non-Resident Holder is resident or domiciled in a tax haven jurisdiction or if such preferred shares have not been registered under the Central Bank according to CMN Resolution No. 4,373, dated September 29, 2014, effective as of March 30, 2015 (former CMN Resolution No. 2,689, dated January 26, 2000, and CMN Resolution No. 1,927, dated May 18, 1992), as amended. In those cases, the positive difference between the acquisition cost of such preferred shares or the amount otherwise previously registered under the Central Bank and the average price of such preferred shares, according to the mentioned CMN Resolution No. 4,373/14), may be considered taxable capital gain, and may be subject to income tax. Please refer to “Funds of foreign investors”, for further details.
Non-Resident Holders that are resident or domiciled in tax haven jurisdictions may be subject to capital gain tax at a 25% rate on sale or transfer of shares outside of the financial and capital markets upon such a conversion. On the other hand, when Non-Resident Holders that are not resident or domiciled in tax haven jurisdictions deposit preferred shares registered according to CMN Resolution No. 4,373/14 in exchange for ADSs, such deposit should not be subject to capital gain tax.
Sales or Other Dispositions of Our Preferred Shares
Non-Resident Holders not resident or domiciled in tax haven jurisdictions that register their portfolio according to CMN Resolution No. 4,373/14 may benefit from a special capital gains tax exemption available for the sale of securities in the Brazilian stock exchange. On the other hand, sale of shares not registered according to CMN Resolution No. 4,373/14 or made outside of Brazilian stock exchanges is generally subject to 15% capital gain tax.
Such special treatment is not applicable to Non-Resident Holders resident or domiciled in tax haven jurisdictions, who are subject to general taxation rules applicable to Brazilian residents on the sale of their investments in the financial markets, including stock exchanges and over-the-counter markets. In these cases, the tax rate is generally 15%. If such Non-Resident Holders sell shares outside of the financial and capital markets, the income taxation rate will instead be of 25%. Any exercise of preemptive rights related to our preferred shares (and in connection with the ADS program) will not be subject to Brazilian taxation. The gains from the sale or assignment of preemptive rights will be subject to the Brazilian income tax according to the same rules applicable to disposition of shares or ADSs.
Tax on Financial Transactions IOF/Exchange (IOF/FX) and IOF/Securities
According to the Decree No. 6,306/2007, and further amendments, Tax on Financial Transactions may levy some foreign exchange transactions.
The acquisition of ADSs is not subject to IOF tax. As of December 24, 2013, pursuant to Decree No. 8,165, the IOF/Securities tax levied on the assignment of shares traded in the Brazilian stock exchange market in order to permit the issuance of depositary receipts to be negotiated overseas has been reduced to 0% rate.
Other Brazilian Taxes
There are no Brazilian inheritance, gift or succession taxes applicable to the transfer of ownership or title (ownership without beneficial interest) of our preferred shares or ADSs or the vesting of free beneficial interest of such shares or ADSs outside Brazil by a Non-Resident Holder, except for gift, inheritance and legacy taxes that are levied by some states of Brazil if bestowed in such states of Brazil or abroad when the receiver is resident or domiciled in these states of Brazil. There are no Brazilian stamp, issue, registration, or similar taxes or duties payable to Non-Resident Holders of our preferred shares or ADSs.
187
Table of Contents
INVESTORS ARE STRONGLY ADVISED TO CONSULT THEIR OWN TAX ADVISORS AS TO BRAZILIAN TAX CONSIDERATIONS RELATING TO THE PURCHASE, OWNERSHIP AND DISPOSITION OF OUR PREFERRED SHARES OR ADSs CONSIDERING THEIR PARTICULAR FACTS AND CIRCUMSTANCES, AS WELL AS THE EFFECT OF ANY NON-BRAZILIAN TAX LAWS.
U.S. Federal Income Tax Considerations
The following is a general discussion of certain U.S. federal income tax considerations relating to the purchase, ownership and disposition of our preferred shares or ADSs by U.S. Holders (as defined below) who hold such preferred shares or ADSs as capital assets within the meaning of section 1221 of the U.S. Internal Revenue Code of 1986, as amended, or the Code. This discussion does not address all of the U.S. federal income tax considerations that may be relevant to specific U.S. Holders in light of their particular circumstances or to U.S. Holders subject to special treatment under U.S. federal income tax law, such as banks, insurance companies, retirement plans, regulated investment companies, real estate investment trusts, dealers in securities, brokers, tax-exempt entities, certain former citizens or residents of the United States, U.S. Holders that hold our preferred shares or ADSs as part of a “straddle,” “hedging,” “conversion” or other integrated transaction, U.S. Holders that mark their securities to market for U.S. federal income tax purposes, U.S. Holders that have a functional currency other than the U.S. dollar, U.S. Holders that own (or are deemed to own) 10% or more (by voting power or value) of our shares or U.S. Holders that receive our preferred shares or ADSs as compensation. In addition, this discussion does not address the effect of any U.S. state, local or non-U.S. tax considerations or any U.S. estate, gift or alternative minimum tax considerations.
This discussion is based on the Code, U.S. Treasury regulations promulgated or proposed thereunder and administrative and judicial interpretations thereof, all as in effect on the date hereof, and all of which are subject to change, possibly with retroactive effect, or subject to differing interpretations. This discussion also assumes that each obligation in the deposit agreement and any related agreement will be performed in accordance with its terms.
For purposes of this discussion, the term “U.S. Holder” means a beneficial owner of our preferred shares or ADSs that is, for U.S. federal income tax purposes, (i) an individual who is a citizen or resident of the United States, (ii) a corporation (or entity treated as a corporation) created or organized in or under the laws of the United States, any state thereof, or the District of Columbia, (iii) an estate the income of which is subject to U.S. federal income tax regardless of its source, or (iv) a trust (x) with respect to which a court within the United States is able to exercise primary supervision over its administration and one or more U.S. persons have the authority to control all of its substantial decisions or (y) that has in effect a valid election under applicable U.S. Treasury regulations to be treated as a U.S. person.
If an entity or arrangement treated as a partnership for U.S. federal income tax purposes invests in our preferred shares or ADSs, the U.S. federal income tax treatment of a partner will depend in part upon the status and activities of such entity or arrangement and the particular partner. Any such entity and partners in such entity or arrangement should consult their own tax advisors regarding the U.S. federal income tax considerations applicable to them relating to the purchase, ownership and disposition of such preferred shares or ADSs, especially in light of recent changes to U.S. tax law.
INVESTORS ARE STRONGLY ADVISED TO CONSULT THEIR OWN TAX ADVISORS AS TO THE U.S. FEDERAL, STATE AND LOCAL TAX CONSIDERATIONS RELATING TO THE PURCHASE, OWNERSHIP AND DISPOSITION OF OUR PREFERRED SHARES OR ADSs IN LIGHT OF THEIR PARTICULAR CIRCUMSTANCES, AS WELL AS THE EFFECT OF ANY NON-U.S. TAX LAWS.
Except where specifically described below, this discussion assumes that we are not and will not be a passive foreign investment company, or a PFIC, for U.S. federal income tax purposes. Please see the discussion under “Passive Foreign Investment Company Considerations” below.
188
Table of Contents
Treatment of ADSs
A U.S. Holder of ADSs generally will be treated for U.S. federal income tax purposes as the owner of such U.S. Holder’s proportionate interest in our preferred shares held by the depositary (or its custodian) that are represented and evidenced by such ADSs. Accordingly, any deposit or withdrawal of our preferred shares in exchange for ADSs generally will not result in the realization of gain or loss to such U.S. Holder for U.S. federal income tax purposes.
Distributions
A U.S. Holder that receives a distribution with respect to our preferred shares (whether held through ADSs or directly), including payments of interest on net equity as described above under “Brazilian Tax Considerations – Taxation of Interest on Net Equity,” generally will be required to include the amount of such distribution (without reduction for any Brazilian withholding tax with respect thereto) in gross income as a dividend to the extent of our current or accumulated earnings and profits (as determined for U.S. federal income tax purposes) on the date such U.S. Holder (or the depositary, in the case of ADSs) actually or constructively receives such distribution, and will not be eligible for the dividends received deduction allowed to corporations. A distribution on our preferred shares (whether held through ADSs or directly) in excess of current and accumulated earnings and profits generally will be treated first as a non-taxable return of capital to the extent of such U.S. Holder’s basis in such preferred shares or ADSs, as the case may be, and thereafter as gain from the sale or exchange of such preferred shares or ADSs (which will be treated in the same manner described below under “Sale, Exchange or Other Disposition of Preferred Shares or ADSs”). We have not maintained and do not plan to maintain calculations of earnings and profits for U.S. federal income tax purposes. As a result, a U.S. Holder may need to include the entire amount of any such distribution in income as a dividend.
The U.S. dollar value of any distribution on our preferred shares made in Brazilian reais generally should be calculated by reference to the exchange rate between the U.S. dollar and the Brazilian real in effect on the date of receipt of such distribution by the U.S. Holder (or the depositary, in the case of ADSs), regardless of whether the reais so received are in fact converted into U.S. dollars. Such U.S. Holder generally will have a basis in such reais equal to the U.S. dollar value of such reais on the date of receipt. Any gain or loss on a subsequent conversion or other disposition of such reais by such U.S. Holder generally will be treated as ordinary income or loss and generally will be income or loss from sources within the United States.
Distributions treated as dividends that are received by certain non-corporate U.S. persons (including individuals) in respect of shares of a non-U.S. corporation (other than a corporation that is, in the taxable year during which the distributions are made or the preceding taxable year, a PFIC) that is readily tradable on an established securities market in the United States generally qualify for a 20% reduced maximum tax rate (and potentially additional tax discussed below under “Medicare Tax”) so long as certain holding period and other requirements are met. Since the ADSs will be listed on the NYSE, unless we are treated as a PFIC with respect to a U.S. Holder, dividends received by such a U.S. Holder in respect of the ADSs should qualify for the reduced rate. Based on existing guidance, it is not entirely clear whether dividends received by such a U.S. Holder of our preferred shares in respect of such shares will qualify for the reduced rate, because our preferred shares are not themselves listed on a United States exchange. Special rules apply for purposes of determining the recipient’s investment income (which may limit deductions for investment interest) and foreign income (which may affect the amount of U.S. foreign tax credit) and to certain extraordinary dividends. Each U.S. Holder that is a non-corporate taxpayer should consult its own tax advisor regarding the possible applicability of the reduced tax rate and the related restrictions and special rules.
Sale, Exchange or Other Disposition of Preferred Shares or ADSs
Upon a sale, exchange or other taxable disposition of our preferred shares or ADSs, a U.S. Holder generally will recognize gain or loss for U.S. federal income tax purposes in an amount equal to the difference, if any, between the amount realized on such sale, exchange or other taxable disposition and such U.S. Holder’s adjusted tax basis in such preferred shares or ADSs. Any gain or loss so recognized generally will be long-term capital gain or loss if such U.S. Holder has held such preferred shares or ADSs for more than one year at the time of such sale, exchange or other taxable disposition. Certain non-corporate U.S. Holders are entitled to preferential treatment for net long-term capital gains. The ability of a U.S. Holder to offset capital losses against ordinary income is limited.
189
Table of Contents
A U.S. Holder that receives Brazilian reais from the sale, exchange or other disposition of our preferred shares generally will realize an amount equal to the U.S. dollar value of such reais on the settlement date of such sale, exchange or other taxable disposition if (i) such U.S. Holder is a cash basis or electing accrual basis taxpayer and our preferred shares are treated as being “traded on an established securities market” or (ii) such settlement date is also the date of such sale, exchange or other taxable disposition. Such U.S. Holder generally will have a basis in such reais equal to the U.S. dollar value of such reais on the settlement date. Any gain or loss on a subsequent conversion or other taxable disposition of such reais by such U.S. Holder generally will be treated as ordinary income or loss and generally will be income or loss from sources within the United States. Each U.S. Holder should consult its own tax advisor regarding the U.S. federal income tax consequences of receiving reais from the sale, exchange or other taxable disposition of our preferred shares in cases not described in the first sentence of this paragraph.
Foreign Tax Credit Considerations
Distributions on our preferred shares (whether held through ADSs or directly), including payments of interest on net equity as described above under “Brazilian Tax Considerations, Taxation of Interest on Net Equity,” that are treated as dividends, before reduction for any Brazilian withholding taxes with respect thereto, generally will be included in the gross income of a U.S. Holder. Thus, such U.S. Holder may be required to report income for such purposes in an amount greater than the actual amount such U.S. Holder receives in cash. Distributions treated as dividends generally will constitute income from sources outside the United States and generally will be categorized for U.S. foreign tax credit purposes as “passive category income” or, in the case of some U.S. Holders, as “general category income.” Subject to applicable limitations and holding period requirements, a U.S. Holder may be eligible to elect to claim a U.S. foreign tax credit against its U.S. federal income tax liability for any such Brazilian withholding taxes. Under current law, gain resulting from a sale or other disposal of our preferred shares or ADSs may be subject to Brazilian income or withholding taxes. A U.S. Holder’s use of a foreign tax credit with respect to any such Brazilian income or withholding taxes could be limited, as such gain generally will constitute income from sources within the United States. A U.S. Holder that does not claim a U.S. foreign tax credit generally may instead claim a deduction for any such Brazilian taxes, but only for a taxable year in which such U.S. Holder elects to do so with respect to all non-U.S. income taxes paid or accrued by such U.S. Holder in such taxable year. Foreign currency exchange gain or loss generally will constitute income from sources within the United States. The rules relating to foreign tax credits are complex, and each U.S. Holder should consult its own tax advisor regarding the application of such rules.
Passive Foreign Investment Company Considerations
Special U.S. federal income tax rules apply to U.S. persons owning shares of a PFIC. A non-U.S. corporation generally will be classified as a PFIC for U.S. federal income tax purposes in any taxable year in which, after applying relevant look-through rules with respect to the income and assets of certain subsidiaries, either: at least 75% of its gross income is “passive income”, or on average at least 50% of the gross value of its assets is attributable to assets that produce passive income or are held for the production of passive income.
For this purpose, passive income generally includes, among other things, dividends, interest, rents, royalties, gains from the disposition of passive assets and gains from commodities transactions.
The application of the PFIC rules to banks is unclear under present U.S. federal income tax law. Banks generally derive a substantial part of their income from assets that are interest bearing or that otherwise could be considered passive under the PFIC rules. The IRS, has issued a notice, and has proposed regulations, that exclude from passive income any income derived in the active conduct of a banking business by a qualifying foreign bank, also known as the Active Bank Exception. The IRS notice and proposed regulations have different requirements for qualifying as a foreign bank, and for determining the banking income that may be excluded from passive income under the Active Bank Exception. Moreover, the proposed regulations have been outstanding since 1994 and will not be effective unless finalized.
Based on estimates of our current and projected gross income and gross assets, we do not believe that we will be classified as a PFIC for our current or future taxable years. The determination of whether we are a PFIC, however, is made annually and is based upon the composition of our income and assets (including income and assets of entities in which we hold at least a 25% interest), and the nature of our activities (including our ability to qualify for the Active Bank Exception).
190
Table of Contents
Because final regulations have not been issued and because the notice and the proposed regulations are inconsistent, our status under the PFIC rules is subject to considerable uncertainty. While we conduct, and intend to continue to conduct, a significant banking business, there can be no assurance that we will satisfy the specific requirements for the Active Bank Exception under either the IRS notice or the proposed regulations. Accordingly, U.S. Holders could be subject to U.S. federal income tax under the rules described below.
If we are treated as a PFIC for any taxable year during which a U.S. Holder owns our preferred shares or ADSs, any gain realized on a sale or other taxable disposition of such preferred shares or ADSs and certain “excess distributions” (generally distributions in excess of 125% of the average distribution over the prior three-year period, or if shorter, the holding period for such preferred shares or ADSs) will be treated as ordinary income and will be subject to tax as if (i) the excess distribution or gain had been realized ratably over the U.S. Holder’s holding period for such preferred shares or ADSs, (ii) the amount deemed realized in each year had been subject to tax in each such year at the highest marginal rate for such year (other than income allocated to the current period or any taxable period before we became a PFIC, which would be subject to tax at such U.S. Holder’s regular ordinary income rate for the current year and would not be subject to the interest charge discussed below), and (iii) the interest charge generally applicable to underpayments of tax had been imposed on the taxes deemed to have been payable in those years.
We do not expect to provide information that would allow U.S. Holders to avoid the foregoing consequences by making a “qualified electing fund” election.
If we are treated as a PFIC and, at any time, we invest in non-U.S. corporations that are classified as PFICs, or Subsidiary PFICs, U.S. Holders generally will be deemed to own, and also would be subject to the PFIC rules with respect to, their indirect ownership interest in any such Subsidiary PFIC. If we are treated as a PFIC, a U.S. Holder could incur liability for the deferred tax and interest charge described above if either (i) we receive a distribution from, or dispose of all or part of our interest in, any such Subsidiary PFIC or (ii) such U.S. Holder disposes of all or part of our preferred shares or ADSs.
A U.S. holder of shares in a PFIC (but possibly not a Subsidiary PFIC, as discussed below) may make a “mark-to-market” election, provided the PFIC shares are “marketable stock” as defined under applicable Treasury regulations (i.e., “regularly traded” on a “qualified exchange or other market”). Under applicable Treasury regulations, a “qualified exchange or other market” includes (i) a national securities exchange that is registered with the U.S. Securities and Exchange Commission or the national market system established under the Exchange Act or (ii) a foreign securities exchange that is regulated or supervised by a governmental authority of the country in which the market is located and meets certain trading, listing, financial disclosure and other requirements set forth in applicable Treasury regulations. The ADSs are traded on the NYSE and the preferred shares are traded on the B3. The NYSE constitutes a qualified exchange or other market. Although the IRS has not addressed whether the B3 meets the requirements to be treated as a qualified exchange or other market, we believe that the B3 should be so treated. PFIC shares traded on a qualified exchange or other market are regularly traded on such exchange or other market for any calendar year during which such shares are traded, other than in de minimis quantities, on at least 15 days during each calendar quarter. We cannot assure U.S. Holders that our preferred shares or ADSs will be treated as “marketable stock” for any taxable year.
The tax consequences that would apply if we were a PFIC would be different from those described above if a “mark-to-market” election is available and a U.S. Holder validly makes such an election as of the beginning of such U.S. Holder’s holding period. If such an election were made, such U.S. Holder generally would (i) include in gross income, entirely as ordinary income, an amount equal to the excess, if any, of the fair market value of our preferred shares or ADSs as of the close of each taxable year and such U.S. Holder’s adjusted tax basis in such preferred shares or ADSs, and (ii) deduct as an ordinary loss the excess, if any, of such U.S. Holder’s adjusted tax basis in such preferred shares or ADSs over the fair market value of such preferred shares or ADSs at the end of the taxable year, but only to the extent of the net amount previously included in gross income as a result of the mark-to-market election. Any gain from a sale, exchange or other disposition of our preferred shares or ADSs in a taxable year in which we were a PFIC would be treated as ordinary income, and any loss from such sale, exchange or other disposition would be treated first as ordinary loss (to the extent of any net mark-to-market gains previously included in income) and thereafter as capital loss. A U.S. Holder’s adjusted tax basis in such preferred shares or ADSs would increase or decrease by the amount of the gain or loss taken into account under the mark-to-market regime. Even if a U.S. Holder is eligible to make a mark-to-market election with respect to our preferred shares or ADSs, however, it is not clear whether or how such election would apply with respect to the shares of any Subsidiary PFIC that such U.S. Holder is treated as owning, because such Subsidiary PFIC shares might not be marketable stock. The mark-to-market election is made with respect to marketable stock in a PFIC on a shareholder-by-shareholder basis and, once made, can only be revoked with the consent of the IRS. Special rules would apply if the mark-to-market election is not made for the first taxable year in which a U.S. Holder owns any equity interest in us while we are a PFIC.
A U.S. Holder who owns our preferred shares or ADSs during any taxable year that we are treated as a PFIC generally would be required to file an information return with respect to us and any Subsidiary PFIC in which the U.S. Holder holds a direct or indirect interest. U.S. Holders should consult their own tax advisors regarding the application of the PFIC rules to our preferred shares or ADSs and the availability and advisability of making a mark-to-market election should we be considered a PFIC for any taxable year.
191
Table of Contents
Medicare Tax
In addition to regular U.S. federal income tax, certain U.S. Holders that are individuals, estates or trusts are subject to a 3.8% tax on all or a portion of their “net investment income,” which may include all or a portion of their income arising from a distribution with respect to a preferred share or ADS and net gain from the sale, exchange or other disposition of a preferred share or ADS.
Backup Withholding and Information Reporting
Backup withholding at a rate of 24% and information reporting requirements generally apply to certain U.S. Holders with respect to payments made on or proceeds from the sale, exchange or other disposition of our preferred shares or ADSs. A U.S. Holder not otherwise exempt from backup withholding generally can avoid backup withholding by providing a properly executed IRS Form W-9. Backup withholding is not an additional tax. Any amounts withheld under the backup withholding rules generally will be allowed as a refund or a credit against the U.S. Holder’s U.S. federal income tax liability, provided the required information is timely furnished by the U.S. Holder to the IRS.
Disclosure Requirements for Specified Foreign Financial Assets
Individual U.S. Holders (and certain U.S. entities specified in U.S. Treasury Department guidance) who, during any taxable year, hold any interest in any “specified foreign financial asset” generally will be required to file with their U.S. federal income tax returns certain information on IRS Form 8938 if the aggregate value of all such assets exceeds certain specified amounts. “Specified foreign financial asset” generally includes any financial account maintained with a non-U.S. financial institution and may also include our preferred shares or ADSs if they are not held in an account maintained with a financial institution. Substantial penalties may be imposed, and the period of limitations on assessment and collection of U.S. federal income taxes may be extended, in the event of a failure to comply. U.S. Holders should consult their own tax advisors as to the possible application to them of this filing requirement.
Disclosure Requirements for Certain U.S. Holders Recognizing Significant Losses
A U.S. Holder that claims significant losses in respect of our preferred shares or ADSs for U.S. federal income tax purposes (generally (i) US$10 million or more in a taxable year or US$20 million or more in any combination of taxable years for corporations or partnerships all of whose partners are corporations, (ii) US$2 million or more in a taxable year or US$4 million or more in any combination of taxable years for all other taxpayers, or (iii) US$50,000 or more in a taxable year for individuals or trusts with respect to a foreign currency transaction) may be required to file Form 8886 for “reportable transactions.” U.S. Holders should consult their own tax advisors concerning any possible disclosure obligation with respect to our preferred shares or ADSs.U.S. Foreign Account Tax Compliance Act (FATCA).
Please see “Item 4B, Business Overview – Taxes on Transactions Entered Into by Itaú Unibanco Group – U.S. Foreign Account Tax Compliance Act (FATCA)” for more clarification on FATCA.
| 10F. | Dividends and Paying Agents |
Not applicable.
| 10G. | Statement by Experts |
Not applicable.
192
Table of Contents
| 10H. | Documents on Display |
We are subject to the reporting requirements under the Exchange Act, for foreign private issuers. Accordingly, we are required to file reports and other information with the SEC, including annual reports on Form 20-F and current reports on Form 6-K. You may inspect and copy reports and other information filed with the SEC at the public reference facilities maintained by the SEC at 100 F Street, N.E., Washington D.C. 20549. Copies of the materials may be obtained by mail from the Public Reference Room of the SEC at 100 F Street, N.E., Washington, D.C. 20549 at prescribed rates. The public may obtain information on the operation of the SEC’s Public Reference Room by calling the SEC in the United States at 1-800-SEC-0330. In addition, the SEC maintains an Internet website at www.sec.gov, from which you can electronically access those materials, including this annual report and the accompanying exhibits. We also file financial statements and other periodic reports with the CVM located at Rua Sete de Setembro, 111, Rio de Janeiro, Rio de Janeiro 20050-901, Brazil. The CVM maintains an Internet website at www.cvm.gov.br.
Copies of our Form 20-F will be available for inspection upon request to the Investor Relations department at our office at Avenida Engenheiro Armando de Arruda Pereira, 707, Torre Eudoro Villela, Piso Térreo – São Paulo – SP – 04309-010 – Brazil.
Investors may receive a hard copy of this annual report, including our audited consolidated financial statements for the last fiscal year, free of charge, by requesting a copy from our Investor Relations department, by e-mail, at investor.relations@itau-unibanco.com.br, indicating their contact information and their complete mailing address.
| 10I. | Subsidiary Information |
Not required.
| ITEM 11. | QUANTITATIVE AND QUALITATIVE DISCLOSURES ABOUT MARKET RISK |
Credit Risk
Overview
We define credit risk as the risk of loss associated with: failure by a borrower, issuer or counterparty to fulfill their respective financial obligations as defined in the contracts; value loss of a credit agreement resulting from a deterioration of the borrower’s, issuer’s or counterparty’s credit rating; reduction of profits or income; benefits granted upon subsequent renegotiation; or debt recovery costs.
Our credit risk management is intended to preserve the quality of the loan portfolio at levels compatible with our risk appetite, for each market segment in which we operate.
Governance
Our credit risk governance is managed through corporate bodies, which report to the Board of Directors or to our executive structure. Such corporate bodies act primarily by assessing the competitive market conditions, setting our credit limits, reviewing control practices and policies, and approving these actions at the respective authority levels. The risk communication and reporting processes, including disclosure of institutional and supplementary policies on credit risk management, are the responsibility of our structure. We manage the credit risk to which it is exposed during the entire credit cycle, from before approval, during the monitoring process and up to the collection or recovery phase.
Our credit risk management and control structure is centralized and independent of the business units and defines operational limits, risk mitigation mechanisms and processes, and instruments to measure, monitor and control credit risk inherent to all products, portfolio concentrations and impacts to potential changes in the economic environment. Our credit’s portfolio, policies and strategies are continuously monitored so as to ensure compliance with the rules and laws in effect in each country.
193
Table of Contents
Procedures and key indicators
The key assignments of the business units are (i) monitoring the portfolios under their responsibility, (ii) granting credit, taking into account approval levels, market conditions, macroeconomic prospects, changes in markets and products, and (iii) credit risk management aimed at making the business sustainable.
Our credit policy is based on internal factors, such as: client rating criteria, performance and evolution of our portfolio, default levels, return rates and allocated economic capital, among others; and also take into account external factors such as: interest rates, market default indicators, inflation and changes in consumption, among others.
With respect to our individuals, small and medium companies, credit ratings are assigned based on statistical models (in the early stages of our relationship with a customer) and behavior score models (used for customers with whom we already have a relationship). For large companies, classification is based on information such as the counterparty’s economic and financial situation, its cash-generating capacity, and the business group to which it belongs, the current and prospective situation of the economic sector in which it operates. Credit proposals are analyzed on a case-by-case basis through the approval governance.
The concentrations are monitored continuously for economic sectors, and largest debtors, allowing preventive measures to be taken to avoid the violation of the established limits.
We also strictly control our credit exposure to clients and counterparties, acting to reverse occasional limit breaches. We may use contractual covenants for these purposes, such as the right to demand early payment or require additional collateral.
To measure credit risk, we take into account the probability of default by the borrower, issuer or counterparty, the estimated amount of exposure in the event of default, past losses from default and concentration of borrowers. Quantifying these risk components is part of the lending process, portfolio management and definition of limits.
The models used by us are independently validated, to ensure that the databases used in constructing the models are complete and accurate, and that the method of estimating parameters is adequate, so as to reduce the modeling risk and keep the models calibrated, to that they reflect risk parameters more accurately.
In compliance with the principles of the CMN Resolution 3,721, our credit risk management structure and institutional policy are approved by our Board of Directors and are applicable to all companies and subsidiaries in Brazil and abroad.
Please see “Note 32 – Risk and Capital Management” of our audited consolidated financial statements for further details about credit risk.
Loan approval process
Extensions of credit are approved based on policies at the business unit level, determined in accordance with the assumptions of each department and our bank’s risk appetite. The decision to extend credit may be granted by means of a pre-approval process or the traditional approval mechanism, which is applied on a client by client basis. In both cases, decisions are made based on principles of credit quality such as credit rating supported by statistical models, percentage of income committed by/leverage of the client and credit restrictions determined by us and the market.
The business units prepare and maintain the policies and procedures of the credit cycle.
The credit granting process contemplates the use of credit protection services with the purpose of checking whether a client’s credit history includes information that could be considered an obstacle to granting a loan, such as assets blocked by court orders, invalid tax payer identification numbers, prior or pending debt restructuring or renegotiation processes and checks not honored due to insufficient funds.
194
Table of Contents
The policy assessment process allows for the identification of potential risks and is intended to ensure that credit decisions make sense from both an economic and a risk perspective.

Please see “Note 32 – Risk and Capital Management” to our audited consolidated financial statements for further details about our risk mitigating instruments.
195
Table of Contents
Operational Risk
Overview
Operational risk is defined as the possibility of losses arising from failure, deficiency or inadequacy of internal processes, people or systems or from external events that affect the achievement of strategic, tactical or operational objectives. It includes legal risk associated with inadequacy or deficiency in contracts signed by us, as well as penalties due to non compliance with applicable laws and damages to third parties arising from the activities undertaken by us.
Internally, we classify the risks events as:
| • | Internal fraud; |
| • | External fraud; |
| • | Labor claims and deficient security in the workplace; |
| • | Inadequate practices related to clients, products and services; |
| • | Damage to our own physical assets or assets in use; |
| • | Interruption of our activities; |
| • | Failures in information technology systems; and |
| • | Failures in the performance, compliance with deadlines and management of our activities. |
Operational risk management includes conduct risk, which is subject to mitigating procedures to assess product design (suitability) and incentive models. The inspection area is responsible for fraud prevention. Irrespective of their origin, specific cases may be handled by risk committees and integrity and ethics committees.
Governance
We have a governance process that is structured through forums and corporate bodies composed of senior management, which report to the Board of Directors, with well-defined roles and responsibilities in order to segregate the business and management and control activities, ensuring independence between the areas and, consequently, well-balanced decisions with respect to risks. This is reflected in the risk management process carried out on a decentralized basis under the responsibility of the business areas and by a centralized control carried out by the internal control compliance and operational risk department, by means of methodologies, training courses, certification and monitoring of the control environment in an independent way.
The managers of the executive areas use corporate methods constructed and made available by the internal control, compliance and operational risk area. Among the methodologies and tools used are the self-evaluation and the map of our prioritized risks, the approval of processes, products, and system development products and projects, the monitoring of key risk indicators and the database of operational losses, guaranteeing a single conceptual basis for managing processes, systems, projects and new products and services.
Within the governance of the risk management process, the consolidated reports on risk monitoring, controls, action plans and operational losses are regularly presented to the business area executives.
Procedures and key indicators
Crisis Management and Business Continuity
The purpose of our Business Continuity Program is to protect our employees, ensure the continuity of the critical functions of our business lines, safeguard revenue and sustain both a stable financial market in which we operate and the trust of our clients and strategic partners in providing our services and products.
196
Table of Contents
Our Business Continuity Program is composed of procedures for relocating and/or recovering operations in response to a variety of interruption levels and can be divided into two key elements:
| • | Disaster Recovery Plan: focused on the recovery of our primary data center, ensuring the continuity of the processing of critical systems within minimum pre-established periods; |
| • | Workplace Contingency Plan: employees responsible for carrying out critical business functions have alternative facilities from which to perform their activities in the event the buildings in which they usually work become unavailable. There are approximately 2,000 contingency dedicated seats that are fully equipped to meet the needs of critical business units in emergency situations; |
| • | Emergency Plan: procedures aimed at minimizing the effects of emergency situations that may impact our facilities, with a preventive focus; |
| • | Processes Contingency Plan: alternatives (Plan B) to carry out the critical processes identified in the business areas. |
In order to keep the continuity solutions aligned with the business requirements the program applies the following tools to understand the institution:
| • | Business Impact Analysis (BIA): evaluates the criticality and resumption requirement of the processes that support the delivery of products and services. Through this analysis the businesses’ resumption priorities are defined; and |
| • | Threats and Vulnerabilities Analysis (AVA): identification of threats to the locations where our buildings are located. |
In addition, we have a corporate-wide Crisis Management Program, which is aimed at managing business interruption events, natural disasters, impacts of an environmental, social, and infrastructural/operational (including information technology) nature or of any other nature that jeopardize the image and reputation and/or viability of Itaú Unibanco’s processes with its employees, clients, strategic partners and regulators, with timely and integrated responses.
Our Corporate Business Continuity Policy is available on our website.
Market and Liquidity Risk
Overview
Market risk is the possibility of losses resulting from fluctuations in the market value of positions held by a financial institution, including the risk of operations subject to variations in foreign exchange rates, interest rates, price indexes, equity and commodity prices.
Liquidity risk is defined as the likelihood that an institution will not being able to effectively honor its expected and unexpected obligations, current and future, including those from guarantees commitment, without affecting its daily operations or incurring significant losses.
Governance
Our policies and general market risk management framework are in line with the principles of CMN Resolution No. 4,557, and its subsequent amendments. These principles guide our approach to market risk control across our Itaú Unibanco Group.
Our market risk management strategy is aimed at balancing corporate business goals, taking into account, among other factors:
| • | Political, economic and market conditions; |
| • | The profile of our portfolio; and |
| • | Capacity to act in specific markets. |
197
Table of Contents
The key principles underlying our market risk control structure are as follows:
| • | Provide visibility and comfort for all senior management levels that market risks assumed must be in line with our risk-return objectives; |
| • | Provide disciplined and informed dialogue on the overall market risk profile and its evolution over time; |
| • | Increase transparency as to how the business works to optimize results; |
| • | Provide early warning mechanisms to facilitate effective risk management, without obstructing the business objectives; and |
| • | Monitor and avoid risk concentration. |
Market risk is controlled by an area independent of the business units, which is responsible for the daily activities: (i) measuring and assessing risk; (ii) monitoring stress scenarios, limits and alerts; (iii) applying, analyzing and stress testing scenarios; (iv) reporting risk to the individuals responsible in the business units, in compliance with our governance procedures; (v) monitoring the measures needed to adjust positions and/or risk levels to make them viable; and (vi) supporting the secure launch of new financial products.
The CMN has regulations establishing the segregation of market risk exposure at a minimum into risk factors, such as: interest rates, exchange rates, stocks and commodities. Brazilian inflation indexes are also treated as a group of risk factors and follow the same structure.
Our structure of limits and alerts follows the Board of Directors guidelines, which are reviewed and approved by our Board of Directors on an annual basis. This structure extends to specific limits and is aimed at improving the process of risk monitoring and understanding as well as preventing risk concentration. Limits and alerts are calibrated based on projections of future balance sheets, stockholders’ equity, liquidity, complexity and market volatility, as well as our risk appetite.
Our liquidity risk control is carried out by an area that is independent of our business areas, and which is responsible for defining the composition of our reserve, estimating cash flow and exposure to liquidity risk over different time horizons, and monitoring the minimum limits for absorbing losses in stress scenarios in the countries where we operate. All activities are subject to assessment by our independent validation, internal controls and audit departments.
Additionally, and pursuant to the requirements of CMN and the Central Bank regulations, we deliver our Liquidity Risk Statements (DLR) to the Central Bank monthly and the following items are regularly prepared and submitted to the senior management for monitoring and decision support:
| • | Different scenarios for liquidity projections; |
| • | Contingency plans for crisis situations; |
| • | Reports and charts to enable monitoring risk positions; |
| • | Assessment of funding costs and alternatives; and |
| • | Tracking, and monitoring of funding sources considering counterparty type, maturity and other aspects. |
Procedures and key indicators
In an attempt to fit the transactions into the defined limits, we hedge transactions with clients and proprietary positions, including investments overseas. Derivatives are the most commonly used instruments for carrying out these hedging activities, and can be characterized as either accounting or economic hedge, both of which are governed by our institutional regulations.
Our market risk framework categorizes transactions as part of either part of our trading book, orTrading Book, or our banking book, our Banking Book, in accordance with general criteria established by specific regulation.
198
Table of Contents
Our Trading Book is composed of all trades with financial and commodity instruments (including derivatives) undertaken with the intention of trading.
Our Banking Book is predominantly characterized by portfolios originated from the banking business and operations related to balance sheet management, and intended to be either held to maturity, or sold in the medium or long term.
Market risk management is based on the following key metrics:
| • | Value at Risk (VaR): a statistical metric that quantifies the maximum potential economic loss expected in normal market conditions, considering a defined holding period and confidence interval; |
| • | Losses in Stress Scenarios (Stress Testing): a simulation technique to evaluate the impact, in the assets, liabilities and derivatives of the portfolio, of various risk factors in extreme market situations (based on prospective and historic scenarios); |
| • | Stop Loss: metrics that trigger a management review of positions, if the accumulated losses in a given period reach specified levels; |
| • | Concentration: cumulative exposure of certain financial instruments or risk factors calculated at market value (mark to market); and |
| • | Stressed VaR: a statistical metric derived from VaR calculation, aimed at capturing the biggest risk in simulations of the current portfolio, taking into consideration the observable returns in historical scenarios of extreme volatility. |
In addition to the risk metrics described above, sensitivity and loss control measures are also analyzed. They include:
| • | Gap Analysis: accumulated exposure of cash flows by risk factor, which are marked-to-market and positioned by settlement dates; |
| • | Sensitivity (DV01 – Delta Variation Risk): impact on the market value of cash flows when a one basis point change is applied to current interest rates or on the index rates; and |
| • | Sensitivities to Various Risk Factors (Greek): partial derivatives of a portfolio of options on the prices of the underlying assets, implied volatilities, interest rates and time. |
Please see “Note 32 – Risk and Capital Management” to our audited consolidated financial statements for further details about market risk.
VaR – Consolidated Itaú Unibanco Holding
Our consolidated VaR is calculated through the Historical Simulation. The assumption underlying Historical Simulation is that the expected distribution for the possible gains and losses (P&Ls—Profit and Loss Statement) for a portfolio over a desired time horizon can be estimated based on the historical behavior of the returns of the market risk factors to which this portfolio is exposed. For the VaR calculation of non-linear instruments, a full re-pricing is carried out (full valuation), without any potential simplifications in the calculation.
The VaR is calculated with a confidence interval of 99%, a historical period of 4 years (1000 working days) and a holding period that varies in accordance with the portfolio’s market liquidity, considering a minimum horizon of 10 working days. Also, under a conservative approach, the VaR is calculated on a daily basis with and without volatility weighting, with the final VaR being the most restrictive value between the two methodologies.
199
Table of Contents
As from the third quarter of 2016, we have been calculating VaR for the regulatory portfolio (exposure of the trading portfolio and exposure to foreign currency and commodities of the banking portfolio) according to internal models approved by the Central Bank. The Consolidated Total VaR table provides an analysis of our portfolio exposure to market risk.
| Consolidaded VaR (Historical Simulation approach)(1) |
Average | Minimum | Maximum | December 31, 2018 |
Average | Minimum | Maximum | December 31, 2017 |
||||||||||||||||||||||||
| (In millions of R$) | ||||||||||||||||||||||||||||||||
| Group of Risk Factor |
||||||||||||||||||||||||||||||||
| Interest rate |
851.4 | 720.0 | 1,042.9 | 898.4 | 721.0 | 583.6 | 1,311.9 | 764.7 | ||||||||||||||||||||||||
| Currencies |
24.7 | 12.7 | 45.2 | 37.3 | 20.4 | 6.5 | 50.2 | 11.9 | ||||||||||||||||||||||||
| Equities |
39.2 | 23.6 | 58.5 | 50.1 | 45.4 | 38.5 | 54.9 | 46.4 | ||||||||||||||||||||||||
| Commodities |
1.6 | 0.6 | 3.1 | 1.0 | 1.5 | 0.7 | 4.0 | 0.8 | ||||||||||||||||||||||||
| Diversification effect(2) |
(605.3 | ) | (451.5 | ) | ||||||||||||||||||||||||||||
|
|
|
|
|
|
|
|
|
|
|
|
|
|
|
|
|
|||||||||||||||||
| Total |
399.3 | 294.7 | 603.6 | 381.5 | 409.9 | 304.8 | 874.0 | 372.3 | ||||||||||||||||||||||||
|
|
|
|
|
|
|
|
|
|
|
|
|
|
|
|
|
|||||||||||||||||
| (1) | Determined in local currency and converted into Brazilian reais at the closing price on the reporting date. |
| (2) | Reduction of risk due to the combination of all risk factors. |
As of December 31, 2018, our average global VaR (Historical Simulation) was R$399.3 million, or 0.26% of our consolidated stockholders’ equity as of December 31, 2018, compared to our average global VaR (Historical Simulation) of R$409.9 million as of December 31, 2017 or 0.28% of our consolidated stockholders’ equity as of December 31, 2017.
VaR – Trading Book
The table below presents risks arising from all positions with the intention of trading, following the criteria defined above for our Trading Book. Our total average Trading Book VaR was R$48.4 million as of December 31, 2018, compared to R$52.0 million as of December 31, 2017 and to R$38.6 million as of December 31, 2016.
| Trading Book VaR(1) |
Average | Minimum | Maximum | December 31, 2018 |
Average | Minimum | Maximum | December 31, 2017 |
||||||||||||||||||||||||
| (In millions of R$) | ||||||||||||||||||||||||||||||||
| Group of Risk Factor |
||||||||||||||||||||||||||||||||
| Interest rate |
38.2 | 13.8 | 130.0 | 20.0 | 52.8 | 13.8 | 100.4 | 58.3 | ||||||||||||||||||||||||
| Currencies |
19.9 | 9.0 | 41.0 | 33.1 | 14.6 | 3.9 | 43.6 | 8.8 | ||||||||||||||||||||||||
| Equities |
21.8 | 8.4 | 42.8 | 39.2 | 11.7 | 3.5 | 22.0 | 13.6 | ||||||||||||||||||||||||
| Commodities |
1.6 | 0.8 | 3.1 | 1.0 | 1.3 | 0.3 | 4.0 | 0.8 | ||||||||||||||||||||||||
| Diversification effect(2) |
(40.2 | ) | (34.2 | ) | ||||||||||||||||||||||||||||
|
|
|
|
|
|
|
|
|
|
|
|
|
|
|
|
|
|||||||||||||||||
| Total |
48.4 | 21.9 | 115.7 | 53.1 | 52.0 | 15.3 | 102.8 | 47.3 | ||||||||||||||||||||||||
|
|
|
|
|
|
|
|
|
|
|
|
|
|
|
|
|
|||||||||||||||||
| (1) | Determined in local currency and converted into Brazilian reais at the closing price on the reporting date. |
| (2) | Reduction of risk due to the combination of all risk factors. |
Other risks
Social and Environmental Risk
We understand social and environmental risk as the risk of potential losses due to exposure to social and environmental events arising from the performance of our activities.
Mitigation actions of social and environmental risk are carried out through processes mappings, internal controls, monitoring new regulations on the subject, and recording occurrences in internal databases.
In addition, risks identified, prioritized and actions taken are reported to our management of social and environmental risk.
Please see our Investors Relations website > Itaú Unibanco > Corporate Governance > Rules and Policies > Policies > Policy For Sustainability And Social Environmental Responsibility, for further details about our Sustainability and Social Environmental Responsibility Policy.
200
Table of Contents
The social and environmental risk management is carried out by the first line of defense in its daily operations, supplemented by a technical support of our legal and risk control area, which has a team specialized in social and environmental management. Business units also have their governance for the approval of new products, including assessing the social and environmental risks, which ensures compliance in all new products and processes employed by the institution. Governance also includes the Social and Environmental Risk Committee, which is primarily responsible for guide institutional views of social and environmental risk exposure related to our activities and operations.
We consistently seek to evolve in the management of social and environmental risk, always attentive to the challenges so as to monitor the changes in and demands of society. Therefore, among other actions, we have assumed and incorporated into our internal processes a number of national and international voluntary commitments and pacts aimed at integrating social, environmental and governance aspects into our business. The main ones are the Principles for Responsible Investment (PRI), the Charter for Human Rights – Ethos, the Equator Principles (EP), the Global Impact, the Carbon Disclosure Project (CDP), the Brazilian GHG Protocol Program, the National Pact for Eradicating Slave Labor (Pacto Nacional para Erradicação do Trabalho Escravo), among others. Our efforts to increase the knowledge of the assessment of the social and environmental criteria have been recognized as models in Brazil and abroad, as shown by the recurring presence of the institution in the major sustainability indexes abroad, such as the Dow Jones Sustainability Index, and recently, in Sustainability Index Euronext Vigeo – Emerging 70, and in Brazil, for example in the Corporate Sustainability Index, as well as the numerous prizes which we have been awarded.
Business and Strategy Risk
We define the business and strategy risk as the risk of a negative impact on our financial results or capital as a consequence of a faulty strategic planning, making adverse strategic decisions, and our inability to implement the proper strategic plans and/or changes in its business environment. We have implemented many mechanisms that ensure that both the business and the strategic decision making processes follow proper governance standards, have the active participation of executives and the Board of Directors, are based on market, macroeconomic and risk information and are aimed at optimizing the risk-return ratio. Decision-making and the establishment of business and strategy guidelines, count on the full engagement of the Board of Directors, primarily through the Strategy Committee, and of the executives, through the Executive Committee. In order to handle risk adequately, we have governance and processes that involve the Risks & Finance Control and Management Area in business and strategy decisions, so as to ensure that risk is managed and decisions are sustainable in the long term. They are: (i) the qualifications and incentives of board members and executives; (ii) the budgetary process; (iii) product assessment; (iv) the evaluation and prospecting of proprietary mergers and acquisitions; and (v) a risk appetite framework which, for example, restricts the concentration of credit and exposure to specific and material risks.
Regulatory Risk
We consider regulatory risk as the risk of incurring losses due to fines, sanctions and other penalties applied by regulatory agencies resulting from lack of compliance with regulatory requirements. The regulatory risk is managed through a structured process aimed at identifying changes in the regulatory environment, analyzing their impacts on the institution and monitoring the implementation of actions directed at adherence to the regulatory requirements.
We have a structured process for addressing rules, covering the stages of recognition, distribution, monitoring and compliance, and all of these processes are established in internal policies. The process for handling regulatory risk involves various areas of the institution, and consists of: (i) structure of lines of defense; (ii) monitoring draft legislation, public notices and public hearings; (iii) monitoring new rules and definition of action plans; (iv) relationship with regulators and professional organizations; (v) monitoring action plans; (vi) control over compliance with legal decisions and TAC (conduct adjustment agreements), executed in public civil actions. In addition, the institution’s risks are classified and prioritized according to our internal control methodology.
201
Table of Contents
Insurance Products, Pension Plan and Premium Bonds Risks
Products that compose portfolios of our insurance companies are related to life and elementary insurance, as well as pension plans and premium bonds. Accordingly, we understand that the main risks inherent to these products are:
| • | Underwriting risk: the possibility of losses arising from insurance products, pension plans and premium bonds that go against our expectations, directly or indirectly associated with technical and actuarial bases used for calculating premiums, contributions and technical provisions; |
| • | Market risk; |
| • | Credit risk; |
| • | Operational risk; and |
| • | Liquidity risk. |
In line with domestic and international practices, we have a risk management structure which ensures that risks resulting from insurance, pension and special savings products are properly assessed and reported to the relevant forums.
The process of risk management for insurance, pensions and premium bond plans is independent and focus on the special nature of each risk.
As part of the risk management process, there is a governance structure where decisions may be escalated to sub-committees, thus ensuring compliance with several regulatory and internal requirements, as well as balanced decisions relative to risks.
Our objective is to ensure that assets serving as collateral for long-term products, with guaranteed minimum returns, are managed according to the characteristics of the liabilities, so that they are actuarially balanced and solvent over the long term.
Model Risk
Model risk is the risk that arises from the models used by us not reflecting, on a consistent basis, the relationships of variables of interest, creating results that systematically differ from those observed. This risk may materialize due to the use in different situations from those modeled.
The best practices that mark the model risk control at the institution include: (i) certification of the quality of the database used; (ii) application of a check-list of essential steps to be taken during the model in question’s development; (iii) the use of conservative estimates in judgmental models; (iv) use of external benchmarks; (v) approval of results generated in model implementation; (vi) independent technical validation of models; (vii) validation of use of models; (viii) assessments of the impact in the use of models; (ix) monitoring of performance of models; and (x) monitoring of the distribution of the explanatory variables and final score.
Country Risk
Country risk is the risk of losses arising from non compliance with obligations in connection with borrowers, issuers, counterparties or guarantors as a result of actions taken by the government of the country where the borrower, issuer, counterparty or guarantor is located.
We have a specific structure for the management and control of country risk, consisting of corporate bodies and dedicated teams, with responsibilities defined in policies. The institution has a structured and consistent procedure for managing and controlling country risk, including: (i) the establishment of country ratings; (ii) the determination of limits for countries; and (iii) the monitoring of limits.
Reputational Risk
We understand reputational risk to be the risk arising from internal practices, risk events and external factors that may generate a negative perception of us among clients, counterparties, stockholders, investors, supervisors, commercial partners, among others, which could affect the value of our brand and financial losses, in addition to adversely affecting our capability to maintain our existing commercial relations, start new businesses and continue to have access to financing sources.
202
Table of Contents
We believe that our reputation is extremely important for achieving our long-term goals. As a result, we strive to align our speech with ethical and transparent practices and work, which is essential to raise the confidence of our stakeholders. Our reputation depends on our strategy (vision, culture and skills) and derives from direct and indirect relationship between us and our stakeholders.
Since reputational risk directly or indirectly permeates all of our operations and processes, we have governance procedures that are structured in a way to ensure that potential reputational risks be identified, analyzed and managed in the initial phases of our operations and the analysis of new products.
The treatment given to reputational risk is structured by means of many processes and internal initiatives, which, in turn, are supported by our internal policies. Their main purpose is to provide mechanisms for the monitoring, management, control and mitigation of the main reputational risks. Among those processes and internal initiatives are (i) risk appetite statement; (ii) processes to prevent and combat the use of Itaú Unibanco in unlawful acts; (iii) crisis management processes and business continuity procedures; (iv) processes and guidelines with respect to governmental and institutional relations; (v) corporate communication processes; (vi) brand management processes; (vii) ombudsman offices initiatives and commitment to customer satisfaction; and (vii) ethics and corruption prevention guidelines.
Money Laundering Prevention
Financial institutions play a key role in preventing and fighting illicit acts, which includes money laundering, terrorism financing and fraud.
The challenge is to identify and prevent increasingly sophisticated operations that seek to conceal the source, ownership and transfer of goods and assets, derived from illegal activities.
We have established a corporate policy to prevent our involvement in illicit activities, protecting our reputation and image among employees, customers, strategic partners, suppliers, service providers, regulators and the society. Our policy is based on a governance structure focused on transparency, strict compliance with the rules and regulations and cooperation with enforcement and judicial authorities. We also strive to conduct our business in accordance with the local and international best practices to prevent and fight illicit acts, through investments and training our employees on an ongoing basis.
In order to comply with our corporate policy, we have established a program to prevent and fight illicit acts, which includes the following pillars:
| • | Customer Identification Process; |
| • | KYC; |
| • | KYP; |
| • | KYS; |
| • | KYE; |
| • | Risk Assessment on New Products and Services; |
| • | Transaction Monitoring; |
| • | Reporting Suspicious Transactions to Regulators and Authorities; and |
| • | Training. |
This program is applicable to us and our controlled entities in Brazil and abroad. The oversight of prevention and detection of illegal activities is carried out by the Board of Directors, the Audit Committee, Compliance and Operational Risk Committees, and the Anti-Money Laundering Committee.
Please refer to Item 4B. Business Overview – Regulatory Environment – Anti-Money Laundering Regulations for further details about money laundering regulation. Our Illicit Acts Prevention and Combat Corporate Policy is posted on our Investors Relation website at Itaú Unibanco > Corporate Governance > Rules and Policies > Policies > Corporate Policy for Prevention and Fight Against Illegal Acts.
203
Table of Contents
Politically Exposed Persons (PEPs)
Our commitment to compliance with applicable law and to the adoption of the best practices for prevention and detection of money laundering activity is also reflected in the identification, assessment and monitoring of PEPs, whether as individuals or entities.
As per our policies, we conduct enhanced due diligence with respect to PEPs. We require a higher level of approval prior to establishing any relationship with a PEP.
Please refer to “Item 4B. Business Overview – Regulatory Environment – Politically Exposed Persons (PEPs)” for further details about politically exposed persons.
Cybersecurity Management and Processes
We consider cybersecurity and information security at the highest strategic level. We also manage this subject in order to protect our technological infrastructure against external and internal threats, unauthorized access, malicious code and regulatory needs. In order to protect our customers’ and organization information we operate in a preventive, detective and corrective manner.
The information security strategy has been developed considering the global scenario, regulations and best market practices and standards, in order to focus on establishing data protection for our customers. The strategy takes into account a resilient and appropriate structure to identify, detect and respond to threats and establish recovery procedures for situations that require our defense against cyberattacks. Our organization also maintains an effective security governance through executive committees and a set of information security policies.
Our infrastructure defenses are structured to protect our organization against external and internal attacks, with tools such as network behavioral analysis, intrusion prevention systems (IPS), firewalls, antiviruses and antispam systems.
We have a highly specialized monitoring team, capable of identify potential threats and establishing an active and effective defense (SOC—Security Operational Centers).
Additionally, we have a cyber-intelligence team working to identify threats and manage any necessary corrective measures.
In order to be successful in our information security defense strategy, we consider the culture of security as the basis to improve our information security program as well as the investment in awareness campaigns for employees and customers so they remain prepared to identify and address inherent risks and threats.
204
Table of Contents
| ITEM 12. | DESCRIPTION OF SECURITIES OTHER THAN EQUITY SECURITIES |
| 12A. | Debt Securities |
Not applicable.
| 12B. | Warrants and Rights |
Not applicable.
| 12C. | Other Securities |
Not applicable.
| 12D. | American Depositary Shares |
Our preferred shares have been traded on the NYSE in the form of ADSs (one ADS represents one preferred share) since February 21, 2002, in compliance with NYSE and SEC requirements. These requirements include disclosure of financial statements in IFRS since 2011 and compliance with U.S. legal requirements, including the Exchange Act and the Sarbanes-Oxley Act of 2002.
Our ADSs are issued by BNY Mellon, as depositary, under a Deposit Agreement, dated as of May 31, 2001, as amended and restated as of February 20, 2002 and as of March 30, 2009, and as of August 17, 2018, effective as of August 27, 2018, among us, the depositary and the owners and beneficial owners of ADSs from time to time. The depositary’s principal executive office is located at 225 Liberty Street, New York, New York 10281.
ADS holders have no stockholder rights, which are governed by Brazilian Corporate Law. The depositary is the holder of the preferred shares underlying the ADSs. Holders of ADSs have ADS holder rights.
An investor may hold the ADSs directly, registered under his or her name, or indirectly, through a broker or another financial institution. The holders of our ADSs do not have the same rights as our stockholders and the depositary and holders of corresponding shares in Brazil. The deposit agreement determines the rights and obligations of the ADS holders and is governed by New York law.
In the event of a capital increase that maintains or increases the proportion of our capital represented by preferred shares, the holders of ADSs, except as described above, have preemptive rights to subscribe only to newly issued preferred shares. In the event of a capital increase that reduces the proportion of capital represented by preferred shares, the holders of ADSs, except as described above, have preemptive rights to preferred shares in proportion to their interests and to common shares only to the extent necessary to prevent dilution of their interests.
Please see “Item 10E. Taxation” for further information.
Fees and Expenses
The following table summarizes the fees and expenses payable by holders of ADSs to the depositary:
| Event |
Fees | |
| Issuance(1) or cancellation for the purpose of withdrawal(2) of ADSs | US$5.00 (or less) per 100 ADSs (or portion thereof) plus any additional fees charged by any governmental authorities or other institutions for the execution and delivery or surrender of ADSs. | |
| Any cash distribution | US$0.05 (or less) per ADS (or portion thereof). | |
| Depositary services |
US$0.05 (or less) per ADS (or portion thereof) per calendar year (in addition to cash distribution fee of US$0.05 per ADS during the year). |
| (1) | Including issuances resulting from a distribution of preferred shares or rights or other property, substitution of underlying shares and transferring, splitting or grouping of receipts. |
| (2) | Including if the deposit agreement terminates. |
205
Table of Contents
In addition, set below are other fees and expenses payable by holders of ADSs:
| • | Registration fees: registration of transfers of preferred shares on our preferred share register to or from the name of the depositary or its agent when the holder deposit or withdraws preferred shares. |
| • | Distribution of securities by the depositary to ADS holders fee: equivalent to the fee that would be payable if securities distributed to the holder thereof had been preferred shares and the shares had been deposited for issuance of ADSs. |
| • | Foreign currency conversion expenses: expenses of the depositary in converting foreign currency to U.S. dollars. |
| • | Depositary expenses: cable, telex and facsimile transmissions (when expressly provided in the Deposit Agreement). |
Moreover, taxes and other governmental charges which the depositary or the custodian has to pay on any ADR or preferred share underlying an ADS (for example, stock transfer taxes, stamp duty or withholding taxes) would be payable by holders of ADSs. Any other charges incurred by the depositary or its agents for servicing the deposited securities are not currently assessed in the Brazilian market.
Payment of Taxes
The depositary may deduct the amount of any taxes owed from any payments to investors. It may also sell deposited securities, by public or private sale, to pay any taxes owed. Investors will remain liable if the proceeds of the sale are not sufficient to pay the taxes. If the depositary sells deposited securities, it will, if appropriate, reduce the number of ADSs to reflect the sale and pay to investors any proceeds or send to investors any property remaining after it has paid the taxes.
Reimbursement of Fees
BNY Mellon, as depositary, has agreed to reimburse us for expenses we incur that are related to establishment and maintenance of the ADS program. The depositary has agreed to reimburse us for our continuing annual stock exchange listing fees. The depositary has also agreed to pay the standard out-of-pocket maintenance costs for the ADSs, which consist of the expenses of postage and envelopes for mailing annual and interim financial reports, printing and distributing dividend checks, electronic filing of United States federal tax information, mailing required tax forms, stationery, facsimile, and telephone calls, as well as to reimburse us annually for certain investor relationship programs or special investor relations promotional activities. In certain instances, the depositary has agreed to provide additional payments to us based on applicable performance indicators relating to the ADS facility. There are limits on the amount of expenses for which the depositary will reimburse us, but the amount of reimbursement available to us is not necessarily tied to the amount of fees the depositary collects from investors.
The depositary collects its fees for delivery and surrender of ADSs directly from investors, depositing shares or surrendering ADSs in case of exercise of withdrawal rights or from intermediaries acting for them. The depositary collects fees for making distributions to investors by deducting those fees from the amounts distributed or by selling a portion of distributable property to pay the fees. The depositary may collect its annual fee for depositary services by deducting from cash distributions, by directly billing investors or by charging the book-entry system accounts of participants acting for them. The depositary may generally refuse to provide services subject to fees until its fees for those services have been paid.
In 2018, we received from the depositary US$26.4 million for promoting and encouraging the ADR program in the market, out-of-pocket maintenance costs for the ADSs (as described above), any applicable performance indicators relating to the ADS facility, underwriting fees and legal fees.
206
Table of Contents
ADS holders’ Payment of Dividends
Preferred shares underlying ADSs are kept in Brazil by the custodian, Itaú Unibanco, which is the owner recorded in the register service of our preferred shares. The depositary of our ADS program is BNY Mellon. The payments of dividends and distributions in cash for our preferred shares underlying the ADSs are made directly to the depositary bank abroad, which is responsible for passing them on to the stockholders within an average period of 10 days after payment is made in Brazil. The amount received by the ADS holder may be reduced if we, the custodian or the depositary are required to retain an amount related to taxes and other government charges.
Please see “Item 8A. Consolidated Statements and Other Financial Information—Stockholders’ Payment” for details on our dividend policy.
| ITEM 13. | DEFAULTS, DIVIDEND ARREARAGES AND DELINQUENCIES |
None.
| ITEM 14. | MATERIAL MODIFICATIONS TO THE RIGHTS OF SECURITY HOLDERS AND USE OF PROCEEDS |
None.
| ITEM 15. | CONTROLS AND PROCEDURES |
Disclosure Controls and Procedures
We carried out an evaluation, under the supervision and with the participation of our management, including our CEO, and our CFO, of the effectiveness of our “disclosure controls and procedures” (as defined in the Exchange Act Rules 13a-15(e) and 15d-15(e)) as required by paragraph (b) of the Exchange Act Rules 13a-15 or 15d-15, as of December 31, 2018.A control system, no matter how well designed and operated, can provide only reasonable, not absolute, assurance that the control system’s objectives will be met. Therefore, our management does not expect that the controls will prevent all errors and all fraud.Based upon the evaluation performed, our CEO and CFO have concluded that as of December 31, 2018, our disclosure controls and procedures were effective to provide reasonable assurance that material information relating to us and our consolidated subsidiaries is (i) recorded, processed, summarized and reported within the time periods specified in the SEC’s rules and forms and (ii) accumulated and communicated to our management, including our principal executive officers and principal financial officers, to allow timely decisions regarding required disclosure.
Management’s Annual Report on Internal Control Over Financial Reporting
Our management is responsible for establishing and maintaining adequate internal control over financial reporting as defined in Rules 13a-15(f) and 15d-15(f) under the Exchange Act. Our internal control was designed to provide reasonable assurance regarding the reliability of financial reporting and the preparation of consolidated financial statements for external purposes, in accordance with the IFRS issued by the IASB.
All internal control systems, no matter how well designed, have inherent limitations. Therefore, even those systems determined to be effective may not prevent or detect misstatements. Also, projections of any evaluation of effectiveness to future periods are subject to risk that controls may become inadequate because of changes in conditions, or a decline in the level of compliance with policies or procedures may occur.
Our management assessed the effectiveness of our internal control over financial reporting as of December 31, 2018. In making this assessment, our management used the criteria set forth in “Internal Control – Integrated Framework (2013)” issued by the COSO. Based on its evaluation and those criteria, our management has concluded that our internal control over financial reporting was effective as of December 31, 2018.
The effectiveness of our internal control over financial reporting as of December 31, 2018, has been audited by PricewaterhouseCoopers Auditores Independentes, an independent registered public accounting firm.
207
Table of Contents
Attestation Report of the Independent Registered Public Accounting Firm
The report of PricewaterhouseCoopers Auditores Independentes, our independent registered public accounting firm, dated April 30, 2019, on the effectiveness of our internal control over financial reporting as of December 31, 2018 is presented with our audited consolidated financial statements.Please refer to our audited consolidated financial statements for further details about our independent auditor’s report.
Changes in Internal Control Over Financial Reporting
In connection with the evaluation required by the Exchange Act Rule 13a-15(d), our management, including our CEO and CFO, concluded that the changes that occurred during the year ended December 31, 2018 have not materially affected, and are not reasonably likely to materially affect, our internal control over financial reporting.
| ITEM 16. | [RESERVED] |
| 16A. | Audit Committee Financial Expert |
Our Board of Directors has designated Mr. Diego Fresco Gutierrez as our audit committee financial expert that meets the requirements set forth by the SEC, the NYSE and the Central Bank. Our audit committee financial expert along with the other members of our audit committee are independent pursuant to CMN Resolution No. 3,198, which requires that the members not be, or have been in the last year, an officer or employee of the company or its affiliates or an employee with managerial responsibilities in the internal audit division of the financial institution. Other members of our audit committee are financially literate and we believe the skills, experience and education of our audit committee members qualify them to carry out all of their duties as members of the audit committee, including overseeing the preparation of our IFRS financial statements. In addition, our audit committee has the ability to retain independent accountants, financial advisors or other consultants, advisors and experts whenever it deems appropriate. For more information on our Audit Committee, see “Item 6A. Board Practices—Audit Committee.”
| 16B. | Code of Ethics |
We consider ethics to be an essential value for our reputation and longevity. We., including all of our employees, are subject to our Code of Ethics. We report each year under this Item 16B of our annual report on Form 20-F any waivers of the Code of Ethics, in favor of our principal executive officer, chief financial officer, principal accounting officer and persons performing similar functions. The Code of Ethics governs all relations between companies in our corporate group and their stakeholders (shareholders, clients, employees, suppliers, service providers, governments, communities and society).
A copy of the Code of Ethics is available on our Investors Relations website at Itaú Unibanco > Corporate Governance > Rules and Policies > Code of Ethics and Conduct. An update of our Code of Ethics is scheduled to occur in the second half of 2019.
| 16C. | Principal Accountant Fees and Services |
Pre-approval of Policies and Procedures
The Audit Committee’s responsibilities include establishing policies and procedures for services that can be provided by our external auditors. On an annual basis, the Audit Committee issues (i) the list of services that cannot be provided by our external auditors, due to the fact that such services could, eventually, affect their independence, (ii) the list of pre-approved services, and (iii) those services that need to be pre-approved by the Audit Committee.
208
Table of Contents
Fees and Services of the Principal Auditor
The following table presents the total amount charged by PwC by category for services provided in the years ended December 31, 2018 and 2017:
| Fees |
2018 | % Approved by the Audit Committee |
2017 | % Approved by the Audit Committee |
||||||||||||
| (In thousands of R$) | ||||||||||||||||
| Audit Fees |
64,960 | 99.4 | 61,835 | 100.0 | ||||||||||||
| Audit-Related Fees |
4,727 | 100.0 | 6,478 | 100.0 | ||||||||||||
| Tax Fees |
581 | 100.0 | 416 | 100.0 | ||||||||||||
| All Other Fees |
466 | 100.0 | 89 | 100.0 | ||||||||||||
| Total |
70,735 | 68,819 | ||||||||||||||
|
|
|
|
|
|
|
|
|
|||||||||

| 16D. | Exemptions from the Listing Standards for Audit Committees |
Under the audit committee rules of the NYSE and the SEC, listed companies must comply with Rule 10A-3 of the Exchange Act (Listing Standards Relating to Audit Committees). Rule 10A-3 requires that listed companies establish an audit committee composed of members of the Board of Directors that meets specified requirements, or designate and empower a board of auditors or similar body to perform the role of the audit committee in reliance on the general exemption for audit committees of foreign private issuers set forth in Rule 10A-3(c)(3) of the Exchange Act.
In accordance with Central Bank regulations, we have established a body similar to the audit committee of the board of directors of a U.S. company, which we are required to call an “audit committee.” All the members of our Audit Committee are independent in accordance with the criteria established by the Central Bank. For more information, see “Item 6A. Board Practices — Director and Senior Management – Statutory Bodies — Audit Committee.”
209
Table of Contents
Our Audit Committee, to the extent permitted under Brazilian law, performs all the functions required of an audit committee under Rule 10A-3. As required by Brazilian law, our Board of Directors and Audit Committee are separate corporate bodies. Only one of the six members of our Audit Committee is also member of our Board of Directors. In addition, under Brazilian law, the function of hiring independent auditors is a power reserved exclusively for a company’s Board of Directors. Therefore, our Board of Directors acts as our audit committee, as permitted under Rule 10A-3(c)(3)(v) of the Exchange Act for the purpose of the appointment of our independent auditors.
Except in these respects, our Audit Committee is comparable to, and performs the functions of, an audit committee of the Board of Directors of a U.S. company. We believe that our Audit Committee is able to act independently in performing the responsibilities of an audit committee under Sarbanes-Oxley, satisfies the other requirements of the exemption of Rule 10A-3(c)(3) and therefore is in compliance with Rule 10A-3 of the Exchange Act.
| 16E. | Purchases of Equity Securities by the Issuer and Affiliated Purchasers |
In conformity with best corporate governance practices, on November 18, 2004, we started to voluntarily disclose our Policy for Trading Itaú Unibanco Holding S.A. Securities. Please refer to our Investors Relation website at Itaú Unibanco > Corporate Governance > Rules and Policies > Others > Operating Rules for the Trading of Own Shares as Treasury Stock for further details. We disclose to the market the transactions carried out with our own shares by our Treasury department through “Announcements to the Market” on a monthly basis, as well as the other disclosure requirements imposed by the Brazilian securities regulation and the SEC.
The current share repurchase program was approved by our Board of Directors on December 15, 2017, is effective from January 1, 2018 through June 19, 2019, and authorizes the acquisition of up to 50.0 million of our preferred shares and 28.62 million of our common shares, issued by us, without reducing our capital stock.
The share repurchase program has the following potential objectives: (i) to maximize the allocation of capital through the efficient application of available funds; (ii) to provide for the delivery of shares to the employees and management of our company and those of its subsidiaries within the scope of the compensation models and the long term incentive plans; and (iii) to use the repurchased shares in the event of business opportunities arising in the future. All repurchases shall be made on the open market through stock exchanges.
|
Period(1) |
(a) Total number of preferred shares purchased(2) |
(b) Average price paid per preferred share(2)(3) |
(c) Total number of preferred shares purchased as part of publicly announced plans or programs(2) |
(d) Maximum number of preferred shares that may yet be purchased under the plans or programs |
(e) Total number of common shares purchased |
(f) Average price paid per common share |
(g) Total number of common shares purchased as part of publicly announced plans or programs |
(h) Maximum number of common shares that may yet be purchased under the plans or programs |
||||||||||||||||||||||||
| 01/02 to 01/31/2018 |
- | - | - | 50,000,000 | - | - | - | 14,195,517 | ||||||||||||||||||||||||
| 02/01 to 02/28/2018 |
- | - | - | 50,000,000 | - | - | - | 14,195,517 | ||||||||||||||||||||||||
| 03/01 to 03/29/2018 |
- | - | - | 50,000,000 | - | - | - | 14,195,517 | ||||||||||||||||||||||||
| 04/02 to 04/30/2018 |
- | - | - | 50,000,000 | - | - | - | 14,195,517 | ||||||||||||||||||||||||
| 05/02 to 05/30/2018 |
- | - | - | 50,000,000 | - | - | - | 14,195,517 | ||||||||||||||||||||||||
| 06/01 to 06/29/2018 |
13,100,000 | 38.95 | 13,100,000 | 36,900,000 | - | - | - | 14,195,517 | ||||||||||||||||||||||||
| 07/02 to 07/31/2018 |
- | - | - | 36,900,000 | - | - | - | 14,195,517 | ||||||||||||||||||||||||
| 08/01 to 08/31/2018 |
- | - | - | 36,900,000 | - | - | - | 14,195,517 | ||||||||||||||||||||||||
| 09/03 to 09/28/2018 |
- | - | - | 36,900,000 | - | - | - | 14,195,517 | ||||||||||||||||||||||||
| 10/01 to 10/31/2018 |
- | - | - | 36,900,000 | - | - | - | 14,195,517 | ||||||||||||||||||||||||
| 11/01 to 11/30/2018 |
- | - | - | 36,900,000 | - | - | - | 14,195,517 | ||||||||||||||||||||||||
| 12/03 to 12/31/2018 |
- | - | - | 36,900,000 | - | - | - | 14,195,517 | ||||||||||||||||||||||||
|
|
|
|
|
|
|
|
|
|
|
|
|
|
|
|
|
|||||||||||||||||
| (1) | On December 15, 2017 our Board of Directors approved the purchase of up to 28,616,649 common shares and 50,000,000 preferred shares. |
| (2) | All amounts were not adjusted at the 50% stock split for our shares. Considering the 50% stock split, occurred in November 2018, we acquired (a) 19,650 million preferred shares of our own issue, in the total amount of R$510.3 million, at the average price of R$25.97 per share. |
| (3) | Includes brokerage costs. |
| 16F. | Change in Registrant’s Certifying Accountant |
Not applicable.
| 16G. | Corporate Governance |
Our ADSs are registered on the NYSE in the US as a foreign private issuer. As a result, NYSE allows us to comply with certain corporate governance requirements established by applicable Brazilian legislation, rather than those set forth in the NYSE corporate governance listing rules applicable to US companies with securities traded on that exchange.
210
Table of Contents
The following is a description of the main differences between our corporate governance practices and those required for US publicly traded companies.

211
Table of Contents
| 16H. | Mine Safety Disclosure |
Not applicable.
| ITEM 17. | FINANCIAL STATEMENTS |
We have responded to Item 18 in lieu of responding to this item.
| ITEM 18. | FINANCIAL STATEMENTS |
Our audited consolidated financial statements, together with the Report of Independent Registered Public Accounting Firm, are filed as part of this annual report.
A
| • | ABECS – Associação Brasileira de Empresas de Cartões de Crédito e Serviços (Brazilian Association of Credit Cards and Services Companies) |
| • | ABRASCA – Associação Brasileira de Companhias Abertas (Brazilian Association of Public Companies) |
| • | ADS – American Depositary Shares |
| • | ANBIMA – Associação Brasileira das Entidades dos Mercados Financeiro e de Capitais (Brazilian Financial and Capital Markets Association) |
| • | ANS – Agência Nacional de Saúde Suplementar (National Regulatory Agency for Private Health Insurance and Plans) |
| • | APIMEC – Associação dos Analistas e Profissionais de Investimento do Mercado de Capitais (Association of Capital Markets Analysts and Investment Professionals) |
| • | ATM – Automatic Teller Machine |
B
| • | B3 S.A. – Brasil, Bolsa, Balcão (Brazilian Exchange and OTC, formerly BM&FBovespa – Bolsa de Valores, Mercadorias e Futuros S.A.) |
| • | Banco Itaú Argentina – Banco Itaú Argentina S.A |
| • | Banco Itaú Chile – Banco Itaú Chile S.A. |
| • | Banco Itaú Paraguay – Banco Itaú Paraguay S.A |
| • | Banco Itaú Uruguay – Banco Itaú Uruguay S.A |
| • | BCBS – Basel Committee on Banking Supervision |
| • | BIS – Bank for International Settlements |
| • | BNDES – Banco Nacional de Desenvolvimento Econômico e Social (Brazilian Development Bank) |
| • | BNY Mellon – The Bank of New York Mellon |
| • | Brazilian Corporate Law – Law No. 6,404, of December 15, 1976, as amended (including by Law No. 11,638) |
| • | Brazilian Payment System – encompasses the institutions, the systems and the procedures related to the transfer of funds and other financial assets, among the diverse economic agents of the Brazilian market, or that involve the processing, clearing and settlement of payments in any of its forms. |
C
| • | CADE – Conselho Administrativo de Defesa Econômica (Administrative Council for Economic Defense) |
| • | CCR – Counterparty Credit Risk |
| • | CDC – Código de Defesa do Consumidor (Consumer Protection Code) |
| • | CDI – Certificado de Depósito Interbancário (Interbank Deposit Certificate) |
| • | CEDEAR – Argentine Certificates of Deposits |
| • | Central Bank – Banco Central do Brasil (Brazilian Central Bank) |
| • | CFC – Conselho Federal de Contabilidade (Federal Accounting Council) |
| • | CGRC – Risk and Capital Management Committee |
| • | Cia E. Johnston – Companhia E. Johnston de Participações |
212
Table of Contents
| • | CMN – Conselho Monetário Nacional (National Monetary Council) |
| • | CNSEG – Confederação Nacional das Empresas de Seguros Gerais, Previdência Privada e Vida, Saúde Suplementar e Capitalização (National Council of General Insurance, Private Pension and Life, Supplementary Health and Capitalization Companies) |
| • | CNSP – Conselho Nacional de Seguros Privados (National Council of Private Insurance) |
| • | COAF – Conselho de Controle de Atividades Financeiras (Financial Activities Control Council) |
| • | COSO – Committee of Sponsoring Organizations of the Treadway Commission |
| • | COFINS – Contribuição Para o Financiamento da Seguridade Social (Social Security Financing Contribution) |
| • | CONSIF – Confederação Nacional do Sistema Financeiro (National Association of the Financial System) |
| • | CSB – Corporate Site Branch |
| • | CSC – Superior Credit Committee |
| • | CSCCA – Superior Wholesale Credit and Collection Committee |
| • | CSCCV – Superior Retail Credit and Collection Committee |
| • | CSLL – Contribuição Social Sobre o Lucro Líquido (Social Contribution on Profits) |
| • | CSP – Superior Products Committee |
| • | CSRML – Superior Market Risk and Liquidity Committee |
| • | CSRO – Superior Operational Risk Management Committee |
| • | CTAM – Model Assessment Technical Committee |
| • | CVM – Comissão de Valores Mobiliários (Brazilian Securities and Exchange Comission) |
D
| • | DJSI – Dow Jones Sustainability Index |
F
| • | FATF – Financial Action Task Force |
| • | FEBRABAN – Federação Brasileira de Bancos (Brazilian Federation of Banks) |
| • | Fed – U.S. Federal Reserve System |
| • | FGC – Fundo Garantidor de Crédito (Credit Insurance Fund) |
I
| • | IASB – International Accounting Standards Board |
| • | IBRACON – Instituto de Auditores Independentes do Brasil (Institute of Independent Auditors of Brazil) |
| • | IBRI – Instituto Brasileiro de Relações com Investidores (Brazilian Investor Relations Institute) |
| • | ICAAP – Internal Capital Adequacy Assessment Process |
| • | IFRS – International Financial Reporting Standards |
| • | IOF – Imposto Sobre Operações Financeiras (Tax on Financial Transactions) |
| • | IRPJ – Imposto de Renda da Pessoa Jurídica (Corporate Income Tax) |
| • | IRS – U.S. Internal Revenue Service |
| • | ISE – Índice de Sustentabilidade Empresarial (Corporate Sustainability Index) |
| • | ISS – Imposto sobre Serviços (Service Tax) |
| • | Itaú BBA Colombia – Itaú BBA Colombia S.A. Corporación Financiera |
| • | Itau BBA International – Itau BBA International plc |
| • | Itaucard – Banco Itaucard S.A. |
| • | Itaú Holding Financeira – Itaú Holding Financeira S.A. |
| • | Itaú Unibanco Group – Itaú Unibanco Holding S.A. and all its subsidiaries and affiliates |
| • | Itaúsa – Itaú Investimentos S.A. |
| • | IUPAR – Itaú Unibanco Participações S.A. |
213
Table of Contents
K
| • | KYC – Know Your Customer |
| • | KYP – Know Your Partner |
| • | KYS – Know Your Supplier |
| • | KYE – Know Your Employee |
L
| • | LCR – Liquidity Coverage Ratio |
N
| • | NSFR – Net Stable Funding Ratio |
| • | NYSE – New York Stock Exchange |
P
| • | PEP – Politically Exposed Person |
| • | PFIC – Passive Foreign Investment Company |
| • | PIS – Programa de Integração Social (Social Integration Program) |
| • | PwC – PricewaterhouseCoopers Auditores Independentes |
R
| • | RAET – Regime Especial de Administração Temporária (Temporary Special Administration Regime) |
S
| • | SEC – U.S. Securities and Exchange Commission |
| • | SELIC – Sistema Especial de Liquidação e Custódia (Special Clearing and Settlement System) |
| • | SOX – The Sarbanes-Oxley Act of 2002 |
| • | STF – Superior Tribunal Federal (Brazilian Federal Supreme Court) |
| • | STJ – Superior Tribunal de Justiça (Brazilian Superior Court of Justice) |
| • | SUSEP – Superintendência de Seguros Privados (Superintendency of Private Insurance) |
T
| • | TR – Taxa Referencial (Brazilian Reference Interest Rate) |
U
| • | Unibanco – União de Bancos Brasileiros S.A. |
V
| • | VaR – Value at Risk |
214
Table of Contents
| ITEM 19. | EXHIBITS |
| No. | Description | |
|
1 |
| |
| 2(a) |
| |
| 2(b)(i) | The total amount of long-term debt securities of Itaú Unibanco Holding S.A. and our subsidiaries under any one instrument does not exceed 10.0% of our total assets on a consolidated basis. We agree to furnish copies of instruments defining the rights of certain holders of long-term debt to the SEC upon request.
| |
| 4(a) |
| |
| 4(b) |
| |
| 4(c) |
| |
| 8.1 |
| |
| 11.1 |
| |
| 12.1 | Chief Executive Officer Certification pursuant to Section 302 of the Sarbanes-Oxley Act of 2002.
| |
| 12.2 | Chief Financial Officer Certification pursuant to Section 302 of the Sarbanes-Oxley Act of 2002.
| |
| 13 |
| |
| 101.INS | XBRL Instance Document
| |
| 101.SCH | XBRL Taxonomy Extension Schema Document
| |
| 101.CAL | XBRL Taxonomy Extension Calculation Linkbase Document
| |
| 101.DEF | XBRL Taxonomy Extension Definition Linkbase Document
| |
| 101.LAB | XBRL Taxonomy Extension Label Linkbase Document
| |
| 101.PRE | XBRL Taxonomy Extension Presentation Linkbase Document
|
215
Table of Contents
SIGNATURES
The registrant hereby certifies that it meets all of the requirements for filing on Form 20-F and that it has duly caused and authorized the undersigned to sign this annual report on its behalf.
| ITAÚ UNIBANCO HOLDING S.A. | ||||||||
| By: | /s/ Candido Botelho Bracher | |||||||
| Name: | Candido Botelho Bracher | |||||||
| Title: | Chief Executive Officer | |||||||
| By: | /s/ Milton Maluhy Filho | |||||||
| Name: | Milton Maluhy Filho | |||||||
| Title: |
Chief Financial Officer | |||||||
Date: April 30, 2019.
Table of Contents
Table of Contents
Management’s Annual Report on Internal Control over Financial Reporting
The management of Itaú Unibanco Holding S.A is responsible for establishing and maintaining adequate internal control over financial reporting for the company.
The company’s internal control over financial reporting is a process designed to provide reasonable assurance regarding the reliability of financial reporting and the preparation of financial statements for external purposes in accordance with International Financial Reporting Standards (IFRS) as issued by the International Accounting Standards Board (IASB). The company’s internal control over financial reporting includes those policies and procedures that: (i) pertain to the maintenance of records that, in reasonable detail, accurately and fairly reflect the transactions and disposals of the assets of the company; (ii) provide reasonable assurance that transactions are recorded as necessary to allow for the preparation of financial statements in accordance with generally accepted accounting principles, and that receipts and expenditures of the company are being made only in accordance with authorizations of management and directors of the company; and (iii) provide reasonable assurance regarding prevention or timely detection of unauthorized acquisition, use or disposition of the company’s assets that could have a material effect on the financial statements.
Because of its inherent limitations, internal control over financial reporting may not prevent or detect misstatements. Therefore, even those controls determined to be effective may not prevent or detect misstatements. Also, projections of any evaluation of effectiveness to future periods are subject to risk that controls may become inadequate because of changes in conditions, or a decline in the level of compliance with policies or procedures may occur.
Our management assessed the effectiveness of our internal control over financial reporting as of December 31, 2018. In making this assessment, our management used the criteria set forth in “Internal Control – Integrated Framework (2013)” issued by the Committee of Sponsoring Organizations of the Treadway Commission (COSO).
Based on its evaluation and those criteria, our management has concluded that our internal control over financial reporting was effective as of December 31, 2018. In connection with the evaluation required by the Exchange Act Rule 13a-15(d), our management concluded that the changes that occurred during the year ended December 31, 2018 have not materially affected, or are not reasonably likely to materially affect, our internal control over financial reporting.
The effectiveness of the Company’s internal control over financial reporting as of December 31, 2018 has been audited by PricewaterhouseCoopers Auditores Independentes, an independent registered public accounting firm, as stated in their report which appears herein.
| By: | /S/ CANDIDO BOTELHO BRACHER | |
| Name: |
Candido Botelho Bracher | |
| Title: |
Chief Executive Officer |
| By: | /S/ MILTON MALUHY FILHO | |
| Name: |
Milton Maluhy Filho | |
| Title: |
Chief Financial Officer |
A signed original copy of this report has been provided to the registrant and will be retained by the registrant and furnished to the Securities and Exchange Commission or its staff upon request.
Date: April 30, 2019
F-1
Table of Contents

Report of independent registered
public accounting firm
To the Board of Directors and Stockholders
Itaú Unibanco Holding S.A.
Opinions on the financial statements and internal control over financial reporting
We have audited the accompanying consolidated balance sheet of Itaú Unibanco Holding S.A. and its subsidiaries (the Company) as of December 31, 2018 and 2017, and the related consolidated statements of income, comprehensive income, changes in stockholders’ equity and cash flows for each of the three years in the period ended December 31, 2018, including the related notes (collectively referred to as the “consolidated financial statements”). We also have audited the Company’s internal control over financial reporting as of December 31, 2018, based on criteria established in Internal Control—Integrated Framework (2013) issued by the Committee of Sponsoring Organizations of the Treadway Commission (COSO).
In our opinion, the consolidated financial statements referred to above present fairly, in all material respects, the financial position of the Company as of December 31, 2018 and 2017, and the results of their operations and their cash flows for each of the three years in the period ended December 31, 2018 in conformity with International Financial Reporting Standards as issued by the International Accounting Standards Board. Also in our opinion, the Company maintained, in all material respects, effective internal control over financial reporting as of December 31, 2018, based on criteria established in Internal Control—Integrated Framework (2013) issued by the COSO.
Change in Accounting Principle
As discussed in Note 2.2 to the consolidated financial statements, the Company changed the manner in which it accounts for financial instruments in 2018.
Basis for opinions
The Company’s management is responsible for these consolidated financial statements, for maintaining effective internal control over financial reporting, and for its assessment of the effectiveness of internal control over financial reporting, included in Management’s Annual Report on Internal Control over Financial Reporting. Our responsibility is to express opinions on the Company’s consolidated financial statements and on the Company’s internal control over financial reporting based on our audits. We are a public accounting firm registered with the Public Company Accounting Oversight Board (United States) (“PCAOB”) and are required to be independent with respect to the Company in accordance with the U.S. federal securities laws and the applicable rules and regulations of the Securities and Exchange Commission and the PCAOB.
PricewaterhouseCoopers, Av. Francisco Matarazzo 1400, Torre Torino, São Paulo, SP, Brasil, 05001-903, Caixa Postal 61005,
T: +55 (11) 3674 2000, www.pwc.com/br
F-2
Table of Contents

Itaú Unibanco Holding S.A.
We conducted our audits in accordance with the standards of the PCAOB. Those standards require that we plan and perform the audits to obtain reasonable assurance about whether the consolidated financial statements are free of material misstatement, whether due to error or fraud, and whether effective internal control over financial reporting was maintained in all material respects.
Our audits of the consolidated financial statements included performing procedures to assess the risks of material misstatement of the consolidated financial statements, whether due to error or fraud, and performing procedures that respond to those risks. Such procedures included examining, on a test basis, evidence regarding the amounts and disclosures in the consolidated financial statements. Our audits also included evaluating the accounting principles used and significant estimates made by management, as well as evaluating the overall presentation of the consolidated financial statements. Our audit of internal control over financial reporting included obtaining an understanding of internal control over financial reporting, assessing the risk that a material weakness exists, and testing and evaluating the design and operating effectiveness of internal control based on the assessed risk. Our audits also included performing such other procedures as we considered necessary in the circumstances. We believe that our audits provide a reasonable basis for our opinions.
Definition and limitations of internal control over financial reporting
A company’s internal control over financial reporting is a process designed to provide reasonable assurance regarding the reliability of financial reporting and the preparation of financial statements for external purposes in accordance with generally accepted accounting principles. A company’s internal control over financial reporting includes those policies and procedures that (i) pertain to the maintenance of records that, in reasonable detail, accurately and fairly reflect the transactions and dispositions of the assets of the company; (ii) provide reasonable assurance that transactions are recorded as necessary to permit preparation of financial statements in accordance with generally accepted accounting principles, and that receipts and expenditures of the company are being made only in accordance with authorizations of management and directors of the company; and (iii) provide reasonable assurance regarding prevention or timely detection of unauthorized acquisition, use, or disposition of the company’s assets that could have a material effect on the financial statements.
Because of its inherent limitations, internal control over financial reporting may not prevent or detect misstatements. Also, projections of any evaluation of effectiveness to future periods are subject to the risk that controls may become inadequate because of changes in conditions, or that the degree of compliance with the policies or procedures may deteriorate.
São Paulo, Brazil
April 30, 2019
/s/ PricewaterhouseCoopers
Auditores Independentes
We have served as the Company’s auditor since 2001.
F-3
Table of Contents
ITAÚ UNIBANCO HOLDING S.A.
(In millions of Reais)
| Assets |
Note | 12/31/2018 | 12/31/2017 | 1/1/2017 | ||||||||||
| Cash |
37,159 | 18,749 | 18,542 | |||||||||||
| Financial Assets |
1,424,876 | 1,330,251 | 1,246,833 | |||||||||||
| Compulsory deposits in the Central Bank of Brazil |
94,148 | 98,837 | 85,700 | |||||||||||
| At Amortized Cost |
994,759 | 905,729 | 902,289 | |||||||||||
| Interbank deposits |
4 | 26,420 | 29,048 | 22,688 | ||||||||||
| Securities purchased under agreements to resell |
4 | 280,136 | 244,707 | 265,050 | ||||||||||
| Securities |
9 | 110,395 | 111,424 | 102,568 | ||||||||||
| Loan operations and lease operations portfolio |
10 | 536,091 | 497,719 | 494,851 | ||||||||||
| Other financial assets |
18a | 75,090 | 59,568 | 53,895 | ||||||||||
| (-) Provision for Expected Loss |
(33,373 | ) | (36,737 | ) | (36,763 | ) | ||||||||
| At Fair Value Through Other Comprehensive Income |
49,323 | 52,149 | 40,039 | |||||||||||
| Securities |
8 | 49,323 | 52,149 | 40,039 | ||||||||||
| At Fair Value Through Profit or Loss |
286,646 | 273,536 | 218,805 | |||||||||||
| Securities |
5 | 263,180 | 250,693 | 194,574 | ||||||||||
| Derivatives |
6 and 7 | 23,466 | 22,843 | 24,231 | ||||||||||
| Investments in associates and joint ventures |
11 | 12,019 | 5,055 | 5,073 | ||||||||||
| Fixed assets, net |
13 | 7,302 | 7,359 | 8,042 | ||||||||||
| Goodwill and Intangible assets, net |
14 | 19,329 | 19,383 | 17,056 | ||||||||||
| Tax assets |
42,830 | 44,249 | 45,081 | |||||||||||
| Income tax and social contribution - current |
2,831 | 2,336 | 2,703 | |||||||||||
| Income tax and social contribution - deferred |
24b | 32,781 | 35,869 | 38,202 | ||||||||||
| Other |
7,218 | 6,044 | 4,176 | |||||||||||
| Other assets |
18a | 9,282 | 11,193 | 10,687 | ||||||||||
|
|
|
|
|
|
|
|||||||||
| Total assets |
1,552,797 | 1,436,239 | 1,351,314 | |||||||||||
|
|
|
|
|
|
|
|||||||||
The accompanying notes are an integral part of these consolidated financial statements.
F-4
Table of Contents
ITAÚ UNIBANCO HOLDING S.A.
Consolidated Balance Sheet
(In millions of Reais)
| Liabilities and stockholders’ equity |
Note | 12/31/2018 | 12/31/2017 | 1/1/2017 | ||||||||||||
| Financial Liabilities |
1,151,237 | 1,056,717 | 1,012,075 | |||||||||||||
| At Amortized Cost |
1,119,734 | 1,024,584 | 982,116 | |||||||||||||
| Deposits |
15 | 463,424 | 402,938 | 329,414 | ||||||||||||
| Securities sold under repurchase agreements |
17a | 330,237 | 312,634 | 349,164 | ||||||||||||
| Interbank market debt |
17b | 134,670 | 124,587 | 129,648 | ||||||||||||
| Institutional market debt |
17c | 93,974 | 98,482 | 96,239 | ||||||||||||
| Other financial liabilities |
18b | 97,429 | 85,943 | 77,651 | ||||||||||||
| At Fair Value Through Profit or Loss |
27,711 | 27,211 | 25,217 | |||||||||||||
| Derivatives |
6 and 7 | 27,519 | 26,746 | 24,698 | ||||||||||||
| Structured notes |
16 | 192 | 465 | 519 | ||||||||||||
| Provision for Expected Loss |
10 | 3,792 | 4,922 | 4,742 | ||||||||||||
| Loan Commitments |
2,601 | 3,015 | 2,761 | |||||||||||||
| Financial Guarantees |
1,191 | 1,907 | 1,981 | |||||||||||||
| Reserves for insurance and private pension |
27c | 201,187 | 181,232 | 154,076 | ||||||||||||
| Provisions |
29 | 18,613 | 19,736 | 20,909 | ||||||||||||
| Tax liabilities |
24c | 5,284 | 7,836 | 4,950 | ||||||||||||
| Income tax and social contribution - current |
2,058 | 3,175 | 1,741 | |||||||||||||
| Income tax and social contribution - deferred |
24b | 447 | 391 | (289 | ) | |||||||||||
| Other |
2,779 | 4,270 | 3,498 | |||||||||||||
| Other liabilities |
18b | 26,010 | 26,362 | 26,920 | ||||||||||||
| Total liabilities |
1,402,331 | 1,291,883 | 1,218,930 | |||||||||||||
| Capital |
19a | 97,148 | 97,148 | 97,148 | ||||||||||||
| Treasury shares |
19a | (1,820 | ) | (2,743 | ) | (1,882 | ) | |||||||||
| Additional paid-in capital |
19c | 2,120 | 1,930 | 1,785 | ||||||||||||
| Appropriated reserves |
19c | 13,480 | 12,499 | 3,443 | ||||||||||||
| Unappropriated reserves |
19c | 29,666 | 26,030 | 23,740 | ||||||||||||
| Cumulative other comprehensive income |
(3,812 | ) | (3,486 | ) | (4,139 | ) | ||||||||||
| Total stockholders’ equity attributed to the owners of the parent company |
136,782 | 131,378 | 120,095 | |||||||||||||
| Non-controlling interests |
19d | 13,684 | 12,978 | 12,289 | ||||||||||||
| Total stockholders’ equity |
150,466 | 144,356 | 132,384 | |||||||||||||
|
|
|
|
|
|
|
|||||||||||
| Total liabilities and stockholders’ equity |
1,552,797 | 1,436,239 | 1,351,314 | |||||||||||||
|
|
|
|
|
|
|
|||||||||||
The accompanying notes are an integral part of these consolidated financial statements.
F-5
Table of Contents
ITAÚ UNIBANCO HOLDING S.A.
Consolidated Statement of Income
(In millions of Reais, except for number of shares and earnings per share information)
| Note | 01/01 to 12/31/2018 |
01/01 to 12/31/2017 |
01/01 to 12/31/2016 |
|||||||||||||
| Banking product |
104,200 | 111,523 | 118,422 | |||||||||||||
| Interest and similar income of financial assets at amortized cost and at fair value through other comprehensive income |
21a | 110,324 | 122,703 | 138,764 | ||||||||||||
| Interest, similar income and dividend of financial assets at fair value through profit or loss |
22,853 | 22,938 | 23,641 | |||||||||||||
| Interest and similar expenses |
21b | (70,612 | ) | (78,330 | ) | (95,129 | ) | |||||||||
| Adjustments to Fair Value of Financial Assets and Liabilities |
21c | (4,834 | ) | 4,181 | 7,066 | |||||||||||
| Foreign exchange results and exchange variations on transactions |
2,974 | (250 | ) | 5,513 | ||||||||||||
| Banking service fees |
22 | 36,809 | 34,448 | 31,918 | ||||||||||||
| Income related to insurance and private pension operations before claim and selling expenses |
3,961 | 4,699 | 5,265 | |||||||||||||
| Income related to insurance and private pension |
24,097 | 26,876 | 24,755 | |||||||||||||
| Change in reserves for insurance and private pension |
(20,136 | ) | (22,177 | ) | (19,490 | ) | ||||||||||
| Other income |
2,725 | 1,134 | 1,384 | |||||||||||||
| Expected Loss from Financial Assets and Claims |
(10,182 | ) | (20,966 | ) | (24,355 | ) | ||||||||||
| Expected Loss with Loan Operations and Lease Operations |
10c | (10,587 | ) | (18,381 | ) | (22,466 | ) | |||||||||
| Expected Loss with Other Financial Assets |
1,633 | (1,393 | ) | (404 | ) | |||||||||||
| (Expenses) Recovery of claims |
(1,228 | ) | (1,192 | ) | (1,485 | ) | ||||||||||
| Net Banking Product of Expected Losses from Financial Assets and Claims |
94,018 | 90,557 | 94,067 | |||||||||||||
| Other operating income (expenses) |
(63,410 | ) | (59,975 | ) | (58,388 | ) | ||||||||||
| General and administrative expenses |
23 | (57,538 | ) | (53,494 | ) | (50,905 | ) | |||||||||
| Tax expenses |
(6,619 | ) | (7,031 | ) | (8,011 | ) | ||||||||||
| Share of profit or (loss) in associates and joint ventures |
11 | 747 | 550 | 528 | ||||||||||||
| Income before income tax and social contribution |
30,608 | 30,582 | 35,679 | |||||||||||||
| Current income tax and social contribution |
24a | (2,564 | ) | (4,539 | ) | (3,898 | ) | |||||||||
| Deferred income tax and social contribution |
24a | (2,405 | ) | (2,818 | ) | (9,765 | ) | |||||||||
| Net income |
25,639 | 23,225 | 22,016 | |||||||||||||
| Net income attributable to owners of the parent company |
25 | 24,907 | 23,193 | 21,627 | ||||||||||||
| Net income attributable to non-controlling interests |
19d | 732 | 32 | 389 | ||||||||||||
| Earnings per share - basic |
25 | |||||||||||||||
| Common |
2.56 | 2.38 | 2.21 | |||||||||||||
| Preferred |
2.56 | 2.38 | 2.21 | |||||||||||||
| Earnings per share - diluted |
25 | |||||||||||||||
| Common |
2.55 | 2.36 | 2.20 | |||||||||||||
| Preferred |
2.55 | 2.36 | 2.20 | |||||||||||||
| Weighted average number of shares outstanding - basic |
25 | |||||||||||||||
| Common |
4,958,290,359 | 5,021,834,934 | 5,027,611,714 | |||||||||||||
| Preferred |
4,759,872,085 | 4,734,030,111 | 4,756,823,490 | |||||||||||||
| Weighted average number of shares outstanding - diluted |
25 | |||||||||||||||
| Common |
4,958,290,359 | 5,021,834,934 | 5,027,611,714 | |||||||||||||
| Preferred |
4,815,473,777 | 4,796,645,028 | 4,821,864,280 | |||||||||||||
The accompanying notes are an integral part of these consolidated financial statements.
F-6
Table of Contents
ITAÚ UNIBANCO HOLDING S.A.
Consolidated Statement of Comprehensive Income
(In millions of Reais)
| Note | 01/01 to 12/31/2018 |
01/01 to 12/31/2017 |
01/01 to 12/31/2016 |
|||||||||||||
| Net income |
25,639 | 23,225 | 22,016 | |||||||||||||
| Financial assets at fair value through other comprehensive income |
(166 | ) | 652 | 1,557 | ||||||||||||
| Change in fair value |
(576 | ) | 997 | 2,239 | ||||||||||||
| Income tax effect |
270 | (415 | ) | (1,193 | ) | |||||||||||
| (Gains) / losses transferred to income statement |
21c | 254 | 128 | 851 | ||||||||||||
| Income tax effect |
(114 | ) | (58 | ) | (340 | ) | ||||||||||
| Hedge |
(1,135 | ) | (571 | ) | (697 | ) | ||||||||||
| Cash flow hedge |
7 | (81 | ) | (29 | ) | (2,815 | ) | |||||||||
| Change in fair value |
(256 | ) | (86 | ) | (5,041 | ) | ||||||||||
| Income tax effect |
175 | 57 | 2,226 | |||||||||||||
| Hedge of net investment in foreign operation |
7 | (1,054 | ) | (542 | ) | 2,118 | ||||||||||
| Change in fair value |
(1,793 | ) | (1,055 | ) | 3,760 | |||||||||||
| Income tax effect |
739 | 513 | (1,642 | ) | ||||||||||||
| Remeasurements of liabilities for post-employment benefits (*) |
(164 | ) | (10 | ) | (590 | ) | ||||||||||
| Remeasurements |
26 | (267 | ) | 33 | (1,048 | ) | ||||||||||
| Income tax effect |
103 | (43 | ) | 458 | ||||||||||||
| Foreign exchange differences on foreign investments |
1,139 | 582 | (2,737 | ) | ||||||||||||
| Total other comprehensive income |
(326 | ) | 653 | (2,467 | ) | |||||||||||
| Total comprehensive income |
25,313 | 23,878 | 19,549 | |||||||||||||
| Comprehensive income attributable to non-controlling interests |
732 | 32 | 389 | |||||||||||||
| Comprehensive income attributable to the owners of the parent company |
24,581 | 23,846 | 19,160 | |||||||||||||
| (*) | Amounts that will not be subsequently reclassified to income. |
The accompanying notes are an integral part of these consolidated financial statements.
F-7
Table of Contents
ITAÚ UNIBANCO HOLDING S.A.
Consolidated Statement of Changes in Stockholders’ Equity (Notes 19 and 20)
Periods ended December 31, 2018, 2017 and 2016
(In millions of Reais)
| Attributed to owners of the parent company | Total stockholders’ equity – owners of the parent company |
Total stockholders’ equity – non-controlling interests |
Total | |||||||||||||||||||||||||||||||||||||||||||||||||
| Capital | Treasury shares |
Additional paid-in capital |
Appropriated reserves |
Unappropriated reserves |
Retained earnings |
Other comprehensive income | ||||||||||||||||||||||||||||||||||||||||||||||
| Financial Assets at Fair Value Through Other Comprehensive Income (1) |
Remeasurements of liabilities of post- employment benefits |
Cumulative translation adjustments abroad |
Gains and losses – hedge (2) |
|||||||||||||||||||||||||||||||||||||||||||||||||
| Balance at 01/01/2016 - In accordance with IAS 39 |
85,148 | (4,353 | ) | 1,733 | 10,067 | 20,947 | — | (2,771 | ) | (225 | ) | 4,822 | (3,116 | ) | 112,252 | 1,807 | 114,059 | |||||||||||||||||||||||||||||||||||
| Adjustments (Note 2.2) |
— | — | — | — | 107 | — | (382 | ) | — | — | — | (275 | ) | (187 | ) | (462 | ) | |||||||||||||||||||||||||||||||||||
| Balance at 01/01/2016 |
85,148 | (4,353 | ) | 1,733 | 10,067 | 21,054 | — | (3,153 | ) | (225 | ) | 4,822 | (3,116 | ) | 111,977 | 1,620 | 113,597 | |||||||||||||||||||||||||||||||||||
| Transactions with owners |
12,000 | 2,471 | 52 | (9,620 | ) | — | (11,574 | ) | — | — | — | — | (6,671 | ) | 10,280 | 3,609 | ||||||||||||||||||||||||||||||||||||
| Capital increase - Statutory Reserve - ESM of September 14, 2016 |
12,000 | — | — | (12,000 | ) | — | — | — | — | — | — | — | — | — | ||||||||||||||||||||||||||||||||||||||
| Treasury shares |
— | 2,471 | (17 | ) | (2,670 | ) | — | — | — | — | — | — | (216 | ) | — | (216 | ) | |||||||||||||||||||||||||||||||||||
| Acquisition of treasury shares (Note 19a) |
— | (947 | ) | — | — | — | — | — | — | — | — | (947 | ) | — | (947 | ) | ||||||||||||||||||||||||||||||||||||
| Cancellation of shares - ESM of April 27, 2016 – Approved on June 7, 2016 |
— | 2,670 | — | (2,670 | ) | — | — | — | — | — | — | — | — | — | ||||||||||||||||||||||||||||||||||||||
| Result of delivery of treasury shares |
— | 748 | (17 | ) | — | — | — | — | — | — | — | 731 | — | 731 | ||||||||||||||||||||||||||||||||||||||
| Recognition of stock-based payment plans |
— | — | 69 | — | — | — | — | — | — | — | 69 | — | 69 | |||||||||||||||||||||||||||||||||||||||
| (Increase) / Reduction of interest of controlling stockholders (Note 2.4a I and 3) |
— | — | — | — | — | — | — | — | — | — | — | 10,373 | 10,373 | |||||||||||||||||||||||||||||||||||||||
| Dividends / interest on capital – Special profit reserve (Note 19b) |
— | — | — | 5,050 | — | (11,574 | ) | — | — | — | — | (6,524 | ) | (93 | ) | (6,617 | ) | |||||||||||||||||||||||||||||||||||
| Dividends / Interest on capital paid in 2016 - Year 2015 - Special profit reserve |
— | — | — | (2,697 | ) | — | — | — | — | — | — | (2,697 | ) | — | (2,697 | ) | ||||||||||||||||||||||||||||||||||||
| Corporate reorganizations (Note 2.4 a III) |
— | — | — | (1,586 | ) | — | — | — | — | — | — | (1,586 | ) | — | (1,586 | ) | ||||||||||||||||||||||||||||||||||||
| Other |
— | — | — | — | (88 | ) | — | — | — | — | — | (88 | ) | — | (88 | ) | ||||||||||||||||||||||||||||||||||||
| Total comprehensive income |
— | — | — | — | — | 21,627 | 1,557 | (590 | ) | (2,737 | ) | (697 | ) | 19,160 | 389 | 19,549 | ||||||||||||||||||||||||||||||||||||
| Net income |
— | — | — | — | — | 21,627 | — | — | — | — | 21,627 | 389 | 22,016 | |||||||||||||||||||||||||||||||||||||||
| Other comprehensive income for the period |
— | — | — | — | — | — | 1,557 | (590 | ) | (2,737 | ) | (697 | ) | (2,467 | ) | — | (2,467 | ) | ||||||||||||||||||||||||||||||||||
| Appropriations: |
||||||||||||||||||||||||||||||||||||||||||||||||||||
| Legal reserve |
— | — | — | 943 | — | (943 | ) | — | — | — | — | — | — | — | ||||||||||||||||||||||||||||||||||||||
| Statutory reserve |
— | — | — | 6,336 | 2,774 | (9,110 | ) | — | — | — | — | — | — | — | ||||||||||||||||||||||||||||||||||||||
| Balance at 12/31/2016 |
97,148 | (1,882 | ) | 1,785 | 3,443 | 23,740 | — | (1,596 | ) | (815 | ) | 2,085 | (3,813 | ) | 120,095 | 12,289 | 132,384 | |||||||||||||||||||||||||||||||||||
|
|
|
|
|
|
|
|
|
|
|
|
|
|
|
|
|
|
|
|
|
|
|
|
|
|
|
|||||||||||||||||||||||||||
| Change in the period |
12,000 | 2,471 | 52 | (6,624 | ) | 2,686 | — | 1,557 | (590 | ) | (2,737 | ) | (697 | ) | 8,118 | 10,669 | 18,787 | |||||||||||||||||||||||||||||||||||
|
|
|
|
|
|
|
|
|
|
|
|
|
|
|
|
|
|
|
|
|
|
|
|
|
|
|
|||||||||||||||||||||||||||
| Balance at 01/01/2017 |
97,148 | (1,882 | ) | 1,785 | 3,443 | 23,740 | (1,596 | ) | (815 | ) | 2,085 | (3,813 | ) | 120,095 | 12,289 | 132,384 | ||||||||||||||||||||||||||||||||||||
| Transactions with owners |
— | (861 | ) | 145 | 12,480 | — | (19,201 | ) | — | — | — | — | (7,437 | ) | 657 | (6,780 | ) | |||||||||||||||||||||||||||||||||||
| Treasury shares - granting of stock options |
— | (861 | ) | 64 | (1,178 | ) | — | — | — | — | — | — | (1,975 | ) | — | (1,975 | ) | |||||||||||||||||||||||||||||||||||
| Cancellation of Shares – Meeting of the Board of Directors 12/15/2017 |
— | 1,178 | — | (1,178 | ) | — | — | — | — | — | — | — | — | — | ||||||||||||||||||||||||||||||||||||||
| Acquisition of treasury shares (Note 18a) |
— | (3,089 | ) | — | — | — | — | — | — | — | — | (3,089 | ) | — | (3,089 | ) | ||||||||||||||||||||||||||||||||||||
| Result of delivery of treasury shares |
— | 1,050 | 64 | — | — | — | — | — | — | — | 1,114 | — | 1,114 | |||||||||||||||||||||||||||||||||||||||
| Share-based payment – variable compensation |
— | — | 81 | — | — | — | — | — | — | — | 81 | — | 81 | |||||||||||||||||||||||||||||||||||||||
| (Increase) / Reduction of interest of controlling stockholders (Note 2.4a I and 3) |
— | — | — | — | — | — | — | — | — | — | — | 1,002 | 1,002 | |||||||||||||||||||||||||||||||||||||||
| Dividends / interest on capital – Special profit reserve (Note 19b) |
— | — | — | 13,658 | — | (19,201 | ) | — | — | — | — | (5,543 | ) | (345 | ) | (5,888 | ) | |||||||||||||||||||||||||||||||||||
| Dividends / Interest on capital paid in 2017 - Year 2016 - Special profit reserve |
— | — | — | (5,048 | ) | — | — | — | — | — | — | (5,048 | ) | — | (5,048 | ) | ||||||||||||||||||||||||||||||||||||
| Corporate reorganizations (Note 2.4 a III) |
— | — | — | (63 | ) | — | — | — | — | — | — | (63 | ) | — | (63 | ) | ||||||||||||||||||||||||||||||||||||
| Other |
— | — | — | (15 | ) | — | — | — | — | — | (15 | ) | — | (15 | ) | |||||||||||||||||||||||||||||||||||||
| Total comprehensive income |
— | — | — | — | — | 23,193 | 652 | (10 | ) | 582 | (571 | ) | 23,846 | 32 | 23,878 | |||||||||||||||||||||||||||||||||||||
| Net income |
— | — | — | — | — | 23,193 | — | — | — | — | 23,193 | 32 | 23,225 | |||||||||||||||||||||||||||||||||||||||
| Other comprehensive income for the period |
— | — | — | — | — | — | 652 | (10 | ) | 582 | (571 | ) | 653 | — | 653 | |||||||||||||||||||||||||||||||||||||
| Appropriations: |
||||||||||||||||||||||||||||||||||||||||||||||||||||
| Legal reserve |
— | — | — | 1,055 | (1,055 | ) | — | — | — | — | — | — | — | |||||||||||||||||||||||||||||||||||||||
| Statutory reserve |
— | — | — | 632 | 2,305 | (2,937 | ) | — | — | — | — | — | — | — | ||||||||||||||||||||||||||||||||||||||
| Balance at 12/31/2017 |
97,148 | (2,743 | ) | 1,930 | 12,499 | 26,030 | — | (944 | ) | (825 | ) | 2,667 | (4,384 | ) | 131,378 | 12,978 | 144,356 | |||||||||||||||||||||||||||||||||||
|
|
|
|
|
|
|
|
|
|
|
|
|
|
|
|
|
|
|
|
|
|
|
|
|
|
|
|||||||||||||||||||||||||||
| Change in the period |
— | (861 | ) | 145 | 9,056 | 2,290 | — | 652 | (10 | ) | 582 | (571 | ) | 11,283 | 689 | 11,972 | ||||||||||||||||||||||||||||||||||||
|
|
|
|
|
|
|
|
|
|
|
|
|
|
|
|
|
|
|
|
|
|
|
|
|
|
|
|||||||||||||||||||||||||||
| Balance at 01/01/2018 |
97,148 | (2,743 | ) | 1,930 | 12,499 | 26,030 | 0 | (944 | ) | (825 | ) | 2,667 | (4,384 | ) | 131,378 | 12,978 | 144,356 | |||||||||||||||||||||||||||||||||||
| Transactions with owners |
0 | 923 | 190 | 14,145 | 0 | (20,848 | ) | 0 | 0 | 0 | 0 | (5,590 | ) | (26 | ) | (5,616 | ) | |||||||||||||||||||||||||||||||||||
| Treasury shares |
0 | 923 | 422 | (534 | ) | 0 | 0 | 0 | 0 | 0 | 0 | 811 | 0 | 811 | ||||||||||||||||||||||||||||||||||||||
| Acquisition of treasury shares (Note 19a) |
0 | (510 | ) | 0 | 0 | 0 | 0 | 0 | 0 | 0 | 0 | (510 | ) | 0 | (510 | ) | ||||||||||||||||||||||||||||||||||||
| Cancellation of Shares – Meeting of the Board of Directors 02/22/2018 |
0 | 534 | 0 | (534 | ) | 0 | 0 | 0 | 0 | 0 | 0 | 0 | 0 | 0 | ||||||||||||||||||||||||||||||||||||||
| Result of delivery of treasury shares |
0 | 899 | 422 | 0 | 0 | 0 | 0 | 0 | 0 | 0 | 1,321 | 0 | 1,321 | |||||||||||||||||||||||||||||||||||||||
| Recognition of stock-based payment plans |
0 | 0 | (232 | ) | 0 | 0 | 0 | 0 | 0 | 0 | 0 | (232 | ) | 0 | (232 | ) | ||||||||||||||||||||||||||||||||||||
| (Increase) / Reduction of interest of controlling stockholders (Note 2.4a I and 3) |
0 | 0 | 0 | 0 | 0 | 0 | 0 | 0 | 0 | 0 | 0 | 131 | 131 | |||||||||||||||||||||||||||||||||||||||
| Dividends / interest on capital |
0 | 0 | 0 | 14,679 | 0 | (20,848 | ) | 0 | 0 | 0 | 0 | (6,169 | ) | (157 | ) | (6,326 | ) | |||||||||||||||||||||||||||||||||||
| Dividends / Interest on capital paid in 2018 - Year 2017 - Special profit reserve |
0 | 0 | 0 | (13,673 | ) | 0 | 0 | 0 | 0 | 0 | 0 | (13,673 | ) | 0 | (13,673 | ) | ||||||||||||||||||||||||||||||||||||
| Corporate reorganizations (Note 2.4 a III) |
0 | 0 | 0 | (592 | ) | 0 | 0 | 0 | 0 | 0 | 0 | (592 | ) | 0 | (592 | ) | ||||||||||||||||||||||||||||||||||||
| Unclaimed dividends |
0 | 0 | 0 | 0 | 0 | 4 | 0 | 0 | 0 | 0 | 4 | 0 | 4 | |||||||||||||||||||||||||||||||||||||||
| Other (3) |
0 | 0 | 0 | 0 | 674 | 0 | 0 | 0 | 0 | 0 | 674 | 0 | 674 | |||||||||||||||||||||||||||||||||||||||
| Total comprehensive income |
0 | 0 | 0 | 0 | 0 | 24,907 | (166 | ) | (164 | ) | 1,139 | (1,135 | ) | 24,581 | 732 | 25,313 | ||||||||||||||||||||||||||||||||||||
| Net income |
0 | 0 | 0 | 0 | 0 | 24,907 | 0 | 0 | 0 | 0 | 24,907 | 732 | 25,639 | |||||||||||||||||||||||||||||||||||||||
| Other comprehensive income for the period |
0 | 0 | 0 | 0 | 0 | 0 | (166 | ) | (164 | ) | 1,139 | (1,135 | ) | (326 | ) | 0 | (326 | ) | ||||||||||||||||||||||||||||||||||
| Appropriations: |
||||||||||||||||||||||||||||||||||||||||||||||||||||
| Legal reserve |
0 | 0 | 0 | 1,097 | 0 | (1,097 | ) | 0 | 0 | 0 | 0 | 0 | 0 | 0 | ||||||||||||||||||||||||||||||||||||||
| Statutory reserve |
0 | 0 | 0 | 4 | 2,962 | (2,966 | ) | 0 | 0 | 0 | 0 | 0 | 0 | 0 | ||||||||||||||||||||||||||||||||||||||
| Balance at 12/31/2018 |
97,148 | (1,820 | ) | 2,120 | 13,480 | 29,666 | 0 | (1,110 | ) | (989 | ) | 3,806 | (5,519 | ) | 136,782 | 13,684 | 150,466 | |||||||||||||||||||||||||||||||||||
|
|
|
|
|
|
|
|
|
|
|
|
|
|
|
|
|
|
|
|
|
|
|
|
|
|
|
|||||||||||||||||||||||||||
| Change in the period |
0 | (923 | ) | (190 | ) | (981 | ) | (3,636 | ) | 0 | 166 | 164 | (1,139 | ) | 1,135 | (5,404 | ) | (706 | ) | (6,110 | ) | |||||||||||||||||||||||||||||||
|
|
|
|
|
|
|
|
|
|
|
|
|
|
|
|
|
|
|
|
|
|
|
|
|
|
|
|||||||||||||||||||||||||||
| (1) | Includes Share of Other Comprehensive Income of Investments in Associates and Joint Ventures related to Financial Assets at Fair Value Through Other Comprehensive Income. |
| (2) | Includes Cash flow hedge and hedge of net investment in foreign operation. |
| (3) | Includes Argentina´s hyperinflation adjustment. |
The accompanying notes are an integral part of these consolidated financial statements.
F-8
Table of Contents
ITAÚ UNIBANCO HOLDING S.A.
Consolidated Statement of Cash Flows
(In millions of Reais)
| Note | 01/01 to 12/31/2018 |
01/01 to 12/31/2017 |
01/01 to 12/31/2016 |
|||||||||||
| Adjusted net income |
55,841 | 60,431 | 70,570 | |||||||||||
| Net income |
25,639 | 23,225 | 22,016 | |||||||||||
| Adjustments to net income: |
30,202 | 37,206 | 48,554 | |||||||||||
| Share-based payment |
(98 | ) | 215 | 127 | ||||||||||
| Financial assets through Profit or Loss and Derivatives |
551 | 452 | 163 | |||||||||||
| Effects of changes in exchange rates on cash and cash equivalents |
(990 | ) | 642 | 17,941 | ||||||||||
| Expected Loss from Financial Assets and Claims |
10b | 10,182 | 20,966 | 24,355 | ||||||||||
| Interest and foreign exchange expense from operations with subordinated debt |
8,759 | 4,714 | 942 | |||||||||||
| Change in reserves for insurance and private pension |
20,136 | 22,177 | 19,490 | |||||||||||
| Depreciation and amortization |
13 and 14 | 3,567 | 3,169 | 3,249 | ||||||||||
| Update/charge expense provision for Civil, labor, fiscal and legal obligations |
1,037 | 1,325 | 1,609 | |||||||||||
| Interest expense from provision for contingent and legal liabilities |
2,465 | 3,641 | 4,247 | |||||||||||
| Provision for contingent and legal liabilities |
(199 | ) | (345 | ) | (383 | ) | ||||||||
| Deferred taxes (excluding hedge tax effects) |
24b | 10,287 | 3,972 | 886 | ||||||||||
| Share of profit or (loss) in associates and joint ventures |
(747 | ) | (550 | ) | (528 | ) | ||||||||
| (Gain) loss on Financial assets - At fair value through other comprehensive income |
254 | 128 | 851 | |||||||||||
| Interest and foreign exchange income of financial assets at fair value through other comprehensive income |
21c | (12,808 | ) | (9,073 | ) | (2,570 | ) | |||||||
| Interest and foreign exchange of financial assets at amortized cost |
(11,402 | ) | (12,502 | ) | (17,332 | ) | ||||||||
| (Gain) loss on sale of investments and fixed assets |
23 | (297 | ) | (283 | ) | (21 | ) | |||||||
| Impairment losses of fixed assets and intangible assets |
13 and 14 | 167 | 14 | (5 | ) | |||||||||
| Other |
(662 | ) | (1,456 | ) | (4,467 | ) | ||||||||
| Change in assets and liabilities |
(33,132 | ) | (50,039 | ) | (34,498 | ) | ||||||||
| (Increase) decrease in assets |
(123,522 | ) | (97,420 | ) | (78,196 | ) | ||||||||
| Interbank deposits |
(9,404 | ) | (4,391 | ) | (827 | ) | ||||||||
| Securities purchased under agreements to resell |
(29,561 | ) | 5,368 | (10,646 | ) | |||||||||
| Compulsory deposits with the Central Bank of Brazil |
4,689 | (13,137 | ) | (19,144 | ) | |||||||||
| Loan operations |
(51,919 | ) | (22,467 | ) | (29,455 | ) | ||||||||
| Derivatives (assets / liabilities) |
217 | 3,396 | (3,858 | ) | ||||||||||
| Financial assets designated at fair value through profit or loss |
(13,105 | ) | (56,531 | ) | (17,743 | ) | ||||||||
| Other financial assets |
(15,323 | ) | (5,328 | ) | (6 | ) | ||||||||
| Other tax assets |
(1,669 | ) | (1,501 | ) | (2,183 | ) | ||||||||
| Other assets |
(7,447 | ) | (2,829 | ) | 5,666 | |||||||||
| (Decrease) increase in liabilities |
90,390 | 47,381 | 43,698 | |||||||||||
| Deposits |
60,486 | 73,524 | 36,804 | |||||||||||
| Deposits received under securities repurchase agreements |
17,603 | (36,530 | ) | 12,521 | ||||||||||
| Funds from interbank markets |
10,083 | (5,061 | ) | (27,238 | ) | |||||||||
| Funds from institutional markets |
(1,125 | ) | 6,967 | 10,686 | ||||||||||
| Other financial liabilities |
11,486 | 8,292 | 5,892 | |||||||||||
| Financial liabilities at fair value throught profit or loss |
(273 | ) | (54 | ) | 107 | |||||||||
| Technical reserve for insurance and private pension |
(1,409 | ) | 3,787 | 3,796 | ||||||||||
| Provisions |
(495 | ) | (1,412 | ) | 4,030 | |||||||||
| Tax liabilities |
(1,739 | ) | 2,944 | 2,391 | ||||||||||
| Other liabilities |
(348 | ) | (558 | ) | 1,132 | |||||||||
| Payment of income tax and social contribution |
(3,879 | ) | (4,518 | ) | (6,423 | ) | ||||||||
| Net cash from (used in) operating activities |
22,709 | 10,392 | 36,072 | |||||||||||
| Dividends / Interest on capital received from investments in associates and joint ventures |
671 | 489 | 287 | |||||||||||
| Cash received on financial assets - At fair value through other comprehensive income |
16,622 | 19,695 | 19,127 | |||||||||||
| Cash received from redemption of financial assets at amortized cost |
14,991 | 4,025 | 3,473 | |||||||||||
| Cash upon sale of investments in associates and joint ventures |
266 | 314 | 19 | |||||||||||
| Cash upon sale of fixed assets |
13 | 180 | 204 | 102 | ||||||||||
| Cash upon sale of intangible assets |
14 | 35 | 26 | 46 | ||||||||||
| Purchase of financial assets at fair value through other comprehensive income |
(591 | ) | (21,647 | ) | (25,845 | ) | ||||||||
| Purchase of financial assets at amortized cost |
(2,463 | ) | (406 | ) | (1,599 | ) | ||||||||
| Purchase of investments in associates and joint ventures |
(6,718 | ) | (69 | ) | (421 | ) | ||||||||
| Purchase of fixed assets |
13 | (1,483 | ) | (943 | ) | (1,364 | ) | |||||||
| Purchase of intangible assets |
14 | (1,381 | ) | (2,553 | ) | (10,552 | ) | |||||||
| Net cash from (used in) investing activities |
20,129 | (865 | ) | (16,727 | ) | |||||||||
| Funding from institutional markets |
2,906 | 4,135 | 4,863 | |||||||||||
| Redemptions in institutional markets |
(15,048 | ) | (13,573 | ) | (14,170 | ) | ||||||||
| Change in non-controlling interests stockholders |
128 | 1,003 | 10,373 | |||||||||||
| Result of delivery of treasury shares |
1,187 | 980 | 673 | |||||||||||
| Purchase of treasury shares |
(510 | ) | (3,089 | ) | (947 | ) | ||||||||
| Dividends and interest on capital paid to non-controlling interests |
(154 | ) | (346 | ) | (93 | ) | ||||||||
| Dividends and interest on capital paid |
(20,093 | ) | (10,800 | ) | (10,769 | ) | ||||||||
| Net cash from (used in) financing activities |
(31,584 | ) | (21,690 | ) | (10,070 | ) | ||||||||
| Net increase (decrease) in cash and cash equivalents |
2.4c | 11,254 | (12,163 | ) | 9,275 | |||||||||
| Cash and cash equivalents at the beginning of the period |
83,314 | 96,119 | 104,785 | |||||||||||
| Effects of changes in exchange rates on cash and cash equivalents |
990 | (642 | ) | (17,941 | ) | |||||||||
| Cash and cash equivalents at the end of the period |
95,558 | 83,314 | 96,119 | |||||||||||
|
|
|
|
|
|
|
|||||||||
| Cash |
37,159 | 18,749 | 18,542 | |||||||||||
| Interbank deposits |
3,295 | 15,327 | 13,358 | |||||||||||
| Securities purchased under agreements to resell |
55,104 | 49,238 | 64,219 | |||||||||||
| Additional information on cash flow (Mainly Operating activities) |
||||||||||||||
| Interest received |
122,405 | 139,895 | 169,618 | |||||||||||
| Interest paid |
84,668 | 71,456 | 79,227 | |||||||||||
| Non-cash transactions |
||||||||||||||
| Dividends and interest on capital declared and not yet paid |
515 | 1,876 | 2,869 | |||||||||||
The accompanying notes are an integral part of these consolidated financial statements.
F-9
Table of Contents
ITAÚ UNIBANCO HOLDING S.A.
Notes to the Consolidated Financial Statements
At 12/31/2018, 12/31/2017 and 01/01/2017 for balance sheet accounts and
From 01/01 to 12/31 of 2018, 2017 and 2016 for income statement accounts
(In millions of Reais, except information per share)
Note 1 - Overview
Itaú Unibanco Holding S.A. (ITAÚ UNIBANCO HOLDING) is a publicly-held company, organized and existing under the Laws of Brazil. The head office is located at Praça Alfredo Egydio de Souza Aranha, n° 100, in the city of São Paulo, state of São Paulo, Brazil.
ITAÚ UNIBANCO HOLDING is present in 19 countries and offers a wide variety of financial products and services to individual and corporate customers, through its branches, subsidiaries and international associates. It operates in all modalities of banking activities, by means of its portfolios: commercial; investment; mortgage loans; loans, financing and investment; lease and foreign exchange transactions. Its operations are divided into three segments: Retail Bank, Wholesale Bank, and Activities with the Market + Corporation. Further detailed segment information is presented in Note 30.
ITAÚ UNIBANCO HOLDING is a holding company controlled by Itaú Unibanco Participações S.A. (“IUPAR”), a holding company which owns 51.71% of our common shares, and which is jointly controlled by (i) Itaúsa Investimentos Itaú S.A. (“Itaúsa”), a holding company controlled by members of the Egydio de Souza Aranha family, and (ii) Companhia E. Johnston de Participações (“E. Johnston”), a holding company controlled by the Moreira Salles family. Itaúsa also directly holds 39.21% of ITAÚ UNIBANCO HOLDING common shares.
These consolidated financial statements were approved by the Executive Board on February 04, 2019.
Note 2 – Significant accounting policies
2.1. Basis of preparation
The Consolidated Financial Statements of ITAÚ UNIBANCO HOLDING were prepared taking into account the requirements and guidelines set out by the National Monetary Council (CMN), which established that as from December 31, 2010 annual Consolidated Financial Statements are to be prepared in accordance with the International Financial Reporting Standards (IFRS), as issued by the International Accounting Standards Board (IASB).
In the preparation of these Consolidated Financial Statements, ITAÚ UNIBANCO HOLDING adopted the criteria for recognition, measurement and disclosure established in the IFRS and in the interpretations of the International Financial Reporting Interpretation Committee (IFRIC).
Management believes that the information included in these Consolidated Financial Statements is relevant and a faithful representation of the information used in the management of the ITAÚ UNIBANCO HOLDING.
2.2. New accounting standards and new accounting standards changes and interpretations
| a) | Accounting standards applicable for period ended December 31, 2018 |
| • | IFRS 9 – Financial Instruments: The pronouncement replaces lAS 39 – Financial Instruments: Recognition and Measurement. IFRS 9 is applicable to all financial assets and liabilities and was retrospectively adopted on the date the standard becomes effective, on January 1st, 2018. The new rule is structured to contemplate the pillars (I) Classification and measurement of financial assets, (II) Impairment and (III) Hedge accounting. |
Transition for IFRS 9
The main changes identified by ITAÚ UNIBANCO HOLDING due to the adoption of IFRS 9 are related to the classification, measurement and impairment of financial assets. ITAÚ UNIBANCO HOLDING will continue applying the hedge accounting requirements set forth in IAS 39 and retrospectively applied the other criteria of IFRS 9 as from January 1st, 2016.
F-10
Table of Contents
ITAÚ UNIBANCO HOLDING S.A.
Notes to the Consolidated Financial Statements
At 12/31/2018, 12/31/2017 and 01/01/2017 for balance sheet accounts and
From 01/01 to 12/31 of 2018, 2017 and 2016 for income statement accounts
(In millions of Reais, except information per share)
| (I) | Classification and Measurement of Financial Assets and Liabilities |
IFRS 9 introduces the concept of business model and assessment of characteristics of contractual cash flows (Solely Payment of Principal and Interest Test – SPPI Test) for classification of financial assets.
| • | Business Model: represents the way the entity manages its financial assets; |
| • | SPPI Test: assessment of cash flows generated by the financial instrument aiming at checking whether they represent solely payments of principal and interest. |
ITAÚ UNIBANCO HOLDING conducted a detailed analysis of its business models and characteristics of its cash flows of financial assets, and the main changes resulting from the adoption of IFRS 9 are:
| • | The classification categories of financial assets Held to maturity, Available for sale, Held for trading and Loans and receivables have ceased to exist. |
| • | Three measurement categories of financial assets were introduced: |
| – | Amortized Cost: used when financial assets are managed to obtain contractual cash flows, constituted solely of payments of principal and interest. A significant portion of financial assets previously classified in Loans and Receivables, Held to Maturity and Available for Sale was accounted for in this category; |
| – | Fair Value Through Other Comprehensive Income: used when financial assets are held both for obtaining contractual cash flows, constituted solely by payments of principal and interest, and for sale. The remaining portion of financial assets previously accounted for as Available for Sale was classified in this category; and |
| – | Fair Value Through Profit or Loss: used for financial assets that do not meet the aforementioned criteria. Derivatives and financial assets Held for Trading were recorded in this category. |
| • | In the initial adoption, there were designations of equity instruments at fair value through other comprehensive income. |
| • | The existing designations of financial assets/liabilities at fair value through profit or loss were maintained and there were no new designations. |
| • | Financial assets which cash flows were modified (without derecognition) had their gross carrying amount recalculated, according to IFRS 9 requirements, and the effects of this change were recognized in profit or loss after the initial date. There were no adjustments recognized at January 01, 2016. |
ITAÚ UNIBANCO HOLDING maintained the classification of financial liabilities unchanged, which continue being measured at amortized cost or fair value through profit or loss, in the event they had been previously designated.
| (II) | Impairment |
The requirements for assessment of impairment of financial assets are based on an expected credit loss model. The main changes in the accounting policy of ITAÚ UNIBANCO HOLDING for impairment are listed below.
The expected credit loss model includes the use of forward looking information and classification of financial assets in three stages:
| • | Stage 1 – 12-month expected credit loss: represents default events possible within 12 months. Applicable to financial assets purchased or originated credit impaired financial assets; |
| • | Stage 2 – Lifetime expected credit loss of financial instrument: considers all possible default events. Applicable to financial assets purchased or originated credit impaired financial assets and which credit risk has increased significantly; and |
| • | Stage 3 – Credit loss expected for credit-impaired assets: considers all possible default events. Applicable to financial assets purchased or originated credit impaired financial assets. The measurement of assets classified in this stage is different from Stage 2 due to the recognition of interest income by applying the effective interest rate at amortized cost (net of provision) rather than at the gross carrying amount. |
F-11
Table of Contents
ITAÚ UNIBANCO HOLDING S.A.
Notes to the Consolidated Financial Statements
At 12/31/2018, 12/31/2017 and 01/01/2017 for balance sheet accounts and
From 01/01 to 12/31 of 2018, 2017 and 2016 for income statement accounts
(In millions of Reais, except information per share)
An asset will migrate from a phase as its credit risk increases or decreases. Therefore, a financial asset that migrated to phases 2 and 3 may return to phase 1, unless it was purchased or originated credit impaired financial assets.
The change in the calculation model of expected credit loss gave rise to an increase in the provision recorded in the consolidated financial statements of ITAÚ UNIBANCO HOLDING due to the change in measurement of financial assets, and loss revaluation considering forward looking criteria.
| (III) | Hedge accounting |
The hedge accounting requirements are closed aligned with risk management and should be applied on a prospective basis. ITAÚ UNIBANCO HOLDING will continue applying all requirements for hedge accounting set forth in IAS 39, as permitted by IFRS 9.
Reconciliation of Stockholders’ Equity and Net Income between IAS 39 and IFRS 9
| Reference | 12/31/2017 | 12/31/2016 | 1/1/2016 | |||||||||||||||||||||
| Stockholders’ Equity |
Net Income |
Stockholders’ Equity |
Net Income |
Stockholders’ Equity |
||||||||||||||||||||
| In accordance with IAS 39 (excluding non-controlling interests) |
134,840 | 23,903 | 122,582 | 23,263 | 112,252 | |||||||||||||||||||
| Adjustments arising from changes in the financial asset derecognition policy, net of tax effects |
a | 2,402 | (78 | ) | 2,462 | 201 | 2,280 | |||||||||||||||||
| In accordance with IAS 39 (excluding non-controlling interests) |
137,242 | 23,825 | 125,044 | 23,464 | 114,532 | |||||||||||||||||||
| Expected loss |
b | (9,858 | ) | (1,948 | ) | (7,915 | ) | (3,438 | ) | (4,615 | ) | |||||||||||||
| Loan operations and Finance leases |
(8,574 | ) | (1,192 | ) | (7,385 | ) | (2,259 | ) | (5,189 | ) | ||||||||||||||
| Other financial assets |
(1,284 | ) | (756 | ) | (530 | ) | (1,179 | ) | 574 | |||||||||||||||
| Change in financial assets |
c | 138 | 101 | 36 | 36 | — | ||||||||||||||||||
| Adjustment to fair value of financial assets |
d | (540 | ) | 359 | (787 | ) | 514 | (661 | ) | |||||||||||||||
| Effect of adoption of investments in Associates / Joint ventures |
(116 | ) | — | — | — | — | ||||||||||||||||||
| Deferred taxes on the above adjustments |
4,324 | 522 | 3,774 | 1,164 | 2,534 | |||||||||||||||||||
| Interest of non-controlling stockholders |
188 | 334 | (57 | ) | (113 | ) | 187 | |||||||||||||||||
|
|
|
|
|
|
|
|
|
|
|
|||||||||||||||
| Total adjustments |
(5,864 | ) | (632 | ) | (4,949 | ) | (1,837 | ) | (2,555 | ) | ||||||||||||||
|
|
|
|
|
|
|
|
|
|
|
|||||||||||||||
| In accordance with IFRS 9 - attributable to controlling stockholders |
131,378 | 23,193 | 120,095 | 21,627 | 111,977 | |||||||||||||||||||
| In accordance with IFRS 9 - attributable to non-controlling stockholders |
12,978 | 32 | 12,289 | 389 | 1,620 | |||||||||||||||||||
| In accordance with IFRS 9 - attributable to controlling and non-controlling stockholders |
144,356 | 23,225 | 132,384 | 22,016 | 113,597 | |||||||||||||||||||
| (a) | Change in the policy for partial derecognition of financial assets, in accordance with IAS 8, which caused the proportional treatment as asset, aligning the recovery behavior of financial assets and their economic realization. |
| (b) | Change in the calculation model based on loss incurred (IAS 39) for expected loss, considering prospective information. |
| (c) | Adequacy of gross carrying amount of financial assets that had their cash flows modified (without derecognition), and which balances were recalculated in accordance with IFRS 9. |
| (d) | Change in the measurement model of financial assets due to the new categories introduced by IFRS 9. |
F-12
Table of Contents
ITAÚ UNIBANCO HOLDING S.A.
Notes to the Consolidated Financial Statements
At 12/31/2018, 12/31/2017 and 01/01/2017 for balance sheet accounts and
From 01/01 to 12/31 of 2018, 2017 and 2016 for income statement accounts
(In millions of Reais, except information per share)
Consolidated Balance Sheet at 01/01/2016
(In million Reais)
| IAS 39 01/01/2016 |
IFRS 9 01/01/2016 |
|||||||||||||||||||
| Assets |
Categories |
Balance | Reclassifications (a) | Remeasurements / Changes (b) |
Categories |
Balance | ||||||||||||||
| Cash and deposits on demand |
18,544 | — | — | |||||||||||||||||
| Central Bank compulsory deposits to Brazil |
66,556 | (66,556 | ) | — | — | |||||||||||||||
| Interbank deposits |
30,525 | (30,525 | ) | — | — | |||||||||||||||
| Securities purchased under agreements to resell |
254,404 | (254,404 | ) | — | — | |||||||||||||||
| Financial assets held for trading |
Held for trading | 164,311 | (164,311 | ) | — | — | ||||||||||||||
| Pledged as collateral |
11,008 | (11,008 | ) | — | — | |||||||||||||||
| Other Financial assets held for trading |
153,303 | (153,303 | ) | — | — | |||||||||||||||
| Financial assets designated at fair value through profit or loss |
Available for sale | 642 | (642 | ) | — | — | ||||||||||||||
| Derivatives |
26,755 | (26,755 | ) | — | — | |||||||||||||||
| Available-for-sale financial assets |
Available for sale | 86,045 | (86,045 | ) | — | — | ||||||||||||||
| Pledged as collateral |
16,706 | (16,706 | ) | — | — | |||||||||||||||
| Other Available-for-sale financial assets |
69,339 | (69,339 | ) | — | — | |||||||||||||||
| Held-to-maturity financial assets |
Held to maturity | 42,185 | (42,185 | ) | — | — | ||||||||||||||
| Pledged as collateral |
9,460 | (9,460 | ) | — | — | |||||||||||||||
| Other Held-to-maturity financial assets |
32,725 | (32,725 | ) | — | — | |||||||||||||||
| Loan operations and lease operations portfolio, net |
Loans and receivables | 447,404 | (447,404 | ) | — | — | ||||||||||||||
| Loan operations and lease operations portfolio |
474,248 | (474,248 | ) | — | — | |||||||||||||||
| (-) Allowance for loan and lease losses |
(26,844 | ) | 26,844 | — | — | |||||||||||||||
| Other financial assets |
53,506 | (53,506 | ) | — | — | |||||||||||||||
|
|
|
|
|
|
|
|
|
|||||||||||||
| Cash and deposits on demand |
18,544 | — | — | 18,544 | ||||||||||||||||
| Financial assets |
— | 1,172,333 | 2,513 | 1,174,846 | ||||||||||||||||
| Central Bank compulsory deposits to Brazil |
— | 66,556 | — | 66,556 | ||||||||||||||||
| At amortized cost |
— | 874,360 | 1,589 | amortized cost | 875,949 | |||||||||||||||
| Interbank deposits |
— | 30,525 | — | 30,525 | ||||||||||||||||
| Securities purchased under agreements to resell |
— | 254,404 | — | 254,404 | ||||||||||||||||
| Securities |
— | 88,521 | (1,007 | ) | 87,514 | |||||||||||||||
| Loan operations and lease operations portfolio |
— | 474,248 | 4,142 | 478,390 | ||||||||||||||||
| Other financial assets |
— | 53,506 | — | 53,506 | ||||||||||||||||
| (-) Provision for expected loss |
— | (26,844 | ) | (1,546 | ) | (28,390 | ) | |||||||||||||
| At fair value through other comprehensive income |
— | 26,069 | 2,532 | fair value through other comprehensive income | 28,601 | |||||||||||||||
| Securities |
— | 26,069 | 2,532 | 28,601 | ||||||||||||||||
| At fair value through profit or loss |
— | 205,348 | (1,608 | ) | fair value through profit or loss | 203,740 | ||||||||||||||
| Securities |
— | 178,593 | (1,608 | ) | 176,985 | |||||||||||||||
| Derivatives |
— | 26,755 | — | 26,755 | ||||||||||||||||
| Investments in subsidiaries and joint ventures |
4,399 | — | — | 4,399 | ||||||||||||||||
| Fixed assets, net |
8,541 | — | — | 8,541 | ||||||||||||||||
| Goodwill and Intangible assets, net |
8,352 | — | — | 8,352 | ||||||||||||||||
| Tax assets |
52,149 | — | 3,193 | 55,342 | ||||||||||||||||
| Other assets |
12,097 | — | 82 | 12,179 | ||||||||||||||||
|
|
|
|
|
|
|
|
|
|||||||||||||
| Total assets |
1,276,415 | — | 5,788 | 1,282,203 | ||||||||||||||||
|
|
|
|
|
|
|
|
|
|||||||||||||
F-13
Table of Contents
ITAÚ UNIBANCO HOLDING S.A.
Notes to the Consolidated Financial Statements
At 12/31/2018, 12/31/2017 and 01/01/2017 for balance sheet accounts and
From 01/01 to 12/31 of 2018, 2017 and 2016 for income statement accounts
(In millions of Reais, except information per share)
| IAS 39 01/01/2016 |
IFRS 9 01/01/2016 |
|||||||||||||||||||
|
Liabilities and stockholders’ equity |
Categories |
Balance | Reclassifications (a) | Remeasurements / Changes (b) |
Categories |
Balance | ||||||||||||||
| Deposits |
292,610 | (292,610 | ) | — | — | — | ||||||||||||||
| Securities sold under repurchase agreements |
336,643 | (336,643 | ) | — | — | — | ||||||||||||||
| Financial liabilities held for trading |
412 | (412 | ) | — | — | — | ||||||||||||||
| Derivatives |
31,071 | (31,071 | ) | — | — | — | ||||||||||||||
| Interbank market debt |
156,886 | (156,886 | ) | — | — | — | ||||||||||||||
| Institutional market debt |
93,918 | (93,918 | ) | — | — | — | ||||||||||||||
| Other financial liabilities |
68,715 | (68,715 | ) | — | — | — | ||||||||||||||
| Reserves for insurance and private pension |
129,305 | — | — | — | — | |||||||||||||||
| Liabilities for capitalization plans |
3,044 | (3,044 | ) | — | — | — | ||||||||||||||
| Provisions |
18,994 | — | — | — | — | |||||||||||||||
| Tax liabilities |
4,971 | — | — | — | — | |||||||||||||||
| Other liabilities |
25,787 | — | — | — | — | |||||||||||||||
| Total liabilities |
1,162,356 | — | — | — | — | |||||||||||||||
|
|
|
|
|
|
|
|
|
|
||||||||||||
| Financial liabilities |
— | 983,299 | 3,643 | 986,942 | ||||||||||||||||
| At amortized cost |
— | 951,816 | — | 951,816 | ||||||||||||||||
| Deposits |
— | 292,610 | — | 292,610 | ||||||||||||||||
| Securities sold under repurchase agreements |
— | 336,643 | — | 336,643 | ||||||||||||||||
| Interbank market debt |
— | 156,886 | — | 156,886 | ||||||||||||||||
| Institutional market debt |
— | 93,918 | — | 93,918 | ||||||||||||||||
| Other financial liabilities |
— | 71,759 | 71,759 | |||||||||||||||||
| At fair value through profit or loss |
— | 31,483 | — | Financial Liabilities Designated at Fair Value Through Profit or Loss | 31,483 | |||||||||||||||
| Derivatives |
— | 31,071 | — | 31,071 | ||||||||||||||||
| Others |
— | 412 | — | 412 | ||||||||||||||||
| Provision for expected loss |
— | — | 3,643 | 3,643 | ||||||||||||||||
| Loan commitments |
— | — | 2,820 | 2,820 | ||||||||||||||||
| Financial guarantees |
— | — | 823 | 823 | ||||||||||||||||
| Reserves for insurance and private pension |
129,305 | — | — | 129,305 | ||||||||||||||||
| Provisions |
18,994 | — | — | 18,994 | ||||||||||||||||
| Tax liabilities |
4,971 | — | 2,606 | 7,577 | ||||||||||||||||
| Other liabilities |
25,787 | — | 1 | 25,788 | ||||||||||||||||
| Total liabilities |
179,057 | 983,299 | 6,250 | 1,168,606 | ||||||||||||||||
| Total stockholders’ equity attributed to the owners of the parent company |
112,252 | — | (275 | ) | 111,977 | |||||||||||||||
| Non-controlling interests |
1,807 | — | (187 | ) | 1,620 | |||||||||||||||
| Total stockholders’ equity |
114,059 | — | (462 | ) | 113,597 | |||||||||||||||
|
|
|
|
|
|
|
|
|
|||||||||||||
| Total liabilities and stockholders’ equity |
1,276,415 | — | 5,788 | 1,282,203 | ||||||||||||||||
|
|
|
|
|
|
|
|
|
|||||||||||||
| (a) | Reclassifications: refer to reclassifications of financial assets between categories of measurement at fair value and amortized cost; |
| (b) | Remeasurements: refer to expected credit loss and adjustment to fair value of financial assets reclassified between measurement categories; and financial assets changed and not written-off, which balances were recalculated in accordance with IFRS 9. |
F-14
Table of Contents
ITAÚ UNIBANCO HOLDING S.A.
Notes to the Consolidated Financial Statements
At 12/31/2018, 12/31/2017 and 01/01/2017 for balance sheet accounts and
From 01/01 to 12/31 of 2018, 2017 and 2016 for income statement accounts
(In millions of Reais, except information per share)
Consolidated Balance Sheet at 12/31/2017
(In million Reais)
| IAS 39 12/31/2017 | IFRS 9 12/31/2017 |
|||||||||||||||||||||
| Assets |
Categories | Balance | Reclassifications (a) |
Remeasurements / Changes (b) |
Categories |
Balance | ||||||||||||||||
| Cash and deposits on demand |
18,749 | — | — | — | ||||||||||||||||||
| Central Bank compulsory deposits to Brazil |
98,837 | (98,837 | ) | — | — | |||||||||||||||||
| Interbank deposits |
29,053 | (29,053 | ) | — | — | |||||||||||||||||
| Securities purchased under agreements to resell |
244,707 | (244,707 | ) | — | — | |||||||||||||||||
| Financial assets held for trading |
Held for trading | 270,121 | (270,121 | ) | — | — | ||||||||||||||||
| Pledged as collateral |
30,585 | (30,585 | ) | — | — | |||||||||||||||||
| Other Financial assets held for trading |
239,536 | (239,536 | ) | — | — | |||||||||||||||||
| Financial assets designated at fair value through profit or loss |
Available for sale | 1,746 | (1,746 | ) | — | — | ||||||||||||||||
| Derivatives |
22,843 | (22,843 | ) | — | — | |||||||||||||||||
| Available-for-sale financial assets |
Available for sale | 102,284 | (102,284 | ) | — | — | ||||||||||||||||
| Pledged as collateral |
33,671 | (33,671 | ) | — | — | |||||||||||||||||
| Other Available-for-sale financial assets |
68,613 | (68,613 | ) | — | — | |||||||||||||||||
| Held-to-maturity financial assets |
Held to maturity | 36,560 | (36,560 | ) | — | — | ||||||||||||||||
| Pledged as collateral |
974 | (974 | ) | — | — | |||||||||||||||||
| Other Held-to-maturity financial assets |
35,586 | (35,586 | ) | — | — | |||||||||||||||||
| Loan operations and lease operations portfolio, net |
Loans and receivables | 465,472 | (465,472 | ) | — | — | ||||||||||||||||
| Loan operations and lease operations portfolio |
493,367 | (493,367 | ) | — | — | |||||||||||||||||
| (-) Allowance for loan and lease losses |
(27,895 | ) | 27,895 | — | — | |||||||||||||||||
| Other financial assets |
59,568 | (59,568 | ) | — | — | |||||||||||||||||
|
|
|
|
|
|
|
|
|
|||||||||||||||
| Cash and deposits on demand |
18,749 | — | — | 18,749 | ||||||||||||||||||
| Financial assets |
— | 1,331,191 | (940 | ) | 1,330,251 | |||||||||||||||||
| Central Bank compulsory deposits to Brazil |
— | 98,837 | — | 98,837 | ||||||||||||||||||
| At amortized cost |
— | 909,104 | (3,375 | ) | Amortized cost | 905,729 | ||||||||||||||||
| Interbank deposits |
— | 29,053 | (5 | ) | 29,048 | |||||||||||||||||
| Securities purchased under agreements to resell |
— | 244,707 | — | 244,707 | ||||||||||||||||||
| Securities |
— | 110,304 | 1,120 | 111,424 | ||||||||||||||||||
| Loan operations and lease operations portfolio |
— | 493,367 | 4,352 | 497,719 | ||||||||||||||||||
| Other financial assets |
— | 59,568 | — | 59,568 | ||||||||||||||||||
| (-) Provision for expected loss |
— | (27,895 | ) | (8,842 | ) | (36,737 | ) | |||||||||||||||
| At fair value through other comprehensive income |
— | 49,029 | 3,120 | Fair value through other comprhensive income | 52,149 | |||||||||||||||||
| Securities |
— | 49,029 | 3,120 | 52,149 | ||||||||||||||||||
| At fair value through profit or loss |
— | 274,221 | (685 | ) | Fair value through profit or loss | 273,536 | ||||||||||||||||
| Securities |
— | 251,378 | (685 | ) | 250,693 | |||||||||||||||||
| Derivatives |
— | 22,843 | — | 22,843 | ||||||||||||||||||
| Investments in subsidiaries and joint ventures |
5,171 | — | (116 | ) | 5,055 | |||||||||||||||||
| Fixed assets, net |
7,359 | — | — | 7,359 | ||||||||||||||||||
| Goodwill and Intangible assets, net |
19,383 | — | — | 19,383 | ||||||||||||||||||
| Tax assets |
41,927 | — | 2,322 | 44,249 | ||||||||||||||||||
| Other assets |
11,189 | — | 4 | 11,193 | ||||||||||||||||||
|
|
|
|
|
|
|
|
|
|||||||||||||||
| Total assets |
1,434,969 | — | 1,270 | 1,436,239 | ||||||||||||||||||
|
|
|
|
|
|
|
|
|
|||||||||||||||
F-15
Table of Contents
ITAÚ UNIBANCO HOLDING S.A.
Notes to the Consolidated Financial Statements
At 12/31/2018, 12/31/2017 and 01/01/2017 for balance sheet accounts and
From 01/01 to 12/31 of 2018, 2017 and 2016 for income statement accounts
(In millions of Reais, except information per share)
| IAS 39 12/31/2017 | IFRS 9 12/31/2017 |
|||||||||||||||||||||
|
Liabilities and stockholders’ equity |
Categories | Balance | Reclassifications (a) | Remeasurements / Changes (b) |
Categories |
Balance | ||||||||||||||||
| Deposits |
402,938 | (402,938 | ) | — | — | |||||||||||||||||
| Securities sold under repurchase agreements |
312,634 | (312,634 | ) | — | — | |||||||||||||||||
| Financial liabilities held for trading |
465 | (465 | ) | — | — | |||||||||||||||||
| Derivatives |
26,746 | (26,746 | ) | — | — | |||||||||||||||||
| Interbank market debt |
129,616 | (129,616 | ) | — | — | |||||||||||||||||
| Institutional market debt |
98,482 | (98,482 | ) | — | — | |||||||||||||||||
| Other financial liabilities |
77,613 | (77,613 | ) | — | — | |||||||||||||||||
| Reserves for insurance and private pension |
181,232 | — | — | — | ||||||||||||||||||
| Liabilities for capitalization plans |
3,301 | (3,301 | ) | — | — | |||||||||||||||||
| Provisions |
19,736 | — | — | — | ||||||||||||||||||
| Tax liabilities |
7,839 | — | — | — | ||||||||||||||||||
| Other liabilities |
26,361 | — | — | — | ||||||||||||||||||
| Total liabilities |
1,286,963 | — | — | — | ||||||||||||||||||
|
|
|
|
|
|
|
|
|
|||||||||||||||
| Financial liabilities |
— | 1,051,795 | 4,922 | 1,056,717 | ||||||||||||||||||
| At amortized cost |
— | 1,024,584 | — | 1,024,584 | ||||||||||||||||||
| Deposits |
— | 402,938 | — | 402,938 | ||||||||||||||||||
| Securities sold under repurchase agreements |
— | 312,634 | — | 312,634 | ||||||||||||||||||
| Interbank market debt |
— | 124,587 | — | 124,587 | ||||||||||||||||||
| Institutional market debt |
— | 98,482 | — | 98,482 | ||||||||||||||||||
| Other financial liabilities |
— | 85,943 | — | 85,943 | ||||||||||||||||||
| At fair value through profit or loss |
— | 27,211 | — | Financial Liabilities Designated at Fair Value Through Profit or Loss | 27,211 | |||||||||||||||||
| Derivatives |
— | 26,746 | — | 26,746 | ||||||||||||||||||
| Others |
— | 465 | — | 465 | ||||||||||||||||||
| Provision for expected loss |
— | — | 4,922 | 4,922 | ||||||||||||||||||
| Loan commitments |
— | — | 3,015 | 3,015 | ||||||||||||||||||
| Financial guarantees |
— | — | 1,907 | 1,907 | ||||||||||||||||||
| Reserves for insurance and private pension |
181,232 | — | — | 181,232 | ||||||||||||||||||
| Provisions |
19,736 | — | — | 19,736 | ||||||||||||||||||
| Tax liabilities |
7,839 | — | (3 | ) | 7,836 | |||||||||||||||||
| Other liabilities |
26,361 | — | 1 | 26,362 | ||||||||||||||||||
| Total liabilities |
235,168 | 1,051,795 | 4,920 | 1,291,883 | ||||||||||||||||||
| Total stockholders’ equity attributed to the owners of the parent company |
134,840 | — | (3,462 | ) | 131,378 | |||||||||||||||||
| Non-controlling interests |
13,166 | — | (188 | ) | 12,978 | |||||||||||||||||
| Total stockholders’ equity |
148,006 | — | (3,650 | ) | 144,356 | |||||||||||||||||
|
|
|
|
|
|
|
|
|
|||||||||||||||
| Total liabilities and stockholders’ equity |
1,434,969 | — | 1,270 | 1,436,239 | ||||||||||||||||||
|
|
|
|
|
|
|
|
|
|||||||||||||||
| (a) | Reclassifications: refer to reclassifications of financial assets between categories of measurement at fair value and amortized cost; |
| (b) | Remeasurements: refer to expected credit loss and adjustment to fair value of financial assets reclassified between measurement categories; and financial assets changed and not written-off, which balances were recalculated in accordance with IFRS 9. |
| • | IFRS 15 – Revenue from Contracts with Customers: The pronouncement replaces IAS 18 – Revenue and IAS 11 – Construction Contracts, as well as respective interpretations (IFRICs 13, 15 and 18). It requires that the recognition of revenue reflect the transfer of goods or services to the client. This standard is effective for the years beginning January 1st, 2018 and there are no impacts for the Consolidated Financial Statements of ITAÚ UNIBANCO HOLDING. |
| • | Amendment to IFRS 4 – Insurance Contracts – Joint application of IFRS 9: The amendment enables entities that are issuers of insurance contracts to mitigate possible impacts of the adoption of IFRS 9 – Financial Instruments before the effectiveness of IFRS 17 – Insurance Contracts, through two options: |
| • | Temporary exemption: adoption of IFRS 9 together with IFRS 17, as from January 2021. This option is applicable only to entities with significant insurance activities (over 80% of total liabilities) and that have not applied IFRS 9 in advance; |
| • | Overlay approach: adoption of IFRS 9, however, for assets reclassified to the category Fair Value through Profit or Loss, transferring the effects of the adoption of IFRS 9 from Income for the Period to Other Comprehensive Income until the effectiveness of IFRS 17. |
Liabilities related to insurance contracts are not representative as compared to total liabilities of ITAÚ UNIBANCO HOLDING.
F-16
Table of Contents
ITAÚ UNIBANCO HOLDING S.A.
Notes to the Consolidated Financial Statements
At 12/31/2018, 12/31/2017 and 01/01/2017 for balance sheet accounts and
From 01/01 to 12/31 of 2018, 2017 and 2016 for income statement accounts
(In millions of Reais, except information per share)
In 2018, ITAÚ UNIBANCO HOLDING adopted IFRS 9 for all financial assets of insurance entities, and, therefore, will not use the aforementioned options.
| b) | Accounting standards recently issued and applicable in future periods |
| • | IFRIC 23 – Uncertainty Over Income Tax Treatments on income tax clarifies how to apply the requirements for recognition and measurement of IAS 12 – Income Taxes when there is uncertainty about the acceptance of income tax treatment by tax authorities. This interpretation is effective for the years beginning January 1, 2019 and there will be no relevant impacts for the consolidated financial statements of ITAÚ UNIBANCO HOLDING. |
| • | Change in Conceptual Framework – In March, 2018, o IASB issued a review of the Conceptual Framework and the main changes refer to: definitions of assets and liabilities, recognition criteria, derecognition, measurement, presentation and disclosure for equity elements and result. These changes are effective for the years started on January 1st, 2020 and possible impacts are being assessed and will be completed by the date they are in force. |
| • | IFRS 16 – Leases – The pronouncement replaces IAS 17 - Leases, and related interpretations (IFRIC 4, SIC 15 and SIC 27). It eliminates the accounting for operating lease agreements for the lessee, presenting only one lease model, that consists of: (a) initially recognizing all lease in assets (Right-of-Use Asset) and liabilities (Other liabilities) at present value; and (b) recognizing depreciation of Right-of-Use Asset and interest from lease separately in the result. This standard is effective for annual periods beginning on January 1st, 2019. The modified retrospective transition method will be applied, which does not require the presentation of comparative information, and liabilities and the Right-of-Use Asset are stated at present value of remaining installments. Transition to IFRS 16 will cause a variation not exceeding 0.5% of Total Assets, with no impact on Stockholders’ Equity. |
| • | IFRS 17 – Insurance Contracts: The pronouncement replaces IFRS 4 – Insurance Contracts and presents three approaches for assessment: |
| • | General Model: applicable to all contracts without direct participation features; |
| • | Premium Allocation Approach (PAA): applicable to contracts which term is up to 12 months and with modestly complex cash flows. It is simpler than the standard model; and it can be used only when it produces results similar to those that would be obtained it the standard model was used; |
| • | Variable Fee Approach: applicable to insurance contracts with direct participation features. The insurance contracts are substantially investment related service contracts under which an entity promises an investment return based on underlying items. |
Insurance contracts should be recognized based on the analysis of four components:
| • | Expected Future Cash Flows: estimate of all components of cash flow of the contract, considering inflows and outflows; |
| • | Risk Adjustment: estimate of offset required by deviations that may occur between cash flows; |
| • | Contractual Margin: difference between any amounts received before the beginning of the contract coverage and present value of cash flows estimated in the beginning of the contract; |
| • | Discount: projected cash flows should be discounted at present value, to reflect the time value of money, at rates that reflect the characteristics of respective flows. |
This standard is effective for annual periods beginning on January 1st, 2021. Possible impacts are being assessed and will be completed by the date this standard is effective.
2.3. Critical accounting estimates and judgments
The preparation of Consolidated Financial Statements in accordance with IFRS requires Management to make estimates and assumptions that affect the reported amounts of assets, liabilities, and contingent assets and liabilities at the date of the Consolidated Financial Statements, due to uncertainties and high level of subjectivity involved in the recognition and measurement of certain items.
Estimates and judgments considered more relevant by ITAÚ UNIBANCO HOLDING are detailed below:
F-17
Table of Contents
ITAÚ UNIBANCO HOLDING S.A.
Notes to the Consolidated Financial Statements
At 12/31/2018, 12/31/2017 and 01/01/2017 for balance sheet accounts and
From 01/01 to 12/31 of 2018, 2017 and 2016 for income statement accounts
(In millions of Reais, except information per share)
| a) | Consolidation |
Controlled entities are all entities to which ITAÚ UNIBANCO HOLDING is exposed, or is entitled to variable returns of involvement with the entity and that can affect these returns through its power on the entity. Control assessment is conducted on a continuous basis. Controlled entities are consolidated from the date control is established to the date on which control ceases to exist.
| b) | Goodwill |
The review of goodwill due to impairment reflects the Management’s best estimate for future cash flows of Cash Generating Units (CGU). These flows are subject to market conditions and uncertain factors, such as:
| • | Cash flows projected for periods of available forecasts and long-term assumptions for these flows; |
| • | Discount rates, since they generally reflect financial and economic variables, such as risk-free interest rate and a risk premium. |
| c) | Expected Credit Loss |
The measurement of expected credit loss requires the application of significant assumptions, such as:
| • | Maturity term: ITAÚ UNIBANCO HOLDING considers the maximum contractual period on which it will be exposed to financial instrument’s credit risk. However, the estimated useful life of assets that do not have a determined maturity is based on the period of exposure to credit risk. Additionally, all contractual terms are considered when determining the expected life, including prepayment and rollover options. |
| • | Prospective information: IFRS 9 requires a balanced and impartial estimate of credit loss that comprises forecasts of future economic conditions. ITAÚ UNIBANCO HOLDING uses prospective macroeconomic information and public information with projections prepared internally to determine the impact of these estimates on the calculation of expected credit loss. |
| • | Probability-weighted loss scenarios: ITAÚ UNIBANCO HOLDING uses weighted scenarios to determine credit loss expected in a proper observation horizon. |
| • | Determining criteria for significant increase or decrease in credit risk: in each period of the consolidated financial statements, ITAÚ UNIBANCO HOLDING assesses whether the credit risk on a financial asset has increased significantly using relative and absolute triggers (indicators) by product and by country. |
Brazilian and foreign government securities are considered with low credit risk, and therefore they remain in stage 1, in accordance with a study conducted by ITAÚ UNIBANCO HOLDING.
Significant increase in credit risk: ITAÚ UNIBANCO HOLDING assesses several factors to determine a significant increase in credit risk, such as: the counterparty, type and characteristics of the product and region in which it was taken out, considering the following objective criteria as minimum factors:
| • | Phase 1 to phase 2: default exceeding 30 days, except for payroll loans for public bodies, which recognition is made after 45 days in arrears; |
| • | Phase 2 to phase 3: default exceeding 90 days, except for the mortgage loan portfolio, which uses 180 days in arrears as a parameter for phase migration. |
ITAÚ UNIBANCO HOLDING assesses whether the credit risk has significantly increased on an individual or collective basis. For collective assessment purposes, financial assets are grouped based on characteristics of shared credit risk, considering the type of instrument, credit risk classifications, initial recognition date, remaining term, industry, geographical location of the counterparty, among other significant factors.
Macroeconomic scenarios: This information involves inherent risks, market uncertainties and other factors that may give rise to results different from expected, including changes in market conditions and economic policy, recessions or fluctuations in indicators different from expected.
F-18
Table of Contents
ITAÚ UNIBANCO HOLDING S.A.
Notes to the Consolidated Financial Statements
At 12/31/2018, 12/31/2017 and 01/01/2017 for balance sheet accounts and
From 01/01 to 12/31 of 2018, 2017 and 2016 for income statement accounts
(In millions of Reais, except information per share)
| d) | Change to Financial Assets |
The factors used to determine whether there was substantial change to a contract are: change to contractual cash flows and significant extensions in the operation term due to the debtor’s financial constraints, significant changes to interest rate and changes to the currency in which the operation is denominated.
| e) | Transfer of Financial Assets |
Financial assets are written off when all their risks and benefits are transferred. In this assessment, ITAÚ UNIBANCO HOLDING considers if: there is no obligation to make payments unless the due amounts are received (assets); there is no prohibition to sell these assets or pledge them as guarantee; and there is no obligation to send all proceedings received from assets without a significant delay.
| f) | Derecognition of Financial Assets |
When there are no reasonable expectations of recovery of a financial asset, considering historical curves, its total or partial derecognition is carried out concurrently with the use of the related allowance for expected credit loss, with no effect on the Consolidated Statement of Income of ITAÚ UNIBANCO HOLDING. Subsequent recoveries of amounts previously written off are accounted for as income in the Consolidated Statement of Income.
| g) | Deferred income tax and social contribution |
As explained in Note 2.4j, deferred tax assets are recognized only in relation to temporary differences and tax assets and loss for offset to the extent it is probable that ITAÚ UNIBANCO HOLDING will generate future taxable profit for its use. The expected realization of deferred tax assets is based on the projection of future taxable profits and technical studies, as disclosed in Note 24.
| h) | Fair value of financial instruments, including derivatives |
The fair value of financial instruments, including Derivatives that are not traded in active markets is calculated by using valuation techniques based on assumptions that consider market information and conditions. The main assumptions are: historical data, information on similar transactions and pricing techniques. For more complex or illiquid instruments, significant judgment is necessary to determine the model used with the selection of specific inputs and, in certain cases, evaluation adjustments are applied to the model amount our price quoted for financial instruments that are not actively traded.
The methodologies used to estimate the fair value of certain financial instruments are described in Note 28.
| i) | Defined benefit pension plan |
The current amount of pension plans is obtained from actuarial calculations, which use assumptions as discount rate, which is appropriated at the end of each year and used to determine the present value of estimated future cash outflows. To determine the appropriate discount rate, ITAÚ UNIBANCO HOLDING considers the interest rates of National Treasury Notes that have maturity terms approximating the terms of the respective liabilities.
The main assumptions on Pension plan obligations are based on, in part, current market conditions. Additional information is disclosed in Note 26.
F-19
Table of Contents
ITAÚ UNIBANCO HOLDING S.A.
Notes to the Consolidated Financial Statements
At 12/31/2018, 12/31/2017 and 01/01/2017 for balance sheet accounts and
From 01/01 to 12/31 of 2018, 2017 and 2016 for income statement accounts
(In millions of Reais, except information per share)
| j) | Provisions, contingencies and legal liabilities |
ITAÚ UNIBANCO HOLDING periodically reviews its contingencies. These contingencies are evaluated based on Management´s best estimates, taking into account the opinion of legal counsel when there is a likelihood that financial resources will be required to settle the obligations and the amounts may be reasonably estimated.
Contingencies classified as probable losses are recognized in the Balance Sheet under Provisions.
Contingent amounts are measured using appropriate models and criteria, despite the uncertainty surrounding the ultimate timing and amounts. Provisions, contingencies and other commitments are detailed in Note 29.
| k) | Technical provisions for insurance and private pension |
Technical provisions are liabilities arising from obligations of ITAÚ UNIBANCO HOLDING to its policyholders and participants. These obligations may be short term liabilities (property and casualty insurance) or medium and long term liabilities (life insurance and pension plans).
The determination of the actuarial liability is subject to several uncertainties inherent in the coverage of insurance and pension contracts, such as assumptions of persistence, mortality, disability, life expectancy, morbidity, expenses, frequency and severity of claims, conversion of benefits into annuities, redemptions and return on assets.
The estimates for these assumptions are based on the historical experience of ITAÚ UNIBANCO HOLDING, benchmarks and experience of the actuary, in order to comply with best market practices and the continuous review of the actuarial liability. The adjustments resulting from these continuous improvements, when necessary, are recognized in the statement of income for the corresponding period.
Additional information is described in Note 27.
2.4. Summary of main accounting practices
| a) | Consolidation |
| l. | Subsidiaries |
In accordance with IFRS 10 - Consolidated Financial Statements, subsidiaries are all entities in which ITAÚ UNIBANCO HOLDING holds control.
Consolidated financial statements are prepared using consistent accounting policies. lntra-Group transactions and balances are eliminated on consolidation.
From the 3rd quarter of 2018, ITAÚ UNIBANCO HOLDING started adjusting the financial statements of its subsidiaries in Argentina to reflect the effects of hyperinflation, pursuant to IAS 29 – Financial Reporting in Hyperinflationary Economies.
F-20
Table of Contents
ITAÚ UNIBANCO HOLDING S.A.
Notes to the Consolidated Financial Statements
At 12/31/2018, 12/31/2017 and 01/01/2017 for balance sheet accounts and
From 01/01 to 12/31 of 2018, 2017 and 2016 for income statement accounts
(In millions of Reais, except information per share)
The following table shows the main consolidated companies, which together represent over 95% of total consolidated assets, as well as the interests of ITAÚ UNIBANCO HOLDING in their voting capital at 12/31/2018 and 12/31/2017.
| Functional currency (1) |
Incorporation country |
Activity | Interest in voting capital at |
Interest in total capital at |
||||||||||||||||||||||||||||
| 12/31/2018 | 12/31/2017 | 12/31/2018 | 12/31/2017 | |||||||||||||||||||||||||||||
| Domestic |
||||||||||||||||||||||||||||||||
| Banco Itaú BBA S.A. |
Brazil | Financial institution | 100.00 | % | 100.00 | % | 100.00 | % | 100.00 | % | ||||||||||||||||||||||
| Banco Itaú Consignado S.A. |
Brazil | Financial institution | 100.00 | % | 100.00 | % | 100.00 | % | 100.00 | % | ||||||||||||||||||||||
| Banco Itaucard S.A. |
Brazil | Financial institution | 100.00 | % | 100.00 | % | 100.00 | % | 100.00 | % | ||||||||||||||||||||||
| Banco Itauleasing S.A. |
Brazil | Financial institution | 100.00 | % | 100.00 | % | 100.00 | % | 100.00 | % | ||||||||||||||||||||||
| Cia. Itaú de Capitalização |
Brazil | Capitalization | 100.00 | % | 100.00 | % | 100.00 | % | 100.00 | % | ||||||||||||||||||||||
| Dibens Leasing S.A. - Arrendamento Mercantil |
Brazil | Leasing | 100.00 | % | 100.00 | % | 100.00 | % | 100.00 | % | ||||||||||||||||||||||
| Financeira Itaú CBD S.A. Crédito, Financiamento e Investimento | Brazil | Consumer finance credit | 50.00 | % | 50.00 | % | 50.00 | % | 50.00 | % | ||||||||||||||||||||||
| Hipercard Banco Múltiplo S.A. |
Brazil | Financial institution | 100.00 | % | 100.00 | % | 100.00 | % | 100.00 | % | ||||||||||||||||||||||
| Itauseg Seguradora S.A. |
Brazil | Insurance | 100.00 | % | 99.99 | % | 100.00 | % | 99.99 | % | ||||||||||||||||||||||
| Itaú Corretora de Valores S.A. |
Brazil | Broker | 100.00 | % | 100.00 | % | 100.00 | % | 100.00 | % | ||||||||||||||||||||||
| Itaú Seguros S.A. |
Brazil | Insurance | 100.00 | % | 100.00 | % | 100.00 | % | 100.00 | % | ||||||||||||||||||||||
| Itaú Unibanco S.A. |
Brazil | Financial institution | 100.00 | % | 100.00 | % | 100.00 | % | 100.00 | % | ||||||||||||||||||||||
| Itaú Vida e Previdência S.A. |
Brazil | Pension plan | 100.00 | % | 100.00 | % | 100.00 | % | 100.00 | % | ||||||||||||||||||||||
| Luizacred S.A. Sociedade de Crédito, Financiamento e Investimento | Brazil | Consumer finance credit | 50.00 | % | 50.00 | % | 50.00 | % | 50.00 | % | ||||||||||||||||||||||
| Redecard S.A. |
Brazil | Acquirer | 100.00 | % | 100.00 | % | 100.00 | % | 100.00 | % | ||||||||||||||||||||||
| Foreign |
||||||||||||||||||||||||||||||||
| Itaú CorpBanca Colombia S.A. |
(Note 3 | ) | Colombian peso | Colombia | Financial institution | 25.28 | % | 23.90 | % | 25.28 | % | 23.90 | % | |||||||||||||||||||
| Banco Itaú Argentina S.A. |
Argentinian peso | Argentina | Financial institution | 100.00 | % | 100.00 | % | 100.00 | % | 100.00 | % | |||||||||||||||||||||
| Banco Itaú (Suisse) SA |
Swiss franc | Switzerland | Financial institution | 100.00 | % | 100.00 | % | 100.00 | % | 100.00 | % | |||||||||||||||||||||
| Banco Itaú Paraguay S.A. |
Guarani | Paraguay | Financial institution | 100.00 | % | 100.00 | % | 100.00 | % | 100.00 | % | |||||||||||||||||||||
| Banco Itaú Uruguay S.A. |
Uruguayan peso | Uruguay | Financial institution | 100.00 | % | 100.00 | % | 100.00 | % | 100.00 | % | |||||||||||||||||||||
| Itau Bank, Ltd. |
Real | Cayman Islands | Financial institution | 100.00 | % | 100.00 | % | 100.00 | % | 100.00 | % | |||||||||||||||||||||
| Itaú BBA Colombia S.A. Corporacion Financiera |
Colombian peso | Colombia | Financial institution | 100.00 | % | 100.00 | % | 100.00 | % | 100.00 | % | |||||||||||||||||||||
| Itau BBA International plc |
Dollar | |
United Kingdom |
|
Financial institution | 100.00 | % | 100.00 | % | 100.00 | % | 100.00 | % | |||||||||||||||||||
| Itau BBA USA Securities Inc. |
Real | United States | Broker | 100.00 | % | 100.00 | % | 100.00 | % | 100.00 | % | |||||||||||||||||||||
| Itaú CorpBanca(2) |
(Note 3 | ) | Chilean peso | Chile | Financial institution | 38.14 | % | 36.06 | % | 38.14 | % | 36.06 | % | |||||||||||||||||||
| (1) | All foreign branches and subsidiaries of ITAÚ UNIBANCO HOLDING have functional currency equal to that of the controlling entity, except for CorpBanca New York Branch, which functional currency is the dollar. |
| (2) | ITAÚ UNIBANCO HOLDING controls ITAÚ CORPBANCA due to the shareholders’ agreement. |
F-21
Table of Contents
ITAÚ UNIBANCO HOLDING S.A.
Notes to the Consolidated Financial Statements
At 12/31/2018, 12/31/2017 and 01/01/2017 for balance sheet accounts and
From 01/01 to 12/31 of 2018, 2017 and 2016 for income statement accounts
(In millions of Reais, except information per share)
| II. | Business combinations |
In general, a business consists of an integrated set of activities and assets that may be conducted and managed so as to provide a direct return, as dividends, lower costs or other economic benefits, to investors or other stockholders, members or participants. There is goodwill in a set of activities and transferred assets, it is presumed to be a business.
The acquisition method is used to account for business combinations, except for those classified as under common control.
The acquisition cost is measured at the fair value of the assets transferred, equity instruments issued and liabilities incurred or assumed at the acquisition date, plus costs directly attributable to the acquisition. Acquired assets and assumed liabilities and contingent liabilities identifiable in a business combination are initially measured at fair value at the date of acquisition, regardless of the existence of non-controlling interests. When the amount paid, plus non-controlling interests, is higher than the fair value of identifiable net assets acquired, the difference will be account for as goodwill. On the other hand, if the difference is negative, it will be addressed as bargain purchase gain and the amount will be recognized directly in income.
| III. | Goodwill |
Goodwill is not amortized, but its recoverable amount is assessed semi-annually or when there is indication an of impairment loss event, using an approach that involves the identification of cash-generating units (CGU) and estimates of fair value less cost to sell and/or value in use.
Cash-generating units or groups are identified in the lowest level in which the goodwill is monitored for internal management purposes (Note 32). Goodwill is allocated for cash flow generating units for purposes of testing the recoverable amount.
Goodwill of associates and joint ventures is reported as part of investment in the Consolidated Balance Sheet under Investments in Associates and Joint Ventures and the recoverable amount analysis is carried out in relation to the total balance of the investments (including goodwill).
| IV. | Capital Transactions with non-controlling stockholders |
IFRS 10 – Consolidated Financial Statements establishes that, changes in an ownership interest in a subsidiary, which do not result in a loss of control, are accounted for as capital transactions and any difference between the amount paid and the carrying amount of non-controlling stockholders is recognized directly in consolidated stockholders’ equity.
| b) | Foreign currency translation |
| I. | Functional and presentation currency |
The Consolidated Financial Statements of ITAÚ UNIBANCO HOLDING are presented in Brazilian Reais, which is its functional and presentation currency. For each subsidiary and investment in associates and joint ventures, ITAÚ UNIBANCO HOLDING defined the functional currency, as the currency of the primary economic environment in which the entity operates.
| II. | Foreign currency operations |
Foreign currency operations are translated into the functional currency using the exchange rates prevailing at the dates of the transactions. Foreign exchange gains and losses are recognized in the consolidated statement of income, unless they are related to cash flow hedge, when they are recognized in stockholders’ equity.
F-22
Table of Contents
ITAÚ UNIBANCO HOLDING S.A.
Notes to the Consolidated Financial Statements
At 12/31/2018, 12/31/2017 and 01/01/2017 for balance sheet accounts and
From 01/01 to 12/31 of 2018, 2017 and 2016 for income statement accounts
(In millions of Reais, except information per share)
| c) | Cash and cash equivalents |
It is defined as cash and current accounts in banks, considered in the Consolidated Balance Sheet in the heading Cash, Interbank Deposits and Securities purchased under agreements to resell that have original maturities of up to 90 days or less.
| d) | Financial assets and liabilities |
Financial assets and liabilities are initially recognized at fair value and subsequently measured at amortized cost or fair value.
| I - | Classification and Measurement of Financial Assets |
As from January 1st, 2018, ITAÚ UNIBANCO HOLDING applies IFRS 9 – Financial Instruments and classified its financial assets in the following measurement categories:
| • | Amortized Cost; |
| • | Fair Value Through Other Comprehensive Income; |
| • | Fair Value Through Profit or Loss. |
The classification and subsequent measurement of financial assets depend on:
| • | The business model under which they are measured; |
| • | The characteristics of its cash flows (Solely Payment of Principal and Interest Test – SPPI Test). |
Business model: represents how financial assets are managed to generate cash flows and does not depend on the Management’s intention regarding an individual instrument. Financial assets may be managed with the purpose of: i) obtaining contractual cash flows; ii) obtaining contractual cash flows and sale; or iii) others. To assess business models, ITAÚ UNIBANCO HOLDING considers risks that affect the performance of business model; how business managers are compensated; and how the performance of business model is assessed and reported to Management.
When the financial asset is maintained in business models i) and ii) the application of the SPPI Test is required.
SPPI Test: assessment of cash flows generated by financial instrument with the purpose of checking whether they represent solely payments of principal and interest. To fit into this concept, cash flows should include consideration for the time value of money and credit risk. If contractual terms introduce risk exposure or cash flow volatilities, such as exposure to changes in prices of equity instruments or prices of commodities, the financial asset is classified at fair value through profit or loss. Hybrid contracts should be assessed as a whole, including all embedded characteristics. The accounting of a hybrid contract that contains an embedded derivative is performed on a joint basis, i.e. the whole instrument is measured at fair value through profit or loss.
Amortized Cost
The amortized cost is the amount through which the financial asset or liability is measured at the initial recognition, plus updates performed using the effective interest method, less amortization of principal and interest, adjusted for any provision for expected credit loss.
Effective Interest Rate
The effective interest rate is the rate that discounts estimated future receipts or payments over the expected life of the financial asset or liability.
To calculate the effective interest rate, ITAÚ UNIBANCO HOLDING estimates cash flows including all contractual terms of the financial instrument, but does not include future credit losses. The calculation includes all commissions paid or received between parties to the contract, transaction costs, and all other premiums or discounts.
F-23
Table of Contents
ITAÚ UNIBANCO HOLDING S.A.
Notes to the Consolidated Financial Statements
At 12/31/2018, 12/31/2017 and 01/01/2017 for balance sheet accounts and
From 01/01 to 12/31 of 2018, 2017 and 2016 for income statement accounts
(In millions of Reais, except information per share)
The interest revenue is calculated by applying the effective interest rate to the gross carrying amount of a financial asset. In case of purchased or originated credit impaired financial assets, the adjusted effective interest rate is applied (considers the expected credit loss) at the amortized cost of the financial asset.
Fair Value
Fair value is the price that would be received for the sale of an asset or that would be paid for the transfer of a liability in a normal transaction between market players on the measurement date.
ITAÚ UNIBANCO HOLDING classifies the fair value hierarchy according to the relevance of data observed in the measurement process.
Details of the fair value of financial instruments, including Derivatives, as well as about the hierarchy of fair value are detailed in Note 28.
The average cost is used to determine the gains and losses realized on disposal of financial assets at fair value, which are recorded in the Consolidated Statement of Income as Adjustments to Fair Value of Financial Assets and Liabilities. Dividends on assets at fair value through other comprehensive income are recognized in the Consolidated Statement of Income as Dividend income when it is probable that ITAÚ UNIBANCO HOLDING’s right to receive such dividends is established.
Regular purchases and sales of financial assets are recognized and derecognized, respectively, on the trade date.
Financial assets are derecognized when rights to receive cash flows expire or when ITAÚ UNIBANCO HOLDING transfers substantially all risks and rewards of ownership, and such transfer qualifies for derecognition. Otherwise, control should be assessed to determine whether the continuous involvement related to any retained control does not prevent derecognition.
Financial assets and liabilities are offset against each other and the net amount is reported in the Balance Sheet solely when there is a legally enforceable right to offset the recognized amounts and intention to settle them on a net basis, or simultaneously realize the asset and settle the liability.
Equity Instruments
An equity instrument is any contract that evidences a residual interest in an entity’s assets, after the deduction of all its liabilities, such as Shares and Units.
ITAÚ UNIBANCO HOLDING subsequently measures all its equity instruments at fair value through profit or loss, except when Management opts, in the initial recognition, for irrevocably designating an equity instrument at fair value through other comprehensive income if it is held with a purpose other than only generating returns. When this option is selected, gains and losses on the fair value of an instrument are recognized in the Consolidated Statement of Comprehensive Income and are not subsequently reclassified to the Consolidated Statement of Income, even in the sale. Dividends continue being recognized in the Consolidated Statement of Income when ITAÚ UNIBANCO HOLDING’s right is established.
Gains and losses on equity instruments measured at fair value through profit or loss are accounted for in the Consolidated Statement of Income.
Expected Credit Loss
ITAÚ UNIBANCO HOLDING assesses on a forward-looking basis the expected credit loss associated with financial assets measured at amortized cost or through other comprehensive income, loan commitments and financial guarantee contracts:
| • | Financial assets: loss is measured at present value of the difference between contractual cash flows and cash flows that ITAÚ UNIBANCO HOLDING expects to receive; |
| • | Loan commitments: expected loss is measured at present value of the difference between contractual cash flows that would be due if the commitment was drawn down and the cash flows that ITAÚ UNIBANCO HOLDING expects to receive; |
F-24
Table of Contents
ITAÚ UNIBANCO HOLDING S.A.
Notes to the Consolidated Financial Statements
At 12/31/2018, 12/31/2017 and 01/01/2017 for balance sheet accounts and
From 01/01 to 12/31 of 2018, 2017 and 2016 for income statement accounts
(In millions of Reais, except information per share)
| • | Financial guarantees: the loss is measured at the difference between the payments expected for refunding the counterparty and the amounts that ITAÚ UNIBANCO HOLDING expects to recover. |
ITAÚ UNIBANCO HOLDING applies the three-stage approach to measure the expected credit loss, in which financial assets migrate from one stage to the other in accordance with changes in credit risk.
Macroeconomic Scenarios
Prospective information is based on macroeconomic scenarios that are reassessed annually or when market conditions so require.
Changes in Contractual Cash Flows
When contractual cash flows of a financial asset are renegotiated or otherwise modified and this does not substantially change its terms and conditions, ITAÚ UNIBANCO HOLDING does not derecognize it. However, the gross carrying amount of this financial asset is recalculated as the present value of contractual cash flows renegotiated or changed, discounted at the original effective interest rate and a modification gain or loss is recognized in profit or loss. Any costs or fees incurred adjust the modified carrying amount and are amortized over the remaining term of the financial asset.
If, on the other hand, the renegotiation or change substantially modifies the terms and conditions of the financial asset, ITAÚ UNIBANCO HOLDING derecognises the original asset and recognizes a new one. Accordingly, the renegotiation date is considered the initial recognition date of the new asset for expected credit loss calculation purposes, including to determine significant increases in credit risk.
ITAÚ UNIBANCO HOLDING also assesses if the new financial asset may be considered as purchased or originated credit impaired financial assets, particularly when the renegotiation was motivated by the debtor’s financial constraints. Differences between the carrying amount of the original asset and fair value of the new asset are immediately recognized in the Consolidated Statement of Income.
The effects of changes to cash flows of financial assets and other details about methodologies and assumptions adopted by Management to measure the allowance for expected credit loss, including the use of prospective information, are detailed in Note 32.
Transfer of Financial Assets
ITAÚ UNIBANCO HOLDING derecognizes a financial asset, or a portion of a financial asset, from its Balance sheet when it transfers substantially all the risks and rewards of ownership of the financial asset. lf ITAÚ UNIBANCO HOLDING neither transfers nor retains substantially all the risks and rewards of ownership of the financial asset, it determines whether was retained control of the financial asset.
When ITAÚ UNIBANCO HOLDING retains control, it continues to recognize the financial asset to the extent of its continuing involvement in the financial asset and consideration received is accounted for as a financial liability.
| II | - Classification and Measurement of Financial Liabilities |
Financial liabilities are initially recognized at fair value and subsequently measures at amortized cost, except for:
| • | Financial Liabilities at Fair Value Through Profit or Loss: classification applied to derivatives and other financial liabilities designated at fair value through profit or loss to reduce “accounting mismatches”. ITAÚ UNIBANCO HOLDING irrevocably designates financial liabilities at fair value through profit or loss in the initial recognition (fair value option), when the option eliminates or significantly reduces measurement or recognition inconsistencies. |
| • | Loan Commitments and Financial Guarantees, as detailed in Note 2.4d Vll. |
F-25
Table of Contents
ITAÚ UNIBANCO HOLDING S.A.
Notes to the Consolidated Financial Statements
At 12/31/2018, 12/31/2017 and 01/01/2017 for balance sheet accounts and
From 01/01 to 12/31 of 2018, 2017 and 2016 for income statement accounts
(In millions of Reais, except information per share)
Derecognition and Change of Financial Liabilities
ITAÚ UNIBANCO HOLDING derecognition a financial liability from the Consolidated Balance Sheet when it is extinguished, i.e., when the obligation specified in the contract is discharged, cancelled or expires.
A debt instrument change or substantial terms modification of a financial liability is accounted as a derecognition of the original financial liability and a new one is recognized.
A substantial change to contractual terms occurs when the present value of cash flow discount under the new terms, including any rates paid/received and discounted using the original effective interest rate, is at least 10% different from discounted present value of cash flow remaining from original financial liabilities.
| III | – Securities purchased under agreements to resell |
ITAÚ UNIBANCO HOLDING has purchased securities with resale agreement (resale agreements), and sold securities with repurchase agreement (repurchase agreement) of financial assets. Resale and repurchase agreements are accounted for under Securities purchased under agreements to resell and Securities sold under repurchase agreements, respectively.
The difference between the sale and repurchase prices is treated as interest and recognized over the life of the agreements using the effective interest rate method.
The financial assets accepted as collateral in our resale agreements can be used by us, if provided for in the agreements, as collateral for our repurchase agreements or can be sold.
| IV | - Derivatives |
All derivatives are accounted for as financial assets when the fair value is positive and as financial liabilities when the fair value is negative.
The assessment of active hybrid contracts that are in the scope of IFRS 9 is carried out as a whole, including all embedded characteristics, whereas the accounting is carried out on a joint basis, i.e. the whole instrument is measured at fair value through profit or loss.
When a contract has a host component outside the scope of IFRS 9, such as a lease agreement receivable or an insurance contract, or even a financial liability, embedded derivatives are treated as separate financial instruments if:
(i) Respective characteristics and economic risks are not closely related to those of the main component;
(ii) the separate instrument meets the definition of derivative; and
(iii) the underlying instrument is not account for at fair value through profit or loss.
These embedded derivatives are accounted for separately at fair value, with variations recognized in the Consolidated Statement of Income as Adjustments to Fair Value of Financial Assets and Liabilities.
ITAÚ UNIBANCO HOLDING will continue applying all accounting hedge requirements set forth in IAS 39; however, it may adopt the requirements of IFRS 9, according to the Management’s decision. According to this standard, derivatives may be designated and qualified as hedge instruments for accounting purposes and, depending on the nature of the hedged item, the method for recognizing gains or losses of fair value will be different.
ITAÚ UNIBANCO HOLDING documents, in the beginning of the hedge transaction, the relationship between hedge instruments and protected items, as well as its management risk purpose and strategy. Hedge is assessed on an ongoing basis and it is determined as having been highly effective throughout all periods of the Financial Statements for which it was designated.
IAS 39 presents three hedge strategies: fair value hedge, cash flow hedge, and hedge of net investments in a foreign operation. ITAÚ UNIBANCO HOLDING uses derivatives as hedging instruments under the three hedge strategies, as detailed in Note 7.
F-26
Table of Contents
ITAÚ UNIBANCO HOLDING S.A.
Notes to the Consolidated Financial Statements
At 12/31/2018, 12/31/2017 and 01/01/2017 for balance sheet accounts and
From 01/01 to 12/31 of 2018, 2017 and 2016 for income statement accounts
(In millions of Reais, except information per share)
Fair value hedge
The following practices are adopted for these operations:
| a) | The gain or loss arising from the new measurement of the hedge instrument at fair value should be recognized in income; and |
| b) | The gain or loss arising from the hedged item, attributable to the effective portion of the hedged risk, should adjust the book value of the hedged item and also be recognized in income. |
When the derivative expires or is sold or the hedge no longer meets the accounting hedge criteria or in the event the designation is revoked, the accounting hedge should be prospectively discontinued. In addition, any adjustment in the book value of the hedged item should be amortized in income.
Cash flow hedge
For derivatives that are designated and qualify as a cash flow hedge, the effective portion of derivative gains or losses are recognized in Other comprehensive income – Cash flow hedge, and reclassified to Income in the same period or periods in which the hedged transaction affects income. The portion of gain or loss on derivatives that represents the ineffective portion or the hedge components excluded from the assessment of effectiveness is recognized immediately in income. Amounts originally recorded in Other comprehensive income and subsequently reclassified to Income are recorded in the corresponding income or expense lines corresponding to the hedged item.
When the derivative expires or is sold, when the hedge no longer meets the accounting hedge criteria or when the entity revokes the designation, any cumulative gain or loss existing in Other comprehensive income should be kept recognized in stockholders’ equity until the expected transaction occurs or is no longer expected to occur, when the hedged item is ultimately recognized in the income statement. When a forecast transaction is no longer expected to occur, the cumulative gain or loss recognized in Other Comprehensive Income is immediately transferred to the statement of income.
Hedge of net investments in foreign operations
The hedge of a net investment in a foreign operation, including hedge of a monetary item that is accounted for as part of the net investment, is accounted for in a manner similar to a cash flow hedge:
| a) | The portion of gain or loss on the hedge instrument determined as effective is recognized in other comprehensive income; |
| b) | The ineffective portion is recognized in income. |
Gains or losses on the hedging instrument related to the effective portion of the hedge which is recognized in comprehensive income is reclassified to income for the period when the foreign operation is partially or totally sold.
V - Loan operations
ITAÚ UNIBANCO HOLDING classifies a loan operation as on non-accrual status if the payment of the principal or interest has been in default for 60 days or more. In this case, accrual of interest is no longer recognized.
VI - Capitalization plans
In Brazil they are regulated by the insurance regulator. These plans do not meet the definition of an insurance contract under IFRS 4, and therefore they are classified as a financial liability at amortized cost under IFRS 9.
Revenue from capitalization plans is recognized during the period of the contract and measured as the difference between the amount deposited by the client and the amount that ITAÚ UNIBANCO HOLDING has to reimburse.
F-27
Table of Contents
ITAÚ UNIBANCO HOLDING S.A.
Notes to the Consolidated Financial Statements
At 12/31/2018, 12/31/2017 and 01/01/2017 for balance sheet accounts and
From 01/01 to 12/31 of 2018, 2017 and 2016 for income statement accounts
(In millions of Reais, except information per share)
VII – Loan Commitments and Financial Guarantees
ITAÚ UNIBANCO HOLDING recognizes in the Consolidated Balance Sheet, as an obligation, on the issue date, the fair value of loan commitments and financial guarantees. The fair value is generally represented by the fee charged from the client. This amount is amortized for the instrument term and is recognized in the Consolidated Statement of Income in the heading Banking service fees.
After the issue, based on the best estimate, if ITAÚ UNIBANCO HOLDING concludes that the credit loss expected in relation to the guarantee issued is higher that the fair value less accumulated amortization, this amount is replaced by a provision for loss.
| e) | Investments in associates and joint ventures |
I – Associates
Associates are companies in which the investor has a significant influence but does not hold control. Investments in these companies are initially recognized at cost of acquisition and subsequently accounted for using the equity method. Investments in associates and joint ventures include the goodwill identified upon acquisition, net of any cumulative impairment loss.
II – Joint arrangements
ITAÚ UNIBANCO HOLDING defines a joint arrangements when it is entitled to rights and obligations for liabilities related to the business.
ITAÚ UNIBANCO HOLDING’s share in profits or losses of its associates and joint ventures after acquisition is recognized in the Consolidated statement of income. Its share of the changes in the share in OCI of corresponding stockholders’ equity of its associates and joint ventures is recognized in its own reserves of stockholders’ equity. The cumulative changes after acquisition are adjusted against the carrying amount of the investment. When the ITAÚ UNIBANCO HOLDING share of losses of an associates and joint ventures is equal or above its interest in the associates and joint ventures, including any other receivables, ITAÚ UNIBANCO HOLDING does not recognize additional losses, unless it has incurred any obligations or made payments on behalf of the associates and joint ventures.
Unrealized profits on transactions between ITAÚ UNIBANCO HOLDING and its associates and joint ventures are eliminated to the extent of the interest of ITAÚ UNIBANCO HOLDING. Unrealized losses are also eliminated, unless the transaction provides evidence of impairment of the transferred asset. The accounting policies on associates and joint ventures are consistent with the policies adopted by ITAÚ UNIBANCO HOLDING.
If the interest in the associates and joint ventures decreases, but ITAÚ UNIBANCO HOLDING retains significant influence or joint control, only the proportional amount of the previously recognized amounts in Other comprehensive income is reclassified in Income, when appropriate.
| f) | Lease commitments (as lessee) |
As a lessee, ITAÚ UNIBANCO HOLDING has finance and operating lease agreements.
ITAÚ UNIBANCO HOLDING leases certain fixed assets, and those substantially holding the risks and benefits incidental to the ownership are classified as finance leases.
Each lease installment paid is allocated part to liabilities and part to financial charges, so that a constant rate is obtained for the outstanding debt balance. Corresponding obligations, net of future financial charges, are included in Other financial liabilities. Interest expenses are recognized in the Consolidated Statement of Income over the lease term, to produce a constant periodic interest rate on the remaining liabilities balance for each period.
Expenses related to operating leases are recognized in the Consolidated statement of income, on a straight-line basis, over the period of lease.
When an operating lease is terminated before the end of the lease term, any payment to be made to the lessor as a penalty is recognized as an expense in the period the termination occurs.
F-28
Table of Contents
ITAÚ UNIBANCO HOLDING S.A.
Notes to the Consolidated Financial Statements
At 12/31/2018, 12/31/2017 and 01/01/2017 for balance sheet accounts and
From 01/01 to 12/31 of 2018, 2017 and 2016 for income statement accounts
(In millions of Reais, except information per share)
| g) | Fixed assets |
Fixed assets are recognized at cost of acquisition less accumulated depreciation, and adjusted for impairment, if applicable. Depreciation is calculated using the straight-line method and rates based on the estimated useful lives of these assets. These rates and other information are presented in Note 13.
The residual values and useful lives of assets are reviewed and adjusted, if appropriate, at the end of each period.
ITAÚ UNIBANCO HOLDING reviews its assets in order to identify whether any indications of impairment exist. The recoverable amount of an asset is defined as the higher of its fair value less costs to sell and its value in use. For purposes of assessing impairment, assets are grouped at the lowest level for which independent cash flows can be identified (cash-generating units). The assessment may be made at an individual asset level when the fair value less the cost to sell may be reliably determined.
Gains and losses on disposals of fixed assets are recognized in the Consolidated statement of income under Other income or General and administrative expenses.
| h) | Intangible assets |
Intangible assets are non-physical assets, including software and other assets, and are initially recognized at cost. Intangible assets are recognized when they arise from legal or contractual rights, their costs can be reliably measured, and in the case of intangible assets not arising from separate acquisitions or business combinations, it is probable that future economic benefits may arise from their use. The balance of intangible assets refers to acquired assets or those internally generated.
Intangible assets may have finite or indefinite useful lives. Intangible assets with finite useful lives are amortized using the straight-line method over their estimated useful lives. Intangible assets with indefinite useful lives are not amortized, but periodically tested in order to identify any impairment.
ITAÚ UNIBANCO HOLDING semi-annually assesses its intangible assets in order to identify whether any indications of impairment exist, as well as possible reversal of previous impairment losses. If such indications are found, intangible assets are tested for impairment. The recoverable amount of an asset is defined as the higher of its fair value less costs to sell and its value in use. For purposes of assessing impairment, assets are grouped at the lowest level for which independent cash flows can be identified (cash-generating units). The assessment may be made at an individual asset level when the fair value less the cost to sell may be reliably determined.
ITAÚ UNIBANCO HOLDING elected the cost model to measure its intangible assets after its initial recognition.
The breakdown of intangible assets is described in Note 14.
| i) | Assets held for sale |
Assets held for sale are recognized in the consolidated balance sheet under the line Other assets when they are actually repossessed or there is intention to sell. These assets are initially recorded at the lower of: (i) the fair value of the asset less the estimated selling expenses, or (ii) the carrying amount of the related asset held for sale.
| j) | Income tax and social contribution |
There are two components of the provision for income tax and social contribution: current and deferred.
Current income tax expense approximates taxes to be paid or recovered for the applicable period.
Deferred income tax and social contribution, represented by deferred tax assets and liabilities, are obtained based on the differences between the tax bases of assets and liabilities and the amounts reported in the financial statements at each year end.
F-29
Table of Contents
ITAÚ UNIBANCO HOLDING S.A.
Notes to the Consolidated Financial Statements
At 12/31/2018, 12/31/2017 and 01/01/2017 for balance sheet accounts and
From 01/01 to 12/31 of 2018, 2017 and 2016 for income statement accounts
(In millions of Reais, except information per share)
Income tax and social contribution expense is recognized in the Consolidated statement of income under Income tax and social contribution, except when it refers to items directly recognized in Other comprehensive income, such as: tax on fair value of financial assets measured at fair value through other comprehensive income, post-employment benefits and tax on cash flow hedges and hedge of net investment in foreign operations. Subsequently, these items are recognized in income in the realization of gain/loss of instruments.
Changes in tax legislation and rates are recognized in the Consolidated statement of income in the period in which they are enacted. Interest and fines are recognized in the Consolidated statement of income under General and administrative expenses.
To determine the proper level of provisions for taxes to be maintained for uncertain tax positions, a approach was applied, according to which a tax benefit is recognized if it is more likely than not that a position can be sustained, following assumptions of recognition, detailed item 2.4 n.
| k) | Insurance contracts and private pension |
Insurance contracts are contracts under which ITAÚ UNIBANCO HOLDING accepts a significant insurance risk of the counterparty, by agreeing to compensate it if a specified uncertain future event adversely affects it. An insurance risk is significant only if the insurance event could cause ITAÚ UNIBANCO HOLDING to pay significant additional benefits in any scenario, except for those that do not have commercial substance. Additional benefits refer to amounts that exceed those that would be payable if no insured event occurred.
At the time of the first-time adoption of IFRS, ITAÚ UNIBANCO HOLDING decided not to change its accounting policies for insurance contracts, which follow the accounting practices generally accepted in Brazil (“BRGAAP”).
Although investment agreements with discretionary participation characteristics are financial instruments, they are treated as insurance contracts, as established by IFRS 4, as well as those transferring a significant financial risk.
Once the contract is classified as an insurance contract, it remains as such until the end of its life, even if the insurance risk is significantly reduced during such period, unless all rights and obligations are extinguished or expired.
Note 27 presents a detailed description of all products classified as insurance contracts.
Private pension plans
Contracts that contemplate retirement benefits after an accumulation period (known as PGBL, VGBL and FGB) assure, at the commencement date of the contract, the basis for calculating the retirement benefit (mortality table and minimum interest). The contracts specify the annuity fees and, therefore, the contract transfers the insurance risk to the issuer at the commencement date, and they are classified as insurance contracts.
Insurance premiums
Insurance premiums are recognized by issuing an insurance policy or over the period of the contracts in proportion to the amount of the insurance coverage.
If there is evidence of impairment losses with respect to receivables for insurance premiums, ITAÚ UNIBANCO HOLDING recognizes a provision, sufficient to cover this loss, based on the risk analysis of realization of insurance premiums receivable with installments overdue for over 60 days.
F-30
Table of Contents
ITAÚ UNIBANCO HOLDING S.A.
Notes to the Consolidated Financial Statements
At 12/31/2018, 12/31/2017 and 01/01/2017 for balance sheet accounts and
From 01/01 to 12/31 of 2018, 2017 and 2016 for income statement accounts
(In millions of Reais, except information per share)
Reinsurance
In the ordinary course of business, ITAÚ UNIBANCO HOLDING reinsures a portion of the risks underwritten, particularly property and casualty risks that exceed the maximum limits of responsibility that we determine to be appropriate for each segment and product (after a study which considers size, experience, specificities, and the necessary capital to support these limits). These reinsurance agreements allow the recovery of a portion of the losses from the reinsurer, although they do not release the insurer from the main obligation as direct insurer of the risks contemplated in the reinsurance.
O ITAÚ UNIBANCO HOLDING basically holds non-proportional contracts, which transfer part of responsibility to the reinsurance company for losses that will materialize after a certain level of claims in the portfolio. Reinsurance premiums of these contracts are accounted for under Other Assets, according to contractual effectiveness.
If there is any evidence of impairment loss, ITAÚ UNIBANCO HOLDING recognizes a provision when the default period exceeds 180 days as from the credit record related to refund of claims paid.
Acquisition costs
Acquisition costs include direct and indirect costs related to the origination of insurance. These costs and recorded directly in result as incurred, expect for deferred acquisition costs (commissions paid for brokerage services, agency and prospecting efforts), which are recorded proportionally to the recognition of premium revenues, i.e. for the term corresponding to the insurance contract.
Insurance Contract Liabilities
Reserves for claims are established based on historical experience, claims in process of payment, estimated amounts of claims incurred but not yet reported, and other factors relevant to the required reserve levels.
Liability Adequacy Test
ITAÚ UNIBANCO HOLDING conducts the liability adequacy test by adopting current actuarial assumptions for future cash flows of all insurance contracts in force at the balance sheet date.
Should the analysis show insufficiency, any deficiency identified will be immediately accounted for in income for the period.
The assumptions used to conduct the liability adequacy test are detailed in Note 27.
| l) | Post-employments benefits |
ITAÚ UNIBANCO HOLDING sponsors Defined Benefit Plans and Defined Contribution Plans, accounted for in accordance with IAS 19 – Benefits to Employees.
Pension plans - Defined benefit plans
The liability or asset, as the case, is recognized in the Consolidated Balance Sheet with respect to the defined benefit plan corresponds to the present value of defined benefit obligations at the balance sheet date less the fair value of plan assets. Defined benefit obligations are calculated on a yearly basis by an independent actuarial advisor based on the projected unit credit method.
F-31
Table of Contents
ITAÚ UNIBANCO HOLDING S.A.
Notes to the Consolidated Financial Statements
At 12/31/2018, 12/31/2017 and 01/01/2017 for balance sheet accounts and
From 01/01 to 12/31 of 2018, 2017 and 2016 for income statement accounts
(In millions of Reais, except information per share)
Pension plans - defined contribution
For defined contribution plans, contributions to plans made by ITAÚ UNIBANCO HOLDING, through pension plan funds, are recognized as a liabilities as a contra entry to expense, when due. If contributions made exceed the liability for a service provided, it will be accounted for as an asset recognized at fair value, and possible remeasurements are recognized in Other Comprehensive Income, in the period they occur.
Other post-employment benefit obligations
Likewise the defined benefit pension plans, these obligations are assessed annually by independent and qualified actuaries, and costs expected from these benefits are accumulated during the employment period and gains and losses arising from adjustments of practices and changes in actuarial assumptions are recognized in Stockholders’ equity, under Other comprehensive income, in the period they occurred.
| m) | Share-based payment |
Share-based payments are accounted for in accordance with the amount of equity instruments granted, and they may be shares or stock options according to the plan, based on their fair value at the grant date. This cost is recognized during the vesting period of the right to exercise the instruments.
The total amount to be expensed is determined by reference to the fair value of equity instruments excluding the impact of any service and non-market performance vesting conditions (notably remaining an employee of the entity over a specified time period).
| n) | Provisions, contingent assets and contingent liabilities |
Contingent assets and liabilities are potential rights and obligations arising from past events for which materialization depends on uncertain future events.
Contingent assets are not recognized in the Consolidated Financial Statements, except when the Management of ITAÚ UNIBANCO HOLDING understands that realization is virtually certain, which generally corresponds to lawsuits with favorable rulings, in final and unappealable judgments, withdrawal from lawsuits as a result of a payment in settlement or as a result of an agreement to offset against an existing liability.
These contingencies are evaluated based on Management’s best estimates, and are classified as:
| • | Probable: in which liabilities are recognized in the consolidated balance sheet under Provisions; |
| • | Possible: which are disclosed in the Consolidated Financial Statements, but no provision is recorded; |
| • | Remote: which require neither a provision nor disclosure. |
The amount of court escrow deposits is adjusted in accordance with current legislation.
| o) | Capital |
Common and preferred shares, which are equivalent to common shares but without voting rights are classified in Stockholders’ equity. The additional costs directly attributable to the issue of new shares are included in Stockholders’ equity as a deduction from the proceeds, net of taxes.
F-32
Table of Contents
ITAÚ UNIBANCO HOLDING S.A.
Notes to the Consolidated Financial Statements
At 12/31/2018, 12/31/2017 and 01/01/2017 for balance sheet accounts and
From 01/01 to 12/31 of 2018, 2017 and 2016 for income statement accounts
(In millions of Reais, except information per share)
| p) | Treasury shares |
Common and preferred shares repurchased are recorded in Stockholders’ equity under Treasury shares at their average purchase price.
Shares that are subsequently sold, such as those sold to grantees under our share-based payment, are recorded as a reduction in treasury shares, measured at the average price of treasury stock held at such date.
The difference between the sale price and the average price of the treasury shares is recorded as a reduction or increase in Additional paid-in capital. The cancellation of treasury shares is recorded as a reduction in Treasury shares against Appropriated reserves, at the average price of treasury shares at the cancellation date.
| q) | Dividends and interest on capital |
Minimum dividend amounts established in the bylaws are recorded as liabilities at the end of each year. Any other amount above the mandatory minimum dividend is accounted for as a liability when approved by Meeting of the Board of Directors.
Interest on capital is treated for accounting purposes as a dividend, and it is presented as a reduction of stockholders’ equity in the consolidated financial statements.
Dividends have been and continue to be calculated and paid based on the financial statements prepared under Brazilian accounting standards and regulations for financial institutions and not based on these Consolidated financial statements prepared under IFRS.
Dividends and interest on capital are presented in Note 19.
| r) | Earnings per share |
ITAÚ UNIBANCO HOLDING grants stock-based compensation whose dilutive effect is reflected in diluted earnings per share, with the application of the “treasury stock method“. Under the treasury stock method, earnings per share are calculated as if shares under stock-based compensation plans had been issued and as if the assumed proceeds were used to purchase shares of ITAÚ UNIBANCO HOLDING.
Earnings per share are presented in Note 25.
| s) | Segment information |
Segment information is disclosed consistently with the internal report prepared for the Executive Committee, which makes the operational decisions of ITAÚ UNIBANCO HOLDING.
ITAÚ UNIBANCO HOLDING has three reportable segments: (i) Retail Banking (ii) Wholesale Banking and (iii) Activities with the Market + Corporation.
Segment information is presented in Note 30.
F-33
Table of Contents
ITAÚ UNIBANCO HOLDING S.A.
Notes to the Consolidated Financial Statements
At 12/31/2018, 12/31/2017 and 01/01/2017 for balance sheet accounts and
From 01/01 to 12/31 of 2018, 2017 and 2016 for income statement accounts
(In millions of Reais, except information per share)
| t) | Revenue from contracts with customers |
Revenue from contracts with customers is recognized when ITAÚ UNIBANCO HOLDING provides or makes the services to the clients, in an amount that reflects the consideration ITAÚ UNIBANCO HOLDING expects to collect in exchange for those services. A five-step model is applied to account for revenues: i) identification of the contract with a client; ii) identification of the performance obligations in the contract; iii) determination of the transaction price; iv) allocation of the transaction price to the performance obligations in the contract; and v) recognition of revenue when it satisfies a performance obligation.
Note 3 – Business development
Itaú CorpBanca
The ITAÚ CORPBANCA is controlled as of April 1st, 2016 by ITAÚ UNIBANCO HOLDING. On the same date, ITAU UNIBANCO HOLDING entered into a shareholders’ agreement with CORP GROUP, which sets forth, among others, the right of ITAÚ UNIBANCO HOLDING and CORP GROUP to appoint members for the Board of Directors of ITAÚ CORPBANCA in accordance to their interests in capital stock, and this group of shareholders will have the right to appoint the majority of members of the Board of Directors of ITAÚ CORPBANCA and ITAÚ UNIBANCO HOLDING will be entitled to appoint the majority of members elected by this block.
ITAÚ UNIBANCO HOLDING, through its subsidiary ITB Holding Brasil Participações Ltda., indirectly acquired the following additional interests in the capital of ITAÚ CORPBANCA:
| • | On September 14, 2017 – 1,800,000,000 shares (0.35%) for the amount of R$ 55.6, then holding 36.06%; |
| • | On October 12, 2018 – 10,651,555,020 shares (2.08%) for the amount of R$ 362.9, then holding 38.14%. |
Acquisition of minority interest in XP Investimentos S.A.
On May 11, 2017, ITAÚ UNIBANCO HOLDING, through its subsidiary ITAÚ UNIBANCO, entered into an agreement for purchase and sale of shares with XP Controle Participações S.A. (XP CONTROLE), G.A. Brasil IV Fundo de Investimento em Participações, Dyna III Fundo de Investimento em Participações, among other parties (SELLERS), for acquisition of 49.9% of total capital (of which 30.1% of common shares) of XP Investimentos S.A. (XP HOLDING), through capital contribution in the amount of R$ 600 and acquisition of shares issued by XP HOLDING held by the SELLERS in the amount of R$ 5,700, and such amounts were restated pursuant to contractual provision, totaling R$ 6,650 (FIRST ACQUISITION). A portion of this amount were withheld as a guarantee for possible future obligations of XP CONTROLE, for a 10-year period, and possible remaining balance will be paid to XP CONTROLE at the end of this term.
In addition to the FIRST ACQUISITION, the agreement sets forth only one additional acquisition in 2022, subject to future BACEN’s approval. Should it be approved, it will enable ITAÚ UNIBANCO to hold up to 62.4% of XP HOLDING’s total capital (equivalent to 40.0% of common shares) based on a multiple of result (19 times) of XP HOLDING, therefore being clear that the control over XP Group will remain unchanged, with XP CONTROLE’s shareholders. ITAÚ UNIBANCO will act as minority partner.
Effective acquisitions and financial settlements occurred on August 31, 2018, after the satisfaction of certain contractual conditions and obtainment of regulatory and government authorizations required.
F-34
Table of Contents
ITAÚ UNIBANCO HOLDING S.A.
Notes to the Consolidated Financial Statements
At 12/31/2018, 12/31/2017 and 01/01/2017 for balance sheet accounts and
From 01/01 to 12/31 of 2018, 2017 and 2016 for income statement accounts
(In millions of Reais, except information per share)
Citibank’s Retail Operations
On October 08, 2016, ITAÚ UNIBANCO HOLDING entered, by means of its subsidiaries Itaú Unibanco S.A. (ITAÚ UNIBANCO) and Itaú Corretora de Valores S.A., into a share purchase and sale agreement with Banco Citibank S.A. and with other companies of its conglomerate (CITIBANK) for the acquisition of the retail banking activities carried out by Citibank in Brazil, including loans, deposits, credit cards, branches, assets under management and insurance brokerage, as well as the equity investments held by CITIBANK in TECBAN – Tecnologia Bancária S.A. (representing 5.64% of its capital) and in CIBRASEC – Companhia Brasileira de Securitização (representing 3.60% of its capital), for R$ 628.
The operation was structured in three phases:
| i. | Acquisition of retail operations, cards and insurance brokerage on October 31, 2017; |
| ii. | Acquisition of securities brokerage on December 1st, 2017; |
| iii. | Acquisition of ownership interest in TECBAN and CIBRASEC on December 26, 2017. |
The difference between the amount paid and net assets acquired resulted in the recognition of goodwill due to expected future profitability on the acquisition date of R$ 631.
Gestora de Inteligência de Crédito
On January 21, 2016, o ITAÚ UNIBANCO HOLDING, through its subsidiary ITAÚ UNIBANCO, executing a non-binding Memorandum of Understanding with Banco Bradesco S.A., Banco do Brasil S.A., Banco Santander S.A. and Caixa Econômica Federal, aiming at the creation of a credit intelligence bureau that will develop a databank with the purpose of aggregating, reconciling and addressing master file and credit data of individuals and legal entities.
Gestora de Inteligência de Crédito S.A., located in the city of São Paulo, was organized as a corporation, and each of its shareholders will have a 20% interest in its capital.
After compliance with conditions precedent and approval by proper regulatory authorities, the operation was closed on June 14, 2017. Ownership interest acquired will be assessed under the Equity Method.
Note 4 - Interbank deposits and securities purchased under agreements to resell
| 12/31/2018 | 12/31/2017 | |||||||||||||||||||||||
| Current | Non-current | Total | Current | Non-current | Total | |||||||||||||||||||
| Securities purchased under agreements to resell |
280,029 | 103 | 280,132 | 244,503 | 196 | 244,699 | ||||||||||||||||||
| Collateral held (1) |
63,392 | 93 | 63,485 | 59,207 | 196 | 59,403 | ||||||||||||||||||
| Collateral repledge |
170,500 | 10 | 170,510 | 147,749 | — | 147,749 | ||||||||||||||||||
| Assets received as collateral with right to sell or repledge |
28,369 | 0 | 28,369 | 55,004 | — | 55,004 | ||||||||||||||||||
| Assets received as collateral without right to sell or repledge |
142,131 | 10 | 142,141 | 92,745 | — | 92,745 | ||||||||||||||||||
| Collateral sold |
46,137 | 0 | 46,137 | 37,547 | — | 37,547 | ||||||||||||||||||
| Interbank deposits |
25,726 | 688 | 26,414 | 28,034 | 1,014 | 29,048 | ||||||||||||||||||
|
|
|
|
|
|
|
|
|
|
|
|
|
|||||||||||||
| Total (2) |
305,755 | 791 | 306,546 | 272,537 | 1,210 | 273,747 | ||||||||||||||||||
|
|
|
|
|
|
|
|
|
|
|
|
|
|||||||||||||
| (1) | The amounts of R$ 5,120 (R$ 3,664 at 12/31/2017) are pledged in guarantee of operations on B3 S.A. - Brasil, Bolsa, Balcão (B3) and Central Bank and the amounts of R$ 216,647 (R$ 185,296 at 12/31/2017) are pledged in guarantee of repurchase agreement transactions. |
| (2) | Includes losses in amounts R$ (10) (R$ (8) at 12/31/2017). |
F-35
Table of Contents
ITAÚ UNIBANCO HOLDING S.A.
Notes to the Consolidated Financial Statements
At 12/31/2018, 12/31/2017 and 01/01/2017 for balance sheet accounts and
From 01/01 to 12/31 of 2018, 2017 and 2016 for income statement accounts
(In millions of Reais, except information per share)
Note 5 – Financial assets at fair value through profit or loss and designated at fair value through profit or loss - Securities
a) Financial assets at fair value through profit or loss are presented in the following table:
| 12/31/2018 | 12/31/2017 | |||||||||||||||||||||||
| Gross carrying amount |
Adjustments to Fair Value (in Income) |
Fair value | Gross carrying amount |
Adjustments to Fair Value (in Income) |
Fair value | |||||||||||||||||||
| Investment funds |
5,253 | (927 | ) | 4,326 | 4,135 | (622 | ) | 3,513 | ||||||||||||||||
| Brazilian government securities (1a) |
215,956 | 1,102 | 217,058 | 207,418 | 426 | 207,844 | ||||||||||||||||||
| Government securities – abroad (1b) |
2,070 | 9 | 2,079 | 3,917 | 32 | 3,949 | ||||||||||||||||||
| Argentina |
1,121 | 8 | 1,129 | 1,446 | 20 | 1,466 | ||||||||||||||||||
| Chile |
301 | 1 | 302 | 57 | — | 57 | ||||||||||||||||||
| Colombia |
207 | 0 | 207 | 2,080 | 12 | 2,092 | ||||||||||||||||||
| United States |
117 | 0 | 117 | 100 | — | 100 | ||||||||||||||||||
| Mexico |
120 | 0 | 120 | 5 | — | 5 | ||||||||||||||||||
| Paraguay |
1 | 0 | 1 | 3 | — | 3 | ||||||||||||||||||
| Uruguay |
84 | 0 | 84 | 193 | — | 193 | ||||||||||||||||||
| Italy |
115 | 0 | 115 | — | — | — | ||||||||||||||||||
| Other |
4 | 0 | 4 | 33 | — | 33 | ||||||||||||||||||
| Corporate securities (1c) |
38,953 | (505 | ) | 38,448 | 33,816 | (175 | ) | 33,641 | ||||||||||||||||
| Shares |
9,778 | (332 | ) | 9,446 | 6,080 | (121 | ) | 5,959 | ||||||||||||||||
| Bank deposit certificates |
969 | 0 | 969 | 335 | — | 335 | ||||||||||||||||||
| Securitized real estate loans |
1,391 | 20 | 1,411 | 1,779 | 16 | 1,795 | ||||||||||||||||||
| Debentures |
5,147 | (187 | ) | 4,960 | 3,290 | (74 | ) | 3,216 | ||||||||||||||||
| Eurobonds and other |
1,403 | (7 | ) | 1,396 | 684 | 4 | 688 | |||||||||||||||||
| Financial credit bills |
19,724 | 0 | 19,724 | 21,170 | — | 21,170 | ||||||||||||||||||
| Promissory notes |
435 | 0 | 435 | 391 | — | 391 | ||||||||||||||||||
| Other |
106 | 1 | 107 | 87 | — | 87 | ||||||||||||||||||
|
|
|
|
|
|
|
|
|
|
|
|
|
|||||||||||||
| Total |
262,232 | (321 | ) | 261,911 | 249,286 | (339 | ) | 248,947 | ||||||||||||||||
|
|
|
|
|
|
|
|
|
|
|
|
|
|||||||||||||
| 1) | Financial assets at fair value through profit or loss – Securities pledged as Guarantee of Funding of Financial Institutions and Clients were: a) R$ 30,114 (R$ 30,325 at 12/31/2017), b) R$ 131 (R$ 46 at 12/31/2017) and c) (R$ 28 at 12/31/2017), totaling R$ 30,245 (R$ 30,399 at 12/31/2017). |
The cost and fair value of Financial Assets at Fair Value Through Profit or Loss are as follows:
| 12/31/2018 | 12/31/2017 | |||||||||||||||
| Gross carrying amount |
Fair value | Gross carrying amount |
Fair value | |||||||||||||
| Current |
53,382 | 52,096 | 50,174 | 49,512 | ||||||||||||
| Non-stated maturity |
15,031 | 13,772 | 10,214 | 9,469 | ||||||||||||
| Up to one year |
38,351 | 38,324 | 39,960 | 40,043 | ||||||||||||
| Non-current |
208,850 | 209,815 | 199,112 | 199,435 | ||||||||||||
| From one to five years |
153,256 | 153,701 | 147,700 | 147,805 | ||||||||||||
| From five to ten years |
44,258 | 44,620 | 41,279 | 41,499 | ||||||||||||
| After ten years |
11,336 | 11,494 | 10,133 | 10,131 | ||||||||||||
|
|
|
|
|
|
|
|
|
|||||||||
| Total |
262,232 | 261,911 | 249,286 | 248,947 | ||||||||||||
|
|
|
|
|
|
|
|
|
|||||||||
Financial Assets at Fair Value Through Profit or Loss include assets with a fair value of R$ 188,069 (R$ 169,178 at 12/31/2017) that belong to investment funds wholly owned by Itaú Vida e Previdência S.A. The return of those assets (positive or negative) is fully transferred to customers of our PGBL and VGBL private pension plans whose premiums (less fees charged by us) are used by our subsidiary to purchase quotas of those investment funds.
F-36
Table of Contents
ITAÚ UNIBANCO HOLDING S.A.
Notes to the Consolidated Financial Statements
At 12/31/2018, 12/31/2017 and 01/01/2017 for balance sheet accounts and
From 01/01 to 12/31 of 2018, 2017 and 2016 for income statement accounts
(In millions of Reais, except information per share)
b) Financial assets designated at fair value through profit or loss are presented in the following table:
| 12/31/2018 | ||||||||||||
| Gross carrying amount |
Adjustments to Fair Value (in Income) |
Fair value | ||||||||||
| Brazilian external debt bonds |
1,232 | 37 | 1,269 | |||||||||
|
|
|
|
|
|
|
|||||||
| Total |
1,232 | 37 | 1,269 | |||||||||
|
|
|
|
|
|
|
|||||||
| 12/31/2017 | ||||||||||||
| Gross carrying amount |
Adjustments to Fair Value (in Income) |
Fair value | ||||||||||
| Brazilian external debt bonds |
1,670 | 76 | 1,746 | |||||||||
|
|
|
|
|
|
|
|||||||
| Total |
1,670 | 76 | 1,746 | |||||||||
|
|
|
|
|
|
|
|||||||
The cost and fair value by maturity of financial assets designated as fair value through profit or loss were as follows:
| 12/31/2018 | 12/31/2017 | |||||||||||||||
| Gross carrying amount |
Fair value | Gross carrying amount |
Fair value | |||||||||||||
| Current |
765 | 799 | 1,006 | 1,041 | ||||||||||||
| Up to one year |
765 | 799 | 1,006 | 1,041 | ||||||||||||
|
|
|
|
|
|
|
|
|
|||||||||
| Non-current |
467 | 470 | 664 | 705 | ||||||||||||
| From one to five years |
467 | 470 | 664 | 705 | ||||||||||||
Note 6 – Derivatives
ITAÚ UNIBANCO HOLDING enters into derivative financial instruments with various counterparties to manage its overall exposures and to assist its customers in managing their own exposures.
Futures – Interest rate and foreign currency futures contracts are commitments to buy or sell a financial instrument at a future date, at a contracted price or yield and may be settled in cash or through delivery. The notional amount represents the face value of the underlying instrument. Commodity futures contracts or financial instruments are commitments to buy or sell commodities (mainly gold, coffee and orange juice), at a future date, at a contracted price, which are settled in cash. The notional amount represents the quantity of such commodities multiplied by the future price at the contract date. Daily cash settlements of price movements are made for all instruments.
Forwards – Interest forward contracts are agreements to exchange payments on a specified future date, based on a market change in interest rates from trade date to contract settlement date. Foreign exchange forward contracts represent agreements to exchange the currency of one country for the currency of another country at an agreed price, at an agreed settlement date. Financial instrument forward contracts are commitments to buy or sell a financial instrument on a future date at a contracted price and are settled in cash.
Swaps – Interest rate and foreign exchange swap contracts are commitments to settle in cash at a future date or dates, based on differentials between specified financial indices (either two different interest rates in a single currency or two different rates each in a different currency), as applied to a notional principal amount. Swap contracts presented in Other in the table below correspond substantially to inflation rate swap contracts.
Options – Option contracts give the purchaser, for a fee, the right, but not the obligation, to buy or sell within a limited time a financial instrument including a flow of interest, foreign currencies, commodities, or financial instruments at a contracted price that may also be settled in cash, based on differentials between specific indices.
F-37
Table of Contents
ITAÚ UNIBANCO HOLDING S.A.
Notes to the Consolidated Financial Statements
At 12/31/2018, 12/31/2017 and 01/01/2017 for balance sheet accounts and
From 01/01 to 12/31 of 2018, 2017 and 2016 for income statement accounts
(In millions of Reais, except information per share)
Credit Derivatives – Credit derivatives are financial instruments with value relating to the credit risk associated to the debt issued by a third party (the reference entity), which permits that one party (the purchaser of the hedge) transfers the risk to the counterparty (the seller of the hedge). The seller of the hedge should make payments as set forth in the contract when the reference entity undergoes a credit event, such as bankruptcy, default or debt restructuring. The seller of the hedge receives a premium for the hedge, but, on the other hand, assumes the risk that the underlying asset referenced in the contract undergoes a credit event, and the seller would have to make the payment to the purchaser of the hedge, which could be the notional amount of the credit derivative.
The total value of margins pledged in guarantee by ITAÚ UNIBANCO HOLDING was R$ 12,855 (R$ 18,284 at 12/31/2017) and was basically comprised of government securities.
I - Derivatives Summary
See below the composition of the Derivative financial instruments portfolio (assets and liabilities) by type of instrument, stated fair value, and by maturity.
| 12/31/2018 | ||||||||||||||||||||||||||||||||
| Fair value | % | 0-30 days |
31-90 days |
91-180 days |
181-365 days |
366-720 days |
Over 720 days |
|||||||||||||||||||||||||
| Assets |
||||||||||||||||||||||||||||||||
| Swaps – difference receivable |
13,049 | 55.6 | 705 | 187 | 245 | 700 | 2,881 | 8,331 | ||||||||||||||||||||||||
| Option premiums |
4,215 | 18.0 | 1,167 | 408 | 610 | 872 | 975 | 183 | ||||||||||||||||||||||||
| Forwards (onshore) |
1,835 | 7.8 | 893 | 716 | 145 | 81 | 0 | 0 | ||||||||||||||||||||||||
| Credit derivatives - financial Institutions |
120 | 0.5 | 0 | 0 | 1 | 5 | 9 | 105 | ||||||||||||||||||||||||
| NDF - Non Deliverable Forward |
3,711 | 15.8 | 1,013 | 968 | 772 | 653 | 178 | 127 | ||||||||||||||||||||||||
| Check of swap - Companies |
44 | 0.2 | 0 | 0 | 7 | 0 | 13 | 24 | ||||||||||||||||||||||||
| Other |
492 | 2.1 | 209 | 10 | 2 | 2 | 13 | 256 | ||||||||||||||||||||||||
|
|
|
|
|
|
|
|
|
|
|
|
|
|
|
|
|
|||||||||||||||||
| Total |
23,466 | 100.0 | 3,987 | 2,289 | 1,782 | 2,313 | 4,069 | 9,026 | ||||||||||||||||||||||||
|
|
|
|
|
|
|
|
|
|
|
|
|
|
|
|
|
|||||||||||||||||
| % per maturity term |
17.0 | 9.8 | 7.6 | 9.9 | 17.3 | 38.4 | ||||||||||||||||||||||||||
| 12/31/2018 | ||||||||||||||||||||||||||||||||
| Fair value | % | 0-30 days |
31-90 days |
91-180 days |
181-365 days |
366-720 days |
Over 720 days |
|||||||||||||||||||||||||
| Liabilities |
||||||||||||||||||||||||||||||||
| Swaps – difference payable |
(19,354 | ) | 70.3 | (923 | ) | (979 | ) | (606 | ) | (1,417 | ) | (4,687 | ) | (10,742 | ) | |||||||||||||||||
| Option premiums |
(3,929 | ) | 14.3 | (883 | ) | (500 | ) | (604 | ) | (831 | ) | (823 | ) | (288 | ) | |||||||||||||||||
| Forwards (onshore) |
(470 | ) | 1.7 | (470 | ) | 0 | 0 | 0 | 0 | 0 | ||||||||||||||||||||||
| Credit derivatives - financial Institutions |
(140 | ) | 0.5 | 0 | 0 | 0 | (2 | ) | (4 | ) | (134 | ) | ||||||||||||||||||||
| NDF - Non Deliverable Forward |
(3,384 | ) | 12.3 | (890 | ) | (772 | ) | (583 | ) | (552 | ) | (150 | ) | (437 | ) | |||||||||||||||||
| Check of swap - Companies |
(162 | ) | 0.6 | 0 | 0 | (16 | ) | 0 | 0 | (146 | ) | |||||||||||||||||||||
| Other |
(80 | ) | 0.3 | (2 | ) | (2 | ) | (8 | ) | (13 | ) | (8 | ) | (47 | ) | |||||||||||||||||
|
|
|
|
|
|
|
|
|
|
|
|
|
|
|
|
|
|||||||||||||||||
| Total |
(27,519 | ) | 100.0 | (3,168 | ) | (2,253 | ) | (1,817 | ) | (2,815 | ) | (5,672 | ) | (11,794 | ) | |||||||||||||||||
|
|
|
|
|
|
|
|
|
|
|
|
|
|
|
|
|
|||||||||||||||||
| % per maturity term |
11.5 | 8.2 | 6.6 | 10.2 | 20.6 | 42.9 | ||||||||||||||||||||||||||
F-38
Table of Contents
ITAÚ UNIBANCO HOLDING S.A.
Notes to the Consolidated Financial Statements
At 12/31/2018, 12/31/2017 and 01/01/2017 for balance sheet accounts and
From 01/01 to 12/31 of 2018, 2017 and 2016 for income statement accounts
(In millions of Reais, except information per share)
See below the composition of the Derivative financial instruments portfolio (assets and liabilities) by type of instrument, stated fair value, and by maturity.
| 12/31/2017 | ||||||||||||||||||||||||||||||||
| Fair value | % | 0-30 days |
31-90 days |
91-180 days |
181-365 days |
366-720 days |
Over 720 days |
|||||||||||||||||||||||||
| Assets |
||||||||||||||||||||||||||||||||
| Futures contracts |
158 | 0.7 | 153 | 11 | (2 | ) | (3 | ) | 38 | (39 | ) | |||||||||||||||||||||
| Swaps – difference receivable |
9,190 | 40.2 | 189 | 187 | 327 | 744 | 1,661 | 6,082 | ||||||||||||||||||||||||
| Option premiums |
3,337 | 14.6 | 430 | 440 | 353 | 955 | 865 | 294 | ||||||||||||||||||||||||
| Forwards (onshore) |
6,911 | 30.3 | 6,529 | 293 | 46 | 43 | — | — | ||||||||||||||||||||||||
| Credit derivatives - financial Institutions |
137 | 0.6 | — | — | 1 | 8 | 21 | 107 | ||||||||||||||||||||||||
| NDF - Non Deliverable Forward |
2,950 | 12.9 | 677 | 717 | 624 | 610 | 166 | 156 | ||||||||||||||||||||||||
| Check of swap - Companies |
68 | 0.3 | — | — | 6 | — | — | 62 | ||||||||||||||||||||||||
| Other |
92 | 0.4 | — | — | — | 3 | 5 | 84 | ||||||||||||||||||||||||
|
|
|
|
|
|
|
|
|
|
|
|
|
|
|
|
|
|||||||||||||||||
| Total |
22,843 | 100.0 | 7,978 | 1,648 | 1,355 | 2,360 | 2,756 | 6,746 | ||||||||||||||||||||||||
|
|
|
|
|
|
|
|
|
|
|
|
|
|
|
|
|
|||||||||||||||||
| % per maturity term |
34.9 | 7.2 | 5.9 | 10.3 | 12.1 | 29.6 | ||||||||||||||||||||||||||
| 12/31/2017 | ||||||||||||||||||||||||||||||||
| Fair value | % | 0-30 days |
31-90 days |
91-180 days |
181-365 days |
366-720 days |
Over 720 days |
|||||||||||||||||||||||||
| Liabilities |
||||||||||||||||||||||||||||||||
| Swaps – difference receivable |
(13,692 | ) | 51.2 | (65 | ) | (202 | ) | (451 | ) | (1,711 | ) | (3,747 | ) | (7,516 | ) | |||||||||||||||||
| Option premiums |
(2,793 | ) | 10.4 | (332 | ) | (174 | ) | (304 | ) | (821 | ) | (889 | ) | (273 | ) | |||||||||||||||||
| Forwards (onshore) |
(6,272 | ) | 23.5 | (6,272 | ) | — | — | — | — | — | ||||||||||||||||||||||
| Credit derivatives - financial Institutions |
(58 | ) | 0.2 | — | — | (1 | ) | (2 | ) | (7 | ) | (48 | ) | |||||||||||||||||||
| NDF - Non Deliverable Forward |
(3,745 | ) | 14.0 | (927 | ) | (735 | ) | (547 | ) | (785 | ) | (225 | ) | (526 | ) | |||||||||||||||||
| Check of swap - Companies |
(122 | ) | 0.5 | — | — | (73 | ) | — | — | (49 | ) | |||||||||||||||||||||
| Other |
(64 | ) | 0.2 | — | (2 | ) | (2 | ) | (6 | ) | (9 | ) | (45 | ) | ||||||||||||||||||
|
|
|
|
|
|
|
|
|
|
|
|
|
|
|
|
|
|||||||||||||||||
| Total |
(26,746 | ) | 100.0 | (7,596 | ) | (1,113 | ) | (1,378 | ) | (3,325 | ) | (4,877 | ) | (8,457 | ) | |||||||||||||||||
|
|
|
|
|
|
|
|
|
|
|
|
|
|
|
|
|
|||||||||||||||||
| % per maturity term |
28.4 | 4.2 | 5.2 | 12.4 | 18.2 | 31.6 | ||||||||||||||||||||||||||
F-39
Table of Contents
ITAÚ UNIBANCO HOLDING S.A.
Notes to the Consolidated Financial Statements
At 12/31/2018, 12/31/2017 and 01/01/2017 for balance sheet accounts and
From 01/01 to 12/31 of 2018, 2017 and 2016 for income statement accounts
(In millions of Reais, except information per share)
II - Derivatives by index and Risk Fator
The following table shows the composition of derivatives by index:
| Off-balance sheet notional amount |
Balance sheet account receivable / (received) (payable) / paid |
Adjustment to market value (in results / stockholders’ equity) |
Fair value | |||||||||||||||||
| 12/31/2018 | 12/31/2018 | 12/31/2018 | 12/31/2018 | |||||||||||||||||
| Futures contracts |
586,033 | 0 | 0 | 0 | ||||||||||||||||
| Purchase commitments |
268,228 | 0 | 0 | 0 | ||||||||||||||||
| Shares |
13,675 | 0 | 0 | 0 | ||||||||||||||||
| Commodities |
194 | 0 | 0 | 0 | ||||||||||||||||
| Interest |
243,369 | 0 | 0 | 0 | ||||||||||||||||
| Foreign currency |
10,990 | 0 | 0 | 0 | ||||||||||||||||
| Commitments to sell |
317,805 | 0 | 0 | 0 | ||||||||||||||||
| Shares |
13,965 | 0 | 0 | 0 | ||||||||||||||||
| Commodities |
155 | 0 | 0 | 0 | ||||||||||||||||
| Interest |
265,218 | 0 | 0 | 0 | ||||||||||||||||
| Foreign currency |
38,467 | 0 | 0 | 0 | ||||||||||||||||
| Swap contracts |
0 | (5,188 | ) | (1,117 | ) | (6,305 | ) | |||||||||||||
| Asset position |
939,510 | 6,263 | 6,786 | 13,049 | ||||||||||||||||
| Commodities |
6 | 0 | 0 | 0 | ||||||||||||||||
| Interest |
925,381 | 5,124 | 6,380 | 11,504 | ||||||||||||||||
| Foreign currency |
14,123 | 1,139 | 406 | 1,545 | ||||||||||||||||
| Liability position |
939,510 | (11,451 | ) | (7,903 | ) | (19,354 | ) | |||||||||||||
| Shares |
76 | (5 | ) | 2 | (3 | ) | ||||||||||||||
| Commodities |
620 | 0 | (1 | ) | (1 | ) | ||||||||||||||
| Interest |
913,745 | (9,410 | ) | (7,973 | ) | (17,383 | ) | |||||||||||||
| Foreign currency |
25,069 | (2,036 | ) | 69 | (1,967 | ) | ||||||||||||||
| Option contracts |
1,262,568 | 324 | (38 | ) | 286 | |||||||||||||||
| Purchase commitments – long position |
151,179 | 1,935 | (108 | ) | 1,827 | |||||||||||||||
| Shares |
8,211 | 289 | 100 | 389 | ||||||||||||||||
| Commodities |
321 | 10 | (3 | ) | 7 | |||||||||||||||
| Interest |
100,338 | 183 | (98 | ) | 85 | |||||||||||||||
| Foreign currency |
42,309 | 1,453 | (107 | ) | 1,346 | |||||||||||||||
| Commitments to sell – long position |
495,464 | 1,808 | 580 | 2,388 | ||||||||||||||||
| Shares |
10,802 | 394 | 500 | 894 | ||||||||||||||||
| Commodities |
278 | 11 | 1 | 12 | ||||||||||||||||
| Interest |
441,673 | 427 | 460 | 887 | ||||||||||||||||
| Foreign currency |
42,711 | 976 | (381 | ) | 595 | |||||||||||||||
| Purchase commitments – short position |
116,005 | (1,564 | ) | 153 | (1,411 | ) | ||||||||||||||
| Shares |
9,716 | (184 | ) | (98 | ) | (282 | ) | |||||||||||||
| Commodities |
317 | (9 | ) | 6 | (3 | ) | ||||||||||||||
| Interest |
69,934 | (147 | ) | 95 | (52 | ) | ||||||||||||||
| Foreign currency |
36,038 | (1,224 | ) | 150 | (1,074 | ) | ||||||||||||||
| Commitments to sell – short position |
499,920 | (1,855 | ) | (663 | ) | (2,518 | ) | |||||||||||||
| Shares |
8,898 | (246 | ) | (503 | ) | (749 | ) | |||||||||||||
| Commodities |
192 | (6 | ) | (2 | ) | (8 | ) | |||||||||||||
| Interest |
448,029 | (528 | ) | (497 | ) | (1,025 | ) | |||||||||||||
| Foreign currency |
42,801 | (1,075 | ) | 339 | (736 | ) | ||||||||||||||
F-40
Table of Contents
ITAÚ UNIBANCO HOLDING S.A.
Notes to the Consolidated Financial Statements
At 12/31/2018, 12/31/2017 and 01/01/2017 for balance sheet accounts and
From 01/01 to 12/31 of 2018, 2017 and 2016 for income statement accounts
(In millions of Reais, except information per share)
| Off-balance sheet notional amount |
Balance sheet account receivable / (received) (payable) / paid |
Adjustment to market value (in results / stockholders’ equity) |
Fair value | |||||||||||||||||
| 12/31/2018 | 12/31/2018 | 12/31/2018 | 12/31/2018 | |||||||||||||||||
| Forward operations (onshore) |
2,341 | 1,363 | 2 | 1,365 | ||||||||||||||||
| Purchases receivable |
415 | 496 | 0 | 496 | ||||||||||||||||
| Shares |
36 | 36 | 0 | 36 | ||||||||||||||||
| Interest |
379 | 460 | 0 | 460 | ||||||||||||||||
| Purchases payable |
0 | (381 | ) | 0 | (381 | ) | ||||||||||||||
| Shares |
0 | (2 | ) | 0 | (2 | ) | ||||||||||||||
| Interest |
0 | (379 | ) | 0 | (379 | ) | ||||||||||||||
| Sales receivable |
1,307 | 1,337 | 2 | 1,339 | ||||||||||||||||
| Shares |
1,307 | 1,292 | 2 | 1,294 | ||||||||||||||||
| Interest |
0 | 45 | 0 | 45 | ||||||||||||||||
| Sales deliverable |
619 | (89 | ) | 0 | (89 | ) | ||||||||||||||
| Shares |
2 | (2 | ) | 0 | (2 | ) | ||||||||||||||
| Interest |
45 | (87 | ) | 0 | (87 | ) | ||||||||||||||
| Foreign currency |
572 | 0 | 0 | 0 | ||||||||||||||||
| Credit derivatives |
|
8,324 | (243 | ) | 223 | (20 | ) | |||||||||||||
| Asset position |
3,825 | (87 | ) | 207 | 120 | |||||||||||||||
| Shares |
1,576 | (44 | ) | 136 | 92 | |||||||||||||||
| Interest |
2,249 | (43 | ) | 71 | 28 | |||||||||||||||
| Liability position |
4,499 | (156 | ) | 16 | (140 | ) | ||||||||||||||
| Shares |
1,316 | (55 | ) | (14 | ) | (69 | ) | |||||||||||||
| Interest |
3,183 | (101 | ) | 30 | (71 | ) | ||||||||||||||
| NDF - Non Deliverable Forward |
|
225,355 | 99 | 228 | 327 | |||||||||||||||
| Asset position |
122,495 | 3,378 | 333 | 3,711 | ||||||||||||||||
| Commodities |
167 | 16 | 1 | 17 | ||||||||||||||||
| Foreign currency |
122,328 | 3,362 | 332 | 3,694 | ||||||||||||||||
| Liability position |
102,860 | (3,279 | ) | (105 | ) | (3,384 | ) | |||||||||||||
| Commodities |
96 | (6 | ) | 1 | (5 | ) | ||||||||||||||
| Foreign currency |
102,764 | (3,273 | ) | (106 | ) | (3,379 | ) | |||||||||||||
| Check of swap |
1,334 | (71 | ) | (47 | ) | (118 | ) | |||||||||||||
| Asset position |
115 | 7 | 37 | 44 | ||||||||||||||||
| Interest |
115 | 2 | 21 | 23 | ||||||||||||||||
| Foreign currency |
0 | 5 | 16 | 21 | ||||||||||||||||
| Liability position |
1,219 | (78 | ) | (84 | ) | (162 | ) | |||||||||||||
| Interest |
1,219 | (17 | ) | (6 | ) | (23 | ) | |||||||||||||
| Foreign currency |
0 | (61 | ) | (78 | ) | (139 | ) | |||||||||||||
| Other derivative financial instruments |
5,304 | 198 | 214 | 412 | ||||||||||||||||
| Asset position |
4,296 | 205 | 287 | 492 | ||||||||||||||||
| Shares |
217 | (8 | ) | 10 | 2 | |||||||||||||||
| Interest |
4,074 | 213 | 65 | 278 | ||||||||||||||||
| Foreign currency |
5 | 0 | 212 | 212 | ||||||||||||||||
| Liability position |
1,008 | (7 | ) | (73 | ) | (80 | ) | |||||||||||||
| Shares |
842 | (4 | ) | (42 | ) | (46 | ) | |||||||||||||
| Interest |
158 | (2 | ) | (21 | ) | (23 | ) | |||||||||||||
| Foreign currency |
8 | (1 | ) | (10 | ) | (11 | ) | |||||||||||||
| Asset | 15,342 | 8,124 | 23,466 | |||||||||||||||||
| Liability | (18,860 | ) | (8,659 | ) | (27,519 | ) | ||||||||||||||
|
|
|
|
|
|
|
|||||||||||||||
| Total | (3,518 | ) | (535 | ) | (4,053 | ) | ||||||||||||||
|
|
|
|
|
|
|
|||||||||||||||
F-41
Table of Contents
ITAÚ UNIBANCO HOLDING S.A.
Notes to the Consolidated Financial Statements
At 12/31/2018, 12/31/2017 and 01/01/2017 for balance sheet accounts and
From 01/01 to 12/31 of 2018, 2017 and 2016 for income statement accounts
(In millions of Reais, except information per share)
| Derivative contracts mature as follows (in days): |
| |||||||||||||||||||
| Off-balance sheet – notional amount |
0 - 30 | 31 - 180 | 181 - 365 | Over 365 | 12/31/2018 | |||||||||||||||
| Futures contracts |
217,836 | 193,637 | 33,969 | 140,591 | 586,033 | |||||||||||||||
| Swaps contracts |
70,403 | 96,913 | 96,090 | 676,104 | 939,510 | |||||||||||||||
| Options |
595,515 | 131,147 | 329,834 | 206,072 | 1,262,568 | |||||||||||||||
| Forwards (onshore) |
1,412 | 844 | 85 | — | 2,341 | |||||||||||||||
| Credit derivatives |
— | 1,188 | 680 | 6,456 | 8,324 | |||||||||||||||
| NDF - Non Deliverable Forward |
76,032 | 102,024 | 30,212 | 17,087 | 225,355 | |||||||||||||||
| Check of swap |
— | 115 | — | 1,219 | 1,334 | |||||||||||||||
| Other derivative financial instruments |
8 | 405 | 357 | 4,534 | 5,304 | |||||||||||||||
The following table shows the composition of derivatives by index:
| Off-balance sheet notional amount |
Balance sheet account receivable / (received) (payable) paid |
Adjustment to market value (in results / stockholders’ equity) |
Fair value | |||||||||||||||||
| 12/31/2017 | 12/31/2017 | 12/31/2017 | 12/31/2017 | |||||||||||||||||
| Futures contracts |
607,980 | 8 | 150 | 158 | ||||||||||||||||
| Purchase commitments |
323,102 | 8 | 150 | 158 | ||||||||||||||||
| Shares |
18,149 | — | — | — | ||||||||||||||||
| Commodities |
187 | — | — | — | ||||||||||||||||
| Interest |
275,155 | 7 | (3 | ) | 4 | |||||||||||||||
| Foreign currency |
29,611 | 1 | 153 | 154 | ||||||||||||||||
| Commitments to sell |
284,878 | — | — | — | ||||||||||||||||
| Shares |
11,359 | — | — | — | ||||||||||||||||
| Commodities |
168 | — | — | — | ||||||||||||||||
| Interest |
245,230 | — | — | — | ||||||||||||||||
| Foreign currency |
28,121 | — | — | — | ||||||||||||||||
| Swap contracts |
837,299 | (4,770 | ) | 268 | (4,502 | ) | ||||||||||||||
| Asset position |
837,299 | 3,630 | 5,560 | 9,190 | ||||||||||||||||
| Shares |
350 | — | 1 | 1 | ||||||||||||||||
| Interest |
825,811 | 2,937 | 5,314 | 8,251 | ||||||||||||||||
| Foreign currency |
11,138 | 693 | 245 | 938 | ||||||||||||||||
| Liability position |
837,299 | (8,400 | ) | (5,292 | ) | (13,692 | ) | |||||||||||||
| Shares |
1,088 | (1 | ) | — | (1 | ) | ||||||||||||||
| Interest |
814,141 | (8,244 | ) | (5,275 | ) | (13,519 | ) | |||||||||||||
| Foreign currency |
22,070 | (155 | ) | (17 | ) | (172 | ) | |||||||||||||
| Option contracts |
1,847,829 | 452 | 92 | 544 | ||||||||||||||||
| Purchase commitments – long position |
245,514 | 1,256 | 392 | 1,648 | ||||||||||||||||
| Shares |
8,655 | 396 | 618 | 1,014 | ||||||||||||||||
| Commodities |
367 | 11 | 18 | 29 | ||||||||||||||||
| Interest |
204,674 | 202 | (44 | ) | 158 | |||||||||||||||
| Foreign currency |
31,818 | 647 | (200 | ) | 447 | |||||||||||||||
| Commitments to sell – long position |
736,856 | 1,457 | 232 | 1,689 | ||||||||||||||||
| Shares |
11,795 | 358 | 34 | 392 | ||||||||||||||||
| Commodities |
269 | 4 | — | 4 | ||||||||||||||||
| Interest |
700,658 | 416 | 348 | 764 | ||||||||||||||||
| Foreign currency |
24,134 | 679 | (150 | ) | 529 | |||||||||||||||
F-42
Table of Contents
ITAÚ UNIBANCO HOLDING S.A.
Notes to the Consolidated Financial Statements
At 12/31/2018, 12/31/2017 and 01/01/2017 for balance sheet accounts and
From 01/01 to 12/31 of 2018, 2017 and 2016 for income statement accounts
(In millions of Reais, except information per share)
| Off-balance sheet notional amount |
Balance sheet account receivable / (received) (payable) paid |
Adjustment to market value (in results / stockholders’ equity) |
Fair value | |||||||||||||||||
| 12/31/2017 | 12/31/2017 | 12/31/2017 | 12/31/2017 | |||||||||||||||||
| Purchase commitments – short position |
88,688 | (1,008 | ) | (229 | ) | (1,237 | ) | |||||||||||||
| Shares |
9,159 | (128 | ) | (527 | ) | (655 | ) | |||||||||||||
| Commodities |
278 | (6 | ) | (14 | ) | (20 | ) | |||||||||||||
| Interest |
51,477 | (155 | ) | 65 | (90 | ) | ||||||||||||||
| Foreign currency |
27,774 | (719 | ) | 247 | (472 | ) | ||||||||||||||
| Commitments to sell – short position |
776,771 | (1,253 | ) | (303 | ) | (1,556 | ) | |||||||||||||
| Shares |
10,241 | (261 | ) | (33 | ) | (294 | ) | |||||||||||||
| Commodities |
222 | (8 | ) | 4 | (4 | ) | ||||||||||||||
| Interest |
742,475 | (435 | ) | (378 | ) | (813 | ) | |||||||||||||
| Foreign currency |
23,833 | (549 | ) | 104 | (445 | ) | ||||||||||||||
| Forward operations (onshore) |
|
9,954 | 639 | — | 639 | |||||||||||||||
| Purchases receivable |
1,654 | 1,861 | — | 1,861 | ||||||||||||||||
| Shares |
25 | 25 | — | 25 | ||||||||||||||||
| Interest |
1,629 | 1,836 | — | 1,836 | ||||||||||||||||
| Purchases payable - Interest |
— | (1,644 | ) | — | (1,644 | ) | ||||||||||||||
| Sales receivable |
737 | 5,049 | 1 | 5,050 | ||||||||||||||||
| Shares |
737 | 729 | 1 | 730 | ||||||||||||||||
| Interest |
— | 4,320 | — | 4,320 | ||||||||||||||||
| Sales deliverable |
7,563 | (4,627 | ) | (1 | ) | (4,628 | ) | |||||||||||||
| Shares |
3,261 | 1 | — | 1 | ||||||||||||||||
| Interest |
4,302 | (4,628 | ) | (1 | ) | (4,629 | ) | |||||||||||||
| Credit derivatives |
|
10,110 | (30 | ) | 109 | 79 | ||||||||||||||
| Asset position |
5,831 | 38 | 99 | 137 | ||||||||||||||||
| Shares |
1,955 | 22 | 69 | 91 | ||||||||||||||||
| Interest |
3,876 | 16 | 30 | 46 | ||||||||||||||||
| Liability position |
4,279 | (68 | ) | 10 | (58 | ) | ||||||||||||||
| Shares |
769 | (21 | ) | 4 | (17 | ) | ||||||||||||||
| Interest |
3,510 | (47 | ) | 6 | (41 | ) | ||||||||||||||
| NDF - Non Deliverable Forward |
|
252,628 | (948 | ) | 153 | (795 | ) | |||||||||||||
| Asset position |
119,312 | 2,781 | 169 | 2,950 | ||||||||||||||||
| Commodities |
80 | 6 | 1 | 7 | ||||||||||||||||
| Foreign currency |
119,232 | 2,775 | 168 | 2,943 | ||||||||||||||||
| Liability position |
133,316 | (3,729 | ) | (16 | ) | (3,745 | ) | |||||||||||||
| Commodities |
175 | (14 | ) | — | (14 | ) | ||||||||||||||
| Foreign currency |
133,141 | (3,715 | ) | (16 | ) | (3,731 | ) | |||||||||||||
| Check of swap |
955 | (73 | ) | 19 | (54 | ) | ||||||||||||||
| Asset position - Foreign currency |
514 | — | 68 | 68 | ||||||||||||||||
| Liability position - Interest |
441 | (73 | ) | (49 | ) | (122 | ) | |||||||||||||
| Other financial instruments |
|
4,225 | 90 | (62 | ) | 28 | ||||||||||||||
| Asset position |
2,464 | 100 | (8 | ) | 92 | |||||||||||||||
| Shares |
191 | (9 | ) | 5 | (4 | ) | ||||||||||||||
| Interest |
2,147 | 109 | (15 | ) | 94 | |||||||||||||||
| Foreign currency |
126 | — | 2 | 2 | ||||||||||||||||
| Liability position |
1,761 | (10 | ) | (54 | ) | (64 | ) | |||||||||||||
| Shares |
1,404 | (1 | ) | (57 | ) | (58 | ) | |||||||||||||
| Interest |
327 | (2 | ) | (2 | ) | (4 | ) | |||||||||||||
| Foreign currency |
30 | (7 | ) | 5 | (2 | ) | ||||||||||||||
| Asset | 16,180 | 6,663 | 22,843 | |||||||||||||||||
| Liability | (20,812 | ) | (5,934 | ) | (26,746 | ) | ||||||||||||||
|
|
|
|
|
|
|
|||||||||||||||
| Total | (4,632 | ) | 729 | (3,903 | ) | |||||||||||||||
|
|
|
|
|
|
|
|||||||||||||||
F-43
Table of Contents
ITAÚ UNIBANCO HOLDING S.A.
Notes to the Consolidated Financial Statements
At 12/31/2018, 12/31/2017 and 01/01/2017 for balance sheet accounts and
From 01/01 to 12/31 of 2018, 2017 and 2016 for income statement accounts
(In millions of Reais, except information per share)
| Derivative contracts mature as follows (in days): |
| |||||||||||||||||||
| Off-balance sheet – notional amount |
0 - 30 | 31 - 180 | 181 - 365 | Over 365 | 12/31/2017 | |||||||||||||||
| Futures contracts |
187,771 | 152,660 | 87,819 | 179,730 | 607,980 | |||||||||||||||
| Swaps contracts |
37,526 | 135,791 | 115,296 | 548,686 | 837,299 | |||||||||||||||
| Options |
418,679 | 290,491 | 457,164 | 681,495 | 1,847,829 | |||||||||||||||
| Forwards (onshore) |
6,997 | 1,933 | 1,024 | — | 9,954 | |||||||||||||||
| Credit derivatives |
— | 510 | 1,230 | 8,370 | 10,110 | |||||||||||||||
| NDF - Non Deliverable Forward |
63,446 | 136,650 | 39,109 | 13,423 | 252,628 | |||||||||||||||
| Check of swap |
— | 293 | — | 662 | 955 | |||||||||||||||
| Other derivative financial instruments |
— | 474 | 851 | 2,900 | 4,225 | |||||||||||||||
III - Derivatives by notional amount
See below the composition of the Derivative Financial Instruments portfolio by type of instrument, stated at their notional amounts, per trading location (organized or over-the-counter market) and counterparties.
| 12/31/2018 | ||||||||||||||||||||||||||||||||
| Futures | Swaps | Options | Forwards (onshore) |
Credit derivatives | NDF - Non Deliverable Forward |
Target flow of swap |
Other derivative financial instruments |
|||||||||||||||||||||||||
| B3 |
480,950 | 20,209 | 1,106,794 | 1,912 | 0 | 47,628 | 0 | 0 | ||||||||||||||||||||||||
|
Over-the-counter market |
105,083 | 919,301 | 155,774 | 429 | 8,324 | 177,727 | 1,334 | 5,304 | ||||||||||||||||||||||||
| Financial institutions |
104,297 | 702,848 | 110,859 | 0 | 7,742 | 103,172 | 0 | 3,602 | ||||||||||||||||||||||||
| Companies |
786 | 150,639 | 44,464 | 429 | 582 | 73,811 | 1,334 | 1,702 | ||||||||||||||||||||||||
| Individuals |
0 | 65,814 | 451 | 0 | 0 | 744 | 0 | 0 | ||||||||||||||||||||||||
|
|
|
|
|
|
|
|
|
|
|
|
|
|
|
|
|
|||||||||||||||||
| Total |
586,033 | 939,510 | 1,262,568 | 2,341 | 8,324 | 225,355 | 1,334 | 5,304 | ||||||||||||||||||||||||
|
|
|
|
|
|
|
|
|
|
|
|
|
|
|
|
|
|||||||||||||||||
| 12/31/2017 | ||||||||||||||||||||||||||||||||
| Futures | Swaps | Options | Forwards (onshore) |
Credit derivatives | NDF - Non Deliverable Forward |
Target flow of swap |
Other derivative financial instruments |
|||||||||||||||||||||||||
| B3 |
476,031 | 24,339 | 1,746,729 | 4,023 | — | 76,838 | — | — | ||||||||||||||||||||||||
|
Over-the-counter market |
131,949 | 812,960 | 101,100 | 5,931 | 10,110 | 175,790 | 955 | 4,225 | ||||||||||||||||||||||||
| Financial institutions |
131,525 | 525,855 | 69,460 | — | 10,110 | 118,743 | — | 1,792 | ||||||||||||||||||||||||
| Companies |
424 | 173,129 | 31,340 | 5,931 | — | 56,905 | 955 | 2,433 | ||||||||||||||||||||||||
| Individuals |
— | 113,976 | 300 | — | — | 142 | — | — | ||||||||||||||||||||||||
|
|
|
|
|
|
|
|
|
|
|
|
|
|
|
|
|
|||||||||||||||||
| Total |
607,980 | 837,299 | 1,847,829 | 9,954 | 10,110 | 252,628 | 955 | 4,225 | ||||||||||||||||||||||||
|
|
|
|
|
|
|
|
|
|
|
|
|
|
|
|
|
|||||||||||||||||
IV - Credit derivatives
| a) | Information on credit derivatives |
ITAÚ UNIBANCO HOLDING buys and sells credit protection mainly related to securities of Brazilian listed companies in order to meet the needs of its customers. When ITAÚ UNIBANCO HOLDING sells contracts for credit protection, the exposure for a given reference entity may be partially or totally offset by a credit protection purchase contract of another counterparty for the same reference entity or similar entity. The credit derivatives for which ITAÚ UNIBANCO HOLDING is protection seller are credit default swaps.
F-44
Table of Contents
ITAÚ UNIBANCO HOLDING S.A.
Notes to the Consolidated Financial Statements
At 12/31/2018, 12/31/2017 and 01/01/2017 for balance sheet accounts and
From 01/01 to 12/31 of 2018, 2017 and 2016 for income statement accounts
(In millions of Reais, except information per share)
Credit Default Swaps – CDS
CDS are credit derivatives in which, upon a credit event related to the reference entity pursuant to the terms of the contract, the protection buyer is entitled to receive, from the protection seller, the amount equivalent to the difference between the face value of the CDS contract and the fair value of the liability on the date the contract was settled, also known as the recovered amount. The protection buyer does not need to hold the debt instrument of the reference entity for it to receive the amounts due pursuant to the CDS contract terms when a credit event occurs.
| 12/31/2018 | ||||||||||||||||||||
| Maximum potential of future payments, gross |
Before 1 year | From 1 to 3 years |
From 3 to 5 years |
Over 5 years | ||||||||||||||||
| By instrument |
||||||||||||||||||||
| CDS |
6,853 | 1,685 | 1,913 | 3,203 | 52 | |||||||||||||||
|
|
|
|
|
|
|
|
|
|
|
|||||||||||
| Total by instrument |
6,853 | 1,685 | 1,913 | 3,203 | 52 | |||||||||||||||
|
|
|
|
|
|
|
|
|
|
|
|||||||||||
| By risk rating |
||||||||||||||||||||
| Investment grade |
1,361 | 300 | 510 | 539 | 12 | |||||||||||||||
| Below investment grade |
5,492 | 1,385 | 1,403 | 2,664 | 40 | |||||||||||||||
|
|
|
|
|
|
|
|
|
|
|
|||||||||||
| Total by risk |
6,853 | 1,685 | 1,913 | 3,203 | 52 | |||||||||||||||
|
|
|
|
|
|
|
|
|
|
|
|||||||||||
| By reference entity |
||||||||||||||||||||
| Brazilian government |
3,772 | 1,167 | 1,118 | 1,487 | 0 | |||||||||||||||
| Government – abroad |
314 | 71 | 85 | 156 | 2 | |||||||||||||||
| Private entities |
2,767 | 447 | 710 | 1,560 | 50 | |||||||||||||||
|
|
|
|
|
|
|
|
|
|
|
|||||||||||
| Total by entity |
6,853 | 1,685 | 1,913 | 3,203 | 52 | |||||||||||||||
|
|
|
|
|
|
|
|
|
|
|
|||||||||||
| 12/31/2017 | ||||||||||||||||||||
| Maximum potential of future payments, gross |
Before 1 year | From 1 to 3 years |
From 3 to 5 years |
Over 5 years | ||||||||||||||||
| By instrument |
||||||||||||||||||||
| CDS |
6,416 | 1,200 | 2,412 | 2,804 | — | |||||||||||||||
|
|
|
|
|
|
|
|
|
|
|
|||||||||||
| Total by instrument |
6,416 | 1,200 | 2,412 | 2,804 | — | |||||||||||||||
|
|
|
|
|
|
|
|
|
|
|
|||||||||||
| By risk rating |
||||||||||||||||||||
| Investment grade |
1,416 | 449 | 347 | 620 | — | |||||||||||||||
| Below investment grade |
5,000 | 751 | 2,065 | 2,184 | — | |||||||||||||||
|
|
|
|
|
|
|
|
|
|
|
|||||||||||
| Total by risk |
6,416 | 1,200 | 2,412 | 2,804 | — | |||||||||||||||
|
|
|
|
|
|
|
|
|
|
|
|||||||||||
| By reference entity |
||||||||||||||||||||
| Brazilian government |
3,597 | 406 | 1,671 | 1,520 | — | |||||||||||||||
| Government – abroad |
329 | 144 | 90 | 95 | — | |||||||||||||||
| Private entities |
2,490 | 650 | 651 | 1,189 | — | |||||||||||||||
|
|
|
|
|
|
|
|
|
|
|
|||||||||||
| Total by entity |
6,416 | 1,200 | 2,412 | 2,804 | — | |||||||||||||||
|
|
|
|
|
|
|
|
|
|
|
|||||||||||
ITAÚ UNIBANCO HOLDING assesses the risk of a credit derivative based on the credit ratings attributed to the reference entity by independent credit rating agencies. Investment grade are those entities for which credit risk is rated as Baa3 or higher, as rated by Moody’s, and BBB- or higher, according to the ratings of Standard & Poor’s and Fitch Ratings. The maximum potential loss that may be incurred with the credit derivative is based on the notional amount of the derivative. ITAÚ UNIBANCO HOLDING believes, based on its historical experience, that the amount of the maximum potential loss does not represent the actual level of loss. This is so because, should there be an event of loss, the amount of maximum potential loss should be reduced from the notional amount by the recoverable amount.
F-45
Table of Contents
ITAÚ UNIBANCO HOLDING S.A.
Notes to the Consolidated Financial Statements
At 12/31/2018, 12/31/2017 and 01/01/2017 for balance sheet accounts and
From 01/01 to 12/31 of 2018, 2017 and 2016 for income statement accounts
(In millions of Reais, except information per share)
The credit derivatives sold are not covered by guarantees, and during this period, ITAÚ UNIBANCO HOLDING has not incurred any loss related to credit derivative contracts.
The following table presents the notional amount of purchased credit derivatives whose underlying amounts are identical to those for which ITAÚ UNIBANCO HOLDING operates as seller of the credit protection.
| 12/31/2018 | ||||||||||||
| Notional amount of credit protection sold |
Notional amount of credit protection purchased with identical underlying amount |
Net position | ||||||||||
| CDS |
(6,853 | ) | 1,471 | (5,382 | ) | |||||||
|
|
|
|
|
|
|
|||||||
| Total |
(6,853 | ) | 1,471 | (5,382 | ) | |||||||
|
|
|
|
|
|
|
|||||||
| 12/31/2017 | ||||||||||||
| Notional amount of credit protection sold |
Notional amount of credit protection purchased with identical underlying amount |
Net position | ||||||||||
| CDS |
(6,416 | ) | 3,694 | (2,722 | ) | |||||||
|
|
|
|
|
|
|
|||||||
| Total |
(6,416 | ) | 3,694 | (2,722 | ) | |||||||
|
|
|
|
|
|
|
|||||||
b) Financial instruments subject to offsetting, enforceable master netting arrangements and similar agreements
The following tables set forth the financial assets and liabilities that are subject to offsetting, enforceable master netting arrangements, as well as how these financial assets and liabilities have been presented in ITAÚ UNIBANCO HOLDING’s consolidated financial statements. These tables also reflect the amounts of collateral pledged or received in relation to financial assets and liabilities subject to enforceable arrangements that have not been presented on a net basis in accordance with IAS 32.
F-46
Table of Contents
ITAÚ UNIBANCO HOLDING S.A.
Notes to the Consolidated Financial Statements
At 12/31/2018, 12/31/2017 and 01/01/2017 for balance sheet accounts and
From 01/01 to 12/31 of 2018, 2017 and 2016 for income statement accounts
(In millions of Reais, except information per share)
Financial assets subject to offsetting, enforceable master netting arrangements and similar agreements:
| 12/31/2018 | ||||||||||||||||||||||||
| Gross amount of recognized financial assets (1) |
Gross amount offset in the statement of financial position |
Net amount of financial assets presented in the statement of financial position |
Related amounts not offset in the statement of financial position (2) |
Net amount | ||||||||||||||||||||
| Financial instruments (3) | Cash collateral received | |||||||||||||||||||||||
| Securities purchased under agreements to resell |
280,126 | 0 | 280,126 | (2,822 | ) | 0 | 277,304 | |||||||||||||||||
| Derivatives |
23,466 | 0 | 23,466 | (3,091 | ) | 0 | 20,375 | |||||||||||||||||
| 12/31/2017 | ||||||||||||||||||||||||
| Gross amount of recognized financial assets (1) |
Gross amount offset in the statement of financial position |
Net amount of financial assets presented in the statement of financial position |
Related amounts not offset in the statement of financial position (2) |
Net amount | ||||||||||||||||||||
| Financial instruments (3) | Cash collateral received | |||||||||||||||||||||||
| Securities purchased under agreements to resell |
244,699 | — | 244,699 | (575 | ) | — | 244,124 | |||||||||||||||||
| Derivatives |
22,843 | — | 22,843 | (3,138 | ) | — | 19,705 | |||||||||||||||||
| Financial liabilities subject to offsetting, enforceable master netting arrangements and similar agreements:
|
| |||||||||||||||||||||||
| 12/31/2018 | ||||||||||||||||||||||||
| Gross amount of recognized financial liabilities (1) |
Gross amount offset in the statement of financial position |
Net amount of financial liabilities presented in the statement of financial position |
Related amounts not offset in the statement of financial position (2) |
Net amount | ||||||||||||||||||||
| Financial instruments (3) | Cash collateral pledged | |||||||||||||||||||||||
| Securities sold under repurchase agreements |
330,237 | 0 | 330,237 | (23,079 | ) | 0 | 307,158 | |||||||||||||||||
| Derivatives |
27,519 | 0 | 27,519 | (3,091 | ) | (333 | ) | 24,095 | ||||||||||||||||
| 12/31/2017 | ||||||||||||||||||||||||
| Gross amount of recognized financial liabilities (1) |
Gross amount offset in the statement of financial position |
Net amount of financial liabilities presented in the statement of financial position |
Related amounts not offset in the statement of financial position (2) |
Net amount | ||||||||||||||||||||
| Financial instruments (3) | Cash collateral pledged | |||||||||||||||||||||||
| Securities sold under repurchase agreements |
312,634 | — | 312,634 | (14,489 | ) | — | 298,145 | |||||||||||||||||
| Derivatives |
26,746 | — | 26,746 | (3,138 | ) | (452 | ) | 23,156 | ||||||||||||||||
| (1) | Includes amounts of master offset agreements and other such agreements, both enforceable and unenforceable; |
| (2) | Limited to amounts subject to enforceable master offset agreements and other such agreements; |
| (3) | Includes amounts subject to enforceable master offset agreements and other such agreements, and guarantees in financial instruments. |
Financial assets and financial liabilities are offset in the balance sheet only when there is a legally enforceable right to offset the recognized amounts and there is an intention to settle on a net basis, or realize the asset and settle the liability simultaneously.
Derivatives and repurchase agreements not set off in the balance sheet relate to transactions in which there are enforceable master netting agreements or similar agreements, but the offset criteria have not been met in accordance with paragraph 42 of IAS 32 mainly because ITAÚ UNIBANCO HOLDING has no intention to settle on a net basis, or realize the asset and settle the liability simultaneously.
F-47
Table of Contents
ITAÚ UNIBANCO HOLDING S.A.
Notes to the Consolidated Financial Statements
At 12/31/2018, 12/31/2017 and 01/01/2017 for balance sheet accounts and
From 01/01 to 12/31 of 2018, 2017 and 2016 for income statement accounts
(In millions of Reais, except information per share)
Note 7 – Hedge accounting
There are three types of hedge relations: Fair value hedge, Cash flow hedge, and Hedge of net investment in foreign operations.
In hedge accounting, the groups of risk factors measured by ITAÚ UNIBANCO HOLDING are:
| • | Interest Rate: Risk of loss in transactions subject to interest rate variations; |
| • | Currency: Risk of loss in transactions subject to exchange variation. |
The structure of risk limits is extended to the risk factor level, with specific limits that aim at improving the monitoring and understanding process, as well as avoiding concentration of these risks.
The structures designed for categories of interest rate and exchange rate are realized considering aggregate risks when there are compatible hedge instruments. Due to a management’s decision, in certain cases risks are hedged for the term and limit of the hedge instrument risk factor.
The other risk factors hedged by the institution are presented in Note 32.
To protect cash flows and fair value of instruments designated as hedged items, ITAÚ UNIBANCO HOLDING uses derivative financial instruments and financial assets. Currently, Futures Contracts, Options, NDF (non-deliverable forward), Forward, Swap and Financial Assets are used.
ITAÚ UNIBANCO HOLDING manages risks through the economic relationship between hedge instruments and hedged items, where the expectation is that these instruments move in opposite directions and in the same proportion, with the purpose of neutralizing risk factors.
The designated coverage ratio is always 100% of the risk factor eligible for coverage. The sources of ineffectiveness are in general related to the counterparty’s credit risk and possible mismatches of terms between the hedge instrument and the hedged item.
| a) | Cash flow hedge |
The cash flow hedge strategies of ITAÚ UNIBANCO HOLDING consist of a hedge of exposure to variations in cash flows, payment of interest and exposure to interest rate, which are attributable to changes in interest rates related to assets and liabilities recognized and changes in interest rates of unrecognized assets and liabilities.
ITAÚ UNIBANCO HOLDING has applied cash flow hedge strategies as follows:
Interest rate risks
| • | Hedge of time deposits and repurchase agreements: to hedge of the variability in cash flows of interest payments resulting from changes in the DI interest rate, through futures contracts; |
| • | Hedge of Syndicated Loan: to hedge the variability in cash flow of interest payments resulting from changes in the LIBOR interest rate, through futures contracts; |
| • | Hedge of asset transactions: to hedge the variations in cash flows of interest receipts resulting from changes in the DI rate, through futures contracts; |
| • | Hedge of assets denominated in UF*: to hedge the variations in cash flows of interest receipts resulting from changes in the UF*, through swap contracts; |
| • | Hedge of Funding: to hedge the variations in cash flows of interest payments resulting from changes in the TPM* rate and foreign exchange, through swap contracts; |
| • | Hedge of loan operations: to hedge the variations in cash flows of interest receipts resulting from changes in the TPM* rate, through swap contracts; |
| • | Hedge of asset-backed securities under repurchase agreements: to hedge changes in cash flows from interest received on changes in Selic (benchmark interest rate), through futures contracts. |
| * | UF – Chilean unit of account / TPM – Monetary policy rate |
F-48
Table of Contents
ITAÚ UNIBANCO HOLDING S.A.
Notes to the Consolidated Financial Statements
At 12/31/2018, 12/31/2017 and 01/01/2017 for balance sheet accounts and
From 01/01 to 12/31 of 2018, 2017 and 2016 for income statement accounts
(In millions of Reais, except information per share)
ITAÚ UNIBANCO HOLDING does not use the qualitative method to evaluate the effectiveness and to measure the ineffectiveness of such strategies.
In such strategies of cash flow hedge, ITAÚ UNIBANCO HOLDING uses the hypothetical derivative method. The hypothetical derivative method is based on a comparison of the change in the fair value of a hypothetical derivative with terms identical to the critical terms of the variable-rate liability, and this change in the fair value of a hypothetical derivative is considered a proxy of the present value of the cumulative change in the future cash flow expected for the hedged liability.
| a) | Hedge Cash flow |
| Strategies |
Heading |
12/31/2018 | ||||||||||||||||||||||||
| Hedged item | Hedge instrument | |||||||||||||||||||||||||
| Book Value | Variation in value recognized in Other comprehensive income |
Cash flow hedge reserve |
Nominal Value |
Variation in the amounts used to calculate hedge ineffectiveness |
||||||||||||||||||||||
| Assets | Liabilities | |||||||||||||||||||||||||
| Interest rate risk |
||||||||||||||||||||||||||
| Hedge of deposits and repurchase agreements |
Securities purchased under agreements to resell | 0 | 29,727 | (1,682 | ) | (2,946 | ) | 29,727 | (1,800 | ) | ||||||||||||||||
| Hedge of assets transactions |
Loan operations and lease operations and Securities | 7,866 | 0 | 136 | 136 | 8,003 | 136 | |||||||||||||||||||
| Hedge of Asset-backed securities under repurchase agreements |
Securities purchased under agreements to resell | 36,668 | 0 | 353 | 353 | 38,013 | 359 | |||||||||||||||||||
| Hedge of loan operations |
Loan operations and lease operations | 274 | 0 | 6 | 6 | 268 | 7 | |||||||||||||||||||
| Hedge of funding |
Deposits | 0 | 3,200 | 78 | 86 | 3,105 | 82 | |||||||||||||||||||
| Hedge of assets denominated in UF |
Securities | 13,247 | 0 | 26 | 26 | 13,221 | 23 | |||||||||||||||||||
| Foreign exchange risk |
||||||||||||||||||||||||||
| Hedge of highly probable forecast transactions |
71 | 0 | 6 | 6 | 71 | 6 | ||||||||||||||||||||
|
|
|
|
|
|
|
|
|
|
|
|
|
|||||||||||||||
| Total |
58,126 | 32,927 | (1,077 | ) | (2,333 | ) | 92,408 | (1,187 | ) | |||||||||||||||||
|
|
|
|
|
|
|
|
|
|
|
|
|
|||||||||||||||
F-49
Table of Contents
ITAÚ UNIBANCO HOLDING S.A.
Notes to the Consolidated Financial Statements
At 12/31/2018, 12/31/2017 and 01/01/2017 for balance sheet accounts and
From 01/01 to 12/31 of 2018, 2017 and 2016 for income statement accounts
(In millions of Reais, except information per share)
| Strategies |
Heading |
12/31/2017 | ||||||||||||||||||||||||
| Hedged item | Hedge instrument | |||||||||||||||||||||||||
| Book Value | Variation in value recognized in Other comprehensive income |
Cash flow hedge reserve |
Nominal Value |
Variation in the amounts used to calculate hedge ineffectiveness |
||||||||||||||||||||||
| Assets | Liabilities | |||||||||||||||||||||||||
| Interest rate risk |
||||||||||||||||||||||||||
| Hedge of deposits and repurchase agreements |
Securities purchased under agreements to resell | — | 62,667 | (3,227 | ) | (3,227 | ) | 62,667 | (3,377 | ) | ||||||||||||||||
| Hedge of assets transactions |
Loan operations and lease operations and Securities | 23,490 | — | 429 | 429 | 23,919 | 429 | |||||||||||||||||||
| Hedge of Asset-backed securities under repurchase agreements |
Securities purchased under agreements to resell | 31,099 | — | 672 | 672 | 31,855 | 670 | |||||||||||||||||||
| Hedge of loan operations |
Loan operations and lease operations | 1,124 | — | 14 | 14 | 1,124 | 13 | |||||||||||||||||||
| Hedge of funding |
Deposits | — | 6,444 | (16 | ) | (16 | ) | 6,444 | (17 | ) | ||||||||||||||||
| Hedge of assets denominated in UF |
Securities | 15,227 | — | (29 | ) | (29 | ) | 15,227 | (34 | ) | ||||||||||||||||
| Foreign exchange risk |
||||||||||||||||||||||||||
| Hedge of highly probable forecast transactions |
219 | — | (5 | ) | (5 | ) | 232 | (5 | ) | |||||||||||||||||
|
|
|
|
|
|
|
|
|
|
|
|
|
|||||||||||||||
| Total |
71,159 | 69,111 | (2,162 | ) | (2,162 | ) | 141,468 | (2,321 | ) | |||||||||||||||||
|
|
|
|
|
|
|
|
|
|
|
|
|
|||||||||||||||
For strategies of deposits and repurchase agreements to resell, asset transactions and asset-backed securities under repurchase agreements, the entity frequently reestablishes the coverage relationship, since both the hedged item and instruments change over time. This is so because they are portfolio strategies, reflecting guidelines for risk management strategy approved in the proper approval level.
The amount of R$ (1,615) in Reserve of Cash Flow Hedge will be recognized in result for the maturity term of the hedged item. In the period ended December 31, 2018, the amount of R$ (499) was recognized in Result related to this deferral.
| Hedge Instruments |
12/31/2018 | |||||||||||||||||||||||||||
| Nominal Value |
Book Value (*) | Variations in fair value used to calculate hedge ineffectiveness |
Variation in value recognized in Other comprehensive income |
Hedge ineffectiveness recognized in income |
Amount reclassified from Cash flow hedge reserve to income |
|||||||||||||||||||||||
| Assets | Liabilities | |||||||||||||||||||||||||||
| Interest rate risk |
||||||||||||||||||||||||||||
| Interest rate futures |
75,743 | 256 | 21 | (1,305 | ) | (1,193 | ) | (112 | ) | 0 | ||||||||||||||||||
| Interest rate Swap |
16,594 | 3,023 | 13,519 | 112 | 110 | 2 | 0 | |||||||||||||||||||||
| Foreign currency risk |
||||||||||||||||||||||||||||
| DDI futures |
6 | 5 | 0 | 1 | 1 | 0 | ||||||||||||||||||||||
| Option |
65 | 9 | 0 | 5 | 5 | 0 | 0 | |||||||||||||||||||||
|
|
|
|
|
|
|
|
|
|
|
|
|
|
|
|||||||||||||||
| Total |
92,408 | 3,293 | 13,540 | (1,187 | ) | (1,077 | ) | (110 | ) | 0 | ||||||||||||||||||
|
|
|
|
|
|
|
|
|
|
|
|
|
|
|
|||||||||||||||
F-50
Table of Contents
ITAÚ UNIBANCO HOLDING S.A.
Notes to the Consolidated Financial Statements
At 12/31/2018, 12/31/2017 and 01/01/2017 for balance sheet accounts and
From 01/01 to 12/31 of 2018, 2017 and 2016 for income statement accounts
(In millions of Reais, except information per share)
| Hedge Instruments |
12/31/2017 | |||||||||||||||||||||||||||
| Nominal Value |
Book Value (*) | Variations in fair value used to calculate hedge ineffectiveness |
Variation in value recognized in Other comprehensive income |
Hedge ineffectiveness recognized in income |
Amount reclassified from Cash flow hedge reserve to income |
|||||||||||||||||||||||
| Assets | Liabilities | |||||||||||||||||||||||||||
| Interest rate risk |
||||||||||||||||||||||||||||
| Interest rate futures |
118,441 | 13 | (32 | ) | (2,278 | ) | (2,126 | ) | (152 | ) | — | |||||||||||||||||
| Interest rate Swap |
22,795 | 14 | (44 | ) | (38 | ) | (31 | ) | (7 | ) | — | |||||||||||||||||
| Foreign currency risk |
||||||||||||||||||||||||||||
| DDI futures |
78 | — | — | 1 | 1 | — | — | |||||||||||||||||||||
| Option |
154 | 9 | — | (6 | ) | (6 | ) | — | — | |||||||||||||||||||
|
|
|
|
|
|
|
|
|
|
|
|
|
|
|
|||||||||||||||
| Total |
141,468 | 36 | (76 | ) | (2,321 | ) | (2,162 | ) | (159 | ) | — | |||||||||||||||||
|
|
|
|
|
|
|
|
|
|
|
|
|
|
|
|||||||||||||||
| (*) | Amounts recorded in the Derivatives. |
For strategies of deposits and repurchase agreements to resell, asset transactions and asset-backed securities under repurchase agreements, the entity frequently reestablishes the coverage relationship, since both the hedged item and instruments change over time. This is so because they are portfolio strategies, reflecting guidelines for risk management strategy approved in the proper approval level.
| b) | Hedge of net investment in foreign operations |
ITAÚ UNIBANCO HOLDING strategies of net investments in foreign operations consist of a hedge of the exposure in foreign currency arising from the functional currency of the foreign operation, with respect to the functional currency of the head office, by contracting futures, DDI, NDF and financial assets.
The risk hedged in this type of strategy is the foreign exchange risk.
ITAÚ UNIBANCO HOLDING does not use the qualitative method to assess the effectiveness and measure the ineffectiveness of these strategies.
To evaluate the effectiveness and to measure the ineffectiveness of such strategies, ITAÚ UNIBANCO HOLDING uses the Dollar Offset Method. The Dollar Offset Method is based on a comparison of the change in fair value (cash flow) of the hedge instrument, attributable to changes in exchange rate and gain (loss) arising from the variation in exchange rates, on the amount of investment abroad designated as a hedged item.
| Strategies |
12/31/2018 | |||||||||||||||||||||||
| Hedged item | Hedge instrument | |||||||||||||||||||||||
| Book Value (2) | Variation in value recognized in Other comprehensive income |
Foreign currency convertion |
Nominal Value |
Variation in the amounts used to calculate hedge ineffectiveness |
||||||||||||||||||||
| Assets | Liabilities | |||||||||||||||||||||||
| Foreign exchange risk |
||||||||||||||||||||||||
| Hedge of net investment in foreign operations (1) |
0 | 14,820 | (7,300 | ) | (7,300 | ) | 12,550 | (7,296 | ) | |||||||||||||||
|
|
|
|
|
|
|
|
|
|
|
|
|
|||||||||||||
| Total |
0 | 14,820 | (7,300 | ) | (7,300 | ) | 12,550 | (7,296 | ) | |||||||||||||||
|
|
|
|
|
|
|
|
|
|
|
|
|
|||||||||||||
F-51
Table of Contents
ITAÚ UNIBANCO HOLDING S.A.
Notes to the Consolidated Financial Statements
At 12/31/2018, 12/31/2017 and 01/01/2017 for balance sheet accounts and
From 01/01 to 12/31 of 2018, 2017 and 2016 for income statement accounts
(In millions of Reais, except information per share)
| Strategies |
12/31/2017 | |||||||||||||||||||||||
| Hedged item | Hedge instrument | |||||||||||||||||||||||
| Book Value (2) | Variation in value recognized in Other comprehensive income |
Foreign currency convertion |
Nominal Value |
Variation in the amounts used to calculate hedge ineffectiveness |
||||||||||||||||||||
| Assets | Liabilities | |||||||||||||||||||||||
| Foreign exchange risk |
||||||||||||||||||||||||
| Hedge of net investment in foreign operations (1) |
— | 13,074 | (5,507 | ) | (5,507 | ) | 10,561 | (5,503 | ) | |||||||||||||||
|
|
|
|
|
|
|
|
|
|
|
|
|
|||||||||||||
| Total |
— | 13,074 | (5,507 | ) | (5,507 | ) | 10,561 | (5,503 | ) | |||||||||||||||
|
|
|
|
|
|
|
|
|
|
|
|
|
|||||||||||||
| (1) | Hedge instruments include the overhedge rate of 44.65% regarding taxes. |
| (2) | Amounts recorded in the Hedge of net investment in foreign operation. |
| Hedge instruments |
12/31/2018 | |||||||||||||||||||||||||||
| Nominal Value |
Book Value (*) | Variations in fair value used to calculate hedge ineffectiveness |
Variation in value recognized in Other comprehensive income |
Hedge ineffectiveness recognized in income |
Amount reclassified from foreign currency convertion into income |
|||||||||||||||||||||||
| Assets | Liabilities | |||||||||||||||||||||||||||
| Foreign exchange risk |
||||||||||||||||||||||||||||
| DDI futures |
27,990 | 0 | 113 | (11,394 | ) | (11,353 | ) | (41 | ) | 0 | ||||||||||||||||||
| Forward |
(1,470 | ) | 1,059 | 0 | 764 | 726 | 38 | 0 | ||||||||||||||||||||
| NDF |
(13,167 | ) | 255 | 0 | 3,198 | 3,189 | 9 | 0 | ||||||||||||||||||||
| Financial Assets |
(803 | ) | 803 | 0 | 136 | 138 | (2 | ) | 0 | |||||||||||||||||||
|
|
|
|
|
|
|
|
|
|
|
|
|
|
|
|||||||||||||||
| Total |
12,550 | 2,117 | 113 | (7,296 | ) | (7,300 | ) | 4 | 0 | |||||||||||||||||||
|
|
|
|
|
|
|
|
|
|
|
|
|
|
|
|||||||||||||||
| Hedge instruments |
12/31/2017 | |||||||||||||||||||||||||||
| Nominal Value |
Book Value (*) | Variations in fair value used to calculate hedge ineffectiveness |
Variation in value recognized in Other comprehensive income |
Hedge ineffectiveness recognized in income |
Amount reclassified from foreign currency convertion into income |
|||||||||||||||||||||||
| Assets | Liabilities | |||||||||||||||||||||||||||
| Foreign exchange risk |
||||||||||||||||||||||||||||
| DDI futures |
23,641 | 49 | — | (7,646 | ) | (7,605 | ) | (41 | ) | — | ||||||||||||||||||
| Forward |
(1,065 | ) | 1,050 | — | 661 | 623 | 38 | — | ||||||||||||||||||||
| NDF |
(11,474 | ) | — | 357 | 1,525 | 1,516 | 9 | — | ||||||||||||||||||||
| Financial Assets |
(541 | ) | 541 | — | (43 | ) | (41 | ) | (2 | ) | — | |||||||||||||||||
|
|
|
|
|
|
|
|
|
|
|
|
|
|
|
|||||||||||||||
| Total |
10,561 | 1,640 | 357 | (5,503 | ) | (5,507 | ) | 4 | — | |||||||||||||||||||
|
|
|
|
|
|
|
|
|
|
|
|
|
|
|
|||||||||||||||
| (*) | Amounts recorded in the Derivatives. |
| c) | Fair value hedge |
The fair value hedge strategy of ITAÚ UNIBANCO HOLDING consists in hedging the exposure to variation in fair value, in the receipt and payment of interest related to recognized assets and liabilities.
ITAÚ UNIBANCO HOLDING has applied fair value hedge as follows:
Interest rate risk:
| • | To protect the risk of variation in the fair value of receipt and payment of interest resulting from variations in the fair value of variable rates involved, by contracting swaps and futures. |
F-52
Table of Contents
ITAÚ UNIBANCO HOLDING S.A.
Notes to the Consolidated Financial Statements
At 12/31/2018, 12/31/2017 and 01/01/2017 for balance sheet accounts and
From 01/01 to 12/31 of 2018, 2017 and 2016 for income statement accounts
(In millions of Reais, except information per share)
ITAÚ UNIBANCO HOLDING does not use the qualitative method to assess effectiveness and to measure ineffectiveness of these strategies.
To evaluate the effectiveness and to measure the ineffectiveness of such strategy, ITAÚ UNIBANCO HOLDING uses the percentage approach and dollar offset method:
| • | The percentage approach is based on the calculation of change in the fair value of the reviewed estimate for the hedged position (hedge item) attributable to the protected risk versus the change in the fair value of the hedged derivative instrument. |
| • | The dollar offset method is calculated based on the difference between the variation of the fair value of the hedging instrument and the variation in the fair value of the hedged item attributed to changes in the interest rate. |
The effects of hedge accounting on the financial position and performance of ITAÚ UNIBANCO HOLDING are presented below:
| Strategies |
12/31/2018 | |||||||||||||||||||||||||||
| Hedged Item | Hedge Instruments | |||||||||||||||||||||||||||
| Book Value (*) | Fair value | Variation in the amounts used to calculate hedge ineffectiveness |
Nominal Value |
Variation in value recognized in income |
||||||||||||||||||||||||
| Assets | Liabilities | Assets | Liabilities | |||||||||||||||||||||||||
| Interest rate risk |
||||||||||||||||||||||||||||
| Hedge of loan operations |
7,066 | 0 | 7,119 | 0 | 53 | 7,066 | (54 | ) | ||||||||||||||||||||
| Hedge of funding |
0 | 9,124 | 0 | 9,081 | (43 | ) | 9,124 | 43 | ||||||||||||||||||||
| Hedge of fair value through other comprehensive income |
5,391 | 0 | 5,483 | 0 | 93 | 5,401 | (82 | ) | ||||||||||||||||||||
|
|
|
|
|
|
|
|
|
|
|
|
|
|
|
|||||||||||||||
| Total |
12,457 | 9,124 | 12,602 | 9,081 | 103 | 21,591 | (93 | ) | ||||||||||||||||||||
|
|
|
|
|
|
|
|
|
|
|
|
|
|
|
|||||||||||||||
| Strategies |
12/31/2017 | |||||||||||||||||||||||||||
| Hedged Item | Hedge Instruments | |||||||||||||||||||||||||||
| Book Value (*) | Fair value | Variation in the amounts used to calculate hedge ineffectiveness |
Nominal Value |
Variation in value recognized in income |
||||||||||||||||||||||||
| Assets | Liabilities | Assets | Liabilities | |||||||||||||||||||||||||
| Interest rate risk |
||||||||||||||||||||||||||||
| Hedge of loan operations |
5,977 | — | 5,978 | — | (50 | ) | 5,977 | 52 | ||||||||||||||||||||
| Hedge of funding |
— | 12,157 | — | 9,562 | 108 | 12,157 | (113 | ) | ||||||||||||||||||||
| Hedge of syndicated loan |
— | 794 | — | 779 | — | 794 | — | |||||||||||||||||||||
| Hedge of fair value through other comprehensive income |
482 | — | 450 | — | (33 | ) | 482 | 34 | ||||||||||||||||||||
|
|
|
|
|
|
|
|
|
|
|
|
|
|
|
|||||||||||||||
| Total |
6,459 | 12,951 | 6,428 | 10,341 | 25 | 19,410 | (27 | ) | ||||||||||||||||||||
|
|
|
|
|
|
|
|
|
|
|
|
|
|
|
|||||||||||||||
| (*) | Amounts recorded in the heading Deposits, Securities, Funds from Interbank Markets and Loan and Lease Operation. |
For loan operations strategies, the entity reestablishes the coverage ratio, since both the hedged item and the instruments change over time. This occurs because they are portfolio strategies that reflect the risk management strategy guidelines approved in the proper authority level.
F-53
Table of Contents
ITAÚ UNIBANCO HOLDING S.A.
Notes to the Consolidated Financial Statements
At 12/31/2018, 12/31/2017 and 01/01/2017 for balance sheet accounts and
From 01/01 to 12/31 of 2018, 2017 and 2016 for income statement accounts
(In millions of Reais, except information per share)
| Hedge Instruments |
12/31/2018 | |||||||||||||||||||
| Nominal Value |
Book value (*) | Variation in the amount used to calculate hedge ineffectiveness |
Hedge ineffectiveness recognized in income |
|||||||||||||||||
| Assets | Liabilities | |||||||||||||||||||
| Interest rate risk |
||||||||||||||||||||
| Interest rate Swap |
21,591 | 86 | 1,078 | (93 | ) | 10 | ||||||||||||||
|
|
|
|
|
|
|
|
|
|
|
|||||||||||
| Total |
21,591 | 86 | 1,078 | (93 | ) | 10 | ||||||||||||||
|
|
|
|
|
|
|
|
|
|
|
|||||||||||
| Hedge Instruments |
12/31/2017 | |||||||||||||||||||
| Nominal Value |
Book value (*) | Variation in the amount used to calculate hedge ineffectiveness |
Hedge ineffectiveness recognized in income |
|||||||||||||||||
| Assets | Liabilities | |||||||||||||||||||
| Interest rate risk |
||||||||||||||||||||
| Interest rate Swap |
19,410 | 86 | 114 | (27 | ) | (2 | ) | |||||||||||||
|
|
|
|
|
|
|
|
|
|
|
|||||||||||
| Total |
19,410 | 86 | 114 | (27 | ) | (2 | ) | |||||||||||||
|
|
|
|
|
|
|
|
|
|
|
|||||||||||
| (*) | Amounts recorded in the Derivatives. |
The tables below present, for each strategy, the nominal value and the fair value adjustments of hedge instruments and the book value of the hedged item:
| Strategies |
12/31/2018 | 12/31/2017 | ||||||||||||||||||||||
| Hedge instruments | Hedged item | Hedge instruments | Hedged item | |||||||||||||||||||||
| Nominal Value |
Fair value adjustments |
Book Value | Nominal Value |
Fair value adjustments |
Book Value | |||||||||||||||||||
| Hedge of deposits and repurchase agreements |
29,727 | (21 | ) | 29,727 | 62,667 | (32 | ) | 62,667 | ||||||||||||||||
| Hedge of highly probable forecast transactions |
71 | 6 | 71 | 232 | 9 | 219 | ||||||||||||||||||
| Hedge of net investment in foreign operations (*) |
12,550 | 2,230 | 14,820 | 10,561 | 1,283 | 13,074 | ||||||||||||||||||
| Hedge of loan operations (Fair value) |
7,066 | (54 | ) | 7,066 | 5,977 | 52 | 5,977 | |||||||||||||||||
| Hedge of loan operations (Cash flow) |
268 | 7 | 274 | 1,124 | 14 | 1,124 | ||||||||||||||||||
| Hedge of funding (Fair value) |
9,124 | 43 | 9,124 | 12,157 | (114 | ) | 12,157 | |||||||||||||||||
| Hedge of funding (Cash flow) |
3,105 | 82 | 3,200 | 6,444 | (16 | ) | 6,444 | |||||||||||||||||
| Hedge of syndicated loan (Fair value) |
0 | 0 | 0 | 794 | 794 | |||||||||||||||||||
| Hedge of assets transactions |
8,003 | 136 | 7,866 | 23,919 | 2 | 23,490 | ||||||||||||||||||
| Hedge of Asset-backed securities under repurchase agreements |
38,013 | 8 | 36,668 | 31,855 | 11 | 31,099 | ||||||||||||||||||
| Hedge of assets denominated in UF |
13,221 | 23 | 13,247 | 15,227 | (28 | ) | 15,227 | |||||||||||||||||
| Hedge of fair value through other comprehensive income |
5,401 | (82 | ) | 5,391 | 482 | 34 | 482 | |||||||||||||||||
|
|
|
|
|
|
|
|
|
|
|
|
|
|||||||||||||
| Total |
0 | 2,378 | 0 | 1,215 | ||||||||||||||||||||
|
|
|
|
|
|
|
|
|
|
|
|
|
|||||||||||||
| (*) | Hedge instruments include the overhedge rate of 44.65% regarding taxes. |
F-54
Table of Contents
ITAÚ UNIBANCO HOLDING S.A.
Notes to the Consolidated Financial Statements
At 12/31/2018, 12/31/2017 and 01/01/2017 for balance sheet accounts and
From 01/01 to 12/31 of 2018, 2017 and 2016 for income statement accounts
(In millions of Reais, except information per share)
The table below shows the breakdown by maturity of the hedging strategies:
| Strategies |
12/31/2018 | |||||||||||||||||||||||||||||||
| 0-1 year | 1-2 years | 2-3 years | 3-4 years | 4-5 years | 5-10 years | over 10 years | Total | |||||||||||||||||||||||||
| Hedge of deposits and repurchase agreements |
11,925 | 4,729 | 3,519 | 0 | 5,737 | 3,817 | 0 | 29,727 | ||||||||||||||||||||||||
| Hedge of highly probable forecast transactions |
71 | 0 | 0 | 0 | 0 | 0 | 0 | 71 | ||||||||||||||||||||||||
| Hedge of net investment in foreign operations (*) |
12,550 | 0 | 0 | 0 | 0 | 0 | 0 | 12,550 | ||||||||||||||||||||||||
| Hedge of loan operations (Fair value) |
293 | 1,416 | 1,793 | 1,379 | 375 | 822 | 988 | 7,066 | ||||||||||||||||||||||||
| Hedge of loan operations (Cash flow) |
0 | 28 | 162 | 78 | 0 | 0 | 0 | 268 | ||||||||||||||||||||||||
| Hedge of funding (Fair value) |
1,590 | 297 | 154 | 391 | 377 | 3,972 | 2,343 | 9,124 | ||||||||||||||||||||||||
| Hedge of funding (Cash flow) |
2,874 | 0 | 0 | 0 | 0 | 231 | 0 | 3,105 | ||||||||||||||||||||||||
| Hedge of assets transactions |
6,346 | 0 | 1,657 | 0 | 0 | 0 | 0 | 8,003 | ||||||||||||||||||||||||
| Hedge of Asset-backed securities under repurchase agreements |
26,943 | 5,838 | 1,517 | 0 | 3,715 | 0 | 0 | 38,013 | ||||||||||||||||||||||||
| Hedge of assets denominated in UF |
12,241 | 924 | 56 | 0 | 0 | 0 | 0 | 13,221 | ||||||||||||||||||||||||
| Hedge of fair value through other comprehensive income |
4,223 | 0 | 0 | 0 | 0 | 1,178 | 0 | 5,401 | ||||||||||||||||||||||||
|
|
|
|
|
|
|
|
|
|
|
|
|
|
|
|
|
|||||||||||||||||
| Total |
79,056 | 13,232 | 8,858 | 1,848 | 10,204 | 10,020 | 3,331 | 126,549 | ||||||||||||||||||||||||
|
|
|
|
|
|
|
|
|
|
|
|
|
|
|
|
|
|||||||||||||||||
| Strategies |
12/31/2017 | |||||||||||||||||||||||||||||||
| 0-1 year | 1-2 years | 2-3 years | 3-4 years | 4-5 years | 5-10 years | over de 10 years | Total | |||||||||||||||||||||||||
| Hedge of deposits and repurchase agreements |
31,471 | 11,205 | 6,210 | 12,125 | — | 1,656 | — | 62,667 | ||||||||||||||||||||||||
| Hedge of highly probable forecast transactions |
162 | 70 | — | — | — | — | — | 232 | ||||||||||||||||||||||||
| Hedge of net investment in foreign operations (*) |
10,561 | — | — | — | — | — | — | 10,561 | ||||||||||||||||||||||||
| Hedge of loan operations (Fair value) |
268 | 143 | 628 | 1,502 | 1,335 | 642 | 1,459 | 5,977 | ||||||||||||||||||||||||
| Hedge of loan operations (Cash flow) |
— | — | 27 | 157 | 75 | 865 | — | 1,124 | ||||||||||||||||||||||||
| Hedge of funding (Fair value) |
2,399 | 3,669 | 799 | 218 | 348 | 2,099 | 2,625 | 12,157 | ||||||||||||||||||||||||
| Hedge of funding (Cash flow) |
1,646 | 749 | 1,026 | 884 | 525 | 1,614 | — | 6,444 | ||||||||||||||||||||||||
| Hedge of syndicated loan (Fair value) |
794 | — | — | — | — | — | — | 794 | ||||||||||||||||||||||||
| Hedge of assets transactions |
16,726 | 5,940 | — | 1,253 | — | — | — | 23,919 | ||||||||||||||||||||||||
| Hedge of Asset-backed securities under repurchase agreements |
251 | 25,209 | 3,956 | 1,349 | — | 1,090 | — | 31,855 | ||||||||||||||||||||||||
| Hedge of assets denominated in UF |
12,352 | 2,822 | — | 53 | — | — | — | 15,227 | ||||||||||||||||||||||||
| Hedge of fair value through other comprehensive income |
— | — | 223 | — | — | 259 | — | 482 | ||||||||||||||||||||||||
|
|
|
|
|
|
|
|
|
|
|
|
|
|
|
|
|
|||||||||||||||||
| Total |
76,630 | 49,807 | 12,869 | 17,541 | 2,283 | 8,225 | 4,084 | 171,439 | ||||||||||||||||||||||||
|
|
|
|
|
|
|
|
|
|
|
|
|
|
|
|
|
|||||||||||||||||
| (*) | Classified as current, since instruments are frequently renewed. |
F-55
Table of Contents
ITAÚ UNIBANCO HOLDING S.A.
Notes to the Consolidated Financial Statements
At 12/31/2018, 12/31/2017 and 01/01/2017 for balance sheet accounts and
From 01/01 to 12/31 of 2018, 2017 and 2016 for income statement accounts
(In millions of Reais, except information per share)
Note 8 – Financial Assets at Fair Value Through Other Comprehensive Income - Securities
The fair value and corresponding gross carrying amount of Financial Assets at Fair Value Through Other Comprehensive Income - Securities assets are as follows:
| 12/31/2018 | 12/31/2017 | |||||||||||||||||||||||||||||||
| Gross carrying amount |
Fair value adjustments (in stockholders’ equity) |
Expected loss |
Fair value | Gross carrying amount |
Fair value adjustments (in stockholders’ equity) |
Expected loss |
Fair value | |||||||||||||||||||||||||
| Brazilian government securities (1a) |
27,064 | 775 | 0 | 27,839 | 31,933 | 993 | — | 32,926 | ||||||||||||||||||||||||
| Other |
36 | 0 | (36 | ) | 0 | 36 | — | (36 | ) | — | ||||||||||||||||||||||
| Government securities – abroad (1b) |
18,844 | (70 | ) | (2 | ) | 18,772 | 16,583 | (41 | ) | — | 16,542 | |||||||||||||||||||||
| Germany |
22 | 0 | 0 | 22 | — | — | — | — | ||||||||||||||||||||||||
| Colombia |
5,491 | 14 | 0 | 5,505 | 2,928 | 92 | — | 3,020 | ||||||||||||||||||||||||
| Chile |
7,647 | 7 | (1 | ) | 7,653 | 9,554 | (4 | ) | — | 9,550 | ||||||||||||||||||||||
| United States |
2,634 | (16 | ) | 0 | 2,618 | 1,568 | (18 | ) | — | 1,550 | ||||||||||||||||||||||
| France |
891 | 0 | 0 | 891 | — | — | — | — | ||||||||||||||||||||||||
| Paraguay |
1,601 | (71 | ) | (1 | ) | 1,529 | 1,915 | (115 | ) | — | 1,800 | |||||||||||||||||||||
| Uruguay |
557 | (4 | ) | 0 | 553 | 618 | 4 | — | 622 | |||||||||||||||||||||||
| Other |
1 | 0 | 0 | 1 | — | — | — | — | ||||||||||||||||||||||||
| Corporate securities (1c) |
2,719 | 40 | (47 | ) | 2,712 | 2,656 | 73 | (48 | ) | 2,681 | ||||||||||||||||||||||
| Shares |
77 | 84 | 0 | 161 | 73 | 75 | — | 148 | ||||||||||||||||||||||||
| Bank deposit certificates |
1,053 | 0 | 0 | 1,053 | 685 | — | — | 685 | ||||||||||||||||||||||||
| Debentures |
44 | 0 | (42 | ) | 2 | 44 | — | (43 | ) | 1 | ||||||||||||||||||||||
| Eurobonds and others |
1,542 | (44 | ) | (2 | ) | 1,496 | 1,851 | (2 | ) | (2 | ) | 1,847 | ||||||||||||||||||||
| Other |
3 | 0 | (3 | ) | 0 | 3 | — | (3 | ) | — | ||||||||||||||||||||||
|
|
|
|
|
|
|
|
|
|
|
|
|
|
|
|
|
|||||||||||||||||
| Total |
48,663 | 745 | (85 | ) | 49,323 | 51,208 | 1,025 | (84 | ) | 52,149 | ||||||||||||||||||||||
|
|
|
|
|
|
|
|
|
|
|
|
|
|
|
|
|
|||||||||||||||||
| (1) | Financial assets at fair value through other comprehensive income - Securities pledged in guarantee of funding transactions of financial institutions and clients were: a) R$ 25,147 (R$ 26,953 at 12/31/2017), b) R$ 3,583 (R$ 37 at 12/31/2017) and c) R$ 237 (R$ 479 at 12/31/2017), totaling R$ 28,967 (R$ 27,469 at 12/31/2017); |
The gross carrying amount and the fair value of financial assets through other comprehensive income - securities by maturity are as follows:
| 12/31/2018 | 12/31/2017 | |||||||||||||||
| Gross carrying amount |
Fair value | Gross carrying amount |
Fair value | |||||||||||||
| Current |
10,666 | 10,684 | 9,546 | 9,666 | ||||||||||||
| Non-stated maturity |
77 | 161 | 73 | 148 | ||||||||||||
| Up to one year |
10,589 | 10,523 | 9,473 | 9,518 | ||||||||||||
| Non-current |
37,997 | 38,639 | 41,662 | 42,483 | ||||||||||||
| From one to five years |
21,417 | 21,650 | 23,138 | 23,415 | ||||||||||||
| From five to ten years |
11,906 | 12,029 | 11,368 | 11,680 | ||||||||||||
| After ten years |
4,674 | 4,960 | 7,156 | 7,388 | ||||||||||||
|
|
|
|
|
|
|
|
|
|||||||||
| Total |
48,663 | 49,323 | 51,208 | 52,149 | ||||||||||||
|
|
|
|
|
|
|
|
|
|||||||||
F-56
Table of Contents
ITAÚ UNIBANCO HOLDING S.A.
Notes to the Consolidated Financial Statements
At 12/31/2018, 12/31/2017 and 01/01/2017 for balance sheet accounts and
From 01/01 to 12/31 of 2018, 2017 and 2016 for income statement accounts
(In millions of Reais, except information per share)
Equity instruments at fair value through other comprehensive income - securities are presented in the table below:
| 12/31/2018 | ||||||||||||||||
| Gross carrying amount |
Adjustments to fair value (in Stockholders’ equity) |
Expected loss | Fair Value | |||||||||||||
| Negotiable shares |
77 | 84 | 0 | 161 | ||||||||||||
|
|
|
|
|
|
|
|
|
|||||||||
| Total |
77 | 84 | 0 | 161 | ||||||||||||
|
|
|
|
|
|
|
|
|
|||||||||
| 12/31/2017 | ||||||||||||||||
| Gross carrying amount |
Adjustments to fair value (in Stockholders’ equity) |
Expected loss | Fair Value | |||||||||||||
| Negotiable shares |
73 | 75 | — | 148 | ||||||||||||
|
|
|
|
|
|
|
|
|
|||||||||
| Total |
73 | 75 | — | 148 | ||||||||||||
|
|
|
|
|
|
|
|
|
|||||||||
In the period there was no receipt of dividends and there was no reclassification in Stockholder’s Equity.
ITAÚ UNIBANCO HOLDING adopted the option of designating equity instruments at fair value through other comprehensive income due to the particularities of a certain market.
| 12/31/2018 | 12/31/2017 | |||||||||||||||
| Gross carrying amount |
Fair Value |
Gross carrying amount |
Fair Value |
|||||||||||||
| Current |
77 | 161 | 73 | 148 | ||||||||||||
| Non-stated maturity |
77 | 161 | 73 | 148 | ||||||||||||
Reconciliation of expected loss for Financial assets at fair value through other comprehensive instrument - securities, segregated by stages:
| Stage 1 |
Expected loss 01/01/2018 |
Gains / (Losses) |
Purchases | Settlements | Expected loss 12/31/2018 |
|||||||||||||||
| Financial assets at fair value through other comprehensive income |
(84 | ) | (1 | ) | (2 | ) | 2 | (85 | ) | |||||||||||
|
|
|
|
|
|
|
|
|
|
|
|||||||||||
| Brazilian government securities |
(36 | ) | 0 | 0 | 0 | (36 | ) | |||||||||||||
| Other |
(36 | ) | 0 | 0 | 0 | (36 | ) | |||||||||||||
| Corporate securities |
(48 | ) | (1 | ) | (2 | ) | 2 | (49 | ) | |||||||||||
| Debentures |
(43 | ) | 0 | 0 | 0 | (43 | ) | |||||||||||||
| Eurobonds and others |
(2 | ) | (1 | ) | (2 | ) | 2 | (3 | ) | |||||||||||
| Other |
(3 | ) | 0 | 0 | 0 | (3 | ) | |||||||||||||
F-57
Table of Contents
ITAÚ UNIBANCO HOLDING S.A.
Notes to the Consolidated Financial Statements
At 12/31/2018, 12/31/2017 and 01/01/2017 for balance sheet accounts and
From 01/01 to 12/31 of 2018, 2017 and 2016 for income statement accounts
(In millions of Reais, except information per share)
| Stage 1 |
Expected loss 01/01/2017 |
Gains / (Losses) |
Purchases | Settlements | Transfer to stage 2 |
Transfer to stage 3 |
Expected loss 12/31/2017 |
|||||||||||||||||||||
| Financial assets at fair value through other comprehensive income |
(93 | ) | — | (2 | ) | — | — | 11 | (84 | ) | ||||||||||||||||||
|
|
|
|
|
|
|
|
|
|
|
|
|
|
|
|||||||||||||||
| Brazilian government securities |
(36 | ) | — | — | — | — | — | (36 | ) | |||||||||||||||||||
| Others |
(36 | ) | — | — | — | — | — | (36 | ) | |||||||||||||||||||
| Corporate securities |
(57 | ) | — | (2 | ) | — | — | 11 | (48 | ) | ||||||||||||||||||
| Debentures |
(43 | ) | — | — | — | — | — | (43 | ) | |||||||||||||||||||
| Eurobond and others |
(11 | ) | — | (2 | ) | — | — | 11 | (2 | ) | ||||||||||||||||||
| Others |
(3 | ) | — | — | — | — | — | (3 | ) | |||||||||||||||||||
| Stage 3 |
Expected loss 01/01/2017 |
Gains / (Losses) |
Purchases | Settlements | Cure from stage 1 |
Transfer to stage 2 |
Expected loss 12/31/2017 |
|||||||||||||||||||||
| Financial assets at fair value through other comprehensive income |
— | — | — | 10 | (10 | ) | — | — | ||||||||||||||||||||
|
|
|
|
|
|
|
|
|
|
|
|
|
|
|
|||||||||||||||
| Corporate securities |
— | — | — | 10 | (10 | ) | — | — | ||||||||||||||||||||
| Eurobonds and others |
— | — | — | 10 | (10 | ) | — | — | ||||||||||||||||||||
| Stage 1 |
Expected loss 01/01/2016 |
Gains / (Losses) |
Purchases | Settlements | Transfer to stage 2 |
Cure from stage 3 |
Expected loss 12/31/2016 |
|||||||||||||||||||||
| Financial assets at fair value through other comprehensive income |
(82 | ) | — | (1 | ) | — | — | (10 | ) | (93 | ) | |||||||||||||||||
|
|
|
|
|
|
|
|
|
|
|
|
|
|
|
|||||||||||||||
| Brazilian government securities |
(36 | ) | — | — | — | — | — | (36 | ) | |||||||||||||||||||
| Other |
(36 | ) | — | — | — | — | — | (36 | ) | |||||||||||||||||||
| Corporate securities |
(46 | ) | — | (1 | ) | — | — | (10 | ) | (57 | ) | |||||||||||||||||
| Debentures |
(43 | ) | — | — | — | — | — | (43 | ) | |||||||||||||||||||
| Other |
(3 | ) | — | — | — | — | — | (3 | ) | |||||||||||||||||||
| Stage 3 |
Expected loss 01/01/2016 |
Gains / (Losses) |
Purchases | Settlements | Transfer to stage 1 |
Transfer to stage 2 |
Expected loss 12/31/2016 |
|||||||||||||||||||||
| Financial assets at fair value through other comprehensive income |
(13 | ) | — | — | — | 13 | — | — | ||||||||||||||||||||
|
|
|
|
|
|
|
|
|
|
|
|
|
|
|
|||||||||||||||
| Corporate securities |
(13 | ) | — | — | — | 13 | — | — | ||||||||||||||||||||
| Eurobonds and others |
(13 | ) | — | — | — | 13 | — | — | ||||||||||||||||||||
F-58
Table of Contents
ITAÚ UNIBANCO HOLDING S.A.
Notes to the Consolidated Financial Statements
At 12/31/2018, 12/31/2017 and 01/01/2017 for balance sheet accounts and
From 01/01 to 12/31 of 2018, 2017 and 2016 for income statement accounts
(In millions of Reais, except information per share)
Note 9 - Financial assets at amortized cost - Securities
The Financial assets at amortized cost - Securities is as follows:
| 12/31/2018 | 12/31/2017 | |||||||||||||||||||||||
| Amortized cost |
Expected loss |
Fair Value | Amortized cost |
Expected loss |
Fair Value | |||||||||||||||||||
| Brazilian government securities (1a) |
54,064 | (58 | ) | 54,006 | 54,875 | (66 | ) | 54,809 | ||||||||||||||||
| Government securities – abroad (1b) |
6,700 | (3 | ) | 6,697 | 8,414 | (3 | ) | 8,411 | ||||||||||||||||
| Colombia |
356 | (3 | ) | 353 | 836 | (3 | ) | 833 | ||||||||||||||||
| Chile |
256 | 0 | 256 | 154 | — | 154 | ||||||||||||||||||
| Korea |
1,385 | 0 | 1,385 | 1,944 | — | 1,944 | ||||||||||||||||||
| Denmark |
0 | 0 | 0 | 1,951 | — | 1,951 | ||||||||||||||||||
| Spain |
2,411 | 0 | 2,411 | 2,937 | — | 2,937 | ||||||||||||||||||
| United States |
19 | 0 | 19 | 16 | — | 16 | ||||||||||||||||||
| Mexico |
2,258 | 0 | 2,258 | 559 | — | 559 | ||||||||||||||||||
| Paraguay |
0 | 0 | 0 | 4 | — | 4 | ||||||||||||||||||
| Uruguay |
15 | 0 | 15 | 13 | — | 13 | ||||||||||||||||||
| Corporate securities (1c) |
49,631 | (3,585 | ) | 46,046 | 48,135 | (5,113 | ) | 43,022 | ||||||||||||||||
| Rural product note |
4,181 | (178 | ) | 4,003 | 2,899 | (160 | ) | 2,739 | ||||||||||||||||
| Bank deposit certificates |
123 | 0 | 123 | 130 | — | 130 | ||||||||||||||||||
| Securitized real estate loans |
9,876 | (361 | ) | 9,515 | 13,839 | (2,056 | ) | 11,783 | ||||||||||||||||
| Debentures |
29,001 | (3,013 | ) | 25,988 | 23,397 | (2,857 | ) | 20,540 | ||||||||||||||||
| Eurobonds and others |
4,005 | (2 | ) | 4,003 | 3,660 | (3 | ) | 3,657 | ||||||||||||||||
| Financial bills |
0 | 0 | 0 | 60 | — | 60 | ||||||||||||||||||
| Promissory notes |
1,069 | (14 | ) | 1,055 | 3,246 | (23 | ) | 3,223 | ||||||||||||||||
| Other |
1,376 | (17 | ) | 1,359 | 904 | (14 | ) | 890 | ||||||||||||||||
|
|
|
|
|
|
|
|
|
|
|
|
|
|||||||||||||
| Total (2) |
110,395 | (3,646 | ) | 106,749 | 111,424 | (5,182 | ) | 106,242 | ||||||||||||||||
|
|
|
|
|
|
|
|
|
|
|
|
|
|||||||||||||
| (1) | Financial Assets at Amortized Cost – Securities Pledged as Collateral of Funding Transactions of Financial Institutions and Clients were: a) R$ 24,988 (R$ 26,953 at 12/31/2017), b) (R$ 479 at 12/31/2017) and c) R$ 8,860 (R$ 37 at 12/31/2017), totaling R$ 33,848 (R$ 27,469 at 12/31/2017). |
| (2) | In order to reflect the risk management to the current strategy considered in business models, in the period ended 06/30/2018, ITAÚ UNIBANCO HOLDING changed the classification of Brazilian Debt Securities from Fair Value Through Profit or Loss, in the amount of R$ 3,707, and Fair Value Through Other Comprehensive Income, in the amount of R$ 8,678 to amortized cost. The fair value of these instruments at 06/30/2018 was R$ 11,880. In the event these financial assets had not been reclassified, the adjustment to fair value that would have been recognized in Other Comprehensive Income would be of R$ (282), net of tax effects. |
The interest income related to Financial assets at amortized cost - Securities assets was R$ 2,614 (Note 21a).
The fair value of Financial assets at amortized cost - Securities assets is disclosed in Note 28.
The amortized cost of Financial assets at amortized cost - Securities by maturity is as follows:
| 12/31/2018 | 12/31/2017 | |||||||||||||||
| Amortized cost | Fair Value | Amortized cost | Fair Value | |||||||||||||
| Current |
14,661 | 14,119 | 26,057 | 25,652 | ||||||||||||
| Up to one year |
14,661 | 14,119 | 26,057 | 25,652 | ||||||||||||
| Non-current |
95,734 | 92,630 | 85,367 | 80,590 | ||||||||||||
| From one to five years |
51,820 | 50,970 | 53,303 | 50,650 | ||||||||||||
| From five to ten years |
31,318 | 29,802 | 19,883 | 18,571 | ||||||||||||
| After ten years |
12,596 | 11,858 | 12,181 | 11,369 | ||||||||||||
|
|
|
|
|
|
|
|
|
|||||||||
| Total |
110,395 | 106,749 | 111,424 | 106,242 | ||||||||||||
|
|
|
|
|
|
|
|
|
|||||||||
F-59
Table of Contents
ITAÚ UNIBANCO HOLDING S.A.
Notes to the Consolidated Financial Statements
At 12/31/2018, 12/31/2017 and 01/01/2017 for balance sheet accounts and
From 01/01 to 12/31 of 2018, 2017 and 2016 for income statement accounts
(In millions of Reais, except information per share)
Reconciliation of expected loss to financial assets at amortized cost - securities, segregated by stages:
| Stage 1 |
Expected loss 01/01/2018 |
Gains / (Losses) |
Purchases | Settlements | Transfer to Stage 2 |
Transfer to Stage 3 |
Cure from Stage 2 |
Cure from Stage 3 |
Expected loss 12/31/2018 |
|||||||||||||||||||||||||||
| Financial assets at amortized cost |
(76 | ) | (129 | ) | (28 | ) | 14 | 0 | 0 | (4 | ) | 0 | (223 | ) | ||||||||||||||||||||||
|
|
|
|
|
|
|
|
|
|
|
|
|
|
|
|
|
|
|
|||||||||||||||||||
| Government securities - other countries - Colombia |
(3 | ) | 1 | (2 | ) | 0 | 0 | 0 | 0 | 0 | (4 | ) | ||||||||||||||||||||||||
| Corporate securities |
(73 | ) | (130 | ) | (26 | ) | 14 | 0 | 0 | (4 | ) | 0 | (219 | ) | ||||||||||||||||||||||
| Rural product note |
(9 | ) | 5 | (7 | ) | 4 | 0 | 0 | 0 | 0 | (7 | ) | ||||||||||||||||||||||||
| Securitized real estate loans |
(9 | ) | 5 | 0 | 2 | 0 | 0 | 0 | 0 | (2 | ) | |||||||||||||||||||||||||
| Debentures |
(52 | ) | (140 | ) | (18 | ) | 8 | 0 | 0 | (4 | ) | 0 | (206 | ) | ||||||||||||||||||||||
| Eurobond and others |
(2 | ) | 0 | 0 | 0 | 0 | 0 | 0 | 0 | (2 | ) | |||||||||||||||||||||||||
| Promissory notes |
(1 | ) | 0 | (1 | ) | 0 | 0 | 0 | 0 | 0 | (2 | ) | ||||||||||||||||||||||||
| Stage 2 |
Expected loss 01/01/2018 |
Gains / (Losses) |
Purchases | Settlements | Transfer to Stage 1 |
Transfer to Stage 3 |
Cure from Stage 1 |
Cure from Stage 3 |
Expected loss 12/31/2018 |
|||||||||||||||||||||||||||
| Financial assets at amortized cost |
(368 | ) | (12 | ) | (561 | ) | 6 | 51 | 74 | (14 | ) | 0 | (824 | ) | ||||||||||||||||||||||
|
|
|
|
|
|
|
|
|
|
|
|
|
|
|
|
|
|
|
|||||||||||||||||||
| Brazilian government securities |
(65 | ) | 6 | 0 | 0 | 0 | 0 | 0 | 0 | (59 | ) | |||||||||||||||||||||||||
| Corporate securities |
(303 | ) | (18 | ) | (561 | ) | 6 | 51 | 74 | (14 | ) | 0 | (765 | ) | ||||||||||||||||||||||
| Rural product note |
0 | 11 | (22 | ) | 0 | 0 | 11 | 0 | 0 | 0 | ||||||||||||||||||||||||||
| Securitized real estate loans |
(5 | ) | 0 | 0 | 0 | 0 | 6 | (1 | ) | 0 | 0 | |||||||||||||||||||||||||
| Debentures |
(284 | ) | (22 | ) | (539 | ) | 1 | 51 | 36 | (8 | ) | 0 | (765 | ) | ||||||||||||||||||||||
| Eurobond and others |
0 | 0 | 0 | 5 | 0 | 0 | (5 | ) | 0 | 0 | ||||||||||||||||||||||||||
| Other |
(14 | ) | (7 | ) | 0 | 0 | 0 | 21 | 0 | 0 | 0 | |||||||||||||||||||||||||
| Stage 3 |
Expected loss 01/01/2018 |
Gains / (Losses) |
Purchases | Settlements | Transfer to Stage 1 |
Transfer to Stage 2 |
Cure from Stage 1 |
Cure from Stage 2 |
Expected loss 12/31/2018 |
|||||||||||||||||||||||||||
| Financial assets at amortized cost |
(4,738 | ) | 784 | (594 | ) | 2,065 | 0 | 0 | 0 | (116 | ) | (2,599 | ) | |||||||||||||||||||||||
|
|
|
|
|
|
|
|
|
|
|
|
|
|
|
|
|
|
|
|||||||||||||||||||
| Corporate securities |
(4,738 | ) | 784 | (594 | ) | 2,065 | 0 | 0 | 0 | (116 | ) | (2,599 | ) | |||||||||||||||||||||||
| Rural product note |
(148 | ) | (106 | ) | (36 | ) | 127 | 0 | 0 | 0 | (10 | ) | (173 | ) | ||||||||||||||||||||||
| Securitized real estate loans |
(2,046 | ) | 463 | 0 | 1,244 | 0 | 0 | 0 | (22 | ) | (361 | ) | ||||||||||||||||||||||||
| Debentures |
(2,522 | ) | 432 | (558 | ) | 678 | 0 | 0 | 0 | (67 | ) | (2,037 | ) | |||||||||||||||||||||||
| Promissory notes |
(22 | ) | (5 | ) | 0 | 16 | 0 | 0 | 0 | 0 | (11 | ) | ||||||||||||||||||||||||
| Other |
0 | 0 | 0 | 0 | 0 | 0 | 0 | (17 | ) | (17 | ) | |||||||||||||||||||||||||
| Stage 1 |
Expected loss 01/01/2017 |
Gains / (Losses) |
Purchases | Settlements | Transfer to Stage 2 |
Transfer to Stage 3 |
Cure from Stage 2 |
Cure from Stage 3 |
Expected loss 12/31/2017 |
|||||||||||||||||||||||||||
| Financial assets at amortized cost |
(82 | ) | (24 | ) | (44 | ) | 48 | — | 26 | — | — | (76 | ) | |||||||||||||||||||||||
|
|
|
|
|
|
|
|
|
|
|
|
|
|
|
|
|
|
|
|||||||||||||||||||
| Government securities - other countries - Colombia |
(3 | ) | — | — | — | — | — | — | — | (3 | ) | |||||||||||||||||||||||||
| Corporate securities |
(79 | ) | (24 | ) | (44 | ) | 48 | — | 26 | — | — | (73 | ) | |||||||||||||||||||||||
| Rural product note |
(4 | ) | (2 | ) | (7 | ) | 4 | — | — | — | — | (9 | ) | |||||||||||||||||||||||
| Securitized real estate loans |
(17 | ) | (3 | ) | — | — | — | 11 | — | — | (9 | ) | ||||||||||||||||||||||||
| Debentures |
(50 | ) | (20 | ) | (35 | ) | 39 | — | 14 | — | — | (52 | ) | |||||||||||||||||||||||
| Eurobond and others |
(5 | ) | 1 | (1 | ) | 3 | — | — | — | — | (2 | ) | ||||||||||||||||||||||||
| Promissory notes |
(1 | ) | — | (1 | ) | 1 | — | — | — | — | (1 | ) | ||||||||||||||||||||||||
| Others |
(2 | ) | — | — | 1 | — | 1 | — | — | — | ||||||||||||||||||||||||||
F-60
Table of Contents
ITAÚ UNIBANCO HOLDING S.A.
Notes to the Consolidated Financial Statements
At 12/31/2018, 12/31/2017 and 01/01/2017 for balance sheet accounts and
From 01/01 to 12/31 of 2018, 2017 and 2016 for income statement accounts
(In millions of Reais, except information per share)
| Stage 2 |
Expected loss 01/01/2017 |
Gains / (Losses) |
Purchases | Settlements | Transfer to Stage 1 |
Transfer to Stage 3 |
Cure from Stage 1 |
Cure from Stage 3 |
Expected loss 12/31/2017 |
|||||||||||||||||||||||||||
| Financial assets at amortized cost |
(438 | ) | (73 | ) | (281 | ) | 314 | — | 176 | (66 | ) | — | (368 | ) | ||||||||||||||||||||||
|
|
|
|
|
|
|
|
|
|
|
|
|
|
|
|
|
|
|
|||||||||||||||||||
| Brazilian government securities |
(72 | ) | 7 | — | — | — | — | — | — | (65 | ) | |||||||||||||||||||||||||
| Corporate securities |
(366 | ) | (80 | ) | (281 | ) | 314 | — | 176 | (66 | ) | — | (303 | ) | ||||||||||||||||||||||
| Rural product note |
(30 | ) | (3 | ) | — | 33 | — | — | — | — | — | |||||||||||||||||||||||||
| Securitized real estate loans |
(50 | ) | 2 | — | — | — | 43 | — | — | (5 | ) | |||||||||||||||||||||||||
| Debentures |
(286 | ) | (79 | ) | (267 | ) | 281 | — | 133 | (66 | ) | — | (284 | ) | ||||||||||||||||||||||
| Others |
— | — | (14 | ) | — | — | — | — | — | (14 | ) | |||||||||||||||||||||||||
| Stage 3 |
Expected loss 01/01/2017 |
Gains / (Losses) |
Purchases | Settlements | Transfer to Stage 1 |
Transfer to Stage 2 |
Cure from Stage 1 |
Cure from Stage 2 |
Expected loss 12/31/2017 |
|||||||||||||||||||||||||||
| Financial assets at amortized cost |
(3,298 | ) | (528 | ) | (1,276 | ) | 1,221 | — | — | (115 | ) | (742 | ) | (4,738 | ) | |||||||||||||||||||||
|
|
|
|
|
|
|
|
|
|
|
|
|
|
|
|
|
|
|
|||||||||||||||||||
| Corporate securities |
(3,298 | ) | (528 | ) | (1,276 | ) | 1,221 | — | — | (115 | ) | (742 | ) | (4,738 | ) | |||||||||||||||||||||
| Rural product note |
(56 | ) | (37 | ) | (55 | ) | — | — | — | — | — | (148 | ) | |||||||||||||||||||||||
| Securitized real estate loans |
(1,650 | ) | (200 | ) | — | 125 | — | — | (115 | ) | (206 | ) | (2,046 | ) | ||||||||||||||||||||||
| Debentures |
(1,469 | ) | (294 | ) | (1,199 | ) | 976 | — | — | — | (536 | ) | (2,522 | ) | ||||||||||||||||||||||
| Eurobond and others |
(101 | ) | 3 | — | 98 | — | — | — | — | — | ||||||||||||||||||||||||||
| Promissory notes |
(22 | ) | — | (22 | ) | 22 | — | — | — | — | (22 | ) | ||||||||||||||||||||||||
| Stage 1 |
Expected loss 01/01/2016 |
Gains / (Losses) |
Purchases | Settlements | Transfer to Stage 2 |
Transfer to Stage 3 |
Cure from Stage 2 |
Cure from Stage 3 |
Expected loss 12/31/2016 |
|||||||||||||||||||||||||||
| Financial assets at amortized cost |
(199 | ) | 31 | (34 | ) | 60 | 12 | 48 | — | — | (82 | ) | ||||||||||||||||||||||||
|
|
|
|
|
|
|
|
|
|
|
|
|
|
|
|
|
|
|
|||||||||||||||||||
| Government securities - other countries - Colombia |
(3 | ) | — | — | (3 | ) | ||||||||||||||||||||||||||||||
| Corporate securities |
(199 | ) | 31 | (31 | ) | 60 | 12 | 48 | — | — | (79 | ) | ||||||||||||||||||||||||
| Rural product note |
(2 | ) | (1 | ) | (2 | ) | 1 | — | — | — | — | (4 | ) | |||||||||||||||||||||||
| Securitized real estate loans |
(54 | ) | 1 | — | 1 | 2 | 33 | — | — | (17 | ) | |||||||||||||||||||||||||
| Debentures |
(109 | ) | 27 | (25 | ) | 35 | 10 | 12 | — | — | (50 | ) | ||||||||||||||||||||||||
| Eurobond and others |
(32 | ) | 4 | (2 | ) | 22 | — | 3 | — | — | (5 | ) | ||||||||||||||||||||||||
| Promissory notes |
(2 | ) | — | — | 1 | — | — | — | — | (1 | ) | |||||||||||||||||||||||||
| Outros |
— | — | (2 | ) | — | — | — | — | — | (2 | ) | |||||||||||||||||||||||||
| Stage 2 |
Expected loss 12/31/2016 |
Gains / (Losses) |
Purchases | Settlements | Transfer to Stage 1 |
Transfer to Stage 3 |
Cure from Stage 1 |
Cure from Stage 3 |
Expected loss 12/31/2016 |
|||||||||||||||||||||||||||
| Financial assets at amortized cost |
(385 | ) | 21 | (131 | ) | 161 | — | 68 | (172 | ) | — | (438 | ) | |||||||||||||||||||||||
|
|
|
|
|
|
|
|
|
|
|
|
|
|
|
|
|
|
|
|||||||||||||||||||
| Brazilian government securities |
(78 | ) | 6 | — | — | — | — | — | — | (72 | ) | |||||||||||||||||||||||||
| Corporate securities |
(307 | ) | 15 | (131 | ) | 161 | — | 68 | (172 | ) | — | (366 | ) | |||||||||||||||||||||||
| Rural product note |
(26 | ) | 11 | (17 | ) | 2 | — | — | — | — | (30 | ) | ||||||||||||||||||||||||
| Securitized real estate loans |
(6 | ) | — | — | — | — | 6 | (50 | ) | — | (50 | ) | ||||||||||||||||||||||||
| Debentures |
(223 | ) | 4 | (114 | ) | 107 | — | 62 | (122 | ) | — | (286 | ) | |||||||||||||||||||||||
| Eurobond and others |
(13 | ) | — | — | 13 | — | — | — | — | — | ||||||||||||||||||||||||||
| Outros |
(39 | ) | — | — | 39 | — | — | — | — | — | ||||||||||||||||||||||||||
| Stage 3 |
Expected loss 01/01/2016 |
Gains / (Losses) |
Purchases | Settlements | Transfer to Stage 1 |
Transfer to Stage 2 |
Cure from Stage 1 |
Cure from Stage 2 |
Expected loss 12/31/2016 |
|||||||||||||||||||||||||||
| Financial assets at amortized cost |
(425 | ) | (186 | ) | (720 | ) | 176 | — | — | (1,699 | ) | (444 | ) | (3,298 | ) | |||||||||||||||||||||
|
|
|
|
|
|
|
|
|
|
|
|
|
|
|
|
|
|
|
|||||||||||||||||||
| Corporate securities |
(425 | ) | (186 | ) | (720 | ) | 176 | — | — | (1,699 | ) | (444 | ) | (3,298 | ) | |||||||||||||||||||||
| Rural product note |
— | (56 | ) | — | — | — | — | — | — | (56 | ) | |||||||||||||||||||||||||
| Securitized real estate loans |
(10 | ) | (1 | ) | (95 | ) | 10 | — | — | (1,321 | ) | (233 | ) | (1,650 | ) | |||||||||||||||||||||
| Debentures |
(285 | ) | (149 | ) | (623 | ) | 61 | — | — | (262 | ) | (211 | ) | (1,469 | ) | |||||||||||||||||||||
| Eurobond and others |
(52 | ) | 20 | (2 | ) | 27 | — | — | (94 | ) | — | (101 | ) | |||||||||||||||||||||||
| Promissory notes |
(78 | ) | — | — | 78 | — | — | (22 | ) | — | (22 | ) | ||||||||||||||||||||||||
F-61
Table of Contents
ITAÚ UNIBANCO HOLDING S.A.
Notes to the Consolidated Financial Statements
At 12/31/2018, 12/31/2017 and 01/01/2017 for balance sheet accounts and
From 01/01 to 12/31 of 2018, 2017 and 2016 for income statement accounts
(In millions of Reais, except information per share)
Note 10 - Loan operations and lease operations portfolio
| a) | Composition of loan operations and lease operations |
Below is the composition of the carrying amount of loan operations and lease operations by type, sector of debtor, maturity and concentration:
| Loan operations and lease operations by type |
12/31/2018 | 12/31/2017 | ||||||
| Individuals |
212,564 | 193,385 | ||||||
| Credit card |
78,255 | 67,413 | ||||||
| Personal loan |
29,543 | 27,295 | ||||||
| Payroll loans |
46,878 | 44,716 | ||||||
| Vehicles |
15,920 | 14,165 | ||||||
| Mortgage loans |
41,968 | 39,796 | ||||||
| Corporate |
102,643 | 107,647 | ||||||
| Small and medium businesses |
68,812 | 60,290 | ||||||
| Foreign loans - Latin America |
152,072 | 136,397 | ||||||
|
|
|
|
|
|||||
| Total Loan Operations and Lease Operations |
536,091 | 497,719 | ||||||
|
|
|
|
|
|||||
| Provision for Expected Loss (*) |
(33,509 | ) | (36,469 | ) | ||||
|
|
|
|
|
|||||
| Total loan operations and lease operations, net of allowance for Expected Credit Loss |
502,582 | 461,250 | ||||||
|
|
|
|
|
|||||
| (*) | Comprises Provision for Expected Loss for Financial Guarantees Pledged R$ (1,191) (R$ (1,907) at 12/31/2017) and Commitments to be Released R$ (2,601) (R$ (3,015) at 12/31/2017). |
| By maturity |
12/31/2018 | 12/31/2017 | ||||||
| Overdue as from 1 day |
19,563 | 21,974 | ||||||
| Falling due up to 3 months |
144,812 | 127,402 | ||||||
| Falling due more than 3 months but less than 1 year |
127,805 | 116,089 | ||||||
| Falling due after 1 year |
243,911 | 232,254 | ||||||
|
|
|
|
|
|||||
| Total loan operations and lease operations |
536,091 | 497,719 | ||||||
|
|
|
|
|
|||||
| By concentration (*) |
12/31/2018 | 12/31/2017 | ||||||
| Largest debtor |
5,193 | 4,079 | ||||||
| 10 largest debtors |
31,564 | 28,958 | ||||||
| 20 largest debtors |
47,433 | 46,313 | ||||||
| 50 largest debtors |
73,358 | 74,772 | ||||||
| 100 largest debtors |
98,675 | 101,149 | ||||||
| (*) | The amounts include Financial Guarantees Pledged |
The breakdown of the Loan and lease operations portfolio by debtor’s industry is evidenced in Note 32, item 1.4.1 - By business sector.
F-62
Table of Contents
ITAÚ UNIBANCO HOLDING S.A.
Notes to the Consolidated Financial Statements
At 12/31/2018, 12/31/2017 and 01/01/2017 for balance sheet accounts and
From 01/01 to 12/31 of 2018, 2017 and 2016 for income statement accounts
(In millions of Reais, except information per share)
| b) | Gross Carrying Amount (Loan Portfolio) |
Reconciliation of gross portfolio of Loan Operations and Lease Operations, segregated by stages:
| Stage 1 |
Beginning balance at 12/31/2017 |
Transfer to Stage 2 |
Transfer to Stage 3 |
Cure from the Stage 2 |
Cure from the Stage 3 |
Derecognition | Acquisition / (Settlement) |
Closing balance at 12/31/2018 |
||||||||||||||||||||||||
| Individuals |
161,364 | (15,847 | ) | (1,921 | ) | 5,820 | 0 | 0 | 28,072 | 177,488 | ||||||||||||||||||||||
| Credit card |
57,073 | (6,361 | ) | (471 | ) | 3,335 | 0 | 0 | 11,651 | 65,227 | ||||||||||||||||||||||
| Personal loans |
12,290 | (4,854 | ) | (908 | ) | 665 | 0 | 0 | 6,932 | 14,125 | ||||||||||||||||||||||
| Payroll loans |
42,115 | (1,882 | ) | (431 | ) | 542 | 0 | 0 | 3,812 | 44,156 | ||||||||||||||||||||||
| Vehicles |
12,550 | (1,442 | ) | (104 | ) | 322 | 0 | 0 | 3,027 | 14,353 | ||||||||||||||||||||||
| Mortgage loans |
37,336 | (1,308 | ) | (7 | ) | 956 | 0 | 0 | 2,650 | 39,627 | ||||||||||||||||||||||
| Corporate |
91,442 | (726 | ) | (137 | ) | 1,629 | 113 | 0 | (1,605 | ) | 90,716 | |||||||||||||||||||||
| Small and medium businesses |
47,132 | (4,891 | ) | (742 | ) | 2,849 | 22 | 0 | 12,729 | 57,099 | ||||||||||||||||||||||
| Foreign loans - Latin America |
117,448 | (10,913 | ) | (1,261 | ) | 9,691 | 132 | 0 | 19,226 | 134,323 | ||||||||||||||||||||||
|
|
|
|
|
|
|
|
|
|
|
|
|
|
|
|
|
|||||||||||||||||
| Total |
417,386 | (32,377 | ) | (4,061 | ) | 19,989 | 267 | 0 | 58,422 | 459,626 | ||||||||||||||||||||||
|
|
|
|
|
|
|
|
|
|
|
|
|
|
|
|
|
|||||||||||||||||
| Stage 2 |
Beginning balance at 12/31/2017 |
Transfer to Stage 1 |
Transfer to Stage 3 |
Cure from the Stage 1 |
Cure from the Stage 3 |
Derecognition | Acquisition / (Settlement) |
Closing balance at 12/31/2018 |
||||||||||||||||||||||||
| Individuals |
13,032 | (5,820 | ) | (7,796 | ) | 15,847 | 1,018 | 0 | 748 | 17,029 | ||||||||||||||||||||||
| Credit card |
6,027 | (3,335 | ) | (2,794 | ) | 6,361 | 60 | 0 | 2,170 | 8,489 | ||||||||||||||||||||||
| Personal loans |
3,108 | (665 | ) | (2,970 | ) | 4,854 | 611 | 0 | (511 | ) | 4,427 | |||||||||||||||||||||
| Payroll loans |
733 | (542 | ) | (1,136 | ) | 1,882 | 131 | 0 | (44 | ) | 1,024 | |||||||||||||||||||||
| Vehicles |
987 | (322 | ) | (598 | ) | 1,442 | 65 | 0 | (552 | ) | 1,022 | |||||||||||||||||||||
| Mortgage loans |
2,177 | (956 | ) | (298 | ) | 1,308 | 151 | 0 | (315 | ) | 2,067 | |||||||||||||||||||||
| Corporate |
3,833 | (1,629 | ) | (1,032 | ) | 726 | 1,347 | 0 | (1,023 | ) | 2,222 | |||||||||||||||||||||
| Small and medium businesses |
6,001 | (2,849 | ) | (1,610 | ) | 4,891 | 505 | 0 | (1,063 | ) | 5,875 | |||||||||||||||||||||
| Foreign loans - Latin America |
13,028 | (9,691 | ) | (3,025 | ) | 10,913 | 1,002 | 0 | (459 | ) | 11,768 | |||||||||||||||||||||
|
|
|
|
|
|
|
|
|
|
|
|
|
|
|
|
|
|||||||||||||||||
| Total |
35,894 | (19,989 | ) | (13,463 | ) | 32,377 | 3,872 | 0 | (1,797 | ) | 36,894 | |||||||||||||||||||||
|
|
|
|
|
|
|
|
|
|
|
|
|
|
|
|
|
|||||||||||||||||
| Stage 3 |
Beginning balance at 12/31/2017 |
Transfer to Stage 1 |
Transfer to Stage 2 |
Cure from the Stage 1 |
Cure from the Stage 2 |
Derecognition | Acquisition / (Settlement) |
Closing balance at 12/31/2018 |
||||||||||||||||||||||||
| Individuals |
18,989 | 0 | (1,018 | ) | 1,921 | 7,796 | (8,520 | ) | (1,121 | ) | 18,047 | |||||||||||||||||||||
| Credit card |
4,313 | 0 | (60 | ) | 471 | 2,794 | (3,155 | ) | 176 | 4,539 | ||||||||||||||||||||||
| Personal loans |
11,897 | 0 | (611 | ) | 908 | 2,970 | (3,724 | ) | (449 | ) | 10,991 | |||||||||||||||||||||
| Payroll loans |
1,868 | 0 | (131 | ) | 431 | 1,136 | (1,336 | ) | (270 | ) | 1,698 | |||||||||||||||||||||
| Vehicles |
628 | 0 | (65 | ) | 104 | 598 | (283 | ) | (437 | ) | 545 | |||||||||||||||||||||
| Mortgage loans |
283 | 0 | (151 | ) | 7 | 298 | (22 | ) | (141 | ) | 274 | |||||||||||||||||||||
| Corporate |
12,372 | (113 | ) | (1,347 | ) | 137 | 1,032 | (1,172 | ) | (1,204 | ) | 9,705 | ||||||||||||||||||||
| Small and medium businesses |
7,157 | (22 | ) | (505 | ) | 742 | 1,610 | (2,471 | ) | (673 | ) | 5,838 | ||||||||||||||||||||
| Foreign loans - Latin America |
5,921 | (132 | ) | (1,002 | ) | 1,261 | 3,025 | (1,384 | ) | (1,708 | ) | 5,981 | ||||||||||||||||||||
|
|
|
|
|
|
|
|
|
|
|
|
|
|
|
|
|
|||||||||||||||||
| Total |
44,439 | (267 | ) | (3,872 | ) | 4,061 | 13,463 | (13,547 | ) | (4,706 | ) | 39,571 | ||||||||||||||||||||
|
|
|
|
|
|
|
|
|
|
|
|
|
|
|
|
|
|||||||||||||||||
F-63
Table of Contents
ITAÚ UNIBANCO HOLDING S.A.
Notes to the Consolidated Financial Statements
At 12/31/2018, 12/31/2017 and 01/01/2017 for balance sheet accounts and
From 01/01 to 12/31 of 2018, 2017 and 2016 for income statement accounts
(In millions of Reais, except information per share)
| Consolidated 3 Stages |
Beginning balance at 12/31/2017 |
Derecognition | Acquisition / (Settlement) |
Closing balance at 12/31/2018 |
||||||||||||
| Individuals |
193,385 | (8,520 | ) | 27,699 | 212,564 | |||||||||||
| Credit card |
67,413 | (3,155 | ) | 13,997 | 78,255 | |||||||||||
| Personal loans |
27,295 | (3,724 | ) | 5,972 | 29,543 | |||||||||||
| Payroll loans |
44,716 | (1,336 | ) | 3,498 | 46,878 | |||||||||||
| Vehicles |
14,165 | (283 | ) | 2,038 | 15,920 | |||||||||||
| Mortgage loans |
39,796 | (22 | ) | 2,194 | 41,968 | |||||||||||
| Corporate |
107,647 | (1,172 | ) | (3,832 | ) | 102,643 | ||||||||||
| Small and medium businesses |
60,290 | (2,471 | ) | 10,993 | 68,812 | |||||||||||
| Foreign loans - Latin America |
136,397 | (1,384 | ) | 17,059 | 152,072 | |||||||||||
|
|
|
|
|
|
|
|
|
|||||||||
| Total |
497,719 | (13,547 | ) | 51,919 | 536,091 | |||||||||||
|
|
|
|
|
|
|
|
|
|||||||||
Reconciliation of gross portfolio of Loan Operations and Lease Operations, segregated by stages:
| Stage 1 |
Beginning balance at 12/31/2016 |
Transfer to Stage 2 |
Transfer to Stage 3 |
Cure from the Stage 2 |
Cure from the Stage 3 |
Derecognition | Acquisition / (Settlement) |
Closing balance at 12/31/2017 |
||||||||||||||||||||||||
| Individuals |
151,645 | (3,925 | ) | (2,346 | ) | 2,747 | 72 | — | 13,171 | 161,364 | ||||||||||||||||||||||
| Credit card |
48,772 | (1,191 | ) | (176 | ) | 1,513 | 10 | — | 8,145 | 57,073 | ||||||||||||||||||||||
| Personal loans |
11,068 | (621 | ) | (907 | ) | 313 | 6 | — | 2,431 | 12,290 | ||||||||||||||||||||||
| Payroll loans |
42,360 | (412 | ) | (866 | ) | 225 | 33 | — | 775 | 42,115 | ||||||||||||||||||||||
| Vehicles |
13,482 | (733 | ) | (338 | ) | 211 | 9 | — | (81 | ) | 12,550 | |||||||||||||||||||||
| Mortgage loans |
35,963 | (968 | ) | (59 | ) | 485 | 14 | — | 1,901 | 37,336 | ||||||||||||||||||||||
| Corporate |
104,359 | (884 | ) | (731 | ) | 894 | 4 | — | (12,200 | ) | 91,442 | |||||||||||||||||||||
| Small and medium businesses |
43,047 | (1,599 | ) | (701 | ) | 901 | 10 | — | 5,474 | 47,132 | ||||||||||||||||||||||
| Foreign loans - Latin America |
113,441 | (5,913 | ) | (1,589 | ) | 1,501 | 74 | — | 9,934 | 117,448 | ||||||||||||||||||||||
|
|
|
|
|
|
|
|
|
|
|
|
|
|
|
|
|
|||||||||||||||||
| Total |
412,492 | (12,321 | ) | (5,367 | ) | 6,043 | 160 | — | 16,379 | 417,386 | ||||||||||||||||||||||
|
|
|
|
|
|
|
|
|
|
|
|
|
|
|
|
|
|||||||||||||||||
| Stage 2 |
Beginning balance at 12/31/2016 |
Transfer to Stage 1 |
Transfer to Stage 3 |
Cure from the Stage 1 |
Cure from the Stage 3 |
Derecognition | Acquisition / (Settlement) |
Closing balance at 12/31/2017 |
||||||||||||||||||||||||
| Individuals |
14,248 | (2,747 | ) | (2,282 | ) | 3,925 | 665 | — | (777 | ) | 13,032 | |||||||||||||||||||||
| Credit card |
6,634 | (1,513 | ) | (722 | ) | 1,191 | 12 | — | 425 | 6,027 | ||||||||||||||||||||||
| Personal loans |
3,534 | (313 | ) | (872 | ) | 621 | 515 | — | (377 | ) | 3,108 | |||||||||||||||||||||
| Payroll loans |
771 | (225 | ) | (241 | ) | 412 | 44 | — | (28 | ) | 733 | |||||||||||||||||||||
| Vehicles |
1,269 | (211 | ) | (297 | ) | 733 | 39 | — | (546 | ) | 987 | |||||||||||||||||||||
| Mortgage loans |
2,040 | (485 | ) | (150 | ) | 968 | 55 | — | (251 | ) | 2,177 | |||||||||||||||||||||
| Corporate |
5,877 | (894 | ) | (434 | ) | 884 | 90 | — | (1,690 | ) | 3,833 | |||||||||||||||||||||
| Small and medium businesses |
7,815 | (901 | ) | (946 | ) | 1,599 | 428 | — | (1,994 | ) | 6,001 | |||||||||||||||||||||
| Foreign loans - Latin America |
8,964 | (1,501 | ) | (1,246 | ) | 5,913 | 134 | — | 764 | 13,028 | ||||||||||||||||||||||
|
|
|
|
|
|
|
|
|
|
|
|
|
|
|
|
|
|||||||||||||||||
| Total |
36,904 | (6,043 | ) | (4,908 | ) | 12,321 | 1,317 | — | (3,697 | ) | 35,894 | |||||||||||||||||||||
|
|
|
|
|
|
|
|
|
|
|
|
|
|
|
|
|
|||||||||||||||||
F-64
Table of Contents
ITAÚ UNIBANCO HOLDING S.A.
Notes to the Consolidated Financial Statements
At 12/31/2018, 12/31/2017 and 01/01/2017 for balance sheet accounts and
From 01/01 to 12/31 of 2018, 2017 and 2016 for income statement accounts
(In millions of Reais, except information per share)
| Stage 3 |
Beginning balance at 12/31/2016 |
Transfer to Stage 1 |
Transfer to Stage 2 |
Cure from the Stage 1 |
Cure from the Stage 2 |
Derecognition | Acquisition/ (Settlement) |
Closing balance at 12/31/2017 |
||||||||||||||||||||||||
| Individuals |
20,574 | (72 | ) | (665 | ) | 2,346 | 2,282 | (10,728 | ) | 5,252 | 18,989 | |||||||||||||||||||||
| Credit card |
4,457 | (10 | ) | (12 | ) | 176 | 722 | (3,891 | ) | 2,871 | 4,313 | |||||||||||||||||||||
| Personal loans |
13,328 | (6 | ) | (515 | ) | 907 | 872 | (5,190 | ) | 2,501 | 11,897 | |||||||||||||||||||||
| Payroll loans |
1,729 | (33 | ) | (44 | ) | 866 | 241 | (1,177 | ) | 286 | 1,868 | |||||||||||||||||||||
| Vehicles |
815 | (9 | ) | (39 | ) | 338 | 297 | (433 | ) | (341 | ) | 628 | ||||||||||||||||||||
| Mortgage loans |
245 | (14 | ) | (55 | ) | 59 | 150 | (37 | ) | (65 | ) | 283 | ||||||||||||||||||||
| Corporate |
11,525 | (4 | ) | (90 | ) | 731 | 434 | (956 | ) | 732 | 12,372 | |||||||||||||||||||||
| Small and medium businesses |
8,985 | (10 | ) | (428 | ) | 701 | 946 | (3,648 | ) | 611 | 7,157 | |||||||||||||||||||||
| Foreign loans - Latin America |
4,371 | (74 | ) | (134 | ) | 1,589 | 1,246 | (1,105 | ) | 28 | 5,921 | |||||||||||||||||||||
|
|
|
|
|
|
|
|
|
|
|
|
|
|
|
|
|
|||||||||||||||||
| Total |
45,455 | (160 | ) | (1,317 | ) | 5,367 | 4,908 | (16,437 | ) | 6,623 | 44,439 | |||||||||||||||||||||
|
|
|
|
|
|
|
|
|
|
|
|
|
|
|
|
|
|||||||||||||||||
| Consolidated 3 Stages |
Beginning balance at 12/31/2016 |
Derecognition | Acquisition/ (Settlement) |
Closing balance at 12/31/2017 |
||||||||||||||||||||||||||||
| Individuals |
186,467 | (10,728 | ) | 17,646 | 193,385 | |||||||||||||||||||||||||||
| Credit card |
59,863 | (3,891 | ) | 11,441 | 67,413 | |||||||||||||||||||||||||||
| Personal loans |
27,930 | (5,190 | ) | 4,555 | 27,295 | |||||||||||||||||||||||||||
| Payroll loans |
44,860 | (1,177 | ) | 1,033 | 44,716 | |||||||||||||||||||||||||||
| Vehicles |
15,566 | (433 | ) | (968 | ) | 14,165 | ||||||||||||||||||||||||||
| Mortgage loans |
38,248 | (37 | ) | 1,585 | 39,796 | |||||||||||||||||||||||||||
| Corporate |
121,761 | (956 | ) | (13,158 | ) | 107,647 | ||||||||||||||||||||||||||
| Small and medium businesses |
59,847 | (3,648 | ) | 4,091 | 60,290 | |||||||||||||||||||||||||||
| Foreign loans - Latin America |
126,776 | (1,105 | ) | 10,726 | 136,397 | |||||||||||||||||||||||||||
|
|
|
|
|
|
|
|
|
|||||||||||||||||||||||||
| Total |
494,851 | (16,437 | ) | 19,305 | 497,719 | |||||||||||||||||||||||||||
|
|
|
|
|
|
|
|
|
|||||||||||||||||||||||||
c) Expected credit loss
Reconciliation of expected loan losses for Loan operations and lease operations, segregated by stages:
| Stage 1 |
Beginning balance at 01/01/2018 |
Transfer to Stage 2 |
Transfer to Stage 3 |
Cure from the Stage 2 |
Cure from the Stage 3 |
Derecognition | Net increase/ (Reversal) |
Closing balance at 12/31/2018 |
||||||||||||||||||||||||
| Individuals |
(3,834 | ) | 708 | 313 | (388 | ) | 0 | 0 | (691 | ) | (3,892 | ) | ||||||||||||||||||||
| Credit card |
(2,135 | ) | 303 | 70 | (246 | ) | 0 | 0 | 7 | (2,001 | ) | |||||||||||||||||||||
| Personal loans |
(759 | ) | 250 | 153 | (39 | ) | 0 | 0 | (568 | ) | (963 | ) | ||||||||||||||||||||
| Payroll loans |
(805 | ) | 98 | 82 | (79 | ) | 0 | 0 | (73 | ) | (777 | ) | ||||||||||||||||||||
| Vehicles |
(123 | ) | 55 | 8 | (16 | ) | 0 | 0 | (65 | ) | (141 | ) | ||||||||||||||||||||
| Mortgage loans |
(12 | ) | 2 | 0 | (8 | ) | 0 | 0 | 8 | (10 | ) | |||||||||||||||||||||
| Corporate |
(451 | ) | 7 | 1 | (259 | ) | (85 | ) | 0 | 256 | (531 | ) | ||||||||||||||||||||
| Small and medium businesses |
(1,149 | ) | 213 | 75 | (177 | ) | (4 | ) | 0 | (70 | ) | (1,112 | ) | |||||||||||||||||||
| Foreign loans - Latin America |
(1,013 | ) | 142 | 20 | (659 | ) | (45 | ) | 0 | 159 | (1,396 | ) | ||||||||||||||||||||
|
|
|
|
|
|
|
|
|
|
|
|
|
|
|
|
|
|||||||||||||||||
| Total |
(6,447 | ) | 1,070 | 409 | (1,483 | ) | (134 | ) | 0 | (346 | ) | (6,931 | ) | |||||||||||||||||||
|
|
|
|
|
|
|
|
|
|
|
|
|
|
|
|
|
|||||||||||||||||
F-65
Table of Contents
ITAÚ UNIBANCO HOLDING S.A.
Notes to the Consolidated Financial Statements
At 12/31/2018, 12/31/2017 and 01/01/2017 for balance sheet accounts and
From 01/01 to 12/31 of 2018, 2017 and 2016 for income statement accounts
(In millions of Reais, except information per share)
| Stage 2 |
Beginning balance at 01/01/2018 |
Transfer to Stage 1 |
Transfer to Stage 3 |
Cure from the Stage 1 |
Cure from the Stage 3 |
Derecognition | Net increase / (Reversal) |
Closing balance at 12/31/2018 |
||||||||||||||||||||||||
| Individuals |
(2,209 | ) | 388 | 3,258 | (708 | ) | (145 | ) | 0 | (2,700 | ) | (2,116 | ) | |||||||||||||||||||
| Credit card |
(1,261 | ) | 246 | 1,309 | (303 | ) | (29 | ) | 0 | (1,048 | ) | (1,086 | ) | |||||||||||||||||||
| Personal loans |
(567 | ) | 39 | 1,194 | (250 | ) | (78 | ) | 0 | (1,013 | ) | (675 | ) | |||||||||||||||||||
| Payroll loans |
(262 | ) | 79 | 628 | (98 | ) | (13 | ) | 0 | (577 | ) | (243 | ) | |||||||||||||||||||
| Vehicles |
(108 | ) | 16 | 113 | (55 | ) | (16 | ) | 0 | (44 | ) | (94 | ) | |||||||||||||||||||
| Mortgage loans |
(11 | ) | 8 | 14 | (2 | ) | (9 | ) | 0 | (18 | ) | (18 | ) | |||||||||||||||||||
| Corporate |
(1,174 | ) | 259 | 193 | (7 | ) | (147 | ) | 0 | 281 | (595 | ) | ||||||||||||||||||||
| Small and medium businesses |
(701 | ) | 177 | 430 | (213 | ) | (195 | ) | 0 | (55 | ) | (557 | ) | |||||||||||||||||||
| Foreign loans - Latin America |
(1,223 | ) | 659 | 406 | (142 | ) | (405 | ) | 0 | (478 | ) | (1,183 | ) | |||||||||||||||||||
|
|
|
|
|
|
|
|
|
|
|
|
|
|
|
|
|
|||||||||||||||||
| Total |
(5,307 | ) | 1,483 | 4,287 | (1,070 | ) | (892 | ) | 0 | (2,952 | ) | (4,451 | ) | |||||||||||||||||||
|
|
|
|
|
|
|
|
|
|
|
|
|
|
|
|
|
|||||||||||||||||
| Stage 3 |
Beginning balance at 01/01/2018 |
Transfer to Stage 1 |
Transfer to Stage 2 |
Cure from the Stage 1 |
Cure from the Stage 2 |
Derecognition | Net increase / (Reversal) |
Closing balance at 12/31/2018 |
||||||||||||||||||||||||
| Individuals |
(8,787 | ) | 0 | 145 | (313 | ) | (3,258 | ) | 8,520 | (4,724 | ) | (8,417 | ) | |||||||||||||||||||
| Credit card |
(3,288 | ) | 0 | 29 | (70 | ) | (1,309 | ) | 3,155 | (1,507 | ) | (2,990 | ) | |||||||||||||||||||
| Personal loans |
(3,812 | ) | 0 | 78 | (153 | ) | (1,194 | ) | 3,724 | (2,452 | ) | (3,809 | ) | |||||||||||||||||||
| Payroll loans |
(1,301 | ) | 0 | 13 | (82 | ) | (628 | ) | 1,336 | (597 | ) | (1,259 | ) | |||||||||||||||||||
| Vehicles |
(316 | ) | 0 | 16 | (8 | ) | (113 | ) | 283 | (150 | ) | (288 | ) | |||||||||||||||||||
| Mortgage loans |
(70 | ) | 0 | 9 | 0 | (14 | ) | 22 | (18 | ) | (71 | ) | ||||||||||||||||||||
| Corporate |
(9,827 | ) | 85 | 147 | (1 | ) | (193 | ) | 1,172 | 376 | (8,241 | ) | ||||||||||||||||||||
| Small and medium businesses |
(3,554 | ) | 4 | 195 | (75 | ) | (430 | ) | 2,471 | (1,474 | ) | (2,863 | ) | |||||||||||||||||||
| Foreign loans - Latin America |
(2,547 | ) | 45 | 405 | (20 | ) | (406 | ) | 1,384 | (1,467 | ) | (2,606 | ) | |||||||||||||||||||
|
|
|
|
|
|
|
|
|
|
|
|
|
|
|
|
|
|||||||||||||||||
| Total |
(24,715 | ) | 134 | 892 | (409 | ) | (4,287 | ) | 13,547 | (7,289 | ) | (22,127 | ) | |||||||||||||||||||
|
|
|
|
|
|
|
|
|
|
|
|
|
|
|
|
|
|||||||||||||||||
| Consolidated 3 Stages |
Beginning balance at 01/01/2018 |
Derecognition | Net increase / (Reversal) (1) |
Closing balance at 12/31/2018 (2) |
||||||||||||||||||||||||||||
| Individuals |
(14,830 | ) | 8,520 | (8,115 | ) | (14,425 | ) | |||||||||||||||||||||||||
| Credit card |
(6,684 | ) | 3,155 | (2,548 | ) | (6,077 | ) | |||||||||||||||||||||||||
| Personal loans |
(5,138 | ) | 3,724 | (4,033 | ) | (5,447 | ) | |||||||||||||||||||||||||
| Payroll loans |
(2,368 | ) | 1,336 | (1,247 | ) | (2,279 | ) | |||||||||||||||||||||||||
| Vehicles |
(547 | ) | 283 | (259 | ) | (523 | ) | |||||||||||||||||||||||||
| Mortgage loans |
(93 | ) | 22 | (28 | ) | (99 | ) | |||||||||||||||||||||||||
| Corporate |
(11,452 | ) | 1,172 | 913 | (9,367 | ) | ||||||||||||||||||||||||||
| Small and medium businesses |
(5,404 | ) | 2,471 | (1,599 | ) | (4,532 | ) | |||||||||||||||||||||||||
| Foreign loans - Latin America |
(4,783 | ) | 1,384 | (1,786 | ) | (5,185 | ) | |||||||||||||||||||||||||
|
|
|
|
|
|
|
|
|
|||||||||||||||||||||||||
| Total |
(36,469 | ) | 13,547 | (10,587 | ) | (33,509 | ) | |||||||||||||||||||||||||
|
|
|
|
|
|
|
|
|
|||||||||||||||||||||||||
| (1) | Change in macroeconomic scenarios used gave rise, in the fourth quarter, the recognition of a provision for Expected Loss in the amount of R$ 41. |
| (2) | Comprises Expected Loan Losses for Financial Guarantees Pledged R$ (1,191) (R$ (1,907) at 01/01/2018) and Commitments to be Released R$ (2,601) (R$ (3,015) at 01/01/2018). |
F-66
Table of Contents
ITAÚ UNIBANCO HOLDING S.A.
Notes to the Consolidated Financial Statements
At 12/31/2018, 12/31/2017 and 01/01/2017 for balance sheet accounts and
From 01/01 to 12/31 of 2018, 2017 and 2016 for income statement accounts
(In millions of Reais, except information per share)
Reconciliation of expected loan losses for Loan operations and lease operations, segregated by stages:
| Stage 1 |
Beginning balance at 01/01/2017 |
Transfer to Stage 2 |
Transfer to Stage 3 |
Cure from the Stage 2 |
Cure from the Stage 3 |
Derecognition | Net increase / (Reversal) |
Closing balance at 12/31/2017 |
||||||||||||||||||||||||
| Individuals |
(3,352 | ) | 107 | 118 | (220 | ) | (22 | ) | — | (465 | ) | (3,834 | ) | |||||||||||||||||||
| Credit card |
(1,685 | ) | 50 | 21 | (135 | ) | (6 | ) | — | (380 | ) | (2,135 | ) | |||||||||||||||||||
| Personal loans |
(733 | ) | 29 | 56 | (24 | ) | (9 | ) | — | (78 | ) | (759 | ) | |||||||||||||||||||
| Payroll loans |
(787 | ) | 12 | 33 | (40 | ) | (4 | ) | — | (19 | ) | (805 | ) | |||||||||||||||||||
| Vehicles |
(135 | ) | 15 | 8 | (16 | ) | (2 | ) | — | 7 | (123 | ) | ||||||||||||||||||||
| Mortgage loans |
(12 | ) | 1 | — | (5 | ) | (1 | ) | — | 5 | (12 | ) | ||||||||||||||||||||
| Corporate |
(616 | ) | 7 | 6 | (104 | ) | (23 | ) | — | 279 | (451 | ) | ||||||||||||||||||||
| Small and medium businesses |
(1,016 | ) | 51 | 29 | (79 | ) | (6 | ) | — | (128 | ) | (1,149 | ) | |||||||||||||||||||
| Foreign loans - Latin America |
(702 | ) | 97 | 31 | (66 | ) | (50 | ) | — | (323 | ) | (1,013 | ) | |||||||||||||||||||
|
|
|
|
|
|
|
|
|
|
|
|
|
|
|
|
|
|||||||||||||||||
| Total |
(5,686 | ) | 262 | 184 | (469 | ) | (101 | ) | — | (637 | ) | (6,447 | ) | |||||||||||||||||||
|
|
|
|
|
|
|
|
|
|
|
|
|
|
|
|
|
|||||||||||||||||
| Stage 2 |
Beginning balance at 01/01/2017 |
Transfer to Stage 1 |
Transfer to Stage 3 |
Cure from the Stage 1 |
Cure from the Stage 3 |
Derecognition | Net increase / (Reversal) |
Closing balance at 12/31/2017 |
||||||||||||||||||||||||
| Individuals |
(2,232 | ) | 220 | 721 | (107 | ) | (112 | ) | — | (699 | ) | (2,209 | ) | |||||||||||||||||||
| Credit card |
(1,145 | ) | 135 | 293 | (50 | ) | (5 | ) | — | (489 | ) | (1,261 | ) | |||||||||||||||||||
| Personal loans |
(662 | ) | 24 | 261 | (29 | ) | (57 | ) | — | (104 | ) | (567 | ) | |||||||||||||||||||
| Payroll loans |
(251 | ) | 40 | 121 | (12 | ) | (27 | ) | — | (133 | ) | (262 | ) | |||||||||||||||||||
| Vehicles |
(147 | ) | 16 | 43 | (15 | ) | (14 | ) | — | 9 | (108 | ) | ||||||||||||||||||||
| Mortgage loans |
(27 | ) | 5 | 3 | (1 | ) | (9 | ) | — | 18 | (11 | ) | ||||||||||||||||||||
| Corporate |
(1,501 | ) | 104 | 89 | (7 | ) | (36 | ) | — | 177 | (1,174 | ) | ||||||||||||||||||||
| Small and medium businesses |
(898 | ) | 79 | 182 | (51 | ) | (153 | ) | — | 140 | (701 | ) | ||||||||||||||||||||
| Foreign loans - Latin America |
(471 | ) | 66 | 124 | (97 | ) | (55 | ) | — | (790 | ) | (1,223 | ) | |||||||||||||||||||
|
|
|
|
|
|
|
|
|
|
|
|
|
|
|
|
|
|||||||||||||||||
| Total |
(5,102 | ) | 469 | 1,116 | (262 | ) | (356 | ) | — | (1,172 | ) | (5,307 | ) | |||||||||||||||||||
|
|
|
|
|
|
|
|
|
|
|
|
|
|
|
|
|
|||||||||||||||||
| Stage 3 |
Beginning balance at 01/01/2017 |
Transfer to Stage 1 |
Transfer to Stage 2 |
Cure from the Stage 1 |
Cure from the Stage 2 |
Derecognition | Net increase / (Reversal) |
Closing balance at 12/31/2017 |
||||||||||||||||||||||||
| Individuals |
(9,206 | ) | 22 | 112 | (118 | ) | (721 | ) | 10,728 | (9,604 | ) | (8,787 | ) | |||||||||||||||||||
| Credit card |
(2,863 | ) | 6 | 5 | (21 | ) | (293 | ) | 3,891 | (4,013 | ) | (3,288 | ) | |||||||||||||||||||
| Personal loans |
(4,643 | ) | 9 | 57 | (56 | ) | (261 | ) | 5,190 | (4,108 | ) | (3,812 | ) | |||||||||||||||||||
| Payroll loans |
(1,246 | ) | 4 | 27 | (33 | ) | (121 | ) | 1,177 | (1,109 | ) | (1,301 | ) | |||||||||||||||||||
| Vehicles |
(393 | ) | 2 | 14 | (8 | ) | (43 | ) | 433 | (321 | ) | (316 | ) | |||||||||||||||||||
| Mortgage loans |
(61 | ) | 1 | 9 | — | (3 | ) | 37 | (53 | ) | (70 | ) | ||||||||||||||||||||
| Corporate |
(8,972 | ) | 23 | 36 | (6 | ) | (89 | ) | 956 | (1,775 | ) | (9,827 | ) | |||||||||||||||||||
| Small and medium businesses |
(4,452 | ) | 6 | 153 | (29 | ) | (182 | ) | 3,648 | (2,698 | ) | (3,554 | ) | |||||||||||||||||||
| Foreign loans - Latin America |
(1,107 | ) | 50 | 55 | (31 | ) | (124 | ) | 1,105 | (2,495 | ) | (2,547 | ) | |||||||||||||||||||
|
|
|
|
|
|
|
|
|
|
|
|
|
|
|
|
|
|||||||||||||||||
| Total |
(23,737 | ) | 101 | 356 | (184 | ) | (1,116 | ) | 16,437 | (16,572 | ) | (24,715 | ) | |||||||||||||||||||
|
|
|
|
|
|
|
|
|
|
|
|
|
|
|
|
|
|||||||||||||||||
F-67
Table of Contents
ITAÚ UNIBANCO HOLDING S.A.
Notes to the Consolidated Financial Statements
At 12/31/2018, 12/31/2017 and 01/01/2017 for balance sheet accounts and
From 01/01 to 12/31 of 2018, 2017 and 2016 for income statement accounts
(In millions of Reais, except information per share)
| Consolidated 3 Stages |
Beginning balance at 01/01/2017 |
Derecognition | Net increase / (Reversal) |
Closing balance at 12/31/2017 (*) |
||||||||||||||||||||||||||||
| Individuals |
(14,790 | ) | 10,728 | (10,768 | ) | (14,830 | ) | |||||||||||||||||||||||||
| Credit card |
(5,693 | ) | 3,891 | (4,882 | ) | (6,684 | ) | |||||||||||||||||||||||||
| Personal loans |
(6,038 | ) | 5,190 | (4,290 | ) | (5,138 | ) | |||||||||||||||||||||||||
| Payroll loans |
(2,284 | ) | 1,177 | (1,261 | ) | (2,368 | ) | |||||||||||||||||||||||||
| Vehicles |
(675 | ) | 433 | (305 | ) | (547 | ) | |||||||||||||||||||||||||
| Mortgage loans |
(100 | ) | 37 | (30 | ) | (93 | ) | |||||||||||||||||||||||||
| Corporate |
(11,089 | ) | 956 | (1,319 | ) | (11,452 | ) | |||||||||||||||||||||||||
| Small and medium businesses |
(6,366 | ) | 3,648 | (2,686 | ) | (5,404 | ) | |||||||||||||||||||||||||
| Foreign loans - Latin America |
(2,280 | ) | 1,105 | (3,608 | ) | (4,783 | ) | |||||||||||||||||||||||||
|
|
|
|
|
|
|
|
|
|||||||||||||||||||||||||
| Total |
(34,525 | ) | 16,437 | (18,381 | ) | (36,469 | ) | |||||||||||||||||||||||||
|
|
|
|
|
|
|
|
|
|||||||||||||||||||||||||
| (*) | Comprises Expected Loan Losses for Financial Guarantees Pledged R$ (1,907) (R$ (1,580) at 01/01/2017) and Commitments to be Released R$ (3,015) (R$ (2,691) at 01/01/2017). |
Reconciliation of expected loan losses for Loan operations and lease operations, segregated by stages:
| Stage 1 |
Beginning balance at 01/01/2016 |
Transfer to Stage 2 |
Transfer to Stage 3 |
Cure from the Stage 2 |
Cure from the Stage 3 |
Derecognition | Net increase / (Reversal) |
Closing balance at 12/31/2016 |
||||||||||||||||||||||||
| Individuals |
(4,035 | ) | 161 | 1,387 | (188 | ) | (104 | ) | — | (573 | ) | (3,352 | ) | |||||||||||||||||||
| Credit card |
(2,096 | ) | 32 | 761 | (37 | ) | (4 | ) | — | (341 | ) | (1,685 | ) | |||||||||||||||||||
| Personal loans |
(886 | ) | 76 | 337 | (82 | ) | (66 | ) | — | (112 | ) | (733 | ) | |||||||||||||||||||
| Payroll loans |
(811 | ) | 38 | 221 | (21 | ) | (15 | ) | — | (199 | ) | (787 | ) | |||||||||||||||||||
| Vehicles |
(230 | ) | 15 | 67 | (40 | ) | (13 | ) | — | 66 | (135 | ) | ||||||||||||||||||||
| Mortgage loans |
(12 | ) | — | 1 | (8 | ) | (6 | ) | — | 13 | (12 | ) | ||||||||||||||||||||
| Corporate |
(2,826 | ) | 136 | 355 | (172 | ) | — | — | 1,891 | (616 | ) | |||||||||||||||||||||
| Small and medium businesses |
(2,033 | ) | 115 | 603 | (170 | ) | (121 | ) | — | 590 | (1,016 | ) | ||||||||||||||||||||
| Foreign loans - Latin America |
(438 | ) | 6 | 254 | (108 | ) | (7 | ) | — | (409 | ) | (702 | ) | |||||||||||||||||||
|
|
|
|
|
|
|
|
|
|
|
|
|
|
|
|
|
|||||||||||||||||
| Total |
(9,332 | ) | 418 | 2,599 | (638 | ) | (232 | ) | — | 1,499 | (5,686 | ) | ||||||||||||||||||||
|
|
|
|
|
|
|
|
|
|
|
|
|
|
|
|
|
|||||||||||||||||
| Stage 2 |
Beginning balance at 01/01/2016 |
Transfer to Stage 1 |
Transfer to Stage 3 |
Cure from the Stage 1 |
Cure from the Stage 3 |
Derecognition | Net increase / (Reversal) |
Closing balance at 12/31/2016 |
||||||||||||||||||||||||
| Individuals |
(1,907 | ) | 188 | 860 | (161 | ) | (6,528 | ) | — | 5,316 | (2,232 | ) | ||||||||||||||||||||
| Credit card |
(797 | ) | 37 | 418 | (32 | ) | (2,403 | ) | — | 1,632 | (1,145 | ) | ||||||||||||||||||||
| Personal loans |
(718 | ) | 82 | 329 | (76 | ) | (2,881 | ) | — | 2,602 | (662 | ) | ||||||||||||||||||||
| Payroll loans |
(221 | ) | 21 | 54 | (38 | ) | (913 | ) | — | 846 | (251 | ) | ||||||||||||||||||||
| Vehicles |
(155 | ) | 40 | 55 | (15 | ) | (309 | ) | — | 237 | (147 | ) | ||||||||||||||||||||
| Mortgage loans |
(16 | ) | 8 | 4 | — | (22 | ) | — | (1 | ) | (27 | ) | ||||||||||||||||||||
| Corporate |
(2,078 | ) | 172 | 684 | (136 | ) | (1,558 | ) | — | 1,415 | (1,501 | ) | ||||||||||||||||||||
| Small and medium businesses |
(721 | ) | 170 | 287 | (115 | ) | (3,037 | ) | — | 2,518 | (898 | ) | ||||||||||||||||||||
| Foreign loans - Latin America |
(281 | ) | 108 | 92 | (6 | ) | (190 | ) | — | (194 | ) | (471 | ) | |||||||||||||||||||
|
|
|
|
|
|
|
|
|
|
|
|
|
|
|
|
|
|||||||||||||||||
| Total |
(4,987 | ) | 638 | 1,923 | (418 | ) | (11,313 | ) | — | 9,055 | (5,102 | ) | ||||||||||||||||||||
|
|
|
|
|
|
|
|
|
|
|
|
|
|
|
|
|
|||||||||||||||||
F-68
Table of Contents
ITAÚ UNIBANCO HOLDING S.A.
Notes to the Consolidated Financial Statements
At 12/31/2018, 12/31/2017 and 01/01/2017 for balance sheet accounts and
From 01/01 to 12/31 of 2018, 2017 and 2016 for income statement accounts
(In millions of Reais, except information per share)
| Stage 3 |
Beginning balance at 01/01/2016 |
Transfer to Stage 1 |
Transfer to Stage 2 |
Cure from the Stage 1 |
Cure from the Stage 2 |
Derecognition | Net increase / (Reversal) |
Closing balance at 12/31/2016 |
||||||||||||||||||||||||
| Individuals |
(9,697 | ) | 103 | 6,528 | (1,387 | ) | (860 | ) | 12,103 | (15,996 | ) | (9,206 | ) | |||||||||||||||||||
| Credit card |
(3,158 | ) | 4 | 2,403 | (761 | ) | (418 | ) | 4,641 | (5,574 | ) | (2,863 | ) | |||||||||||||||||||
| Personal loans |
(4,850 | ) | 66 | 2,881 | (337 | ) | (329 | ) | 5,592 | (7,666 | ) | (4,643 | ) | |||||||||||||||||||
| Payroll loans |
(1,074 | ) | 15 | 913 | (221 | ) | (54 | ) | 1,151 | (1,976 | ) | (1,246 | ) | |||||||||||||||||||
| Vehicles |
(565 | ) | 13 | 309 | (67 | ) | (55 | ) | 671 | (699 | ) | (393 | ) | |||||||||||||||||||
| Mortgage loans |
(50 | ) | 5 | 22 | (1 | ) | (4 | ) | 48 | (81 | ) | (61 | ) | |||||||||||||||||||
| Corporate |
(3,155 | ) | — | 1,558 | (355 | ) | (684 | ) | 2,995 | (9,331 | ) | (8,972 | ) | |||||||||||||||||||
| Small and medium businesses |
(4,462 | ) | 121 | 3,037 | (603 | ) | (287 | ) | 3,862 | (6,120 | ) | (4,452 | ) | |||||||||||||||||||
| Foreign loans - Latin America |
(400 | ) | 7 | 190 | (254 | ) | (92 | ) | 1,014 | (1,572 | ) | (1,107 | ) | |||||||||||||||||||
|
|
|
|
|
|
|
|
|
|
|
|
|
|
|
|
|
|||||||||||||||||
| Total |
(17,714 | ) | 231 | 11,313 | (2,599 | ) | (1,923 | ) | 19,974 | (33,019 | ) | (23,737 | ) | |||||||||||||||||||
|
|
|
|
|
|
|
|
|
|
|
|
|
|
|
|
|
|||||||||||||||||
| Consolidated 3 Stages |
Beginning balance at 01/01/2016 |
Derecognition | Net increase / (Reversal) |
Closing balance at 12/31/2016 (*) |
||||||||||||||||||||||||||||
| Individuals |
(15,639 | ) | 12,103 | (11,254 | ) | (14,790 | ) | |||||||||||||||||||||||||
| Credit card |
(6,051 | ) | 4,641 | (4,283 | ) | (5,693 | ) | |||||||||||||||||||||||||
| Personal loans |
(6,454 | ) | 5,592 | (5,176 | ) | (6,038 | ) | |||||||||||||||||||||||||
| Payroll loans |
(2,106 | ) | 1,151 | (1,329 | ) | (2,284 | ) | |||||||||||||||||||||||||
| Vehicles |
(950 | ) | 671 | (396 | ) | (675 | ) | |||||||||||||||||||||||||
| Mortgage loans |
(78 | ) | 48 | (70 | ) | (100 | ) | |||||||||||||||||||||||||
| Corporate |
(8,059 | ) | 2,995 | (6,025 | ) | (11,089 | ) | |||||||||||||||||||||||||
| Small and medium businesses |
(7,216 | ) | 3,862 | (3,012 | ) | (6,366 | ) | |||||||||||||||||||||||||
| Foreign loans - Latin America |
(1,119 | ) | 1,014 | (2,175 | ) | (2,280 | ) | |||||||||||||||||||||||||
|
|
|
|
|
|
|
|
|
|||||||||||||||||||||||||
| Total |
(32,033 | ) | 19,974 | (22,466 | ) | (34,525 | ) | |||||||||||||||||||||||||
|
|
|
|
|
|
|
|
|
|||||||||||||||||||||||||
| (*) | Comprises Expected Loan Losses for Financial Guarantees Pledged R$ (1,580) and Commitments to be Released R$ (2,691). |
| d) | Present value of lease operations (as lessor) |
Below is the analysis of the present value of the future minimum payments receivable from Finance Leases by maturity: The portfolio is composed of lease of vehicles, machines, equipment and real estate contracted in by individuals and legal entities in Brazil and abroad:
| 12/31/2018 | ||||||||||||
| Minimum future | Future financial | Present | ||||||||||
| payments | income | value | ||||||||||
| Current |
2,007 | (708 | ) | 1,299 | ||||||||
| Up to 1 year |
2,007 | (708 | ) | 1,299 | ||||||||
| Non-current |
8,518 | (2,265 | ) | 6,253 | ||||||||
| From 1 to 5 years |
4,390 | (2,038 | ) | 2,352 | ||||||||
| Over 5 years |
4,128 | (227 | ) | 3,901 | ||||||||
|
|
|
|
|
|
|
|||||||
| Total |
10,525 | (2,973 | ) | 7,552 | ||||||||
|
|
|
|
|
|
|
|||||||
F-69
Table of Contents
ITAÚ UNIBANCO HOLDING S.A.
Notes to the Consolidated Financial Statements
At 12/31/2018, 12/31/2017 and 01/01/2017 for balance sheet accounts and
From 01/01 to 12/31 of 2018, 2017 and 2016 for income statement accounts
(In millions of Reais, except information per share)
| 12/31/2017 | ||||||||||||
| Minimum future | Future financial | Present | ||||||||||
| payments | income | value | ||||||||||
| Current |
3,292 | (1,898 | ) | 1,394 | ||||||||
| Up to 1 year |
3,292 | (1,898 | ) | 1,394 | ||||||||
| Non-current |
9,223 | (2,859 | ) | 6,364 | ||||||||
| From 1 to 5 years |
5,334 | (2,803 | ) | 2,531 | ||||||||
| Over 5 years |
3,889 | (56 | ) | 3,833 | ||||||||
|
|
|
|
|
|
|
|||||||
| Total |
12,515 | (4,757 | ) | 7,758 | ||||||||
|
|
|
|
|
|
|
|||||||
The allowance for loan and lease losses related to the lease portfolio amounts to: R$ 243 (R$ 322 at 12/31/2017).
| e) | Operations of securitization or transfers and acquisition of financial assets |
ITAÚ UNIBANCO HOLDING carried out operations of securitization or transfer of financial assets in which there was retention of credit risks of financial assets transferred through co-obligation covenants. Thus, such credits continued recorded in the Consolidated Balance Sheet and are represented as follows:
| 12/31/2018 | 12/31/2017 | |||||||||||||||||||||||||||||||
| Assets | Liabilities (*) | Assets | Liabilities (*) | |||||||||||||||||||||||||||||
| Nature of operation |
Book value |
Fair value | Book value |
Fair value | Book value |
Fair value | Book value |
Fair value | ||||||||||||||||||||||||
| Mortgage loan |
1,941 | 1,925 | 1,939 | 1,920 | 2,460 | 2,405 | 2,453 | 2,390 | ||||||||||||||||||||||||
| Working capital |
2,140 | 2,140 | 2,128 | 2,128 | 2,651 | 2,651 | 2,570 | 2,570 | ||||||||||||||||||||||||
| Other |
0 | 0 | 4 | 4 | — | — | 6 | 6 | ||||||||||||||||||||||||
|
|
|
|
|
|
|
|
|
|
|
|
|
|
|
|
|
|||||||||||||||||
| Total |
4,081 | 4,065 | 4,071 | 4,052 | 5,111 | 5,056 | 5,029 | 4,966 | ||||||||||||||||||||||||
|
|
|
|
|
|
|
|
|
|
|
|
|
|
|
|
|
|||||||||||||||||
| (*) | Under Interbank Market Debt. |
Operations of transfers of financial assets with no retention of risks and benefits generated impact on the result of R$ 372 in the period from January 1 to december 31, 2018 (R$ 393 from January 1 to December 31, 2017), net of the Allowance for Loan Losses.
F-70
Table of Contents
ITAÚ UNIBANCO HOLDING S.A.
Notes to the Consolidated Financial Statements
At 12/31/2018, 12/31/2017 and 01/01/2017 for balance sheet accounts and
From 01/01 to 12/31 of 2018, 2017 and 2016 for income statement accounts
(In millions of Reais, except information per share)
Note 11 - Investments in associates and joint ventures
a) The following table shows the main investments of ITAÚ UNIBANCO HOLDING:
| 12/31/2018 | ||||||||||||||||
| Investment | Equity in earnings |
Other comprehensive income |
Total comprehensive results |
|||||||||||||
| Associates (a) |
11,802 | 798 | 0 | 798 | ||||||||||||
| Joint ventures (b) |
217 | (51 | ) | 0 | (51 | ) | ||||||||||
|
|
|
|
|
|
|
|
|
|||||||||
| Total |
12,019 | 747 | 0 | 747 | ||||||||||||
|
|
|
|
|
|
|
|
|
|||||||||
| 12/31/2017 | 01/01 to 12/31/2016 |
|||||||||||||||||||
| Investment | Equity in earnings |
Other comprehensive income |
Total comprehensive results |
Equity in earnings |
||||||||||||||||
| Associates (a) |
4,851 | 578 | (102 | ) | 476 | 557 | ||||||||||||||
| Joint ventures (b) |
204 | (28 | ) | — | (28 | ) | (29 | ) | ||||||||||||
|
|
|
|
|
|
|
|
|
|
|
|||||||||||
| Total |
5,055 | 550 | (102 | ) | 448 | 528 | ||||||||||||||
|
|
|
|
|
|
|
|
|
|
|
|||||||||||
| (a) | At 12/31/2018, includes interest in total capital and voting capital of the following companies: XP Investimentos S.A. (49.90% total capital and 30.06% voting capital); Porto Seguro Itaú Unibanco Participações S.A. (42.93% total and voting capital; 42.93% at 12/31/2017); BSF Holding S.A. (49% total and voting capital; 49% at 12/31/2017); IRB-Brasil Resseguros S.A. (11,20% total capital and 11.20% voting capital; 11,20% total capital and 11.20% voting capital at 12/31/2017); Gestora de Inteligência de Crédito S.A (20% total and voting capital; 20% at 12/31/2017), Compañia Uruguaya de Medios de Procesamiento S.A. (35.83% total and voting capital; 35.83% at 12/31/2017); Rias Redbanc S.A. (25% total and voting capital; 25% at 12/31/2017); Kinea Private Equity Investimentos S.A. (80% total capital and 40% voting capital; 80% total capital and 49% voting capital at 12/31/2017) and Tecnologia Bancária S.A. (28.95% total and voting capital; and 28.95% at 12/31/2017). |
| (b) | At 12/31/2018, includes interest in total and voting capital of the following companies: Olimpia Promoção e Serviços S.A. (50% total and voting capital; 50% at 12/31/2017); ConectCar Soluções de Mobilidade Eletrônica S.A. (50% total and voting capital; 50% at 12/31/2017) and includes result not arising from controlled companies’ net income. |
Note 12 – Lease commitments - As Lessee
| a) | Finance lease |
ITAÚ UNIBANCO HOLDING is the lessee in finance lease contracts of data processing equipment, with the option of purchase or extension, without contingent rental payments or imposed restrictions. The net carrying amount of these assets is R$ 16 (R$ 4 at 12/31/2017).
The table below shows the total future minimum payments:
| 12/31/2018 | 12/31/2017 | |||||||
| Current |
6 | 4 | ||||||
| Up to 1 year |
6 | 4 | ||||||
| Non-current |
10 | — | ||||||
| From 1 to 5 years |
10 | — | ||||||
|
|
|
|
|
|||||
| Total future minimum payments |
16 | 4 | ||||||
|
|
|
|
|
|||||
| Present value |
16 | 4 | ||||||
|
|
|
|
|
|||||
| b) | Operating leases |
ITAÚ UNIBANCO HOLDING leases many properties, for use in its operations, under standard real estate leases that normally can be cancelled at its option and include renewal options and escalations clauses. No lease agreement imposes any restriction on our ability to pay dividends, enter into further lease agreements or engage in debt or equity financing transactions, and there is no contingent payments related to the agreements.
F-71
Table of Contents
ITAÚ UNIBANCO HOLDING S.A.
Notes to the Consolidated Financial Statements
At 12/31/2018, 12/31/2017 and 01/01/2017 for balance sheet accounts and
From 01/01 to 12/31 of 2018, 2017 and 2016 for income statement accounts
(In millions of Reais, except information per share)
The expenses related to operating lease agreements recognized under General and administrative expenses total R$ (1,566) from 01/01 to 12/31/2018 (R$ (1,134) from 01/01 to 12/31/2017 and R$ (1,145) from 01/01 to 12/31/2016).
ITAÚ UNIBANCO HOLDING has no relevant sublease contracts.
Minimum payments of initiated and remaining lease agreements with non-cancelable clauses are as follows:
| 12/31/2018 | 12/31/2017 | |||||||
| Current |
774 | 1,113 | ||||||
| Up to 1 year |
774 | 1,113 | ||||||
| Non-current |
4,663 | 4,310 | ||||||
| From 1 to 5 years |
3,894 | 3,927 | ||||||
|
|
|
|
|
|||||
| Over 5 years |
769 | 383 | ||||||
|
|
|
|
|
|||||
| Total future minimum payments |
5,437 | 5,423 | ||||||
|
|
|
|
|
|||||
Note 13 - Fixed assets
| Fixed Assets (1) |
Fixed assets under construction |
Real estate in use (2) |
Other fixed assets (2) | Total | ||||||||||||||||||||||||||||||||
| Land | Buildings | Improvements | Installations | Furniture and equipment |
EDP systems (3) | Other (communication, security and transportation) |
||||||||||||||||||||||||||||||
| Annual depreciation rates |
4% | 10% | 10 to 20% | 10 to 20% | 20 to 50% | 10 to 20% | ||||||||||||||||||||||||||||||
| Cost |
||||||||||||||||||||||||||||||||||||
| Balance at 01/01/2018 |
367 | 1,044 | 3,107 | 2,204 | 1,955 | 1,152 | 8,679 | 1,148 | 19,656 | |||||||||||||||||||||||||||
| Acquisitions |
474 | — | — | 35 | 22 | 59 | 764 | 129 | 1,483 | |||||||||||||||||||||||||||
| Disposal |
— | (13 | ) | (103 | ) | (45 | ) | (13 | ) | (16 | ) | (264 | ) | (30 | ) | (484 | ) | |||||||||||||||||||
| Exchange variation |
3 | 6 | (2 | ) | 42 | (8 | ) | (5 | ) | (12 | ) | 4 | 28 | |||||||||||||||||||||||
| Transfers |
(289 | ) | — | 66 | 122 | 39 | — | 62 | — | — | ||||||||||||||||||||||||||
| Other (5) |
1 | 47 | 43 | 129 | (7 | ) | 19 | 99 | 2 | 333 | ||||||||||||||||||||||||||
| Balance at 12/31/2018 |
556 | 1,084 | 3,111 | 2,487 | 1,988 | 1,209 | 9,328 | 1,253 | 21,016 | |||||||||||||||||||||||||||
| Depreciation |
||||||||||||||||||||||||||||||||||||
| Balance at 01/01/2018 |
— | — | (1,893 | ) | (1,375 | ) | (1,151 | ) | (715 | ) | (6,411 | ) | (752 | ) | (12,297 | ) | ||||||||||||||||||||
| Accumulated depreciation |
— | — | (80 | ) | (183 | ) | (155 | ) | (97 | ) | (909 | ) | (121 | ) | (1,545 | ) | ||||||||||||||||||||
| Disposal |
— | — | 24 | 32 | 5 | 11 | 236 | 29 | 337 | |||||||||||||||||||||||||||
| Exchange variation |
— | — | 14 | (24 | ) | 12 | 20 | (5 | ) | (3 | ) | 14 | ||||||||||||||||||||||||
| Other (5) |
— | — | 6 | (120 | ) | (1 | ) | (53 | ) | (39 | ) | (16 | ) | (223 | ) | |||||||||||||||||||||
| Balance at 12/31/2018 |
— | — | (1,929 | ) | (1,670 | ) | (1,290 | ) | (834 | ) | (7,128 | ) | (863 | ) | (13,714 | ) | ||||||||||||||||||||
| Book value |
||||||||||||||||||||||||||||||||||||
| Balance at 12/31/2018 (4) |
556 | 1,084 | 1,182 | 817 | 698 | 375 | 2,200 | 390 | 7,302 | |||||||||||||||||||||||||||
| (1) | The contractual commitments for purchase of the fixed assets totaled R$ 41 achievable by 2019 (Note 32 - Off balance sheet). |
| (2) | Includes the amount of R$ 3 related to attached real estate. |
| (3) | Includes lease contracts, mainly related to data processing equipment, which are accounted for as lease operations. The asset and the liability are recognized in the Financial Statements. |
| (4) | During de period, there was no impairment of assets recorded in Fixed assets. |
| (5) | Includes the total amount of R$ 209 related to the hyperinflationary adjustment for Argentina. |
F-72
Table of Contents
ITAÚ UNIBANCO HOLDING S.A.
Notes to the Consolidated Financial Statements
At 12/31/2018, 12/31/2017 and 01/01/2017 for balance sheet accounts and
From 01/01 to 12/31 of 2018, 2017 and 2016 for income statement accounts
(In millions of Reais, except information per share)
| Fixed assets (1) |
Fixed assets under construction |
Real estate in use (2) |
Other fixed assets (2) | Total | ||||||||||||||||||||||||||||||||
| Land | Buildings | Improvements | Installations | Furniture and equipment |
EDP systems (3) | Other (communication, security and transportation) |
||||||||||||||||||||||||||||||
| Annual depreciation rates |
4% | 10% | 10 to 20% | 10 to 20% | 20 to 50% | 10 to 20% | ||||||||||||||||||||||||||||||
| Cost |
||||||||||||||||||||||||||||||||||||
| Balance at 01/01/2017 |
387 | 1,047 | 3,099 | 1,857 | 1,901 | 1,205 | 8,543 | 1,075 | 19,114 | |||||||||||||||||||||||||||
| Acquisitions |
302 | — | — | 147 | 7 | 111 | 294 | 82 | 943 | |||||||||||||||||||||||||||
| Disposal |
— | (1 | ) | (69 | ) | (46 | ) | (1 | ) | (14 | ) | (313 | ) | (20 | ) | (464 | ) | |||||||||||||||||||
| Exchange variation |
— | 4 | 5 | 37 | 15 | (12 | ) | 5 | 1 | 55 | ||||||||||||||||||||||||||
| Transfers |
(320 | ) | — | 86 | 122 | 26 | — | 86 | — | — | ||||||||||||||||||||||||||
| Other |
(2 | ) | (6 | ) | (14 | ) | 87 | 7 | (138 | ) | 64 | 10 | 8 | |||||||||||||||||||||||
| Balance at 12/31/2017 |
367 | 1,044 | 3,107 | 2,204 | 1,955 | 1,152 | 8,679 | 1,148 | 19,656 | |||||||||||||||||||||||||||
| Depreciation |
||||||||||||||||||||||||||||||||||||
| Balance at 01/01/2017 |
— | — | (1,840 | ) | (1,114 | ) | (986 | ) | (674 | ) | (5,804 | ) | (654 | ) | (11,072 | ) | ||||||||||||||||||||
| Accumulated depreciation |
— | — | (80 | ) | (211 | ) | (154 | ) | (104 | ) | (910 | ) | (105 | ) | (1,564 | ) | ||||||||||||||||||||
| Disposal |
— | — | 16 | 29 | — | 6 | 283 | 19 | 353 | |||||||||||||||||||||||||||
| Exchange variation |
— | — | — | (12 | ) | 10 | 28 | (16 | ) | (4 | ) | 6 | ||||||||||||||||||||||||
| Other |
— | — | 11 | (67 | ) | (21 | ) | 29 | 36 | (8 | ) | (20 | ) | |||||||||||||||||||||||
| Balance at 12/31/2017 |
— | — | (1,893 | ) | (1,375 | ) | (1,151 | ) | (715 | ) | (6,411 | ) | (752 | ) | (12,297 | ) | ||||||||||||||||||||
| Book value |
||||||||||||||||||||||||||||||||||||
| Balance at 12/31/2017 (4) |
367 | 1,044 | 1,214 | 829 | 804 | 437 | 2,268 | 396 | 7,359 | |||||||||||||||||||||||||||
| (1) | The contractual commitments for purchase of the fixed assets totaled R$ 181 achievable by 2019 (Note 32 - Off balance sheet). |
| (2) | Includes the amount of R$ 3 related to attached real estate. |
| (3) | Includes lease contracts, mainly related to data processing equipment, which are accounted for as lease operations. The asset and the liability are recognized in the Financial Statements. |
| (4) | During de period, there was no impairment of assets recorded in Fixed assets. |
F-73
Table of Contents
ITAÚ UNIBANCO HOLDING S.A.
Notes to the Consolidated Financial Statements
At 12/31/2018, 12/31/2017 and 01/01/2017 for balance sheet accounts and
From 01/01 to 12/31 of 2018, 2017 and 2016 for income statement accounts
(In millions of Reais, except information per share)
| Fixed assets (1) |
Fixed assets under construction |
Real estate in use (2) |
Other fixed assets (2) | Total | ||||||||||||||||||||||||||||||||
| Land | Buildings | Improvements | Installations | Furniture and equipment |
EDP systems (3) | Other (communication, security and transportation) |
||||||||||||||||||||||||||||||
| Annual depreciation rates |
4% | 10% | 10 to 20% | 10 to 20% | 20 to 50% | 10 to 20% | ||||||||||||||||||||||||||||||
| Cost |
||||||||||||||||||||||||||||||||||||
| Balance at 01/01/2016 |
792 | 1,008 | 3,026 | 1,673 | 1,801 | 975 | 8,217 | 858 | 18,350 | |||||||||||||||||||||||||||
| Acquisitions |
341 | 57 | 70 | 137 | 47 | 309 | 246 | 223 | 1,430 | |||||||||||||||||||||||||||
| Disposal |
— | (4 | ) | (13 | ) | (56 | ) | (15 | ) | (8 | ) | (449 | ) | (6 | ) | (551 | ) | |||||||||||||||||||
| Exchange variation |
(2 | ) | (15 | ) | (11 | ) | (22 | ) | (3 | ) | (67 | ) | 151 | 3 | 34 | |||||||||||||||||||||
| Transfers |
(738 | ) | — | 27 | 125 | — | 1 | 515 | 4 | (66 | ) | |||||||||||||||||||||||||
| Other |
(6 | ) | 1 | — | — | 71 | (5 | ) | (137 | ) | (7 | ) | (83 | ) | ||||||||||||||||||||||
| Balance at 12/31/2016 |
387 | 1,047 | 3,099 | 1,857 | 1,901 | 1,205 | 8,543 | 1,075 | 19,114 | |||||||||||||||||||||||||||
| Depreciation |
||||||||||||||||||||||||||||||||||||
| Balance at 01/01/2016 |
— | — | (1,764 | ) | (930 | ) | (841 | ) | (579 | ) | (5,138 | ) | (557 | ) | (9,809 | ) | ||||||||||||||||||||
| Accumulated depreciation |
— | — | (80 | ) | (245 | ) | (142 | ) | (102 | ) | (1,038 | ) | (95 | ) | (1,702 | ) | ||||||||||||||||||||
| Disposal |
— | — | 11 | 53 | 6 | 5 | 377 | 4 | 456 | |||||||||||||||||||||||||||
| Exchange variation |
— | — | (8 | ) | 8 | 9 | (1 | ) | (101 | ) | (8 | ) | (101 | ) | ||||||||||||||||||||||
| Other |
— | — | 1 | — | (18 | ) | 3 | 96 | 2 | 84 | ||||||||||||||||||||||||||
| Balance at 12/31/2016 |
— | — | (1,840 | ) | (1,114 | ) | (986 | ) | (674 | ) | (5,804 | ) | (654 | ) | (11,072 | ) | ||||||||||||||||||||
| Book value |
||||||||||||||||||||||||||||||||||||
| Balance
at |
387 | 1,047 | 1,259 | 743 | 915 | 531 | 2,739 | 421 | 8,042 | |||||||||||||||||||||||||||
| (1) | The contractual commitments for purchase of the fixed assets totaled R$ 48, achievable by 2017 (Note 32 - Off balance sheet). |
| (2) | Includes the amount of R$ 4 related to attached real estate. |
| (3) | Includes lease contracts, mainly related to data processing equipment, which are accounted for as lease operations. The asset and the liability are recognized in the Financial Statements. |
| (4) | During de period, there was no impairment of assets recorded in Fixed assets. |
F-74
Table of Contents
ITAÚ UNIBANCO HOLDING S.A.
Notes to the Consolidated Financial Statements
At 12/31/2018, 12/31/2017 and 01/01/2017 for balance sheet accounts and
From 01/01 to 12/31 of 2018, 2017 and 2016 for income statement accounts
(In millions of Reais, except information per share)
Note 14 - Goodwill and Intangible assets
| Goodwill and intangible from acquisition |
Intangible assets (1) | Total | ||||||||||||||||||||||
| Association for the promotion and offer of financial products and services |
Software Acquired |
Internally developed software |
Other intangible assets (2) |
|||||||||||||||||||||
| Annual amortization rates |
Up to 20% | 8% | 20% | 20% | 10 to 20% | |||||||||||||||||||
| Cost |
||||||||||||||||||||||||
| Balance at 01/01/2018 |
11,162 | 2,452 | 4,571 | 4,353 | 2,161 | 24,699 | ||||||||||||||||||
| Acquisitions |
8 | 1 | 646 | 318 | 408 | 1,381 | ||||||||||||||||||
| Terminated agreements/ derecognition |
— | (27 | ) | (312 | ) | (189 | ) | (210 | ) | (738 | ) | |||||||||||||
| Exchange variation |
560 | 47 | 205 | — | (4 | ) | 808 | |||||||||||||||||
| Other (4) |
(266 | ) | 56 | 137 | 47 | 5 | (21 | ) | ||||||||||||||||
| Balance at 12/31/2018 |
11,464 | 2,529 | 5,247 | 4,529 | 2,360 | 26,129 | ||||||||||||||||||
| Amortization |
||||||||||||||||||||||||
| Balance at 01/01/2018 |
(23 | ) | (647 | ) | (1,998 | ) | (1,267 | ) | (984 | ) | (4,919 | ) | ||||||||||||
| Amortization expense (3) |
— | (223 | ) | (596 | ) | (697 | ) | (261 | ) | (1,777 | ) | |||||||||||||
| Terminated agreements/ derecognition |
— | 27 | 312 | 154 | 210 | 703 | ||||||||||||||||||
| Exchange variation |
— | (141 | ) | (152 | ) | 0 | 16 | (277 | ) | |||||||||||||||
| Other (4) |
(3 | ) | 117 | (67 | ) | (13 | ) | 4 | 38 | |||||||||||||||
| Balance at 12/31/2018 |
(26 | ) | (867 | ) | (2,501 | ) | (1,823 | ) | (1,015 | ) | (6,232 | ) | ||||||||||||
| Impairment (Note 2.4h) |
||||||||||||||||||||||||
| Balance at 01/01/2018 |
— | — | (54 | ) | (343 | ) | — | (397 | ) | |||||||||||||||
| Increase |
— | — | (167 | ) | — | — | (167 | ) | ||||||||||||||||
| Exchange variation |
— | — | (4 | ) | — | — | (4 | ) | ||||||||||||||||
| Balance at 12/31/2018 |
— | — | (225 | ) | (343 | ) | — | (568 | ) | |||||||||||||||
| Book value |
||||||||||||||||||||||||
| Balance at 12/31/2018 |
11,438 | 1,662 | 2,521 | 2,363 | 1,345 | 19,329 | ||||||||||||||||||
| (1) | The contractual commitments for the purchase of the new intangible assets totaled R$ 637 achievable by 2020; |
| (2) | Includes of amounts paid for acquisition of rights to provide services of payment of salaries, proceeds, retirement and pension benefits and similar benefits; |
| (3) | Amortization expenses related to the rights for acquisition of payrolls and associations, in the amount of R$ (452) (R$ (487) from 01/01 to 12/31/2017) are disclosed in the General and administrative expenses. |
| (4) | Includes the total amount of R$ 31 related to the hyperinflationary adjustment for Argentina. |
F-75
Table of Contents
ITAÚ UNIBANCO HOLDING S.A.
Notes to the Consolidated Financial Statements
At 12/31/2018, 12/31/2017 and 01/01/2017 for balance sheet accounts and
From 01/01 to 12/31 of 2018, 2017 and 2016 for income statement accounts
(In millions of Reais, except information per share)
| Goodwill and intangible from acquisition |
Intangible assets (1) | Total | ||||||||||||||||||||||
| Association for the promotion and offer of financial products and services |
Software Acquired |
Internally developed software |
Other intangible assets (2) |
|||||||||||||||||||||
| Annual amortization rates |
Up to 20% | 8% | 20% | 20% | 10 to 20% | |||||||||||||||||||
| Cost |
||||||||||||||||||||||||
| Balance at 01/01/2017 |
9,694 | 1,748 | 3,840 | 3,525 | 2,112 | 20,919 | ||||||||||||||||||
| Acquisitions |
634 | 18 | 1,206 | 350 | 345 | 2,553 | ||||||||||||||||||
| Terminated agreements / derecognition |
(22 | ) | (16 | ) | — | (1 | ) | (329 | ) | (368 | ) | |||||||||||||
| Exchange variation |
1,305 | 25 | (77 | ) | — | 34 | 1,287 | |||||||||||||||||
| Other |
(449 | ) | 677 | (398 | ) | 479 | (1 | ) | 308 | |||||||||||||||
| Balance at 12/31/2017 |
11,162 | 2,452 | 4,571 | 4,353 | 2,161 | 24,699 | ||||||||||||||||||
| Amortization |
||||||||||||||||||||||||
| Balance at 01/01/2017 |
166 | (376 | ) | (1,701 | ) | (532 | ) | (1,012 | ) | (3,455 | ) | |||||||||||||
| Amortization expense (3) |
— | (273 | ) | (495 | ) | (446 | ) | (244 | ) | (1,458 | ) | |||||||||||||
| Terminated agreements / derecognition |
— | 16 | — | (6 | ) | 310 | 320 | |||||||||||||||||
| Exchange variation |
— | (17 | ) | 79 | — | (27 | ) | 35 | ||||||||||||||||
| Other |
(189 | ) | 3 | 119 | (283 | ) | (11 | ) | (361 | ) | ||||||||||||||
| Balance at 12/31/2017 |
(23 | ) | (647 | ) | (1,998 | ) | (1,267 | ) | (984 | ) | (4,919 | ) | ||||||||||||
| Impairment (Note 2.4h) |
||||||||||||||||||||||||
| Balance at 01/01/2017 |
— | — | (54 | ) | (335 | ) | (19 | ) | (408 | ) | ||||||||||||||
| Increase |
— | — | — | (14 | ) | — | (14 | ) | ||||||||||||||||
| Exchange variation |
— | — | — | 6 | 19 | 25 | ||||||||||||||||||
| Balance at 12/31/2017 |
— | — | (54 | ) | (343 | ) | — | (397 | ) | |||||||||||||||
| Book value |
||||||||||||||||||||||||
| Balance at 12/31/2017 |
11,139 | 1,805 | 2,519 | 2,743 | 1,177 | 19,383 | ||||||||||||||||||
| (1) | The contractual commitments for the purchase of the new intangible assets totaled R$ 984 achievable by 2020; |
| (2) | Includes of amounts paid for acquisition of rights to provide services of payment of salaries, proceeds, retirement and pension benefits and similar benefits; |
| (3) | Amortization expenses related to the rights for acquisition of payrolls and associations, in the amount of R$ (487) (R$ (524) from 01/01 to 12/31/2016) are disclosed in the General and administrative expenses. |
F-76
Table of Contents
ITAÚ UNIBANCO HOLDING S.A.
Notes to the Consolidated Financial Statements
At 12/31/2018, 12/31/2017 and 01/01/2017 for balance sheet accounts and
From 01/01 to 12/31 of 2018, 2017 and 2016 for income statement accounts
(In millions of Reais, except information per share)
| Goodwill and intangible from acquisition |
Intangible assets (1) | Total | ||||||||||||||||||||||
| Association for the promotion and offer of financial products and services |
Software Acquired |
Internally developed software |
Other intangible assets (2) |
|||||||||||||||||||||
| Annual amortization rates |
Up to 20% | 8% | 20% | 20% | 10 to 20% | |||||||||||||||||||
| Cost |
||||||||||||||||||||||||
| Balance at 01/01/2016 |
2,081 | 1,409 | 2,362 | 3,311 | 1,946 | 11,109 | ||||||||||||||||||
| Acquisitions |
7,706 | 719 | 1,293 | 215 | 619 | 10,552 | ||||||||||||||||||
| Terminated agreements / derecognition |
(35 | ) | (73 | ) | (3 | ) | (1 | ) | (308 | ) | (420 | ) | ||||||||||||
| Exchange variation |
(58 | ) | (12 | ) | 120 | — | (123 | ) | (73 | ) | ||||||||||||||
| Other |
— | (295 | ) | 68 | — | (22 | ) | (249 | ) | |||||||||||||||
| Balance at 12/31/2016 |
9,694 | 1,748 | 3,840 | 3,525 | 2,112 | 20,919 | ||||||||||||||||||
| Amortization |
||||||||||||||||||||||||
| Balance at 01/01/2016 |
153 | (330 | ) | (1,190 | ) | (252 | ) | (1,100 | ) | (2,719 | ) | |||||||||||||
| Amortization expense (3) |
— | (263 | ) | (429 | ) | (280 | ) | (311 | ) | (1,283 | ) | |||||||||||||
| Terminated agreements / derecognition |
— | 67 | 1 | — | 306 | 374 | ||||||||||||||||||
| Exchange variation |
— | 84 | (107 | ) | — | 96 | 73 | |||||||||||||||||
| Other |
13 | 66 | 24 | — | (3 | ) | 100 | |||||||||||||||||
| Balance at 12/31/2016 |
166 | (376 | ) | (1,701 | ) | (532 | ) | (1,012 | ) | (3,455 | ) | |||||||||||||
| Impairment (Note 2.4h) |
||||||||||||||||||||||||
| Balance at 01/01/2016 |
— | (2 | ) | — | (18 | ) | (18 | ) | (38 | ) | ||||||||||||||
| Incresase |
— | — | (57 | ) | (317 | ) | (1 | ) | (375 | ) | ||||||||||||||
| Write-off |
— | 2 | — | — | — | 2 | ||||||||||||||||||
| Exchange variation |
— | — | 3 | — | — | 3 | ||||||||||||||||||
| Balance at 12/31/2016 |
— | — | (54 | ) | (335 | ) | (19 | ) | (408 | ) | ||||||||||||||
| Book value |
||||||||||||||||||||||||
| Balance at 12/31/2016 |
9,860 | 1,372 | 2,085 | 2,658 | 1,081 | 17,056 | ||||||||||||||||||
| (1) | The contractual commitments for the purchase of the new intangible assets totaled R$ 262 achievable by 2017; |
| (2) | Includes of amounts paid for acquisition of rights to provide services of payment of salaries, proceeds, retirement and pension benefits and similar benefits; |
| (3) | Amortization expenses related to the rights for acquisition of payrolls and associations, in the amount of R$ (524) (R$ (357) from 01/01 to 12/31/2015) are disclosed in the General and administrative expenses. |
F-77
Table of Contents
ITAÚ UNIBANCO HOLDING S.A.
Notes to the Consolidated Financial Statements
At 12/31/2018, 12/31/2017 and 01/01/2017 for balance sheet accounts and
From 01/01 to 12/31 of 2018, 2017 and 2016 for income statement accounts
(In millions of Reais, except information per share)
Note 15 - Deposits
| 12/31/2018 | 12/31/2017 | |||||||||||||||||||||||
| Current | Non-current | Total | Current | Non-current | Total | |||||||||||||||||||
| Interest-bearing deposits |
235,248 | 155,592 | 390,840 | 204,363 | 129,599 | 333,962 | ||||||||||||||||||
| Time deposits |
95,914 | 155,386 | 251,300 | 82,718 | 129,082 | 211,800 | ||||||||||||||||||
| Interbank |
2,469 | 206 | 2,675 | 1,665 | 517 | 2,182 | ||||||||||||||||||
| Savings accounts |
136,865 | 0 | 136,865 | 119,980 | — | 119,980 | ||||||||||||||||||
| Non-interest bearing deposits |
72,584 | 0 | 72,584 | 68,976 | — | 68,976 | ||||||||||||||||||
| Demand deposits |
72,581 | 0 | 72,581 | 68,973 | — | 68,973 | ||||||||||||||||||
| Others Deposits |
3 | 0 | 3 | 3 | — | 3 | ||||||||||||||||||
| Total |
307,832 | 155,592 | 463,424 | 273,339 | 129,599 | 402,938 | ||||||||||||||||||
|
|
|
|
|
|
|
|
|
|
|
|
|
|||||||||||||
Note 16 – Financial liabilities designated at fair value through profit or loss
| 12/31/2018 | 12/31/2017 | |||||||||||||||||||||||
| Current | Non-current | Total | Current | Non-current | Total | |||||||||||||||||||
| Structured notes |
||||||||||||||||||||||||
| Shares |
31 | 9 | 40 | 6 | 53 | 59 | ||||||||||||||||||
| Debt securities |
6 | 146 | 152 | 49 | 357 | 406 | ||||||||||||||||||
|
|
|
|
|
|
|
|
|
|
|
|
|
|||||||||||||
| Total |
37 | 155 | 192 | 55 | 410 | 465 | ||||||||||||||||||
|
|
|
|
|
|
|
|
|
|
|
|
|
|||||||||||||
The effect of credit risk of these instruments is not significant at 12/31/2018 and 12/31/2017.
Shares and debt securities do not have a defined amount on maturity, since they vary according to market quotation and an exchange variation component, respectively.
Note 17 – Securities sold under repurchase agreements and interbank and institutional market debts
| a) | Securities sold under repurchase agreements |
The table below shows the breakdown of funds:
| Interest rate (p.a.) |
12/31/2018 | 12/31/2017 | ||||||||||||||||||||||||
| Current | Non-current | Total | Current | Non-current | Total | |||||||||||||||||||||
| Assets pledged as collateral |
71,231 | 6,420 | 77,651 | 82,075 | 27,178 | 109,253 | ||||||||||||||||||||
| Government securities |
93.5% of CDI to 6.4% | 46,676 | 4 | 46,680 | 43,491 | — | 43,491 | |||||||||||||||||||
| Corporate securities |
40% of CDI to 97.7% of CDI | 9,051 | 0 | 9,051 | 6,564 | — | 6,564 | |||||||||||||||||||
| Own issue |
65% of CDI to 16.93% | 15,156 | 6,261 | 21,417 | 31,659 | 27,178 | 58,837 | |||||||||||||||||||
| Foreign |
0.22% to 5.2% | 348 | 155 | 503 | 361 | — | 361 | |||||||||||||||||||
| Assets received as collateral |
5.6% to 6.4% | 172,953 | 0 | 172,953 | 146,853 | — | 146,853 | |||||||||||||||||||
| Right to sell or repledge the collateral |
97.5% of CDI to 10% | 27,337 | 52,296 | 79,633 | 11,880 | 44,648 | 56,528 | |||||||||||||||||||
|
|
|
|
|
|
|
|
|
|
|
|
|
|||||||||||||||
| Total |
271,521 | 58,716 | 330,237 | 240,808 | 71,826 | 312,634 | ||||||||||||||||||||
|
|
|
|
|
|
|
|
|
|
|
|
|
|||||||||||||||
F-78
Table of Contents
ITAÚ UNIBANCO HOLDING S.A.
Notes to the Consolidated Financial Statements
At 12/31/2018, 12/31/2017 and 01/01/2017 for balance sheet accounts and
From 01/01 to 12/31 of 2018, 2017 and 2016 for income statement accounts
(In millions of Reais, except information per share)
| b) | Interbank market debt |
| Interest rate (p.a.) |
12/31/2018 | 12/31/2017 | ||||||||||||||||||||||||
| Current | Non-current | Total | Current | Non-current | Total | |||||||||||||||||||||
| Financial credit bills |
IGPM to 110% of CDI | 9,139 | 28,789 | 37,928 | 13,234 | 14,457 | 27,691 | |||||||||||||||||||
| Real state credit bills |
82% of CDI to 95% of CDI | 6,465 | 3,081 | 9,546 | 14,046 | 4,479 | 18,525 | |||||||||||||||||||
| Agribusiness credit bills |
70% of CDI to 98% of CDI | 9,586 | 8,427 | 18,013 | 7,562 | 7,539 | 15,101 | |||||||||||||||||||
| Guaranteed real state notes |
96% of CDI | 0 | 1,227 | 1,227 | — | — | — | |||||||||||||||||||
| Import and export financing |
0.79% to 11.1% | 42,685 | 7,365 | 50,050 | 30,548 | 8,541 | 39,089 | |||||||||||||||||||
| On-lending - domestic |
2.5% to 14.5% | 5,301 | 12,605 | 17,906 | 7,991 | 16,190 | 24,181 | |||||||||||||||||||
|
|
|
|
|
|
|
|
|
|
|
|
|
|||||||||||||||
| Total |
73,176 | 61,494 | 134,670 | 73,381 | 51,206 | 124,587 | ||||||||||||||||||||
|
|
|
|
|
|
|
|
|
|
|
|
|
|||||||||||||||
Funding for import and export financing represents credit facilities available for financing of imports and exports of Brazilian companies, in general denominated in foreign currency.
| c) | Institucional market debt |
| Interest rate (p.a.) |
12/31/2018 | 12/31/2017 | ||||||||||||||||||||||||
| Current | Non-current | Total | Current | Non-current | Total | |||||||||||||||||||||
| Subordinated debt (1) |
3.8% to IGPM + 4.63% | 343 | 48,970 | 49,313 | 12,500 | 40,196 | 52,696 | |||||||||||||||||||
| Foreign borrowing through securities |
0.89% to 30.35% | 6,232 | 35,631 | 41,863 | 11,764 | 29,636 | 41,400 | |||||||||||||||||||
| Structured Operations Certificates (2) |
IPCA to 15.82% | 1,949 | 849 | 2,798 | 1,762 | 2,624 | 4,386 | |||||||||||||||||||
|
|
|
|
|
|
|
|
|
|
|
|
|
|||||||||||||||
| Total |
8,524 | 85,450 | 93,974 | 26,026 | 72,456 | 98,482 | ||||||||||||||||||||
|
|
|
|
|
|
|
|
|
|
|
|
|
|||||||||||||||
| (1) | At 12/31/2018, the amount of R$ 32,205 (R$ 42,687 at 12/31/2017) is included in the Reference Equity, under the proportion defined by CMN Resolution No. 4,192, of March 01, 2013. |
| (2) | As at December 31, 2018, the market value of the funding from Structured Operations Certificates issued is R$ 2,902 (R$ 4,605 at 12/31/2017). |
F-79
Table of Contents
ITAÚ UNIBANCO HOLDING S.A.
Notes to the Consolidated Financial Statements
At 12/31/2018, 12/31/2017 and 01/01/2017 for balance sheet accounts and
From 01/01 to 12/31 of 2018, 2017 and 2016 for income statement accounts
(In millions of Reais, except information per share)
Note 18 - Other assets and liabilities
| a) | Other assets |
| 12/31/2018 | 12/31/2017 | |||||||||||||||||||||||
| Current | Non-current | Total | Current | Non-current | Total | |||||||||||||||||||
| Financial |
62,390 | 12,700 | 75,090 | 46,718 | 12,850 | 59,568 | ||||||||||||||||||
| Receivables from credit card issuers |
36,491 | 0 | 36,491 | 32,073 | — | 32,073 | ||||||||||||||||||
| Deposits in guarantee for contingent, provisions and legal obligations (Note 29) |
1,455 | 12,079 | 13,534 | 1,520 | 11,892 | 13,412 | ||||||||||||||||||
| Negotiation and intermediation of securities |
15,400 | 255 | 15,655 | 6,202 | 18 | 6,220 | ||||||||||||||||||
| Income receivable |
3,155 | 5 | 3,160 | 2,843 | 106 | 2,949 | ||||||||||||||||||
| Credit of Operations without credit granting characteristics, net amount |
3,021 | 4 | 3,025 | 1,973 | 3 | 1,976 | ||||||||||||||||||
| Insurance and reinsurance operations |
899 | 356 | 1,255 | 1,224 | 10 | 1,234 | ||||||||||||||||||
| Net amount receivables from reimbursement of provisions (Note 29d) |
999 | 0 | 999 | 244 | 821 | 1,065 | ||||||||||||||||||
| Deposits in guarantee for foreign borrowing program |
970 | 1 | 971 | 639 | — | 639 | ||||||||||||||||||
| Non-financial |
7,969 | 1,313 | 9,282 | 9,373 | 1,820 | 11,193 | ||||||||||||||||||
| Sundry foreign |
995 | 9 | 1,004 | 1,847 | 29 | 1,876 | ||||||||||||||||||
| Prepaid expenses |
2,642 | 546 | 3,188 | 2,432 | 643 | 3,075 | ||||||||||||||||||
| Sundry domestic |
1,579 | 27 | 1,606 | 2,882 | 77 | 2,959 | ||||||||||||||||||
| Plan assets post-employment benefits (Note 26e) |
0 | 731 | 731 | — | 1,067 | 1,067 | ||||||||||||||||||
| Other |
2,753 | 0 | 2,753 | 2,212 | 4 | 2,216 | ||||||||||||||||||
| b) | Other liabilities |
| 12/31/2018 | 12/31/2017 | |||||||||||||||||||||||
| Current | Non-current | Total | Current | Non-current | Total | |||||||||||||||||||
| Financial |
95,639 | 1,790 | 97,429 | 85,928 | 15 | 85,943 | ||||||||||||||||||
| Credit card operations |
78,803 | 0 | 78,803 | 71,892 | — | 71,892 | ||||||||||||||||||
| Negotiation and intermediation of securities |
9,167 | 172 | 9,339 | 4,606 | 15 | 4,621 | ||||||||||||||||||
| Foreign exchange portfolio |
634 | 0 | 634 | 197 | — | 197 | ||||||||||||||||||
| Other |
7,035 | 1,618 | 8,653 | 9,233 | — | 9,233 | ||||||||||||||||||
| Non-financial |
24,931 | 1,079 | 26,010 | 24,186 | 2,176 | 26,362 | ||||||||||||||||||
| Funds in transit |
10,015 | 27 | 10,042 | 8,800 | 989 | 9,789 | ||||||||||||||||||
| Collection and payment of taxes and contributions |
476 | 0 | 476 | 325 | — | 325 | ||||||||||||||||||
| Social and statutory |
4,085 | 23 | 4,108 | 4,931 | 137 | 5,068 | ||||||||||||||||||
| Deferred income |
2,530 | 0 | 2,530 | 2,326 | — | 2,326 | ||||||||||||||||||
| Sundry creditors - domestic |
2,310 | 188 | 2,498 | 2,009 | 143 | 2,152 | ||||||||||||||||||
| Personnel provision |
1,606 | 63 | 1,669 | 1,496 | 51 | 1,547 | ||||||||||||||||||
| Provision for sundry payments |
1,670 | 81 | 1,751 | 1,721 | 135 | 1,856 | ||||||||||||||||||
| Liabilities for official agreements and rendering of payment services |
1,155 | 0 | 1,155 | 985 | — | 985 | ||||||||||||||||||
| Provision for retirement plan benefits (Note 26e) |
0 | 697 | 697 | — | 721 | 721 | ||||||||||||||||||
| Other |
1,084 | 0 | 1,084 | 1,593 | — | 1,593 | ||||||||||||||||||
F-80
Table of Contents
ITAÚ UNIBANCO HOLDING S.A.
Notes to the Consolidated Financial Statements
At 12/31/2018, 12/31/2017 and 01/01/2017 for balance sheet accounts and
From 01/01 to 12/31 of 2018, 2017 and 2016 for income statement accounts
(In millions of Reais, except information per share)
| Note | 19 – Stockholders’ equity |
| a) | Capital |
Capital is represented by 9,804,135,348 book-entry shares with no par value, of which 4,958,290,359 are common and 4,845,844,989 are preferred shares with no voting rights, but with tag-along rights, in the event of disposal of control, to be included in a public offering of shares, so as to ensure the price equal to eighty per cent (80%) of the amount paid per share with voting rights in the controlling stake, as well as a dividend at least equal to that of the common shares.
In Meetings of the Board of Directors held on 12/15/2017 and 02/22/2018, cancellations of 31,793,105 (47,689,657 amount considering the effect of the split) and 14,424,206, were approved, respective of common shares of own issue and shares held in treasury, with no change in capital, upon capitalization of amounts recorded in Revenue Reserves – Statutory Reserve.
The Extraordinary Stockholders’ Meeting – ESM held on July 27, 2018 approved the split in 50% the Company’s shares of capital stock, and the process was approved by BACEN on October 31, 2018. The new shares were included in the share position on November 26, 2018. Thus, for better comparability, the number of shares presented in this item are affected by the split effect.
The breakdown and change in shares of paid-in capital in the beginning and end of the period are shown below:
| 12/31/2018 | ||||||||||||||||
| Number | Amount | |||||||||||||||
| Common | Preferred | Total | ||||||||||||||
| Residents in Brazil at 12/31/2017 |
3,299,073,506 | 1,116,291,341 | 4,415,364,847 | 65,482 | ||||||||||||
| Residents abroad at 12/31/2017 |
20,877,606 | 2,114,271,985 | 2,135,149,591 | 31,666 | ||||||||||||
|
|
|
|
|
|
|
|
|
|||||||||
| Shares of capital stock at 12/31/2017 |
3,319,951,112 | 3,230,563,326 | 6,550,514,438 | 97,148 | ||||||||||||
| Stock Split – ESM of 07/27/2018 – Approved on 10/31/2018 |
1,652,763,453 | 1,615,281,663 | 3,268,045,116 | 0 | ||||||||||||
| (-) Cancellation of Shares – Meeting of the Board of Directors 02/22/2018 |
(14,424,206 | ) | 0 | (14,424,206 | ) | 0 | ||||||||||
| Shares of capital stock at 12/31/2018 |
4,958,290,359 | 4,845,844,989 | 9,804,135,348 | 97,148 | ||||||||||||
|
|
|
|
|
|
|
|
|
|||||||||
| Residents in Brazil at 12/31/2018 |
4,928,076,320 | 1,609,055,166 | 6,537,131,486 | 64,776 | ||||||||||||
| Residents abroad at 12/31/2018 |
30,214,039 | 3,236,789,823 | 3,267,003,862 | 32,372 | ||||||||||||
| Treasury shares at 12/31/2017 (1) |
14,424,206 | 71,459,714 | 85,883,920 | (2,743 | ) | |||||||||||
| Purchase of shares |
0 | 13,100,000 | 13,100,000 | (510 | ) | |||||||||||
| (-) Cancellation of Shares – Meeting of the Board of Directors 02/22/2018 |
(14,424,206 | ) | 0 | (14,424,206 | ) | 534 | ||||||||||
| Result of delivery of treasury shares |
0 | (29,623,265 | ) | (29,623,265 | ) | 899 | ||||||||||
| Stock Split – ESM of 07/27/2018 – Approved on 10/31/2018 |
0 | 28,677,977 | 28,677,977 | 0 | ||||||||||||
| Treasury shares at 12/31/2018 (1) |
0 | 83,614,426 | 83,614,426 | (1,820 | ) | |||||||||||
|
|
|
|
|
|
|
|
|
|||||||||
| Outstanding shares at 12/31/2018 |
4,958,290,359 | 4,762,230,563 | 9,720,520,922 | |||||||||||||
| Outstanding shares at 12/31/2017 (2) |
4,958,290,359 | 4,738,655,417 | 9,696,945,776 | |||||||||||||
|
|
|
|
|
|
|
|||||||||||
F-81
Table of Contents
ITAÚ UNIBANCO HOLDING S.A.
Notes to the Consolidated Financial Statements
At 12/31/2018, 12/31/2017 and 01/01/2017 for balance sheet accounts and
From 01/01 to 12/31 of 2018, 2017 and 2016 for income statement accounts
(In millions of Reais, except information per share)
| 12/31/2017 | ||||||||||||||||
| Number | Amount | |||||||||||||||
| Common | Preferred | Total | ||||||||||||||
| Residents in Brazil at 12/31/2016 |
5,003,025,466 | 1,657,445,596 | 6,660,471,062 | 65,534 | ||||||||||||
| Residents abroad at 12/31/2016 |
24,590,859 | 3,188,399,392 | 3,212,990,251 | 31,614 | ||||||||||||
|
|
|
|
|
|
|
|
|
|||||||||
| Shares of capital stock at 12/31/2016 |
5,027,616,325 | 4,845,844,988 | 9,873,461,313 | 97,148 | ||||||||||||
| (-) Cancellation of shares – Meeting of the Board of Directors 12/15/2017 |
(47,689,657 | ) | — | (47,689,657 | ) | — | ||||||||||
| Shares of capital stock at 12/31/2017 |
4,979,926,668 | 4,845,844,988 | 9,825,771,656 | 97,148 | ||||||||||||
|
|
|
|
|
|
|
|
|
|||||||||
| Residents in Brazil at 12/31/2017 |
4,948,610,259 | 1,674,437,011 | 6,623,047,270 | 65,482 | ||||||||||||
| Residents abroad at 12/31/2017 |
31,316,409 | 3,171,407,977 | 3,202,724,386 | 31,666 | ||||||||||||
| Treasury shares at 12/31/2016 (1) |
4,611 | 104,406,693 | 104,411,304 | (1,882 | ) | |||||||||||
| Purchase of shares |
69,321,355 | 56,974,350 | 126,295,705 | (3,089 | ) | |||||||||||
| (-) Cancellation of shares – Meeting of the Board of Directors 12/15/2017 |
(47,689,657 | ) | — | (47,689,657 | ) | 1,178 | ||||||||||
| Result of delivery of treasury shares |
— | (54,191,472 | ) | (54,191,472 | ) | 1,050 | ||||||||||
| Treasury shares at 12/31/2017 (1) |
21,636,309 | 107,189,571 | 128,825,880 | (2,743 | ) | |||||||||||
|
|
|
|
|
|
|
|
|
|||||||||
| Outstanding shares at 12/31/2017 (2) |
4,958,290,359 | 4,738,655,417 | 9,696,945,776 | |||||||||||||
| Outstanding shares at 12/31/2016 (2) |
5,027,611,714 | 4,741,438,296 | 9,769,050,010 | |||||||||||||
|
|
|
|
|
|
|
|||||||||||
| (1) | Own shares, purchased based on authorization of the Board of Directors, to be held in Treasury for subsequent cancellation of replacement in the market. |
| (2) | For better comparability, outstanding shares in the period of 12/31/2017 and 12/31/2016 were adjusted by the split approved on 10/31/2018. |
Cost of shares purchased in the period, as well the average cost of treasury shares and their market price (in Brazilian Reais per share):
| Cost / market value |
01/01 to 12/31/2018 | |||||||
| Common | Preferred | |||||||
| Minimum |
0 | 37.45 | ||||||
| Weighted average |
0 | 38.95 | ||||||
| Maximum |
0 | 40.06 | ||||||
|
|
|
|
|
|||||
| Treasury shares |
||||||||
| Average cost |
0 | 21.76 | ||||||
| Market value at 12/31/2018 |
30.05 | 35.50 | ||||||
| Cost / market value (*) |
01/01 to 12/31/2017 | |||||||
| Common | Preferred | |||||||
| Minimum |
24.70 | 22.32 | ||||||
| Weighted average |
24.70 | 24.16 | ||||||
| Maximum |
24.70 | 25.70 | ||||||
|
|
|
|
|
|||||
| Treasury shares (*) |
||||||||
| Average cost |
24.70 | 20.60 | ||||||
| Market value at 12/31/2017 |
25.12 | 28.38 | ||||||
| (*) | For better comparability, information of the period 12/31/2017 was adjusted by the split approved on 10/31/2018. |
F-82
Table of Contents
ITAÚ UNIBANCO HOLDING S.A.
Notes to the Consolidated Financial Statements
At 12/31/2018, 12/31/2017 and 01/01/2017 for balance sheet accounts and
From 01/01 to 12/31 of 2018, 2017 and 2016 for income statement accounts
(In millions of Reais, except information per share)
| b) | Dividends |
Shareholders are entitled mandatory minimum dividends in each fiscal year, corresponding to 25% of adjusted net income, as set forth in the Bylaws. Common and preferred shares participate equally of income distributed, after common shares have received dividends equal to the annual minimum priority dividend to be paid to preferred shares (R$ 0.022 non-cumulative per share).
The calculation of the monthly advance of the mandatory minimum dividend is based on the share position on the last day of the prior month, with payment being made on the first business day of the subsequent month, amounting to R$ 0.015 per share.
| l - | Calculation of dividends and interest on capital |
| 12/31/2018 | 12/31/2017 | 12/31/2016 | ||||||||||
| Statutory net income |
21,945 | 21,108 | 18,853 | |||||||||
| Adjustments: |
||||||||||||
| (-) Legal reserve - 5% |
(1,097 | ) | (1,055 | ) | (943 | ) | ||||||
| Dividend calculation basis |
20,848 | 20,053 | 17,910 | |||||||||
| Mandatory minimum dividend - 25% |
5,212 | 5,013 | 4,478 | |||||||||
| Dividends and Interest on Capital Paid / Provided for / Identified (*) |
22,437 | 17,558 | 10,000 | |||||||||
| (*) | On December 31, 2018, it includes extraordinary dividends, with balances of the Statutory Reserve. |
| ll - | Stockholders’ compensation |
| 12/31/2018 | ||||||||||||||||
| Gross value per share (R$) |
Gross | WHT | Net | |||||||||||||
| Paid / prepaid |
5,921 | (122 | ) | 5,799 | ||||||||||||
| Dividends - 11 monthly installments from February to December 2018 |
0,0150 | 1,069 | 0 | 1,069 | ||||||||||||
| Dividends - paid on 08/30/2018 |
0,6240 | 4,041 | 0 | 4,041 | ||||||||||||
| Interest on capital - paid on 08/30/2018 |
0,1252 | 811 | (122 | ) | 689 | |||||||||||
| Provided for (Recorded in Other Liabilities) |
248 | (15 | ) | 233 | ||||||||||||
| Dividends - 1 monthly installment paid on 01/02/2019 |
0,0150 | 145 | 0 | 145 | ||||||||||||
| Interest on capital - credited on 12/27/2018 to be paid until 04/30/2019 |
0.0106 | 103 | (15 | ) | 88 | |||||||||||
| Identified in Revenue Reserve In Stockholders’ Equity |
1.8001 | 17,498 | (1,093 | ) | 16,405 | |||||||||||
|
|
|
|
|
|
|
|||||||||||
| Total from 01/01 to 12/31/2018 |
23,667 | (1,230 | ) | 22,437 | ||||||||||||
|
|
|
|
|
|
|
|||||||||||
| 12/31/2017 | ||||||||||||||||
| Gross value per share (R$) |
Gross | WHT | Net | |||||||||||||
| Paid / prepaid |
3,666 | (389 | ) | 3,277 | ||||||||||||
| Dividends - 11 monthly installments from February to December 2017 |
0,0150 | 1,074 | — | 1,074 | ||||||||||||
| Interest on capital - paid on 08/25/2017 |
0,3990 | 2,592 | (389 | ) | 2,203 | |||||||||||
| Provided for (Recorded in Other Liabilities) |
1,877 | (140 | ) | 1,737 | ||||||||||||
| Dividends - 1 monthly installment paid on 01/02/2018 |
0,0150 | 98 | — | 98 | ||||||||||||
| Dividends provision |
0.1304 | 843 | — | 843 | ||||||||||||
| Interest on capital, credited on 12/28/2017 to be paid until 04/30/2018 |
0.1445 | 936 | (140 | ) | 796 | |||||||||||
| Identified in Revenue Reserve In Stockholders’ Equity |
2.1126 | 13,658 | (1,114 | ) | 12,544 | |||||||||||
|
|
|
|
|
|
|
|||||||||||
| Total from 01/01 to 12/31/2017 |
19,201 | (1,643 | ) | 17,558 | ||||||||||||
|
|
|
|
|
|
|
|||||||||||
F-83
Table of Contents
ITAÚ UNIBANCO HOLDING S.A.
Notes to the Consolidated Financial Statements
At 12/31/2018, 12/31/2017 and 01/01/2017 for balance sheet accounts and
From 01/01 to 12/31 of 2018, 2017 and 2016 for income statement accounts
(In millions of Reais, except information per share)
| 12/31/2016 | ||||||||||||||||
| Gross value per share (R$) |
Gross | WHT | Net | |||||||||||||
| Paid / prepaid |
3,355 | (355 | ) | 3,000 | ||||||||||||
| Dividends - 11 monthly installments paid from February to December 2016 |
0,0150 | 987 | — | 987 | ||||||||||||
| Interest on capital - paid on 08/25/2016 |
0,3990 | 2,368 | (355 | ) | 2,013 | |||||||||||
| Provided for (Recorded in Other Liabilities) |
3,169 | (461 | ) | 2,708 | ||||||||||||
| Dividends - 1 monthly installment paid on 01/02/2017 |
0,0150 | 98 | — | 98 | ||||||||||||
| Interest on capital - credited on 12/30/2016 paid on 04/28/2017 |
0.4714 | 3,071 | (461 | ) | 2,610 | |||||||||||
| Identified in Revenue Reserve In Stockholders’ Equity |
0.7754 | 5,050 | (758 | ) | 4,292 | |||||||||||
|
|
|
|
|
|
|
|||||||||||
| Total from 01/01 to 12/31/2016 |
11,574 | (1,574 | ) | 10,000 | ||||||||||||
|
|
|
|
|
|
|
|||||||||||
| c) | Capital reserves and revenue reserves |
| l - | Additional paid-in capital |
Additional paid-in capital corresponds to: (i) the difference between the proceeds from the sale of treasury shares and the average cost of such shares, and (ii) the compensation expenses recognized in accordance with the stock option plan and variable compensation.
| ll - | Appropriated reserves |
| 12/31/2018 | 12/31/2017 | 12/31/2016 | ||||||||||
| Capital reserves |
285 | 285 | 285 | |||||||||
| Premium on subscription of shares |
284 | 284 | 284 | |||||||||
| Reserves from tax incentives, restatement of equity securities and other |
1 | 1 | 1 | |||||||||
| Revenue reserves |
13,195 | 12,214 | 3,158 | |||||||||
| Legal (1) |
9,989 | 8,892 | 7,838 | |||||||||
| Statutory (2) |
(2,775 | ) | 589 | 1,132 | ||||||||
| Corporate reorganizations (Note 2.4 a IV) |
(11,517 | ) | (10,925 | ) | (10,862 | ) | ||||||
| Special revenue reserves (3) |
17,498 | 13,658 | 5,050 | |||||||||
|
|
|
|
|
|
|
|||||||
| Total reserves at parent company |
13,480 | 12,499 | 3,443 | |||||||||
|
|
|
|
|
|
|
|||||||
| (1) | It purpose is to ensure the integrity of capital, compensate loss or increase capital. |
| (2) | Its main purpose is to ensure the remuneration flow to shareholders. |
| (3) | Refers to Dividends or Interest on Capital declared until 12/31/2018, 12/31/2017 and 12/31/2016. |
| lll - | Unappropriated reserves |
Refers to balance of profit remaining after the distribution of dividends and appropriations to statutory reserves in the statutory accounts of ITAÚ UNIBANCO HOLDING.
F-84
Table of Contents
ITAÚ UNIBANCO HOLDING S.A.
Notes to the Consolidated Financial Statements
At 12/31/2018, 12/31/2017 and 01/01/2017 for balance sheet accounts and
From 01/01 to 12/31 of 2018, 2017 and 2016 for income statement accounts
(In millions of Reais, except information per share)
| d) | Non-controlling interests |
| Stockholders’ equity | Net Income | |||||||||||||||
| 12/31/2018 | 12/31/2017 | 01/01 to 12/31/2018 |
01/01 to 12/31/2017 |
|||||||||||||
| Itaú CorpBanca (Note 3) |
11,645 | 11,144 | 539 | (38 | ) | |||||||||||
| Itaú CorpBanca Colômbia S.A. (Note 3) |
1,268 | 1,203 | (2 | ) | (50 | ) | ||||||||||
| Financeira Itaú CBD S.A. Crédito, Financiamento e Investimento |
364 | 297 | 105 | 70 | ||||||||||||
| Luizacred S.A. Soc. Cred. Financiamento Investimento |
288 | 241 | 44 | 24 | ||||||||||||
| Other |
119 | 93 | 46 | 26 | ||||||||||||
|
|
|
|
|
|
|
|
|
|||||||||
| Total |
13,684 | 12,978 | 732 | 32 | ||||||||||||
|
|
|
|
|
|
|
|
|
|||||||||
| Note | 20 – Share-based payment |
ITAÚ UNIBANCO HOLDING and its subsidiaries have share-based payment plans aimed at involving its management members and employees in the medium and long term corporate development process.
The grant of these benefits are only made in years in which there are sufficient profits to enable the distribution of mandatory dividends, limiting the maximum dilutive effect to 0.5% of the total shares held by the controlling and minority stockholders at the balance sheet date. These programs are settled through the delivery of ITUB4 treasury shares to stockholders.
The Extraordinary Stockholders’ Meeting – ESM held on July 27, 2018 approved the split in 50% the Company’s shares of capital stock, and the process was approved by BACEN on October 31, 2018. The new shares were included in the share position on November 26, 2018. Thus, for better comparability, the number of shares presented in this item are affected by the split effect.
Expenses on stock-based payment plans are presented in the table below:
| 01/01 to 12/31/2018 |
01/01 to 12/31/2017 |
01/01 to 12/31/2016 |
||||||||||
| Partner Plan |
(226 | ) | (234 | ) | (306 | ) | ||||||
| Variable compensation plan |
(377 | ) | (302 | ) | (285 | ) | ||||||
|
|
|
|
|
|
|
|||||||
| Total |
(603 | ) | (536 | ) | (591 | ) | ||||||
|
|
|
|
|
|
|
|||||||
F-85
Table of Contents
ITAÚ UNIBANCO HOLDING S.A.
Notes to the Consolidated Financial Statements
At 12/31/2018, 12/31/2017 and 01/01/2017 for balance sheet accounts and
From 01/01 to 12/31 of 2018, 2017 and 2016 for income statement accounts
(In millions of Reais, except information per share)
| l - | Partner Plan |
The employees and management members of ITAÚ UNIBANCO HOLDING invest a percentage of their bonus to acquire shares and share-based instruments. Accordingly, the ownership of these shares should be held by the beneficiaries for a period from three to five years, counted from the initial investment, and are thus subject to market price variation. After complying with the suspensive conditions set forth in the program, beneficiaries will be entitled to receive shares as consideration, in accordance with the numbers of shares provided for in the program regulation.
The acquisition prices of shares and share-based Instruments are established every six months and are equivalent to the average of share quotation in the 30 days prior to the determination of the acquisition price, which is performed on the seventh business day prior to the remuneration grant date.
The fair value of the shares as consideration is the market price at the grant date, less expected dividends.
Changes in the Partner Program
| 01/01 to 12/31/2018 |
01/01 to 12/31/2017 |
|||||||
| Quantity | Quantity | |||||||
| Opening balance |
51,074,441 | 53,193,569 | ||||||
|
|
|
|
|
|||||
| New granted |
9,912,356 | 10,562,936 | ||||||
| Exercised |
(11,597,420 | ) | (11,284,577 | ) | ||||
| Cancelled |
(518,195 | ) | (1,397,487 | ) | ||||
|
|
|
|
|
|||||
| Closing balance |
48,871,182 | 51,074,441 | ||||||
|
|
|
|
|
|||||
| Weighted average of remaining contractual life (years) |
2.52 | 2.46 | ||||||
|
|
|
|
|
|||||
| Market value weighted average (R$) |
26.22 | 21.55 | ||||||
|
|
|
|
|
|||||
| II - | Variable compensation |
In this plan, 50% of variable compensation of management members should be paid in cash and fifty percent (50%) should be paid in shares for a period of three years. Shares are delivered on a deferred basis, of which one-third (1/3) per year, will be contingent upon the executive’s remaining with the institution. The deferred unpaid portions may be reversed proportionally to the significant reduction of the recurring income realized or the negative income for the period.
Management members become eligible for the receipt of these benefits according to individual performance, business performance or both. The benefit amount is established according to the activities of each management member that should meet at least the performance and conduct requirements.
The fair value of the share is the market price at its grant date.
Change in variable compensation in shares
| 01/01 to 12/31/2018 |
01/01 to 12/31/2017 |
|||||||
| Quantity | Quantity | |||||||
| Opening balance |
31,229,973 | 36,809,109 | ||||||
|
|
|
|
|
|||||
| New |
10,552,225 | 12,835,324 | ||||||
| Delivered |
(16,611,521 | ) | (18,072,947 | ) | ||||
| Cancelled |
(154,532 | ) | (341,513 | ) | ||||
|
|
|
|
|
|||||
| Closing balance |
25,016,145 | 31,229,973 | ||||||
|
|
|
|
|
|||||
| Market value weighted average (R$) |
34.04 | 25.49 | ||||||
|
|
|
|
|
|||||
F-86
Table of Contents
ITAÚ UNIBANCO HOLDING S.A.
Notes to the Consolidated Financial Statements
At 12/31/2018, 12/31/2017 and 01/01/2017 for balance sheet accounts and
From 01/01 to 12/31 of 2018, 2017 and 2016 for income statement accounts
(In millions of Reais, except information per share)
| Ill - | Stock Option Plan (Simple Options) |
ITAÚ UNIBANCO HOLDING has a Stock Option Plan (“Simple Options”), which was discontinued, and only exercisable options remain.
Simple options have the following characteristics:
| a) | Exercise price: calculated based on the average prices of shares in the three months of the year prior to the grant date. The prices determined will be inflation-adjusted to the last business day of the month prior to the option exercise date based on IGP-M or, in its absence, on an index to be determined internally, and should be paid within the period in force for the settlement of operations on B3. |
| b) | Vesting period: determined upon issue, from one to seven years, counted from the grant date. The vesting period is normally determined at five years. |
Summary of changes in the Simple options plan
| 01/01 to 12/31/2018 | 01/01 to 12/31/2017 | |||||||||||||||
| Quantity | Weighted average exercise price |
Quantity | Weighted average exercise price |
|||||||||||||
| Opening balance |
24,514,359 | 25.21 | 57,050,259 | 24.63 | ||||||||||||
| Options exercisable at the end of the period |
24,514,359 | 25.21 | 35,160,265 | 27.32 | ||||||||||||
| Options outstanding but not exercisable |
0 | 0 | 21,889,994 | 20.30 | ||||||||||||
|
|
|
|
|
|
|
|
|
|||||||||
| Options: |
||||||||||||||||
| Canceled / Forfeited (*) |
(352,085 | ) | 29.29 | (1,807,091 | ) | 27.41 | ||||||||||
| Exercised |
(21,072,675 | ) | 28.26 | (30,728,809 | ) | 23.72 | ||||||||||
|
|
|
|
|
|
|
|
|
|||||||||
| Closing balance |
3,089,599 | 22.11 | 24,514,359 | 25.21 | ||||||||||||
| Options exercisable at the end of the period |
3,089,599 | 22.11 | 24,514,359 | 25.21 | ||||||||||||
|
|
|
|
|
|
|
|
|
|||||||||
| Range of exercise prices |
14.47 - 29.51 | 14.47 - 27.54 | ||||||||||||||
| Weighted average of the remaining contractual life (in years) |
0.99 | 1.28 | ||||||||||||||
|
|
|
|
|
|||||||||||||
| Market value weighted average (R$) |
33.98 | 28.04 | ||||||||||||||
|
|
|
|
|
|||||||||||||
| (*) | Refers to non-exercise based on the beneficiary’s decision. |
| Note | 21 - Interest and similar income and expense and net gain (loss) on investment securities and derivatives |
| a) | Interest and similar income of financial assets at amortized cost and at fair value through other comprehensive income |
| 01/01 to 12/31/2018 |
01/01 to 12/31/2017 |
01/01 to 12/31/2016 |
||||||||||
| Central Bank compulsory deposits |
5,063 | 7,201 | 6,920 | |||||||||
| Interbank deposits |
1,080 | 744 | 674 | |||||||||
| Securities purchased under agreements to resell |
17,365 | 25,711 | 34,162 | |||||||||
| Financial assets at fair value through other comprehensive income |
9,194 | 8,886 | 11,160 | |||||||||
| Financial assets at amortized cost |
2,614 | 3,017 | 3,822 | |||||||||
| Loan and lease operations |
73,640 | 75,568 | 80,124 | |||||||||
| Other financial assets |
1,368 | 1,576 | 1,902 | |||||||||
|
|
|
|
|
|
|
|||||||
| Total |
110,324 | 122,703 | 138,764 | |||||||||
|
|
|
|
|
|
|
|||||||
F-87
Table of Contents
ITAÚ UNIBANCO HOLDING S.A.
Notes to the Consolidated Financial Statements
At 12/31/2018, 12/31/2017 and 01/01/2017 for balance sheet accounts and
From 01/01 to 12/31 of 2018, 2017 and 2016 for income statement accounts
(In millions of Reais, except information per share)
| b) | Interest and similar expense |
| 01/01 to 12/31/2018 |
01/01 to 12/31/2017 |
01/01 to 12/31/2016 |
||||||||||
| Deposits |
(17,484 | ) | (13,340 | ) | (14,701 | ) | ||||||
| Securities sold under repurchase agreements |
(20,889 | ) | (33,087 | ) | (45,935 | ) | ||||||
| Interbank market debt |
(13,587 | ) | (10,059 | ) | (8,347 | ) | ||||||
| Institutional market debt |
(6,773 | ) | (6,852 | ) | (8,249 | ) | ||||||
| Financial expense from technical reserves for insurance and private pension plans |
(11,815 | ) | (14,918 | ) | (17,790 | ) | ||||||
| Other |
(64 | ) | (74 | ) | (107 | ) | ||||||
|
|
|
|
|
|
|
|||||||
| Total |
(70,612 | ) | (78,330 | ) | (95,129 | ) | ||||||
|
|
|
|
|
|
|
|||||||
| c) | Adjustments to Fair Value of Financial Assets and Liabilities |
| 01/01 to 12/31/2018 |
01/01 to 12/31/2017 |
01/01 to 12/31/2016 |
||||||||||
| Financial assets at fair value through profit or loss |
(4,110 | ) | 2,138 | 684 | ||||||||
| Derivatives (*) |
(260 | ) | 2,028 | 7,332 | ||||||||
| Financial assets designated at fair value through profit or loss |
(218 | ) | 180 | 48 | ||||||||
| Financial assets at fair value through other comprehensive income |
(254 | ) | (128 | ) | (851 | ) | ||||||
| Finacial liabilities designated at fair value |
8 | (37 | ) | (147 | ) | |||||||
|
|
|
|
|
|
|
|||||||
| Total |
(4,834 | ) | 4,181 | 7,066 | ||||||||
|
|
|
|
|
|
|
|||||||
| (*) | Includes the ineffective derivatives portion related to hedge accounting. |
During the period ended 12/31/2018, ITAÚ UNIBANCO HOLDING reversal R$ 1,535 as expenses for Expected Losses, with loss of R$ (1) for Financial Assets – Fair Value through Other Comprehensive Income, and reversal of loss of R$ 1,536 for Financial Assets – Amortized Cost.
| Note | 22 - Banking service fees |
| 01/01 to 12/31/2018 |
01/01 to 12/31/2017 |
01/01 to 12/31/2016 |
||||||||||
| Fees from credit and debit card services |
15,394 | 14,802 | 14,002 | |||||||||
| Current account services |
10,017 | 9,589 | 8,856 | |||||||||
| Asset management fees |
5,013 | 4,141 | 3,514 | |||||||||
| Fees for guarantees issued and credit lines |
1,768 | 1,783 | 1,773 | |||||||||
| Collection commissions |
1,506 | 1,378 | 1,315 | |||||||||
| Brokerage commission |
618 | 606 | 295 | |||||||||
| Other |
2,493 | 2,149 | 2,163 | |||||||||
|
|
|
|
|
|
|
|||||||
| Total |
36,809 | 34,448 | 31,918 | |||||||||
|
|
|
|
|
|
|
|||||||
F-88
Table of Contents
ITAÚ UNIBANCO HOLDING S.A.
Notes to the Consolidated Financial Statements
At 12/31/2018, 12/31/2017 and 01/01/2017 for balance sheet accounts and
From 01/01 to 12/31 of 2018, 2017 and 2016 for income statement accounts
(In millions of Reais, except information per share)
| Note | 23 - General and administrative expenses |
| 01/01 to 12/31/2018 |
01/01 to 12/31/2017 |
01/01 to 12/31/2016 |
||||||||||
| Personnel expenses |
(24,846 | ) | (23,276 | ) | (22,360 | ) | ||||||
| Compensation |
(10,226 | ) | (9,305 | ) | (8,897 | ) | ||||||
| Employee profit sharing |
(4,425 | ) | (3,836 | ) | (3,610 | ) | ||||||
| Welfare benefits |
(3,764 | ) | (3,374 | ) | (3,070 | ) | ||||||
| Provision for labor claims and Dismissals |
(2,907 | ) | (3,427 | ) | (4,143 | ) | ||||||
| Payroll taxes |
(3,011 | ) | (2,832 | ) | (2,567 | ) | ||||||
| Stock option plan (Note 20) |
(226 | ) | (234 | ) | (306 | ) | ||||||
| Training |
(253 | ) | (232 | ) | (193 | ) | ||||||
| Other |
(34 | ) | (36 | ) | 426 | |||||||
| Administrative expenses |
(17,268 | ) | (16,289 | ) | (15,959 | ) | ||||||
| Third party services |
(4,482 | ) | (4,161 | ) | (4,340 | ) | ||||||
| Data processing and telecommunications |
(4,273 | ) | (4,152 | ) | (3,966 | ) | ||||||
| Installations |
(3,306 | ) | (3,132 | ) | (3,066 | ) | ||||||
| Advertising, promotions and publications |
(1,419 | ) | (1,167 | ) | (1,036 | ) | ||||||
| Financial services |
(790 | ) | (833 | ) | (731 | ) | ||||||
| Security |
(754 | ) | (723 | ) | (716 | ) | ||||||
| Transportation |
(350 | ) | (339 | ) | (391 | ) | ||||||
| Materials |
(339 | ) | (350 | ) | (313 | ) | ||||||
| Travel |
(232 | ) | (214 | ) | (199 | ) | ||||||
| Other |
(1,323 | ) | (1,218 | ) | (1,201 | ) | ||||||
| Depreciation and Amortization |
(3,332 | ) | (3,034 | ) | (2,995 | ) | ||||||
| Other expenses |
(12,092 | ) | (10,895 | ) | (9,591 | ) | ||||||
| Selling - credit cards |
(4,285 | ) | (3,753 | ) | (3,165 | ) | ||||||
| Claims |
(675 | ) | (596 | ) | (571 | ) | ||||||
| Loss on sale of other assets, fixed assets and investments in associates and joint ventures |
(632 | ) | (495 | ) | (273 | ) | ||||||
| Provision for civil lawsuits (Note 29) |
(464 | ) | (1,519 | ) | (1,489 | ) | ||||||
| Provision for tax and social security lawsuits (Note 29) |
(328 | ) | (953 | ) | (915 | ) | ||||||
| Refund of interbank costs |
(272 | ) | (288 | ) | (292 | ) | ||||||
| Impairment - intangible asset |
(168 | ) | (504 | ) | — | |||||||
| Other |
(5,268 | ) | (2,787 | ) | (2,886 | ) | ||||||
|
|
|
|
|
|
|
|||||||
| Total |
(57,538 | ) | (53,494 | ) | (50,905 | ) | ||||||
|
|
|
|
|
|
|
|||||||
F-89
Table of Contents
ITAÚ UNIBANCO HOLDING S.A.
Notes to the Consolidated Financial Statements
At 12/31/2018, 12/31/2017 and 01/01/2017 for balance sheet accounts and
From 01/01 to 12/31 of 2018, 2017 and 2016 for income statement accounts
(In millions of Reais, except information per share)
| Note | 24 – Taxes |
ITAÚ UNIBANCO HOLDING and each one of its subsidiaries calculate separately, in each fiscal year, Income Tax and Social Contribution on Net Income.
Taxes are calculated at the rates shown below and consider, for effects of respective calculation bases, the legislation in force applicable to each charge.
| Income tax |
15.00 | % | ||
| Additional income tax |
10.00 | % | ||
| Social contribution (*) |
20.00 | % |
| (*) | On october 06, 2015, Law No. 13,169, a conversion of Provisional Measure No. 675, which increased the Social Contribution tax rate from 15.00% to 20.00% until December 31, 2018, for financial institutions, insurance companies and credit card management companies, was introduced. For the other companies, the tax rate remains at 9.00%. |
| a) | Expenses for taxes and contributions |
Demonstration of Income tax and social contribution expense calculation:
| Due on operations for the period |
01/01 to 12/31/2018 |
01/01 to 12/31/2017 |
01/01 to 12/31/2016 |
|||||||||
| Income before income tax and social contribution |
30,608 | 30,582 | 35,679 | |||||||||
| Charges (income tax and social contribution) at the rates in effect |
(13,774 | ) | (13,762 | ) | (16,057 | ) | ||||||
| Increase / decrease in income tax and social contribution charges arising from: |
||||||||||||
| Share of profit or (loss) of associates and joint ventures net |
147 | 169 | 165 | |||||||||
| Foreign exchange variation on investiments abroad |
4,381 | 397 | (4,313 | ) | ||||||||
| Interest on capital |
3,791 | 3,873 | 3,617 | |||||||||
| Corporate reorganizations (Note 2.4 a IV) |
628 | 628 | 628 | |||||||||
| Dividends and interest on external debt bonds |
516 | 420 | 365 | |||||||||
| Other nondeductible expenses net of non taxable income (*) |
1,747 | 3,736 | 11,697 | |||||||||
| Income tax and social contribution expenses |
(2,564 | ) | (4,539 | ) | (3,898 | ) | ||||||
|
|
|
|
|
|
|
|||||||
| Related to temporary differences |
||||||||||||
| Increase (reversal) for the period |
(2,650 | ) | (2,888 | ) | (9,827 | ) | ||||||
| Increase (reversal) of prior periods |
245 | 70 | 62 | |||||||||
| (Expenses) / Income related to deferred taxes |
(2,405 | ) | (2,818 | ) | (9,765 | ) | ||||||
|
|
|
|
|
|
|
|||||||
| Total income tax and social contribution expenses |
(4,969 | ) | (7,357 | ) | (13,663 | ) | ||||||
|
|
|
|
|
|
|
|||||||
| (*) | Includes temporary (additions) and exclusions. |
F-90
Table of Contents
ITAÚ UNIBANCO HOLDING S.A.
Notes to the Consolidated Financial Statements
At 12/31/2018, 12/31/2017 and 01/01/2017 for balance sheet accounts and
From 01/01 to 12/31 of 2018, 2017 and 2016 for income statement accounts
(In millions of Reais, except information per share)
| b) | Deferred taxes |
| I - | The deferred tax asset balance and its changes, segregated based on its origin and disbursements, are represented by: |
| 12/31/2017 | Realization / Reversal |
Increase | 12/31/2018 | |||||||||||||
| Reflected in income |
48,810 | (23,511 | ) | 11,953 | 37,252 | |||||||||||
| Provision for expected loss |
24,686 | (9,746 | ) | 3,623 | 18,563 | |||||||||||
| Related to tax losses and social contribution loss carryforwards |
7,595 | (3,649 | ) | 445 | 4,391 | |||||||||||
| Provision for profit sharing |
1,829 | (1,829 | ) | 1,844 | 1,844 | |||||||||||
| Provision for devaluation of securities with permanent impairment |
2,228 | (1,843 | ) | 1,344 | 1,729 | |||||||||||
| Provision |
5,194 | (2,124 | ) | 1,394 | 4,464 | |||||||||||
|
|
|
|
|
|
|
|
|
|||||||||
| Civil lawsuits |
1,974 | (610 | ) | 222 | 1,586 | |||||||||||
| Labor claims |
2,200 | (1,280 | ) | 1,117 | 2,037 | |||||||||||
| Tax and social security |
1,020 | (234 | ) | 55 | 841 | |||||||||||
| Goodwill on purchase of investments |
141 | (163 | ) | 82 | 60 | |||||||||||
| Legal liabilities |
488 | (61 | ) | 249 | 676 | |||||||||||
| Adjustments of operations carried out on the futures settlement market |
277 | (277 | ) | 98 | 98 | |||||||||||
| Adjustment to Fair Value of Financial Assets - At Fair Value Through Profit or Loss |
429 | (429 | ) | 631 | 631 | |||||||||||
| Provision related to health insurance operations |
341 | (5 | ) | 7 | 343 | |||||||||||
| Other |
5,602 | (3,385 | ) | 2,236 | 4,453 | |||||||||||
| Reflected in stockholders’ equity |
2,192 | (785 | ) | 481 | 1,888 | |||||||||||
| Corporate reorganizations (Note 2.4 a IV) |
628 | (628 | ) | — | — | |||||||||||
| Adjustment to Fair Value of Financial Assets - At Fair Value Through Other Comprehensive Income |
327 | (157 | ) | 213 | 383 | |||||||||||
| Cash flow hedge |
983 | — | 166 | 1,149 | ||||||||||||
| Other |
254 | — | 102 | 356 | ||||||||||||
|
|
|
|
|
|
|
|
|
|||||||||
| Total (1)(2) |
51,002 | (24,296 | ) | 12,434 | 39,140 | |||||||||||
|
|
|
|
|
|
|
|
|
|||||||||
| (1) | Deferred income tax and social contribution assets and liabilities are recorded in the balance sheet offset by a taxable entity and total R$ 32,781 and R$ 447, respectively. |
| (2) | The accounting records of deferred tax assets on income tax losses and/or social contribution loss carryforwards, as well as those arising from temporary differences, are based on technical feasibility studies which consider the expected generation of future taxable income, considering the history of profitability for each subsidiary individually, and for the consolidated taken as a whole. |
F-91
Table of Contents
ITAÚ UNIBANCO HOLDING S.A.
Notes to the Consolidated Financial Statements
At 12/31/2018, 12/31/2017 and 01/01/2017 for balance sheet accounts and
From 01/01 to 12/31 of 2018, 2017 and 2016 for income statement accounts
(In millions of Reais, except information per share)
| 12/31/2016 | Realization / Reversal |
Increase | 12/31/2017 | |||||||||||||
| Reflected in income |
49,841 | (16,347 | ) | 15,316 | 48,810 | |||||||||||
| Provision for expected loss |
27,510 | (9,453 | ) | 6,629 | 24,686 | |||||||||||
| Related to tax losses and social contribution loss carryforwards |
6,981 | (197 | ) | 811 | 7,595 | |||||||||||
| Provision for profit sharing |
1,541 | (1,541 | ) | 1,829 | 1,829 | |||||||||||
| Provision for devaluation of securities with permanent impairment |
1,727 | — | 501 | 2,228 | ||||||||||||
| Provision |
5,704 | (2,733 | ) | 2,223 | 5,194 | |||||||||||
|
|
|
|
|
|
|
|
|
|||||||||
| Civil lawsuits |
1,955 | (576 | ) | 595 | 1,974 | |||||||||||
| Labor claims |
2,167 | (1,233 | ) | 1,266 | 2,200 | |||||||||||
| Tax and social security |
1,582 | (924 | ) | 362 | 1,020 | |||||||||||
| Goodwill on purchase of investments |
165 | (758 | ) | 734 | 141 | |||||||||||
| Legal liabilities |
387 | (557 | ) | 658 | 488 | |||||||||||
| Adjustments of operations carried out in futures settlement market |
485 | (239 | ) | 31 | 277 | |||||||||||
| Adjustment to Fair Value of Financial Assets - At Fair Value Through Profit or Loss |
243 | (243 | ) | 429 | 429 | |||||||||||
| Provision related to health insurance operations |
300 | — | 41 | 341 | ||||||||||||
| Other |
4,798 | (626 | ) | 1,430 | 5,602 | |||||||||||
| Reflected in stockholders’ equity |
3,123 | (1,072 | ) | 141 | 2,192 | |||||||||||
| Corporate reorganizations (Note 2.4 a IV) |
1,256 | (628 | ) | — | 628 | |||||||||||
| Adjustment to Fair Value of Financial Assets - At Fair Value Through Other Comprehensive Income |
771 | (444 | ) | — | 327 | |||||||||||
| Cash flow hedge |
843 | — | 140 | 983 | ||||||||||||
| Other |
253 | — | 1 | 254 | ||||||||||||
|
|
|
|
|
|
|
|
|
|||||||||
| Total (*) |
52,964 | (17,419 | ) | 15,457 | 51,002 | |||||||||||
|
|
|
|
|
|
|
|
|
|||||||||
| (*) | Deferred income tax and social contribution assets and liabilities are recorded in the balance sheet offset by a taxable entity and total R$ 35,869 and R$ 391, respectively. |
F-92
Table of Contents
ITAÚ UNIBANCO HOLDING S.A.
Notes to the Consolidated Financial Statements
At 12/31/2018, 12/31/2017 and 01/01/2017 for balance sheet accounts and
From 01/01 to 12/31 of 2018, 2017 and 2016 for income statement accounts
(In millions of Reais, except information per share)
| II - | The provision for deferred tax and contributions and respective changes are as follows: |
| 12/31/2017 | Realization / reversal |
Increase | 12/31/2018 | |||||||||||||
| Reflected in income |
14,569 | (11,385 | ) | 2,960 | 6,144 | |||||||||||
| Depreciation in excess – finance lease |
613 | (267 | ) | — | 346 | |||||||||||
| Adjustment of escrow deposits and provisions |
1,280 | (11 | ) | 79 | 1,348 | |||||||||||
| Post-employment benefits |
304 | (143 | ) | 126 | 287 | |||||||||||
| Adjustments of operations carried out on the futures settlement market |
1,421 | (1,421 | ) | 923 | 923 | |||||||||||
| Adjustment to Fair Value of Financial Assets - At Fair Value Through Profit or Loss |
7,592 | (7,592 | ) | 1,790 | 1,790 | |||||||||||
| Taxation of results abroad – capital gains |
1,973 | (1,314 | ) | — | 659 | |||||||||||
| Other |
1,386 | (637 | ) | 42 | 791 | |||||||||||
| Reflected in stockholders’ equity |
955 | (311 | ) | 18 | 662 | |||||||||||
| Adjustment to Fair Value of Financial Assets - At Fair Value Through Other Comprehensive Income |
767 | (302 | ) | 9 | 474 | |||||||||||
| Cash flow hedge |
166 | — | 2 | 168 | ||||||||||||
| Post-employment benefits |
9 | (9 | ) | 7 | 7 | |||||||||||
| Other |
13 | — | — | 13 | ||||||||||||
|
|
|
|
|
|
|
|
|
|||||||||
| Total (*) |
15,524 | (11,696 | ) | 2,978 | 6,806 | |||||||||||
|
|
|
|
|
|
|
|
|
|||||||||
| (*) | Deferred income tax and social contribution asset and liabilities are recorded in the balance sheet offset by a taxable entity and total R$ 32,781 and R$ 447, respectively. |
| 12/31/2016 | Realization / reversal |
Increase | 12/31/2017 | |||||||||||||
| Reflected in income |
13,507 | (8,716 | ) | 9,778 | 14,569 | |||||||||||
| Depreciation in excess – finance lease |
936 | (323 | ) | — | 613 | |||||||||||
| Adjustment of escrow deposits and provisions |
1,193 | (179 | ) | 266 | 1,280 | |||||||||||
| Post-employment benefits |
233 | — | 71 | 304 | ||||||||||||
| Adjustments of operations carried out on the futures settlement market |
1,095 | — | 326 | 1,421 | ||||||||||||
| Adjustment to Fair Value of Financial Assets - At Fair Value Through Profit or Loss |
7,293 | (7,293 | ) | 7,592 | 7,592 | |||||||||||
| Taxation of results abroad – capital gains |
1,502 | — | 471 | 1,973 | ||||||||||||
| Other |
1,255 | (921 | ) | 1,052 | 1,386 | |||||||||||
| Reflected in stockholders’ equity |
968 | (129 | ) | 116 | 955 | |||||||||||
| Adjustment to Fair Value of Financial Assets - At Fair Value Through Other Comprehensive Income |
836 | (82 | ) | 13 | 767 | |||||||||||
| Cash flow hedge |
63 | — | 103 | 166 | ||||||||||||
| Post-employment benefits |
35 | (26 | ) | — | 9 | |||||||||||
| Other |
34 | (21 | ) | — | 13 | |||||||||||
|
|
|
|
|
|
|
|
|
|||||||||
| Total (*) |
14,475 | (8,845 | ) | 9,894 | 15,524 | |||||||||||
|
|
|
|
|
|
|
|
|
|||||||||
| (*) | Deferred income tax and social contribution asset and liabilities are recorded in the balance sheet offset by a taxable entity and total R$ 35,869 and R$ 391, respectively. |
F-93
Table of Contents
ITAÚ UNIBANCO HOLDING S.A.
Notes to the Consolidated Financial Statements
At 12/31/2018, 12/31/2017 and 01/01/2017 for balance sheet accounts and
From 01/01 to 12/31 of 2018, 2017 and 2016 for income statement accounts
(In millions of Reais, except information per share)
| III - | The estimate of realization and present value of tax credits and from the Provision for Deferred Income Tax and Social Contribution existing at 12/31/2018, are: |
| Year of realization |
Deferred tax assets | Deferred tax liabilities |
% | Net deferred taxes |
% | |||||||||||||||||||||||||||||||||||
| Temporary differences |
% | Tax loss / social contribution loss carryforwards |
% | Total | % | |||||||||||||||||||||||||||||||||||
| 2019 |
10,808 | 31 | % | 1,394 | 32 | % | 12,202 | 31 | % | (1,333 | ) | 20 | % | 10,869 | 33 | % | ||||||||||||||||||||||||
| 2020 |
12,961 | 38 | % | 751 | 17 | % | 13,712 | 35 | % | (1,258 | ) | 18 | % | 12,454 | 39 | % | ||||||||||||||||||||||||
| 2021 |
4,575 | 13 | % | 614 | 14 | % | 5,189 | 13 | % | (432 | ) | 6 | % | 4,757 | 15 | % | ||||||||||||||||||||||||
| 2022 |
813 | 2 | % | 395 | 9 | % | 1,208 | 3 | % | (1,069 | ) | 16 | % | 139 | 0 | % | ||||||||||||||||||||||||
| 2023 |
685 | 2 | % | 157 | 3 | % | 842 | 2 | % | (142 | ) | 2 | % | 700 | 2 | % | ||||||||||||||||||||||||
| After 2023 |
4,907 | 14 | % | 1,080 | 25 | % | 5,987 | 16 | % | (2,572 | ) | 38 | % | 3,415 | 11 | % | ||||||||||||||||||||||||
| Total |
34,749 | 100 | % | 4,391 | 100 | % | 39,140 | 100 | % | (6,806 | ) | 100 | % | 32,334 | 100 | % | ||||||||||||||||||||||||
|
|
|
|
|
|
|
|
|
|
|
|||||||||||||||||||||||||||||||
| Present value (*) |
31,526 | 3,859 | 35,384 | (5,735 | ) | 29,649 | ||||||||||||||||||||||||||||||||||
|
|
|
|
|
|
|
|
|
|
|
|||||||||||||||||||||||||||||||
| (*) | The average funding rate, net of tax effects, was used to determine the present value. |
The projections of future taxable income include estimates related to macroeconomic variables, exchange rates, interest rates, volume of financial operations and services fees and others, which can vary in relation to actual data and amounts.
Net income in the financial statements is not directly related to the taxable income, due to differences between the accounting criteria and tax legislation, in addition to corporate aspects. Accordingly, it is recommended that changes in realization of deferred tax assets presented below is not considered as an indication of future net income.
On December 31, 2018, Social Contribution deferred tax assets are recorded at 15% due to the end of temporary effects brought by Law No. 13,169/15, which increased the social contribution tax rate from 15% to 20% until December 31, 2018. As at 12/31/2018 and 12/31/2017, there are no unrecognized tax credits.
c) Tax liabilities
| 12/31/2018 | 12/31/2017 | |||||||
| Taxes and contributions on income payable |
615 | 1,752 | ||||||
| Other Taxes and Contributions payable |
1,443 | 1,423 | ||||||
| Provision for deferred income tax and social contribution (Note 24b II) |
447 | 391 | ||||||
| Other |
2,779 | 4,270 | ||||||
|
|
|
|
|
|||||
| Total |
5,284 | 7,836 | ||||||
|
|
|
|
|
|||||
F-94
Table of Contents
ITAÚ UNIBANCO HOLDING S.A.
Notes to the Consolidated Financial Statements
At 12/31/2018, 12/31/2017 and 01/01/2017 for balance sheet accounts and
From 01/01 to 12/31 of 2018, 2017 and 2016 for income statement accounts
(In millions of Reais, except information per share)
| Note | 25 – Earnings per share |
| a) | Earning per share basic |
Net income attributable to ITAÚ UNIBANCO HOLDING’s shareholders is divided by the average number of outstanding shares in the period, excluding treasury shares.
| 01/01 to 12/31/2018 |
01/01 to 12/31/2017 |
01/01 to 12/31/2016 |
||||||||||
| Net income attributable to owners of the parent company |
24,907 | 23,193 | 21,627 | |||||||||
| Minimum non-cumulative dividend on preferred shares |
(104 | ) | (105 | ) | (105 | ) | ||||||
| Retained earnings to be distributed to common equity owners in an amount per share equal to the minimum dividend payable to preferred equity owners |
(109 | ) | (110 | ) | (111 | ) | ||||||
| Retained earnings to be distributed, on a pro-rata basis, to common and preferred equity owners |
||||||||||||
| Common |
12,599 | 11,828 | 11,002 | |||||||||
| Preferred |
12,095 | 11,150 | 10,409 | |||||||||
| Total net income available to equity owners: |
||||||||||||
| Common |
12,708 | 11,938 | 11,113 | |||||||||
| Preferred |
12,199 | 11,255 | 10,514 | |||||||||
| Weighted average number of shares outstanding (Note 19a) |
||||||||||||
| Common |
4,958,290,359 | 5,021,834,934 | 5,027,611,714 | |||||||||
| Preferred |
4,759,872,085 | 4,734,030,111 | 4,756,823,490 | |||||||||
| Earnings per share - Basic – R$ |
||||||||||||
| Common |
2.56 | 2.38 | 2.21 | |||||||||
| Preferred |
2.56 | 2.38 | 2.21 | |||||||||
| b) | Earnings per share diluted |
Calculated similarly to the basic earnings per share; however, it includes the conversion of all preferred shares potentially dilutable in the denominator.
| 01/01 to 12/31/2018 |
01/01 to 12/31/2017 |
01/01 to 12/31/2016 |
||||||||||
| Total net income available to preferred equity owners |
12,199 | 11,255 | 10,514 | |||||||||
| Dividend on preferred shares after dilution effects |
72 | 76 | 74 | |||||||||
| Net income available to preferred equity owners considering preferred shares after the dilution effect |
12,271 | 11,331 | 10,588 | |||||||||
| Total net income available to ordinary equity owners |
12,708 | 11,938 | 11,113 | |||||||||
| Dividend on preferred shares after dilution effects |
(72 | ) | (76 | ) | (74 | ) | ||||||
| Net income available to ordinary equity owners considering preferred shares after the dilution effect |
12,636 | 11,862 | 11,039 | |||||||||
| Adjusted weighted average of shares (Note 19a) |
||||||||||||
| Common |
4,958,290,359 | 5,021,834,934 | 5,027,611,714 | |||||||||
| Preferred |
4,815,473,777 | 4,796,645,028 | 4,821,864,280 | |||||||||
| Preferred |
4,759,872,085 | 4,734,030,111 | 4,756,823,490 | |||||||||
| Incremental from stock options granted under our share-based payment |
55,601,692 | 62,614,917 | 65,040,790 | |||||||||
| Earnings per share - diluted – R$ |
||||||||||||
| Common |
2.55 | 2.36 | 2.20 | |||||||||
| Preferred |
2.55 | 2.36 | 2.20 | |||||||||
Potential anti-dilution effects of shares under our share-based payment, excluded from the calculation of diluted earnings per share, totaled 538,312 preferred shares at 12/31/2017 and 13,938,070 preferred shares at 12/31/2016. In 2018 doesn’t have this effect.
F-95
Table of Contents
ITAÚ UNIBANCO HOLDING S.A.
Notes to the Consolidated Financial Statements
At 12/31/2018, 12/31/2017 and 01/01/2017 for balance sheet accounts and
From 01/01 to 12/31 of 2018, 2017 and 2016 for income statement accounts
(In millions of Reais, except information per share)
| Note | 26 – Post-employment benefits |
ITAÚ UNIBANCO HOLDING, through its subsidiaries, sponsors retirement plans to its employees.
Retirement plans are managed by Closed-end Private Pension Entities (EFPC) and are closed to new adhesions. These entities have an independent structure and manage their plans according to the characteristics of their regulations.
There are three types of retirement plans:
| • | Defined Benefit Plans (BD): plans which scheduled benefits have their value established in advance, based on salaries and/or length of service of employees, and its cost is actuarially determined; |
| • | Defined Contribution Plans (CD): are those plans which scheduled benefits have their value permanently adjusted to the investments balance, kept in favor of the participant, including in the benefit concession phase, considering net proceedings of its investment, amounts contributed and benefits paid; and |
| • | Variable Contribution Plans (CV): in this type of plan, scheduled benefits present a combination of characteristics of defined contribution and defined benefit modalities, and the benefit is actuarially determined based on the investment accumulated by the participant on the eligibility date. |
Below is a list of benefit plans and their modalities:
| Entity |
Benefit plan |
Modality | ||
| Fundação Itaú Unibanco - Previdência Complementar | Supplementary retirement plan | Defined Benefit | ||
| Supplementary Retirement Plan – Flexible Premium Annuity | ||||
| Franprev benefit plan – PBF | ||||
| 002 benefit plan – PB002 | ||||
| Prebeg benefit plan | ||||
| UBB PREV defined benefit plan | ||||
| Benefit Plan II | ||||
| Itaulam basic plan | ||||
| Itaú Defined Benefit Plan | ||||
| REDECARD Retirement Plan | ||||
| ITAUCARD Retirement Defined Benefit Plan | ||||
| Itaubanco Defined Contribution Plan | Defined Contribution | |||
| Itaubank Retirement Plan | ||||
| REDECARD Pension Plan | ||||
| Unibanco Pension Plan | Variable Contribution | |||
| Itaulam Supplementary Plan | ||||
| Itaú Defined Contribution Plan | ||||
| REDECARD Retirement Plan | ||||
| ITAUCARD Supplementary Retirement Plan | ||||
| FUNBEP Fundo de Pensão Multipatrocinado | Funbep I Benefit Plan | Defined Benefit Variable Contribution | ||
| Funbep II Benefit Plan |
The modality of Defined Contribution plans have funds composed by the portions of sponsors’ contributions not yet included in the participant’s account balance due to loss of eligibility to the benefit, as well as of resources arising from the migration of retirement plans in defined benefit modality. The fund is used for future contributions to the individual participants’ accounts, according to the rules of the respective benefit plan regulation.
F-96
Table of Contents
ITAÚ UNIBANCO HOLDING S.A.
Notes to the Consolidated Financial Statements
At 12/31/2018, 12/31/2017 and 01/01/2017 for balance sheet accounts and
From 01/01 to 12/31 of 2018, 2017 and 2016 for income statement accounts
(In millions of Reais, except information per share)
| a) | Main Actuarial Assumptions |
Actuarial assumptions of demographic and financial nature should reflect the best estimated about the variables that determine the post-employment benefit amounts.
The main demographic assumptions comprise: mortality table and turnover of active participants and the main financial assumptions include: discount rate, future salary increases, growth of plan benefits and inflation.
| 12/31/2018 | 12/31/2017 | 12/31/2016 | ||||
| Discount rate (1) |
9.72% p.a. | 9.98% p.a. | 10.24% a.a. | |||
| Mortality table (2) |
AT-2000 | AT-2000 | AT-2000 | |||
| Turnover |
Itaú Experience 2008/2010 (3) | Itaú Experience 2008/2010 | Exp.Itaú 2008/2010 | |||
| Future salary growth |
4.00% to 7.12 % p.a. | 5.04% to 7.12 % p.a. | 5.04% to 7.12% p.a. | |||
| Growth of the pension fund benefits |
4.00 % p.a. | 4.00 % p.a. | 4.00% p.a. | |||
| Inflation |
4.00 % p.a. | 4.00 % p.a. | 4.00% p.a. | |||
| Actuarial method |
Projected Unit Credit | Projected Unit Credit | Cred.Unit.Projet. |
| (1) | Determined based on market yield related to National Treasury Notes (NTN-B) and compatible with the economic scenario observed on the balance sheet closing date, considering the volatility of interest market and models used. |
| (2) | Correspond to those disclosed by SOA – Society of Actuaries, that reflect a 10% increase in the probabilities of survival regarding the respective basic tables. |
| (3) | Updated to the new expectation of mass behavior. |
Retired plans sponsored by foreign subsidiaries - Banco Itaú (Suisse) S.A., Itaú CorpBanca Colombia S.A. and PROSERV - Promociones y Servicios S.A. de C.V. - are structured as Defined Benefit modality and adopt actual assumptions adequate to masses of participants and the economic scenario of each country.
| b) | Risk Management |
The EFPCs sponsored by ITAÚ UNIBANCO HOLDING are regulated by the National Council for Complementary Pension (CNPC) and PREVIC, has an Executive Board, Advisory and Tax Councils.
Benefits offered have long-tem characteristics and the main factors involved in the management and measurement of their risks are financial risk, inflation risk and biometric risk.
- Financial Risk – the actuarial liability is calculated by adopting a discount rate different from rates earned in investments. If real income from plan investments is lower than yield expected, this may give rise to a deficit. To mitigate this risk and assure the capacity to pay long-term benefits, the plans have a significant percentage of fixed-income securities pegged to the plan commitments, aiming at minimizing volatility and risk of mismatch between assets and liabilities.
- Inflation risk – a large part of liabilities is pegged to inflation risk, making actuarial liabilities sensitive to increase in rates. To mitigate this risk, the same financial risks mitigation strategies are used.
- Demographic Risk – plans that have any obligation actuarially assessed are exposed to biometric risk. In the event the mortality tables used are not adherent to the mass of plan participants, a deficit or surplus may arise in actuarial evaluation. To mitigate this risk, adherence tests to biometric assumptions are conducted to ensure their adequacy to liabilities of respective plans.
For purposes of registering in the balance sheet the EFPCs that manage them, actuarial liabilities of plans use discount rate adherent to its asset portfolio and income and expense flows, according to a study preparedby an independent consulting company. The actuarial method used is the aggregate method, through which the plan costing Is defined by the difference between its equity coverage and the current value of its future liabilities. Observing the methodology established in the respective actuarial technical note. In the event deficit is verified in the concession period above the settlement limits set forth by the legislation in force, a debt agreement is entered into with the sponsor with financial guarantees.
F-97
Table of Contents
ITAÚ UNIBANCO HOLDING S.A.
Notes to the Consolidated Financial Statements
At 12/31/2018, 12/31/2017 and 01/01/2017 for balance sheet accounts and
From 01/01 to 12/31 of 2018, 2017 and 2016 for income statement accounts
(In millions of Reais, except information per share)
| c) | Asset management |
The purpose of the management of the funds is the long-term balance between pension assets and liabilities with payment of benefits by exceeding actuarial goals (discount rate plus benefit adjustment index, established in the plan regulations).
Below is a table with the allocation of assets by category, segmented into Quoted in an Active Market and Not Quoted in an Active Market:
| Fair value | % Allocation | |||||||||||||||||||||||
| Types |
12/31/2018 | 12/31/2017 | 12/31/2016 | 12/31/2018 | 12/31/2017 | 12/31/2016 | ||||||||||||||||||
| Fixed income securities |
18,065 | 16,851 | 15,134 | 96.05 | % | 95.81 | % | 91.61 | % | |||||||||||||||
| Quoted in an active market |
17,775 | 16,281 | 14,751 | 94.51 | % | 92.57 | % | 89.29 | % | |||||||||||||||
| Non quoted in an active market |
290 | 570 | 383 | 1.54 | % | 3.24 | % | 2.32 | % | |||||||||||||||
| Variable income securities |
24 | 19 | 685 | 0.13 | % | 0.11 | % | 4.15 | % | |||||||||||||||
| Quoted in an active market |
18 | 15 | 681 | 0.09 | % | 0.09 | % | 4.12 | % | |||||||||||||||
| Non quoted in an active market |
6 | 4 | 4 | 0.04 | % | 0.02 | % | 0.03 | % | |||||||||||||||
| Structured investments |
59 | 24 | 9 | 0.31 | % | 0.14 | % | 0.05 | % | |||||||||||||||
| Quoted in an active market |
1 | 1 | 1 | 0.01 | % | 0.01 | % | 0.01 | % | |||||||||||||||
| Non quoted in an active market |
58 | 23 | 8 | 0.30 | % | 0.13 | % | 0.04 | % | |||||||||||||||
| Real estate |
578 | 615 | 623 | 3.07 | % | 3.49 | % | 3.77 | % | |||||||||||||||
| Loans to participants |
82 | 79 | 69 | 0.44 | % | 0.45 | % | 0.42 | % | |||||||||||||||
|
|
|
|
|
|
|
|
|
|
|
|
|
|||||||||||||
| Total |
18,808 | 17,588 | 16,520 | 100.00 | % | 100.00 | % | 100.00 | % | |||||||||||||||
|
|
|
|
|
|
|
|
|
|
|
|
|
|||||||||||||
The defined benefit plan assets include shares of ITAÚ UNIBANCO HOLDING, its main parent company (ITAÚSA) and of subsidiaries of the latter, with a fair value of R$ 11 (R$ 12 at 12/31/2017), and real estate rented to Group companies, with a fair value of R$ 487 (R$ 531 at 12/31/2017).
| d) | Other post-employment benefits |
ITAÚ UNIBANCO HOLDING and its subsidiaries do not have additional liabilities related to post-employment benefits, except in cases arising from maintenance commitments assumed in acquisition agreements occurred over the years, as well as those benefits originated from judicial decision in the terms and conditions established, in which there is total or partial sponsorship of health care plan for a specific mass of former employees and their beneficiaries. Its costing is actuarially determined so as to ensure coverage maintenance. These plans are closed to new adhesions.
Assumptions for discount rate, inflation, mortality table and actuarial method are the same used for retirement plans. In the last 3 years, ITAÚ UNIBANCO HOLDING used the percentage of 8.16% p.a. for medical inflation and the percentage of 3% p.a. for aging factor.
Particularly in other post-employment benefits, there is medical inflation risk associated to increase in medical costs above expectation. To mitigate this risk, the same financial risks mitigation strategies are used.
F-98
Table of Contents
ITAÚ UNIBANCO HOLDING S.A.
Notes to the Consolidated Financial Statements
At 12/31/2018, 12/31/2017 and 01/01/2017 for balance sheet accounts and
From 01/01 to 12/31 of 2018, 2017 and 2016 for income statement accounts
(In millions of Reais, except information per share)
| e) | Net amount recognized in the balance sheet |
Following is the calculation of the net amount recognized in the balance sheet, corresponding to the defined benefit plan:
| 12/31/2018 | ||||||||||||||||
| BD and CV Plans | CD Plans | Other post- employment benefits |
Total | |||||||||||||
| 1 - Net assets of the plans |
18,808 | 1,604 | 0 | 20,412 | ||||||||||||
| 2 - Actuarial liabilities |
(15,493 | ) | 0 | (282 | ) | (15,775 | ) | |||||||||
|
|
|
|
|
|
|
|
|
|||||||||
| 3 - Asset restriction (*) |
(3,664 | ) | (939 | ) | 0 | (4,603 | ) | |||||||||
|
|
|
|
|
|
|
|
|
|||||||||
| 4 - Net amount recognized in the balance sheet (1+2+3) |
(349 | ) | 665 | (282 | ) | 34 | ||||||||||
|
|
|
|
|
|
|
|
|
|||||||||
| Amount recognized in Assets (Note 18a) |
66 | 665 | 0 | 731 | ||||||||||||
| Amount recognized in Liabilities (Note 18b) |
(415 | ) | 0 | (282 | ) | (697 | ) | |||||||||
|
|
|
|
|
|
|
|
|
|||||||||
| 12/31/2017 | ||||||||||||||||
| BD and CV Plans | CD Plans | Other post- employment benefits |
Total | |||||||||||||
| 1 - Net assets of the plans |
17,588 | 1,634 | — | 19,222 | ||||||||||||
| 2 - Actuarial liabilities |
(14,491 | ) | — | (257 | ) | (14,748 | ) | |||||||||
|
|
|
|
|
|
|
|
|
|||||||||
| 3 - Asset restriction (*) |
(3,217 | ) | (912 | ) | — | (4,129 | ) | |||||||||
|
|
|
|
|
|
|
|
|
|||||||||
| 4 - Net amount recognized in the balance sheet (1+2+3) |
(120 | ) | 722 | (257 | ) | 345 | ||||||||||
|
|
|
|
|
|
|
|
|
|||||||||
| Amount recognized in Assets (Note 18a) |
345 | 722 | — | 1,067 | ||||||||||||
| Amount recognized in Liabilities (Note 18b) |
(465 | ) | — | (257 | ) | (722 | ) | |||||||||
|
|
|
|
|
|
|
|
|
|||||||||
| 12/31/2016 | ||||||||||||||||
| BD and CV Plans | CD Plans | Other post- employment benefits |
Total | |||||||||||||
| 1 - Net assets of the plans |
16,520 | 1,287 | — | 17,807 | ||||||||||||
| 2 - Actuarial liabilities |
(13,723 | ) | — | (221 | ) | (13,944 | ) | |||||||||
|
|
|
|
|
|
|
|
|
|||||||||
| 3 - Asset restriction (*) |
(3,008 | ) | (491 | ) | — | (3,499 | ) | |||||||||
|
|
|
|
|
|
|
|
|
|||||||||
| 4 - Net amount recognized in the balance sheet (1+2+3) |
(211 | ) | 796 | (221 | ) | 364 | ||||||||||
|
|
|
|
|
|
|
|
|
|||||||||
| Amount recognized in Assets (Note 18a) |
317 | 796 | — | 1,113 | ||||||||||||
| Amount recognized in Liabilities (Note 18b) |
(528 | ) | — | (221 | ) | (749 | ) | |||||||||
|
|
|
|
|
|
|
|
|
|||||||||
| (*) | Corresponds to the excess of the present value of the available economic benefit, in conformity with paragraph 58 of IAS 19. |
F-99
Table of Contents
ITAÚ UNIBANCO HOLDING S.A.
Notes to the Consolidated Financial Statements
At 12/31/2018, 12/31/2017 and 01/01/2017 for balance sheet accounts and
From 01/01 to 12/31 of 2018, 2017 and 2016 for income statement accounts
(In millions of Reais, except information per share)
| f) | Change in the net amount recognized in the balance sheet |
| 12/31/2018 | ||||||||||||||||||||||||||||||||||||
| BD and CV plans | CD plans | Ohter post- employment benefit |
Total | |||||||||||||||||||||||||||||||||
| Net assets |
Actuarial liabilities |
Asset ceiling |
Recognized amount |
Pension plan fund |
Asset ceiling |
Recognized amount |
Liabilities | Recognized amount |
||||||||||||||||||||||||||||
| Amounts at the beginning of the period |
17,588 | (14,491 | ) | (3,217 | ) | (120 | ) | 1,634 | (912 | ) | 722 | (257 | ) | 345 | ||||||||||||||||||||||
| Amounts recognized in income (loss) (1+2+3) |
1,700 | (1,454 | ) | (321 | ) | (75 | ) | 157 | (90 | ) | 67 | (25 | ) | (33 | ) | |||||||||||||||||||||
| 1 - Cost of current service |
0 | (69 | ) | 0 | (69 | ) | 0 | 0 | 0 | 0 | (69 | ) | ||||||||||||||||||||||||
| 2 - Cost of past service |
0 | 0 | 0 | 0 | 0 | 0 | 0 | 0 | 0 | |||||||||||||||||||||||||||
| 3 - Net interest (1) |
1,700 | (1,385 | ) | (321 | ) | (6 | ) | 157 | (90 | ) | 67 | (25 | ) | 36 | ||||||||||||||||||||||
| Amounts recognized in stockholders’ equity (4+5+6) |
580 | (688 | ) | (126 | ) | (234 | ) | (102 | ) | 63 | (39 | ) | (19 | ) | (292 | ) | ||||||||||||||||||||
| 4 - Effects on asset ceiling |
0 | 0 | (126 | ) | (126 | ) | 0 | 63 | 63 | 0 | (63 | ) | ||||||||||||||||||||||||
| 5 - Remeasurements (2) (3) |
566 | (683 | ) | 0 | (117 | ) | (102 | ) | 0 | (102 | ) | (19 | ) | (238 | ) | |||||||||||||||||||||
| 6 - Exchange variation |
14 | (5 | ) | 0 | 9 | 0 | 0 | 0 | 0 | 9 | ||||||||||||||||||||||||||
| Other (7+8+9+10) |
(1,060 | ) | 1,140 | 0 | 80 | (85 | ) | 0 | (85 | ) | 19 | 14 | ||||||||||||||||||||||||
| 7 - Receipt by allocation of funds (4) |
0 | 0 | 0 | 0 | 0 | 0 | 0 | 0 | 0 | |||||||||||||||||||||||||||
| 8 - Benefits paid |
(1,140 | ) | 1,140 | 0 | 0 | 0 | 0 | 0 | 19 | 19 | ||||||||||||||||||||||||||
| 9 - Contributions from sponsor |
69 | 0 | 0 | 69 | (85 | ) | 0 | (85 | ) | 0 | (16 | ) | ||||||||||||||||||||||||
| 10 - Contributions from parcipants |
11 | 0 | 0 | 11 | 0 | 0 | 0 | 0 | 11 | |||||||||||||||||||||||||||
|
|
|
|
|
|
|
|
|
|
|
|
|
|
|
|
|
|
|
|||||||||||||||||||
| Amounts end of the period |
18,808 | (15,493 | ) | (3,664 | ) | (349 | ) | 1,604 | (939 | ) | 665 | (282 | ) | 34 | ||||||||||||||||||||||
|
|
|
|
|
|
|
|
|
|
|
|
|
|
|
|
|
|
|
|||||||||||||||||||
| 12/31/2017 | ||||||||||||||||||||||||||||||||||||
| BD and CV plans | CD plans | Ohter post- employment benefit |
Total | |||||||||||||||||||||||||||||||||
| Net assets |
Actuarial liabilities |
Asset ceiling |
Recognized amount |
Pension plan fund |
Asset ceiling |
Recognized amount |
Liabilities | Recognized amount |
||||||||||||||||||||||||||||
| Amounts at the beginning of the period |
16,520 | (13,723 | ) | (3,008 | ) | (211 | ) | 1,287 | (491 | ) | 796 | (221 | ) | 364 | ||||||||||||||||||||||
| Amounts recognized in income (loss) (1+2+3) |
1,639 | (1,416 | ) | (307 | ) | (84 | ) | 126 | (50 | ) | 76 | (22 | ) | (30 | ) | |||||||||||||||||||||
| 1 - Cost of current service |
— | (69 | ) | — | (69 | ) | — | — | — | — | (69 | ) | ||||||||||||||||||||||||
| 2 - Cost of past service |
— | — | — | — | — | — | — | — | — | |||||||||||||||||||||||||||
| 3 - Net interest (1) |
1,639 | (1,347 | ) | (307 | ) | (15 | ) | 126 | (50 | ) | 76 | (22 | ) | 39 | ||||||||||||||||||||||
| Amounts recognized in stockholders’ equity (4+5+6) |
487 | (493 | ) | 98 | 92 | 324 | (371 | ) | (47 | ) | (28 | ) | 17 | |||||||||||||||||||||||
| 4 - Effects on asset ceiling |
— | — | 97 | 97 | (15 | ) | (371 | ) | (386 | ) | — | (289 | ) | |||||||||||||||||||||||
| 5 - Remeasurements (2) (3) |
485 | (487 | ) | 1 | (1 | ) | 339 | — | 339 | (28 | ) | 310 | ||||||||||||||||||||||||
| 6 - Exchange variation |
2 | (6 | ) | — | (4 | ) | — | — | — | — | (4 | ) | ||||||||||||||||||||||||
| Other (7+8+9+10) |
(1,058 | ) | 1,141 | — | 83 | (103 | ) | — | (103 | ) | 14 | (6 | ) | |||||||||||||||||||||||
| 7 - Receipt by allocation of funds (4) |
— | — | — | — | (12 | ) | — | (12 | ) | — | (12 | ) | ||||||||||||||||||||||||
| 8 - Benefits paid |
(1,141 | ) | 1,141 | — | — | — | — | — | 14 | 14 | ||||||||||||||||||||||||||
| 9 - Contributions from sponsor |
71 | — | — | 71 | (91 | ) | — | (91 | ) | — | (20 | ) | ||||||||||||||||||||||||
| 10 - Contributions from parcipants |
12 | — | — | 12 | — | — | — | — | 12 | |||||||||||||||||||||||||||
|
|
|
|
|
|
|
|
|
|
|
|
|
|
|
|
|
|
|
|||||||||||||||||||
| Amounts end of the period |
17,588 | (14,491 | ) | (3,217 | ) | (120 | ) | 1,634 | (912 | ) | 722 | (257 | ) | 345 | ||||||||||||||||||||||
|
|
|
|
|
|
|
|
|
|
|
|
|
|
|
|
|
|
|
|||||||||||||||||||
F-100
Table of Contents
ITAÚ UNIBANCO HOLDING S.A.
Notes to the Consolidated Financial Statements
At 12/31/2018, 12/31/2017 and 01/01/2017 for balance sheet accounts and
From 01/01 to 12/31 of 2018, 2017 and 2016 for income statement accounts
(In millions of Reais, except information per share)
| 12/31/2016 | ||||||||||||||||||||||||||||||||||||
| BD and CV plans | CD plans | Ohter post- employment benefit |
Total | |||||||||||||||||||||||||||||||||
| Net assets |
Actuarial liabilities |
Asset ceiling |
Recognized amount |
Pension plan fund |
Asset ceiling |
Recognized amount |
Liabilities | Recognized amount |
||||||||||||||||||||||||||||
| Amounts at the beginning of the period |
13,633 | (11,587 | ) | (2,134 | ) | (88 | ) | 2,229 | (270 | ) | 1,959 | (179 | ) | 1,692 | ||||||||||||||||||||||
| Amounts recognized in income (loss) (1+2+3) |
1,483 | (1,317 | ) | (241 | ) | (75 | ) | 269 | (30 | ) | 239 | (19 | ) | 145 | ||||||||||||||||||||||
| 1 - Cost of current service |
— | (62 | ) | — | (62 | ) | — | — | — | — | (62 | ) | ||||||||||||||||||||||||
| 2 - Cost of past service |
— | — | — | — | — | — | — | — | — | |||||||||||||||||||||||||||
| 3 - Net interest (1) |
1,483 | (1,255 | ) | (241 | ) | (13 | ) | 269 | (30 | ) | 239 | (19 | ) | 207 | ||||||||||||||||||||||
| Amounts recognized in stockholders’ equity (4+5+6) |
2,300 | (1,672 | ) | (633 | ) | (5 | ) | (817 | ) | (191 | ) | (1,008 | ) | (36 | ) | (1,049 | ) | |||||||||||||||||||
| 4 - Effects on asset ceiling |
— | — | (633 | ) | (633 | ) | (1,053 | ) | (191 | ) | (1,244 | ) | — | (1,877 | ) | |||||||||||||||||||||
| 5 - Remeasurements (2) (3) |
2,308 | (1,715 | ) | — | 593 | 236 | — | 236 | (36 | ) | 793 | |||||||||||||||||||||||||
| 6 - Exchange variation |
(8 | ) | 43 | — | 35 | — | — | — | — | 35 | ||||||||||||||||||||||||||
| Other (7+8+9+10) |
(896 | ) | 853 | — | (43 | ) | (394 | ) | — | (394 | ) | 13 | (424 | ) | ||||||||||||||||||||||
| 7 - Receipt by allocation of funds (4) |
— | — | — | — | (515 | ) | — | (515 | ) | — | (515 | ) | ||||||||||||||||||||||||
| 8 - Benefits paid |
(1,060 | ) | 1,060 | — | — | — | — | — | 13 | 13 | ||||||||||||||||||||||||||
| 9 - Contributions from sponsor |
149 | — | — | 149 | 121 | — | 121 | — | 270 | |||||||||||||||||||||||||||
| 10 - Contributions from parcipants |
15 | — | — | 15 | — | — | — | — | 15 | |||||||||||||||||||||||||||
| 11 - Balance arising from the CorpBanca acquisition (Note 3) |
— | (207 | ) | — | (207 | ) | — | — | — | — | (207 | ) | ||||||||||||||||||||||||
|
|
|
|
|
|
|
|
|
|
|
|
|
|
|
|
|
|
|
|||||||||||||||||||
| Amounts end of the period |
16,520 | (13,723 | ) | (3,008 | ) | (211 | ) | 1,287 | (491 | ) | 796 | (221 | ) | 364 | ||||||||||||||||||||||
|
|
|
|
|
|
|
|
|
|
|
|
|
|
|
|
|
|
|
|||||||||||||||||||
| (1) | Corresponds to the amount calculated at 01/01/2018 based on the beginning amount (Net Assets, Actuarial Liabilities and Restriction of Assets), taking into account the estimated amount of payments/ receipts of benefits/ contributions, multiplied by the discount rate of 9.98% p.a.(at 01/01/2017 the rate used was 10.24% p.a.); |
| (2) | Remeasurements recorded in net assets and asset ceiling correspond to the income earned above/below the expected return rate; |
| (3) | The actual return on assets amounted to R$ 2,266 (R$ 2,124 at 12/31/2017). |
| (4) | Refers to distribution of excess pension fund from Itaubanco CD Plan. |
F-101
Table of Contents
ITAÚ UNIBANCO HOLDING S.A.
Notes to the Consolidated Financial Statements
At 12/31/2018, 12/31/2017 and 01/01/2017 for balance sheet accounts and
From 01/01 to 12/31 of 2018, 2017 and 2016 for income statement accounts
(In millions of Reais, except information per share)
| g) | Defined benefit contribution |
| Estimated contribution |
Contributions made | |||||||||||||||
| 2019 | 01/01 to 12/31/2018 |
01/01 to 12/31/2017 |
01/01 to 12/31/2016 |
|||||||||||||
| Pension plan - FIU |
47 | 58 | 58 | 78 | ||||||||||||
| Pension plan - FUNBEP |
10 | 11 | 14 | 71 | ||||||||||||
|
|
|
|
|
|
|
|
|
|||||||||
| Total |
57 | 69 | 72 | 149 | ||||||||||||
|
|
|
|
|
|
|
|
|
|||||||||
| h) | Maturity profile of defined benefit liabilities |
| Duration (*) | 2019 | 2020 | 2021 | 2022 | 2023 | 2024 to 2028 |
||||||||||||||||||||||
| Pension plan - FIU |
10.88 | 799 | 824 | 859 | 894 | 929 | 5,184 | |||||||||||||||||||||
| Pension plan - FUNBEP |
10.09 | 370 | 387 | 404 | 420 | 435 | 2,362 | |||||||||||||||||||||
| Other post-employment benefits |
12.02 | 17 | 18 | 19 | 20 | 21 | 127 | |||||||||||||||||||||
|
|
|
|
|
|
|
|
|
|
|
|
|
|||||||||||||||||
| Total |
1,186 | 1,229 | 1,282 | 1,334 | 1,385 | 7,673 | ||||||||||||||||||||||
|
|
|
|
|
|
|
|
|
|
|
|
|
|||||||||||||||||
| (*) | Average duration of plan´s actuarial liabilities. |
| i) | Sensitivity analysis |
To measure the effects of changes in the key assumptions, sensitivity tests were conducted in actuarial liabilities. The sensitivity analysis considers a vision of the impacts caused by changes in assumptions, which could affect the income for the period and stockholders’ equity at the balance sheet date. This type of analysis is usually carried out under the ceteris paribus condition, in which the sensitivity of a system is measured when only one variable of interest is changed and all the others remain unchanged. The results obtained are shown in the table below:
| BD and CV pension plans | Other post-employment benefits | |||||||||||||||||||||||
| Main assumptions |
Present value of liability |
Income | Stockholders’ equity (*) |
Present value of liability |
Income | Stockholders’ equity (*) |
||||||||||||||||||
| Interest rate |
||||||||||||||||||||||||
| Increase by 0,5% |
(718 | ) | — | 76 | (15 | ) | — | (15 | ) | |||||||||||||||
| Decrease by 0,5% |
782 | — | (250 | ) | 17 | — | 17 | |||||||||||||||||
| Mortality rate |
||||||||||||||||||||||||
| Increase by 5% |
(160 | ) | — | 45 | (6 | ) | — | (6 | ) | |||||||||||||||
| Decrease by 5% |
167 | — | (48 | ) | 7 | — | 7 | |||||||||||||||||
| Medical inflation |
||||||||||||||||||||||||
| Increase by 1% |
— | — | — | 33 | — | 33 | ||||||||||||||||||
| Decrease by 1% |
— | — | — | (28 | ) | — | (28 | ) | ||||||||||||||||
| (*) | Net of effects of asset ceiling |
F-102
Table of Contents
ITAÚ UNIBANCO HOLDING S.A.
Notes to the Consolidated Financial Statements
At 12/31/2018, 12/31/2017 and 01/01/2017 for balance sheet accounts and
From 01/01 to 12/31 of 2018, 2017 and 2016 for income statement accounts
(In millions of Reais, except information per share)
| Note | 27 – Insurance contracts and private pension |
ITAÚ UNIBANCO HOLDING, through its subsidiaries, offers to the market insurance and private pension products, with the purpose of assuming risks and restoring the economic balance of insured’s equity affected. Products are offered through insurance brokers (third parties operating in the market and their own), Itaú Unibanco’s electronic channels and branches, in compliance with regulatory requirements, issued by the National Council of Private Insurance – CNSP and by the Superintendence of Private Insurance - SUSEP.
| I – | Insurance |
Contract entered between the parties to protect the client’s goods, that, upon payment of a premium, is protected by means of replacement or pre-established financial compensation, against damages that may cause property or personal destabilization. ITAÚ UNIBANCO HOLDING insurance companies then recognize technical reserves, through specialized areas within the conglomerate, with the objective of indemnifying the policyholder’s loss in the event of claims of insured risks.
The insurance risks sold by insurance companies of ITAÚ UNIBANCO HOLDING are divided into property and casualty, that covers losses, damages or liabilities for assets or persons, and life insurance that includes coverage for death and personal accidents.
| II – | Private pension |
Developed to ensure the maintenance of the quality of life of participants, as a supplement to the government plans, through long term investments, private pension products are divided into three major groups:
| • | PGBL - Plan Generator of Benefits: The main objective of this plan is the accumulation of financial resources, but it can be purchased with additional risk coverage. Recommended for clients that file the full version of income tax return, because they can deduct contributions paid for tax purposes up to 12% of the annual taxable gross income. |
| • | VGBL - Redeemable Life Insurance: This is an insurance structured as a pension plan. Its taxation differs from the PGBL; in this case, the tax basis is the earned income. |
| • | FGB - Fund Generator of Benefits: This is a pension plan with minimum income guarantee, and possibility of receiving earnings from asset performance. Although there are plans still in existence, they are no longer sold. |
| III – | Technical reserves for insurance and private pension |
The technical provisions of insurance and private pension are recognized according to the technical notes approved by SUSEP and criteria established by current legislation, as follows:
| • | Provision for unearned premiums (PPNG) - this provision is recognized, based on insurance premiums, for the coverage of amounts payable related to claims and expenses to be incurred. In the calculation, term to maturity of risks assumed and issued and risks in effect but not issued (PPNG-RVNE) in the policies or endorsements of contracts in force are considered , on a pro rata-die basis; |
| • | Provision for unsettled claims (PSL) - this provision is recognized for the coverage of expected amounts related reported and unpaid claims, including administrative and judicial claims. It includes amounts related to indemnities, reserve funds and income past-due, all gross of reinsurance operations and net of coinsurance operations. When required, it should contemplate IBNER (claims incurred but not sufficiently reported) adjustments for the aggregate development of claims reported but not paid, which mounts may be changed throughout the process up to final settlement; |
F-103
Table of Contents
ITAÚ UNIBANCO HOLDING S.A.
Notes to the Consolidated Financial Statements
At 12/31/2018, 12/31/2017 and 01/01/2017 for balance sheet accounts and
From 01/01 to 12/31 of 2018, 2017 and 2016 for income statement accounts
(In millions of Reais, except information per share)
| • | Provision for claims incurred and not reported (IBNR) - this provision is recognized for the coverage of expected unsettled amounts related to claims incurred but not reported up to the calculation base date, including administrative and judicial claims. It includes amounts related to indemnities, reserve funds and income, all gross of reinsurance operations and net of coinsurance operations; |
| • | Mathematical provisions for benefits to be granted (PMBAC) - recognized for the coverage of commitments assumed to participants or policyholders, based on the assumptions set forth in the contract, while the event that gave rise to the benefit and/or indemnity has not occurred; |
| • | Mathematical provisions for granted benefits (PMBC) - recognized for the coverage of commitments to payment of indemnities and/or benefits assumed with participants or insured parties, based on the assumptions established in the agreement, after the event has occurred. |
| • | Provision for financial surplus (PEF) - it is recognized to ensure the amounts intended for distribution of financial surplus, if the event is stated in the agreement. Corresponds to the financial income exceeding the minimum return guaranteed in the product; |
| • | Supplemental Coverage Reserve (PCC) - recognized when technical reserves are found to be insufficient, as shown by the Liability Adequacy Test, which follows specific provisions in the prevailing regulation; |
| • | Provision for redemptions and other amounts to be regularize (PVR) - this provision is recognized for the coverage of amounts related to redemptions to regularize, returns on premiums or funds, transfers requested but, for any reason, not yet transferred to the insurance company or open private pension entity beneficiary, and where premiums have been received but not quoted; |
| • | Provision for related expenses (PDR) - recognized for the coverage of expected amounts related to expenses on benefits and indemnities, due to events which have occurred and will occur. |
| IV - | Main information related to Insurance and Private Pension operations |
| a) | Indexes |
| Sales ratio | Loss ratio | |||||||||||||||
| % | % | |||||||||||||||
| Main Insurance Lines |
01/01 to 12/31/2018 |
01/01 to 12/31/2017 |
01/01 to 12/31/2018 |
01/01 to 12/31/2017 |
||||||||||||
| Group accident insurance |
34.3 | 38.0 | 9.4 | 7.8 | ||||||||||||
| Individual accident |
14.1 | 12.5 | 20.8 | 23.5 | ||||||||||||
| Commercial multiple peril |
21.1 | 21.2 | 29.3 | 36.4 | ||||||||||||
| Internal credit |
0.7 | 0.9 | 134.5 | 139.6 | ||||||||||||
| Mandatory insurance for personal injury caused by motor vehicles (DPVAT) |
0 | 1.2 | 0 | 84.5 | ||||||||||||
| Serious or terminal diseases |
16.1 | 10.7 | 17.5 | 21.1 | ||||||||||||
| Extended warranty - assets |
62.0 | 62.1 | 13.9 | 16.0 | ||||||||||||
| Credit Life |
20.4 | 18.7 | 18.3 | 16.9 | ||||||||||||
| Income from Uncertain Events |
20.3 | 16.3 | 17.1 | 18.4 | ||||||||||||
| Multiple risks |
48.1 | 57.8 | 53.3 | 27.2 | ||||||||||||
| Home insurance in market policies – Credit Life |
20.4 | 20.7 | 15.3 | 13.0 | ||||||||||||
| Group life |
15.1 | 8.3 | 33.2 | 24.2 | ||||||||||||
F-104
Table of Contents
ITAÚ UNIBANCO HOLDING S.A.
Notes to the Consolidated Financial Statements
At 12/31/2018, 12/31/2017 and 01/01/2017 for balance sheet accounts and
From 01/01 to 12/31 of 2018, 2017 and 2016 for income statement accounts
(In millions of Reais, except information per share)
b) Income related to insurance and private pension
| Main lines |
Premiums and contributions | |||||||||||
| 01/01 to 12/31/2018 |
01/01 to 12/31/2017 |
01/01 to 12/31/2016 |
||||||||||
| Group accident insurance |
689 | 666 | 776 | |||||||||
| Individual accident |
280 | 289 | 212 | |||||||||
| Commercial multiple peril |
52 | 53 | 56 | |||||||||
| Internal Credit |
78 | 64 | 63 | |||||||||
| Mandatory insurance for personal injury caused by motor vehicles (DPVAT) |
0 | 24 | 37 | |||||||||
| Serious or terminal diseases |
188 | 172 | 166 | |||||||||
| Warranty extension - Assets |
0 | — | 112 | |||||||||
| Disability Savings Pension |
291 | 319 | 295 | |||||||||
| PGBL |
2,193 | 2,084 | 1,955 | |||||||||
| Credit Life |
879 | 621 | 570 | |||||||||
| Income from Uncertain Events |
235 | 177 | 146 | |||||||||
| Multiple risks |
209 | 151 | 162 | |||||||||
| Home Insurance in Market Policies – Credit Life |
288 | 272 | 243 | |||||||||
| Traditional |
122 | 129 | 142 | |||||||||
| VGBL |
17,154 | 20,318 | 18,153 | |||||||||
| Group life |
937 | 990 | 1,234 | |||||||||
| Other lines |
502 | 547 | 433 | |||||||||
| Total |
24,097 | 26,876 | 24,755 | |||||||||
|
|
|
|
|
|
|
|||||||
c) Technical provisions balances
| Insurance | Private Pension | Total | ||||||||||||||||||||||
| 12/31/2018 | 12/31/2017 | 12/31/2018 | 12/31/2017 | 12/31/2018 | 12/31/2017 | |||||||||||||||||||
| Unearned premiums (PPNG) |
2,111 | 1,883 | 13 | 15 | 2,124 | 1,898 | ||||||||||||||||||
| Mathematical reserve for benefits to be granted (PMBAC) and benefits granted (PMBC) |
195 | 173 | 195,348 | 175,992 | 195,543 | 176,165 | ||||||||||||||||||
| Redemptions and Other Unsettled Amounts (PVR) |
12 | 11 | 298 | 264 | 310 | 275 | ||||||||||||||||||
| Financial surplus (PEF) |
2 | 2 | 605 | 604 | 607 | 606 | ||||||||||||||||||
| Unsettled claims (PSL) |
548 | 560 | 43 | 34 | 591 | 594 | ||||||||||||||||||
| Claims / events incurred but not reported (IBNR) |
348 | 401 | 25 | 27 | 373 | 428 | ||||||||||||||||||
| Related Expenses (PDR) |
31 | 28 | 98 | 95 | 129 | 123 | ||||||||||||||||||
| Other |
562 | 406 | 948 | 737 | 1,510 | 1,143 | ||||||||||||||||||
| Total |
3,809 | 3,464 | 197,378 | 177,768 | 201,187 | 181,232 | ||||||||||||||||||
|
|
|
|
|
|
|
|
|
|
|
|
|
|||||||||||||
F-105
Table of Contents
ITAÚ UNIBANCO HOLDING S.A.
Notes to the Consolidated Financial Statements
At 12/31/2018, 12/31/2017 and 01/01/2017 for balance sheet accounts and
From 01/01 to 12/31 of 2018, 2017 and 2016 for income statement accounts
(In millions of Reais, except information per share)
d) Change in technical provisions
| 12/31/2018 | 12/31/2017 | |||||||||||||||||||||||
| Insurance | Private pension |
Total | Insurance | Private pension |
Total | |||||||||||||||||||
| Opening balance |
3,464 | 177,768 | 181,232 | 3,926 | 150,150 | 154,076 | ||||||||||||||||||
| (+) Additions arising from premiums / contribution |
4,340 | 19,764 | 24,104 | 4,059 | 22,854 | 26,913 | ||||||||||||||||||
| (-) Risk adjustments |
(3,937 | ) | (297 | ) | (4,234 | ) | (4,225 | ) | (323 | ) | (4,548 | ) | ||||||||||||
| (-) Payment of claims / benefits |
(1,184 | ) | (580 | ) | (1,764 | ) | (1,228 | ) | (472 | ) | (1,700 | ) | ||||||||||||
| (+) Reported claims |
1,325 | 0 | 1,325 | 1,291 | — | 1,291 | ||||||||||||||||||
| (-) Redemptions |
(1 | ) | (13,771 | ) | (13,772 | ) | (2 | ) | (12,534 | ) | (12,536 | ) | ||||||||||||
| (+/-) Portability of insurances |
0 | 3,758 | 3,758 | — | 3,436 | 3,436 | ||||||||||||||||||
| (+) Adjustment of reserves and financial surplus |
9 | 11,622 | 11,631 | 16 | 7,754 | 7,770 | ||||||||||||||||||
| (+) Corporate Reorganization |
0 | 0 | 0 | (282 | ) | — | (282 | ) | ||||||||||||||||
| (+/-) Other (recognition / reversal) |
(207 | ) | (886 | ) | (1,093 | ) | (91 | ) | 6,903 | 6,812 | ||||||||||||||
| Closing balance |
3,809 | 197,378 | 201,187 | 3,464 | 177,768 | 181,232 | ||||||||||||||||||
Through actuarial models based mainly on the portfolio historical experience and on macroeconomic projections, ITAÚ UNIBANCO HOLDING establishes the assumptions that influence the assessment of technical provisions. The assumptions are reassessed annually by experts of the actuarial and risk area, and are subsequently submitted to the executive’s approval. The effects on assumptions are recognized in income for the period in which they occurred.
V - Deferred acquisition costs
They are recorded in assets and charges are shown in the table below:
| 12/31/2018 | 12/31/2017 | |||||||
| Opening Balance |
253 | 429 | ||||||
|
|
|
|
|
|||||
| Increase |
1,001 | 772 | ||||||
| Amortization |
(845 | ) | (948 | ) | ||||
|
|
|
|
|
|||||
| Closening Balance |
409 | 253 | ||||||
|
|
|
|
|
|||||
| Balance to be amortized in up to 12 months |
334 | 209 | ||||||
| Balance to be amortized after 12 months |
75 | 44 | ||||||
VI - Table of Claims Development
The amounts shown in the tables express the position at 12/31/2018, since the actuarial calculations are made semi-annually:
| Provision for unsettled claims (PSL) (*) |
591 | |||
| (-) IBNER |
170 | |||
| (-) Reinsurance |
35 | |||
| (-) Retrocession and other estimates |
(25 | ) | ||
| Liability claims presented in the development table (a + b) |
411 |
| (*) | It stated in Note 27lV c at 12/31/2018. |
Changes in the amount of obligations of the ITAÚ UNIBANCO HOLDING may occur at the end of each annual reporting period. The table below shows the development by the claims incurred method. The first part of the table shows how the final loss estimate changes through time. The second part of the table reconciles the amounts pending payment and the liability disclosed in the balance sheet.
F-106
Table of Contents
ITAÚ UNIBANCO HOLDING S.A.
Notes to the Consolidated Financial Statements
At 12/31/2018, 12/31/2017 and 01/01/2017 for balance sheet accounts and
From 01/01 to 12/31 of 2018, 2017 and 2016 for income statement accounts
(In millions of Reais, except information per share)
a) Administratives claims
| Occurrence date |
12/31/2014 | 12/31/2015 | 12/31/2016 | 12/31/2017 | 12/31/2018 | Total | ||||||||||||||||||
| At the end of reporting period |
910 | 1,009 | 938 | 934 | 992 | |||||||||||||||||||
| After 1 year |
935 | 1,054 | 981 | 977 | 0 | |||||||||||||||||||
| After 2 years |
958 | 1,082 | 1,001 | 0 | ||||||||||||||||||||
| After 3 years |
964 | 1,091 | 0 | |||||||||||||||||||||
| After 4 years |
967 | 0 | ||||||||||||||||||||||
| Current estimate |
967 | 1,091 | 1,001 | 977 | 992 | |||||||||||||||||||
| Accumulated payments through base date |
962 | 1,078 | 978 | 956 | 815 | 4,789 | ||||||||||||||||||
| Liabilities recognized in the balance sheet |
5 | 13 | 23 | 21 | 178 | 240 | ||||||||||||||||||
| Liabilities in relation to prior periods |
0 | 12 | ||||||||||||||||||||||
| Total administratives claims |
0 | 252 | ||||||||||||||||||||||
b) Judicial claims
| Occurrence date |
12/31/2014 | 12/31/2015 | 12/31/2016 | 12/31/2017 | 12/31/2018 | Total | ||||||||||||||||||
| At the end of reporting period |
27 | 30 | 26 | 28 | 16 | |||||||||||||||||||
| After 1 year |
37 | 41 | 35 | 40 | 0 | |||||||||||||||||||
| After 2 years |
46 | 52 | 43 | 0 | ||||||||||||||||||||
| After 3 years |
54 | 64 | 0 | |||||||||||||||||||||
| After 4 years |
60 | 0 | ||||||||||||||||||||||
| Current estimate |
60 | 64 | 43 | 40 | 16 | |||||||||||||||||||
| Accumulated payments through base date |
45 | 49 | 34 | 30 | 10 | 168 | ||||||||||||||||||
| Liabilities recognized in the balance sheet |
15 | 15 | 10 | 10 | 5 | 55 | ||||||||||||||||||
| Liabilities in relation to prior periods |
0 | 104 | ||||||||||||||||||||||
| Total judicial claims |
0 | 159 | ||||||||||||||||||||||
The breakdown of the table development of claims between administrative and legal evidences the reallocation of claims up to a certain base date and that become legal ones afterwards, which may give the wrong impression of need for adjusting the provisions in each breakdown.
VII – Liability Adequacy Test
The ITAÚ UNIBANCO HOLDING carry out the Liability Adequacy Test, comparing the amount recognized for its technical reserves with the current estimate of cash flow of its future obligations. The estimate should consider all cash flows related to the business, which is the minimum requirement for carrying out the adequacy test.
The Liability Adequacy Test did not indicate significant insufficiency in the periods ended of 2018, 2017 and 2016.
The assumptions used in the test are periodically reviewed and are based on the best practices and the analysis of subsidiaries’ experience, therefore representing the best estimates for cash flow projections.
Methodology and test grouping
Specifically for insurance products, cash flows were projected using the method known as run-off triangle of quarterly frequency. For social security products, cash flows for the deferral and assignment phases are tested on a separate basis.
The risk grouping criterion considers groups subject to similar risks that are jointly managed as a single portfolio.
F-107
Table of Contents
ITAÚ UNIBANCO HOLDING S.A.
Notes to the Consolidated Financial Statements
At 12/31/2018, 12/31/2017 and 01/01/2017 for balance sheet accounts and
From 01/01 to 12/31 of 2018, 2017 and 2016 for income statement accounts
(In millions of Reais, except information per share)
Biometric tables
Biometric tables are instruments to measure the biometric risk represented by the probability of death, survival or disability of a participant.
For death and survival estimates, the Brazilian Market Insurer Experience (BR-EMS) tables in effect are used, adjusted according to life expectancy development of Scale G, and the Álvaro Vindas table is adopted to estimate benefit requests for disability.
Risk-free interest rate
The relevant risk-free forward interest-rate structure is an indicator of the pure time value of money used to price the set of projected cash flows.
The relevant structure of risk-free interest rate was obtained from the curve of securities deemed to be credit risk free, available in the Brazilian financial market and determined pursuant to an internal policy of ITAÚ UNIBANCO HOLDING, considering the addition of spread, which took into account the impact of the market result of Financial assets at amortized cost of the guarantee assets portfolio.
Income conversion rate
The income conversion rate represents the expected conversion of balances accumulated by participants in retirement benefits. The decision of conversion into income by participants is influenced by behavioral, economic and tax factors.
Other assumptions
Related expenses, cancellations and partial redemptions, future increases and contributions, among others, are assumptions that affect the estimate of projected cash flows since they represent expenses and income arising from insurance agreements assumed.
Note 28 – Fair value of financial instruments
In cases where market prices are not available, fair values are based on estimates using discounted cash flows or other valuation techniques. These techniques are significantly affected by the assumptions adopted, including the discount rate and estimate of future cash flows. The estimated fair value achieved through these techniques cannot be substantiated by comparison with independent markets and, in many cases, it cannot be realized in the immediate settlement of the instrument.
F-108
Table of Contents
ITAÚ UNIBANCO HOLDING S.A.
Notes to the Consolidated Financial Statements
At 12/31/2018, 12/31/2017 and 01/01/2017 for balance sheet accounts and
From 01/01 to 12/31 of 2018, 2017 and 2016 for income statement accounts
(In millions of Reais, except information per share)
The following table summarizes the carrying and estimated fair values for financial instruments:
| 12/31/2018 | 12/31/2017 | |||||||||||||||||||
| Carrying value |
Estimated fair value |
Carrying value |
Estimated fair value |
|||||||||||||||||
| Cash deposits on demand |
(a | ) | 37,159 | 37,159 | 18,749 | 18,749 | ||||||||||||||
| Financial assets |
1,424,876 | 1,433,116 | 1,330,251 | 1,338,314 | ||||||||||||||||
| Central Bank compulsory deposits |
(a | ) | 94,148 | 94,148 | 98,837 | 98,837 | ||||||||||||||
| At Amortized Cost |
994,759 | 1,002,999 | 905,729 | 913,792 | ||||||||||||||||
| Interbank deposits |
(b | ) | 26,420 | 26,510 | 29,048 | 29,112 | ||||||||||||||
| Securities purchased under agreements to resell |
(a | ) | 280,136 | 280,136 | 244,707 | 244,707 | ||||||||||||||
| Securities |
(c | ) | 110,395 | 112,171 | 111,424 | 113,049 | ||||||||||||||
| Loan operations and lease operations portfolio (*) |
(d | ) | 536,091 | 542,465 | 497,719 | 504,093 | ||||||||||||||
| Other financial assets |
(e | ) | 75,090 | 75,090 | 59,568 | 59,568 | ||||||||||||||
| (-) Provision for Expected Loss |
(33,373 | ) | (33,373 | ) | (36,737 | ) | (36,737 | ) | ||||||||||||
| At Fair Value Through Other Comprehensive Income |
49,323 | 49,323 | 52,149 | 52,149 | ||||||||||||||||
| Securities |
(c | ) | 49,323 | 49,323 | 52,149 | 52,149 | ||||||||||||||
| At Fair Value Through Profit or Loss |
286,646 | 286,646 | 273,536 | 273,536 | ||||||||||||||||
| Securities |
(c | ) | 263,180 | 263,180 | 250,693 | 250,693 | ||||||||||||||
| Derivatives |
(c | ) | 23,466 | 23,466 | 22,843 | 22,843 | ||||||||||||||
| Financial liabilities |
1,151,237 | 1,150,700 | 1,056,717 | 1,054,981 | ||||||||||||||||
| At Amortized Cost |
1,119,734 | 1,119,197 | 1,024,584 | 1,022,848 | ||||||||||||||||
| Deposits |
(b | ) | 463,424 | 463,363 | 402,938 | 402,911 | ||||||||||||||
| Securities sold under repurchase agreements |
(a | ) | 330,237 | 330,237 | 312,634 | 312,634 | ||||||||||||||
| Interbank market debt |
(b | ) | 134,670 | 134,533 | 124,587 | 124,257 | ||||||||||||||
| Institutional market debt |
(b | ) | 93,974 | 93,635 | 98,482 | 97,103 | ||||||||||||||
| Other financial liabilities |
(e | ) | 97,429 | 97,429 | 85,943 | 85,943 | ||||||||||||||
| At Fair Value Through Profit or Loss |
27,711 | 27,711 | 27,211 | 27,211 | ||||||||||||||||
| Derivatives |
(c | ) | 27,519 | 27,519 | 26,746 | 26,746 | ||||||||||||||
| Structured notes |
192 | 192 | 465 | 465 | ||||||||||||||||
| Provision for Expected Loss |
3,792 | 3,792 | 4,922 | 4,922 | ||||||||||||||||
| Loan Commitments |
2,601 | 2,601 | 3,015 | 3,015 | ||||||||||||||||
| Financial Guarantees |
1,191 | 1,191 | 1,907 | 1,907 | ||||||||||||||||
| (*) | In the composition of balance there are operations designated at fair value through profit or loss, in the amount of R$ 102 at 12/31/2017. |
Financial instruments not included in the Balance Sheet (Note 32) are represented by Standby letters of credit and financial guarantees provided, which amount to R$ 76,852 (R$ 79,703 at 12/31/2017) with an estimated fair value of R$ 1,168 (R$ 935 at 12/31/2017).
The methods and assumptions adopted to estimate the fair value are defined below:
| a) | Cash and deposits on demand, Central Bank compulsory deposits, Securities purchased under agreements to resell, Securities sold under repurchase agreements – The carrying amounts for these instruments approximate their fair values. |
| b) | Interbank deposits, Deposits, Interbank and Institutional Market Funds – they are calculated by discounting estimated cash flows at market interest rates. |
F-109
Table of Contents
ITAÚ UNIBANCO HOLDING S.A.
Notes to the Consolidated Financial Statements
At 12/31/2018, 12/31/2017 and 01/01/2017 for balance sheet accounts and
From 01/01 to 12/31 of 2018, 2017 and 2016 for income statement accounts
(In millions of Reais, except information per share)
| c) | Securities and Derivatives – Under usual conditions, the prices quoted in the market are the best indicators of fair values of these financial instruments. However, not all instruments have liquidity or quoted market prices and, in such cases, it is necessary to adopt present value estimates and other techniques to establish their fair value. In the absence of the prices quoted by the Brazilian Association of Entities from Financial and Capital Markets (ANBIMA), the fair values of government securities are determined based on the interest rates provided by brokers. The fair values of corporate debt securities are calculated by discounting estimated cash flows at market interest rates. The fair values of shares are computed based on their prices quoted in the market. The fair values of derivative financial instruments were determined as follows: |
| • | Swaps: The cash flows are discounted to present value based on yield curves that reflect the appropriate risk factors drawn mainly based on the exchange price of derivatives at B3, of Brazilian government securities in the secondary market or derivatives and securities traded abroad. These yield curves may be used to obtain the fair value of currency swaps, interest rate swaps and swaps based on other risk factors (commodities, stock exchange indices, etc.). |
| • | Futures and forwards: Quotations on exchanges or criteria identical to those applied to swaps. |
| • |
|
| • | Loans: They are inversely related to the probability of default (PD) in a financial instrument subject to credit risk. The process of adjusting the market price of these spreads is based on the differences between the yield curves with and without credit risk. |
| d) | Loan operations and lease operations – Fair value is estimated based on groups of loans with similar financial and risk characteristics, using valuation models. The fair value of fixed-rate loans was determined by discounting estimated cash flows, applying current interest rates for similar loans. For the majority of loans at floating rate, the carrying amount was considered close to their fair value. The fair value of loan and lease operations not overdue was calculated by discounting the expected payments of principal and interest through maturity, at the aforementioned rates. The fair value of overdue loan and lease transactions was based on the discount of estimated cash flows, using a rate proportional to the risk associated with the estimated cash flows, or on the underlying collateral. The assumptions related to cash flows and discount rates are determined using information available in the market and the borrower’s specific information of the debtor. |
| e) | Other financial assets / liabilities – primarily composed of receivables from credit card issuers, deposits in guarantee for contingent liabilities, provisions and legal obligations and trading and intermediation of securities. The carrying amounts for these assets/liabilities substantially approximate their fair values, since they principally represent amounts to be received in the short term from credit card holders and to be paid to credit card acquirers, judicially required deposits (indexed to market rates) made by ITAÚ UNIBANCO HOLDING as guarantees for lawsuits or very short-term receivables (generally with a maturity of approximately 5 (five) business days). All of these items represent assets / liabilities without significant associated market, credit and liquidity risks. |
Level 1: Observable inputs that reflect quoted prices (unadjusted) for identical assets or liabilities in active markets. An active market is a market in which transactions for the asset or liability being measured occur often enough and with sufficient volume to provide pricing information on an ongoing basis.
Level 2: Information that is observable for the asset or liability either directly or indirectly. Level 2 generally includes: (i) quoted prices for similar assets or liabilities in active markets; (ii) quoted prices for identical or similar assets or liabilities in markets that are not active, that is, markets in which there are few transactions for the asset or liability, the prices are not current, or quoted prices vary substantially either over time or among market makers, or in which little information is released publicly; (iii) inputs other than quoted prices that are observable for the asset or liability (for example, interest rates and yield curves observable at commonly quoted intervals, volatilities, etc.); (iv) inputs that are mainly derived from or corroborated by observable market data through correlation or by other means.
F-110
Table of Contents
ITAÚ UNIBANCO HOLDING S.A.
Notes to the Consolidated Financial Statements
At 12/31/2018, 12/31/2017 and 01/01/2017 for balance sheet accounts and
From 01/01 to 12/31 of 2018, 2017 and 2016 for income statement accounts
(In millions of Reais, except information per share)
Level 3: Inputs are unobservable for the asset or liability. Unobservable information shall be used to measure fair value to the extent that observable information is not available, thus allowing for situations in which there is little, if any, market activity for the asset or liability at the measurement date.
Financial assets at fair value through profit or loss, including Derivatives, and at fair value through other comprehensive income:
Level 1: Highly-liquid securities with prices available in an active market and derivatives traded on stock exchanges. This classification level includes most of the Brazilian government securities, other foreign government securities, shares and debentures traded on stock exchanges and other securities traded in an active market.
Level 2: When the pricing information is not available for a specific security, the assessment is usually based on prices quoted in the market for similar instruments, pricing information obtained for pricing services, such as Bloomberg, Reuters and brokers (only when the prices represent actual transactions) or discounted cash flows, which use information for assets actively traded in an active market. These securities are classified into Level 2 of the fair value hierarchy and are comprised of certain Brazilian government securities, debentures, some government securities quoted in a less-liquid market in relation to those classified into Level 1, and some share prices in investment funds.
Derivatives included in Level 2 are credit default swaps, cross-currency swaps, interest rate swaps, simple options and certain forwards, since information adopted by pricing models are immediately observable in actively quoted markets. The models used for these instruments are Black & Scholes, Garman & Kohlhagen, Monte Carlo and discounted cash flow.
ITAÚ UNIBANCO HOLDING does not hold positions in alternative investment funds or private equity funds.
Level 3: When no pricing information in an active market, ITAÚ UNIBANCO HOLDING uses internally developed models, from curves generated according to the proprietary model. The Level 3 classification includes some Brazilian government and private securities falling due after 2025 and securities that are not usually traded in an active market.
Derivatives with fair values classified into Level 3 of the fair value hierarchy are composed of exotic options, certain swaps indexed to non-observable information, and swaps with other products, such as swap with option and target flow, credit derivatives and futures of certain commodities.
All aforementioned methodologies may result in a fair value that may not be indicative of the net realizable value or future fair values. However, ITAÚ UNIBANCO HOLDING believes that all methodologies used are appropriate and consistent with the other market participants. However, the adoption of other methodologies or assumptions different than those used to estimate fair value may result in different fair value estimates at the balance sheet date.
F-111
Table of Contents
ITAÚ UNIBANCO HOLDING S.A.
Notes to the Consolidated Financial Statements
At 12/31/2018, 12/31/2017 and 01/01/2017 for balance sheet accounts and
From 01/01 to 12/31 of 2018, 2017 and 2016 for income statement accounts
(In millions of Reais, except information per share)
Distribution by level
The following table presents the breakdown of fair value hierarchy levels.
| 12/31/2018 | 12/31/2017 | |||||||||||||||||||||||||||||||
| Level 1 | Level 2 | Level 3 | Total | Level 1 | Level 2 | Level 3 | Total | |||||||||||||||||||||||||
| Financial assets at fair value through profit or loss |
224,872 | 34,206 | 2,833 | 261,911 | 213,421 | 31,579 | 3,947 | 248,947 | ||||||||||||||||||||||||
|
|
|
|
|
|
|
|
|
|
|
|
|
|
|
|
|
|||||||||||||||||
| Investment funds |
2,003 | 2,323 | 0 | 4,326 | 1,738 | 1,775 | — | 3,513 | ||||||||||||||||||||||||
| Brazilian government securities |
213,816 | 3,242 | 0 | 217,058 | 205,027 | 2,816 | 1 | 207,844 | ||||||||||||||||||||||||
| Government securities – other countries |
1,517 | 562 | 0 | 2,079 | 1,643 | 2,306 | — | 3,949 | ||||||||||||||||||||||||
|
|
|
|
|
|
|
|
|
|
|
|
|
|
|
|
|
|||||||||||||||||
| Argentina |
1,129 | 0 | 0 | 1,129 | 1,466 | — | — | 1,466 | ||||||||||||||||||||||||
| Chile |
147 | 155 | 0 | 302 | 39 | 18 | — | 57 | ||||||||||||||||||||||||
| Colombia |
0 | 207 | 0 | 207 | — | 2,092 | — | 2,092 | ||||||||||||||||||||||||
| United States |
117 | 0 | 0 | 117 | 100 | — | — | 100 | ||||||||||||||||||||||||
| Italy |
0 | 115 | 0 | 115 | — | — | — | — | ||||||||||||||||||||||||
| Mexico |
120 | 0 | 0 | 120 | 5 | — | — | 5 | ||||||||||||||||||||||||
| Paraguay |
0 | 1 | 0 | 1 | — | 3 | — | 3 | ||||||||||||||||||||||||
| Uruguay |
0 | 84 | 0 | 84 | — | 193 | — | 193 | ||||||||||||||||||||||||
| Other |
4 | 0 | 0 | 4 | 33 | — | — | 33 | ||||||||||||||||||||||||
| Corporate securities |
7,536 | 28,079 | 2,833 | 38,448 | 5,013 | 24,682 | 3,946 | 33,641 | ||||||||||||||||||||||||
|
|
|
|
|
|
|
|
|
|
|
|
|
|
|
|
|
|||||||||||||||||
| Shares |
6,175 | 2,003 | 1,268 | 9,446 | 3,875 | 65 | 2,019 | 5,959 | ||||||||||||||||||||||||
| Bank deposit certificates |
1 | 968 | 0 | 969 | 1 | 334 | — | 335 | ||||||||||||||||||||||||
| Securitized real estate loans |
0 | 0 | 1,411 | 1,411 | — | — | 1,795 | 1,795 | ||||||||||||||||||||||||
| Debentures |
168 | 4,707 | 85 | 4,960 | 486 | 2,608 | 122 | 3,216 | ||||||||||||||||||||||||
| Eurobonds and others |
1,192 | 173 | 31 | 1,396 | 651 | 37 | — | 688 | ||||||||||||||||||||||||
| Financial credit bills |
0 | 19,719 | 5 | 19,724 | — | 21,170 | — | 21,170 | ||||||||||||||||||||||||
| Promissory notes |
0 | 435 | 0 | 435 | — | 391 | — | 391 | ||||||||||||||||||||||||
| Other |
0 | 74 | 33 | 107 | — | 77 | 10 | 87 | ||||||||||||||||||||||||
| Financial assets at fair value through other comprehensive income |
30,680 | 18,643 | 0 | 49,323 | 35,234 | 16,915 | — | 52,149 | ||||||||||||||||||||||||
|
|
|
|
|
|
|
|
|
|
|
|
|
|
|
|
|
|||||||||||||||||
| Brazilian government securities |
27,038 | 801 | 0 | 27,839 | 32,218 | 708 | — | 32,926 | ||||||||||||||||||||||||
| Government securities – other countries |
2,448 | 16,324 | 0 | 18,772 | 1,550 | 14,992 | — | 16,542 | ||||||||||||||||||||||||
|
|
|
|
|
|
|
|
|
|
|
|
|
|
|
|
|
|||||||||||||||||
| Germany |
22 | 0 | 0 | 22 | — | — | — | — | ||||||||||||||||||||||||
| Chile |
0 | 7,653 | 0 | 7,653 | — | 9,550 | — | 9,550 | ||||||||||||||||||||||||
| Colombia |
0 | 5,505 | 0 | 5,505 | — | 3,020 | — | 3,020 | ||||||||||||||||||||||||
| United States |
2,425 | 193 | 0 | 2,618 | 1,550 | — | — | 1,550 | ||||||||||||||||||||||||
| France |
0 | 891 | 0 | 891 | — | — | — | — | ||||||||||||||||||||||||
| Paraguay |
0 | 1,529 | 0 | 1,529 | — | 1,800 | — | 1,800 | ||||||||||||||||||||||||
| Uruguay |
0 | 553 | 0 | 553 | — | 622 | — | 622 | ||||||||||||||||||||||||
| Other |
1 | 0 | 0 | 1 | — | — | — | — | ||||||||||||||||||||||||
| Corporate securities |
1,194 | 1,518 | 0 | 2,712 | 1,466 | 1,215 | — | 2,681 | ||||||||||||||||||||||||
|
|
|
|
|
|
|
|
|
|
|
|
|
|
|
|
|
|||||||||||||||||
| Shares |
161 | 0 | 0 | 161 | 148 | — | — | 148 | ||||||||||||||||||||||||
| Bank deposit certificates |
0 | 1,053 | 0 | 1,053 | — | 685 | — | 685 | ||||||||||||||||||||||||
| Debentures |
0 | 2 | 0 | 2 | — | 1 | — | 1 | ||||||||||||||||||||||||
| Eurobonds and others |
1,033 | 463 | 0 | 1,496 | 1,318 | 529 | — | 1,847 | ||||||||||||||||||||||||
| Financial assets at fair value through profit or loss |
1,269 | 0 | 0 | 1,269 | 1,746 | — | — | 1,746 | ||||||||||||||||||||||||
|
|
|
|
|
|
|
|
|
|
|
|
|
|
|
|
|
|||||||||||||||||
| Brazilian government securities |
1,269 | 0 | 0 | 1,269 | 1,746 | — | — | 1,746 | ||||||||||||||||||||||||
| Financial liabilities designated at fair value through profit or loss |
0 | 192 | 0 | 192 | — | 465 | — | 465 | ||||||||||||||||||||||||
|
|
|
|
|
|
|
|
|
|
|
|
|
|
|
|
|
|||||||||||||||||
| Structured notes |
0 | 192 | 0 | 192 | — | 465 | — | 465 | ||||||||||||||||||||||||
F-112
Table of Contents
ITAÚ UNIBANCO HOLDING S.A.
Notes to the Consolidated Financial Statements
At 12/31/2018, 12/31/2017 and 01/01/2017 for balance sheet accounts and
From 01/01 to 12/31 of 2018, 2017 and 2016 for income statement accounts
(In millions of Reais, except information per share)
The following table presents the breakdown of fair value hierarchy levels for our derivative assets and liabilities.
| 12/31/2018 | 12/31/2017 | |||||||||||||||||||||||||||||||
| Level 1 | Level 2 | Level 3 | Total | Level 1 | Level 2 | Level 3 | Total | |||||||||||||||||||||||||
| Assets |
15 | 23,309 | 142 | 23,466 | 158 | 22,249 | 436 | 22,843 | ||||||||||||||||||||||||
|
|
|
|
|
|
|
|
|
|
|
|
|
|
|
|
|
|||||||||||||||||
| Futures Contract |
0 | 0 | 0 | 0 | 158 | — | — | 158 | ||||||||||||||||||||||||
| Swap Contract– adjustment receivable |
0 | 12,959 | 90 | 13,049 | — | 8,821 | 369 | 9,190 | ||||||||||||||||||||||||
| Options Contract |
0 | 4,163 | 52 | 4,215 | — | 3,271 | 66 | 3,337 | ||||||||||||||||||||||||
| Forwards Contract |
0 | 1,835 | 0 | 1,835 | — | 6,911 | — | 6,911 | ||||||||||||||||||||||||
| Credit derivatives - financial Institutions |
0 | 120 | 0 | 120 | — | 137 | — | 137 | ||||||||||||||||||||||||
| NDF - Non Deliverable Forward |
0 | 3,711 | 0 | 3,711 | — | 2,950 | — | 2,950 | ||||||||||||||||||||||||
| Check of swap - Companies |
0 | 44 | 0 | 44 | — | 68 | — | 68 | ||||||||||||||||||||||||
| Other derivative financial instruments |
15 | 477 | 0 | 492 | — | 91 | 1 | 92 | ||||||||||||||||||||||||
| Liabilities |
(22 | ) | (27,471 | ) | (26 | ) | (27,519 | ) | — | (26,643 | ) | (103 | ) | (26,746 | ) | |||||||||||||||||
|
|
|
|
|
|
|
|
|
|
|
|
|
|
|
|
|
|||||||||||||||||
| Swap Contract – adjustment payable |
0 | (19,351 | ) | (3 | ) | (19,354 | ) | — | (13,590 | ) | (102 | ) | (13,692 | ) | ||||||||||||||||||
| Options Contract |
0 | (3,906 | ) | (23 | ) | (3,929 | ) | — | (2,792 | ) | (1 | ) | (2,793 | ) | ||||||||||||||||||
| Forwards Contract |
0 | (470 | ) | 0 | (470 | ) | — | (6,272 | ) | — | (6,272 | ) | ||||||||||||||||||||
| Credit derivatives - financial Institutions |
0 | (140 | ) | 0 | (140 | ) | — | (58 | ) | — | (58 | ) | ||||||||||||||||||||
| NDF - Non Deliverable Forward |
0 | (3,384 | ) | 0 | (3,384 | ) | — | (3,745 | ) | — | (3,745 | ) | ||||||||||||||||||||
| Check of swap - Companies |
0 | (162 | ) | 0 | (162 | ) | — | (122 | ) | — | (122 | ) | ||||||||||||||||||||
| Other derivative financial instruments |
(22 | ) | (58 | ) | 0 | (80 | ) | — | (64 | ) | — | (64 | ) | |||||||||||||||||||
There were no significant transfer between Level 1 and Level 2 during the period from December 31, 2018. Transfers to and from Level 3 are presented in movements of Level 3.
Measurement of fair value Level 2 based on pricing services and brokers
To assure that the fair value of these instruments is properly classified as Level 2, internal analysis of the information received are conducted, so as to understand the nature of the input by the service provider.
Prices provided by pricing services that meet the following requirements are considered Level 2: input is immediately available, regularly distributed, provided by sources actively involved in significant markets and it is not proprietary.
Of the total of R$ 52,849 in financial instruments classified as Level 2, on December 31, 2018, pricing service or brokers were used to evaluate securities at the value of R$ 22,231, substantially represented by:
| • | Debentures: When available, we use price information for transactions recorded in the Brazilian Debenture System (SND), an electronic platform operated by B3, which provides multiple services for transactions involving debentures in the secondary market. Alternatively, prices of debentures provided by ANBIMA are used. Its methodology includes obtaining, on a daily basis, illustration and non-binding prices from a group of market players deemed to be significant. Such information is subject to statistical filters established in the methodology, with the purpose of eliminating outliers. |
| • | Global and corporate securities: The pricing process for these securities consists in capturing from 2 to 8 quotes from Bloomberg, depending on the asset. The methodology consists in comparing the highest purchase prices and the lowest sale prices of trades provided by Bloomberg for the last day of the month. Such prices are compared with information from purchase orders that the Institutional Treasury of ITAÚ UNIBANCO HOLDING. Should the difference between them be lower than 0.5%, the average price of Bloomberg is used. Should it be higher than 0.5% or if the Institutional Treasury does not provide information on this specific security, the average price gathered directly from other banks is used. The price of the Institutional Treasury is used as a reference only and never in the computation of the final price. |
F-113
Table of Contents
ITAÚ UNIBANCO HOLDING S.A.
Notes to the Consolidated Financial Statements
At 12/31/2018, 12/31/2017 and 01/01/2017 for balance sheet accounts and
From 01/01 to 12/31 of 2018, 2017 and 2016 for income statement accounts
(In millions of Reais, except information per share)
Level 3 recurring fair value measurements
The departments in charge of defining and applying the pricing models are segregated from the business areas. The models are documented, submitted to validation by an independent area and approved by a specific committee. The daily process of price capture, calculation and disclosure are periodically checked according to formally defined testing and criteria and the information is stored in a single and corporate history data base.
The most recurring cases of assets classified as Level 3 are justified by the discount factors used. Factors such as the fixed interest curve in Brazilian Reais and the TR coupon curve – and, as a result, its related factors – have inputs with terms shorter than the maturities of these fixed-income assets. For swaps, the analysis is carried out by index for both parties. There are some cases in which the inputs periods are shorter than the maturity of the derivative.
Level 3 recurring fair value changes
The tables below show the changes in balance sheet for financial instruments classified by ITAÚ UNIBANCO HOLDING in Level 3 of the fair value hierarchy. Derivative financial instruments classified in Level 3 correspond to other derivatives indexed to shares.
| Fair value at 12/31/2017 |
Total gains or losses (realized / unrealized) |
Purchases | Settlements | Transfers in and / or out of Level |
Fair value at 12/31/2018 |
Total Gains or Losses (Unrealized) |
||||||||||||||||||||||||||
| Recognized in the result |
Recognized in other comprehensive income |
|||||||||||||||||||||||||||||||
| Financial assets designated at fair value |
3,947 | (377 | ) | — | 90 | (353 | ) | (474 | ) | 2,833 | (618 | ) | ||||||||||||||||||||
|
|
|
|
|
|
|
|
|
|
|
|
|
|
|
|
|
|||||||||||||||||
| Brazilian government securities |
1 | (1 | ) | — | — | — | — | 0 | — | |||||||||||||||||||||||
| Corporate securities |
3,946 | (376 | ) | — | 90 | (353 | ) | (474 | ) | 2,833 | (618 | ) | ||||||||||||||||||||
| Shares |
2,019 | 34 | — | — | (203 | ) | (582 | ) | 1,268 | (442 | ) | |||||||||||||||||||||
| Securitized real estate loans |
1,795 | (359 | ) | — | 57 | (89 | ) | 7 | 1,411 | 19 | ||||||||||||||||||||||
| Debentures |
122 | (41 | ) | — | — | (53 | ) | 57 | 85 | (196 | ) | |||||||||||||||||||||
| Eurobonds and others |
— | 2 | — | 20 | (2 | ) | 11 | 31 | — | |||||||||||||||||||||||
| Financial credit bills |
— | — | — | — | 5 | 5 | — | |||||||||||||||||||||||||
| Other |
10 | (12 | ) | — | 13 | (6 | ) | 28 | 33 | 1 | ||||||||||||||||||||||
| Fair value at 12/31/2017 |
Total gains or losses (realized /unrealized) |
Purchases | Settlements | Transfers in and / or out of Level |
Fair value at 12/31/2018 |
Total Gains or Losses (Unrealized) |
||||||||||||||||||||||||||
| Recognized in the result |
Recognized in other comprehensive income |
|||||||||||||||||||||||||||||||
| Derivatives - assets |
436 | (3 | ) | — | 205 | (254 | ) | (242 | ) | 142 | 61 | |||||||||||||||||||||
|
|
|
|
|
|
|
|
|
|
|
|
|
|
|
|
|
|||||||||||||||||
| Swap Contract– adjustment receivable |
369 | (5 | ) | — | — | (30 | ) | (244 | ) | 90 | 61 | |||||||||||||||||||||
| Options Contract |
66 | 2 | 205 | (223 | ) | 2 | 52 | — | ||||||||||||||||||||||||
| Other derivative financial instruments |
1 | (1 | ) | 0 | — | |||||||||||||||||||||||||||
| Derivatives - liabilities |
(103 | ) | 40 | — | (148 | ) | 141 | 44 | (26 | ) | 6 | |||||||||||||||||||||
|
|
|
|
|
|
|
|
|
|
|
|
|
|
|
|
|
|||||||||||||||||
| Swap Contract – adjustment payable |
(102 | ) | (37 | ) | — | — | 92 | 44 | (3 | ) | (3 | ) | ||||||||||||||||||||
| Options Contract |
(1 | ) | 77 | — | (148 | ) | 49 | — | (23 | ) | 9 | |||||||||||||||||||||
F-114
Table of Contents
ITAÚ UNIBANCO HOLDING S.A.
Notes to the Consolidated Financial Statements
At 12/31/2018, 12/31/2017 and 01/01/2017 for balance sheet accounts and
From 01/01 to 12/31 of 2018, 2017 and 2016 for income statement accounts
(In millions of Reais, except information per share)
| Fair value at 12/31/2016 |
Total gains or losses (realized / unrealized) |
Purchases | Settlements | Transfers in and / or out of Level |
Fair value at 12/31/2017 |
Total Gains or Losses (Unrealized) |
||||||||||||||||||||||||||
| Recognized in the result |
Recognized in other comprehensive income |
|||||||||||||||||||||||||||||||
| Financial assets designated at fair value through profit or loss |
3,808 | (232 | ) | — | 578 | (146 | ) | (61 | ) | 3,947 | (412 | ) | ||||||||||||||||||||
|
|
|
|
|
|
|
|
|
|
|
|
|
|
|
|
|
|||||||||||||||||
| Brazilian government securities |
1 | — | — | — | — | — | 1 | (1 | ) | |||||||||||||||||||||||
| Corporate securities |
3,807 | (232 | ) | — | 578 | (146 | ) | (61 | ) | 3,946 | (411 | ) | ||||||||||||||||||||
| Shares |
1,662 | 122 | — | 400 | — | (165 | ) | 2,019 | (274 | ) | ||||||||||||||||||||||
| Securitized real estate loans |
2,092 | (355 | ) | — | 58 | — | — | 1,795 | 16 | |||||||||||||||||||||||
| Debentures |
37 | (1 | ) | — | 106 | (124 | ) | 104 | 122 | (153 | ) | |||||||||||||||||||||
| Eurobonds and others |
— | — | — | 9 | (9 | ) | — | — | — | |||||||||||||||||||||||
| Other |
16 | 2 | — | 5 | (13 | ) | — | 10 | — | |||||||||||||||||||||||
| Financial assets designated at fair value through other comprehensive income |
227 | — | — | 200 | (427 | ) | — | — | — | |||||||||||||||||||||||
|
|
|
|
|
|
|
|
|
|
|
|
|
|
|
|
|
|||||||||||||||||
| Corporate securities |
227 | — | — | 200 | (427 | ) | — | — | — | |||||||||||||||||||||||
| Securitized real estate loans |
6 | — | — | — | (6 | ) | — | — | — | |||||||||||||||||||||||
| Eurobonds and others |
221 | — | — | 200 | (421 | ) | — | — | — | |||||||||||||||||||||||
| Fair value at 12/31/2016 |
Total gains or losses (realized / unrealized) |
Purchases | Settlements | Transfers in and / or out of Level |
Fair value at 12/31/2017 |
Total Gains or Losses (Unrealized) |
||||||||||||||||||||||||||
| Recognized in the result |
Recognized in other comprehensive income |
|||||||||||||||||||||||||||||||
| Derivatives - Assets |
521 | (33 | ) | 101 | — | (244 | ) | 91 | 436 | 17 | ||||||||||||||||||||||
|
|
|
|
|
|
|
|
|
|
|
|
|
|
|
|
|
|||||||||||||||||
| Swap Contract– adjustment receivable |
468 | (41 | ) | — | — | (100 | ) | 42 | 369 | 32 | ||||||||||||||||||||||
| Options Contract |
47 | 12 | 101 | — | (143 | ) | 49 | 66 | (14 | ) | ||||||||||||||||||||||
| Other derivative financial instruments |
6 | (4 | ) | — | — | (1 | ) | — | 1 | (1 | ) | |||||||||||||||||||||
| Derivatives - Liabilities |
(60 | ) | (117 | ) | (15 | ) | — | 111 | (22 | ) | (103 | ) | (57 | ) | ||||||||||||||||||
|
|
|
|
|
|
|
|
|
|
|
|
|
|
|
|
|
|||||||||||||||||
| Swap Contract – adjustment payable |
(56 | ) | (122 | ) | — | — | 97 | (21 | ) | (102 | ) | (60 | ) | |||||||||||||||||||
| Options Contract |
(4 | ) | 5 | (15 | ) | — | 13 | — | (1 | ) | 3 | |||||||||||||||||||||
| Credit derivatives - financial Institutions |
— | — | — | — | 1 | (1 | ) | — | — | |||||||||||||||||||||||
F-115
Table of Contents
ITAÚ UNIBANCO HOLDING S.A.
Notes to the Consolidated Financial Statements
At 12/31/2018, 12/31/2017 and 01/01/2017 for balance sheet accounts and
From 01/01 to 12/31 of 2018, 2017 and 2016 for income statement accounts
(In millions of Reais, except information per share)
Sensitivity analyses operations of Level 3
The fair value of financial instruments classified in Level 3 is measured through assessment techniques based on correlations and associated products traded in active markets, internal estimates and internal models.
Significant unverifiable inputs used for measurement of the fair value of instruments classified in Level 3 are: interest rates, underlying asset prices and volatility. Significant variations in any of these inputs separately may give rise to significant changes in the fair value.
The table below shows the sensitivity of these fair values in scenarios of changes of interest rates, asset prices, or in scenarios vary in prices with shocks and the volatility for non-linear assets:
| Sensitivity – Level 3 Operations |
12/31/2018 | 12/31/2017 | ||||||||||||||||||
| Market risk factor groups |
Scenarios | Impact | Impact | |||||||||||||||||
| Result | Stockholders’ equity |
Result | Stockholders’ equity |
|||||||||||||||||
| I | (0.4 | ) | (1.2 | ) | (1.9 | ) | (2.4 | ) | ||||||||||||
| Interest rates |
II | (9.3 | ) | (29.3 | ) | (47.0 | ) | (55.4 | ) | |||||||||||
| III | (18.6 | ) | (57.8 | ) | (93.9 | ) | (114.5 | ) | ||||||||||||
|
|
|
|
|
|
|
|
|
|
|
|||||||||||
| Shares |
I | (63.4 | ) | 0 | (146.6 | ) | — | |||||||||||||
| II | (126.8 | ) | 0 | (293.2 | ) | — | ||||||||||||||
|
|
|
|
|
|
|
|
|
|
|
|||||||||||
| Nonlinear |
I | (48.2 | ) | 0 | (9.2 | ) | — | |||||||||||||
| II | (89.3 | ) | 0 | (11.9 | ) | — | ||||||||||||||
|
|
|
|
|
|
|
|
|
|
|
|||||||||||
The following scenarios are used to measure the sensitivity:
Interest rate
Based on reasonably possible changes in assumptions at 1, 25 and 50 basis points (scenarios I, II and III respectively) in the interest curves, both for increase and decrease, considering the largest losses resulting in each scenario.
Shares
Based on reasonably possible changes in assumptions at 5 and 10 percentage points (scenarios I and II respectively) in prices of currencies, commodities and ratios, both for increase and decrease, considering the largest losses resulting in each scenario.
Non linear
Scenario I: Based on reasonably possible changes in assumptions at 5 percentage points in prices and 25 percentage points the level in volatility, both for increase and decrease, considering the largest losses resulting in each scenario.
Scenario II: Based on reasonably possible changes in assumptions at 10 percentage points in prices and 25 percentage points the level in volatility, both for increase and decrease, considering the largest losses resulting in each scenario.
F-116
Table of Contents
ITAÚ UNIBANCO HOLDING S.A.
Notes to the Consolidated Financial Statements
At 12/31/2018, 12/31/2017 and 01/01/2017 for balance sheet accounts and
From 01/01 to 12/31 of 2018, 2017 and 2016 for income statement accounts
(In millions of Reais, except information per share)
Note 29 - Contingent Assets and Liabilities, Provisions and Legal Obligations
ITAÚ UNIBANCO HOLDING, as a result of the ordinary course of its business, may be a party to legal lawsuits of labor, civil and tax nature. The contingencies related to these lawsuits are classified as follows:
a) Contingent Assets: There are no contingent assets recorded.
b) Provisions and contingencies: The criteria to quantify of provisions for contingencies are adequate in relation to the specific characteristics of civil, labor and tax lawsuits portfolios, as well as other risks, taking into consideration the opinion of its legal advisors, the nature of the lawsuits, the similarity with previous lawsuits and the prevailing previous court decisions. A provision is recognized whenever the loss is classified as probable.
Legal liabilities arise from lawsuits filed to discuss the legality and unconstitutionality of the legislation in force, being subject to an accounting provision.
| I- | Civil lawsuits |
In general, provisions and contingencies arise from claims related to the revision of contracts and compensation for damages and pain and suffering and the lawsuits are classified as follows:
Collective lawsuits: Related to claims of a similar nature and with individual amounts that are not considered significant. Provisions are determined on a monthly basis and the expected amount of losses is accrued according to statistical references that take into account the nature of the lawsuit and the characteristics of the court (Small Claims Court or Regular Court). Contingencies and provisions are adjusted to reflect the amounts deposited as guarantee for their execution when realized.
Individual lawsuits: Related to claims with unusual characteristics or involving significant amounts, these are periodically calculated based on the calculation of the amount claimed. The amounts considered as probable losses are recorded as provisions.
ITAÚ UNIBANCO HOLDING, despite having complied with the rules in force at the time, is a defendant in lawsuits filed by individuals referring to collection of inflation adjustments to savings accounts resulting from economic plans implemented in the decades of 1980 and 1990, as well as in collective lawsuits filed by: (i) consumer protection associations; and (ii) the Public Attorney’s Office, on behalf of the savings accounts holders. ITAÚ UNIBANCO HOLDING recognizes provisions upon receipt of summons, as well as at the time individuals demand the enforcement of the decision rendered by the Judiciary power, using the same criteria adopted to determine provisions for individual lawsuits.
The Federal Supreme Court (STF) has issued some decisions favorable to savings account holders, but it has not established its understanding with respect to the constitutionality of the economic plans and their applicability to savings accounts. Currently, the appeals involving these matters are suspended, as determined by the STF, until it pronounces a final decision.
In December 2017, through mediation of the Federal Attorney’s Office (AGU) and supervision of the BACEN, savers (represented by two civil associations, FEBRAPO and IDEC) and FEBRABAN entered into an instrument of agreement aiming at resolving lawsuits related to economic plans, and ITAÚ UNIBANCO HOLDING has already adhered to its terms. Said agreement was approved on March 1, 2018, by the Plenary Session of the Federal Supreme Court (STF) and, savers may adhere to their terms for a 24-month period, counted as from May 22, 2018 with the subsequent conclusion of lawsuits.
| II- | Labor claims |
Provisions and Contingencies arise from lawsuits in which labor rights provided for in labor legislation specific to the related profession are discussed, such as: overtime, salary equalization, reinstatement, transfer allowance, pension plan supplement, among others, are discussed. These lawsuits are classified as follows:
Collective lawsuits: related to claims considered similar and with individual amounts that are not considered relevant. The expected amount of loss is determined and accrued on a monthly basis in accordance with a statistical share pricing model and is reassessed taking into account the court rulings. Provisions and contingencies are adjusted to the amounts deposited as guarantee for their execution when realized.
F-117
Table of Contents
ITAÚ UNIBANCO HOLDING S.A.
Notes to the Consolidated Financial Statements
At 12/31/2018, 12/31/2017 and 01/01/2017 for balance sheet accounts and
From 01/01 to 12/31 of 2018, 2017 and 2016 for income statement accounts
(In millions of Reais, except information per share)
Individual lawsuits: related to claims with unusual characteristics or involving significant amounts. These are periodically calculated based on the calculation of the amount claimed.
| III- | Other Risks |
These are quantified and accrued mainly based on the evaluation of rural credit transactions with joint liability and FCVS (salary variations compensation fund) credits assigned to Banco Nacional.
Below are the changes in civil, labor and other risks provisions:
| 01/01 to 12/31/2018 | ||||||||||||||||
| Civil | Labor | Other | Total | |||||||||||||
| Opening balance |
5,300 | 7,283 | 150 | 12,733 | ||||||||||||
| (-) Guaranteed Provisions by indemnity clause (Note 2.4.n) |
(243 | ) | (998 | ) | 0 | (1,241 | ) | |||||||||
| Subtotal |
5,057 | 6,285 | 150 | 11,492 | ||||||||||||
| Interest (Note 23) |
145 | 508 | 0 | 653 | ||||||||||||
| Changes in the period reflected in results (Note 23) |
319 | 1,982 | 423 | 2,724 | ||||||||||||
|
|
|
|
|
|
|
|
|
|||||||||
| Increase (*) |
774 | 2,152 | 425 | 3,351 | ||||||||||||
| Reversal |
(455 | ) | (170 | ) | (2 | ) | (627 | ) | ||||||||
| Payment |
(1,321 | ) | (2,911 | ) | 0 | (4,232 | ) | |||||||||
| Subtotal |
4,200 | 5,864 | 573 | 10,637 | ||||||||||||
| (+) Guaranteed Provisions by indemnity clause (Note 2.4.n) |
226 | 957 | 0 | 1,183 | ||||||||||||
| Closing balance |
4,426 | 6,821 | 573 | 11,820 | ||||||||||||
|
|
|
|
|
|
|
|
|
|||||||||
| Current |
1,350 | 2,911 | 573 | 4,834 | ||||||||||||
| Non-current |
3,076 | 3,910 | 0 | 6,986 | ||||||||||||
|
|
|
|
|
|
|
|
|
|||||||||
| Escrow deposits at 12/31/2018 (Note 18a) |
1,574 | 2,302 | 0 | 3,876 | ||||||||||||
|
|
|
|
|
|
|
|
|
|||||||||
| (*) | Civil provisions include the provision for economic plans amounting to R$ (184). |
| 01/01 to 12/31/2017 | ||||||||||||||||
| Civil | Labor | Other | Total | |||||||||||||
| Opening balance |
5,172 | 7,232 | 259 | 12,663 | ||||||||||||
| Effect of change in consolidation criteria |
(1 | ) | — | — | (1 | ) | ||||||||||
| Balance arising from the merger with Corpbanca (Note 3a) |
39 | 284 | — | 323 | ||||||||||||
| (-) Guaranteed Provisions by indemnity clause (Note 2.4.n) |
(256 | ) | (1,066 | ) | — | (1,322 | ) | |||||||||
| Subtotal |
4,954 | 6,450 | 259 | 11,663 | ||||||||||||
| Interest (Note 23) |
99 | 613 | — | 712 | ||||||||||||
| Changes in the period reflected in results (Note 23) |
1,420 | 2,357 | (109 | ) | 3,668 | |||||||||||
|
|
|
|
|
|
|
|
|
|||||||||
| Increase (*) |
1,962 | 2,592 | 4 | 4,558 | ||||||||||||
| Reversal |
(542 | ) | (235 | ) | (113 | ) | (890 | ) | ||||||||
| Payment |
(1,416 | ) | (3,135 | ) | — | (4,551 | ) | |||||||||
| Subtotal |
5,057 | 6,285 | 150 | 11,492 | ||||||||||||
| (+) Guaranteed Provisions by indemnity clause (Note 2.4.n) |
243 | 998 | — | 1,241 | ||||||||||||
| Closing balance |
5,300 | 7,283 | 150 | 12,733 | ||||||||||||
|
|
|
|
|
|
|
|
|
|||||||||
| Current |
1,450 | 3,144 | 150 | 4,744 | ||||||||||||
| Non-current |
3,850 | 4,139 | — | 7,989 | ||||||||||||
|
|
|
|
|
|
|
|
|
|||||||||
| Escrow deposits at 12/31/2017 (Note 18a) |
1,457 | 2,200 | — | 3,657 | ||||||||||||
|
|
|
|
|
|
|
|
|
|||||||||
| (*) | Civil provisions include the provision for economic plans amounting to R$ 184. |
F-118
Table of Contents
ITAÚ UNIBANCO HOLDING S.A.
Notes to the Consolidated Financial Statements
At 12/31/2018, 12/31/2017 and 01/01/2017 for balance sheet accounts and
From 01/01 to 12/31 of 2018, 2017 and 2016 for income statement accounts
(In millions of Reais, except information per share)
IV- Tax proceedings and legal obligations
Provisions correspond to the principal amount of taxes involved in tax, administrative or judicial lawsuits, subject to tax assessment notices, plus interest and, when applicable, fines and charges.
The table below shows the changes in the provisions:
| 01/01 to 12/31/2018 |
01/01 to 12/31/2017 |
|||||||
| Opening balance |
7,003 | 8,246 | ||||||
| (-) Provisions guaranteed by indemnity clause (Note 2.4 n) |
(66 | ) | (69 | ) | ||||
| Subtotal |
6,937 | 8,177 | ||||||
| Interest (*) |
384 | 613 | ||||||
| Changes in the period reflected in results |
(259 | ) | (27 | ) | ||||
|
|
|
|
|
|||||
| Increase (*) |
392 | 452 | ||||||
| Reversal (*) |
(651 | ) | (479 | ) | ||||
| Payment |
(337 | ) | (1,826 | ) | ||||
| Subtotal |
6,725 | 6,937 | ||||||
| (+) Provisions guaranteed by indemnity clause (Note 2.4 n) |
68 | 66 | ||||||
| Closing balance |
6,793 | 7,003 | ||||||
|
|
|
|
|
|||||
| Current |
107 | 230 | ||||||
| Non-current |
6,686 | 6,773 | ||||||
|
|
|
|
|
|||||
| (*) | The amounts are included in the headings Tax Expenses, General and Administrative Expenses and Current Income Tax and Social Contribution. |
| Escrow deposits |
01/01 to 12/31/2018 |
01/01 to 12/31/2017 |
||||||
| Opening balance |
5,170 | 4,847 | ||||||
| Appropriation of interest |
199 | 344 | ||||||
| Changes in the period |
(22 | ) | (3 | ) | ||||
|
|
|
|
|
|||||
| Deposits made |
251 | 240 | ||||||
| Withdrawals |
(48 | ) | (202 | ) | ||||
| Deposits released |
(225 | ) | (41 | ) | ||||
| Closing balance |
5,347 | 5,188 | ||||||
|
|
|
|
|
|||||
| Reclassification of assets pledged as collateral for contingencies (Note 29e) |
(1 | ) | (18 | ) | ||||
| Closing balance after reclassification (Note 18a) |
5,346 | 5,170 | ||||||
|
|
|
|
|
|||||
F-119
Table of Contents
ITAÚ UNIBANCO HOLDING S.A.
Notes to the Consolidated Financial Statements
At 12/31/2018, 12/31/2017 and 01/01/2017 for balance sheet accounts and
From 01/01 to 12/31 of 2018, 2017 and 2016 for income statement accounts
(In millions of Reais, except information per share)
The main discussions related to Tax and Tax Lawsuits and Legal Obligations are described below:
| • | CSLL – Isonomy – R$ 1,340: discussing the lack of constitutional support for the increase, establishes by Law nº 11,727/08, of the CSLL rate for financial and insurance companies from 9% to 15%. The balance of the deposit in court totals R$ 1,324; |
| • | INSS – Non-compensatory amounts – R$ 660: the non-levy of social security contribution on amounts paid as profit sharing is defended; |
| • | PIS and COFINS – Calculation basis – R$ 636: defending the levy of PIS and COFINS on revenue, a tax on revenue from the sales of assets and services. The balance of the deposit in court totals R$ 612. |
| c) | Off-balance sheet contingencies |
The amounts involved in administrative and judicial challenges with estimated risk of possible loss are subject to accounting provision and are basically composed of:
I- Civil and Labor Claims
In Civil Lawsuits with possible loss, total estimated risk is R$ 3,879 (R$ 3,494 at December 31, 2017), and in this amount there are no values arising from interest in Joint Ventures.
For Labor Claims with possible loss, estimated risk is R$ 177 (R$ 122 at December 31, 2017).
II - Tax proceedings
The tax proceedings of possible loss totaled R$ 27,530, and the main discussions are described below:
| • | INSS – Non-compensatory amounts – R$ 5,373: defends the non-levy of this contribution on these amounts, among which are profit sharing, stock options, transportation vouchers and sole bonuses; |
| • | IRPJ, CSLL, PIS and COFINS – Funding Expenses – R$ 3,930: the deductibility of funding expenses (Interbank expenses), related to funds that were capitalized between Group companies, is being challenged; |
| • | PIS and COFINS - Reversal of Revenues from Depreciation in Excess – R$ 3,205: discussing the accounting and tax treatment granted to PIS and COFINS upon settlement of leasing operations; |
| • | IRPJ and CSLL – Goodwill – Deduction – R$ 2,704: the deductibility of goodwill with future expected profitability on the acquisition of investments; |
| • | IRPJ, CSLL, PIS and COFINS – Requests for offsetting dismissed - R$ 1,695: cases in which the liquidity and the ability of offset credits are discussed; |
| • | IRPJ and CSLL – Interest on capital – R$ 1,510: defending the deductibility of interest on capital declared to stockholders based on the Brazilian long term interest rate (TJLP) on the stockholders’ equity for the year and for prior years; |
| • | ISS – Banking Institutions – R$ 1,166: these are banking operations, revenue from which may not be interpreted as prices for services rendered, and/or which arises from activities not listed under Supplementary Law No. 116/03 or Decree Law No. 406/68; |
| • | IRPJ and CSLL – Disallowance of Losses – R$ 1,112: discussion on the amount of tax loss (IRPJ) and/or social contribution (CSLL) tax loss carryforwards used by the Federal Revenue Service when drawing up tax assessment notes that are still pending a final decision; |
| • | IRPJ and CSLL – Deductibility of Losses in Credit Operations – R$ 757 – Assessments to require the payment of IRPJ and CSLL due to the alleged non-observance of the legal criteria for the deduction of losses upon the receipt of credits. |
F-120
Table of Contents
ITAÚ UNIBANCO HOLDING S.A.
Notes to the Consolidated Financial Statements
At 12/31/2018, 12/31/2017 and 01/01/2017 for balance sheet accounts and
From 01/01 to 12/31 of 2018, 2017 and 2016 for income statement accounts
(In millions of Reais, except information per share)
| d) | Accounts Receivable – Reimbursement of Provisions |
The receivables balance arising from reimbursements of contingencies totals R$ 999 (R$ 1,065 at December 31, 2017)) (Note 18a), arising basically from the collateral established in Banco Banerj S.A. privatization process occurred in 1997, when the State of Rio de Janeiro created a fund to guarantee the equity recomposition in provisions for Civil, Labor and Tax Claims.
| e) | Guarantees of contingencies, provisions and legal obligations |
The guarantees related to legal proceedings involving ITAÚ UNIBANCO HOLDING and basically consist of:
| 12/31/2018 | 12/31/2017 | |||||||
| Financial assets - at fair value through profit or loss and at fair value through other comprehensive income (basically financial treasury bills) |
730 | 962 | ||||||
| Escrow deposits (Note 18a) |
4,312 | 4,585 | ||||||
ITAÚ UNIBANCO HOLDING’s provisions for judicial and administrative challenges are long-term, considering the time required for their questioning, and this prevents the disclosure of a deadline for their conclusion.
The legal advisors believe that ITAÚ UNIBANCO HOLDING is not a party to this or any other administrative proceedings or lawsuits that could significantly affect the results of its operations.
F-121
Table of Contents
ITAÚ UNIBANCO HOLDING S.A.
Notes to the Consolidated Financial Statements
At 12/31/2018, 12/31/2017 and 01/01/2017 for balance sheet accounts and
From 01/01 to 12/31 of 2018, 2017 and 2016 for income statement accounts
(In millions of Reais, except information per share)
Note 30 – Segment Information
The current operational and reporting segments of ITAÚ UNIBANCO HOLDING are described below:
| • | Retail Banking |
The segment comprises retail clients, account holders and non-account holders, individuals and legal entities, high net worth clients (Itaú Uniclass and Personnalité) and the companies segment (microenterprises and small companies). It includes financing and credit offers made outside the branch network, in addition to credit cards and payroll loans.
| • | Wholesale Banking |
It comprises products and services offered to middle-market companies, clients with high financial equity (Private Bank), activities of Latin American units and Itaú BBA, the unit responsible for commercial transactions with large companies and operation as Investment Bank.
| • | Activities with the Market + Corporation |
It basically corresponds to the result arising from capital surplus, subordinated debt surplus and the net balance of tax credits and debits. It also shows the financial margin with the market, the Treasury operating cost, the equity in earnings of companies not associated to each one of the segments.
| a) | Basis of presentation |
Segment information is prepared based on the reports used by top management to assess the performance and to make decisions regarding the allocation of funds for investment and other purposes.
These reports use a variety of information for management purposes, including financial and non-financial information supported by bases different from information prepared according to accounting practices adopted in Brazil. The main indicator adopted for monitoring of business performance is Recurring Net Income, as well as Return on Economic Capital for each business segment.
Information by segment has been prepared in accordance with accounting practices adopted in Brazil and was adjusted by the items below:
Allocated capital: The statements of each segment consider the capital allocation based on a proprietary model and consequent impacts on results arising from this allocation. This model comprises the following components: Credit risk, operational risk, market risk and insurance underwriting risk.
Income tax rate: We consider the total income tax rate, net of the tax effect from the payment of interest on capital, for the Retail Banking, Wholesale Bank and Activities with the Market segments. The difference between the income tax amount calculated by segment and the effective income tax amount, as stated in the consolidated financial statements, is allocated to the Activities with the Market + Corporation column.
F-122
Table of Contents
ITAÚ UNIBANCO HOLDING S.A.
Notes to the Consolidated Financial Statements
At 12/31/2018, 12/31/2017 and 01/01/2017 for balance sheet accounts and
From 01/01 to 12/31 of 2018, 2017 and 2016 for income statement accounts
(In millions of Reais, except information per share)
| • | Reclassification and application of managerial criteria |
The managerial statement of income was used to prepare information per segment. These statements were obtained based on the statement of income adjusted by the impact of non-recurring events and the managerial reclassifications in income.
The main reclassifications between the accounting and managerial results are:
Banking product: Considers the opportunity cost for each operation. The financial statements were adjusted so that the stockholders’ equity was replaced by funding at market price. Subsequently, the financial statements were adjusted to include revenues related to capital allocated to each segment. The cost of subordinated debt and the respective remuneration at market price were proportionally allocated to the segments, based on the economic allocated capital.
Hedge tax effects: The tax effects of the hedge of investments abroad were adjusted – these were originally recorded in the tax expenses (PIS and COFINS) and Income Tax and Social Contribution on Net Income (IR and CSLL) lines – and are now reclassified to financial margin.
Insurance: The main reclassifications of revenues refer to the financial margins obtained with the technical provisions of insurance, pension plan and capitalization, in addition to revenue from management of pension plan funds.
Other reclassifications: Other Income, Share of Income of Associates and joint ventures, Non-Operating Income, Profit Sharing of Management Members and Expenses for Credit Card Reward Program were reclassified to those lines representing the way the ITAÚ UNIBANCO HOLDING manages its business, enabling greater understanding for performance analysis.
The adjustments and reclassifications column shows the effects of the differences between the accounting principles followed for the presentation of segment information, which are substantially in line with the accounting practices adopted for financial institutions in Brazil, except as described above, and the policies used in the preparation of these consolidated financial statements according to IFRS. Main adjustments are as follows:
| • | Requirements for evaluation of impairment of financial assets are based on an expected loan losses model; |
| • | Adjustment to fair value due to reclassifications of financial assets for measurement categories as a result of the concept of business models of IFRS 9; |
| • | Financial assets modified and not written-off, which balance was recalculated in accordance with the requirements of IFRS 9; |
| • | Effective interest rate of financial assets and liabilities measure at amortized cost, recording revenues and costs directly attributable to their acquisition, issue or disposal for the transaction term, whereas in the standards adopted in Brazil, recognition of expenses and revenues from fees occurs at the time these transactions are contracted; |
Goodwill generated in business combination is not amortized, whereas in the standards adopted in Brazil, it is amortized.
F-123
Table of Contents
ITAÚ UNIBANCO HOLDING S.A.
Notes to the Consolidated Financial Statements
At 12/31/2018, 12/31/2017 and 01/01/2017 for balance sheet accounts and
From 01/01 to 12/31 of 2018, 2017 and 2016 for income statement accounts
(In millions of Reais, except information per share)
| b) | Consolidated Statement of Managerial Result |
ITAÚ UNIBANCO HOLDING S.A.
From January 1, December 31, 2018
| Retail Banking |
Wholesale Banking |
Activities with the Market + Corporation |
ITAÚ UNIBANCO |
Adjustments | IFRS consolidated (3) |
|||||||||||||||||||
| Banking product |
72,182 | 29,389 | 10,246 | 111,817 | (7,617 | ) | 104,200 | |||||||||||||||||
| Interest margin (1) |
40,243 | 18,930 | 9,912 | 69,085 | (8,380 | ) | 60,705 | |||||||||||||||||
| Banking service fees |
25,131 | 9,810 | 138 | 35,079 | 1,730 | 36,809 | ||||||||||||||||||
| Income related to insurance and private pension operations before claim and selling expenses |
6,808 | 649 | 196 | 7,653 | (3,692 | ) | 3,961 | |||||||||||||||||
| Other income |
0 | 0 | 0 | 0 | 2,725 | 2,725 | ||||||||||||||||||
| Cost of Credit |
(12,526 | ) | (1,540 | ) | 0 | (14,066 | ) | 5,112 | (8,954 | ) | ||||||||||||||
| Claims |
(1,160 | ) | (68 | ) | 0 | (1,228 | ) | 0 | (1,228 | ) | ||||||||||||||
| Operating margin |
58,496 | 27,781 | 10,246 | 96,523 | (2,505 | ) | 94,018 | |||||||||||||||||
| Other operating income (expenses) |
(40,002 | ) | (15,217 | ) | (1,070 | ) | (56,289 | ) | (7,121 | ) | (63,410 | ) | ||||||||||||
| Non-interest expenses (2) |
(35,296 | ) | (13,817 | ) | (331 | ) | (49,444 | ) | (8,094 | ) | (57,538 | ) | ||||||||||||
| Tax expenses for ISS, PIS and COFINS and Other |
(4,706 | ) | (1,400 | ) | (739 | ) | (6,845 | ) | 226 | (6,619 | ) | |||||||||||||
| Share of profit or (loss) in associates and joint ventures |
0 | 0 | 0 | 0 | 747 | 747 | ||||||||||||||||||
| Net income before income tax and social contribution |
18,494 | 12,564 | 9,176 | 40,234 | (9,626 | ) | 30,608 | |||||||||||||||||
| Income tax and social contribution |
(6,939 | ) | (3,829 | ) | (2,964 | ) | (13,732 | ) | 8,763 | (4,969 | ) | |||||||||||||
| Non-controlling interest in subsidiaries |
(184 | ) | (550 | ) | (35 | ) | (769 | ) | 37 | (732 | ) | |||||||||||||
| Net income |
11,371 | 8,185 | 6,177 | 25,733 | (826 | ) | 24,907 | |||||||||||||||||
|
|
|
|
|
|
|
|
|
|
|
|
|
|||||||||||||
| Total assets (*) - 12/31/2018 |
1,042,145 | 655,393 | 142,853 | 1,649,613 | (96,816 | ) | 1,552,797 | |||||||||||||||||
|
|
|
|
|
|
|
|
|
|
|
|
|
|||||||||||||
| Total liabilities - 12/31/2018 |
1,005,194 | 597,528 | 93,546 | 1,505,490 | (103,159 | ) | 1,402,331 | |||||||||||||||||
|
|
|
|
|
|
|
|
|
|
|
|
|
|||||||||||||
| (*) Includes: |
||||||||||||||||||||||||
| Investments in associates and joint ventures |
1,220 | 0 | 11,438 | 12,658 | (639 | ) | 12,019 | |||||||||||||||||
| Fixed assets, net |
5,526 | 879 | 0 | 6,405 | 897 | 7,302 | ||||||||||||||||||
| Goodwill and Intangible assets, net |
6,845 | 8,178 | 0 | 15,023 | 4,306 | 19,329 | ||||||||||||||||||
| (1) | Includes interest and similar income and expenses of R$ 62,565, net gains (loss) on investment securities and derivatives of R$ (4,834) and results from foreign exchange operations and exchange variation of transactions abroad of R$ 2,974. |
| (2) | Refers to general and administrative expenses including depreciation and amortization expenses of R$ (3,332). |
| (3) | The IFRS consolidated figures do not represent the sum of the segments because there are intercompany transactions that were eliminated only in the consolidated financial statements. Segments are assessed by top management, net of income and expenses between related parties. |
F-124
Table of Contents
ITAÚ UNIBANCO HOLDING S.A.
Notes to the Consolidated Financial Statements
At 12/31/2018, 12/31/2017 and 01/01/2017 for balance sheet accounts and
From 01/01 to 12/31 of 2018, 2017 and 2016 for income statement accounts
(In millions of Reais, except information per share)
ITAÚ UNIBANCO HOLDING S.A.
From January 1 to December 31, 2017
| Retail Banking |
Wholesale Banking |
Actitivities with the Market + Corporation |
ITAÚ UNIBANCO |
Adjustments | IFRS consolidated (3) |
|||||||||||||||||||
| Banking product |
69,921 | 28,748 | 10,623 | 109,292 | 2,231 | 111,523 | ||||||||||||||||||
| Interest margin (1) |
38,570 | 19,426 | 10,515 | 68,511 | 2,731 | 71,242 | ||||||||||||||||||
| Banking service fees |
24,096 | 8,876 | 42 | 33,014 | 1,434 | 34,448 | ||||||||||||||||||
| Income related to insurance and private pension operations before claim and selling expenses |
7,255 | 446 | 66 | 7,767 | (3,068 | ) | 4,699 | |||||||||||||||||
| Other income |
— | — | — | — | 1,134 | 1,134 | ||||||||||||||||||
| Cost of Credit |
(12,166 | ) | (5,829 | ) | (6 | ) | (18,001 | ) | (1,773 | ) | (19,774 | ) | ||||||||||||
| Claims |
(1,222 | ) | (53 | ) | — | (1,275 | ) | 83 | (1,192 | ) | ||||||||||||||
| Operating margin |
56,533 | 22,866 | 10,617 | 90,016 | 541 | 90,557 | ||||||||||||||||||
| Other operating income (expenses) |
(37,601 | ) | (14,523 | ) | (1,647 | ) | (53,771 | ) | (6,204 | ) | (59,975 | ) | ||||||||||||
| Non-interest expenses (2) |
(33,186 | ) | (13,265 | ) | (831 | ) | (47,282 | ) | (6,212 | ) | (53,494 | ) | ||||||||||||
| Tax expenses for ISS, PIS and COFINS and Other |
(4,415 | ) | (1,258 | ) | (816 | ) | (6,489 | ) | (542 | ) | (7,031 | ) | ||||||||||||
| Share of profit or (loss) in associates and joint ventures |
— | — | — | — | 550 | 550 | ||||||||||||||||||
| Net income before income tax and social contribution |
18,932 | 8,343 | 8,970 | 36,245 | (5,663 | ) | 30,582 | |||||||||||||||||
| Income tax and social contribution |
(7,107 | ) | (2,412 | ) | (1,775 | ) | (11,294 | ) | 3,937 | (7,357 | ) | |||||||||||||
| Non-controlling interest in subsidiaries |
(166 | ) | 117 | (23 | ) | (72 | ) | 40 | (32 | ) | ||||||||||||||
| Net income |
11,659 | 6,048 | 7,172 | 24,879 | (1,686 | ) | 23,193 | |||||||||||||||||
|
|
|
|
|
|
|
|
|
|
|
|
|
|||||||||||||
| Total assets (*) - 12/31/2017 |
970,137 | 604,384 | 119,309 | 1,503,503 | (67,264 | ) | 1,436,239 | |||||||||||||||||
|
|
|
|
|
|
|
|
|
|
|
|
|
|||||||||||||
| Total liabilities - 12/31/2017 |
934,835 | 548,185 | 71,873 | 1,364,566 | (72,683 | ) | 1,291,883 | |||||||||||||||||
|
|
|
|
|
|
|
|
|
|
|
|
|
|||||||||||||
| (*) Includes: |
||||||||||||||||||||||||
| Investments in associates and joint ventures |
1,168 | — | 3,986 | 5,154 | (99 | ) | 5,055 | |||||||||||||||||
| Fixed assets, net |
5,105 | 1,290 | — | 6,395 | 964 | 7,359 | ||||||||||||||||||
| Goodwill and Intangible assets, net |
8,739 | 7,694 | — | 16,433 | 2,950 | 19,383 | ||||||||||||||||||
| (1) | Includes interest and similar income and expenses of R$ 67,311, net gains (loss) on investment securities and derivatives of R$ 4,181 and results from foreign exchange operations and exchange variation of transactions abroad of R$ (250). |
| (2) | Refers to general and administrative expenses including depreciation and amortization expenses of R$ (3,034). |
| (3) | The IFRS Consolidated figures do not represent the sum of the segments because there are intercompany transactions that were eliminated only in the consolidated financial statements. Segments are assessed by top management, net of income and expenses between related parties. |
F-125
Table of Contents
ITAÚ UNIBANCO HOLDING S.A.
Notes to the Consolidated Financial Statements
At 12/31/2018, 12/31/2017 and 01/01/2017 for balance sheet accounts and
From 01/01 to 12/31 of 2018, 2017 and 2016 for income statement accounts
(In millions of Reais, except information per share)
ITAÚ UNIBANCO HOLDING S.A.
From January 1 to December 31, 2016
| Retail Banking |
Wholesale Banking |
Actitivities with the Market + Corporation |
ITAÚ UNIBANCO |
Adjustments | IFRS consolidated (3) |
|||||||||||||||||||
| Banking product |
70,496 | 30,498 | 9,412 | 110,406 | 8,016 | 118,422 | ||||||||||||||||||
| Interest margin (1) |
40,073 | 21,929 | 9,264 | 71,266 | 8,589 | 79,855 | ||||||||||||||||||
| Banking service fees |
22,659 | 8,072 | 59 | 30,790 | 1,128 | 31,918 | ||||||||||||||||||
| Income related to insurance and private pension operations before claim and selling expenses |
7,764 | 497 | 89 | 8,350 | (3,085 | ) | 5,265 | |||||||||||||||||
| Other income |
— | — | — | — | 1,384 | 1,384 | ||||||||||||||||||
| Cost of Credit |
(14,394 | ) | (10,586 | ) | 71 | (24,909 | ) | 2,039 | (22,870 | ) | ||||||||||||||
| Claims |
(1,426 | ) | (59 | ) | — | (1,485 | ) | — | (1,485 | ) | ||||||||||||||
| Operating margin |
54,676 | 19,853 | 9,483 | 84,012 | 10,055 | 94,067 | ||||||||||||||||||
| Other operating income (expenses) |
(37,202 | ) | (13,410 | ) | (2,387 | ) | (52,999 | ) | (5,389 | ) | (58,388 | ) | ||||||||||||
| Non-interest expenses (2) |
(32,883 | ) | (12,034 | ) | (1,616 | ) | (46,533 | ) | (4,372 | ) | (50,905 | ) | ||||||||||||
| Tax expenses for ISS, PIS and COFINS and Other |
(4,319 | ) | (1,376 | ) | (771 | ) | (6,466 | ) | (1,545 | ) | (8,011 | ) | ||||||||||||
| Share of profit or (loss) in associates and joint ventures |
— | — | — | — | 528 | 528 | ||||||||||||||||||
| Net income before income tax and social contribution |
17,474 | 6,443 | 7,096 | 31,013 | 4,666 | 35,679 | ||||||||||||||||||
| Income tax and social contribution |
(6,328 | ) | (1,081 | ) | (1,237 | ) | (8,646 | ) | (5,017 | ) | (13,663 | ) | ||||||||||||
| Non-controlling interest in subsidiaries |
(223 | ) | 79 | (1 | ) | (145 | ) | (244 | ) | (389 | ) | |||||||||||||
| Net income |
10,923 | 5,441 | 5,858 | 22,222 | (595 | ) | 21,627 | |||||||||||||||||
|
|
|
|
|
|
|
|
|
|
|
|
|
|||||||||||||
| Total assets (*) - 01/01/2017 |
909,779 | 585,088 | 116,401 | 1,427,084 | (75,770 | ) | 1,351,314 | |||||||||||||||||
|
|
|
|
|
|
|
|
|
|
|
|
|
|||||||||||||
| Total liabilities - 01/01/2017 |
877,792 | 525,390 | 80,810 | 1,299,869 | (80,939 | ) | 1,218,930 | |||||||||||||||||
|
|
|
|
|
|
|
|
|
|
|
|
|
|||||||||||||
| (*) Includes: |
||||||||||||||||||||||||
| Investments in associates and joint ventures |
1,325 | — | 3,106 | 4,431 | 642 | 5,073 | ||||||||||||||||||
| Fixed assets, net |
5,635 | 1,177 | — | 6,812 | 1,230 | 8,042 | ||||||||||||||||||
| Goodwill and Intangible assets, net |
7,957 | 7,276 | — | 15,233 | 1,823 | 17,056 | ||||||||||||||||||
| (1) | Includes net interest and similar income and expenses of R$ 67,276, net gain (loss) on investment securities and derivatives of R$ 7,066 and foreign exchange results and exchange variation on transactions of abroad R$ 5,513. |
| (2) | Refers to general and administrative expenses including depreciation and amortization expenses of R$ (2,995). |
| (3) | The IFRS Consolidated figures do not represent the sum of the segments because there are intercompany transactions that were eliminated only in the consolidated financial statements. Segments are assessed by top management, net of income and expenses between related parties. |
F-126
Table of Contents
ITAÚ UNIBANCO HOLDING S.A.
Notes to the Consolidated Financial Statements
At 12/31/2018, 12/31/2017 and 01/01/2017 for balance sheet accounts and
From 01/01 to 12/31 of 2018, 2017 and 2016 for income statement accounts
(In millions of Reais, except information per share)
| c) | Result of Non-Current Assets and Main Services and Products by Geographic Region |
| 12/31/2018 | 12/31/2017 | 1/1/2017 | ||||||||||||||||||||||||||||||||||
| Brazil | Abroad | Total | Brazil | Abroad | Total | Brazil | Abroad | Total | ||||||||||||||||||||||||||||
| Non-current assets |
22,991 | 3,640 | 26,631 | 23,411 | 3,331 | 26,742 | 22,974 | 2,124 | 25,098 | |||||||||||||||||||||||||||
| 01/01 to 12/31/2018 | 01/01 to 12/31/2017 | 01/01 to 12/31/2016 | ||||||||||||||||||||||||||||||||||
| Brazil | Abroad | Total | Brazil | Abroad | Total | Brazil | Abroad | Total | ||||||||||||||||||||||||||||
| Income related to financial operations (1) (2) |
108,362 | 22,955 | 131,317 | 131,689 | 17,883 | 149,572 | 155,030 | 19,954 | 174,984 | |||||||||||||||||||||||||||
| Income related to insurance and private pension operations before claim and selling expenses |
3,812 | 149 | 3,961 | 4,551 | 148 | 4,699 | 5,133 | 132 | 5,265 | |||||||||||||||||||||||||||
| Banking service fees |
33,211 | 3,598 | 36,809 | 31,296 | 3,152 | 34,448 | 29,061 | 2,857 | 31,918 | |||||||||||||||||||||||||||
| (1) | Includes interest and similar income, dividend income, net gain (loss) on investment securities and derivatives, foreign exchange results, and exchange variation on transactions. |
| (2) | ITAÚ UNIBANCO HOLDING does not have clients representing 10% or higher of its revenues. |
Note 31 – Related parties
Transactions between related parties are carried out at amounts, terms and average rates in accordance with normal market practices during the period, as well as under reciprocal conditions.
Transactions between companies and investment funds, included in consolidation (note 2.b), were eliminated and do not have effects on the consolidated statements.
The main unconsolidated related parties are as follows:
| • | Itaú Unibanco Participações S.A. (IUPAR), Companhia E.Johnston de Participações S.A. (shareholder of IUPAR) and ITAÚSA, direct and indirect shareholders of ITAÚ UNIBANCO HOLDING; |
| • | The non-financial subsidiaries and joint ventures of ITAÚSA, specially: Itautec S.A., Duratex S.A., Itaúsa Empreendimentos S.A. and Alpargatas S.A.; |
| • | Investments in associates and joint ventures, and the main ones are: Porto Seguro Itaú Unibanco Participações S.A., BSF Holding S.A., IRB-Brasil Resseguros S.A. and XP Investimentos S.A.; |
| • | Fundação Itaú Unibanco - Previdência Complementar and FUNBEP – Fundo de Pensão Multipatrocinado, closed-end supplementary pension entities, that administer retirement plans sponsored by ITAÚ UNIBANCO HOLDING, created exclusively for employees; |
| • | Foundations and Institutes maintained by ITAÚ UNIBANCO HOLDING’s donations and by the proceedings generated by its assets to accomplish its purposed, as well as to maintain the operational and administrative structure: |
Fundação Itaú Social – manages the “Itaú Social Program”, which aims at coordinating the organization’s role in projects of interest to the community by supporting or developing social, scientific and cultural projects, mainly in the elementary education and health areas and supports projects or initiatives in progress, supported or sponsored by entities qualified to work in the ”Programa Itaú Social” (Itaú Social Program).
Instituto Itaú Cultural – promotes and disseminates Brazilian culture in the country and abroad.
Instituto Unibanco – supports projects focused on social assistance, particularly education, culture, promotion of integration to labor market, and environmental protection, on a direct and/or supplementary basis, through the civil society’s institutions.
Instituto Unibanco de Cinema – promotes culture in general and provides access of low-income population to cinematography, videography and similar productions, for which it should maintain movie theaters and movie clubs owned or managed by itself, and theaters to screen films, videos, video-laser discs and other related activities, as well as to screen and divulge movies in general, especially those produced in Brazil.
F-127
Table of Contents
ITAÚ UNIBANCO HOLDING S.A.
Notes to the Consolidated Financial Statements
At 12/31/2018, 12/31/2017 and 01/01/2017 for balance sheet accounts and
From 01/01 to 12/31 of 2018, 2017 and 2016 for income statement accounts
(In millions of Reais, except information per share)
Associação Itaú Viver Mais – provides social services for the welfare of beneficiaries, in the way and under conditions established by its Internal Rules, and according to the funds available. These services may include, among others, the promotion of cultural, educational, sports, entertainment and health care activities.
| • | Associação Cubo Coworking Itaú – partner entity of ITAÚ UNIBANCO HOLDING which purpose is to encourage and promote: discussions, the development of alternative and innovative technologies, business models and solutions; the production and dissemination of the resulting technical and scientific knowledge; the attraction and gathering of new information technology talents that may be characterized as startups; research, development and establishment of ecosystems for entrepreneurship and startups. |
| a) | Transactions with related parties: |
| ITAÚ UNIBANCO HOLDING |
||||||||||||||||||||||
| Annual rate |
Assets / (Liabilities) | Revenue / (Expenses) | ||||||||||||||||||||
| 12/31/2018 | 12/31/2017 | 01/01 to 12/31/2018 |
01/01 to 12/31/2017 |
01/01 to 12/31/2016 |
||||||||||||||||||
| Loan operations |
144 | 96 | 187 | 6 | — | |||||||||||||||||
| Alpargatas S.A. |
2.5% to 6% / SELIC + 2.35% / CDI + 3.15% | 49 | 96 | 3 | 6 | — | ||||||||||||||||
| Other |
113% of CDI | 95 | — | 184 | — | — | ||||||||||||||||
| Derivative financial instruments - assets and liabilities |
— | — | (138 | ) | — | — | ||||||||||||||||
| Other |
— | — | (138 | ) | — | — | ||||||||||||||||
| Deposits |
(70 | ) | — | (9 | ) | — | — | |||||||||||||||
| Other |
75% to 96% of CDI | (70 | ) | — | (9 | ) | — | — | ||||||||||||||
| Securities sold under repurchase agreements |
(29 | ) | (48 | ) | (3 | ) | (5 | ) | (19 | ) | ||||||||||||
| Duratex S.A. |
95% to 97.5% of CDI | (19 | ) | (22 | ) | (1 | ) | (2 | ) | (4 | ) | |||||||||||
| Other |
50.01% to 100.15% of CDI | (10 | ) | (26 | ) | (2 | ) | (3 | ) | (15 | ) | |||||||||||
| Amounts receivable from (payable to) related companies / Banking service fees (expenses) |
(92 | ) | (108 | ) | 46 | 39 | 28 | |||||||||||||||
| Olimpia Promoção e Serviços S.A. |
(3 | ) | (2 | ) | (25 | ) | (23 | ) | (25 | ) | ||||||||||||
| Fundação Itaú Unibanco - Previdência Complementar |
(98 | ) | (106 | ) | 51 | 47 | 44 | |||||||||||||||
| Other |
9 | — | 20 | 15 | 9 | |||||||||||||||||
| Rental revenues (expenses) |
— | — | (46 | ) | (62 | ) | (59 | ) | ||||||||||||||
| Fundação Itaú Unibanco - Previdência Complementar |
— | — | (36 | ) | (49 | ) | (44 | ) | ||||||||||||||
| FUNBEP - Fundo de Pensão Multipatrocinado |
— | — | (7 | ) | (11 | ) | (13 | ) | ||||||||||||||
| Other |
— | — | (3 | ) | (2 | ) | (2 | ) | ||||||||||||||
| Sponsorship expenses |
— | — | (31 | ) | (10 | ) | (6 | ) | ||||||||||||||
| Associação Cubo Coworking Itaú |
— | — | (31 | ) | (10 | ) | (6 | ) | ||||||||||||||
| Donation expenses |
— | — | (96 | ) | (94 | ) | (88 | ) | ||||||||||||||
| Instituto Itaú Cultural |
— | — | (95 | ) | (93 | ) | (87 | ) | ||||||||||||||
| Associação Itaú Viver Mais |
— | — | (1 | ) | (1 | ) | (1 | ) | ||||||||||||||
F-128
Table of Contents
ITAÚ UNIBANCO HOLDING S.A.
Notes to the Consolidated Financial Statements
At 12/31/2018, 12/31/2017 and 01/01/2017 for balance sheet accounts and
From 01/01 to 12/31 of 2018, 2017 and 2016 for income statement accounts
(In millions of Reais, except information per share)
| b) | Compensation and Benefits of Key Management Personnel |
Compensation and benefits attributed to Management Members, members of the Audit Committee and the Board of Directors of ITAÚ UNIBANCO HOLDING in the period correspond to:
| 01/01 to 12/31/2018 |
01/01 to 12/31/2017 |
01/01 to 12/31/2016 |
||||||||||
| Fees |
(481 | ) | (426 | ) | (360 | ) | ||||||
| Profit sharing |
(258 | ) | (244 | ) | (251 | ) | ||||||
| Post-employment benefits |
(9 | ) | (9 | ) | (12 | ) | ||||||
| Granting of the Share-based payment |
(212 | ) | (220 | ) | (263 | ) | ||||||
|
|
|
|
|
|
|
|||||||
| Total |
(960 | ) | (899 | ) | (886 | ) | ||||||
|
|
|
|
|
|
|
|||||||
Total amounts related to stock-based compensation plan, personnel expenses and post-employment benefits is detailed in Notes 20, 23 and 26, respectively.
Note 32 – Risk and Capital Management
| a) | Corporate Governance |
ITAÚ UNIBANCO HOLDING invests in sound processes for risk and capital management that permeates the whole institution and are the basis of all strategic decisions to ensure business sustainability.
These processes are aligned with the guidelines of the Board of Directors and Executives that, through corporate bodies, define the global objectives that are measured as goals and limits to the risk management units. Control and capital management units, in turn, support the ITAÚ UNIBANCO HOLDING management by monitoring and analyzing risk and capital.
The Board of Directors is the main body responsible for establishing guidelines, policies, and approval levels for risk and capital management. The Capital and Risk Management Committee (CGRC), in turn, is responsible for supporting the Board of Directors in the performance of its assignments related to capital and risk management. In the executive level, collegiate bodies, presided over by the Chief Executive Officer (CEO) of ITAÚ UNIBANCO HOLDING, are responsible for capital and risk management and which decisions are monitored in the scope of CGRC.
Additionally, the institution has panels collegiate bodies, which exercise the responsibilities delegated in capital and risk management, presided over by the Executive Vice-President of the Risk and Finance Department (ARF). To support this structure, ARF has specialized executive boards to ensure, on an independent and centralized basis, that the institution’s risks and capital are managed in compliance with policies and procedures established.
| b) | Risk Management |
Risk Appetite
The risk appetite of ITAÚ UNIBANCO HOLDING is based on the Board of Director’s statement:
“We are a universal bank, operating mainly in Latin America. Supported by our risk culture, we act with strict ethical standard and regulatory compliance, in search for high and increasing results, with low volatility, through long-lasting relationship with the client, correct risk pricing, pulverized funding and proper use of capital.”
Based on this statement, five dimensions have been established, each dimension is made up of a set of metrics associated with the main risks involved, combining supplementary measurement methods, in search for a comprehensive vision of our exposures.
The Board of Directors is responsible for approving guidelines and limits for risk appetite, exercising its activities with the support of CGRC and CRO - Chief Risk Officer.
F-129
Table of Contents
ITAÚ UNIBANCO HOLDING S.A.
Notes to the Consolidated Financial Statements
At 12/31/2018, 12/31/2017 and 01/01/2017 for balance sheet accounts and
From 01/01 to 12/31 of 2018, 2017 and 2016 for income statement accounts
(In millions of Reais, except information per share)
The limits for risk appetite are frequently monitored and reported to risk committees and to the Board of Directors, which will guide the preventive measures to be taken to ensure that exposures are aligned with the strategies of ITAÚ UNIBANCO HOLDING.
The five dimensions of risk appetite are:
| • | Capitalization: establishes that ITAÚ UNIBANCO HOLDING must have capital sufficient to face any serious recession period or a stress event without the need to adjust its capital structure under unfavorable circumstances. It is monitored through the follow-up of ITAÚ UNIBANCO HOLDING’s capital ratios, both in normal and stress scenarios, and of the ratings of the institution’s debt issues. |
| • | Liquidity: establishes that the liquidity of ITAÚ UNIBANCO HOLDING must withstand long stress periods. It is monitored through the follow-up of liquidity ratios. |
| • | Composition of results: defines that business will be focused primarily in Latin America, where ITAÚ UNIBANCO HOLDING has a diversified base of clients and products, with low appetite for volatility of results and high risks. This dimension comprises aspects related to business and profitability, and market and credit risks. By adopting exposure concentration limits, such as industry sectors, counterparty quality, countries and geographical regions and risk factors, these monitored metrics seek to ensure the proper composition of portfolios, aimed at the low volatility of results and business sustainability. |
| • | Operational risk: focuses on the control of operational risk events that may adversely impact the operation and business strategy, and is carried out by monitoring the main operational risk events and incurred losses. |
| • | Reputation: addresses risks that may impact the institution’s brand value and reputation with clients, employees, regulatory bodies, investors and the general public. The risk monitoring in this dimension is carried out by the follow-up of client satisfaction and dissatisfaction and media exposure, in addition to monitoring the institution’s conduct. |
Substantiation for risk appetite, risk management and guidelines for activities of employees of ITAÚ UNIBANCO HOLDING the day-to-day for decision-making purposes are as follows:
Sustainability and client satisfaction: ITAÚ UNIBANCO HOLDING vision is to be the leading bank in sustainable performance and client satisfaction and, therefore, it is committed to creating shared value to employees, clients, stockholders, and society, ensuring the continuity of business. ITAÚ UNIBANCO HOLDING is committed to do business that is good both for the client and the institution itself;
| • | Risk Culture: ITAÚ UNIBANCO HOLDING’s risk culture goes beyond policies, procedures or processes, as it strengthens the individual and collective responsibility of all employees so they do the right thing at the right moment and on the proper way, by respecting the ethical way of doing business; |
| • | Risk pricing: ITAÚ UNIBANCO HOLDING’s acts and assumes risks in business it knows and understands, avoiding risks that are unknown to the institution or that do not have a competitive edge, therefore carefully assessing the risk-return ratio; |
| • | Diversification: ITAÚ UNIBANCO HOLDING has low appetite to volatility in results and, therefore, it operates with a diversified base of clients, products and business, seeking to diversify risks and giving priority to lower risk business. |
| • | Operational excellence: It is the wish of ITAÚ UNIBANCO HOLDING to be an agile bank, with a robust and stable infrastructure to offer top services; |
| • | Ethics and respect for regulation: for ITAÚ UNIBANCO HOLDING, ethics is non-negotiable, and, therefore, the institute promotes an institutional environment that has integrity, guiding employees to cultivate ethics in relationships and business, and the respect for rules, as it cultivates the care for the institution’s reputation; |
ITAÚ UNIBANCO HOLDING adopts several initiatives to disseminate risk culture, based on four principles: conscious risk-taking, discussion of the risks the institution faces, the corresponding action taken, and the responsibility of everyone to manage risks.
These principles lay down the basis for ITAÚ UNIBANCO HOLDING guidelines by helping employees to consciously understand, identify, measure, manage and mitigate risks.
F-130
Table of Contents
ITAÚ UNIBANCO HOLDING S.A.
Notes to the Consolidated Financial Statements
At 12/31/2018, 12/31/2017 and 01/01/2017 for balance sheet accounts and
From 01/01 to 12/31 of 2018, 2017 and 2016 for income statement accounts
(In millions of Reais, except information per share)
| 1. | Credit risk |
Possibility of losses arising from the breach by the borrower, issuer or counterparty of the respective agreed-upon financial obligations, the devaluation of loan agreement due to downgrading of the borrower’s, the issuer’s, the counterparty’s risk rating, the reduction in gains or compensation, the advantages given upon posterior renegotiation and the recovery costs.
There is a credit risk control and management structure, centralized and independent from the business units, that provides for operational limits and risk mitigating mechanisms, in addition to establishing processes and tools to measure, monitor and control the credit risk inherent in all products, portfolio concentrations and impacts of potential changes in the economic environment.
The credit policy of ITAÚ UNIBANCO HOLDING is based on internal criteria such as: classification of clients, performance and portfolio evolution, default levels, return rate and economic capital allocated, among other external factors, such as interest rates, market default indicators, inflation, consumption variation, among others.
For individual, small and middle-market companies, credit rating is attributed based on application statistical models (in the early phases of relationship with the client) and behavior score (used for clients with which ITAÚ UNIBANCO HOLDING already has a relationship).
For large companies, the rating is based on information such as economic and financial condition of the counterparty, their cash-generating capability, the economic group to which they belong, and the current and prospective situation of the economic sector in which they operate. The credit proposals are analyzed on a case by case basis, through an approval-level mechanism.
In compliance with CMN Resolution 4,557, of February 23, 2017, the document “Public Access Report – Credit Risk“, which includes the guidelines established by the institutional credit risk control policy can be viewed at www.itau.com.br/investor-relations, under Corporate Governance, Regulations and Policies.
ITAÚ UNIBANCO HOLDING strictly controls the credit exposure of clients and counterparties, taking action to address situations in which the actual exposure exceeds the desired one. For this purpose, contractually provided actions can be taken, such as early settlement or requirement of additional collateral.
| 1.1 | Collateral and policies for mitigating credit risk |
ITAÚ UNIBANCO HOLDING uses guarantees to increase its capacity for recovery in operations exposed to credit risk. The guarantees may be personal, secured, legal structures with mitigating power and offset agreements.
For collateral to be considered instruments that mitigate credit risk, they must comply with the requirements and standards that regulate them, be them internal or external ones, be legally valid (effective), enforceable, and assessed on a regular basis.
ITAÚ UNIBANCO HOLDING also uses credit derivatives, to mitigate credit risk of its portfolios of loans and securities. These instruments are priced based on models that use the fair value of market inputs, such as credit spreads, recovery rates, correlations and interest rates.
F-131
Table of Contents
ITAÚ UNIBANCO HOLDING S.A.
Notes to the Consolidated Financial Statements
At 12/31/2018, 12/31/2017 and 01/01/2017 for balance sheet accounts and
From 01/01 to 12/31 of 2018, 2017 and 2016 for income statement accounts
(In millions of Reais, except information per share)
| 1.2 | Policy on the provision and Economic scenarios |
Both the credit risk and the finance areas are responsible for defining the methodologies used to measure the allowance for loan losses and for assessing changes in the provision amounts on a recurring basis.
These areas monitor the trends observed in expected credit loss by segment level, in addition to establishing an initial understanding of the variables that may trigger changes in the allowance for loan losses, the probability of default or the loss given default.
Once the trends have been identified and an initial assessment of the variables has been made at the corporate level, the business areas are responsible for further analyzing these observed trends at a detailed level and for each portfolio, in order to understand the underlying reasons for the trends observed and for deciding whether changes are required in the credit policies.
The provisions for expected losses are recognized considering the expected risk linked to contracts with similar characteristics and in anticipation of impairment signs, considering a loss horizon adequate to the remaining period of the contract termination. For contracts of products with no determined termination date, average results of impairment and default are used to determine the loss horizon.
Additionally, information on economic scenarios and public information with internally developed information are used to determine and affect the expected credit loss, adjusting loss levels to expected macroeconomic realities.
| 1.3 | Classification of Stages of Credit Impairment |
ITAÚ UNIBANCO HOLDING considers clients’ internal information, statistic models, days of default, and quantitative analysis in order to determine the credit status of portfolio agreements.
Rules for change of stage consider lower and higher internal ratings (quantitative criteria), in addition to a relative variation of ratings since the initial recognition. Information on days of delay, used on an absolute basis, is an important factor for the classification of stages, and after a certain credit status of the agreement is determined, the classification in one of the three stages of credit deterioration is established. Based on this classification, rules for measurement of expected credit loss determined for each stage are used, as described in Note 2.4e.
For Retail and middle business portfolios, ITAÚ UNIBANCO HOLDING classifies loan agreements which are over 30 days overdue in stage 2, except payroll loans for public bodies, which recognition is carried out after 45 overdue, due to the payment dynamics for product onlending.
For the Wholesale business portfolio, information on delay is considered in the rating assessment.
Default parameters are: 90 days with no payment record(*); debt restructuring; adjudication of bankruptcy; loss; and court-ordered reorganization.
| (*) | For mortgage loan portfolio, 180 days without payment record are considered. |
F-132
Table of Contents
ITAÚ UNIBANCO HOLDING S.A.
Notes to the Consolidated Financial Statements
At 12/31/2018, 12/31/2017 and 01/01/2017 for balance sheet accounts and
From 01/01 to 12/31 of 2018, 2017 and 2016 for income statement accounts
(In millions of Reais, except information per share)
1.4 Maximum Exposure of Financial Assets to Credit Risk
| 12/31/2018 | 12/31/2017 | |||||||||||||||||||||||
| Brazil | Abroad | Total | Brazil | Abroad | Total | |||||||||||||||||||
| Financial Assets |
1,027,193 | 303,535 | 1,330,728 | 967,703 | 263,711 | 1,231,414 | ||||||||||||||||||
| At Amortized Cost |
756,993 | 237,766 | 994,759 | 702,672 | 203,057 | 905,729 | ||||||||||||||||||
| Interbank deposits |
6,239 | 20,181 | 26,420 | 6,367 | 22,681 | 29,048 | ||||||||||||||||||
| Securities purchased under agreements to resell |
279,353 | 783 | 280,136 | 243,917 | 790 | 244,707 | ||||||||||||||||||
| Securities |
90,234 | 20,161 | 110,395 | 101,365 | 10,059 | 111,424 | ||||||||||||||||||
| Loan operations and lease operations (*) |
345,501 | 190,590 | 536,091 | 327,501 | 170,218 | 497,719 | ||||||||||||||||||
| Other financial assets |
61,875 | 13,215 | 75,090 | 53,787 | 5,781 | 59,568 | ||||||||||||||||||
| (-) Provision for Expected Loss |
(26,209 | ) | (7,164 | ) | (33,373 | ) | (30,265 | ) | (6,472 | ) | (36,737 | ) | ||||||||||||
| At Fair Value Through Other Comprehensive Income |
9,089 | 40,234 | 49,323 | 14,722 | 37,427 | 52,149 | ||||||||||||||||||
| Securities |
9,089 | 40,234 | 49,323 | 14,722 | 37,427 | 52,149 | ||||||||||||||||||
| At Fair Value Through Profit or Loss |
261,111 | 25,535 | 286,646 | 250,309 | 23,227 | 273,536 | ||||||||||||||||||
| Securities |
252,819 | 10,361 | 263,180 | 238,200 | 12,493 | 250,693 | ||||||||||||||||||
| Derivatives |
8,292 | 15,174 | 23,466 | 12,109 | 10,734 | 22,843 | ||||||||||||||||||
| Financial liabilities - provision for expected loss |
3,355 | 437 | 3,792 | 4,513 | 409 | 4,922 | ||||||||||||||||||
| Loan Commitments |
2,289 | 312 | 2,601 | 2,681 | 334 | 3,015 | ||||||||||||||||||
| Financial Guarantees |
1,066 | 125 | 1,191 | 1,832 | 75 | 1,907 | ||||||||||||||||||
| Off balance sheet |
300,522 | 49,173 | 349,695 | 280,032 | 43,797 | 323,829 | ||||||||||||||||||
| Financial Guarantees |
53,443 | 12,662 | 66,105 | 60,062 | 10,427 | 70,489 | ||||||||||||||||||
| Letters of credit to be released |
10,747 | 0 | 10,747 | 9,214 | — | 9,214 | ||||||||||||||||||
| Loan commitments |
236,332 | 36,511 | 272,843 | 210,756 | 33,370 | 244,126 | ||||||||||||||||||
| Mortgage loans |
3,403 | 0 | 3,403 | 3,218 | — | 3,218 | ||||||||||||||||||
| Overdraft accounts |
110,454 | 0 | 110,454 | 93,284 | — | 93,284 | ||||||||||||||||||
| Credit cards |
120,862 | 2,961 | 123,823 | 109,196 | 2,679 | 111,875 | ||||||||||||||||||
| Other pre-approved limits |
1,613 | 33,550 | 35,163 | 5,058 | 30,691 | 35,749 | ||||||||||||||||||
|
|
|
|
|
|
|
|
|
|
|
|
|
|||||||||||||
| Total |
1,324,360 | 352,271 | 1,676,631 | 1,243,222 | 307,099 | 1,550,321 | ||||||||||||||||||
|
|
|
|
|
|
|
|
|
|
|
|
|
|||||||||||||
| (*) | In the composition of balance there are operations designated at Fair Value Through Profit or Loss, in the amount of R$ 102 at 12/31/2017. |
Amounts exposed to credit risk presented are based on gross book value and do not consider any collateral received or other added credit improvements.
The contractual amounts of financial collaterals and credit cards represent the maximum potential of credit risk in the event the counterparty does not meet the terms of the agreement. The vast majority of loan commitments (mortgage loans, overdraft accounts and other pre-approved limits) mature without being drawn, since they are renewed monthly and they may be cancelled unilaterally.
As a result, the total contractual amount does not represent our effective future exposure to credit risk or the liquidity needs arising from such commitments.
| 1.4.1. | By business sector |
Loan Operations and Lease Operations
| 12/31/2018 | % | 12/31/2017 | % | |||||||||||||
| Industry and commerce |
115,225 | 21.5 | 107,201 | 21.5 | ||||||||||||
| Services |
118,435 | 22.1 | 114,332 | 23.0 | ||||||||||||
| Other sectors |
30,440 | 5.7 | 29,047 | 5.8 | ||||||||||||
| Individuals |
271,991 | 50.7 | 247,139 | 49.7 | ||||||||||||
|
|
|
|
|
|
|
|
|
|||||||||
| Total |
536,091 | 100.0 | 497,719 | 100.0 | ||||||||||||
|
|
|
|
|
|
|
|
|
|||||||||
F-133
Table of Contents
ITAÚ UNIBANCO HOLDING S.A.
Notes to the Consolidated Financial Statements
At 12/31/2018, 12/31/2017 and 01/01/2017 for balance sheet accounts and
From 01/01 to 12/31 of 2018, 2017 and 2016 for income statement accounts
(In millions of Reais, except information per share)
Other financial assets (*)
| 12/31/2018 | % | 12/31/2017 | % | |||||||||||||
| Public sector |
330,730 | 43.9 | 327,932 | 46.5 | ||||||||||||
| Services |
92,562 | 12.3 | 84,191 | 11.9 | ||||||||||||
| Other sectors |
23,072 | 3.1 | 19,804 | 2.8 | ||||||||||||
| Financial |
306,556 | 40.7 | 273,747 | 38.8 | ||||||||||||
|
|
|
|
|
|
|
|
|
|||||||||
| Total |
752,920 | 100.0 | 705,674 | 100.0 | ||||||||||||
|
|
|
|
|
|
|
|
|
|||||||||
| (*) | Includes Financial Assets at Fair Value through Profit and Loss, Financial Assets at Fair Value through Other Comprehensive Income and Financial Assets at Amortized Cost, except for loan and finance lease operations. |
The exposure of Off Balance financial instruments (Financial Collaterals and Loan Commitments) are neither categorized nor managed by business sector.
| 1.4.2 | By type and classification of credit risk |
Operations and lease operations
| 12/31/2018 | ||||||||||||||||||||||||||||||||||||||||||||||||||||||||||||||||||||||||||||||||
| Stage 1 | Stage 2 | Stage 3 | Total Consolidated of 3 stages | |||||||||||||||||||||||||||||||||||||||||||||||||||||||||||||||||||||||||||||
| Loan Operations |
Loan commitments |
Financial Guarantees |
Total | Loan Operations |
Loan commitments |
Financial Guarantees |
Total | Loan Operations |
Loan commitments |
Financial Guarantees |
Total | Loan Operations (*) |
Loan commitments |
Financial Guarantees |
Total | |||||||||||||||||||||||||||||||||||||||||||||||||||||||||||||||||
| Individuals |
177,488 | 174,666 | 1,014 | 353,168 | 17,029 | 6,784 | — | 23,813 | 18,047 | 687 | — | 18,734 | 212,564 | 182,137 | 1,014 | 395,715 | ||||||||||||||||||||||||||||||||||||||||||||||||||||||||||||||||
| Credit card |
65,227 | 110,435 | — | 175,662 | 8,489 | 5,719 | — | 14,208 | 4,539 | 594 | — | 5,133 | 78,255 | 116,748 | — | 195,003 | ||||||||||||||||||||||||||||||||||||||||||||||||||||||||||||||||
| Personal loans |
14,125 | 64,201 | 1,014 | 79,340 | 4,427 | 1,064 | — | 5,491 | 10,991 | 93 | — | 11,084 | 29,543 | 65,358 | 1,014 | 95,915 | ||||||||||||||||||||||||||||||||||||||||||||||||||||||||||||||||
| Payroll loans |
44,156 | — | — | 44,156 | 1,024 | — | — | 1,024 | 1,698 | — | — | 1,698 | 46,878 | — | — | 46,878 | ||||||||||||||||||||||||||||||||||||||||||||||||||||||||||||||||
| Vehicles |
14,353 | — | — | 14,353 | 1,022 | — | — | 1,022 | 545 | — | — | 545 | 15,920 | — | — | 15,920 | ||||||||||||||||||||||||||||||||||||||||||||||||||||||||||||||||
| Mortgage loans |
39,627 | 30 | — | 39,657 | 2,067 | 1 | — | 2,068 | 274 | — | — | 274 | 41,968 | 31 | — | 41,999 | ||||||||||||||||||||||||||||||||||||||||||||||||||||||||||||||||
| Corporate |
90,716 | 16,054 | 45,361 | 152,131 | 2,222 | 83 | 1,681 | 3,986 | 9,705 | 143 | 4,148 | 13,996 | 102,643 | 16,280 | 51,190 | 170,113 | ||||||||||||||||||||||||||||||||||||||||||||||||||||||||||||||||
| Small and medium businesses |
57,099 | 40,105 | 2,472 | 99,676 | 5,875 | 1,834 | 69 | 7,778 | 5,838 | 185 | 94 | 6,117 | 68,812 | 42,124 | 2,635 | 113,571 | ||||||||||||||||||||||||||||||||||||||||||||||||||||||||||||||||
| Foreign loans - Latin America |
134,323 | 29,090 | 10,842 | 174,255 | 11,768 | 2,969 | 395 | 15,132 | 5,981 | 243 | 29 | 6,253 | 152,072 | 32,302 | 11,266 | 195,640 | ||||||||||||||||||||||||||||||||||||||||||||||||||||||||||||||||
|
|
|
|
|
|
|
|
|
|
|
|
|
|
|
|
|
|
|
|
|
|
|
|
|
|
|
|
|
|
|
|
|
|||||||||||||||||||||||||||||||||||||||||||||||||
| Total |
459,626 | 259,915 | 59,689 | 779,230 | 36,894 | 11,670 | 2,145 | 50,709 | 39,571 | 1,258 | 4,271 | 45,100 | 536,091 | 272,843 | 66,105 | 875,039 | ||||||||||||||||||||||||||||||||||||||||||||||||||||||||||||||||
|
|
|
|
|
|
|
|
|
|
|
|
|
|
|
|
|
|
|
|
|
|
|
|
|
|
|
|
|
|
|
|
|
|||||||||||||||||||||||||||||||||||||||||||||||||
| % |
59.0 | % | 33.3 | % | 7.7 | % | 100.0 | % | 72.8 | % | 23.0 | % | 4.2 | % | 100.0 | % | 87.7 | % | 2.8 | % | 9.5 | % | 100.0 | % | 61.3 | % | 31.1 | % | 7.6 | % | 100.0 | % | ||||||||||||||||||||||||||||||||||||||||||||||||
|
|
|
|
|
|
|
|
|
|
|
|
|
|
|
|
|
|
|
|
|
|
|
|
|
|
|
|
|
|
|
|
|
|||||||||||||||||||||||||||||||||||||||||||||||||
| 12/31/2017 | ||||||||||||||||||||||||||||||||||||||||||||||||||||||||||||||||||||||||||||||||
| Stage 1 | Stage 2 | Stage 3 | Total Consolidated of 3 stages | |||||||||||||||||||||||||||||||||||||||||||||||||||||||||||||||||||||||||||||
| Loan Operations |
Loan commitments |
Financial Guarantees |
Total | Loan Operations |
Loan commitments |
Financial Guarantees |
Total | Loan Operations |
Loan commitments |
Financial Guarantees |
Total | Loan Operations (*) |
Loan commitments |
Financial Guarantees |
Total | |||||||||||||||||||||||||||||||||||||||||||||||||||||||||||||||||
| Individuals |
161,364 | 159,533 | 1,016 | 321,913 | 13,032 | 4,420 | — | 17,452 | 18,989 | 776 | — | 19,765 | 193,385 | 164,729 | 1,016 | 359,130 | ||||||||||||||||||||||||||||||||||||||||||||||||||||||||||||||||
| Credit card |
57,073 | 102,180 | — | 159,253 | 6,027 | 3,353 | — | 9,380 | 4,313 | 697 | — | 5,010 | 67,413 | 106,230 | — | 173,643 | ||||||||||||||||||||||||||||||||||||||||||||||||||||||||||||||||
| Personal loans |
12,290 | 57,339 | 1,016 | 70,645 | 3,108 | 1,065 | — | 4,173 | 11,897 | 79 | — | 11,976 | 27,295 | 58,483 | 1,016 | 86,794 | ||||||||||||||||||||||||||||||||||||||||||||||||||||||||||||||||
| Payroll loans |
42,115 | — | — | 42,115 | 733 | — | — | 733 | 1,868 | — | — | 1,868 | 44,716 | — | — | 44,716 | ||||||||||||||||||||||||||||||||||||||||||||||||||||||||||||||||
| Vehicles |
12,550 | — | — | 12,550 | 987 | — | — | 987 | 628 | — | — | 628 | 14,165 | — | — | 14,165 | ||||||||||||||||||||||||||||||||||||||||||||||||||||||||||||||||
| Mortgage loans |
37,336 | 14 | — | 37,350 | 2,177 | 2 | — | 2,179 | 283 | — | — | 283 | 39,796 | 16 | — | 39,812 | ||||||||||||||||||||||||||||||||||||||||||||||||||||||||||||||||
| Corporate |
91,442 | 14,100 | 50,811 | 156,353 | 3,833 | 278 | 1,299 | 5,410 | 12,372 | 390 | 5,538 | 18,300 | 107,647 | 14,768 | 57,648 | 180,063 | ||||||||||||||||||||||||||||||||||||||||||||||||||||||||||||||||
| Small and medium businesses |
47,132 | 33,203 | 2,229 | 82,564 | 6,001 | 1,638 | 74 | 7,713 | 7,157 | 254 | 54 | 7,465 | 60,290 | 35,095 | 2,357 | 97,742 | ||||||||||||||||||||||||||||||||||||||||||||||||||||||||||||||||
| Foreign loans - Latin America |
117,448 | 25,867 | 9,069 | 152,384 | 13,028 | 3,527 | 371 | 16,926 | 5,921 | 140 | 28 | 6,089 | 136,397 | 29,534 | 9,468 | 175,399 | ||||||||||||||||||||||||||||||||||||||||||||||||||||||||||||||||
|
|
|
|
|
|
|
|
|
|
|
|
|
|
|
|
|
|
|
|
|
|
|
|
|
|
|
|
|
|
|
|
|
|||||||||||||||||||||||||||||||||||||||||||||||||
| Total |
417,386 | 232,703 | 63,125 | 713,214 | 35,894 | 9,863 | 1,744 | 47,501 | 44,439 | 1,560 | 5,620 | 51,619 | 497,719 | 244,126 | 70,489 | 812,334 | ||||||||||||||||||||||||||||||||||||||||||||||||||||||||||||||||
|
|
|
|
|
|
|
|
|
|
|
|
|
|
|
|
|
|
|
|
|
|
|
|
|
|
|
|
|
|
|
|
|
|||||||||||||||||||||||||||||||||||||||||||||||||
| % |
58.5 | % | 32.6 | % | 8.9 | % | 100.0 | % | 75.5 | % | 20.8 | % | 3.7 | % | 100.0 | % | 86.1 | % | 3.0 | % | 10.9 | % | 100.0 | % | 61.2 | % | 30.1 | % | 8.7 | % | 100.0 | % | ||||||||||||||||||||||||||||||||||||||||||||||||
|
|
|
|
|
|
|
|
|
|
|
|
|
|
|
|
|
|
|
|
|
|
|
|
|
|
|
|
|
|
|
|
|
|||||||||||||||||||||||||||||||||||||||||||||||||
| (*) | In the composition of balance there are operations designated at Fair Value Through Profit or Loss, in the amount of R$ 102 at 12/31/2017. |
| 12/31/2018 | 12/31/2017 | |||||||||||||||||||||||||||||||
| Internal Rating |
Stage 1 | Stage 2 | Stage 3 | Total loans |
Stage 1 | Stage 2 | Stage 3 | Total loans |
||||||||||||||||||||||||
| Lower Risk |
378,389 | 4,536 | — | 382,925 | 349,354 | 5,274 | — | 354,628 | ||||||||||||||||||||||||
| Satisfactory |
72,921 | 19,723 | — | 92,644 | 60,707 | 17,798 | — | 78,505 | ||||||||||||||||||||||||
| Higher Risk |
8,316 | 12,635 | — | 20,951 | 7,325 | 12,822 | — | 20,147 | ||||||||||||||||||||||||
| Credit-lmpaired |
— | — | 39,571 | 39,571 | — | — | 44,439 | 44,439 | ||||||||||||||||||||||||
|
|
|
|
|
|
|
|
|
|
|
|
|
|
|
|
|
|||||||||||||||||
| Total |
459,626 | 36,894 | 39,571 | 536,091 | 417,386 | 35,894 | 44,439 | 497,719 | ||||||||||||||||||||||||
|
|
|
|
|
|
|
|
|
|
|
|
|
|
|
|
|
|||||||||||||||||
| % |
85.7 | 6.9 | 7.4 | 100.0 | 83.9 | 7.2 | 8.9 | 100.0 | ||||||||||||||||||||||||
|
|
|
|
|
|
|
|
|
|
|
|
|
|
|
|
|
|||||||||||||||||
F-134
Table of Contents
ITAÚ UNIBANCO HOLDING S.A.
Notes to the Consolidated Financial Statements
At 12/31/2018, 12/31/2017 and 01/01/2017 for balance sheet accounts and
From 01/01 to 12/31 of 2018, 2017 and 2016 for income statement accounts
(In millions of Reais, except information per share)
Other financial assets
| 12/31/2018 | ||||||||||||||||||||||||||||
| Fair Value | Stage 1 | Stage 2 | Stage 3 | |||||||||||||||||||||||||
| Cost | Fair Value | Cost | Fair Value | Cost | Fair Value | |||||||||||||||||||||||
| Investment funds |
4,326 | 4,335 | 4,129 | 0 | 0 | 918 | 197 | |||||||||||||||||||||
| Government securities |
327,720 | 325,734 | 327,546 | 232 | 174 | 0 | 0 | |||||||||||||||||||||
| Brazilian government |
300,172 | 298,084 | 299,998 | 232 | 174 | 0 | 0 | |||||||||||||||||||||
| Other Public |
0 | 36 | 0 | 0 | 0 | 0 | 0 | |||||||||||||||||||||
| Other countries |
27,548 | 27,614 | 27,548 | 0 | 0 | 0 | 0 | |||||||||||||||||||||
| Argentina |
1,129 | 1,121 | 1,129 | 0 | 0 | 0 | 0 | |||||||||||||||||||||
| United States |
2,754 | 2,770 | 2,754 | 0 | 0 | 0 | 0 | |||||||||||||||||||||
| Mexico |
2,378 | 2,378 | 2,378 | 0 | 0 | 0 | 0 | |||||||||||||||||||||
| Italy |
115 | 115 | 115 | 0 | 0 | 0 | 0 | |||||||||||||||||||||
| Spain |
2,411 | 2,411 | 2,411 | 0 | 0 | 0 | 0 | |||||||||||||||||||||
| Korea |
1,385 | 1,385 | 1,385 | 0 | 0 | 0 | 0 | |||||||||||||||||||||
| Chile |
8,211 | 8,204 | 8,211 | 0 | 0 | 0 | 0 | |||||||||||||||||||||
| Paraguay |
1,530 | 1,602 | 1,530 | 0 | 0 | 0 | 0 | |||||||||||||||||||||
| Uruguay |
652 | 656 | 652 | 0 | 0 | 0 | 0 | |||||||||||||||||||||
| Colombia |
6,065 | 6,054 | 6,065 | 0 | 0 | 0 | 0 | |||||||||||||||||||||
| France |
891 | 891 | 891 | 0 | 0 | 0 | 0 | |||||||||||||||||||||
| Germany |
22 | 22 | 22 | 0 | 0 | 0 | 0 | |||||||||||||||||||||
| Other |
5 | 5 | 5 | 0 | 0 | 0 | 0 | |||||||||||||||||||||
| Corporate securities |
87,206 | 82,438 | 82,301 | 3,908 | 2,937 | 4,957 | 1,968 | |||||||||||||||||||||
| Rural product note |
4,003 | 3,855 | 3,848 | 0 | 0 | 326 | 155 | |||||||||||||||||||||
| Securitized real estate loans |
10,926 | 10,419 | 10,436 | 55 | 55 | 793 | 435 | |||||||||||||||||||||
| Bank deposit certificate |
2,145 | 2,145 | 2,145 | 0 | 0 | 0 | 0 | |||||||||||||||||||||
| Debentures |
30,950 | 27,306 | 27,068 | 3,323 | 2,557 | 3,563 | 1,325 | |||||||||||||||||||||
| Eurobonds and other |
6,895 | 6,950 | 6,895 | 0 | 0 | 0 | 0 | |||||||||||||||||||||
| Financial bills |
19,724 | 19,724 | 19,724 | 0 | 0 | 0 | 0 | |||||||||||||||||||||
| Promissory notes |
1,490 | 1,465 | 1,463 | 15 | 15 | 24 | 12 | |||||||||||||||||||||
| Others |
11,073 | 10,574 | 10,722 | 515 | 310 | 251 | 41 | |||||||||||||||||||||
|
|
|
|
|
|
|
|
|
|
|
|
|
|
|
|||||||||||||||
| Total |
419,252 | 412,507 | 413,976 | 4,140 | 3,111 | 5,875 | 2,165 | |||||||||||||||||||||
|
|
|
|
|
|
|
|
|
|
|
|
|
|
|
|||||||||||||||
F-135
Table of Contents
ITAÚ UNIBANCO HOLDING S.A.
Notes to the Consolidated Financial Statements
At 12/31/2018, 12/31/2017 and 01/01/2017 for balance sheet accounts and
From 01/01 to 12/31 of 2018, 2017 and 2016 for income statement accounts
(In millions of Reais, except information per share)
| 12/31/2017 | ||||||||||||||||||||||||||||
| Fair Value | Stage 1 | Stage 2 | Stage 3 | |||||||||||||||||||||||||
| Cost | Fair Value | Cost | Fair Value | Cost | Fair Value | |||||||||||||||||||||||
| Investment funds |
3,513 | 3,351 | 3,345 | — | — | 784 | 168 | |||||||||||||||||||||
| Government securities |
326,227 | 324,585 | 326,031 | 261 | 196 | — | — | |||||||||||||||||||||
| Brazilian government |
297,325 | 295,671 | 297,129 | 261 | 196 | — | — | |||||||||||||||||||||
| Other countries |
28,902 | 28,914 | 28,902 | — | — | — | — | |||||||||||||||||||||
| Argentina |
1,466 | 1,446 | 1,466 | — | — | — | — | |||||||||||||||||||||
| United States |
1,666 | 1,684 | 1,666 | — | — | — | — | |||||||||||||||||||||
| Mexico |
564 | 564 | 564 | — | — | — | — | |||||||||||||||||||||
| Denmark |
1,951 | 1,951 | 1,951 | — | — | — | — | |||||||||||||||||||||
| Spain |
2,937 | 2,937 | 2,937 | — | — | — | — | |||||||||||||||||||||
| Korea |
1,944 | 1,944 | 1,944 | — | — | — | — | |||||||||||||||||||||
| Chile |
9,761 | 9,765 | 9,761 | — | — | — | — | |||||||||||||||||||||
| Paraguay |
1,807 | 1,922 | 1,807 | — | — | — | — | |||||||||||||||||||||
| Uruguay |
828 | 824 | 828 | — | — | — | — | |||||||||||||||||||||
| Colombia |
5,945 | 5,844 | 5,945 | — | — | — | — | |||||||||||||||||||||
| Other |
33 | 33 | 33 | — | — | — | — | |||||||||||||||||||||
| Corporate securities |
79,344 | 75,240 | 75,486 | 1,510 | 1,109 | 7,857 | 2,749 | |||||||||||||||||||||
| Rural product note |
2,739 | 2,518 | 2,511 | — | — | 381 | 228 | |||||||||||||||||||||
| Securitized real estate loans |
13,577 | 12,492 | 12,501 | 64 | 59 | 3,062 | 1,017 | |||||||||||||||||||||
| Bank deposit certificate |
1,150 | 1,150 | 1,150 | — | — | — | — | |||||||||||||||||||||
| Debentures |
23,758 | 21,584 | 21,569 | 1,255 | 969 | 3,892 | 1,220 | |||||||||||||||||||||
| Eurobonds and other |
6,192 | 6,195 | 6,192 | — | — | — | — | |||||||||||||||||||||
| Financial bills |
21,230 | 21,230 | 21,230 | — | — | — | — | |||||||||||||||||||||
| Promissory notes |
3,614 | 3,597 | 3,596 | — | — | 40 | 18 | |||||||||||||||||||||
| Others |
7,084 | 6,474 | 6,737 | 191 | 81 | 482 | 266 | |||||||||||||||||||||
|
|
|
|
|
|
|
|
|
|
|
|
|
|
|
|||||||||||||||
| Total |
409,084 | 403,176 | 404,862 | 1,771 | 1,305 | 8,641 | 2,917 | |||||||||||||||||||||
|
|
|
|
|
|
|
|
|
|
|
|
|
|
|
|||||||||||||||
Other Financial Assets - Internal Classification by Level of Risk
| 12/31/2018 | ||||||||||||||||||||
| Financial Assets - At Amortized Cost | ||||||||||||||||||||
| Internal rating |
Interbank deposits and securities purchased under agreements to resell |
Securities | Financial assets at fair value through profit or loss at fair value (*) |
Financial Assets Fair Value Through Other Comprehensive Income |
Total | |||||||||||||||
| Lower risk |
306,556 | 103,157 | 284,896 | 49,323 | 743,932 | |||||||||||||||
| Satisfactory |
0 | 3,645 | 1,340 | 0 | 4,985 | |||||||||||||||
| Higher risk |
0 | 3,593 | 410 | 0 | 4,003 | |||||||||||||||
|
|
|
|
|
|
|
|
|
|
|
|||||||||||
| Total |
306,556 | 110,395 | 286,646 | 49,323 | 752,920 | |||||||||||||||
|
|
|
|
|
|
|
|
|
|
|
|||||||||||
| % |
40.6 | 14.7 | 38.1 | 6.6 | 100.0 | |||||||||||||||
|
|
|
|
|
|
|
|
|
|
|
|||||||||||
| (*) | Includes Derivatives in the amount of R$ 23,466 at 12/31/2018. |
F-136
Table of Contents
ITAÚ UNIBANCO HOLDING S.A.
Notes to the Consolidated Financial Statements
At 12/31/2018, 12/31/2017 and 01/01/2017 for balance sheet accounts and
From 01/01 to 12/31 of 2018, 2017 and 2016 for income statement accounts
(In millions of Reais, except information per share)
| 12/31/2017 | ||||||||||||||||||||
| Financial Assets - At Amortized Cost | ||||||||||||||||||||
| Internal rating |
Interbank deposits and securities purchased under agreements to resell |
Securities | Financial assets at fair value through profit or loss at fair value (*) |
Financial Assets Fair Value Through Other Comprehensive Income |
Total | |||||||||||||||
| Lower risk |
273,747 | 104,610 | 271,859 | 52,149 | 702,365 | |||||||||||||||
| Satisfactory |
— | 338 | 1,278 | — | 1,616 | |||||||||||||||
| Higher Risk |
— | 1,294 | 399 | — | 1,693 | |||||||||||||||
|
|
|
|
|
|
|
|
|
|
|
|||||||||||
| Total |
273,747 | 106,242 | 273,536 | 52,149 | 705,674 | |||||||||||||||
|
|
|
|
|
|
|
|
|
|
|
|||||||||||
| % |
38.7 | 15.1 | 38.8 | 7.4 | 100.0 | |||||||||||||||
|
|
|
|
|
|
|
|
|
|
|
|||||||||||
| (*) | Includes Derivatives in the amount of R$ 22,843 at 12/31/2017. |
| 1.4.3 | Collateral held for loan and lease operations portfolio |
| 12/31/2018 | 12/31/2017 | |||||||||||||||||||||||||||||||
| Over-collateralized assets | Under-collateralized assets | Over-collateralized assets | Under-collateralized assets | |||||||||||||||||||||||||||||
| Carrying value of the assets |
Fair value of collateral |
Carrying value of the assets |
Fair value of collateral |
Carrying value of the assets |
Fair value of collateral |
Carrying value of the assets |
Fair value of collateral |
|||||||||||||||||||||||||
| Individuals |
57,842 | 145,775 | 1,054 | 993 | 52,608 | 132,007 | 1,079 | 1,028 | ||||||||||||||||||||||||
| Personal (1) |
643 | 1,949 | 753 | 711 | 370 | 1,398 | 901 | 864 | ||||||||||||||||||||||||
| Vehicles (2) |
15,173 | 35,266 | 298 | 280 | 13,618 | 34,368 | 177 | 163 | ||||||||||||||||||||||||
| Mortgage loans (3) |
42,026 | 108,560 | 3 | 2 | 38,620 | 96,241 | 1 | 1 | ||||||||||||||||||||||||
| Small, medium businesses and corporate (4) |
112,508 | 293,724 | 13,870 | 10,267 | 115,731 | 339,892 | 11,032 | 8,537 | ||||||||||||||||||||||||
| Foreign loans - Latin America (4) |
117,094 | 246,462 | 11,242 | 3,758 | 105,425 | 175,476 | 10,262 | 3,598 | ||||||||||||||||||||||||
| Total |
287,444 | 685,961 | 26,166 | 15,018 | 273,764 | 647,375 | 22,373 | 13,163 | ||||||||||||||||||||||||
|
|
|
|
|
|
|
|
|
|
|
|
|
|
|
|
|
|||||||||||||||||
| (1) | In general requires financial collaterals. |
| (2) | Vehicles themselves are pledged as collateral, as well as assets leased in lease operations. |
| (3) | Properties themselves are pledged as collateral. |
| (4) | Any collateral set forth in the credit policy of ITAÚ UNIBANCO HOLDING (chattel mortgage, surety/joint debtor, mortgage and others). |
Of total credit and finance lease operations, R$ 222,481 (R$ 201,582 at 12/31/2017) represented unsecured loans.
F-137
Table of Contents
ITAÚ UNIBANCO HOLDING S.A.
Notes to the Consolidated Financial Statements
At 12/31/2018, 12/31/2017 and 01/01/2017 for balance sheet accounts and
From 01/01 to 12/31 of 2018, 2017 and 2016 for income statement accounts
(In millions of Reais, except information per share)
1.4.4 Repossessed assets
Assets received from the foreclosure of loans, including real estate, are initially recorded at the lower of: (i) the fair value of the asset less the estimated selling expenses, or (ii) the carrying amount of the loan.
Further impairment of assets is recorded as a provision, with a corresponding charge to income. The maintenance costs of these assets are expensed as incurred.
The policy for sales of these assets (assets not for use) includes periodic auctions that are announced in advance and considers that the assets cannot be held for more than one year as stipulated by the BACEN.
Total assets repossessed in the period was R$ 657 (R$ 701 from 01/01 to 12/31/2017), mainly composed of real estate.
2. Market risk
Possibility of incurring financial losses arising from the changes in the market value of positions held by a financial institution, including the risks of transactions subject to foreign exchange variation, interest rates, share prices, price indexes and commodity prices.
ITAÚ UNIBANCO HOLDING’s market risk management strategy is aimed at balancing corporate business goals, taking into account, among other things: political, economic and market conditions; portfolio profile of ITAÚ UNIBANCO HOLDING and expertise within the group to support operations in specific markets.
The market risk is controlled by an area independent from the business areas, which is responsible for the daily activities of: (i) risk measurement and assessment, (ii) monitoring of stress scenarios, limits and warnings, (iii) application, analysis and tests of stress scenarios, (iv) risk reporting for individuals responsible within the business areas, in compliance with governance of ITAÚ UNIBANCO HOLDING, (v) monitoring of actions required for adjustment of positions and/or risk levels to make them feasible, and (vi) support to the launch of new financial products with security.
The National Monetary Council (CMN) has regulations that establish the segregation of exposure to market risk at least in the following categories: interest rate, exchange rate, shares and commodities. Brazilian inflation indexes are treated as a group of risk indicators and receive the same treatment given to other risk indicators.
The structure of limits and warnings is in line with the Board of Directors’ guidelines, and it is reviewed and approved on an annual basis. This structure has specific limits aiming at improving the risk monitoring and understanding process, and at avoiding concentration. These limits are quantified by assessing the forecasted results of the balance sheet, size of stockholders’ equity, liquidity, market complexity and volatility, as well as the institution’s appetite for risk of ITAÚ UNIBANCO HOLDING.
In order to set up operations within the defined limits, ITAÚ UNIBANCO HOLDING hedges transactions with clients and proprietary positions, including its foreign investments. Derivatives are commonly used for these hedging activities, and can be characterized as accounting or economic hedge, both governed by the institutional polices of ITAÚ UNIBANCO HOLDING.
The market risk structure categorizes transactions as part of either the banking portfolio or the trading portfolio, in accordance with general criteria established by CMN Resolution nº. 4,557, of February 2017, 23, and BACEN Circular nº. 3,354, of June 2007, 27. The trading portfolio consists of all transactions involving financial instruments and goods, including derivatives, which are carried out with the intention of trading. The banking portfolio is basically characterized by transactions from the banking business, and transactions related to the management of the balance sheet of the institution. It has the no-intention of resale and medium and long term time horizons as general guidelines.
F-138
Table of Contents
ITAÚ UNIBANCO HOLDING S.A.
Notes to the Consolidated Financial Statements
At 12/31/2018, 12/31/2017 and 01/01/2017 for balance sheet accounts and
From 01/01 to 12/31 of 2018, 2017 and 2016 for income statement accounts
(In millions of Reais, except information per share)
Market risk management is conducted based on the following metrics:
| • | Value at risk (VaR): statistical measure that estimates the expected maximum potential economic loss under normal market conditions, considering a certain time horizon and confidence level; |
| • | Losses in stress scenarios: simulation technique to assess the behavior of assets, liabilities and derivatives of a portfolio when several risk factors are taken to extreme market situations (based on prospective and historical scenarios); |
| • | Stop loss: metrics which purpose is to review positions, should losses accumulated in a certain period reach a certain amount; |
| • | Concentration: cumulative exposure of a certain financial instrument or risk factor, calculated at market value (“MtM – Mark to Market”); and |
| • | Stressed VaR: statistical metric arising from VaR calculation, which purpose is to capture higher risk in simulations for the trading portfolio, considering returns that can be seen in historical scenarios of extreme volatility. |
Management of interest rate risk in the Banking Book (IRRBB) is performed based on the following metrics:
| • | DEVE: difference between the present value of sum of repricing flows instruments subject to IRRBB in a base scenario and present value of sum of repricing flows of these instruments in a scenario of shock in interest rates; |
| • | DNII: difference between the result of financial intermediation of instruments subject to IRRBB in a base scenario and the result of financial intermediation of these instruments in a scenario of shock in interest rates. |
In addition to the aforementioned risk measures, sensitivity and loss control measures are also analyzed. They comprise:
| • | Mismatching analysis (GAPS): accumulated exposure by risk factor of cash flows expressed at market value, allocated at the maturity dates; |
| • | Sensitivity (DV01- Delta Variation): impact on the market value of cash flows, when submitted to an one annual basis point increase in the current interest rates or index rate; |
| • | Sensitivity to several risk factors (Greeks): partial derivatives of an option portfolio in relation to the prices of underlying assets, implied volatilities, interest rates and time. |
ITAÚ UNIBANCO HOLDING uses proprietary systems to measure the consolidated market risk. The processing of these systems occur, in an access-controlled environment, being highly available, which has data safekeeping and recovery processes, and counts on such an infrastructure to ensure the continuity of business in contingency (disaster recovery) situations.
The document that details the guidelines established by the internal policy on market risk management, that is not part of the financial statements, may be viewed on the website www.itau.com.br/investor-relations, in the section Corporate Governance/Rules and Policies / Public Access Report – Market Risk. For a detailed view of Market Risk and Interest Rate Risk in the Banking Portfolio, see chapter Market Risk of the Publication on Risk and Capital Management - Pillar 3.
F-139
Table of Contents
ITAÚ UNIBANCO HOLDING S.A.
Notes to the Consolidated Financial Statements
At 12/31/2018, 12/31/2017 and 01/01/2017 for balance sheet accounts and
From 01/01 to 12/31 of 2018, 2017 and 2016 for income statement accounts
(In millions of Reais, except information per share)
2.1 VaR - Consolidated ITAÚ UNIBANCO HOLDING
Is calculated by Historical Simulation, i.e., the expected distribution for profit and loss (P&L’s - Profit and loss statement) of a portfolio over a time horizon that can be estimated based on the historical behavior of returns of market risk factors of this portfolio. VaR is calculated at a confidence level of 99%, historical period of 4 years (1000 business days) and a holding period of one day. In addition, in a conservative approach, VaR is calculated daily, being or not volatility-weighted, and the final VaR is the most restrictive value between both methodologies.
From January 1 to December 31, 2018, the average total VaR in Historical Simulation was R$ 399.3 or 0.26% of total stockholders’ equity (R$ 409.9 or 0.28% of total stockholders’ equity 01/01 to 12/31/2017).
| (Reais million) |
||||||||||||||||||||||||||||||||
| VaR Total - Historical Simulation | ||||||||||||||||||||||||||||||||
| 12/31/2018 (1) | 12/31/2017 (1) | |||||||||||||||||||||||||||||||
| Average | Minimum | Maximum | Var Total | Average | Minimum | Maximum | Var Total | |||||||||||||||||||||||||
| Risk factor group |
||||||||||||||||||||||||||||||||
| Interest rates |
851.4 | 720.0 | 1,042.9 | 898.4 | 721.0 | 583.6 | 1,311.9 | 764.7 | ||||||||||||||||||||||||
| Currencies |
24.7 | 12.7 | 45.2 | 37.3 | 20.4 | 6.5 | 50.2 | 11.9 | ||||||||||||||||||||||||
| Shares |
39.2 | 23.6 | 58.5 | 50.1 | 45.4 | 38.5 | 54.9 | 46.4 | ||||||||||||||||||||||||
| Commodities |
1.6 | 0.6 | 3.1 | 1.0 | 1.5 | 0.7 | 4.0 | 0.8 | ||||||||||||||||||||||||
| Effect of diversification |
(605.3 | ) | (451.5 | ) | ||||||||||||||||||||||||||||
|
|
|
|
|
|
|
|
|
|
|
|
|
|
|
|
|
|||||||||||||||||
| Total risk |
399.3 | 294.7 | 603.6 | 381.5 | 409.9 | 304.8 | 874.0 | 372.3 | ||||||||||||||||||||||||
|
|
|
|
|
|
|
|
|
|
|
|
|
|
|
|
|
|||||||||||||||||
| (1) | VaR by Group of Risk Factors considers information from foreign units. |
F-140
Table of Contents
ITAÚ UNIBANCO HOLDING S.A.
Notes to the Consolidated Financial Statements
At 12/31/2018, 12/31/2017 and 01/01/2017 for balance sheet accounts and
From 01/01 to 12/31 of 2018, 2017 and 2016 for income statement accounts
(In millions of Reais, except information per share)
2.1.1 Interest rate risk
The table below shows the accounting position of financial assets and liabilities exposed to interest rate risk, distributed by maturity (remaining contractual terms). This table is not used directly to manage interest rate risks; it is mostly used to permit the assessment of mismatching between accounts and products associated thereto and to identify possible risk concentration.
| 12/31/2018 | 12/31/2017 | |||||||||||||||||||||||||||||||||||||||||||||||
| 0-30 days |
31-180 days |
181-365 days |
1-5 years |
Over 5 years |
Total | 0-30 days |
31-180 days |
181-365 days |
1-5 years |
Over 5 years |
Total | |||||||||||||||||||||||||||||||||||||
| Financial assets |
188,616 | 394,168 | 100,598 | 399,075 | 202,898 | 1,285,355 | 268,059 | 354,885 | 103,785 | 392,119 | 178,592 | 1,297,440 | ||||||||||||||||||||||||||||||||||||
| Central Bank compulsory deposits |
88,549 | 0 | 0 | 0 | 0 | 88,549 | 94,047 | — | — | — | — | 94,047 | ||||||||||||||||||||||||||||||||||||
| At amortized cost |
||||||||||||||||||||||||||||||||||||||||||||||||
| Interbank deposits |
19,181 | 4,815 | 1,730 | 688 | 0 | 26,414 | 21,644 | 3,510 | 2,880 | 1,011 | 3 | 29,048 | ||||||||||||||||||||||||||||||||||||
| Securities purchased under agreements to resell |
64,677 | 215,352 | 0 | 12 | 91 | 280,132 | 42,612 | 201,889 | 2 | 28 | 168 | 244,699 | ||||||||||||||||||||||||||||||||||||
| Securities |
1,007 | 7,320 | 5,792 | 50,969 | 41,661 | 106,749 | 10,897 | 7,921 | 6,834 | 50,650 | 29,940 | 106,242 | ||||||||||||||||||||||||||||||||||||
| Loan and lease operations (1) |
78,709 | 140,057 | 70,792 | 167,517 | 79,016 | 536,091 | 73,239 | 120,231 | 67,463 | 161,824 | 74,962 | 497,719 | ||||||||||||||||||||||||||||||||||||
| At fair value through other comprehensive income |
1,915 | 4,743 | 4,026 | 21,649 | 16,990 | 49,323 | 1,088 | 2,476 | 6,102 | 23,415 | 19,068 | 52,149 | ||||||||||||||||||||||||||||||||||||
| At fair value through profit and loss |
||||||||||||||||||||||||||||||||||||||||||||||||
| Securities |
19,140 | 17,810 | 15,945 | 154,171 | 56,114 | 263,180 | 16,554 | 15,855 | 17,103 | 147,805 | 51,630 | 248,947 | ||||||||||||||||||||||||||||||||||||
| Derivatives |
3,987 | 4,071 | 2,313 | 4,069 | 9,026 | 23,466 | 7,978 | 3,003 | 2,360 | 6,681 | 2,821 | 22,843 | ||||||||||||||||||||||||||||||||||||
| Financial liabilities |
513,889 | 88,152 | 69,102 | 313,240 | 69,055 | 1,053,438 | 376,492 | 93,736 | 87,850 | 290,677 | 56,451 | 905,206 | ||||||||||||||||||||||||||||||||||||
| At amortized cost |
||||||||||||||||||||||||||||||||||||||||||||||||
| Deposits |
248,913 | 36,856 | 22,063 | 146,288 | 9,304 | 463,424 | 216,842 | 33,258 | 23,239 | 126,886 | 2,713 | 402,938 | ||||||||||||||||||||||||||||||||||||
| Securities sold under repurchase agreements |
254,052 | 9,713 | 7,756 | 40,877 | 17,839 | 330,237 | 208,261 | 7,362 | 25,185 | 57,146 | 14,680 | 312,634 | ||||||||||||||||||||||||||||||||||||
| Interbank market debts |
7,438 | 33,869 | 31,869 | 58,375 | 3,119 | 134,670 | 8,557 | 34,097 | 30,727 | 47,219 | 3,987 | 124,587 | ||||||||||||||||||||||||||||||||||||
| Institutional market debts |
314 | 3,631 | 4,579 | 58,513 | 26,937 | 93,974 | 4,188 | 16,495 | 5,343 | 43,911 | 28,545 | 98,482 | ||||||||||||||||||||||||||||||||||||
| Capitalization plans |
0 | 0 | 0 | 3,422 | 0 | 3,422 | — | — | — | 3,301 | — | 3,301 | ||||||||||||||||||||||||||||||||||||
| At fair value through profit and loss |
||||||||||||||||||||||||||||||||||||||||||||||||
| Derivatives |
3,168 | 4,070 | 2,815 | 5,672 | 11,794 | 27,519 | 7,596 | 2,491 | 3,325 | 11,109 | 2,225 | 26,746 | ||||||||||||||||||||||||||||||||||||
| Structured notes |
4 | 13 | 20 | 93 | 62 | 192 | 11 | 22 | 22 | 319 | 91 | 465 | ||||||||||||||||||||||||||||||||||||
| Difference asset/ liability (2) |
(325,273 | ) | 306,016 | 31,496 | 85,835 | 133,843 | 231,917 | (108,433 | ) | 261,149 | 15,935 | 101,442 | 122,141 | 392,234 | ||||||||||||||||||||||||||||||||||
| Cumulative difference |
(325,273 | ) | (19,257 | ) | 12,239 | 98,074 | 231,917 | 0 | (108,433 | ) | 152,716 | 168,651 | 270,093 | 392,234 | ||||||||||||||||||||||||||||||||||
| Ratio of cumulative difference to total interest-bearing assets |
(25.3 | %) | (1.5 | %) | 1.0 | % | 7.6 | % | 18.0 | % | 0 | (8.4 | %) | 11.8 | % | 13.0 | % | 20.8 | % | 30.2 | % | |||||||||||||||||||||||||||
| (1) | In the composition of balance there are operations designated at Fair Value Through Profit or Loss, in the amount of R$ 102 at 12/31/2017. |
| (2) | The difference arises from the mismatch between the maturities of all remunerated assets and liabilities, at the respective period-end date, considering the contractually agreed terms. |
F-141
Table of Contents
ITAÚ UNIBANCO HOLDING S.A.
Notes to the Consolidated Financial Statements
At 12/31/2018, 12/31/2017 and 01/01/2017 for balance sheet accounts and
From 01/01 to 12/31 of 2018, 2017 and 2016 for income statement accounts
(In millions of Reais, except information per share)
2.1.2 Currency risk
The table below shows the accounting exposure to currency risk of financial assets and liabilities and reflects ITAÚ UNIBANCO HOLDING’s currency risk management.
| 12/31/2018 | ||||||||||||||||
| Dollar | Chilean Peso |
Other | Total | |||||||||||||
| Net exposure of financial instruments |
(38,190 | ) | 7,647 | 15,418 | (15,125 | ) | ||||||||||
|
|
|
|
|
|
|
|
|
|||||||||
| 12/31/2017 | ||||||||||||||||
| Dollar | Chilean Peso |
Other | Total | |||||||||||||
| Net exposure of financial instruments |
(15,910 | ) | 7,159 | 13,232 | 4,481 | |||||||||||
|
|
|
|
|
|
|
|
|
|||||||||
2.1.3 Share Price Risk
The exposure to share price risk is disclosed in Note 5, related to Financial Assets Through Profit or Loss – Securities, and Note 8, related to Financial Assets at Fair Value Through Other Comprehensive Income – Securities.
3. Liquidity risk
The institution’s possibility of not being able to efficiently meet its expected and unexpected obligations, both current and future, including those arising from the pledged guarantees, without affecting its daily operations and without incurring significant losses.
The control over liquidity risk is carried out by an area independent from the business area and that is responsible for establishing the reserve composition, estimating the cash flow and exposure to liquidity risk in different horizons of time, and for monitoring the minimum limits to absorb losses in stress scenarios for each country where ITAÚ UNIBANCO HOLDING operates. All activities are subject to verification by the independent validation, internal control and audit areas.
F-142
Table of Contents
ITAÚ UNIBANCO HOLDING S.A.
Notes to the Consolidated Financial Statements
At 12/31/2018, 12/31/2017 and 01/01/2017 for balance sheet accounts and
From 01/01 to 12/31 of 2018, 2017 and 2016 for income statement accounts
(In millions of Reais, except information per share)
The liquidity management policies and respective limits are established based on prospective scenarios and top management’s guidelines. These scenarios are reviewed on a periodic basis, by analyzing the need for cash due to atypical market conditions or resulting from strategic decisions of ITAÚ UNIBANCO HOLDING.
The document Public Access Report - Liquidity Risk, that expresses the guidelines set forth by the internal policy on liquidity risk, that is not part of the financial statements, may be viewed on the website www.itau.com.br/investor-relations, in the section Itaú Unibanco, Corporate Governance, Rules and Policies.
ITAÚ UNIBANCO HOLDING conducts the control over and management of liquidity risk on a daily basis, through a governance approved in superior committees, which sets forth, among other activities, the adoption of liquidity minimum limits, sufficient to absorb possible cash losses in stress scenarios, measured through internal and regulatory methodologies.
Additionally the following items for monitoring and supporting decisions are periodically prepared and submitted to top management:
| • | Different scenarios projected for changes in liquidity; |
| • | Contingency plans for crisis situations; |
| • | Reports and charts that describe the risk positions; |
| • | Assessment of funding costs and alternative sources of funding; |
| • | Monitoring of changes in funding through a constant control over sources of funding, considering the type of investor and maturities, among other factors. |
3.1 Primary sources of funding
ITAÚ UNIBANCO HOLDING has different sources of funding, of which a significant portion is from the retail segment. Of total clients’ funds, 39.2% or R$ 253.0 billion, are immediately available to the client. However, the historical behavior of the accumulated balance of the two largest items in this group – demand and savings deposits - is relatively consistent with the balances increasing over time and inflows exceeding outflows for monthly average amounts.
| 12/31/2018 | 12/31/2017 | |||||||||||||||||||||||
| Funding from clients |
0-30 days | Total | % | 0-30 days | Total | % | ||||||||||||||||||
| Deposits |
248,913 | 463,424 | 0 | 216,842 | 402,938 | |||||||||||||||||||
| Demand deposits |
72,581 | 72,581 | 11.2 | 68,973 | 68,973 | 11.1 | ||||||||||||||||||
| Savings deposits |
136,865 | 136,865 | 21.2 | 119,980 | 119,980 | 19.3 | ||||||||||||||||||
| Time deposits |
37,784 | 251,300 | 38.9 | 27,798 | 211,800 | 34.0 | ||||||||||||||||||
| Other |
1,683 | 2,678 | 0.4 | 91 | 2,185 | 0.4 | ||||||||||||||||||
| Funds from acceptances and issuance of securities (1) |
2,285 | 111,566 | 17.3 | 6,820 | 107,581 | 17.3 | ||||||||||||||||||
| Funds from own issue (2) |
1,831 | 21,417 | 3.3 | 2,570 | 58,837 | 9.5 | ||||||||||||||||||
| Subordinated debt |
2 | 49,313 | 7.6 | 1,315 | 52,696 | 8.5 | ||||||||||||||||||
| Total |
253,031 | 645,720 | 100.0 | 227,547 | 622,052 | 100.0 | ||||||||||||||||||
|
|
|
|
|
|
|
|
|
|
|
|
|
|||||||||||||
| (1) | Includes mortgage notes, real estate credit bills, agribusiness, financial and structured operations certificates recorded in interbank market and debts and liabilities for issuance of debentures and foreign borrowing and securities recorded in funds from institutional markets. |
| (2) | Refer to deposits received under securities repurchase agreements with securities from own issue. |
F-143
Table of Contents
ITAÚ UNIBANCO HOLDING S.A.
Notes to the Consolidated Financial Statements
At 12/31/2018, 12/31/2017 and 01/01/2017 for balance sheet accounts and
From 01/01 to 12/31 of 2018, 2017 and 2016 for income statement accounts
(In millions of Reais, except information per share)
3.2 Control over liquidity
ITAÚ UNIBANCO HOLDING manages its liquidity reserves based on estimates of funds that will be available for investment, considering the continuity of business in normal conditions.
During the period of 2018, ITAÚ UNIBANCO HOLDING maintained appropriate levels of liquidity in Brazil and abroad. Liquid assets (cash and deposits on demand, securities purchased under agreements to resell - funded position and government securities – available, detailed in the table Undiscounted future flows – Financial assets) totaled R$ 158.6 billion and accounted for 62.7% of the short term redeemable obligations, 24.6% of total funding, and 15.8% of total assets.
The table below shows the indicators used by ITAÚ UNIBANCO HOLDING in the management of liquidity risk:
| Liquidity indicators |
12/31/2018 % |
12/31/2017 % |
||||||
| Net assets (1) / funds within 30 days (2) |
62.7 | 72.2 | ||||||
| Net assets (1) / total funds (3) |
24.6 | 26.4 | ||||||
| Net assets (1) / total financial assets (4) |
15.8 | 17.6 | ||||||
| (1) | Net assets: Cash and deposits on demand, Securities purchased under agreements to resell – Funded position and Government securities - available. Detailed in the table Undiscounted future flows – Financial assets. |
| (2) | Table Funding from clients (Total Funding from clients 0-30 days). |
| (3) | Table funding from clients (Total funding from clients). |
| (4) | Detailed in the table Undiscounted future flows – Financial assets, total present value regards R$ 1,001,240 (R$ 933,686 at 12/31/2017). |
F-144
Table of Contents
ITAÚ UNIBANCO HOLDING S.A.
Notes to the Consolidated Financial Statements
At 12/31/2018, 12/31/2017 and 01/01/2017 for balance sheet accounts and
From 01/01 to 12/31 of 2018, 2017 and 2016 for income statement accounts
(In millions of Reais, except information per share)
Assets and liabilities according to their remaining contractual maturities, considering their undiscounted flows, are presented below:
| Undiscounted future flows, except for derivatives which are fair value |
12/31/2018 | 12/31/2017 | ||||||||||||||||||||||||||||||||||||||
| Financial assets (1) |
0 - 30 days |
31 - 365 days |
366 - 720 days |
Over 720 days |
Total | 0 - 30 days |
31 - 365 days |
366 - 720 days |
Over 720 days |
Total | ||||||||||||||||||||||||||||||
| Cash and deposits on demand |
37,159 | 0 | 0 | 0 | 37,159 | 18,749 | — | — | — | 18,749 | ||||||||||||||||||||||||||||||
| Interbank investments |
115,278 | 182,606 | 468 | 322 | 298,674 | 93,218 | 173,663 | 673 | 508 | 268,062 | ||||||||||||||||||||||||||||||
| Securities purchased under agreements to resell – Funded position (2) |
45,335 | 0 | 0 | 0 | 45,335 | 38,833 | — | — | — | 38,833 | ||||||||||||||||||||||||||||||
| Securities purchased under agreements to resell – Financed position |
50,741 | 175,857 | 0 | 10 | 226,608 | 31,238 | 167,061 | — | — | 198,299 | ||||||||||||||||||||||||||||||
| Interbank deposits (4) |
19,202 | 6,749 | 468 | 312 | 26,731 | 23,147 | 6,602 | 673 | 508 | 30,930 | ||||||||||||||||||||||||||||||
| Securities |
82,144 | 17,255 | 17,853 | 98,531 | 215,783 | 110,667 | 24,960 | 16,717 | 76,923 | 229,267 | ||||||||||||||||||||||||||||||
| Government securities - available |
72,026 | 292 | 292 | 5,315 | 77,925 | 103,447 | 152 | 232 | 5,052 | 108,883 | ||||||||||||||||||||||||||||||
| Government securities – subject to repurchase commitments |
52 | 6,321 | 12,671 | 32,811 | 51,855 | 203 | 15,677 | 9,107 | 19,270 | 44,257 | ||||||||||||||||||||||||||||||
| Private securities - available |
10,066 | 9,406 | 4,185 | 49,003 | 72,660 | 7,007 | 8,577 | 5,541 | 45,885 | 67,010 | ||||||||||||||||||||||||||||||
| Private securities – subject to repurchase commitments |
0 | 1,236 | 705 | 11,402 | 13,343 | 10 | 554 | 1,837 | 6,716 | 9,117 | ||||||||||||||||||||||||||||||
| Derivative financial instruments |
3,987 | 6,384 | 4,069 | 9,026 | 23,466 | 7,978 | 5,363 | 2,756 | 6,746 | 22,843 | ||||||||||||||||||||||||||||||
| Net position |
3,987 | 6,384 | 4,069 | 9,026 | 23,466 | 7,978 | 5,363 | 2,756 | 6,746 | 22,843 | ||||||||||||||||||||||||||||||
| Swaps |
705 | 1,132 | 2,881 | 8,331 | 13,049 | 189 | 1,258 | 1,661 | 6,082 | 9,190 | ||||||||||||||||||||||||||||||
| Option |
1,167 | 1,890 | 975 | 183 | 4,215 | 430 | 1,748 | 865 | 294 | 3,337 | ||||||||||||||||||||||||||||||
| Forward (onshore) |
893 | 942 | 0 | 0 | 1,835 | 6,529 | 382 | — | — | 6,911 | ||||||||||||||||||||||||||||||
| Other derivative financial instruments |
1,222 | 2,420 | 213 | 512 | 4,367 | 830 | 1,975 | 230 | 370 | 3,405 | ||||||||||||||||||||||||||||||
| Loan and lease operations portfolio (3) |
68,829 | 166,503 | 88,138 | 241,919 | 565,389 | 57,505 | 152,660 | 71,107 | 201,881 | 483,153 | ||||||||||||||||||||||||||||||
|
|
|
|
|
|
|
|
|
|
|
|
|
|
|
|
|
|
|
|
|
|||||||||||||||||||||
| Total financial assets |
307,397 | 372,748 | 110,528 | 349,798 | 1,140,471 | 288,117 | 356,646 | 91,253 | 286,058 | 1,022,074 | ||||||||||||||||||||||||||||||
|
|
|
|
|
|
|
|
|
|
|
|
|
|
|
|
|
|
|
|
|
|||||||||||||||||||||
| (1) | The assets portfolio does not take into consideration the balance of compulsory deposits in Central Bank, amounting to R$ 94,148 (R$ 98,837 at 12/31/2017), which release of funds is linked to the maturity of the liability portfolios. The amounts of PGBL and VGBL are not considered in the assets portfolio because they are covered in Note 26. |
| (2) | Net of R$ 5,120 (R$ 3,664 at 12/31/2017) which securities are restricted to guarantee transactions at B3 S.A. - Brasil, Bolsa, Balcão and the BACEN. |
| (3) | Net of payment to merchants of R$ 60,504 (R$ 53,687 at 12/31/2017) and the amount of liabilities from transactions related to credit assignments R$ 3,993 (R$ 4,931 at 12/31/2017). |
| (4) | Includes R$ 15,886 (R$ 6,689 at 12/31/2017) related to Compulsory Deposits with Central Banks of other countries. |
F-145
Table of Contents
ITAÚ UNIBANCO HOLDING S.A.
Notes to the Consolidated Financial Statements
At 12/31/2018, 12/31/2017 and 01/01/2017 for balance sheet accounts and
From 01/01 to 12/31 of 2018, 2017 and 2016 for income statement accounts
(In millions of Reais, except information per share)
| Undiscounted future flows, except for derivatives which are fair value |
12/31/2018 | 12/31/2017 | ||||||||||||||||||||||||||||||||||||||
| Financial liabilities |
0 – 30 days |
31 – 365 days |
366 – 720 days |
Over 720 days |
Total | 0 – 30 days |
31 – 365 days |
366 – 720 days |
Over 720 days |
Total | ||||||||||||||||||||||||||||||
| Deposits |
246,729 | 62,909 | 16,674 | 191,131 | 517,443 | 222,782 | 61,672 | 16,500 | 152,961 | 453,915 | ||||||||||||||||||||||||||||||
| Demand deposits |
72,581 | 0 | 0 | 0 | 72,581 | 68,973 | — | — | — | 68,973 | ||||||||||||||||||||||||||||||
| Savings deposits |
136,865 | 0 | 0 | 0 | 136,865 | 119,980 | — | — | — | 119,980 | ||||||||||||||||||||||||||||||
| Time deposit |
35,450 | 62,185 | 16,647 | 190,984 | 305,266 | 33,114 | 60,272 | 16,445 | 152,903 | 262,734 | ||||||||||||||||||||||||||||||
| Interbank deposits |
1,830 | 724 | 27 | 147 | 2,728 | 712 | 1,400 | 55 | 58 | 2,225 | ||||||||||||||||||||||||||||||
| Other deposits |
3 | 0 | 0 | 0 | 3 | 3 | — | — | — | 3 | ||||||||||||||||||||||||||||||
| Compulsory deposits |
(39,116 | ) | (15,228 | ) | (3,831 | ) | (35,973 | ) | (94,148 | ) | (40,538 | ) | (18,197 | ) | (4,644 | ) | (35,458 | ) | (98,837 | ) | ||||||||||||||||||||
| Demand deposits |
(5,600 | ) | 0 | 0 | 0 | (5,600 | ) | (4,790 | ) | — | — | — | (4,790 | ) | ||||||||||||||||||||||||||
| Savings deposits |
(24,695 | ) | 0 | 0 | 0 | (24,695 | ) | (26,008 | ) | — | — | — | (26,008 | ) | ||||||||||||||||||||||||||
| Time deposit |
(8,821 | ) | (15,228 | ) | (3,831 | ) | (35,973 | ) | (63,853 | ) | (9,740 | ) | (18,197 | ) | (4,644 | ) | (35,458 | ) | (68,039 | ) | ||||||||||||||||||||
| Securities sold under repurchase agreements (1) |
275,395 | 16,557 | 10,933 | 42,349 | 345,234 | 232,970 | 35,234 | 30,404 | 39,444 | 338,052 | ||||||||||||||||||||||||||||||
| Government securities |
232,776 | 2,856 | 7,353 | 38,752 | 281,737 | 202,545 | 3,197 | 8,260 | 27,680 | 241,682 | ||||||||||||||||||||||||||||||
| Private securities |
10,910 | 13,701 | 3,580 | 3,597 | 31,788 | 8,020 | 31,348 | 22,144 | 11,764 | 73,276 | ||||||||||||||||||||||||||||||
| Foreign |
31,709 | 0 | 0 | 0 | 31,709 | 22,405 | 689 | — | — | 23,094 | ||||||||||||||||||||||||||||||
| Funds from acceptances and issuance of securities (2) |
2,189 | 32,950 | 39,077 | 53,626 | 127,842 | 7,093 | 43,463 | 21,325 | 52,837 | 124,718 | ||||||||||||||||||||||||||||||
| Borrowing and onlending (3) |
6,304 | 45,668 | 11,541 | 11,840 | 75,353 | 3,975 | 37,132 | 9,839 | 19,807 | 70,753 | ||||||||||||||||||||||||||||||
| Subordinated debt (4) |
154 | 2,658 | 6,264 | 52,453 | 61,529 | 1,061 | 13,402 | 2,054 | 49,454 | 65,971 | ||||||||||||||||||||||||||||||
| Derivative financial instruments |
3,168 | 6,885 | 5,672 | 11,794 | 27,519 | 7,596 | 5,816 | 4,877 | 8,457 | 26,746 | ||||||||||||||||||||||||||||||
| Net position |
3,168 | 6,885 | 5,672 | 11,794 | 27,519 | 7,596 | 5,816 | 4,877 | 8,457 | 26,746 | ||||||||||||||||||||||||||||||
| Swaps |
923 | 3,002 | 4,687 | 10,742 | 19,354 | 65 | 2,364 | 3,747 | 7,516 | 13,692 | ||||||||||||||||||||||||||||||
| Option |
883 | 1,935 | 823 | 288 | 3,929 | 332 | 1,299 | 889 | 273 | 2,793 | ||||||||||||||||||||||||||||||
| Forward (onshore) |
470 | 0 | 0 | 0 | 470 | 6,272 | — | — | — | 6,272 | ||||||||||||||||||||||||||||||
| Other derivative financial instruments |
892 | 1,948 | 162 | 764 | 3,766 | 927 | 2,153 | 241 | 668 | 3,989 | ||||||||||||||||||||||||||||||
|
|
|
|
|
|
|
|
|
|
|
|
|
|
|
|
|
|
|
|
|
|||||||||||||||||||||
| Total financial liabilities |
494,823 | 152,399 | 86,330 | 327,220 | 1,060,772 | 434,939 | 178,522 | 80,355 | 287,502 | 981,318 | ||||||||||||||||||||||||||||||
|
|
|
|
|
|
|
|
|
|
|
|
|
|
|
|
|
|
|
|
|
|||||||||||||||||||||
| (1) | Includes own and third parties’ portfolios. |
| (2) | Includes mortgage notes, real estate credit bills, agribusiness, financial bills and structured operations certificates recorded in interbank market funds and liabilities for issuance of debentures and foreign securities recorded in funds from institutional markets. |
| (3) | Recorded in funds from interbank markets. |
| (4) | Recorded in funds from institutional markets. |
F-146
Table of Contents
ITAÚ UNIBANCO HOLDING S.A.
Notes to the Consolidated Financial Statements
At 12/31/2018, 12/31/2017 and 01/01/2017 for balance sheet accounts and
From 01/01 to 12/31 of 2018, 2017 and 2016 for income statement accounts
(In millions of Reais, except information per share)
| 12/31/2018 | 12/31/2017 | |||||||||||||||||||||||||||||||||||||||
| Off balance sheet |
0 – 30 days |
31 – 365 days |
366 – 720 days |
Over 720 days |
Total | 0 – 30 days |
31 – 365 days |
366 – 720 days |
Over 720 days |
Total | ||||||||||||||||||||||||||||||
| Financial Guarantees |
1,305 | 17,314 | 5,509 | 41,977 | 66,105 | 1,749 | 17,563 | 5,451 | 45,726 | 70,489 | ||||||||||||||||||||||||||||||
| Commitments to be released |
110,909 | 25,977 | 5,796 | 130,161 | 272,843 | 98,310 | 27,857 | 7,307 | 110,652 | 244,126 | ||||||||||||||||||||||||||||||
| Letters of credit to be released |
10,747 | 0 | 0 | 0 | 10,747 | 9,214 | — | — | — | 9,214 | ||||||||||||||||||||||||||||||
| Contractual commitments - Fixed assets and Intangible (Notes 13 and 14) |
0 | 405 | 273 | 0 | 678 | — | 432 | 460 | 273 | 1,165 | ||||||||||||||||||||||||||||||
|
|
|
|
|
|
|
|
|
|
|
|
|
|
|
|
|
|
|
|
|
|||||||||||||||||||||
| Total |
122,961 | 43,696 | 11,578 | 172,138 | 350,373 | 109,273 | 45,852 | 13,218 | 156,651 | 324,994 | ||||||||||||||||||||||||||||||
|
|
|
|
|
|
|
|
|
|
|
|
|
|
|
|
|
|
|
|
|
|||||||||||||||||||||
F-147
Table of Contents
ITAÚ UNIBANCO HOLDING S.A.
Notes to the Consolidated Financial Statements
At 12/31/2018, 12/31/2017 and 01/01/2017 for balance sheet accounts and
From 01/01 to 12/31 of 2018, 2017 and 2016 for income statement accounts
(In millions of Reais, except information per share)
| c) | Capital Management Governance |
ITAÚ UNIBANCO HOLDING is subject to the requirements of BACEN, which determines minimum capital requirements, procedures to assess information on globally systemic important banks (G-SIB), fixed asset limits, loan limits, accounting practices and require banks to conform to the regulation based on the Basel Accord for capital adequacy purposes. Additionally, the CNSP and SUSEP issue regulations on capital requirements that impact our insurance operations, and private pension and capitalization plans.
The capital statements were prepared in accordance with BACEN’s regulatory requirements and with internationally accepted minimum requirements according to the Bank for International Settlements (BIS).
| I - | Composition of capital |
The Referential Equity (PR) used to monitor compliance with the operational limits imposed by BACEN is the sum of three items, namely:
| • | Common Equity Tier I: the sum of capital, reserves and retained earnings, less deductions and prudential adjustments. |
| • | Additional Tier I Capital: consists of instruments of a perpetual nature, which meet eligibility requirements. Together with Common Equity Tier I it makes up Tier I. |
| • | Tier II: consists of subordinated debt instruments with defined maturity dates that meet eligibility requirements. |
Composition of Referential Equity
| 12/31/2018 | 12/31/2017 | |||||||
| Stockholders’ equity attributable to controlling interests |
131,757 | 126,924 | ||||||
| Non-controlling interests |
12,276 | 11,942 | ||||||
| Change in interest in subsidiaries in a capital transaction |
98 | 1,482 | ||||||
| Consolidated Stockholders’ Equity (BACEN) |
144,131 | 140,348 | ||||||
|
|
|
|
|
|||||
| Common Equity Tier I Prudential Adjustments |
(20,773 | ) | (17,952 | ) | ||||
| Common Equity Tier I |
123,358 | 122,396 | ||||||
|
|
|
|
|
|||||
| Instruments Eligible to Comprise Additional Tier I |
7,701 | — | ||||||
| Additional Tier I Prudential Adjustments |
95 | 57 | ||||||
| Additional Tier I Capital |
7,796 | 57 | ||||||
|
|
|
|
|
|||||
| Tier I (Common Equity Tier I + Additional Tier I Capital) |
131,154 | 122,453 | ||||||
|
|
|
|
|
|||||
| Instruments Eligible to Comprise Tier II |
15,778 | 19,723 | ||||||
| Tier II Prudential Adjustments |
96 | 76 | ||||||
| Tier II |
15,874 | 19,799 | ||||||
|
|
|
|
|
|||||
| Referential Equity (Tier I + Tier II) |
147,028 | 142,252 | ||||||
|
|
|
|
|
|||||
The funds obtained through the issuance of subordinated debt securities are considered Tier II capital for the purpose of capital to risk-weighted assets ratio, as follows. According to current legislation, the accounting balance of subordinated debt as of December 2012 was used for the calculation of reference equity as of December 2018, considering instruments approved after the closing date to compose Tier II, totaling R$ 35,206.
F-148
Table of Contents
ITAÚ UNIBANCO HOLDING S.A.
Notes to the Consolidated Financial Statements
At 12/31/2018, 12/31/2017 and 01/01/2017 for balance sheet accounts and
From 01/01 to 12/31 of 2018, 2017 and 2016 for income statement accounts
(In millions of Reais, except information per share)
| Name of security / currency |
Principal amount (original currency) |
Issue | Maturity | Return p.a. |
Account balance 12/31/2018 |
|||||||||||||
| Subordinated financial bills - BRL |
||||||||||||||||||
| 2 | 2011 | 2019 | 109% to 109.7% of CDI | 4 | ||||||||||||||
| 1 | 2012 | 2019 | 110% of CDI | 2 | ||||||||||||||
| 12 | 11.96% | 26 | ||||||||||||||||
| 101 | IPCA + 4.7% to 6.3% | 187 | ||||||||||||||||
| 1 | 2012 | 2020 | 111% of CDI | 2 | ||||||||||||||
| 20 | IPCA + 6% to 6.17% | 44 | ||||||||||||||||
| 6 | 2011 | 2021 | 109.25% to 110.5% of CDI | 13 | ||||||||||||||
| 2,307 | 2012 | 2022 | IPCA + 5.15% to 5.83% | 4,595 | ||||||||||||||
| 20 | IGPM + 4.63% | 29 | ||||||||||||||||
| 2,470 | Total | 4,902 | ||||||||||||||||
| Subordinated euronotes - USD |
||||||||||||||||||
| 990 | 2010 | 2020 | 6.20% | 3,881 | ||||||||||||||
| 1,000 | 2010 | 2021 | 5.75% | 3,987 | ||||||||||||||
| 730 | 2011 | 2021 | 5.75% to 6.20% | 2,839 | ||||||||||||||
| 550 | 2012 | 2021 | 6.20% | 2,131 | ||||||||||||||
| 2,600 | 2012 | 2022 | 5.50% to 5.65% | 10,256 | ||||||||||||||
| 1,851 | 2012 | 2023 | 5.13% | 7,209 | ||||||||||||||
| 7,721 | Total | 30,303 | ||||||||||||||||
| Total |
35,205 | |||||||||||||||||
|
|
|
|||||||||||||||||
Perpetual subordinate notes / Supplementary Capital (AT1), issued on December 12, 2017 and March 19, 2018, were approved by BACEN, increasing by 0.97 p.p. the Tier I Capital index of ITAÚ UNIBANCO HOLDING.
| II - | Capital Requirements in Place and In Progress |
ITAÚ UNIBANCO HOLDING’s minimum capital requirements are expressed as ratios obtained from the ratio between available capital and the Risk-Weighted Assets (RWA).
Schedule for Basel III implementation
| As From January 1, | ||||||||||||
| 2017 | 2018 | 2019 (1) | ||||||||||
| Common Equity Tier I |
4.5 | % | 4.5 | % | 4.5 | % | ||||||
| Tier I |
6.0 | % | 6.0 | % | 6.0 | % | ||||||
| Total Capital |
9.25 | % | 8.625 | % | 8.0 | % | ||||||
| Additional Common Equity Tier I (ACP) |
1.50 | % | 2.375 | % | 3.5 | % | ||||||
| Conservation |
1.25 | % | 1.875 | % | 2.5 | % | ||||||
| Countercyclical(2) |
0 | % | 0 | % | 0 | % | ||||||
| Systemic (3) |
0.25 | % | 0.5 | % | 1.0 | % | ||||||
| Common Equity Tier I + ACP |
6.0 | % | 6.875 | % | 8.0 | % | ||||||
| Total Capital + ACP |
10.75 | % | 11.0 | % | 11.5 | % | ||||||
| Prudential Adjustments Deductions |
80 | % | 100 | % | 100 | % | ||||||
| (1) | Requirements in force as from January 1, 2019. |
| (2) | ACP Countercyclical is triggered during the credit cycle expansion phase. Additionally, in the event of increase of countercyclical additional, the new percentage will be in effect only twelve months after it is announced. |
| (3) | The calculation of ACP Systemic associates the systemic importance, represented by the institution’s total exposure, to Gross Domestic Product (GDP). |
F-149
Table of Contents
ITAÚ UNIBANCO HOLDING S.A.
Notes to the Consolidated Financial Statements
At 12/31/2018, 12/31/2017 and 01/01/2017 for balance sheet accounts and
From 01/01 to 12/31 of 2018, 2017 and 2016 for income statement accounts
(In millions of Reais, except information per share)
| III - | Risk-Weighted Assets (RWA) |
For assessing the minimum capital requirements, the RWA must be calculated by adding the following risk exposures:
RWA = RWACPAD + RWAMINT + RWAOPAD
| 12/31/2018 | 12/31/2017 | |||||||
| Credit risk (RWACPAD)(1) |
714,969 | 660,516 | ||||||
| Market risk (RWAMINT)(2) |
30,270 | 32,915 | ||||||
| Operacional risk (RWAPOPAD)(3) |
72,833 | 63,277 | ||||||
|
|
|
|
|
|||||
| Total risk-weighted assets |
818,072 | 756,708 | ||||||
|
|
|
|
|
|||||
| (1) | Portion related to exposures to credit risk, calculated using the standardized approach; |
| (2) | Portion related to capital required for market risk, composed of the maximum between the internal model and 80% of the standardized model, regulated by BACEN Circulars 3,646 and 3,674; |
| (3) | Portion related to capital required for operational risk, calculated based on the standardized approach. |
The tables below present the breakdown of credit, market and operational risk weighted assets, respectively.
| a) | Credit Risk |
Exposure Weighted by Credit Risk (RWACPAD)
| 12/31/2018 | 12/31/2017 | |||||||
| Exposure Weighted by Credit Risk (RWACPAD) |
714,969 | 660,516 | ||||||
|
|
|
|
|
|||||
| Marketable securities |
40,276 | 45,629 | ||||||
| Loan Operations - Retail |
124,356 | 114,141 | ||||||
| Loan Operations - Non-Retail |
256,958 | 240,816 | ||||||
| Joint Liabilities - Retail |
140 | 172 | ||||||
| Joint Liabilities - Non-Retail |
43,288 | 45,405 | ||||||
| Loan Commitments - Retail |
33,871 | 31,058 | ||||||
| Loan Commitments - Non-Retail |
10,673 | 9,017 | ||||||
| Derivatives – Future potential gain |
4,193 | 5,457 | ||||||
| Agency Transition |
3,330 | — | ||||||
| Other exposures |
197,884 | 168,821 | ||||||
| b) | Market Risk |
| 12/31/2018 (1) | 12/31/2017 | |||||||
| Market Risk Weighted Assets - Standard Aproach (RWAMPAD) |
37,838 | 32,893 | ||||||
| Operations subject to interest rate variations |
30,286 | 31,076 | ||||||
| Fixed rate denominated in reais |
2,026 | 6,119 | ||||||
| Foreign exchange coupons |
19,633 | 17,153 | ||||||
| Price index coupon |
8,627 | 7,804 | ||||||
| Operations subject to commodity price variation |
389 | 361 | ||||||
| Operations subject to stock price variation |
362 | 239 | ||||||
| Operations subject to risk exposures in gold, foreign currency and foreign exchange variation |
6,801 | 1,217 | ||||||
| Minimum Market Risk Weighted Assets - Standard Aproach (RWAMPAD) (1) (a) |
30,270 | 26,314 | ||||||
| Market Risk Weighted Assets calculated based on internal methodology (b) |
22,871 | 32,915 | ||||||
| Reduction of Market Risk Weighted Assets due to Internal Models Aproach |
(7,568 | ) | — | |||||
| Market Risk Weighted Assets (RWAMINT) - maximum of (a) and (b) |
30,270 | 32,915 | ||||||
| (1) | Calculated based on internal models, with maximum saving possibility of 20% of the standard model. |
F-150
Table of Contents
ITAÚ UNIBANCO HOLDING S.A.
Notes to the Consolidated Financial Statements
At 12/31/2018, 12/31/2017 and 01/01/2017 for balance sheet accounts and
From 01/01 to 12/31 of 2018, 2017 and 2016 for income statement accounts
(In millions of Reais, except information per share)
At December 31, 2018, RWAMINT totaled R$ 30,270, which corresponds to 80% of RWAMPAD, higher than the capital calculated at internal models, which totaled R$ 22,871.
| c) | Operational Risk |
| 12/31/2018 | 12/31/2017 | |||||||
| Operational Risk-Weighted Assets (RWAOPAD) |
72,833 | 63,277 | ||||||
|
|
|
|
|
|||||
| Retail |
12,822 | 11,870 | ||||||
| Commercial |
26,214 | 24,857 | ||||||
| Corporate finance |
2,697 | 2,663 | ||||||
| Negotiation and sales |
11,736 | 7,434 | ||||||
| Payments and settlement |
8,282 | 7,532 | ||||||
| Financial agent services |
4,343 | 3,893 | ||||||
| Asset management |
6,715 | 5,010 | ||||||
| Retail brokerage |
24 | 18 | ||||||
| IV - | Capital Adequacy |
The Board of Directors is the body responsible for approving the capital management institutional policy and guidelines for the capitalization level of ITAÚ UNIBANCO HOLDING. The Board is also responsible for the full approval of the ICAAP (Internal Capital Adequacy Assessment Process) report, which purpose is to assess the capital adequacy of ITAÚ UNIBANCO HOLDING.
The result of the last ICAAP – conducted for the base date December 2017 – indicated that ITAÚ UNIBANCO HOLDING has, in addition to capital to face all material risks, a significant capital surplus, thus assuring the institution’s equity soundness.
In order to ensure the soundness of ITAÚ UNIBANCO HOLDING and the availability of capital to support business growth, ITAÚ UNIBANCO HOLDING maintains PR levels above the minimum level required to face risks, as evidenced by the Common Equity, Tier I Capital and Basel ratios.
The Basel Ratio reached 18% on December 31, 2018, with a reduction of 0.8 percentage points in relation to December 31, 2017, mainly due to the payment of additional dividends related to the 2017 net income.
Additionally, ITAÚ UNIBANCO HOLDING has a surplus in relation to the minimum Referential Equity required in the amount of R$ 76,469 million, higher than the ACP of R$ 19,429 million, widely covered by the available capital.
| 12/31/2018 | 12/31/2017 | |||||||||||||||||||||||||||||||
| Amount | Ratio | Amount | Ratio | |||||||||||||||||||||||||||||
| Required | Current | Required | Current | Required | Current | Required | Current | |||||||||||||||||||||||||
| Common Equity Tier I |
36,813 | 123,358 | 4.5 | % | 15.1 | % | 34,052 | 122,396 | 4.5 | % | 16.2 | % | ||||||||||||||||||||
| Additional Tier I Capital |
0 | 7,796 | 0 | 0 | — | 57 | — | — | ||||||||||||||||||||||||
| Tier I (Common Equity Tier I + Additional Tier I Capital) |
49,084 | 131,154 | 6.0 | % | 16.0 | % | 45,402 | 122,453 | 6.0 | % | 16.2 | % | ||||||||||||||||||||
| Tier II |
0 | 15,874 | 0 | 0 | — | 19,799 | — | — | ||||||||||||||||||||||||
| Referential Equity (Tier I + Tier II) |
70,559 | 147,028 | 8.625 | % | 18.0 | % | 69,995 | 142,252 | 9.25 | % | 18.8 | % | ||||||||||||||||||||
|
|
|
|
|
|
|
|
|
|
|
|
|
|
|
|
|
|||||||||||||||||
| Amount Required for Additional Common Equity Tier I (ACP) |
|
19,429 |
|
|
2.375% |
|
11,351 | 1.5% | ||||||||||||||||||||||||
|
|
|
|
|
|
|
|
|
|
|
|||||||||||||||||||||||
The fixed assets ratio shows the commitment percentage of adjusted Referential Equity with adjusted permanent assets. ITAÚ UNIBANCO HOLDING falls within the maximum limit of 50% of adjusted RE, established by BACEN. At 12/31/2018 , fixed assets ratio reached 25.9%, showing a surplus of R$ 35,447 million.
Further details on Risk and Capital Management of ITAÚ UNIBANCO HOLDING and indicators of the Global Systemic Importance Index, which are not included in the financial statements, may be viewed on www.itau.com.br/relacoes-com-investidores “Reports”/ Pillar 3 and Global Systemically Important Banks.
F-151
Table of Contents
ITAÚ UNIBANCO HOLDING S.A.
Notes to the Consolidated Financial Statements
At 12/31/2018, 12/31/2017 and 01/01/2017 for balance sheet accounts and
From 01/01 to 12/31 of 2018, 2017 and 2016 for income statement accounts
(In millions of Reais, except information per share)
| V - | Stress testing |
The stress test is a process of simulation of extreme economic and market conditions in the institution’s results and capital. The institution has conducted this test since 2010 aiming at assessing its solvency in plausible scenarios of a systemic crisis, as well as at identifying areas that are more susceptible to the impact of stress, and that can be subject to risk mitigation.
To perform the test, macroeconomic variables for each stress scenario are estimated by the economic research department. The scenarios are established considering their relevance to the bank’s result, and the probability of occurrence, and they are submitted to the approval of the Board of Directors on an annual basis.
Projections of macroeconomic variables (GDP, benchmark interest rate and inflation) and of the credit market (fundraising, loans, default rate, spread and fees) for these scenarios are generated based on exogenous shocks or by using models validated by an independent area.
These projections affect the budgeted result and balance sheet that then change the risk-weighted assets and capital and liquidity ratios.
The stress test is also an integral part of ICAAP, with the main purpose of assessing whether, even in severe adverse conditions, the institution would have appropriate capital levels, not impacting the development of its activities.
This information allows to identify potential factors of risks on businesses, supporting the Board of Directors’ strategic decisions, the budgetary process and discussions on credit granting policies, in addition to being used as input for risk appetite metrics.
Further details on Risk and Capital Management of ITAÚ UNIBANCO HOLDING and indicators of the Global Systemic Importance Index, which are not included in the financial statements, may be viewed on www.itau.com.br/investor-relations, section “Reports”/ Pillar 3 and Global Systemically Important Banks.
| VI – | Leverage Ratio |
The Leverage Ratio is defined as the rate between Capital Tier I and Total Exposure, calculated pursuant to BACEN Circular 3,748, of February 27, 2015. The purpose of this ratio is to be a simple measure of leverage not sensitive to risk, thus it does not consider weighting or mitigation factors. According to instructions provided by BACEN Circular Letter 3,706, of May 5, 2015, since October 2015, ITAÚ UNIBANCO HOLDING has sent the Leverage Ratio to BACEN, in accordance with Basel recommendations, and the basis was established as the ratio behavior observation period since its implementation in 2011 until 2017.
More information on the composition of the Leverage Ratio, which are not part of its financial statements, is available at www.itau.com.br/investors-relations, “Reports” / Pillar 3 and Global Systemically Important Banks.
| d) | Management Risks of insurance and private pension |
I – Management Structure, roles and responsibilities
In line with good national and international practices, ITAÚ UNIBANCO HOLDING has a risk management structure that ensures that the risks arising from insurance, pension plan and capitalization products are properly reported to the proper bodies. The management process of insurance, pension plan and capitalization risks is independent and focused on the specifics of each risk.
ITAÚ UNIBANCO HOLDING has specific committees to define the management of funds from the technical reserves for insurance and private pension, issue guidelines for managing these funds with the objective of achieving long term return, and define evaluation models, risk limits and strategies on allocation of funds to defined financial assets. Such committees are comprised not only of executives and those directly responsible for the business management process, but also for an equal number of professionals that head up or coordinate the commercial and financial areas.
F-152
Table of Contents
ITAÚ UNIBANCO HOLDING S.A.
Notes to the Consolidated Financial Statements
At 12/31/2018, 12/31/2017 and 01/01/2017 for balance sheet accounts and
From 01/01 to 12/31 of 2018, 2017 and 2016 for income statement accounts
(In millions of Reais, except information per share)
II – Risks of Insurance and Private Pension
ITAÚ UNIBANCO HOLDING offers its products to clients through bancassurance or direct distribution. Life, accident, credit life and multiple peril insurance products are mainly distributed by bancassurance operation.
Life insurance and pension plans are, in general, medium or long-lived products and the main risks involved in the business may be classified as biometric risk, financial and behaviorall.
| • | Biometric risk relates to: i) more than expected increase in life expectancies for products with survivorship coverage (mostly pension plans); and ii) more than expected decrease in mortality rates for products with survivorship coverage (mostly life insurance). |
| • | Financial risk: is inherent in the underwriting risk of products that offer a financial guarantee pre-established in an agreement, and this risk is considered insurance risk |
| • | Behavioral risk relates to a more than expected increase in the rates of conversion into annuity income, resulting in increased payments of retirement benefits. |
The estimated actuarial assumptions are based on the historical evaluation of ITAÚ UNIBANCO HOLDING, on benchmarks and the experience of the actuaries.
| a) | Effect of changes on actuarial assumptions |
To measure the effects of changes in the key actuarial assumptions, sensitivity tests were conducted in the amounts of current estimates of future liability cash flows. The sensitivity analysis considers a vision of the impacts caused by changes in assumptions, which could affect the income for the period and stockholders’ equity at the balance sheet date. This type of analysis is usually conducted under the ceteris paribus condition, in which the sensitivity of a system is measured when one variable of interest is changed and all the others remain unchanged. The results obtained are shown in the table below:
| Sensitivity analysis |
Impact in Results and Stockholders’ Equity (1) | |||||||||||||||
| 12/31/2018 (2) | 12/31/2017 | |||||||||||||||
| Private Pension | Insurance | Private Pension | Insurance | |||||||||||||
| Mortality Rates |
||||||||||||||||
| 5% increase |
15 | (1 | ) | 24 | — | |||||||||||
| 5% decrease |
(16 | ) | (1 | ) | (25 | ) | (1 | ) | ||||||||
| Risk-free Interest Rates |
||||||||||||||||
| 0.1% increase |
30 | 8 | 26 | 5 | ||||||||||||
| 0.1% decrease |
(44 | ) | (8 | ) | (27 | ) | (5 | ) | ||||||||
| Conversion in Income Rates |
||||||||||||||||
| 5% increase |
(14 | ) | 0 | (13 | ) | — | ||||||||||
| 5% decrease |
14 | 0 | 13 | — | ||||||||||||
| Claims |
||||||||||||||||
| 5% increase |
0 | (37 | ) | — | (36 | ) | ||||||||||
| 5% decrease |
0 | 37 | — | 36 | ||||||||||||
| (1) | Amounts net of tax effects. |
| (2) | The amounts shown in the tables express the position at 12/31/2018, since the actuarial calculations are made semi-annually. |
F-153
Table of Contents
ITAÚ UNIBANCO HOLDING S.A.
Notes to the Consolidated Financial Statements
At 12/31/2018, 12/31/2017 and 01/01/2017 for balance sheet accounts and
From 01/01 to 12/31 of 2018, 2017 and 2016 for income statement accounts
(In millions of Reais, except information per share)
| b) | Risk concentration |
For ITAÚ UNIBANCO HOLDING, there is no product concentration in relation to insurance premiums, reducing the risk of product concentration and distribution channels.
At December 31, 2017, the production of DPVAT arises from interests that ITAÚ UNIBANCO HOLDING’s insurance companies hold in Seguradora Líder dos Consórcios de DPVAT.
| 01/01 to 12/31/2018 | 01/01 to 12/31/2017 | 01/01 to 12/31/2016 | ||||||||||||||||||||||||||||||||||
| Insurance premiums |
Retained premium |
Retention (%) |
Insurance premiums |
Retained premium |
Retention (%) |
Insurance premiums |
Retained premium |
Retention (%) |
||||||||||||||||||||||||||||
| Property and casualty |
||||||||||||||||||||||||||||||||||||
| Mandatory personal injury caused by motor vehicle (DPVAT) |
0 | 0 | 0.0 | 24 | 24 | 100.0 | 37 | 37 | 100.0 | |||||||||||||||||||||||||||
| Extended warranty |
0 | 0 | 0.0 | — | — | 0.0 | 112 | 112 | 100.0 | |||||||||||||||||||||||||||
| Individuals |
||||||||||||||||||||||||||||||||||||
| Group accident insurance |
690 | 689 | 99.9 | 667 | 666 | 99.8 | 780 | 776 | 99.5 | |||||||||||||||||||||||||||
| Individual accident |
275 | 280 | 101.8 | 290 | 289 | 99.8 | 224 | 212 | 94.8 | |||||||||||||||||||||||||||
| Credit life |
881 | 879 | 99.8 | 623 | 621 | 99.7 | 570 | 570 | 100.0 | |||||||||||||||||||||||||||
| Group life |
934 | 937 | 100.3 | 1,001 | 990 | 98.9 | 1,278 | 1,234 | 96.5 | |||||||||||||||||||||||||||
| III) | Market, credit and liquidity risk |
| a) | Market risk |
Market risk is analyzed, in relation to insurance operations, based on the following metrics and sensitivity and loss control measures: Value at Risk (VaR), Losses in Stress Scenarios (Stress Test), Sensitivity (DV01- Delta Variation) and Concentration. In the table, the sensitivity analysis (DV01 – Delta Variation) is presented in relation to insurance operations that demonstrate the impact on the cash flows market value when submitted to a 1 annual basis point increase in the current interest rates or index rate and 1 percentage point in the share price and currency.
| 12/31/2018 | 12/31/2017 | |||||||||||||||
| Class |
Account balance |
DV01 | Account balance |
DV01 | ||||||||||||
| Government securities |
||||||||||||||||
| NTN-C |
5,096 | (2.70 | ) | 4,936 | (2.87 | ) | ||||||||||
| NTN-B |
6,091 | (7.17 | ) | 5,343 | (6.78 | ) | ||||||||||
| LTN |
0 | 0 | 279 | (0.09 | ) | |||||||||||
| Private securities |
||||||||||||||||
| Indexed to IPCA |
259 | (0.06 | ) | 336 | (0.10 | ) | ||||||||||
| Indexed to PRE |
10 | 0 | 31 | — | ||||||||||||
| Floating assets |
4,085 | 0 | 5,132 | |||||||||||||
| Under agreements to resell |
5,575 | 0 | 6,856 | |||||||||||||
F-154
Table of Contents
ITAÚ UNIBANCO HOLDING S.A.
Notes to the Consolidated Financial Statements
At 12/31/2018, 12/31/2017 and 01/01/2017 for balance sheet accounts and
From 01/01 to 12/31 of 2018, 2017 and 2016 for income statement accounts
(In millions of Reais, except information per share)
| b) | Liquidity Risk |
Liquidity risk is the risk that ITAÚ UNIBANCO HOLDING may have insufficient net funds available to honor its current obligations at a given moment. The liquidity risk is managed, for insurance operation, continuously based on the monitoring of payment flows related to its liabilities vis a vis the inflows generated by its operations and financial assets portfolio.
Financial assets are managed in order to optimize the risk-return ratio of investments, considering, on a careful basis, the characteristics of their liabilities. The risk integrated control considers the concentration limits by issuer and credit risk, sensitivities and market risk limits and control over asset liquidity risk. Thus, investments are concentrated in government and private securities with good credit quality in active and liquid markets, keeping a considerable amount invested in short-term assets, available on demand, to cover regular needs and any liquidity contingencies. Additionally, ITAÚ UNIBANCO HOLDING constantly monitors the solvency conditions of its insurance operations.
| Liabilities |
Assets |
12/31/2018 | 12/31/2017 | |||||||||||||||||||||||
| Liabilities amounts (1) |
Liabilities DU (2) |
Assets DU (2) |
Liabilities amounts (1) |
Liabilities DU (2) |
Assets DU (2) |
|||||||||||||||||||||
| Insurance operations |
Backing asset | |||||||||||||||||||||||||
| Unearned premiums |
LFT, repurchase agreements, NTN-B, CDB, LF and debentures |
2,111 | 56.7 | 12.6 | 1,882 | 24.7 | 12.0 | |||||||||||||||||||
| IBNR, PDR e PSL |
LFT, repurchase agreements, NTN-B, CDB, LF and debentures |
927 | 48.0 | 18.5 | 985 | 20.4 | 18.3 | |||||||||||||||||||
| Other provisions |
LFT, repurchase agreements, NTN-B, CDB, LF and debentures |
562 | 99.2 | 32.3 | 565 | 70.6 | 26.2 | |||||||||||||||||||
| Subtotal |
Subtotal |
3,600 | 3,432 | |||||||||||||||||||||||
| Pension plan, VGBL and individual life operations |
||||||||||||||||||||||||||
| Related expenses |
LFT, repurchase agreements, NTN-B, CDB, LF and debentures |
98 | 128.4 | 75.9 | 95 | 116.8 | 78.9 | |||||||||||||||||||
| Unearned premiums |
LFT, repurchase agreements, NTN-B, CDB and debentures |
13 | 0 | 11.0 | 16 | — | 9.7 | |||||||||||||||||||
| Unsettled claims |
LFT, repurchase agreements, NTN-B, CDB and debentures |
43 | 0 | 11.0 | 37 | — | 9.8 | |||||||||||||||||||
| IBNR |
LFT, repurchase agreements, NTN-B, CDB and debentures |
25 | 15.4 | 11.0 | 28 | 17.0 | 9.7 | |||||||||||||||||||
| Redemptions and Other Unsettled Amounts |
LFT, repurchase agreements, NTN-B, CDB and debentures |
310 | 0 | 11.0 | 275 | — | 9.8 | |||||||||||||||||||
| Mathematical reserve for benefits granted |
LFT, repurchase agreements, LTN, NTN-B, NTN-C, NTN-F, CDB, LF and debentures |
2,820 | 120.4 | 71.4 | 2,404 | 116.8 | 79.1 | |||||||||||||||||||
| Mathematical reserve for benefits to be granted – PGBL/ VGBL |
LFT, repurchase agreements, LTN, NTN-B, NTN-C, NTN-F, CDB, LF and debentures (3) |
187,908 | 182.0 | 28.2 | 169,149 | 197.2 | 38.9 | |||||||||||||||||||
| Mathematical reserve for benefits to be granted – traditional |
LFT, repurchase agreements, NTN-B, NTN-C, debentures |
4,815 | 209.0 | 91.7 | 4,454 | — | 95.1 | |||||||||||||||||||
| Other provisions |
LFT, repurchase agreements, NTN-B, NTN-C, CDB, LF and debentures |
948 | 165.5 | 91.7 | 737 | 116.8 | 95.1 | |||||||||||||||||||
| Financial surplus |
LFT, repurchase agreements, NTN-B, NTN-C, CDB, LF and debentures |
607 | 208.8 | 91.5 | 605 | 116.8 | 95.0 | |||||||||||||||||||
| Subtotal |
Subtotal |
197,587 | 177,800 | |||||||||||||||||||||||
| Total technical reserves |
Total backing assets |
201,187 | 181,232 | |||||||||||||||||||||||
|
|
|
|
|
|||||||||||||||||||||||
| (1) | Gross amounts of Credit Rights, Escrow Deposits and Reinsurance. |
| (2) | DU = Duration in months. |
| (3) | Excluding PGBL / VGBL reserves allocated in variable income. |
F-155
Table of Contents
ITAÚ UNIBANCO HOLDING S.A.
Notes to the Consolidated Financial Statements
At 12/31/2018, 12/31/2017 and 01/01/2017 for balance sheet accounts and
From 01/01 to 12/31 of 2018, 2017 and 2016 for income statement accounts
(In millions of Reais, except information per share)
| c) | Credit Risk |
| I - | Reinsurers |
Reinsurance operations are controlled through an internal policy, in compliance with the provisions of regulatory authority of reinsurers with which ITAÚ UNIBANCO HOLDING operates.
We present below the division of risks granted by the ITAÚ UNIBANCO HOLDING’s insurance companies to reinsurance companies:
| – | Insurance Operations: reinsurance premiums operations are basically represented by: IRB Brasil Resseguros with 78.13% (45.07% at 12/31/2017) and Munich Re do Brasil with 5.08% (53.80% at 12/31/2017). |
| – | Social Security Operations: related to reinsurance premiums are entirely represented by Austral with 40%, General Reinsurance 30% and IRB Brasil Resseguros with 30%. At 12/31/2017 reinsurance premiums were entirely represented by Munich Re do Brasil with 70% and General Reinsurance AG with 30%. |
| II – | Premiums Receivable |
ITAÚ UNIBANCO HOLDING considers the credit risk arising from past-due premiums immaterial, since cases with coverage payment in default may be canceled, pursuant to Brazilian regulation.
| III – | Risk level of financial assets |
The table below shows insurance financial assets, individually evaluated, classified by rating:
| 12/31/2018 | ||||||||||||||||
| Financial Assets at Amortized Cost | ||||||||||||||||
| Internal rating |
Interbank deposits and securities purchased under agreements to resell |
Securities | Financial assets at fair value through profit or loss (*) |
Total | ||||||||||||
| Lower risk |
8,247 | 28,969 | 179,771 | 216,987 | ||||||||||||
| Satisfactory |
0 | 0 | 2 | 2 | ||||||||||||
| Higher Risk |
0 | 0 | 0 | 0 | ||||||||||||
|
|
|
|
|
|
|
|
|
|||||||||
| Total |
8,247 | 28,969 | 179,773 | 216,989 | ||||||||||||
|
|
|
|
|
|
|
|
|
|||||||||
| % |
3.8 | 13.3 | 82.9 | 100.0 | ||||||||||||
|
|
|
|
|
|
|
|
|
|||||||||
| (*) | Includes Derivatives in the amount of R$ 449 million. |
| 12/31/2017 | ||||||||||||||||
| Financial Assets at Amortized Cost | ||||||||||||||||
| Internal rating |
Interbank deposits and securities purchased under agreements to resell |
Securities | Financial assets at fair value through profit or loss (*) |
Total | ||||||||||||
| Lower risk |
7,558 | 27,719 | 168,006 | 203,283 | ||||||||||||
| Satisfactory |
— | — | 4 | 4 | ||||||||||||
| Higher Risk |
— | — | 25 | 25 | ||||||||||||
|
|
|
|
|
|
|
|
|
|||||||||
| Total |
7,558 | 27,719 | 168,035 | 203,312 | ||||||||||||
|
|
|
|
|
|
|
|
|
|||||||||
| % |
3.5 | 13.9 | 82.6 | 100.0 | ||||||||||||
|
|
|
|
|
|
|
|
|
|||||||||
| (*) | Includes Derivatives in the amount of R$ 194 million. |
F-156
Table of Contents
ITAÚ UNIBANCO HOLDING S.A.
Notes to the Consolidated Financial Statements
At 12/31/2018, 12/31/2017 and 01/01/2017 for balance sheet accounts and
From 01/01 to 12/31 of 2018, 2017 and 2016 for income statement accounts
(In millions of Reais, except information per share)
Note 33 – Supplementary information
| a) | Acquisition of minority interest in Edenred Participações S.A. |
On September 4, 2018, ITAÚ UNIBANCO HOLDING, through its controlled company ITAÚ UNIBANCO, entered into, with Edenred Participações S.A. (EDENRED) a strategic partnership in the benefit market to workers governed mainly by PAT – Worker’s Meal Program. EDENRED is controlled by Ticket Serviços S.A. (TICKET) in Brazil.
The strategic partnership will enable ITAÚ UNIBANCO to add the benefits issued by TICKET to its current offer of products and services focused on clients of wholesale, medium, micro and small companies segments.
In addition, ITAÚ UNIBANCO will make a minority investment of 11% in TICKET, through a capital increase with contribution of (i) cash, equivalent to said interest in the company’s equity value, and (ii) right to exclusive distribution of Ticket Restaurante, Ticket Alimentação, Ticket Cultura and Ticket Transporte products to the Bank’s legal entities base during the partnership term. TICKET will continue distributing its products through other commercial agreements and will continue under EDENRED’s control and management.
The effective acquisitions and financial settlements will occur after the required regulatory approvals.
Note 34 – Subsequent Event
Issuance Perpetual Subordinated Financial
In January 2019, ITAÚ UNIBANCO HOLDING issued R$ 3.05 billion in Perpetual Subordinated Financial bills, in private negotiations with professional investors. The Financial Bills have repurchase option as from 2024, in addition to being eligible to compose the Supplementary Capital of Referential Equity of ITAÚ UNIBANCO HOLDING CONSOLIDATED, with an estimated impact of 0.4 p.p. in its Tier I Capitalization ratio. Both the repurchase and composition of capital are subject to authorization of the Central Bank of Brazil.
F-157